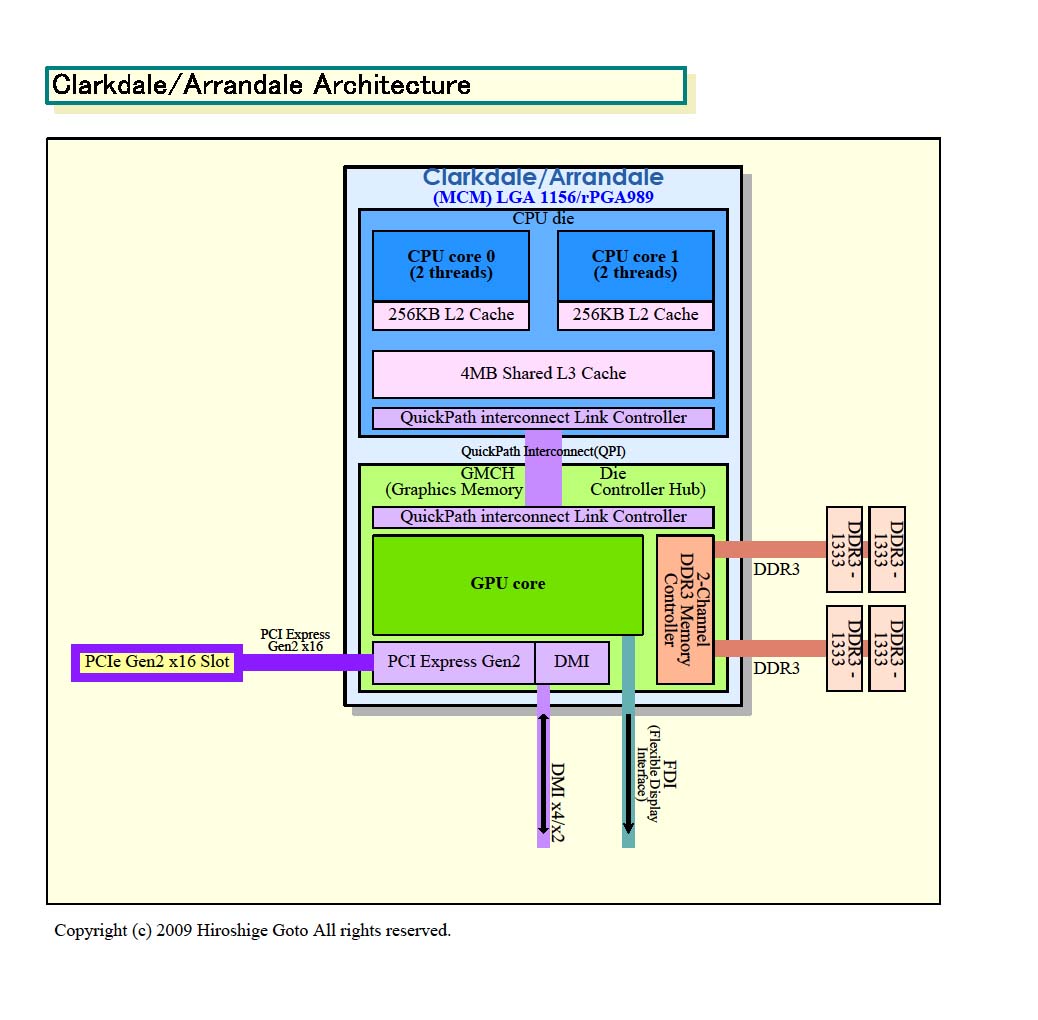
Reviews for the Intel Core i3-330M processor
Review MSI CX620MX Notebook
Energy waster. GPU Boost with ATI HD 545V, eSATA and rear interfaces allow this affordable 15.6 inch notebook to raise the interest of several buyers. Will occasional gamers also be satisfied? Do the hybrid-graphics extend the battery life?
Intel Core i3-330M, ATI Mobility Radeon HD 545v, 15.6", 2.5 kg
Review Toshiba Tecra M11-104 Notebook
Business Case. Toshiba introduces the Tecra M11 as a robust and compact companion for business routine. We'll check if the notebook can support the advertised claim, or if the ad writers have promised too much.
Intel Core i3-330M, Graphics Media Accelerator (GMA) HD Graphics, 14", 2.4 kg
Review Toshiba Satellite A660-151 Notebook
Entertainment Program. Toshiba's 16 incher scores with good sound, gaming starter GPU and good performance. However we found out that there's no perfect notebook for 730 euro. Workmanship, battery life and display show weaknesses.
Intel Core i3-330M, NVIDIA GeForce GT 330M, 16", 2.6 kg
Review HP G62-130EG Notebook
Budget laptop. One Intel core processor please, with a side-order of ATI graphics and a high-speed hard drive. It sounds like a laptop that many people would like to get their hands on. At €565, the 15.6-inch all-rounder from HP could be just what they’re looking for. We check out this small machine with broad appeal.
Intel Core i3-330M, ATI Mobility Radeon HD 5430, 15.6", 2.6 kg
Review Medion P7615 Notebook
Versatility Itself. A bit of everything: check mails early mornings on the train, a game of Battlefield at lunch, a bit of TV in the afternoon coffee break and full-blast music fun in the evening. That's what the 17.3 incher for 749 euro is supposed to be capable of. Unbelievable?
Intel Core i3-330M, NVIDIA GeForce GT 330M, 17.3", 3.3 kgSamsung P530 Pro: Intel Graphics Media Accelerator (GMA) HD Graphics, 15.60", 2.4 kg
Review » Review Samsung P530 Pro Notebook
Lenovo Thinkpad L412 0530-5ZG: Intel Graphics Media Accelerator (GMA) HD Graphics, 14.00", 2.3 kg
Review » Review Lenovo Thinkpad L412 Notebook
Lenovo Thinkpad L512 2597-5VG: Intel Graphics Media Accelerator (GMA) HD Graphics, 15.60", 2.6 kg
Review » Review Lenovo Thinkpad L512 Notebook
Toshiba Qosmio F60: NVIDIA GeForce GT 330M, 15.60", 2.9 kg
Review » Review Toshiba Qosmio F60 Notebook
Acer Aspire 3820TG-334G50N: ATI Mobility Radeon HD 5470, 13.30", 1.8 kg
Review » Review Acer Aspire 3820TG Timeline X Notebook
Sony Vaio VPC-EC1M1E: ATI Mobility Radeon HD 5470, 17.30", 3.1 kg
Review » Review Sony Vaio VPC-EC1M1E Notebook
Sony Vaio VPCEA1S1E/W: ATI Mobility Radeon HD 5145, 14.10", 2.3 kg
Review » Review Sony Vaio VPC-EA1S1E/L Notebook
Acer Aspire 5741G-334G50Mn: ATI Mobility Radeon HD 5470, 15.60", 2.5 kg
Review » Review Acer Aspire 5741G-334G50Mn Notebook
Toshiba Satellite L550-207: ATI Mobility Radeon HD 5165, 17.30", 3.1 kg
Review » Review Toshiba Satellite L550-207 Notebook
Fujitsu Lifebook AH550: Intel Graphics Media Accelerator (GMA) HD Graphics, 15.60", 2.9 kg
Review » Review Fujitsu Lifebook AH550 Notebook
Sony Vaio VPC-CW2S1E/L: NVIDIA GeForce GT 330M, 14.00", 2.3 kg
Review » Review Sony Vaio VPC-CW2S1E/L Notebook
Sony Vaio VPC-S11M1E: NVIDIA GeForce 310M, 13.30", 2 kg
Review » Review Sony Vaio VPC-S11M1E Notebook
Acer Aspire 8942G-334G64Mn: ATI Mobility Radeon HD 5650, 18.40", 3.9 kg
Review » Review Acer Aspire 8942G Notebook
Toshiba Satellite A660-12Q: NVIDIA GeForce GT 330M, 16.00", 2.6 kg
External Review » Toshiba Satellite A660-12Q
Asus X52F-EX894V: Intel Graphics Media Accelerator (GMA) HD Graphics, 15.60", 2.6 kg
External Review » Asus X52F-EX894V
Acer TravelMate TimelineX 8172T-33U4G50n: Intel Graphics Media Accelerator (GMA) HD Graphics, 11.60", 1.4 kg
External Review » Acer TravelMate TimelineX 8172T-33U4G50n
Acer Aspire 1830T-3935: Intel Graphics Media Accelerator (GMA) HD Graphics, 11.60", 1.3 kg
External Review » Acer Aspire 1830T-3935
Sony Vaio VPC-EA151E/G: ATI Mobility Radeon HD 5145, 14.00", 2.4 kg
External Review » Sony Vaio VPC-EA151E/G
Samsung P580-JS00UK: NVIDIA GeForce GT 330M, 15.60", 2.5 kg
External Review » Samsung P580-JS00UK
Sony Vaio VPCS139LE/B: Intel Graphics Media Accelerator (GMA) HD Graphics, 15.60", 2 kg
External Review » Sony Vaio VPCS139LE/B
MSI FX600-007UK: NVIDIA GeForce GT 325M, 15.60", 2.5 kg
External Review » MSI FX600-007UK
Toshiba Portégé R700-02B: Intel Graphics Media Accelerator (GMA) HD Graphics, 13.30", 1.4 kg
External Review » Toshiba Portégé R700-02B
Lenovo Ideapad G560-06792HJ: Intel Graphics Media Accelerator (GMA) HD Graphics, 15.60", 2.7 kg
External Review » Lenovo Ideapad G560-06792HJ
Viewsonic ViewBook VNB155: NVIDIA GeForce GTX 285M, 15.60", 3.5 kg
External Review » Viewsonic ViewBook VNB155
Acer eMachines E730G-334G32Mnks: ATI Mobility Radeon HD 5470, 15.60", 2.6 kg
External Review » Acer eMachines E730G-334G32Mnks
MSI FX600-i3343W7P: NVIDIA GeForce GT 325M, 15.60", 2.4 kg
External Review » MSI FX600-i3343W7P
Acer Aspire 8943G-332G32Mn: ATI Mobility Radeon HD 5650, 18.40", 3.9 kg
External Review » Acer Aspire 8943G-332G32Mn
HP Roddick G62-130ET: ATI Mobility Radeon HD 5430, 15.60", 2.5 kg
External Review » HP Roddick G62-130ET
Samsung P530-JA03UK: Intel Graphics Media Accelerator (GMA) HD Graphics, 15.60", 2.4 kg
External Review » Samsung P530-JA03UK
Asus UL80JT-A1: NVIDIA GeForce 310M, 14.00", 2.2 kg
External Review » Asus UL80JT-A1
Acer eMachines E730G-333G25Mi: ATI Mobility Radeon HD 5470, 15.60", 2.5 kg
External Review » Acer eMachines E730G-333G25Mi
Sony VAIO VPC-EB2L9E/BQ: Intel Graphics Media Accelerator (GMA) HD Graphics, 15.60", 2.7 kg
External Review » Sony VAIO VPC-EB2L9E/BQ
Packard Bell EasyNote TM98: Intel Graphics Media Accelerator (GMA) HD Graphics, 15.60", 2.7 kg
External Review » Packard Bell EasyNote TM98
Mesh Dynamo i3V: Intel Graphics Media Accelerator (GMA) 4500MHD, 15.60", 2.5 kg
External Review » Mesh Dynamo i3V
Toshiba Satellite Pro L500-1T1: ATI Mobility Radeon HD 5165, 15.60", 2.9 kg
External Review » Toshiba Satellite Pro L500-1T1
MSI CX620MX-i3343W7P: ATI Mobility Radeon HD 545v, 15.60", 2.5 kg
External Review » MSI CX620MX-i3343W7P
Toshiba Satellite Pro C650-121: Intel Graphics Media Accelerator (GMA) HD Graphics, 15.60", 2.4 kg
External Review » Toshiba Satellite Pro C650-121
Sony Vaio VPC-EB1E1E/WI: ATI Mobility Radeon HD 5470, 15.50", 2.7 kg
External Review » Sony Vaio VPC-EB1E1E/WI
Packard Bell EasyNote TM87-JN-218: NVIDIA GeForce GT 320M, 15.60", 2.6 kg
External Review » Packard Bell EasyNote TM87-JN-218
Packard Bell EasyNote NM86: Intel Graphics Media Accelerator (GMA) HD Graphics, 14.00", 2.4 kg
External Review » Packard Bell EasyNote NM86
HP G62-144DX: Intel Graphics Media Accelerator (GMA) HD Graphics, 15.60", 2.5 kg
External Review » HP G62-144DX
Toshiba Satellite L670-15P: ATI Mobility Radeon HD 5650, 17.30", 2.8 kg
External Review » Toshiba Satellite L670-15P
Samsung R480L: NVIDIA GeForce 310M, 14.00", 2.3 kg
External Review » Samsung R480L
Samsung R590: NVIDIA GeForce GT 330M, 15.60", 2.6 kg
External Review » Samsung R590
Fujitsu LifeBook TH700: Intel Graphics Media Accelerator (GMA) HD Graphics, 12.10", 2.1 kg
External Review » Fujitsu LifeBook TH700
Dell Inspiron N5010 : Intel Graphics Media Accelerator (GMA) 4500MHD, 15.60", 2.7 kg
External Review » Dell Inspiron N5010
Sony Vaio VPC-EA1S1R: ATI Mobility Radeon HD 5145, 14.00", 2.4 kg
External Review » Sony Vaio VPC-EA1S1R
Toshiba Satellite L670-10P: ATI Mobility Radeon HD 5650, 17.30", 2.8 kg
External Review » Toshiba Satellite L670-10P
MSI CX620-i3343W7P: ATI Mobility Radeon HD 5470, 15.60", 2.5 kg
External Review » MSI CX620-i3343W7P
Medion Akoya E6213/MD97553: Intel Graphics Media Accelerator (GMA) HD Graphics, 15.60", 2.7 kg
External Review » Medion Akoya E6213/MD97553
Toshiba Satellite L500-20X: ATI Mobility Radeon HD 5145, 15.60", 3 kg
External Review » Toshiba Satellite L500-20X
Toshiba Satellite T230-12T: Intel Graphics Media Accelerator (GMA) HD Graphics, 13.30", 1.8 kg
External Review » Toshiba Satellite T230-12T
Fujitsu LifeBook A530: Intel Graphics Media Accelerator (GMA) HD Graphics, 15.60", 2.8 kg
External Review » Fujitsu LifeBook A530
Acer Aspire 5820TG-334G50Mn: ATI Mobility Radeon HD 5470, 15.60", 2.4 kg
External Review » Acer Aspire 5820TG-334G50Mn
Toshiba Satellite A660-14C: NVIDIA GeForce 310M, 15.60", 2.7 kg
External Review » Toshiba Satellite A660-14C
Sony Vaio VPCEB1E0E: Intel Graphics Media Accelerator (GMA) HD Graphics, 15.50", 2.7 kg
External Review » Sony Vaio VPCEB1E0E
Toshiba Satellite T230: ATI Radeon HD 4225, 13.30", 1.8 kg
External Review » Toshiba Satellite T230
Sony Vaio VPCEA24FM/W: Intel Graphics Media Accelerator (GMA) HD Graphics, 14.00", 2.4 kg
External Review » Sony Vaio VPCEA24FM/W
Toshiba Satellite A660-151: NVIDIA GeForce GT 330M, 16.00", 2.6 kg
External Review » Toshiba Satellite A660-151
Medion P7615: NVIDIA GeForce GT 330M, 17.30", 3.3 kg
External Review » Medion P7615
Lenovo IdeaPad Z460: ATI Mobility Radeon HD 5145, 14.00", 2.4 kg
External Review » Lenovo IdeaPad Z460
Lenovo Ideapad V360: NVIDIA GeForce 305M, 13.30", 1.8 kg
External Review » Lenovo Ideapad V360
Toshiba Satellite L500-1WR: ATI Mobility Radeon HD 5145, 15.60", 3 kg
External Review » Toshiba Satellite L500-1WR
Packard Bell EasyNote LM86-GN-005UK: ATI Mobility Radeon HD 5470, 17.30", 3.3 kg
External Review » Packard Bell EasyNote LM86-GN-005UK
Acer Aspire 7740G-334G50Mn: ATI Mobility Radeon HD 5470, 17.30", 3.2 kg
External Review » Acer Aspire 7740G-334G50Mn
Samsung P530 Pro: Intel Graphics Media Accelerator (GMA) HD Graphics, 15.60", 2.4 kg
External Review » Samsung P530 Pro
Lenovo ThinkPad X201i: Intel Graphics Media Accelerator (GMA) HD Graphics, 12.10", 1.4 kg
External Review » Lenovo ThinkPad X201i
MSI CX420: ATI Mobility Radeon HD 5470, 14.00", 2 kg
External Review » MSI CX420
HP G62-130EG: ATI Mobility Radeon HD 5430, 15.60", 2.6 kg
External Review » HP G62-130EG
HP G72-130EG: ATI Mobility Radeon HD 5430, 17.30", 3 kg
External Review » HP G72-130EG
Sony Vaio VPCCW21FD: NVIDIA GeForce 310M, 14.00", 2.4 kg
External Review » Sony Vaio VPCCW21FD
Toshiba Satellite M500-S403: Intel Graphics Media Accelerator (GMA) 4500MHD, 14.10", 2.4 kg
External Review » Toshiba Satellite M500-S403
Acer Aspire 4741G: NVIDIA GeForce 310M, 14.00", 2.2 kg
External Review » Acer Aspire 4741G
Acer Aspire 3820TG-333G25i: ATI Mobility Radeon HD 5470, 13.30", 1.8 kg
External Review » Acer Aspire 3820TG-333G25i
MSI CR720-i3347W7P: Intel Graphics Media Accelerator (GMA) 3150, 17.30", 3 kg
External Review » MSI CR720-i3347W7P
Packard Bell EasyNote TM87-GN-005: Intel Graphics Media Accelerator (GMA) HD Graphics, 15.60", 2.6 kg
External Review » Packard Bell EasyNote TM87-GN-005
Gateway NV59C09u: Intel Graphics Media Accelerator (GMA) HD Graphics, 15.60", 2.6 kg
External Review » Gateway NV59C09u
MSI GE600-i3343W7P: ATI Mobility Radeon HD 5730, 16.00", 2.5 kg
External Review » MSI GE600-i3343W7P
Toshiba Tecra M11-104: Intel Graphics Media Accelerator (GMA) HD Graphics, 14.00", 2.4 kg
External Review » Toshiba Tecra M11-104
HP Compaq Presario CQ62-105TU: Intel Graphics Media Accelerator (GMA) HD Graphics, 15.60", 2.6 kg
External Review » HP Compaq Presario CQ62-105TU
Dell Inspiron 14R: Intel Graphics Media Accelerator (GMA) HD Graphics, 14.00", 2.6 kg
External Review » Dell Inspiron 14R
HP G62-143cl: Intel Graphics Media Accelerator (GMA) HD Graphics, 15.60", 2.9 kg
External Review » HP G62-143cl
Acer Aspire 3820T-334G32Mn: Intel Graphics Media Accelerator (GMA) HD Graphics, 13.30", 1.8 kg
External Review » Acer Aspire 3820T-334G32Mn
Lenovo Thinkpad L412 0530-5ZG: Intel Graphics Media Accelerator (GMA) HD Graphics, 14.00", 2.3 kg
External Review » Lenovo Thinkpad L412 0530-5ZG
Lenovo Thinkpad L512 2597-5VG: Intel Graphics Media Accelerator (GMA) HD Graphics, 15.60", 2.6 kg
External Review » Lenovo Thinkpad L512 2597-5VG
Acer Aspire 5740-333G32Mn: Intel Graphics Media Accelerator (GMA) HD Graphics, 15.60", 2.8 kg
External Review » Acer Aspire 5740-333G32Mn
Acer Aspire 4740-331G32Mn: Intel Graphics Media Accelerator (GMA) HD Graphics, 14.00", 2.4 kg
External Review » Acer Aspire 4740-331G32Mn
Dell Inspiron 1464: Intel Graphics Media Accelerator (GMA) HD Graphics, 14.10", 2.2 kg
External Review » Dell Inspiron 1464
Sony Vaio VPCEB16FG: ATI Mobility Radeon HD 5650, 15.50", 2.7 kg
External Review » Sony Vaio VPCEB16FG
Toshiba Satellite Pro S500-11C: Intel Graphics Media Accelerator (GMA) HD Graphics, 15.60", 2.6 kg
External Review » Toshiba Satellite Pro S500-11C
Toshiba Qosmio F60-10X: NVIDIA GeForce GT 330M, 15.60", 2.9 kg
External Review » Toshiba Qosmio F60-10X
Sony Vaio VPCCW2S1R/L: NVIDIA GeForce GT 330M, 14.00", 2.3 kg
External Review » Sony Vaio VPCCW2S1R/L
Samsung R430-JB01: Intel Graphics Media Accelerator (GMA) HD Graphics, 14.00", 2.2 kg
External Review » Samsung R430-JB01
Lenovo IdeaPad Y560-3B: ATI Mobility Radeon HD 5730, 15.60", 2.6 kg
External Review » Lenovo IdeaPad Y560-3B
Lenovo IdeaPad Y460-3A-B: ATI Mobility Radeon HD 5650, 14.00", 2.2 kg
External Review » Lenovo IdeaPad Y460-3A-B
Sony Vaio VPCEA1S1E/B: ATI Mobility Radeon HD 5145, 14.00", 2.4 kg
External Review » Sony Vaio VPCEA1S1E/B
Packard Bell EasyNote TJ75-GN-520: ATI Mobility Radeon HD 5470, 15.60", 2.7 kg
External Review » Packard Bell EasyNote TJ75-GN-520
Toshiba Tecra A11-10E: Intel Graphics Media Accelerator (GMA) HD Graphics, 15.60", 2.6 kg
External Review » Toshiba Tecra A11-10E
Sony Vaio VPCEA1S1E/P: ATI Mobility Radeon HD 5145, 14.00", 2.4 kg
External Review » Sony Vaio VPCEA1S1E/P
Packard Bell EasyNote TM86-GN-005UK: Intel Graphics Media Accelerator (GMA) HD Graphics, 15.60", 2.6 kg
External Review » Packard Bell EasyNote TM86-GN-005UK
Acer Aspire 3820TG-334G50N: ATI Mobility Radeon HD 5470, 13.30", 1.8 kg
External Review » Acer Aspire 3820TG-334G50N
Toshiba Satellite Pro S500-115: Intel Graphics Media Accelerator (GMA) HD Graphics, 15.60", 2.6 kg
External Review » Toshiba Satellite Pro S500-115
Medion Akoya E6214/MD98330: Intel Graphics Media Accelerator (GMA) HD Graphics, 15.60", 2.8 kg
External Review » Medion Akoya E6214/MD98330
Acer Aspire 4740G: NVIDIA GeForce 310M, 14.00", 2.6 kg
External Review » Acer Aspire 4740G
Toshiba Satellite A505-S6004: Intel Graphics Media Accelerator (GMA) HD Graphics, 16.00", 3.3 kg
External Review » Toshiba Satellite A505-S6004
HP G62t: Intel Graphics Media Accelerator (GMA) HD Graphics, 15.60", 2.5 kg
External Review » HP G62t
Gateway NV5934u: NVIDIA GeForce 310M, 15.60", 2.7 kg
External Review » Gateway NV5934u
Sony Vaio VPCEB1M1E/BJ: ATI Mobility Radeon HD 5650, 15.50", 2.7 kg
External Review » Sony Vaio VPCEB1M1E/BJ
Sony Vaio VPC-EC1M1E: ATI Mobility Radeon HD 5470, 17.30", 3.1 kg
External Review » Sony Vaio VPC-EC1M1E
Sony Vaio VPCS11B7E/B: Intel Graphics Media Accelerator (GMA) HD Graphics, 13.30", 2 kg
External Review » Sony Vaio VPCS11B7E/B
Toshiba Qosmio F60: NVIDIA GeForce GT 330M, 15.60", 2.9 kg
External Review » Toshiba Qosmio F60
MSI A6200-038US: Intel Graphics Media Accelerator (GMA) HD Graphics, 15.60", 2.5 kg
External Review » MSI A6200-038US
Acer Aspire 5740-5513: Intel Graphics Media Accelerator (GMA) HD Graphics, 15.60", 2.8 kg
External Review » Acer Aspire 5740-5513
Toshiba Satellite U500-1EX: Intel Graphics Media Accelerator (GMA) HD Graphics, 13.30", 2.3 kg
External Review » Toshiba Satellite U500-1EX
Lenovo ThinkPad Edge 14: Intel Graphics Media Accelerator (GMA) HD Graphics, 14.00", 2.5 kg
External Review » Lenovo ThinkPad Edge 14
Sony Vaio VPCEA1S1E/W: ATI Mobility Radeon HD 5145, 14.10", 2.3 kg
External Review » Sony Vaio VPCEA1S1E/L
Acer Aspire 5741G-334G50Mn: ATI Mobility Radeon HD 5470, 15.60", 2.5 kg
External Review » Acer Aspire 5741G-334G50Mn
Toshiba Satellite L550-207: ATI Mobility Radeon HD 5165, 17.30", 3.1 kg
External Review » Toshiba Satellite L550-207
Sony Vaio VPC-CW2S1E/L: NVIDIA GeForce GT 330M, 14.00", 2.3 kg
External Review » Sony Vaio VPC-CW2S1E/L
Acer Aspire 5740G-5309: ATI Mobility Radeon HD 5470, 15.60", 2.7 kg
External Review » Acer Aspire AS5740G-5309
Toshiba Satellite L500-1UU: ATI Mobility Radeon HD 5145, 15.60", 2.9 kg
External Review » Toshiba Satellite L500-1UU
Toshiba Satellite L505-13V: ATI Mobility Radeon HD 5165, 15.60", 2.9 kg
External Review » Toshiba Satellite L505-13V
Dell Vostro 3700: Intel Graphics Media Accelerator (GMA) HD Graphics, 17.30", 2.7 kg
External Review » Dell Vostro 3700
Toshiba Satellite M505-S4020: Intel Graphics Media Accelerator (GMA) HD Graphics, 14.00", 2.3 kg
External Review » Toshiba Satellite M505-S4020
Dell Inspiron 1764-7629OBK: Intel Graphics Media Accelerator (GMA) HD Graphics, 17.30", 2.8 kg
External Review » Dell Inspiron 1764-7629OBK
Dell Inspiron 1564-6980CRD: Intel Graphics Media Accelerator (GMA) HD Graphics, 15.60", 2.4 kg
External Review » Dell Inspiron 1564-6980CRD
Toshiba Satellite A505-S6025: NVIDIA GeForce 310M, 16.00", 2.8 kg
External Review » Toshiba Satellite A505-S6025
Dell Inspiron 1564: Intel Graphics Media Accelerator (GMA) HD Graphics, 15.60", 2.5 kg
External Review » Dell Inspiron 1564
Sony Vaio VPC-EB12FX/T: Intel Graphics Media Accelerator (GMA) HD Graphics, 15.50", 2.7 kg
External Review » Sony Vaio VPC-EB12FX/T
Gateway NV5933u: Intel Graphics Media Accelerator (GMA) HD Graphics, 15.60", 2.8 kg
External Review » Gateway NV5933u
Fujitsu Lifebook AH550: Intel Graphics Media Accelerator (GMA) HD Graphics, 15.60", 2.9 kg
External Review » Fujitsu Lifebook AH550
MSI CR620: Intel Graphics Media Accelerator (GMA) HD Graphics, 17.00", 2.6 kg
External Review » MSI CR620
Toshiba Satellite L505-GS5035: Intel Graphics Media Accelerator (GMA) HD Graphics, 15.60", 2.7 kg
External Review » Toshiba Satellite L505-GS5035
HP Pavilion dv4-2155dx: Intel Graphics Media Accelerator (GMA) HD Graphics, 14.10", 2.4 kg
External Review » HP Pavilion dv4-2155dx
Asus U50F-RBBAG05: Intel Graphics Media Accelerator (GMA) HD Graphics, 15.60", 2.8 kg
External Review » Asus U50F-RBBAG05
Acer Aspire 5740-333G25Mi: Intel Graphics Media Accelerator (GMA) HD Graphics, 15.60", 3.1 kg
External Review » Acer Aspire 5740-333G25Mi
Packard Bell Easynote TJ75-JO-101RU : ATI Mobility Radeon HD 5650, 15.60", 2.7 kg
External Review » Packard Bell Easynote TJ75-JO-101RU
Acer Aspire 5740G-333G25Mi : ATI Mobility Radeon HD 5470, 15.60", 2.6 kg
External Review » Acer Aspire 5740G-333G25Mi
Sony Vaio VPC-S11M1E: NVIDIA GeForce 310M, 13.30", 2 kg
External Review » Sony Vaio VPC-S11M1E
Medion P6622: NVIDIA GeForce GT 330M, 15.60", 2.8 kg
External Review » Medion P6622
Sony Vaio VPC-CW2S1E/R: NVIDIA GeForce GT 330M, 14.00", 2.4 kg
External Review » Sony Vaio VPC-CW2S1E/R
Sony Vaio VPC-EB1S0E: ATI Mobility Radeon HD 5470, 15.50", 2.7 kg
External Review » Sony Vaio VPC-EB1S0E
Dell Inspiron i1464-4382OBK : Intel Graphics Media Accelerator (GMA) HD Graphics, 14.10", 2.2 kg
External Review » Dell Inspiron i1464-4382OBK
HP Pavilion dv6-2150us: Intel Graphics Media Accelerator (GMA) HD Graphics, 15.60", 2.9 kg
External Review » HP Pavilion dv6-2150us
Acer Aspire 7740-5691: Intel Graphics Media Accelerator (GMA) HD Graphics, 17.30", 3 kg
External Review » Acer Aspire 7740-5691
Gateway NV7915u: Intel Graphics Media Accelerator (GMA) HD Graphics, 17.30", 3.3 kg
External Review » Gateway NV7915u
Toshiba Satellite P505-S8010: NVIDIA GeForce 310M, 18.40", 4 kg
External Review » Toshiba Satellite P505-S8010
Sony Vaio VPC-EB1JFX/B: Intel Graphics Media Accelerator (GMA) HD Graphics, 15.50", 2.7 kg
External Review » Sony Vaio VPC-EB1JFX/B
Acer Aspire 5740G-332G32Mn: ATI Mobility Radeon HD 5470, 15.60", 2.5 kg
External Review » Acer Aspire 5740G-332G32Mn
Acer Aspire 8942G-334G64Mn: ATI Mobility Radeon HD 5650, 18.40", 3.9 kg
External Review » Acer Aspire 8942G-334G64Mn
HP Pavilion dv4-2153cl: Intel Graphics Media Accelerator (GMA) 4500MHD, 14.10", 2.4 kg
External Review » HP Pavilion dv4-2153cl