

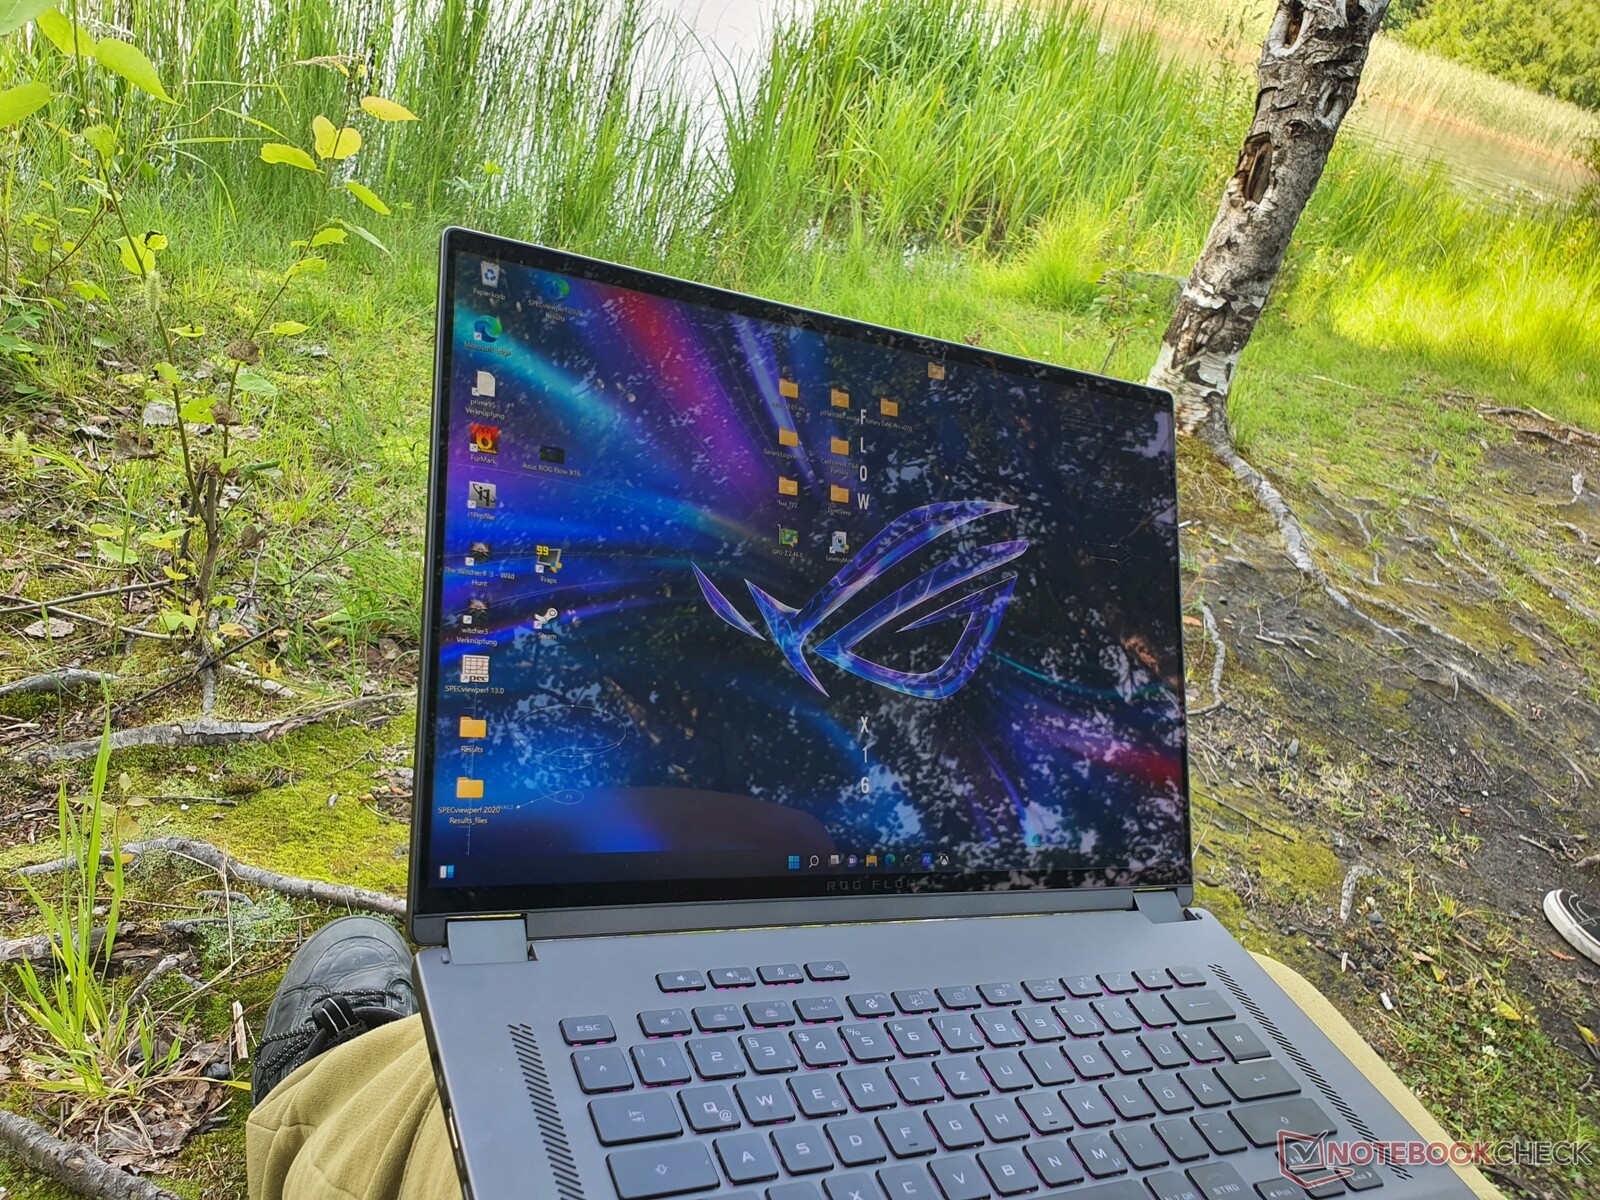
Asus ROG Flow X16 laptop review: 2-in-1 gamer with mini-LED
A 1,100 nit-strong mini-LED display makes its debut in the Asus ROG Flow X16, which also derives its uniqueness from its convertible design. An RTX 3070 Ti with a 125 watts of TGP makes it a real gaming notebook with high-end multimedia features hotly anticipated by many.
We have been able to thoroughly examine a pre-production sample device in detail. Since this review model is representative of the production model (according to Asus), we have taken the liberty of giving it a rating. Minor changes to the device are expected until the final production version, which will be reflected accordingly in updates to this review. We are also reviewing the ROG XG Mobile graphics dock (available separately) with its GeForce RTX 3080 Laptop GPU on the Flow X16 (a similar test was also carried out with the ROG Flow X13 last year), and will provide the results as an update in this review soon.
The Asus ROG Flow X16 forms Asus' 2-in-1 gaming laptop series together with its popular and almost just-as-unique sibling, the ROG Flow X13 from last year, as well as the ROG Flow Z13 (2-in1 tablet). The 16-inch QHD display in a 16:10 format offers an OLED-like black level thanks to mini-LED and also advertises DCI-P3 color space coverage for professional image editing. The touchscreen with pen input support is conceivably useful for creative work, and AMD's Ryzen 6900HS also promises a lot of potential. While all these specs read wonderfully on paper, our review reveals to what extent this raw power can be fully utilized in the compact Asus convertible and what any drawbacks might be.
Our sample model of the Asus Rog Flow X16 with a Nvidia GeForce RTX 3070 Ti, 32 GB of RAM and a 1 TB SSD does not yet appear to be widely available. Depending on your location, identical (i.e. identical hardware with a region-specific keyboard layout) or slighly different configurations may be available at varying prices, usually starting around US$2500.00. See "Price and Availability" at the end of this review for further details.
Direct competitors for the unique, compact 16-inch convertible are far and few in between. Nevertheless, the Asus Rog Flow X16 is primarily designed for creative tasks, multimedia and gaming, so we compared it to the following notebooks: Gigabyte Aero 16, MSI Stealth GS66, Lenovo Legion 5 Pro, Lenovo ThinkPad X1 Extreme, MacBook Pro 16 (2021), Microsoft's Surface Laptop Studio, Dell's compact XPS 17 and Asus' in-house Zephyrus M16.
The latter is similar to the ROG X16 Flow in many ways, which we point out at various points in our review. The comparison to the smaller ROG Flow X13 is certainly interesting, as well as the comparison to traditional, thick gaming behemoths such as Asus' ROG Strix Scar 15. The HP Spectre 16 convertible with an Intel Core i7-12700H, mid-range Arc graphics and a 3K OLED touchscreen will be available around the end of August and could also be of interest for a target group not primarily interested in gaming. Lenovo's Legion Slim 7i will also reportedly use mini-LED.
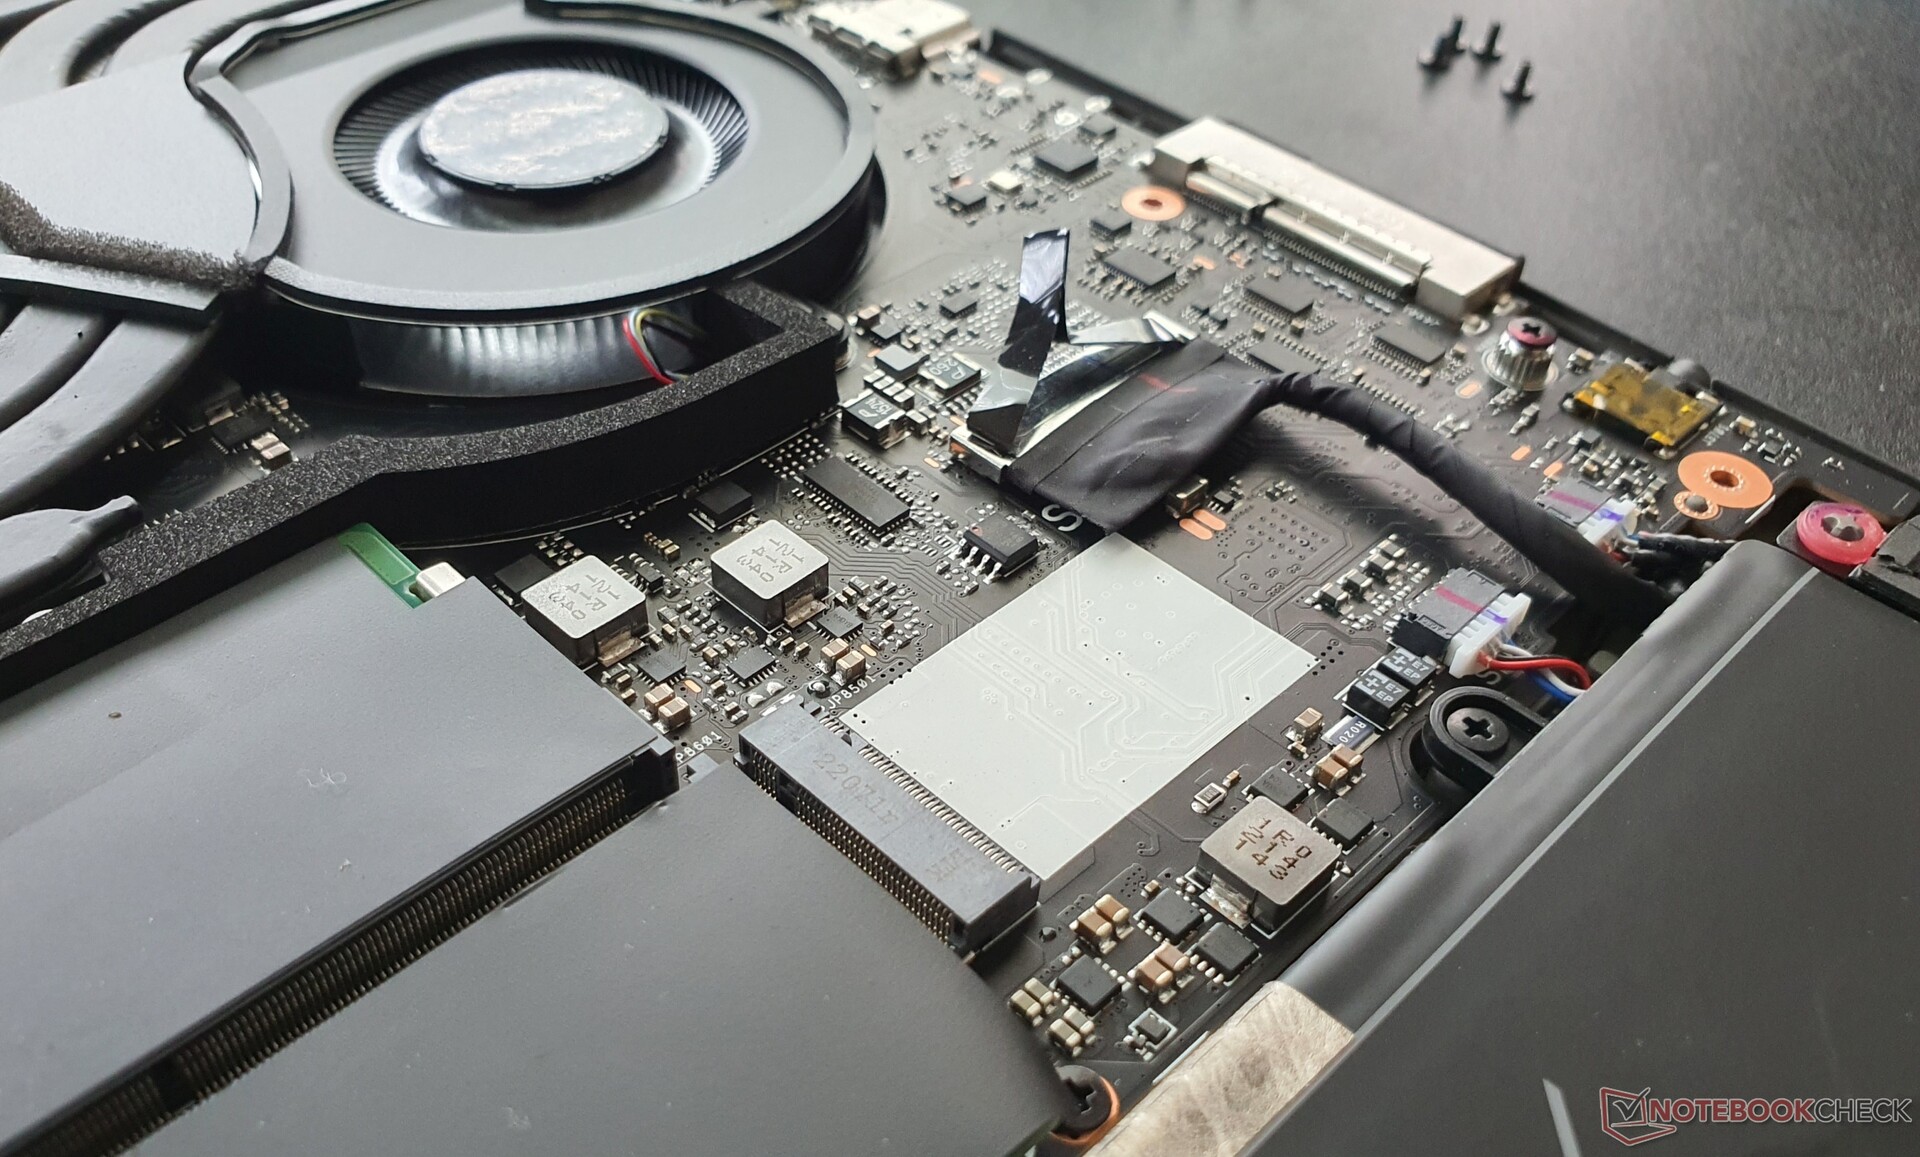
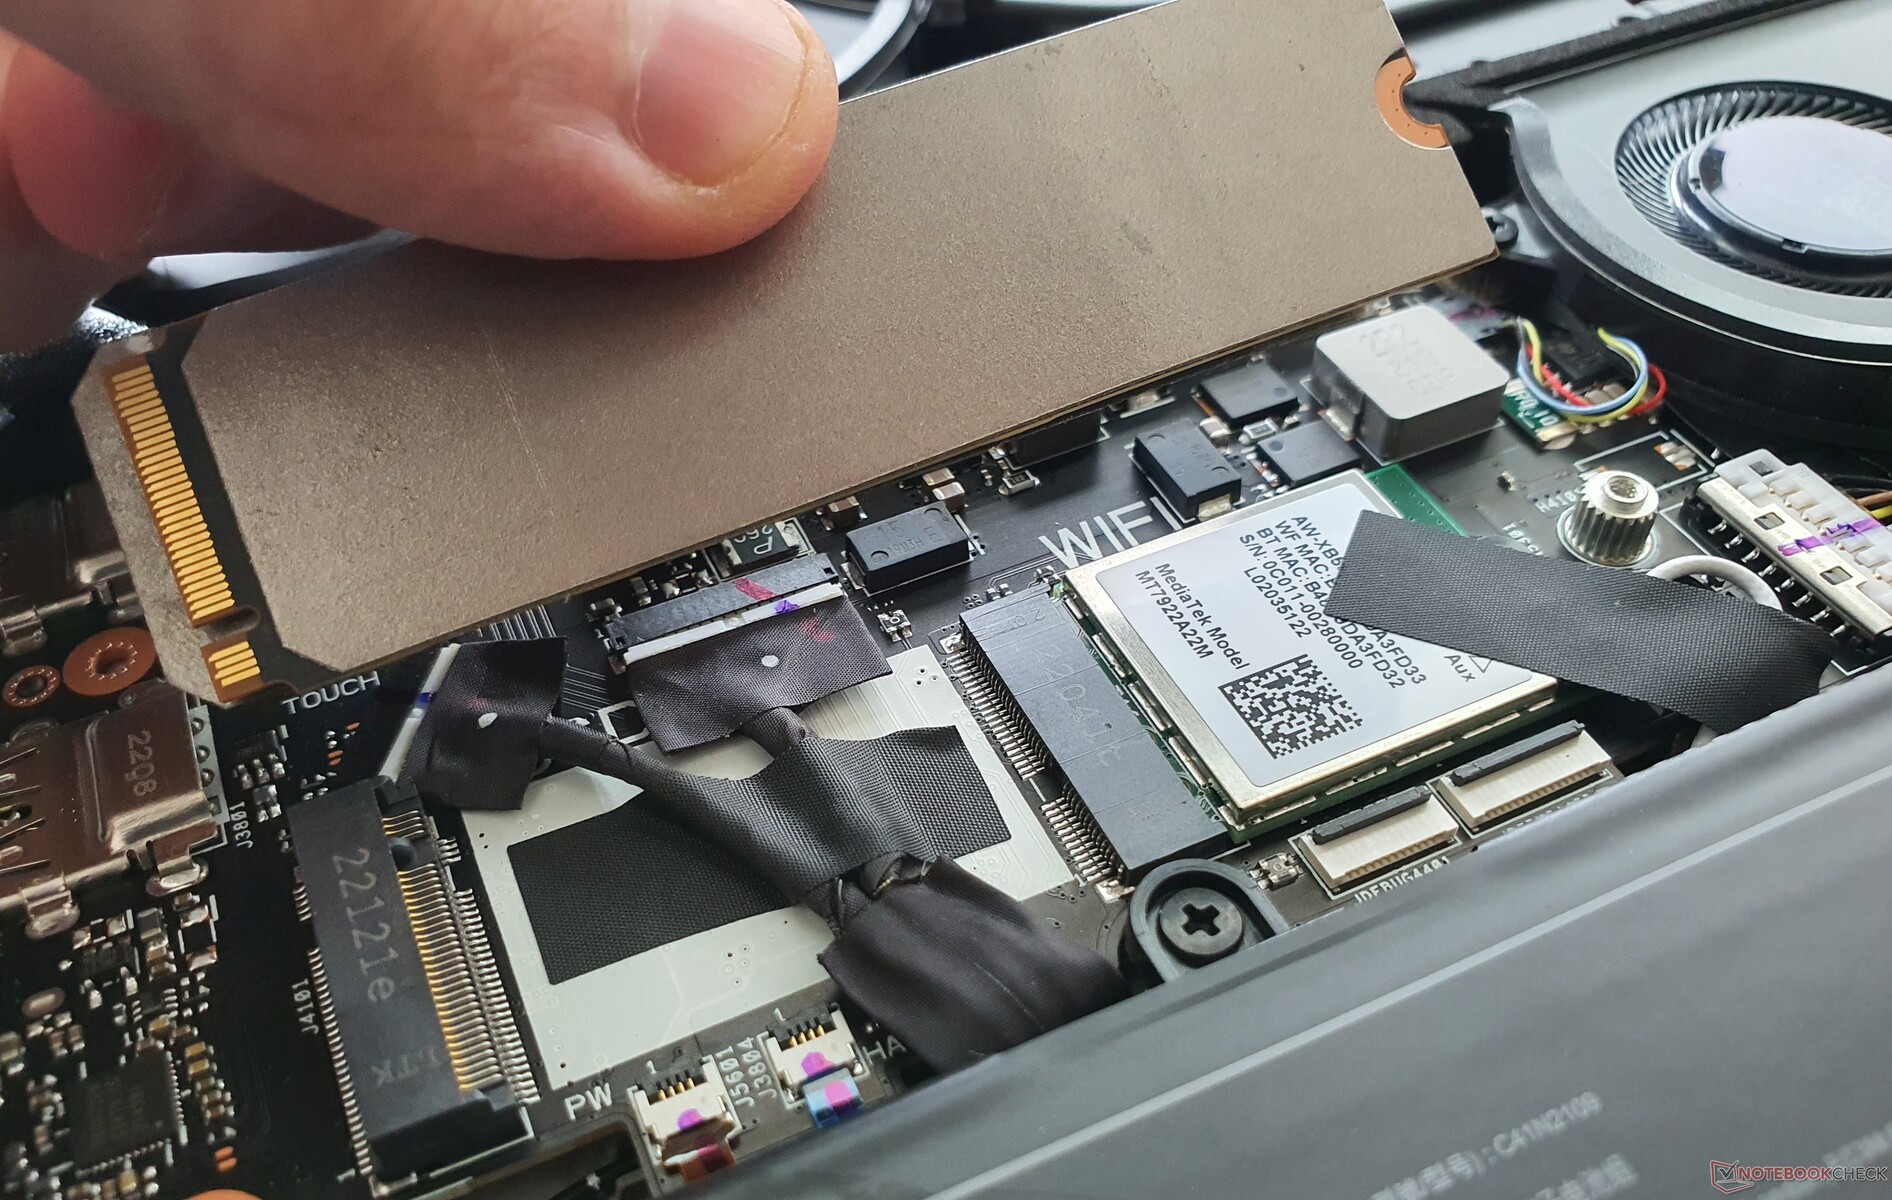
Update 9-30-2022: The author of this article had corrected an error right after the original German review was published. Unfortunately, it did not change for the English review, which readers pointed out. The second M.2 slot is standard size, i.e., M.2 2280 and not M.2 2242, as previously described.
Possible Competitors in Comparison
Rating | Date | Model | Weight | Height | Size | Resolution | Price |
|---|---|---|---|---|---|---|---|
| 89.5 % v7 (old) | 08 / 2022 | Asus ROG Flow X16 GV601RW-M5082W R9 6900HS, GeForce RTX 3070 Ti Laptop GPU | 2.1 kg | 19.4 mm | 16.10" | 2560x1600 | |
| 85.6 % v7 (old) | 07 / 2021 | Asus ROG Zephyrus M16 GU603H i9-11900H, GeForce RTX 3070 Laptop GPU | 2 kg | 20 mm | 16.00" | 2560x1600 | |
| 86.3 % v7 (old) | 05 / 2022 | Asus ROG Strix Scar 15 G533ZW-LN106WS i9-12900H, GeForce RTX 3070 Ti Laptop GPU | 2.3 kg | 27.2 mm | 15.60" | 2560x1440 | |
| 84.7 % v7 (old) | 03 / 2022 | Gigabyte Aero 16 YE5 i9-12900HK, GeForce RTX 3080 Ti Laptop GPU | 2.3 kg | 22.4 mm | 16.00" | 3840x2400 | |
| 88 % v7 (old) | 03 / 2022 | Lenovo Legion 5 Pro 16 G7 i7 RTX 3070Ti i7-12700H, GeForce RTX 3070 Ti Laptop GPU | 2.6 kg | 26.6 mm | 16.00" | 2560x1600 | |
| 84.5 % v7 (old) | 02 / 2022 | MSI Stealth GS66 12UGS i7-12700H, GeForce RTX 3070 Ti Laptop GPU | 2.2 kg | 19.8 mm | 15.60" | 2560x1440 | |
| 93.2 % v7 (old) | 11 / 2021 | Apple MacBook Pro 16 2021 M1 Pro M1 Pro, M1 Pro 16-Core GPU | 2.2 kg | 16.8 mm | 16.20" | 3456x2234 | |
| 88.3 % v7 (old) | 12 / 2021 | Lenovo ThinkPad X1 Extreme G4-20Y50040GE i9-11950H, GeForce RTX 3080 Laptop GPU | 1.9 kg | 18.2 mm | 16.00" | 3840x2400 | |
| 88.8 % v7 (old) | 05 / 2022 | Dell XPS 17 9720 RTX 3060 i7-12700H, GeForce RTX 3060 Laptop GPU | 2.5 kg | 19.5 mm | 17.00" | 3840x2400 | |
| 89 % v7 (old) | 03 / 2022 | Microsoft Surface Laptop Studio i7 RTX 3050 Ti i7-11370H, GeForce RTX 3050 Ti Laptop GPU | 1.8 kg | 19 mm | 14.40" | 2400x1600 | |
| 84.7 % v7 (old) | 02 / 2021 | Asus ROG Flow X13 GV301QH R9 5980HS, GeForce GTX 1650 Max-Q | 1.4 kg | 15.8 mm | 13.40" | 3840x2400 |
Case - Stable gaming laptop from Asus
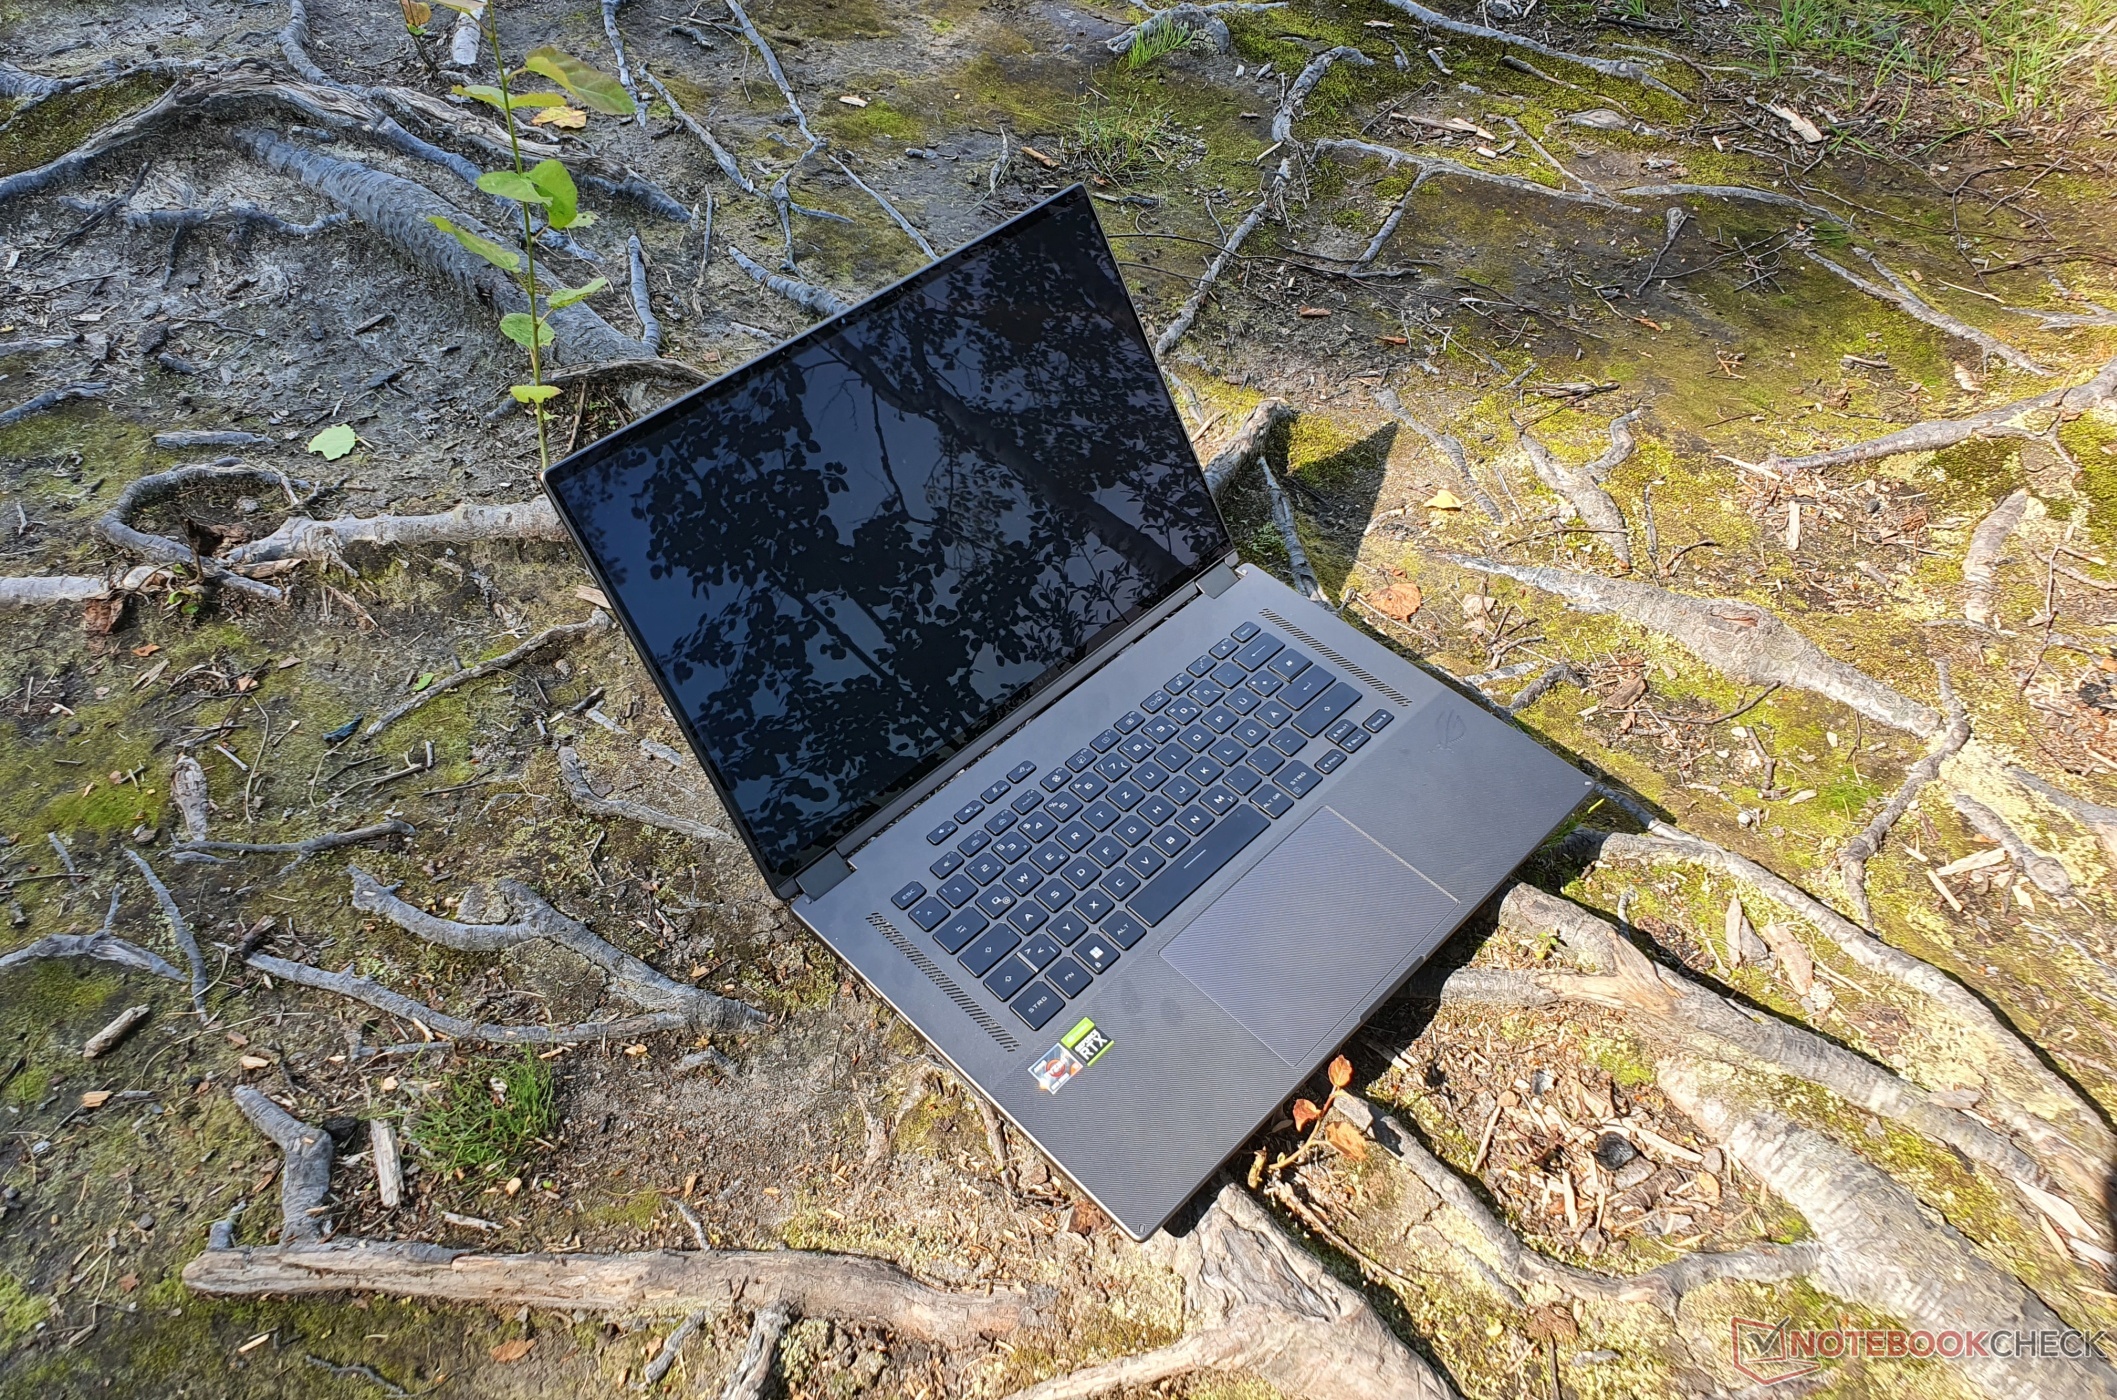
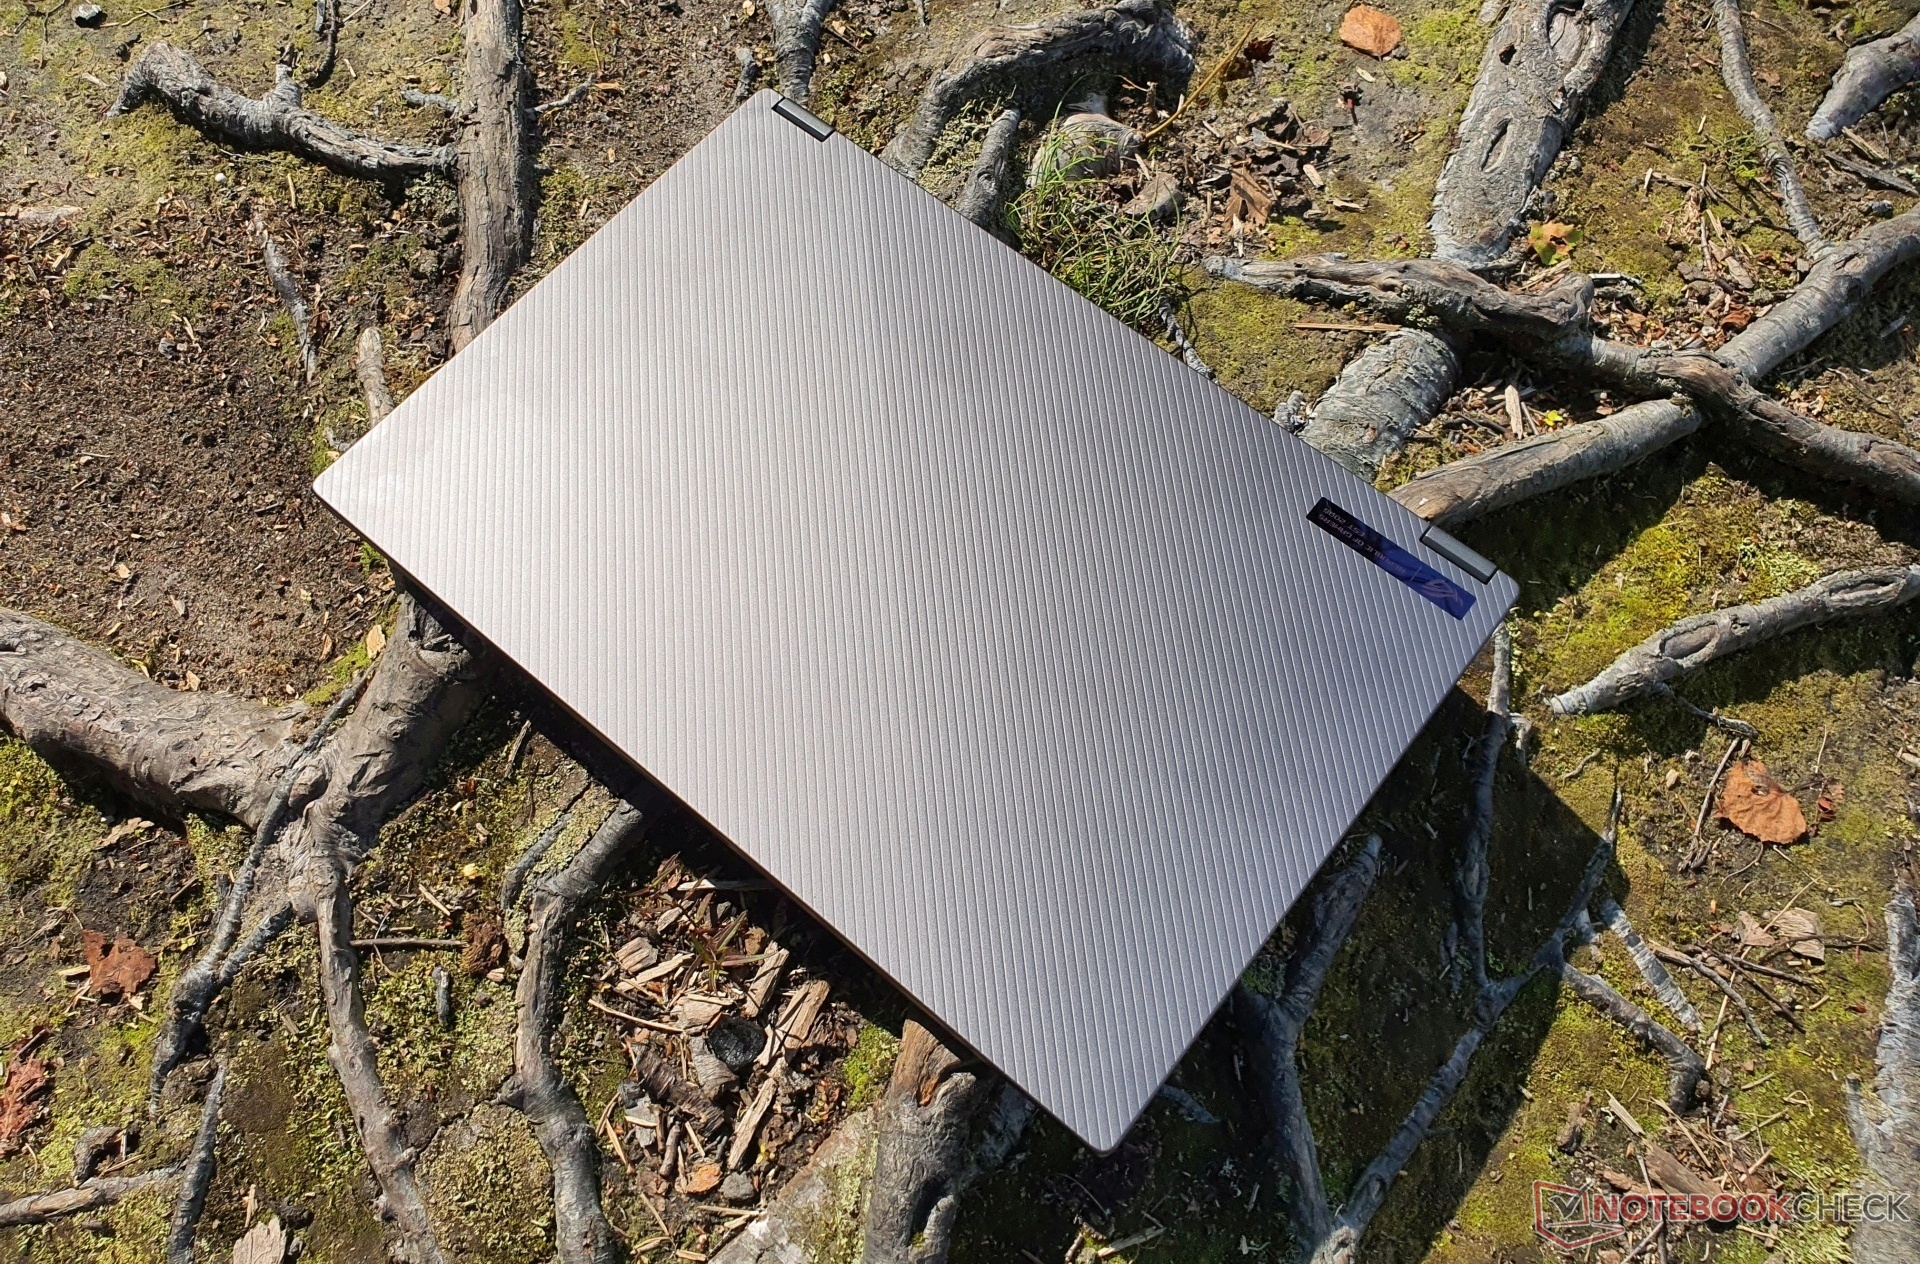
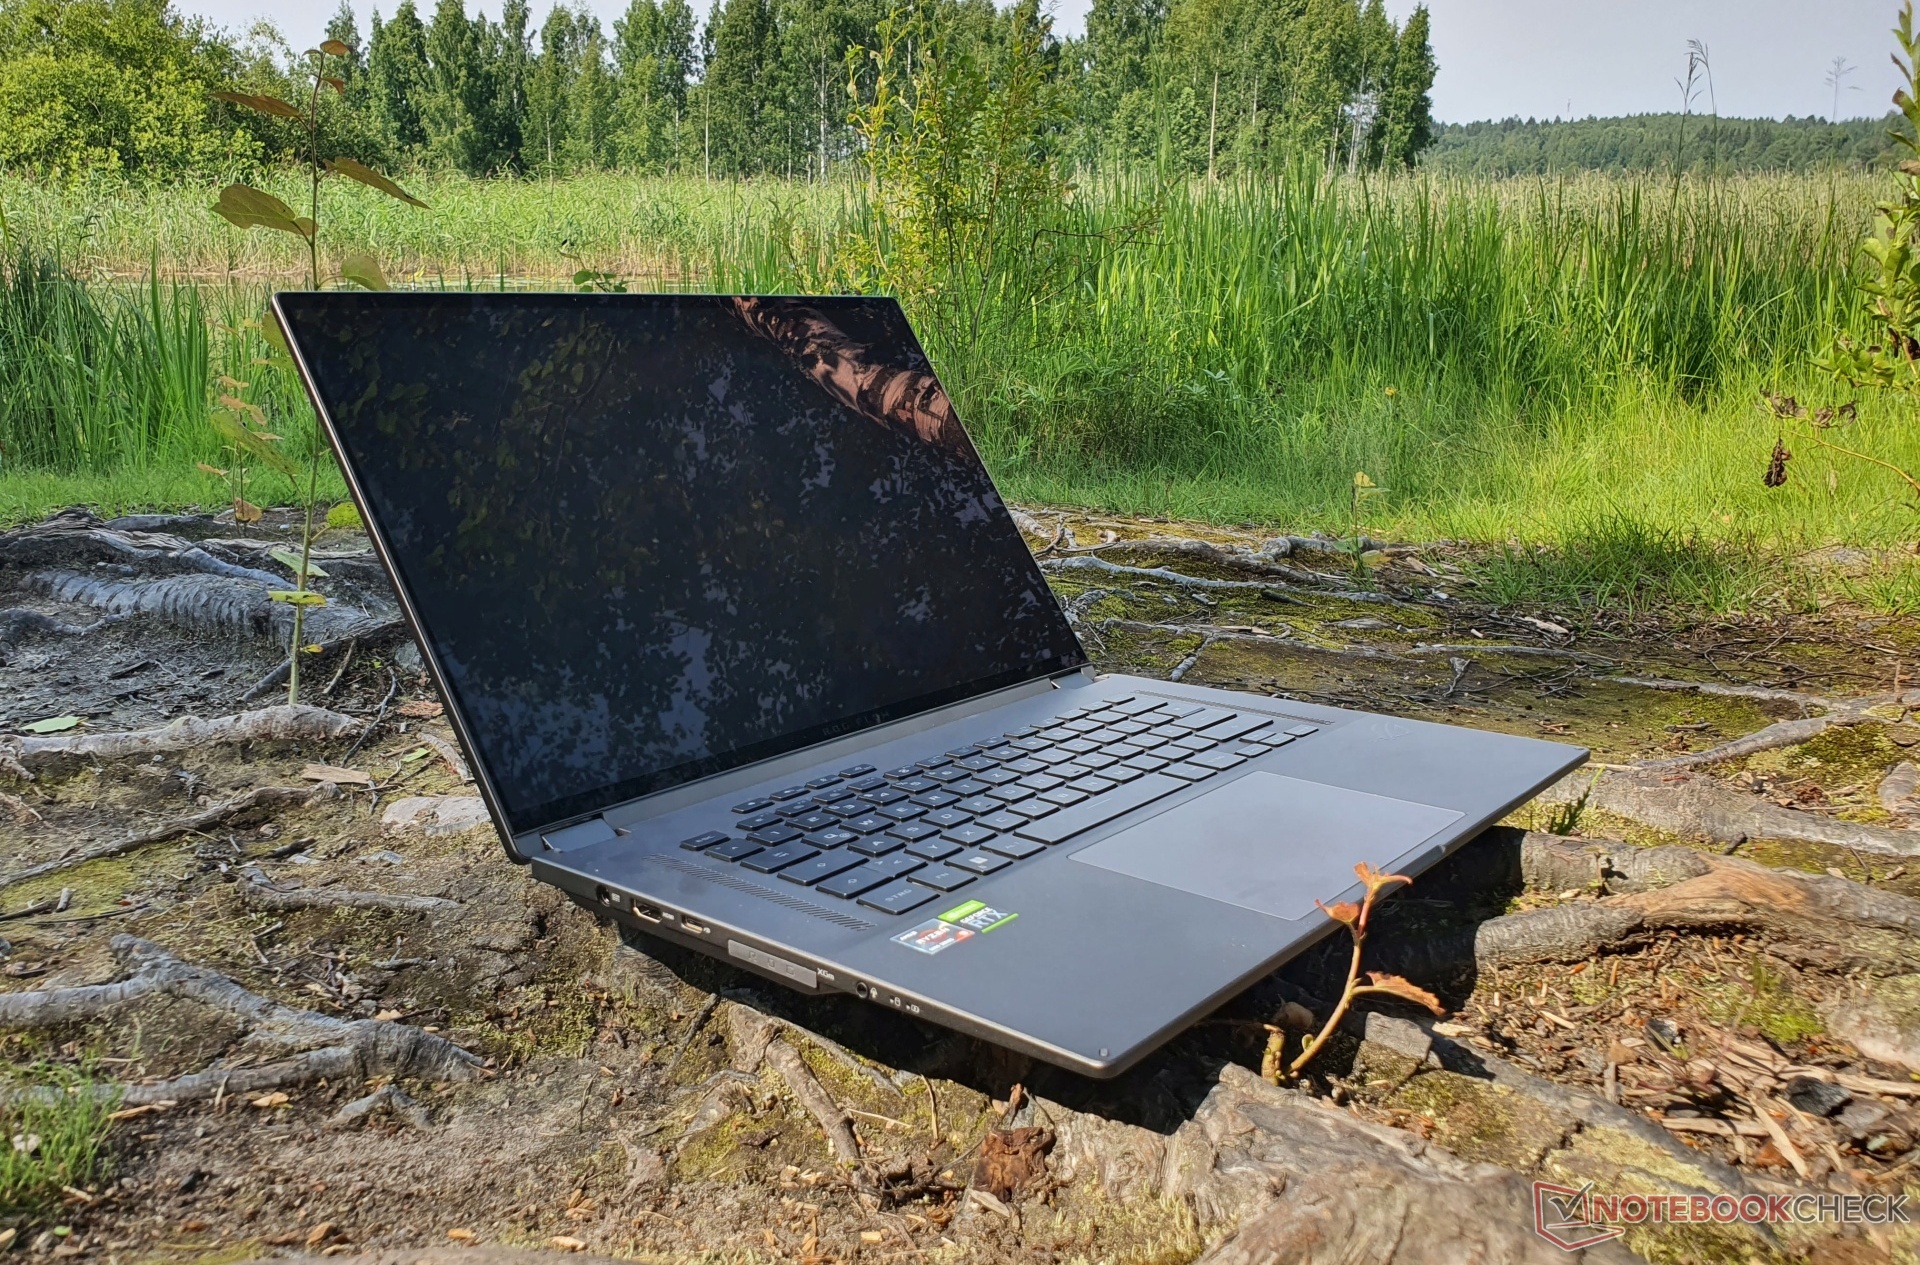
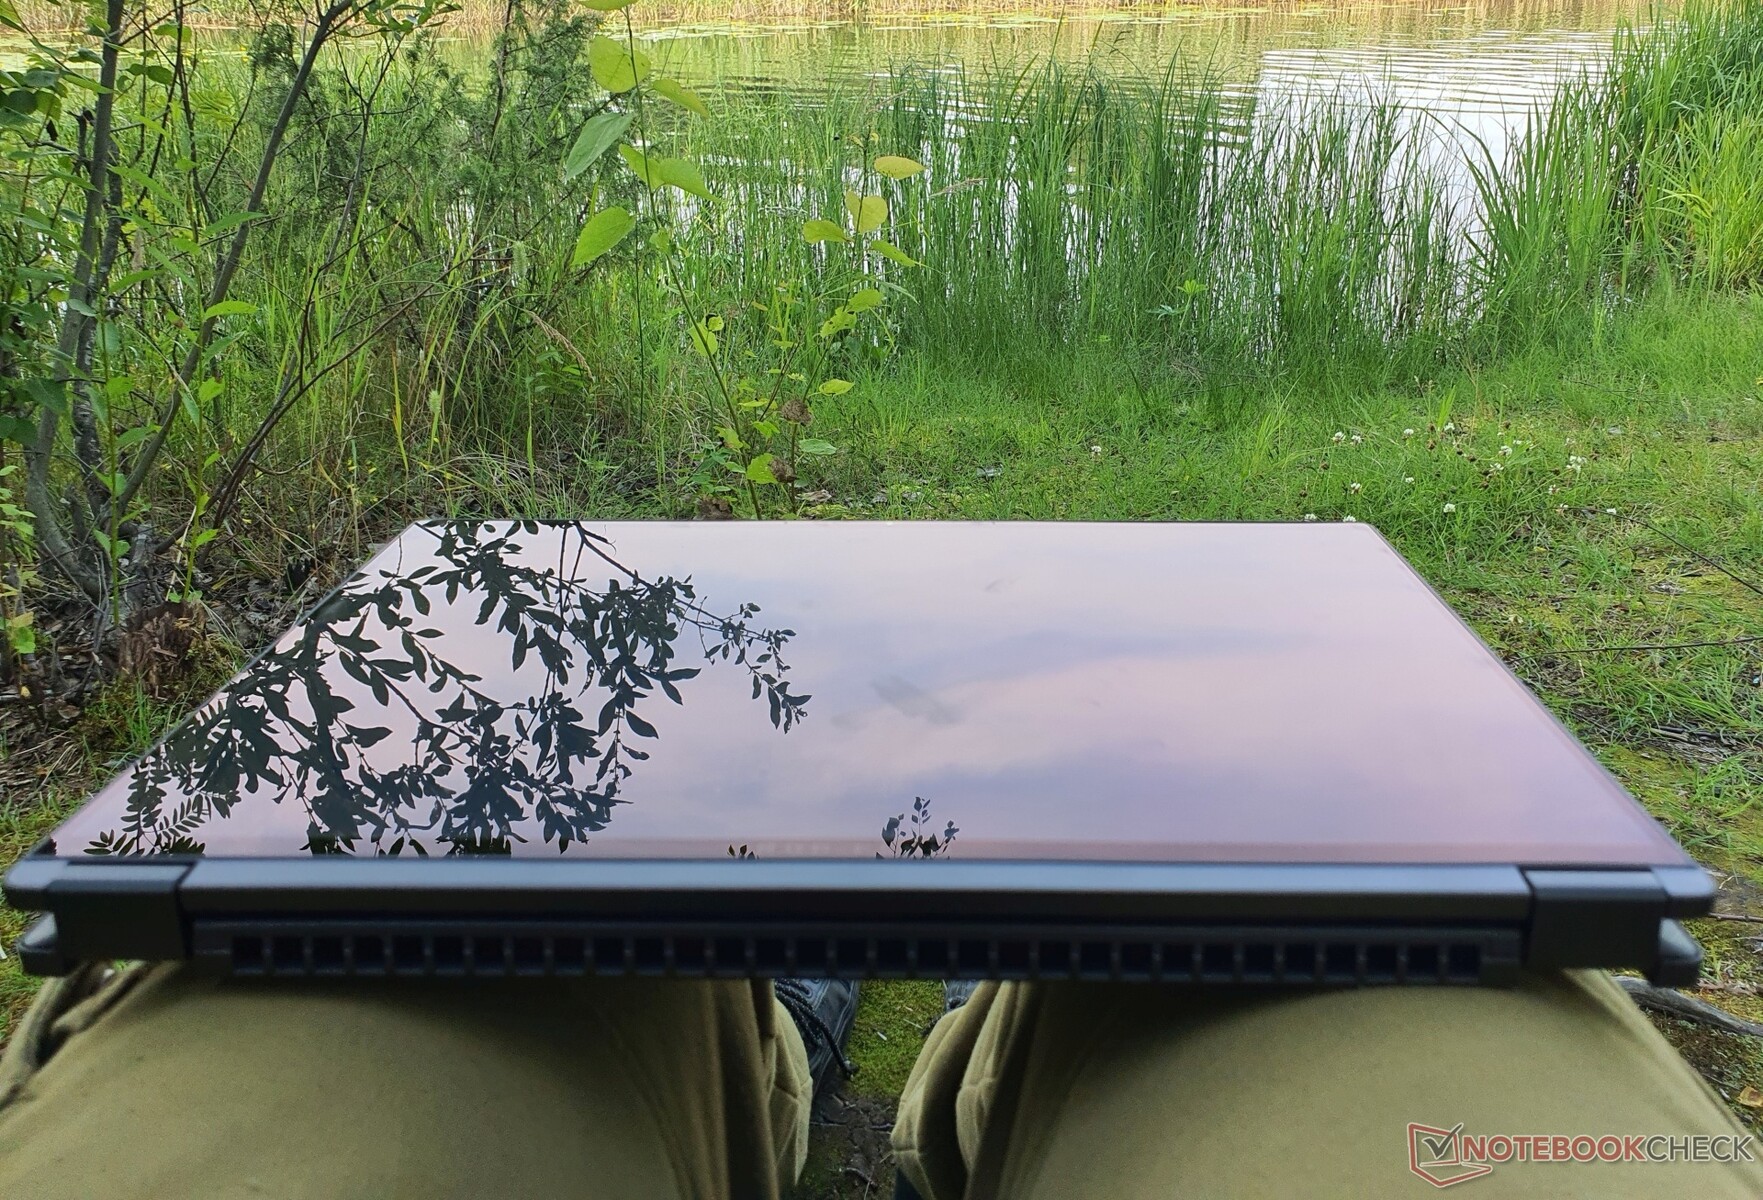
In principle, the ROG Flow X16 is a mix of the smaller Flow X13 and the Zephyrus M16: The distinctive fluting on the iron-gray plastic lid of the former has been replicated, as well as the general shape and silhouette, which are only in a larger size. The base unit, including the baseplate, resemble the Zephyrus M16.
Asus uses a lot of magnesium, so the device feels very high-quality overall. However, the lid and base plate are made of soft plastic and are especially susceptible to scratches. This reduces our initially positive impression somewhat.
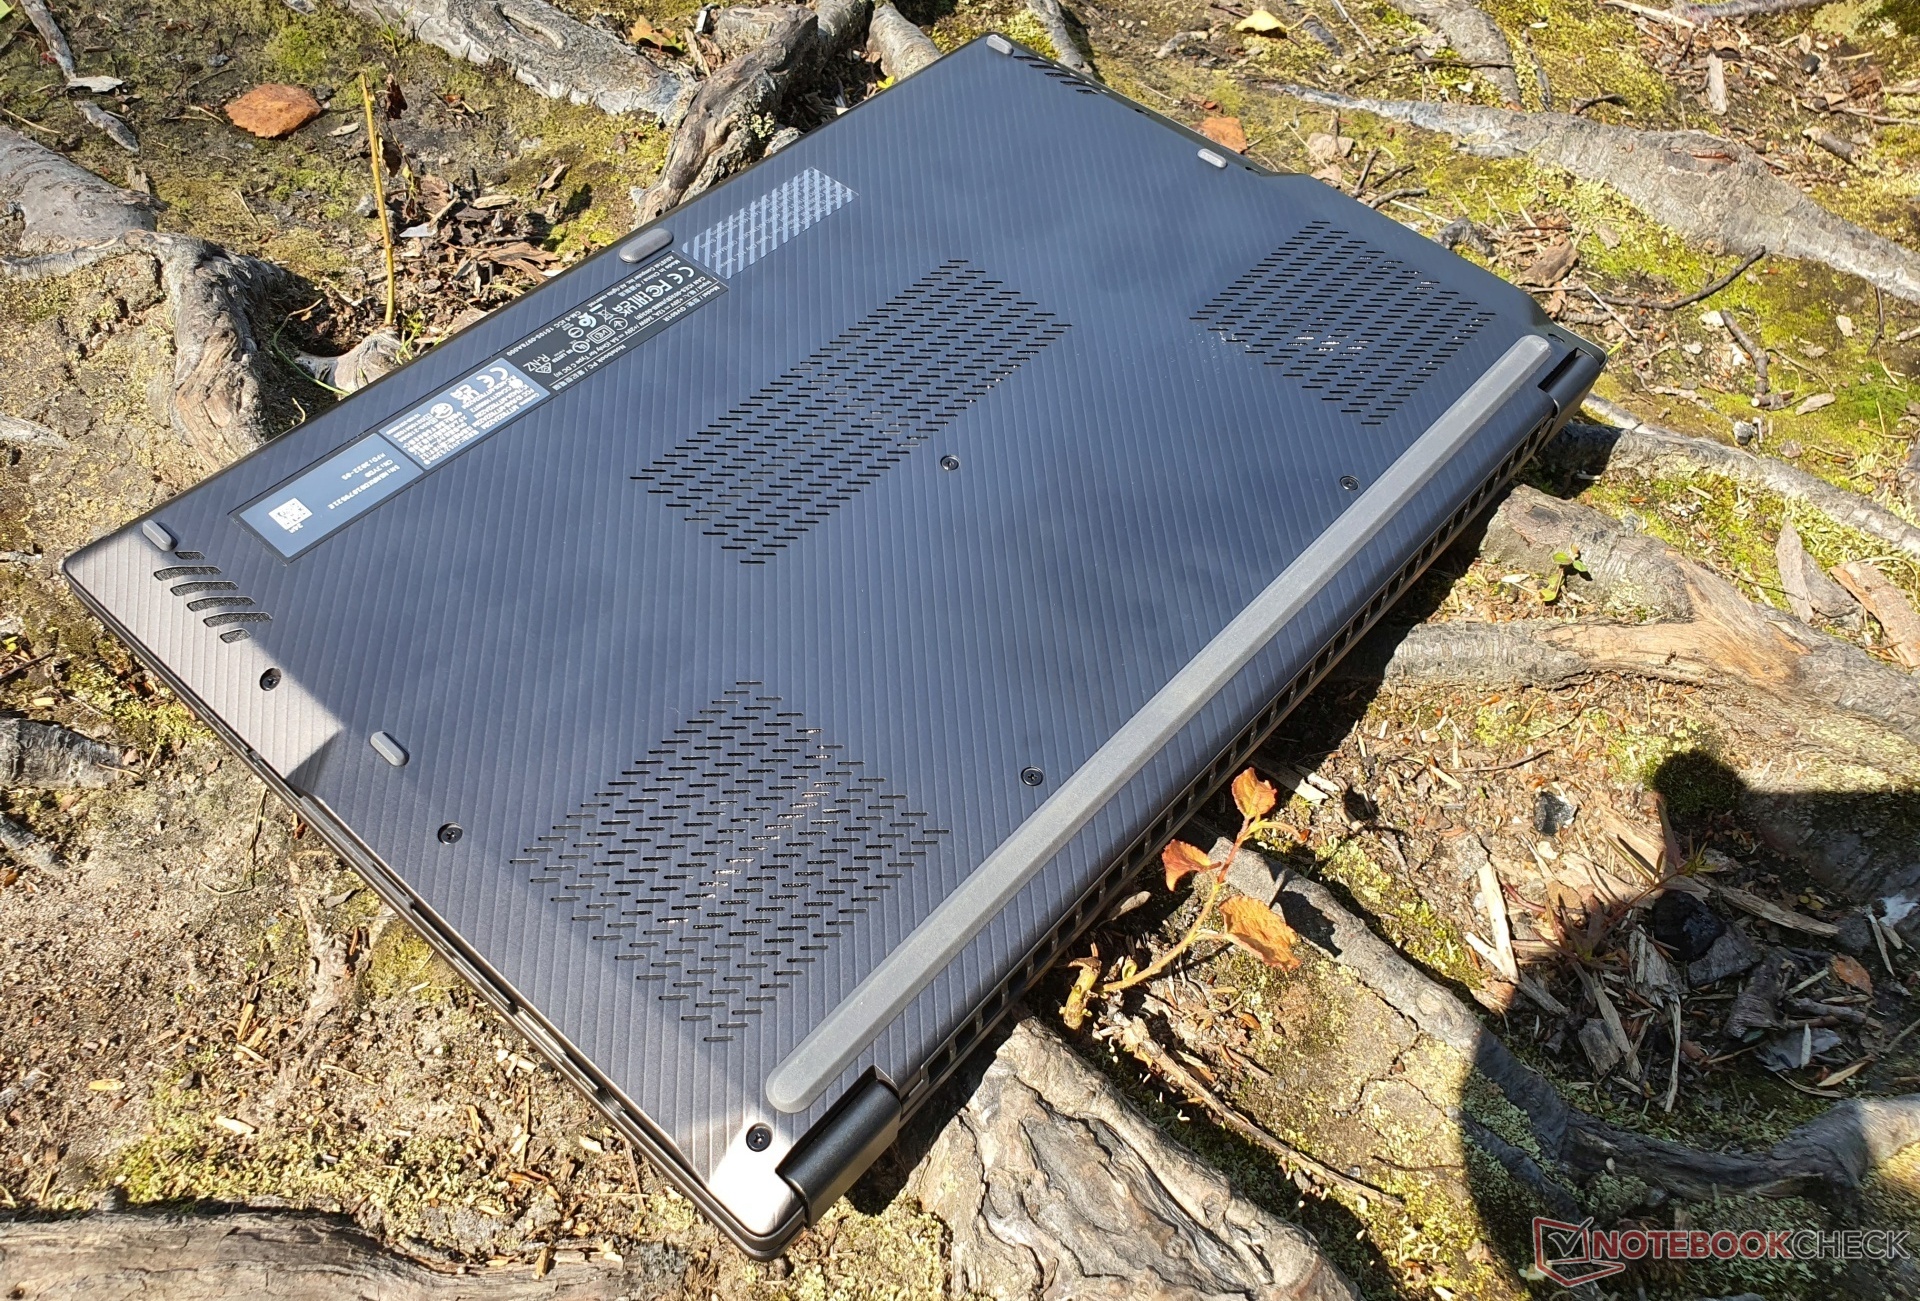
Targeted pressure on the back of the display does not cause image distortions and the baseplate is held in place by 13 screws. When detached from the unit, however, the baseplate turns out to be a flexible piece of plastic.
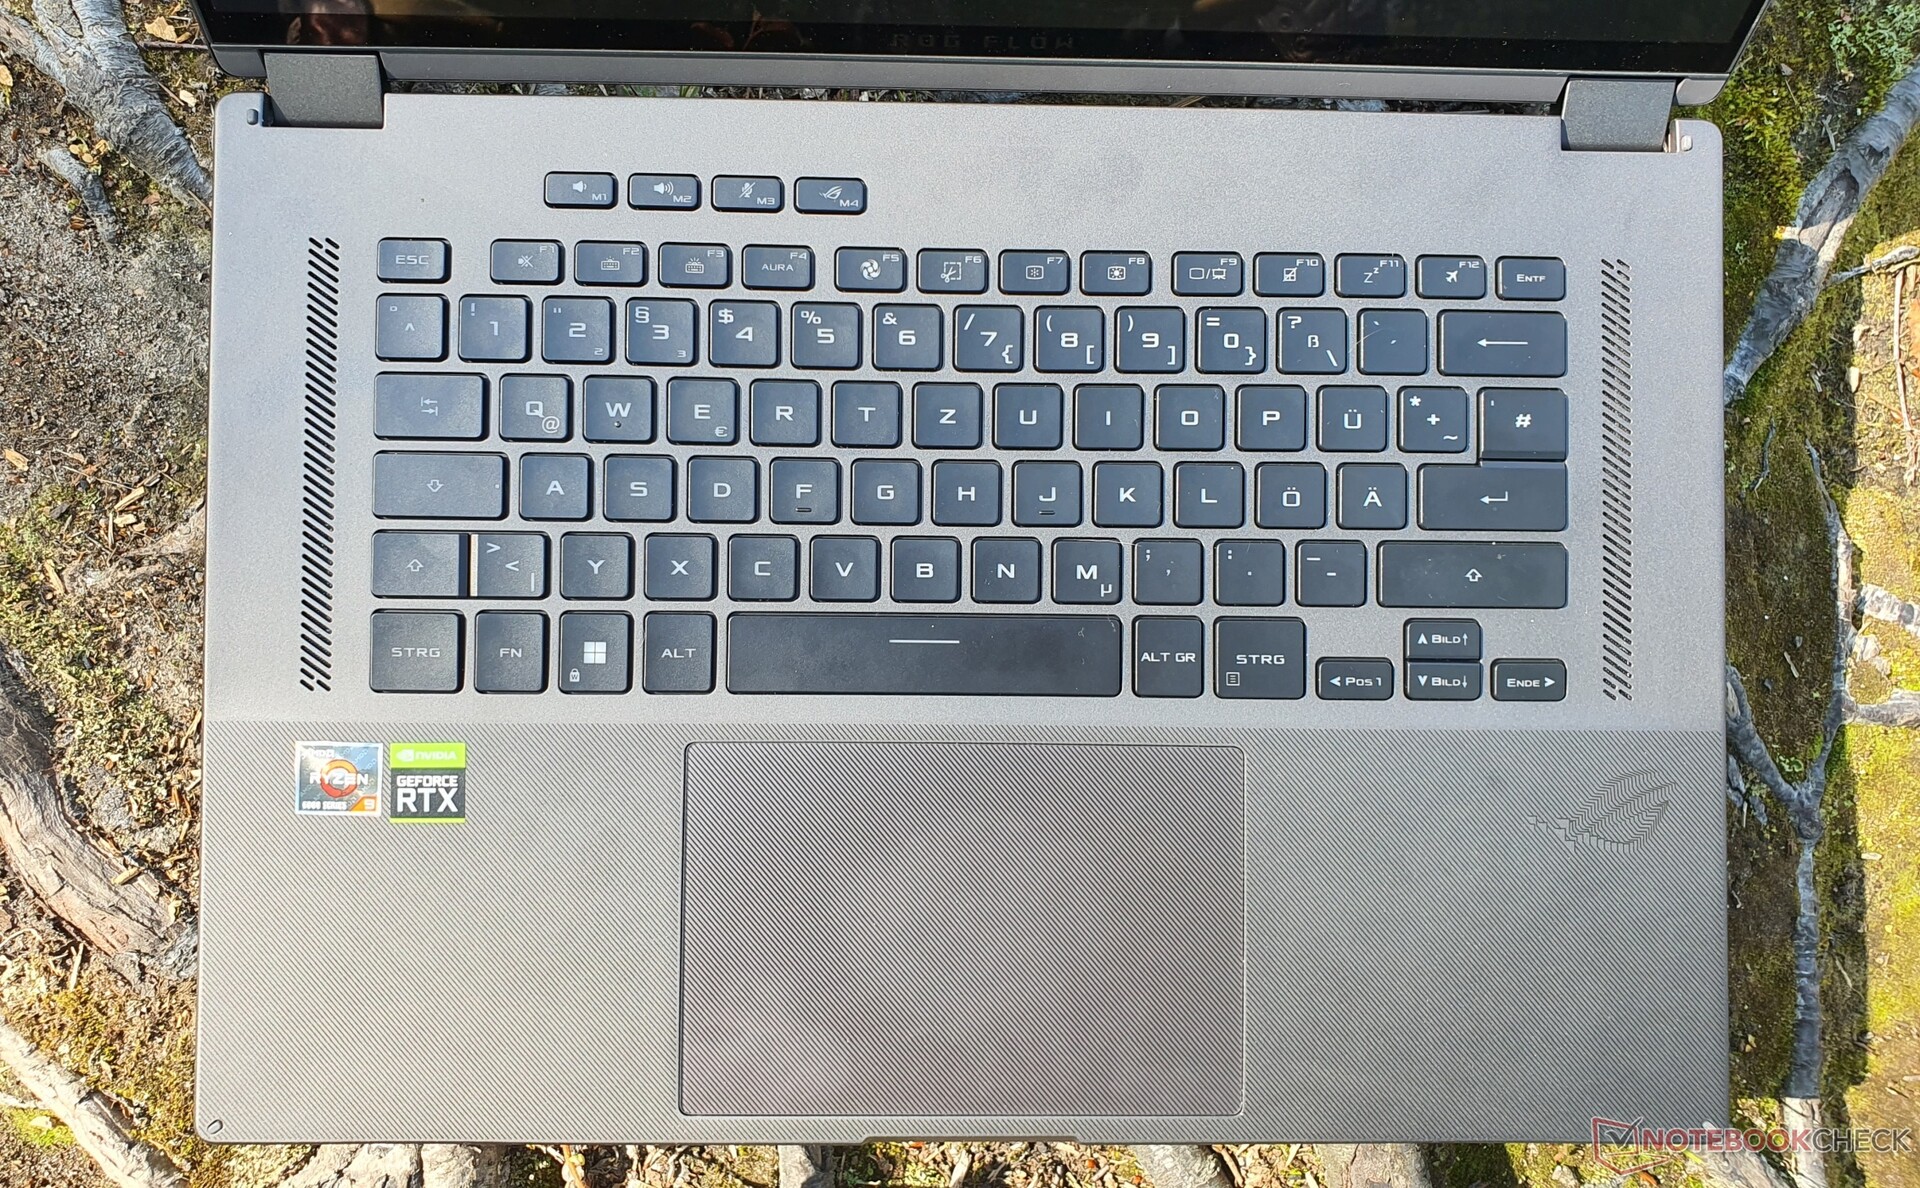
The workmanship is at a high level, the base unit cannot be twisted and the display also leaves little room for torsion. Haptically, the slightly roughened surfaces feel very good. The patterning of the lid is also replicated in an exclusively optical form on the palm rest, including the touchpad. Fingerprints are immediately visible, but the final version of the Flow X16 is not expected to adopt the corrugated pattern, instead using a special coating to keep fingerprints at bay.
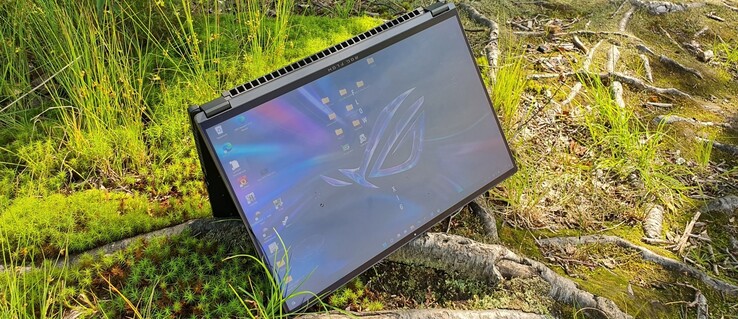
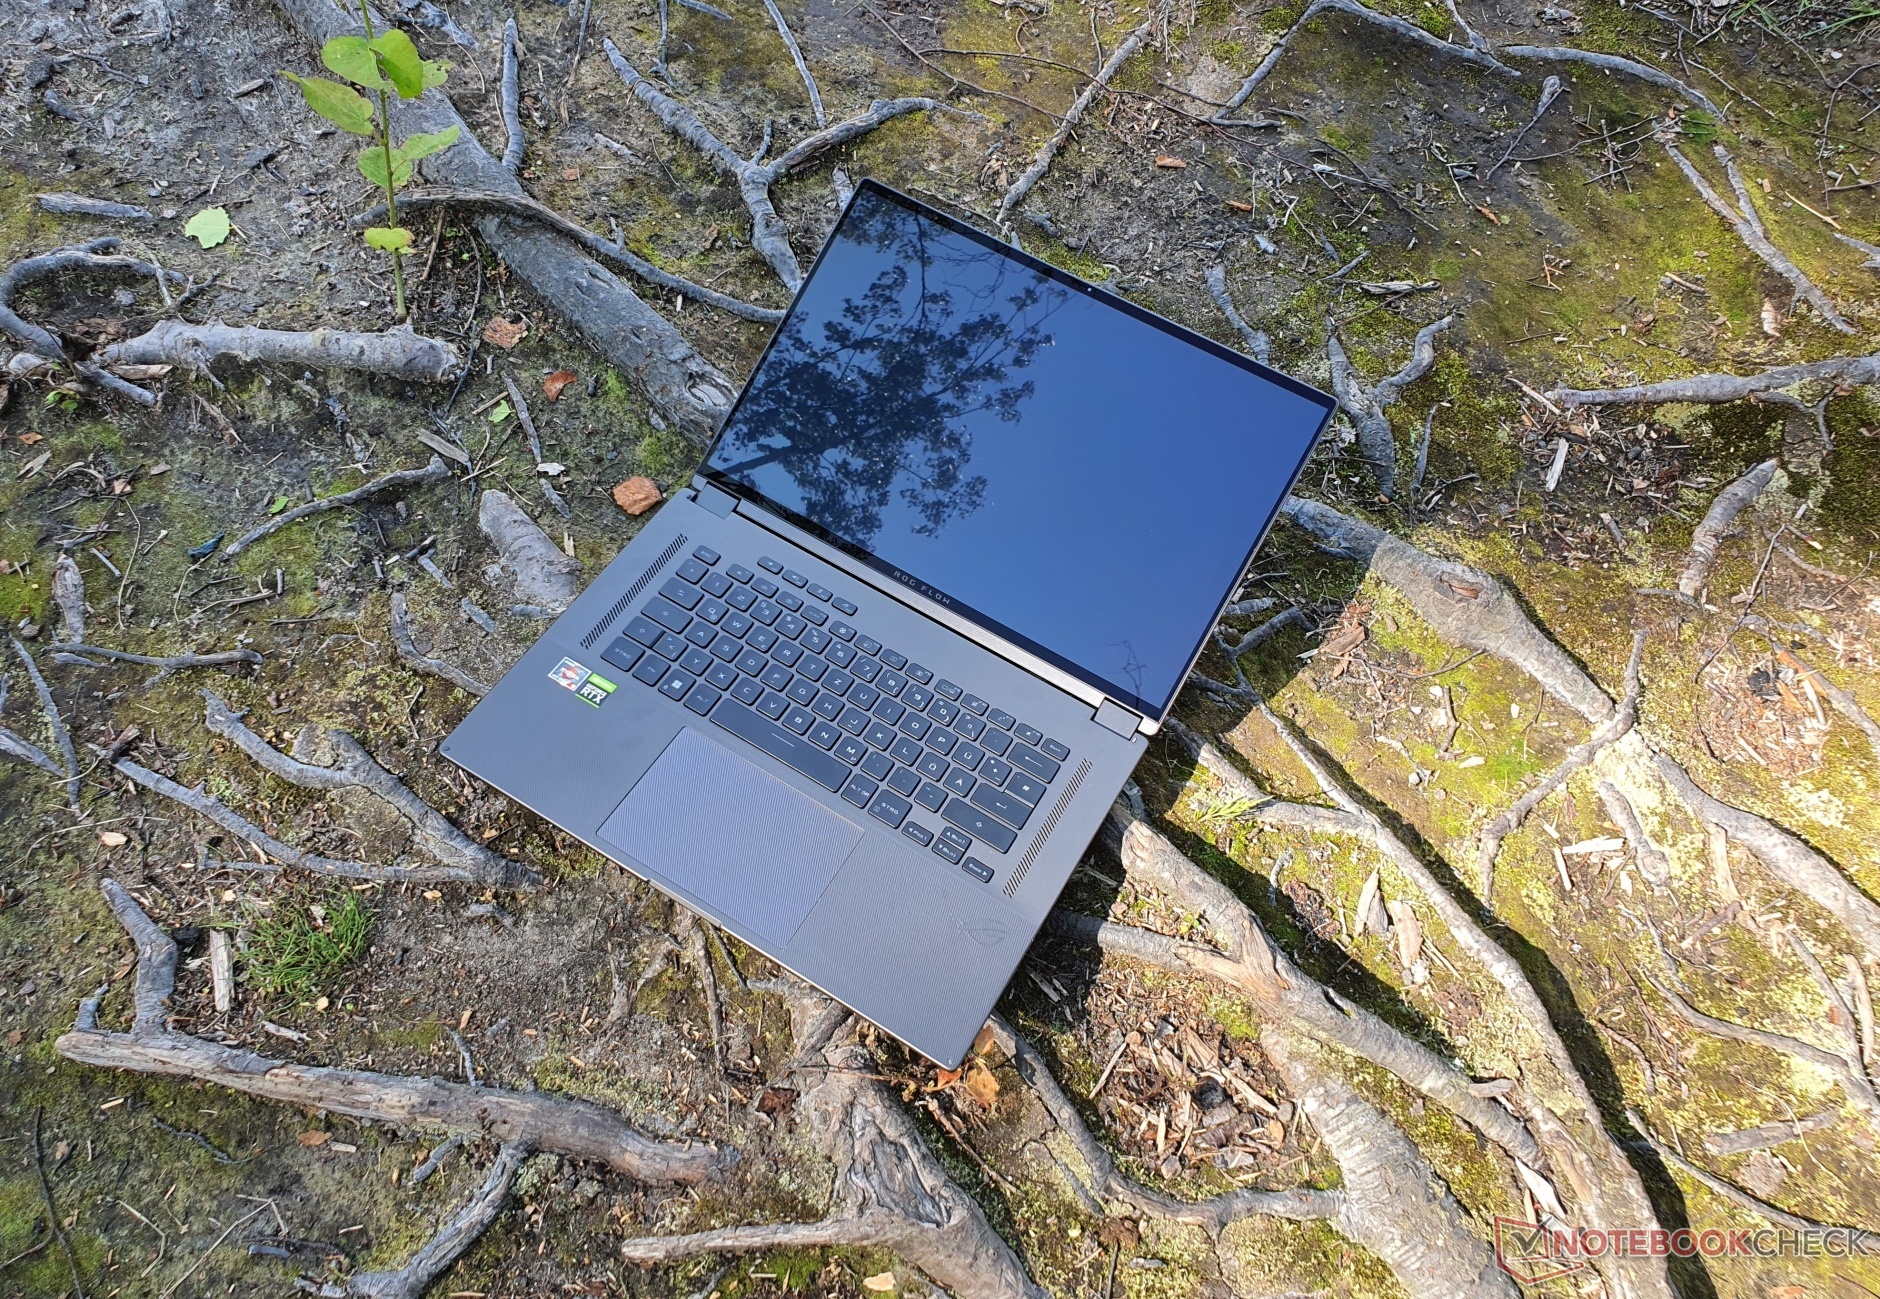
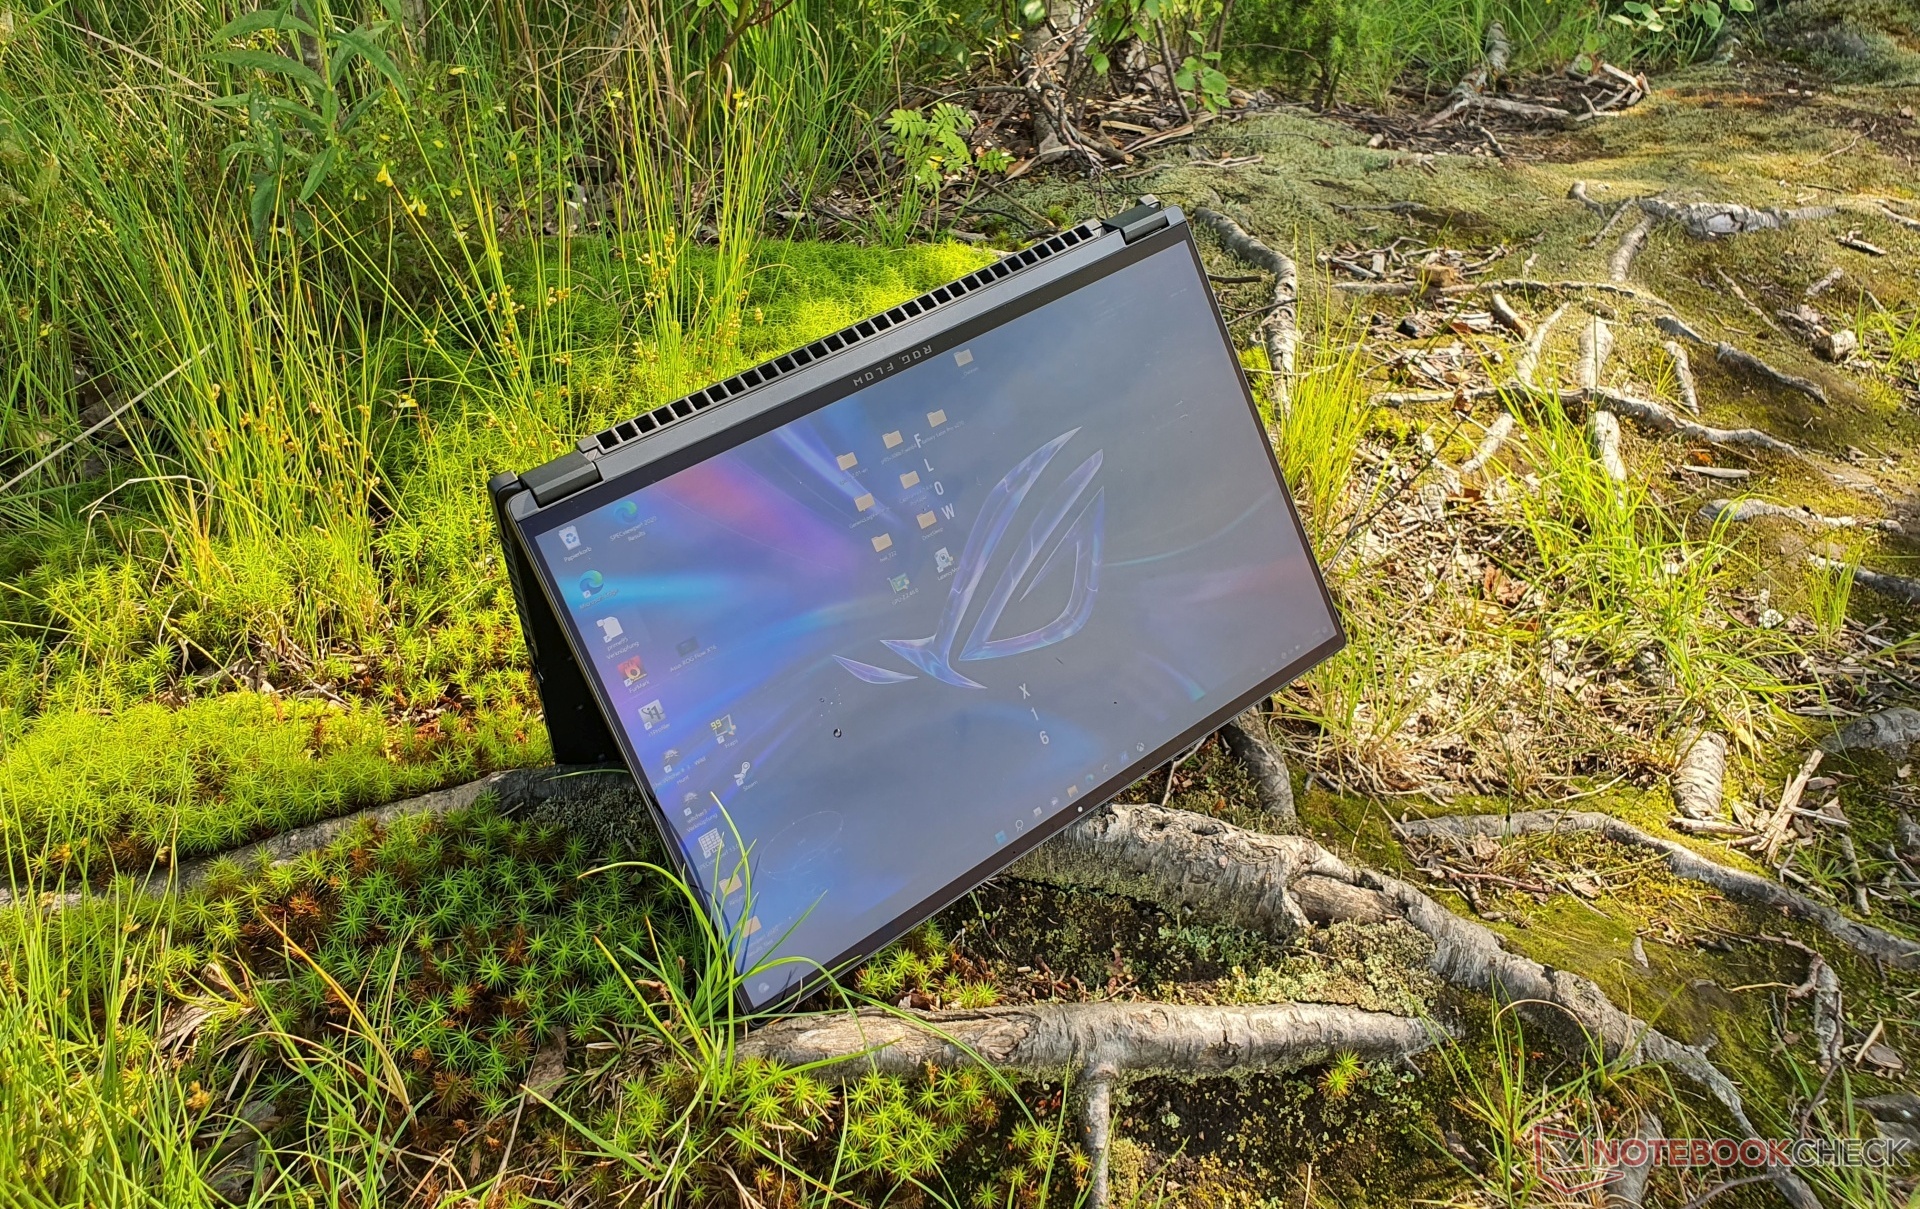
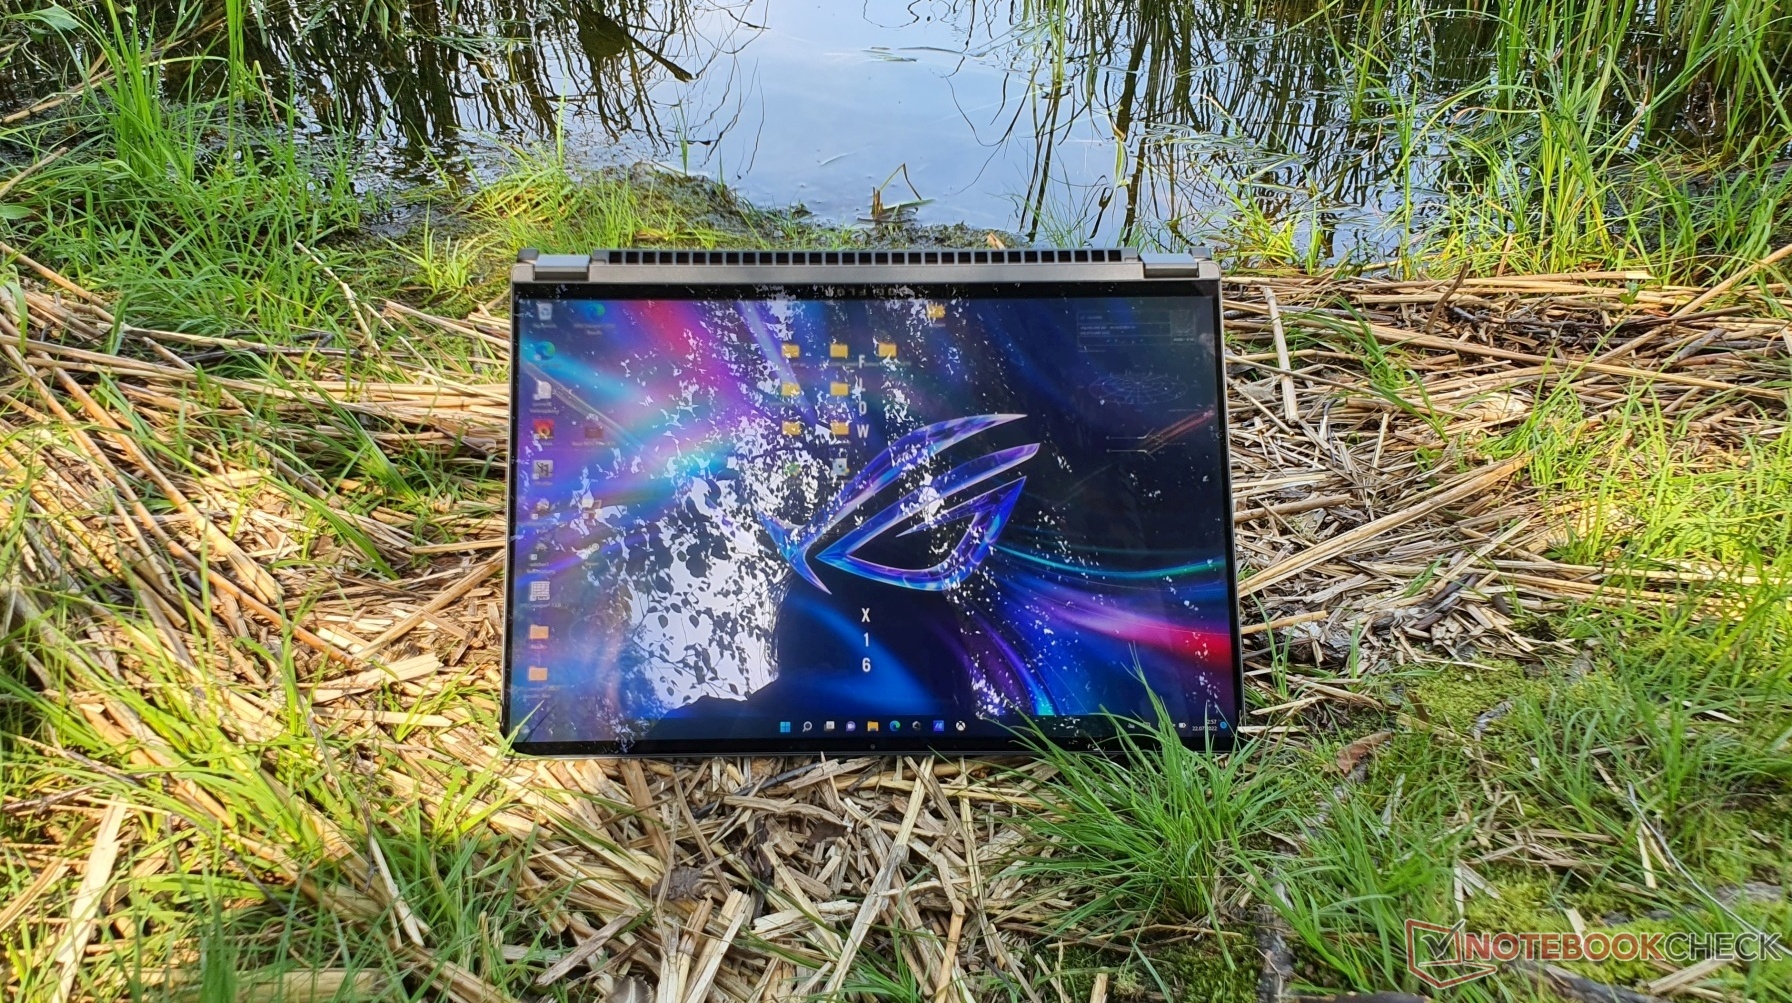
The two hinges of the convertible allow for 360° rotation of the display and hold it firmly in position. The fact that the display of a convertible bobs a little cannot always be completely avoided. Overall, a good balance between smoothness and stability has been achieved. The ROG Flow X16 can also be opened with one hand. Small spacers protect the base unit in tablet and tent mode.

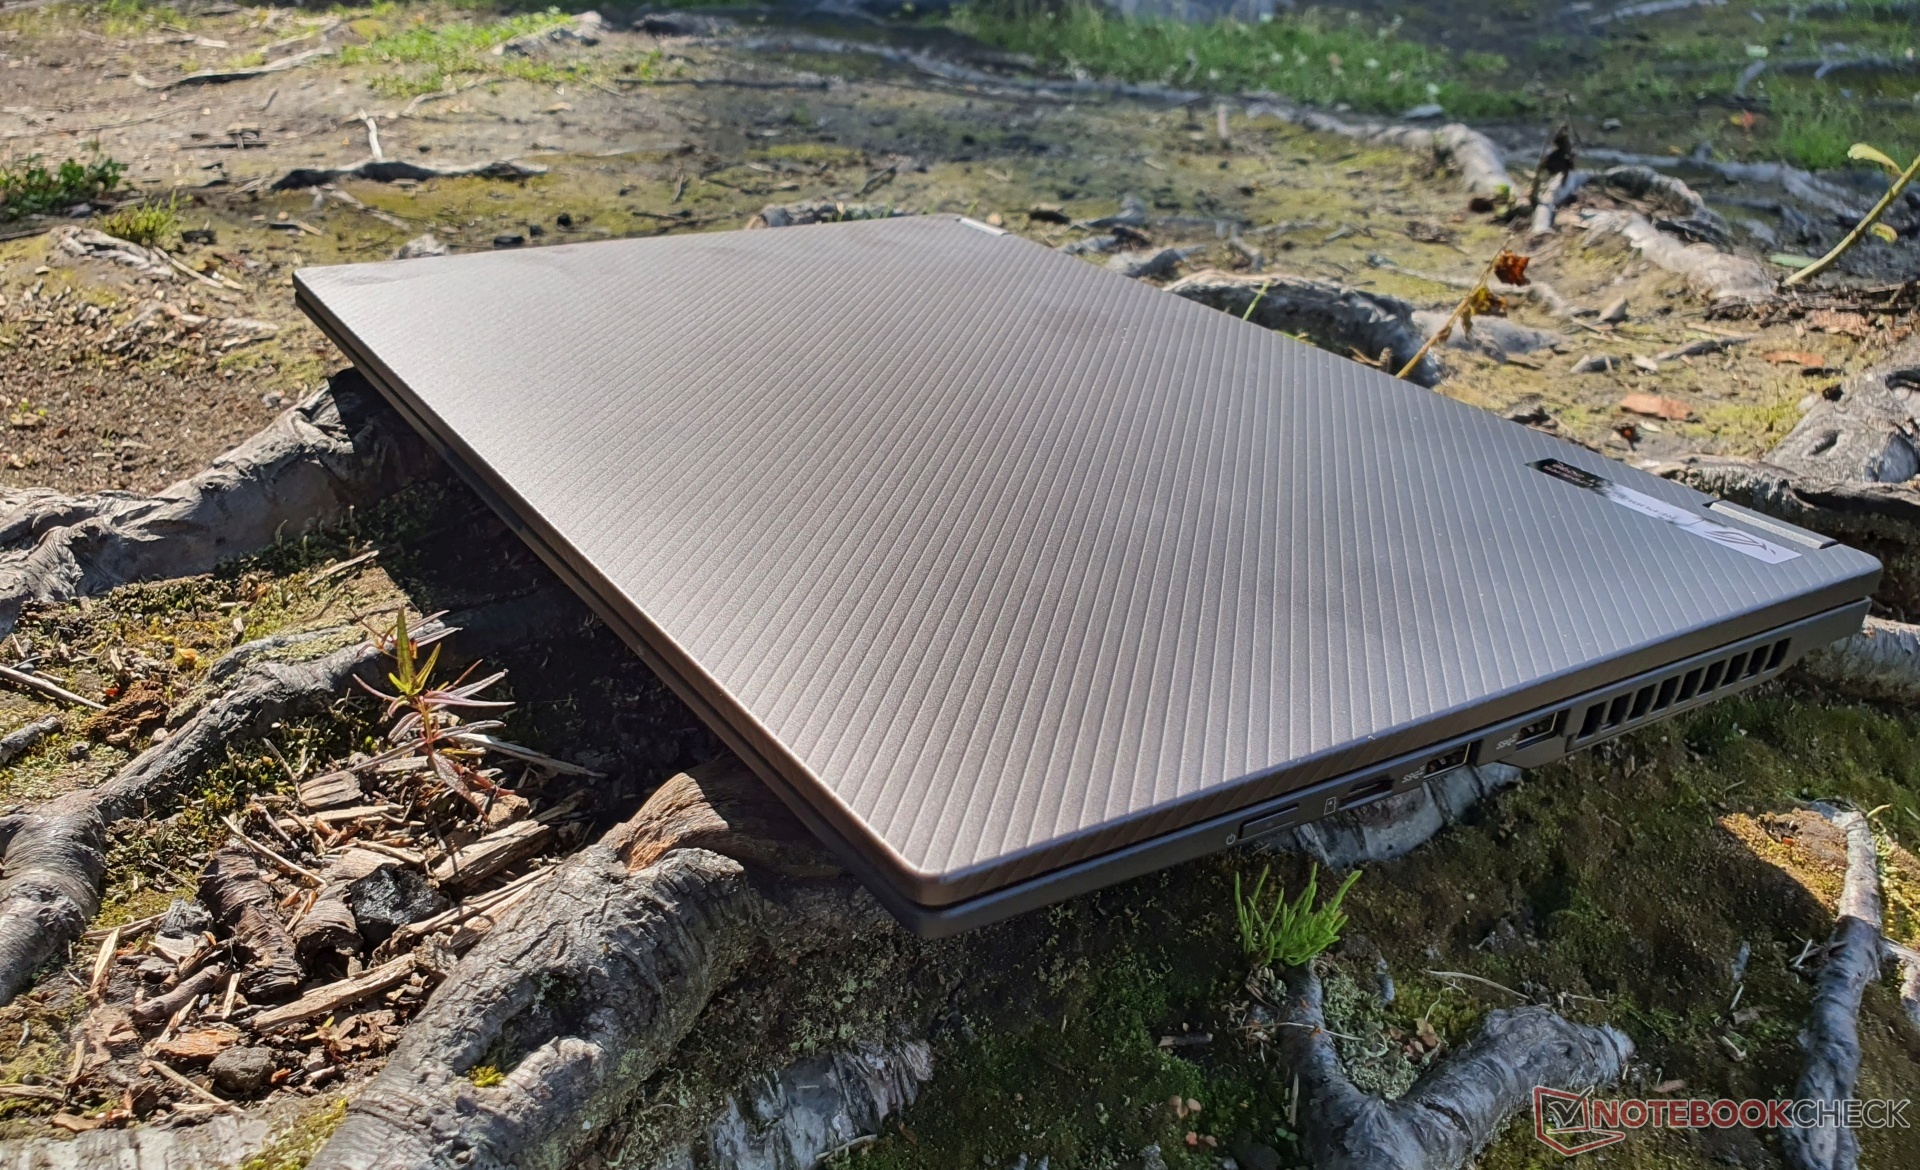

With the ROG Flow X16, Asus manages to create a laptop with the smallest dimensions among the 16-inchers, even outclassing some 15-inch laptops in our comparison field, although the Gigabyte Aero 16 and the MSI Stealth GS66 are already very compact models. The 14.4-inch Surface Laptop Studio is obviously more compact, but is not a real gamer either.
Only the ThinkPad X1 Extreme is superior in terms of weight among the devices with a potent GPU, but its 80 W of TGP requires a less elaborate cooling solution. Asus' Zephyrus M16 is roughly on par due to the similar case.
Equipment - Asus' Flow series offers special eGPU
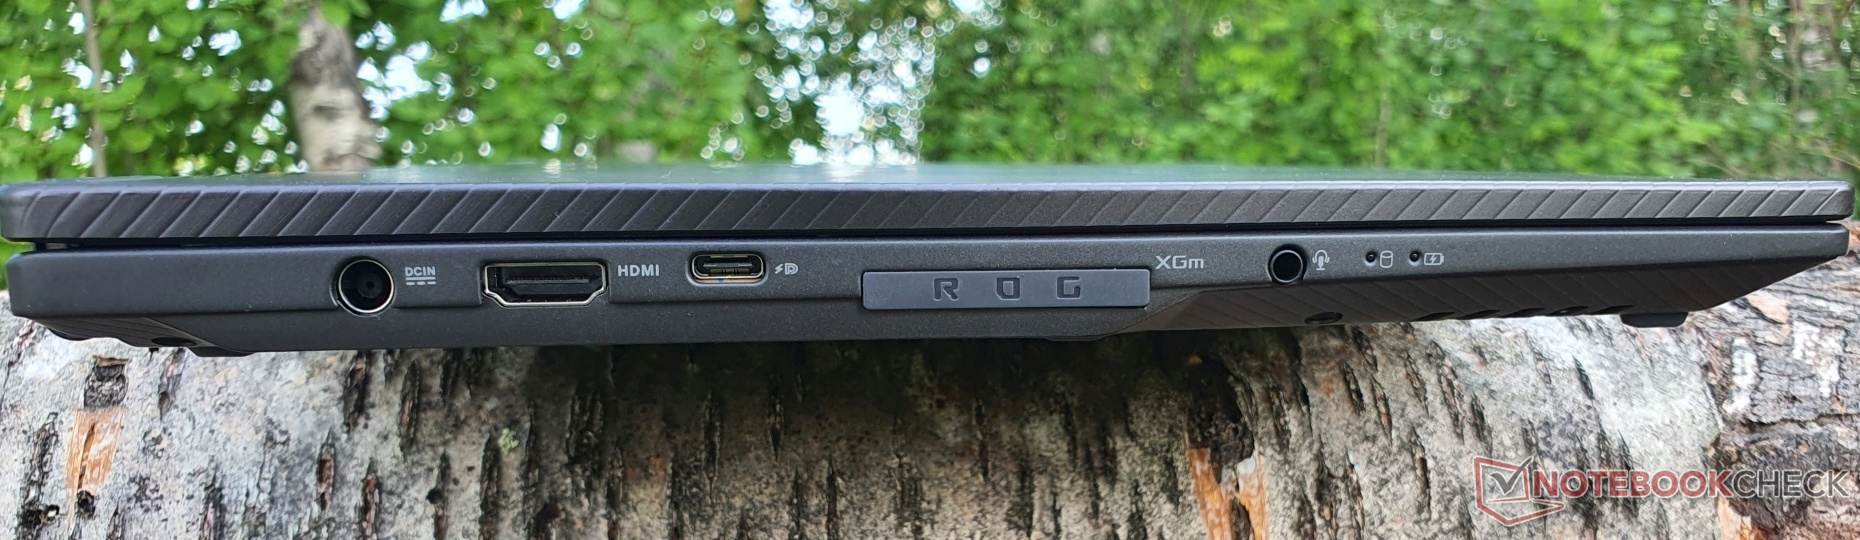
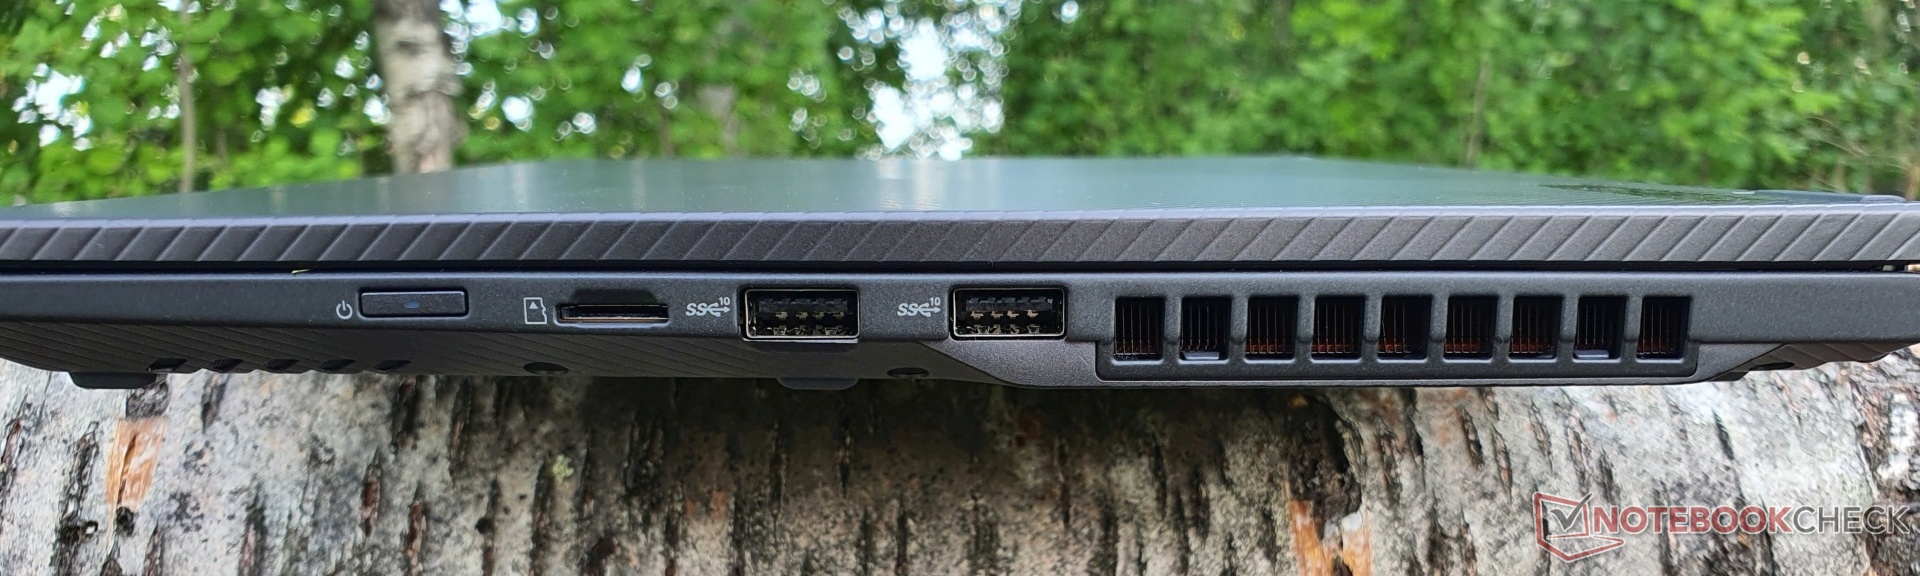
The Asus ROG Flow X16 offers four USB 3.2 Gen2 ports, two of which are Type A, while the other two are Type C and both support DisplayPort and Power Delivery up to 100 watts. The DisplayPort of the USB-C port in the xGM port is connected to the dedicated Nvidia GPU, while the other USB-C port is connected to the Radeon GPU, as is the HDMI 2.0b port, which supports G-Sync. Later in the year, Asus may provide a software upgrade for USB 4.0.
An SD card reader is only available in the micro version and a LAN port is absent. The ROG Flow series features the xGM port for an optional graphics dock (eGPU) that accommodates a GeForce RTX 3080 (laptop GPU). This is the only option for the dock so far, is more compact than conventional eGPUs, and is connected to twice the bandwidth (64 GBit/s @PCIe 3.0 8x versus 32 GBit/s @Thunderbolt 3/4).
Of course, gains in performance are likely to be marginal in our model with an integrated mobile RTX 3070 Ti, and it remains unclear whether the dock will receive updates in the future. Nevertheless, we will measure any differences and report them soon. In addition, the ROG XG Mobile (that we have previously reviewed) offers additional ports, such as GBit LAN and a full-size DisplayPort.
Furthermore, there is also a 3.5 mm audio jack, as well as the power socket for the 240 watt power supply. The spacing between the ports is adequate, but the power button on the right side sits loosely in the case in our pre-release version. The fingerprint reader has been omitted.
SD Card Reader
The UHS-II microSD card reader achieves very good results of 158 MB/s in the copy test and ~183 MB/s in sequential read with our reference microSD card (AV PRO microSD 128 GB V60). Particularly in copying, the ROG Flow X16 is far ahead of the competition. Only Dell's XPS 17 achieves higher copy rates (~205 MB/s).
| SD Card Reader | |
| average JPG Copy Test (av. of 3 runs) | |
| Dell XPS 17 9720 RTX 3060 (Toshiba Exceria Pro SDXC 64 GB UHS-II) | |
| Asus ROG Flow X16 GV601RW-M5082W (AV Pro SD microSD 128 GB V60) | |
| Apple MacBook Pro 16 2021 M1 Pro (Angelbird AV Pro V60) | |
| Average of class Gaming (20 - 210, n=70, last 2 years) | |
| Asus ROG Zephyrus M16 GU603H (AV PRO microSD 128 GB V60) | |
| maximum AS SSD Seq Read Test (1GB) | |
| Dell XPS 17 9720 RTX 3060 (Toshiba Exceria Pro SDXC 64 GB UHS-II) | |
| Asus ROG Zephyrus M16 GU603H (AV PRO microSD 128 GB V60) | |
| Asus ROG Flow X16 GV601RW-M5082W (AV Pro SD microSD 128 GB V60) | |
| Average of class Gaming (25.5 - 261, n=66, last 2 years) | |
Communication
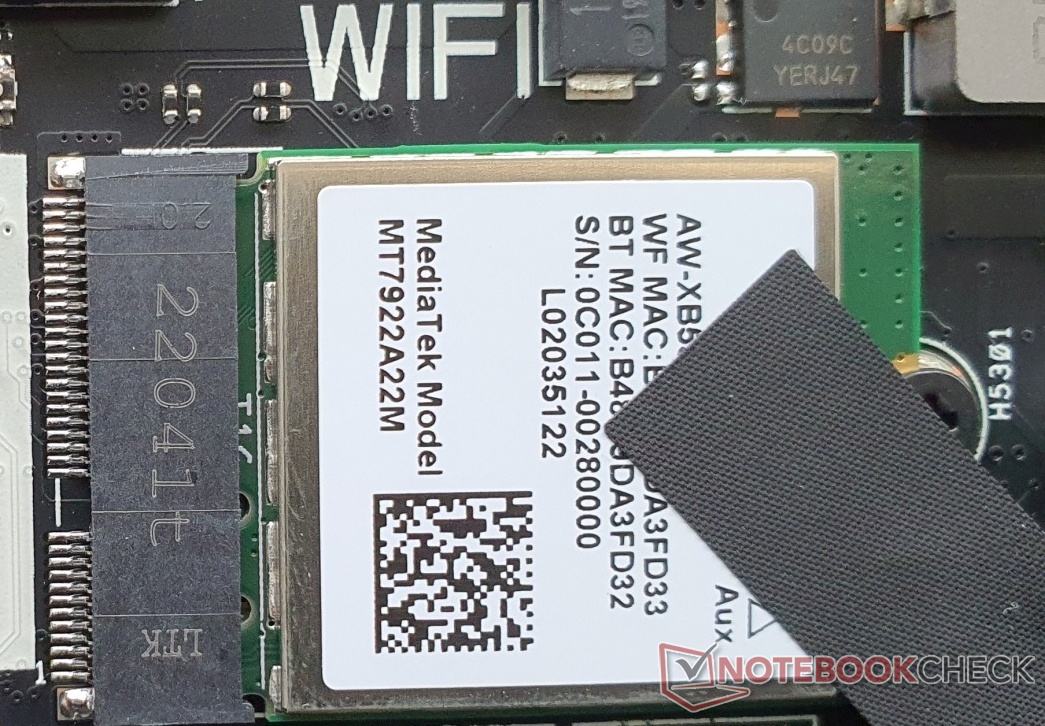
The installed WiFi 6E module comes from MediaTek and delivers decent speeds in both directions. The MT7922 is thus twice as powerful as the MT7921 in the Zephyrus M16 and the MacBook Pro 16.
Webcam

A 720p variant (1280x720) is used as the webcam, but it offers better sharpness and less distortion than usual. There is no mechanical shutter, but there is infrared for Windows Hello.


Accessories
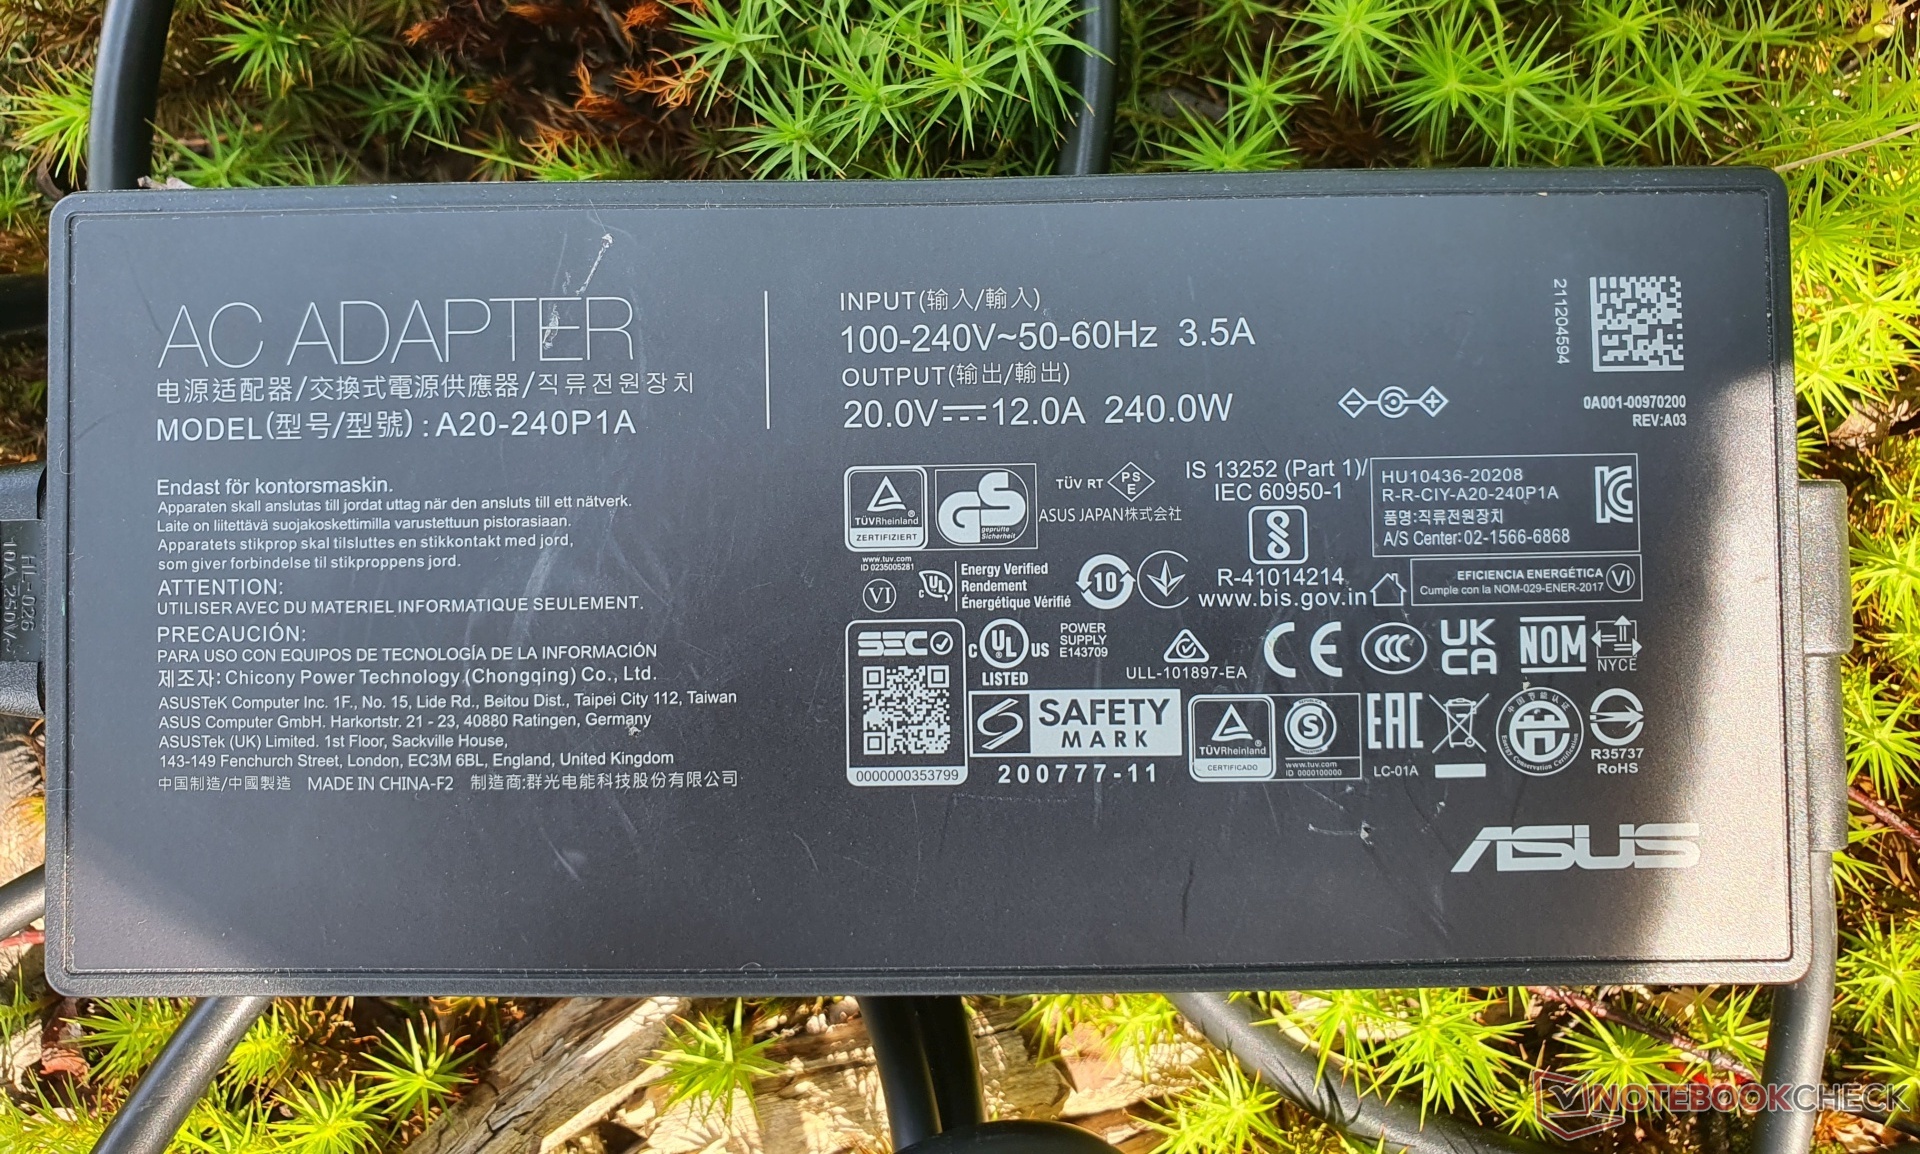
In our review package, Asus provides a 240 watt power adapter as well as the Asus SA201H stylus for touchscreen input (included in scope of delivery). We also received a ROG BP4071 laptop backpack. We ordered the external graphics dock and the ROG 100 watt USB-C power supply separately.
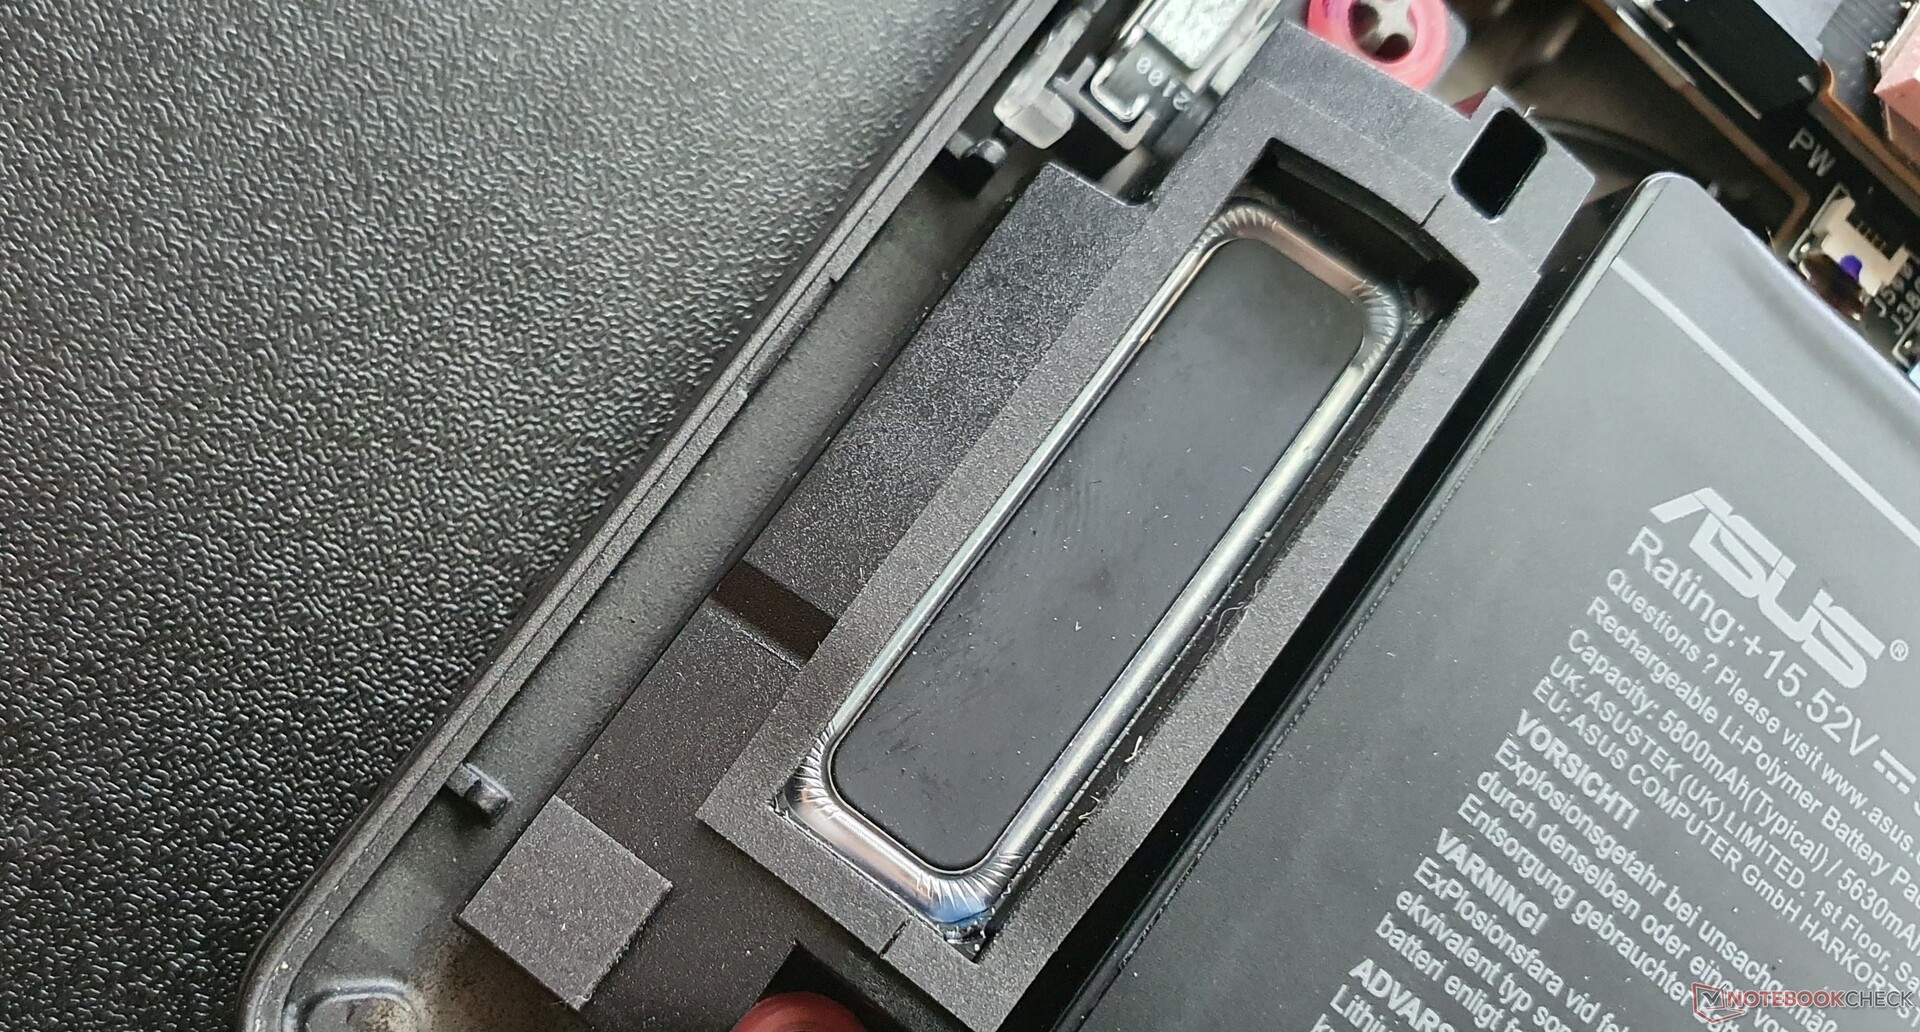
Maintenance
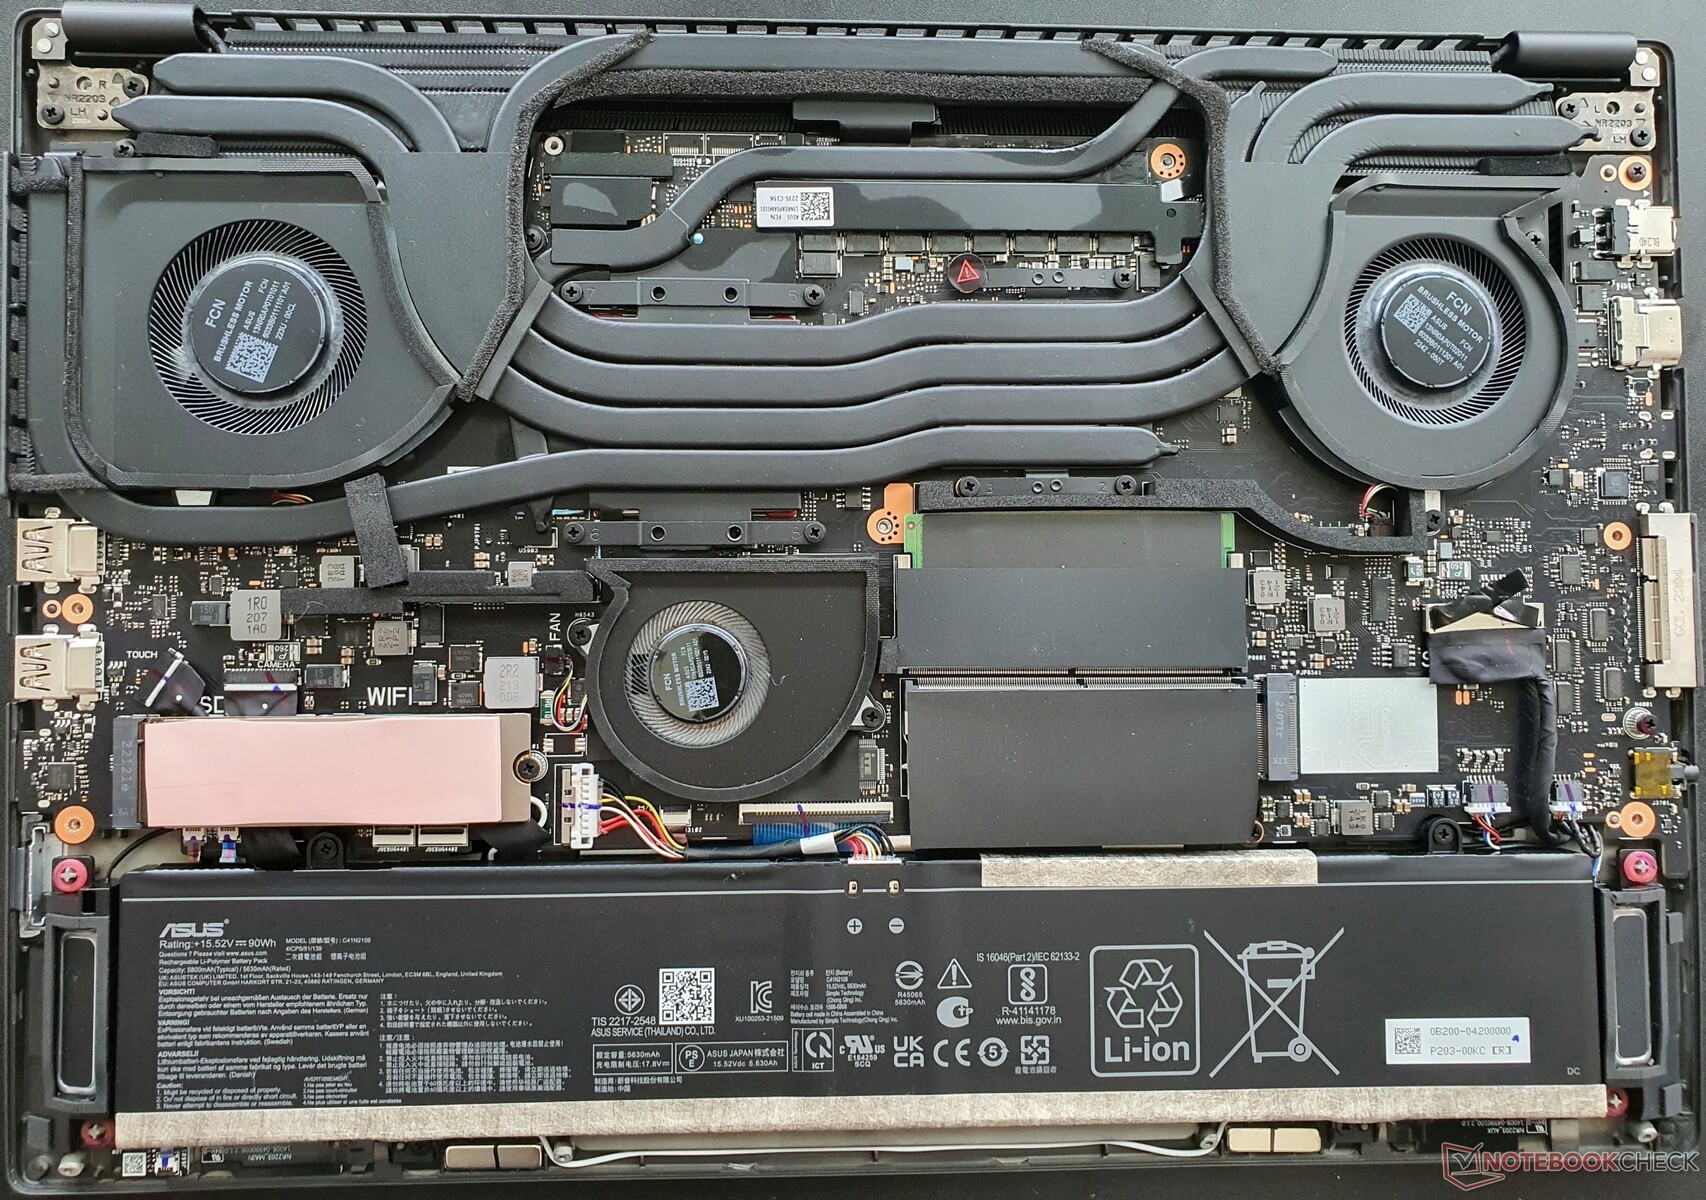
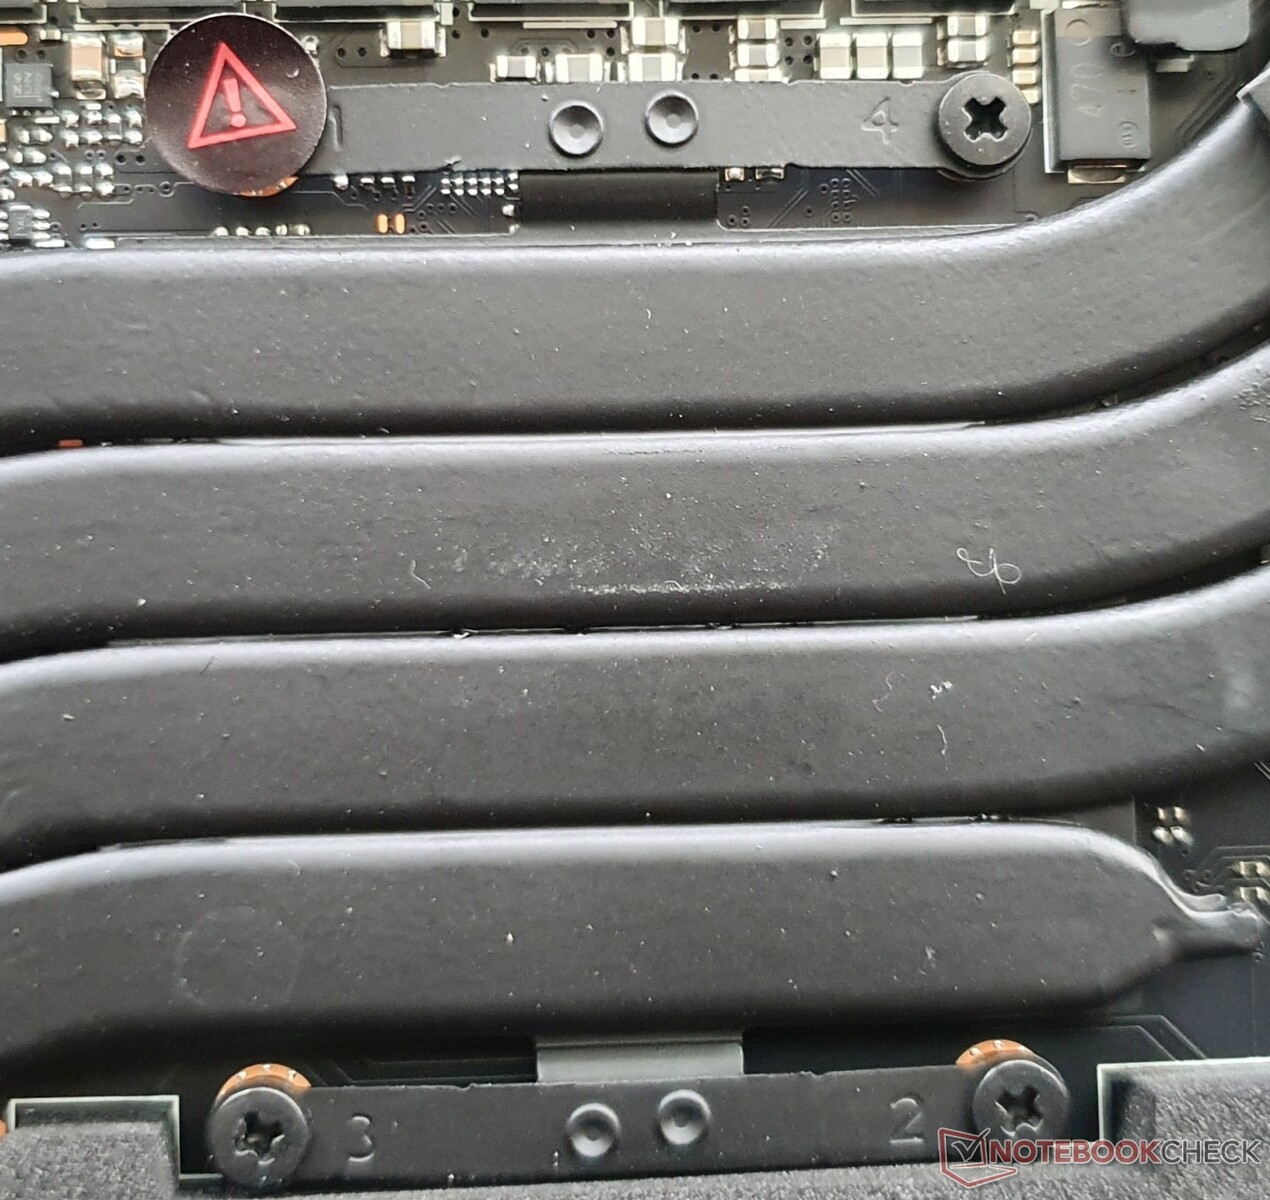
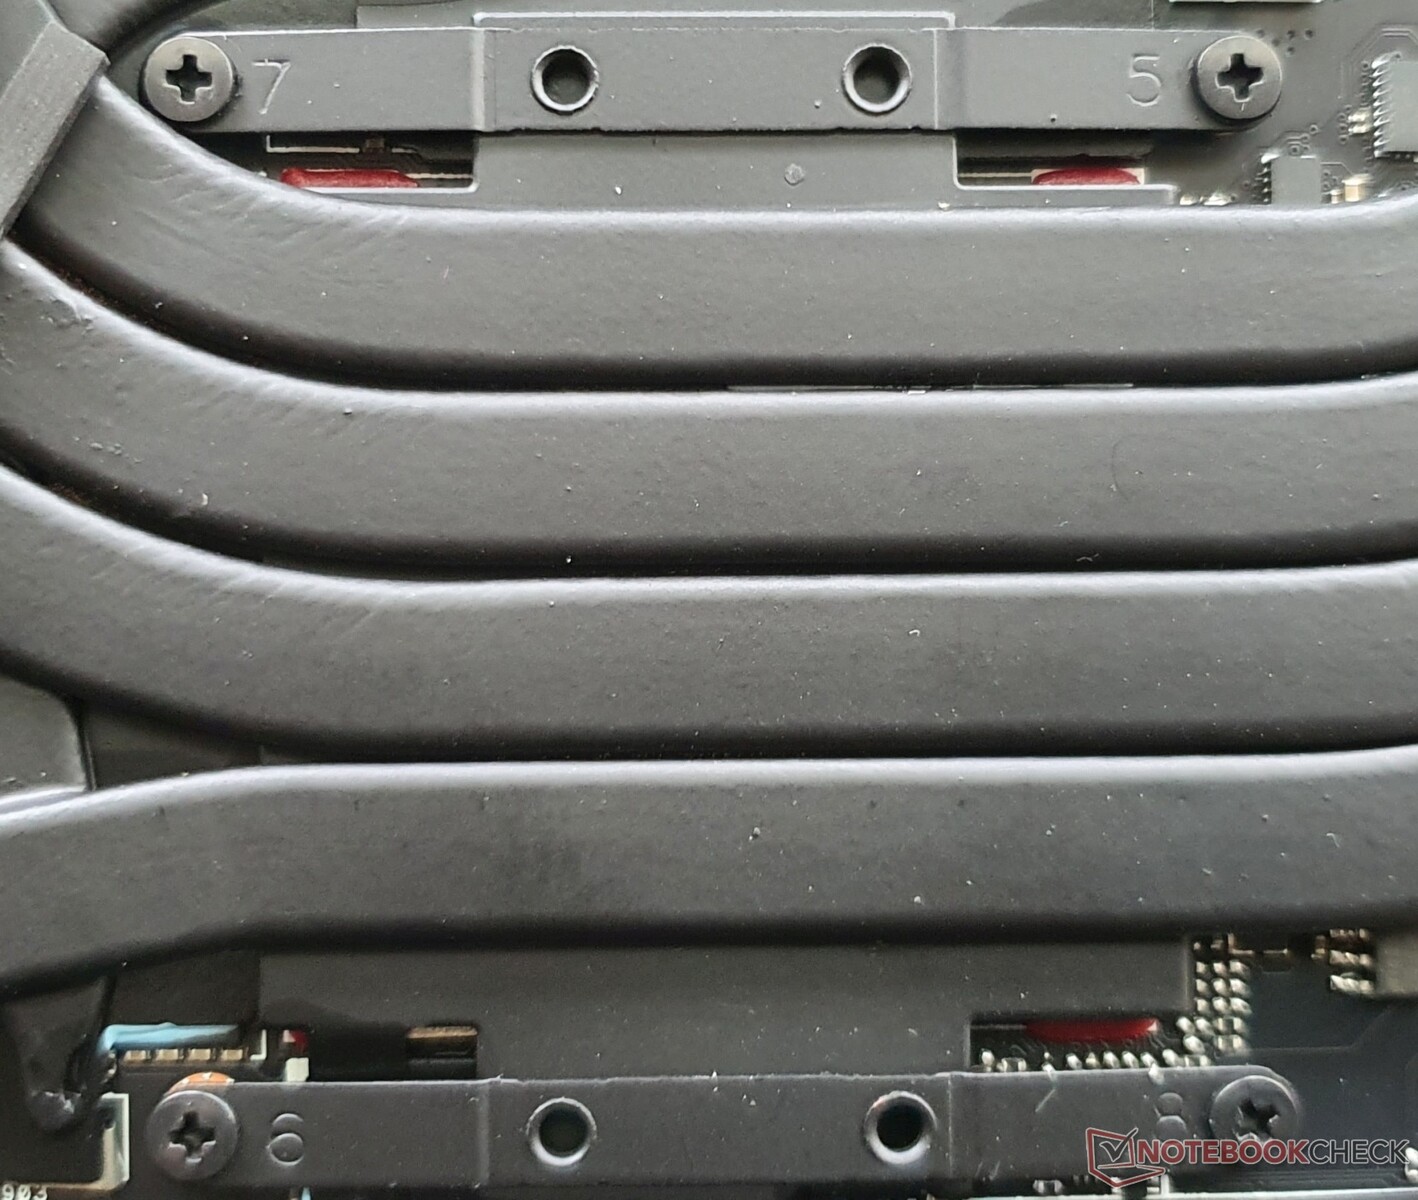
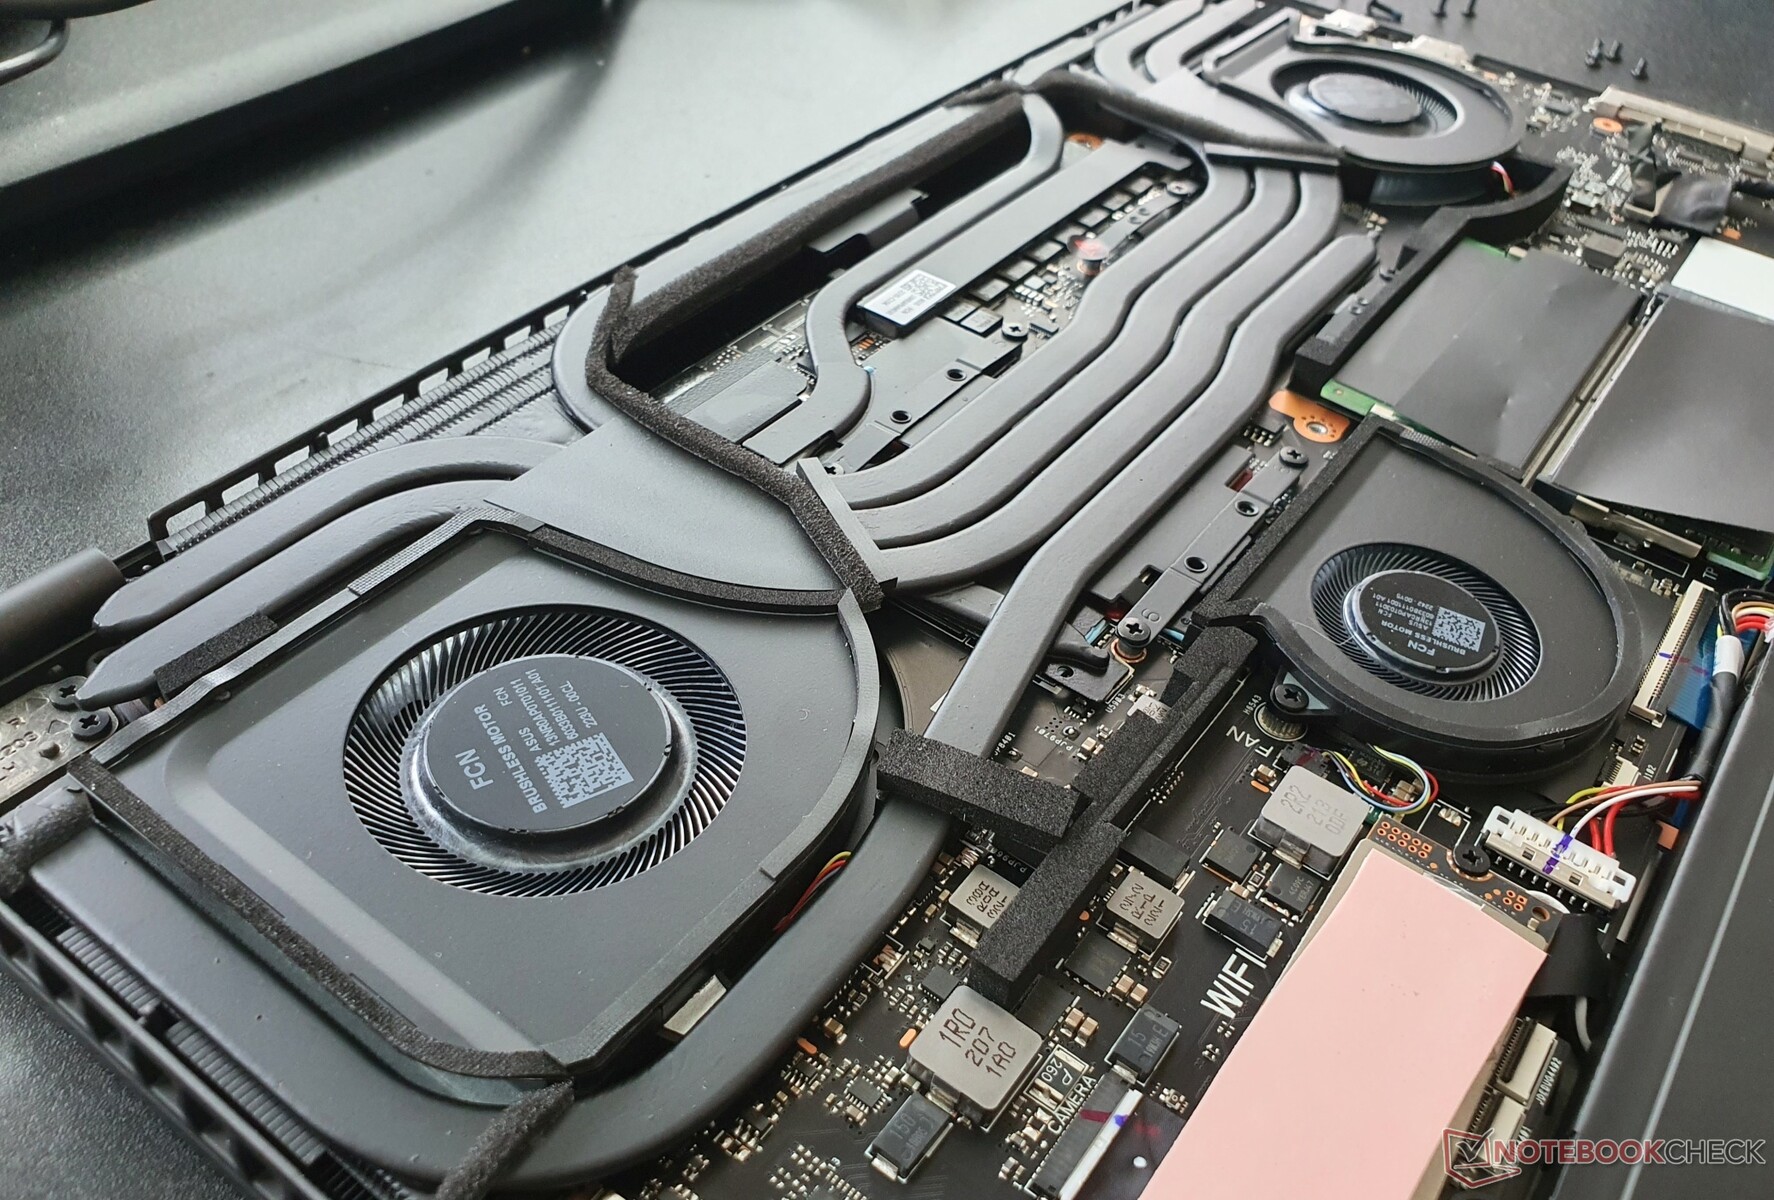
13 Phillips screws have to be loosened in order to remove the plastic baseplate. In addition, some clips have to be loosened with a spatula or a pick. Three fans (1x CPU, 1x GPU and 1x system fan) await us inside, which can be cleaned. The battery is screwed and can thus be replaced.
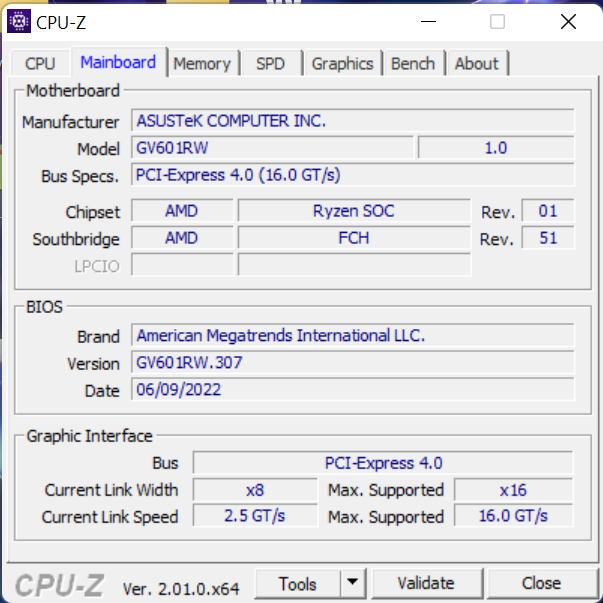
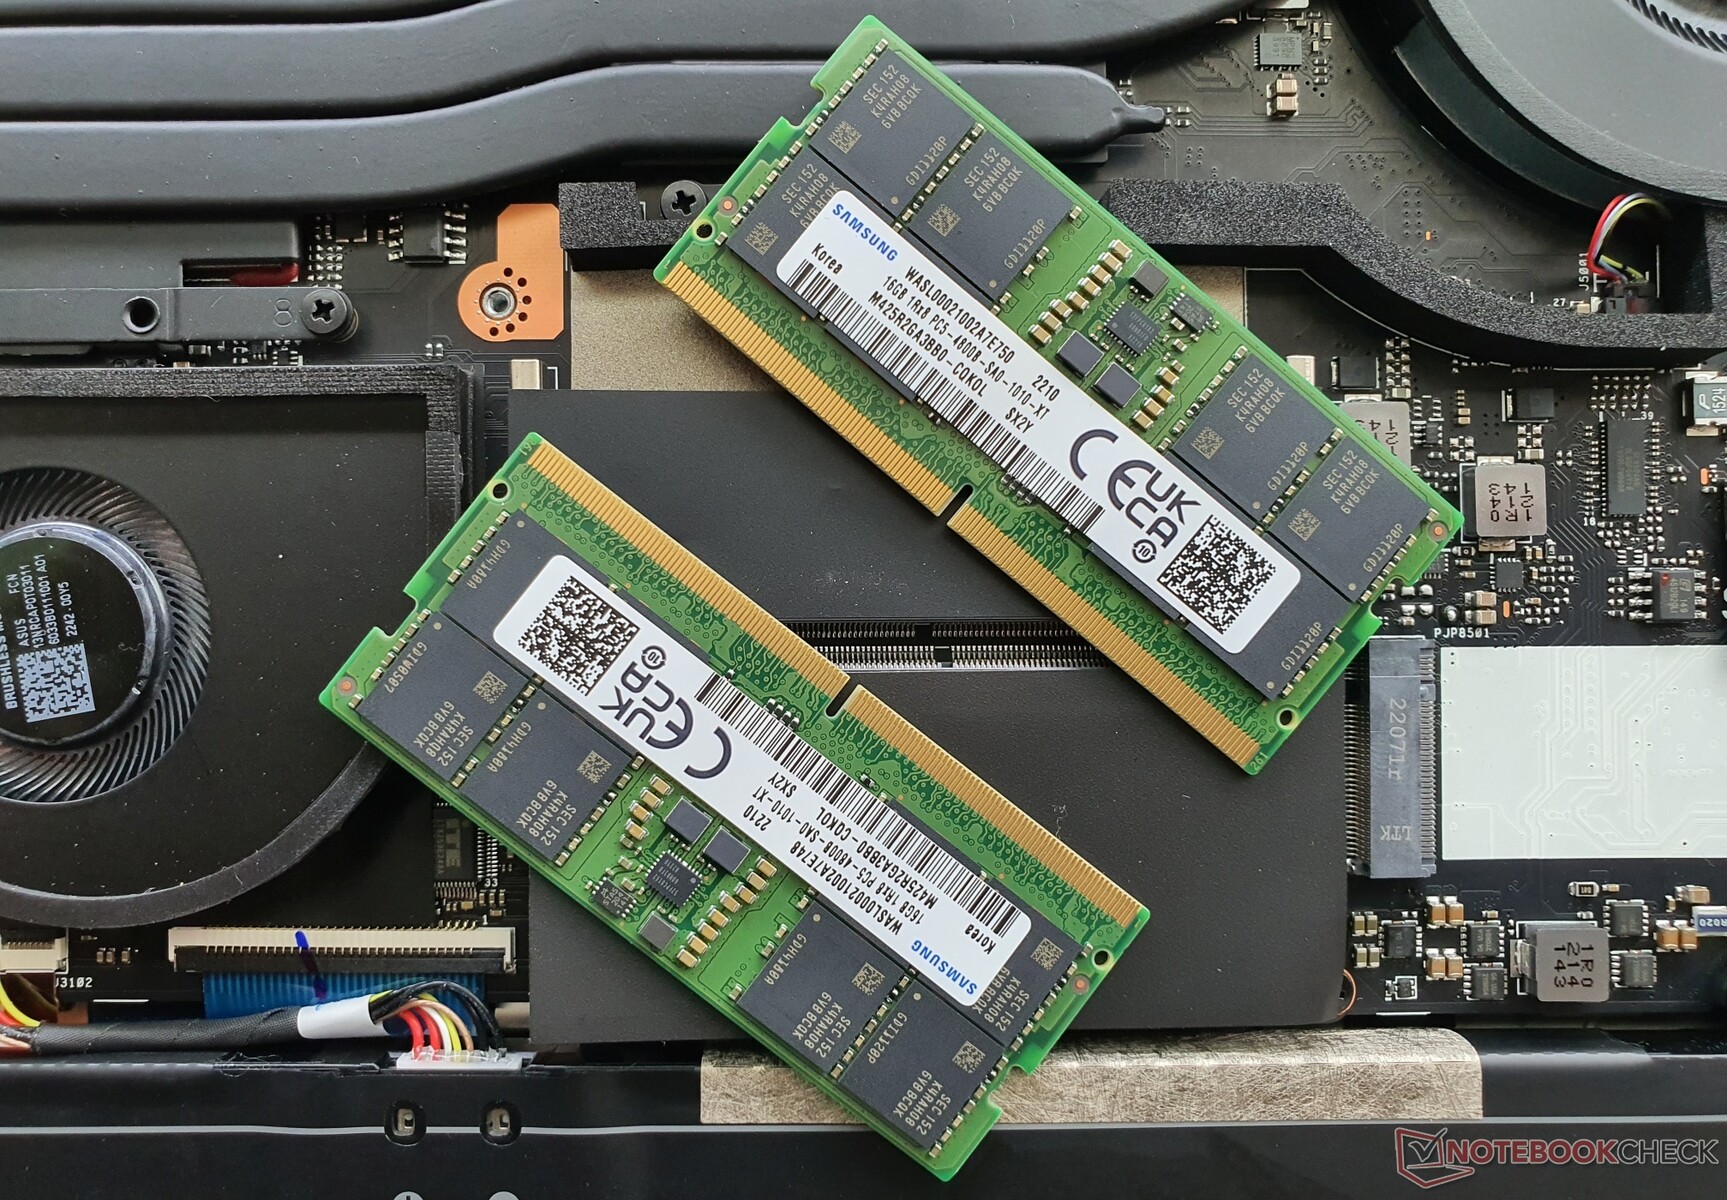
Furthermore, the RAM (two slots) can be upgraded and a larger SSD can be used in the M.2-2280 slot (PCIe 4.0). Another M.2-2280 slot is free for another SSD.
Warranty
In Germany, Asus provides a 24-month warranty with a pickup and return service for the ROG Flow X16. This may vary according to location, so be sure to check with your supplier before purchasing.
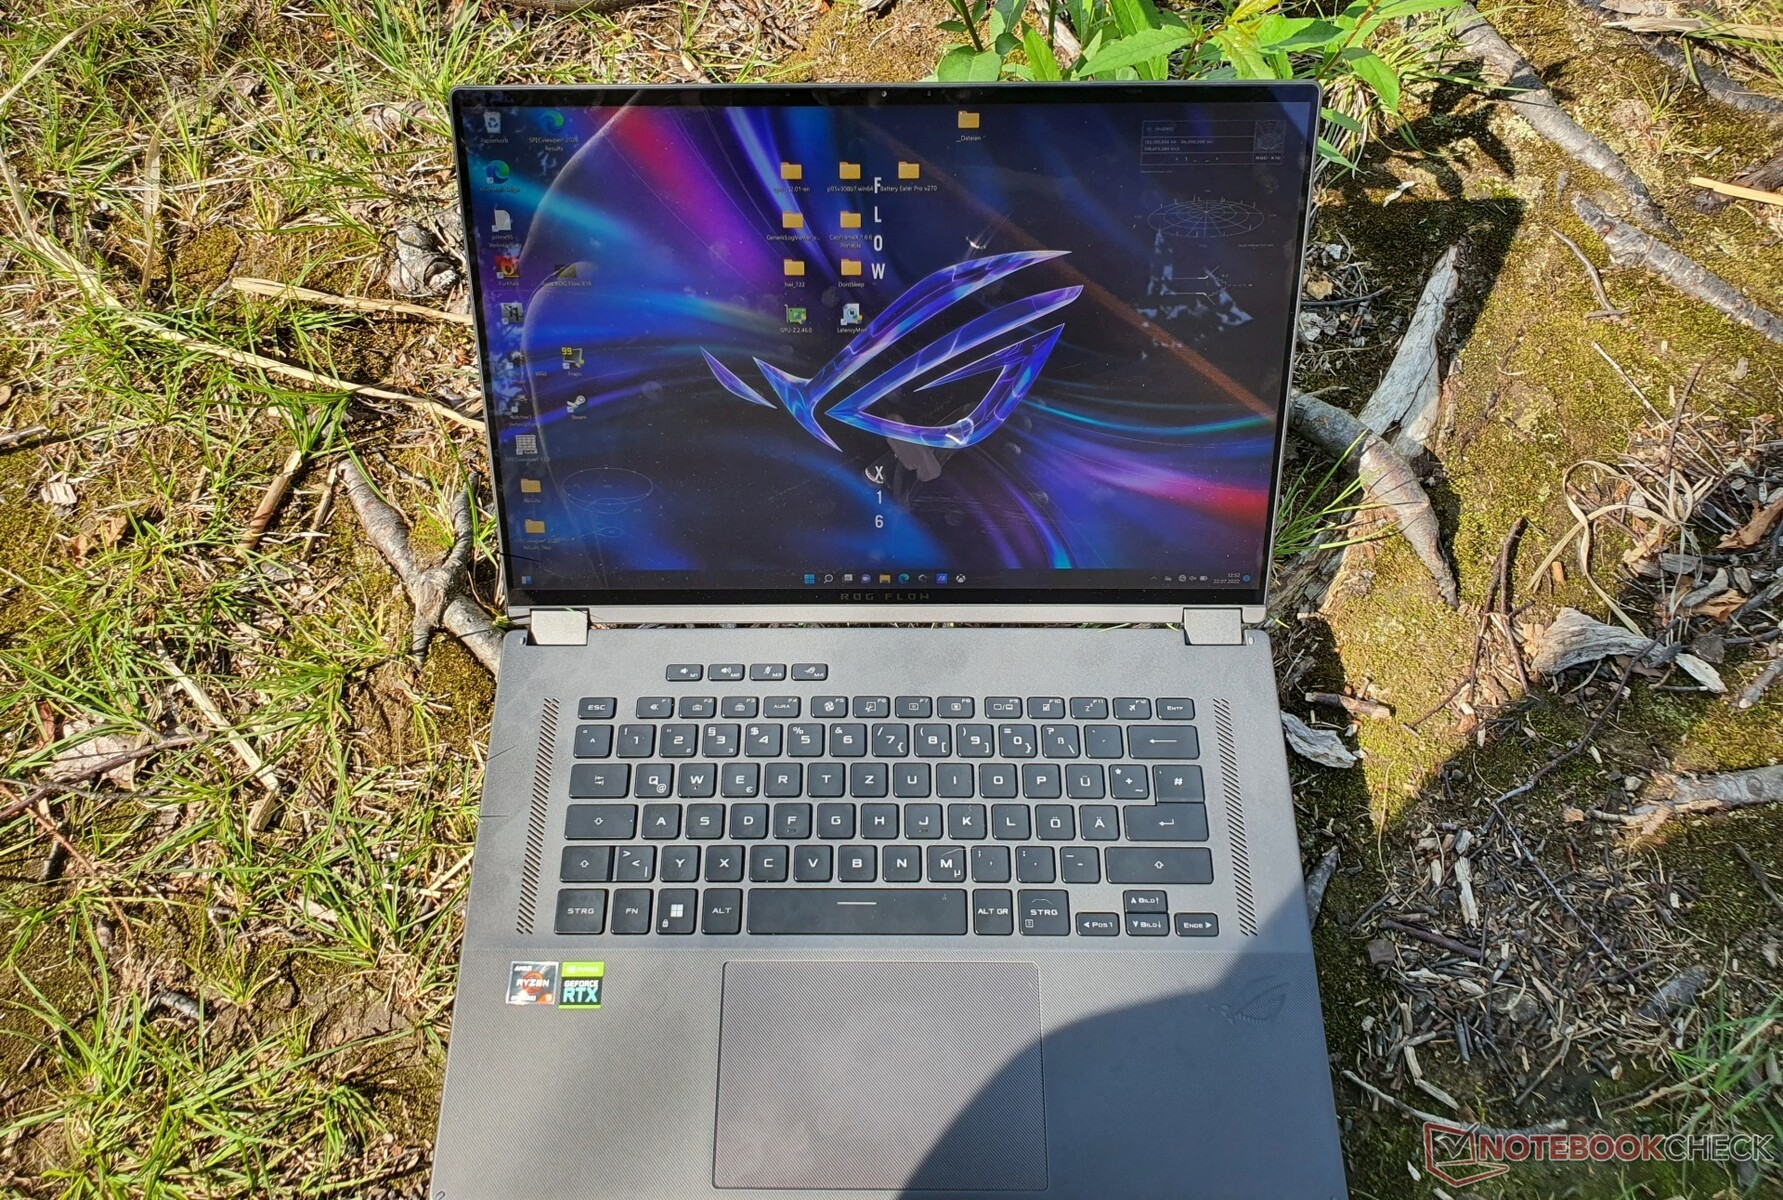
Input Devices - RGB backlit keyboard with 1.7 mm travel
Keyboard
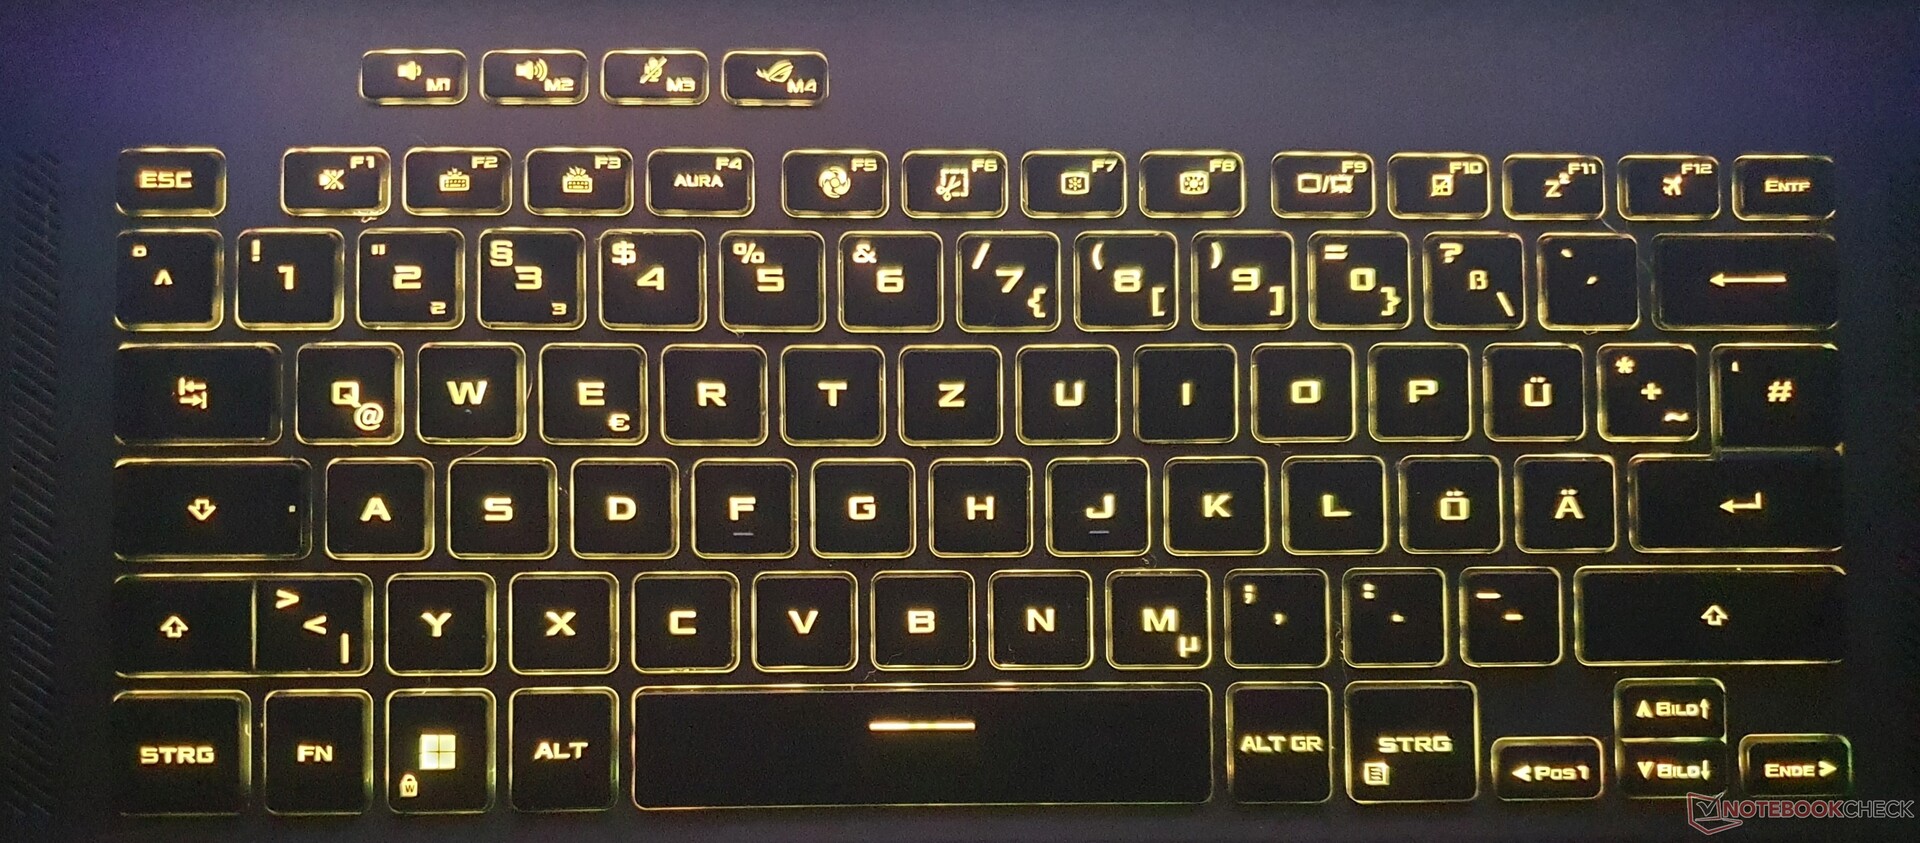
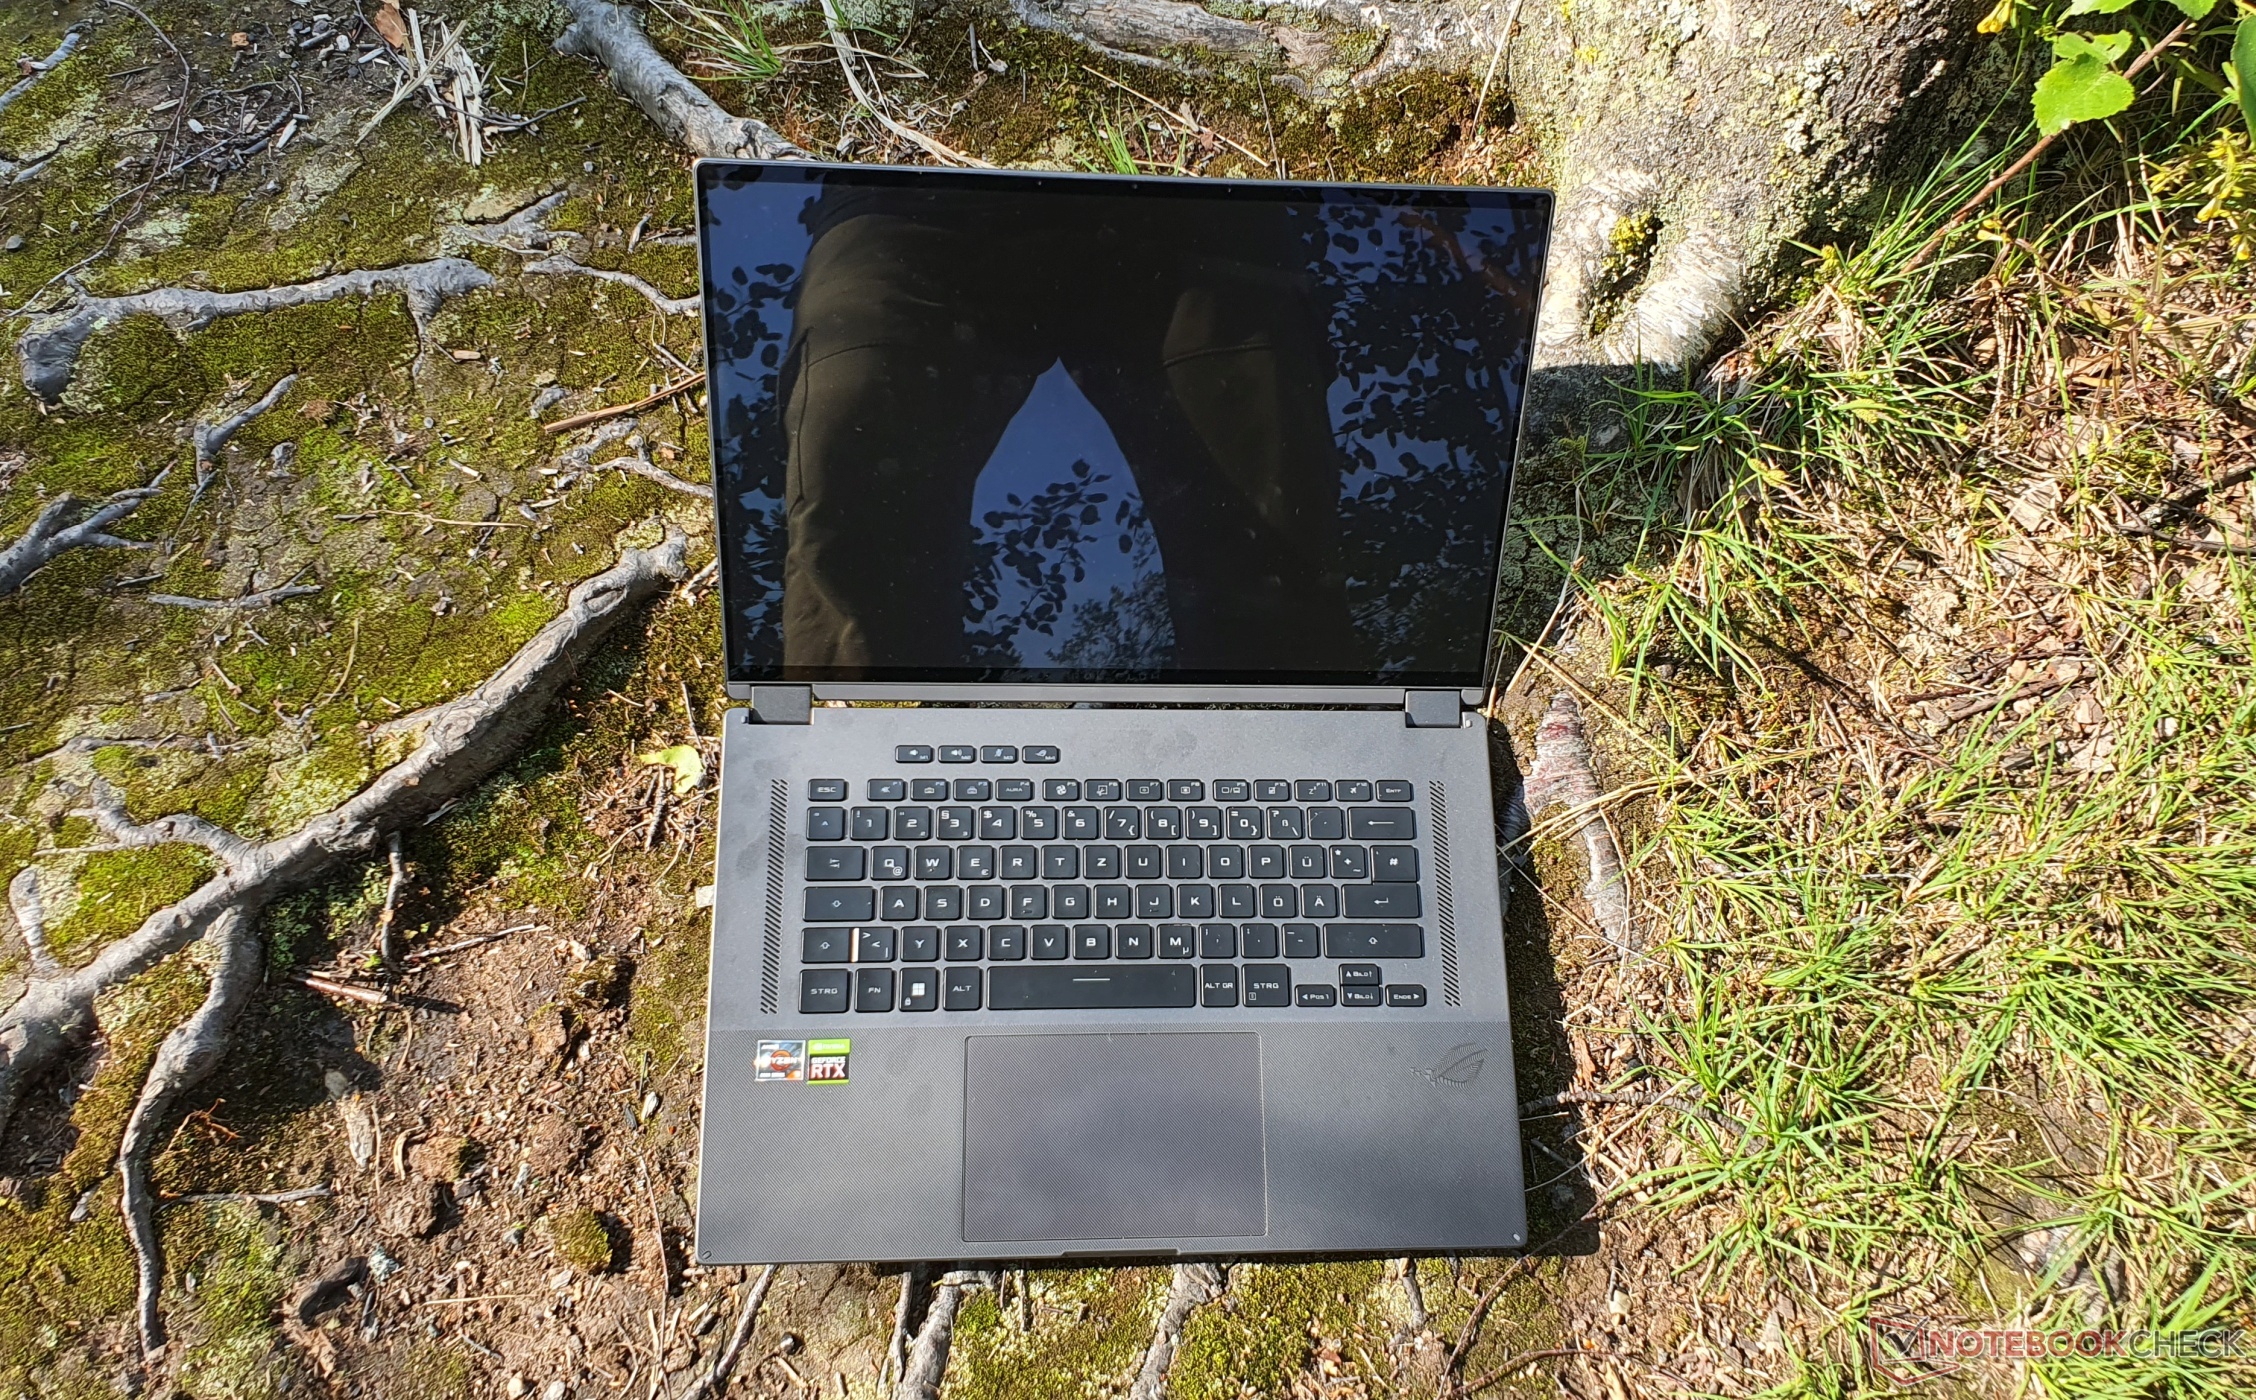
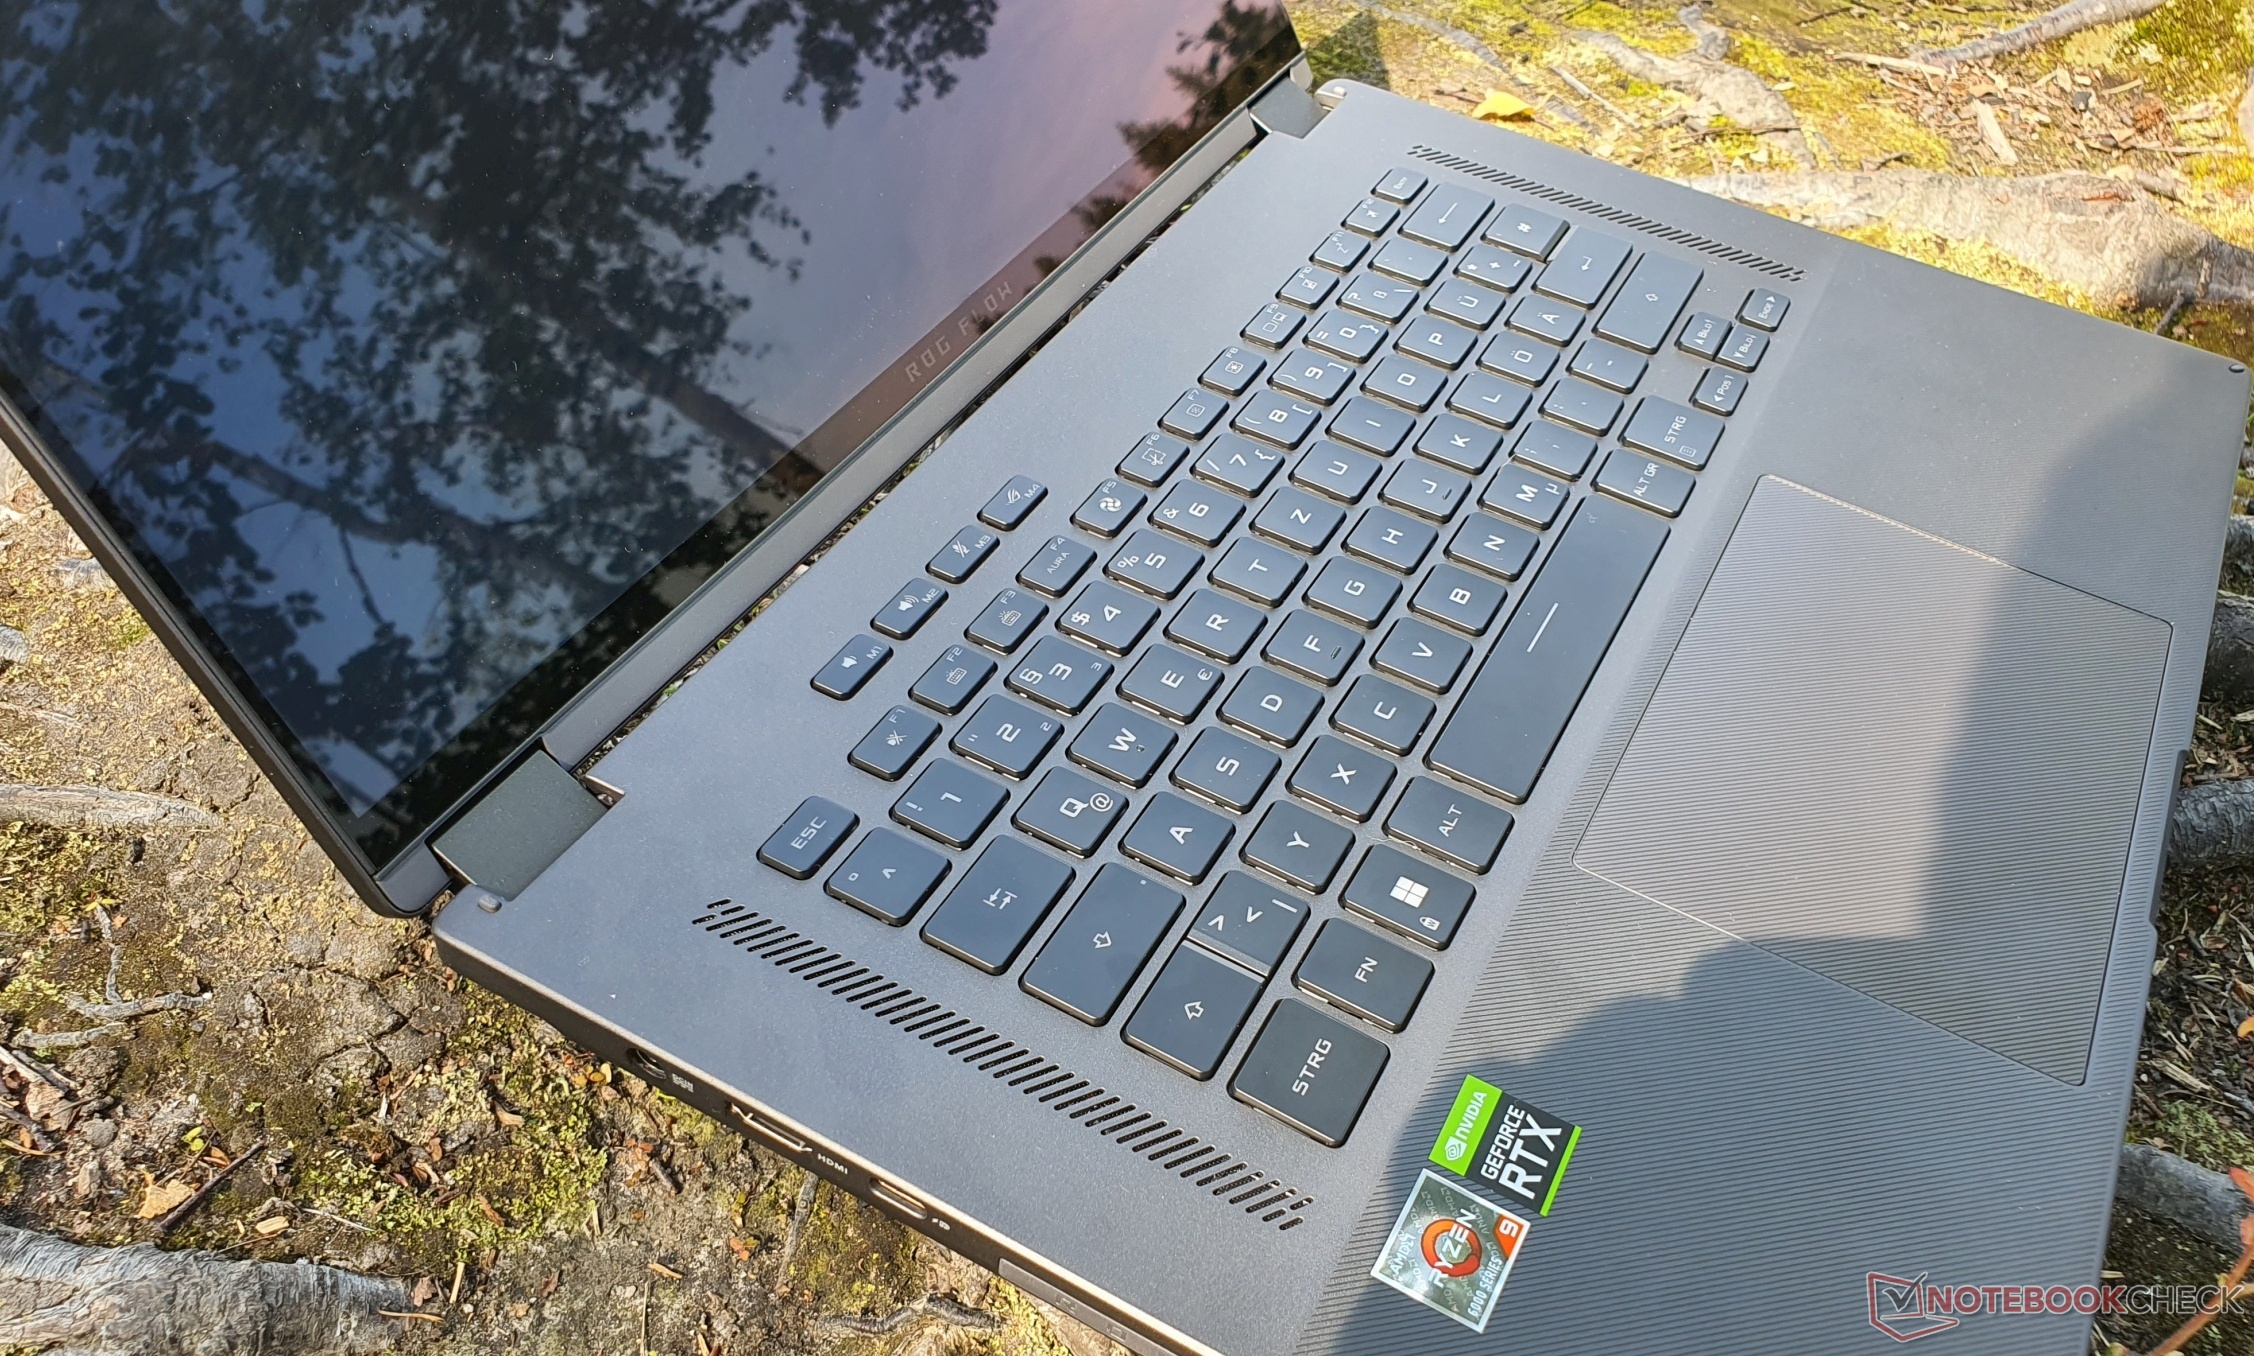
Asus installs a 6-row chiclet keyboard in the ROG Flow X16, whose keys are somewhat smaller at 15 x 15 mm. The lettering is even larger and features a special typography. Typical gaming laptop.
The travel of 1.7 mm is generous and the pressure point noticeable with clear strokes, but the key resistance may be a little too low for some people, which subjectively feels slightly spongy. The keys are not concave, unlike some business notebooks, but nothing stands in the way of fast typing after a short period of familiarization. Basically, the same keyboard is installed as in the Zephyrus M16. N-key rollover is supported to allow for the correct registering of multiple keystrokes simultaneously.
The RGB lighting can be adjusted in three intensity levels. However, the keys cannot be individually programmed (i.e. per key RGB). The layout is good and without surprises. The arrow keys are half the size, the enter key is split, and the usual double assignments have been allocated.
Touchpad & Touchscreen
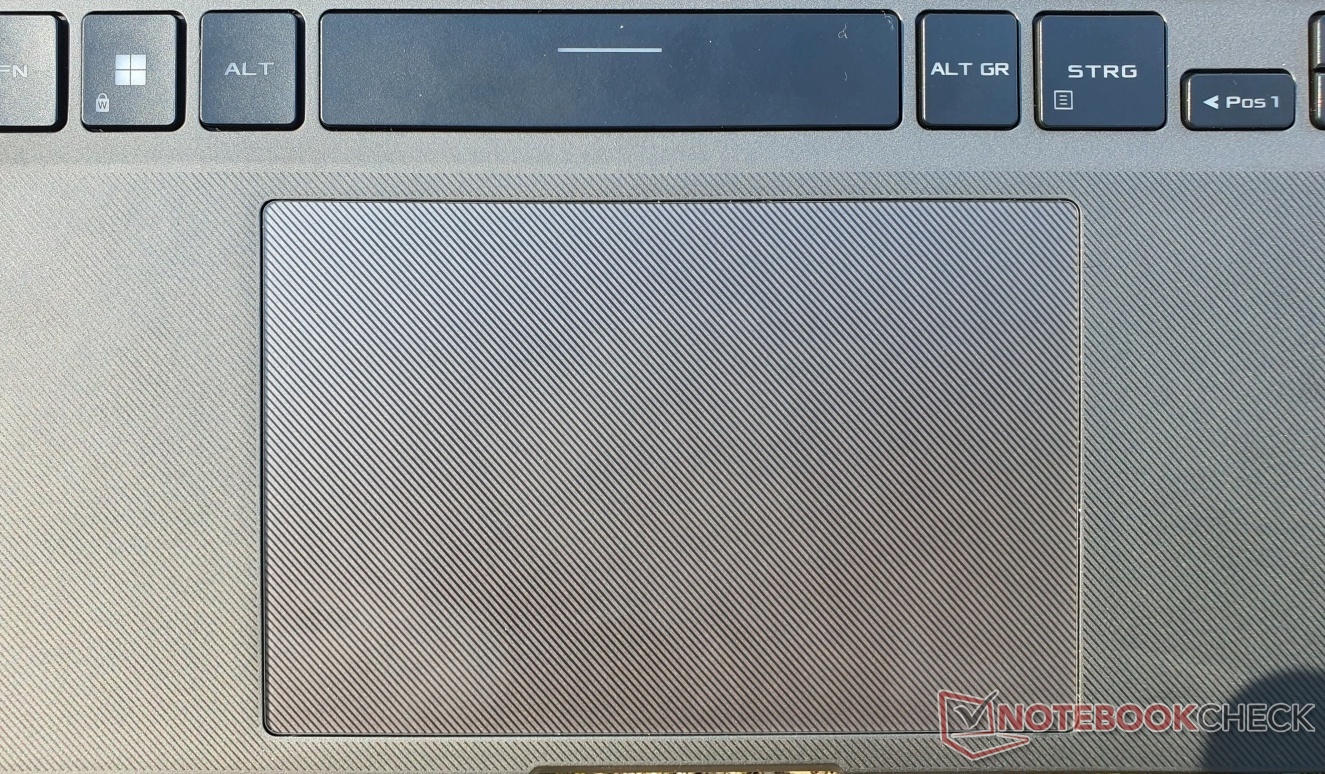
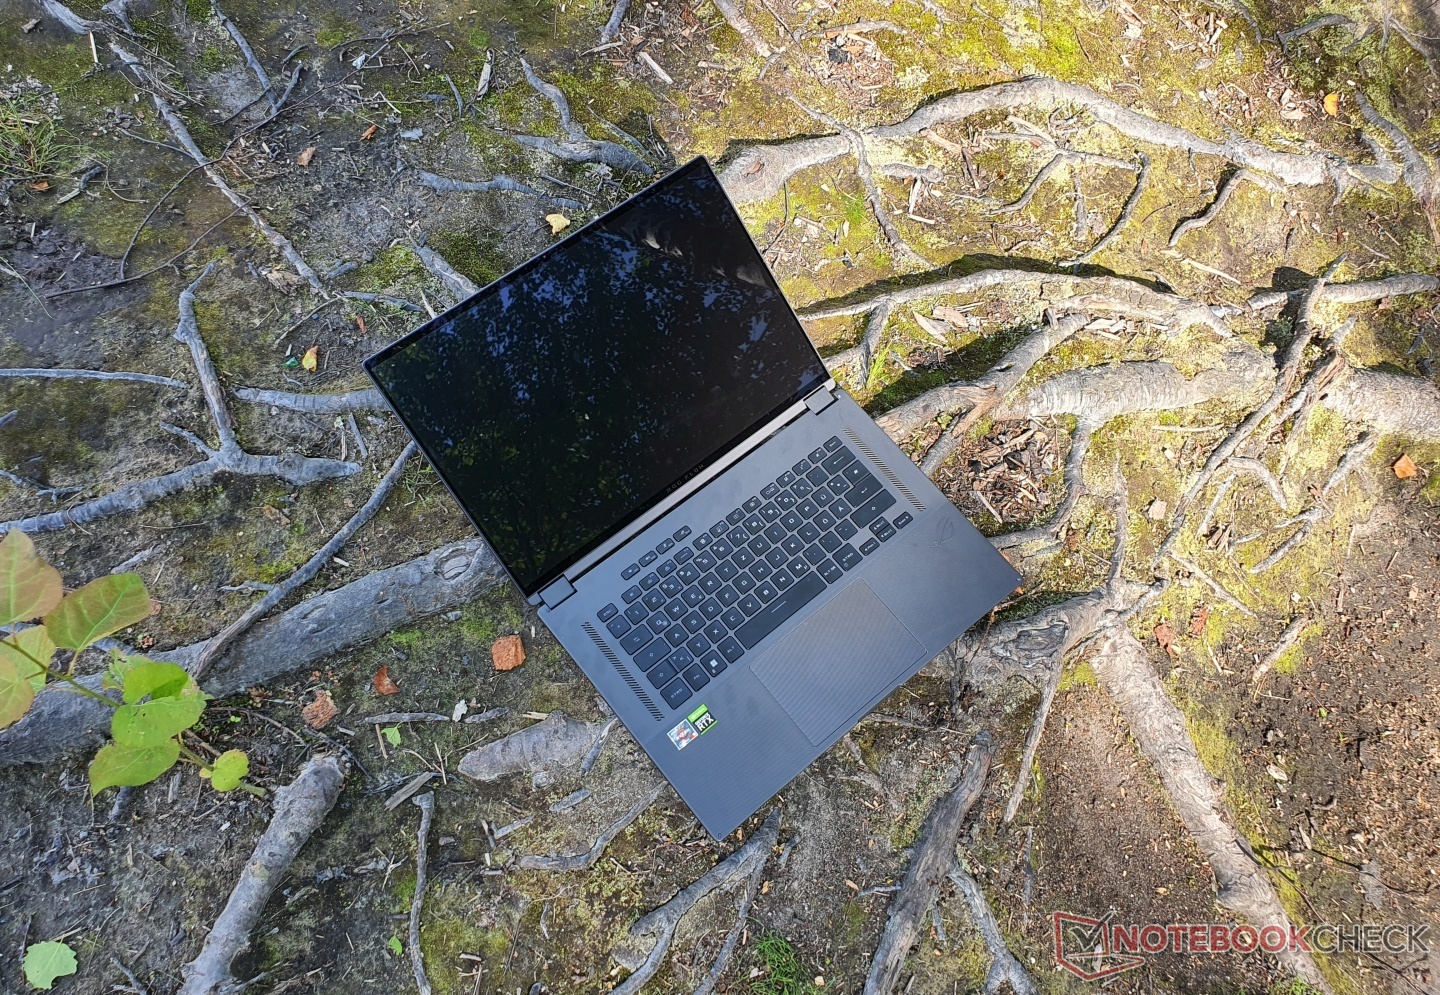
The large glass touchpad measures 13 x 8.5 cm and offers excellent gliding properties. Response and precision are at a high level. Multi-touch gestures and scrolling function without issue.
The integrated keys click quietly, have a short stroke and a satisfactory feedback. However, the touchpad failed after a short time and could not be reactivated. We suspect that this is due to a driver problem that only applies to our pre-production model.
All models of the ROG X16 Flow come with a touchscreen. The response and accuracy are good - scrolling is especially fun with the 165 Hz refresh rate. The included stylus (Asus SA201H) has 4,096 pressure levels and is powered by an AAAA battery. It glides quickly and precisely over the touchscreen and the pen tip offers adequate feedback, as do the two integrated buttons on the bottom side.
Best gaming display? Mini-LED with HDR 1000

The ROG Flow X16 can be ordered either with or without a mini-LED backlight. Some features remain unchanged: the resolution of 2560x1600 in 16:10 format, a refresh rate of 165 Hz and a glossy touchscreen with stylus support.
The mini-LED installed in our variant support DisplayHDR 1000 for the first time in a gaming notebook, alongside Asus' own Zephyrus Duo 16. However, the latter model also offers a matte non-touch variant.
Content looks even more appealing with DisplayHDR 1000 enabled, compared to previous laptops which only supported HDR 400 with significantly lower image enhancements. The only other laptops with DisplayHDR 1000 so far have been the MSI Creator 17 (2020) and Apple's MacBook Pro 16 (2021). Lenovo's Legion Slim 7i with a mini-LED display should also be available later this year.
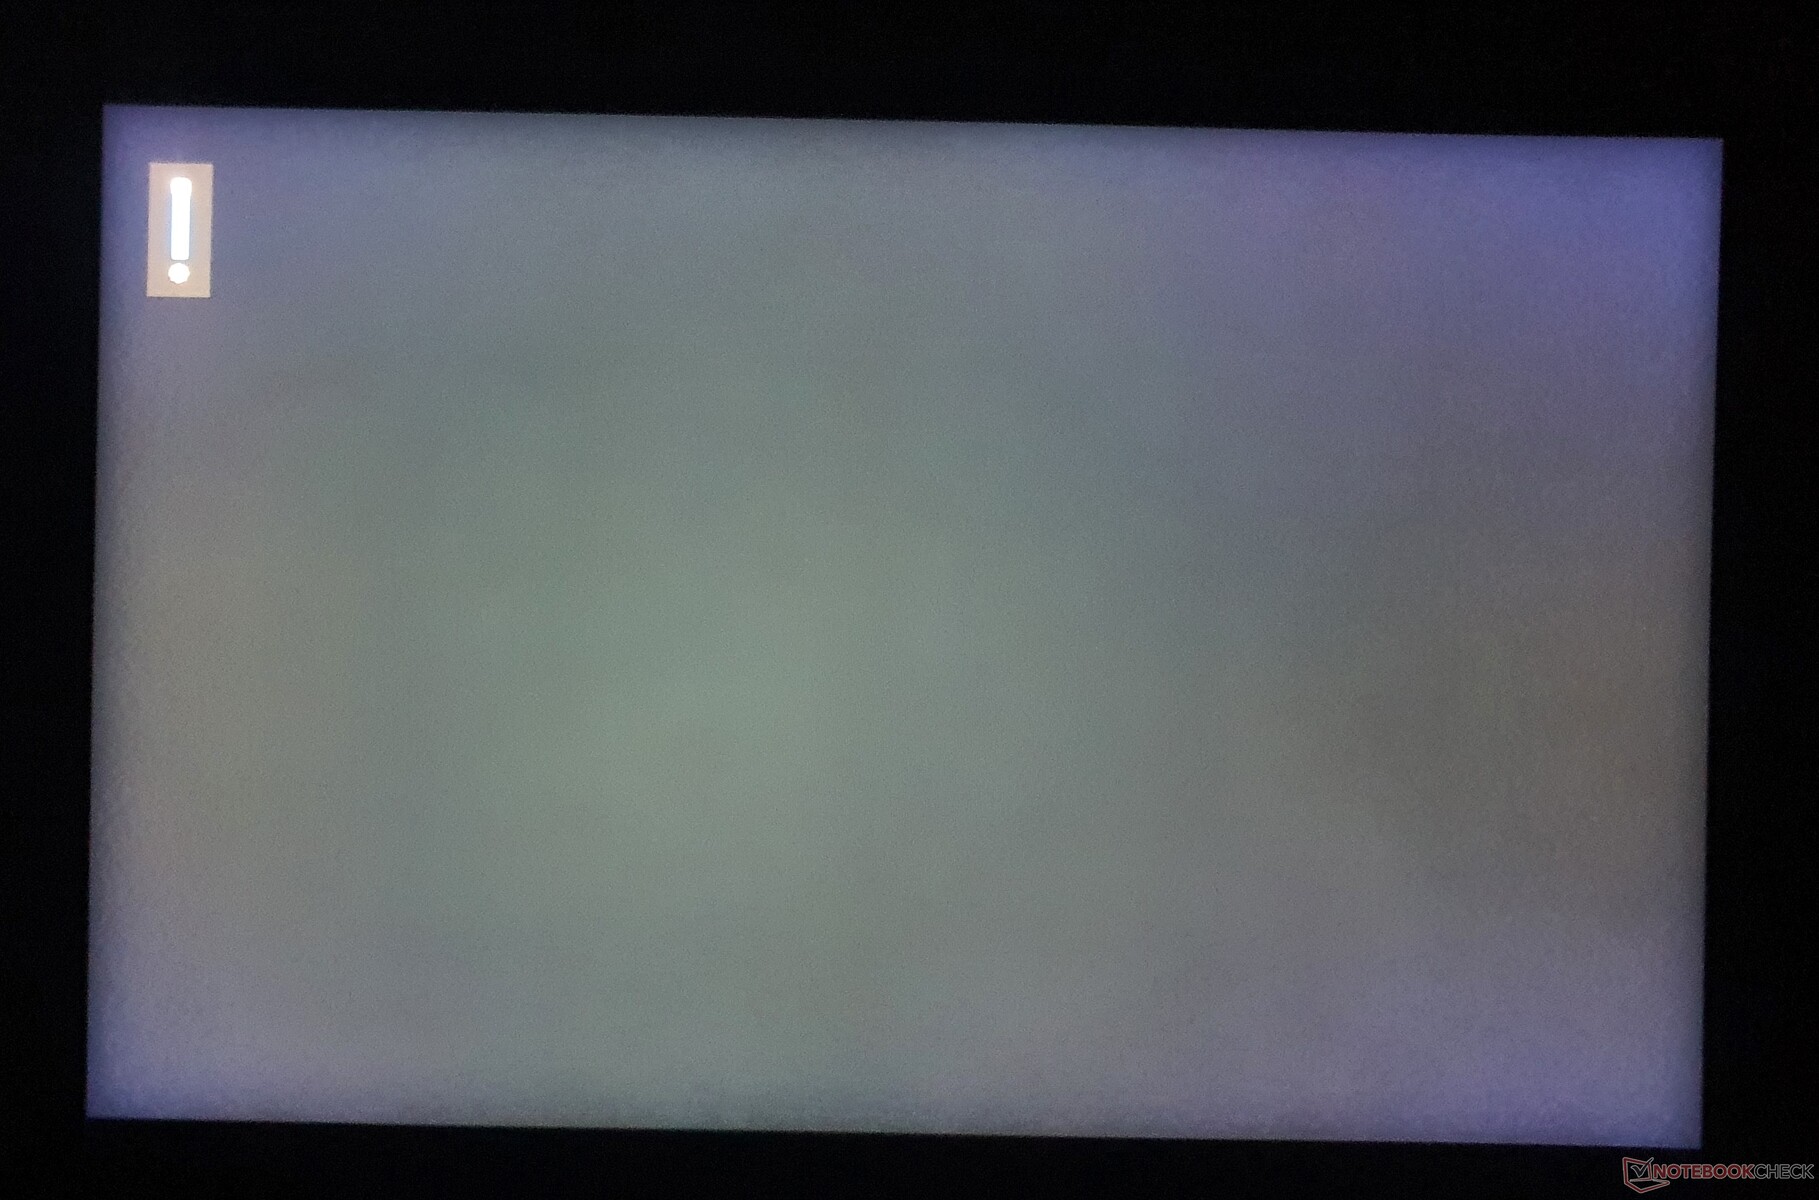
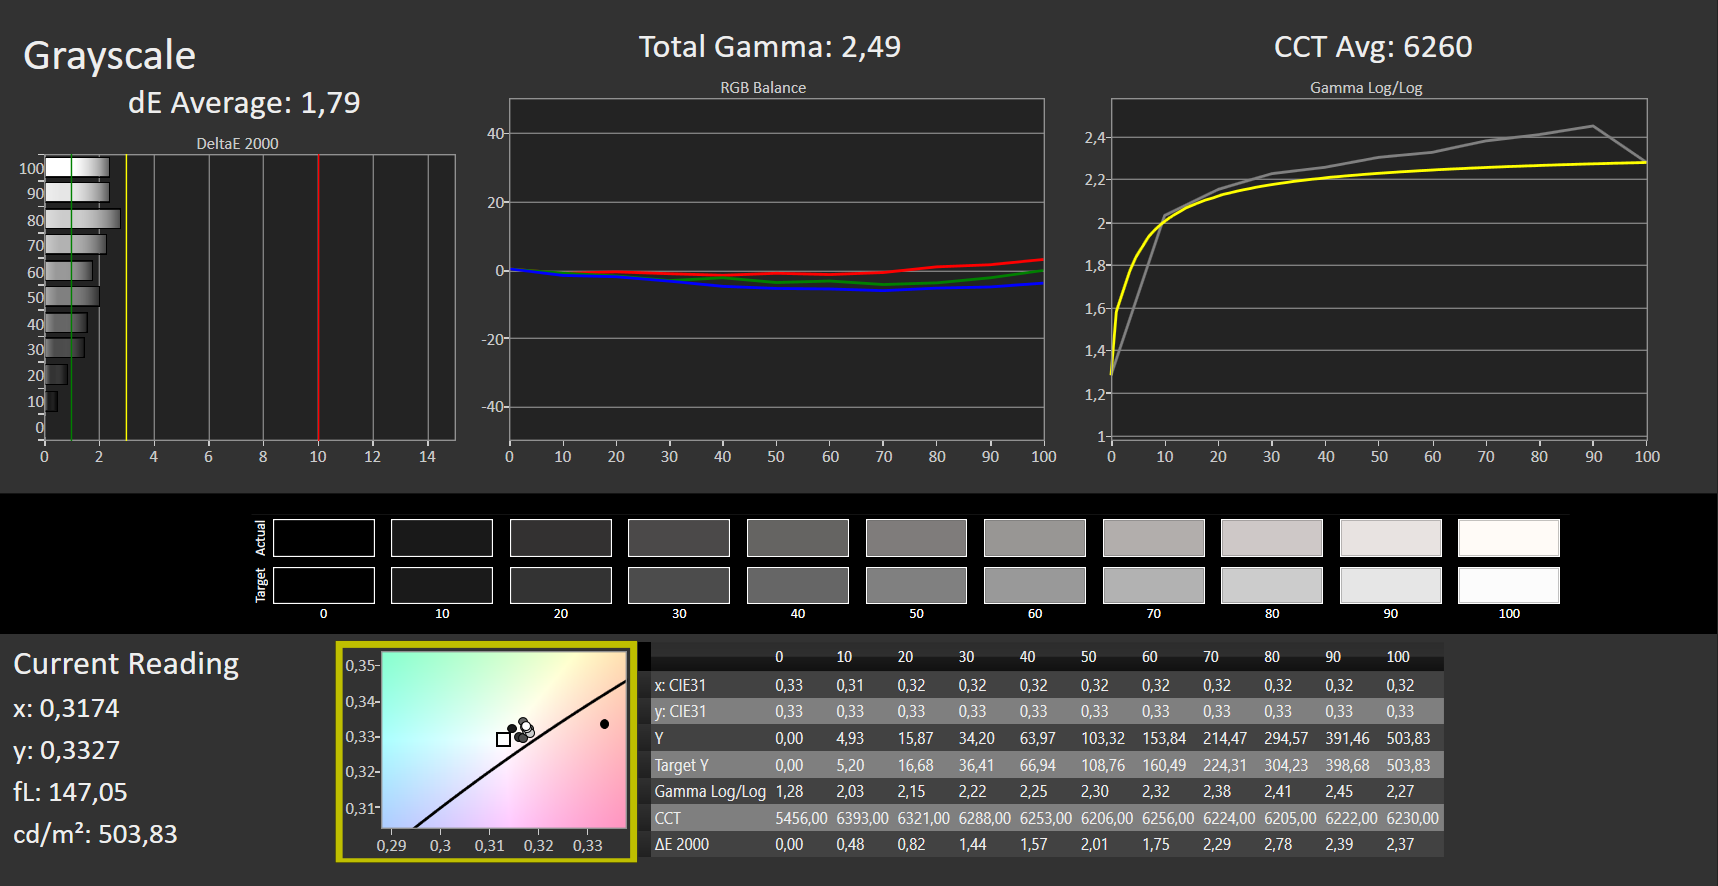
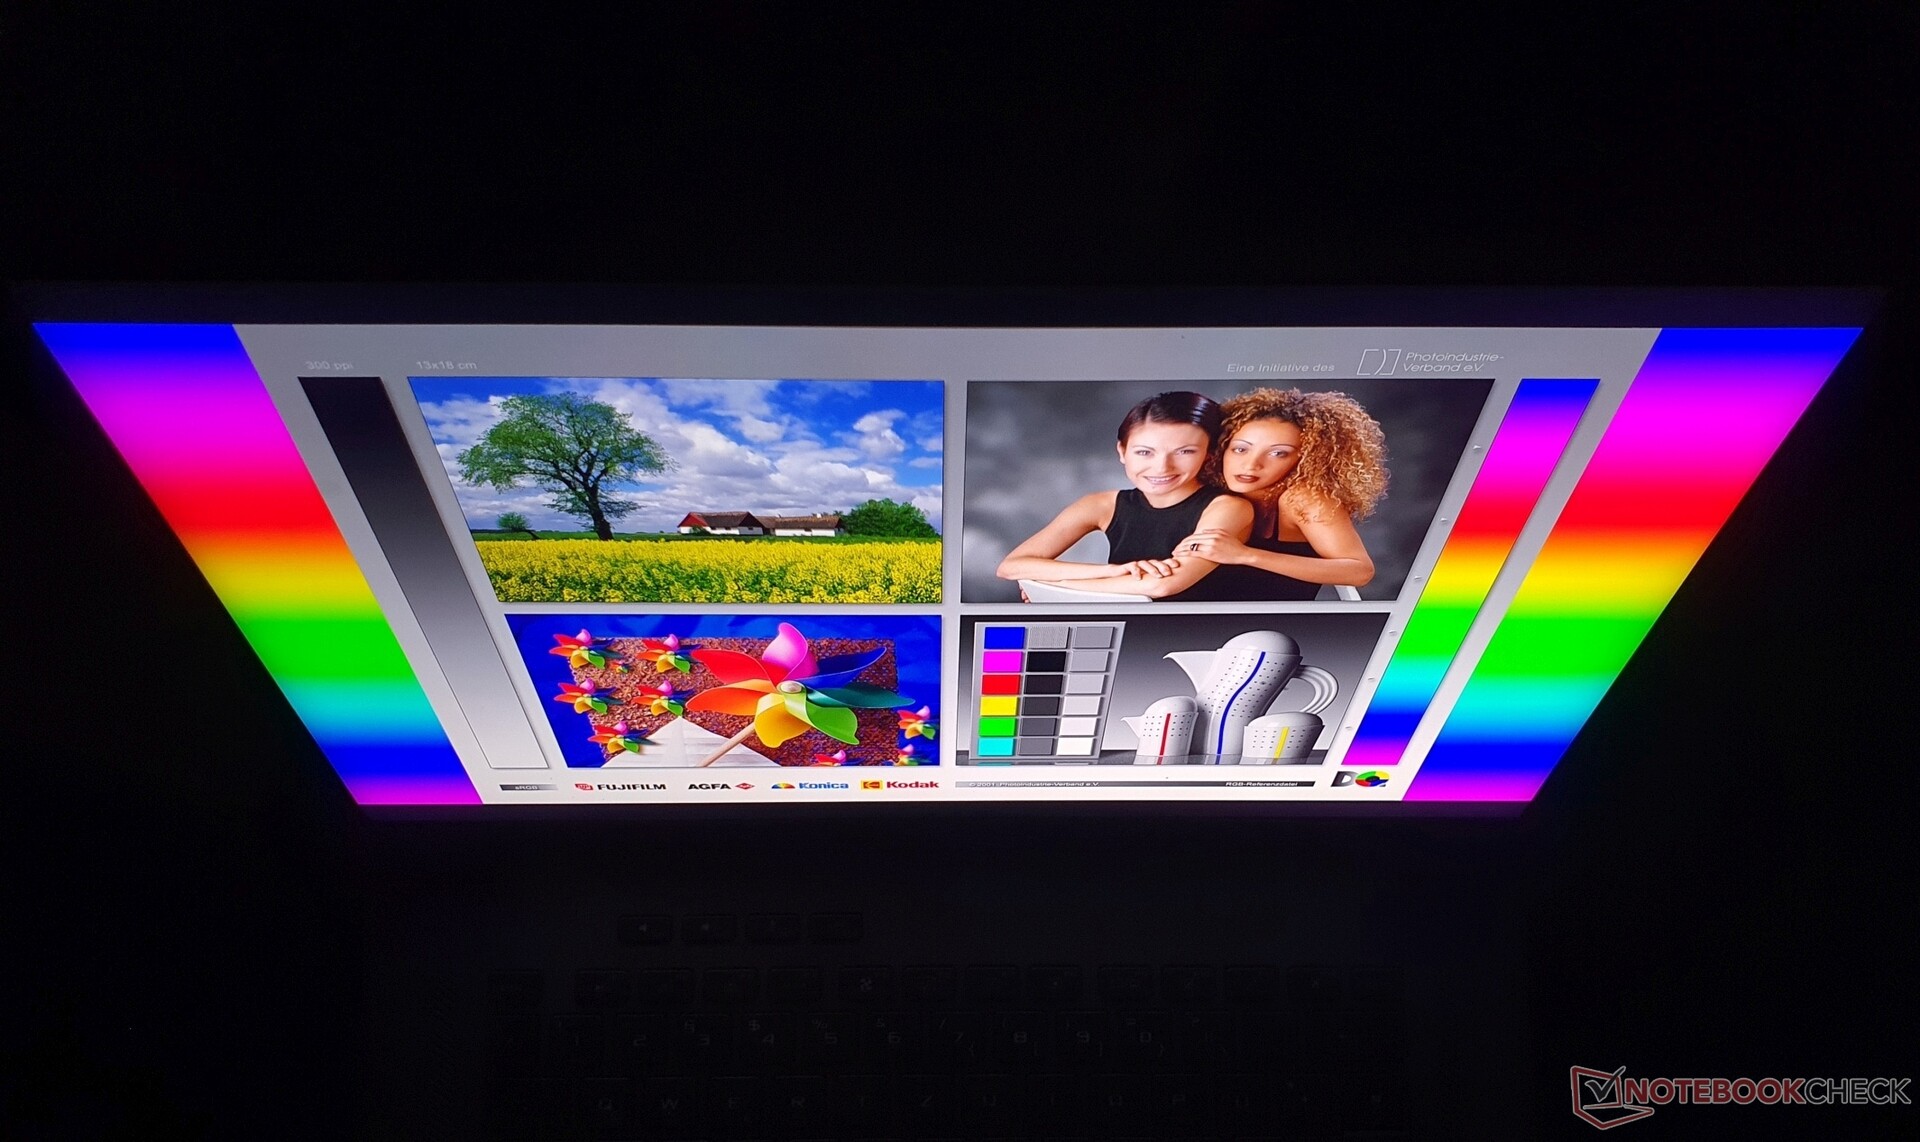
Subjective picture perception is excellent. Colors are displayed very well, the peak brightness of ~1,100 nits with HDR enabled (also works in normal desktop mode) is outstanding, and the black level of 0.11 nits is almost as rich as in OLED, while the contrast ratio of 4,527:1 is very good, as is typical for mini-LED. Our measurements were carried out in SDR mode. In HDR mode, the contrast ratio is typically much higher, particularly due to the 512 activated local dimming zones of our display: Individual pixel areas completely turn off as soon as black is displayed, or areas glow very brightly with HDR content. There are no halos, which also explains the very solid illumination homogeneity of 95%. Average HDR brightness is typically around 20 percent below peak brightness (not measured).
Together with a frame rate of 165 Hz and good response times of 11 ms each (gray to gray and black to white), the display is unrivaled in HDR gaming. Adaptive Sync is supported. Only those who play mostly fast-paced shooters are likely look for alternatives with even higher frame rates and lower response times, such as the MSI Stealth GS66, and may prefer a lower Full HD resolution, since maximum FPS and speed have absolute priority in fast-paced shooters. But since the ROG X16 Flow is also designed for creators, it is not only ideal for HDR content in gaming, but also in editing.
Overall, only Apple's MacBook Pro 16 with its own Mini LED display comes close to the display quality. OLED panels, such as in Gigabyte Aero 16, are not bright enough for DisplayHDR 1000. On the other hand, mini-LED exhibits "blooming" (that is, the light of bright LEDs shines into surrounding, darker content, similar to backlight bleeding, since local dimming zones are larger than pixels) in our review device, but this is somewhat less pronounced than in the MacBook or the iPad Pro 12.9 with the M1 chip. PWM is something we have always observed in mini-LED displays so far, but the very high frequency of 7,400 MHz should not pose any problems, even for sensitive users.
| |||||||||||||||||||||||||
Brightness Distribution: 94 %
Center on Battery: 502 cd/m²
Contrast: 4527:1 (Black: 0.11 cd/m²)
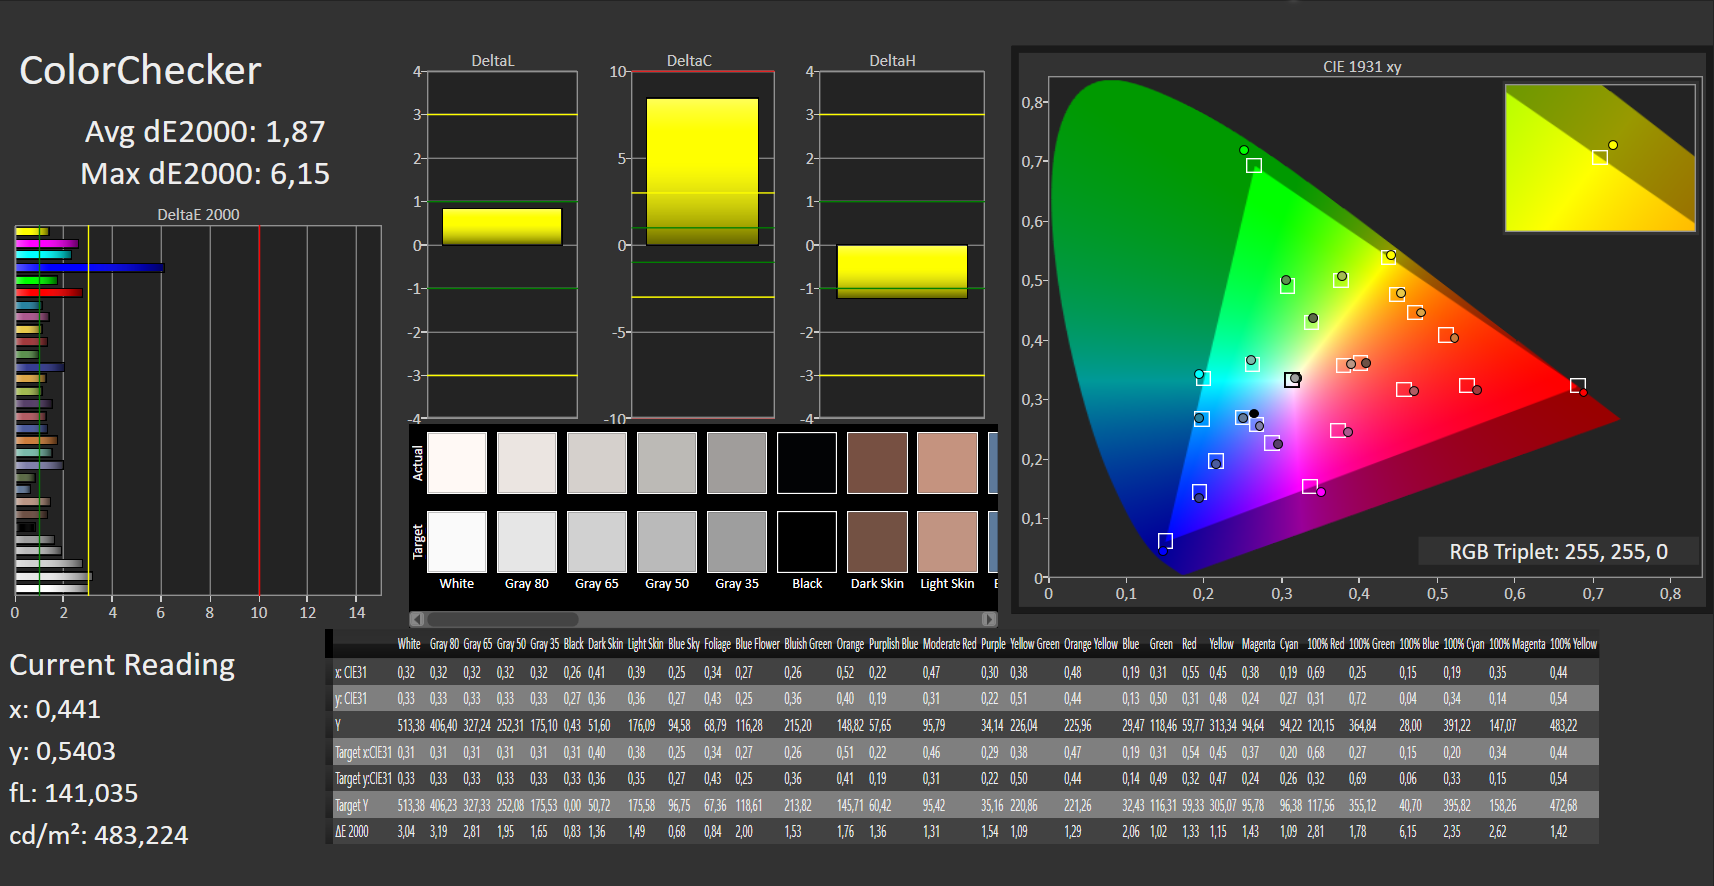
ΔE ColorChecker Calman: 1.87 | ∀{0.5-29.43 Ø4.78}
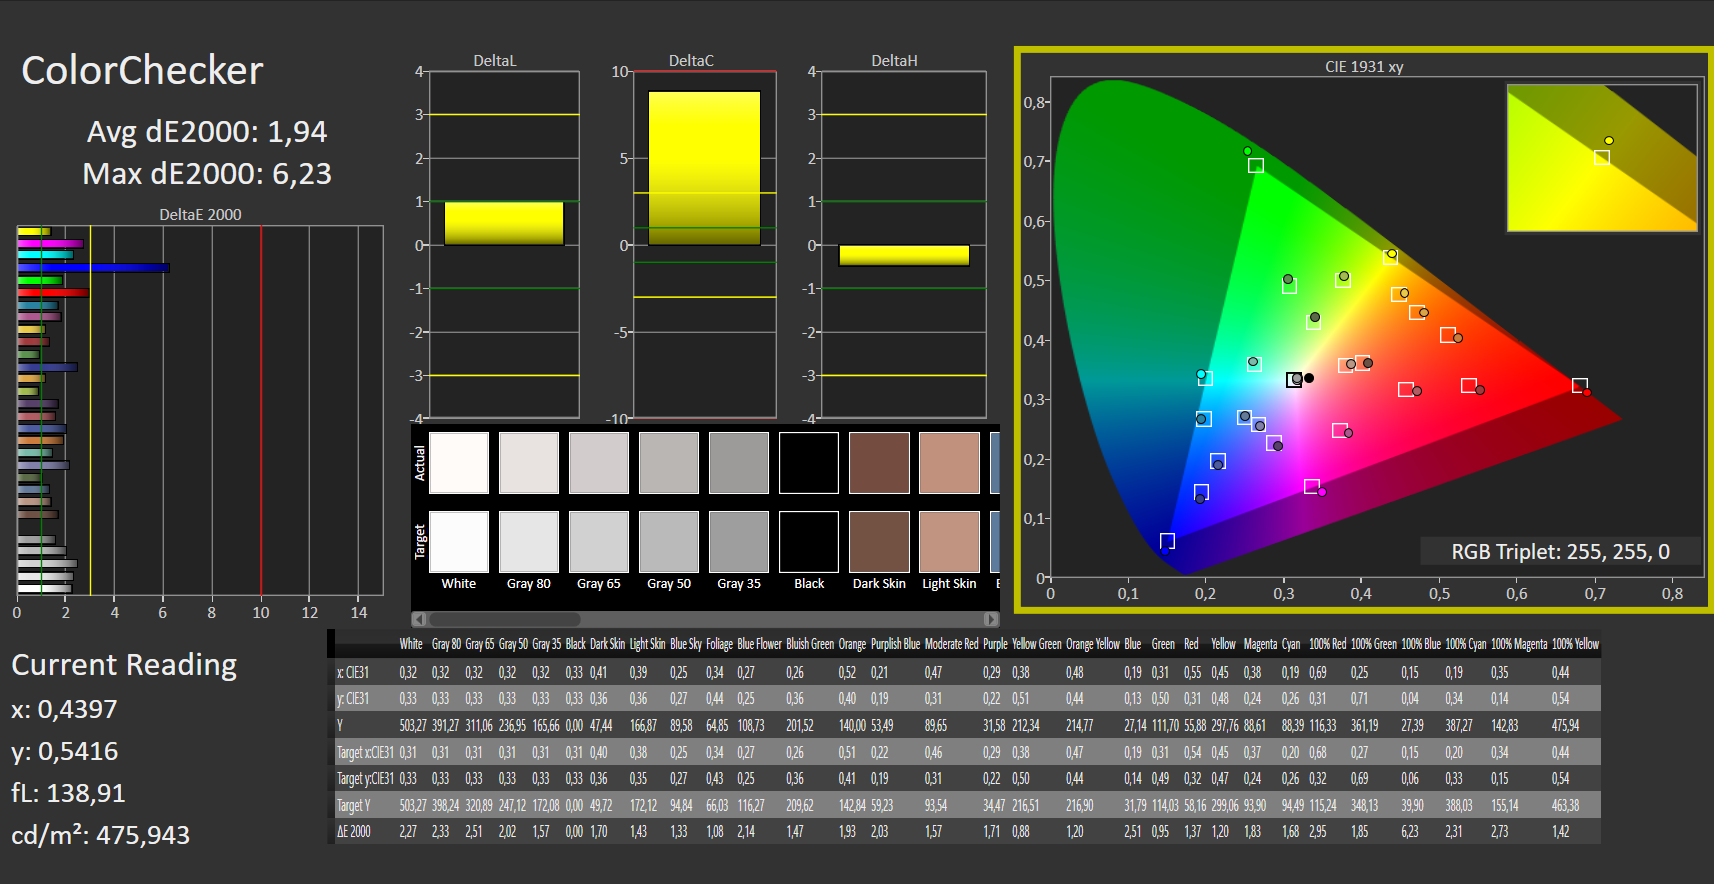
calibrated: 1.94
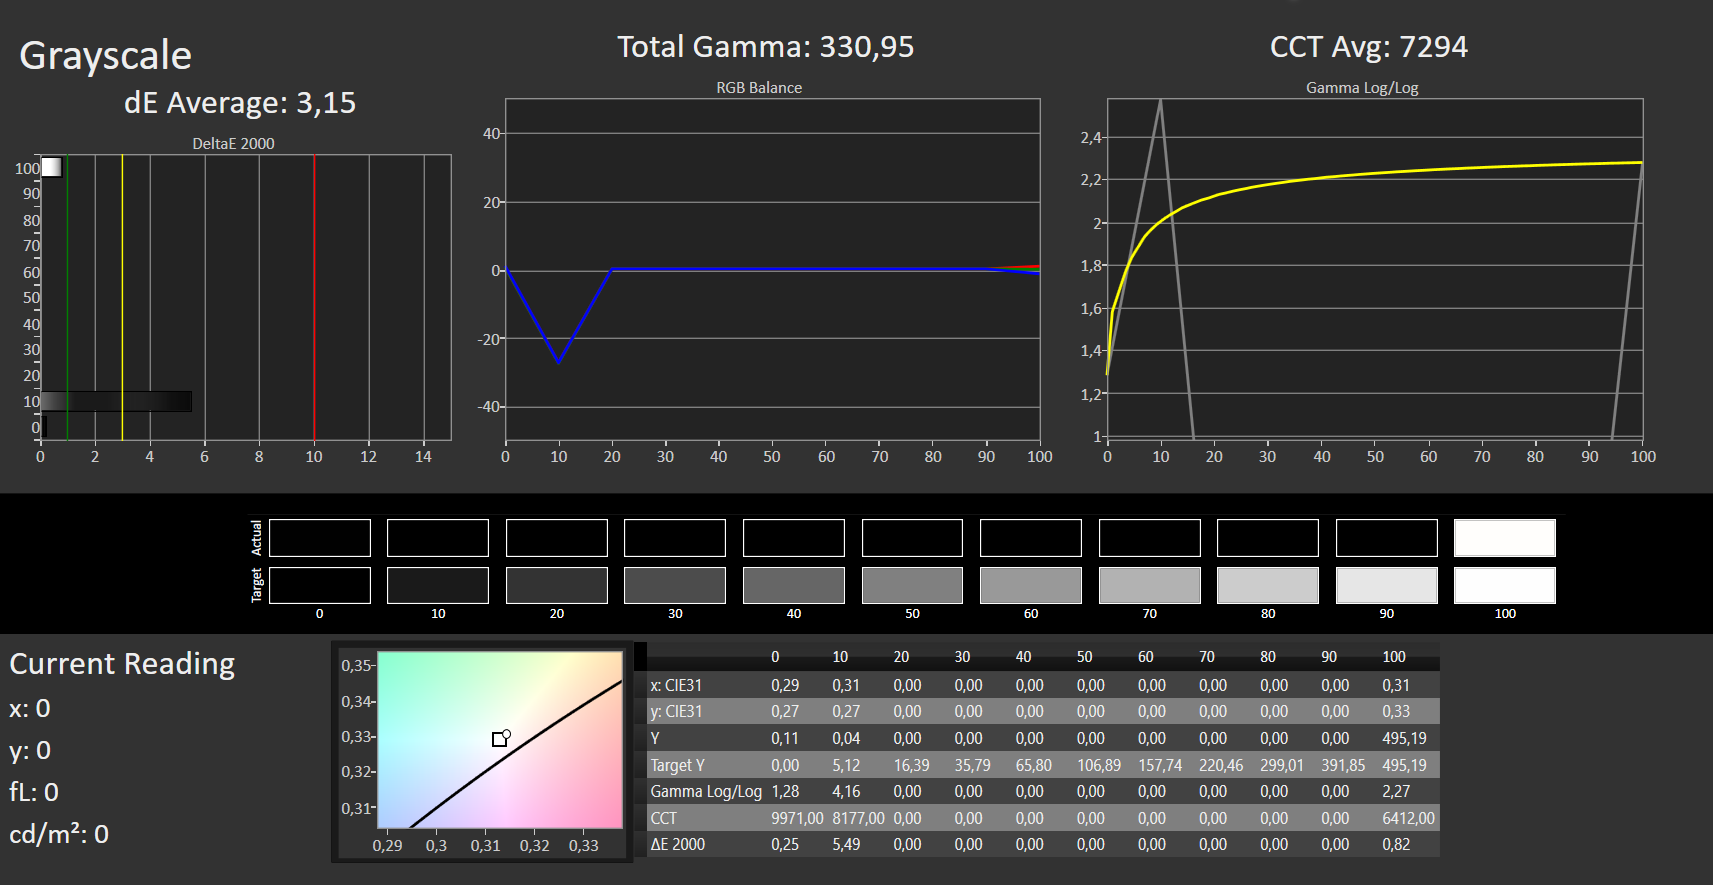
ΔE Greyscale Calman: 3.15 | ∀{0.09-98 Ø5}
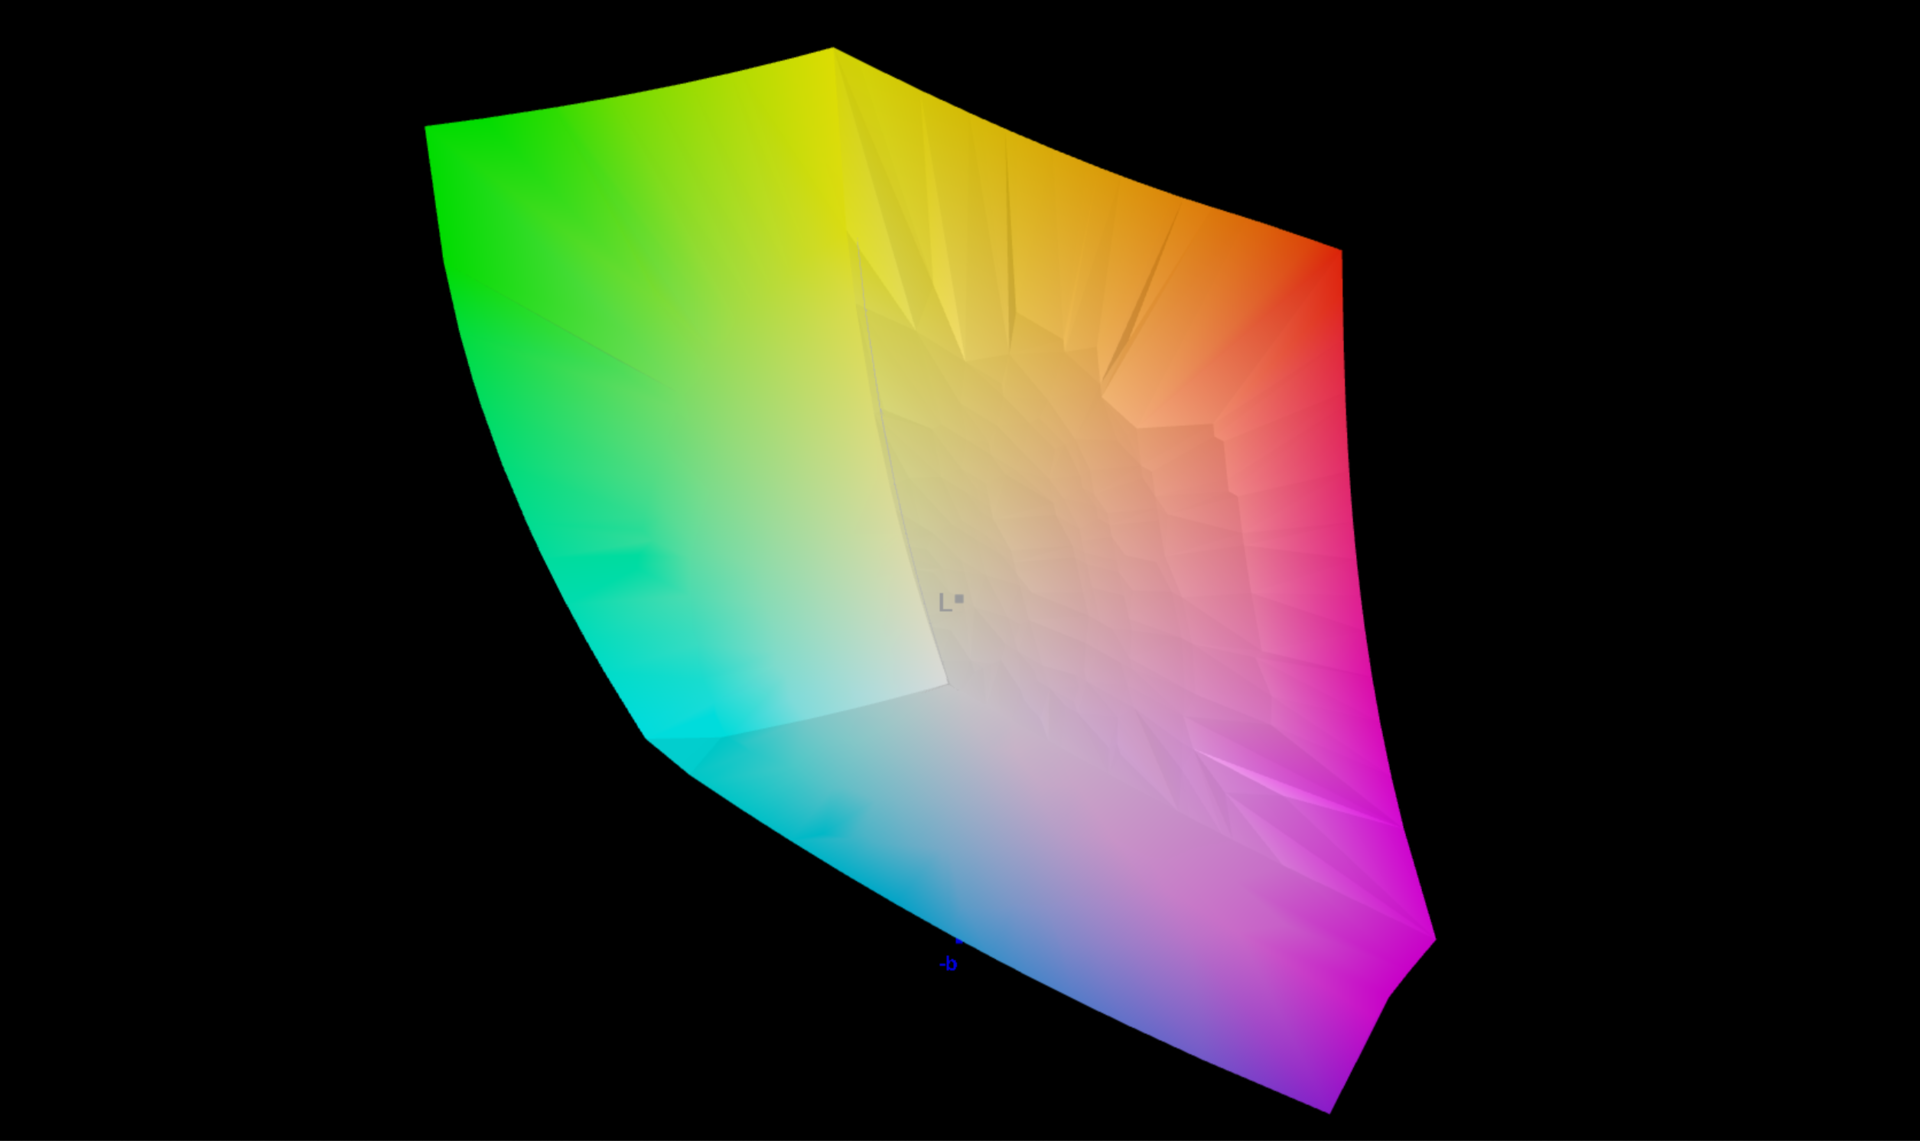
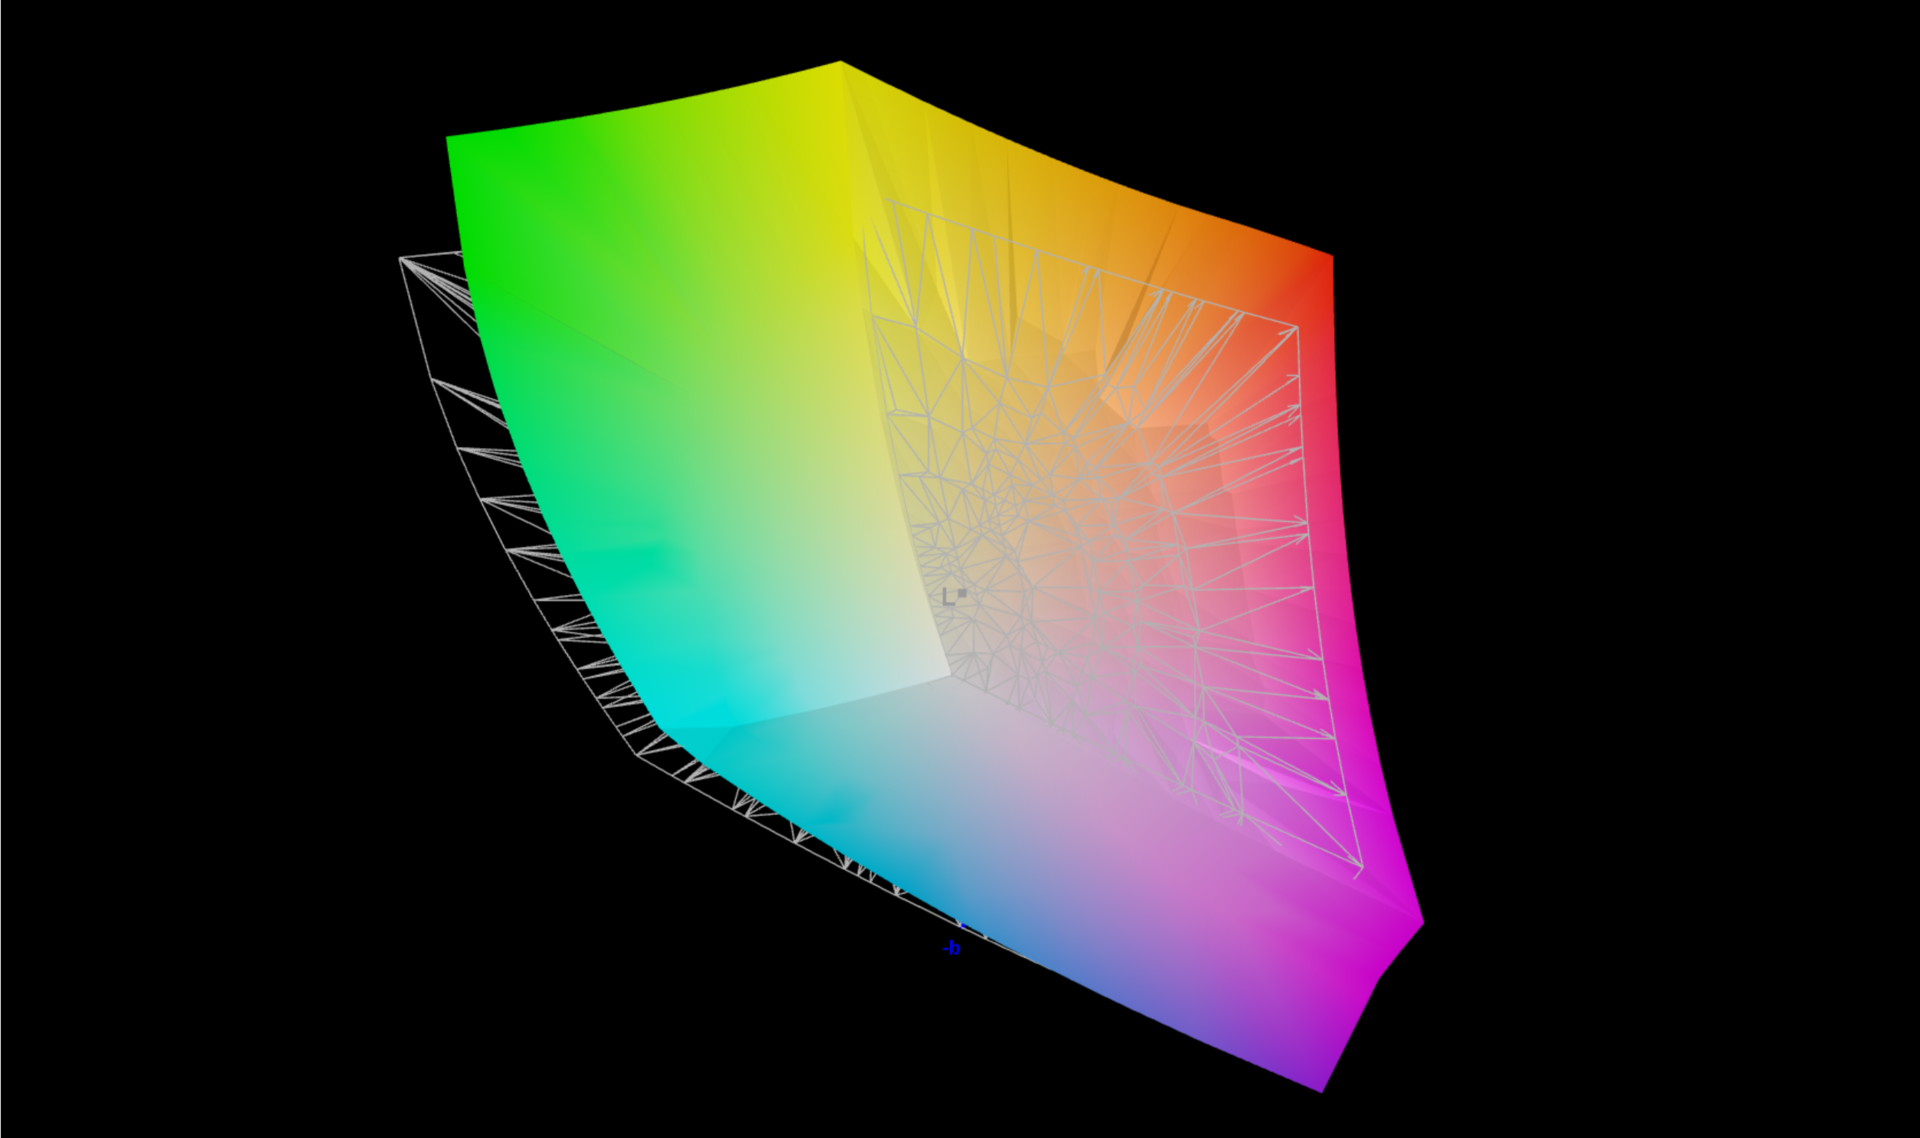
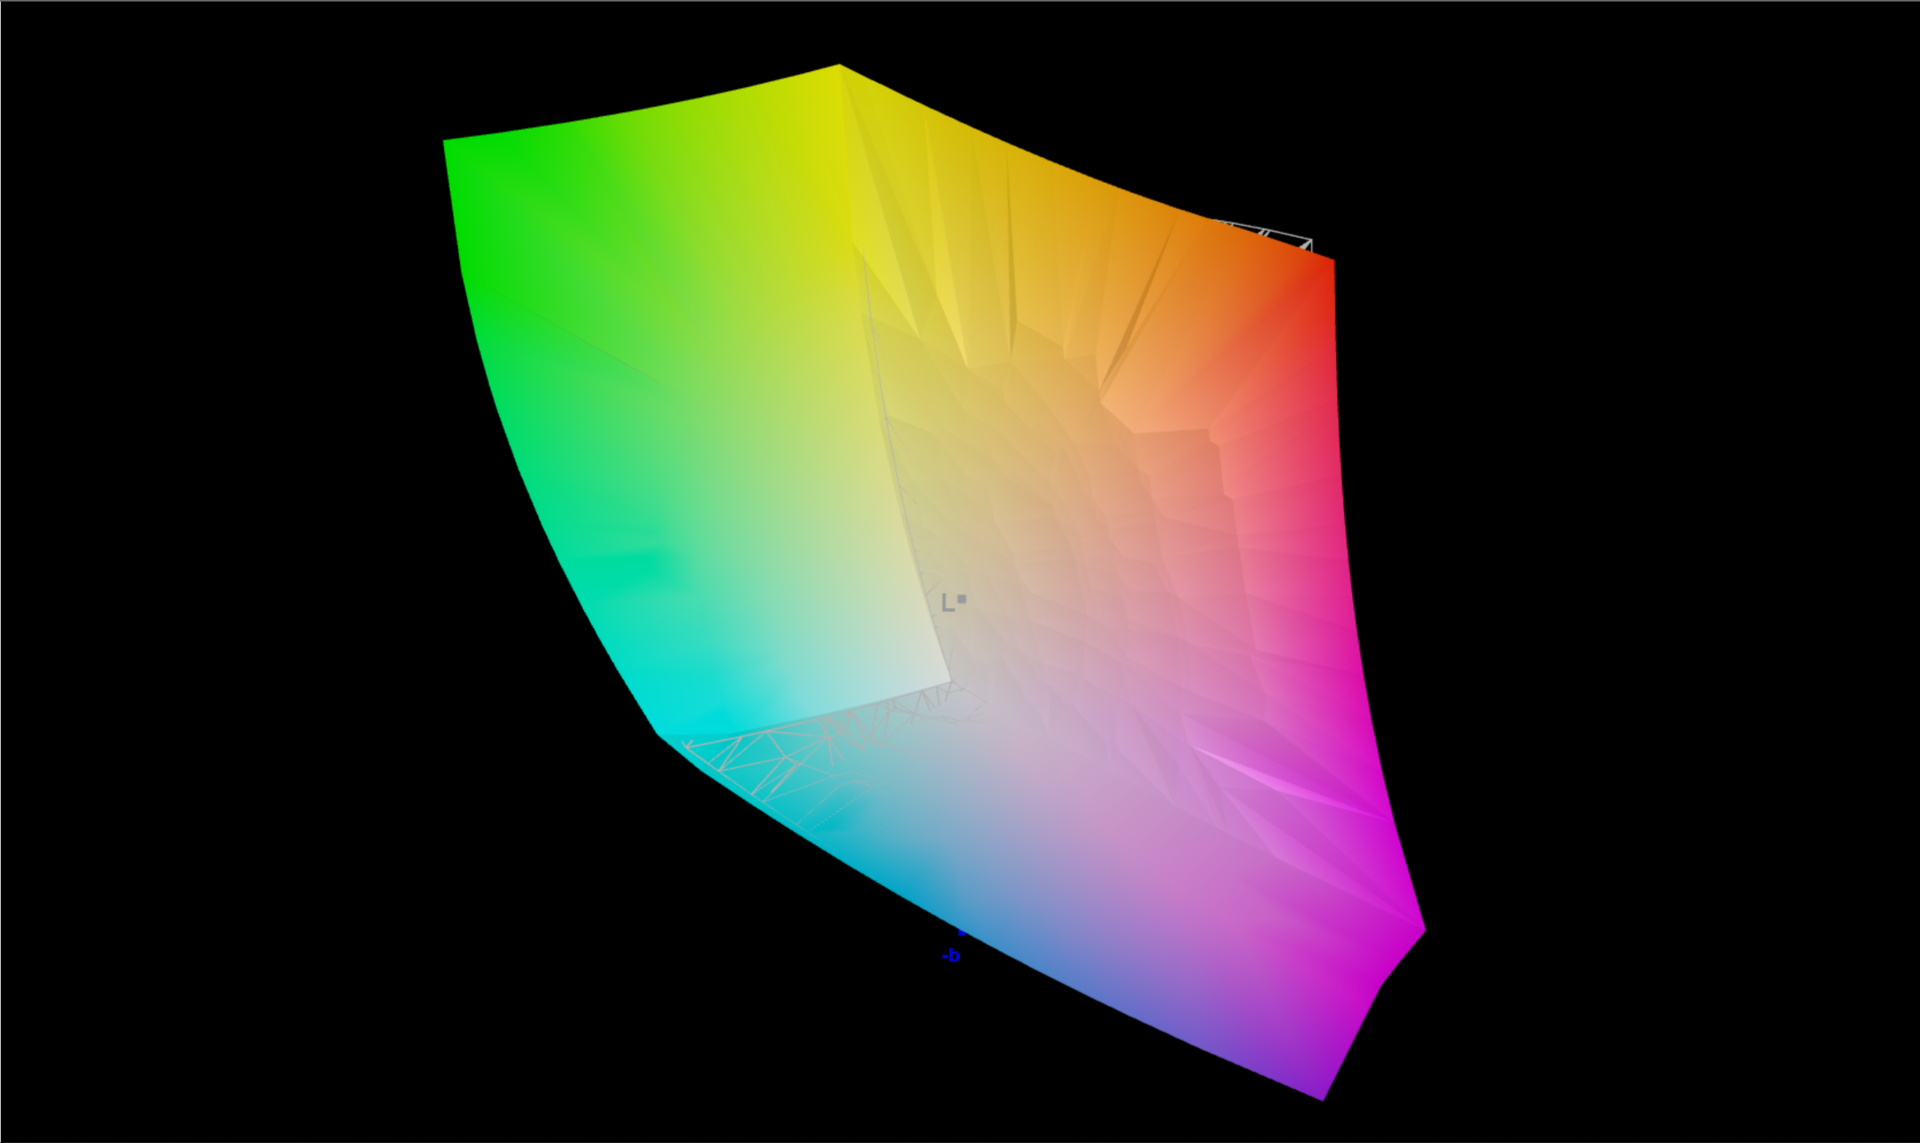
90.21% AdobeRGB 1998 (Argyll 3D)
99.99% sRGB (Argyll 3D)
99.82% Display P3 (Argyll 3D)
Gamma: 330.95
CCT: 7294 K
| Asus ROG Flow X16 GV601RW-M5082W AUO B160QAN02.S, Mini LED, 2560x1600, 16.1" | Asus ROG Zephyrus M16 GU603H AU Optronics AUOC199, IPS, 2560x1600, 16" | Gigabyte Aero 16 YE5 Samsung SDC416B, AMOLED, 3840x2400, 16" | MSI Stealth GS66 12UGS Sharp LQ156T1JW04 (SHP153C), IPS-Level, 2560x1440, 15.6" | Lenovo Legion 5 Pro 16 G7 i7 RTX 3070Ti NE160QDM-NY1, IPS, 2560x1600, 16" | Apple MacBook Pro 16 2021 M1 Pro Liquid Retina XDR, Mini-LED, 3456x2234, 16.2" | Lenovo ThinkPad X1 Extreme G4-20Y5CTO1WW (3050 Ti) LP160UQ1-SPB1, IPS LED, 3840x2400, 16" | Dell XPS 17 9720 RTX 3060 Sharp LQ170R1, IPS, 3840x2400, 17" | Microsoft Surface Laptop Studio i7 RTX 3050 Ti LQ144P1JX01, IPS, 2400x1600, 14.4" | |
|---|---|---|---|---|---|---|---|---|---|
| Display | -3% | -18% | -1% | -3% | -4% | -11% | |||
| Display P3 Coverage (%) | 99.82 | 96.4 -3% | 68.7 -31% | 99.1 -1% | 84.3 -16% | 92.9 -7% | 80.6 -19% | ||
| sRGB Coverage (%) | 99.99 | 99.7 0% | 97.6 -2% | 100 0% | 98.3 -2% | 100 0% | 99.9 0% | ||
| AdobeRGB 1998 Coverage (%) | 90.21 | 85.6 -5% | 70.9 -21% | 88 -2% | 97.8 8% | 85.3 -5% | 78.5 -13% | ||
| Response Times | 51% | 80% | 35% | -15% | -511% | -364% | -293% | -275% | |
| Response Time Grey 50% / Grey 80% * (ms) | 11 ? | 4.8 ? 56% | 2.4 ? 78% | 6 ? 45% | 17.6 ? -60% | 42.8 ? -289% | 60 ? -445% | 51.2 ? -365% | 58.4 ? -431% |
| Response Time Black / White * (ms) | 11 ? | 6 ? 45% | 2 ? 82% | 8.4 ? 24% | 7.6 ? 31% | 91.6 ? -733% | 42 ? -282% | 35.2 ? -220% | 24 ? -118% |
| PWM Frequency (Hz) | 7400 ? | 60 ? | 14880 | 5000 ? | |||||
| Screen | -61% | 104% | -57% | -32% | 82% | -32% | -90% | -5% | |
| Brightness middle (cd/m²) | 498 | 448 -10% | 368 -26% | 272 -45% | 502 1% | 514 3% | 639 28% | 512.7 3% | 497 0% |
| Brightness (cd/m²) | 502 | 446 -11% | 368 -27% | 253 -50% | 491 -2% | 497 -1% | 612 22% | 463 -8% | 491 -2% |
| Brightness Distribution (%) | 94 | 86 -9% | 93 -1% | 87 -7% | 91 -3% | 95 1% | 84 -11% | 85 -10% | 92 -2% |
| Black Level * (cd/m²) | 0.11 | 0.48 -336% | 0.01 91% | 0.25 -127% | 0.37 -236% | 0.02 82% | 0.47 -327% | 0.32 -191% | 0.29 -164% |
| Contrast (:1) | 4527 | 933 -79% | 36800 713% | 1088 -76% | 1357 -70% | 25700 468% | 1360 -70% | 1602 -65% | 1714 -62% |
| Colorchecker dE 2000 * | 1.87 | 2.76 -48% | 2.33 -25% | 3.73 -99% | 2.7 -44% | 1.4 25% | 2.2 -18% | 5.98 -220% | 1.2 36% |
| Colorchecker dE 2000 max. * | 6.15 | 7.09 -15% | 4.34 29% | 9.43 -53% | 4.5 27% | 2.8 54% | 5.3 14% | 12.09 -97% | 2.8 54% |
| Colorchecker dE 2000 calibrated * | 1.94 | 2.86 -47% | 0.98 49% | 1.4 28% | 1.4 28% | 0.8 59% | |||
| Greyscale dE 2000 * | 3.15 | 3.1 2% | 0.8 75% | 6.5 -106% | 2.7 14% | 2.3 27% | 1.7 46% | 7.2 -129% | 1.9 40% |
| Gamma | 330.95 1% | 2.153 102% | 2.119 104% | 2.172 101% | 2.44 90% | 2.27 97% | 2.31 95% | 2.54 87% | 2.14 103% |
| CCT | 7294 89% | 6826 95% | 6569 99% | 6485 100% | 6326 103% | 6792 96% | 6390 102% | 6914 94% | 6821 95% |
| Color Space (Percent of AdobeRGB 1998) (%) | 87 | ||||||||
| Color Space (Percent of sRGB) (%) | 100 | ||||||||
| Total Average (Program / Settings) | -5% /
-41% | 92% /
99% | -8% /
-32% | -22% /
-26% | -143% /
-28% | -133% /
-73% | -129% /
-101% | -97% /
-44% |
* ... smaller is better
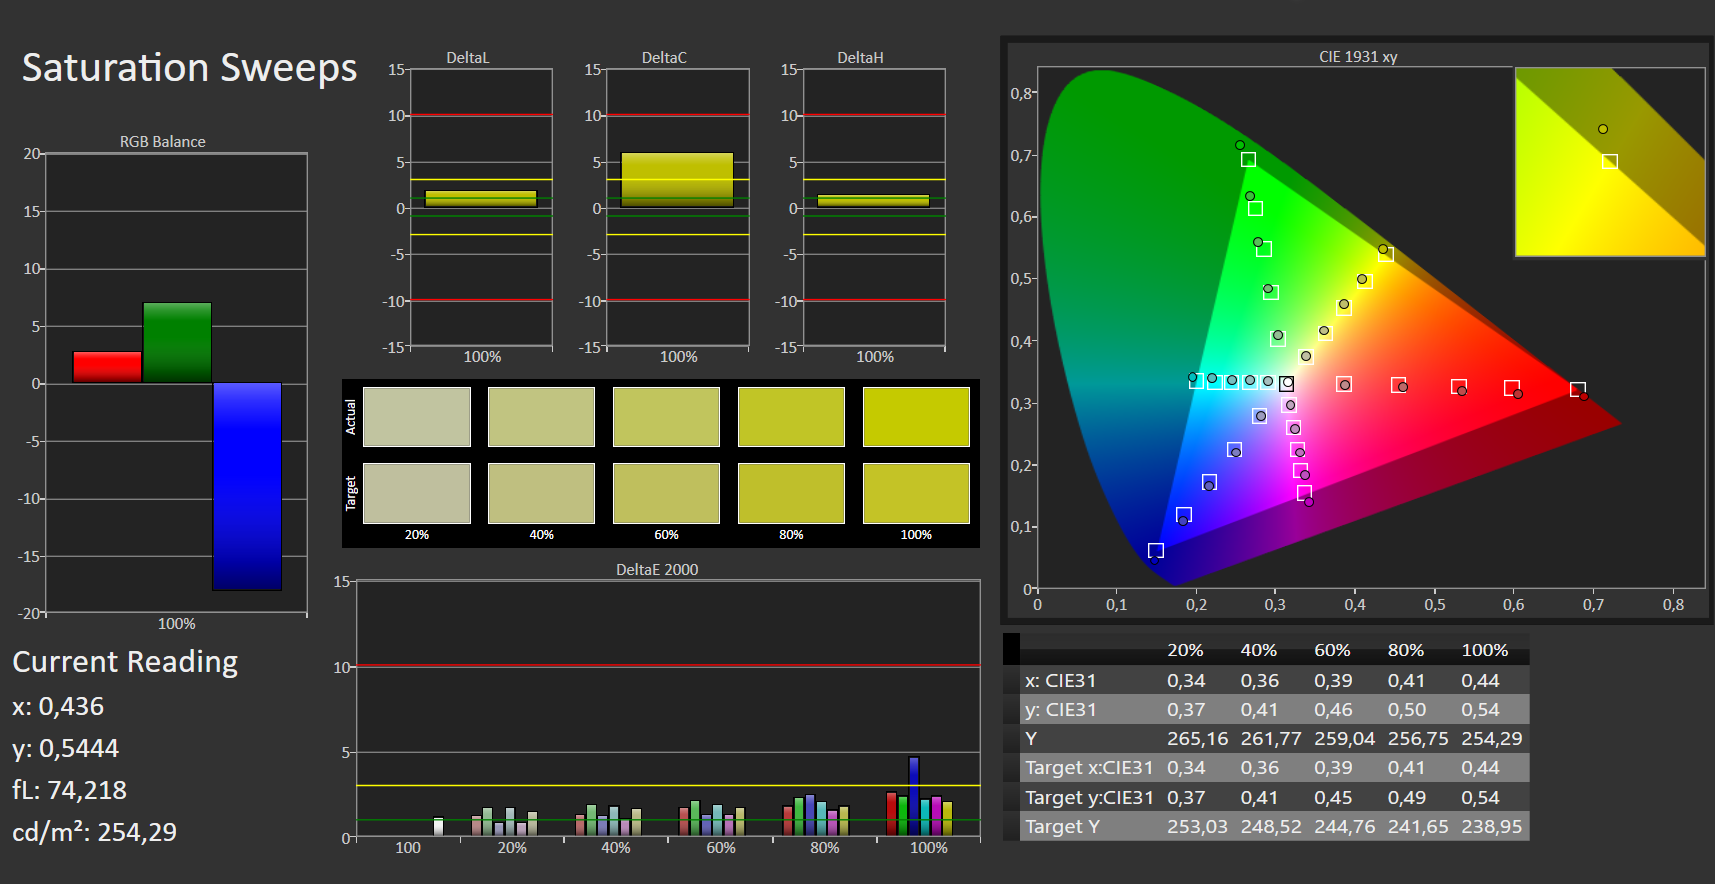
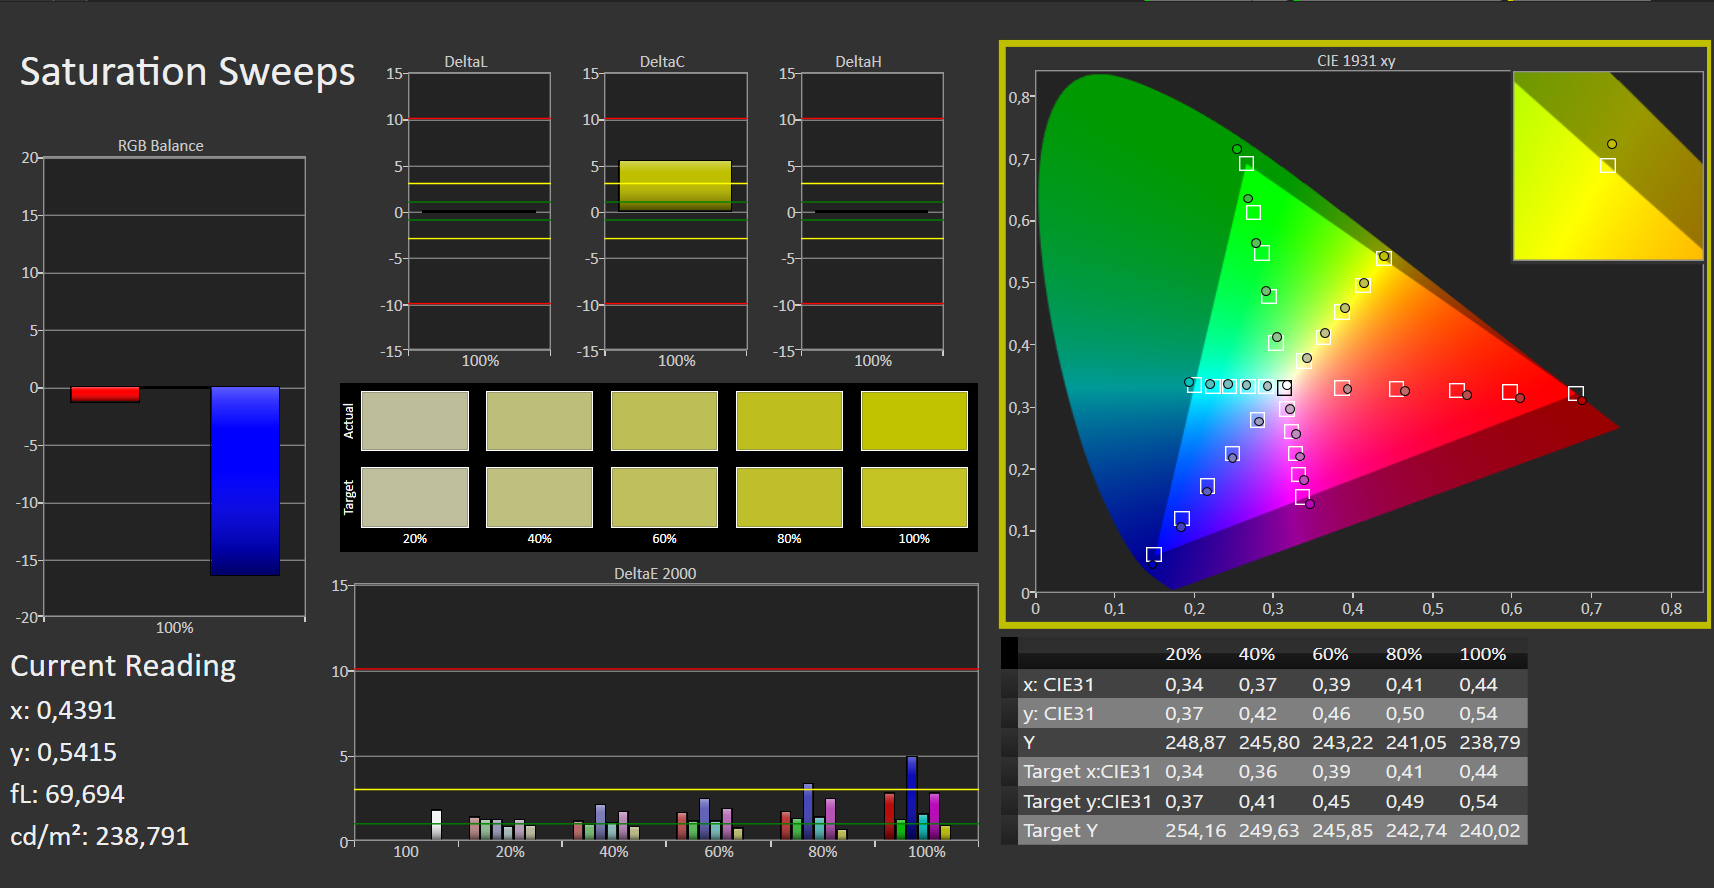
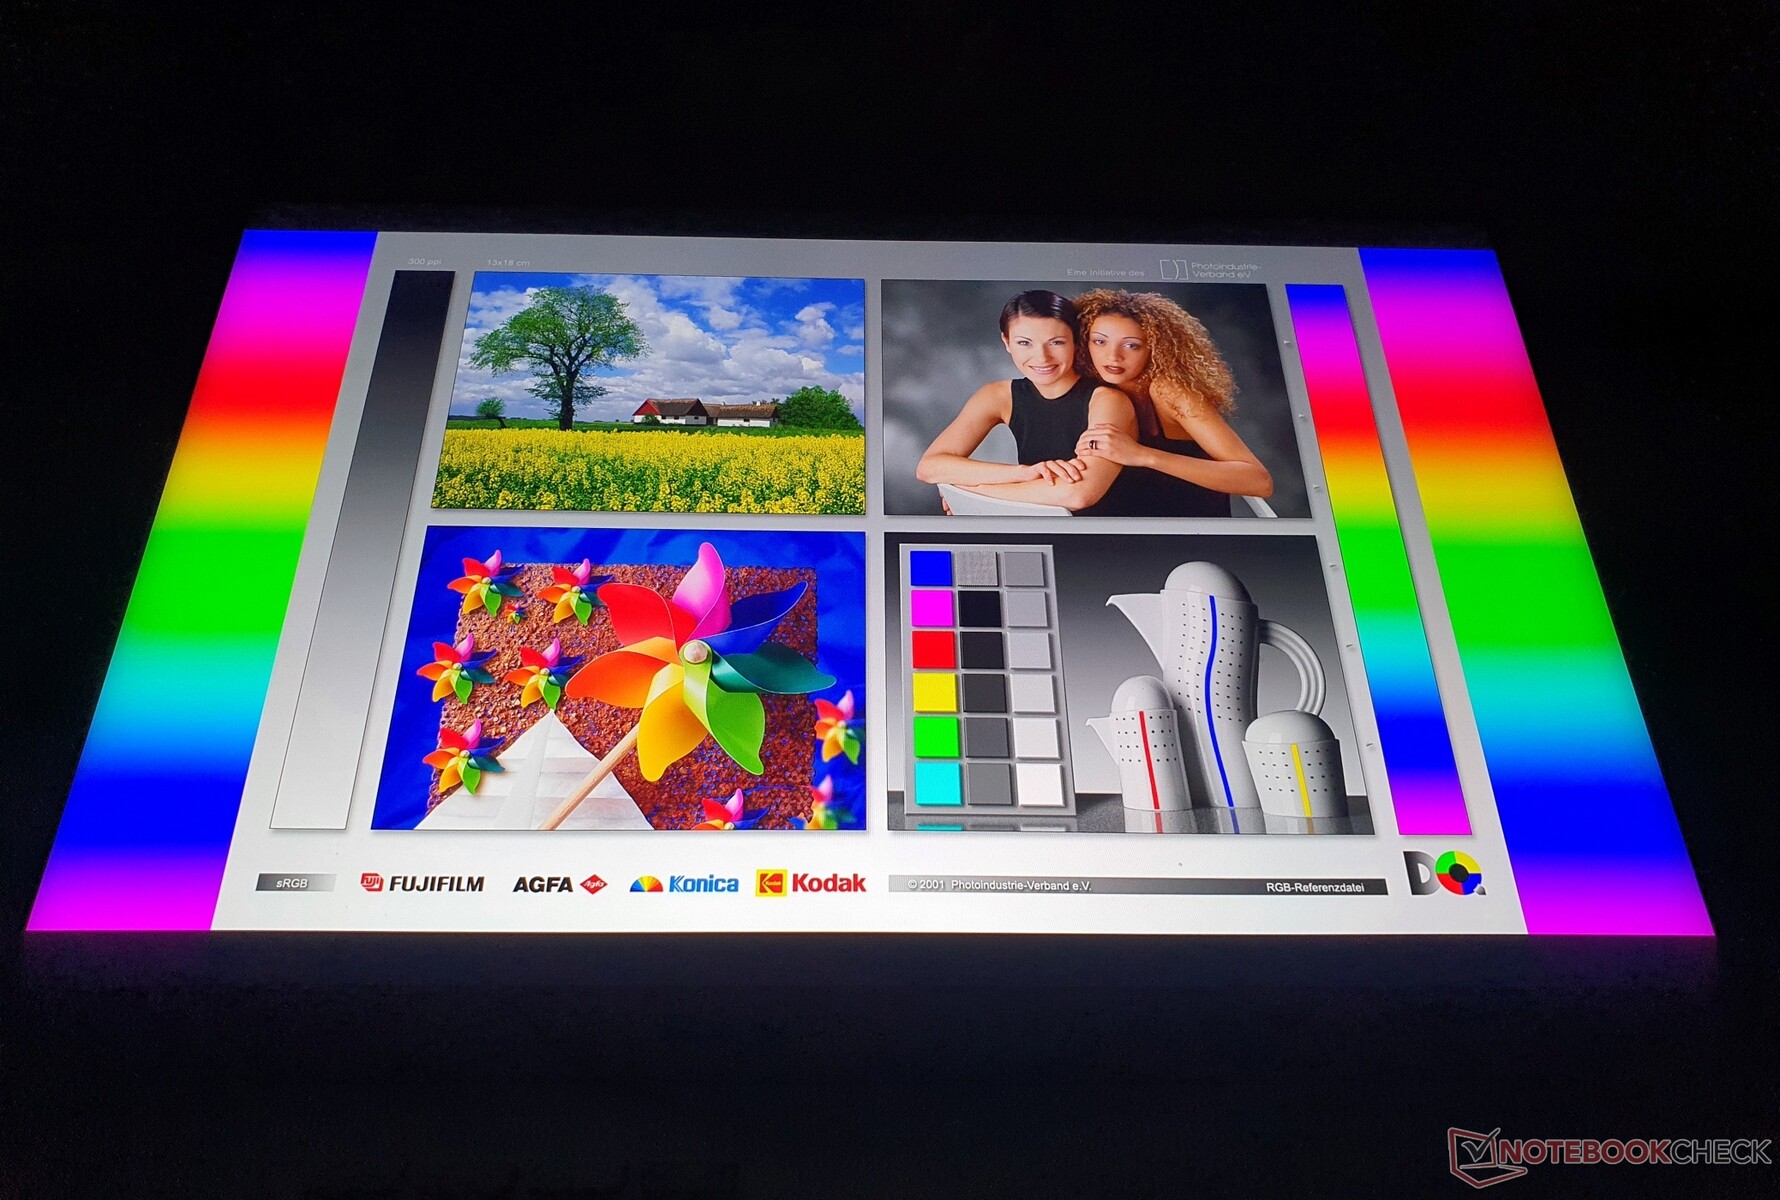
In our test field, the ROG Flow X16 is the only notebook that covers more than 90% of the Adobe RGB color space (90.2%). sRGB and DCI-P3 are covered up to ~100%. Therefore nothing stands in the way of demanding image and video editing.
The DeltaE-2000 values of the factory-calibrated mini-LED display (Pantone certification) are below the threshold of 3 for colors and for grayscale. However, blue deviates with a value of 6.15, which we were unable to improve via calibration. The balance of red, green and blue can be described as perfect. So there is absolutely no color cast.
As always, the calibrated color profile is available for download next to the illumination graphic.
Display Response Times
| ↔ Response Time Black to White | ||
|---|---|---|
| 11 ms ... rise ↗ and fall ↘ combined | ↗ 1 ms rise |  |
| ↘ 10 ms fall | ||
| The screen shows good response rates in our tests, but may be too slow for competitive gamers. In comparison, all tested devices range from 0.1 (minimum) to 240 (maximum) ms. » 28 % of all devices are better. This means that the measured response time is better than the average of all tested devices (20.2 ms). | ||
| ↔ Response Time 50% Grey to 80% Grey | ||
| 11 ms ... rise ↗ and fall ↘ combined | ↗ 1 ms rise |   |
| ↘ 10 ms fall | ||
| The screen shows good response rates in our tests, but may be too slow for competitive gamers. In comparison, all tested devices range from 0.165 (minimum) to 636 (maximum) ms. » 23 % of all devices are better. This means that the measured response time is better than the average of all tested devices (31.6 ms). | ||
Screen Flickering / PWM (Pulse-Width Modulation)
| Screen flickering / PWM detected | 7400 Hz | ≤ 100 % brightness setting |    |
The display backlight flickers at 7400 Hz (worst case, e.g., utilizing PWM) Flickering detected at a brightness setting of 100 % and below. There should be no flickering or PWM above this brightness setting. The frequency of 7400 Hz is quite high, so most users sensitive to PWM should not notice any flickering. In comparison: 53 % of all tested devices do not use PWM to dim the display. If PWM was detected, an average of 8091 (minimum: 5 - maximum: 343500) Hz was measured. | |||
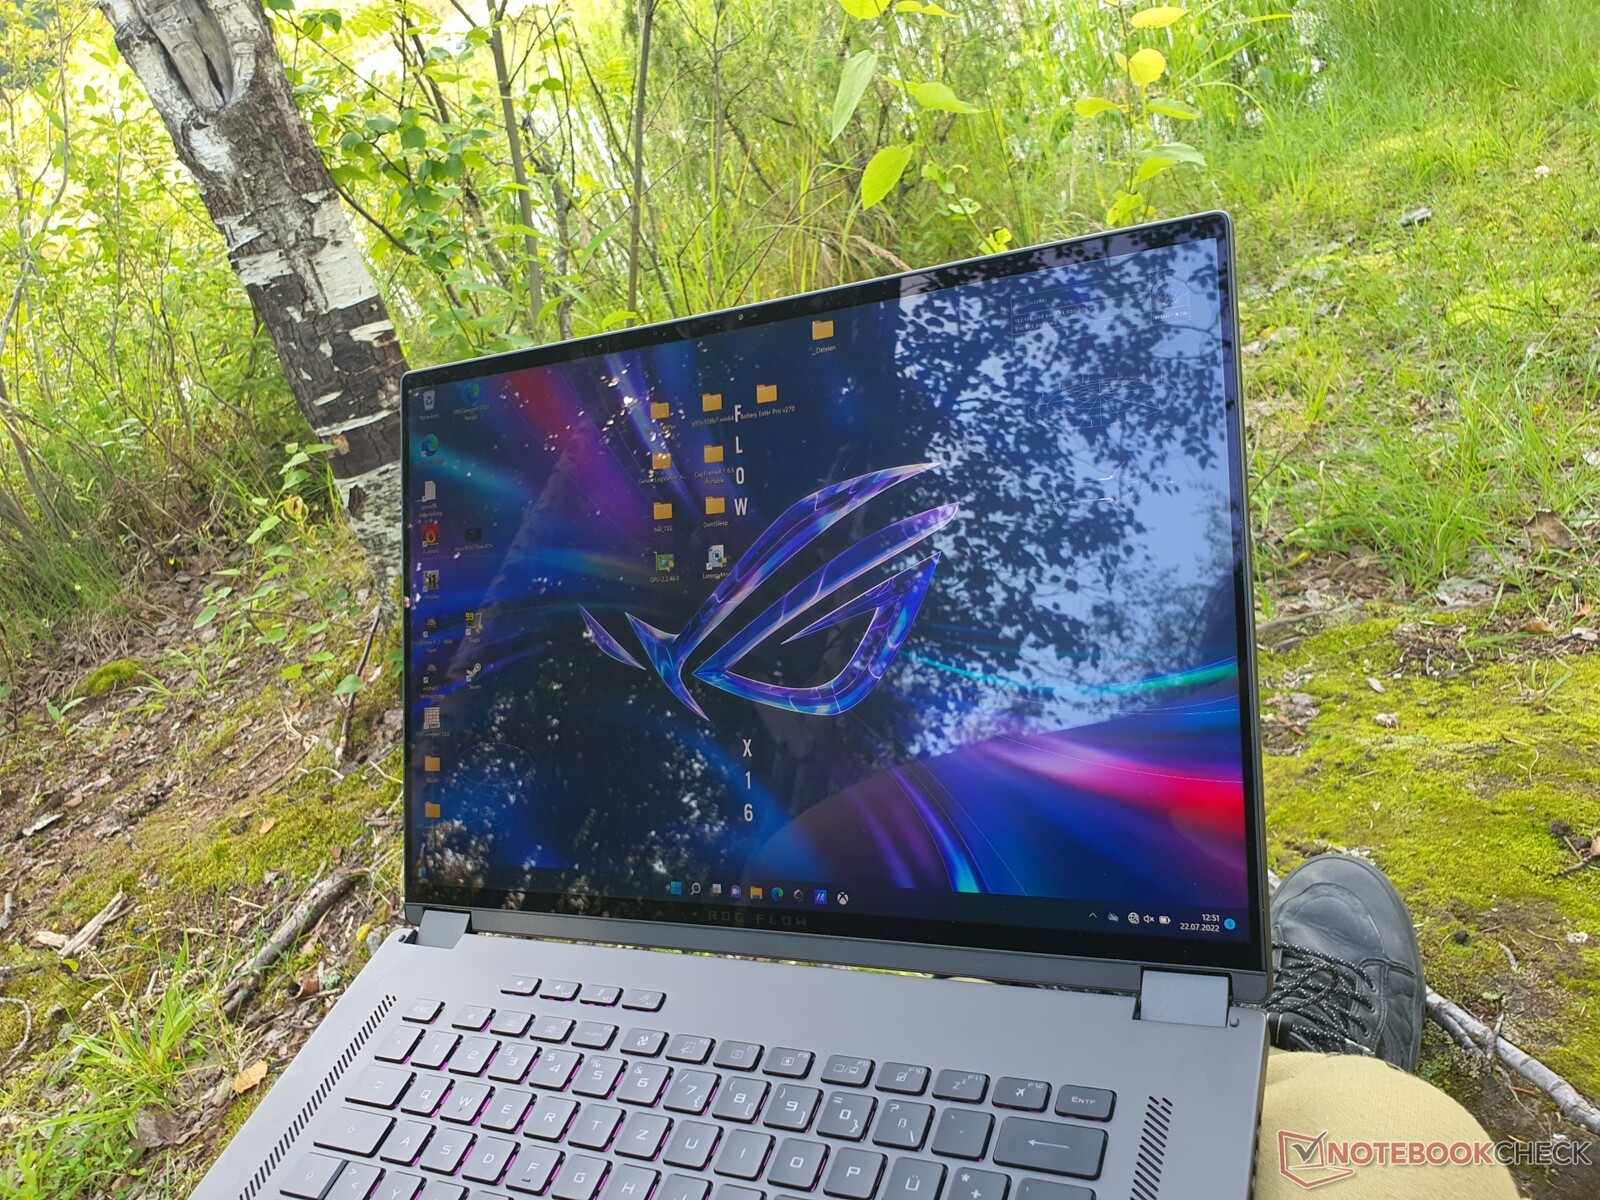
The display reflects very strongly, so that even 500 nits of brightness is necessary for use in (partial) shade. The use of HDR with a maximum brightness of up to 1,100 nits remained deactivated in battery mode for power-saving purposes.
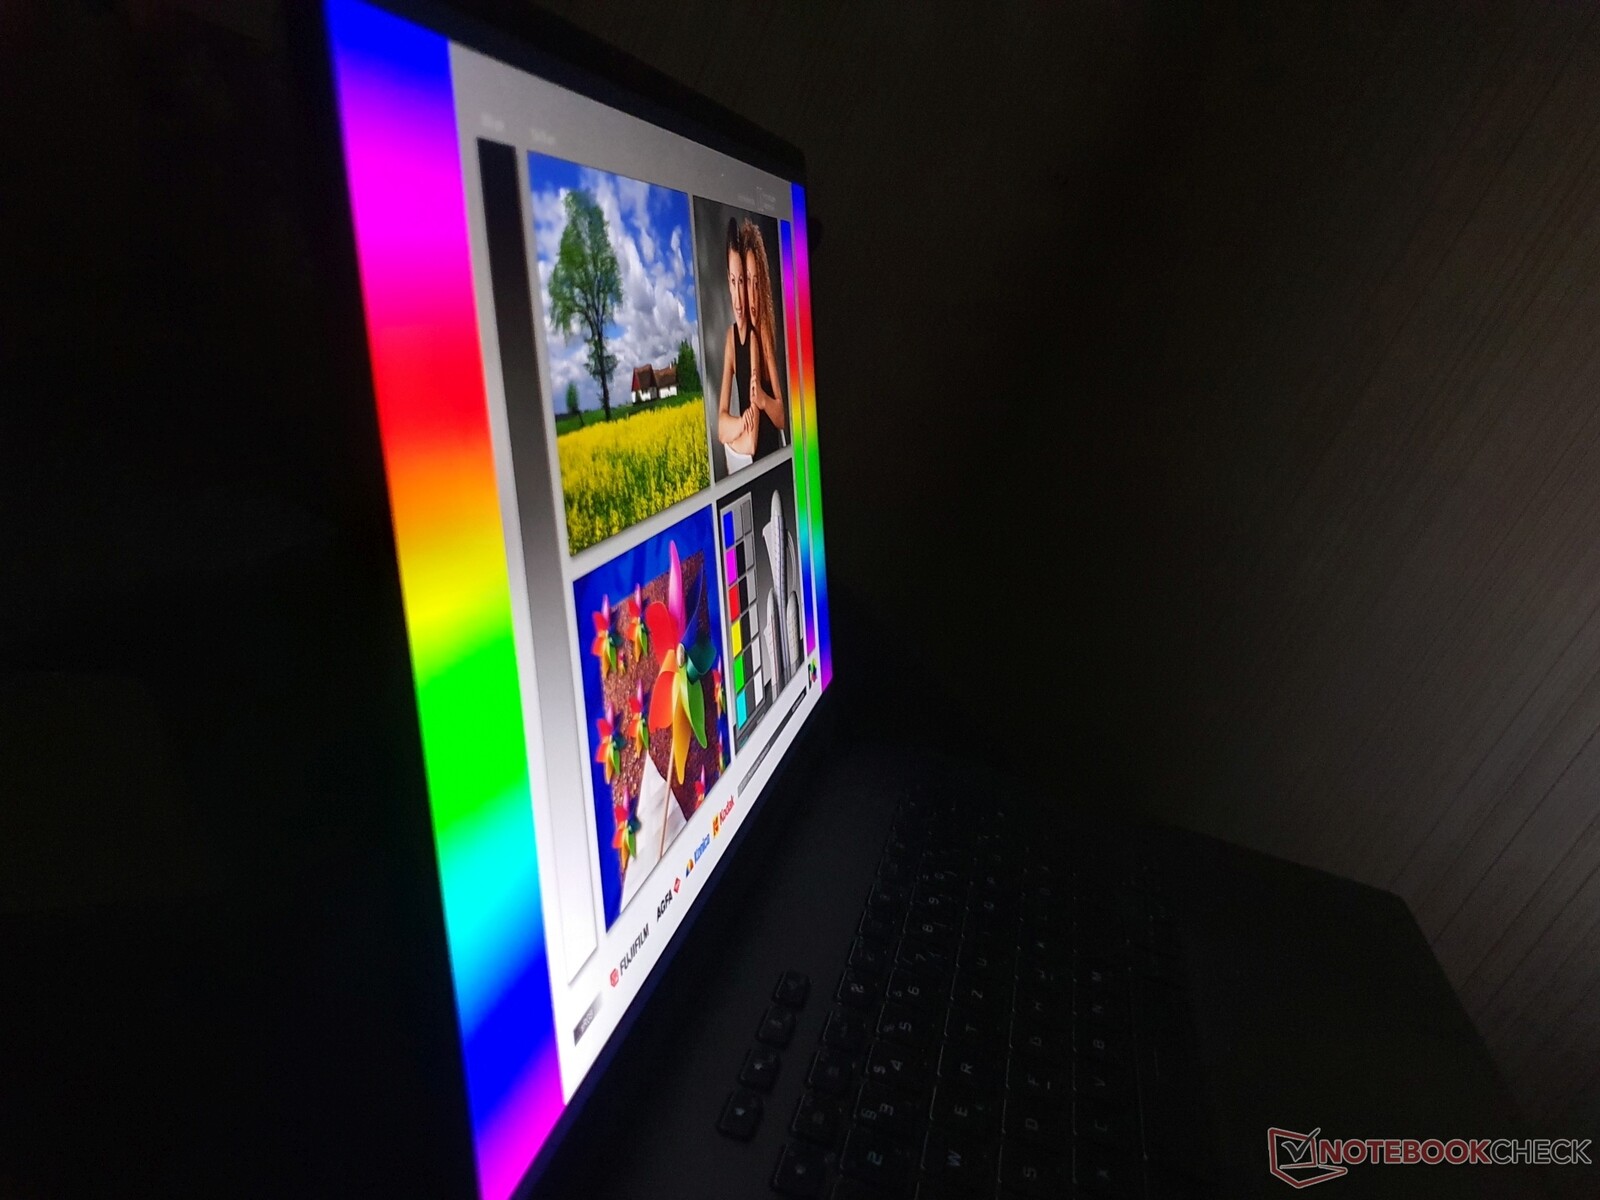
OLED displays still have a slight advantage in viewing angle stability, but as is typical for IPS, the screen of the Asus ROG Flow X16 is on a high level.
Performance - RTX 3070 Ti with 125 W in a compact gaming laptop
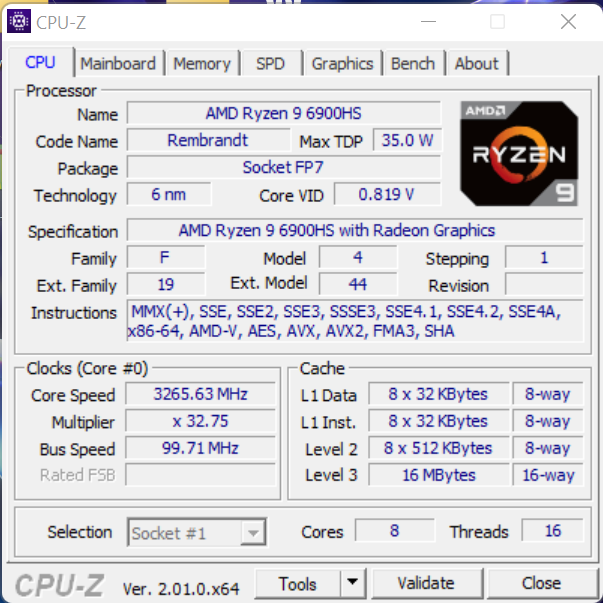
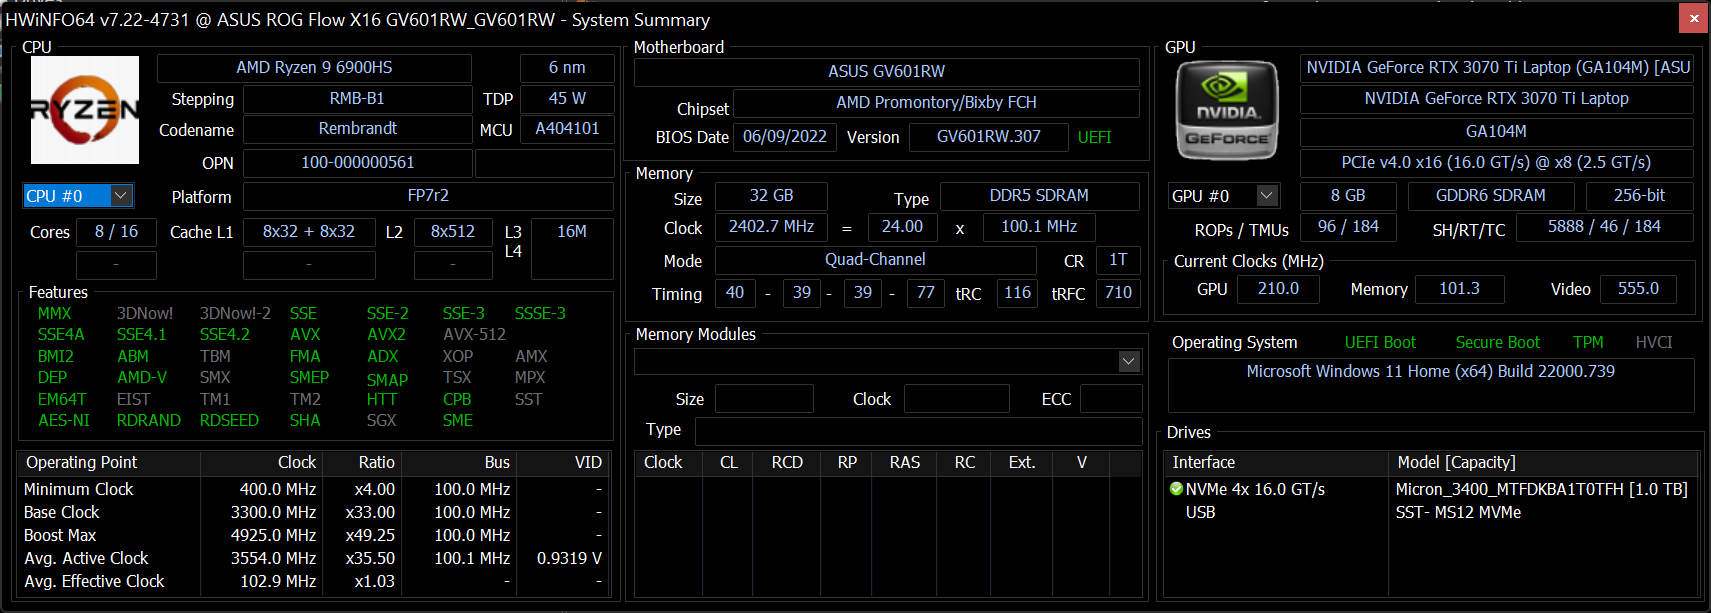
Our configuration is equipped with an AMD Ryzen 9 6900HS octa-core processor and an Nvidia GeForce RTX 3070 Ti with 125 watts of TGP (including Dynamic Boost). A MUX switch has also been integrated.
Cheaper models feature an RTX 3060 or an RTX 3050 Ti. The latter always comes with a Ryzen 7 6800HS (200 MHz lower clock).
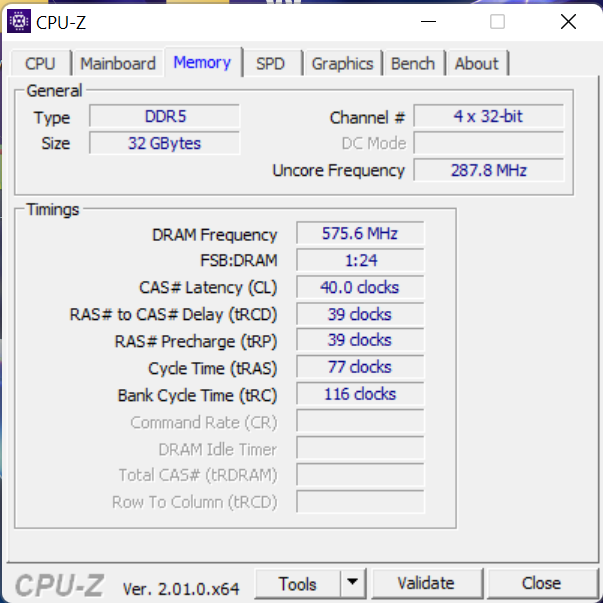
The ROG Flow X16 is shipped with 8 to 32 GB of DDR5-4800 RAM. Our review unit has 32 GB of RAM (2x 16 GB modules in dual-channel mode) and accommodates a 1 TB SSD, which is the minimum capacity offered. A maximum of 2 TB can be ordered and up to two PCIe 4.0 SSDs can be operated.
Testing Conditions
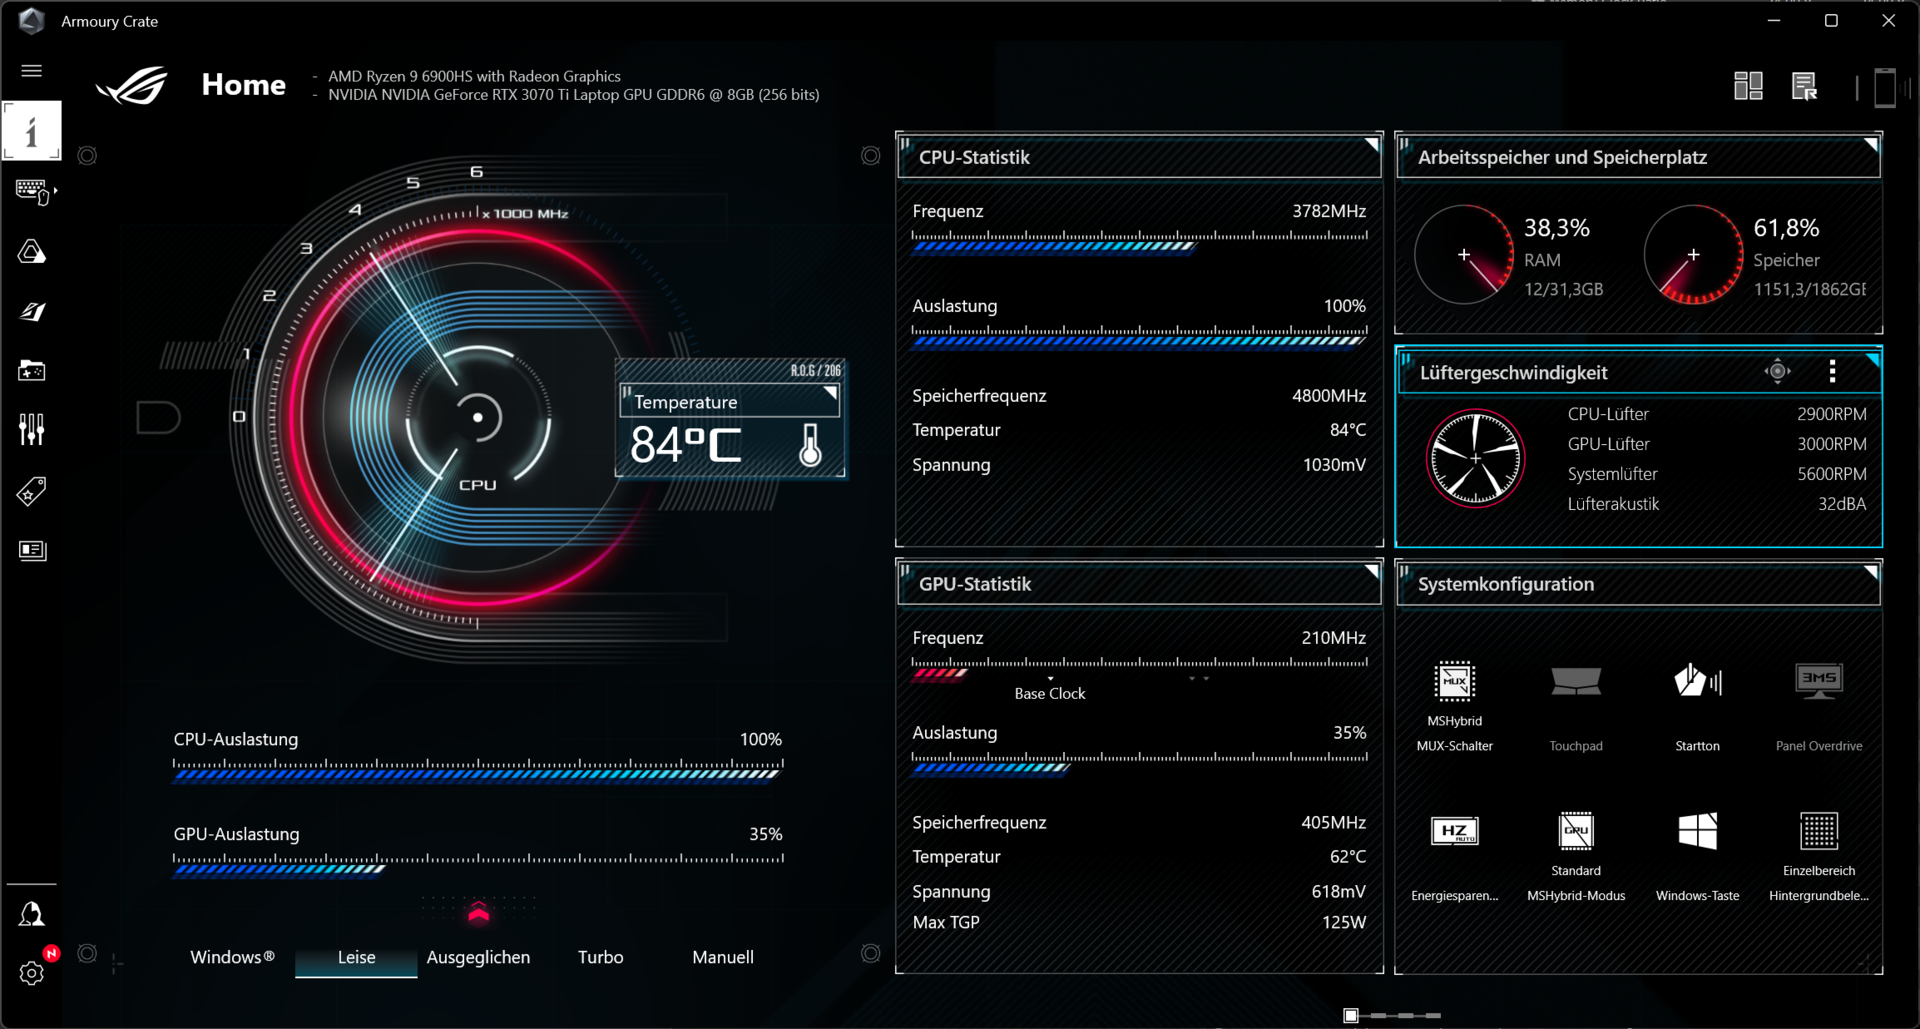
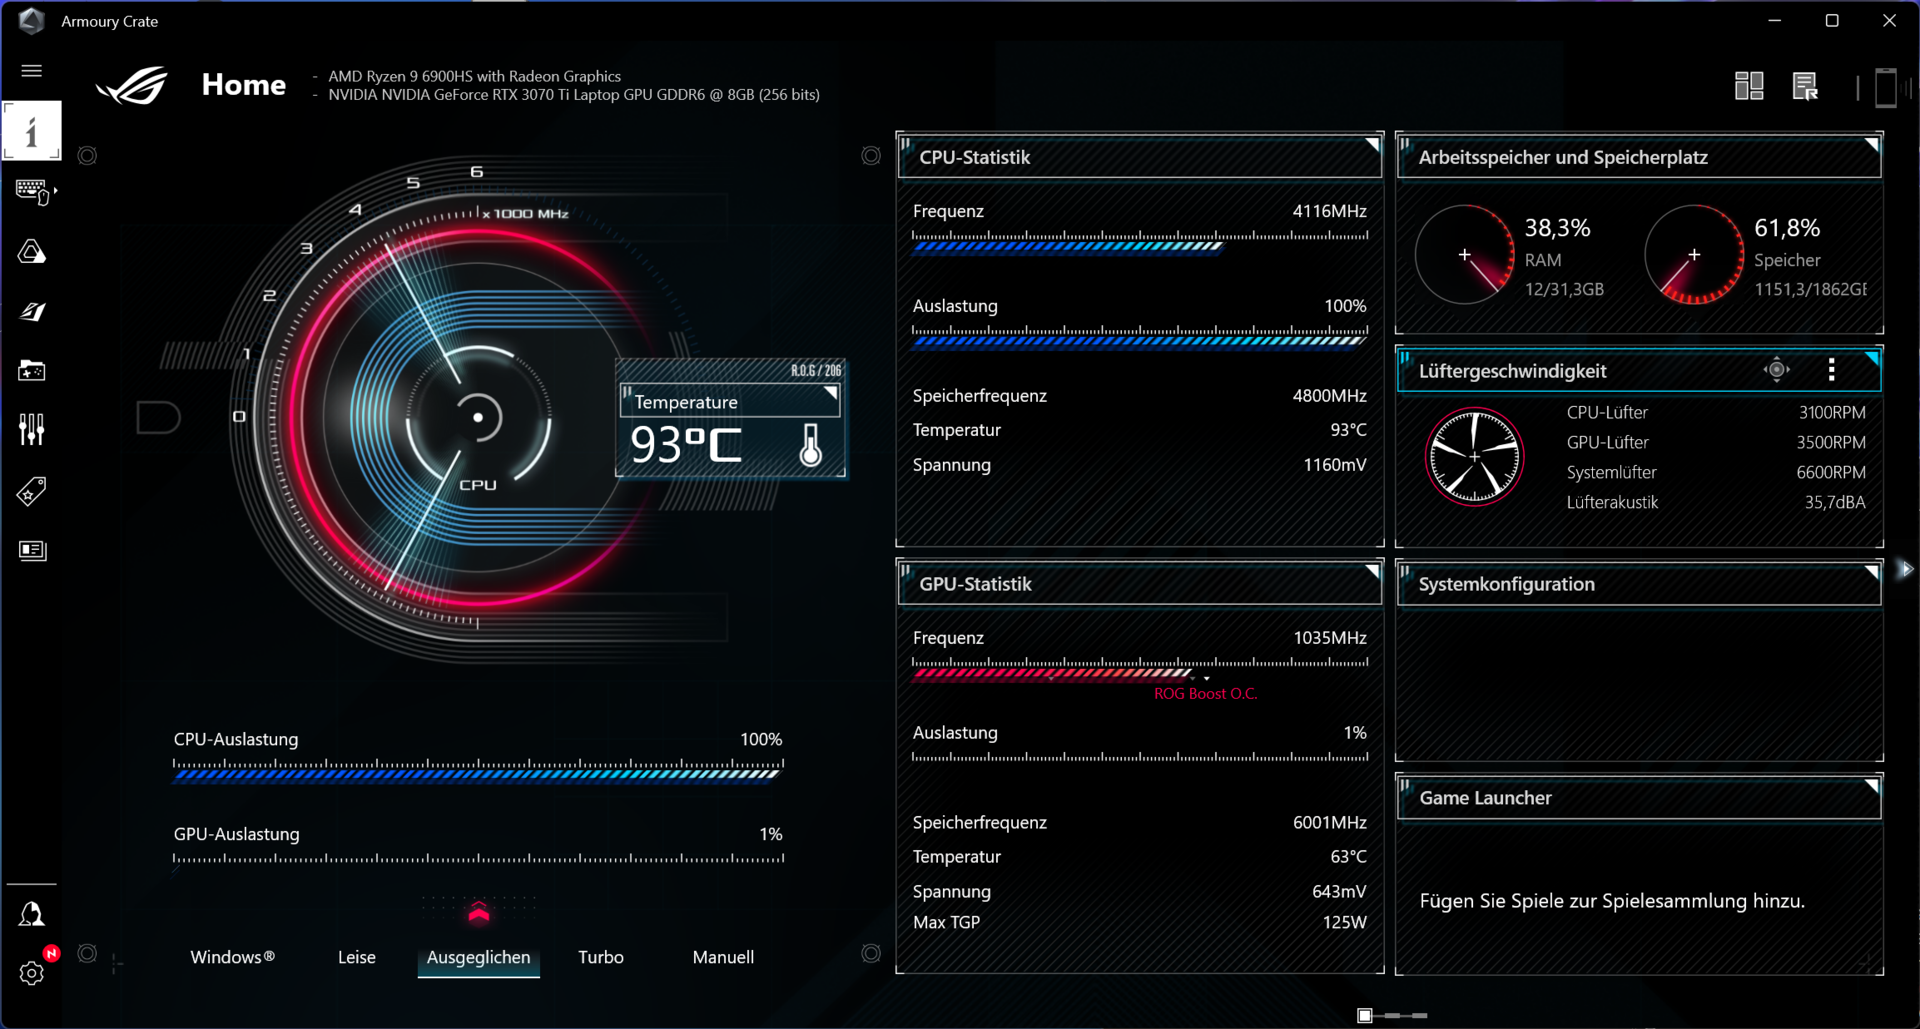
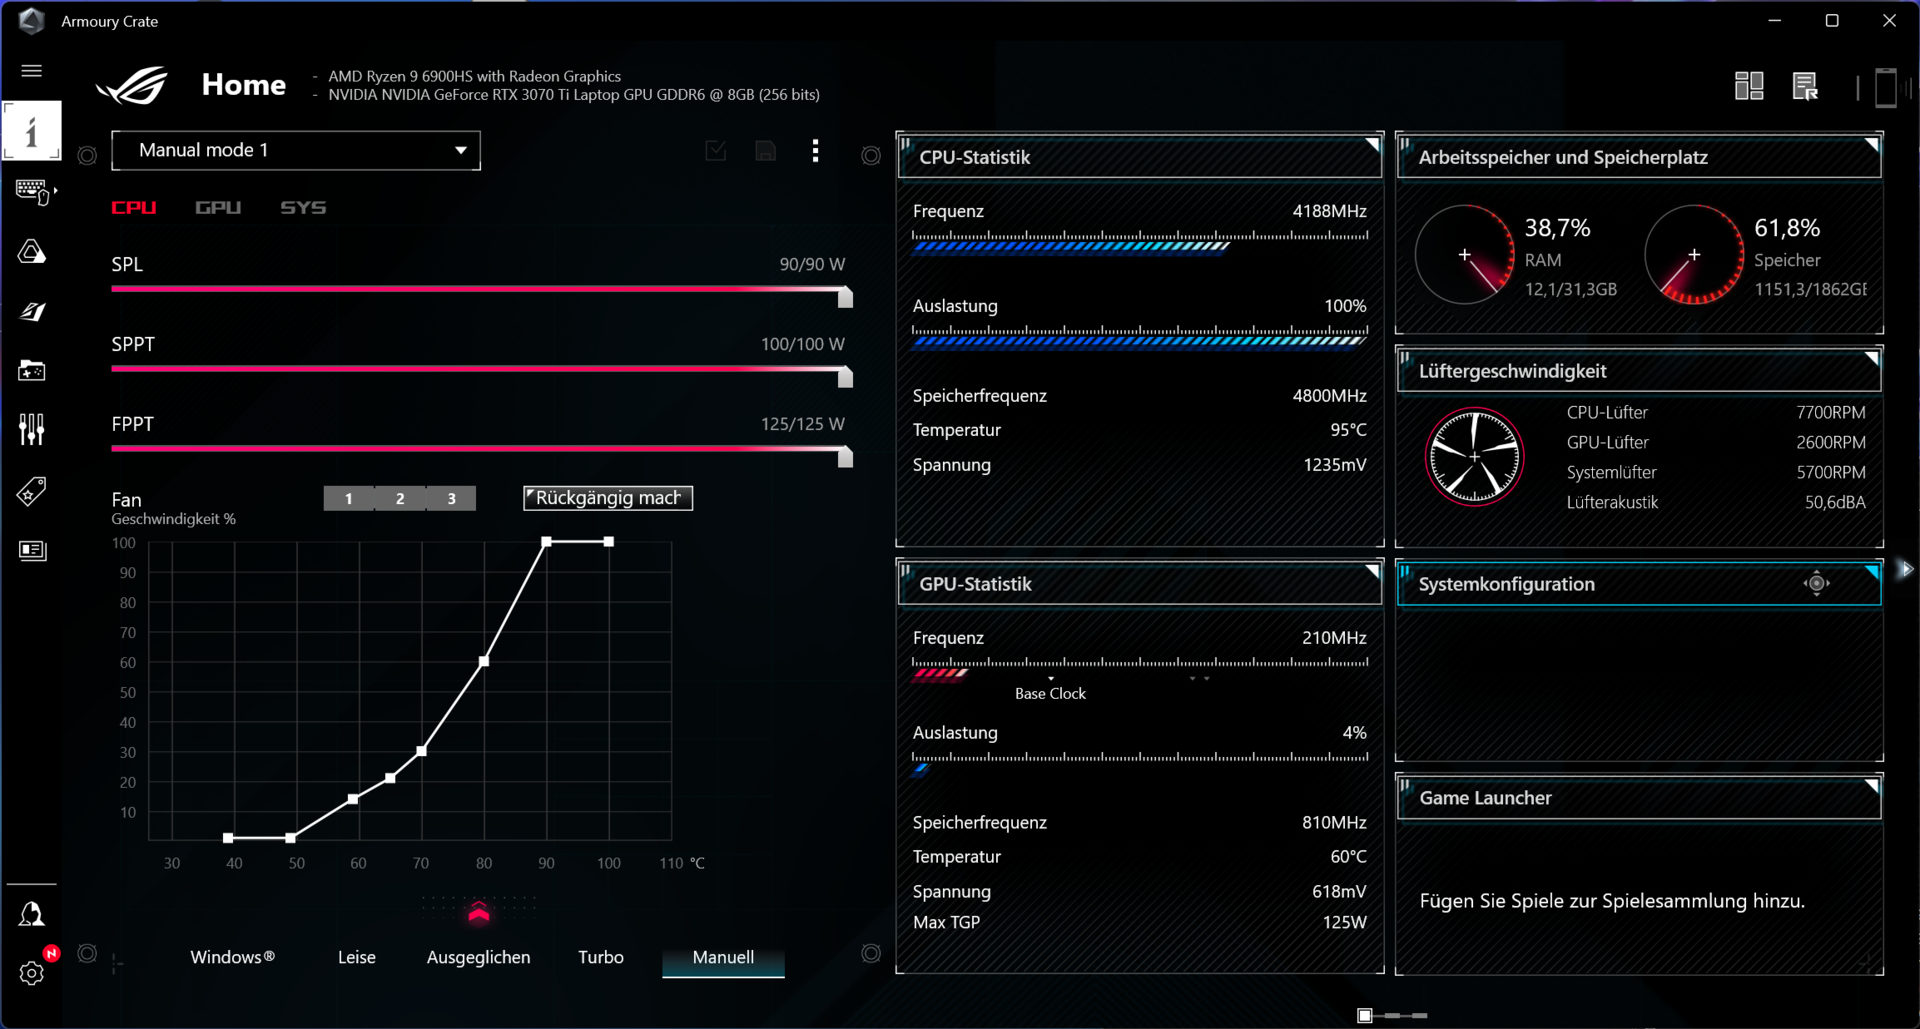
Asus' Armoury Crate software offers four different performance modes: Silent, Balanced ("Performance" since version 5.2.12), Turbo and Manual, of which Manual allows you to set your own fan curves and adjust TDP settings as well as overclock the dGPU.
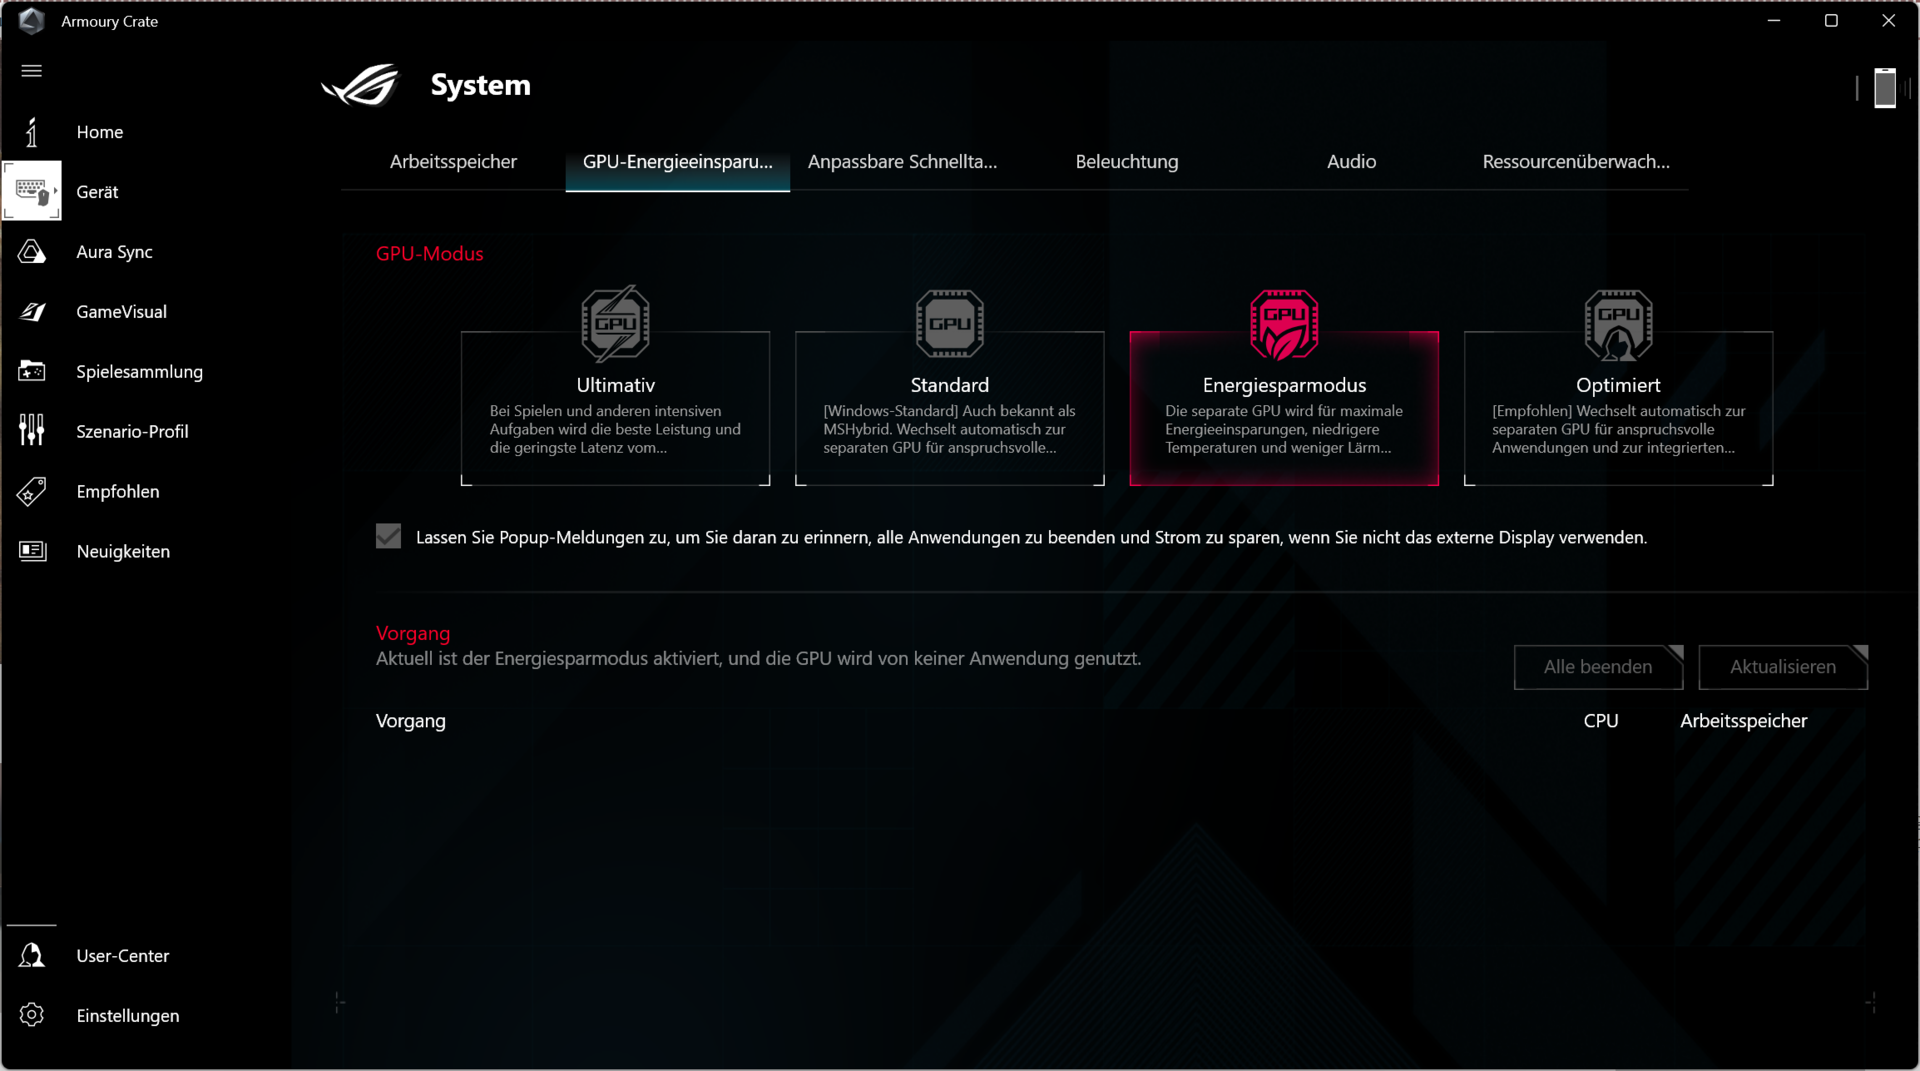
There are also four GPU modes: Ultimate, Standard, Energy Saving and Optimized. "Ultimate" enables the MUX switch, which keeps the RTX 3070 Ti as the active GPU at all times and connects it directly to the internal display instead of detouring through the Radeon iGPU. Activating it requires a reboot (no Advanced Optimus). In Standard mode, you can switch between the integrated and dedicated graphics unit as required (Optimus / "MSHybrid"), while in Energy Saving mode the Nvidia GPU is deactivated (also in mains operation) and the iGPU is used. Optimized mode corresponds to Standard mode, with the difference that the Nvidia GPU is completely deactivated in battery mode.
The effects of the different modes on TDP/TGP, clock rates, temperatures and fan behavior are discussed in the corresponding sections "Processor", "Graphics Card" and "Emissions". We carried out our performance-related benchmarks in Turbo mode and in Standard mode for the GPU. Tests of the other modes are discussed throughout the review. The battery runtimes in WLAN mode were determined in Balanced mode and with the GPU Energy Saving mode enabled.
A lot could be done to improve Amoury Crate, the performance values and the battery runtimes until the release. Our review device runs on version 5.1.8 (Update: In order for Armoury Crate to remain usable, an update to version 5.2.12 had to be installed), BIOS version 307 and GeForce driver 512.78.

Processor
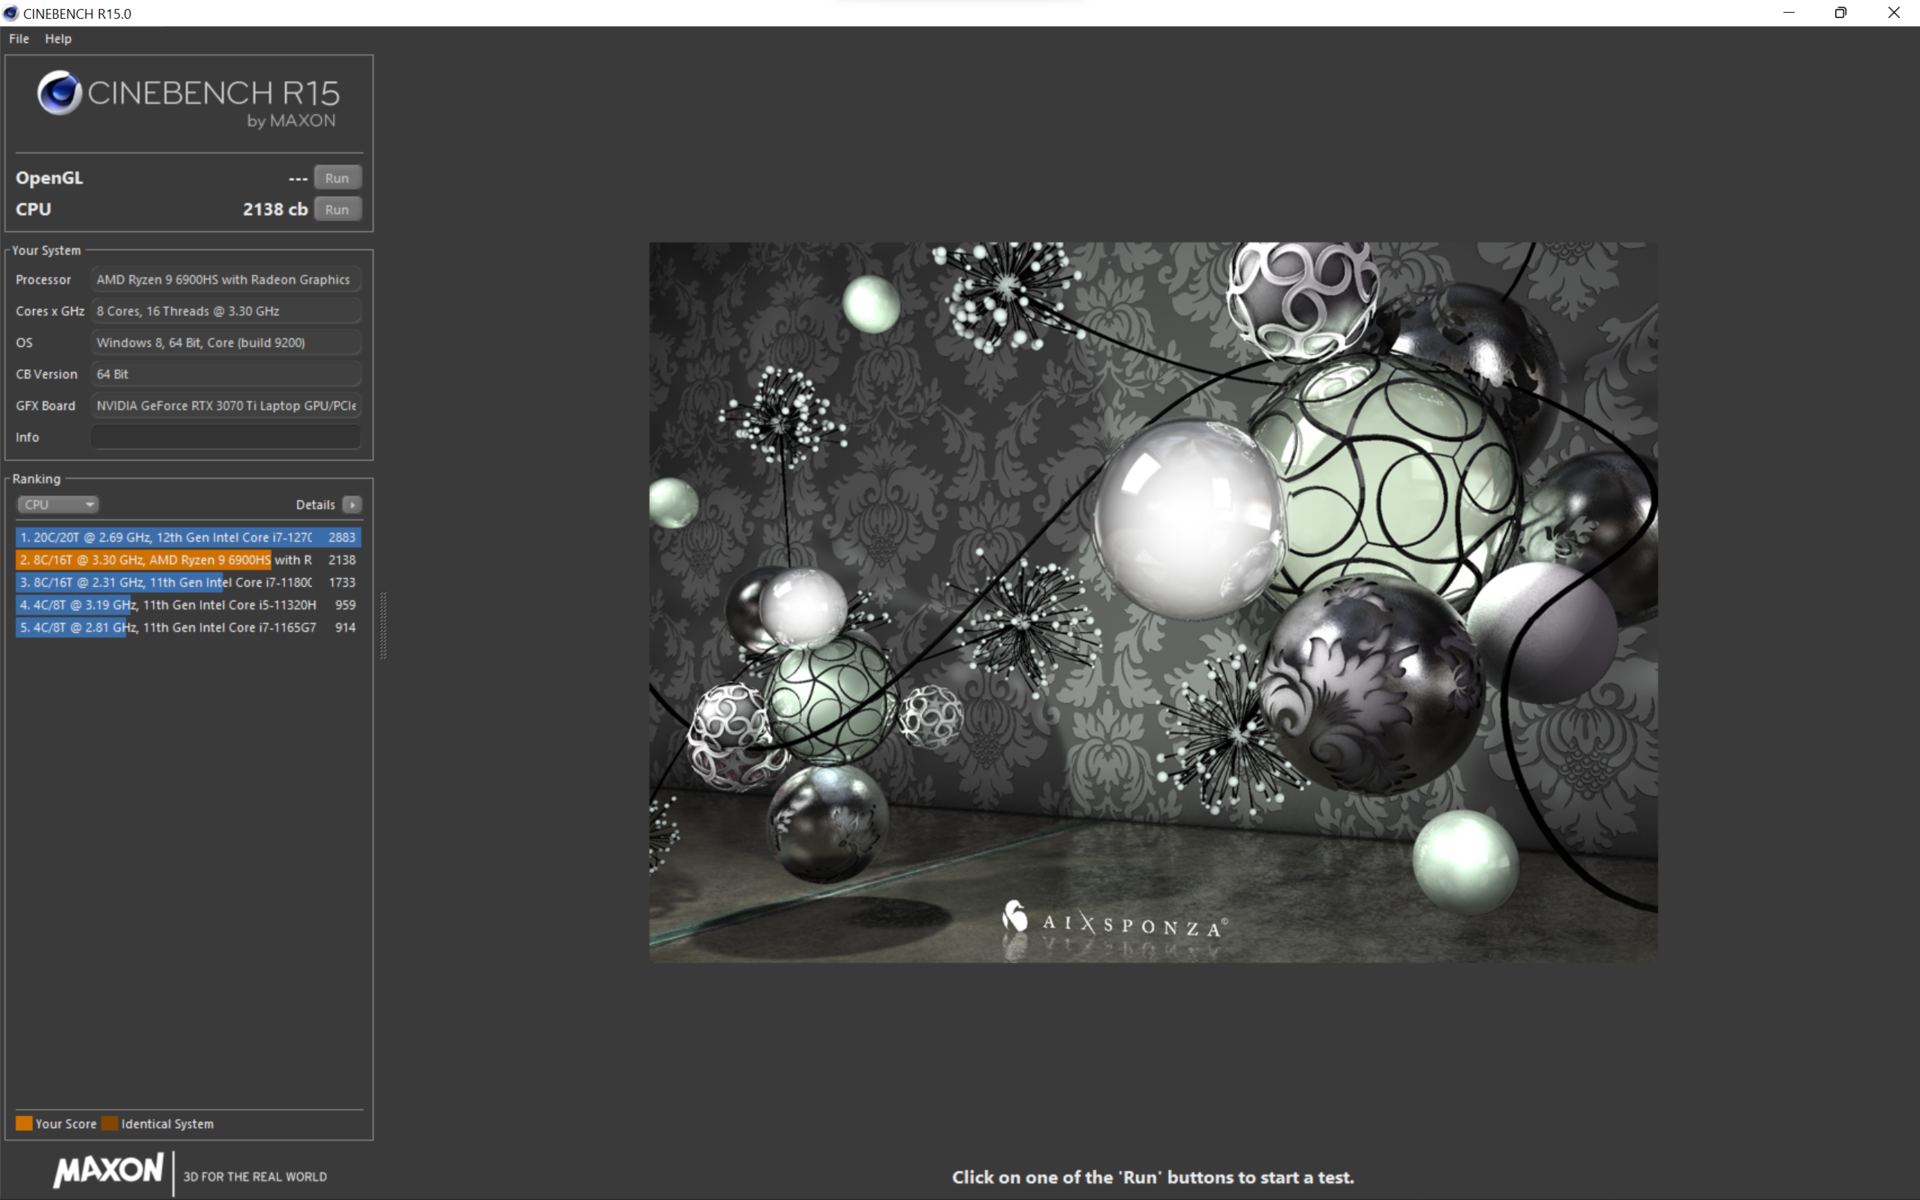
The AMD Ryzen 6900HS is an octa-core CPU with a 8x 3.3 GHz base clock, as well as a Turbo of 4.9 GHz on 1 core and a measured 4.36 GHz on 8 cores. Of these, 4.26 GHz are permanently maintained in Turbo mode while the CPU continuously consumes 74 watts and heats up to 91 °C.
The 35 W CPU is thus very well utilized. The initial consumption is around 90 watts at 4.36 GHz. The short-term power limit "SPPT" (called "PL2" by Intel), set at 100 watts, is thus not reached, nor is the long-term power limit "SPL" (PL1) of 90 watts. AMD still has FPPT (Fast Package Power Tracking) with 125 watts set here.
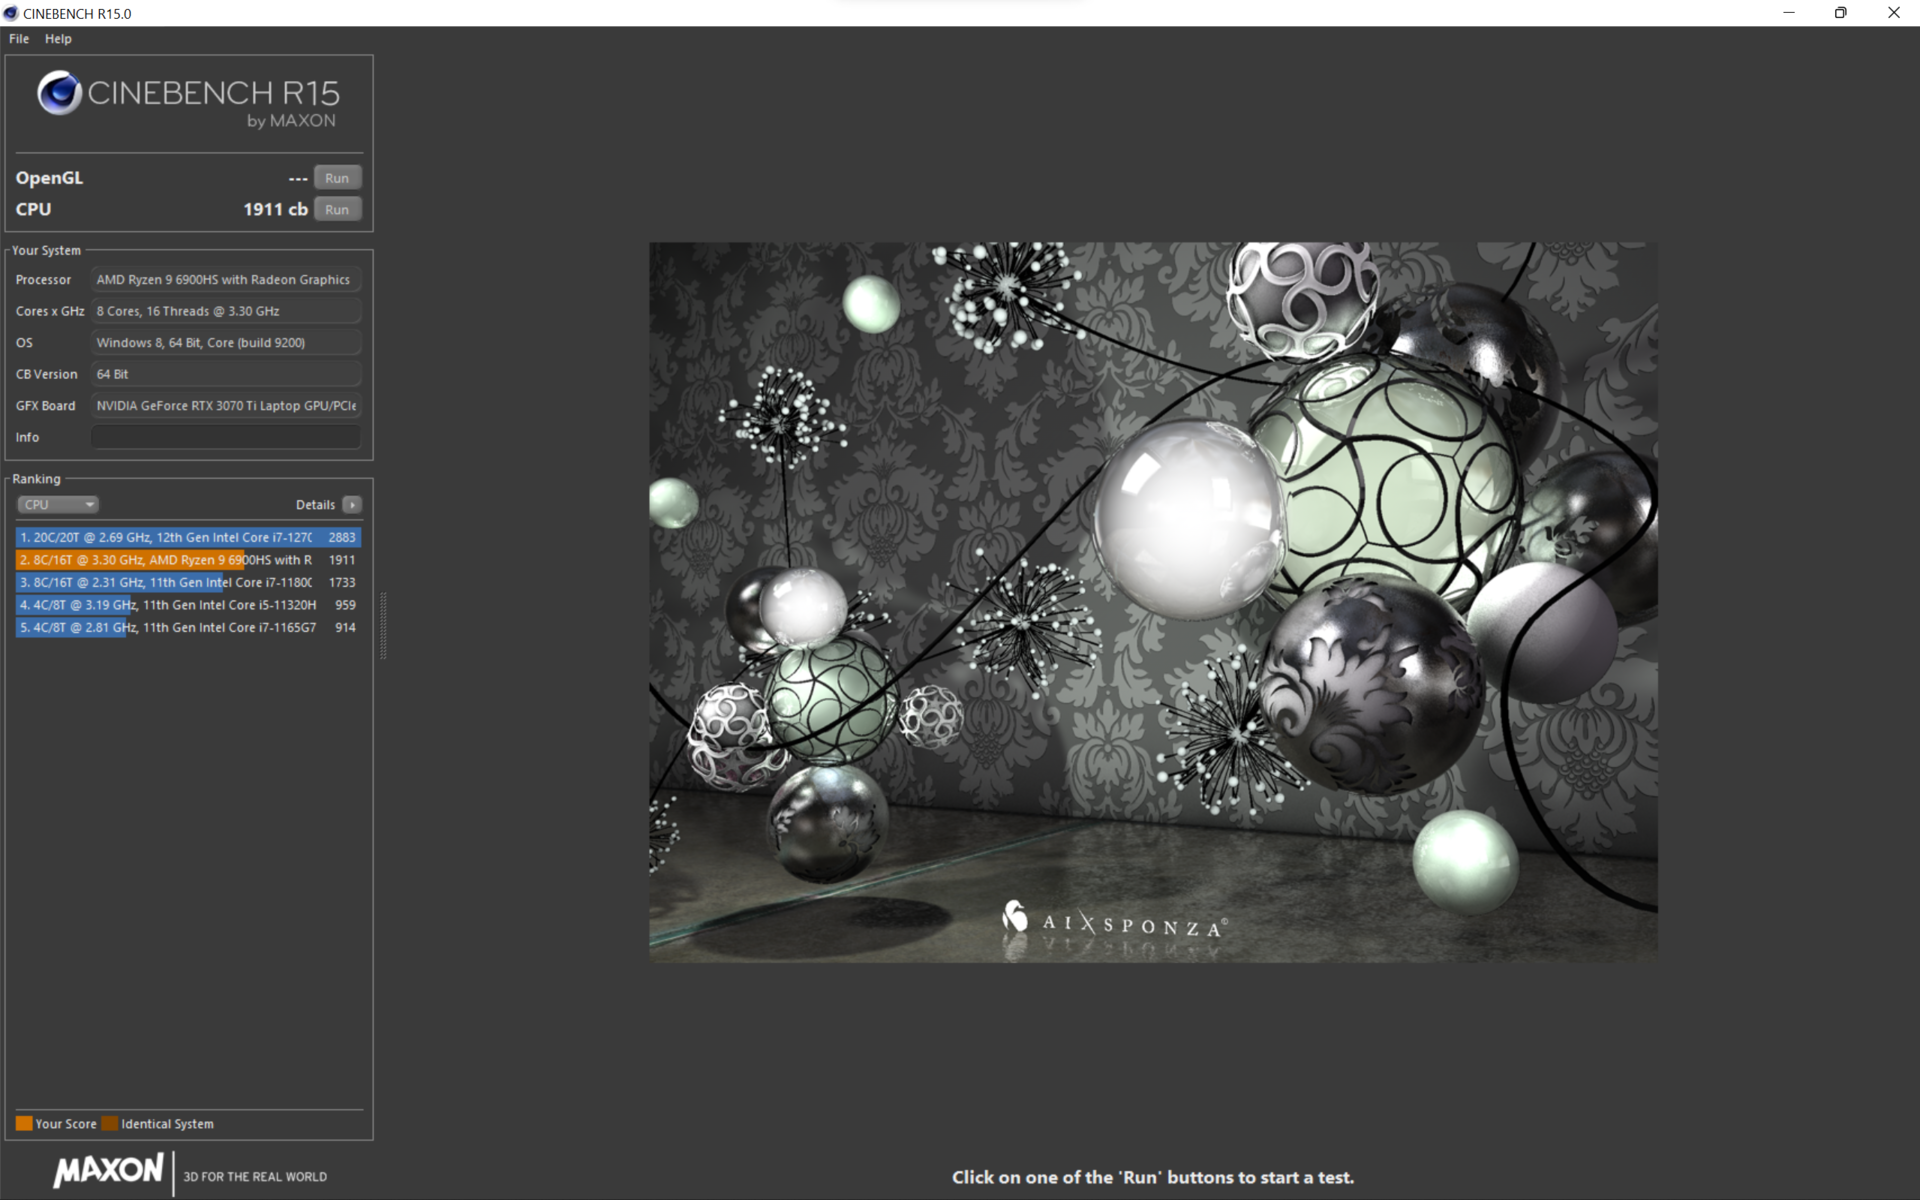
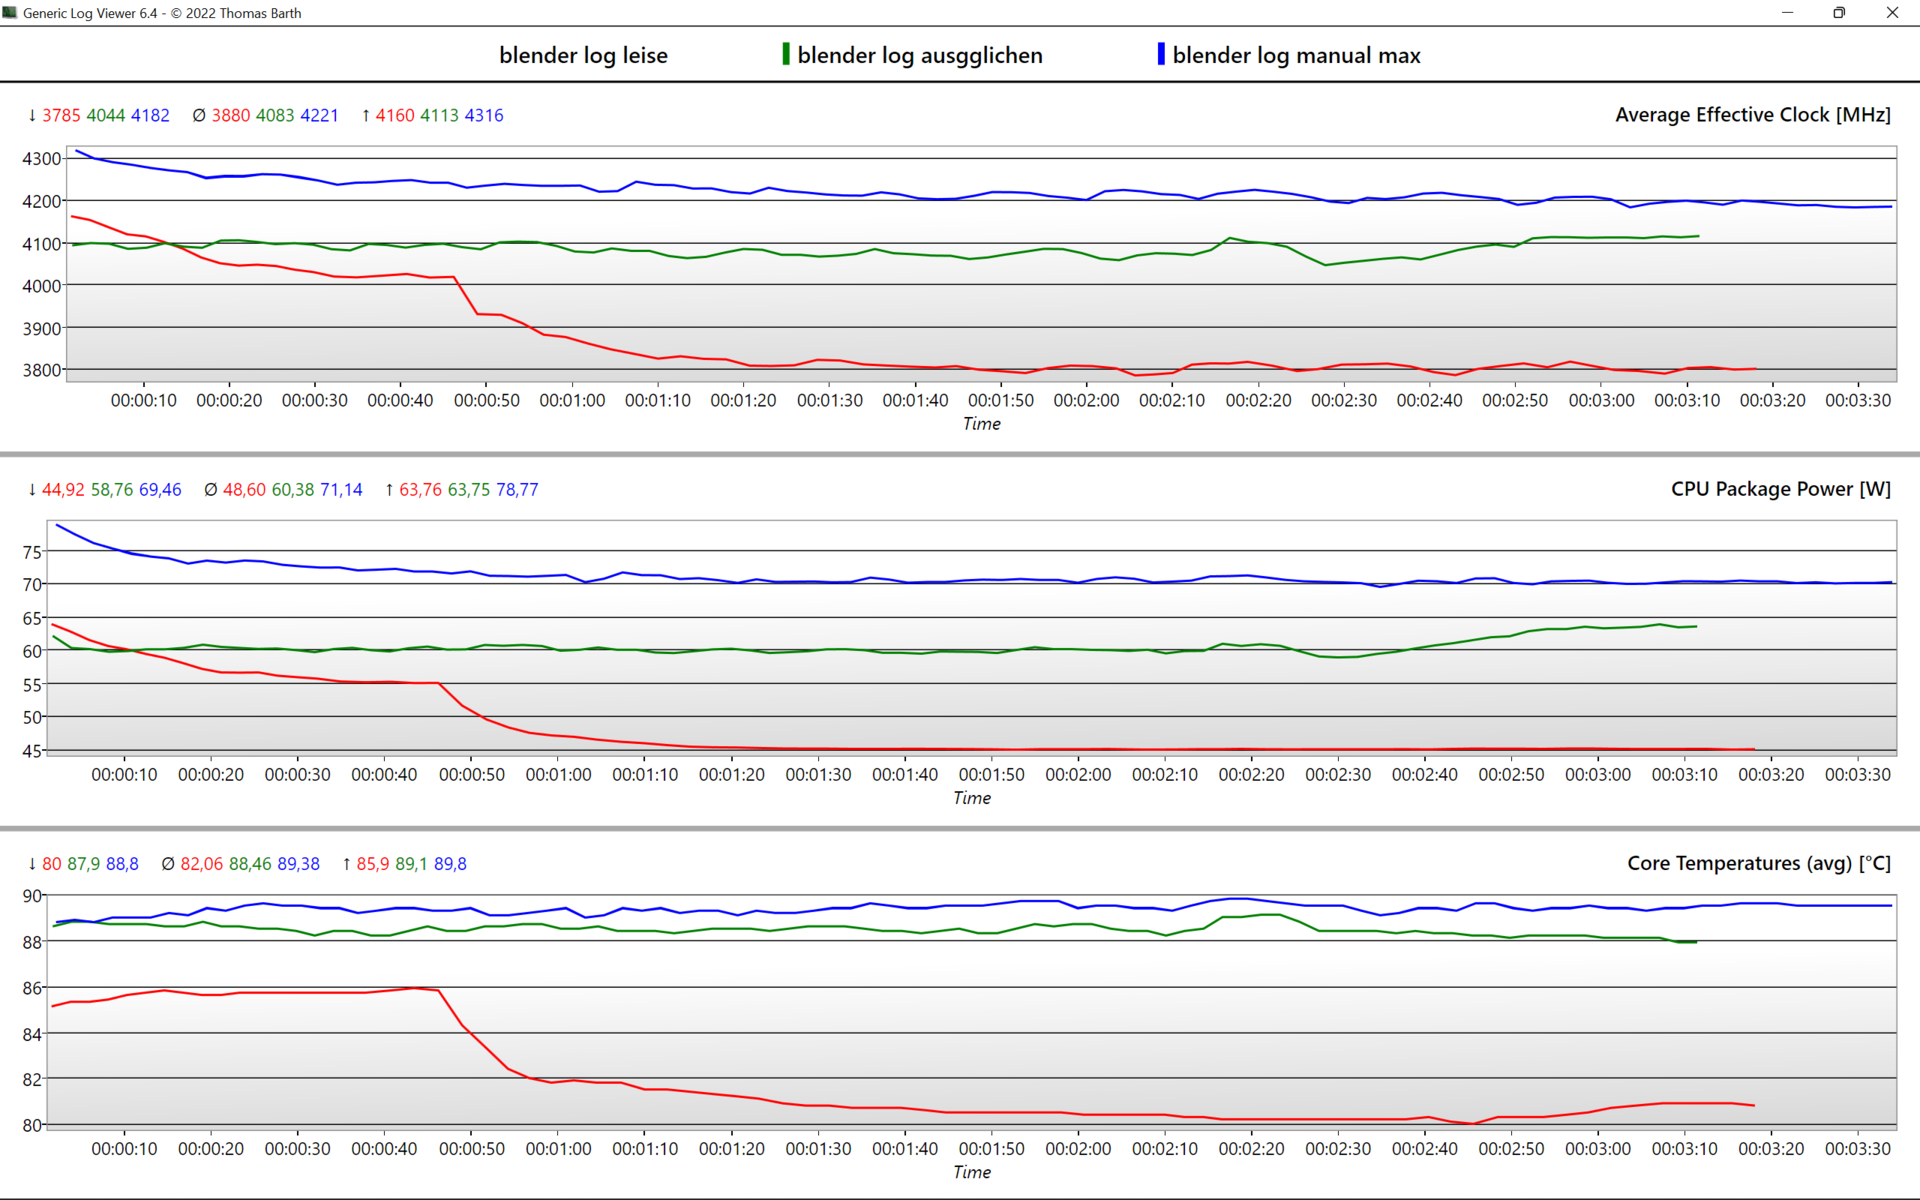
In Balanced mode, the CPU clock drops slightly to 4.1 GHz, which reduces the performance by only 3%, but improves fan noise noticeably: 35.7 db(A) versus 45.1 db(A). The power limit is lowered by 10 watts to 65 watts and the CPU stays around 2 °C cooler.
In Silent mode, the clock drops to 8x 3.8 GHz after 50 seconds and power consumption falls from an initial 65 to 45 watts. The fans then become very pleasant at 32 db(A) and the CPU temperature is significantly cooler at 80 °C. Long-term performance is around 15 percent lower.
In battery mode, there is no boost at all and all power limits are restricted to 35 watts, which leads to a performance reduction of around 20%. Intel counterparts often see a much more significant drop in performance in battery mode, especially with a 35 watt limit (50% and more). The fans are even quieter under load.
In CBR15, the Ryzen 9 is thus able to beat Alder Lake rivals, such as the larger Dell XPS 17. The thinly built Stealth GS66 and Aero 16 are 20% faster, since Alder Lake benefits strongly from high power consumption. Thicker gaming laptops like the Scar 15 or the Legion 5 Pro are even faster.
In the overall rating, our test device falls in the midfield. The Apple M1 Pro is 36% faster in Geekbench 5.4.


| Power Mode | CPU Clock (GHz) | CPU Temperature (°C) | CPU Power Consumption (W) | Loudness in db(A) @Blender |
|---|---|---|---|---|
| Manual (Max) | 4,2 | 89 | 70 | 50,6 |
| Turbo | 4,26 | 91 | 75 | 45,1 |
| Balanced / Performance | 4,1 | 89 | 60 | 36 |
| Silent | 3,8 | 80 | 45 | 32 |
| Battery | 3.5 | 72 | 35 | 26,7 - 30,7 |
Cinebench R15 Multi Sustained Load
Cinebench R23: Multi Core | Single Core
Cinebench R20: CPU (Multi Core) | CPU (Single Core)
Cinebench R15: CPU Multi 64Bit | CPU Single 64Bit
Blender: v2.79 BMW27 CPU | v3.3 Classroom CPU | v3.3 Classroom CUDA
7-Zip 18.03: 7z b 4 | 7z b 4 -mmt1
Geekbench 5.5: Multi-Core | Single-Core | OpenCL Score
HWBOT x265 Benchmark v2.2: 4k Preset
LibreOffice : 20 Documents To PDF
R Benchmark 2.5: Overall mean
V-Ray 5 Benchmark: CPU | GPU CUDA | GPU RTX
V-Ray Benchmark Next 4.10: CPU | GPU
Mozilla Kraken 1.1: Total
WebXPRT 3: Overall
WebXPRT 4: Overall
Octane V2: Total Score
Jetstream 2: 2.0 Total Score
Sunspider: 1.0 Total Score
Speedometer 2.0: Result 2.0
| CPU Performance rating | |
| Average of class Gaming -1! | |
| Lenovo Legion 5 Pro 16 G7 i7 RTX 3070Ti -7! | |
| Asus ROG Strix Scar 15 G533ZW-LN106WS -11! | |
| MSI Stealth GS66 12UGS -10! | |
| Gigabyte Aero 16 YE5 -3! | |
| Dell XPS 17 9720 RTX 3060 -10! | |
| Asus ROG Zephyrus M16 GU603H -12! | |
| Lenovo ThinkPad X1 Extreme G4-20Y50040GE -9! | |
| Asus ROG Flow X16 GV601RW-M5082W | |
| Apple MacBook Pro 16 2021 M1 Pro -11! | |
| Asus ROG Flow X13 GV301QH -5! | |
| Average AMD Ryzen 9 6900HS | |
| Microsoft Surface Laptop Studio i7 RTX 3050 Ti -7! | |
| Blender / v3.3 Classroom CPU | |
| Average AMD Ryzen 9 6900HS (378 - 469, n=3) | |
| Asus ROG Flow X16 GV601RW-M5082W | |
| Average of class Gaming (122 - 962, n=142, last 2 years) | |
| Blender / v3.3 Classroom CUDA | |
| Average AMD Ryzen 9 6900HS (42 - 116, n=2) | |
| Asus ROG Flow X16 GV601RW-M5082W | |
| Average of class Gaming (15 - 228, n=145, last 2 years) | |
| 7-Zip 18.03 / 7z b 4 -mmt1 | |
| Average of class Gaming (4199 - 7508, n=145, last 2 years) | |
| Gigabyte Aero 16 YE5 | |
| Asus ROG Strix Scar 15 G533ZW-LN106WS | |
| Lenovo Legion 5 Pro 16 G7 i7 RTX 3070Ti | |
| MSI Stealth GS66 12UGS | |
| Average AMD Ryzen 9 6900HS (5538 - 5958, n=5) | |
| Asus ROG Flow X16 GV601RW-M5082W | |
| Dell XPS 17 9720 RTX 3060 | |
| Asus ROG Flow X13 GV301QH | |
| Asus ROG Zephyrus M16 GU603H | |
| Microsoft Surface Laptop Studio i7 RTX 3050 Ti | |
| HWBOT x265 Benchmark v2.2 / 4k Preset | |
| Average of class Gaming (7.7 - 44.3, n=145, last 2 years) | |
| Lenovo Legion 5 Pro 16 G7 i7 RTX 3070Ti | |
| Asus ROG Strix Scar 15 G533ZW-LN106WS | |
| MSI Stealth GS66 12UGS | |
| Gigabyte Aero 16 YE5 | |
| Asus ROG Flow X16 GV601RW-M5082W | |
| Average AMD Ryzen 9 6900HS (14.2 - 17.9, n=5) | |
| Dell XPS 17 9720 RTX 3060 | |
| Asus ROG Flow X13 GV301QH | |
| Asus ROG Zephyrus M16 GU603H | |
| Lenovo ThinkPad X1 Extreme G4-20Y50040GE | |
| Microsoft Surface Laptop Studio i7 RTX 3050 Ti | |
| V-Ray 5 Benchmark / CPU | |
| Average of class Gaming (4081 - 30302, n=67, last 2 years) | |
| Dell XPS 17 9720 RTX 3060 | |
| Gigabyte Aero 16 YE5 | |
| Asus ROG Flow X16 GV601RW-M5082W | |
| Lenovo ThinkPad X1 Extreme G4-20Y50040GE | |
| Average AMD Ryzen 9 6900HS (8067 - 9648, n=3) | |
| Apple MacBook Pro 16 2021 M1 Pro | |
| Asus ROG Flow X13 GV301QH | |
| V-Ray 5 Benchmark / GPU CUDA | |
| Average of class Gaming (425 - 3288, n=66, last 2 years) | |
| Gigabyte Aero 16 YE5 | |
| Asus ROG Flow X16 GV601RW-M5082W | |
| Lenovo ThinkPad X1 Extreme G4-20Y50040GE | |
| Average AMD Ryzen 9 6900HS (210 - 1224, n=3) | |
| Apple MacBook Pro 16 2021 M1 Pro | |
| Asus ROG Flow X13 GV301QH | |
| V-Ray 5 Benchmark / GPU RTX | |
| Asus ROG Flow X13 GV301QH | |
| Average of class Gaming (556 - 4077, n=65, last 2 years) | |
| Lenovo ThinkPad X1 Extreme G4-20Y50040GE | |
| Gigabyte Aero 16 YE5 | |
| Asus ROG Flow X16 GV601RW-M5082W | |
| Average AMD Ryzen 9 6900HS (538 - 1510, n=2) | |
| V-Ray Benchmark Next 4.10 / CPU | |
| Average of class Gaming (6122 - 45327, n=132, last 2 years) | |
| Lenovo Legion 5 Pro 16 G7 i7 RTX 3070Ti | |
| Asus ROG Strix Scar 15 G533ZW-LN106WS | |
| MSI Stealth GS66 12UGS | |
| Gigabyte Aero 16 YE5 | |
| Asus ROG Zephyrus M16 GU603H | |
| Average AMD Ryzen 9 6900HS (13527 - 15533, n=4) | |
| Asus ROG Flow X16 GV601RW-M5082W | |
| Asus ROG Flow X13 GV301QH | |
| Microsoft Surface Laptop Studio i7 RTX 3050 Ti | |
| V-Ray Benchmark Next 4.10 / GPU | |
| Average of class Gaming (54 - 1333, n=132, last 2 years) | |
| Lenovo Legion 5 Pro 16 G7 i7 RTX 3070Ti | |
| Gigabyte Aero 16 YE5 | |
| MSI Stealth GS66 12UGS | |
| Asus ROG Flow X16 GV601RW-M5082W | |
| Asus ROG Zephyrus M16 GU603H | |
| Asus ROG Strix Scar 15 G533ZW-LN106WS | |
| Microsoft Surface Laptop Studio i7 RTX 3050 Ti | |
| Average AMD Ryzen 9 6900HS (75 - 427, n=4) | |
| Asus ROG Flow X13 GV301QH | |
| WebXPRT 4 / Overall | |
| Average of class Gaming (176.4 - 345, n=118, last 2 years) | |
| Asus ROG Flow X16 GV601RW-M5082W | |
| Average AMD Ryzen 9 6900HS (184.4 - 225, n=3) | |
| Octane V2 / Total Score | |
| Average of class Gaming (87588 - 136623, n=42, last 2 years) | |
| Gigabyte Aero 16 YE5 | |
| Lenovo Legion 5 Pro 16 G7 i7 RTX 3070Ti | |
| Lenovo ThinkPad X1 Extreme G4-20Y50040GE | |
| Asus ROG Flow X16 GV601RW-M5082W | |
| Average AMD Ryzen 9 6900HS (n=1) | |
| Asus ROG Flow X13 GV301QH | |
| Apple MacBook Pro 16 2021 M1 Pro | |
| Microsoft Surface Laptop Studio i7 RTX 3050 Ti | |
| Jetstream 2 / 2.0 Total Score | |
| Average of class Gaming (239 - 508, n=45, last 2 years) | |
| Gigabyte Aero 16 YE5 | |
| Lenovo Legion 5 Pro 16 G7 i7 RTX 3070Ti | |
| Dell XPS 17 9720 RTX 3060 | |
| Asus ROG Flow X16 GV601RW-M5082W | |
| Average AMD Ryzen 9 6900HS (223 - 236, n=2) | |
| Lenovo ThinkPad X1 Extreme G4-20Y50040GE | |
| Apple MacBook Pro 16 2021 M1 Pro | |
| Microsoft Surface Laptop Studio i7 RTX 3050 Ti | |
| Asus ROG Flow X13 GV301QH | |
| Sunspider / 1.0 Total Score | |
| Average AMD Ryzen 9 6900HS (94 - 119.2, n=2) | |
| Gigabyte Aero 16 YE5 | |
| Asus ROG Flow X16 GV601RW-M5082W | |
| Apple MacBook Pro 16 2021 M1 Pro | |
| Speedometer 2.0 / Result 2.0 | |
| Average of class Gaming (29 - 658, n=41, last 2 years) | |
| Apple MacBook Pro 16 2021 M1 Pro | |
| Gigabyte Aero 16 YE5 | |
| Lenovo Legion 5 Pro 16 G7 i7 RTX 3070Ti | |
| Average AMD Ryzen 9 6900HS (n=1) | |
| Asus ROG Flow X16 GV601RW-M5082W | |
| Lenovo ThinkPad X1 Extreme G4-20Y50040GE | |
| Microsoft Surface Laptop Studio i7 RTX 3050 Ti | |
* ... smaller is better
AIDA64: FP32 Ray-Trace | FPU Julia | CPU SHA3 | CPU Queen | FPU SinJulia | FPU Mandel | CPU AES | CPU ZLib | FP64 Ray-Trace | CPU PhotoWorxx
| AIDA64 / FP32 Ray-Trace | |
| Average of class Gaming (7192 - 85542, n=144, last 2 years) | |
| Asus ROG Flow X16 GV601RW-M5082W | |
| Average AMD Ryzen 9 6900HS (14212 - 16072, n=5) | |
| Lenovo ThinkPad X1 Extreme G4-20Y50040GE | |
| Asus ROG Strix Scar 15 G533ZW-LN106WS | |
| Lenovo Legion 5 Pro 16 G7 i7 RTX 3070Ti | |
| MSI Stealth GS66 12UGS | |
| Gigabyte Aero 16 YE5 | |
| Dell XPS 17 9720 RTX 3060 | |
| Microsoft Surface Laptop Studio i7 RTX 3050 Ti | |
| AIDA64 / FP64 Ray-Trace | |
| Average of class Gaming (3856 - 45446, n=144, last 2 years) | |
| Asus ROG Flow X16 GV601RW-M5082W | |
| Lenovo ThinkPad X1 Extreme G4-20Y50040GE | |
| Average AMD Ryzen 9 6900HS (7530 - 8981, n=5) | |
| Lenovo Legion 5 Pro 16 G7 i7 RTX 3070Ti | |
| Asus ROG Strix Scar 15 G533ZW-LN106WS | |
| MSI Stealth GS66 12UGS | |
| Gigabyte Aero 16 YE5 | |
| Dell XPS 17 9720 RTX 3060 | |
| Microsoft Surface Laptop Studio i7 RTX 3050 Ti | |
| AIDA64 / CPU PhotoWorxx | |
| Average of class Gaming (10805 - 62916, n=144, last 2 years) | |
| Dell XPS 17 9720 RTX 3060 | |
| MSI Stealth GS66 12UGS | |
| Asus ROG Strix Scar 15 G533ZW-LN106WS | |
| Gigabyte Aero 16 YE5 | |
| Microsoft Surface Laptop Studio i7 RTX 3050 Ti | |
| Lenovo Legion 5 Pro 16 G7 i7 RTX 3070Ti | |
| Asus ROG Flow X16 GV601RW-M5082W | |
| Average AMD Ryzen 9 6900HS (25757 - 30291, n=5) | |
| Lenovo ThinkPad X1 Extreme G4-20Y50040GE | |
System Performance
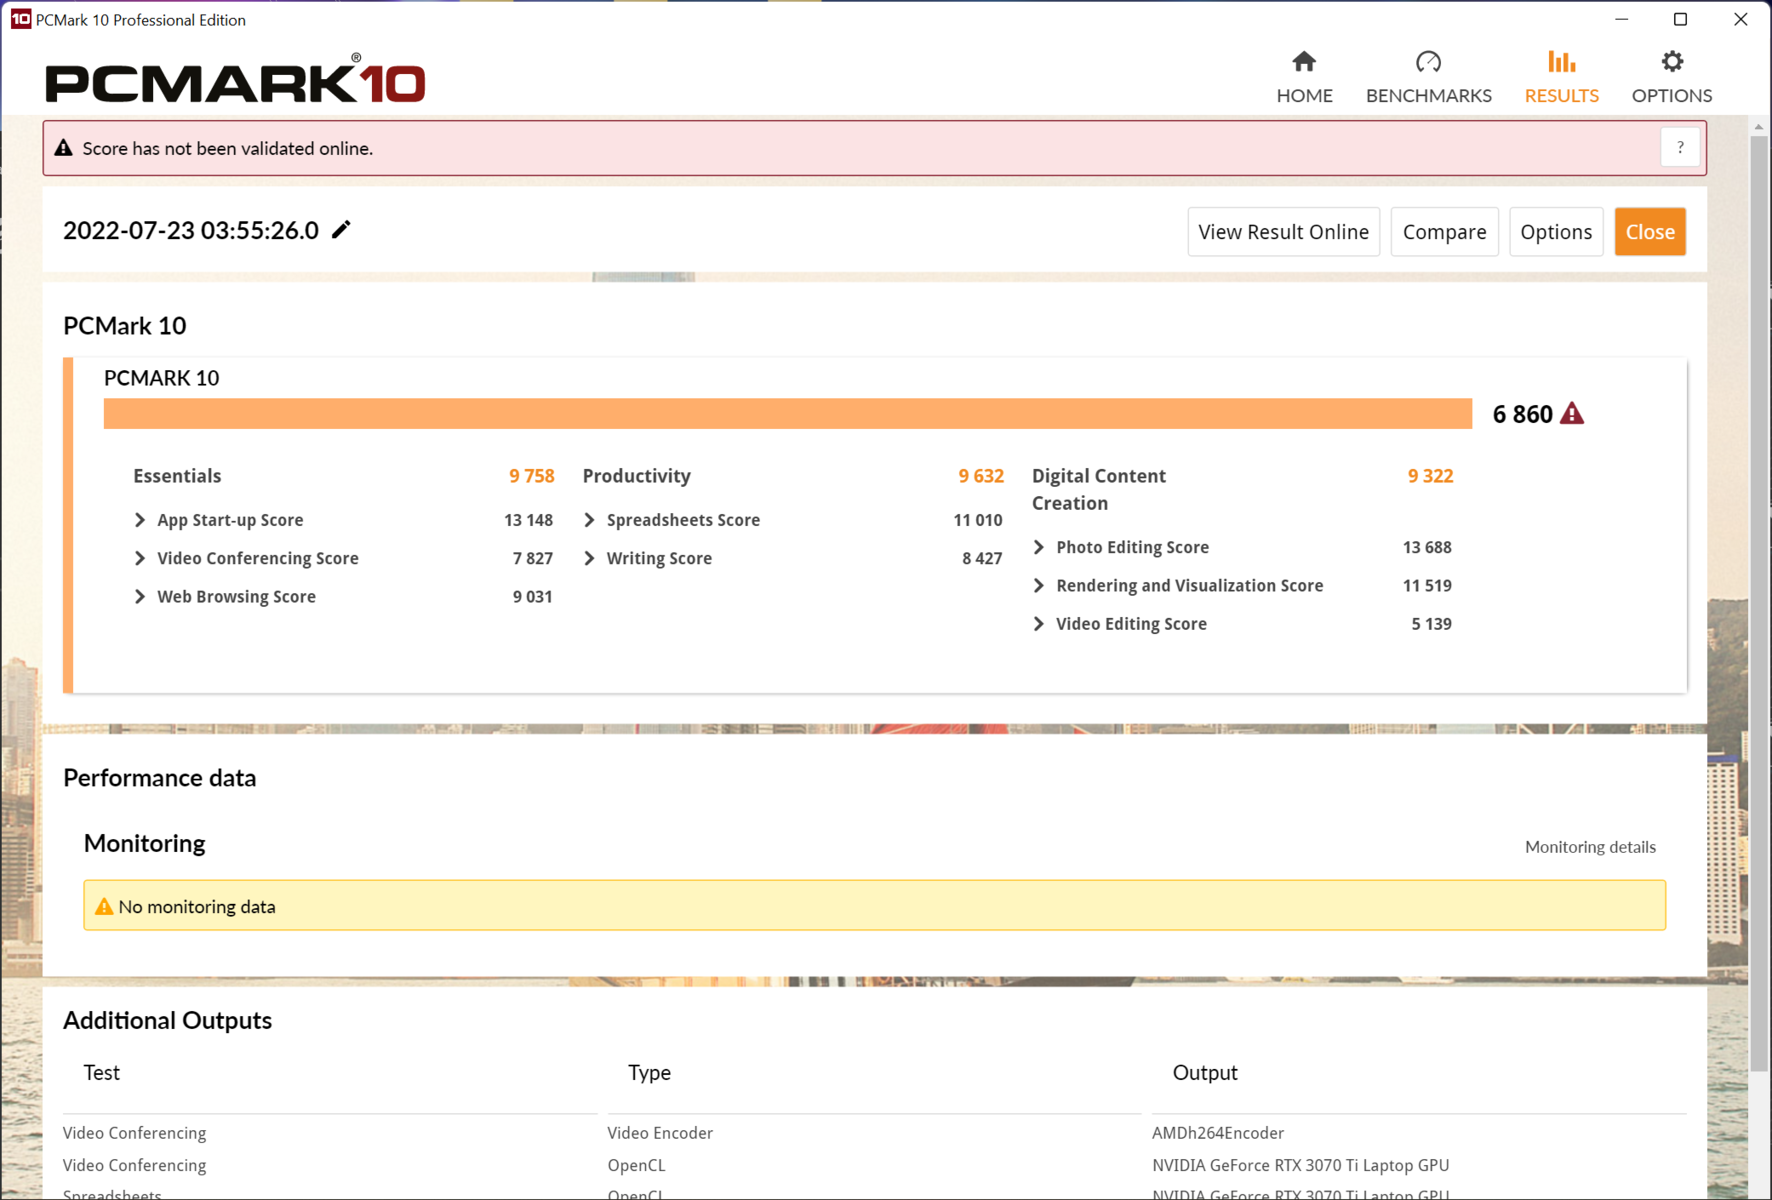
PCMark 10: The ROG Flow X16 is in the midfield here. Subjective system performance is very good and completely lag-free. Any input could not be faster under MS Windows. Intensive browsing with multiple tabs while playing a 4K YouTube video is not a problem for the AMD laptop. There is even enough horsepower for streaming games.
CrossMark: Overall | Productivity | Creativity | Responsiveness
| PCMark 10 / Score | |
| Average of class Gaming (5776 - 9667, n=122, last 2 years) | |
| Asus ROG Strix Scar 15 G533ZW-LN106WS | |
| Gigabyte Aero 16 YE5 | |
| MSI Stealth GS66 12UGS | |
| Lenovo Legion 5 Pro 16 G7 i7 RTX 3070Ti | |
| Dell XPS 17 9720 RTX 3060 | |
| Asus ROG Zephyrus M16 GU603H | |
| Lenovo ThinkPad X1 Extreme G4-20Y50040GE | |
| Asus ROG Flow X16 GV601RW-M5082W | |
| Average AMD Ryzen 9 6900HS, NVIDIA GeForce RTX 3070 Ti Laptop GPU (n=1) | |
| Asus ROG Flow X13 GV301QH | |
| Microsoft Surface Laptop Studio i7 RTX 3050 Ti | |
| PCMark 10 / Essentials | |
| Gigabyte Aero 16 YE5 | |
| MSI Stealth GS66 12UGS | |
| Dell XPS 17 9720 RTX 3060 | |
| Average of class Gaming (8810 - 12600, n=127, last 2 years) | |
| Asus ROG Strix Scar 15 G533ZW-LN106WS | |
| Asus ROG Zephyrus M16 GU603H | |
| Lenovo ThinkPad X1 Extreme G4-20Y50040GE | |
| Lenovo Legion 5 Pro 16 G7 i7 RTX 3070Ti | |
| Asus ROG Flow X13 GV301QH | |
| Asus ROG Flow X16 GV601RW-M5082W | |
| Average AMD Ryzen 9 6900HS, NVIDIA GeForce RTX 3070 Ti Laptop GPU (n=1) | |
| Microsoft Surface Laptop Studio i7 RTX 3050 Ti | |
| PCMark 10 / Productivity | |
| Asus ROG Strix Scar 15 G533ZW-LN106WS | |
| Gigabyte Aero 16 YE5 | |
| Average of class Gaming (6662 - 16716, n=122, last 2 years) | |
| Lenovo Legion 5 Pro 16 G7 i7 RTX 3070Ti | |
| Asus ROG Flow X16 GV601RW-M5082W | |
| Average AMD Ryzen 9 6900HS, NVIDIA GeForce RTX 3070 Ti Laptop GPU (n=1) | |
| MSI Stealth GS66 12UGS | |
| Dell XPS 17 9720 RTX 3060 | |
| Asus ROG Zephyrus M16 GU603H | |
| Lenovo ThinkPad X1 Extreme G4-20Y50040GE | |
| Asus ROG Flow X13 GV301QH | |
| Microsoft Surface Laptop Studio i7 RTX 3050 Ti | |
| PCMark 10 / Digital Content Creation | |
| Average of class Gaming (7440 - 19351, n=122, last 2 years) | |
| Asus ROG Strix Scar 15 G533ZW-LN106WS | |
| Lenovo Legion 5 Pro 16 G7 i7 RTX 3070Ti | |
| Gigabyte Aero 16 YE5 | |
| MSI Stealth GS66 12UGS | |
| Dell XPS 17 9720 RTX 3060 | |
| Asus ROG Zephyrus M16 GU603H | |
| Lenovo ThinkPad X1 Extreme G4-20Y50040GE | |
| Asus ROG Flow X16 GV601RW-M5082W | |
| Average AMD Ryzen 9 6900HS, NVIDIA GeForce RTX 3070 Ti Laptop GPU (n=1) | |
| Asus ROG Flow X13 GV301QH | |
| Microsoft Surface Laptop Studio i7 RTX 3050 Ti | |
| CrossMark / Overall | |
| Gigabyte Aero 16 YE5 | |
| Asus ROG Strix Scar 15 G533ZW-LN106WS | |
| Average of class Gaming (1247 - 2344, n=118, last 2 years) | |
| Lenovo Legion 5 Pro 16 G7 i7 RTX 3070Ti | |
| Dell XPS 17 9720 RTX 3060 | |
| Asus ROG Flow X16 GV601RW-M5082W | |
| Average AMD Ryzen 9 6900HS, NVIDIA GeForce RTX 3070 Ti Laptop GPU (n=1) | |
| Lenovo ThinkPad X1 Extreme G4-20Y50040GE | |
| Apple MacBook Pro 16 2021 M1 Pro | |
| Microsoft Surface Laptop Studio i7 RTX 3050 Ti | |
| CrossMark / Productivity | |
| Gigabyte Aero 16 YE5 | |
| Asus ROG Strix Scar 15 G533ZW-LN106WS | |
| Lenovo Legion 5 Pro 16 G7 i7 RTX 3070Ti | |
| Average of class Gaming (1299 - 2211, n=118, last 2 years) | |
| Dell XPS 17 9720 RTX 3060 | |
| Lenovo ThinkPad X1 Extreme G4-20Y50040GE | |
| Asus ROG Flow X16 GV601RW-M5082W | |
| Average AMD Ryzen 9 6900HS, NVIDIA GeForce RTX 3070 Ti Laptop GPU (n=1) | |
| Microsoft Surface Laptop Studio i7 RTX 3050 Ti | |
| Apple MacBook Pro 16 2021 M1 Pro | |
| CrossMark / Creativity | |
| Average of class Gaming (1275 - 2729, n=118, last 2 years) | |
| Gigabyte Aero 16 YE5 | |
| Asus ROG Strix Scar 15 G533ZW-LN106WS | |
| Dell XPS 17 9720 RTX 3060 | |
| Apple MacBook Pro 16 2021 M1 Pro | |
| Lenovo Legion 5 Pro 16 G7 i7 RTX 3070Ti | |
| Asus ROG Flow X16 GV601RW-M5082W | |
| Average AMD Ryzen 9 6900HS, NVIDIA GeForce RTX 3070 Ti Laptop GPU (n=1) | |
| Lenovo ThinkPad X1 Extreme G4-20Y50040GE | |
| Microsoft Surface Laptop Studio i7 RTX 3050 Ti | |
| CrossMark / Responsiveness | |
| Gigabyte Aero 16 YE5 | |
| Asus ROG Strix Scar 15 G533ZW-LN106WS | |
| Lenovo Legion 5 Pro 16 G7 i7 RTX 3070Ti | |
| Average of class Gaming (1030 - 2330, n=118, last 2 years) | |
| Dell XPS 17 9720 RTX 3060 | |
| Lenovo ThinkPad X1 Extreme G4-20Y50040GE | |
| Asus ROG Flow X16 GV601RW-M5082W | |
| Average AMD Ryzen 9 6900HS, NVIDIA GeForce RTX 3070 Ti Laptop GPU (n=1) | |
| Microsoft Surface Laptop Studio i7 RTX 3050 Ti | |
| Apple MacBook Pro 16 2021 M1 Pro | |
| PCMark 10 Score | 6860 points | |
Help | ||
| AIDA64 / Memory Latency | |
| Average of class Gaming (59.5 - 259, n=144, last 2 years) | |
| Microsoft Surface Laptop Studio i7 RTX 3050 Ti | |
| Asus ROG Strix Scar 15 G533ZW-LN106WS | |
| Lenovo Legion 5 Pro 16 G7 i7 RTX 3070Ti | |
| MSI Stealth GS66 12UGS | |
| Asus ROG Flow X16 GV601RW-M5082W | |
| Dell XPS 17 9720 RTX 3060 | |
| Average AMD Ryzen 9 6900HS (79.2 - 110.9, n=5) | |
| Gigabyte Aero 16 YE5 | |
| Lenovo ThinkPad X1 Extreme G4-20Y50040GE | |
* ... smaller is better
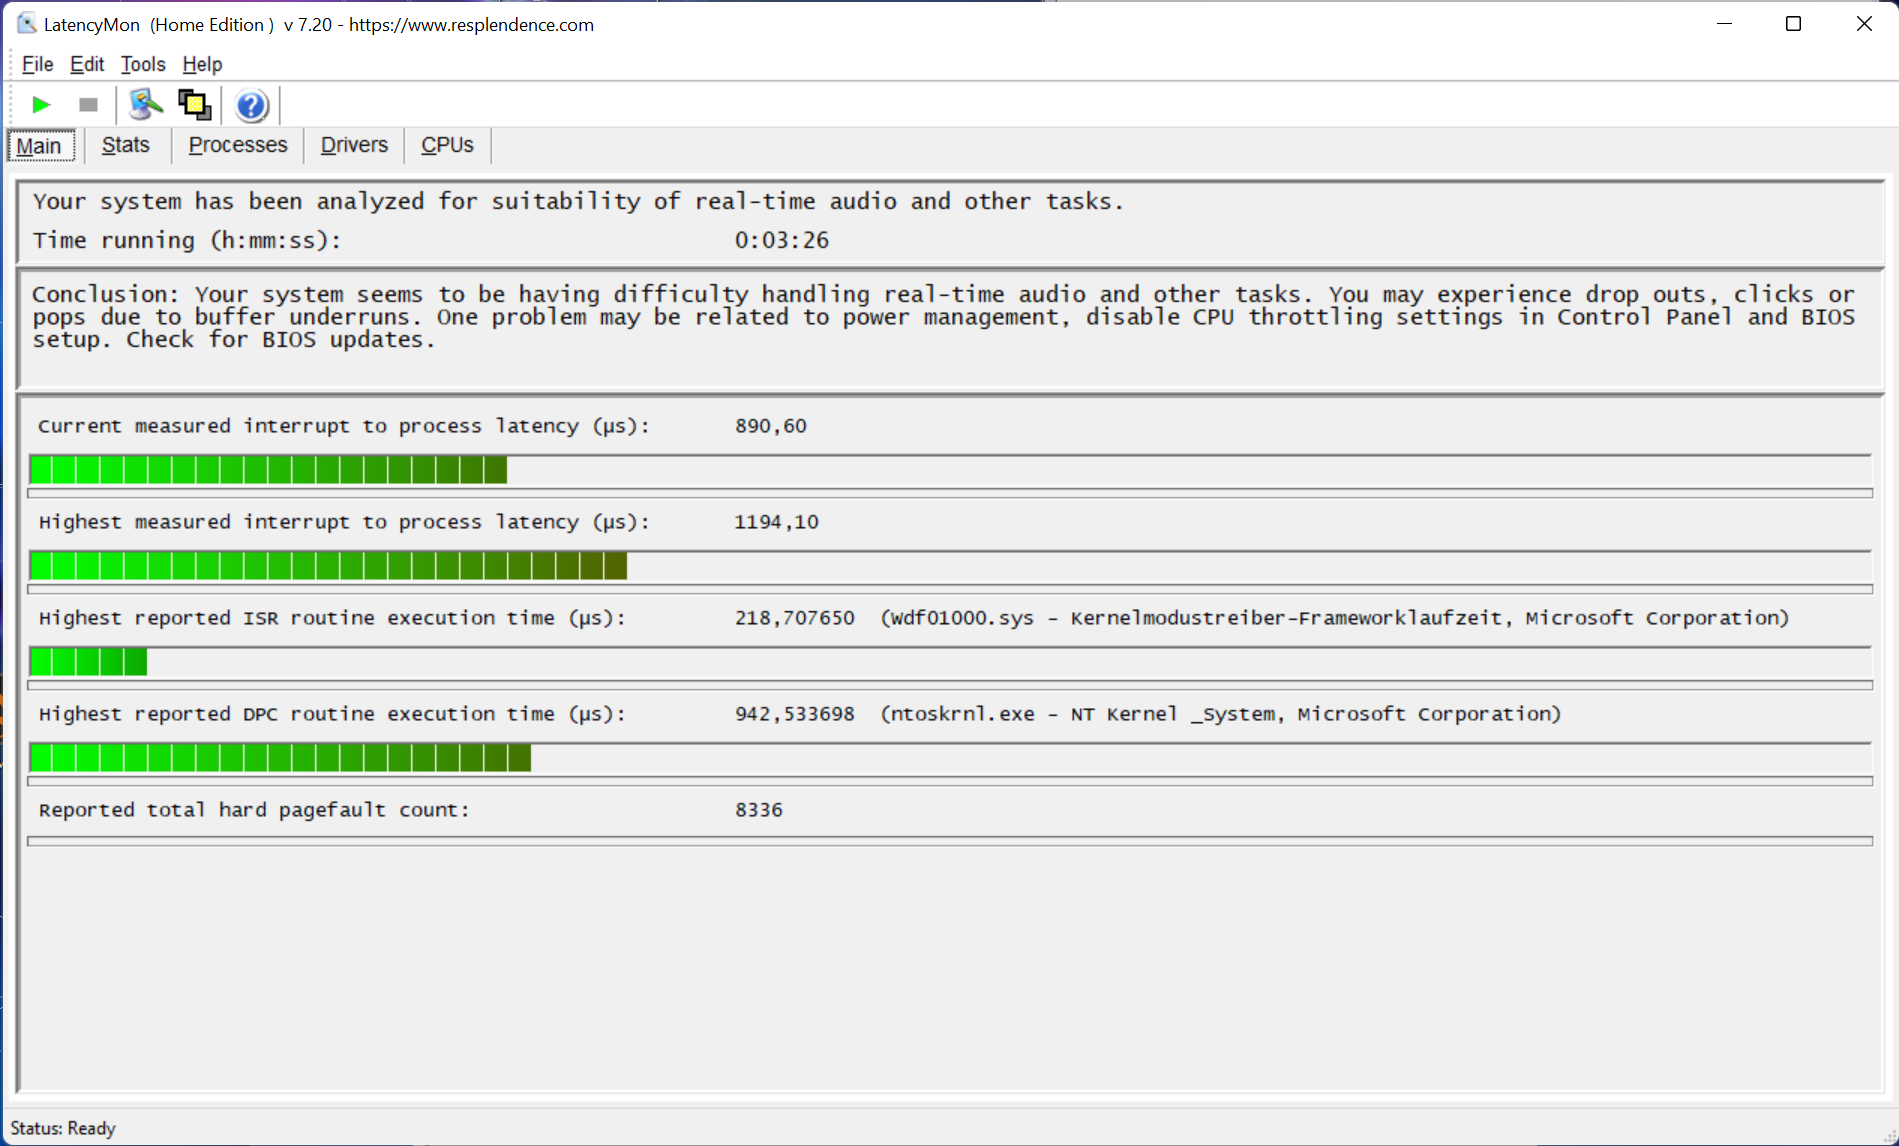
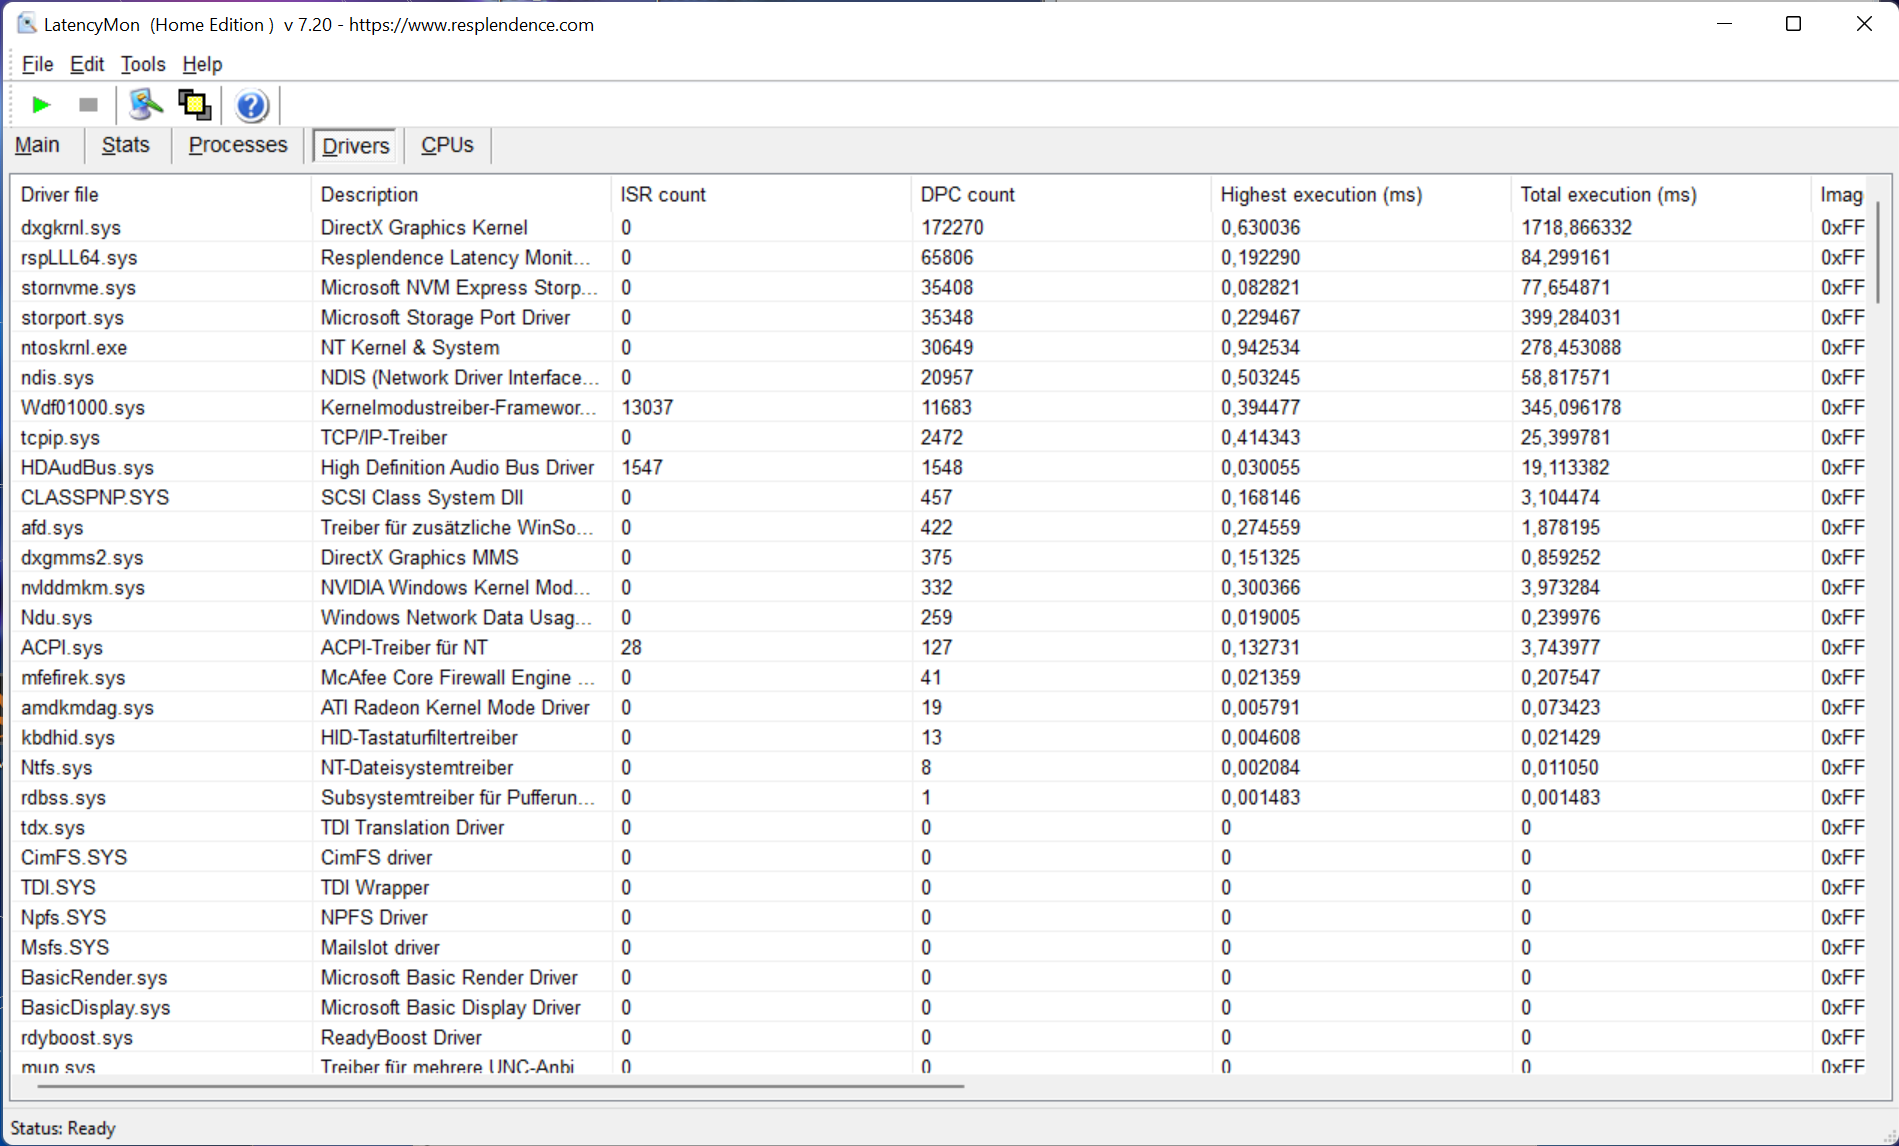
DPC Latency
The ROG Flow X16, namely our review model, appears to have problems managing audio and video editing in real time. The DirectX graphics kernel is primarily responsible here. Future BIOS updates may improve this.
4K YouTube playback causes a CPU load of 4% and ~20% on the Radeon iGPU. No skipped frames were registered.
| DPC Latencies / LatencyMon - interrupt to process latency (max), Web, Youtube, Prime95 | |
| Asus ROG Flow X13 GV301QH | |
| MSI Stealth GS66 12UGS | |
| Lenovo ThinkPad X1 Extreme G4-20Y50040GE | |
| Asus ROG Flow X16 GV601RW-M5082W | |
| Asus ROG Zephyrus M16 GU603H | |
| Asus ROG Strix Scar 15 G533ZW-LN106WS | |
| Microsoft Surface Laptop Studio i7 RTX 3050 Ti | |
| Lenovo Legion 5 Pro 16 G7 i7 RTX 3070Ti | |
| Gigabyte Aero 16 YE5 | |
| Dell XPS 17 9720 RTX 3060 | |
* ... smaller is better
Storage Devices
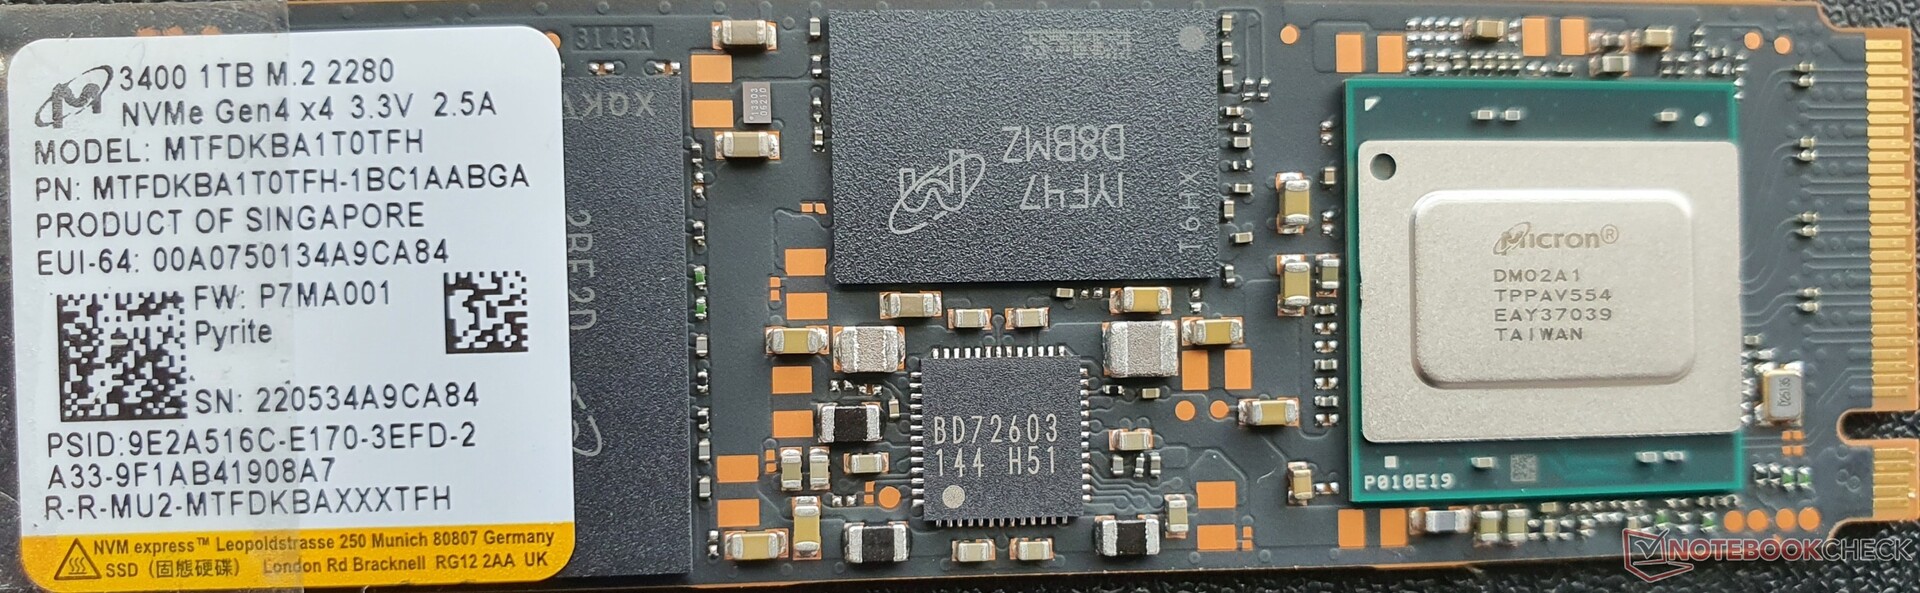
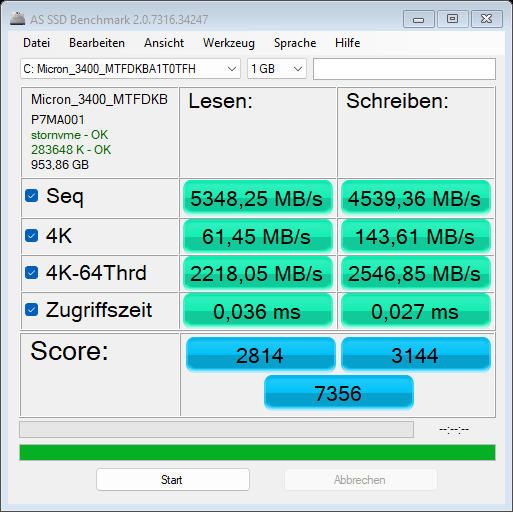
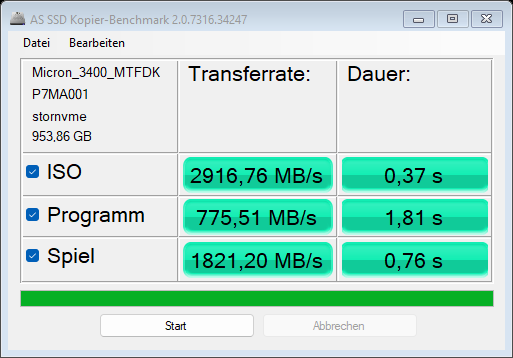
The 1 terabyte Micron 3400 is connected via PCIe 4.0 and is able to run at high speeds. Our read performance endurance test does not show any drops. However, the 4K values lag a little behind the competition.
| Asus ROG Flow X16 GV601RW-M5082W GeForce RTX 3070 Ti Laptop GPU, R9 6900HS, Micron 3400 1TB MTFDKBA1T0TFH | Asus ROG Zephyrus M16 GU603H GeForce RTX 3070 Laptop GPU, i9-11900H, Samsung PM9A1 MZVL22T0HBLB | Asus ROG Strix Scar 15 G533ZW-LN106WS GeForce RTX 3070 Ti Laptop GPU, i9-12900H, Samsung PM9A1 MZVL22T0HBLB | Gigabyte Aero 16 YE5 GeForce RTX 3080 Ti Laptop GPU, i9-12900HK, Phison ESR01TBMFCT | Lenovo Legion 5 Pro 16 G7 i7 RTX 3070Ti GeForce RTX 3070 Ti Laptop GPU, i7-12700H, Samsung PM9A1 MZVL21T0HCLR | Lenovo ThinkPad X1 Extreme G4-20Y50040GE GeForce RTX 3080 Laptop GPU, i9-11950H, Kioxia XG7 KXG7AZNV1T02 | Dell XPS 17 9720 RTX 3060 GeForce RTX 3060 Laptop GPU, i7-12700H, Samsung PM9A1 MZVL21T0HCLR | Microsoft Surface Laptop Studio i7 RTX 3050 Ti GeForce RTX 3050 Ti Laptop GPU, i7-11370H, SK Hynix PC711 1TB HFS001TDE9X084N | |
|---|---|---|---|---|---|---|---|---|
| AS SSD | 9% | 15% | 26% | 24% | -4% | -14% | -21% | |
| Seq Read (MB/s) | 5348.25 | 5615 5% | 5563.48 4% | 5588 4% | 5036 -6% | 5386 1% | 5241.84 -2% | 2768 -48% |
| Seq Write (MB/s) | 4539.36 | 4297 -5% | 4045.87 -11% | 3267 -28% | 3784 -17% | 4218 -7% | 2208.41 -51% | 1683 -63% |
| 4K Read (MB/s) | 61.45 | 55.3 -10% | 81.3 32% | 109.4 78% | 88.1 43% | 65.9 7% | 79.6 30% | 63.7 4% |
| 4K Write (MB/s) | 143.61 | 170.5 19% | 248.96 73% | 321.6 124% | 240.4 67% | 223.2 55% | 221.57 54% | 191.1 33% |
| 4K-64 Read (MB/s) | 2218.05 | 2591 17% | 2740.24 24% | 2966 34% | 2788 26% | 2757 24% | 1264.16 -43% | 917 -59% |
| 4K-64 Write (MB/s) | 2546.85 | 3190 25% | 3345.62 31% | 3342 31% | 3424 34% | 1736 -32% | 3070.83 21% | 1983 -22% |
| Access Time Read * (ms) | 0.036 | 0.04 -11% | 0.022 39% | 0.056 -56% | 0.02 44% | 0.049 -36% | 0.031 14% | 0.024 33% |
| Access Time Write * (ms) | 0.027 | 0.025 7% | 0.017 37% | 0.012 56% | 0.018 33% | 0.02 26% | 0.056 -107% | 0.019 30% |
| Score Read (Points) | 2814 | 3208 14% | 3378 20% | 3634 29% | 3380 20% | 3361 19% | 1868 -34% | 1257 -55% |
| Score Write (Points) | 3144 | 3790 21% | 3999 27% | 3991 27% | 4043 29% | 2381 -24% | 3513 12% | 2343 -25% |
| Score Total (Points) | 7356 | 8563 16% | 9031 23% | 9380 28% | 9094 24% | 7397 1% | 6203 -16% | 4206 -43% |
| Copy ISO MB/s (MB/s) | 2916.76 | 2358.18 -19% | 2352 -19% | 3221 10% | 2598 -11% | 2874.04 -1% | 1991 -32% | |
| Copy Program MB/s (MB/s) | 775.51 | 466.47 -40% | 1031 33% | 939 21% | 434.7 -44% | 447.82 -42% | 606 -22% | |
| Copy Game MB/s (MB/s) | 1821.2 | 1211.65 -33% | 2188 20% | 1995 10% | 1230 -32% | 1327.42 -27% | 1435 -21% |
* ... smaller is better
* ... smaller is better
Sustained Performance Read: DiskSpd Read Loop, Queue Depth 8
Graphics Card
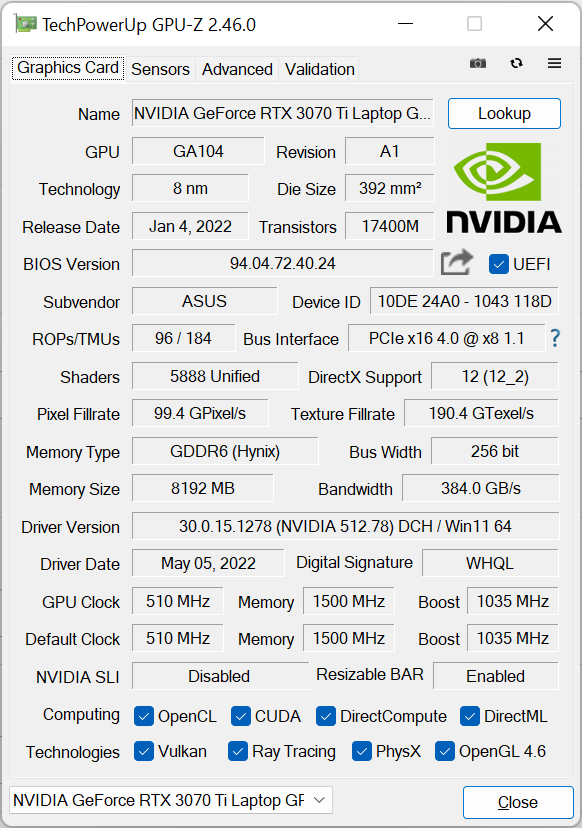
Nvidia's GeForce RTX 3070 Ti is used as the dedicated graphics unit, which has access to 8 GB of GDDR6 VRAM. Performance is at a high level thanks to the most powerful variant (125 watt TGP, including Dynamic Boost), which is not necessarily what you would expect from a compact and lightweight 16-inch convertible.
Even the MSI Stealth GS66 has to concede defeat as a pure gaming notebook due to its lower TGP of 105 watts, and the Gigabyte Aero 16 with its RTX 3080 Ti lags around 10% behind, since it only cools 90 watts despite a similar build. Only thicker gaming laptops such as the Legion 5 Pro and the ROG Strix Scar 15 are capable of operating the RTX 3070 Ti with an even higher TGP of 150 watts (125 W + 25 W Dynamic Boost) and are thus 10 to 15 percent above the ROG Flow X16 in the 3DMark benchmarks.
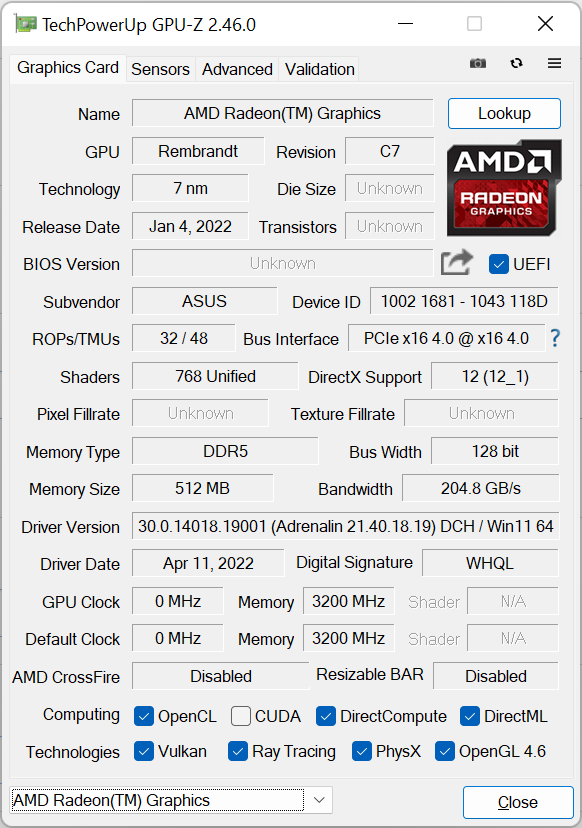
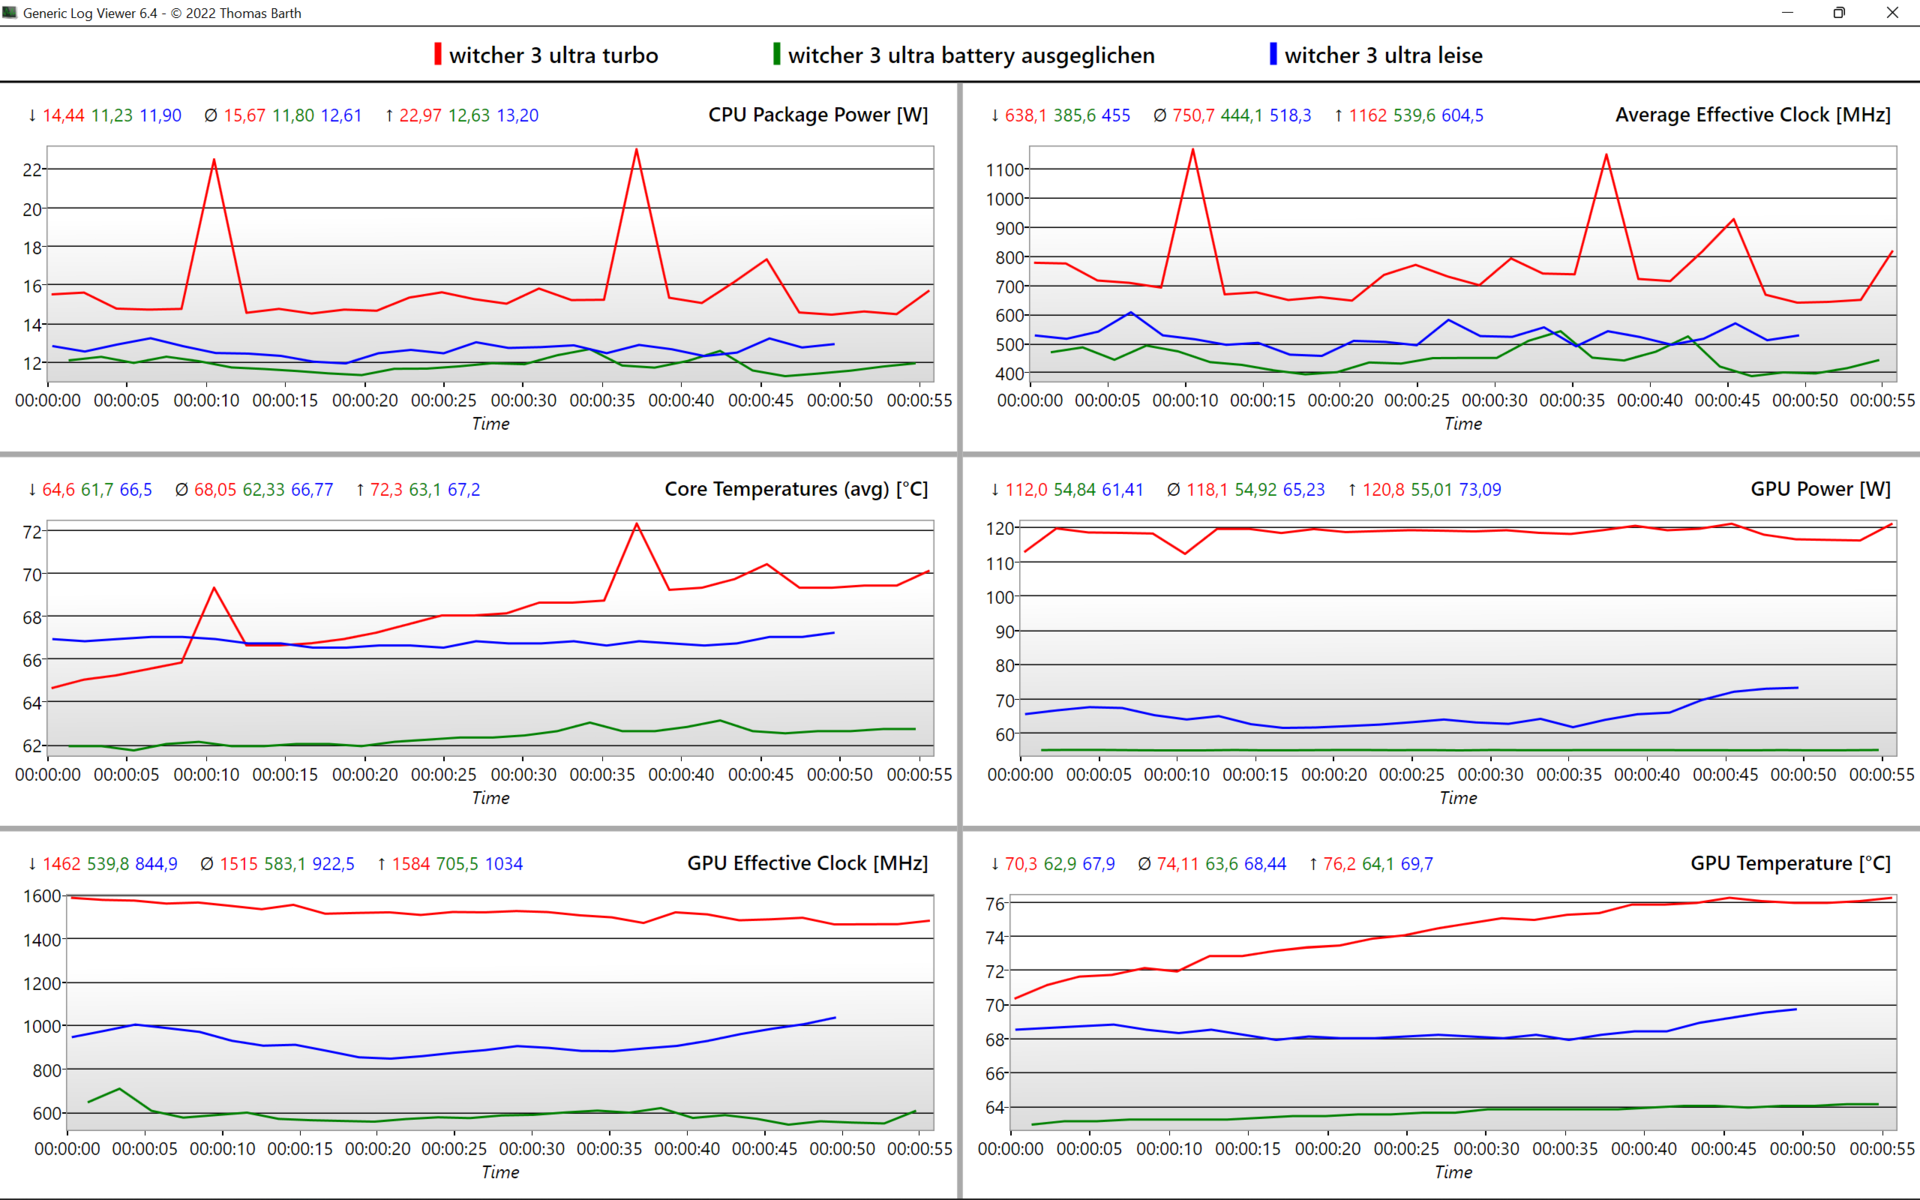
Using the Radeon 680M iGPU, the Flow X16 lasts almost twice as long whilst gaming on battery than with the RTX 3070 Ti enabled (2:06 h versus 0:56 h). The performance of the dGPU is still twice as high as that of the iGPU and at least 50% of the original dGPU performance is still available. In comparison, the XMG Neo 15 limits its graphics performance by 90% in battery mode. With a 100 watt USB-C power supply, only half the dGPU performance is available.
Although the RTX 3070 Ti is not a professional workstation GPU, the corresponding performance, such as in the SpecViewPerf tests, is impressive and the CUDA benchmarks are also at a high level. Nevertheless, the ROG Flow X16 is not designed as a workstation laptop, for which special drivers are missing.
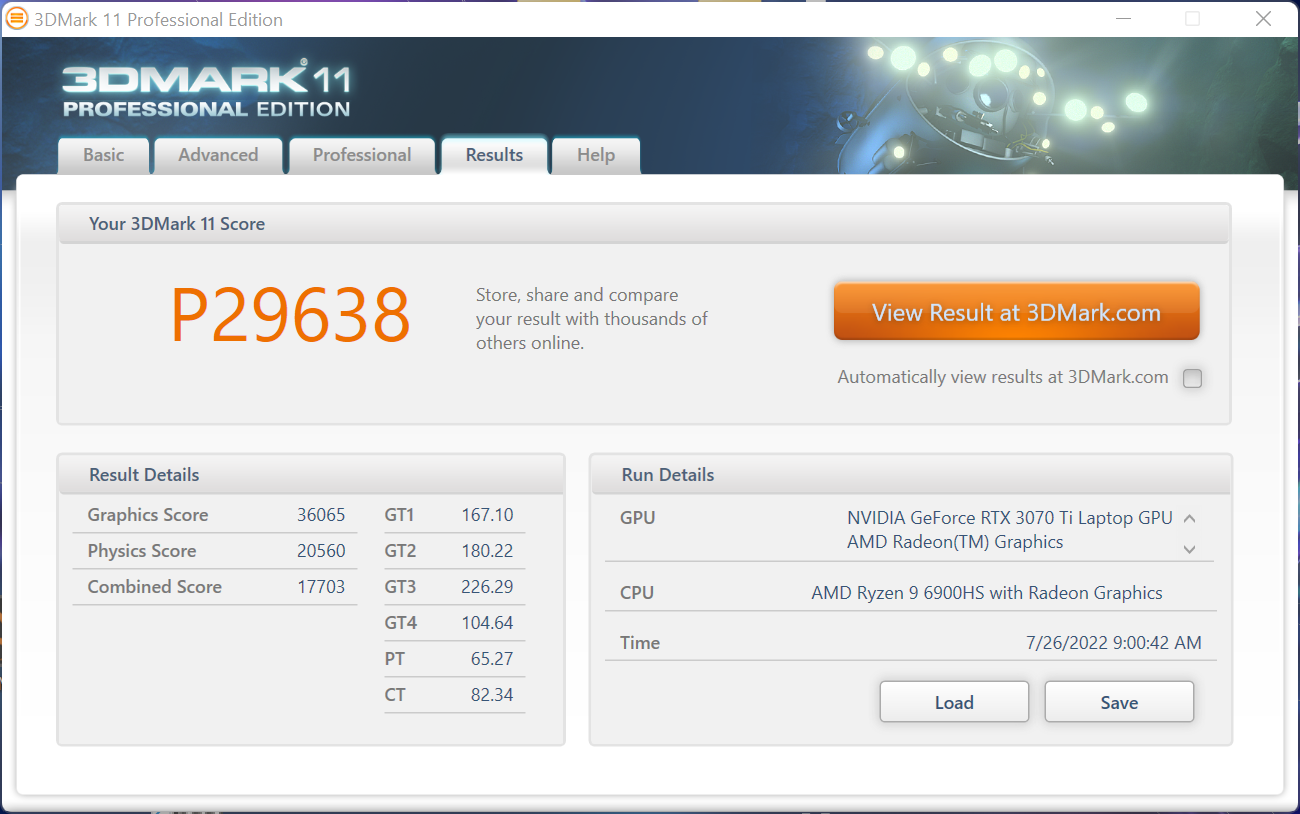


| 3DMark 11 Performance | 29638 points | |
| 3DMark Cloud Gate Standard Score | 51280 points | |
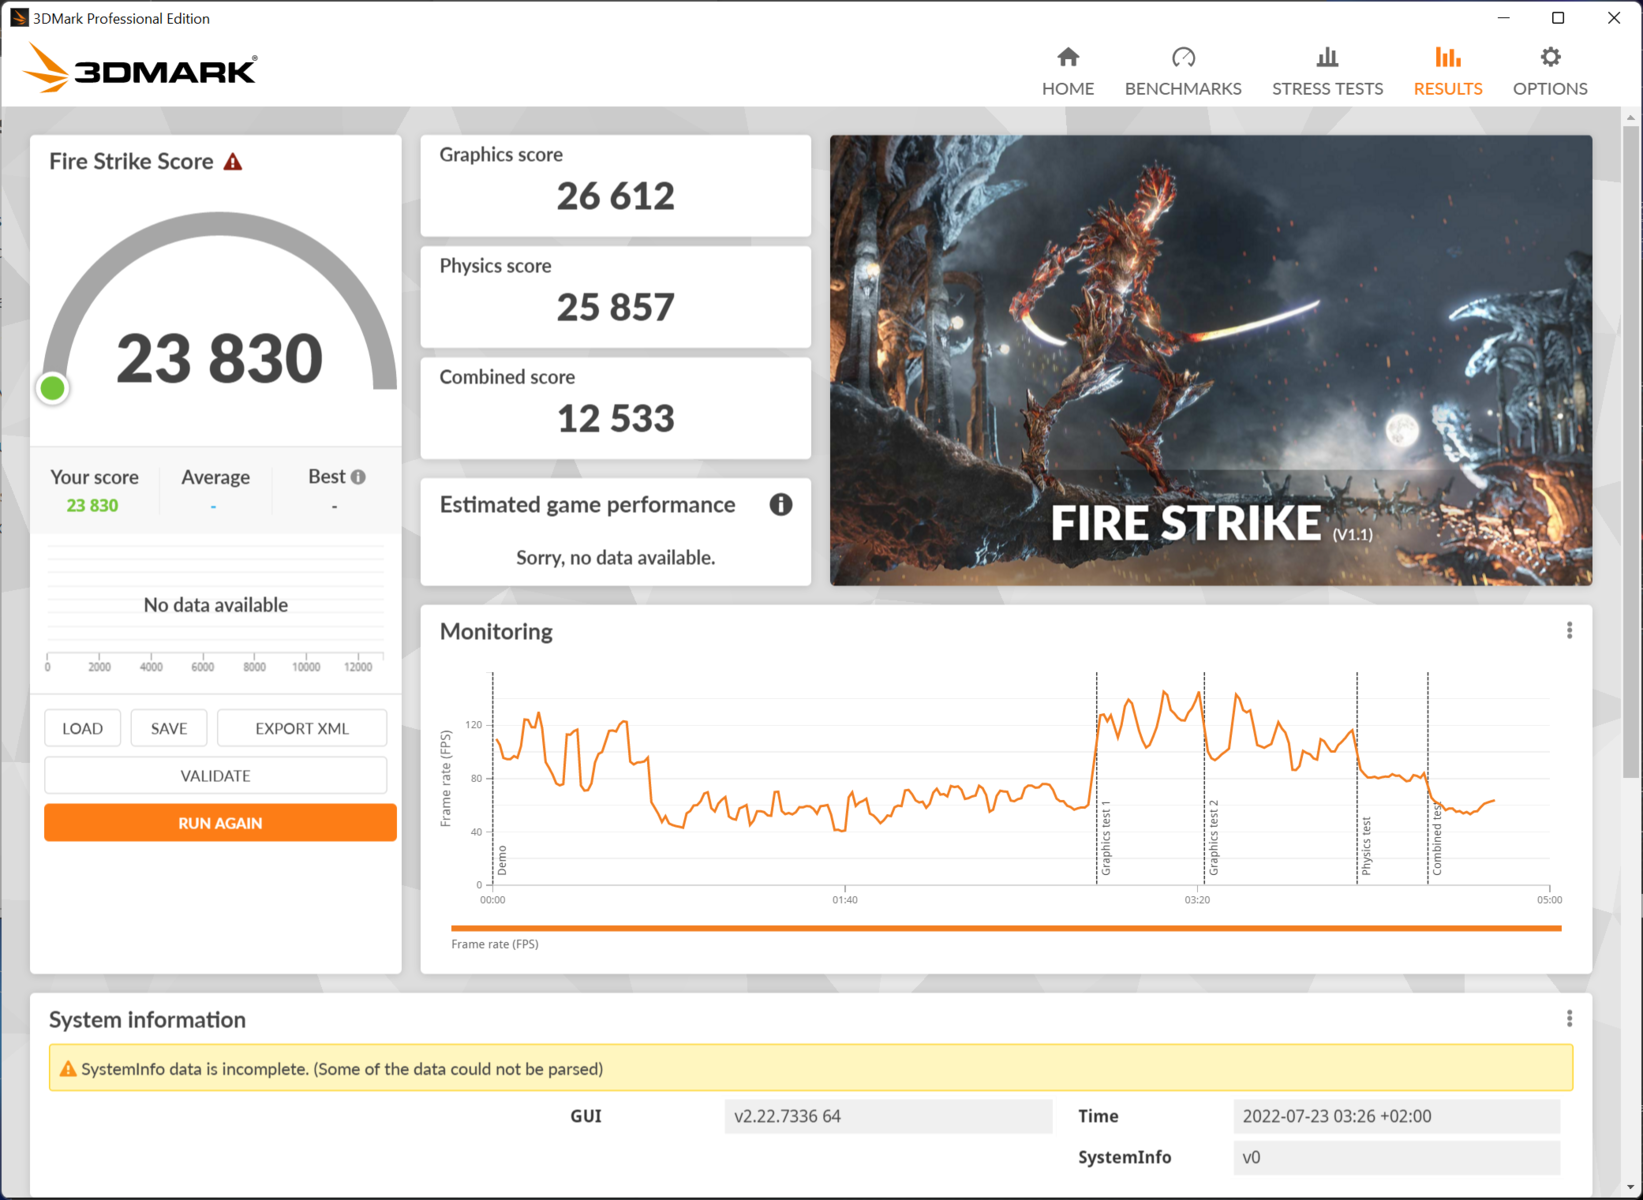
| 3DMark Fire Strike Score | 23830 points | |
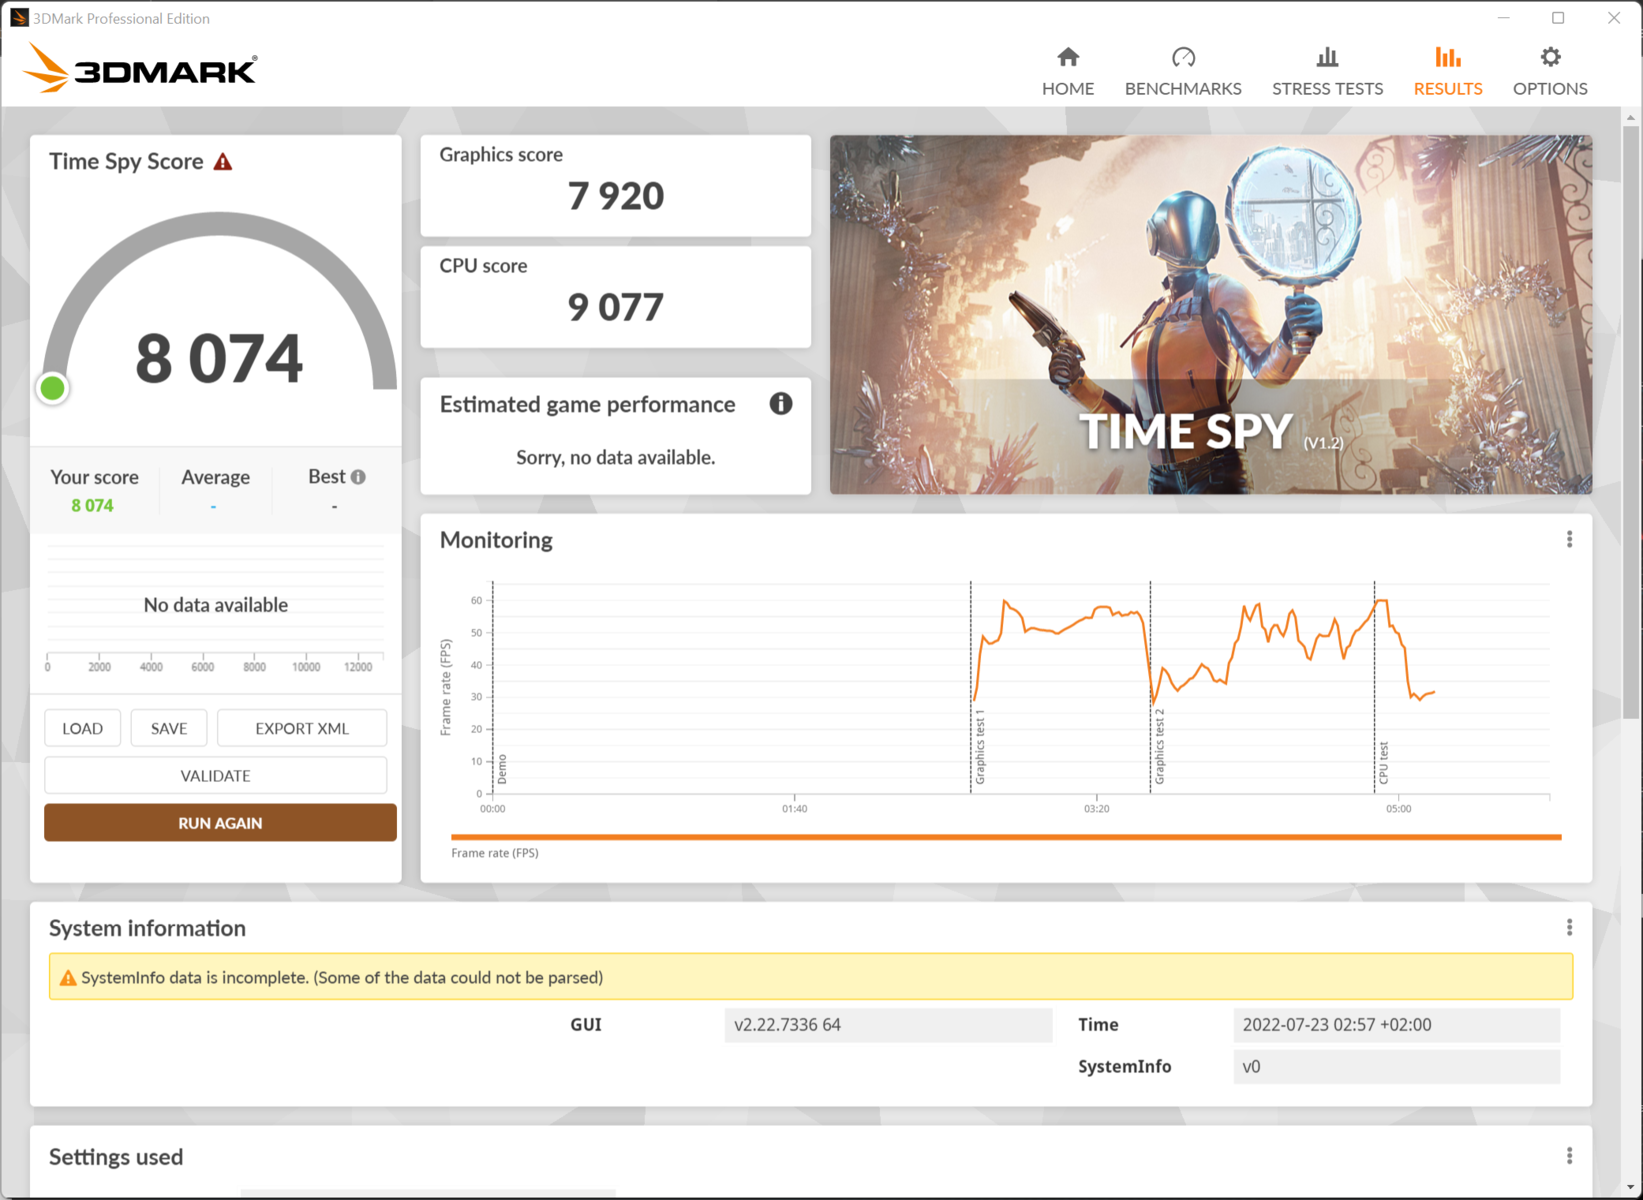
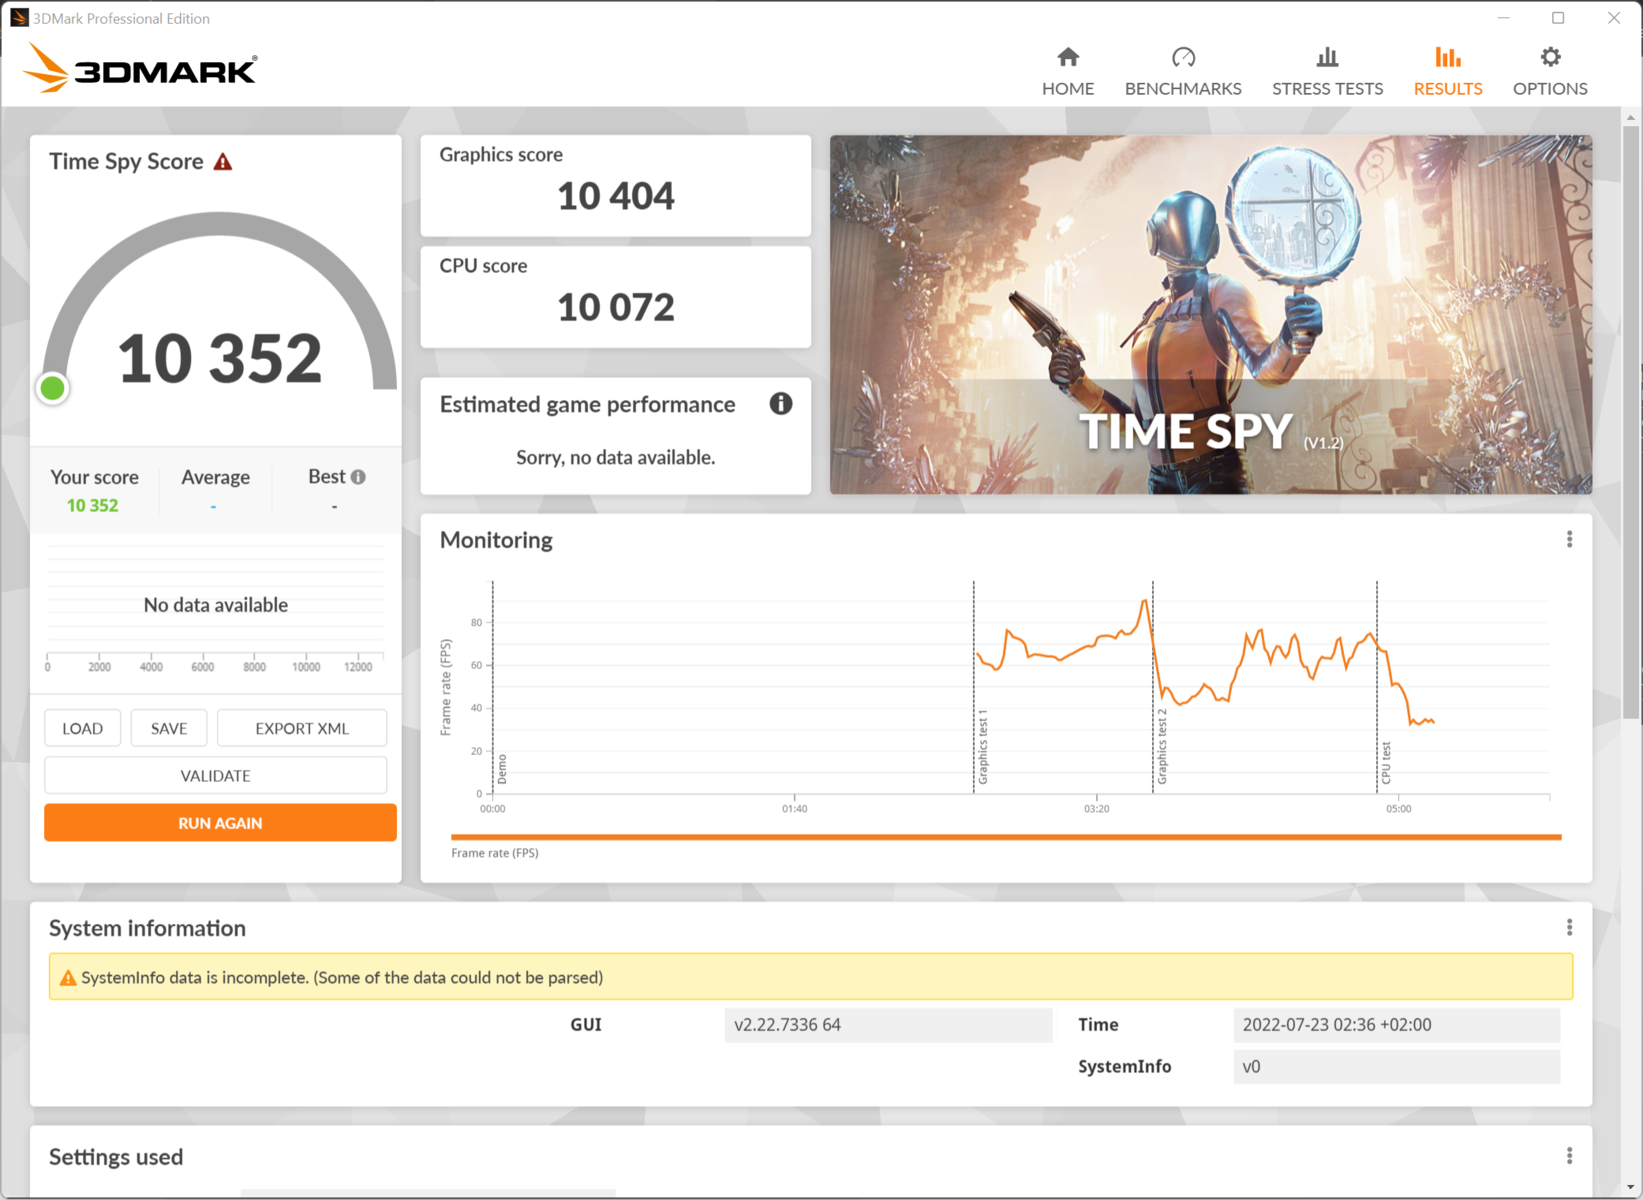
| 3DMark Time Spy Score | 10352 points | |
Help | ||
| Blender - v3.3 Classroom CUDA | |
| Asus ROG Flow X16 GV601RW-M5082W | |
| MSI Raider GE77 HX 12UHS | |
* ... smaller is better
Gaming Performance
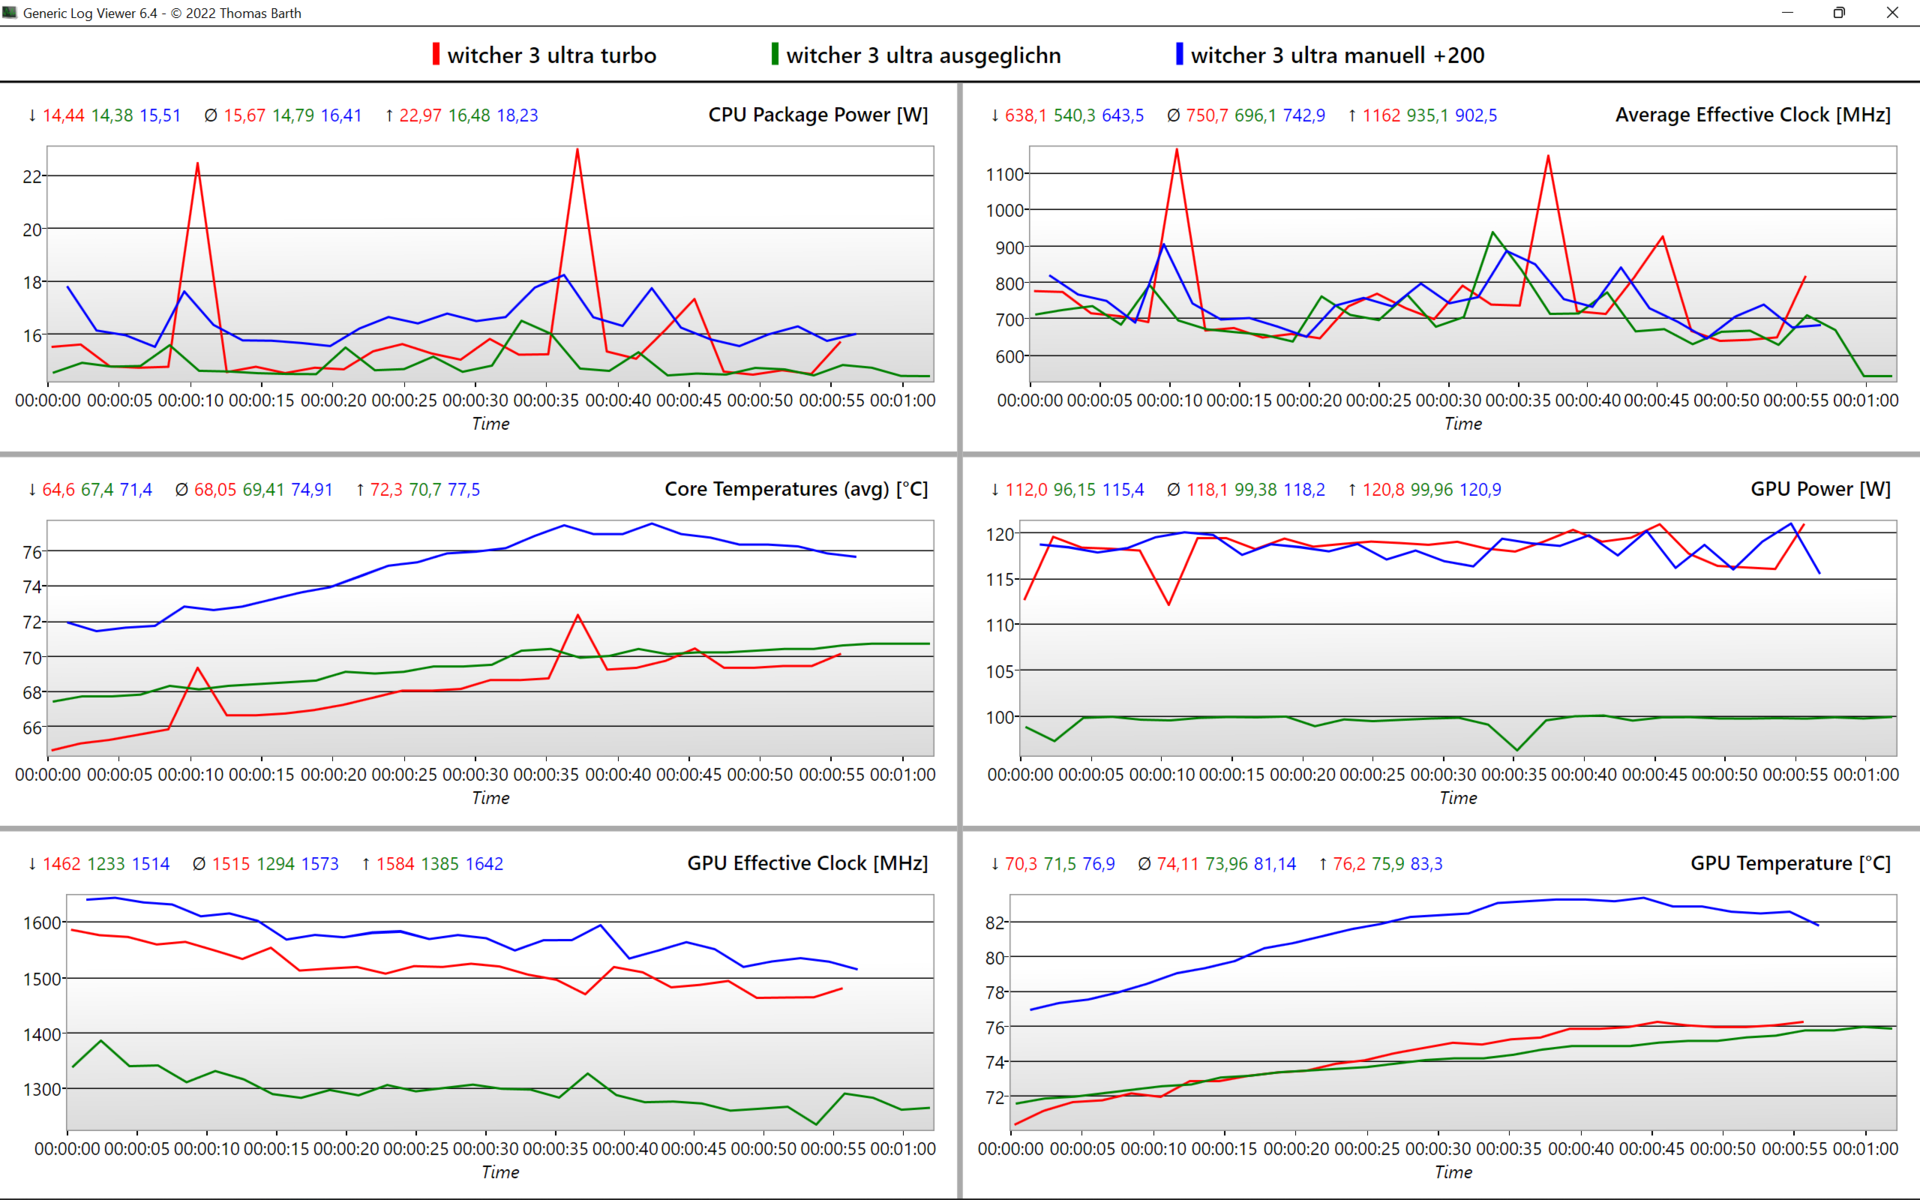
Competing devices only run 5 to 10 percent faster on average in high resolutions with the GeForce RTX 3070 Ti (ROG Strix Scar 15, Legion 5 Pro, Acer Predator Triton 500 SE), and the gap to the Legion 5 Pro in The Witcher 3 even closes when we overclock the GPU via Asus' Armoury Crate or activate the MUX switch.
An RTX 3080 Ti with 105 W of TGP, such as in the MSI Steath GS77, is only ~10 percent faster. In the thinner Aero 16 it runs even more slowly than in our ROG Flow X16 since the Aero 16 can only cool ~90 watts.
With around 150 W of TGP (XMG Pro 17, Razer Blade 17, Medion Erazer Beast X30), ithe RTX 3080 Ti is 15 to 20 percent faster. The best results in our database for mobile GPUs are about 30% higher than our review device, achieved by the few pure gaming notebooks that have 165 to 175 W of TGP due to more space for stronger cooling systems (MSI Raider GE77 HX, Alienware x17 R2). Overall, this is a very good result for a compact 16-inch convertible that can easily run newer games in QHD resolution. Full HD gaming at high details is still possible on battery power.
Gaming performance is 6 to 7 percent higher upon enabling the MUX Switch, and overclocking in "Manual Mode" achieves a similar increase. However, the combination of both does not increase performance any further. All the effects of the different modes can be seen in the table below. The MUX switch without overclocking offers the best result, which also keeps the system quieter at 45.4 db(A). In Silent mode, you lose 30% of GPU performance in return for a quiet 35.5 db(A).
| Power Modes | Witcher 3 Ultra (FPS) | GPU Clock (MHz) | GPU Temperature (°C) | GPU Power Draw (W) | Loudness in db(A) |
|---|---|---|---|---|---|
| MUX +200MHz | 104,4 | 1.550 | 75 | 116 | 51,2 |
| MUX @Turbo | 104,9 | 1.500 | 71 | 116 | 45,4 |
| Manual +200MHz | 102,3 | 1.550 | 75 | 116 | 51,2 |
| Turbo | 97,8 | 1.500 | 71 | 116 | 45,4 |
| Balanced / Performance | 89,3 | 1.270 | 72 | 100 | 42,4 |
| Silent | 59,9 | 1.000 | 69 | 65 | 35,5 |
| Battery @Silent | 48,4 | 600 | 64 | 55 | 32 |
| Radeon 680M iGPU | 25,6 | 2.200 | 65 | 35 | 25,8 |
| Shadow of the Tomb Raider | |
| 1920x1080 Highest Preset AA:T | |
| Average of class Gaming (131 - 212, n=2, last 2 years) | |
| Average NVIDIA GeForce RTX 3070 Ti Laptop GPU (119 - 129, n=2) | |
| Asus ROG Flow X16 GV601RW-M5082W | |
| Apple MacBook Pro 16 2021 M1 Max | |
| Apple MacBook Pro 16 2021 M1 Pro | |
| 2560x1440 Highest Preset AA:T | |
| Average of class Gaming (86 - 176, n=2, last 2 years) | |
| Asus ROG Flow X16 GV601RW-M5082W | |
| Average NVIDIA GeForce RTX 3070 Ti Laptop GPU (n=1) | |
| Ghostwire Tokyo | |
| 1920x1080 Highest Settings | |
| Average NVIDIA GeForce RTX 3070 Ti Laptop GPU (115.4 - 145.1, n=4) | |
| Asus ROG Flow X16 GV601RW-M5082W | |
| 2560x1440 Highest Settings | |
| Average NVIDIA GeForce RTX 3070 Ti Laptop GPU (83.9 - 93.1, n=2) | |
| Asus ROG Flow X16 GV601RW-M5082W | |
| 1920x1080 Highest Settings + Maximum Ray Tracing | |
| Asus ROG Flow X16 GV601RW-M5082W | |
| Average NVIDIA GeForce RTX 3070 Ti Laptop GPU (48.9 - 59.9, n=3) | |
| Tiny Tina's Wonderlands | |
| 1920x1080 High Preset (DX12) | |
| Average of class Gaming (72.1 - 227, n=14, last 2 years) | |
| Average NVIDIA GeForce RTX 3070 Ti Laptop GPU (115 - 118.3, n=3) | |
| Asus ROG Flow X16 GV601RW-M5082W | |
| 1920x1080 Badass Preset (DX12) | |
| Average of class Gaming (55 - 187.5, n=14, last 2 years) | |
| Average NVIDIA GeForce RTX 3070 Ti Laptop GPU (89.8 - 93.7, n=4) | |
| Asus ROG Flow X16 GV601RW-M5082W | |
| 2560x1440 Badass Preset (DX12) | |
| Average of class Gaming (45.3 - 132.8, n=12, last 2 years) | |
| Average NVIDIA GeForce RTX 3070 Ti Laptop GPU (59.3 - 63.9, n=3) | |
| Asus ROG Flow X16 GV601RW-M5082W | |
| Borderlands 3 | |
| 1920x1080 High Overall Quality (DX11) | |
| Asus ROG Flow X16 GV601RW-M5082W | |
| Average NVIDIA GeForce RTX 3070 Ti Laptop GPU (n=1) | |
| Apple MacBook Pro 16 2021 M1 Max | |
| Apple MacBook Pro 16 2021 M1 Pro | |
| 1920x1080 Badass Overall Quality (DX11) | |
| Asus ROG Flow X16 GV601RW-M5082W | |
| Average NVIDIA GeForce RTX 3070 Ti Laptop GPU (n=1) | |
| Apple MacBook Pro 16 2021 M1 Max | |
| Apple MacBook Pro 16 2021 M1 Pro | |
| 2560x1440 Badass Overall Quality (DX11) | |
| Asus ROG Flow X16 GV601RW-M5082W | |
| Average NVIDIA GeForce RTX 3070 Ti Laptop GPU (n=1) | |
| Metro Exodus | |
| 1920x1080 Ultra Quality AF:16x | |
| Average NVIDIA GeForce RTX 3070 Ti Laptop GPU (71 - 77.2, n=2) | |
| Asus ROG Flow X16 GV601RW-M5082W | |
| 1920x1080 Ultra Quality DXR AF:16x | |
| Average NVIDIA GeForce RTX 3070 Ti Laptop GPU (61.3 - 65.1, n=2) | |
| Asus ROG Flow X16 GV601RW-M5082W | |
| 2560x1440 Ultra Quality AF:16x | |
| Asus ROG Flow X16 GV601RW-M5082W | |
| Average NVIDIA GeForce RTX 3070 Ti Laptop GPU (n=1) | |
| Hunt Showdown | |
| 1920x1080 High Preset | |
| Asus ROG Flow X16 GV601RW-M5082W | |
| Average NVIDIA GeForce RTX 3070 Ti Laptop GPU (116 - 125.9, n=2) | |
| MSI Stealth GS66 12UGS | |
| 2560x1440 High Preset | |
| Asus ROG Flow X16 GV601RW-M5082W | |
| Average NVIDIA GeForce RTX 3070 Ti Laptop GPU (75.1 - 82.5, n=2) | |
| MSI Stealth GS66 12UGS | |
Our one-hour Witcher 3 test shows a stable frame rate without any dips.
Witcher 3 FPS Chart
| low | med. | high | ultra | QHD | |
|---|---|---|---|---|---|
| GTA V (2015) | 179.3 | 156.3 | 94.6 | 83.7 | |
| The Witcher 3 (2015) | 264 | 189 | 97.8 | ||
| Dota 2 Reborn (2015) | 135.4 | 128.9 | 116 | 112.1 | |
| Final Fantasy XV Benchmark (2018) | 170.6 | 123.5 | 94.9 | 75.5 | |
| X-Plane 11.11 (2018) | 97.4 | 87.9 | 70.8 | ||
| Far Cry 5 (2018) | 113 | 109 | 88 | ||
| Strange Brigade (2018) | 304 | 214 | 184 | 167.2 | |
| Shadow of the Tomb Raider (2018) | 124 | 119 | 83 | ||
| Metro Exodus (2019) | 149.2 | 114.3 | 88.3 | 71 | 52.7 |
| Borderlands 3 (2019) | 104.2 | 92.4 | 80.9 | 58.7 | |
| Hunt Showdown (2020) | 125.9 | 82.5 | |||
| Assassin´s Creed Valhalla (2020) | 88 | 79 | 61 | ||
| God of War (2022) | 83.6 | 59.8 | 44.7 | ||
| Dying Light 2 (2022) | 119.6 | 80.7 | 71.1 | 48.7 | |
| Cyberpunk 2077 1.6 (2022) | 108.8 | 89.2 | 75.6 | 43.1 | |
| Ghostwire Tokyo (2022) | 131 | 130.2 | 83.9 | ||
| Tiny Tina's Wonderlands (2022) | 115.2 | 90.7 | 59.3 |
Emissions - Quiet gamer thanks to Asus' triple fan solution
System Noise
When idle, we are faced with a silent laptop. The fans remain still. Only under multi-core load do they jump on from time to time, but even then they are restrained, such as when browsing with multiple tabs.
Under permanent load in Performance mode, fan noise, depending on the scenario, hovers around 36 db(A) (@Blender CPU benchmark) or 42.4 db(A) in gaming. In Turbo mode, the laptop emits 45 db(A) on average in both scenarios, but can increase to just under 50db(A) under high combined load. This even becomes 55 db(A) in the stress test (Prime95 + FurMark). At least the fans don't emit any noise at high frequencies. No coil whining was detected either.
The comparatively good values are due to a combination of several factors: five heatpipes, three fans, liquid metal thermal heatpaste, an edge-to-edge fan outlet on the back of the device and foam elements inside that concentrate and direct the airflow. Such a system manages to cool 140 watts (15-40 W for CPU and 100-125 W for GPU), which is very good for a compact 16-inch convertible.
The pure gaming laptops in our comparison field also do not have any fans that remain still when idling and generate similar volumes under load. The quietest representative by far is the MacBook Pro 16, thanks to its efficient Apple M1 ARM processor.
Noise level
| Idle |
| 25.5 / 25.5 / 27.4 dB(A) |
| Load |
| 49.9 / 55 dB(A) |
 | ||
30 dB silent 40 dB(A) audible 50 dB(A) loud |
||
min: | ||
| Asus ROG Flow X16 GV601RW-M5082W GeForce RTX 3070 Ti Laptop GPU, R9 6900HS, Micron 3400 1TB MTFDKBA1T0TFH | Asus ROG Zephyrus M16 GU603H GeForce RTX 3070 Laptop GPU, i9-11900H, Samsung PM9A1 MZVL22T0HBLB | Asus ROG Strix Scar 15 G533ZW-LN106WS GeForce RTX 3070 Ti Laptop GPU, i9-12900H, Samsung PM9A1 MZVL22T0HBLB | Gigabyte Aero 16 YE5 GeForce RTX 3080 Ti Laptop GPU, i9-12900HK, Phison ESR01TBMFCT | Lenovo Legion 5 Pro 16 G7 i7 RTX 3070Ti GeForce RTX 3070 Ti Laptop GPU, i7-12700H, Samsung PM9A1 MZVL21T0HCLR | MSI Stealth GS66 12UGS GeForce RTX 3070 Ti Laptop GPU, i7-12700H, WDC PC SN810 1TB | Apple MacBook Pro 16 2021 M1 Pro M1 Pro 16-Core GPU, M1 Pro, Apple SSD AP1024R | Lenovo ThinkPad X1 Extreme G4-20Y50040GE GeForce RTX 3080 Laptop GPU, i9-11950H, Kioxia XG7 KXG7AZNV1T02 | Dell XPS 17 9720 RTX 3060 GeForce RTX 3060 Laptop GPU, i7-12700H, Samsung PM9A1 MZVL21T0HCLR | |
|---|---|---|---|---|---|---|---|---|---|
| Noise | -12% | -27% | -8% | -3% | -9% | 17% | 4% | 9% | |
| off / environment * (dB) | 25.5 | 25 2% | 26.86 -5% | 25 2% | 24.6 4% | 24 6% | 24.7 3% | 24.7 3% | 23.8 7% |
| Idle Minimum * (dB) | 25.5 | 25 2% | 39.07 -53% | 30 -18% | 28.4 -11% | 31 -22% | 24.7 3% | 24.7 3% | 24.1 5% |
| Idle Average * (dB) | 25.5 | 31 -22% | 39.07 -53% | 32 -25% | 28.4 -11% | 32 -25% | 24.7 3% | 24.7 3% | 24.1 5% |
| Idle Maximum * (dB) | 27.4 | 42 -53% | 39.07 -43% | 33 -20% | 28.4 -4% | 35 -28% | 24.7 10% | 28.1 -3% | 24.1 12% |
| Load Average * (dB) | 49.9 | 48 4% | 53.34 -7% | 45 10% | 49.4 1% | 48 4% | 26.1 48% | 42.5 15% | 43.2 13% |
| Load Maximum * (dB) | 55 | 56 -2% | 56.6 -3% | 52 5% | 54.7 1% | 48 13% | 37.4 32% | 52.1 5% | 48 13% |
| Witcher 3 ultra * (dB) | 52 | 56.6 | 50 | 49.4 | 43 | 46.4 | 48 |
* ... smaller is better
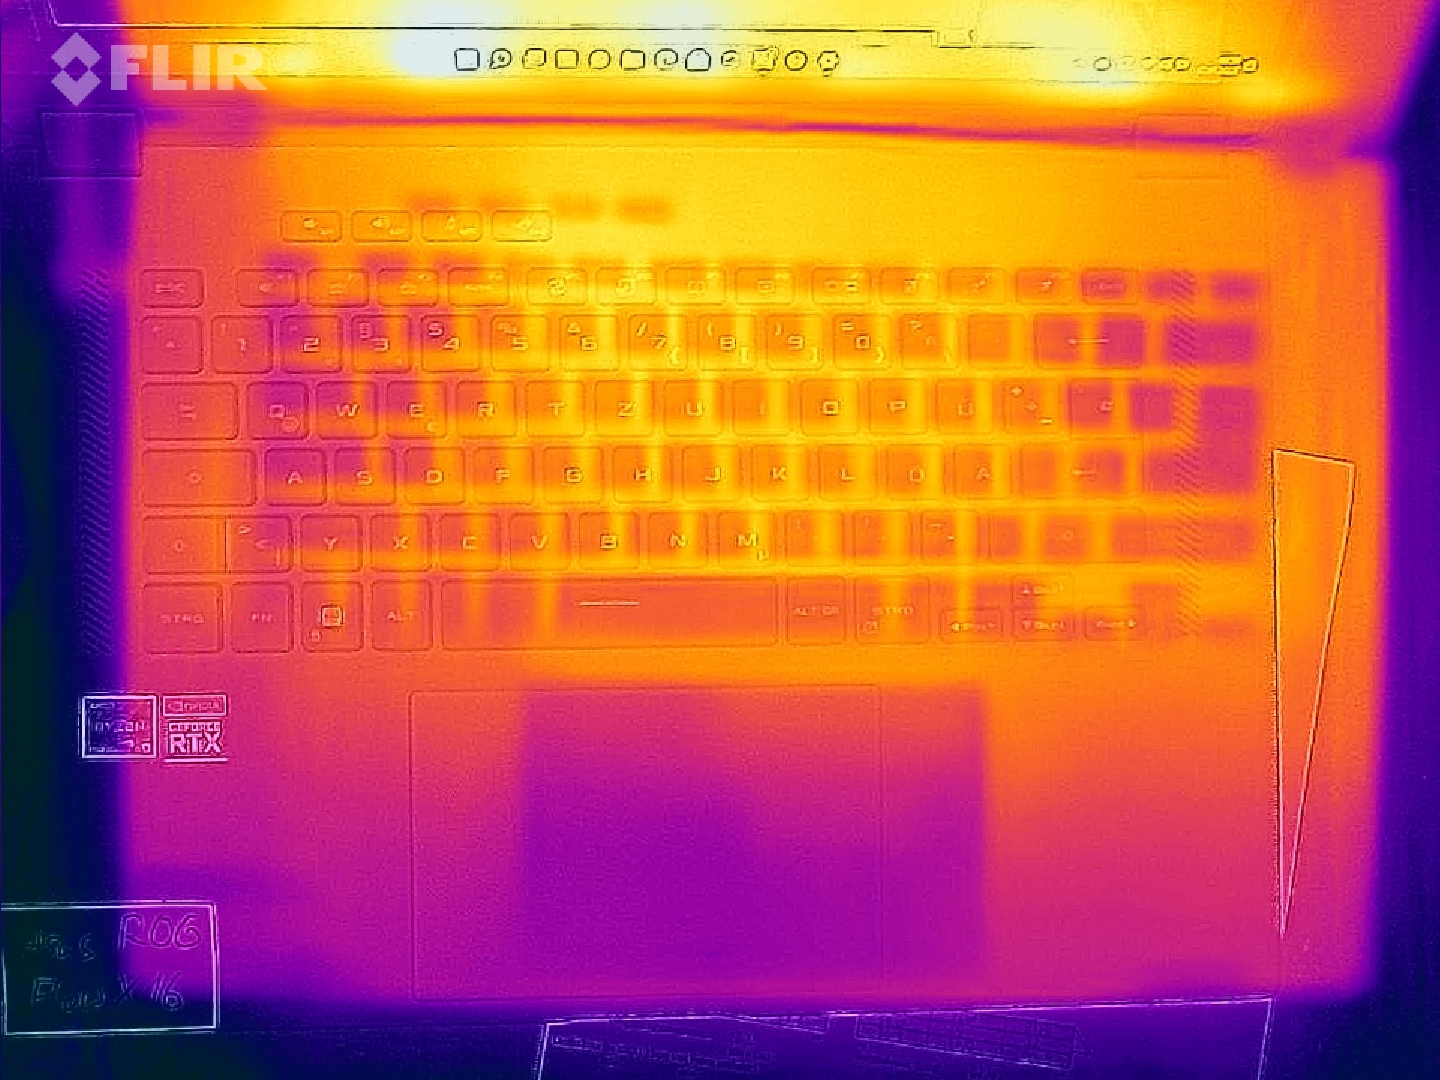
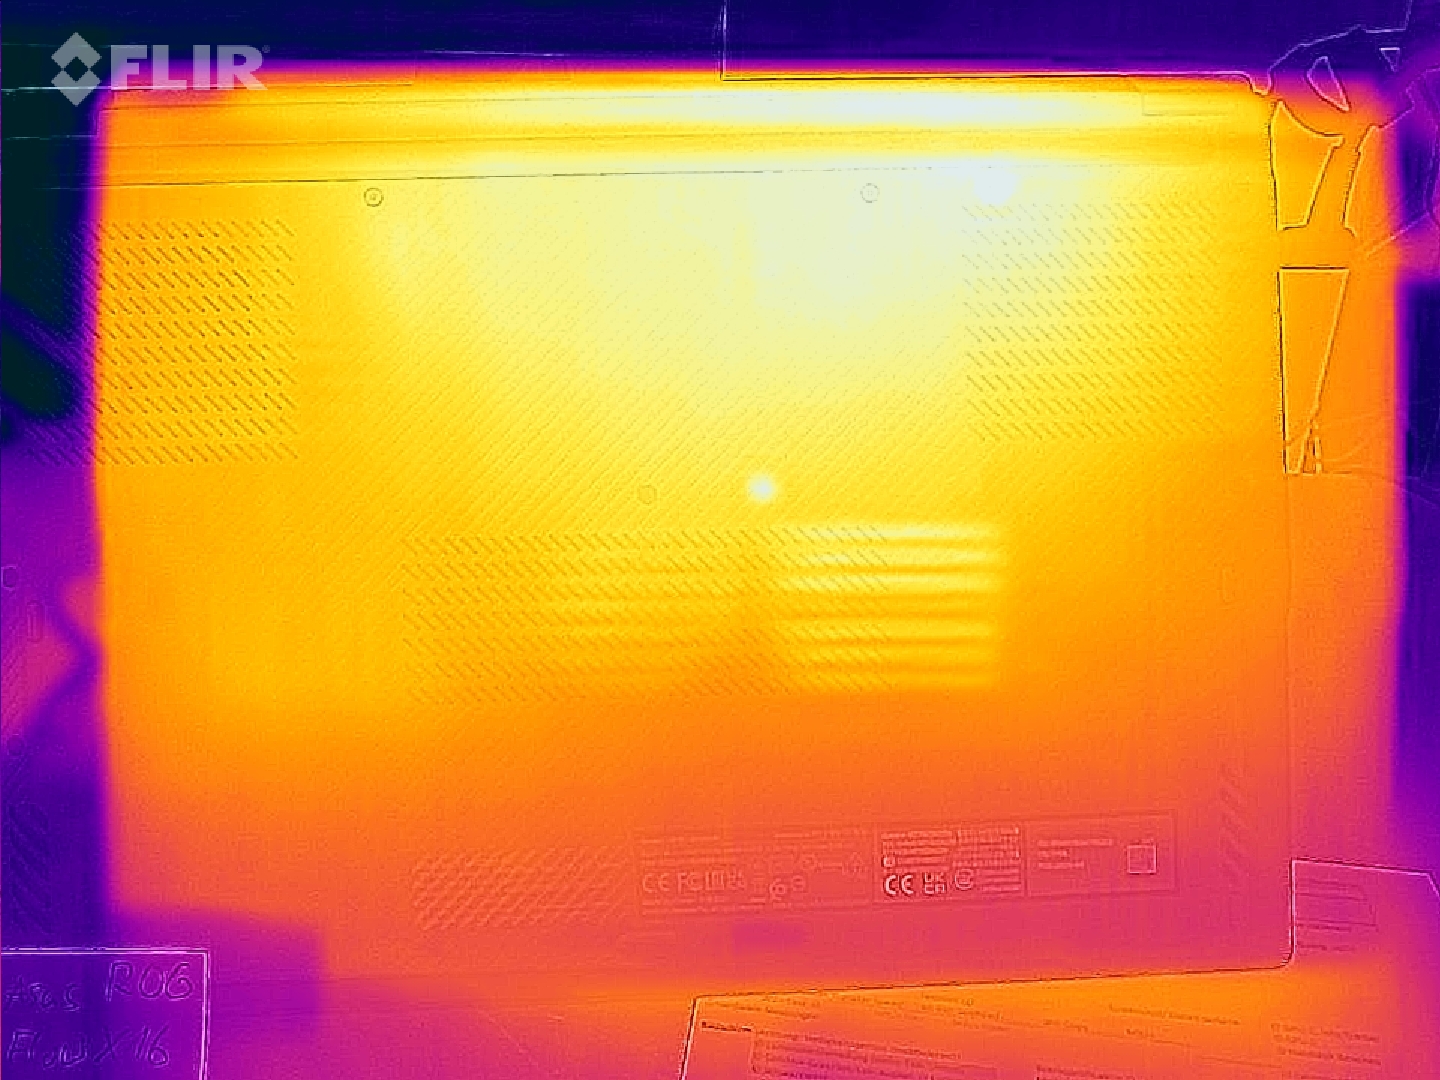
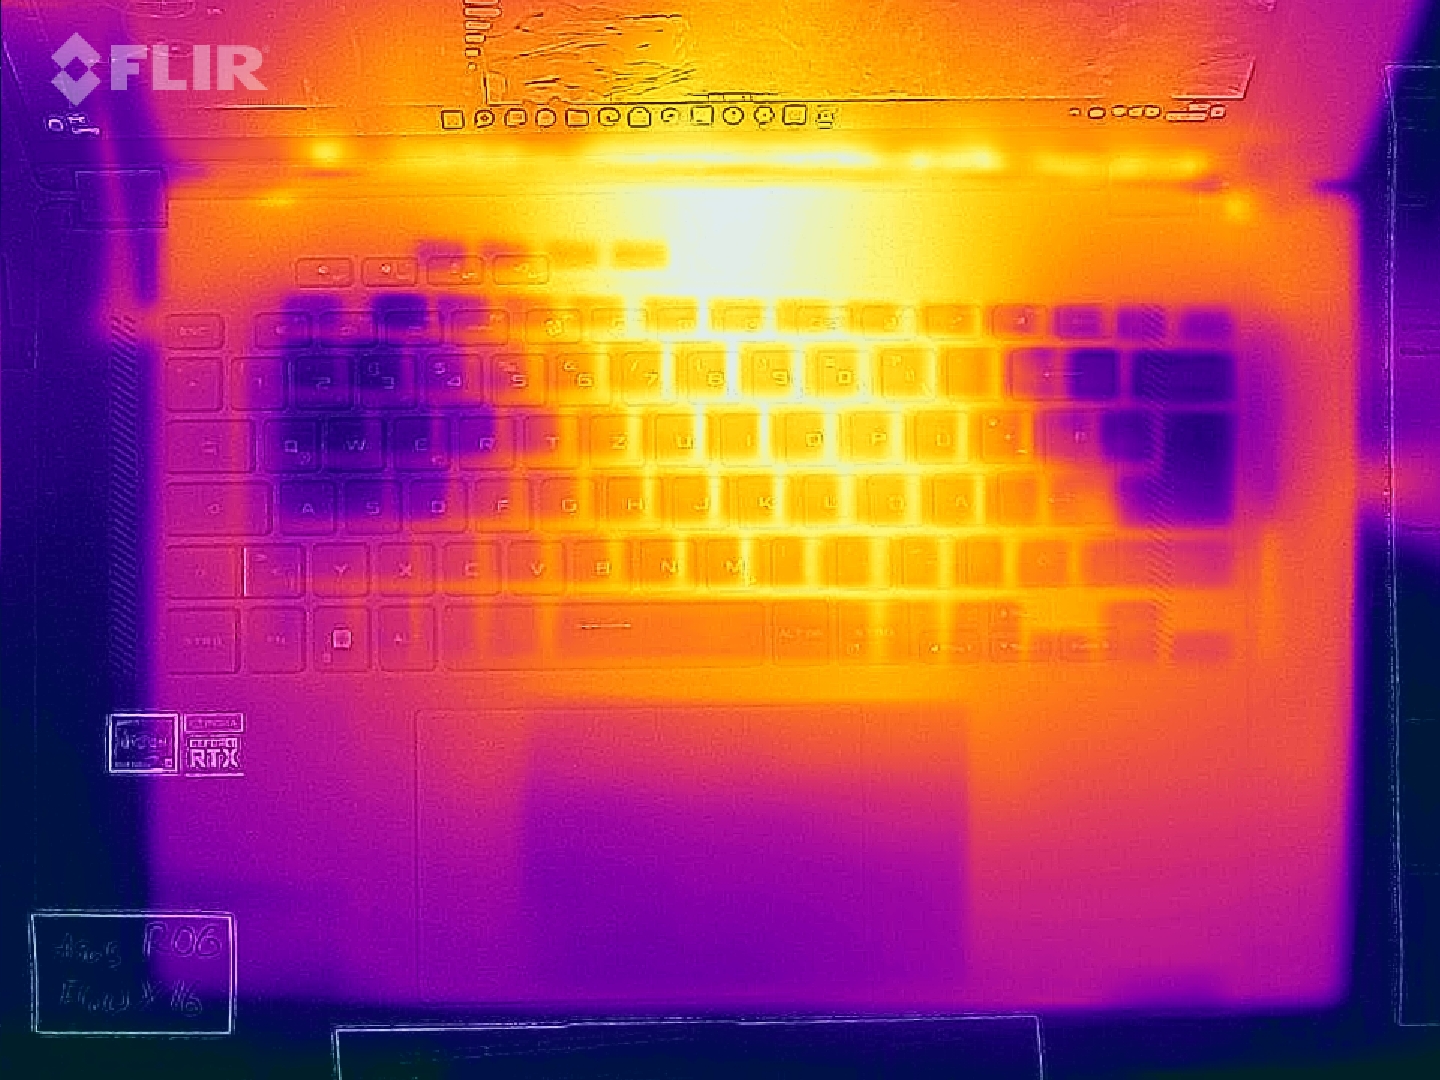
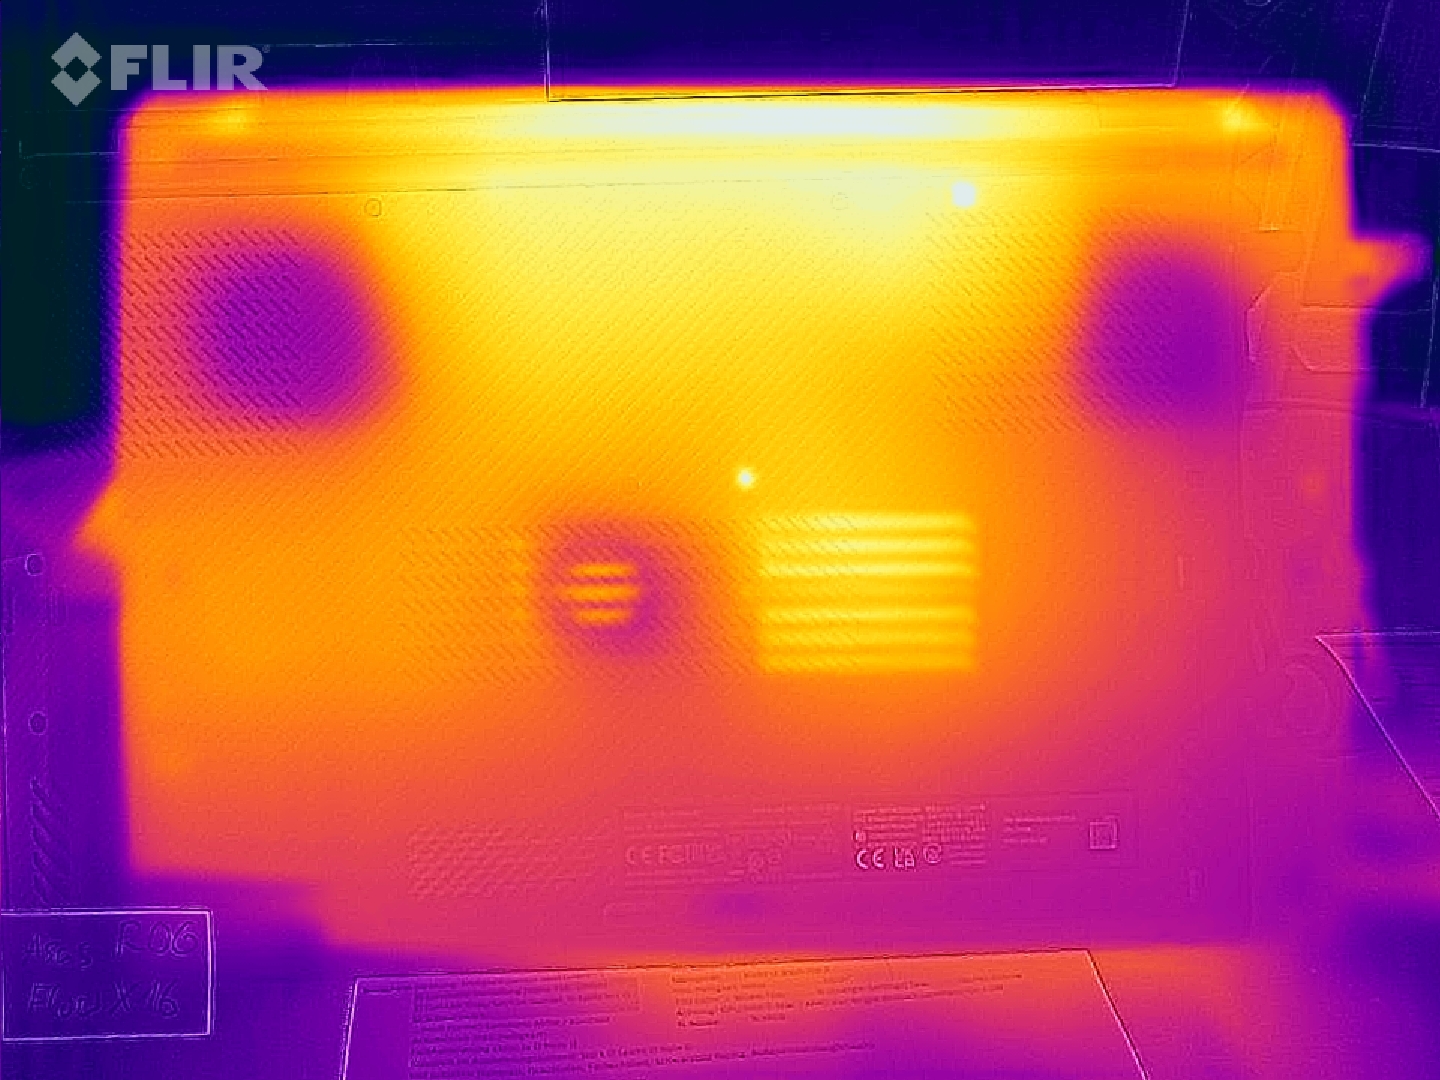
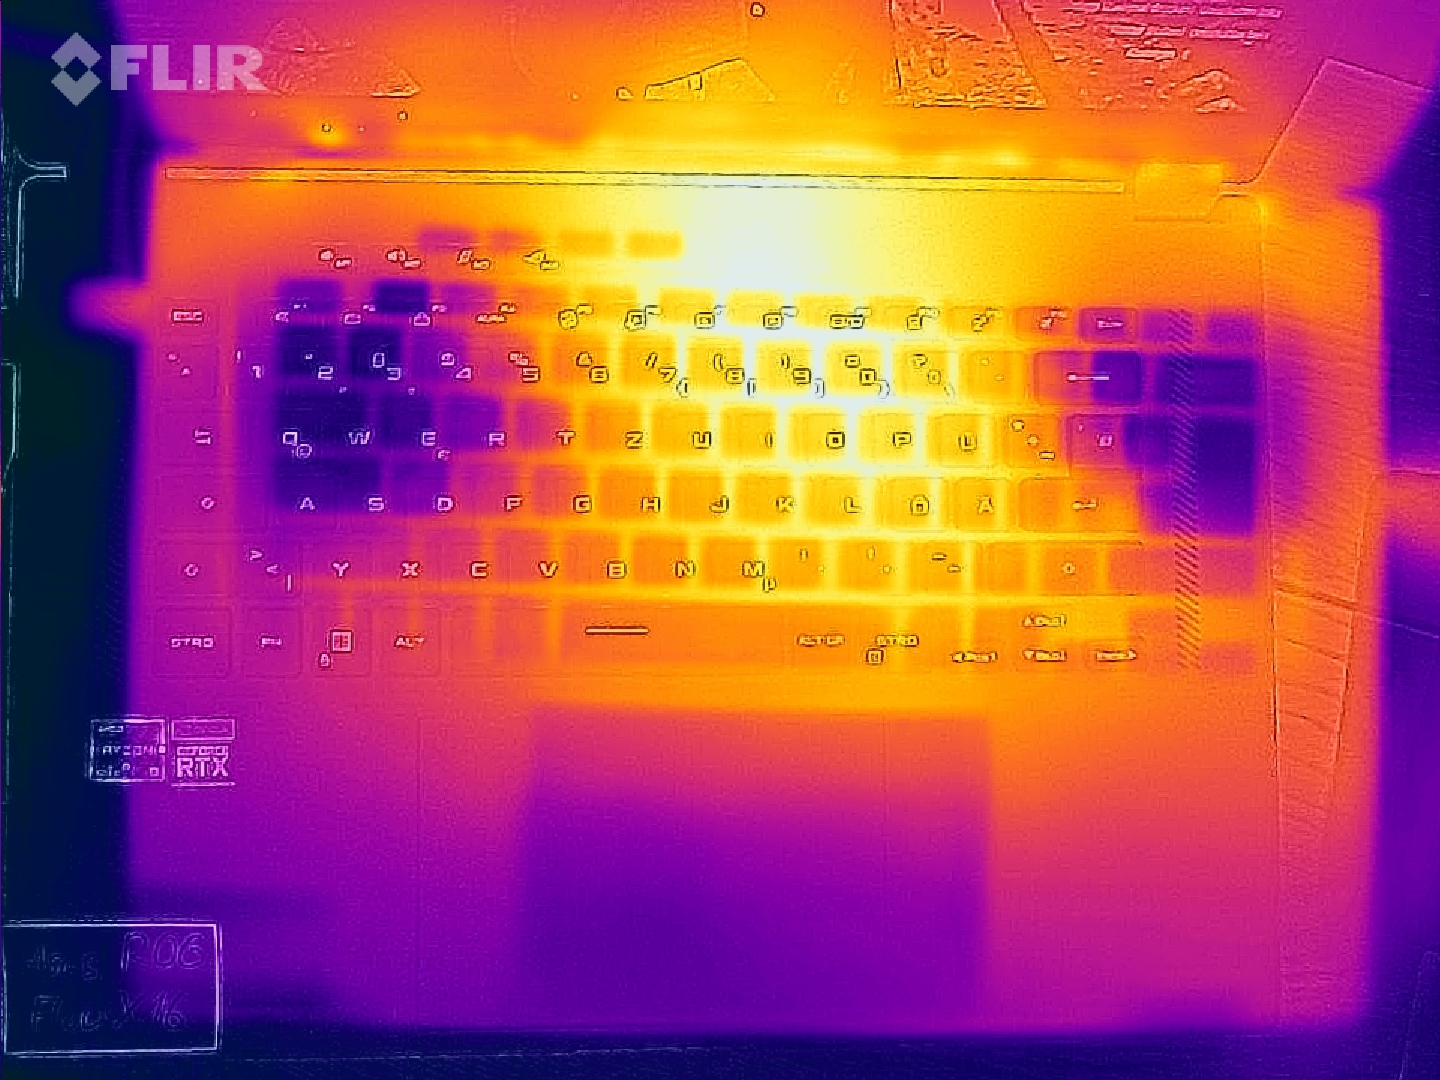
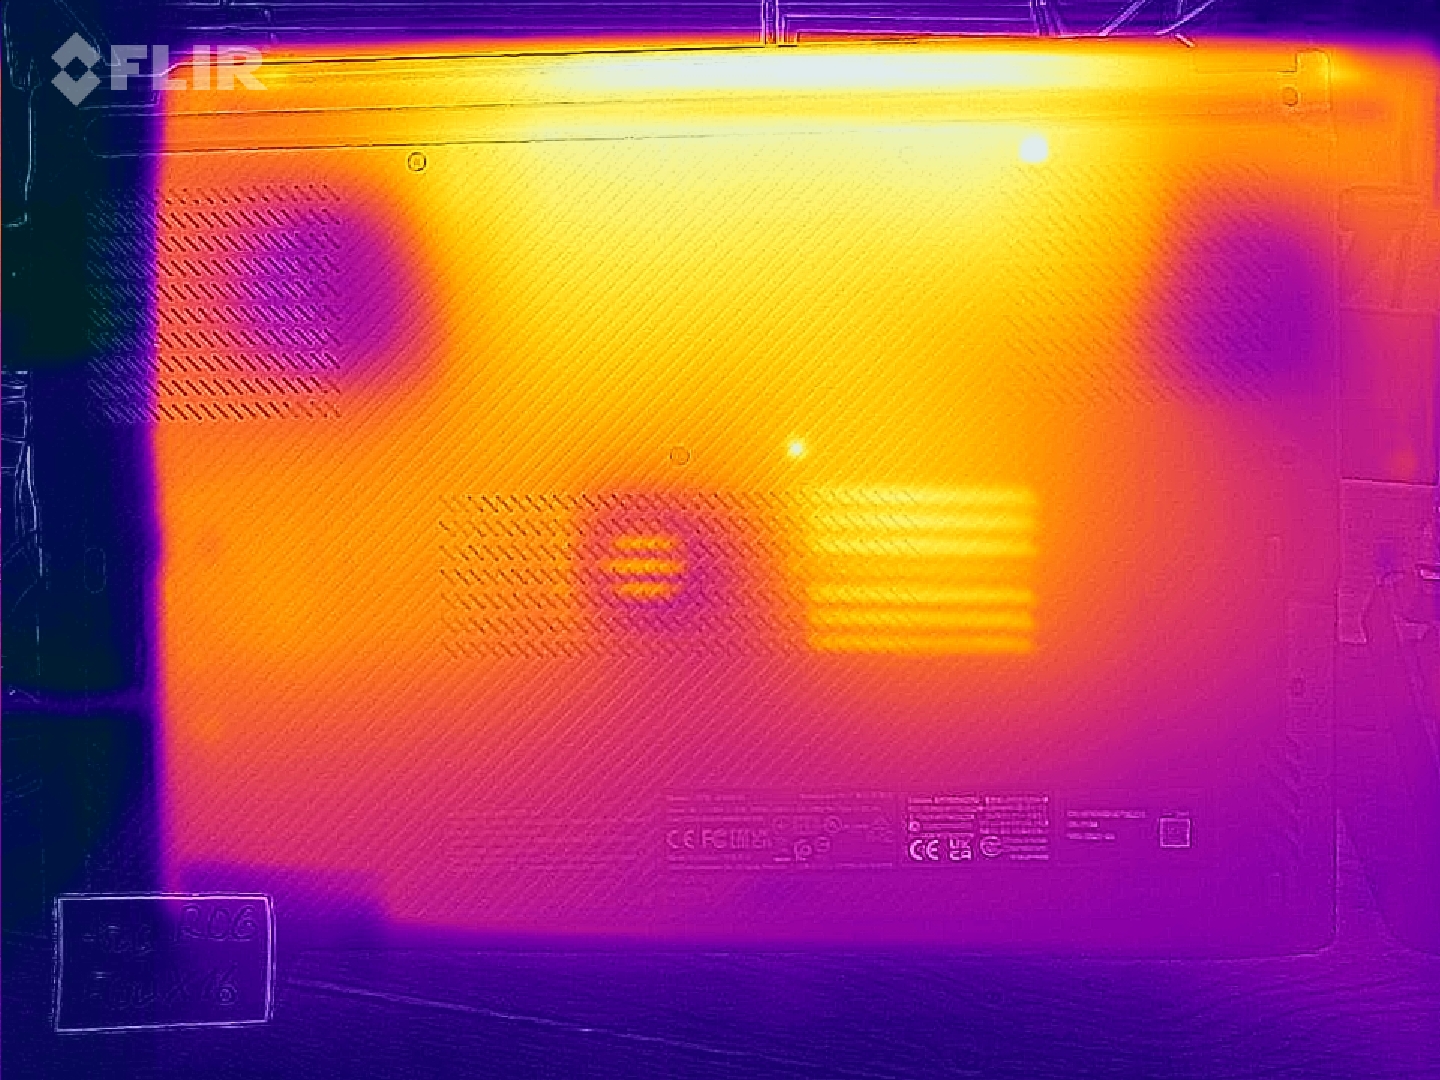
Temperature
Surface temperatures can become quite warm in the center above the keyboard. We measured 55 °C at maximum load and 52.8 °C during gaming. These hotspots remain noticeably cooler when the convertible is propped up at the back so that the fans on the underside have a better supply of air. Similarly thin notebooks with powerful hardware heat up similarly under load (Stealth GS66, Aero 16 und ThinkPad X1 Extreme).
The display can also warm up during long periods of HDR content display at maximum brightness (due to the high power consumption), but not to a degree that is bothersome.
(-) The maximum temperature on the upper side is 55.1 °C / 131 F, compared to the average of 40.4 °C / 105 F, ranging from 21.2 to 68.8 °C for the class Gaming.
(-) The bottom heats up to a maximum of 50.3 °C / 123 F, compared to the average of 43.3 °C / 110 F
(±) In idle usage, the average temperature for the upper side is 32.8 °C / 91 F, compared to the device average of 33.9 °C / 93 F.
(-) Playing The Witcher 3, the average temperature for the upper side is 40.5 °C / 105 F, compared to the device average of 33.9 °C / 93 F.
(-) The palmrests and touchpad can get very hot to the touch with a maximum of 40.8 °C / 105.4 F.
(-) The average temperature of the palmrest area of similar devices was 28.8 °C / 83.8 F (-12 °C / -21.6 F).
| Asus ROG Flow X16 GV601RW-M5082W AMD Ryzen 9 6900HS, NVIDIA GeForce RTX 3070 Ti Laptop GPU | Asus ROG Strix Scar 15 G533ZW-LN106WS Intel Core i9-12900H, NVIDIA GeForce RTX 3070 Ti Laptop GPU | Gigabyte Aero 16 YE5 Intel Core i9-12900HK, NVIDIA GeForce RTX 3080 Ti Laptop GPU | Lenovo Legion 5 Pro 16 G7 i7 RTX 3070Ti Intel Core i7-12700H, NVIDIA GeForce RTX 3070 Ti Laptop GPU | MSI Stealth GS66 12UGS Intel Core i7-12700H, NVIDIA GeForce RTX 3070 Ti Laptop GPU | Apple MacBook Pro 16 2021 M1 Pro Apple M1 Pro, Apple M1 Pro 16-Core GPU | Lenovo ThinkPad X1 Extreme G4-20Y50040GE Intel Core i9-11950H, NVIDIA GeForce RTX 3080 Laptop GPU | Dell XPS 17 9720 RTX 3060 Intel Core i7-12700H, NVIDIA GeForce RTX 3060 Laptop GPU | Microsoft Surface Laptop Studio i7 RTX 3050 Ti Intel Core i7-11370H, NVIDIA GeForce RTX 3050 Ti Laptop GPU | |
|---|---|---|---|---|---|---|---|---|---|
| Heat | 3% | 5% | 7% | 9% | 29% | 10% | 7% | 29% | |
| Maximum Upper Side * (°C) | 55.1 | 42.6 23% | 49 11% | 45.3 18% | 54 2% | 41 26% | 51.4 7% | 51.8 6% | 42.3 23% |
| Maximum Bottom * (°C) | 50.3 | 50.2 -0% | 55 -9% | 61.2 -22% | 59 -17% | 39 22% | 55.9 -11% | 44.2 12% | 38.2 24% |
| Idle Upper Side * (°C) | 35.5 | 36.2 -2% | 33 7% | 28.6 19% | 26 27% | 24 32% | 27.2 23% | 34.8 2% | 23.4 34% |
| Idle Bottom * (°C) | 36.1 | 40.2 -11% | 33 9% | 31.4 13% | 27 25% | 24 34% | 28.8 20% | 33.2 8% | 23.5 35% |
* ... smaller is better
Stress Test
Under pure CPU stress, the Ryzen 9 6900HS still clocks at 3.9 GHz and the temperature remains around 90 °C. Under combined stress (Prime95 + FurMark), the clock remains at 3 GHz, which is 300 MHz below the base clock. The GPU alternates between 800 MHz and 1.4 GHz, while the RTX 3070 Ti clocks at 1.5 GHz in the Witcher 3 stress test. Its temperature is well under 90 °C in every scenario.
| CPU Clock (GHz) | GPU Clock (MHz) | CPU Temperature (°C) | GPU Temperature (°C) | CPU Power Draw (W) | GPU Power Draw (W) | Combined Power Draw (W) | |
| System Idle | 0.07 | 0.2 | 43 | 39 | 7,5 | 13 | 20,5 |
| Prime95 Stress | 3,9 | - | 87 | -- | 75 | - | 75 |
| Prime95 + FurMark Stress | 3 | 800 - 1.400 | 87 | 81 | 40 | 100 | 140 |
| FurMark Stress | 0,2 | 1.150 | 75 | 83 | 20 | 120 | 140 |
| Witcher 3 Stress | 0,75 | 1.500 | 70 | 74 | 15 | 125 | 140 |
Speakers
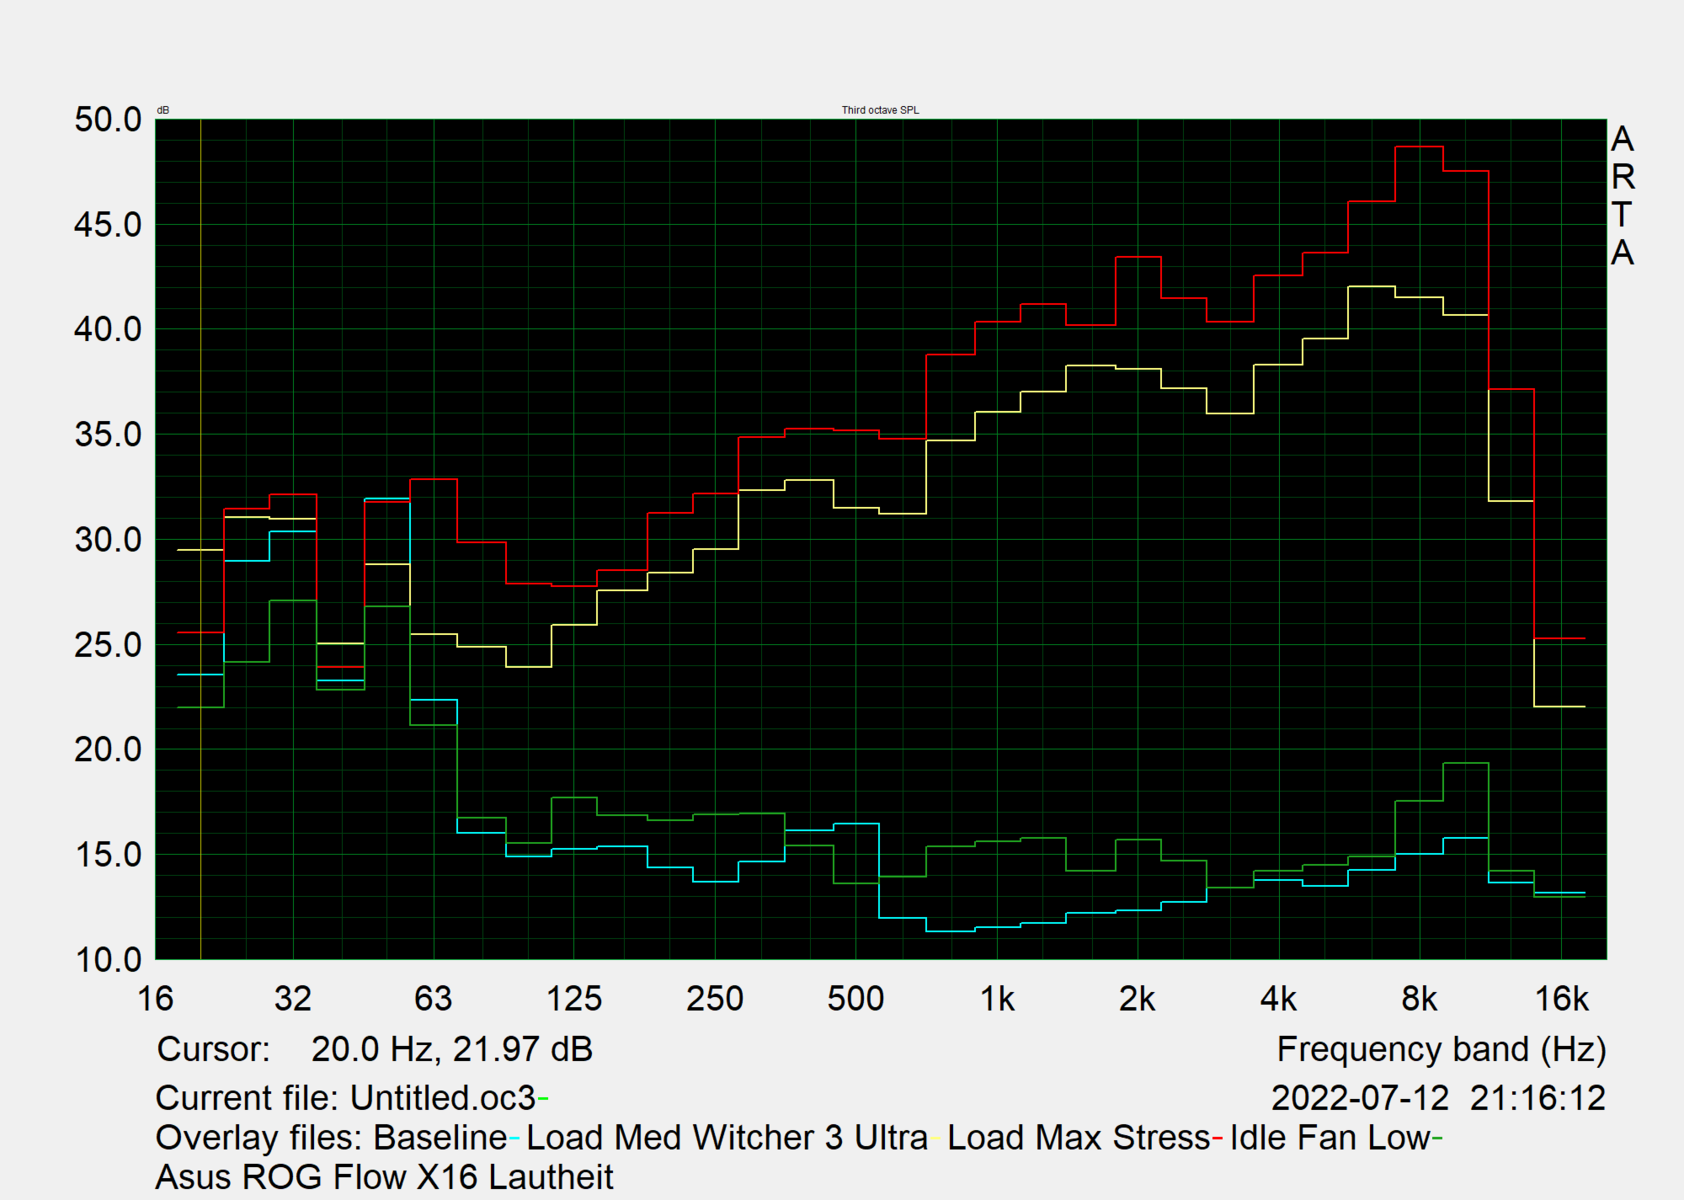
Asus basically uses the same sound system as in the Zephyrus M16 and the ROG Strix G15, which means there are four woofers, but the two additional tweeters are missing. The speakers produce a maximum sound pressure of 80.7 db(A), which is decent for a laptop, but not sufficient for gaming with loud fans.
Bass is only lacking to a small degree, the mids are very balanced, and the trebles overshoot a little. Subjectively, not many laptops give better sound quality; according to our database, only 6% of all reviewed devices can do better.
Asus ROG Flow X16 GV601RW-M5082W audio analysis
(±) | speaker loudness is average but good (80.7 dB)
Bass 100 - 315 Hz
(±) | reduced bass - on average 12.7% lower than median
(±) | linearity of bass is average (13.8% delta to prev. frequency)
Mids 400 - 2000 Hz
(+) | balanced mids - only 1.3% away from median
(+) | mids are linear (4.7% delta to prev. frequency)
Highs 2 - 16 kHz
(±) | higher highs - on average 6.4% higher than median
(+) | highs are linear (6.8% delta to prev. frequency)
Overall 100 - 16.000 Hz
(+) | overall sound is linear (12.9% difference to median)
Compared to same class
» 17% of all tested devices in this class were better, 4% similar, 79% worse
» The best had a delta of 6%, average was 18%, worst was 132%
Compared to all devices tested
» 12% of all tested devices were better, 3% similar, 86% worse
» The best had a delta of 4%, average was 24%, worst was 134%
Apple MacBook Pro 16 2021 M1 Pro audio analysis
(+) | speakers can play relatively loud (84.7 dB)
Bass 100 - 315 Hz
(+) | good bass - only 3.8% away from median
(+) | bass is linear (5.2% delta to prev. frequency)
Mids 400 - 2000 Hz
(+) | balanced mids - only 1.3% away from median
(+) | mids are linear (2.1% delta to prev. frequency)
Highs 2 - 16 kHz
(+) | balanced highs - only 1.9% away from median
(+) | highs are linear (2.7% delta to prev. frequency)
Overall 100 - 16.000 Hz
(+) | overall sound is linear (4.6% difference to median)
Compared to same class
» 0% of all tested devices in this class were better, 0% similar, 100% worse
» The best had a delta of 5%, average was 17%, worst was 45%
Compared to all devices tested
» 0% of all tested devices were better, 0% similar, 100% worse
» The best had a delta of 4%, average was 24%, worst was 134%
Energy Management - Unusually elevated idle values
Power Consumption
While idling, 12.2 watts are required in Silent + GPU Energy Saving mode. In Quiet + GPU Balanced mode, the system needs a full 25.5 watts and just under 30 watts in Turbo mode. These are unusually elevated values, even for a gaming laptop, which may be partly due to the mini-LED display.
The Scar 15, Legion 5 Pro and MSI Stealth GS66 all require significantly less power when idling. OLED laptops, on the other hand, share the high idle values of the ROG Flow X16.
Since the CPU and GPU together require around 140 watts in The Witcher 3, this leaves 43 watts remaining for the rest of the system. The maximum stress test initially demands 253 watts from the 240-watt power adapter. However, the value drops sharply after just a few seconds and settles at an acceptable 217 watts after one minute.
| Off / Standby | |
| Idle | |
| Load |
|
Key:
min: | |
| Asus ROG Flow X16 GV601RW-M5082W R9 6900HS, GeForce RTX 3070 Ti Laptop GPU, Micron 3400 1TB MTFDKBA1T0TFH, Mini LED, 2560x1600, 16.1" | Asus ROG Zephyrus M16 GU603H i9-11900H, GeForce RTX 3070 Laptop GPU, Samsung PM9A1 MZVL22T0HBLB, IPS, 2560x1600, 16" | Asus ROG Strix Scar 15 G533ZW-LN106WS i9-12900H, GeForce RTX 3070 Ti Laptop GPU, Samsung PM9A1 MZVL22T0HBLB, IPS-level, 2560x1440, 15.6" | Gigabyte Aero 16 YE5 i9-12900HK, GeForce RTX 3080 Ti Laptop GPU, Phison ESR01TBMFCT, AMOLED, 3840x2400, 16" | Lenovo Legion 5 Pro 16 G7 i7 RTX 3070Ti i7-12700H, GeForce RTX 3070 Ti Laptop GPU, Samsung PM9A1 MZVL21T0HCLR, IPS, 2560x1600, 16" | MSI Stealth GS66 12UGS i7-12700H, GeForce RTX 3070 Ti Laptop GPU, WDC PC SN810 1TB, IPS-Level, 2560x1440, 15.6" | Apple MacBook Pro 16 2021 M1 Pro M1 Pro, M1 Pro 16-Core GPU, Apple SSD AP1024R, Mini-LED, 3456x2234, 16.2" | Lenovo ThinkPad X1 Extreme G4-20Y50040GE i9-11950H, GeForce RTX 3080 Laptop GPU, Kioxia XG7 KXG7AZNV1T02, IPS, 3840x2400, 16" | Dell XPS 17 9720 RTX 3060 i7-12700H, GeForce RTX 3060 Laptop GPU, Samsung PM9A1 MZVL21T0HCLR, IPS, 3840x2400, 17" | Average NVIDIA GeForce RTX 3070 Ti Laptop GPU | Average of class Gaming | |
|---|---|---|---|---|---|---|---|---|---|---|---|
| Power Consumption | 18% | 24% | -19% | 17% | 23% | 56% | 27% | 37% | 10% | 12% | |
| Idle Minimum * (Watt) | 12.2 | 11 10% | 7.56 38% | 26 -113% | 8.6 30% | 11 10% | 5 59% | 12.3 -1% | 5.9 52% | 14.2 ? -16% | 13.5 ? -11% |
| Idle Average * (Watt) | 25.5 | 20 22% | 13.5 47% | 30 -18% | 17.6 31% | 16 37% | 15.1 41% | 22.8 11% | 15.8 38% | 19.9 ? 22% | 19.3 ? 24% |
| Idle Maximum * (Watt) | 29.8 | 30 -1% | 16.87 43% | 37 -24% | 18.5 38% | 23 23% | 15.5 48% | 13.9 53% | 26.7 10% | 26.2 ? 12% | 25.8 ? 13% |
| Load Average * (Watt) | 183 | 111 39% | 128.9 30% | 127 31% | 110 40% | 110 40% | 54 70% | 95.4 48% | 117.4 36% | 125.8 ? 31% | 110.9 ? 39% |
| Witcher 3 ultra * (Watt) | 183.6 | 156 15% | 196.2 -7% | 176 4% | 227 -24% | 151 18% | 154 16% | 114.8 37% | |||
| Load Maximum * (Watt) | 253 | 197 22% | 274.86 -9% | 236 7% | 294.6 -16% | 230 9% | 90 64% | 170.7 33% | 136.6 46% | 248 ? 2% | 260 ? -3% |
* ... smaller is better
Power consumption Witcher 3 / Stress test
Power consumption with an external monitor
Battery Life
We measured the WLAN battery runtimes with HDR turned off and in Armoury Crate's Balanced mode and in GPU Energy Saving mode (dGPU disabled). The frame rate is automatically set to 60 Hz in battery mode (this feature can be disabled), while brightness was 173 nits during the test. Afterwards we ran a standardized script that calls up web pages at different intervals, scrolls along them where necessary, clicks on links, looks at pictures and animations and whatever people do on websites.
The result is mediocre: a comparison with an identical model without a mini-LED display would be interesting here. Just over 5:39 h is our result (1 hour less at 165 Hz). At full SDR brightness of 500 nits, we lose nearly another 2 hours (3:45 h), while gaming on battery power is over after around 50 minutes.
The roughly identical Zephyrus M16 with the same battery size and a hungrier Intel processor manages over 7 1/2 hours. However, there are plenty of gaming laptops among the competition that do not last 6 hours in the WLAN test, which isn't unusual for this laptop class. Firmware and BIOS updates may improve the Flow X16's battery life. A full recharge of the 90 Wh battery takes an hour and a half.
Apple's MacBook Pro 16 stands out with almost 17 hours of battery life, which is even more impressive when you consider that it also sports a mini-LED display.
| Asus ROG Flow X16 GV601RW-M5082W R9 6900HS, GeForce RTX 3070 Ti Laptop GPU, 90 Wh | Asus ROG Zephyrus M16 GU603H i9-11900H, GeForce RTX 3070 Laptop GPU, 90 Wh | Asus ROG Strix Scar 15 G533ZW-LN106WS i9-12900H, GeForce RTX 3070 Ti Laptop GPU, 90 Wh | Gigabyte Aero 16 YE5 i9-12900HK, GeForce RTX 3080 Ti Laptop GPU, 99 Wh | Lenovo Legion 5 Pro 16 G7 i7 RTX 3070Ti i7-12700H, GeForce RTX 3070 Ti Laptop GPU, 80 Wh | MSI Stealth GS66 12UGS i7-12700H, GeForce RTX 3070 Ti Laptop GPU, 99.9 Wh | Apple MacBook Pro 16 2021 M1 Pro M1 Pro, M1 Pro 16-Core GPU, 99.6 Wh | Lenovo ThinkPad X1 Extreme G4-20Y50040GE i9-11950H, GeForce RTX 3080 Laptop GPU, 90 Wh | Dell XPS 17 9720 RTX 3060 i7-12700H, GeForce RTX 3060 Laptop GPU, 97 Wh | Asus ROG Flow X13 GV301QH R9 5980HS, GeForce GTX 1650 Max-Q, 62 Wh | Average of class Gaming | |
|---|---|---|---|---|---|---|---|---|---|---|---|
| Battery runtime | 57% | 27% | 45% | -19% | 37% | 196% | 21% | 32% | 51% | 28% | |
| WiFi v1.3 (h) | 5.7 | 7.7 35% | 8.4 47% | 6.4 12% | 5.4 -5% | 5.4 -5% | 16.9 196% | 6.8 19% | 8.7 53% | 5.8 2% | 6.79 ? 19% |
| Witcher 3 ultra (h) | 0.9 | 1.2 33% | 0.958 ? 6% | ||||||||
| Load (h) | 0.9 | 1.6 78% | 0.9 0% | 1.6 78% | 0.6 -33% | 1.6 78% | 1.1 22% | 1 11% | 1.8 100% | 1.43 ? 59% | |
| Reader / Idle (h) | 13.3 | 8.9 | 7.8 | 10.4 | 9.62 ? | ||||||
| H.264 (h) | 8.5 | 7.5 | 6.3 | 17.5 | 6.9 | 6.9 | 8.1 ? |
Pros
Cons
Verdict - Asus ROG Flow X16: Successful gaming convertible

Asus manages to create a full-fledged hybrid of gaming laptop and multimedia convertible in the form of the ROG Flow X16. Temperatures and noise levels remain within limits despite the compact design thanks to a special cooling design. This also allows the use of a GeForce RTX 3070 Ti with 125 W of TGP, while many multimedia laptops in the upper class, such as the Dell XPS 17 or the Gigabyte Aero 16, have to make do with 80 to 105 watts.
Consequently, the performance of the Flow X16 is good, which is helped by the existing MUX switch. AMD's frugal Ryzen 9 6900HS also provides sufficient power, which remains highly accessible even in battery mode, unlike many Intel counterparts.
Another essential factor for gaming and creative tasks is the display and Asus could not have done much better here, as mini-LED screens are among the best of their kind and are superior to equally high-contrast OLED displays in terms of brightness, even if this cannot be fully utilized on battery power. Still, the DisplayHDR 1000 makes the corresponding content (e.g. when gaming) incredibly beautiful to look at and also improves contrast and black values in desktop mode (512 local dimming zones are activated). The near 100% coverage of the DCI-P3 color space of a well-calibrated QHD panel in delivery state is a guaranteed boon for professional image editing, while the slight blooming effect is only slightly bothersome.
The 360° hinges are also advantageous for situations such as gaming in tent mode with a controller or when you are on the go, provided you do not intend to do so for more than several hours at a time. Added to this are the good speakers and the possibilities of upgrading to 64 GB of DDR5 RAM and installing a second SSD. The workmanship is at a high level and the input devices are good, even if some would prefer the quiet keyboard with its generous 1.7 mm travel to be crisper, while others would have liked the RGB lighting to be individually programmable.
The ROG Flow X16 convinces as a unique 2-in-1 gamer with its high performance, a well-thought-out cooling system and the bright mini-LED display - not only in games, but in all multimedia tasks. The battery life is our main point of criticism.
USB 4 is missing, but Asus' xGM port gives hope for more powerful eGPUs in the future. We would have also liked a LAN port as well as a fingerprint reader, a full-size SD card reader and a 1080p webcam. You'll also have to live with high power consumption when idling, which can be reduced with Asus' energy-saving profiles. The battery runtimes are not good, but normal for the device class and could be improved with future updates.
Ultimately, only two aspects stand in the way of a decision: The price of just under US$3,000 (or US$2,000 in the basic configuration without Mini LED and with an RTX 3050 Ti) and the question of what you really need: A classic gamer with maximum TGP, the best response times and the highest possible FPS? Then you would be better off with the MSI Raider GE77 HX. The powerful Legion 5 Pro, is also considerably cheaper at around US$1,900, but less compact and it struggles with higher emissions than the ROG Flow X16.
That said, the GPU performance of the Flow X16 is not available in any other notebook with these compact dimensions, not to mention the 2-in-1 functionality. For those who can do without Windows and thus most games, the MacBook Pro 16 with its M1 SoC offers numerous advantages such as very long battery runtimes, mostly-silent operation and a very good mini-LED display.
Price and Availability
Our review sample (GV601RW-M5082W) with Ryzen 9 6900HS, 32 GB RAM, 1 TB SSD, RTX 3070 Ti and mini-LED display is a pre-release model intended for the German-speaking market, where it is not yet available.
Other models in varying configurations are already available in some countries. For example, a near-identical configuration (with 16GB RAM instead of 32) is available in the USA for US$2,699.99. A completely identical configuration is available in the UK via Amazon, but is currently listed as out of stock. India lists two models with different configurations at different prices. Australia, for its part, offers an identical configuration for AU$4,099.00. Prices and availability at the time of writing (04.08.2022) are subject to change.
The aforementioned examples are not exhaustive: Users are advised to check (where applicable) directly via Asus' Republic of Gamers website. Simply find look for ROG Flow X 16 under Products -> Laptops, then click on Where to buy.
Asus ROG Flow X16 GV601RW-M5082W
- 08/03/2022 v7 (old)
Marvin Gollor
Price comparison

