 Deutsch
 English
 Español
 Français
 Italiano
 Nederlands
 Polski
 Português
 Русский
 Türkçe
 Svenska
 Chinese
 Magyar
Schenker XMG Pro 17 E22 review: Gaming laptop with RTX 3080 Ti delivers the goods
At first glance, Schenker has created a true gaming laptop with the XMG Pro 17 E22. Although the case won't win any design awards, the keyboard shines in any color desired in return. Large air vents and a pretty thick case allow sufficient cooling for the Intel Alder Lake processors, and the Nvidia GeForce RTX 3070 Ti or 3080 Ti, in order to ensure the high power supply needed for the correspondingly excellent performance rates. For about 2,500 to 3,500 Euros (~$2,557 to ~$3,840), you can configure an ambitious mid-range laptop or if you like, a pretty outstanding high-end laptop like the one we have with the Intel Core i9-12900H, the Nvidia GeForce RTX 3080 Ti, 32 GB of RAM, and a 1 TB SSD.
But there's more. Instead of the typical sRGB display with a suitable QHD resolution, a precalibrated 4K display with coverage of the AdobeRGB color space can also be selected. However, this brings the price closer to 4,000 Euros (~$4,092). Quite a few desktop systems are likely to lag behind in video and image editing or rendering.
Consequently, the competition includes gaming laptops like the Acer Predator Triton 500SE, the Asus ROG Zephyrus Duo 16, and the Alienware x17 R2, as well as the MSI Raider GE77, which is also aimed at creators.
Possible contenders in comparison
Rating | Date | Model | Weight | Height | Size | Resolution | Best Price |
|---|---|---|---|---|---|---|---|
| 85.4 % | 07/2022 | SCHENKER XMG Pro 17 E22 i9-12900H, GeForce RTX 3080 Ti Laptop GPU | 2.8 kg | 27 mm | 17.30" | 2560x1440 | |
| 86.8 % | 07/2022 | MSI Raider GE77 HX 12UHS i9-12900HX, GeForce RTX 3080 Ti Laptop GPU | 3.1 kg | 25.9 mm | 17.30" | 3840x2160 | |
| 87.2 % | 06/2022 | Acer Predator Triton 500 SE PT516-52s-70KX i7-12700H, GeForce RTX 3080 Ti Laptop GPU | 2.3 kg | 19.9 mm | 16.00" | 2560x1600 | |
| 84.7 % | 01/2022 | SCHENKER XMG Pro 17 (Late 2021, RTX 3080) i7-11800H, GeForce RTX 3080 Laptop GPU | 2.4 kg | 19.9 mm | 17.30" | 3840x2160 | |
| 88.2 % | 05/2022 | Asus ROG Zephyrus Duo 16 GX650RX R9 6900HX, GeForce RTX 3080 Ti Laptop GPU | 2.6 kg | 20.5 mm | 16.00" | 3840x2400 | |
| 80.3 % | 06/2022 | MSI Katana GF66 12UGS i7-12700H, GeForce RTX 3070 Ti Laptop GPU | 2.3 kg | 27.5 mm | 15.60" | 1920x1080 | |
| 89.2 % | 05/2022 | Alienware x17 R2 P48E i9-12900HK, GeForce RTX 3080 Ti Laptop GPU | 3.1 kg | 20.9 mm | 17.30" | 1920x1080 |
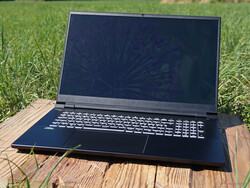
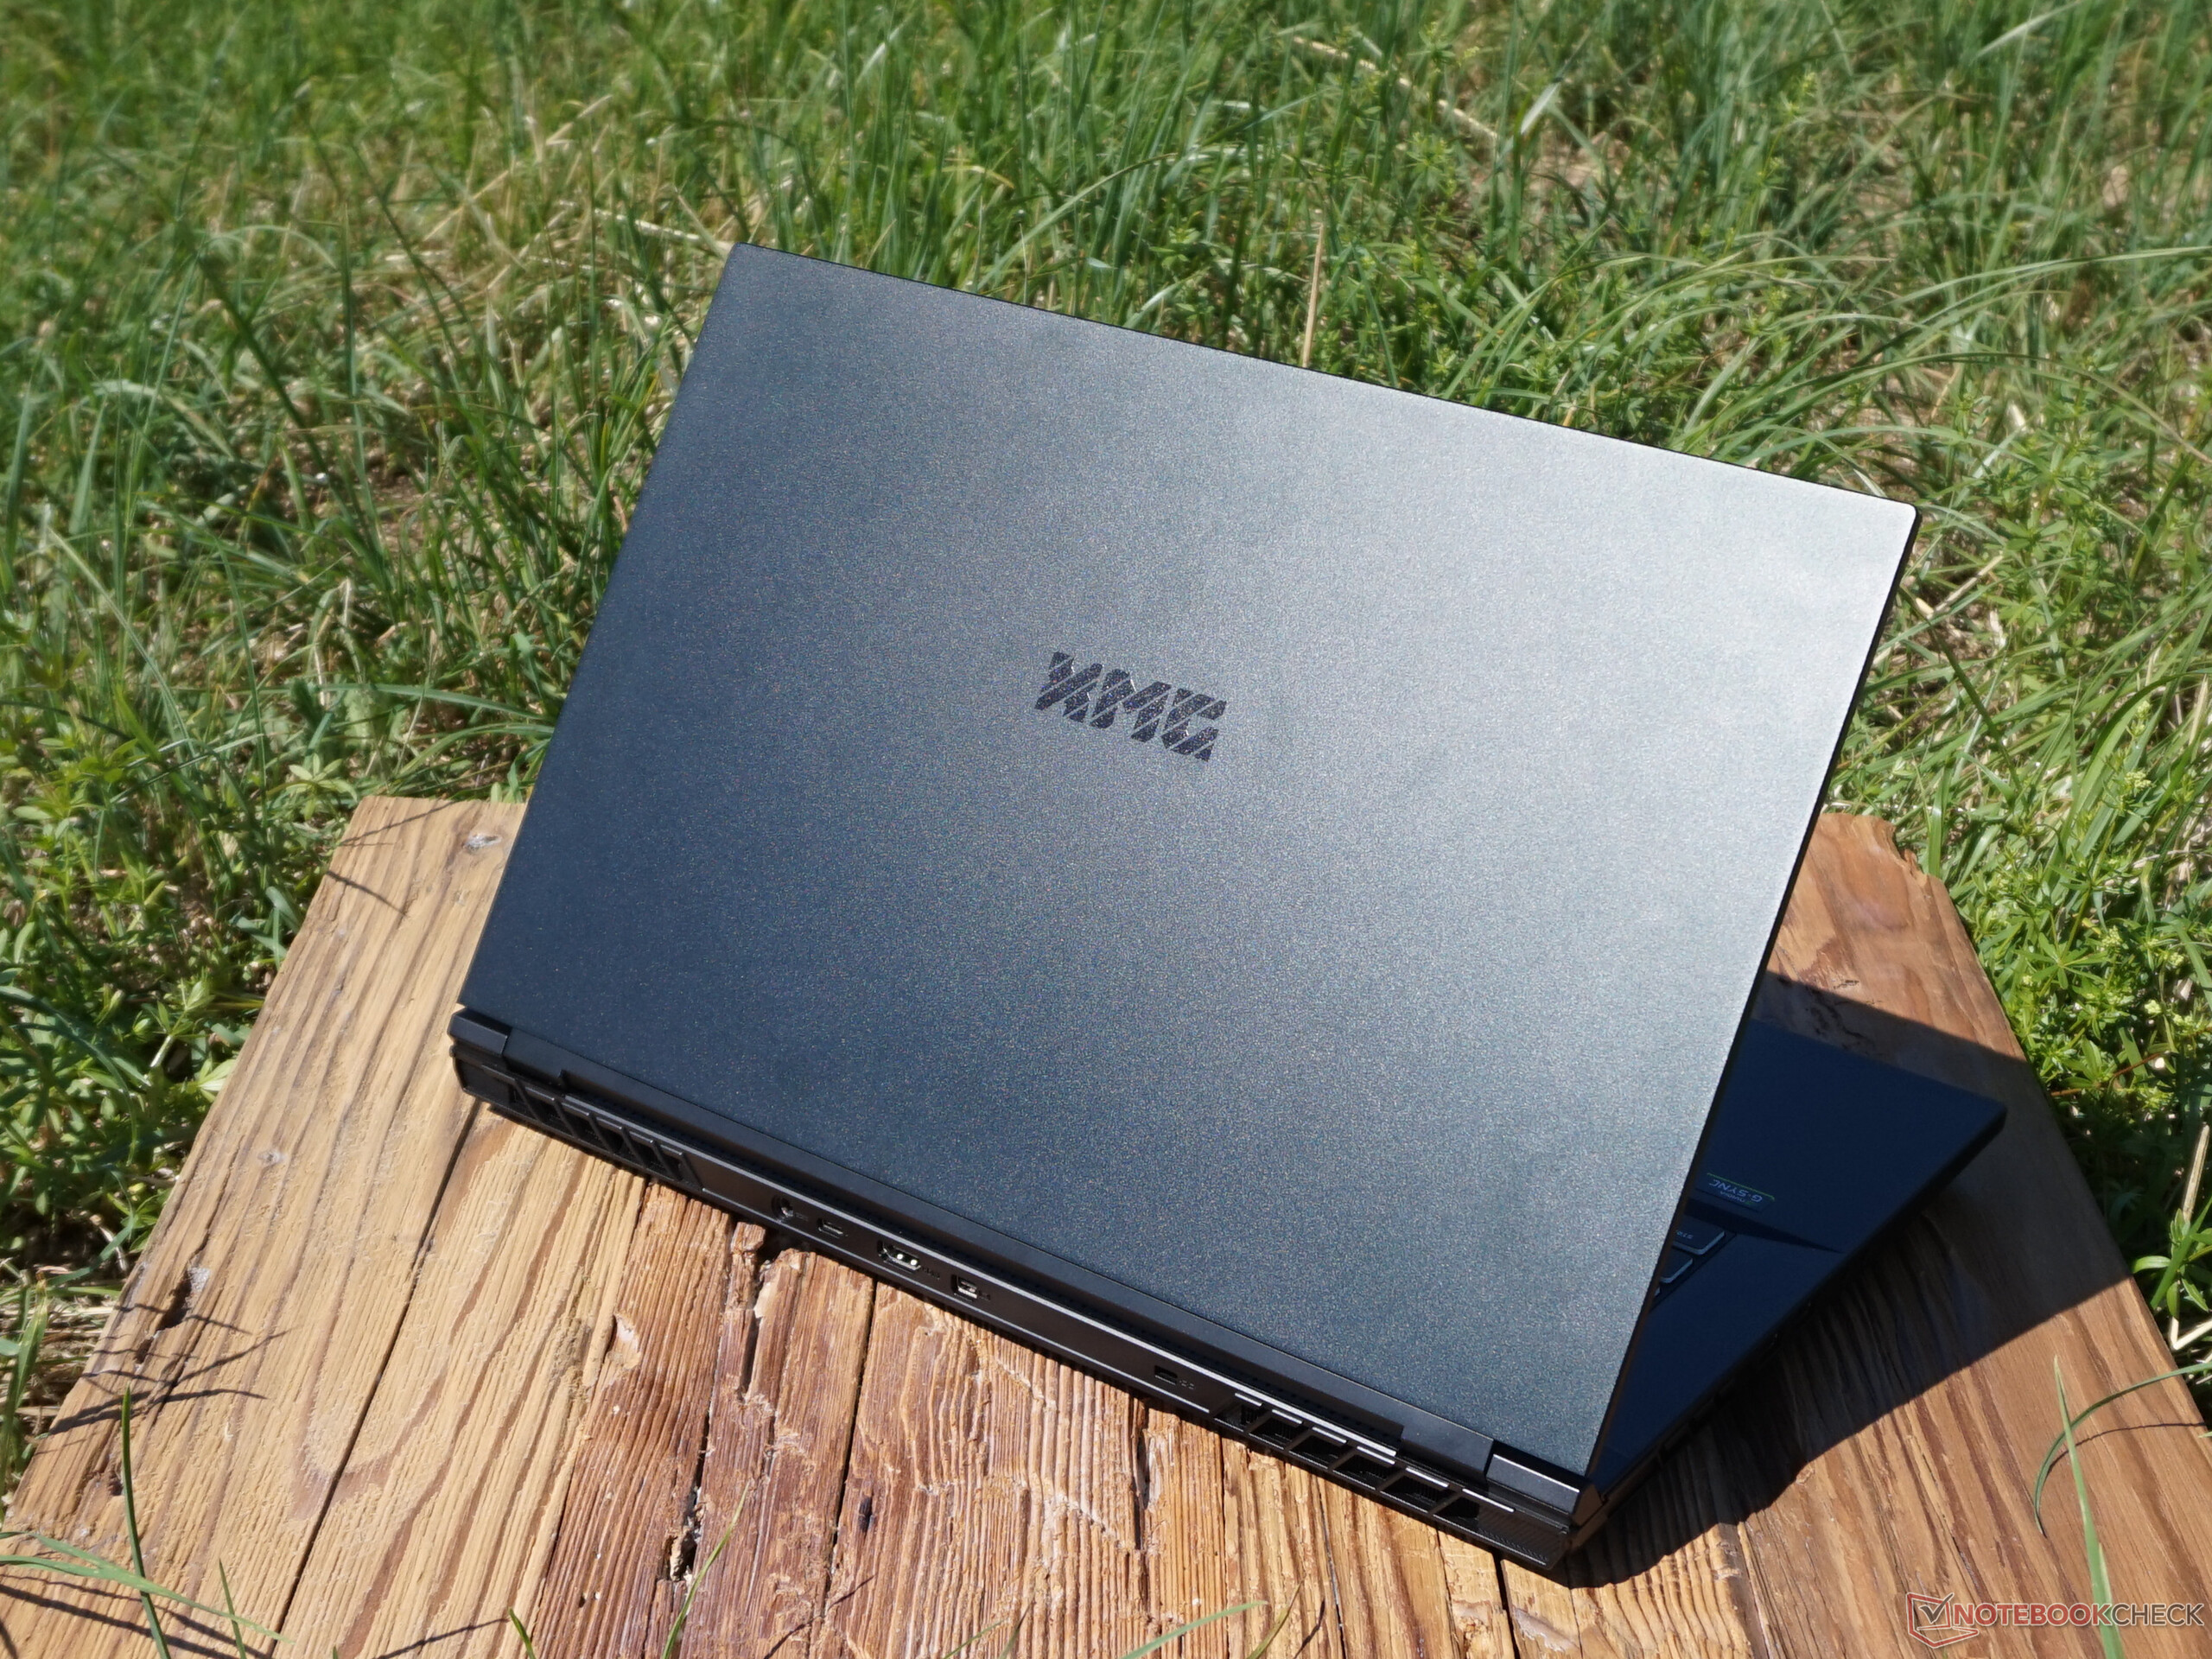
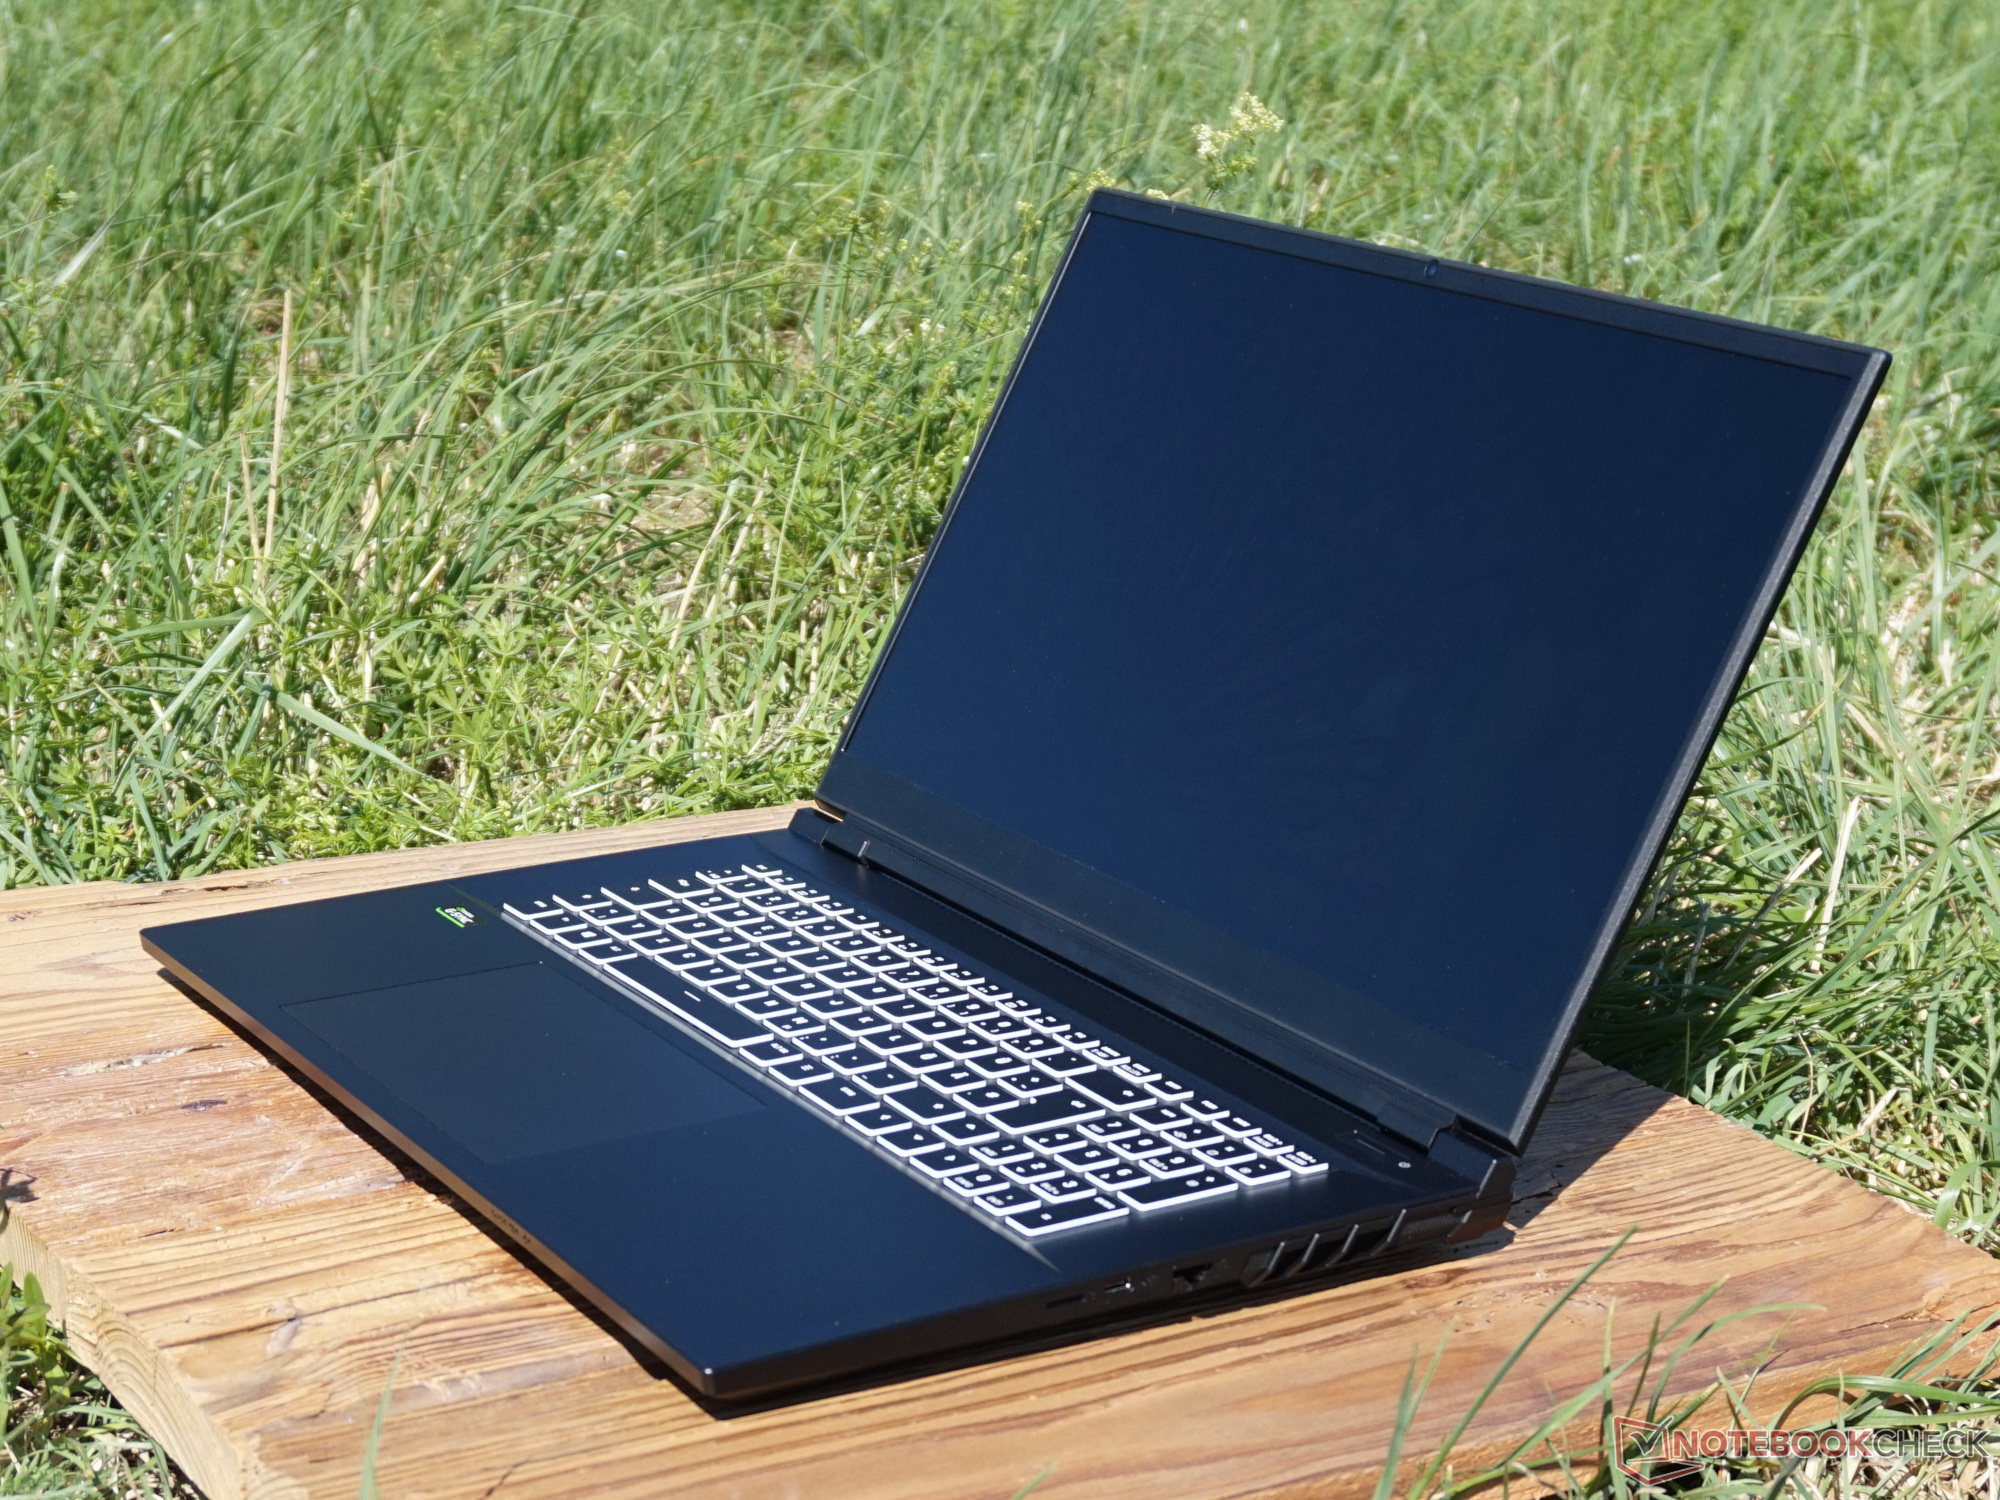
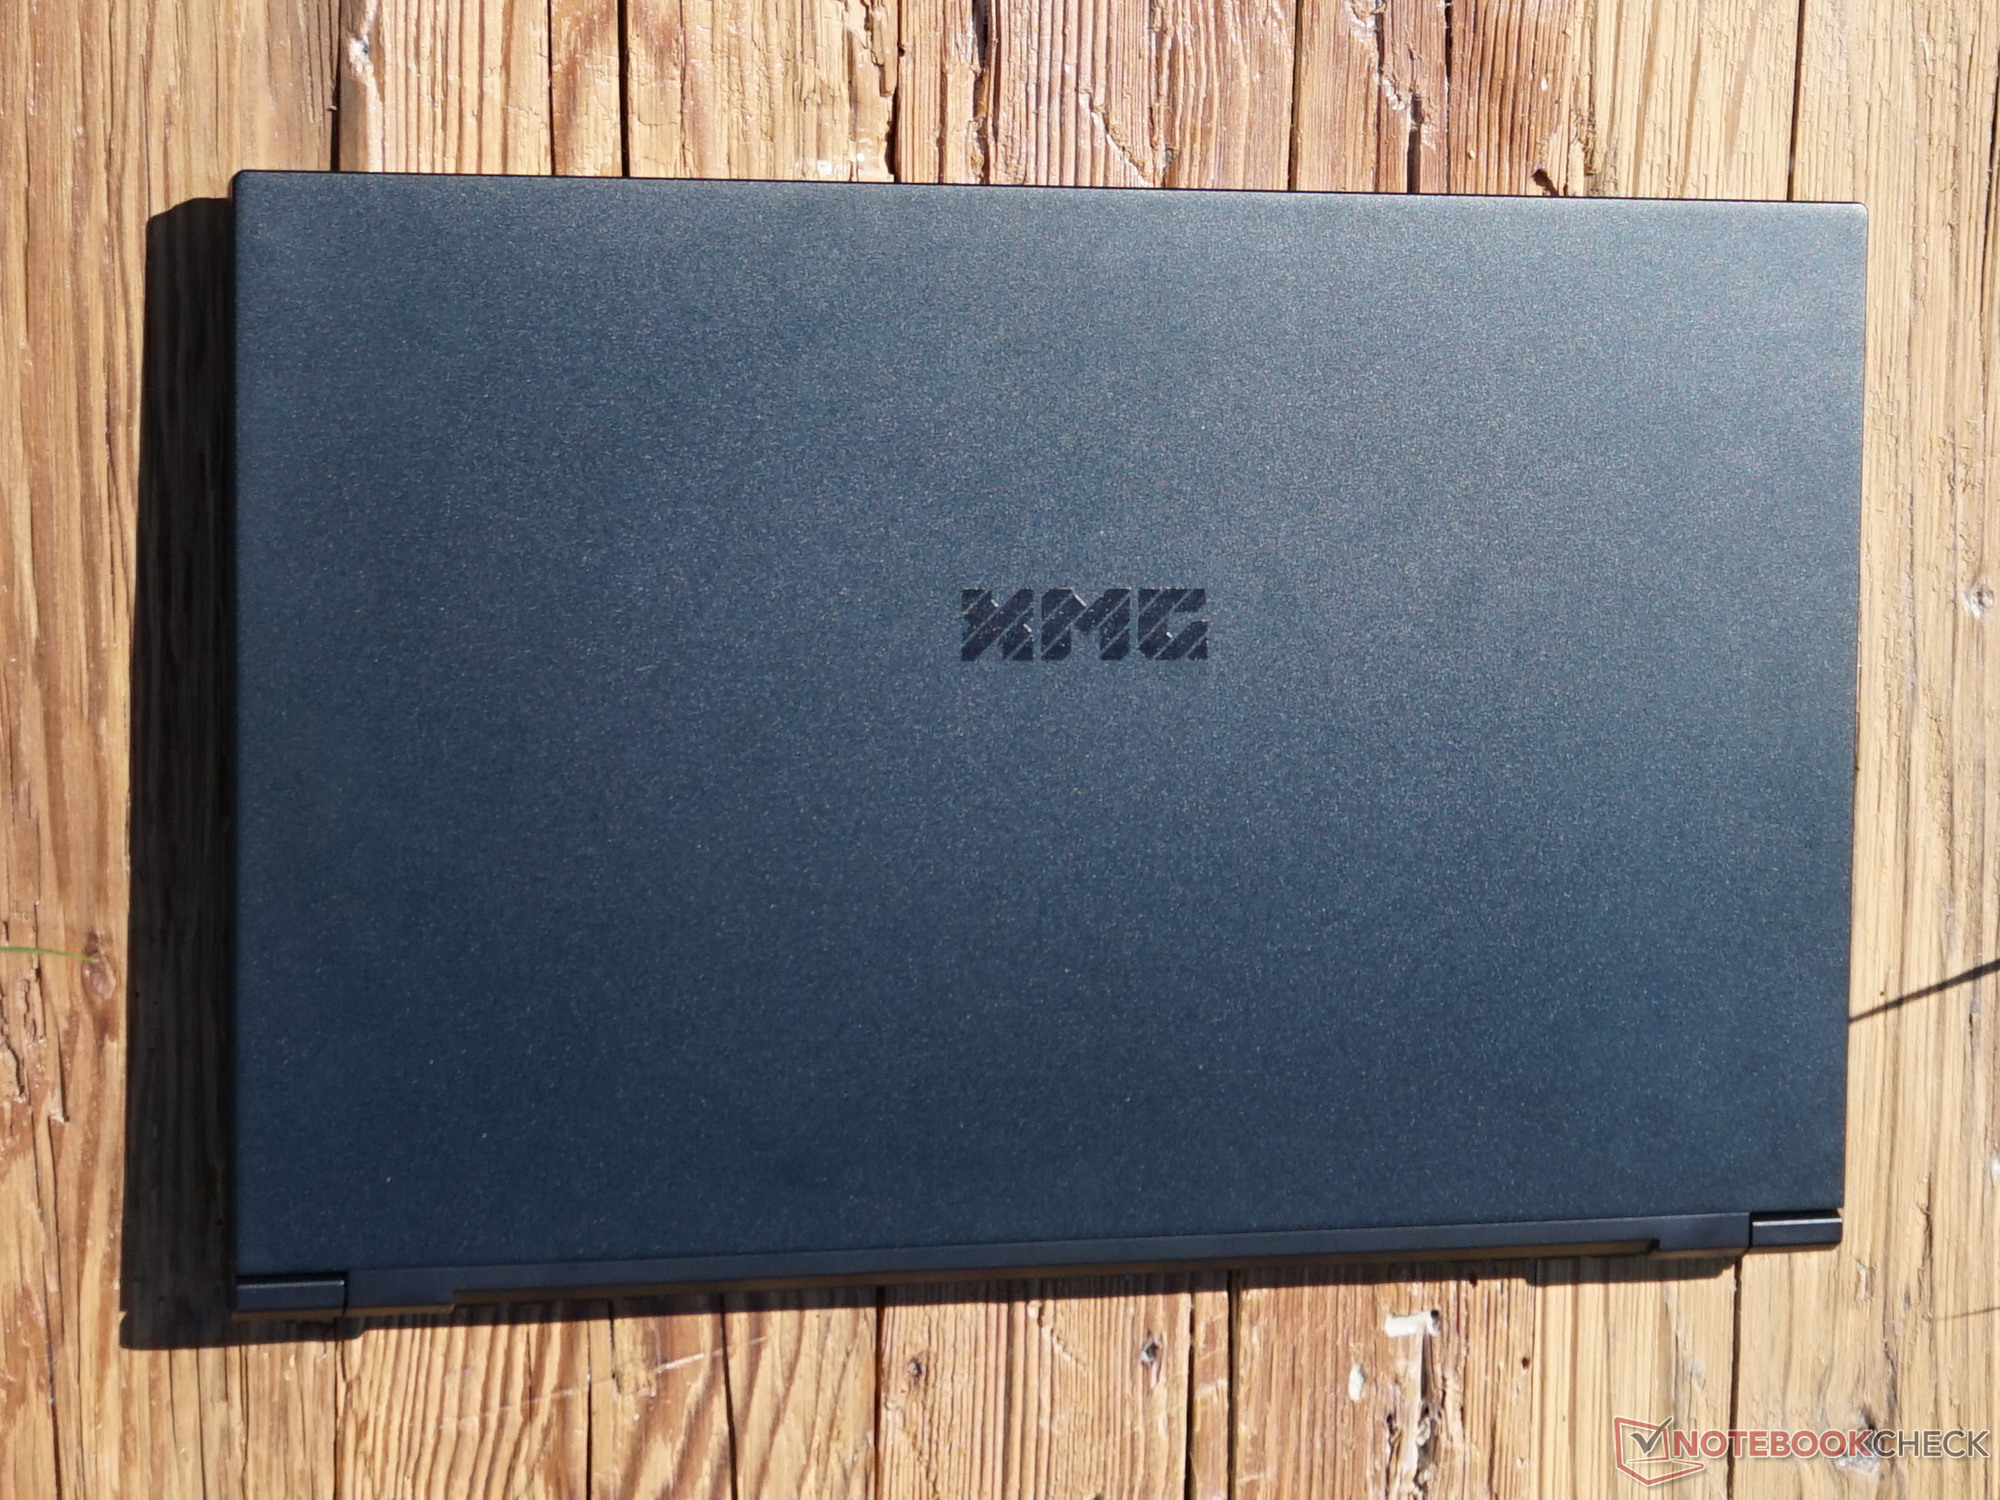
Case - Modest gaming laptop with a lot of black
The black case, which is completely made of plastic in its lower part, looks less elegant, but very pragmatic. Only the back of the display is stabilized with an aluminum cover - also in black. However, anything else would've been surprising in view of the 17.3-inch size. Unfortunately, the surfaces are all very susceptible to fingerprints.
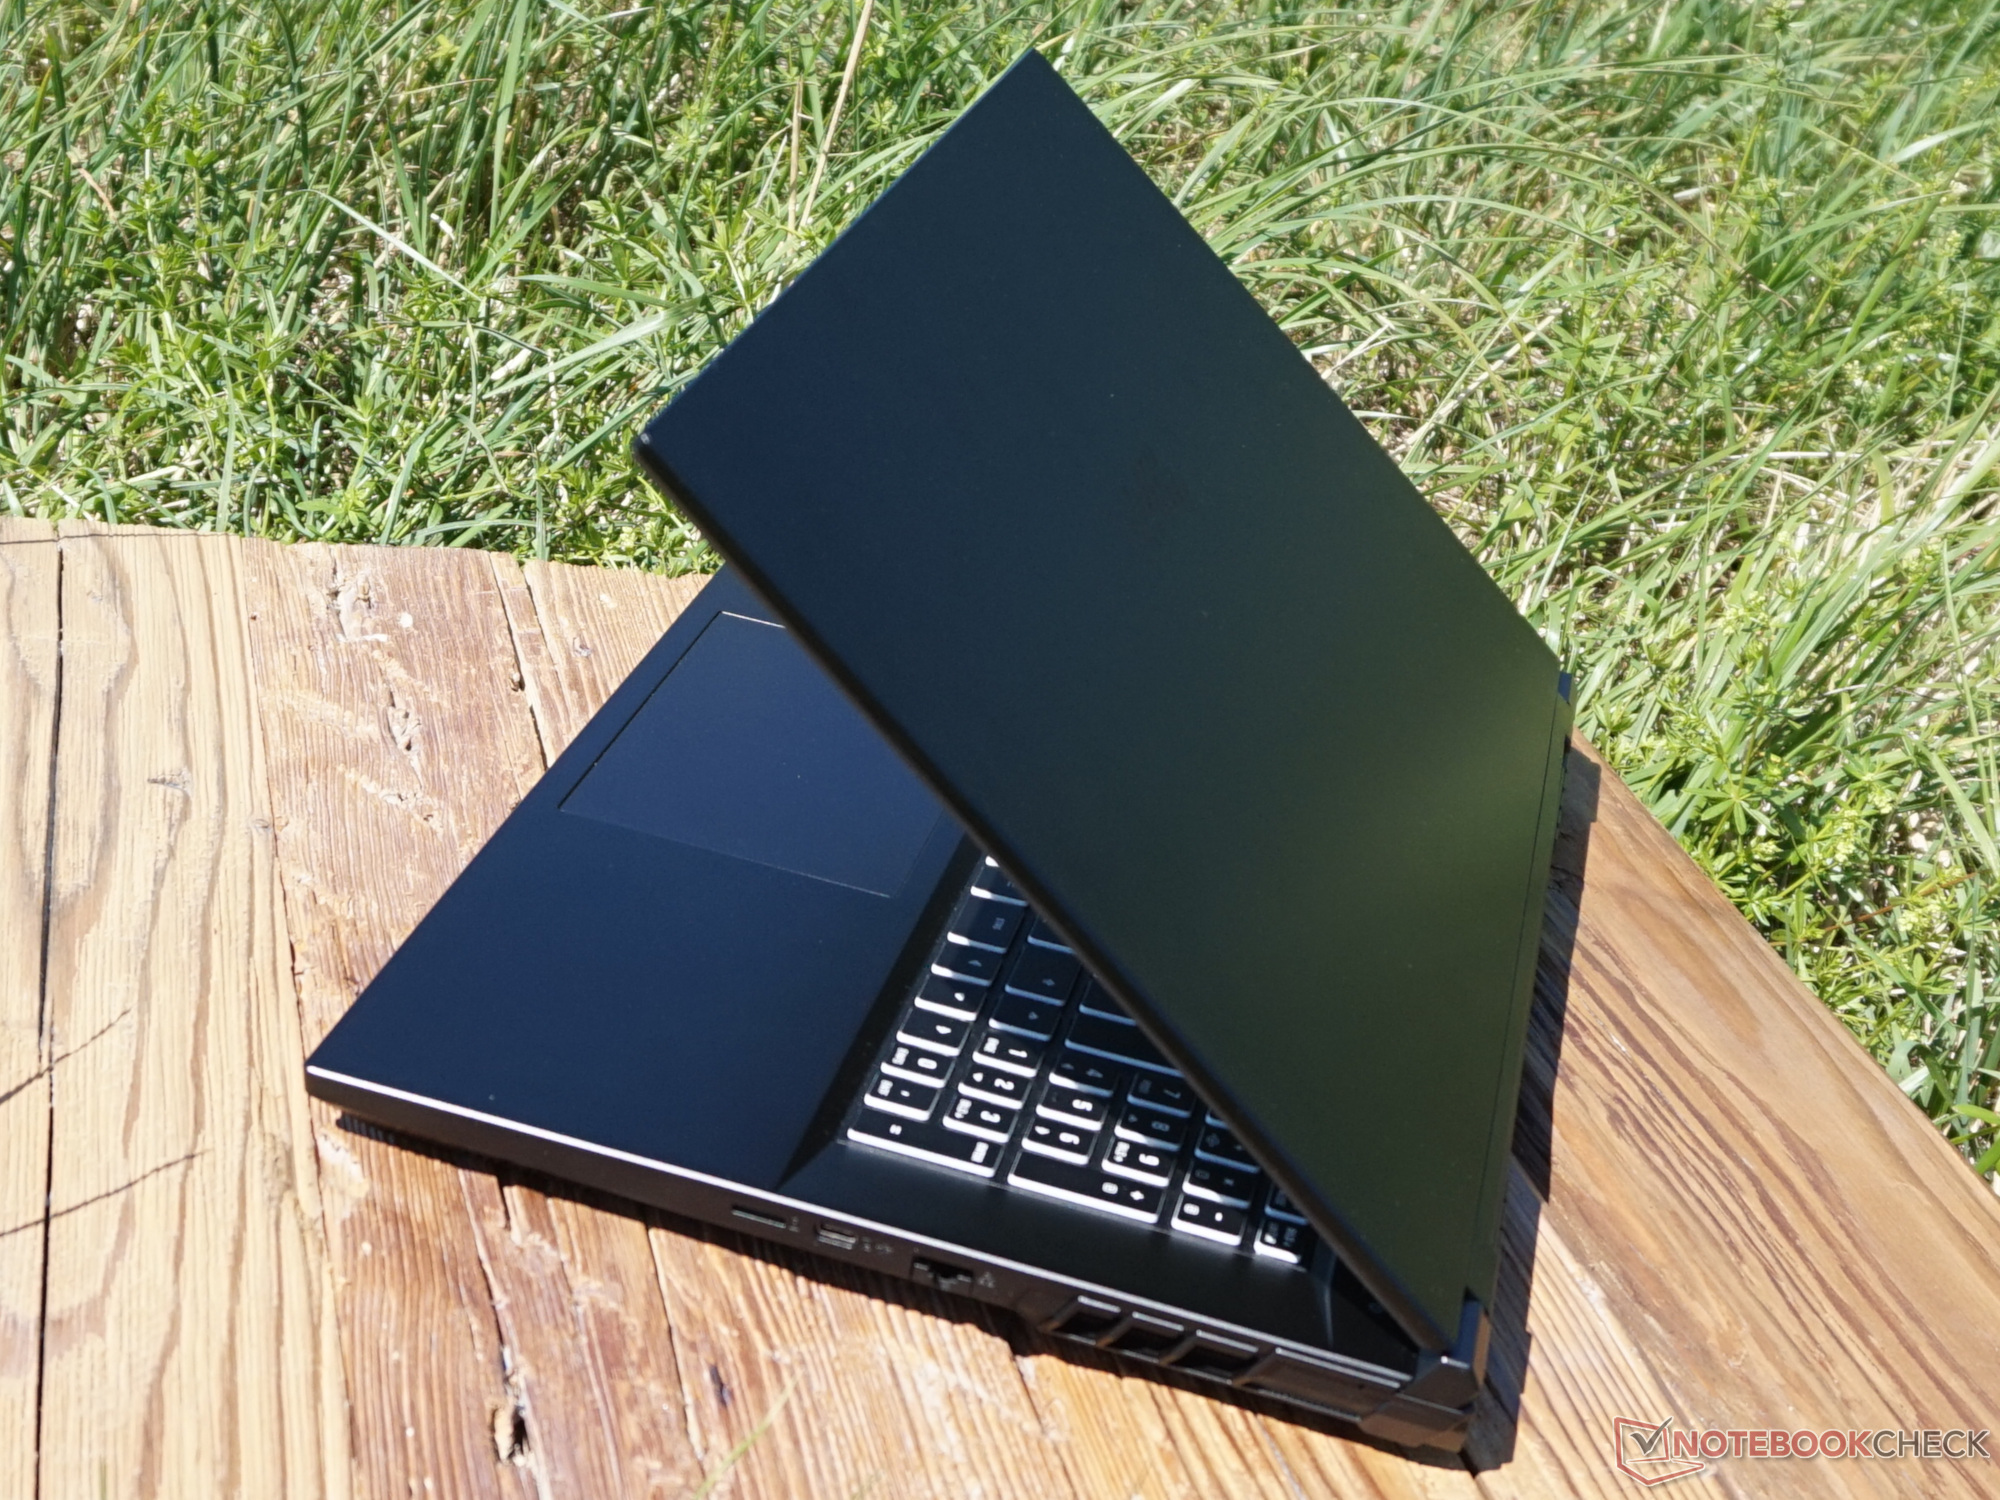
The screen can be opened comfortably with one hand, but then it wobbles a bit. Overall, it makes a stable impression, and it can hardly be twisted. This applies even more to the lower part. Despite a noticeable weight, the case remains almost perfectly level when held at a single corner. Models with a higher proportion of metal components don't manage this any better.
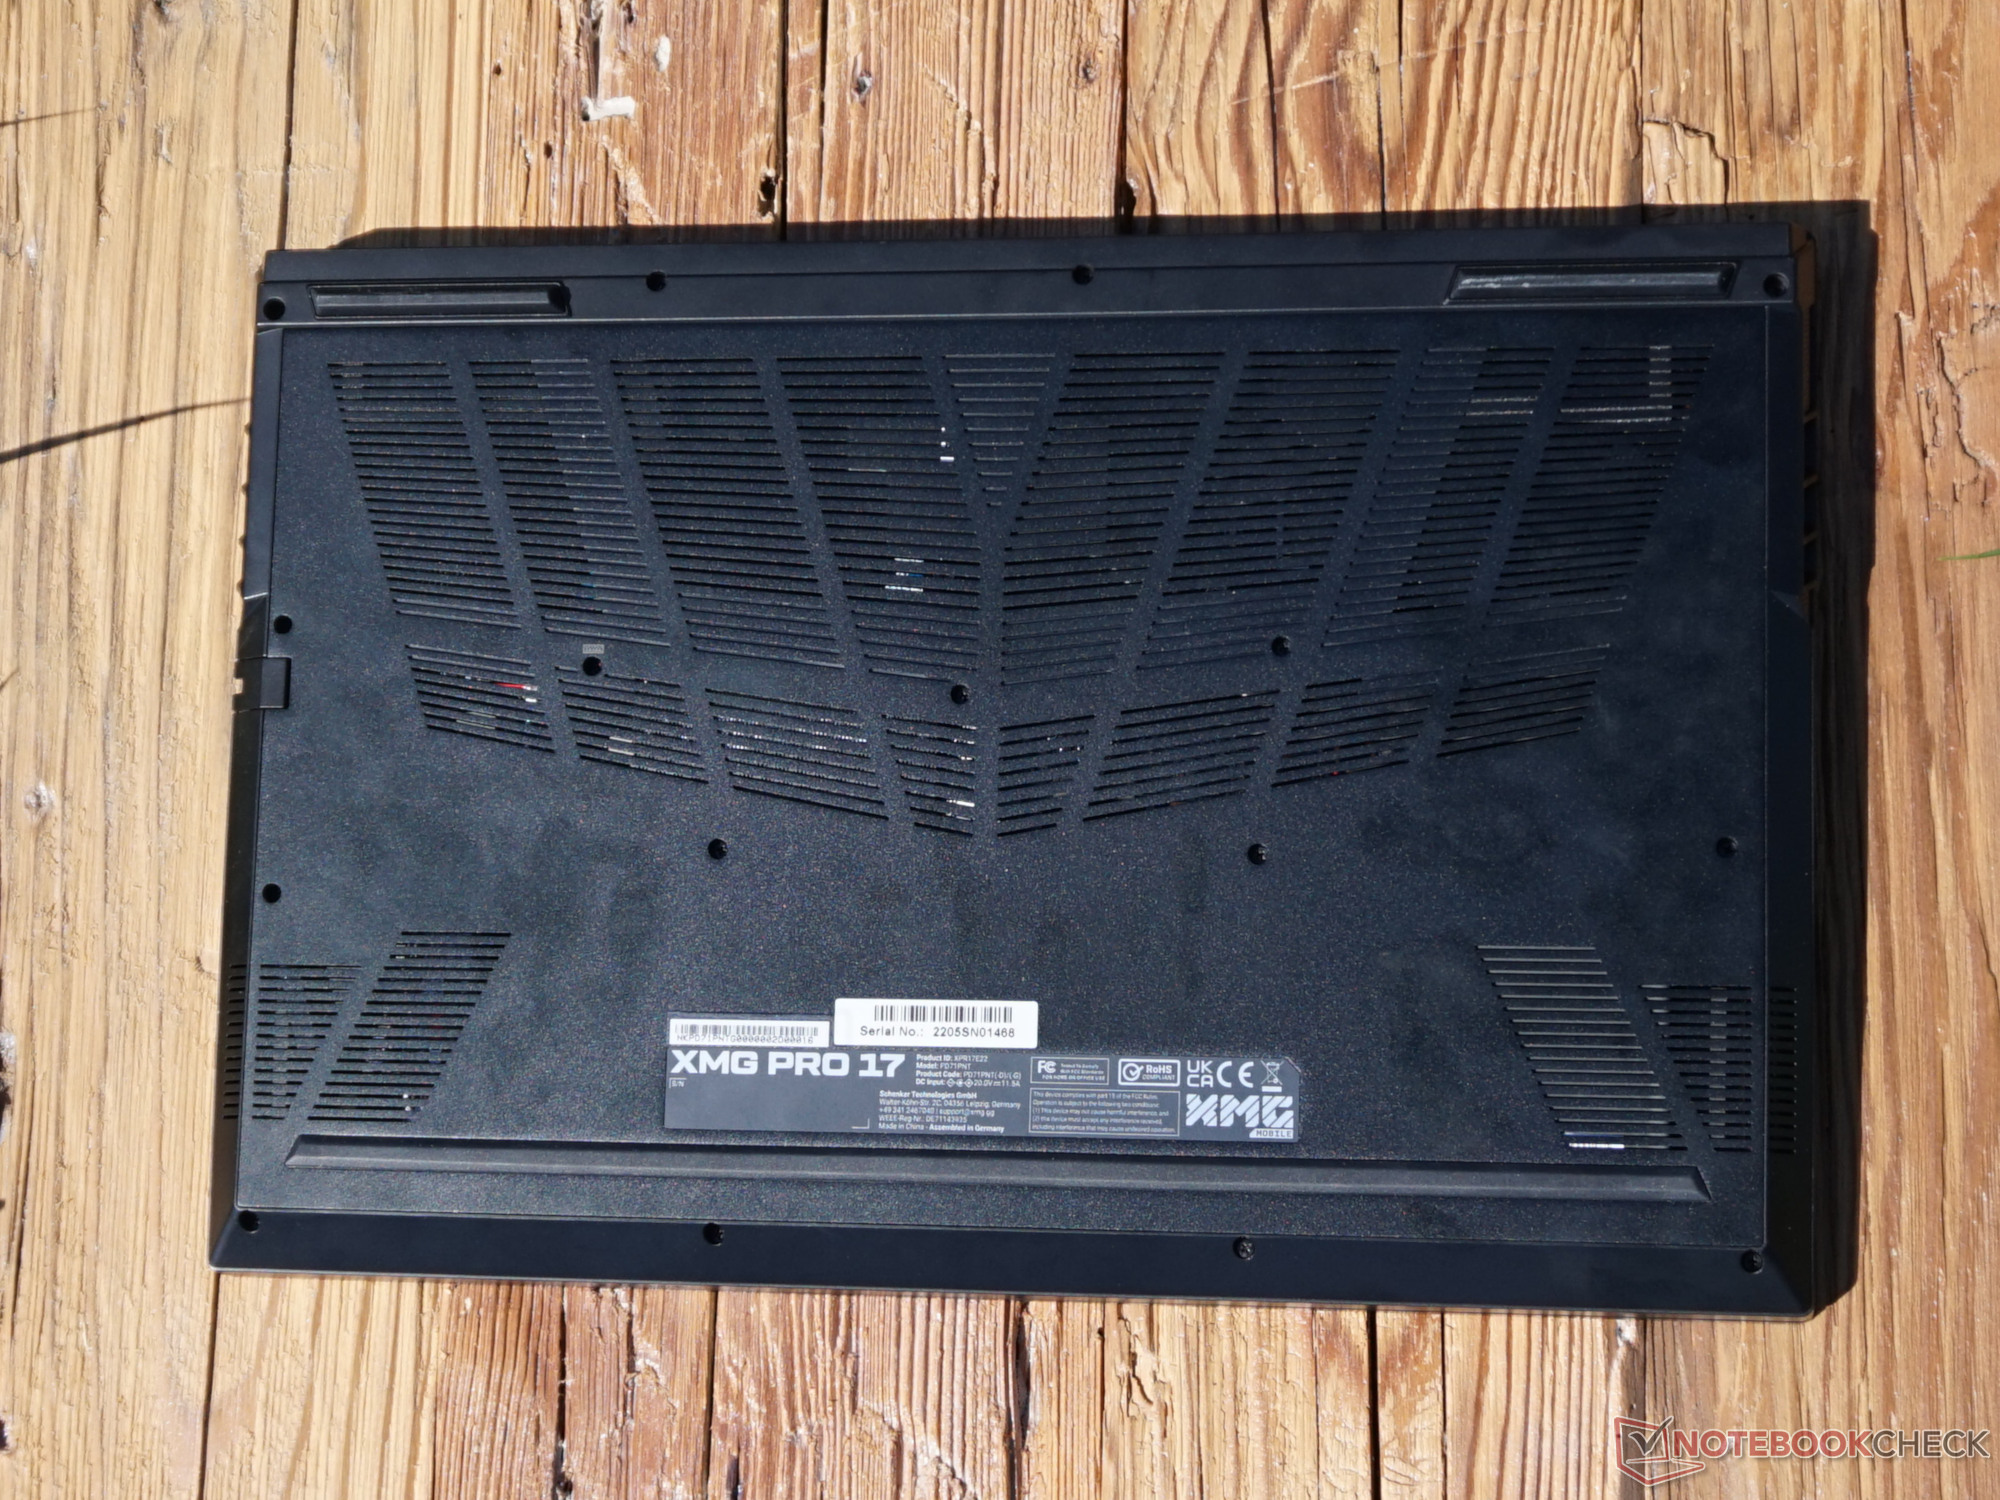
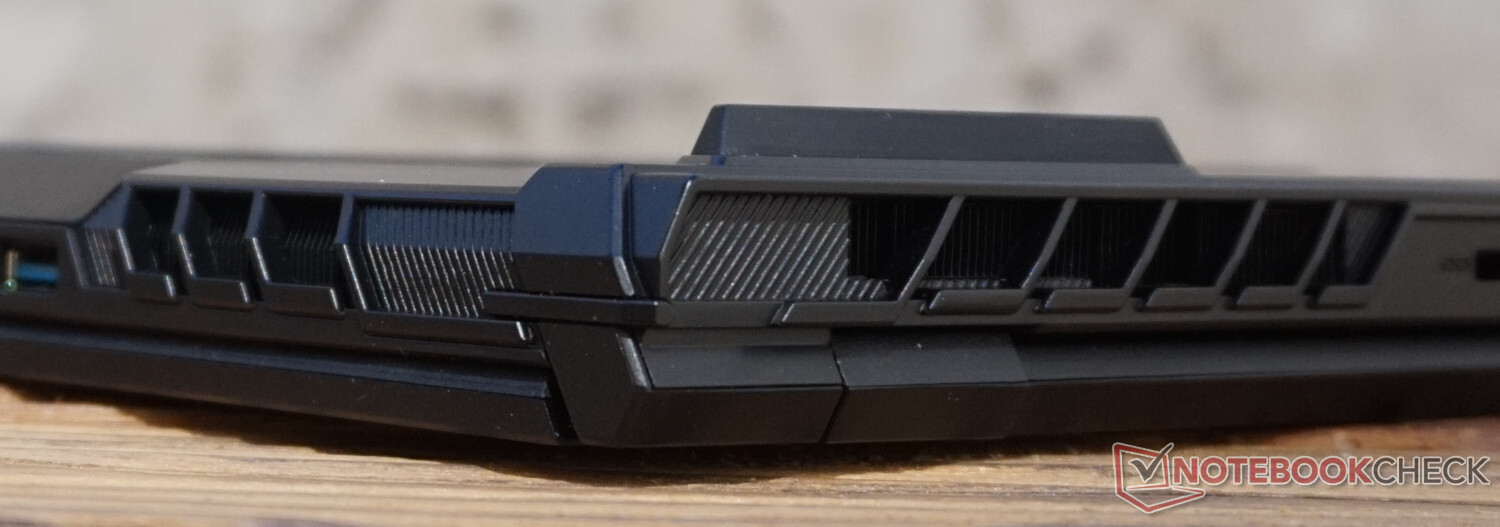
The only noticeable thing are the large ventilation openings that extend around the entire laptop. In addition, the bottom cover allows air exchange with the environment on almost half of its surface. This also provides clarity regarding where to place the laptop: A flat tabletop with enough space on both sides and towards the back.
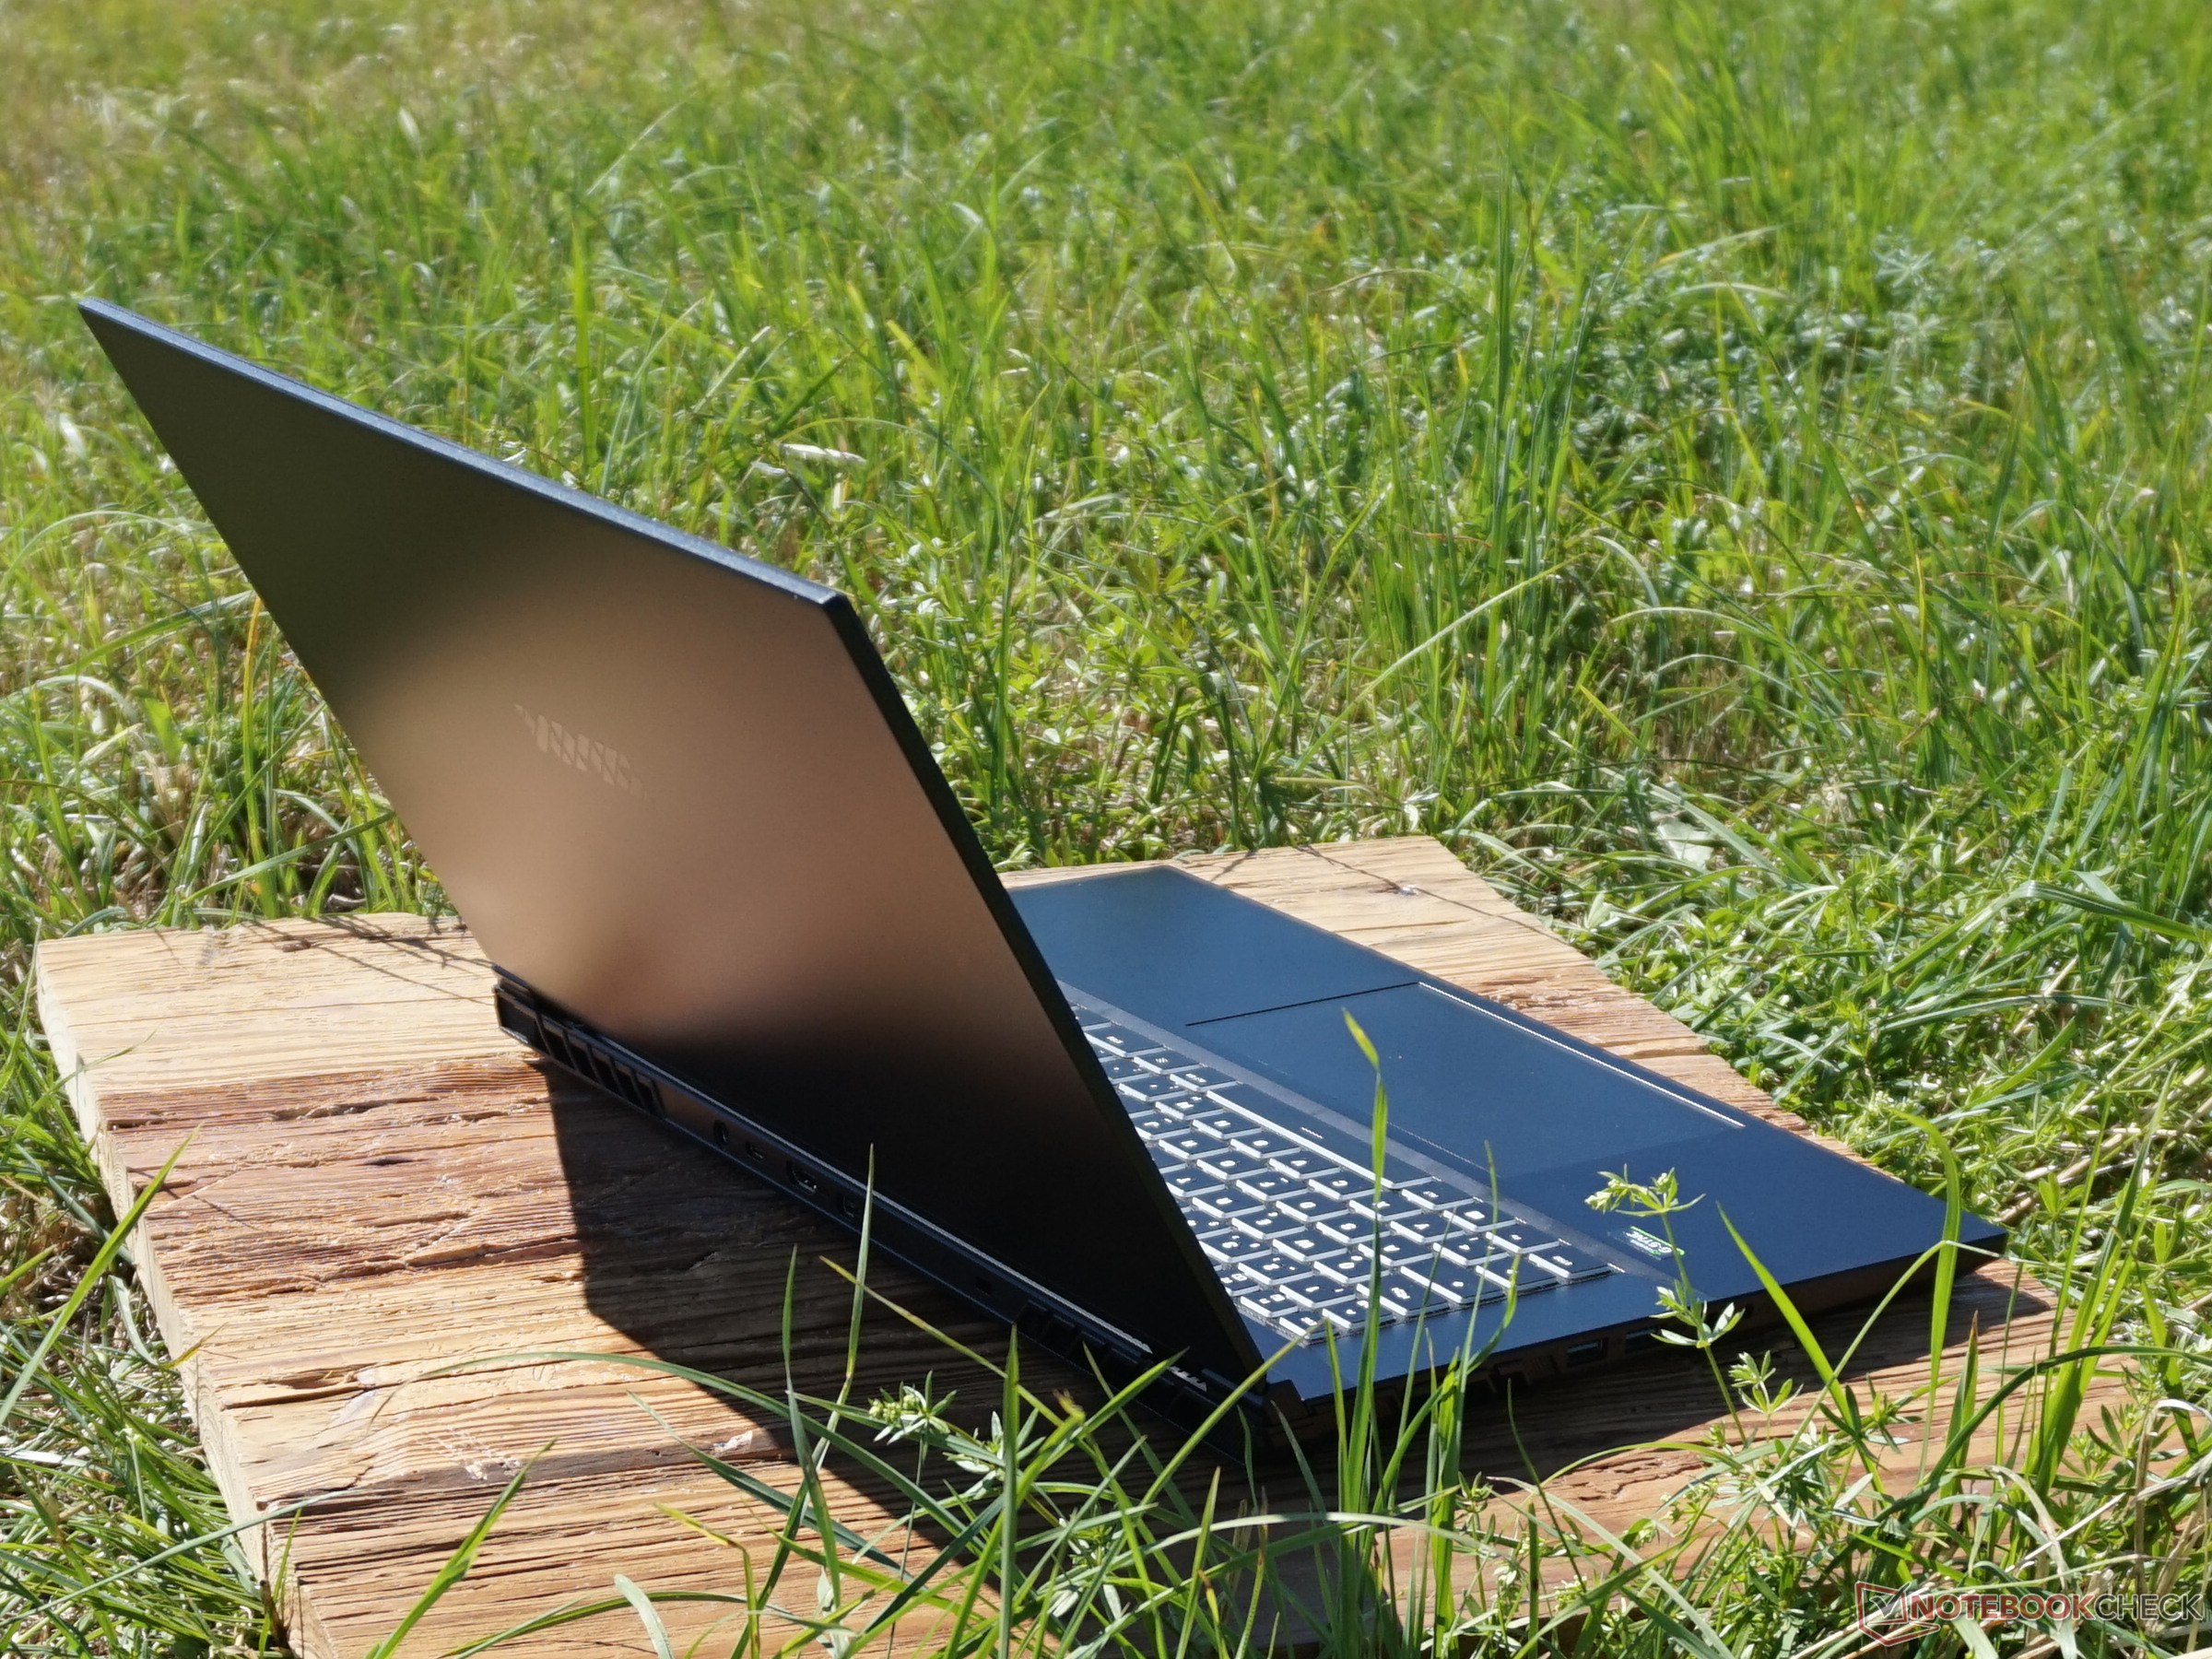
It'd be hard to design a laptop that is much heavier and bigger. Naturally, this is due to the large screen and the powerful components. At the same time, these are provided with enough space inside the case for heat dissipation and ventilation. But the XMG Pro 17 e22 is only truly mobile and portable to a limited extent. A sufficiently large and sturdy bag is a prerequisite for carrying the device, which weighs about 3.5 kg including the power adapter.
You also have to consider that the thickness of 27 mm is accompanied by feet with a height of 5 mm, which ensure sufficient ground clearance for cooling.
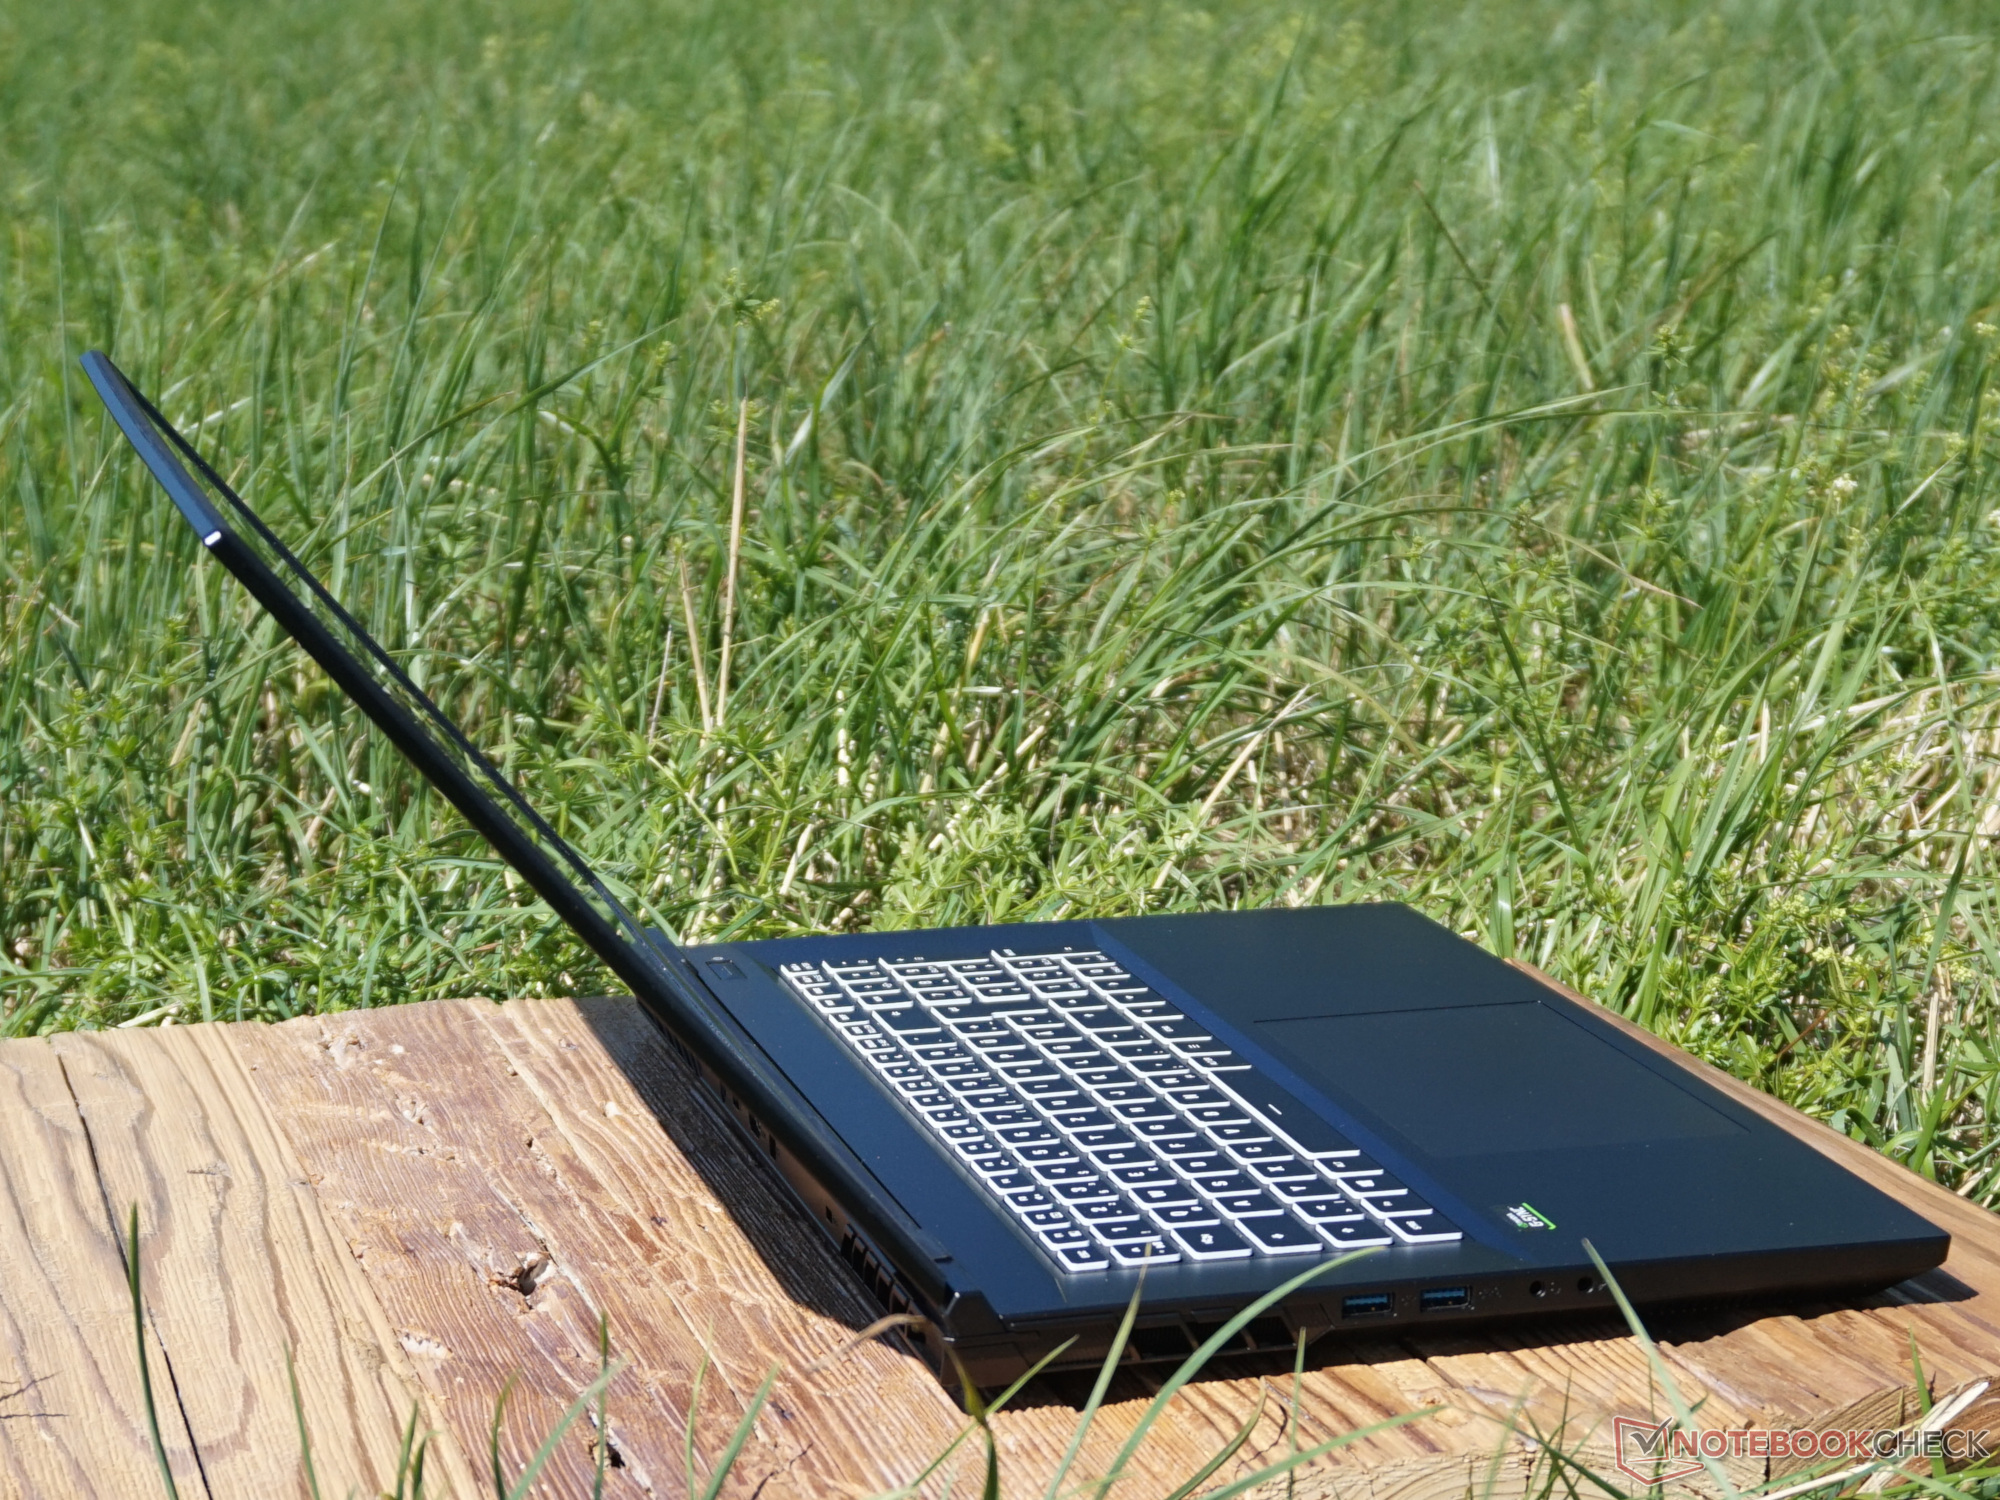
Connectivity - Gaming on five displays
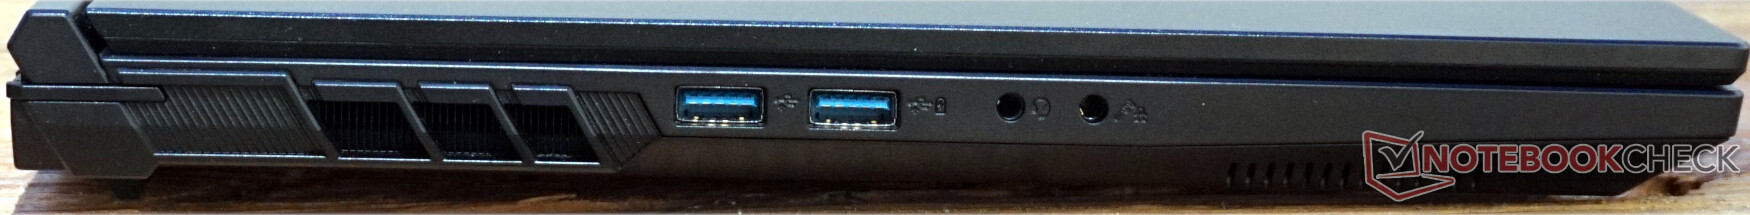
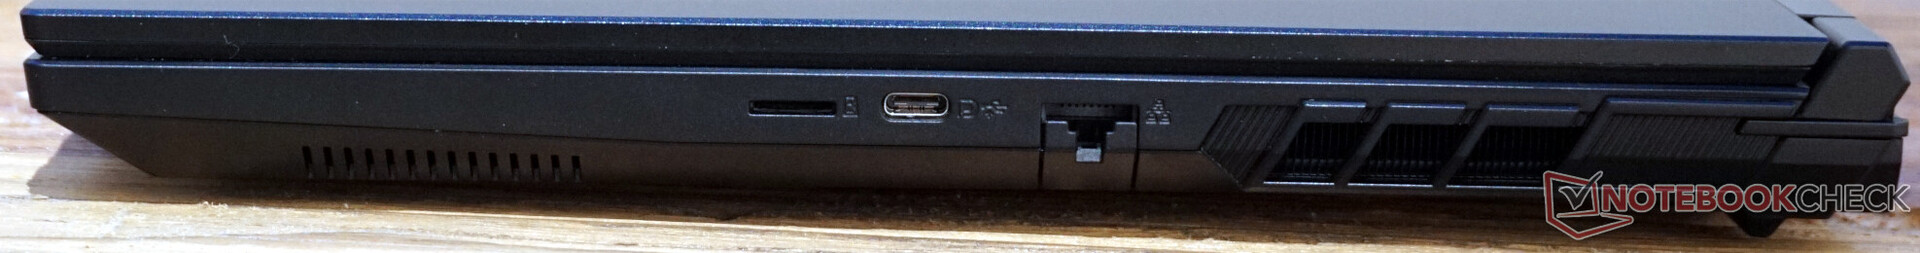
The large case with enough space has almost everything. The card reader, LAN port, four USB ports, and four video outputs leave nothing to be desired.
The placement of the power supply and three of the video ports on the back results in a clean workspace. Especially when used as a workstation, the variable monitor ports, each supporting up to 8K, could be an advantage. On the other hand, a single one would certainly be enough for gaming.
The layout isn't that flawless. Both USB-A ports are on the left, and they're also only 6 mm apart. This is enough most of the time, but USB sticks could block each other. Another USB port on the right would've improved the overall design. The decision for microSD cards doesn't make sense either. There would've been enough space for a full-fledged card slot.

SD card reader
Our reference card, the AV PRO microSD 128 GB V60, remains far away from its potential. The gap to both the top scores as well as to the average among gaming laptops is considerable. Other laptops like the Alienware x17 R2 P48E can copy, read, and overwrite data three times as fast.
| SD Card Reader | |
| average JPG Copy Test (av. of 3 runs) | |
| Alienware x17 R2 P48E (AV Pro V60) | |
| Asus ROG Zephyrus Duo 16 GX650RX (AV PRO microSD 128 GB V60) | |
| Average of class Gaming (19 - 202, n=100, last 2 years) | |
| Acer Predator Triton 500 SE PT516-52s-70KX (AV PRO microSD 128 GB V60) | |
| SCHENKER XMG Pro 17 E22 (AV PRO microSD 128 GB V60) | |
| MSI Raider GE77 HX 12UHS (AV PRO microSD 128 GB V60) | |
| maximum AS SSD Seq Read Test (1GB) | |
| Alienware x17 R2 P48E (AV Pro V60) | |
| Asus ROG Zephyrus Duo 16 GX650RX (AV PRO microSD 128 GB V60) | |
| Average of class Gaming (25.8 - 269, n=94, last 2 years) | |
| SCHENKER XMG Pro 17 E22 (AV PRO microSD 128 GB V60) | |
| Acer Predator Triton 500 SE PT516-52s-70KX (AV PRO microSD 128 GB V60) | |
Communication
The Wi-Fi module offers no reason to complain at all. Its transfer rates remain absolutely constant in the test, and they're within the range of what's technically possible.
Webcam
Thanks to a Full HD resolution, but unfortunately only at 30 fps, the image quality is acceptable. Color deviations are also acceptable, and they don't lead to any color inaccuracies that are immediately visible. Especially when it comes to video calls, the webcam is well equipped.
The microphone also does a good job. If you don't speak directly into its direction, quality suffers a bit, but in general, the ability to pick up the user's voice independently of the direction is only important for business laptops.


Maintenance
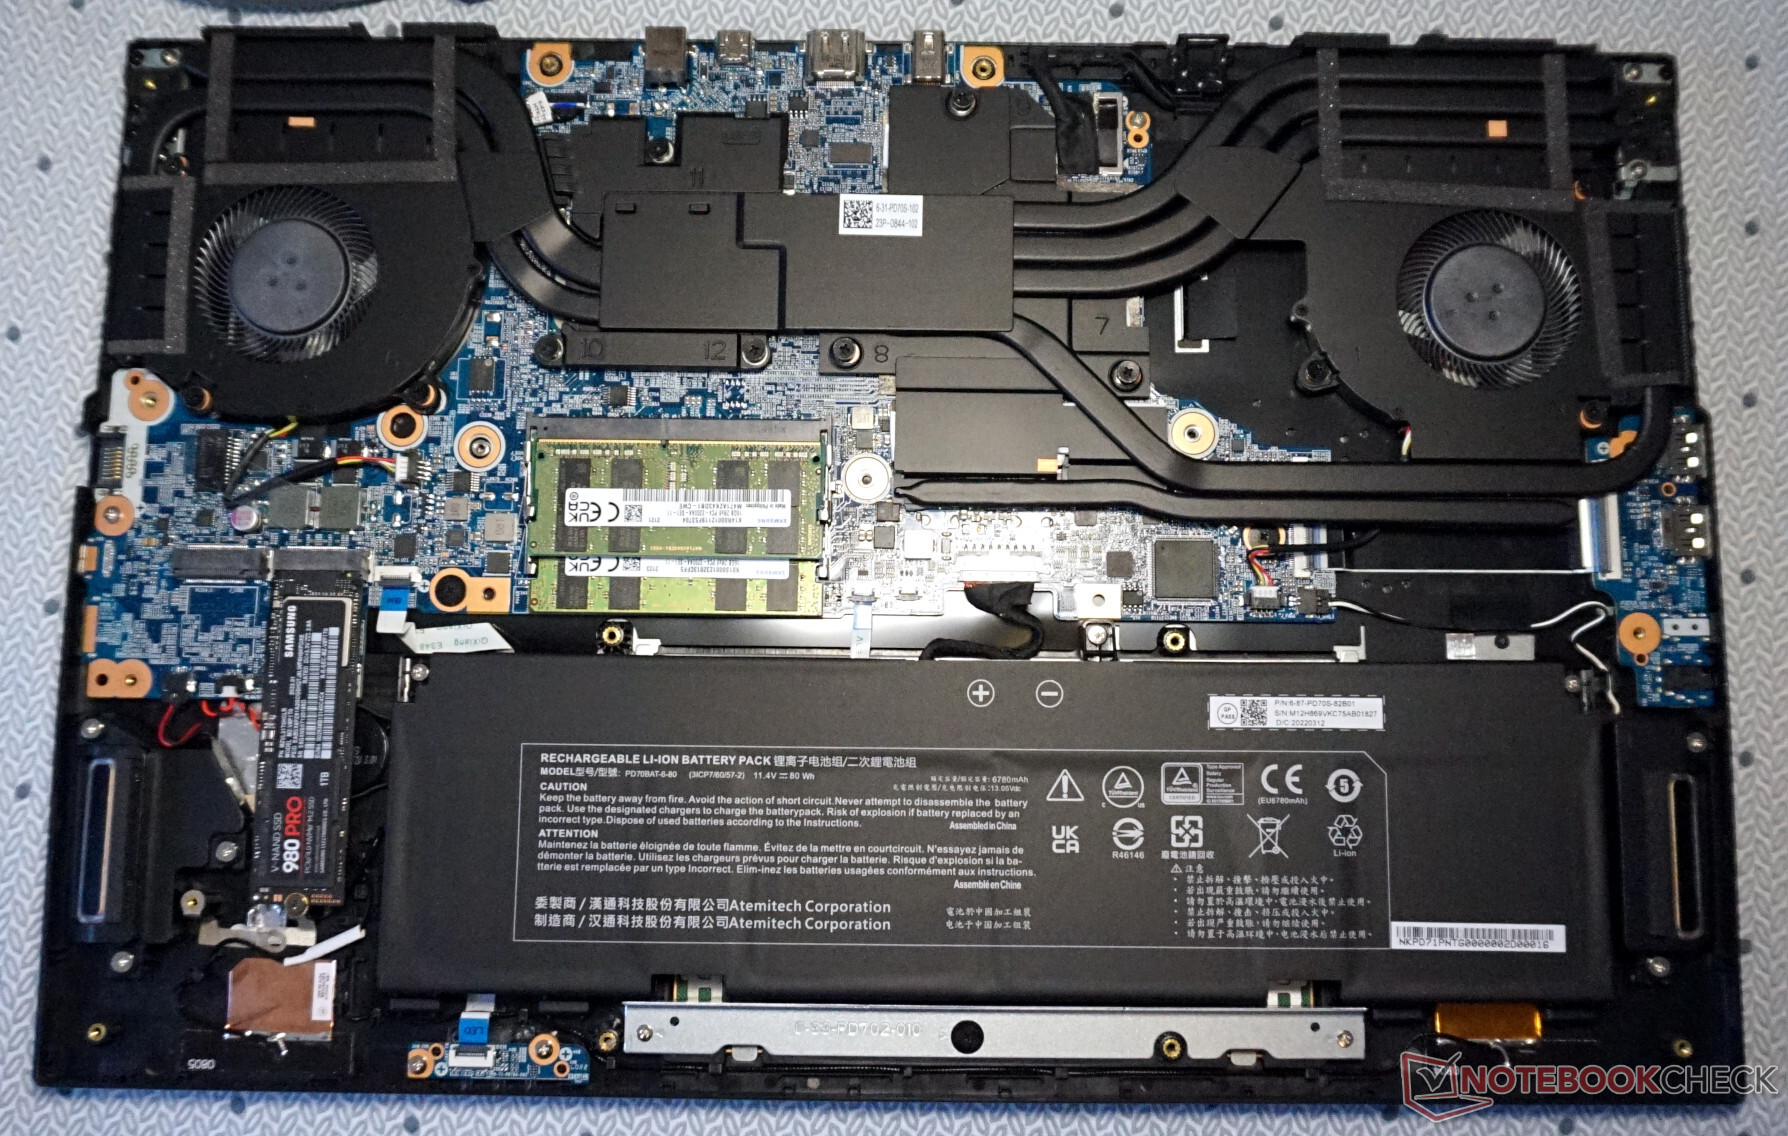
There are no obstacles to perform later upgrades or to clean the fans. Although 16 screws still need to be removed, they're all openly accessible and of the same length. The entire bottom cover can then be removed without requiring much effort. It's recommended to begin in the area of the hinges.
This makes the double fan accessible. The battery can also be replaced easily. This applies even more to the RAM and M.2 SSDs. Two interfaces each are available here, which become occupied either at the time of purchase, or they can be upgraded later as well.
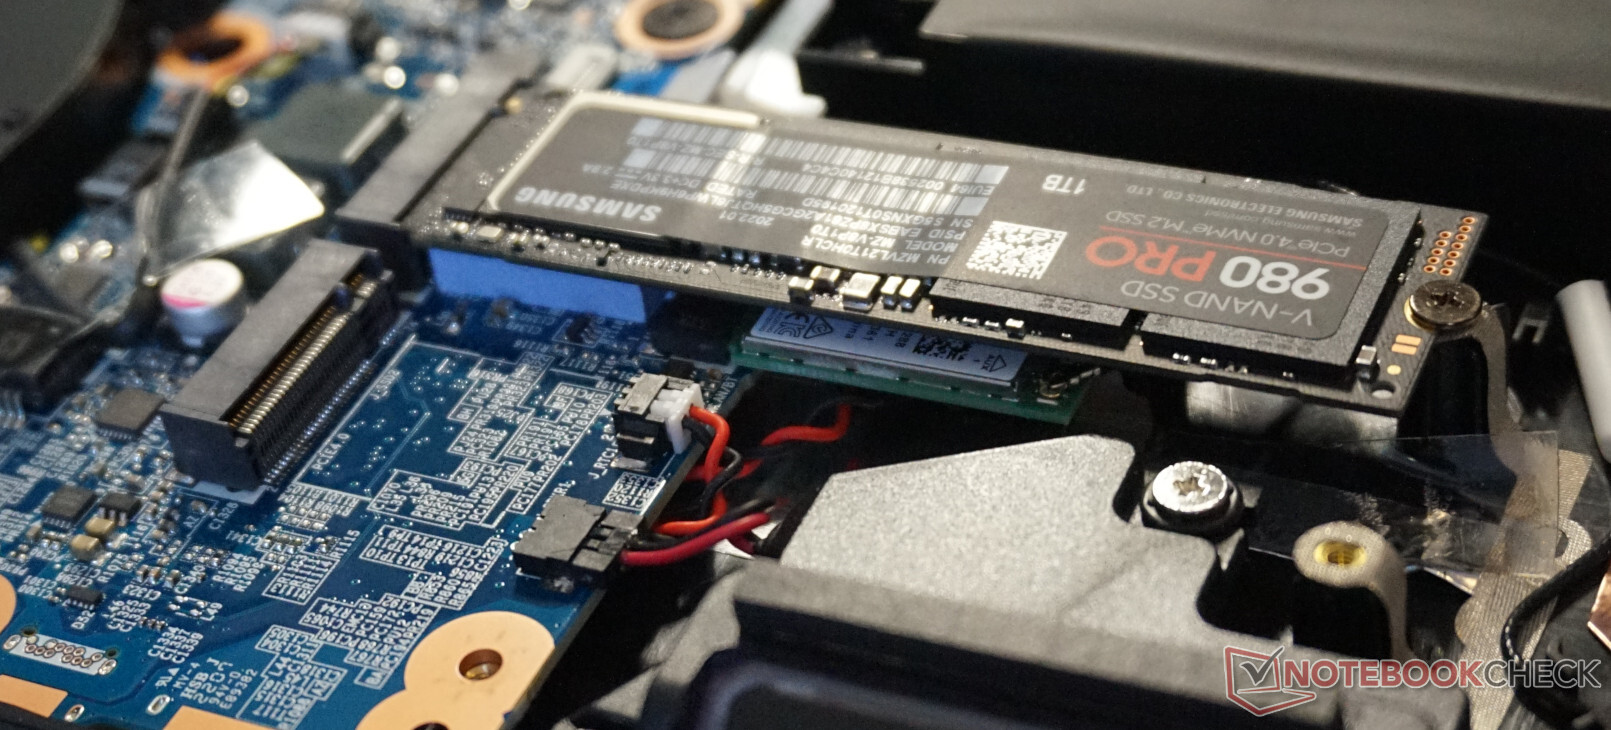
The Wi-Fi module is located in an unusual way since it's placed directly underneath the SSD. It can also be replaced. Overall, it's noticeable that there aren't any heat dissipating elements either for the SSD or for the RAM. This isn't the best decision due to the fact that internal temperatures can rise as a consequence of performance.
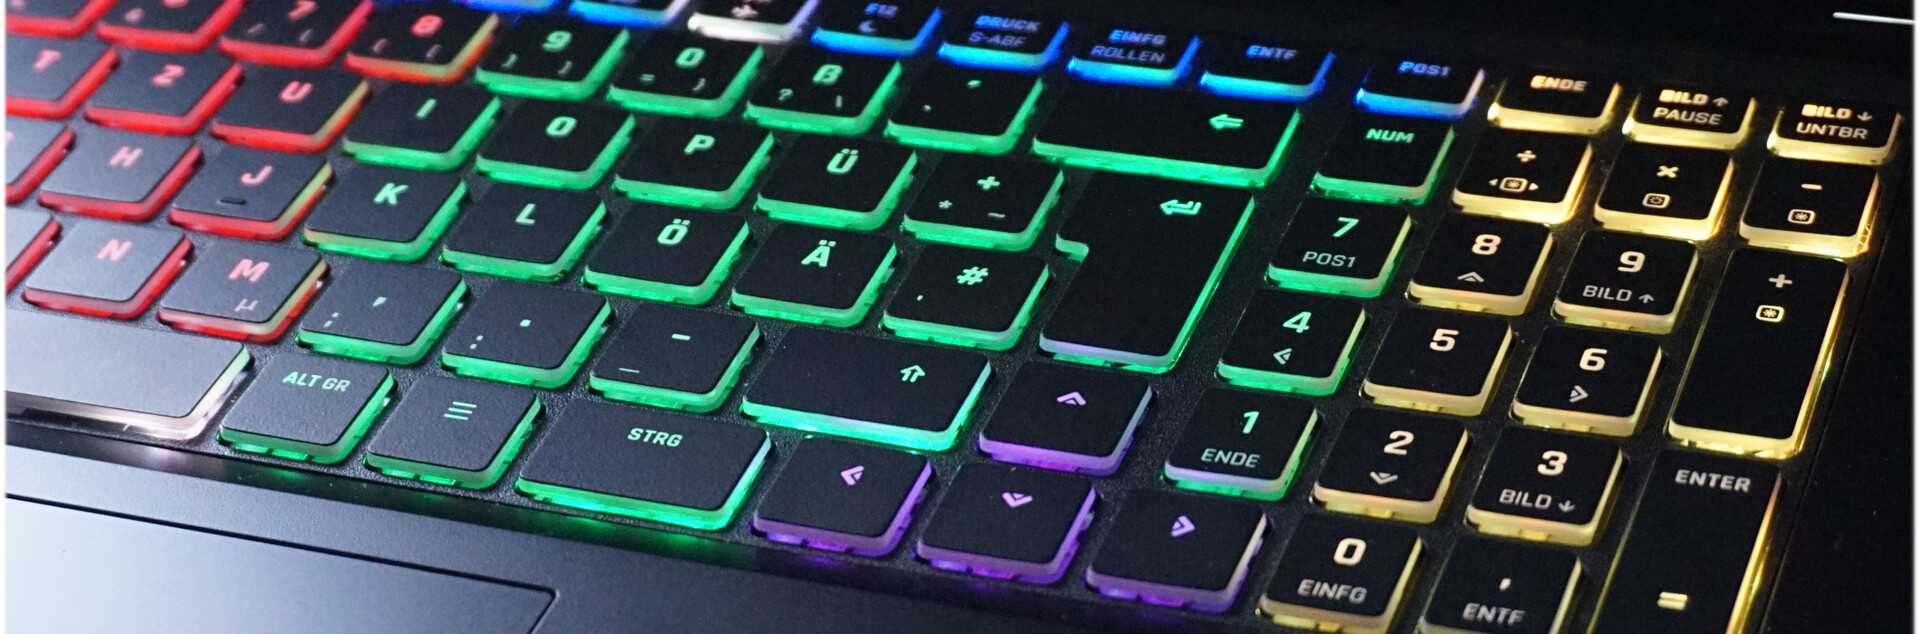
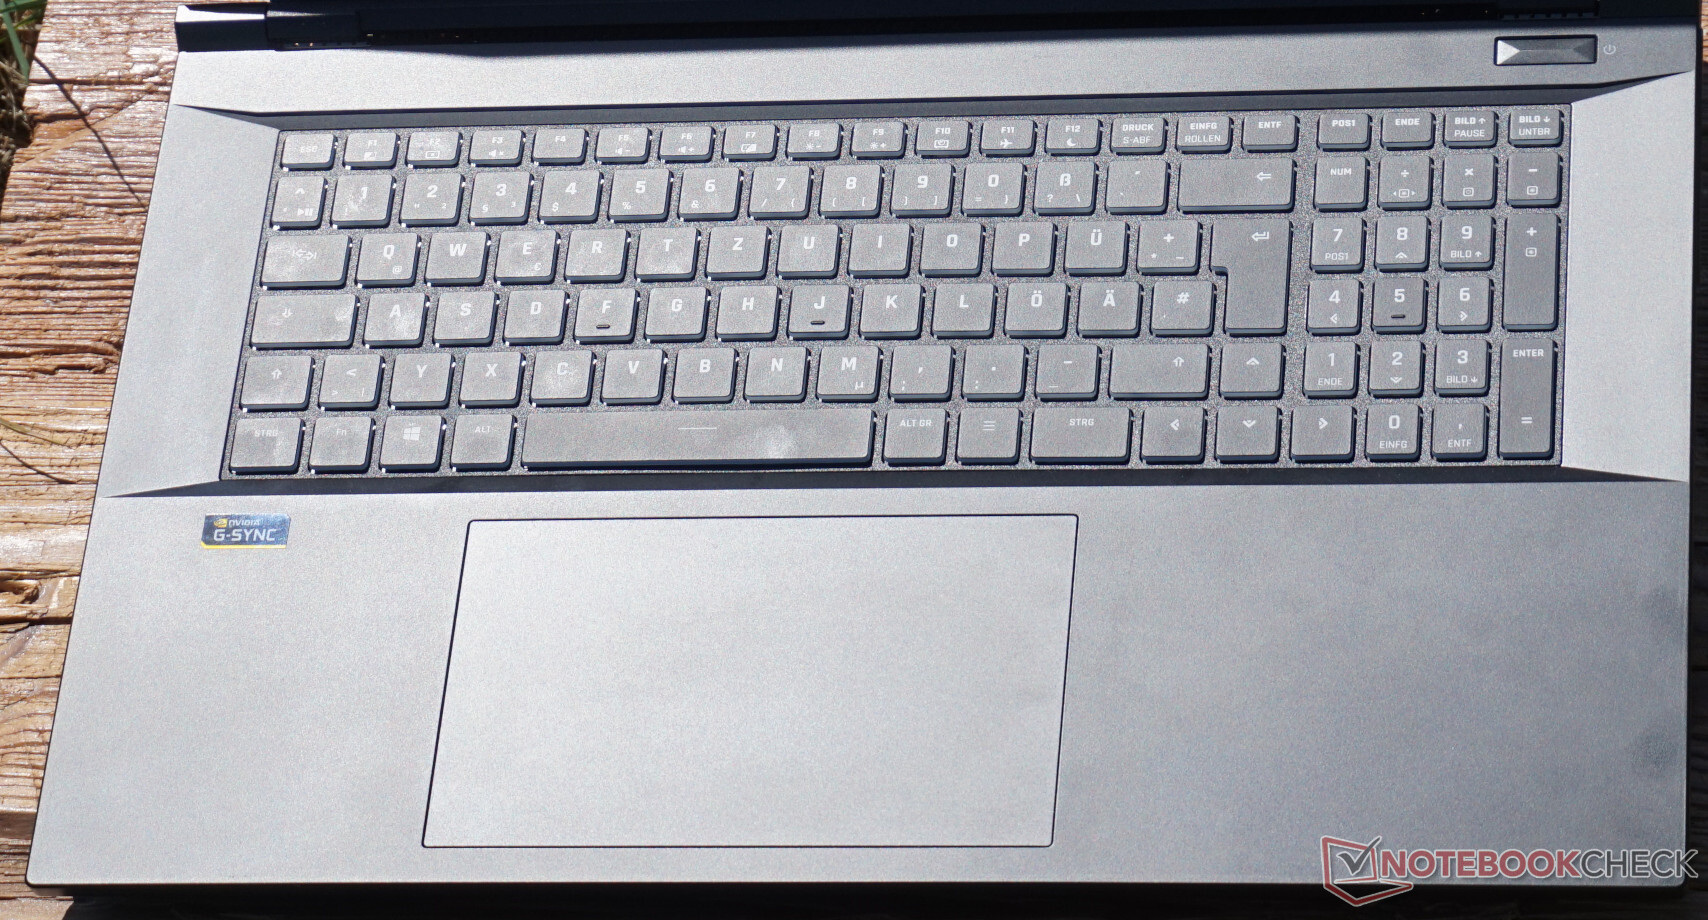
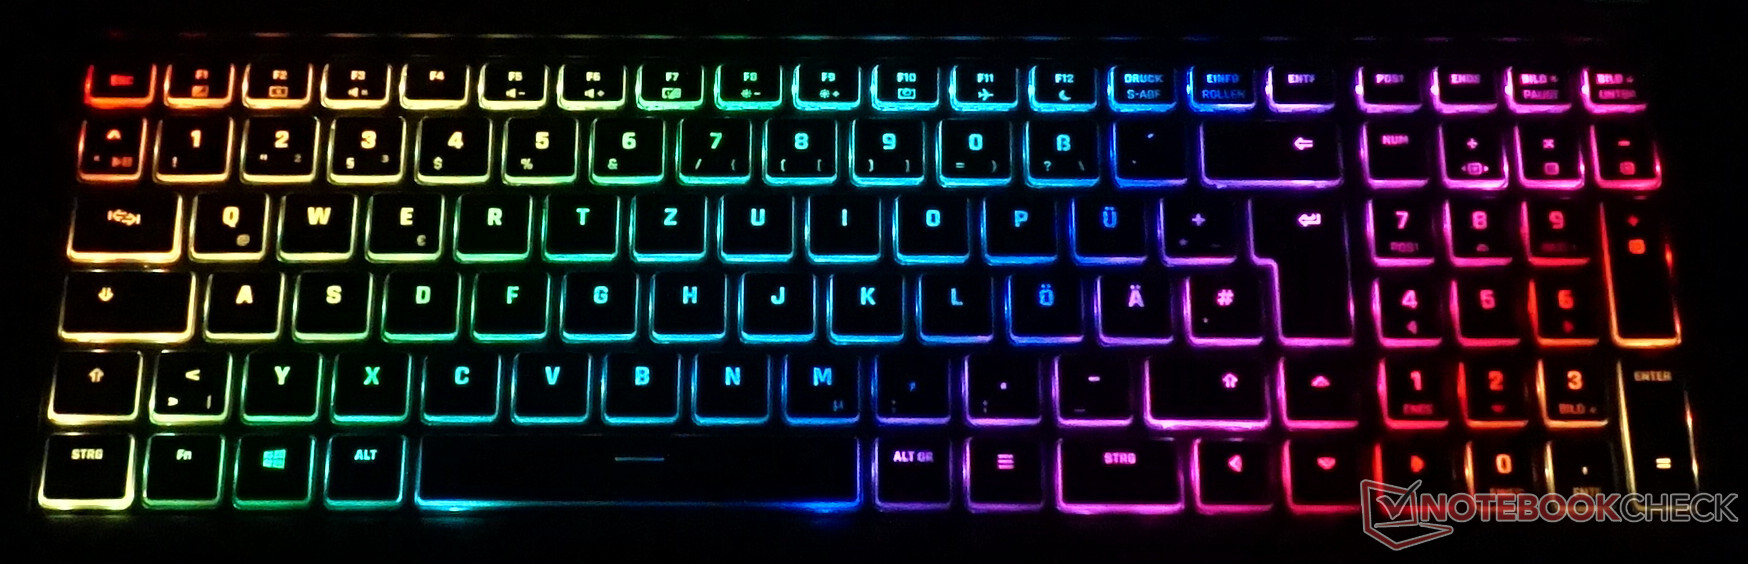
Input devices - XMG Pro 17 with a worthy gaming keyboard
Needless to say, the Schenker XMG Pro 17 E22 features an RGB keyboard. In addition to a few flowing, pulsating, and partly irritating color gradients, each key or a certain area can be customized. The travel of 1.5 mm should be praised. This is significantly higher than in standard laptop keyboards. Accordingly, typing is pleasant, which is also due to the good feedback. Only the slightly yielding keyboard frame could've been built more sturdily.
The 15 x 9 cm touchpad responds precisely and is easy to use. Almost the opposite has to be said about the two keys that are invisibly placed underneath the touchpad. The pressure point seems imprecise, and sometimes, only pressing harder triggers in an action. However, since a mouse will almost always be used with a gaming laptop or workstation, only a few users will be bothered by this.
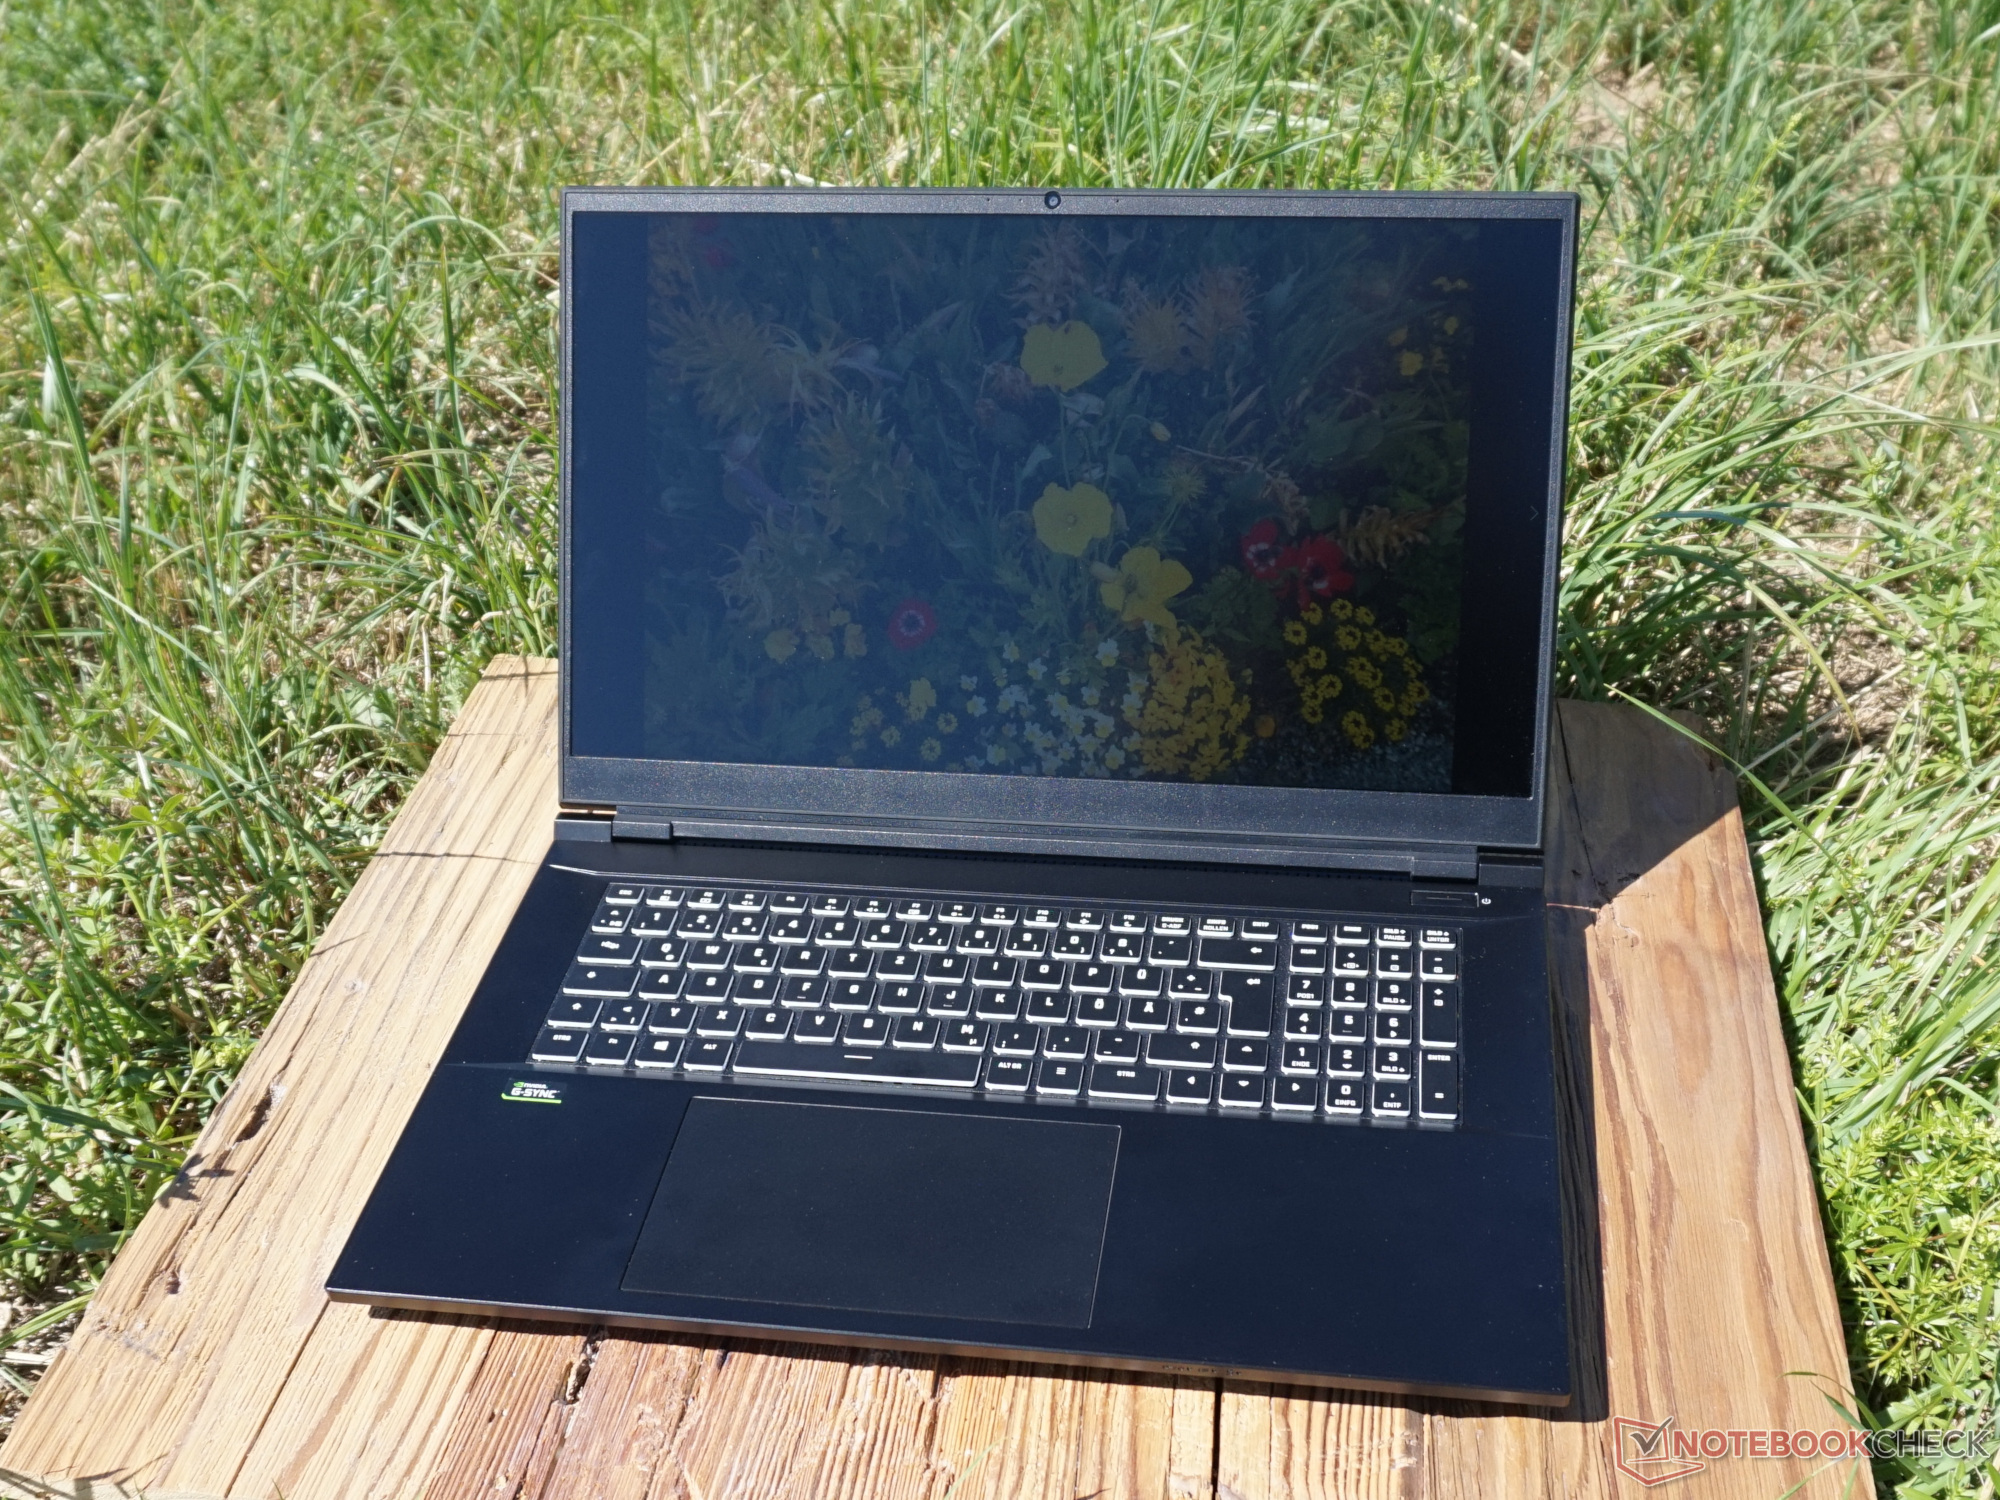
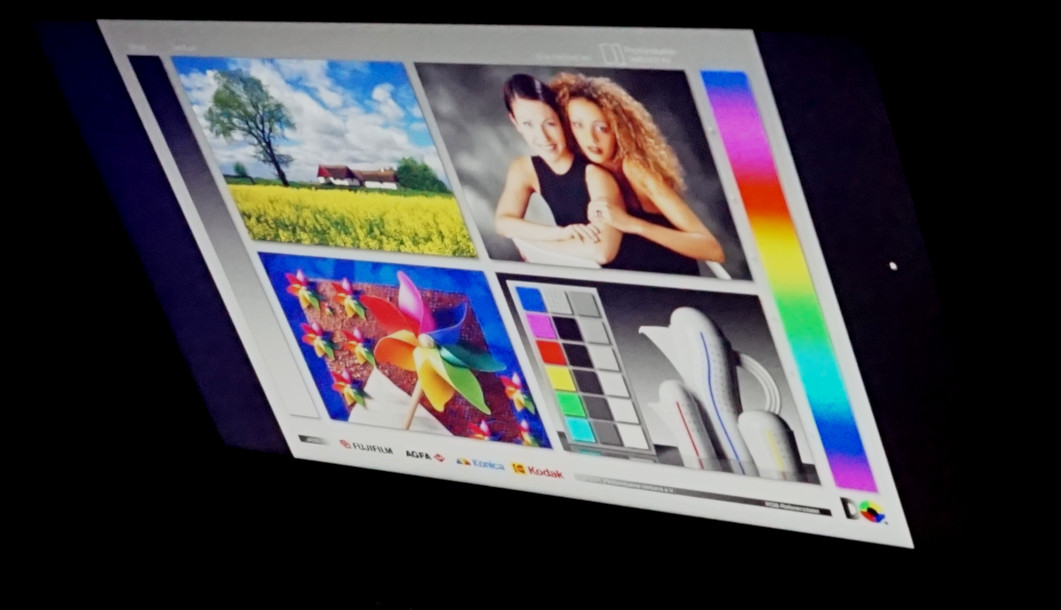
Display - Solid rates for the Schenker gaming laptop

The XMG Pro 17 E22 that we reviewed features an almost classic gaming display. The most important aspects are ticked off with a QHD resolution, a refresh rate of 165 Hz, and the sRGB color space. In addition, 17.3 inches always look pretty impressive at short distances.
The contrast of about 1,100:1 is also compelling. This indicates a good black level because the maximum brightness is rather modest. Just under 300 cd/m² are hardly enough to see anything outdoors or to show the large contrast differences in HDR content. Neither is necessarily required for gaming, though.
A 4K display with AdobeRGB and 400 cd/m² is also available for professional media editing. This is definitely an option for demanding tasks while on the go. Otherwise, there are so many video ports available that the appropriate monitors can also be connected later.
We didn't notice PWM flickering at different brightness levels.
| |||||||||||||||||||||||||
Brightness Distribution: 83 %
Center on Battery: 349 cd/m²
Contrast: 1091:1 (Black: 0.32 cd/m²)
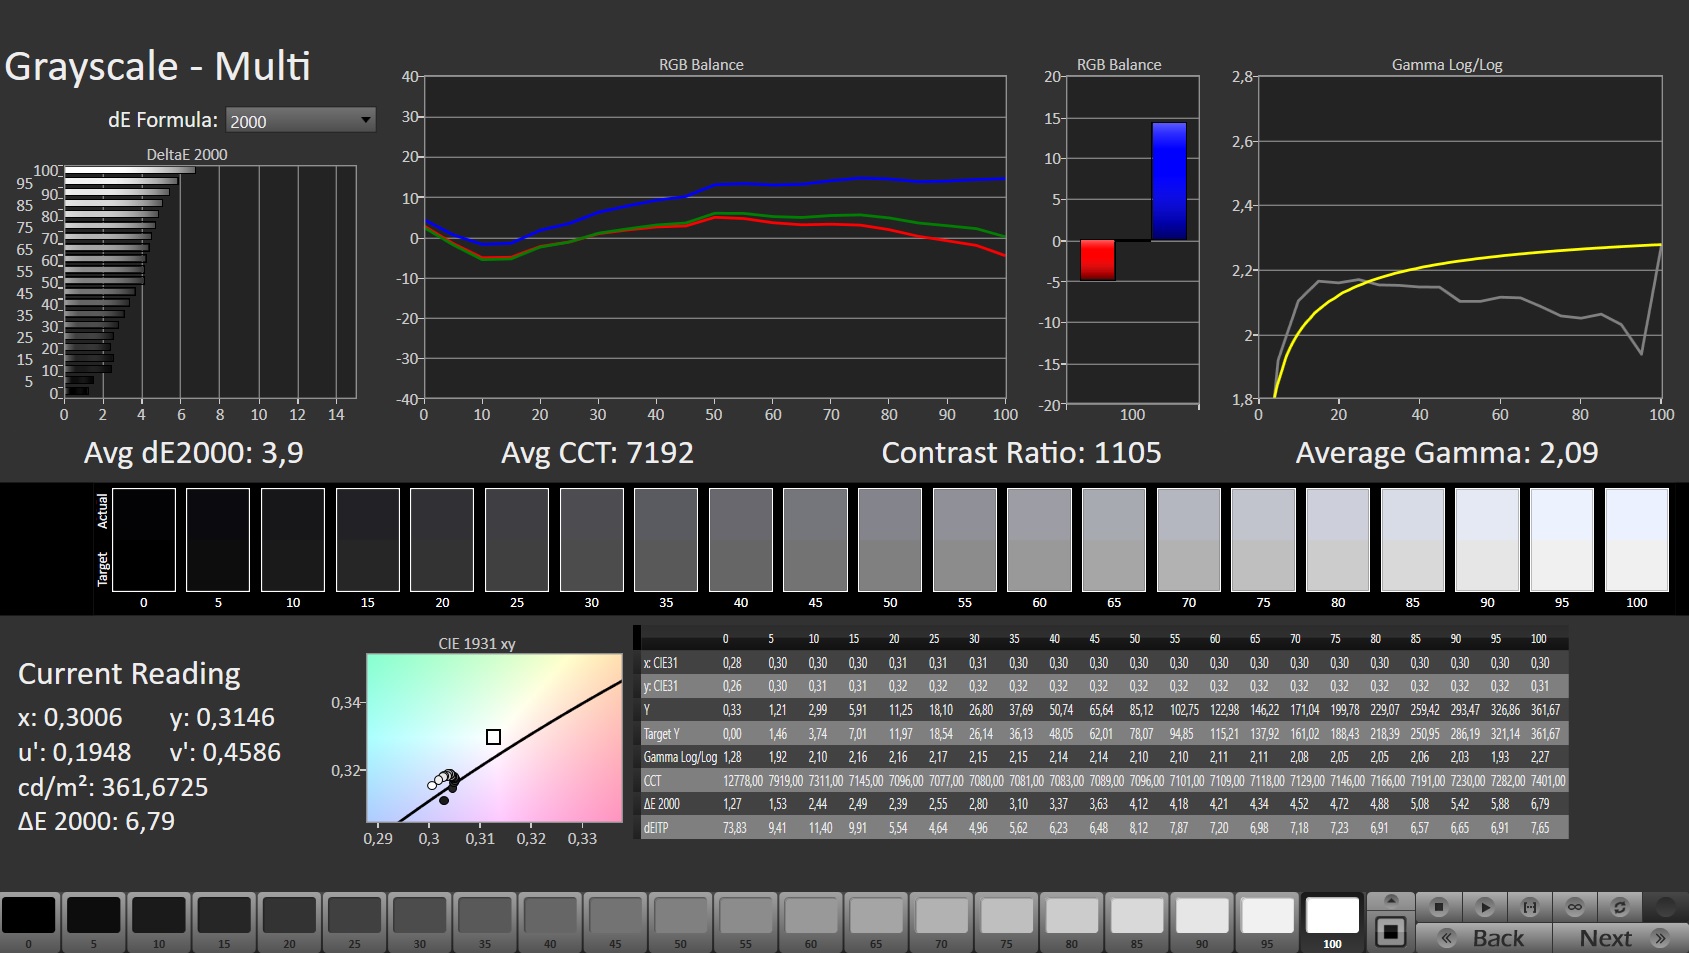
ΔE Color 2.5 | 0.5-29.43 Ø5, calibrated: 0.64
ΔE Greyscale 3.9 | 0.57-98 Ø5.3
85.2% AdobeRGB 1998 (Argyll 2.2.0 3D)
99.9% sRGB (Argyll 2.2.0 3D)
97.5% Display P3 (Argyll 2.2.0 3D)
Gamma: 2.09
| SCHENKER XMG Pro 17 E22 BOE099D, IPS, 2560x1440, 17.30 | MSI Raider GE77 HX 12UHS AU Optronics B173ZAN06.1, IPS, 3840x2160, 17.30 | Acer Predator Triton 500 SE PT516-52s-70KX NE160QDM-NZ2, IPS LED, 2560x1600, 16.00 | SCHENKER XMG Pro 17 (Late 2021, RTX 3080) AUO B173ZAN3.0 (AUO309B), IPS, 3840x2160, 17.30 | Asus ROG Zephyrus Duo 16 GX650RX BOE NE160QAM-NX1, IPS-Level, 3840x2400, 16.00 | MSI Katana GF66 12UGS AU Optronics AUOAF90, IPS, 1920x1080, 15.60 | Alienware x17 R2 P48E AU Optronics B173HAN, IPS, 1920x1080, 17.30 | |
|---|---|---|---|---|---|---|---|
| Display | 0% | 0% | 2% | 1% | -52% | -9% | |
| Display P3 Coverage | 97.5 | 96.6 -1% | 97.3 0% | 87.1 -11% | 98 1% | 39.1 -60% | 79.2 -19% |
| sRGB Coverage | 99.9 | 99.8 0% | 100 0% | 100 0% | 99.9 0% | 58.3 -42% | 99.8 0% |
| AdobeRGB 1998 Coverage | 85.2 | 85.8 1% | 84.9 0% | 100 17% | 86.3 1% | 40.4 -53% | 79.6 -7% |
| Response Times | 6% | -75% | -573% | -76% | -480% | -83% | |
| Response Time Grey 50% / Grey 80% * | 5.4 ? | 5.8 ? -7% | 13.8 ? -156% | 46.8 ? -767% | 14.6 ? -170% | 40 ? -641% | 12.4 ? -130% |
| Response Time Black / White * | 6.8 ? | 5.6 ? 18% | 6.4 ? 6% | 32.6 ? -379% | 5.6 ? 18% | 28.4 ? -318% | 9.2 ? -35% |
| PWM Frequency | |||||||
| Screen | -61% | 21% | -66% | -10% | -79% | -2% | |
| Brightness middle | 349 | 381 9% | 498 43% | 475 36% | 459 32% | 227 -35% | 365.4 5% |
| Brightness | 319 | 371 16% | 468 47% | 451 41% | 434 36% | 225 -29% | 344 8% |
| Brightness Distribution | 83 | 84 1% | 80 -4% | 84 1% | 88 6% | 90 8% | 85 2% |
| Black Level * | 0.32 | 0.52 -63% | 0.36 -13% | 0.34 -6% | 0.44 -38% | 0.21 34% | 0.29 9% |
| Contrast | 1091 | 733 -33% | 1383 27% | 1397 28% | 1043 -4% | 1081 -1% | 1260 15% |
| Colorchecker dE 2000 * | 2.5 | 1.77 29% | 5.84 -134% | 2.97 -19% | 4.19 -68% | 3.17 -27% | |
| Colorchecker dE 2000 max. * | 6.87 | 5.24 24% | 9.97 -45% | 8.13 -18% | 17.45 -154% | 7.69 -12% | |
| Colorchecker dE 2000 calibrated * | 0.64 | 2.53 -295% | 0.63 2% | 3.51 -448% | 1.03 -61% | 3.81 -495% | 0.51 20% |
| Greyscale dE 2000 * | 3.9 | 2.4 38% | 6.56 -68% | 4.9 -26% | 2.7 31% | 5.3 -36% | |
| Gamma | 2.09 105% | 2.14 103% | 2.42 91% | 2.235 98% | 2.208 100% | 2.18 101% | |
| CCT | 7192 90% | 7046 92% | 6376 102% | 6775 96% | 6176 105% | 5879 111% | |
| Total Average (Program / Settings) | -18% /
-32% | -18% /
3% | -212% /
-124% | -28% /
-17% | -204% /
-130% | -31% /
-15% |
* ... smaller is better
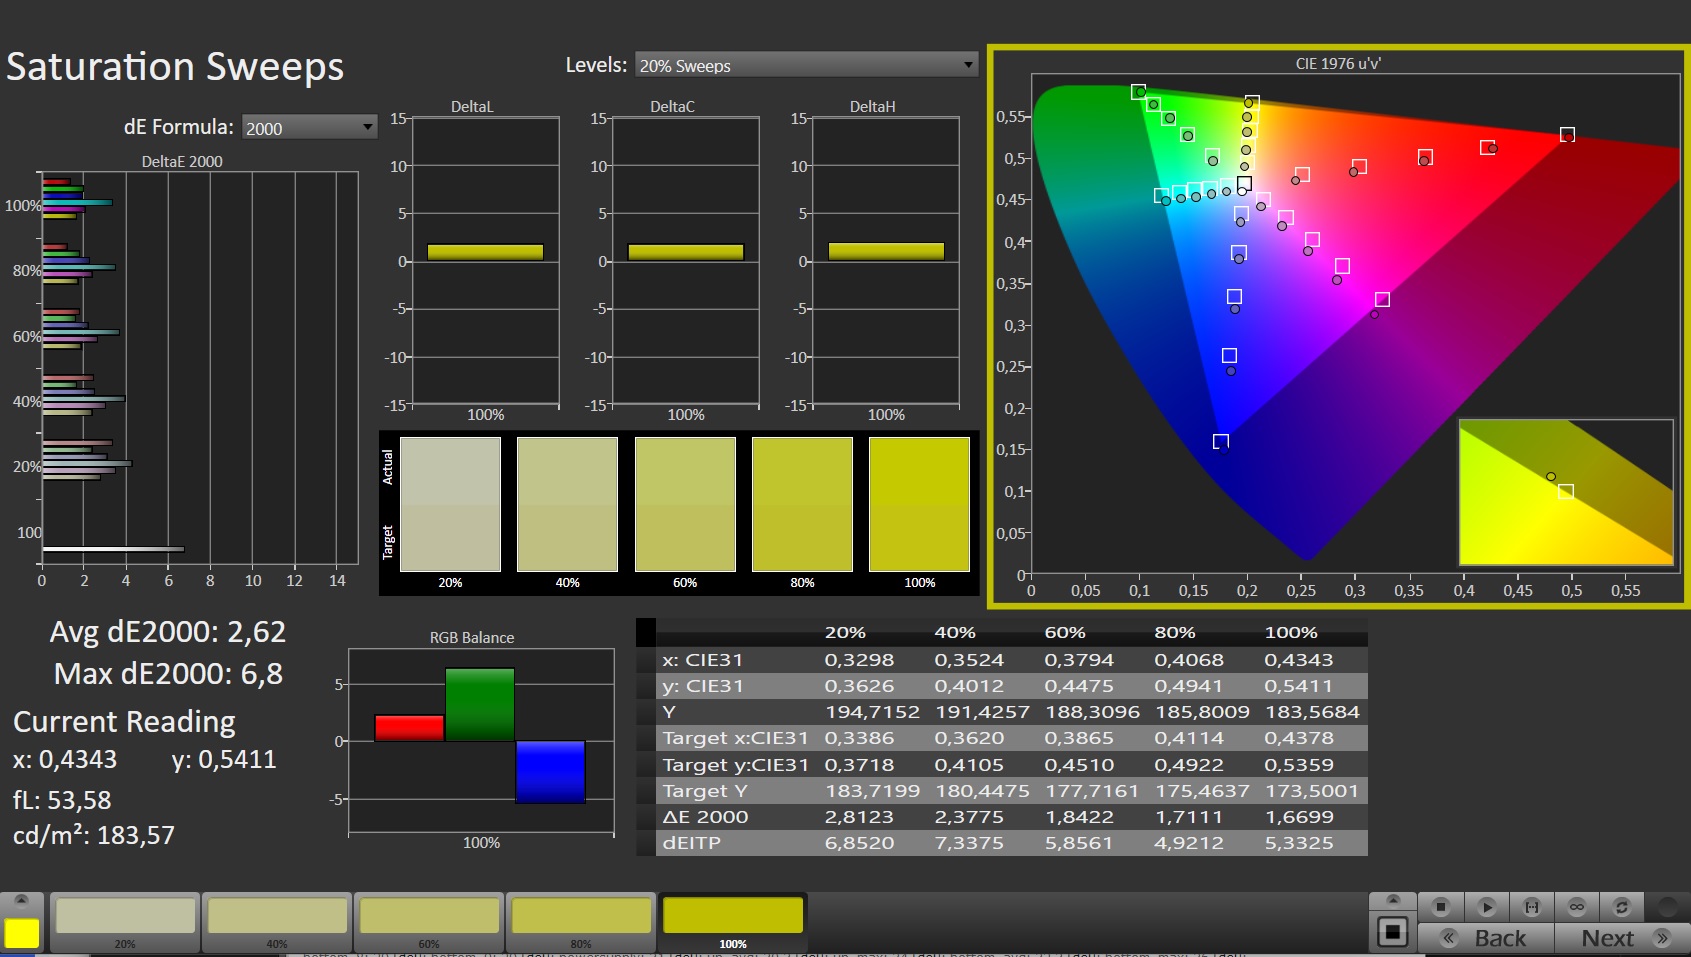
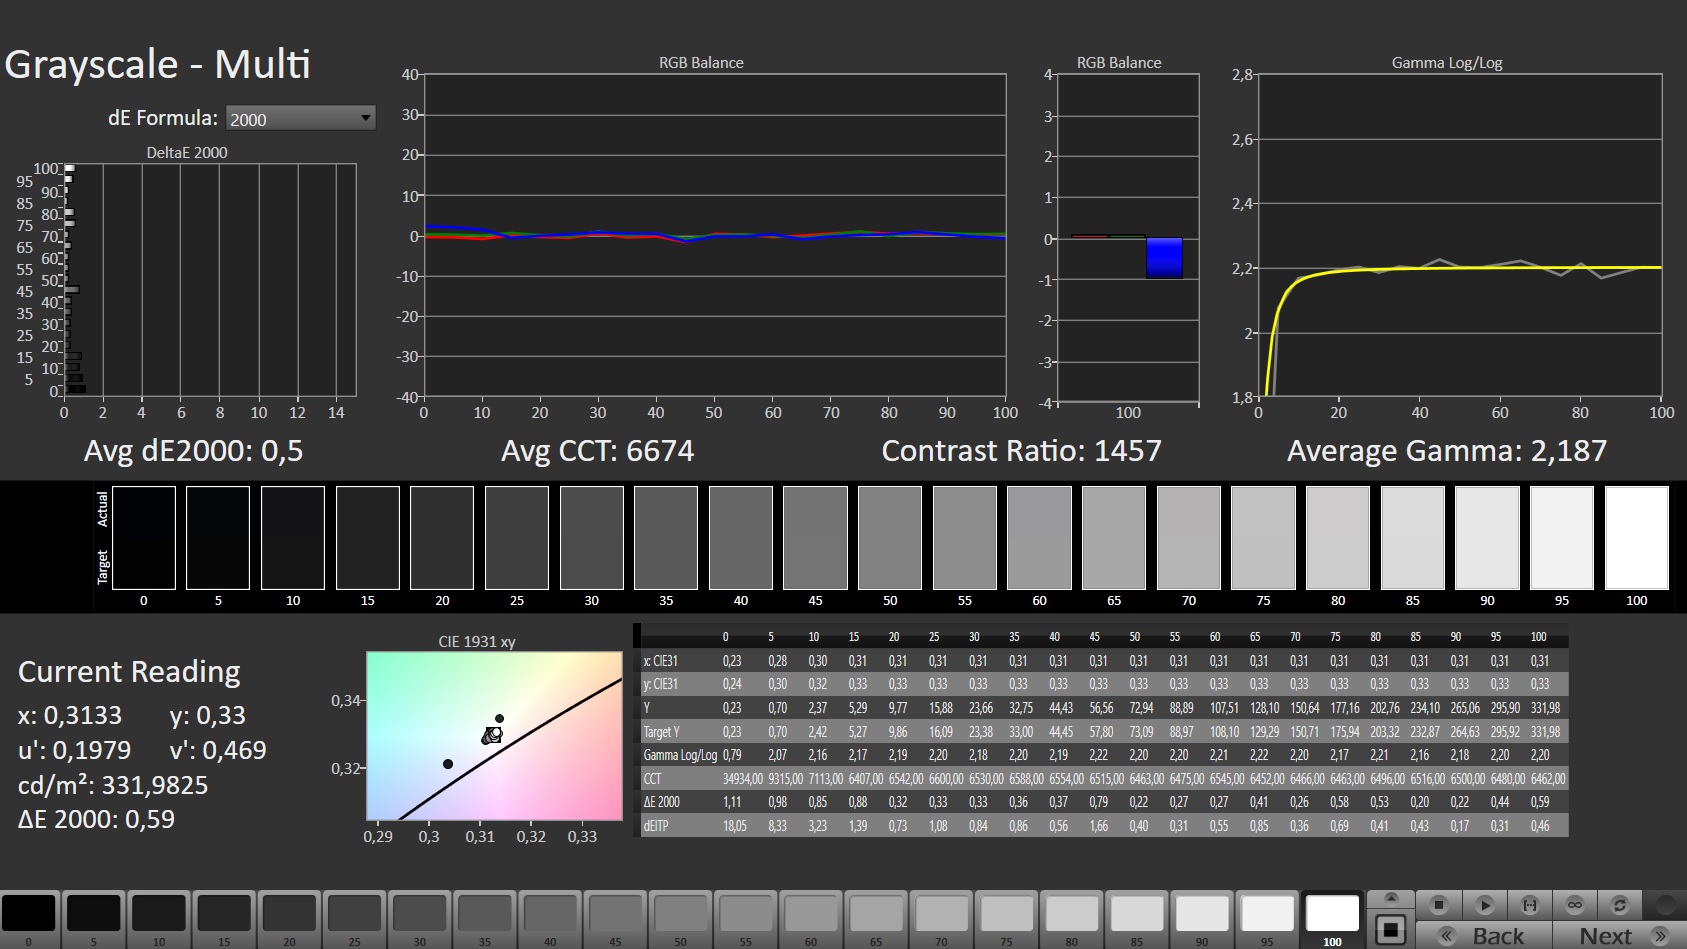
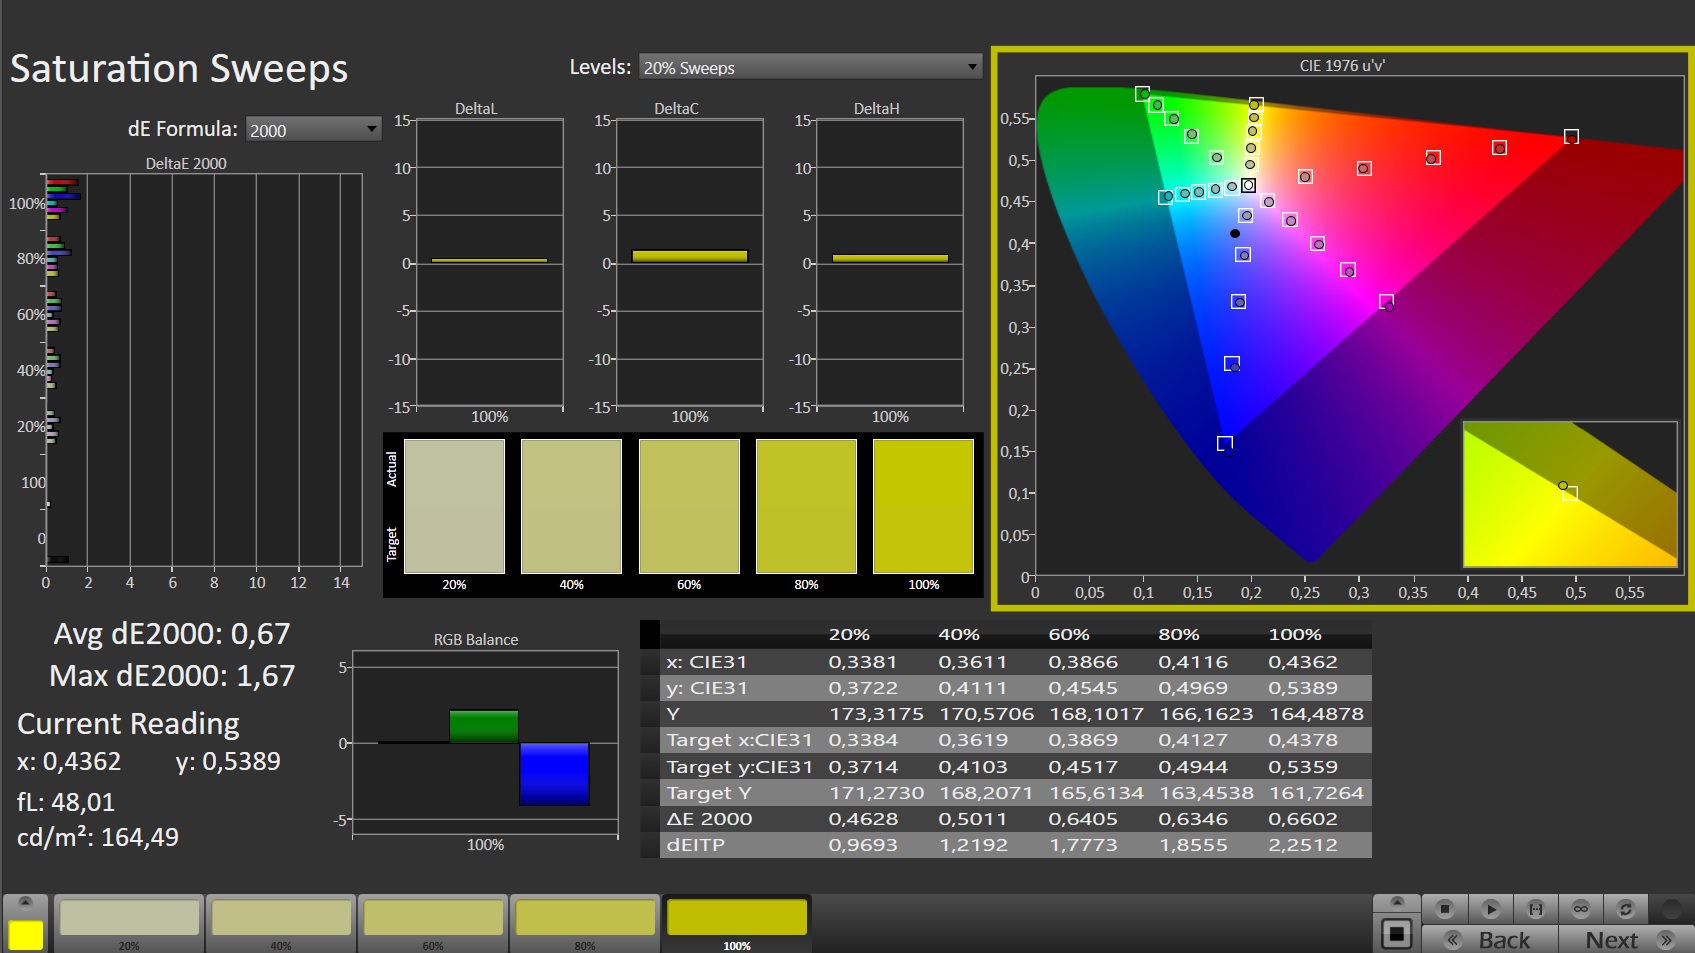
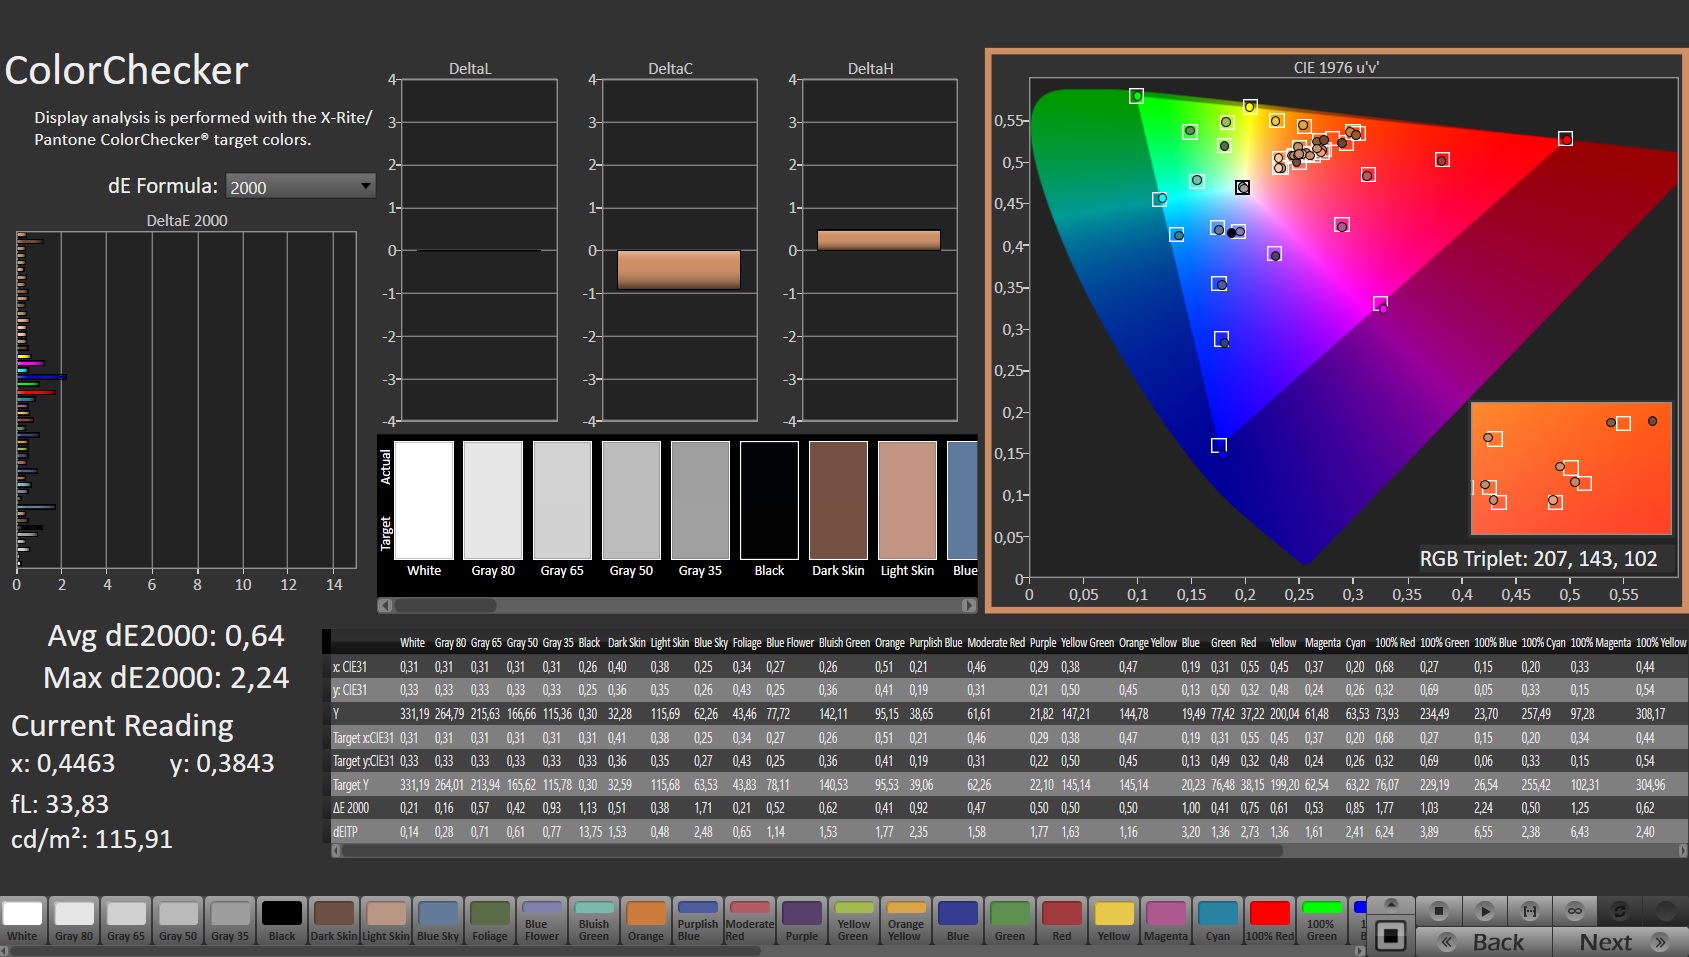
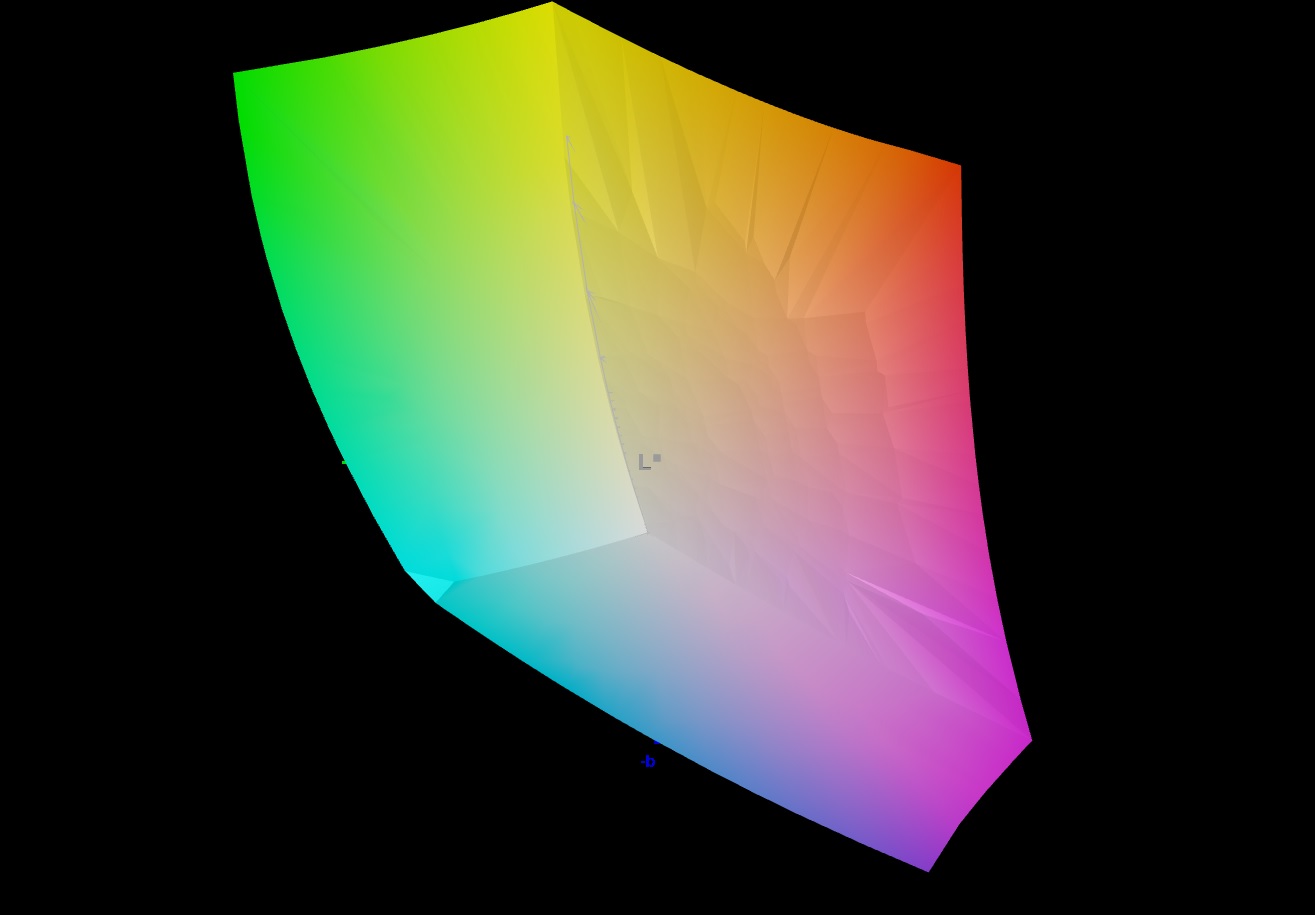
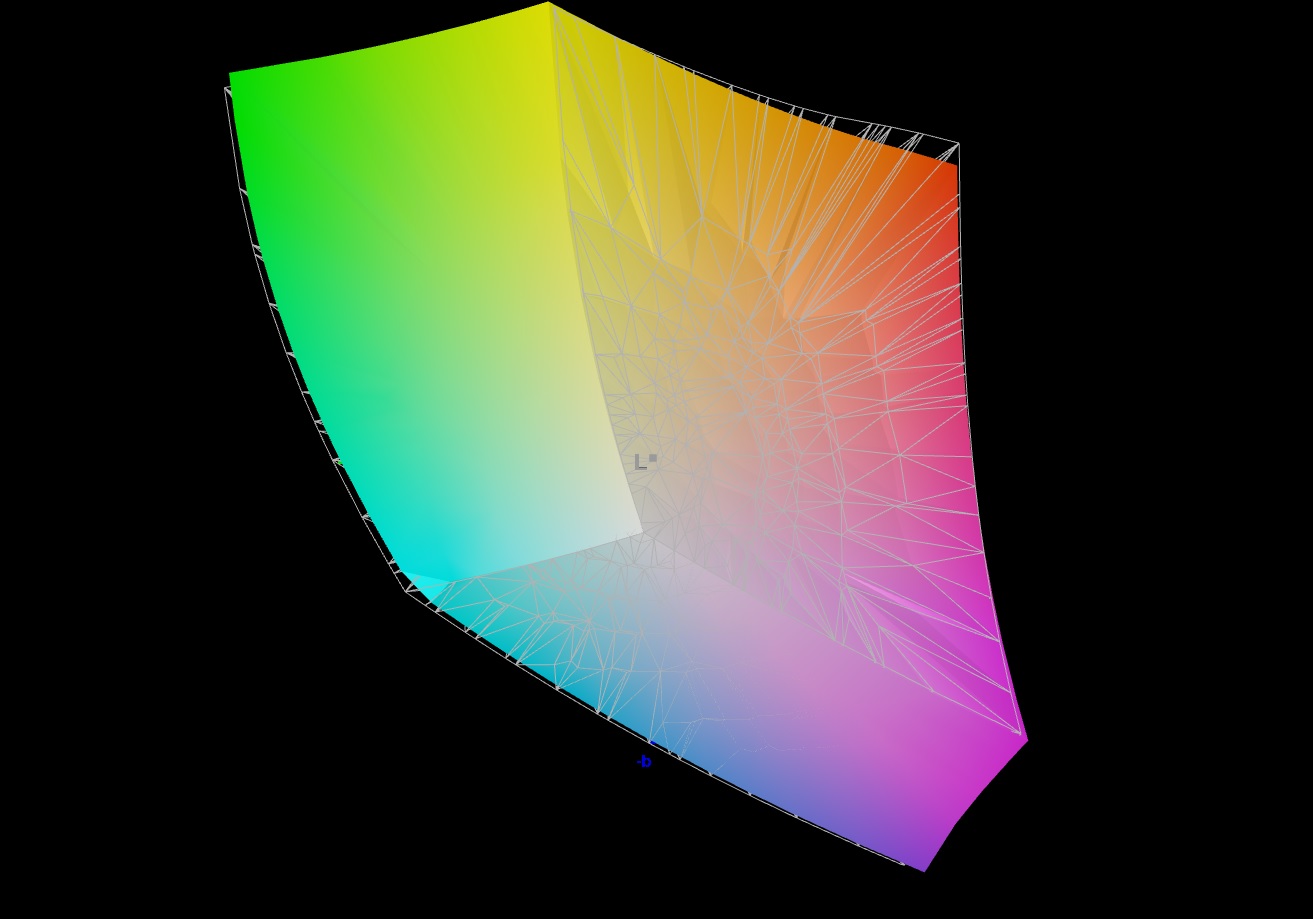
As promised by Schenker, we measure almost complete coverage of the sRGB color space in the XMG Pro 17 E22's display. DCI-P3, which is used in cinema productions, for example, is almost fully covered as well. The AdobeRGB color space, which includes larger green and blue ranges, is still covered by over 80%. In any case, the display proves to be rich in colors.
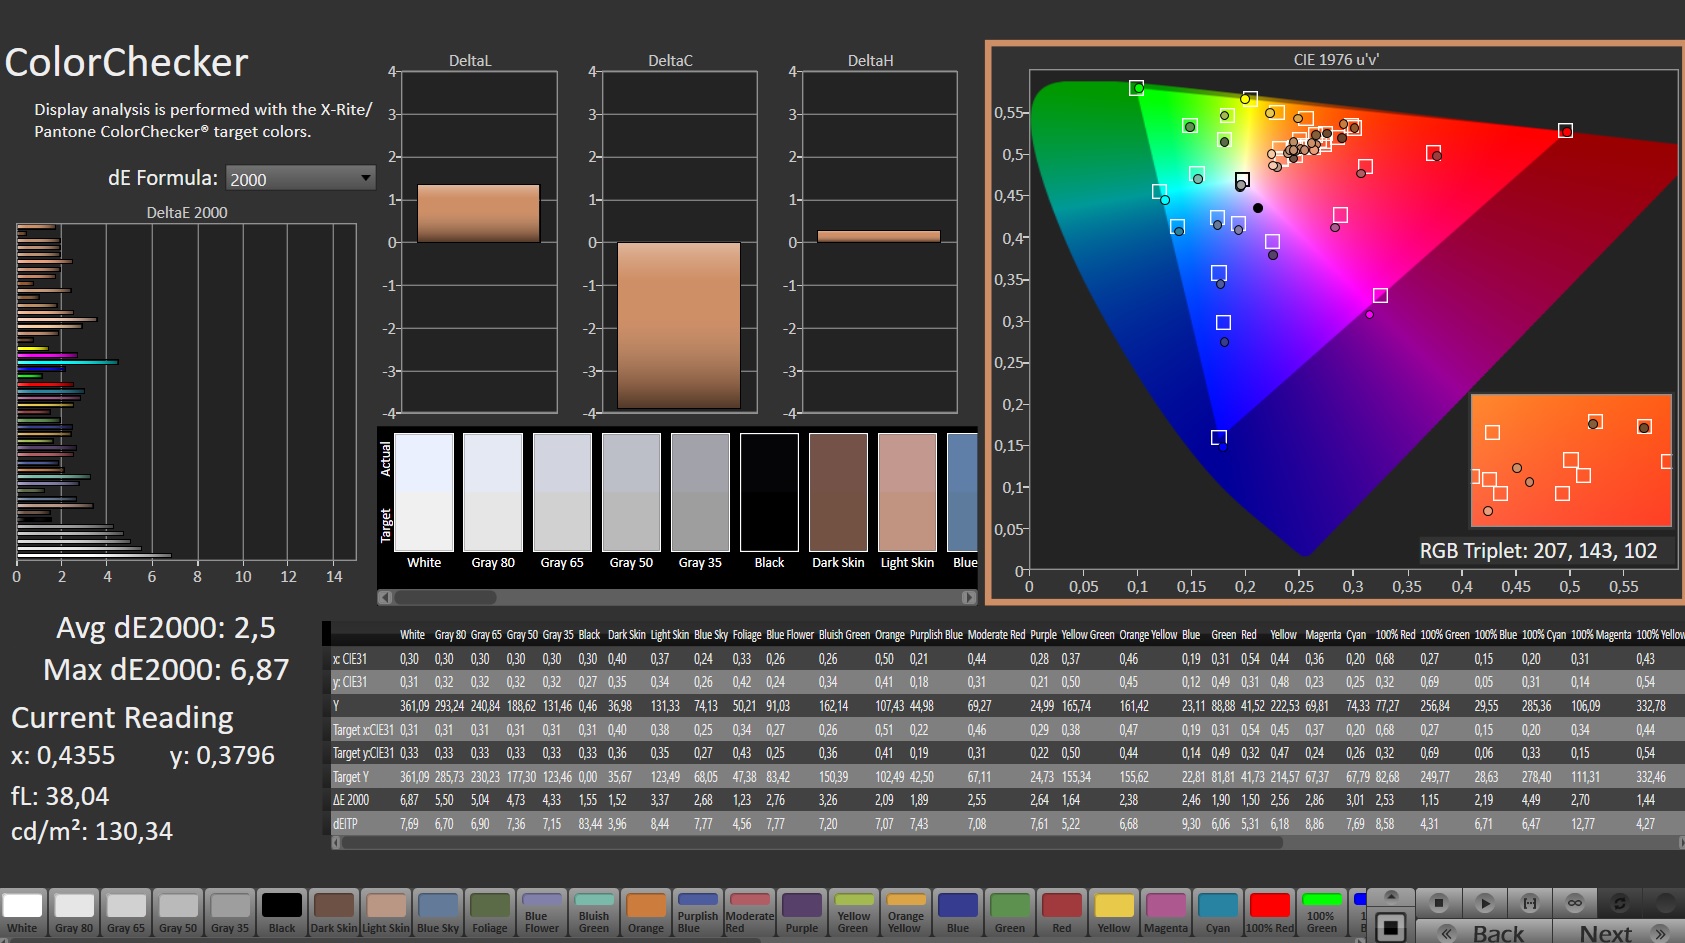
And it's tuned very accurately. Even before calibration, we measure a DeltaE of 2.5. A color deviation of less than 3 is no longer perceptible to the naked eye. The fact that the value drops to only 0.6 afterwards clearly speaks for the panel. The corresponding color profile is available for download in the box containing the display details.

Display Response Times
| ↔ Response Time Black to White | ||
|---|---|---|
| 6.8 ms ... rise ↗ and fall ↘ combined | ↗ 2.9 ms rise | 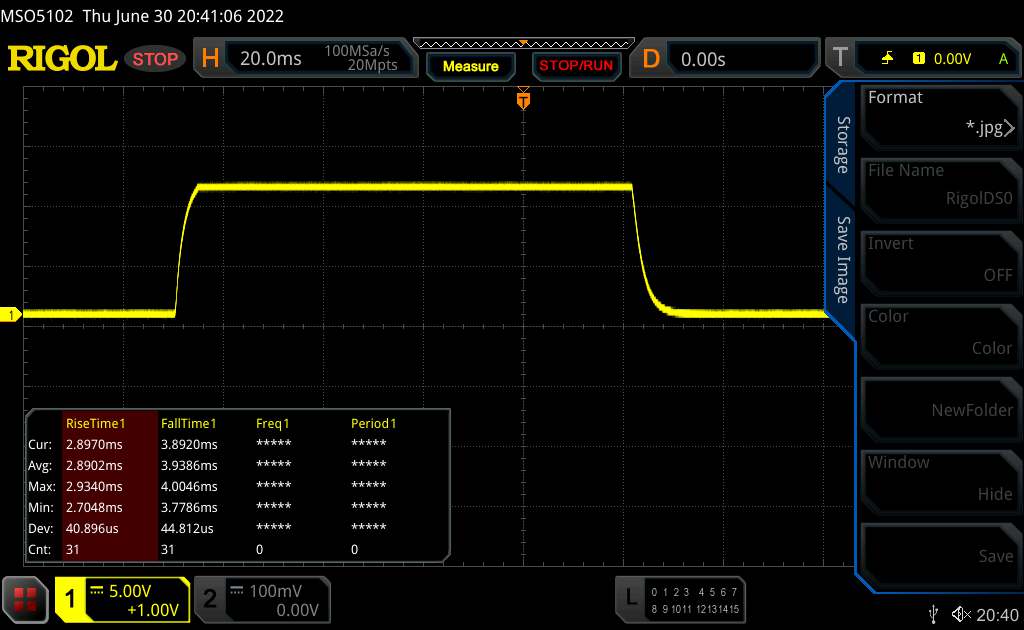 |
| ↘ 3.9 ms fall | ||
| The screen shows very fast response rates in our tests and should be very well suited for fast-paced gaming. In comparison, all tested devices range from 0.1 (minimum) to 240 (maximum) ms. » 15 % of all devices are better. This means that the measured response time is better than the average of all tested devices (21.5 ms). | ||
| ↔ Response Time 50% Grey to 80% Grey | ||
| 5.4 ms ... rise ↗ and fall ↘ combined | ↗ 2.3 ms rise | 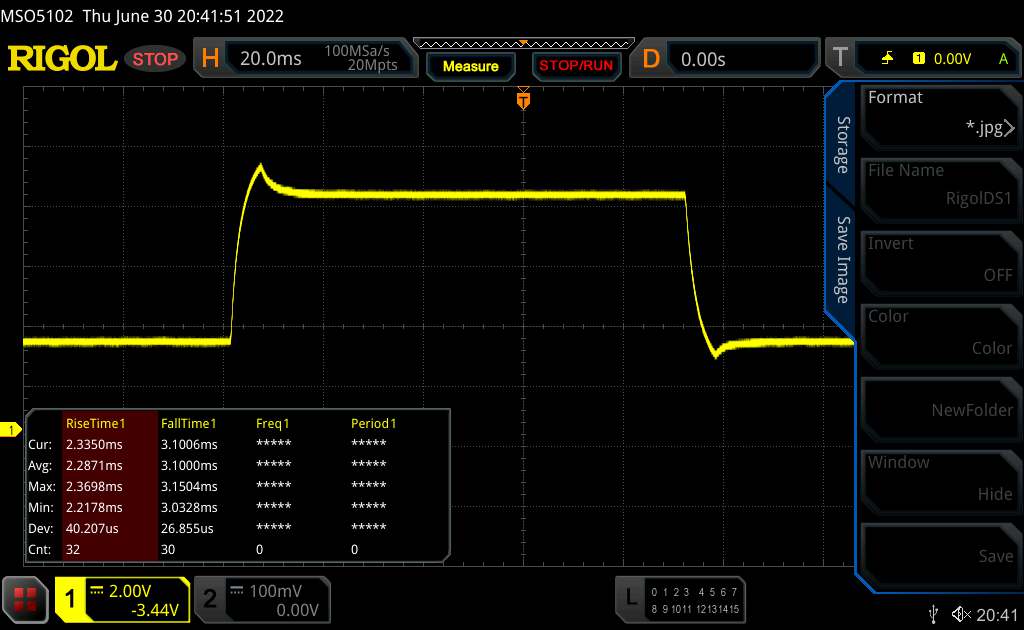 |
| ↘ 3.1 ms fall | ||
| The screen shows very fast response rates in our tests and should be very well suited for fast-paced gaming. In comparison, all tested devices range from 0.2 (minimum) to 636 (maximum) ms. » 12 % of all devices are better. This means that the measured response time is better than the average of all tested devices (33.7 ms). | ||
Screen Flickering / PWM (Pulse-Width Modulation)
| Screen flickering / PWM not detected | 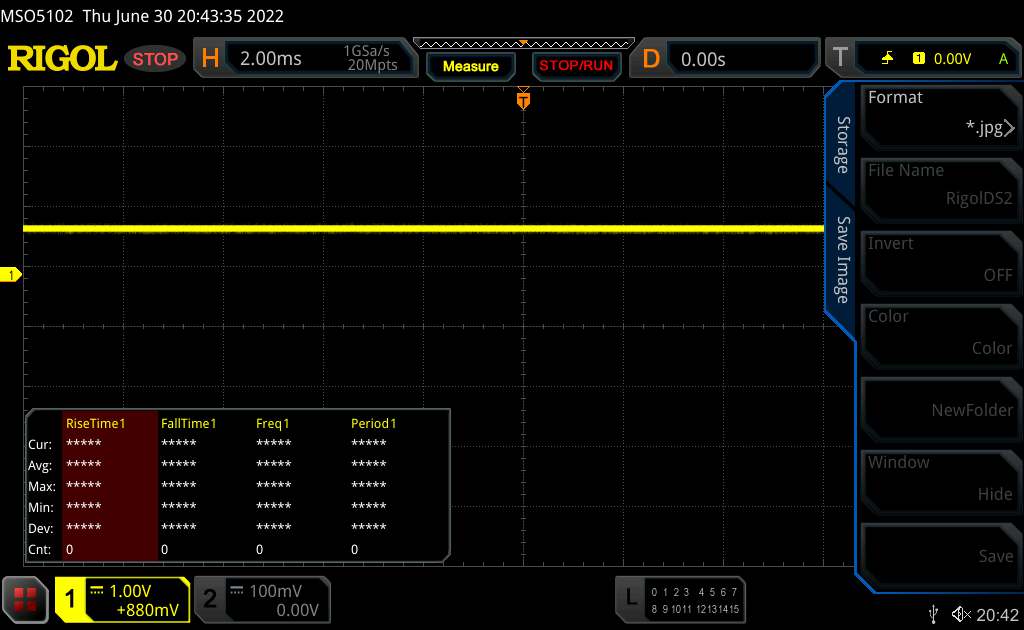 | ||
In comparison: 53 % of all tested devices do not use PWM to dim the display. If PWM was detected, an average of 17900 (minimum: 5 - maximum: 3846000) Hz was measured. | |||
Schenker's gaming laptop isn't necessarily truly portable, which is why the display's usability in sunlight is only rarely requested. Despite a rather low peak brightness, text in particular remains easy to read.
In contrast, colors fade in an environment that is too bright. However, no significant problems should arise on a shady balcony, especially since the slightly matte display does a good job of preventing annoying reflections.
As expected, the IPS panel remains easily legible from any viewing angle. There are no color or contrast changes even far beyond the 45° range.


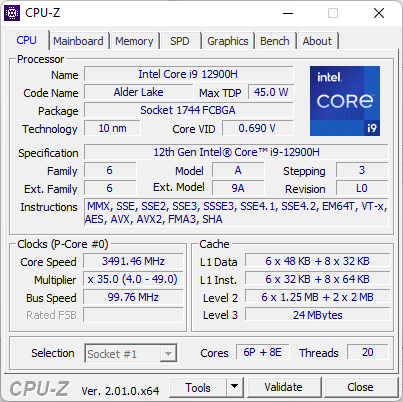
Performance - i9 and RTX 3080 Ti with a lot of headroom
The Schenker XMG Pro 17 E22 certainly doesn't lack performance resources. With the i9-12900H Intel Alder Lake processor and the Nvidia GeForce RTX 3080 Ti, the system uses hardware that has proven to be fast, and it's even well equipped for highly complex programs.
With the i7-12700H and the RTX 3070 Ti, it would still be possible to save on the processor as well as the graphics card. This entry-level variant would still be more than sufficient for modern games, even if some titles couldn't be played at full details. If gaming is the focus, though, the RTX 3080 Ti at least seems quite sensible, while the slightly less powerful processor shouldn't cause any problems.
If the XMG Pro 17 E22 is intended to be a workstation and gaming laptop at the same time, the maximum configuration is recommended, and preferably combined with a minimum of 32 GB of RAM.
Test conditions
The spacious case allows a high power consumption since there's enough room for cooling. For a short time, the processor has 125 watts at its disposal. The graphics card consumes up to 155 watts, where 25 watts can be redirected from the CPU in the form of a "Dynamic Boost".
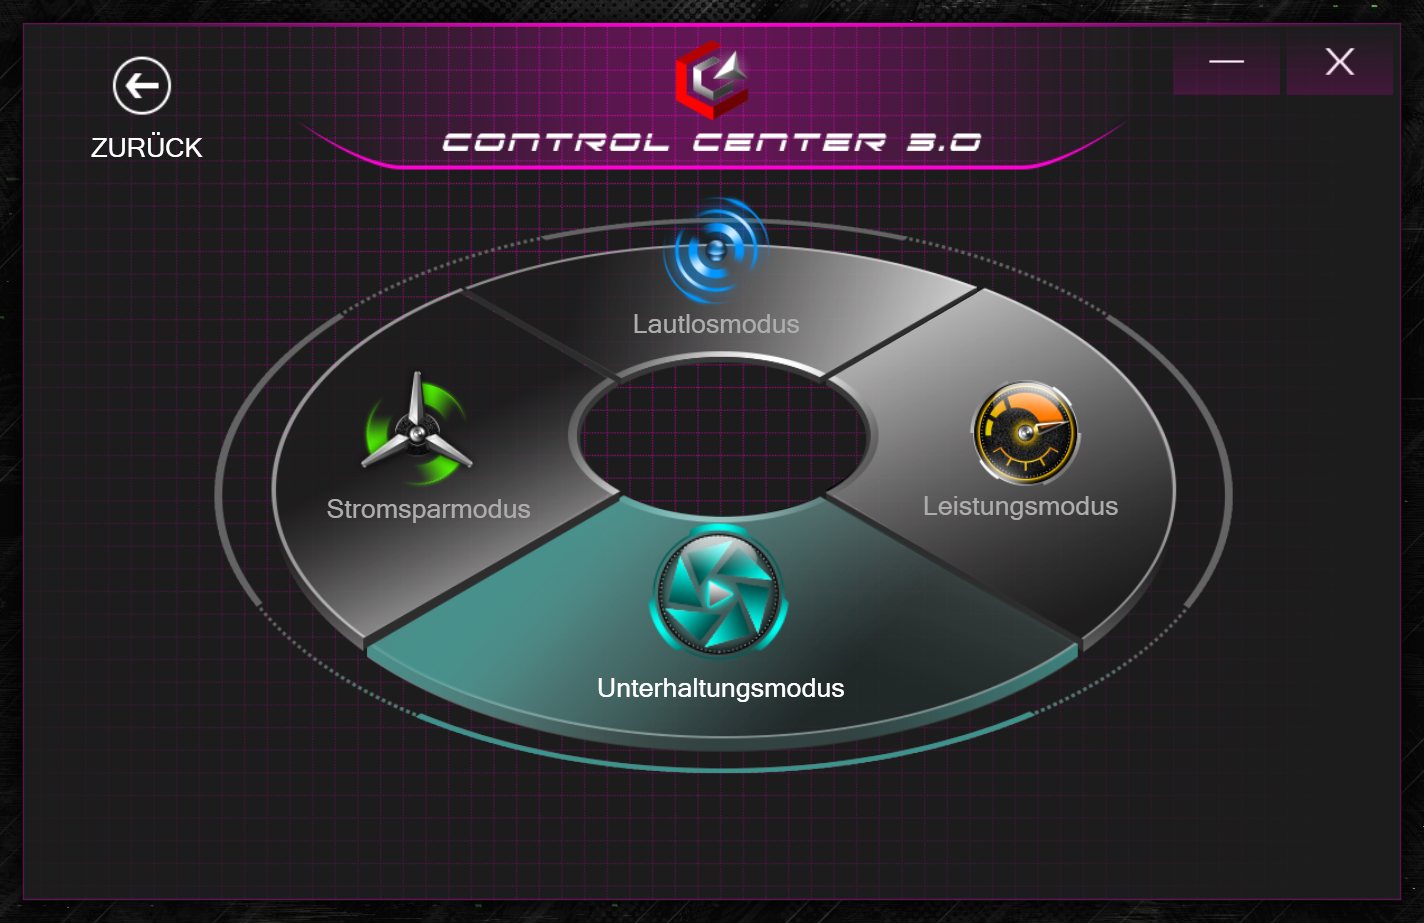
There are four modes available to adapt this performance to the respective task or work environment. We always used Performance Mode for our benchmarks. In addition, there's a slightly scaled-down Entertainment Mode, an incredibly efficient Silent Mode (the name is by no means accurate), and a Power Saving Mode that can add nearly another 10% of battery life when using the laptop on battery power.
Interestingly, power consumption in Silent Mode is set even lower than in Power Saving Mode. This mode is correspondingly cool and quiet, but the fans are always audible, and you can work without having to put up with significant performance losses in everyday tasks.
| Profile | PL1 | PL2 |
|---|---|---|
| Performance Mode | 115 W | 125 W |
| Entertainment Mode | 65 W | 115 W |
| Silent Mode | 35 W | 65 W |
| Power Saving Mode | 45 W | 65 W |
Processor
With a total of 14 cores and 20 threads, there isn't much that can shake the Intel Core i9-12900H. The processor's maximum clock rate of 5 GHz also speaks for its performance. In particular, the "Alder Lake" models can clearly outperform Intel CPUs from previous generations. AMD is also left behind in our Cinebench R15 endurance test. Our CPU Benchmarks article provides a complete overview of the performance rates of the different processors.
However, because Schenker "only" allows a maximum of 125 watts and 115 watts over longer periods of time in the XMG Pro 17 E22, even laptops with the i7-12700H can match it. Other gaming laptops with identical CPUs, such as the Asus ROG Strix Scar 15 G533ZW, simply allow a higher power consumption, which naturally improves the raw processor performance. In this specific case, an increase of 15% in power consumption translates into a 10% gain in results. The extent to which the increased cooling requirement has an impact on the graphics performance is another story, though.
Processing power is greatly reduced in battery mode. The processor is only allowed just under 25 watts. The registered clock rates also drop from 3.5 to 1.5 GHz. Consequently, the scores in Cinebench R15 drop to about one half compared to the maximum performance.
Cinebench R15 Multi endurance test
Cinebench R23: Multi Core | Single Core
Cinebench R20: CPU (Multi Core) | CPU (Single Core)
Cinebench R15: CPU Multi 64Bit | CPU Single 64Bit
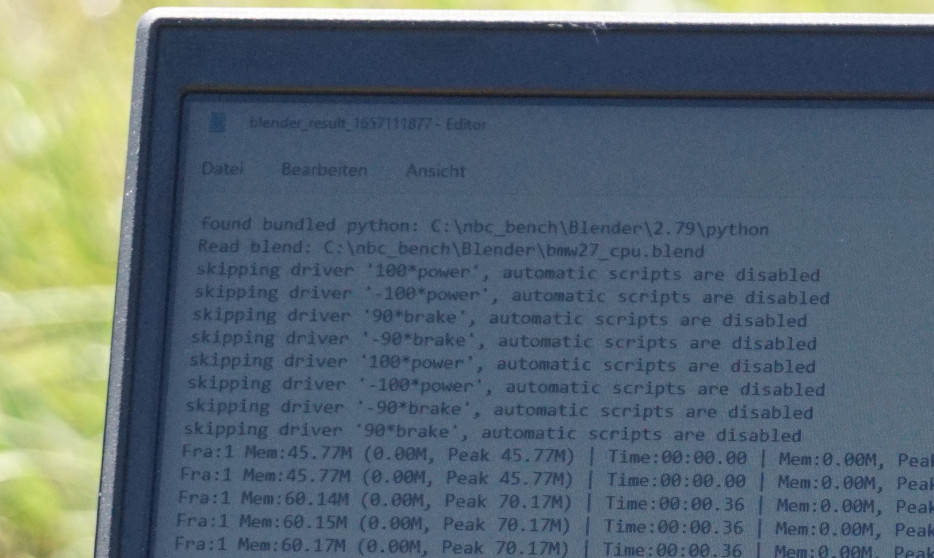
Blender: v2.79 BMW27 CPU
7-Zip 18.03: 7z b 4 | 7z b 4 -mmt1
Geekbench 5.5: Multi-Core | Single-Core
HWBOT x265 Benchmark v2.2: 4k Preset
LibreOffice : 20 Documents To PDF
R Benchmark 2.5: Overall mean
| CPU Performance Rating | |
| MSI Raider GE77 HX 12UHS | |
| Alienware x17 R2 P48E | |
| Average of class Gaming | |
| SCHENKER XMG Pro 17 E22 | |
| Acer Predator Triton 500 SE PT516-52s-70KX | |
| Average Intel Core i9-12900H | |
| MSI Katana GF66 12UGS | |
| Asus ROG Zephyrus Duo 16 GX650RX | |
| SCHENKER XMG Pro 17 (Late 2021, RTX 3080) | |
| Cinebench R23 / Multi Core | |
| MSI Raider GE77 HX 12UHS | |
| Average of class Gaming (2435 - 34613, n=230, last 2 years) | |
| Alienware x17 R2 P48E | |
| MSI Katana GF66 12UGS | |
| SCHENKER XMG Pro 17 E22 | |
| Acer Predator Triton 500 SE PT516-52s-70KX | |
| Average Intel Core i9-12900H (7359 - 19648, n=25) | |
| Asus ROG Zephyrus Duo 16 GX650RX | |
| SCHENKER XMG Pro 17 (Late 2021, RTX 3080) | |
| Cinebench R23 / Single Core | |
| SCHENKER XMG Pro 17 E22 | |
| MSI Raider GE77 HX 12UHS | |
| Alienware x17 R2 P48E | |
| MSI Katana GF66 12UGS | |
| Average Intel Core i9-12900H (1634 - 1921, n=25) | |
| Average of class Gaming (527 - 2235, n=228, last 2 years) | |
| Acer Predator Triton 500 SE PT516-52s-70KX | |
| Asus ROG Zephyrus Duo 16 GX650RX | |
| SCHENKER XMG Pro 17 (Late 2021, RTX 3080) | |
| Cinebench R20 / CPU (Multi Core) | |
| MSI Raider GE77 HX 12UHS | |
| Average of class Gaming (930 - 13769, n=228, last 2 years) | |
| Alienware x17 R2 P48E | |
| SCHENKER XMG Pro 17 E22 | |
| MSI Katana GF66 12UGS | |
| Acer Predator Triton 500 SE PT516-52s-70KX | |
| Average Intel Core i9-12900H (2681 - 7471, n=25) | |
| Asus ROG Zephyrus Duo 16 GX650RX | |
| SCHENKER XMG Pro 17 (Late 2021, RTX 3080) | |
| Cinebench R20 / CPU (Single Core) | |
| MSI Raider GE77 HX 12UHS | |
| SCHENKER XMG Pro 17 E22 | |
| Alienware x17 R2 P48E | |
| Average Intel Core i9-12900H (624 - 738, n=25) | |
| MSI Katana GF66 12UGS | |
| Average of class Gaming (169 - 855, n=228, last 2 years) | |
| Acer Predator Triton 500 SE PT516-52s-70KX | |
| Asus ROG Zephyrus Duo 16 GX650RX | |
| SCHENKER XMG Pro 17 (Late 2021, RTX 3080) | |
| Cinebench R15 / CPU Multi 64Bit | |
| MSI Raider GE77 HX 12UHS | |
| Average of class Gaming (400 - 5663, n=232, last 2 years) | |
| Alienware x17 R2 P48E | |
| MSI Katana GF66 12UGS | |
| MSI Katana GF66 12UGS | |
| SCHENKER XMG Pro 17 E22 | |
| Acer Predator Triton 500 SE PT516-52s-70KX | |
| Average Intel Core i9-12900H (1395 - 3077, n=25) | |
| Asus ROG Zephyrus Duo 16 GX650RX | |
| SCHENKER XMG Pro 17 (Late 2021, RTX 3080) | |
| Cinebench R15 / CPU Single 64Bit | |
| MSI Raider GE77 HX 12UHS | |
| SCHENKER XMG Pro 17 E22 | |
| Alienware x17 R2 P48E | |
| Average of class Gaming (79.2 - 318, n=231, last 2 years) | |
| MSI Katana GF66 12UGS | |
| MSI Katana GF66 12UGS | |
| Average Intel Core i9-12900H (235 - 277, n=26) | |
| Asus ROG Zephyrus Duo 16 GX650RX | |
| Acer Predator Triton 500 SE PT516-52s-70KX | |
| SCHENKER XMG Pro 17 (Late 2021, RTX 3080) | |
| Blender / v2.79 BMW27 CPU | |
| MSI Katana GF66 12UGS | |
| SCHENKER XMG Pro 17 (Late 2021, RTX 3080) | |
| Average Intel Core i9-12900H (160 - 451, n=25) | |
| Asus ROG Zephyrus Duo 16 GX650RX | |
| Average of class Gaming (87 - 1259, n=226, last 2 years) | |
| Acer Predator Triton 500 SE PT516-52s-70KX | |
| SCHENKER XMG Pro 17 E22 | |
| Alienware x17 R2 P48E | |
| MSI Raider GE77 HX 12UHS | |
| 7-Zip 18.03 / 7z b 4 | |
| MSI Raider GE77 HX 12UHS | |
| Average of class Gaming (11386 - 140932, n=227, last 2 years) | |
| Alienware x17 R2 P48E | |
| SCHENKER XMG Pro 17 E22 | |
| Acer Predator Triton 500 SE PT516-52s-70KX | |
| Asus ROG Zephyrus Duo 16 GX650RX | |
| Average Intel Core i9-12900H (34684 - 76677, n=25) | |
| MSI Katana GF66 12UGS | |
| SCHENKER XMG Pro 17 (Late 2021, RTX 3080) | |
| 7-Zip 18.03 / 7z b 4 -mmt1 | |
| MSI Raider GE77 HX 12UHS | |
| Average of class Gaming (2685 - 7581, n=227, last 2 years) | |
| SCHENKER XMG Pro 17 E22 | |
| MSI Katana GF66 12UGS | |
| Average Intel Core i9-12900H (5302 - 6289, n=25) | |
| Alienware x17 R2 P48E | |
| Asus ROG Zephyrus Duo 16 GX650RX | |
| SCHENKER XMG Pro 17 (Late 2021, RTX 3080) | |
| Acer Predator Triton 500 SE PT516-52s-70KX | |
| Geekbench 5.5 / Multi-Core | |
| MSI Raider GE77 HX 12UHS | |
| Alienware x17 R2 P48E | |
| Average of class Gaming (1946 - 22200, n=232, last 2 years) | |
| Acer Predator Triton 500 SE PT516-52s-70KX | |
| SCHENKER XMG Pro 17 E22 | |
| Average Intel Core i9-12900H (8519 - 14376, n=26) | |
| MSI Katana GF66 12UGS | |
| Asus ROG Zephyrus Duo 16 GX650RX | |
| SCHENKER XMG Pro 17 (Late 2021, RTX 3080) | |
| Geekbench 5.5 / Single-Core | |
| MSI Raider GE77 HX 12UHS | |
| Alienware x17 R2 P48E | |
| SCHENKER XMG Pro 17 E22 | |
| Average of class Gaming (158 - 2210, n=232, last 2 years) | |
| Average Intel Core i9-12900H (1631 - 1892, n=26) | |
| MSI Katana GF66 12UGS | |
| Acer Predator Triton 500 SE PT516-52s-70KX | |
| SCHENKER XMG Pro 17 (Late 2021, RTX 3080) | |
| Asus ROG Zephyrus Duo 16 GX650RX | |
| HWBOT x265 Benchmark v2.2 / 4k Preset | |
| MSI Raider GE77 HX 12UHS | |
| Alienware x17 R2 P48E | |
| Average of class Gaming (3 - 37.6, n=230, last 2 years) | |
| SCHENKER XMG Pro 17 E22 | |
| Acer Predator Triton 500 SE PT516-52s-70KX | |
| Asus ROG Zephyrus Duo 16 GX650RX | |
| Average Intel Core i9-12900H (8.05 - 22.5, n=25) | |
| SCHENKER XMG Pro 17 (Late 2021, RTX 3080) | |
| MSI Katana GF66 12UGS | |
| LibreOffice / 20 Documents To PDF | |
| Average of class Gaming (32.8 - 332, n=224, last 2 years) | |
| SCHENKER XMG Pro 17 (Late 2021, RTX 3080) | |
| Asus ROG Zephyrus Duo 16 GX650RX | |
| Average Intel Core i9-12900H (36.8 - 59.8, n=25) | |
| MSI Raider GE77 HX 12UHS | |
| Acer Predator Triton 500 SE PT516-52s-70KX | |
| Alienware x17 R2 P48E | |
| SCHENKER XMG Pro 17 E22 | |
| MSI Katana GF66 12UGS | |
| R Benchmark 2.5 / Overall mean | |
| SCHENKER XMG Pro 17 (Late 2021, RTX 3080) | |
| Asus ROG Zephyrus Duo 16 GX650RX | |
| Average of class Gaming (0.3609 - 4.47, n=227, last 2 years) | |
| Acer Predator Triton 500 SE PT516-52s-70KX | |
| Average Intel Core i9-12900H (0.4218 - 0.506, n=25) | |
| MSI Katana GF66 12UGS | |
| SCHENKER XMG Pro 17 E22 | |
| Alienware x17 R2 P48E | |
| MSI Raider GE77 HX 12UHS | |
* ... smaller is better
AIDA64: FP32 Ray-Trace | FPU Julia | CPU SHA3 | CPU Queen | FPU SinJulia | FPU Mandel | CPU AES | CPU ZLib | FP64 Ray-Trace | CPU PhotoWorxx
| Performance Rating | |
| MSI Raider GE77 HX 12UHS | |
| Average of class Gaming | |
| Asus ROG Zephyrus Duo 16 GX650RX | |
| SCHENKER XMG Pro 17 (Late 2021, RTX 3080) | |
| Alienware x17 R2 P48E | |
| Acer Predator Triton 500 SE PT516-52s-70KX | |
| Average Intel Core i9-12900H | |
| SCHENKER XMG Pro 17 E22 | |
| MSI Katana GF66 12UGS | |
| AIDA64 / FP32 Ray-Trace | |
| MSI Raider GE77 HX 12UHS | |
| Average of class Gaming (3069 - 60169, n=223, last 2 years) | |
| Asus ROG Zephyrus Duo 16 GX650RX | |
| SCHENKER XMG Pro 17 (Late 2021, RTX 3080) | |
| Average Intel Core i9-12900H (4074 - 18289, n=25) | |
| Alienware x17 R2 P48E | |
| Acer Predator Triton 500 SE PT516-52s-70KX | |
| MSI Katana GF66 12UGS | |
| SCHENKER XMG Pro 17 E22 | |
| AIDA64 / FPU Julia | |
| MSI Raider GE77 HX 12UHS | |
| Asus ROG Zephyrus Duo 16 GX650RX | |
| Average of class Gaming (18567 - 252486, n=223, last 2 years) | |
| SCHENKER XMG Pro 17 (Late 2021, RTX 3080) | |
| Average Intel Core i9-12900H (22307 - 93236, n=25) | |
| Alienware x17 R2 P48E | |
| Acer Predator Triton 500 SE PT516-52s-70KX | |
| MSI Katana GF66 12UGS | |
| SCHENKER XMG Pro 17 E22 | |
| AIDA64 / CPU SHA3 | |
| MSI Raider GE77 HX 12UHS | |
| Average of class Gaming (629 - 10389, n=223, last 2 years) | |
| SCHENKER XMG Pro 17 (Late 2021, RTX 3080) | |
| Asus ROG Zephyrus Duo 16 GX650RX | |
| Alienware x17 R2 P48E | |
| Acer Predator Triton 500 SE PT516-52s-70KX | |
| Average Intel Core i9-12900H (1378 - 4215, n=25) | |
| SCHENKER XMG Pro 17 E22 | |
| MSI Katana GF66 12UGS | |
| AIDA64 / CPU Queen | |
| Average of class Gaming (15371 - 200651, n=223, last 2 years) | |
| Alienware x17 R2 P48E | |
| SCHENKER XMG Pro 17 E22 | |
| Asus ROG Zephyrus Duo 16 GX650RX | |
| MSI Raider GE77 HX 12UHS | |
| Average Intel Core i9-12900H (78172 - 111241, n=25) | |
| MSI Katana GF66 12UGS | |
| Acer Predator Triton 500 SE PT516-52s-70KX | |
| SCHENKER XMG Pro 17 (Late 2021, RTX 3080) | |
| AIDA64 / FPU SinJulia | |
| Asus ROG Zephyrus Duo 16 GX650RX | |
| MSI Raider GE77 HX 12UHS | |
| Average of class Gaming (2137 - 32988, n=223, last 2 years) | |
| Alienware x17 R2 P48E | |
| Acer Predator Triton 500 SE PT516-52s-70KX | |
| SCHENKER XMG Pro 17 (Late 2021, RTX 3080) | |
| MSI Katana GF66 12UGS | |
| SCHENKER XMG Pro 17 E22 | |
| Average Intel Core i9-12900H (5709 - 10410, n=25) | |
| AIDA64 / FPU Mandel | |
| Asus ROG Zephyrus Duo 16 GX650RX | |
| MSI Raider GE77 HX 12UHS | |
| Average of class Gaming (10291 - 134044, n=223, last 2 years) | |
| SCHENKER XMG Pro 17 (Late 2021, RTX 3080) | |
| Average Intel Core i9-12900H (11257 - 45581, n=25) | |
| Alienware x17 R2 P48E | |
| Acer Predator Triton 500 SE PT516-52s-70KX | |
| MSI Katana GF66 12UGS | |
| SCHENKER XMG Pro 17 E22 | |
| AIDA64 / CPU AES | |
| MSI Raider GE77 HX 12UHS | |
| SCHENKER XMG Pro 17 (Late 2021, RTX 3080) | |
| Asus ROG Zephyrus Duo 16 GX650RX | |
| Average of class Gaming (19065 - 328679, n=223, last 2 years) | |
| Alienware x17 R2 P48E | |
| Acer Predator Triton 500 SE PT516-52s-70KX | |
| SCHENKER XMG Pro 17 E22 | |
| MSI Katana GF66 12UGS | |
| Average Intel Core i9-12900H (31935 - 151546, n=25) | |
| AIDA64 / CPU ZLib | |
| MSI Raider GE77 HX 12UHS | |
| Average of class Gaming (150.9 - 2409, n=223, last 2 years) | |
| Alienware x17 R2 P48E | |
| Acer Predator Triton 500 SE PT516-52s-70KX | |
| SCHENKER XMG Pro 17 E22 | |
| MSI Katana GF66 12UGS | |
| Average Intel Core i9-12900H (449 - 1193, n=25) | |
| Asus ROG Zephyrus Duo 16 GX650RX | |
| SCHENKER XMG Pro 17 (Late 2021, RTX 3080) | |
| AIDA64 / FP64 Ray-Trace | |
| MSI Raider GE77 HX 12UHS | |
| Average of class Gaming (1518 - 31796, n=223, last 2 years) | |
| Asus ROG Zephyrus Duo 16 GX650RX | |
| SCHENKER XMG Pro 17 (Late 2021, RTX 3080) | |
| Average Intel Core i9-12900H (2235 - 10511, n=25) | |
| Alienware x17 R2 P48E | |
| Acer Predator Triton 500 SE PT516-52s-70KX | |
| MSI Katana GF66 12UGS | |
| SCHENKER XMG Pro 17 E22 | |
| AIDA64 / CPU PhotoWorxx | |
| MSI Raider GE77 HX 12UHS | |
| Average Intel Core i9-12900H (20960 - 48269, n=26) | |
| Average of class Gaming (10805 - 60161, n=224, last 2 years) | |
| Acer Predator Triton 500 SE PT516-52s-70KX | |
| Alienware x17 R2 P48E | |
| Asus ROG Zephyrus Duo 16 GX650RX | |
| SCHENKER XMG Pro 17 E22 | |
| MSI Katana GF66 12UGS | |
| SCHENKER XMG Pro 17 (Late 2021, RTX 3080) | |
System performance
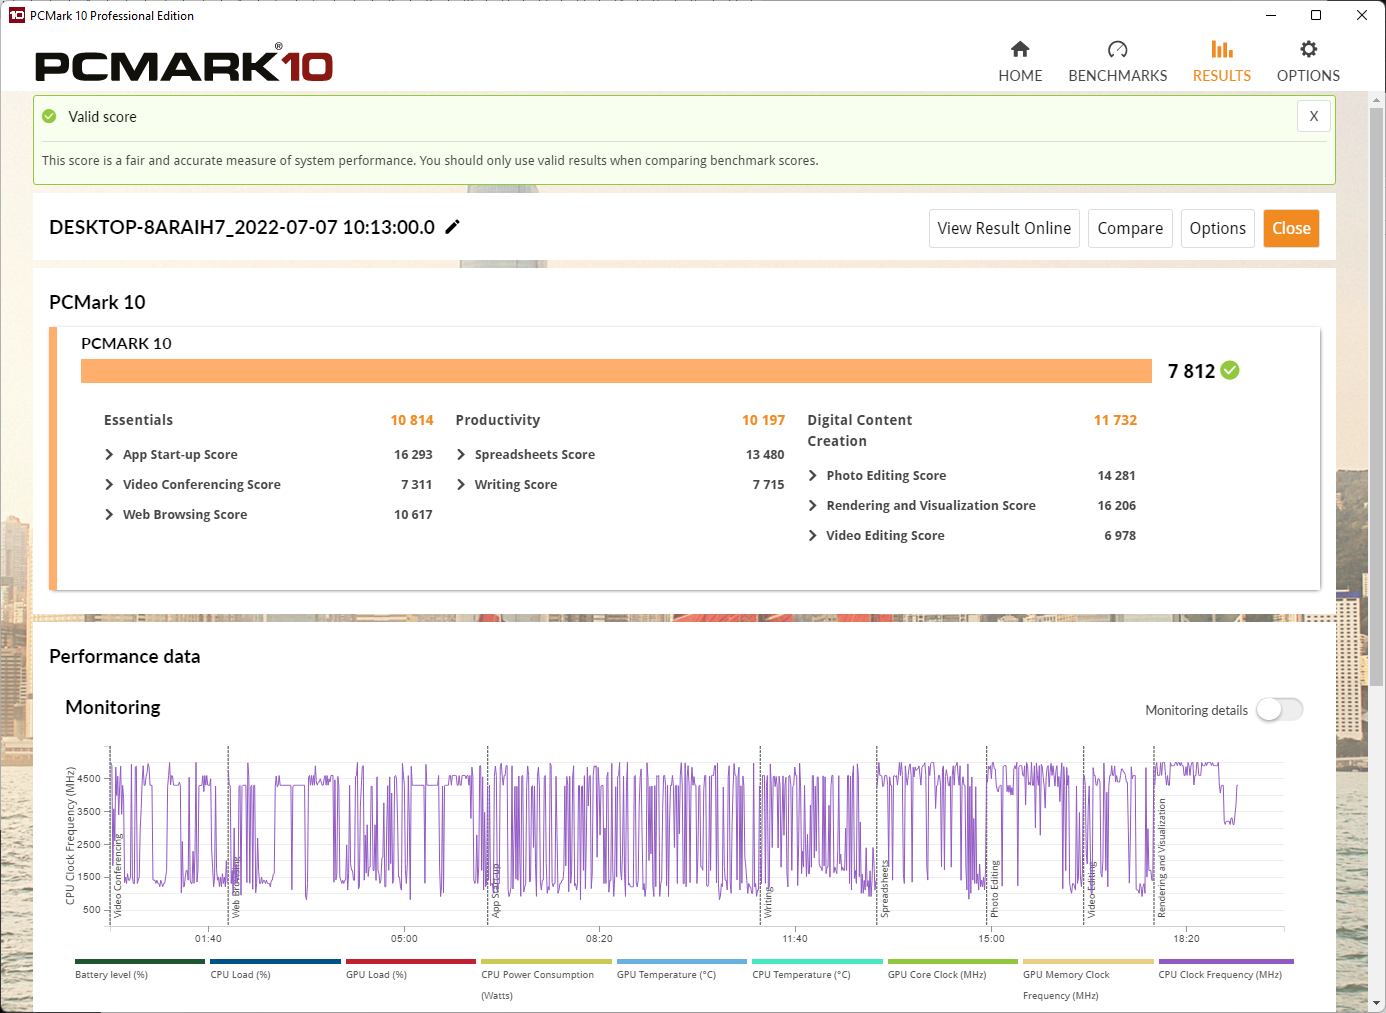
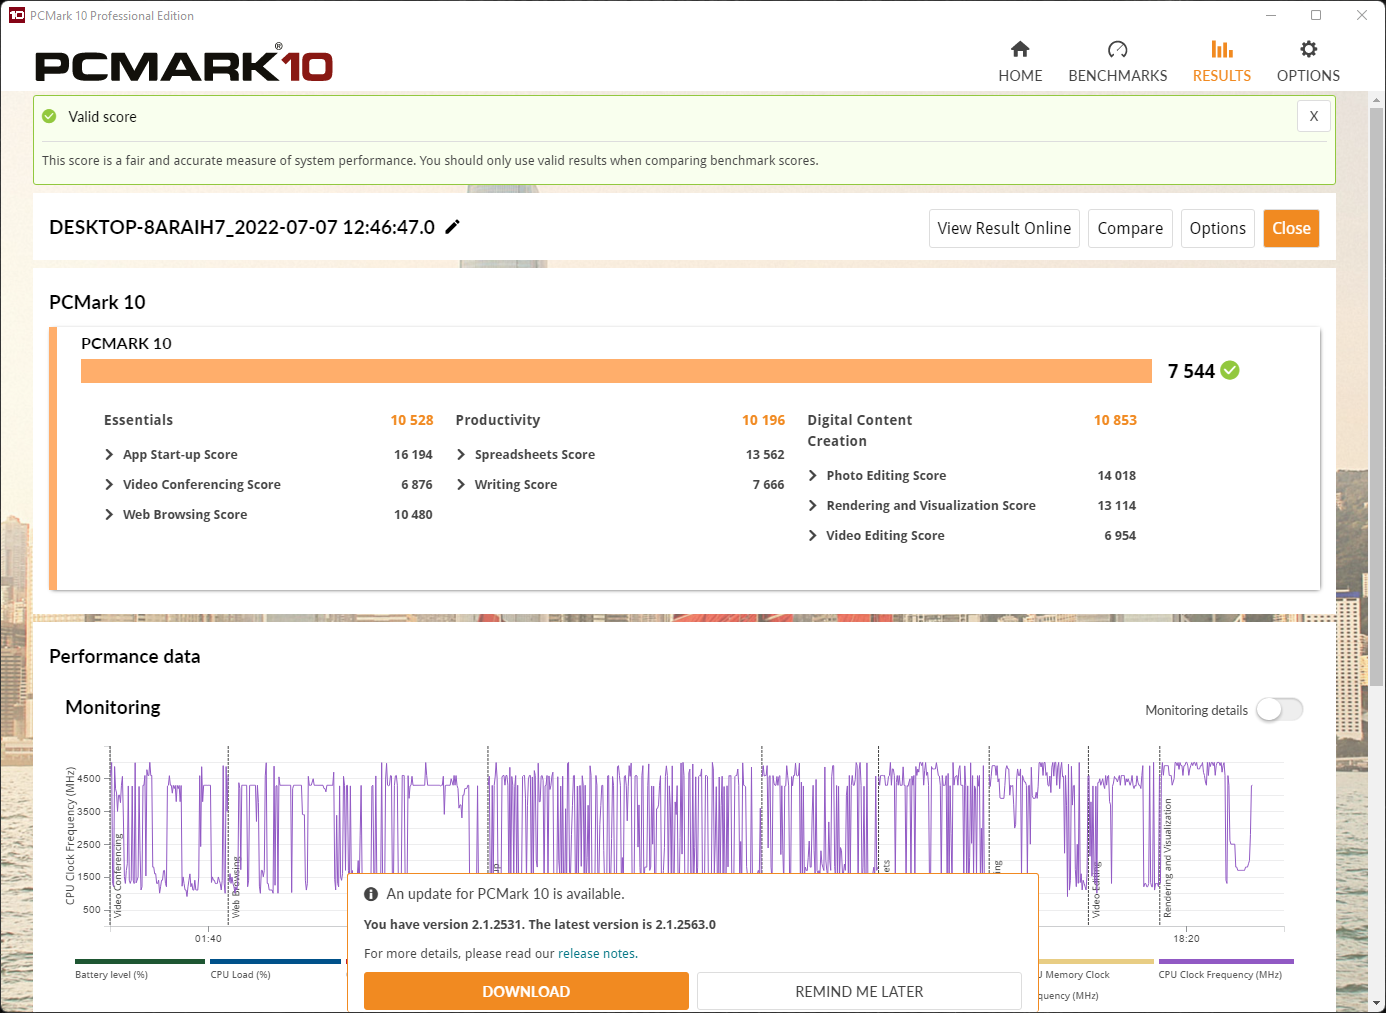
The XMG Pro 17 ranks high in PCMark 10. It scores just above the average of identically configured models in this very realistic test. The MSI Raider GE77, which is even more powerful on paper, is 12% behind.
This result can be verified when using the laptop. The number of programs that are open at the same time is almost irrelevant. There's always enough performance available.
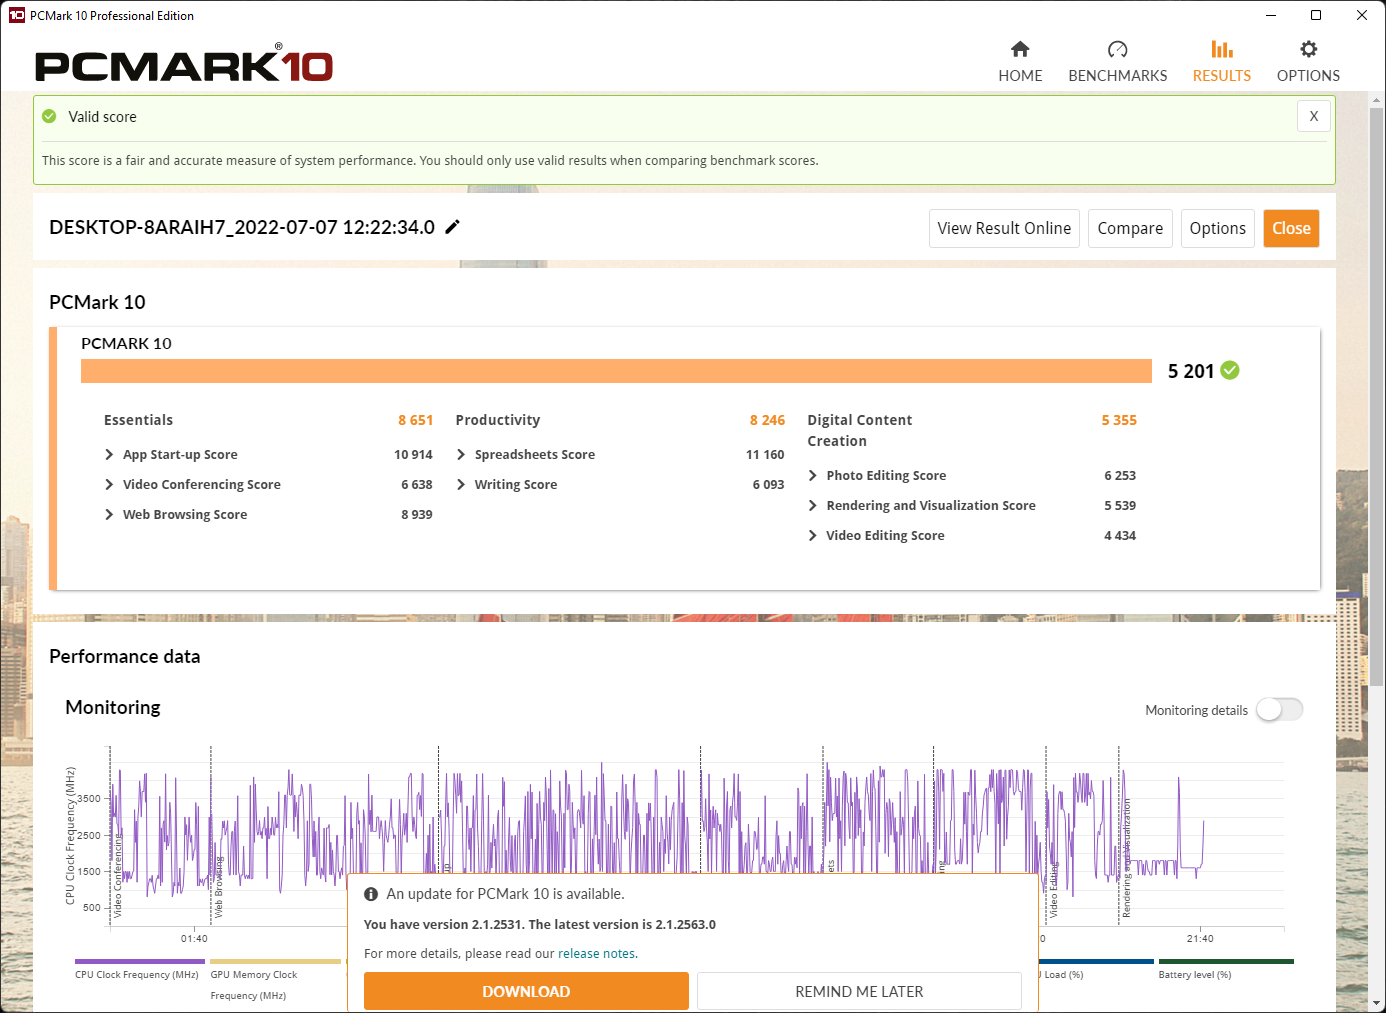
The most remarkable fact, however, is that the rates in Silent Mode would have been enough to achieve the same score. This means that users don't have to put up with a loud fan or an overly warm case in order to use the laptop smoothly. Furthermore, the gaming FPS only drops by about 10% to 20% in this mode.
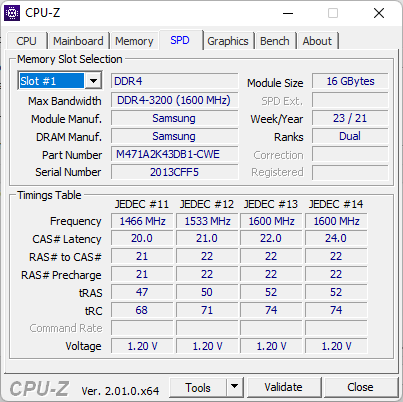
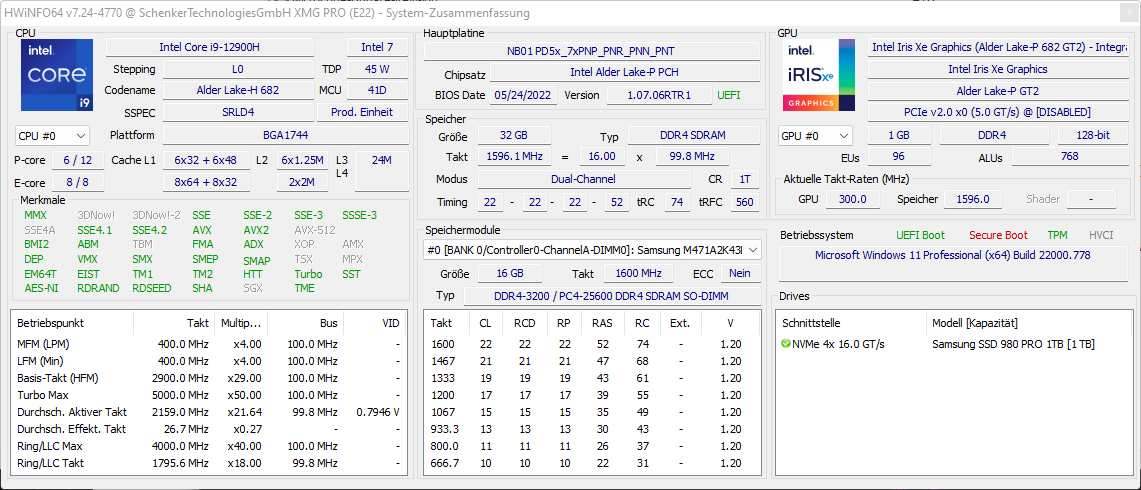
Schenker's decision to do without DDR5 RAM has a bit of an impact on the system performance. The main reason for this is the lower prices for the modules, while the improvement expected compared to DDR4 is in the range of a few percentage points.
CrossMark: Overall | Productivity | Creativity | Responsiveness
| PCMark 10 / Score | |
| Alienware x17 R2 P48E | |
| SCHENKER XMG Pro 17 E22 | |
| Average Intel Core i9-12900H, NVIDIA GeForce RTX 3080 Ti Laptop GPU (7139 - 8083, n=6) | |
| Average of class Gaming (5235 - 9852, n=197, last 2 years) | |
| Acer Predator Triton 500 SE PT516-52s-70KX | |
| MSI Katana GF66 12UGS | |
| SCHENKER XMG Pro 17 (Late 2021, RTX 3080) | |
| MSI Raider GE77 HX 12UHS | |
| Asus ROG Zephyrus Duo 16 GX650RX | |
| PCMark 10 / Essentials | |
| Alienware x17 R2 P48E | |
| SCHENKER XMG Pro 17 E22 | |
| Average Intel Core i9-12900H, NVIDIA GeForce RTX 3080 Ti Laptop GPU (10254 - 11178, n=6) | |
| Average of class Gaming (8300 - 12334, n=196, last 2 years) | |
| Acer Predator Triton 500 SE PT516-52s-70KX | |
| MSI Katana GF66 12UGS | |
| SCHENKER XMG Pro 17 (Late 2021, RTX 3080) | |
| MSI Raider GE77 HX 12UHS | |
| Asus ROG Zephyrus Duo 16 GX650RX | |
| PCMark 10 / Productivity | |
| SCHENKER XMG Pro 17 E22 | |
| Alienware x17 R2 P48E | |
| Average Intel Core i9-12900H, NVIDIA GeForce RTX 3080 Ti Laptop GPU (9102 - 11186, n=6) | |
| MSI Katana GF66 12UGS | |
| Average of class Gaming (6662 - 11833, n=196, last 2 years) | |
| MSI Raider GE77 HX 12UHS | |
| Acer Predator Triton 500 SE PT516-52s-70KX | |
| SCHENKER XMG Pro 17 (Late 2021, RTX 3080) | |
| Asus ROG Zephyrus Duo 16 GX650RX | |
| PCMark 10 / Digital Content Creation | |
| Alienware x17 R2 P48E | |
| SCHENKER XMG Pro 17 E22 | |
| Average Intel Core i9-12900H, NVIDIA GeForce RTX 3080 Ti Laptop GPU (9847 - 12627, n=6) | |
| Average of class Gaming (6462 - 18475, n=196, last 2 years) | |
| Acer Predator Triton 500 SE PT516-52s-70KX | |
| MSI Katana GF66 12UGS | |
| SCHENKER XMG Pro 17 (Late 2021, RTX 3080) | |
| MSI Raider GE77 HX 12UHS | |
| Asus ROG Zephyrus Duo 16 GX650RX | |
| CrossMark / Overall | |
| MSI Raider GE77 HX 12UHS | |
| MSI Katana GF66 12UGS | |
| Alienware x17 R2 P48E | |
| Average of class Gaming (1247 - 2334, n=169, last 2 years) | |
| Acer Predator Triton 500 SE PT516-52s-70KX | |
| Average Intel Core i9-12900H, NVIDIA GeForce RTX 3080 Ti Laptop GPU (1696 - 1965, n=3) | |
| Asus ROG Zephyrus Duo 16 GX650RX | |
| CrossMark / Productivity | |
| MSI Raider GE77 HX 12UHS | |
| MSI Katana GF66 12UGS | |
| Alienware x17 R2 P48E | |
| Average of class Gaming (1299 - 2204, n=169, last 2 years) | |
| Acer Predator Triton 500 SE PT516-52s-70KX | |
| Average Intel Core i9-12900H, NVIDIA GeForce RTX 3080 Ti Laptop GPU (1622 - 1870, n=3) | |
| Asus ROG Zephyrus Duo 16 GX650RX | |
| CrossMark / Creativity | |
| MSI Raider GE77 HX 12UHS | |
| Alienware x17 R2 P48E | |
| Average of class Gaming (1275 - 2514, n=169, last 2 years) | |
| Average Intel Core i9-12900H, NVIDIA GeForce RTX 3080 Ti Laptop GPU (1855 - 2135, n=3) | |
| Acer Predator Triton 500 SE PT516-52s-70KX | |
| MSI Katana GF66 12UGS | |
| Asus ROG Zephyrus Duo 16 GX650RX | |
| CrossMark / Responsiveness | |
| MSI Katana GF66 12UGS | |
| MSI Raider GE77 HX 12UHS | |
| Acer Predator Triton 500 SE PT516-52s-70KX | |
| Asus ROG Zephyrus Duo 16 GX650RX | |
| Average of class Gaming (1030 - 2330, n=169, last 2 years) | |
| Alienware x17 R2 P48E | |
| Average Intel Core i9-12900H, NVIDIA GeForce RTX 3080 Ti Laptop GPU (1483 - 1777, n=3) | |
| PCMark 10 Score | 7812 points | |
Help | ||
| AIDA64 / Memory Copy | |
| MSI Raider GE77 HX 12UHS | |
| Acer Predator Triton 500 SE PT516-52s-70KX | |
| Average of class Gaming (21842 - 92565, n=223, last 2 years) | |
| Average Intel Core i9-12900H (34438 - 74264, n=25) | |
| Alienware x17 R2 P48E | |
| Asus ROG Zephyrus Duo 16 GX650RX | |
| SCHENKER XMG Pro 17 (Late 2021, RTX 3080) | |
| SCHENKER XMG Pro 17 E22 | |
| MSI Katana GF66 12UGS | |
| AIDA64 / Memory Read | |
| MSI Raider GE77 HX 12UHS | |
| Acer Predator Triton 500 SE PT516-52s-70KX | |
| Average of class Gaming (24879 - 90647, n=223, last 2 years) | |
| Average Intel Core i9-12900H (36365 - 74642, n=25) | |
| Alienware x17 R2 P48E | |
| Asus ROG Zephyrus Duo 16 GX650RX | |
| SCHENKER XMG Pro 17 (Late 2021, RTX 3080) | |
| MSI Katana GF66 12UGS | |
| SCHENKER XMG Pro 17 E22 | |
| AIDA64 / Memory Write | |
| MSI Raider GE77 HX 12UHS | |
| Average of class Gaming (21619 - 103259, n=223, last 2 years) | |
| Average Intel Core i9-12900H (32276 - 67858, n=25) | |
| Asus ROG Zephyrus Duo 16 GX650RX | |
| Alienware x17 R2 P48E | |
| Acer Predator Triton 500 SE PT516-52s-70KX | |
| MSI Katana GF66 12UGS | |
| SCHENKER XMG Pro 17 E22 | |
| SCHENKER XMG Pro 17 (Late 2021, RTX 3080) | |
| AIDA64 / Memory Latency | |
| Acer Predator Triton 500 SE PT516-52s-70KX | |
| Alienware x17 R2 P48E | |
| MSI Katana GF66 12UGS | |
| SCHENKER XMG Pro 17 (Late 2021, RTX 3080) | |
| Asus ROG Zephyrus Duo 16 GX650RX | |
| SCHENKER XMG Pro 17 E22 | |
| Average of class Gaming (59.5 - 152.5, n=220, last 2 years) | |
| Average Intel Core i9-12900H (88 - 118.1, n=24) | |
| MSI Raider GE77 HX 12UHS | |
* ... smaller is better
DPC latencies
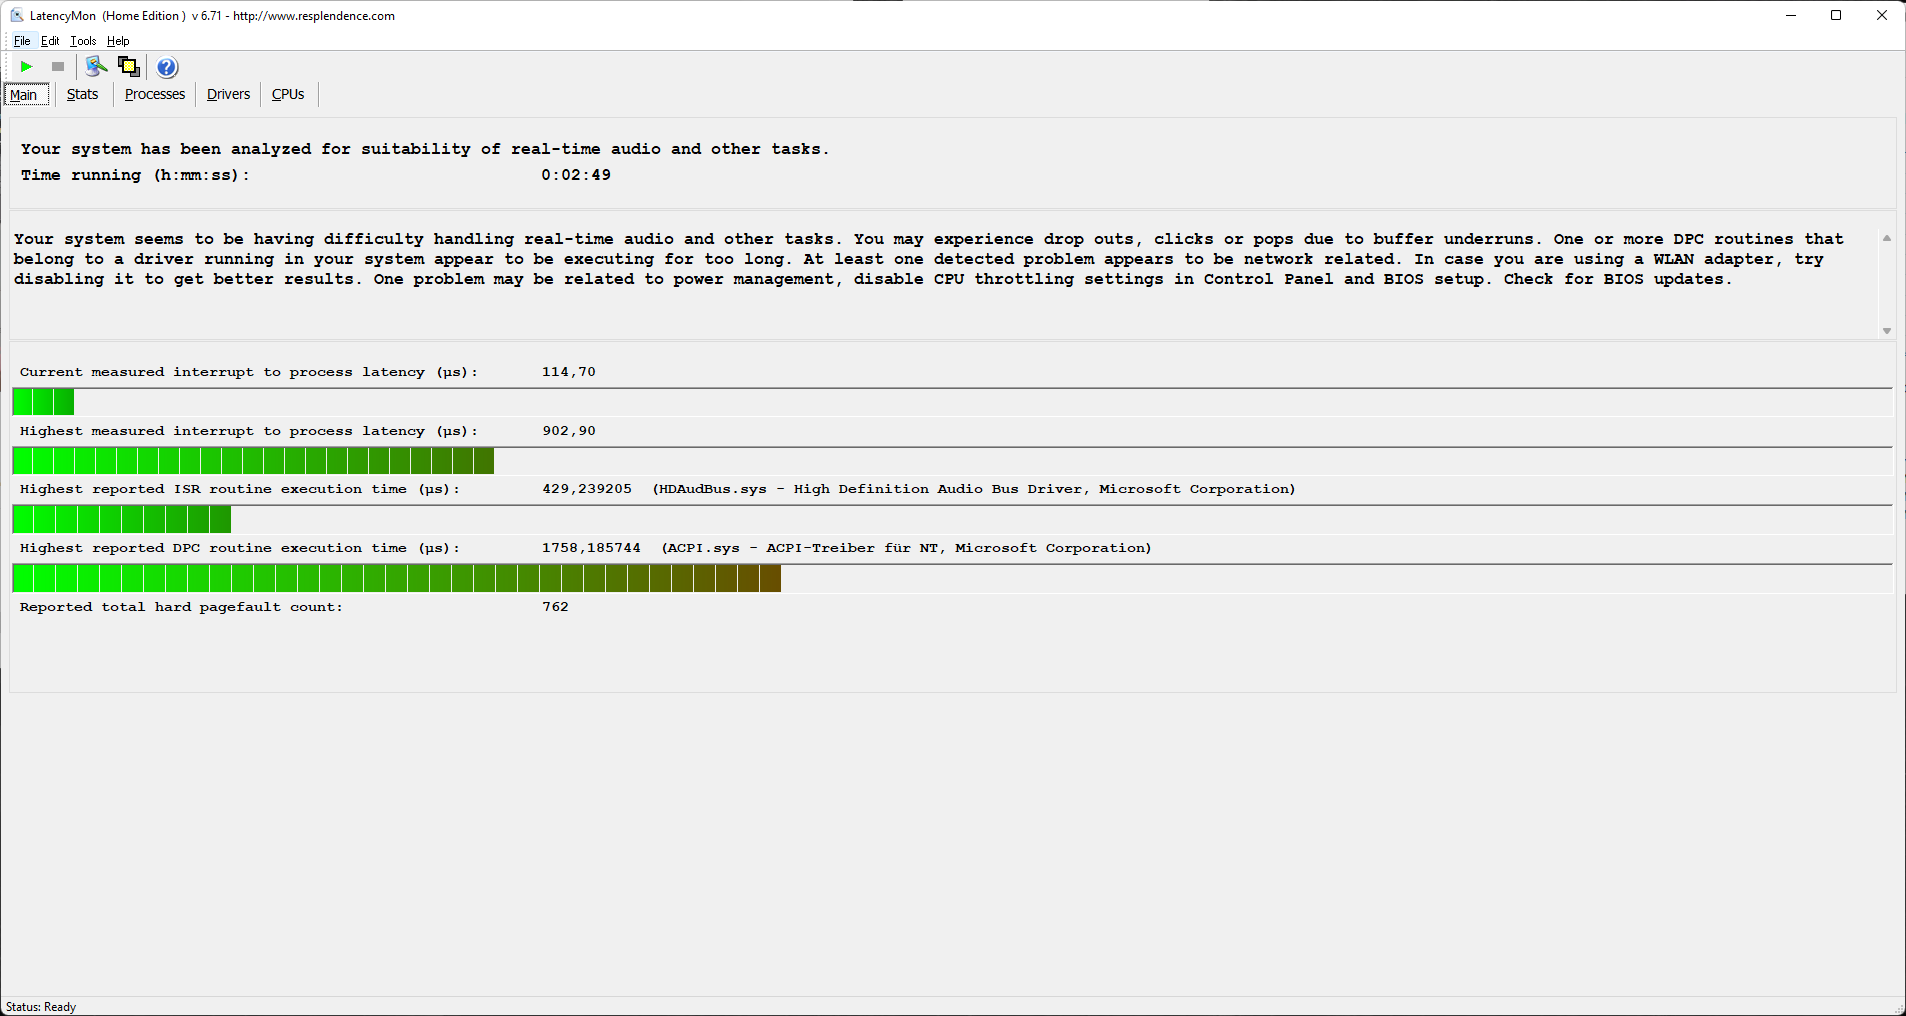
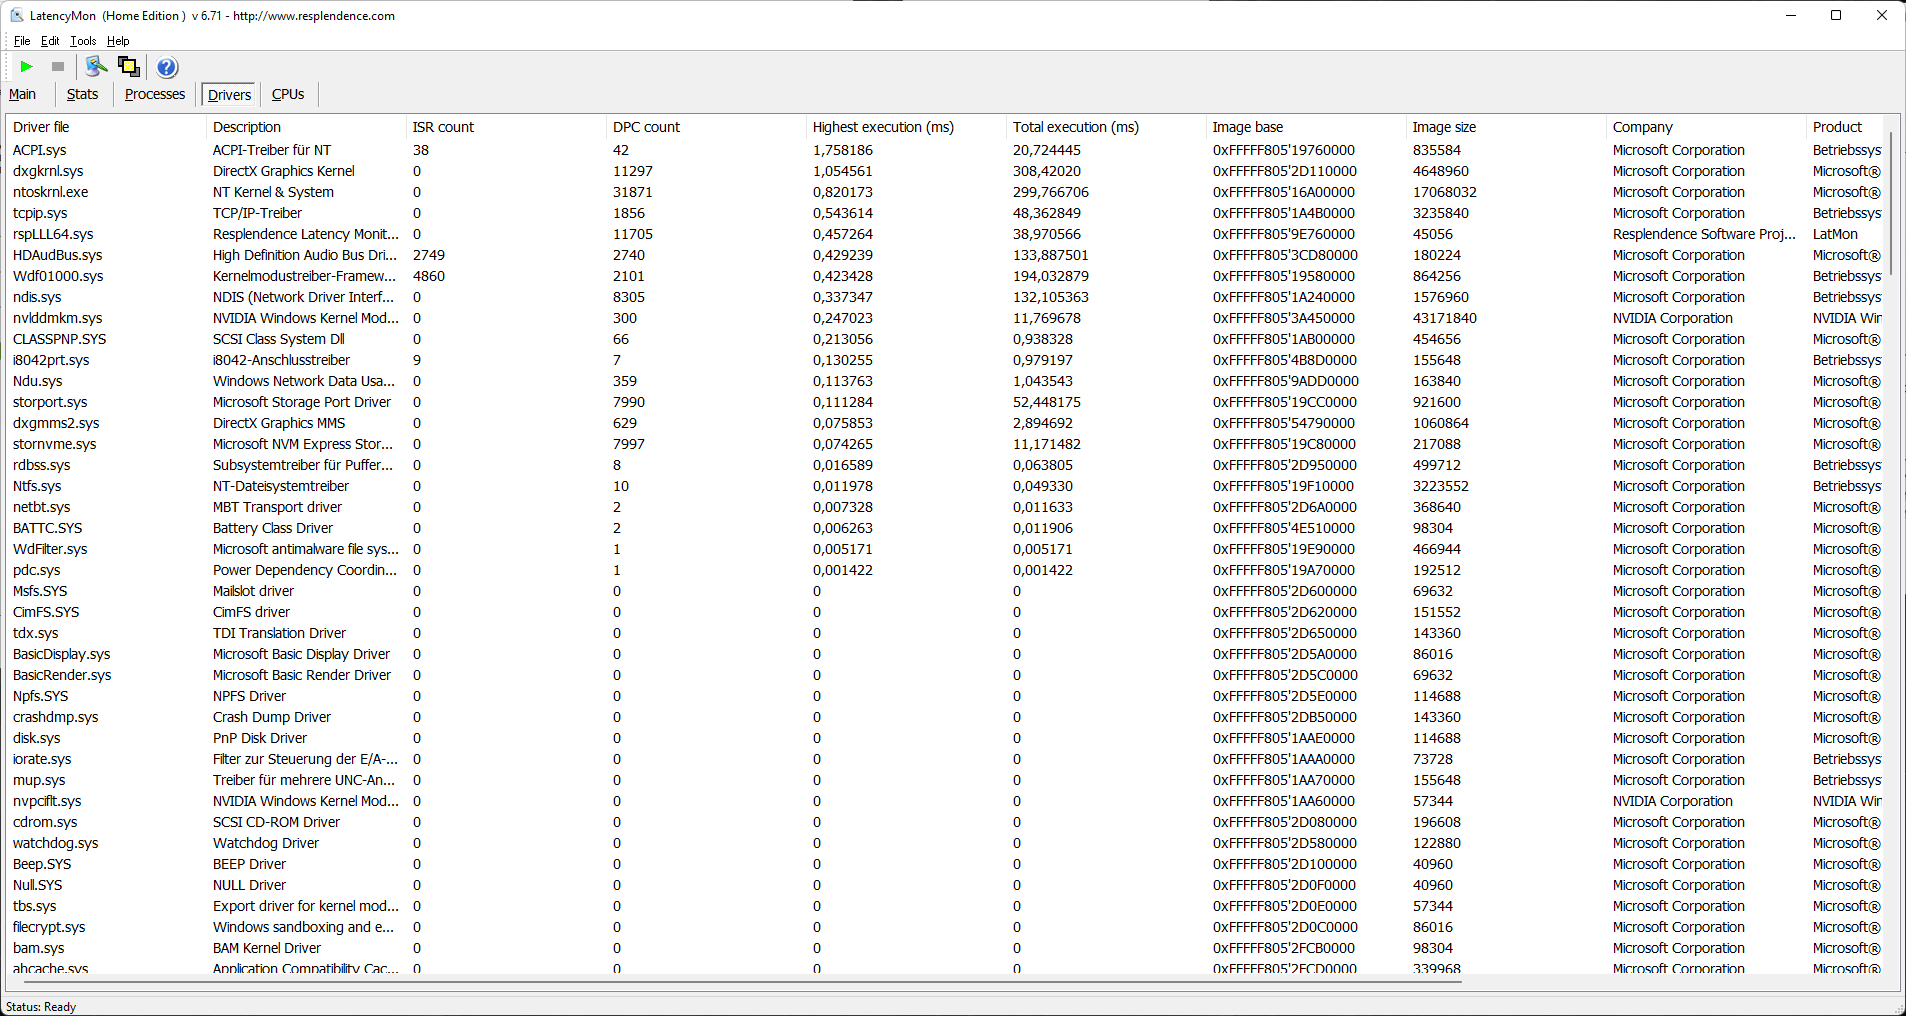
In comparison to the competition, the Schenker XMG Pro 17 E22 scores quite passably when it comes to DPC latencies. However, this isn't sufficient to perform live audio editing, for example, even if the value of the highest interruption remains below one thousandth of a second. The power management and DirectX drivers cause the longest pauses.
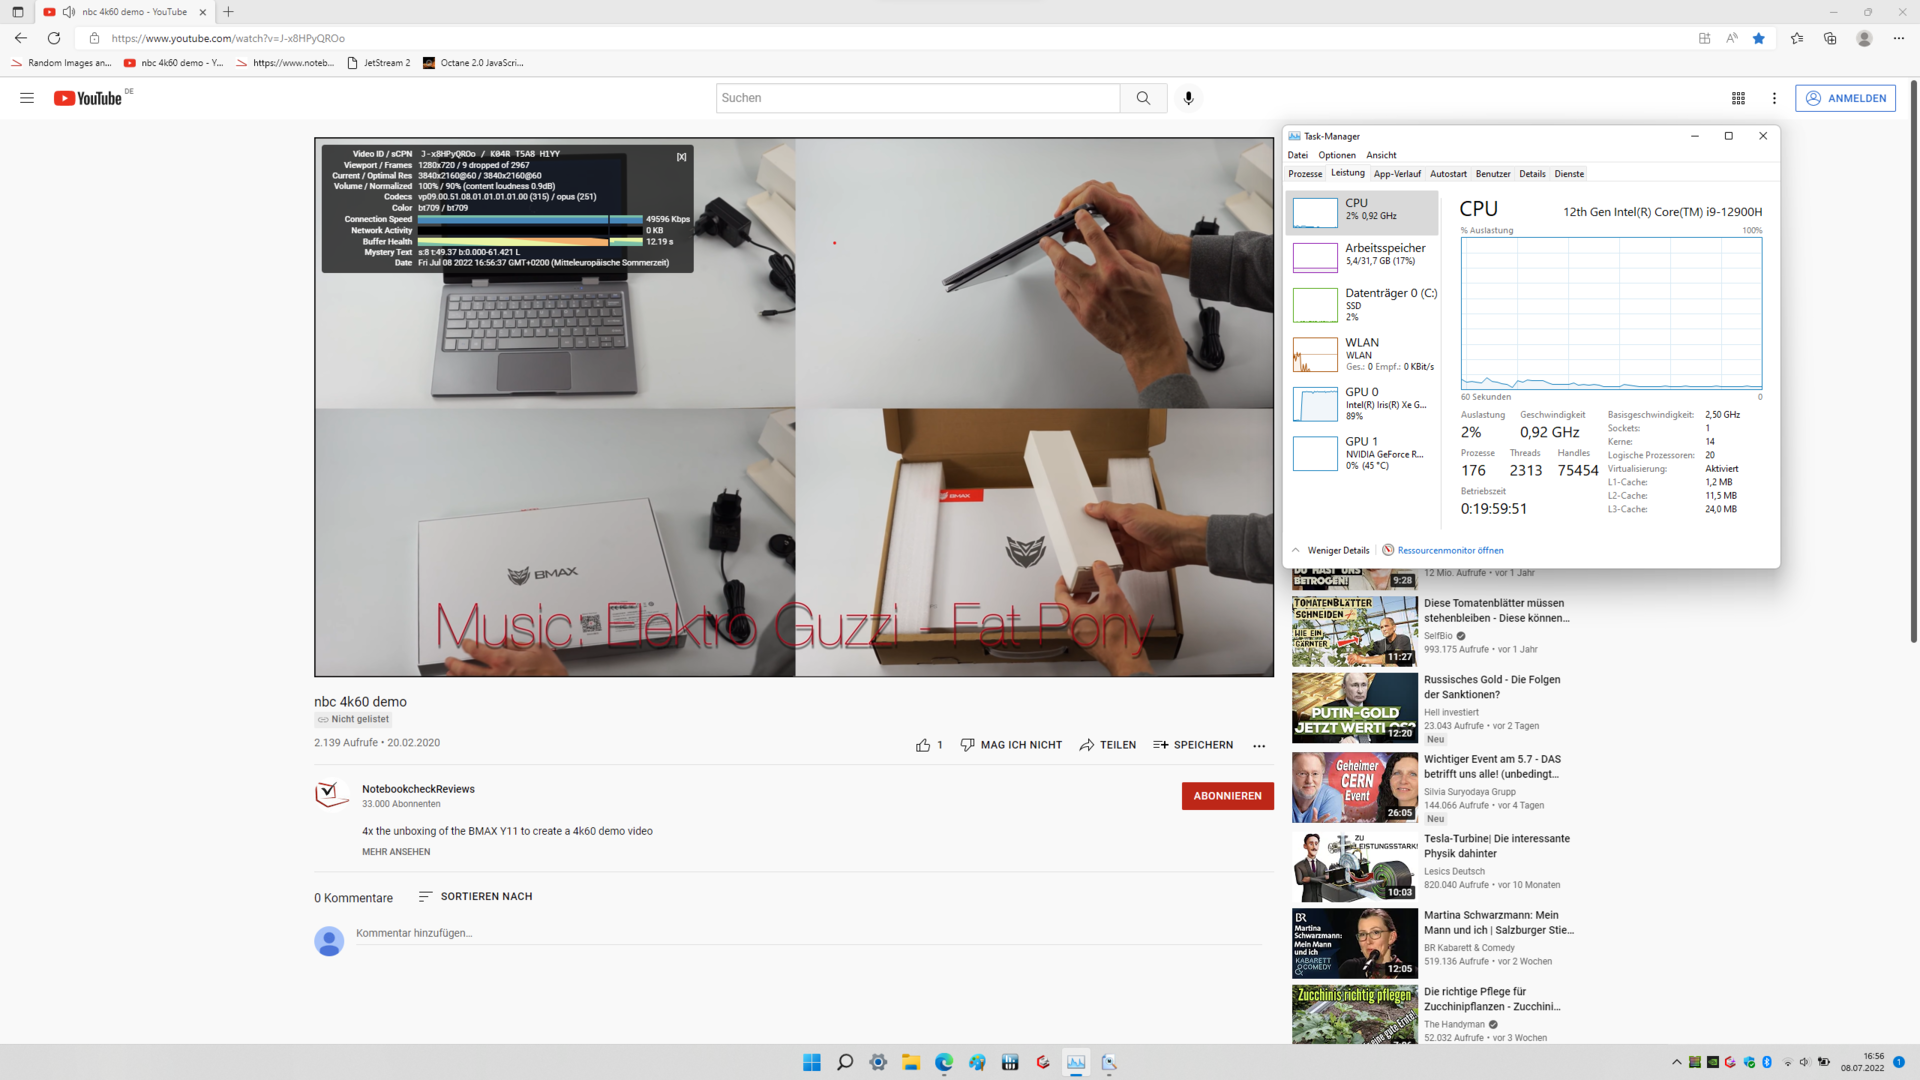
The YouTube 4K video playback wasn't entirely perfect, either. Those 9 dropped frames - as seen in the screenshot - aren't much. However, a gaming workstation should be able to do an even better job.
| DPC Latencies / LatencyMon - interrupt to process latency (max), Web, Youtube, Prime95 | |
| Acer Predator Triton 500 SE PT516-52s-70KX | |
| MSI Raider GE77 HX 12UHS | |
| SCHENKER XMG Pro 17 (Late 2021, RTX 3080) | |
| Alienware x17 R2 P48E | |
| SCHENKER XMG Pro 17 E22 | |
| MSI Katana GF66 12UGS | |
| Asus ROG Zephyrus Duo 16 GX650RX | |
* ... smaller is better
Storage
The built-in Samsung SSD 980 Pro delivers the expected rates. At least during sequential reading, it achieves the transfer rates that PCIe 4.0 allows. However, the lack of thermal dissipation becomes noticeable during prolonged load. This is only a decisive factor when transferring very large amounts of data, while it hardly plays a role in everyday use.
Nevertheless, the Acer Predator Triton 500 SE, for example, demonstrates that the SSD's performance doesn't necessarily have to drop.

| SCHENKER XMG Pro 17 E22 Samsung SSD 980 Pro 1TB MZ-V8P1T0BW | MSI Raider GE77 HX 12UHS Samsung PM9A1 MZVL22T0HBLB | Acer Predator Triton 500 SE PT516-52s-70KX Micron 3400 1TB MTFDKBA1T0TFH | SCHENKER XMG Pro 17 (Late 2021, RTX 3080) Samsung SSD 980 Pro 1TB MZ-V8P1T0BW | Asus ROG Zephyrus Duo 16 GX650RX 2x Samsung SSD 980 Pro 2TB MZ-V8P2T0 (RAID 0) | MSI Katana GF66 12UGS Micron 2450 1TB MTFDKBA1T0TFK | Alienware x17 R2 P48E 2x Samsung PM9A1 1TB (RAID 0) | Average Samsung SSD 980 Pro 1TB MZ-V8P1T0BW | Average of class Gaming | |
|---|---|---|---|---|---|---|---|---|---|
| Drive Performance Rating | |||||||||
| Percent | 73.4 | 78.5 7% | 67.3 -8% | 76.7 4% | 75.9 3% | 60 -18% | 60.8 -17% | 67.1 -9% | 62.4 -15% |
| DiskSpd | 5% | -5% | 3% | 34% | -20% | 9% | -5% | -11% | |
| seq read | 3141 | 3713 18% | 3595 14% | 4285 36% | 4903 56% | 2031 -35% | 4931 57% | 3877 ? 23% | 3539 ? 13% |
| seq write | 3391 | 3706 9% | 4599 36% | 4325 28% | 7889 133% | 3365 -1% | 4819 42% | 3893 ? 15% | 3830 ? 13% |
| seq q8 t1 read | 6766 | 6695 -1% | 6499 -4% | 6666 -1% | 10557 56% | 3372 -50% | 13195 95% | 6544 ? -3% | 6388 ? -6% |
| seq q8 t1 write | 4993 | 4959 -1% | 4765 -5% | 5006 0% | 9830 97% | 3390 -32% | 8227 65% | 4879 ? -2% | 4818 ? -4% |
| 4k q1 t1 read | 67.2 | 83 24% | 70.3 5% | 93.6 39% | 73.1 9% | 70.9 6% | 79.3 18% | 79.9 ? 19% | 67.9 ? 1% |
| 4k q1 t1 write | 279 | 286 3% | 222 -20% | 248 -11% | 359 29% | 403 44% | 170.2 -39% | 217 ? -22% | 224 ? -20% |
| 4k q32 t16 read | 4260 | 4075 -4% | 2750 -35% | 4198 -1% | 2390 -44% | 1849 -57% | 874 -79% | 3197 ? -25% | 2580 ? -39% |
| 4k q32 t16 write | 3961 | 3503 -12% | 2786 -30% | 1225 -69% | 1542 -61% | 2571 -35% | 461 -88% | 2341 ? -41% | 2146 ? -46% |
| AS SSD | 9% | -14% | 8% | 5% | -85% | -39% | -14% | -24% | |
| Score Total | 9047 | 8951 -1% | 7009 -23% | 9011 0% | 6635 -27% | 7793 -14% | 4941 -45% | 7334 ? -19% | 6827 ? -25% |
| Score Read | 3276 | 3399 4% | 2709 -17% | 3372 3% | 2619 -20% | 2741 -16% | 1948 -41% | 2811 ? -14% | 2499 ? -24% |
| Score Write | 4151 | 3882 -6% | 2930 -29% | 3980 -4% | 2556 -38% | 3640 -12% | 2137 -49% | 3159 ? -24% | 3118 ? -25% |
| Seq Read | 4559 | 5053.82 11% | 4531.51 -1% | 5315 17% | 5344.88 17% | 3061.5 -33% | 6561.69 44% | 4838 ? 6% | 4960 ? 9% |
| Seq Write | 3548 | 3628.78 2% | 4186.78 18% | 3920 10% | 7663.27 116% | 3002.92 -15% | 3480.87 -2% | 3490 ? -2% | 3659 ? 3% |
| 4K Read | 63.1 | 82.47 31% | 64.38 2% | 86.2 37% | 68.93 9% | 89.53 42% | 69.21 10% | 72 ? 14% | 66.9 ? 6% |
| 4K Write | 254.1 | 247.61 -3% | 212.27 -16% | 220.6 -13% | 328.69 29% | 339.58 34% | 184.49 -27% | 188.8 ? -26% | 211 ? -17% |
| 4K-64 Read | 2757 | 2811.14 2% | 2191.95 -20% | 2754 0% | 2015.68 -27% | 2345.25 -15% | 1223.07 -56% | 2234 ? -19% | 1931 ? -30% |
| 4K-64 Write | 3543 | 3271.86 -8% | 2298.82 -35% | 3367 -5% | 1460.96 -59% | 2999.99 -15% | 1604.89 -55% | 2622 ? -26% | 2543 ? -28% |
| Access Time Read * | 0.073 | 0.03 59% | 0.034 53% | 0.053 27% | 0.07 4% | 0.03 59% | 0.04075 ? 44% | 0.05344 ? 27% | |
| Access Time Write * | 0.018 | 0.017 6% | 0.022 -22% | 0.019 -6% | 0.013 28% | 0.18 -900% | 0.066 -267% | 0.03363 ? -87% | 0.04637 ? -158% |
| Total Average (Program / Settings) | 7% /
7% | -9% /
-10% | 5% /
6% | 14% /
17% | -41% /
-56% | -16% /
-19% | -9% /
-10% | -17% /
-18% |
* ... smaller is better
Continuous load read: DiskSpd Read Loop, Queue Depth 8
Graphics card
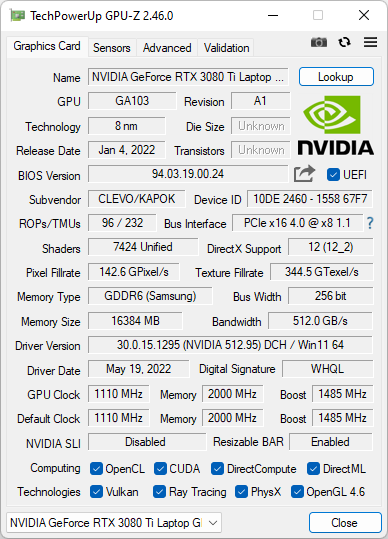
The Schenker XMG Pro 17 E22 that we reviewed is equipped with the Nvidia GeForce RTX 3080 Ti with 16 GB of VRAM. It's the ideal choice for the highest possible graphics performance. Even the latest games running on an external monitor with a higher resolution than QHD shouldn't pose any problems for this GPU.
At the same time, its power consumption is crucial when it comes to performance, and this is in turn related to the laptop's cooling capacity. 155 watts (including 25 watts of Boost) is an above-average value at the very least, and it catapults the XMG Pro to the top of our rankings. Although the MSI Raider GE77 and the Alienware x17 R2 P48E perform better in the 3DMark benchmarks, they both consume a maximum of 175 watts. The difference in points, on the other hand, remains much smaller, which means that the Schenker laptop can definitely draw more performance out of its power consumption.
Our GPU Benchmarks article provides an overview of the performance of various graphics cards.
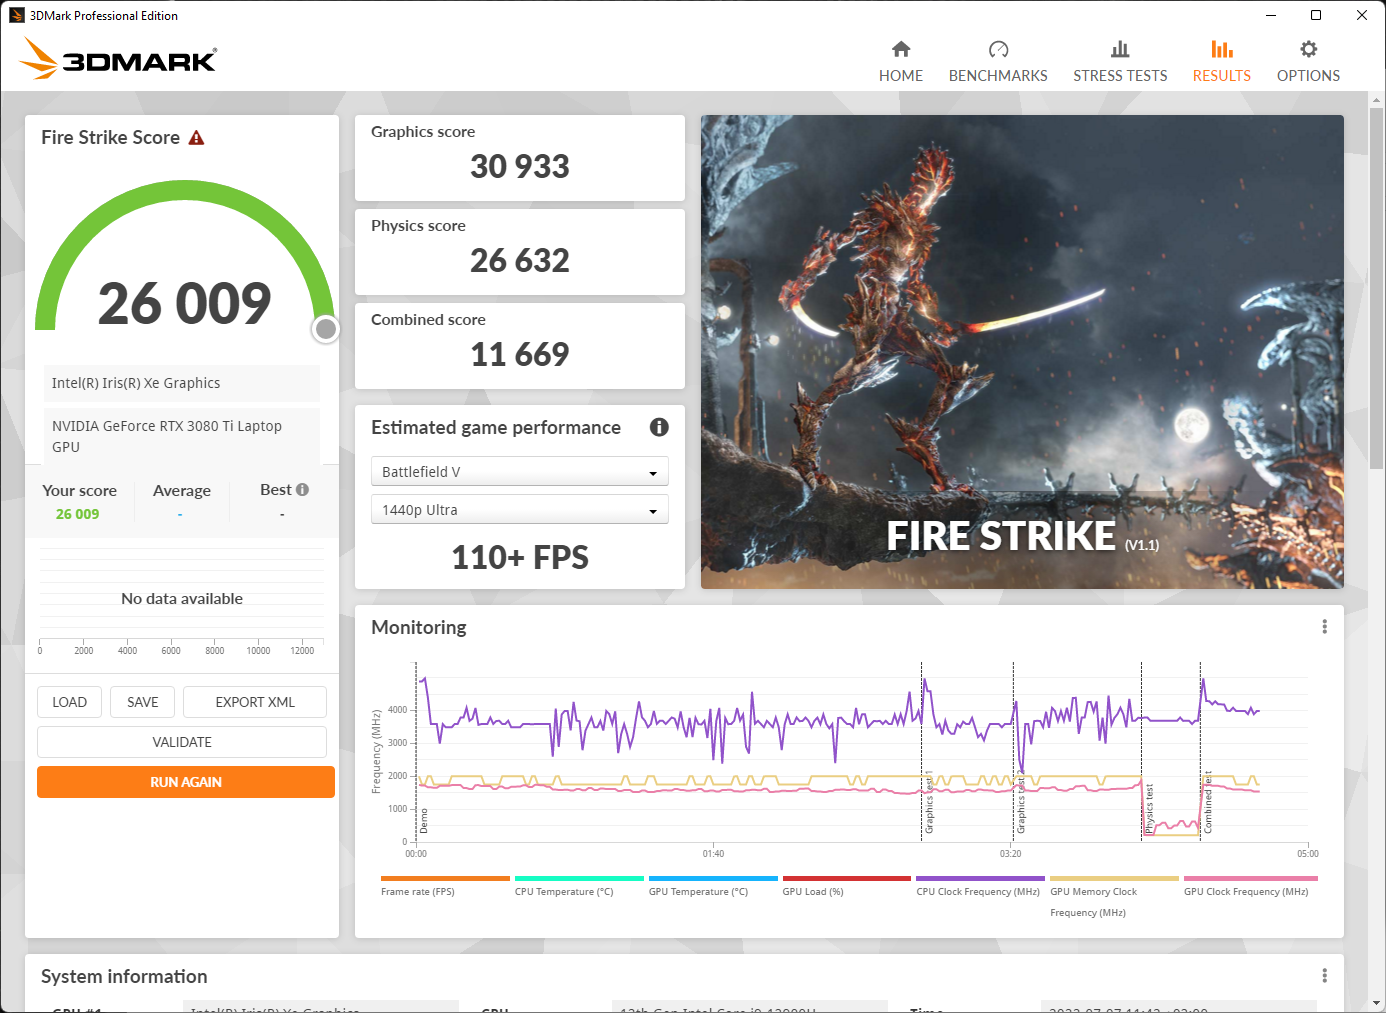
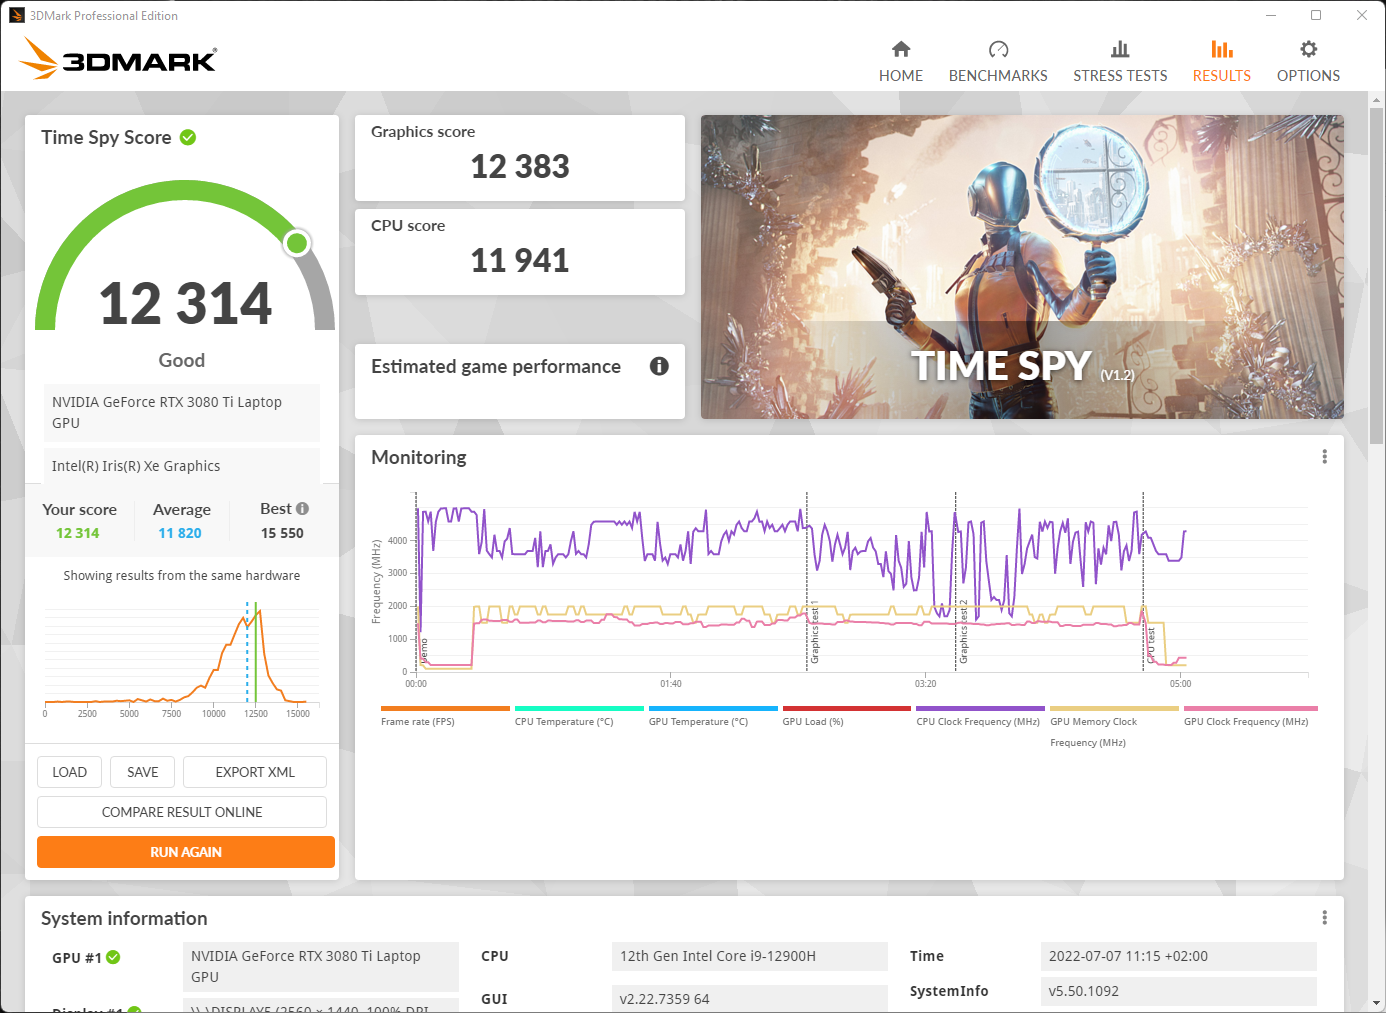
| 3DMark 11 Performance | 32392 points | |
| 3DMark Cloud Gate Standard Score | 55629 points | |
| 3DMark Fire Strike Score | 26009 points | |
| 3DMark Time Spy Score | 12314 points | |
Help | ||
Gaming performance
In general, new and demanding games can be played smoothly without sacrificing details thanks to the high graphics performance and good cooling. You can also connect a 4K monitor. With the large video memory, even a resolution above QHD isn't a problem.
A glance at the games tested also shows that the XMG Pro 17 is considerably above the average of laptops with the same graphics card at times. In addition to the high power supply, the ventilation, which is strong but loud, is also responsible for this.
| Forza Horizon 5 | |
| 1920x1080 High Preset | |
| SCHENKER XMG Pro 17 E22 | |
| Average NVIDIA GeForce RTX 3080 Ti Laptop GPU (66 - 144, n=5) | |
| Average of class Gaming (16 - 174, n=13, last 2 years) | |
| 1920x1080 Extreme Preset | |
| SCHENKER XMG Pro 17 E22 | |
| Average NVIDIA GeForce RTX 3080 Ti Laptop GPU (48 - 95, n=5) | |
| Average of class Gaming (19 - 124, n=11, last 2 years) | |
| 2560x1440 Extreme Preset | |
| SCHENKER XMG Pro 17 E22 | |
| Average of class Gaming (41 - 113, n=6, last 2 years) | |
| Average NVIDIA GeForce RTX 3080 Ti Laptop GPU (40 - 82, n=5) | |
| Elex 2 | |
| 1920x1080 High / On AA:FX AF:16x | |
| SCHENKER XMG Pro 17 E22 | |
| Average of class Gaming (36.9 - 118.7, n=14, last 2 years) | |
| Average NVIDIA GeForce RTX 3080 Ti Laptop GPU (43 - 96, n=3) | |
| 1920x1080 Ultra / On AA:SM AF:16x | |
| SCHENKER XMG Pro 17 E22 | |
| Average of class Gaming (30.1 - 118.5, n=14, last 2 years) | |
| Average NVIDIA GeForce RTX 3080 Ti Laptop GPU (31 - 91, n=3) | |
| 2560x1440 Ultra / On AA:SM AF:16x | |
| SCHENKER XMG Pro 17 E22 | |
| Average of class Gaming (36.5 - 116.7, n=7, last 2 years) | |
| Average NVIDIA GeForce RTX 3080 Ti Laptop GPU (31 - 93, n=3) | |
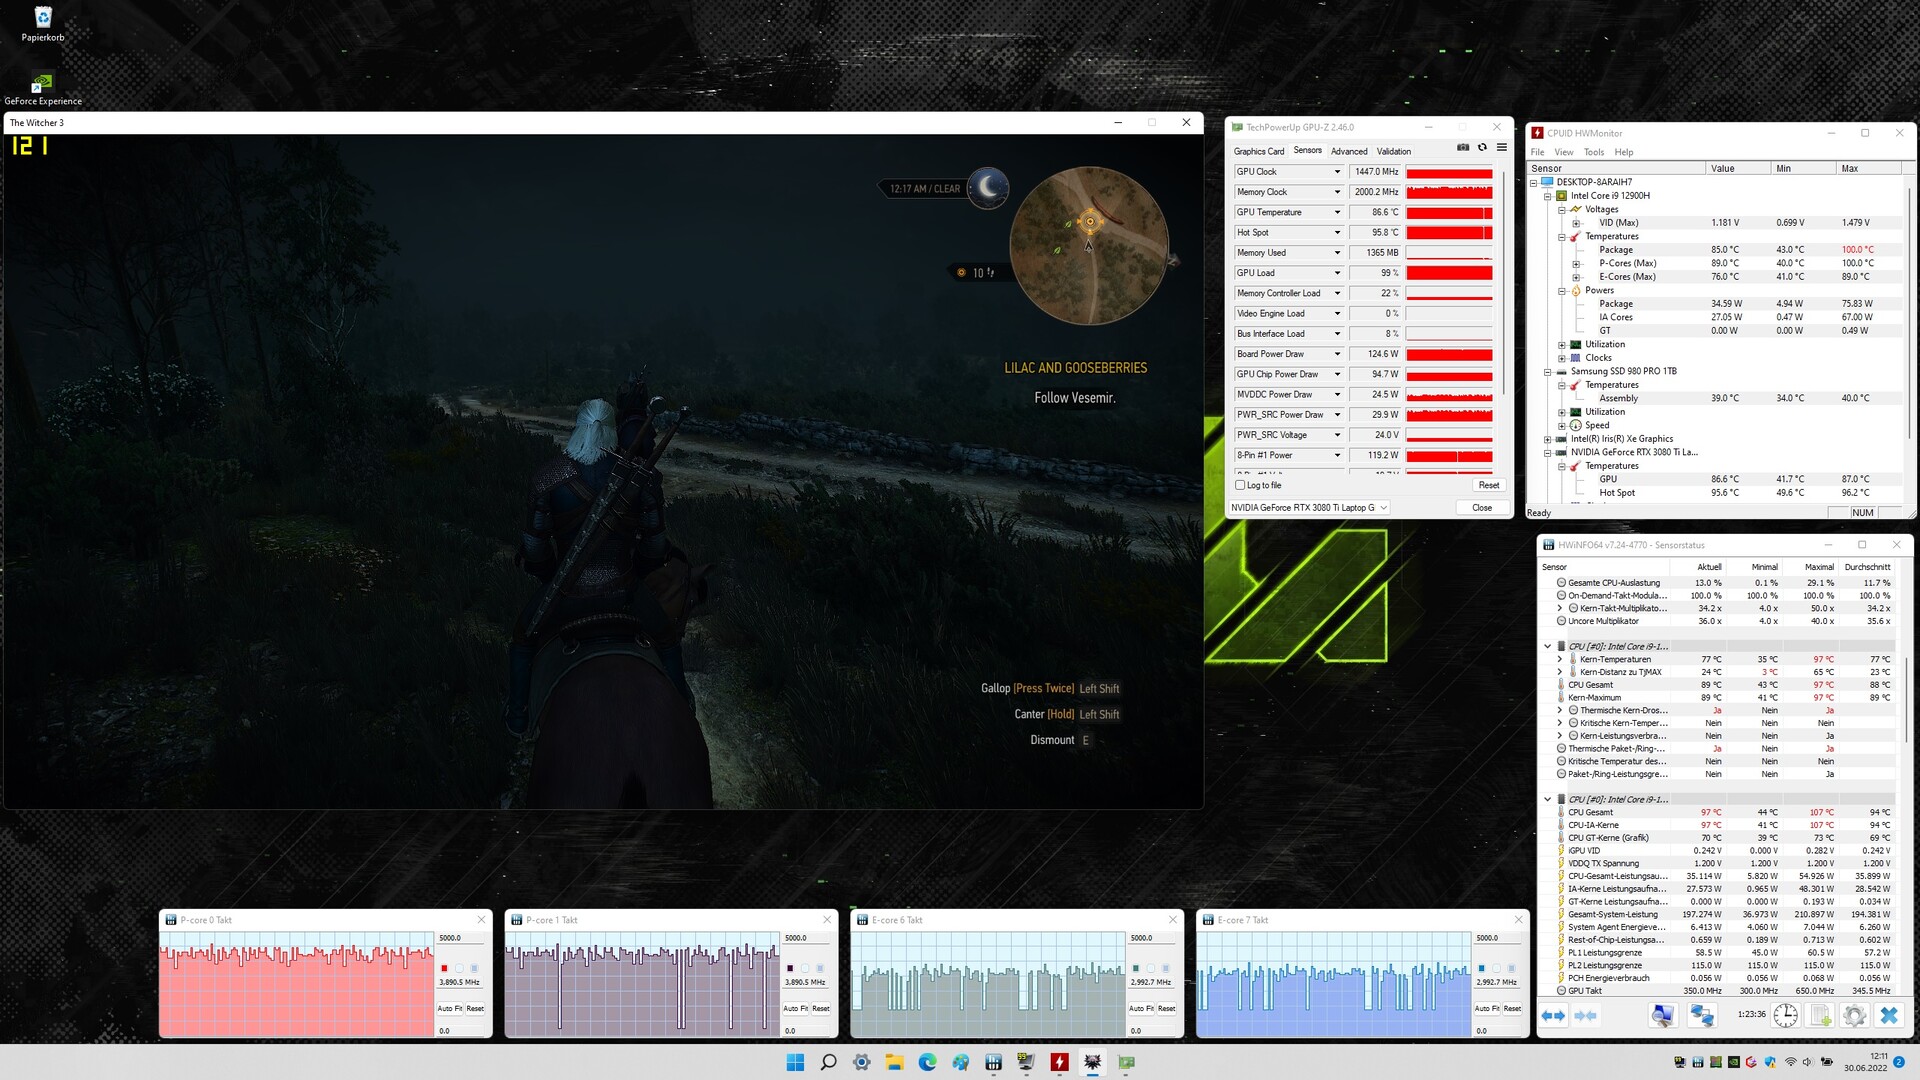
The system performance remains stable over time because the two fans inside as well as the numerous air vents have the appropriate dimensions. The fluctuations in our endurance test with The Witcher 3 running at maximum details are in the range of a few percent. We didn't detect a greater drop in frame rates over a longer period of time, either.
The Witcher 3 FPS diagram
| low | med. | high | ultra | QHD | |
| GTA V (2015) | 177.5 | 116.6 | 93.5 | ||
| The Witcher 3 (2015) | 210 | 112 | |||
| Dota 2 Reborn (2015) | 164.5 | 155.8 | |||
| Final Fantasy XV Benchmark (2018) | 120.2 | 91.1 | |||
| X-Plane 11.11 (2018) | 115.5 | ||||
| Far Cry 5 (2018) | 153 | 136 | 120 | ||
| Strange Brigade (2018) | 238 | 207 | 149.1 | ||
| Forza Horizon 5 (2021) | 144 | 91 | 79 | ||
| Elex 2 (2022) | 96 | 91 | 93 |
Emissions - Cleverly configured gaming laptop
Noise emissions
Schenker's laptop is rarely completely silent. A soft, but pleasantly uniform fan noise can be heard in the background almost all the time. However, it can usually be ignored due to its average of 34 dB, and it's hardly annoying in the long run, either.
Things look different when real performance is required. This will primarily be the case in games. Here, the two fans have to show what they're capable of, and they create a noise level that can no longer be ignored, which is also clearly audible in the next room when the door is open. At over 50 dB, headphones are almost inevitably recommended. Even at high speeds, however, annoying speed changes or significant ramp-ups are never audible.
Silent Mode deserves praise. While the name is completely misleading, the reduced power consumption results in a very pleasant fan behavior. The system performance remains surprisingly good, and the Schenker laptop can therefore also be used in environments that need to remain quiet. This mode should be used especially in an office, home office, or anywhere else where concentration is required, and it's even worthy of a workstation. The fact that editing a video will take a few minutes longer will rarely be bothersome.
Noise Level
| Idle |
| 26 / 34 / 42 dB(A) |
| Load |
| 58 / 58 dB(A) |
 | ||
30 dB silent 40 dB(A) audible 50 dB(A) loud |
||
min: | ||
| SCHENKER XMG Pro 17 E22 i9-12900H, GeForce RTX 3080 Ti Laptop GPU | MSI Raider GE77 HX 12UHS i9-12900HX, GeForce RTX 3080 Ti Laptop GPU | Acer Predator Triton 500 SE PT516-52s-70KX i7-12700H, GeForce RTX 3080 Ti Laptop GPU | SCHENKER XMG Pro 17 (Late 2021, RTX 3080) i7-11800H, GeForce RTX 3080 Laptop GPU | Asus ROG Zephyrus Duo 16 GX650RX R9 6900HX, GeForce RTX 3080 Ti Laptop GPU | MSI Katana GF66 12UGS i7-12700H, GeForce RTX 3070 Ti Laptop GPU | Alienware x17 R2 P48E i9-12900HK, GeForce RTX 3080 Ti Laptop GPU | |
|---|---|---|---|---|---|---|---|
| Noise | 1% | 8% | 9% | 16% | 16% | 23% | |
| off / environment * | 26 | 26 -0% | 26 -0% | 24 8% | 26 -0% | 26 -0% | 22.7 13% |
| Idle Minimum * | 26 | 26 -0% | 26 -0% | 24 8% | 26 -0% | 27 -4% | 23.1 11% |
| Idle Average * | 34 | 34 -0% | 29 15% | 31.26 8% | 27 21% | 28 18% | 23.1 32% |
| Idle Maximum * | 42 | 46 -10% | 34 19% | 38.64 8% | 29 31% | 31 26% | 23.1 45% |
| Load Average * | 58 | 50 14% | 50 14% | 48.11 17% | 41 29% | 44 24% | 31.9 45% |
| Witcher 3 ultra * | 57 | 55 4% | 53 7% | 51.5 10% | 48 16% | 44 23% | 52.5 8% |
| Load Maximum * | 58 | 57 2% | 56 3% | 56.74 2% | 50 14% | 45 22% | 52.5 9% |
* ... smaller is better
Temperature
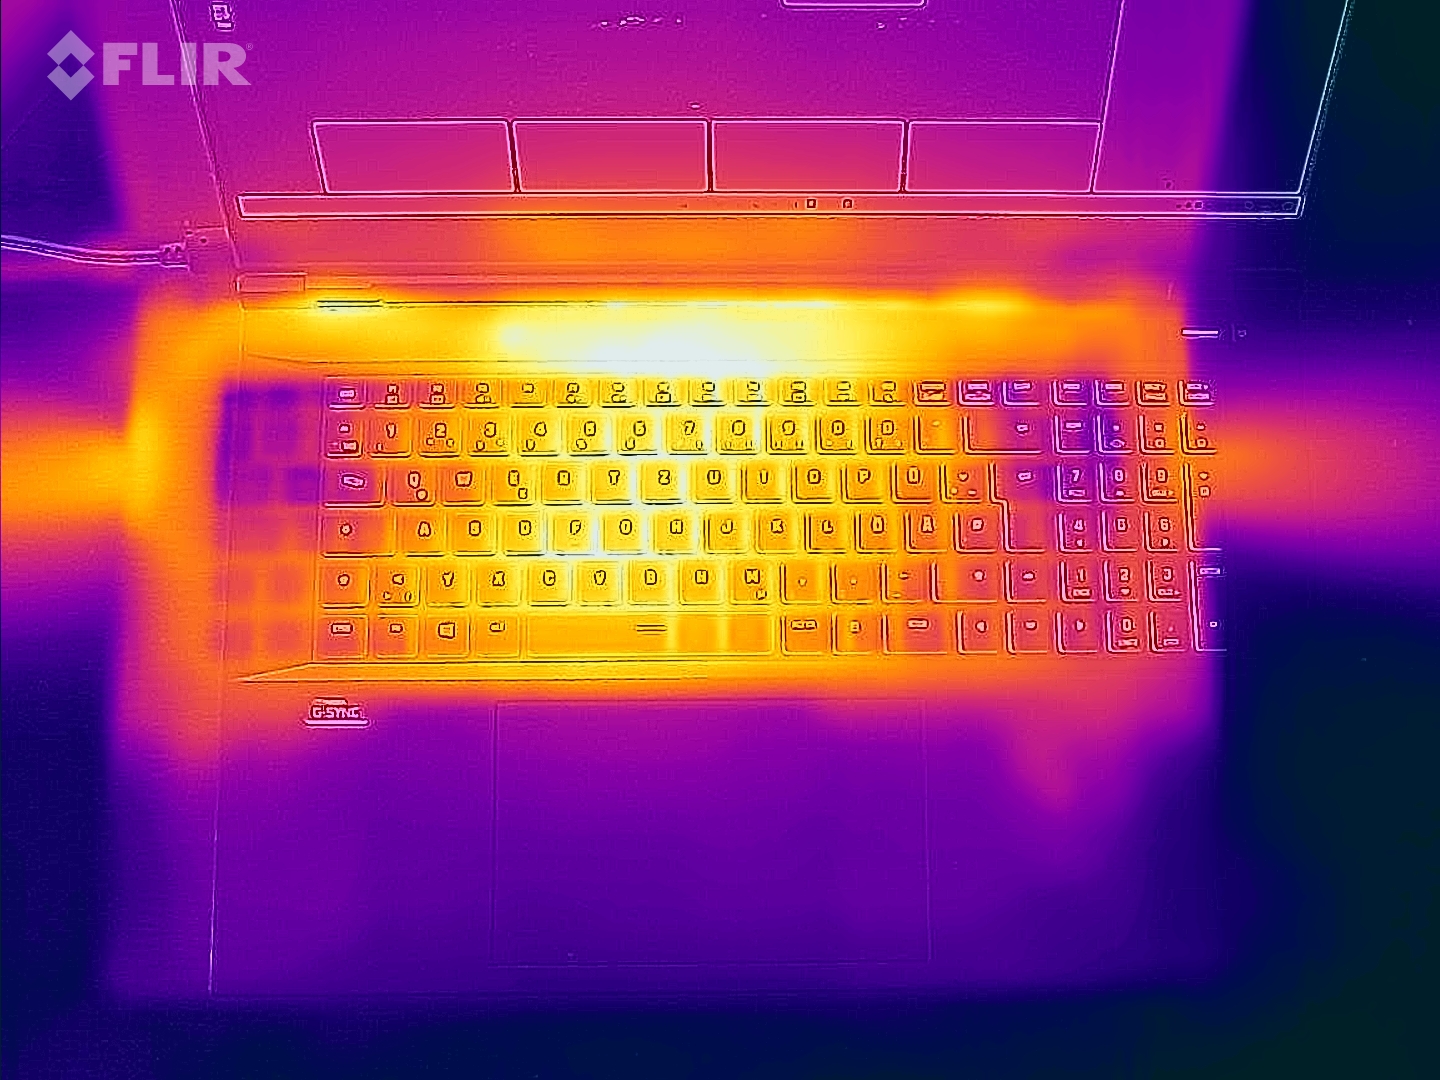
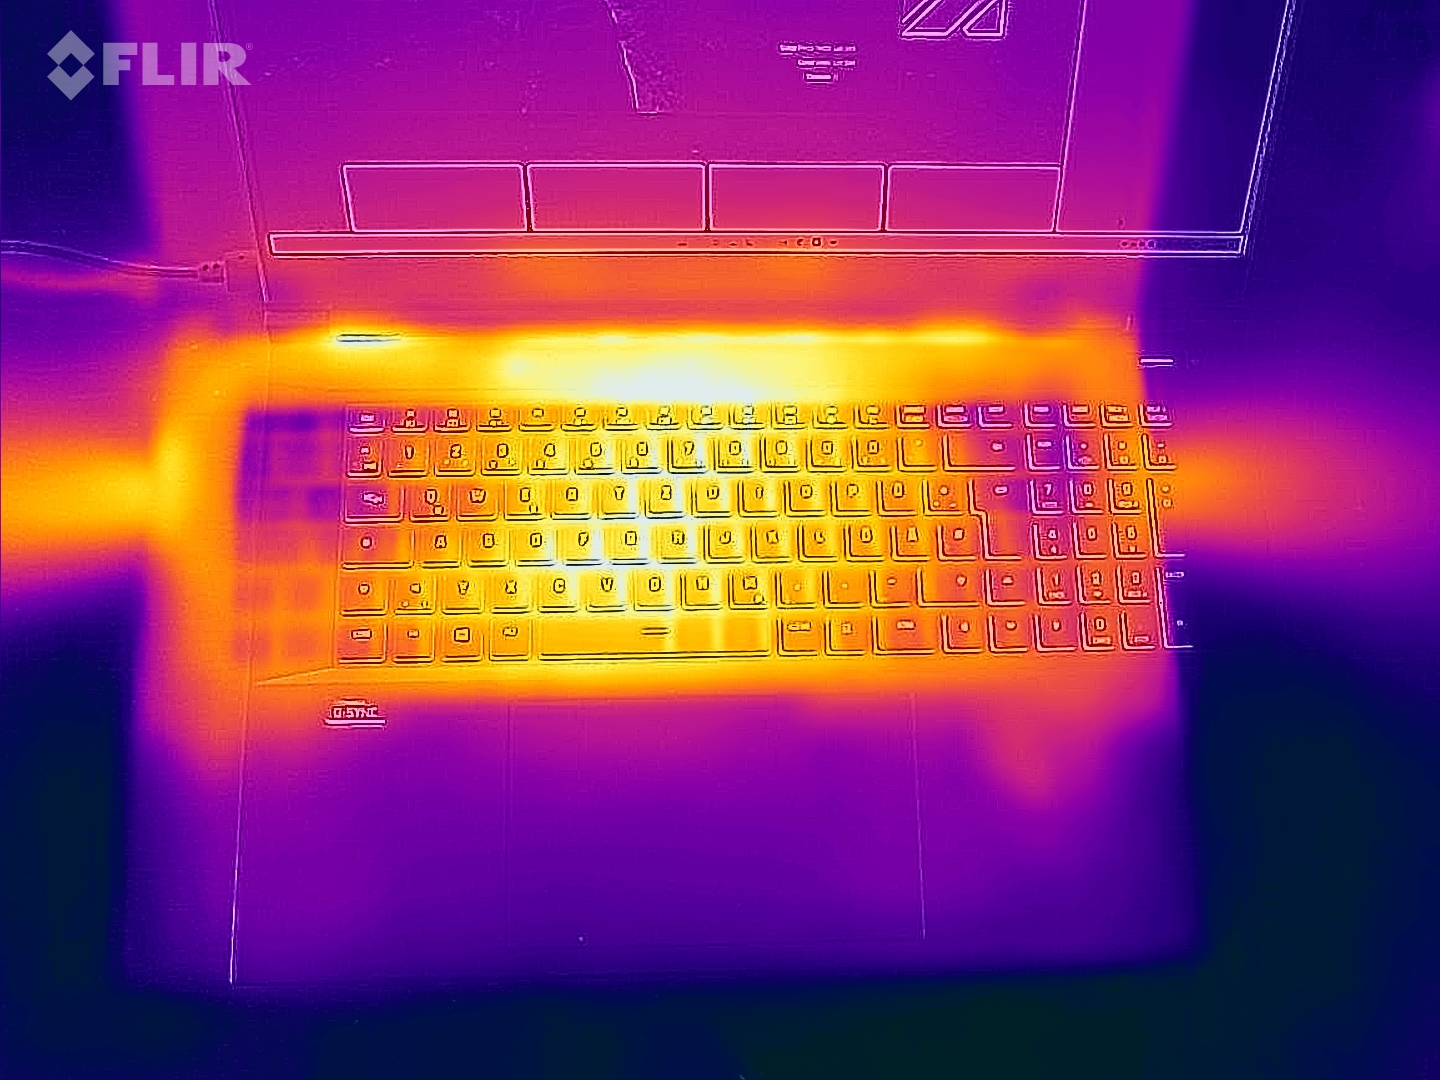
Even everyday tasks cause a slight temperature increase in the keyboard's upper area. Then, the Schenker XMG's case exceeds the 30 °C mark (~86 °F), but this is hardly noticeable. The palm rests, on the other hand, remain completely cool. But there is no built-in hardware underneath, either.
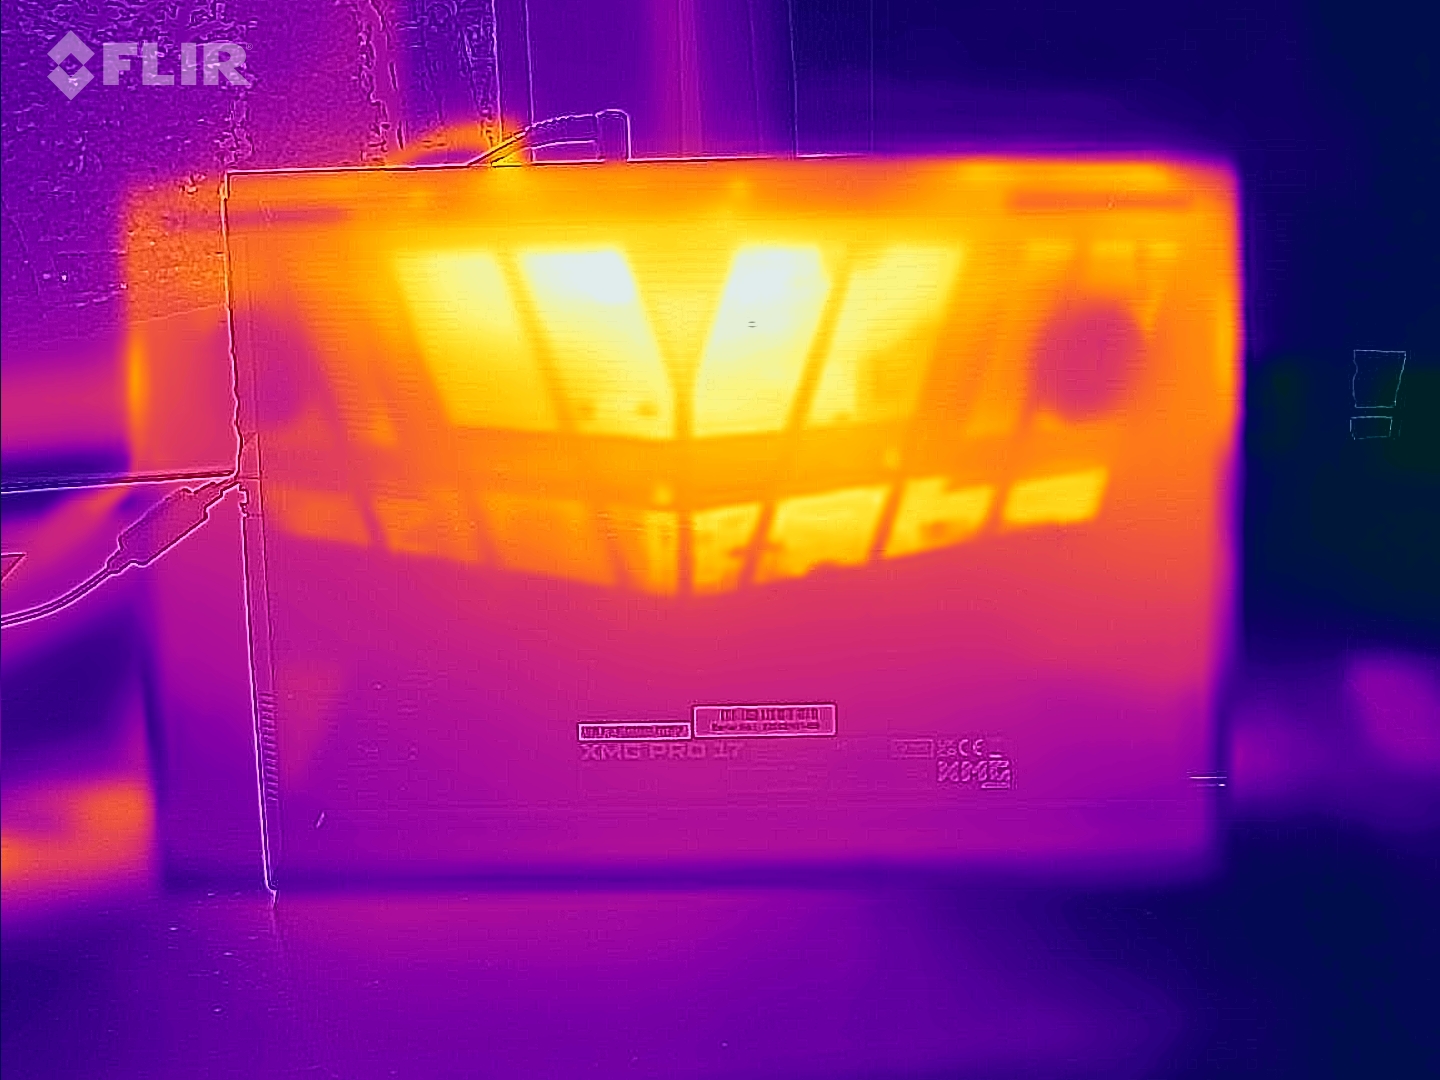
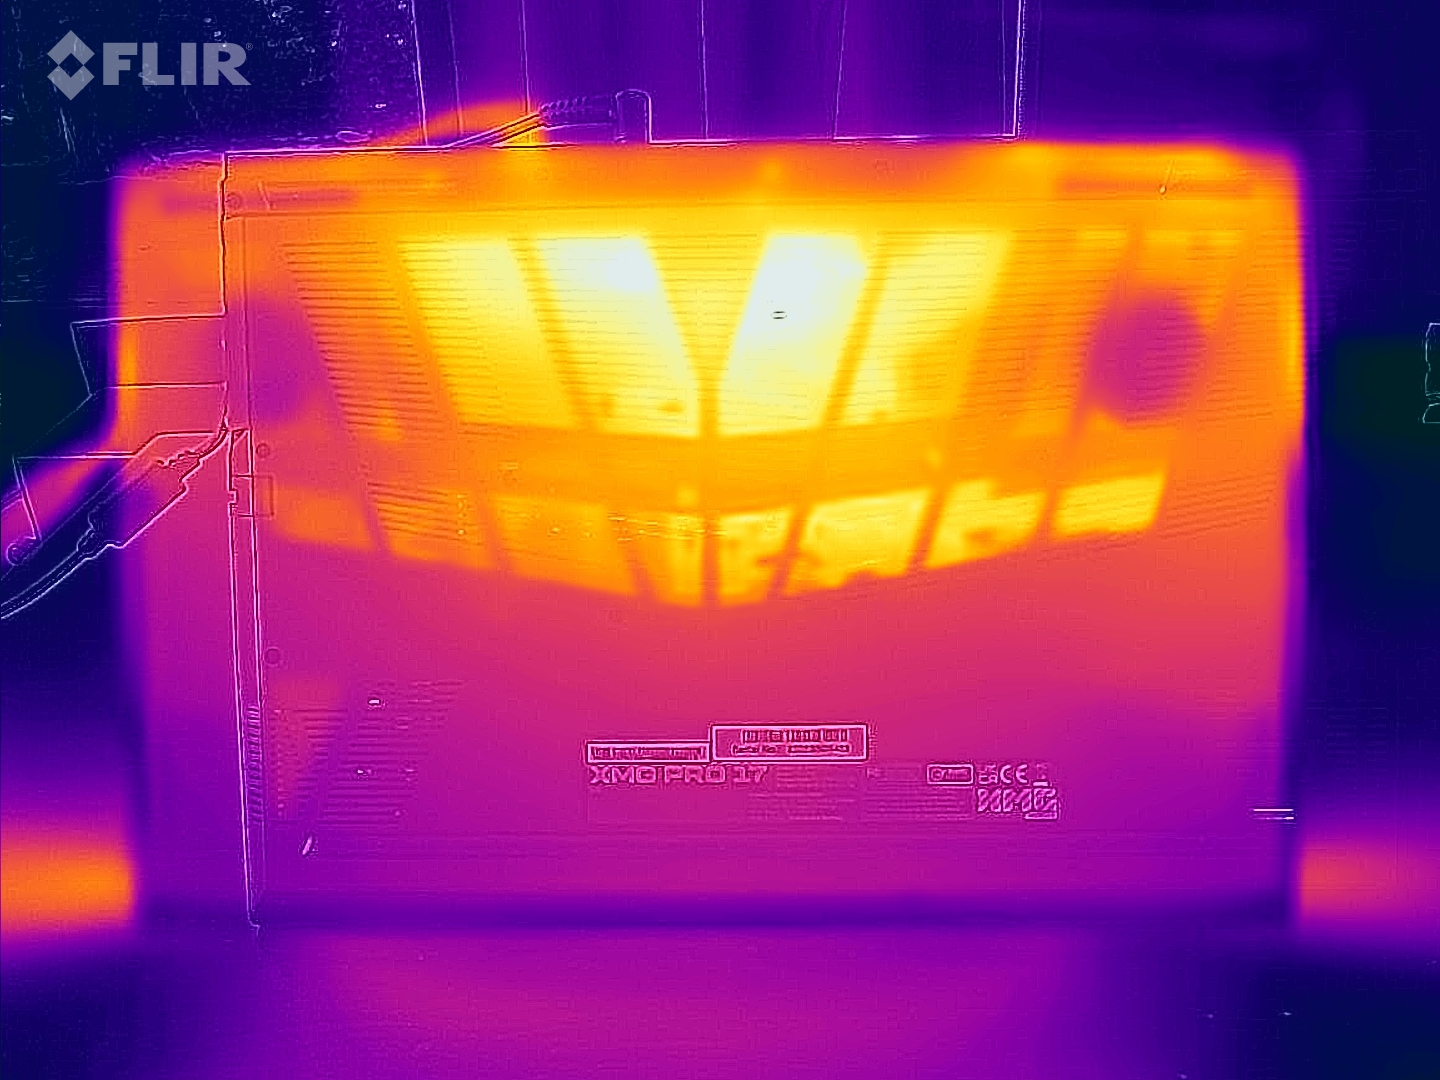
If the requirements increase, the case gets warm, but it remains below the threshold where it becomes really uncomfortable for the fingers to type. On the other hand, the temperature on the bottom rises to 60 °C (~140 °F) in some cases. This explains the unusually high rubber feet, for example. Accordingly, a smooth surface is always mandatory.
(-) The maximum temperature on the upper side is 56 °C / 133 F, compared to the average of 40.4 °C / 105 F, ranging from 21.2 to 68.8 °C for the class Gaming.
(-) The bottom heats up to a maximum of 60 °C / 140 F, compared to the average of 43.2 °C / 110 F
(+) In idle usage, the average temperature for the upper side is 30.3 °C / 87 F, compared to the device average of 33.8 °C / 93 F.
(-) Playing The Witcher 3, the average temperature for the upper side is 44.9 °C / 113 F, compared to the device average of 33.8 °C / 93 F.
(+) The palmrests and touchpad are reaching skin temperature as a maximum (33 °C / 91.4 F) and are therefore not hot.
(-) The average temperature of the palmrest area of similar devices was 28.9 °C / 84 F (-4.1 °C / -7.4 F).
| SCHENKER XMG Pro 17 E22 Intel Core i9-12900H, NVIDIA GeForce RTX 3080 Ti Laptop GPU | MSI Raider GE77 HX 12UHS Intel Core i9-12900HX, NVIDIA GeForce RTX 3080 Ti Laptop GPU | Acer Predator Triton 500 SE PT516-52s-70KX Intel Core i7-12700H, NVIDIA GeForce RTX 3080 Ti Laptop GPU | SCHENKER XMG Pro 17 (Late 2021, RTX 3080) Intel Core i7-11800H, NVIDIA GeForce RTX 3080 Laptop GPU | Asus ROG Zephyrus Duo 16 GX650RX AMD Ryzen 9 6900HX, NVIDIA GeForce RTX 3080 Ti Laptop GPU | MSI Katana GF66 12UGS Intel Core i7-12700H, NVIDIA GeForce RTX 3070 Ti Laptop GPU | Alienware x17 R2 P48E Intel Core i9-12900HK, NVIDIA GeForce RTX 3080 Ti Laptop GPU | |
|---|---|---|---|---|---|---|---|
| Heat | -6% | 14% | 9% | 12% | -8% | 16% | |
| Maximum Upper Side * | 56 | 53 5% | 47 16% | 53 5% | 45 20% | 61 -9% | 49.6 11% |
| Maximum Bottom * | 60 | 58 3% | 49 18% | 68 -13% | 50 17% | 55 8% | 42.4 29% |
| Idle Upper Side * | 34 | 38 -12% | 31 9% | 27 21% | 33 3% | 43 -26% | 29.2 14% |
| Idle Bottom * | 36 | 43 -19% | 32 11% | 28 22% | 33 8% | 38 -6% | 32 11% |
* ... smaller is better
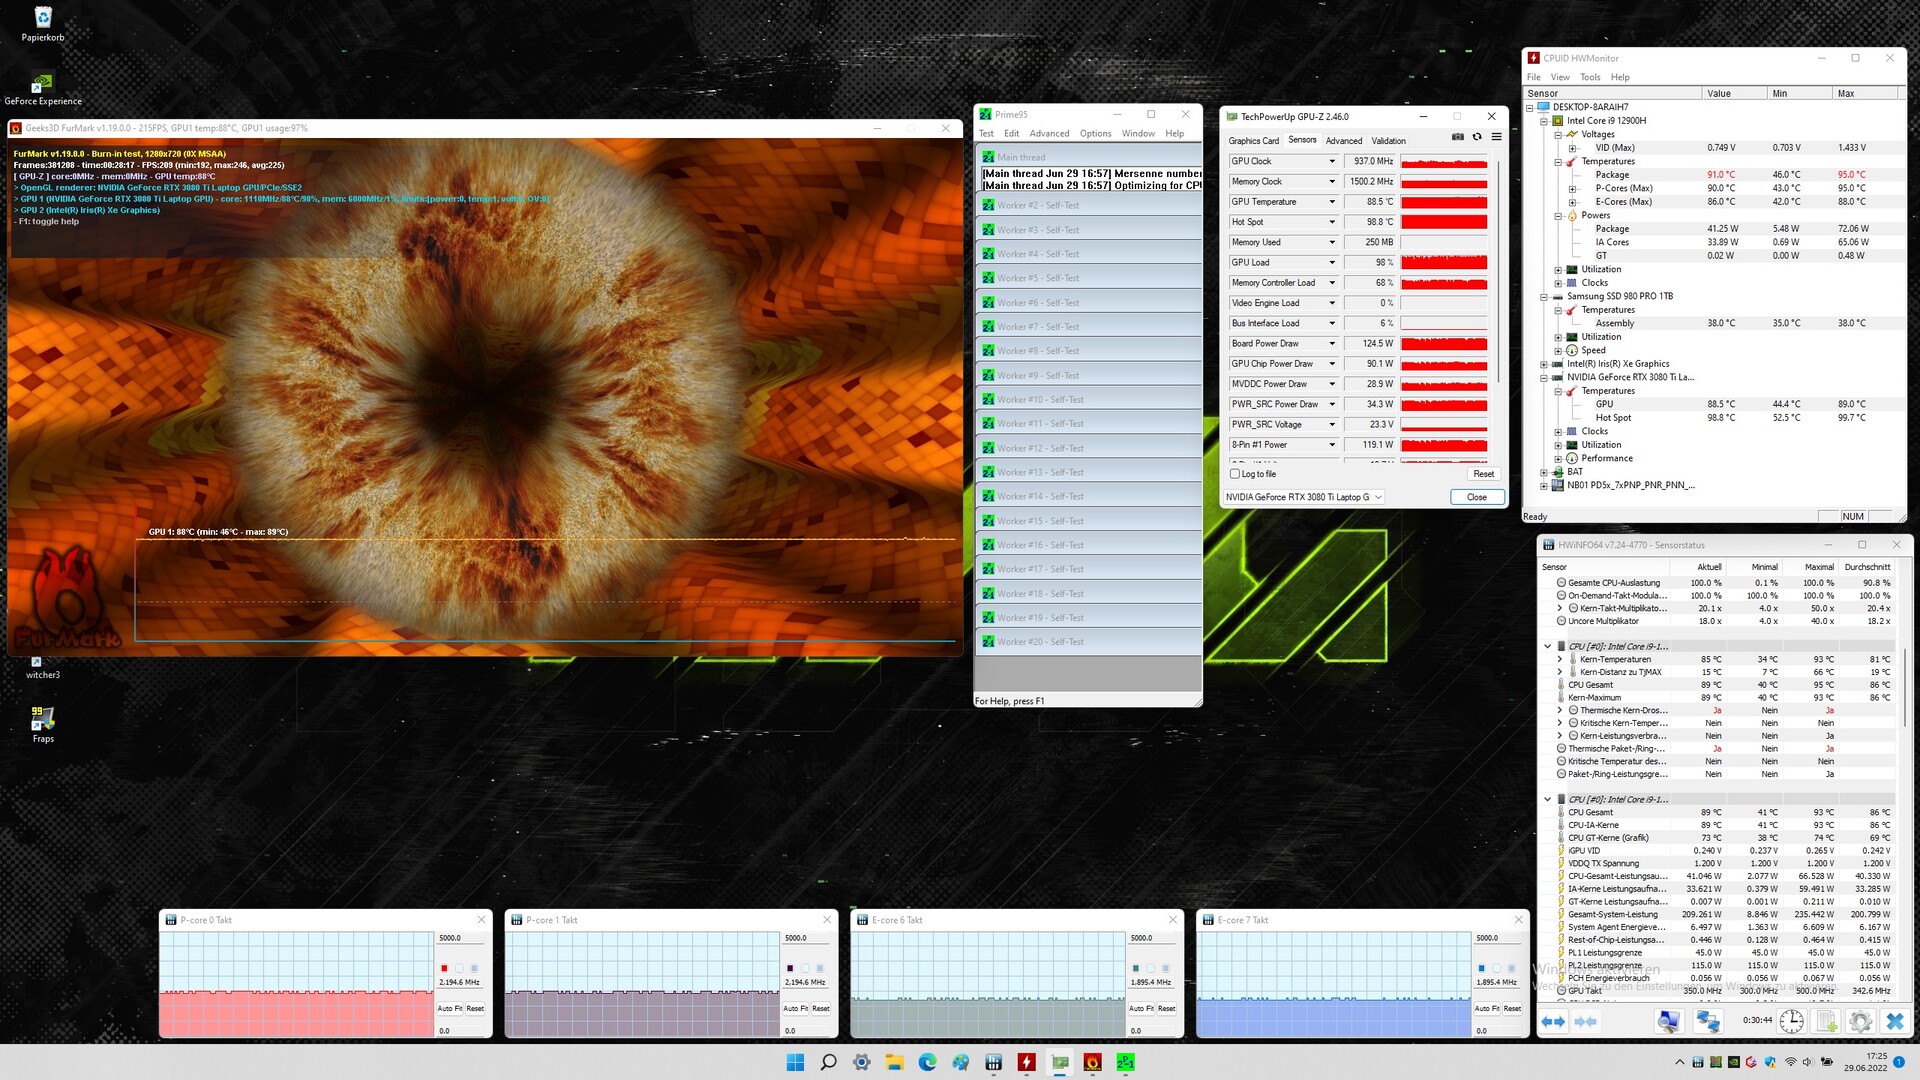
Stress test
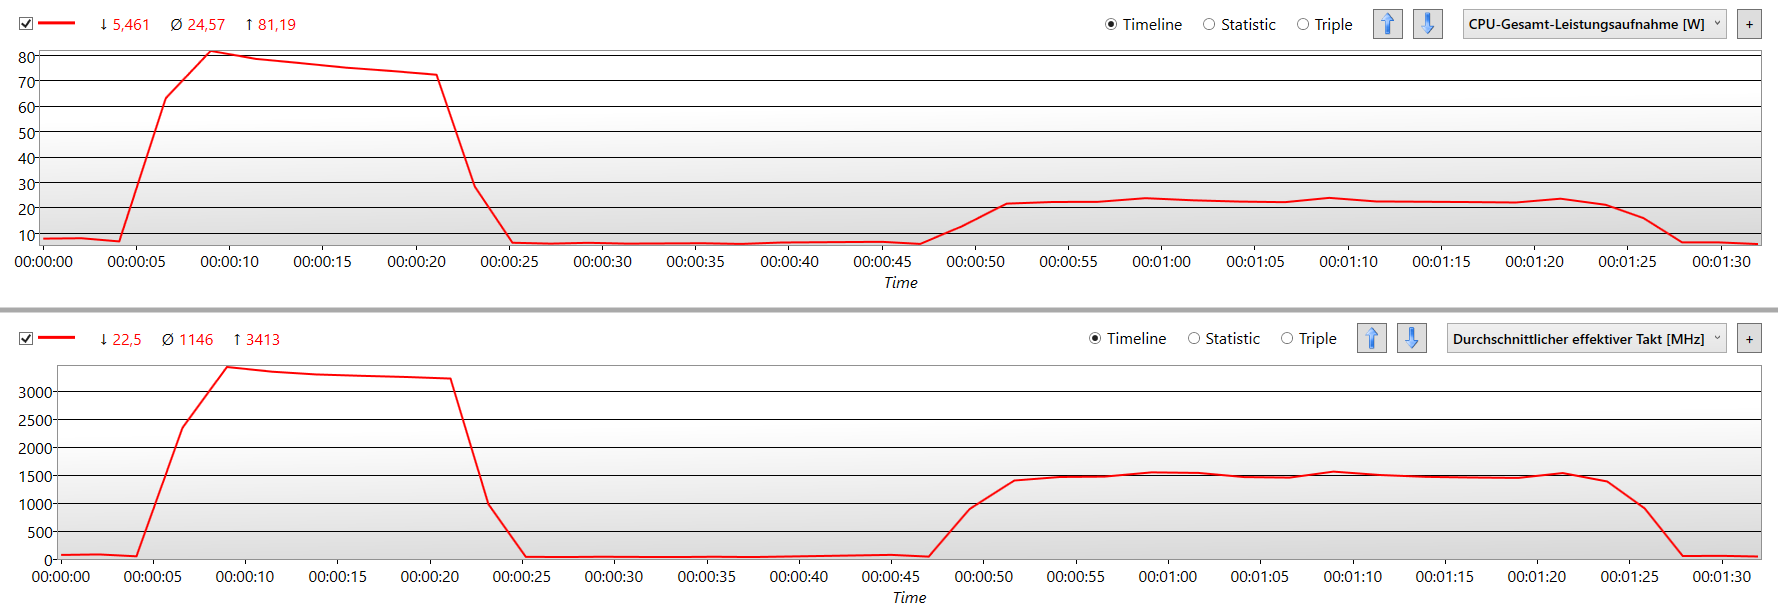
The processor's maximum temperature is quickly reached during high load. At 95 °C (~203 °F), the system starts to reduce its power consumption. Approximately 50 watts of the 125 watts that were available for a short time remain when only the CPU is loaded.
If the graphics card is also stressed, the processor's power consumption even drops to just under 25 watts. The GPU, on the other hand, can consume almost 140 watts even in the long run. Although the fan then blows like a small turbine, it manages to keep all sensors well below the 100 °C (~212. The system always runs with a constant performance. The system runs stably with constant performance and keeps its temperature.
Speakers
You can see quite well in the image of the opened laptop that the speakers are comparatively large. This is reflected in the maximum volume. It's sufficient even in loud environments, and above all, there aren't any sound distortions at maximum volume.
Overall, though, the reproduction quality can't compete with that of the best laptops, such as the Apple MacBook Pro 16. The range of the lower tones is a bit weak. However, the audio quality is sufficient for gaming. If you don't let your expectations get too high, you can listen to music as well.
SCHENKER XMG Pro 17 E22 audio analysis
(±) | speaker loudness is average but good (77 dB)
Bass 100 - 315 Hz
(±) | reduced bass - on average 14.2% lower than median
(±) | linearity of bass is average (13.7% delta to prev. frequency)
Mids 400 - 2000 Hz
(+) | balanced mids - only 3.3% away from median
(+) | mids are linear (2.8% delta to prev. frequency)
Highs 2 - 16 kHz
(+) | balanced highs - only 3.7% away from median
(+) | highs are linear (5.4% delta to prev. frequency)
Overall 100 - 16.000 Hz
(±) | linearity of overall sound is average (17% difference to median)
Compared to same class
» 42% of all tested devices in this class were better, 12% similar, 46% worse
» The best had a delta of 6%, average was 18%, worst was 132%
Compared to all devices tested
» 25% of all tested devices were better, 8% similar, 67% worse
» The best had a delta of 4%, average was 25%, worst was 134%
Apple MacBook Pro 16 2021 M1 Pro audio analysis
(+) | speakers can play relatively loud (84.7 dB)
Bass 100 - 315 Hz
(+) | good bass - only 3.8% away from median
(+) | bass is linear (5.2% delta to prev. frequency)
Mids 400 - 2000 Hz
(+) | balanced mids - only 1.3% away from median
(+) | mids are linear (2.1% delta to prev. frequency)
Highs 2 - 16 kHz
(+) | balanced highs - only 1.9% away from median
(+) | highs are linear (2.7% delta to prev. frequency)
Overall 100 - 16.000 Hz
(+) | overall sound is linear (4.6% difference to median)
Compared to same class
» 0% of all tested devices in this class were better, 0% similar, 100% worse
» The best had a delta of 5%, average was 18%, worst was 45%
Compared to all devices tested
» 0% of all tested devices were better, 0% similar, 100% worse
» The best had a delta of 4%, average was 25%, worst was 134%
Energy management - The XMG Pro 17 is very power-hungry
Energy consumption
At least for a gaming laptop with such a powerful configuration, the XMG Pro 17 E22 is pretty frugal without load. Just under 17 watts is well below the average for the RTX 3080 Ti. However, other laptops with Alder Lake processors are almost able to keep up.
Nevertheless, 266 watts is required under maximum load. This is hardly surprising considering that the processor and graphics card alone are allowed to consume 115 and 130 watts, respectively, for a minimum of 80 seconds. The additional 25 watts of boost are only transferred from the CPU to the GPU.
| Off / Standby | |
| Idle | |
| Load |
|
| SCHENKER XMG Pro 17 E22 i9-12900H, GeForce RTX 3080 Ti Laptop GPU | MSI Raider GE77 HX 12UHS i9-12900HX, GeForce RTX 3080 Ti Laptop GPU | Acer Predator Triton 500 SE PT516-52s-70KX i7-12700H, GeForce RTX 3080 Ti Laptop GPU | SCHENKER XMG Pro 17 (Late 2021, RTX 3080) i7-11800H, GeForce RTX 3080 Laptop GPU | Asus ROG Zephyrus Duo 16 GX650RX R9 6900HX, GeForce RTX 3080 Ti Laptop GPU | Alienware x17 R2 P48E i9-12900HK, GeForce RTX 3080 Ti Laptop GPU | Average NVIDIA GeForce RTX 3080 Ti Laptop GPU | Average of class Gaming | |
|---|---|---|---|---|---|---|---|---|
| Power Consumption | -15% | 12% | 3% | -12% | -55% | -18% | -2% | |
| Idle Minimum * | 13 | 13 -0% | 7 46% | 13.6 -5% | 19 -46% | 24.1 -85% | 17.2 ? -32% | 13.8 ? -6% |
| Idle Average * | 17 | 19 -12% | 19 -12% | 19.4 -14% | 24 -41% | 28.5 -68% | 23.3 ? -37% | 19.2 ? -13% |
| Idle Maximum * | 26 | 29 -12% | 28 -8% | 27.7 -7% | 31 -19% | 60 -131% | 30.8 ? -18% | 26.9 ? -3% |
| Load Average * | 120 | 143 -19% | 114 5% | 110 8% | 104 13% | 128.7 -7% | 121.2 ? -1% | 111.1 ? 7% |
| Witcher 3 ultra * | 221 | 247 -12% | 159 28% | 170 23% | 186.5 16% | 254 -15% | ||
| Load Maximum * | 266 | 352 -32% | 227 15% | 227 15% | 256 4% | 323 -21% | 276 ? -4% | 251 ? 6% |
* ... smaller is better
Energy consumption during The Witcher 3 / stress test
Energy consumption with an external monitor
Battery life
Given the high system performance, the 80 Wh battery is unable to excel in terms of endurance. Only 4:30 hours in the video test is just as below-average as 90 minutes under full load. At least almost 7 hours were achieved in the Wi-Fi test.
However, we wouldn't have expected the overall impression of the battery to be any different. Gaming laptops and workstations are generally meant to be transported rather from outlet to outlet, but they shouldn't be able to win an endurance race. That said, the Power Saving Mode was a bit of a disappointment. The difference is just about 10%, which almost makes the mode superfluous.
This is accompanied by a very long charging time. The discharged battery reaches 80% of its maximum capacity only after about 2 hours. A full charge can take almost 4 hours.
| SCHENKER XMG Pro 17 E22 i9-12900H, GeForce RTX 3080 Ti Laptop GPU, 80 Wh | MSI Raider GE77 HX 12UHS i9-12900HX, GeForce RTX 3080 Ti Laptop GPU, 99.99 Wh | Acer Predator Triton 500 SE PT516-52s-70KX i7-12700H, GeForce RTX 3080 Ti Laptop GPU, 99.98 Wh | SCHENKER XMG Pro 17 (Late 2021, RTX 3080) i7-11800H, GeForce RTX 3080 Laptop GPU, 73 Wh | Asus ROG Zephyrus Duo 16 GX650RX R9 6900HX, GeForce RTX 3080 Ti Laptop GPU, 90 Wh | Alienware x17 R2 P48E i9-12900HK, GeForce RTX 3080 Ti Laptop GPU, 87 Wh | Average of class Gaming | |
|---|---|---|---|---|---|---|---|
| Battery Runtime | 20% | 38% | 6% | 30% | -60% | 11% | |
| H.264 | 273 | 389 42% | 490 79% | 309 13% | 559 105% | 399 ? 46% | |
| WiFi v1.3 | 408 | 324 -21% | 344 -16% | 340 -17% | 469 15% | 117 -71% | 368 ? -10% |
| Load | 88 | 122 39% | 133 51% | 107 22% | 62 -30% | 46 -48% | 84.4 ? -4% |
Pros
Cons
Verdict - Corners cut, but not in terms of performance
Taking a look at the performance rates, the decisive factor in a gaming laptop, is pleasing. The Schenker XMG Pro 17 shows that it has an optimal configuration both in terms of maximum performance as well as continuous load.
While it's not enough for the absolute top ranking, the comparatively high power consumption and the clearly audible ventilation allow the excellent hardware to unleash its potential. In any case, recent games and most future games will be happy with this hardware. Users who want to connect a 4K monitor or an equivalent TV won't have to make any sacrifices even then.
The Schenker XMG Pro 17 E22 is fully focused on performance, while the battery, display, and design can only be considered average at best.
Furthermore, the port configuration is compelling. First of all, the multiple video outputs allow integrating the laptop into an extensive work station. However, it would've been possible to include a full-fledged card slot.
This thriftiness also runs like a red thread through the gaming laptop's construction. The display brightness is low, but of course, it's sufficient for any desk. DDR4 was still used for the RAM, which costs at least a few small percentage points when it comes to gaming performance. In addition, there's the limited mobility, which hardly plays a role in this segment, though. Still, the Schenker laptop is one of the heaviest and thickest models, and its endurance is also limited.
These many minor weaknesses tarnish the overall impression, but certainly not the impression that the laptop makes when gaming and working. There are faster gaming devices like the MSI Raider GE77, but the XMG Pro 17 E22 can certainly keep up with the Asus ROG Zephyrus Duo 16 - at a much more attractive price. The Acer Predator Triton 500 SE is also on par, but it lags a bit behind in almost every benchmark.
The Schenker laptop might be quite big and not exactly stylish, but in return, it delivers surprisingly solid performance rates that are worthy of a gaming workstation.
Price and availability
The base model with the Intel Core i7-12700H and the Nvidia GeForce RTX 3070 Ti starts at 2,500 Euros (~$2,552), but without an operating system. For the top configuration with a 4K display and AdobeRGB, as well as the i9-12900H and the RTX 3080 Ti, you'll have to shell out at least 3,500 Euros (~$3,573). Naturally, this price increases depending on the configuration. The desired configuration can be selected at Bestware.
SCHENKER XMG Pro 17 E22
-
07/18/2022 v7
Mario Petzold
More articles related to this device
SCHENKER XMG Pro 17 E22 (XMG Pro 17 Series)Related Articles


Pricecompare

