

AMD Radeon RX 7700S vs AMD Radeon RX 7600M
AMD Radeon RX 7700S
► remove from comparison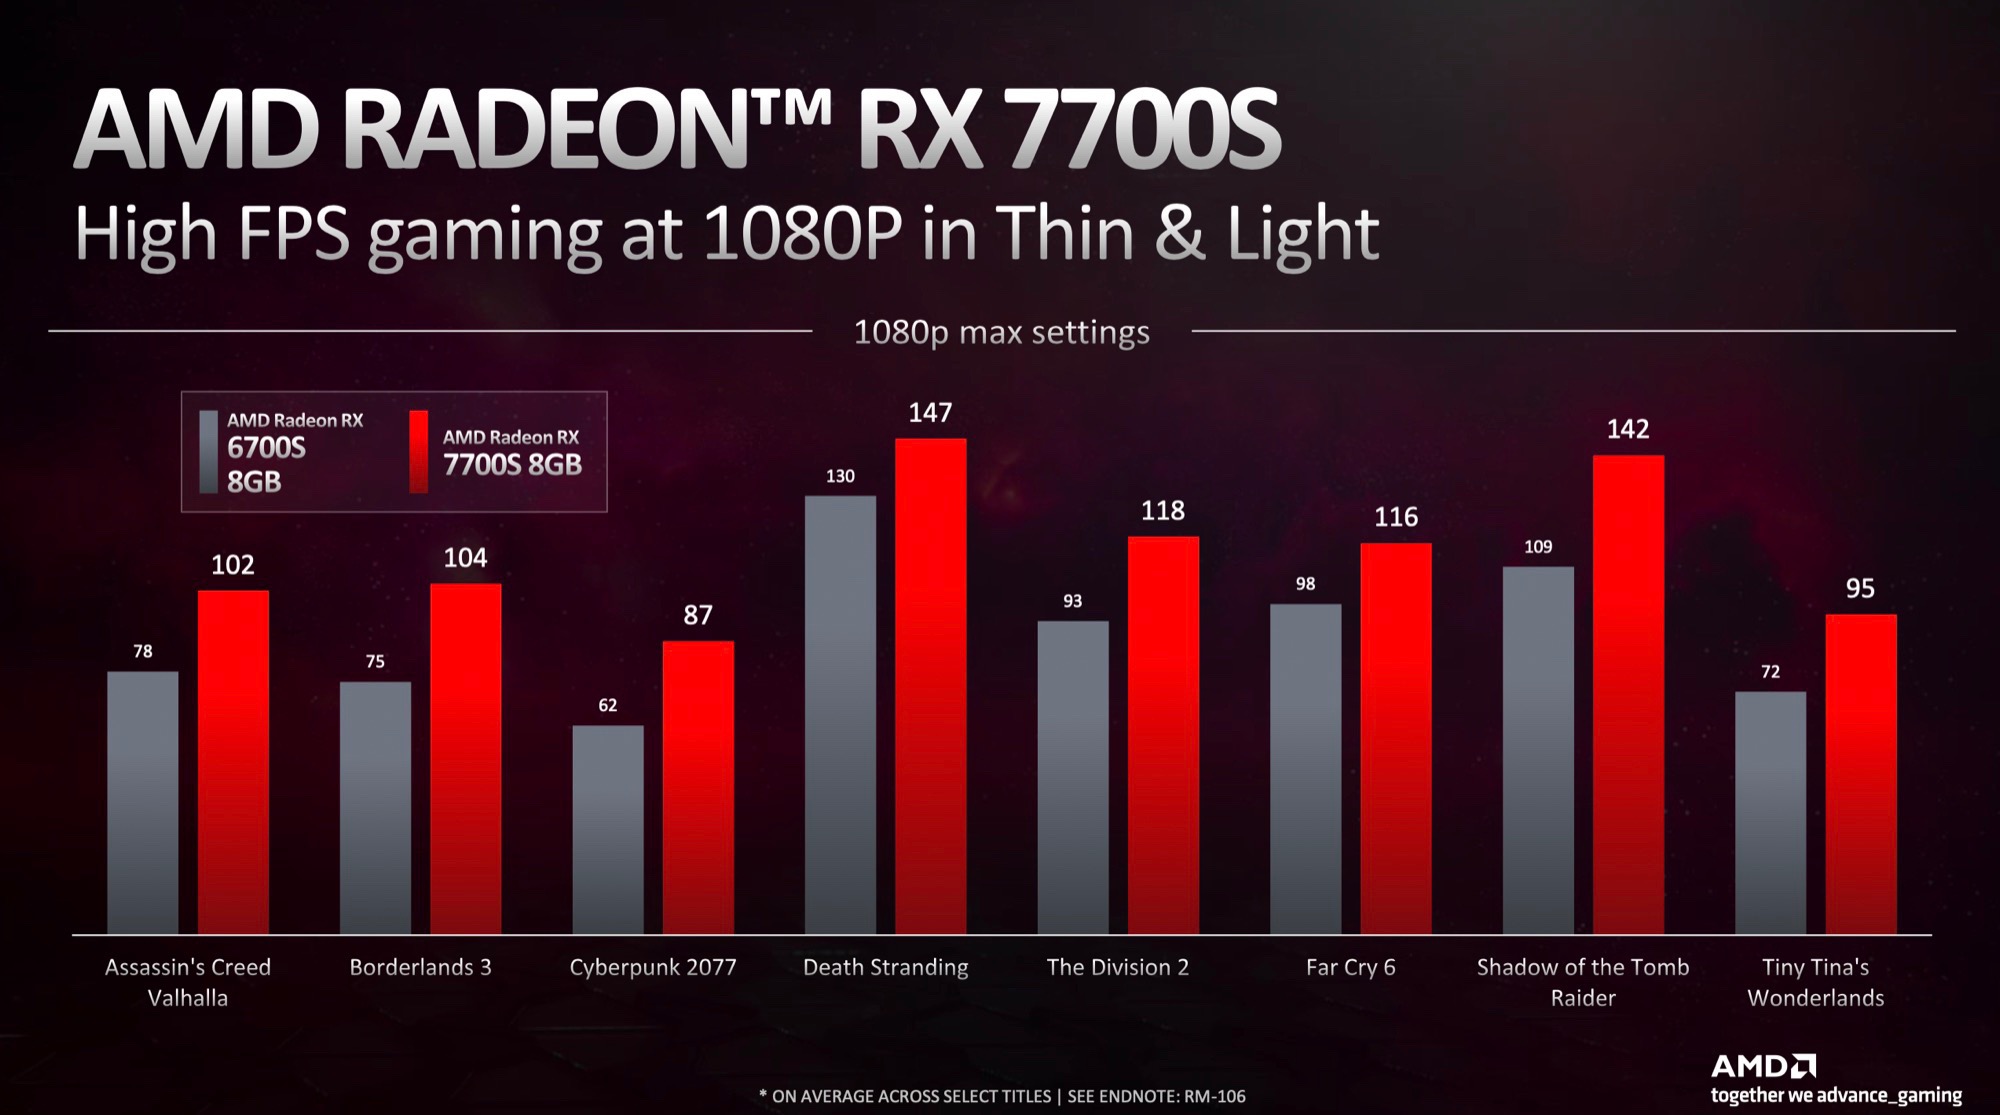
The AMD Radeon RX 7700S is a mobile upper mid-range graphics card based on the Navi 33 chip (RDNA 3 architecture) manufactured in 6nm. It features 2,048 cores (32 CUs - compute units) and 8 GB of fast GDDR6 graphics memory connected with a 128 Bit memory bus. The chip also includes 32 MB Infinity Cache. The clock speed of the cores will depend on the laptop according to AMD. The specified game clock speed is 2200 MHz (most likely at 100 W TGP). The 7700S is the power efficient version of the RX 7600M XT with slightly reduced clock speeds (-100 MHz) and TDP (-20W max).
AMD compares the performance to the old Radeon RX 6700S, that is easily beaten by the 7700S. As the theoretical performance is only slightly below the 7600M XT (at 100W TGP), the 7700S should also beat the RTX 3060 desktop GPU. Although the Raytracing performance did increase for RDNA 3, the GeForce GPUs are still faster in this regard.
The Navi 33 chip is manufactured at TSMC in the current 6nm process (versus 4nm of Nvidia RTX 4000 series). The power consumption (TGP) is specified at 75 to 100 Watt.
AMD Radeon RX 7600M
► remove from comparison
The AMD Radeon RX 7600M is a mobile upper mid-range graphics card based on the Navi 33 chip (RDNA 3 architecture) manufactured in 6nm. It features 1,792 cores (28 CUs - compute units) and 8 GB of fast GDDR6 graphics memory connected with a 128 Bit memory bus. The chip also includes 32 MB Infinity Cache. The clock speed of the cores will depend on the laptop according to AMD. The specified game clock speed is 2070 MHz (most likely at 90 W TGP).
The performance should be similar to the old Radeon RX 6650M XT (28 CUs RDNA 2, higher clock speed) and therefore best suited for 1080p gaming. Although the Raytracing performance did increase for RDNA 3, the GeForce GPUs are still faster in this regard.
The Navi 33 chip is manufactured at TSMC in the current 6nm process (versus 4nm of Nvidia RTX 4000 series). The power consumption (TGP) is specified at 50 to 90 Watt.
| AMD Radeon RX 7700S | AMD Radeon RX 7600M | |||||||||||||||||||||||||||||||
| Radeon RX 7000M Series |
|
| ||||||||||||||||||||||||||||||
| Codename | Navi 33 | Navi 33 | ||||||||||||||||||||||||||||||
| Architecture | RDNA 3 | RDNA 3 | ||||||||||||||||||||||||||||||
| Pipelines | 2048 - unified | 1792 - unified | ||||||||||||||||||||||||||||||
| ROPs | 64 | 64 | ||||||||||||||||||||||||||||||
| Core Speed | 2200 (Boost) MHz | 2070 (Boost) MHz | ||||||||||||||||||||||||||||||
| Theoretical Performance | 31 TFLOPS FP16, 20.5 TFLOPS FP32 | 34.5 TFLOPS FP16, 17.3 TFLOPS FP32 | ||||||||||||||||||||||||||||||
| Cache | L3: 32 MB | L3: 32 MB | ||||||||||||||||||||||||||||||
| Memory Speed | 18000 MHz | 16000 MHz | ||||||||||||||||||||||||||||||
| Memory Bus Width | 128 Bit | 128 Bit | ||||||||||||||||||||||||||||||
| Memory Type | GDDR6 | GDDR6 | ||||||||||||||||||||||||||||||
| Max. Amount of Memory | 8 GB | 8 GB | ||||||||||||||||||||||||||||||
| Shared Memory | no | no | ||||||||||||||||||||||||||||||
| Memory Bandwidth | 288 GB/s | 256 GB/s | ||||||||||||||||||||||||||||||
| API | DirectX 12, Shader 6.4, OpenGL 4.6 | DirectX 12, Shader 6.4, OpenGL 4.6 | ||||||||||||||||||||||||||||||
| Power Consumption | 100 Watt (75 - 100 Watt TGP) | 90 Watt (50 - 90 Watt TGP) | ||||||||||||||||||||||||||||||
| Transistors | 13.3 Billion | 13.3 Billion | ||||||||||||||||||||||||||||||
| Die Size | 204 mm² | 204 mm² | ||||||||||||||||||||||||||||||
| technology | 6 nm | 6 nm | ||||||||||||||||||||||||||||||
| Notebook Size | large | large | ||||||||||||||||||||||||||||||
| Date of Announcement | 05.01.2023 | 05.01.2023 | ||||||||||||||||||||||||||||||
| Link to Manufacturer Page | www.amd.com | www.amd.com |
Benchmarks

3DM Vant. Perf. total + AMD Radeon RX 7600M
Cinebench R15 OpenGL 64 Bit + AMD Radeon RX 7700S
Average Benchmarks AMD Radeon RX 7700S → 100% n=11
Average Benchmarks AMD Radeon RX 7600M → 103% n=11
* Smaller numbers mean a higher performance
1 This benchmark is not used for the average calculation
Game Benchmarks
The following benchmarks stem from our benchmarks of review laptops. The performance depends on the used graphics memory, clock rate, processor, system settings, drivers, and operating systems. So the results don't have to be representative for all laptops with this GPU. For detailed information on the benchmark results, click on the fps number.


Dragon's Dogma 2
2024
Last Epoch
2024
Skull & Bones
2024
Helldivers 2
2024
Enshrouded
2024
Palworld
2024

Ready or Not
2023
The Finals
2023


Alan Wake 2
2023
Lords of the Fallen
2023
Total War Pharaoh
2023

Counter-Strike 2
2023

Baldur's Gate 3
2023
Lies of P
2023
The Crew Motorfest
2023
Armored Core 6
2023
Atlas Fallen
2023

F1 23
2023

Company of Heroes 3
2023
Sons of the Forest
2023
Atomic Heart
2023
Returnal
2023
Hogwarts Legacy
2023
F1 22
2022

Strange Brigade
2018
Far Cry 5
2018
X-Plane 11.11
2018
Dota 2 Reborn
2015
The Witcher 3
2015
GTA V
2015Average Gaming AMD Radeon RX 7700S → 100%
Average Gaming 30-70 fps → 100%
Average Gaming AMD Radeon RX 7600M → 94%
Average Gaming 30-70 fps → 94%
| AMD Radeon RX 7700S | AMD Radeon RX 7600M | |||||||||||||
|---|---|---|---|---|---|---|---|---|---|---|---|---|---|---|
| low | med. | high | ultra | QHD | 4K | low | med. | high | ultra | QHD | 4K | |||
| Horizon Forbidden West | 54.8 | 30.9 | 30.2 | 24.1 | 13.7 | |||||||||
| Dragon's Dogma 2 | 49.5 | 34.6 | 19.6 | |||||||||||
| Last Epoch | 121.2 | 110.6 | 82.7 | 51.5 | 22.6 | |||||||||
| Skull & Bones | 83 | 66 | 47 | 37 | 21 | |||||||||
| Helldivers 2 | 52.5 | 45.5 | 44.9 | 32.4 | 17.8 | |||||||||
| Enshrouded | 49.9 | 41.5 | 34.4 | 25.3 | 13.3 | |||||||||
| Palworld | 83.8 | 64.1 | 59 | 39.4 | 20.8 | |||||||||
| Prince of Persia The Lost Crown | 351 | 339 | 329 | 223 | 112.2 | |||||||||
| Ready or Not | 162.6 | 127.4 | 89.3 | 53.2 | 22.9 | |||||||||
| The Finals | 121.4 | 107.5 | 83.5 | 50.3 | 24 | |||||||||
| Avatar Frontiers of Pandora | 49 | 42 | 28 | 18 | 8 | |||||||||
| Call of Duty Modern Warfare 3 2023 | 111 | 83 | 76 | 48 | 27 | |||||||||
| Alan Wake 2 | 48.1 | 39.9 | 22.5 | 12.3 | ||||||||||
| Lords of the Fallen | 55.7 | 46.3 | 33 | 21.9 | 11.4 | |||||||||
| Total War Pharaoh | 145 | 90.5 | 72.9 | 49 | 24.4 | |||||||||
| Assassin's Creed Mirage | 86 | 80 | 60 | 44 | 27 | |||||||||
| Counter-Strike 2 | 164 | 128 | 98.4 | 61.6 | 30.4 | |||||||||
| Cyberpunk 2077 2.2 Phantom Liberty | 100.7 | 80.5 | 68.1 | 60.7 | 37.3 | 15.8 | 73.8 | 62.3 | 57.1 | 36.6 | 17.2 | |||
| Baldur's Gate 3 | 106.8 | 88 | 76.4 | 73.6 | 51.1 | 24.7 | 83.1 | 71 | 68.9 | 47.2 | 22.9 | |||
| Lies of P | 101.1 | 89.4 | 80.4 | 54.5 | 27 | |||||||||
| The Crew Motorfest | 60 | 58 | 56 | 37 | 21 | |||||||||
| Armored Core 6 | 84.1 | 78.6 | 63.9 | 52.9 | 31.1 | |||||||||
| Atlas Fallen | 94.4 | 86.3 | 70.4 | 48.6 | 26.5 | |||||||||
| Ratchet & Clank Rift Apart | 46.2 | 35.5 | 30.7 | 24.6 | 15.4 | |||||||||
| F1 23 | 232 | 152 | 31 | 19 | 7 | |||||||||
| Resident Evil 4 Remake | 66.3 | 59.8 | 42.5 | 29.4 | 15.5 | |||||||||
| Company of Heroes 3 | 114 | 91.3 | 90.1 | 62.9 | 35.8 | |||||||||
| Sons of the Forest | 65.1 | 61.6 | 61.3 | 45.5 | 26.1 | |||||||||
| Atomic Heart | 95 | 58.3 | 44.4 | 33.3 | 20 | |||||||||
| Returnal | 72 | 65 | 55 | 39 | 21 | |||||||||
| Hogwarts Legacy | 76.1 | 58.4 | 46.9 | 29.8 | 17.7 | |||||||||
| Strange Brigade | 449 | 202 | 167.4 | 143.9 | 91.9 | 47.9 | 218 | 185 | 157.2 | |||||
| Far Cry 5 | 148 | 130 | 123 | 117 | 81 | 39 | 112 | 110 | 103 | |||||
| X-Plane 11.11 | 97.6 | 79.3 | 65 | 46.8 | 93.2 | 76 | 62.1 | |||||||
| Final Fantasy XV Benchmark | 206 | 106 | 74.8 | 54.5 | 29 | 102.3 | 70.3 | |||||||
| Dota 2 Reborn | 174 | 159.8 | 156.5 | 136.8 | 85.3 | 149.4 | 139.6 | 125.7 | 113 | |||||
| The Witcher 3 | 392.2 | 277.5 | 147.1 | 84 | 43 | 232 | 138 | 94 | ||||||
| GTA V | 184 | 178.6 | 170.6 | 95.8 | 67.1 | 68.4 | 168.5 | 145.2 | 77.7 | |||||
| AMD Radeon RX 7700S | AMD Radeon RX 7600M | |||||||||||||
| low | med. | high | ultra | QHD | 4K | low | med. | high | ultra | QHD | 4K | < 30 fps < 60 fps < 120 fps ≥ 120 fps | 3 6 | 4 5 | 4 5 | 5 2 | 3 3 | 3 4 2 | < 30 fps < 60 fps < 120 fps ≥ 120 fps | 1 1 | 7 19 11 | 12 18 8 | 1 14 17 2 | 9 19 2 1 | 27 3 1 |
For more games that might be playable and a list of all games and graphics cards visit our Gaming List