




Verdict
AMD's Strix Halo series is designed to combine powerful processors with particularly capable iGPUs. While the Ryzen AI Max+ Pro 395 with the Radeon 8060S and the Ryzen AI Max Pro 390 with the Radeon 8050S both impressed in our tests, the Ryzen AI Max Pro 380 reviewed here has a much harder time standing out. Its Radeon 8040S is faster than former iGPU frontrunners such as the Radeon 890M and Intel's Arc Graphics 140V, but the advantage is sometimes fairly modest, especially since emissions and power consumption under load are often noticeably higher.
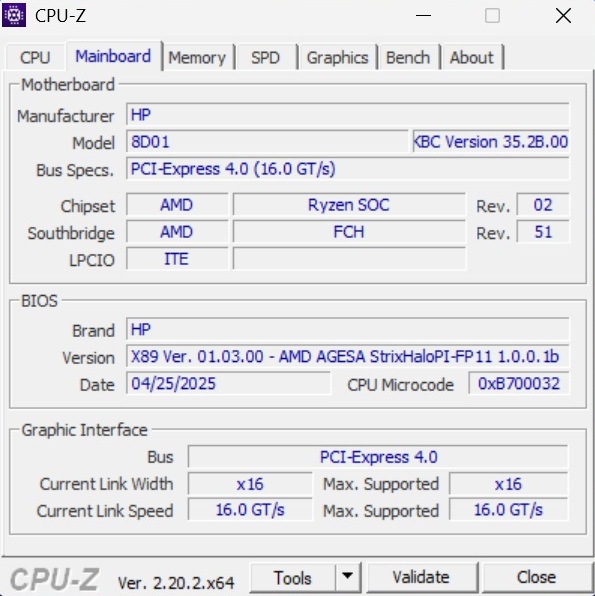
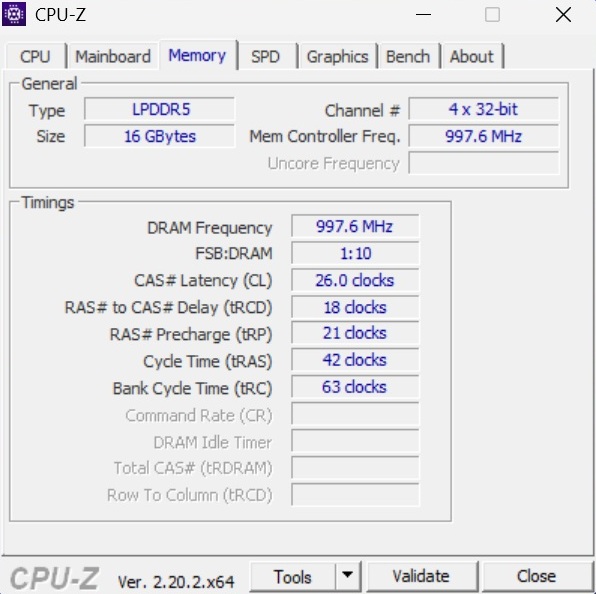
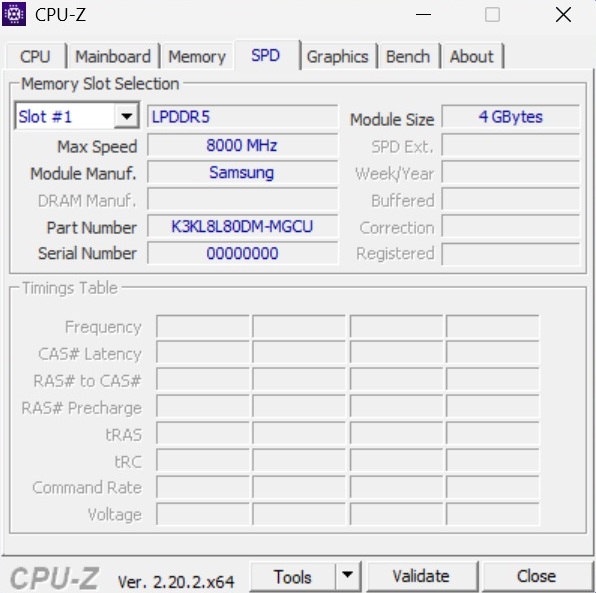
The test configuration is also hampered by its meager memory capacity. The 16 GB of DDR5 RAM cannot be upgraded, which unnecessarily limits the system's potential, particularly with an iGPU that has to share system memory.
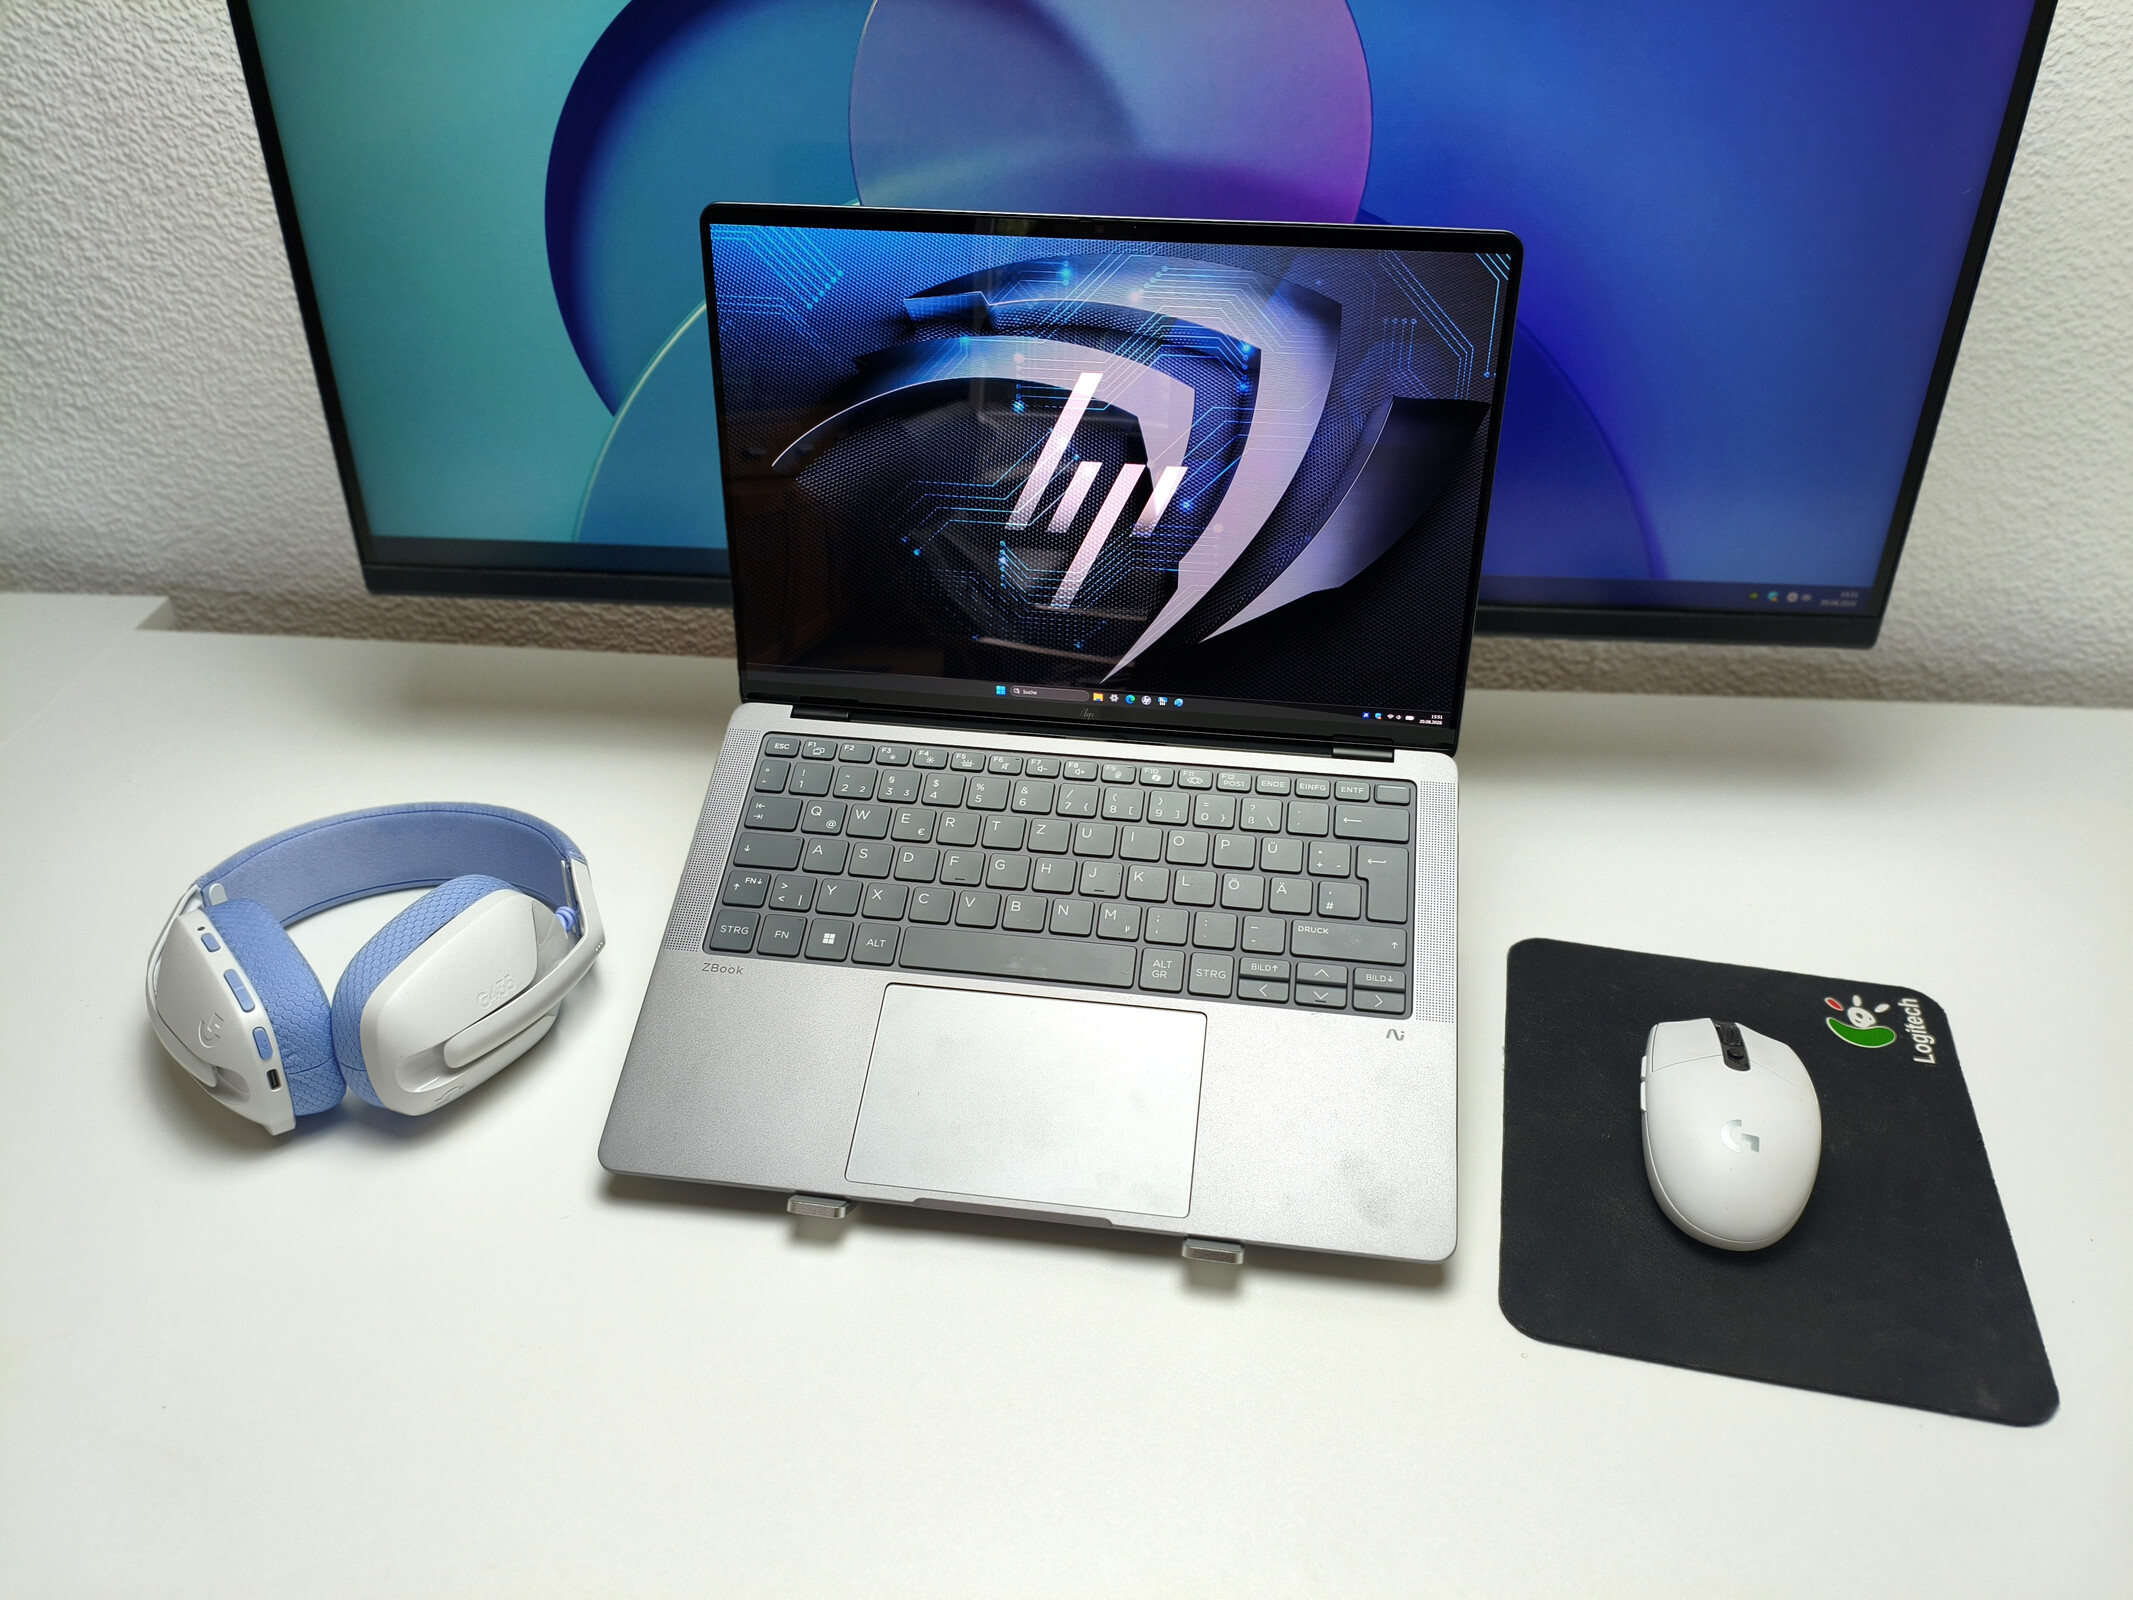
Aside from that, the 14-inch version of the ZBook Ultra G1a once again makes a strong impression. Its highlights include the very sturdy, premium-quality chassis, modern connectivity including two Thunderbolt 4 ports, and a vibrant, high-contrast OLED display with a resolution of 2,880 x 1,800 pixels, a 120 Hz refresh rate and touch support.
Pros
Cons
Price and availability
The tested B30FBES version is available from various online retailers for around €2,000 (e.g., Galaxus). Availability, prices and warranty terms may vary by region.

- $1,950.00HP ZBook Ultra G1a 14" Mobile Workstation - WUXGA - AMD Ryzen AI MAX PRO 390-32 GB - 1 TB SSD - English Keyboard - Meteor Silver - Smart Buy - AMD Chip - 1920 x 1200 - Windows 11 Pro - Radeon 8050S
- $2,824.99HP ZBook Ultra G1a 14" Touchscreen Mobile Workstation - 2.8K - AMD Ryzen AI Max+ PRO 395-64 GB - English Keyboard - Meteor Silver - Smart Buy - AMD Chip - 2880 x 1800 - Windows 11 Pro - Radeon 8060S
- $6,899.21HP ZBook Ultra G1a 14" Touchscreen Mobile Workstation - 2.8K - AMD Ryzen AI Max+ PRO 395-128 GB - English Keyboard - Meteor Silver - Smart Buy - AMD Chip - 2880 x 1800 - Windows 11 Pro - Radeon 8060
Specifications
Case, connectivity and input devices
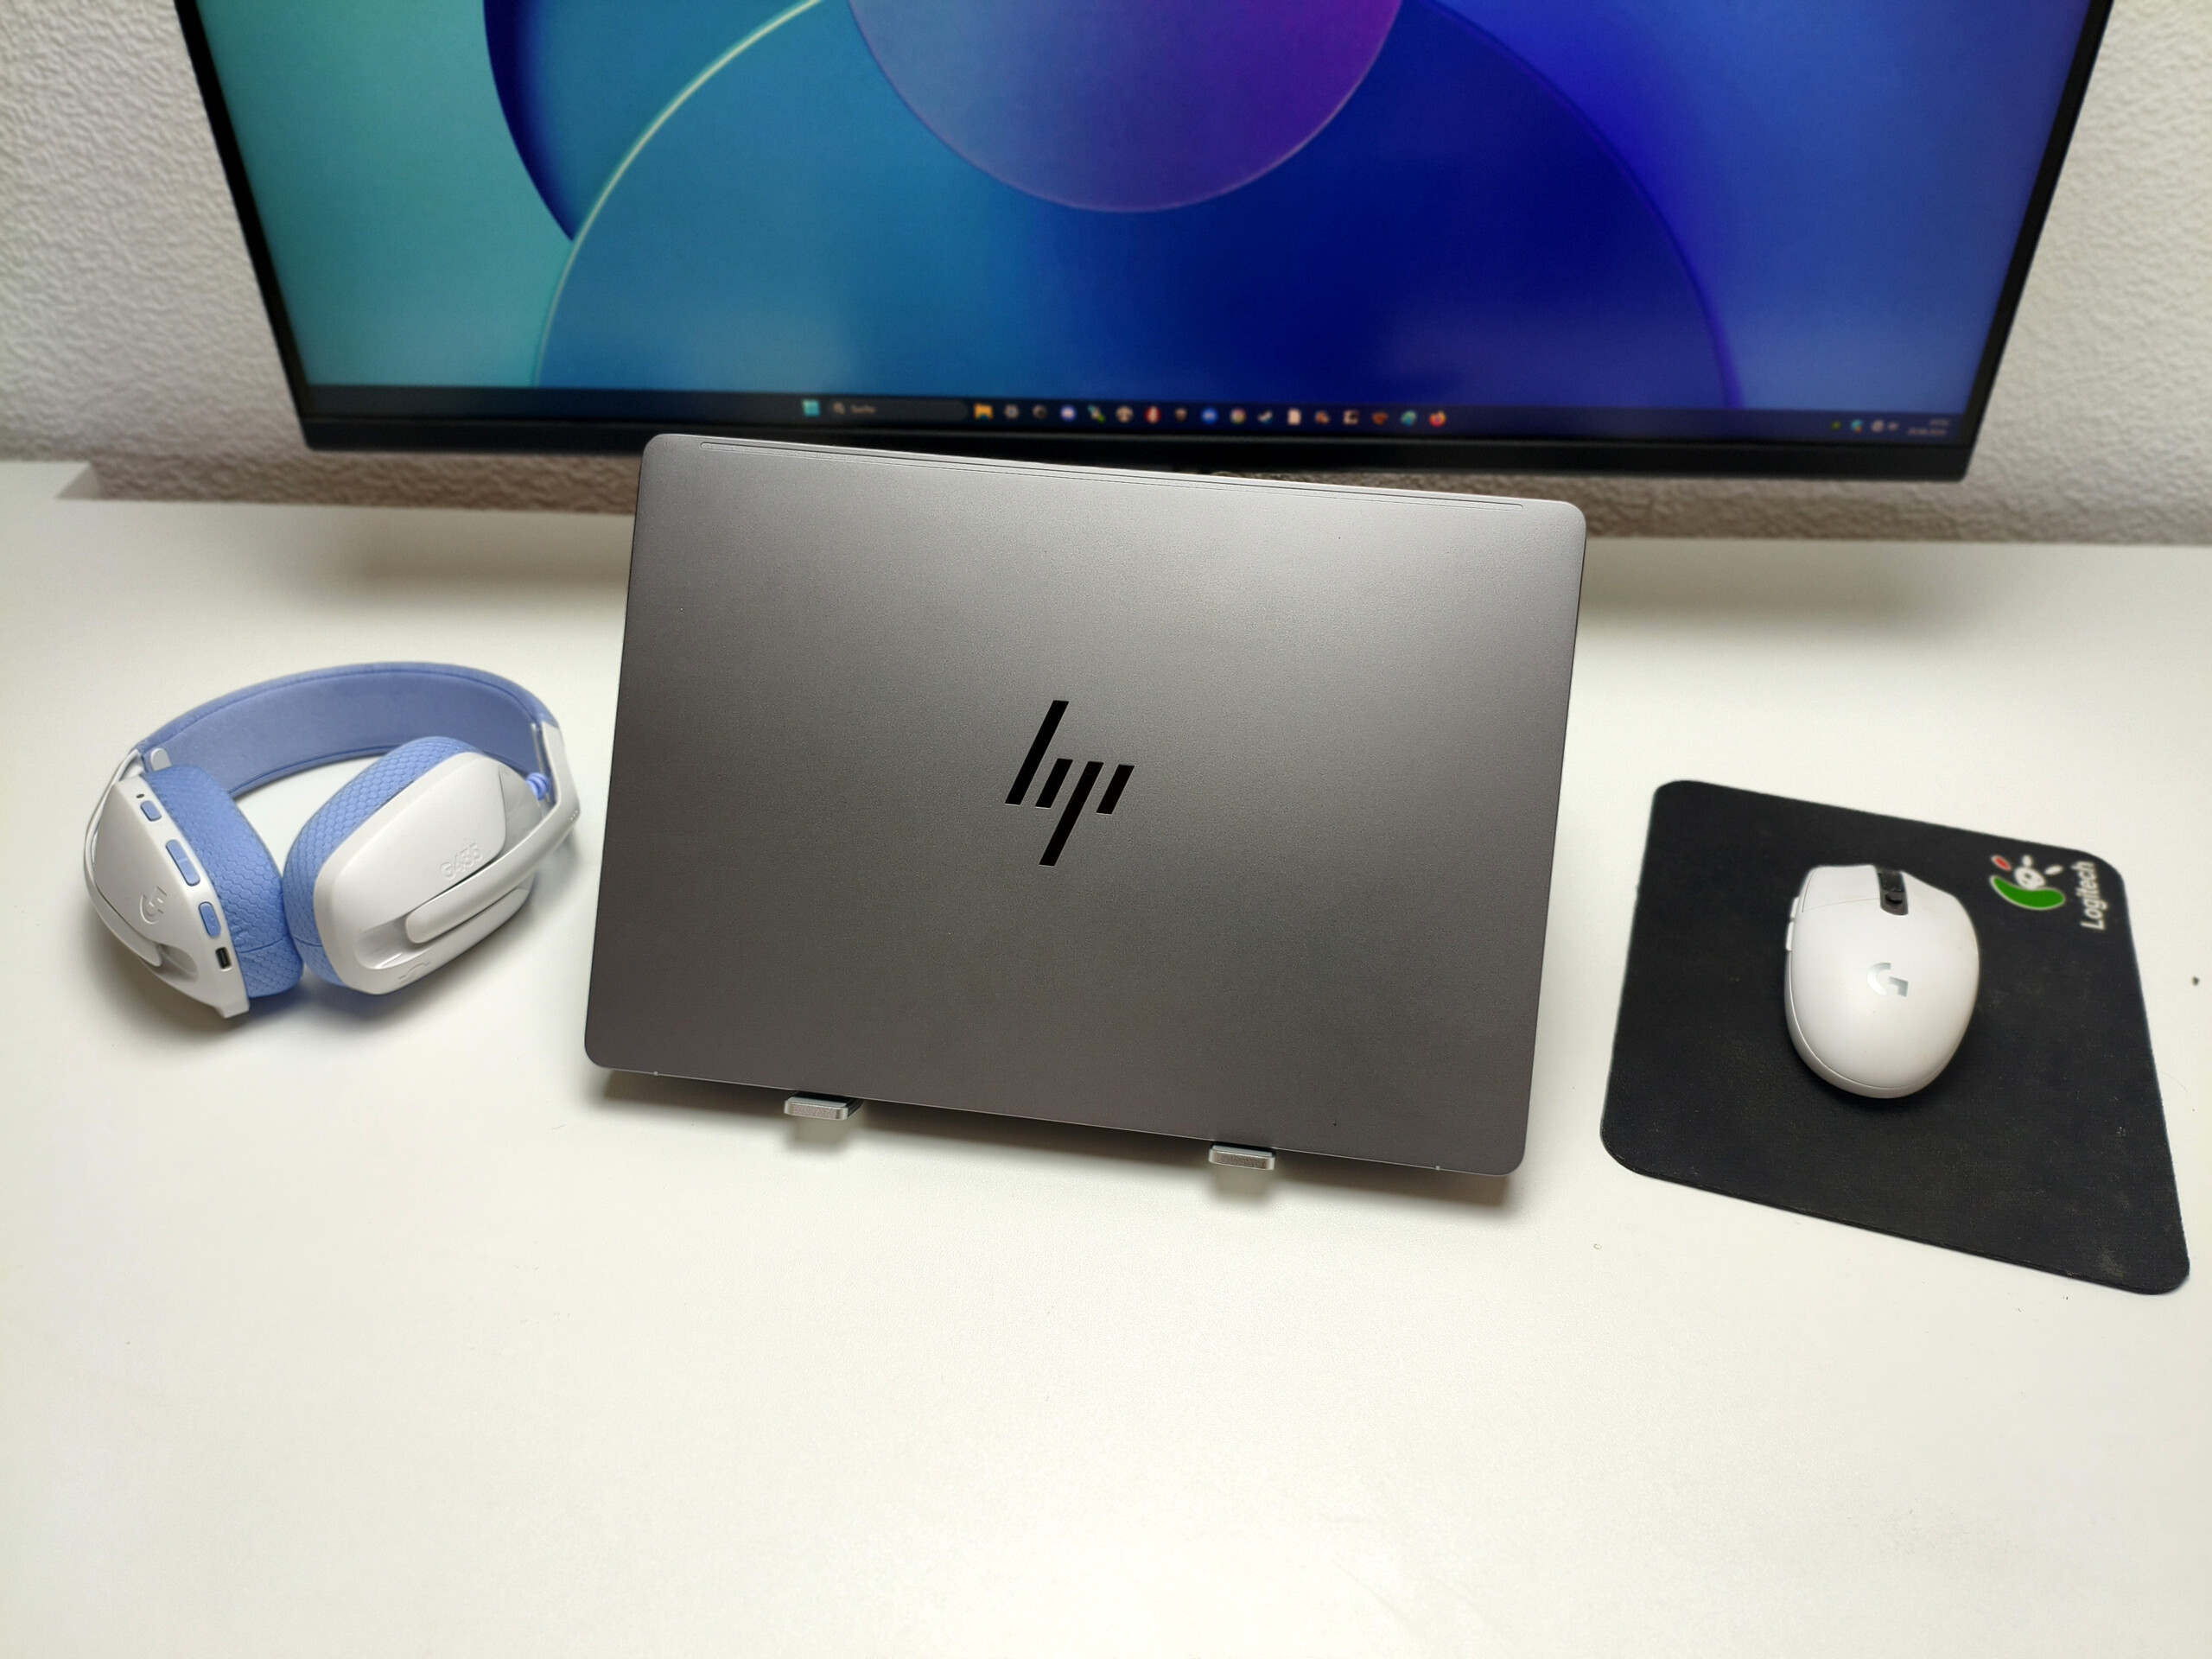
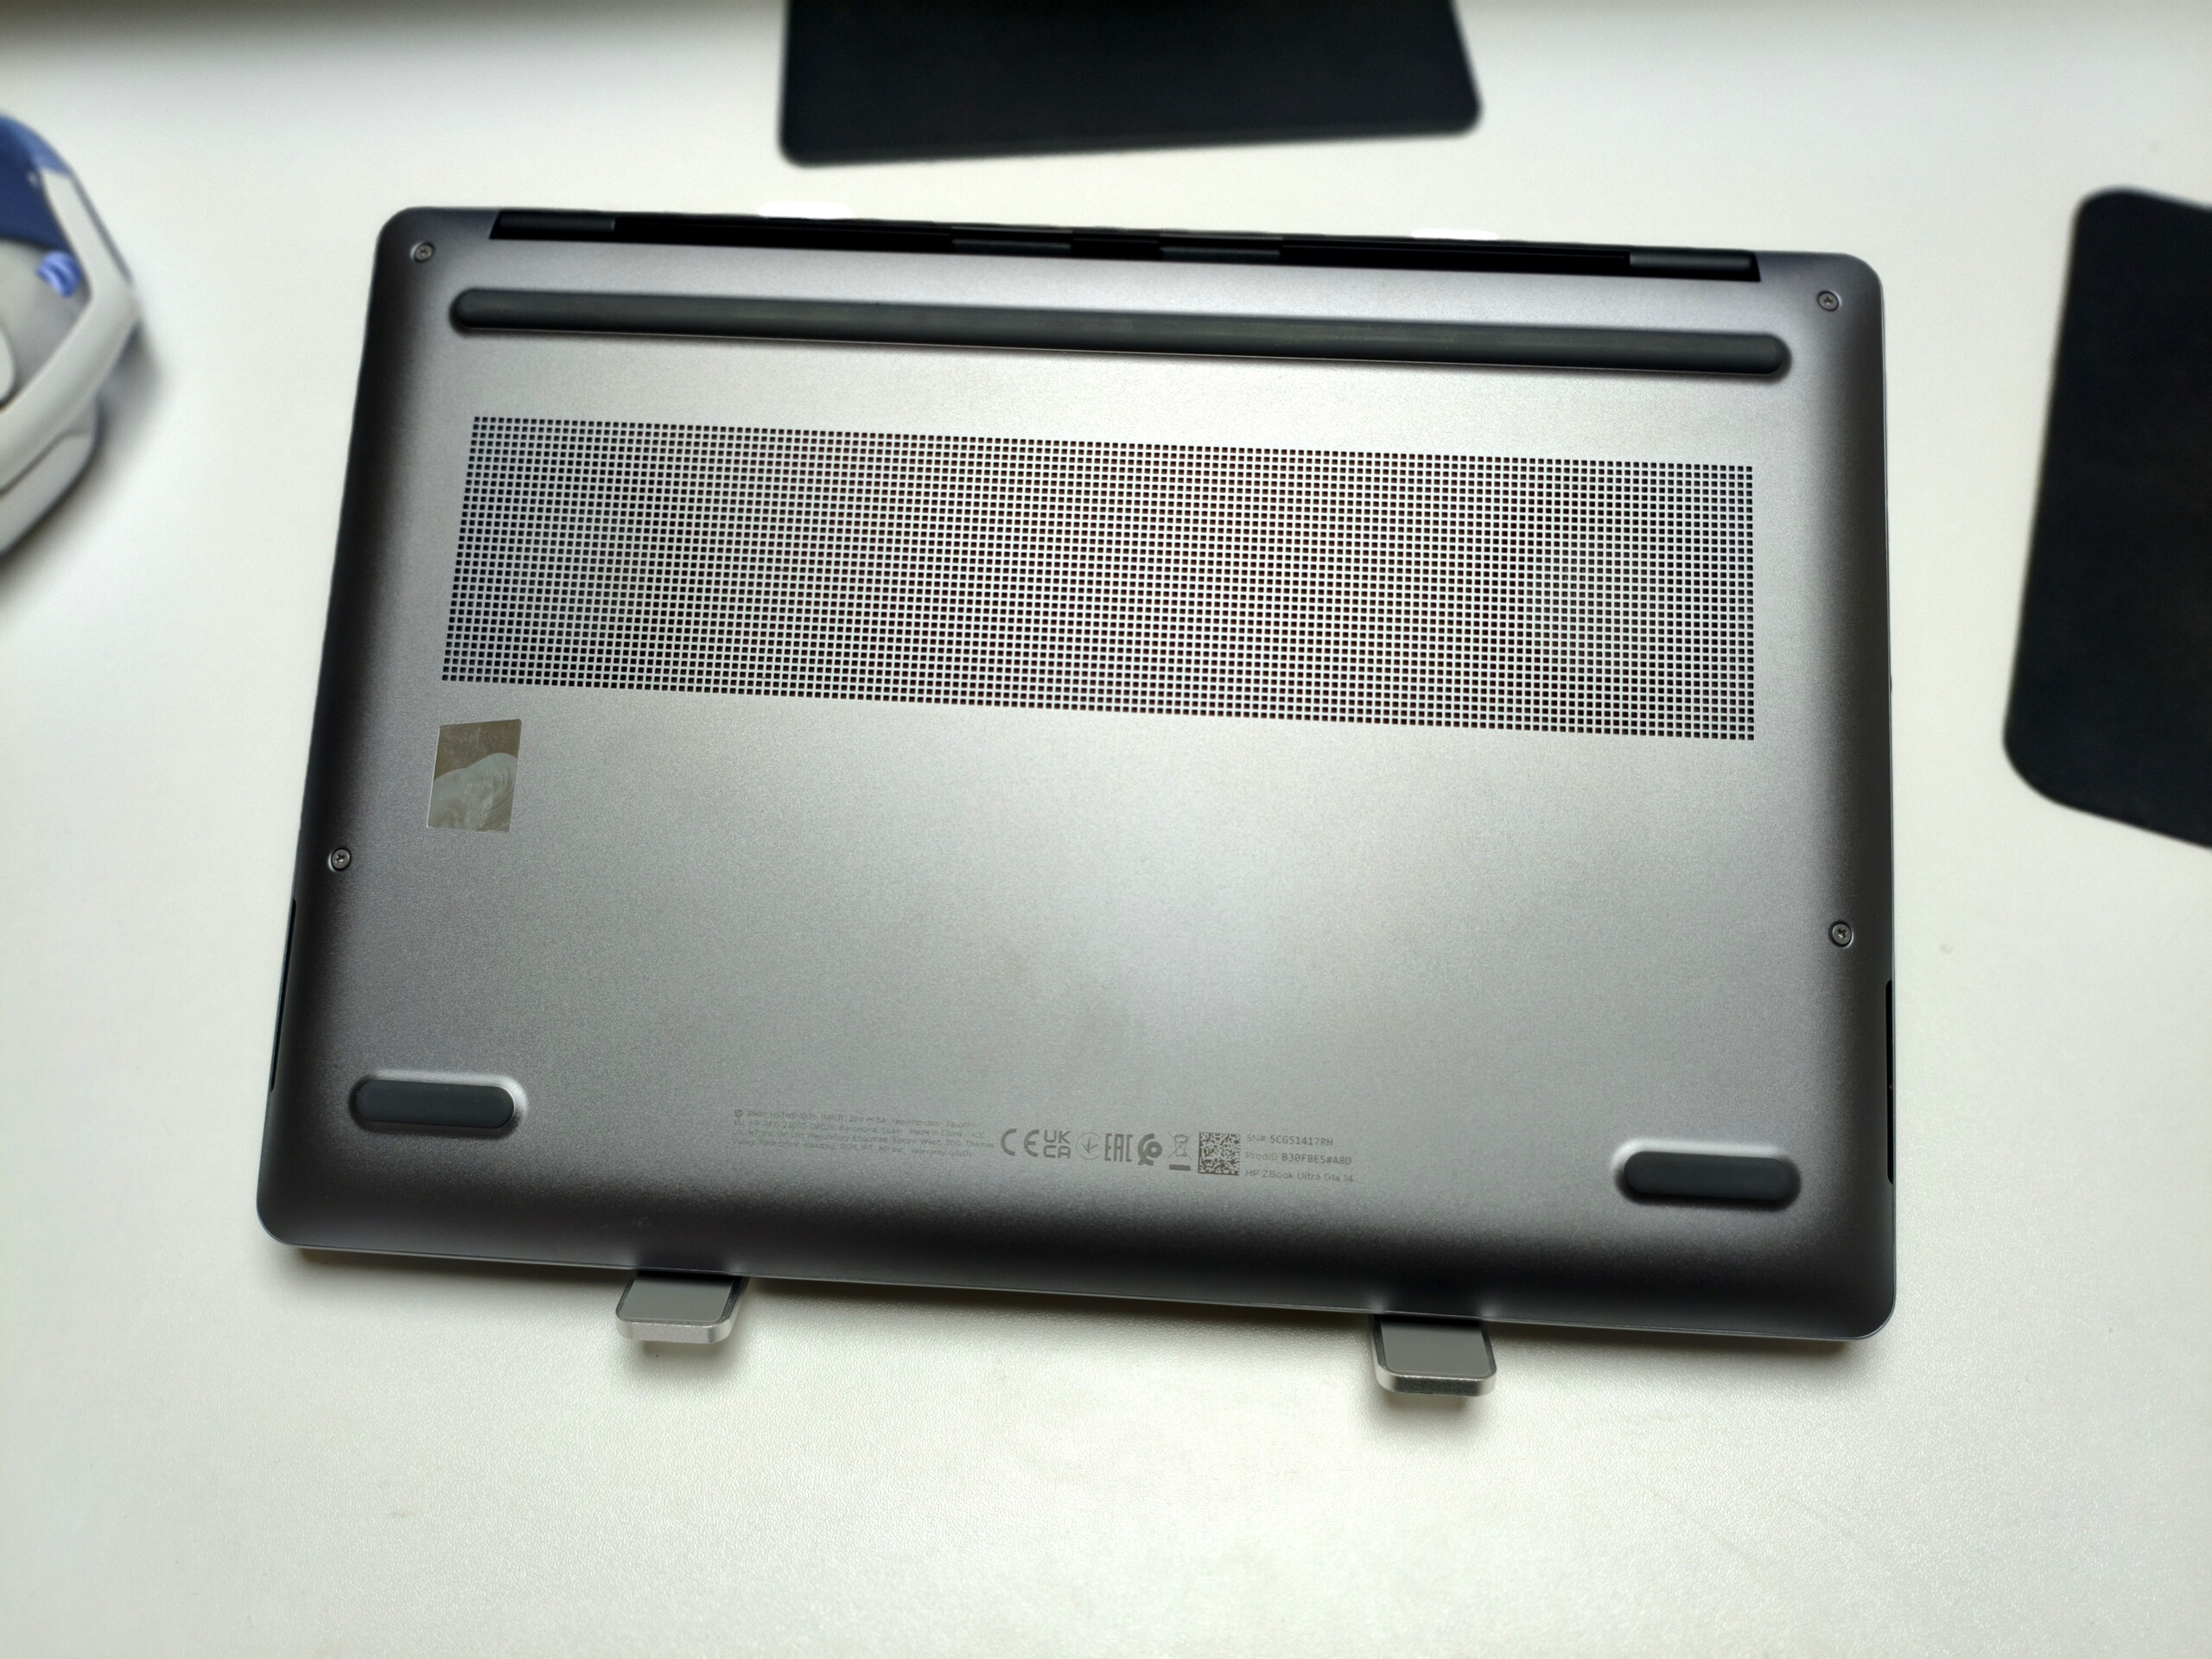
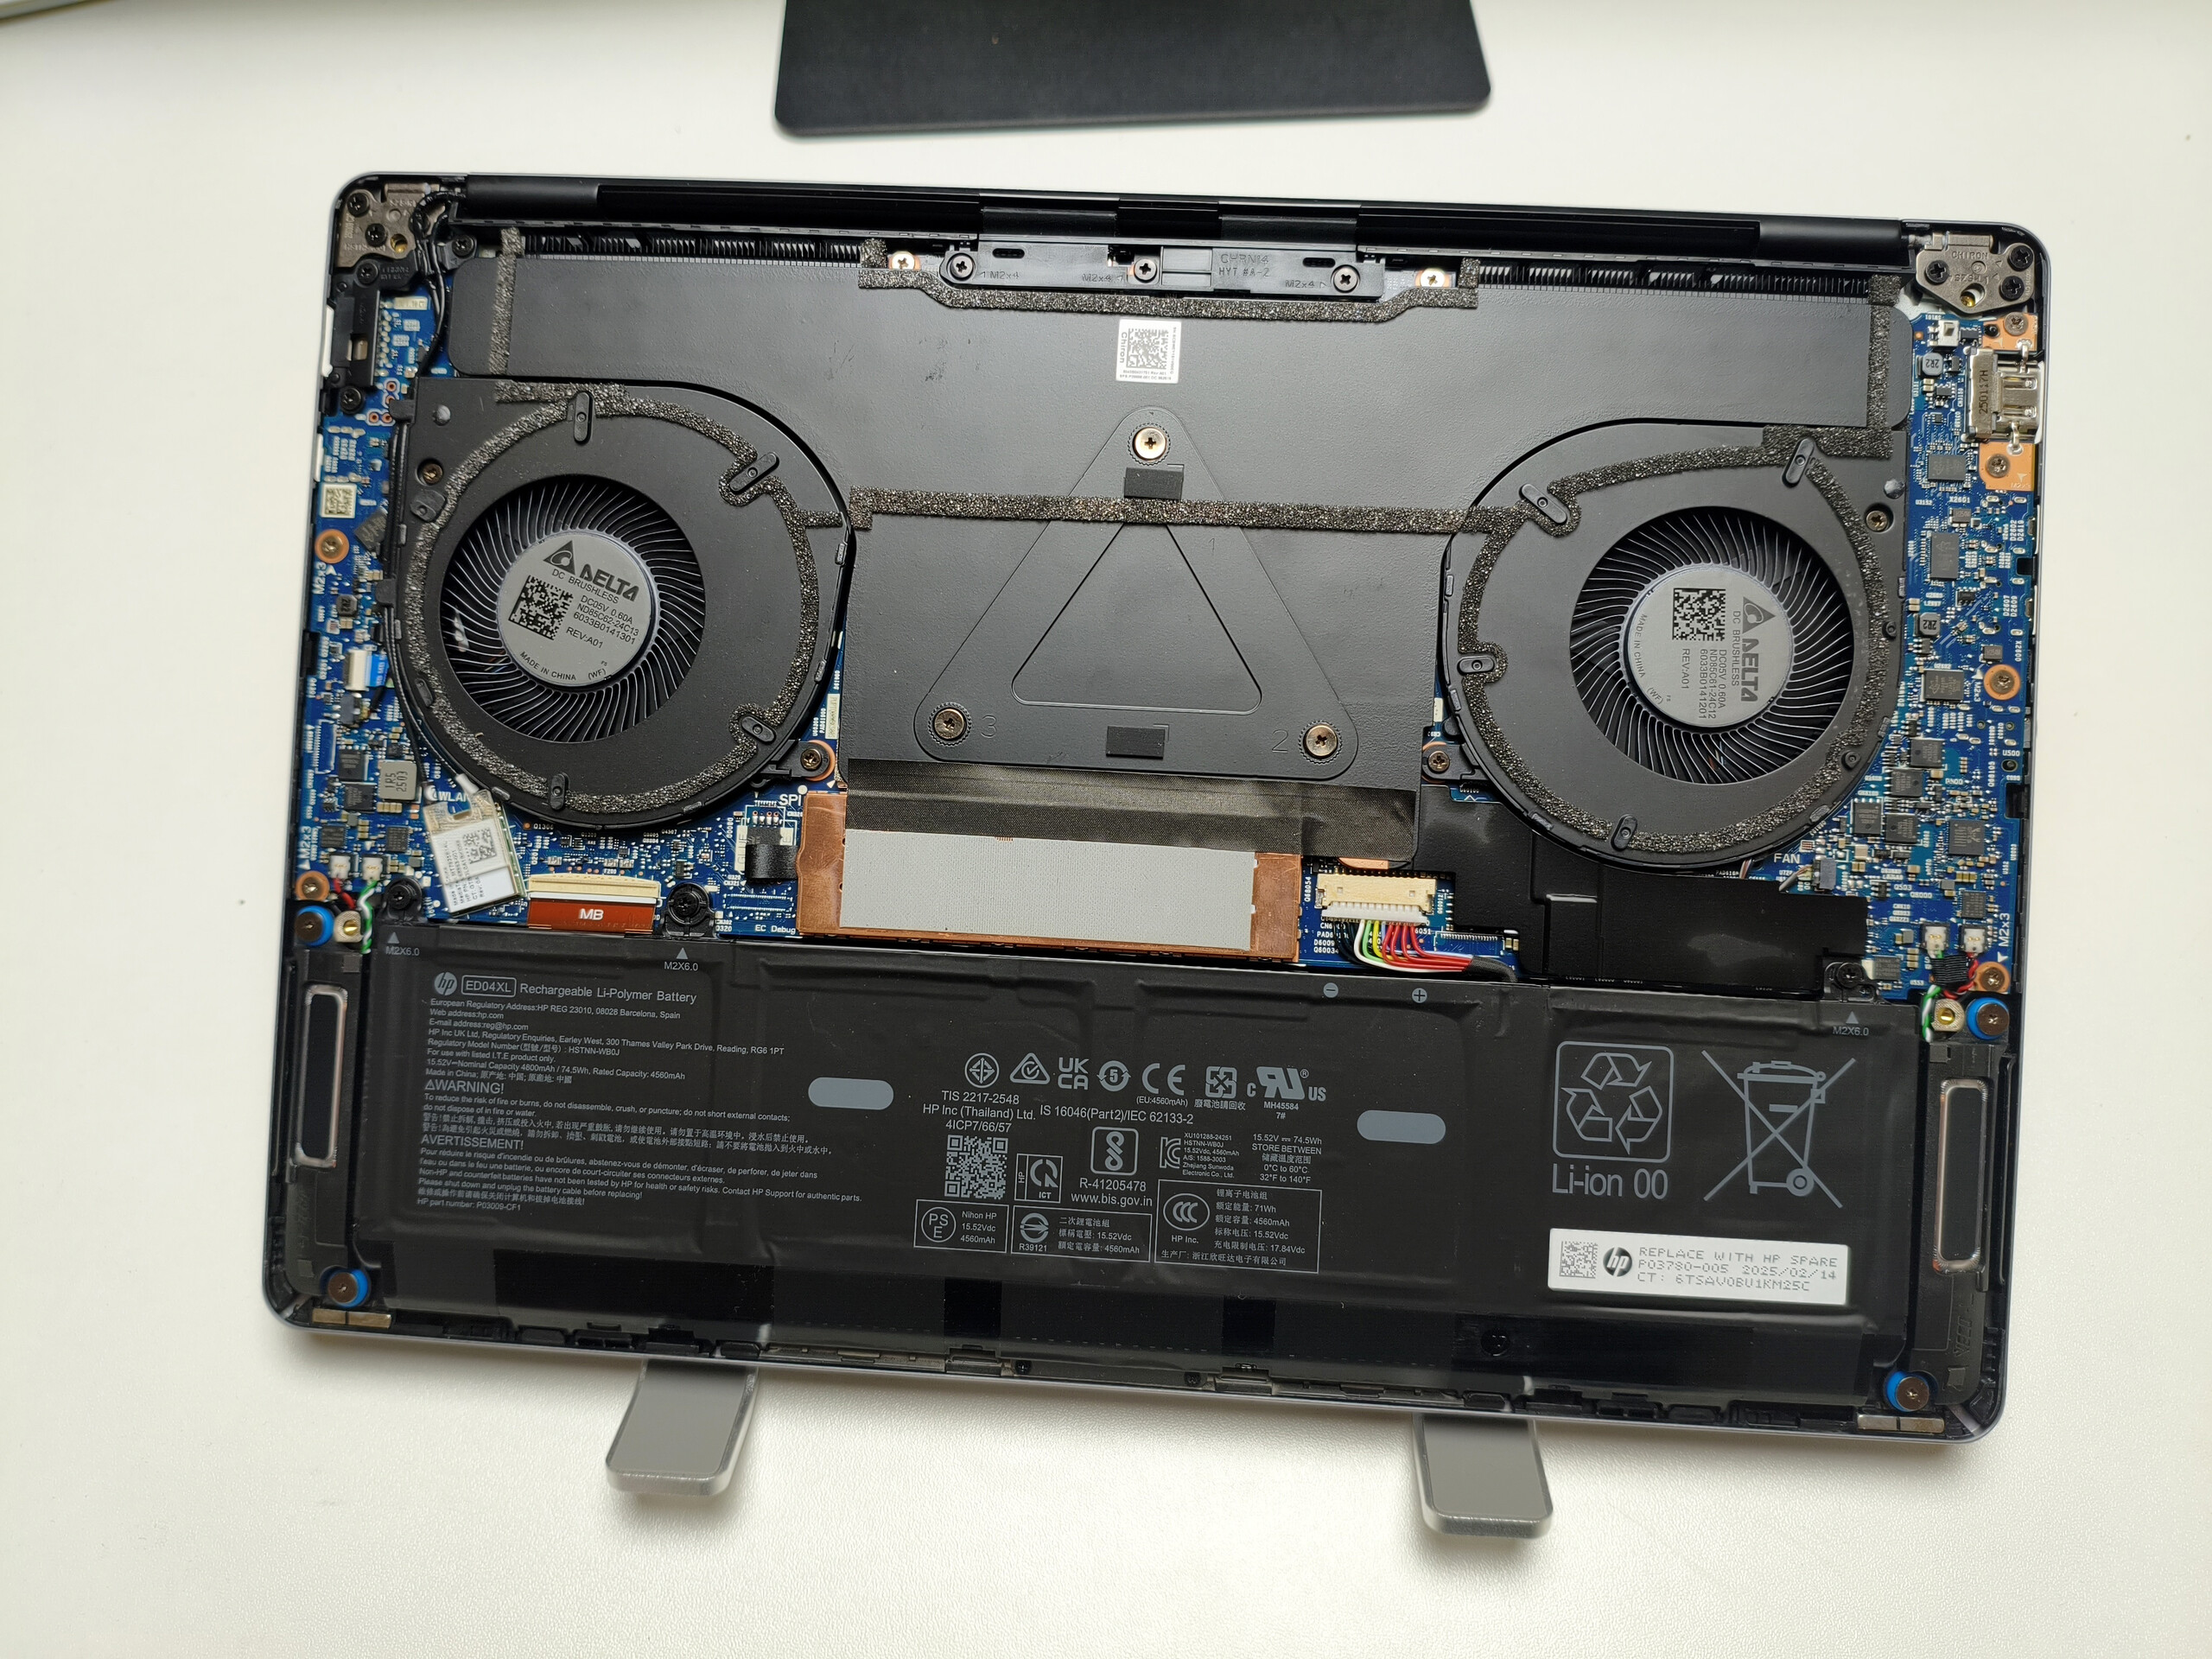
At around 1.6 kg, the ZBook Ultra G1a is now one of the heavier 14-inch laptops, but buyers do get a very rigid metal chassis that feels suitably premium in return. We would describe the design as stylish yet understated. The firm hinges also leave no room for criticism.
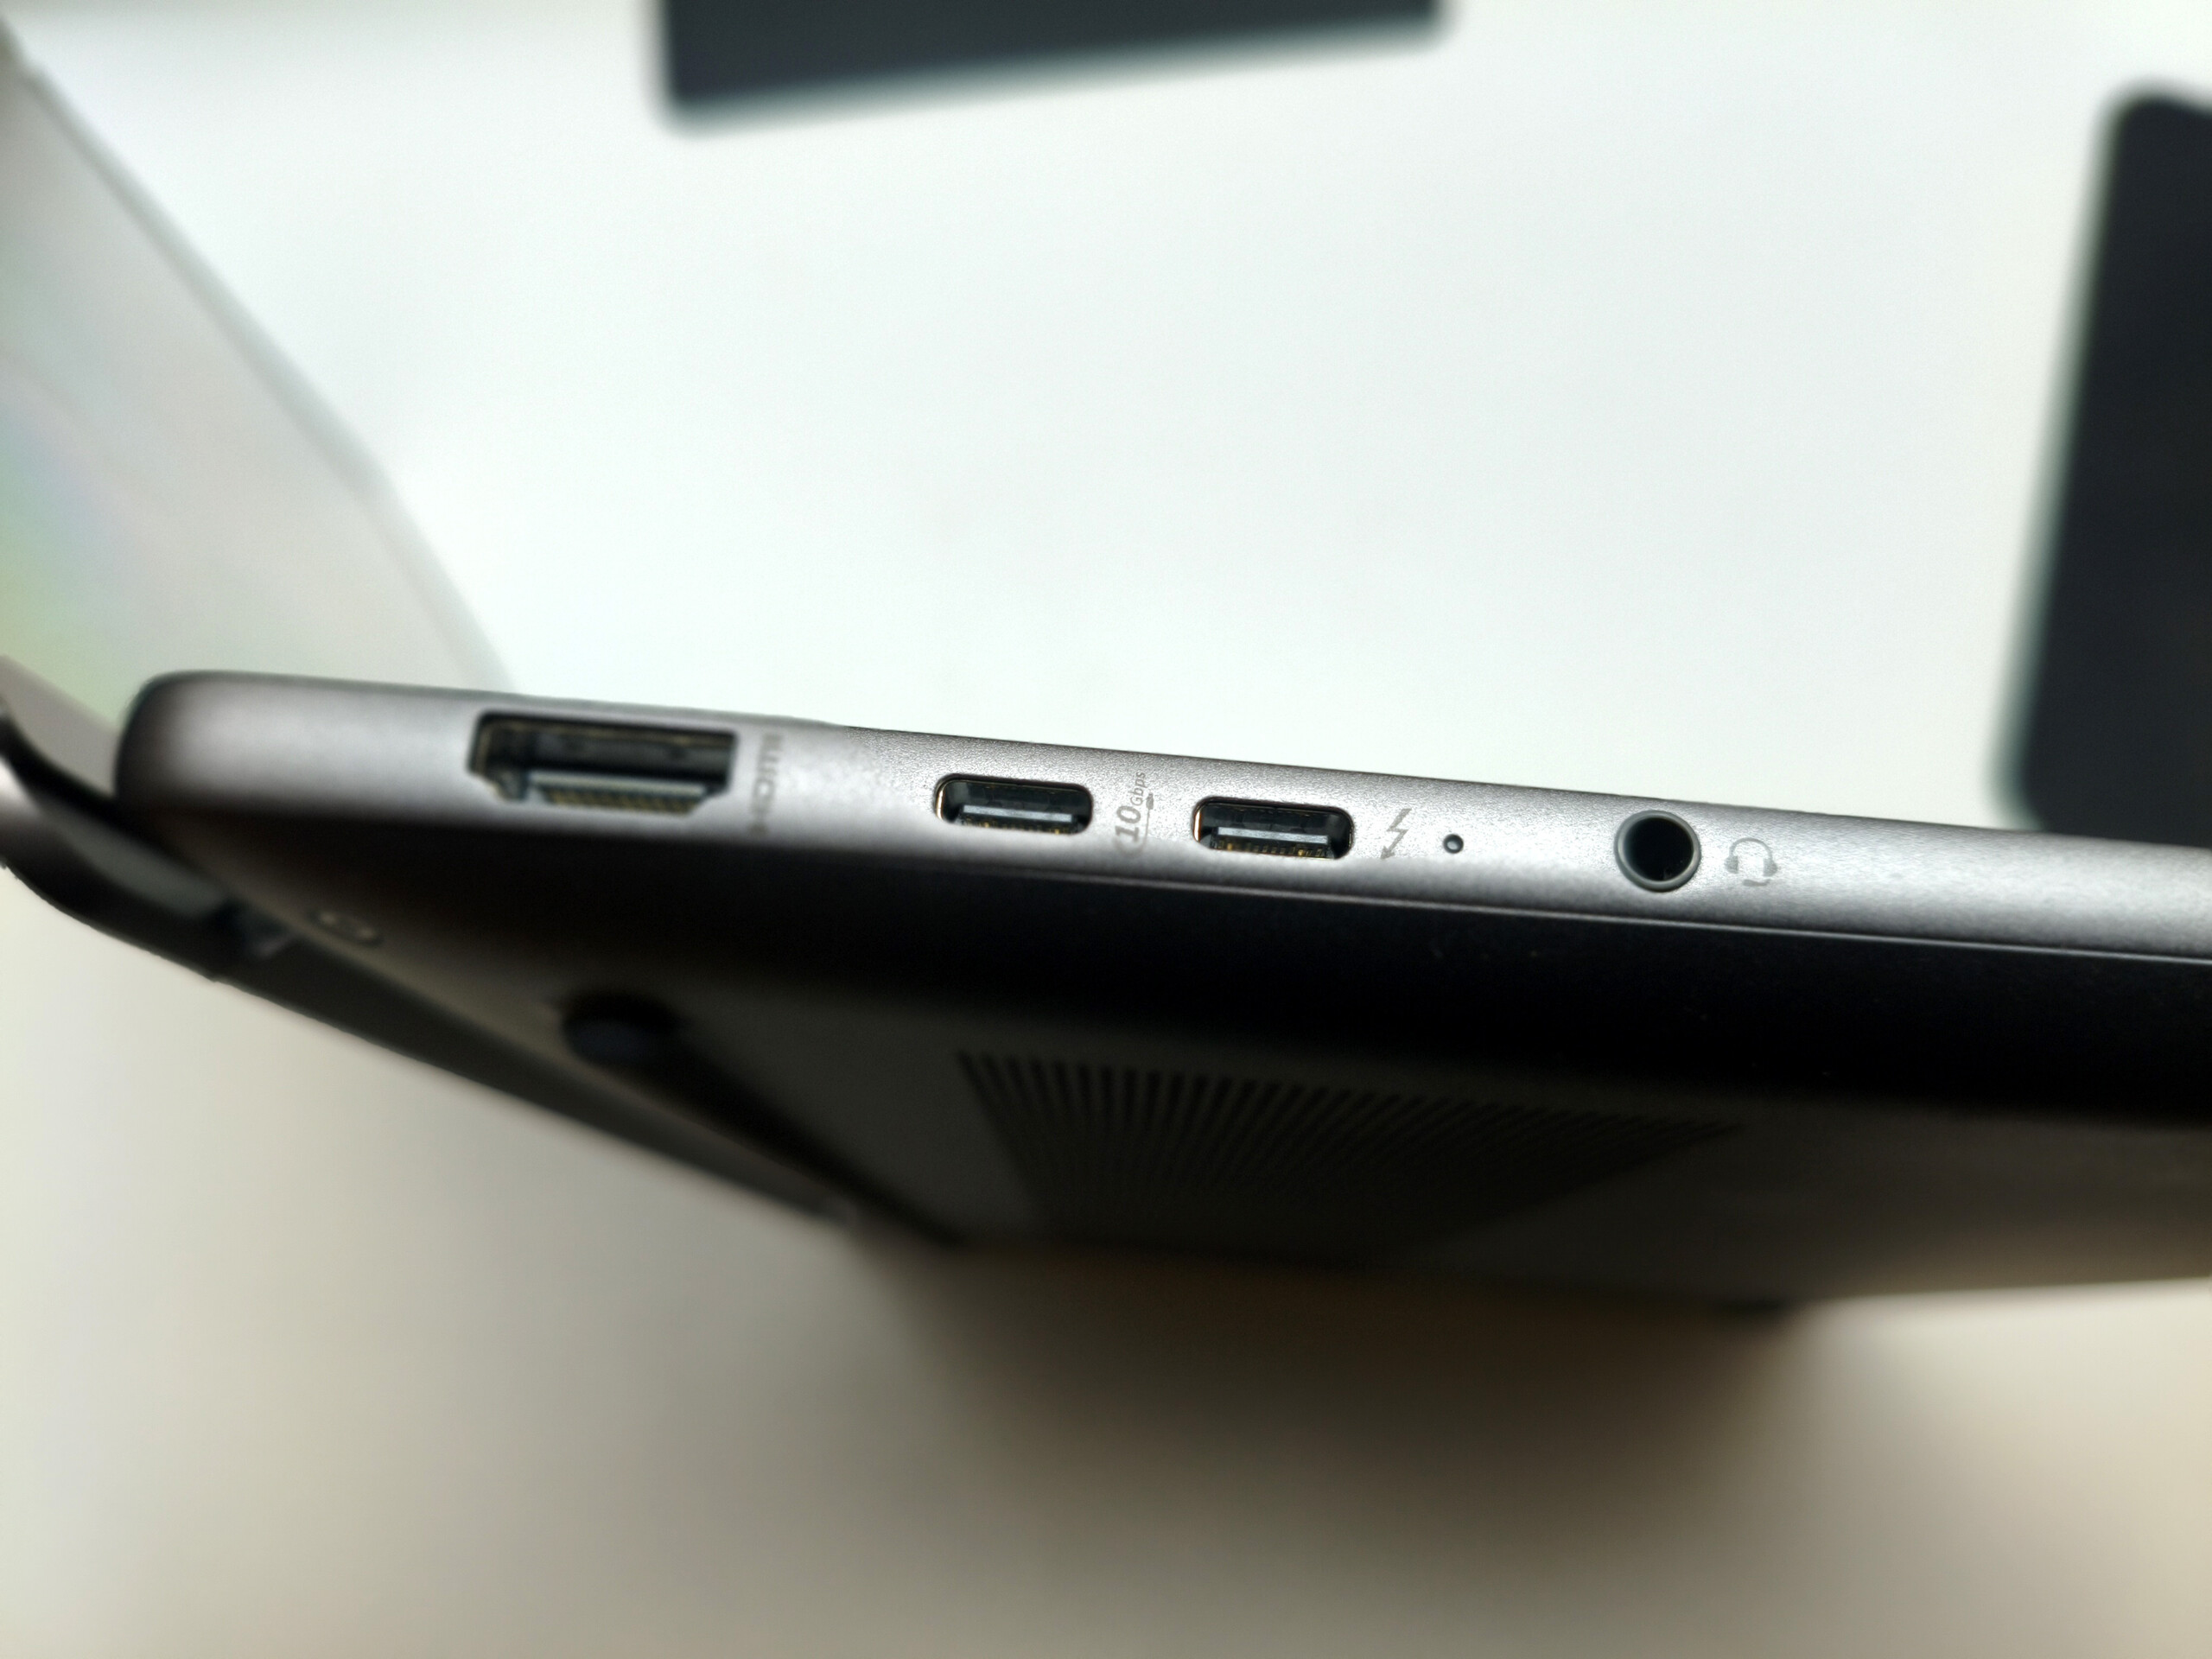
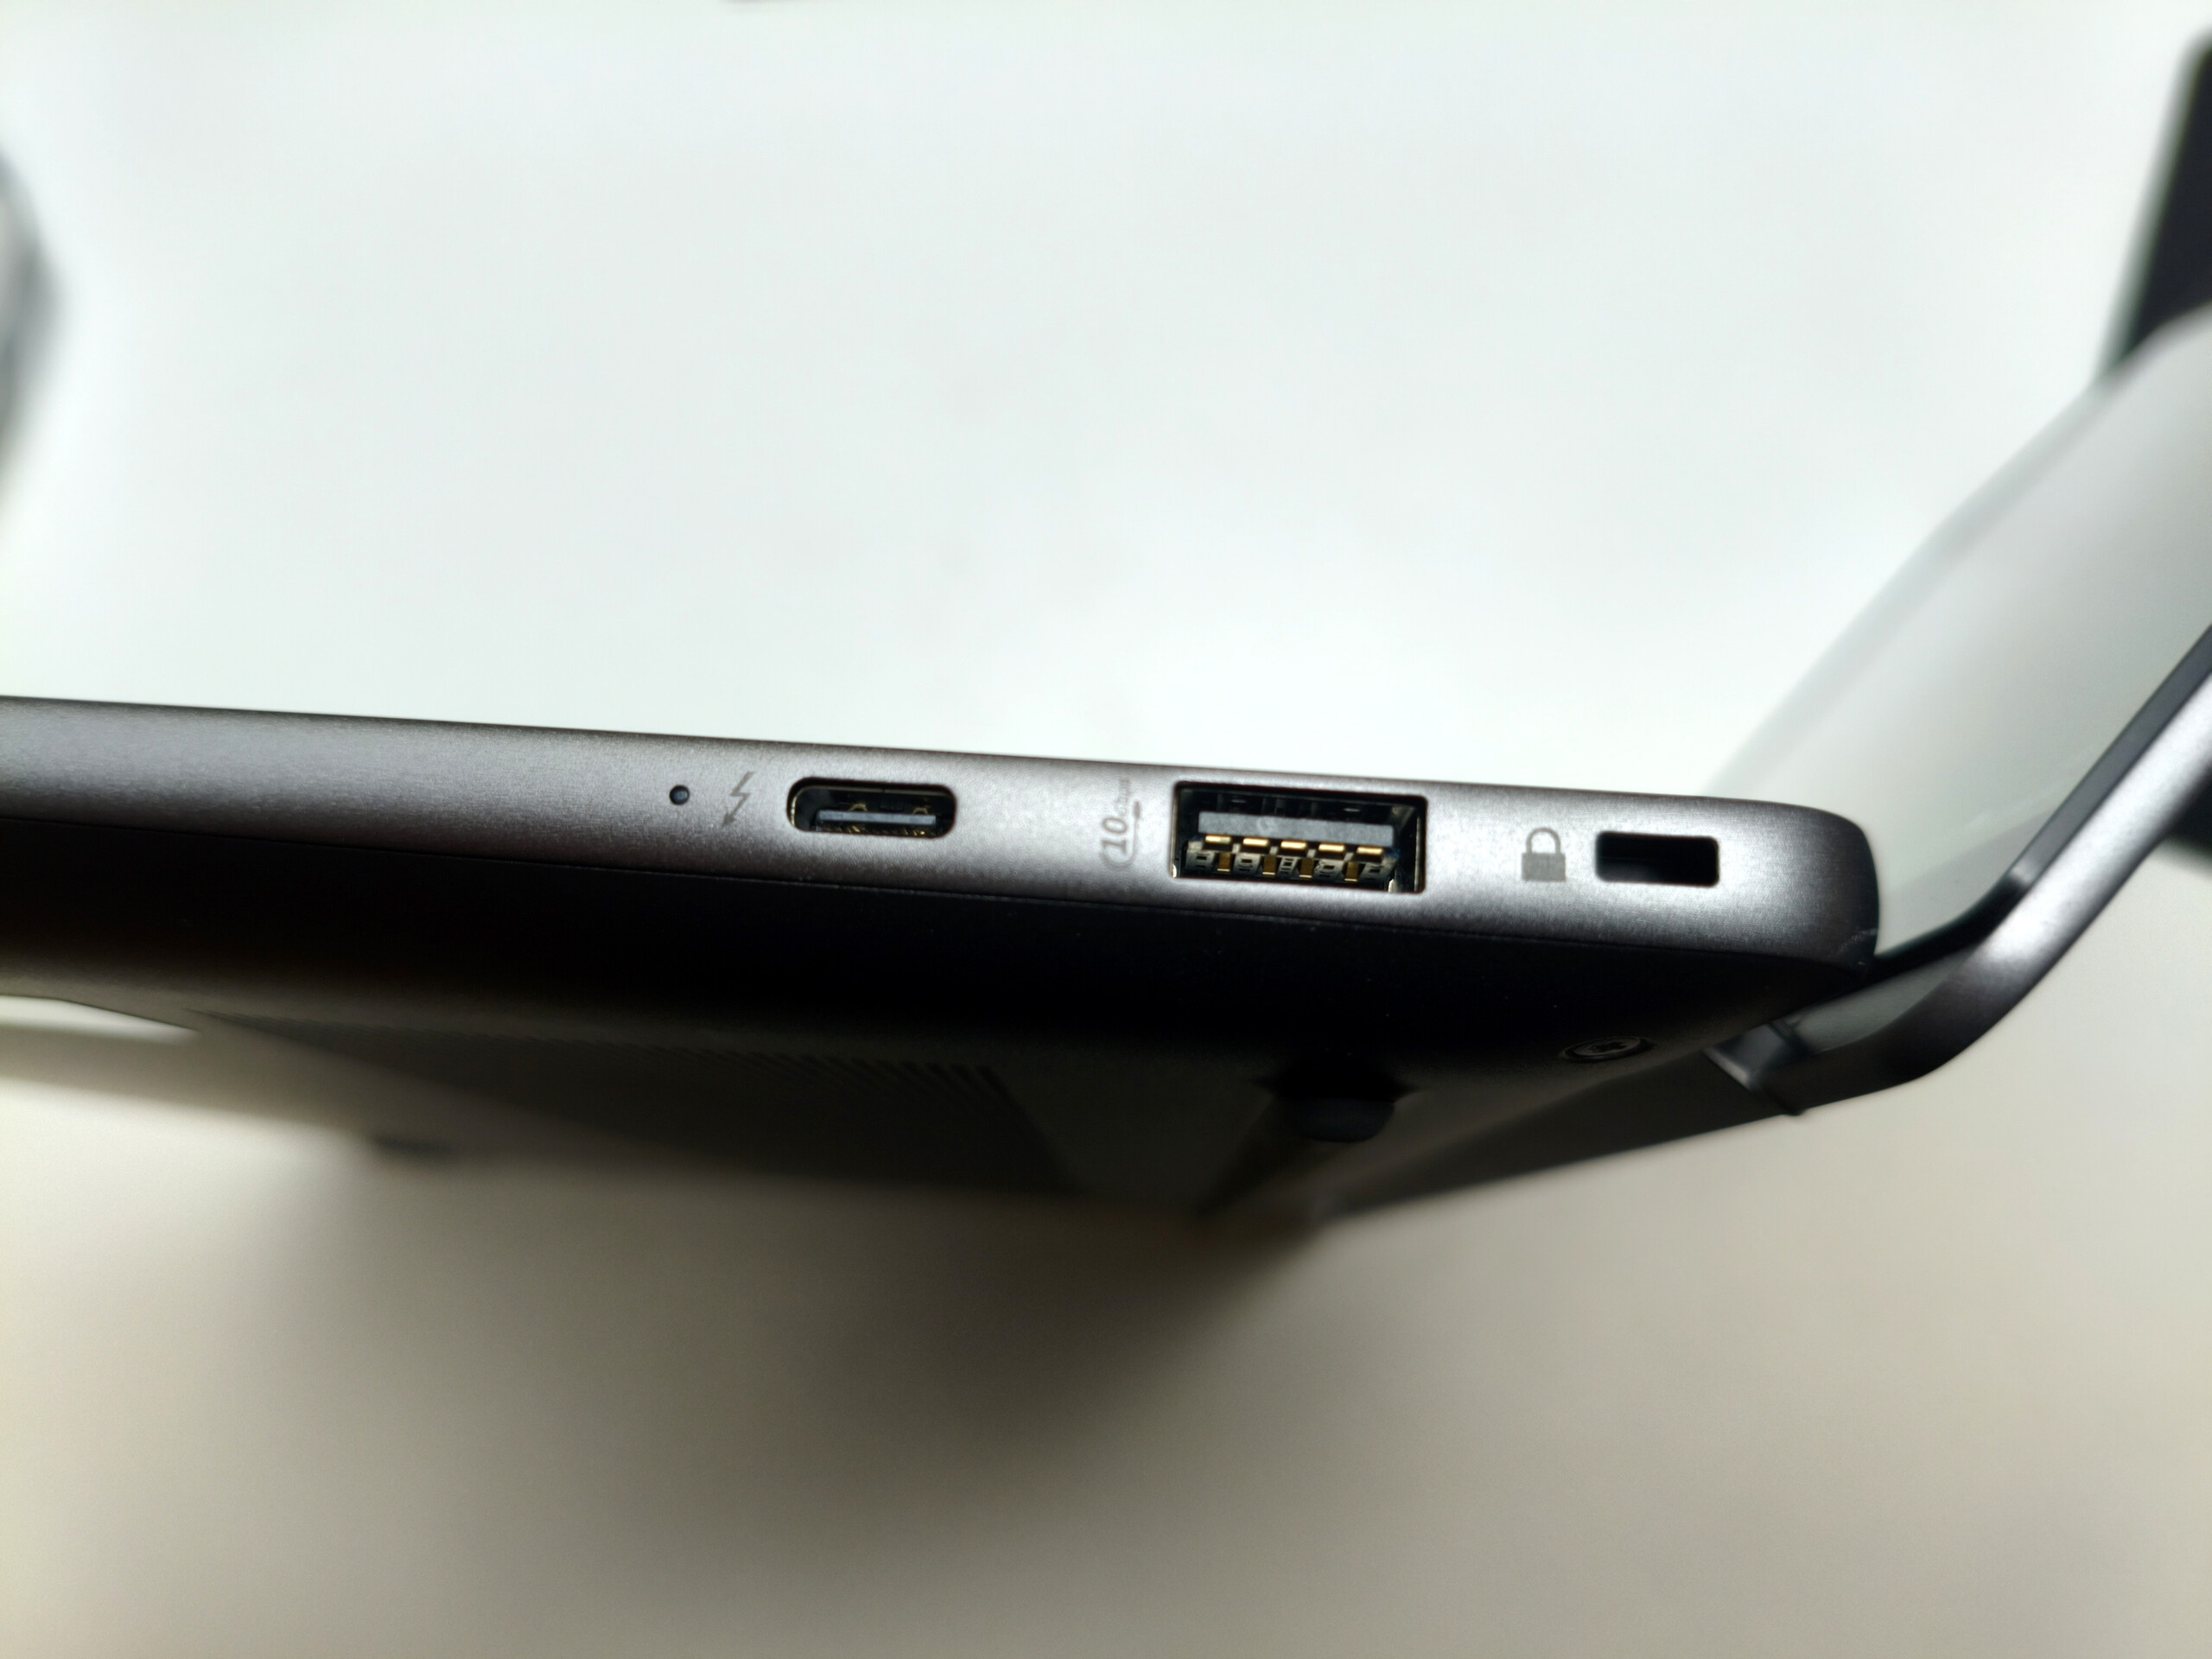
In terms of connectivity, the device offers an audio jack, an HDMI output and a Kensington lock, as well as four USB ports in total, three of which are USB-C ports that each support Power Delivery and DisplayPort. Unfortunately, there is no card reader. The Wi-Fi 7 module, however, delivers strong performance. The 5 MP webcam is similarly impressive and produces a pleasingly sharp image.
The input devices are also very good. The white-backlit keyboard provides decent feedback, while the pleasant touchpad measures 12.5 x 8 cm and is more than large enough.

| Networking - iperf3 receive Wi-Fi6/7 RT-BE96U | |
| Average of class Workstation (2150 - 3092, n=3, last 2 years) | |
| HP ZBook Ultra G1a 14 B30FBES | |
| Average Mediatek Wi-Fi 7 MT7925 Wireless LAN Card (1736 - 2300, n=10) | |
| Aorus Master 16 AM6J | |

Display
The test configuration features the same OLED panel as the top-end model, so most of the results are very similar. Aside from the highly reflective surface and the presence of display flickering, which could affect sensitive users, OLED offers almost nothing but advantages here.
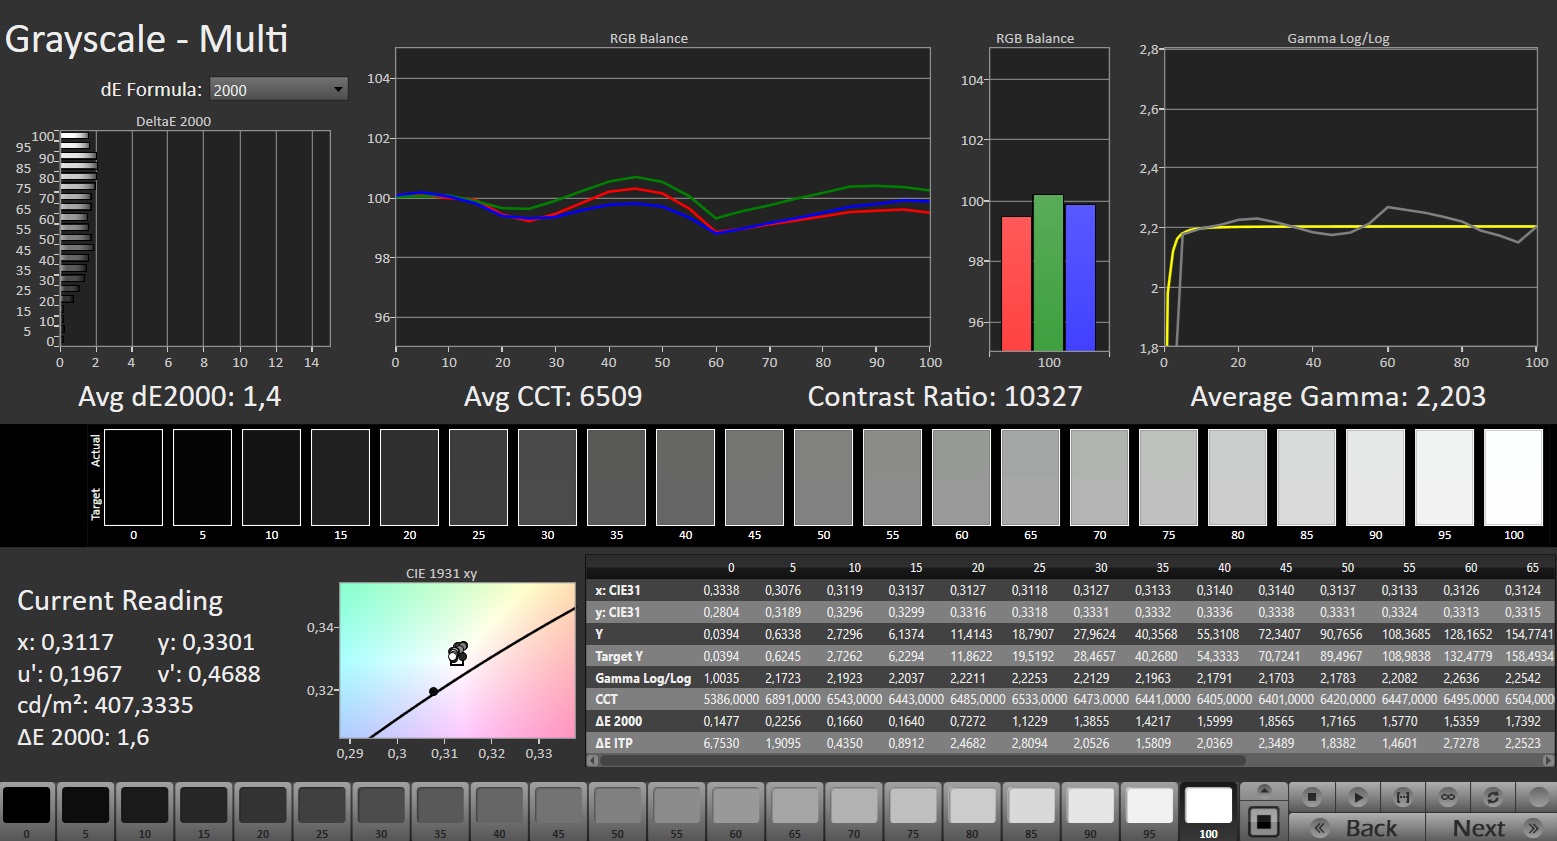
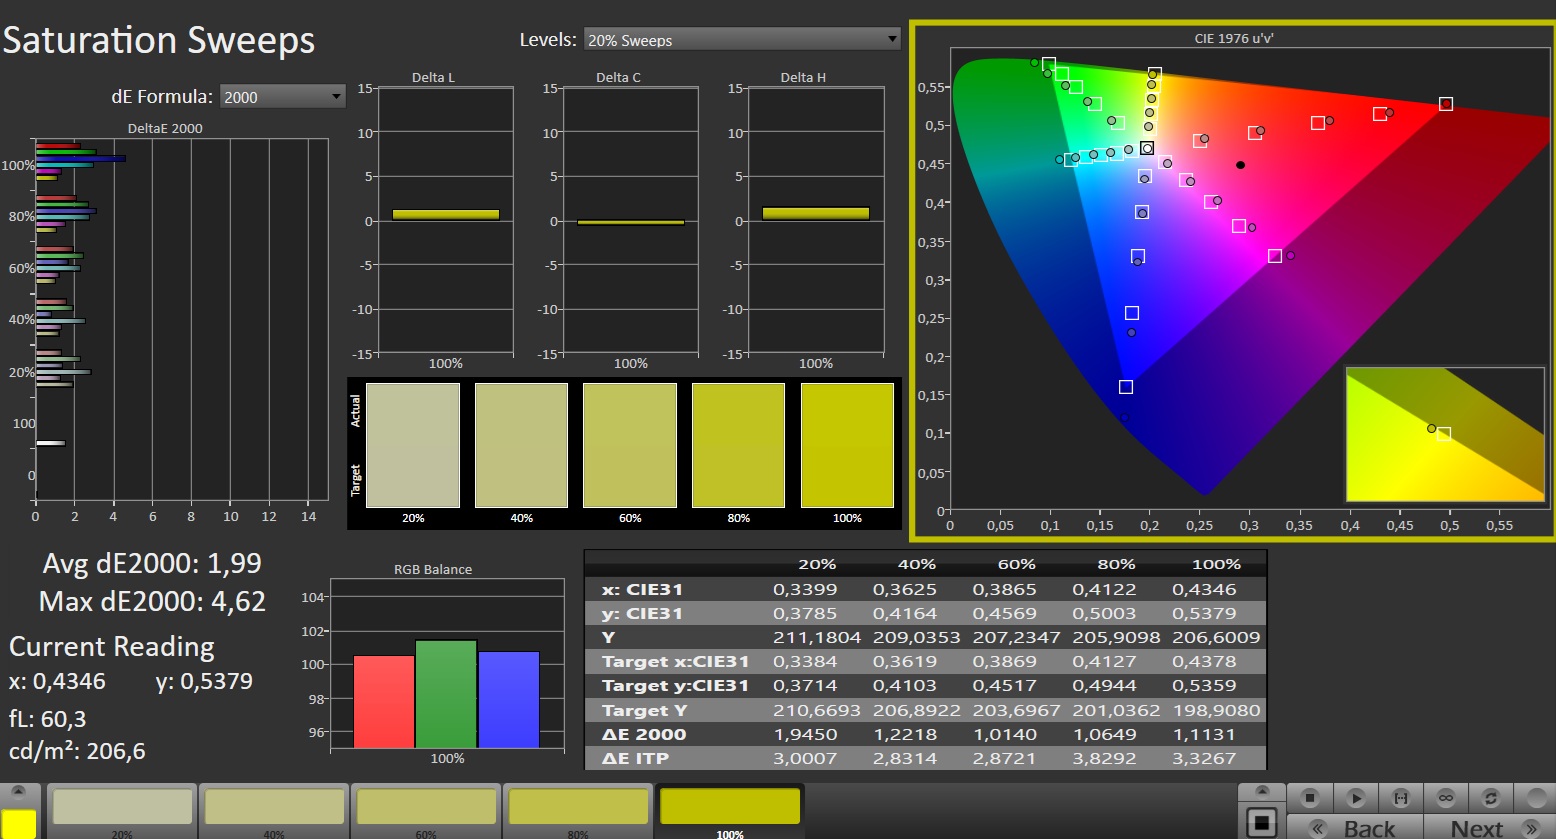
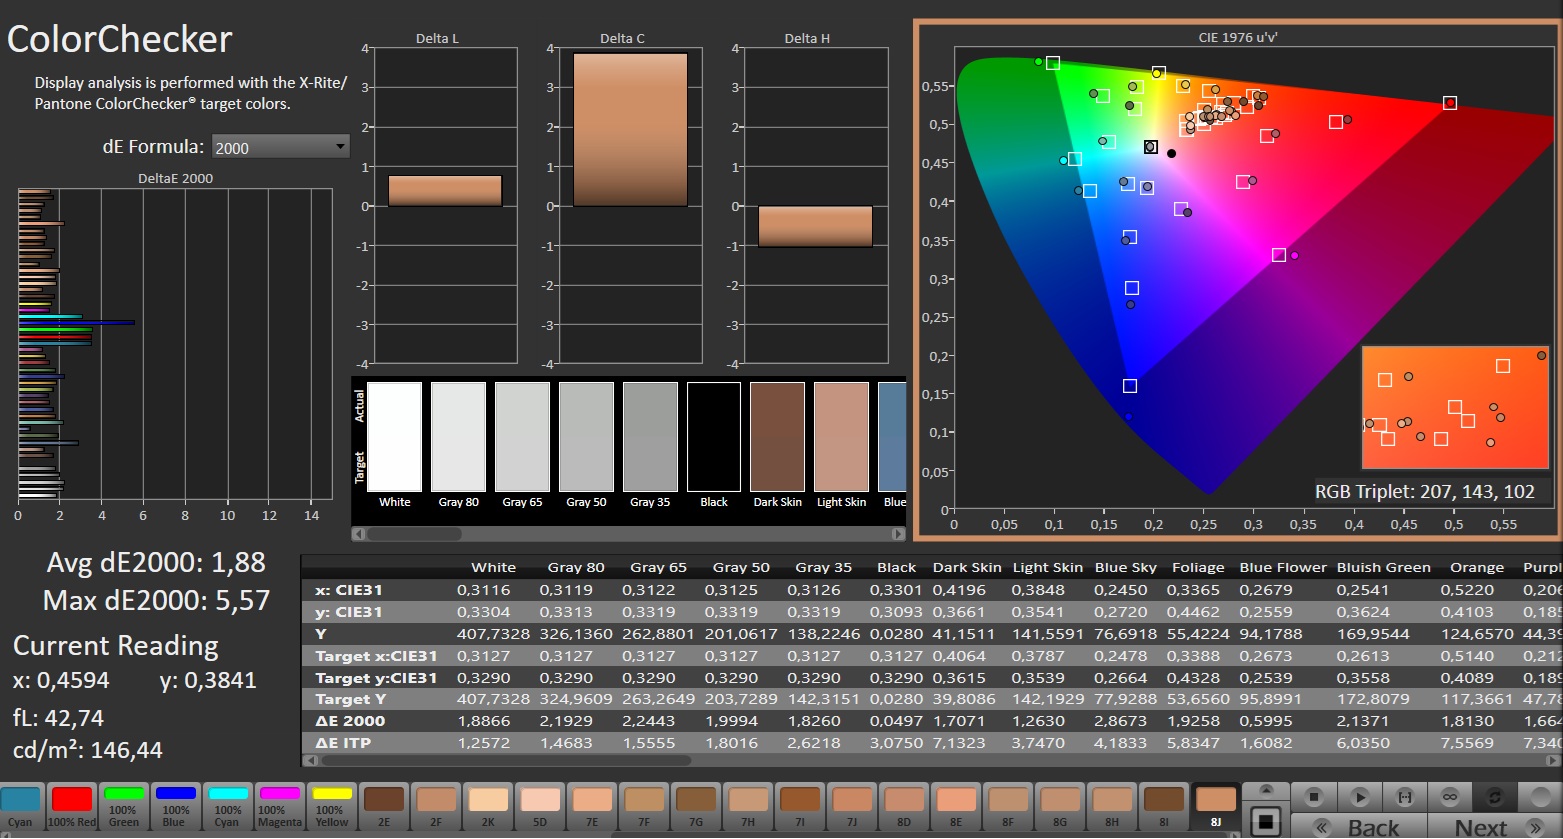
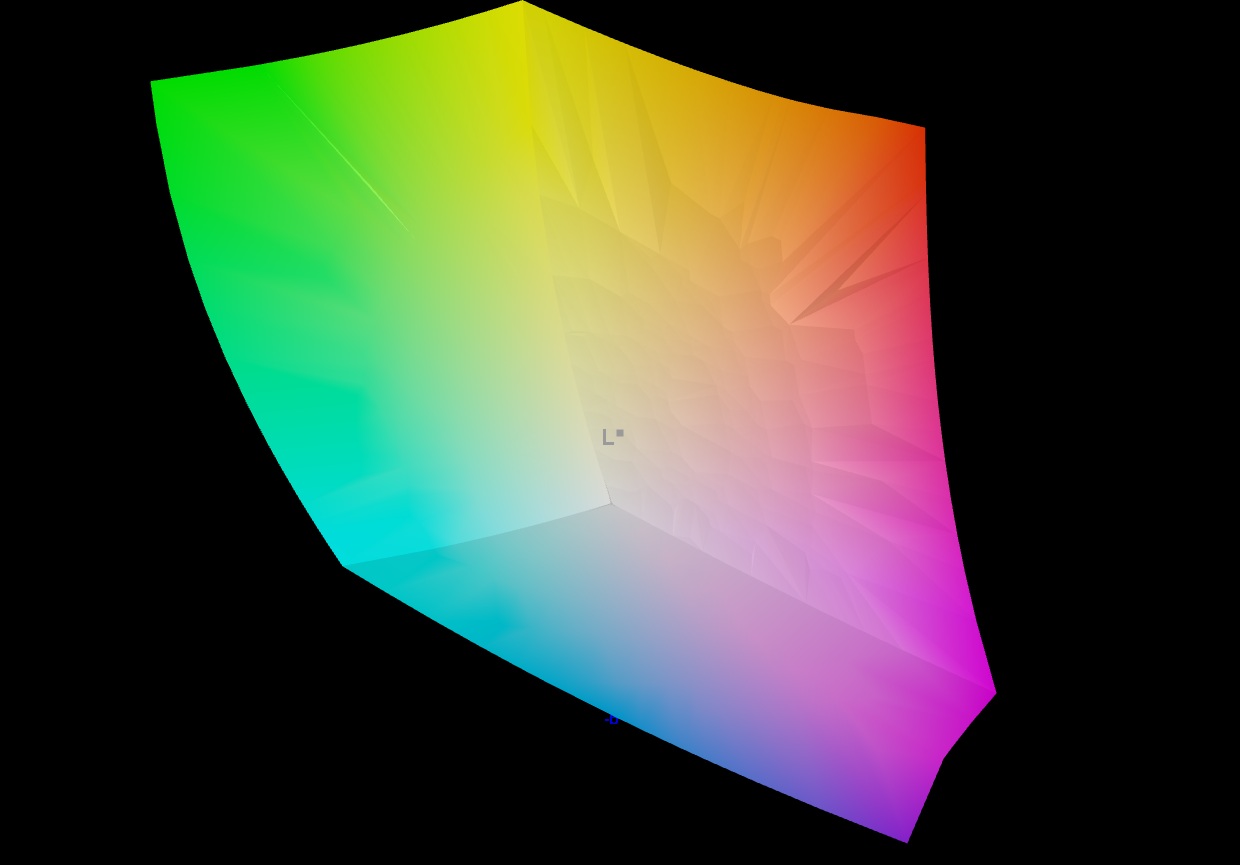
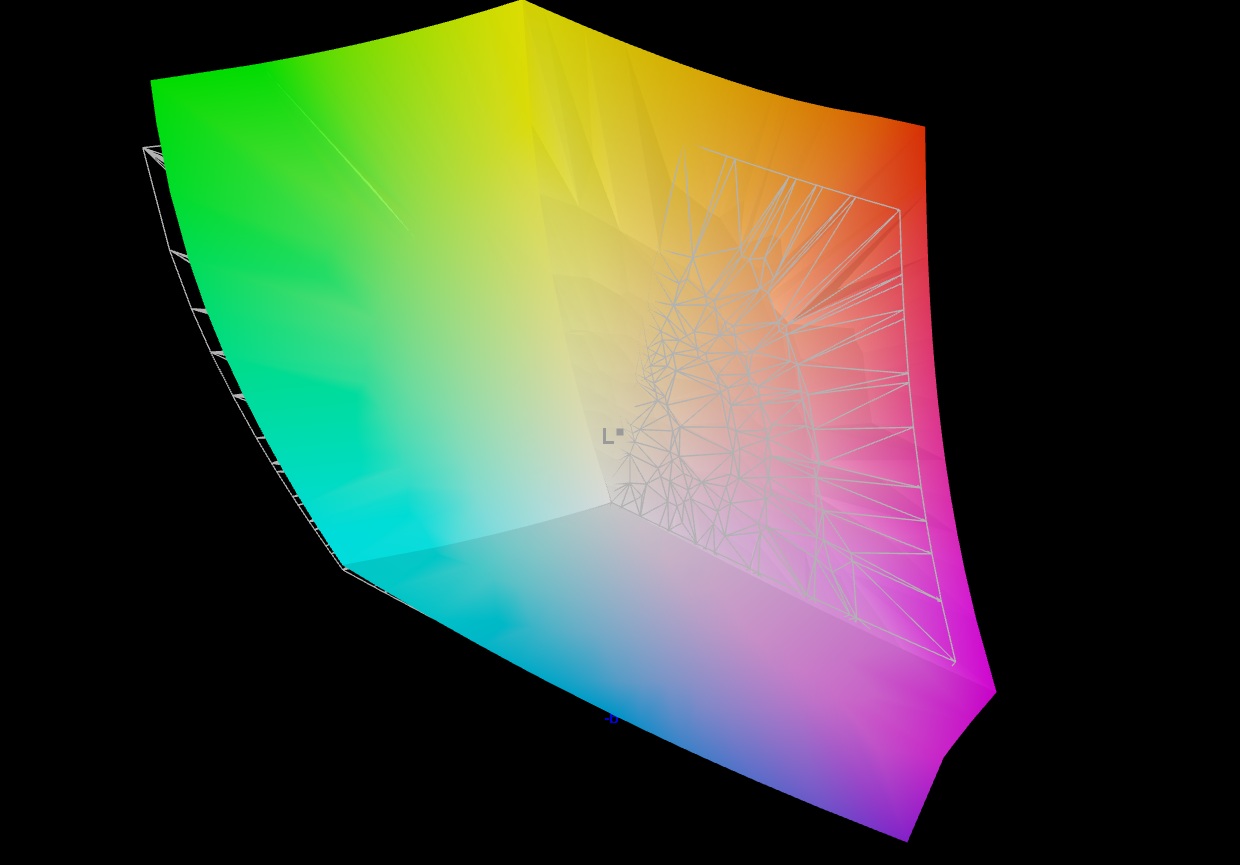
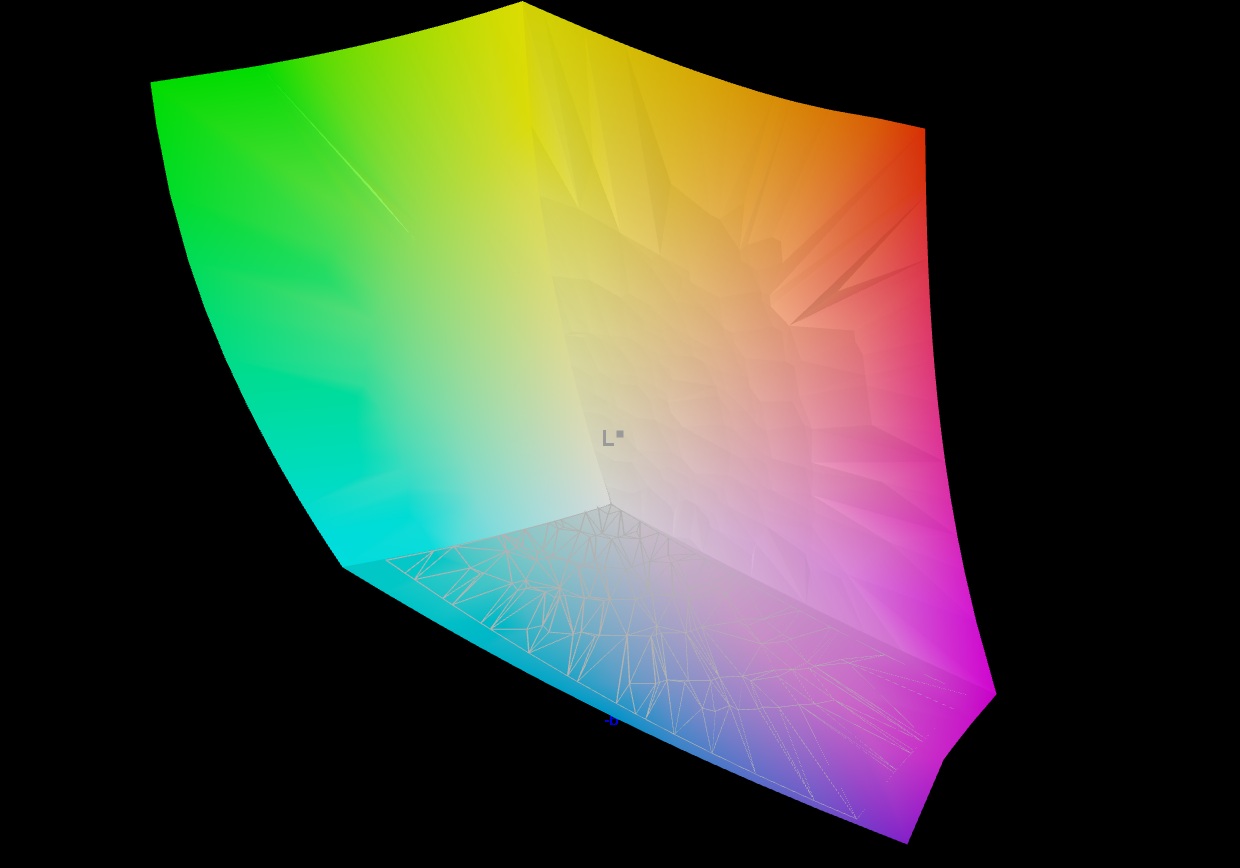
In addition to the excellent black level and contrast ratio, as well as the fast response times, the panel also boasts a very wide color gamut, with even AdobeRGB covered almost completely. Brightness averages just under 400 cd/m², which is neither poor nor particularly impressive. On the plus side, color accuracy is already excellent without calibration.
| |||||||||||||||||||||||||
Brightness Distribution: 98 %
Center on Battery: 397 cd/m²
Contrast: ∞:1 (Black: 0 cd/m²)
ΔE ColorChecker Calman: 1.88 | ∀{0.5-29.43 Ø4.69}
ΔE Greyscale Calman: 1.4 | ∀{0.09-98 Ø4.94}
97.1% AdobeRGB 1998 (Argyll 3D)
100% sRGB (Argyll 3D)
99.8% Display P3 (Argyll 3D)
Gamma: 2.203
CCT: 6509 K
| HP ZBook Ultra G1a 14 B30FBES SDC41B3, OLED, 2880x1800, 14", 120 Hz | HP ZBook Ultra G1a A3ZQ0ET LGD07A1, IPS LED, 1920x1200, 14", 60 Hz | HP ZBook Ultra G1a 14 Samsung SDC41B3, OLED, 2880x1800, 14", 120 Hz | HP EliteBook X G1a 14 AI LG Philips LGD07A1, IPS, 1920x1200, 14", 60 Hz | HP EliteBook X G1i 14 AI IPS, 1920x1200, 14", 60 Hz | HP OmniBook Ultra 14 Core Ultra X9 Samsung SDC4215, OLED, 2880x1800, 14", 120 Hz | |
|---|---|---|---|---|---|---|
| Display | -23% | -1% | -26% | -19% | -2% | |
| Display P3 Coverage (%) | 99.8 | 65.8 -34% | 99.7 0% | 62.6 -37% | 69.9 -30% | 99.9 0% |
| sRGB Coverage (%) | 100 | 97.4 -3% | 100 0% | 93.2 -7% | 98.4 -2% | 100 0% |
| AdobeRGB 1998 Coverage (%) | 97.1 | 67.1 -31% | 95.6 -2% | 64 -34% | 71.6 -26% | 92.3 -5% |
| Response Times | -5673% | -44% | -6338% | -5134% | 1% | |
| Response Time Grey 50% / Grey 80% * (ms) | 0.66 ? | 52 ? -7779% | 0.94 ? -42% | 55.8 ? -8355% | 42.3 ? -6309% | 0.58 ? 12% |
| Response Time Black / White * (ms) | 0.69 ? | 25.3 ? -3567% | 1.01 ? -46% | 30.5 ? -4320% | 28 ? -3958% | 0.87 ? -26% |
| PWM Frequency (Hz) | 476 | 492.6 | 927.13 ? | |||
| PWM Amplitude * (%) | 30 | 43 -43% | 25 17% | |||
| Screen | -60% | -12% | -124% | -28% | 2% | |
| Brightness middle (cd/m²) | 397 | 406 2% | 384.7 -3% | 442.8 12% | 487.5 23% | 446 12% |
| Brightness (cd/m²) | 396 | 379 -4% | 387 -2% | 412 4% | 469 18% | 447 13% |
| Brightness Distribution (%) | 98 | 89 -9% | 99 1% | 87 -11% | 91 -7% | 99 1% |
| Black Level * (cd/m²) | 0.28 | 0.22 | 0.26 | |||
| Colorchecker dE 2000 * | 1.88 | 3.3 -76% | 3.36 -79% | 5.92 -215% | 2.37 -26% | 1.76 6% |
| Colorchecker dE 2000 max. * | 5.57 | 6.4 -15% | 6.45 -16% | 10.46 -88% | 5.77 -4% | 3.29 41% |
| Greyscale dE 2000 * | 1.4 | 5 -257% | 1 29% | 7.6 -443% | 3.8 -171% | 2.3 -64% |
| Gamma | 2.203 100% | 2.33 94% | 2.26 97% | 2.22 99% | 2.14 103% | 2.25 98% |
| CCT | 6509 100% | 6163 105% | 6380 102% | 6728 97% | 6540 99% | 6470 100% |
| Contrast (:1) | 1450 | 2013 | 1875 | |||
| Colorchecker dE 2000 calibrated * | 1.1 | 0.65 | 1.31 | 0.86 | 1.18 | |
| Total Average (Program / Settings) | -1919% /
-1070% | -19% /
-17% | -2163% /
-1227% | -1727% /
-954% | 0% /
1% |
* ... smaller is better
Display Response Times
| ↔ Response Time Black to White | ||
|---|---|---|
| 0.69 ms ... rise ↗ and fall ↘ combined | ↗ 0.37 ms rise | 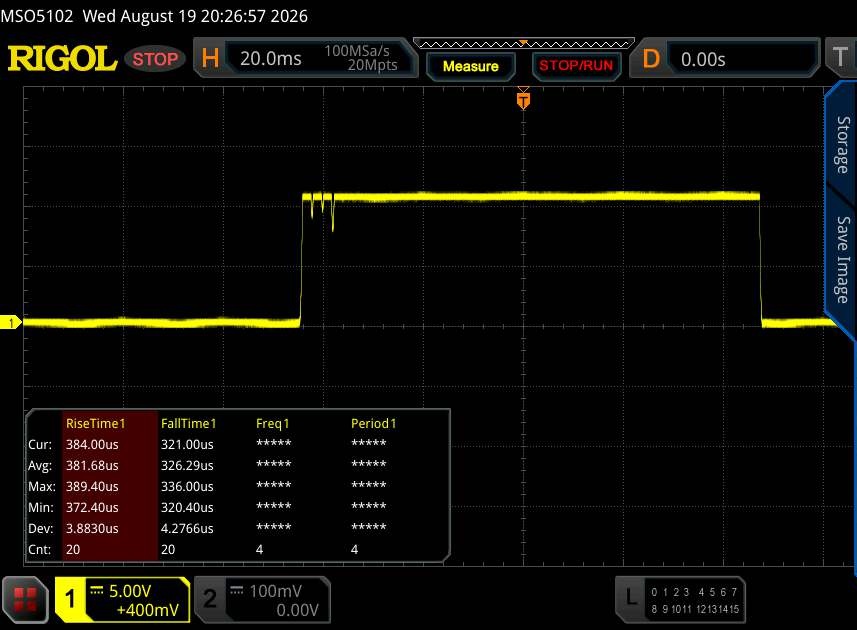 |
| ↘ 0.32 ms fall | ||
| The screen shows very fast response rates in our tests and should be very well suited for fast-paced gaming. In comparison, all tested devices range from 0.1 (minimum) to 240 (maximum) ms. » 2 % of all devices are better. This means that the measured response time is better than the average of all tested devices (19.6 ms). | ||
| ↔ Response Time 50% Grey to 80% Grey | ||
| 0.66 ms ... rise ↗ and fall ↘ combined | ↗ 0.33 ms rise | 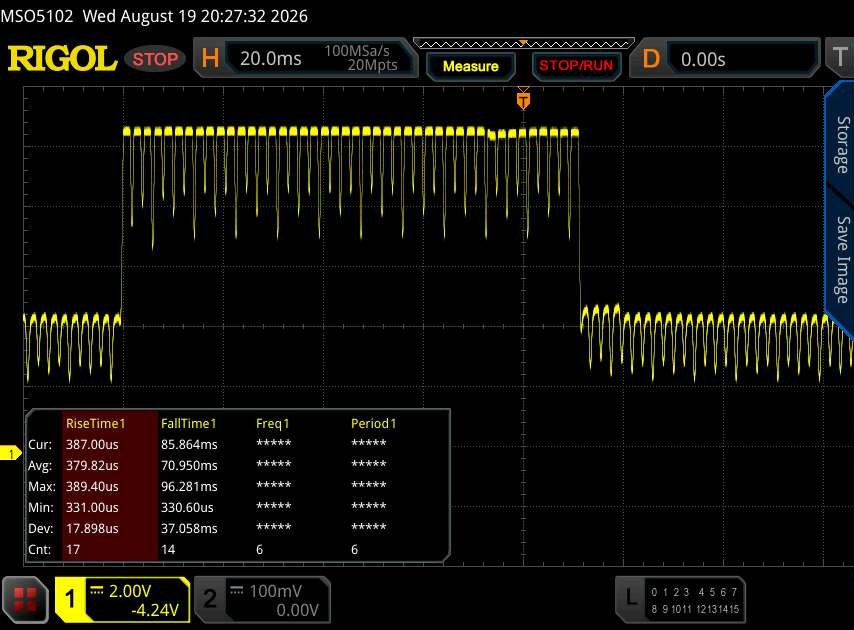 |
| ↘ 0.33 ms fall | ||
| The screen shows very fast response rates in our tests and should be very well suited for fast-paced gaming. In comparison, all tested devices range from 0.13 (minimum) to 636 (maximum) ms. » 2 % of all devices are better. This means that the measured response time is better than the average of all tested devices (30.7 ms). | ||
Screen Flickering / PWM (Pulse-Width Modulation)
| Screen flickering / PWM detected | 476 Hz Amplitude: 30 % | 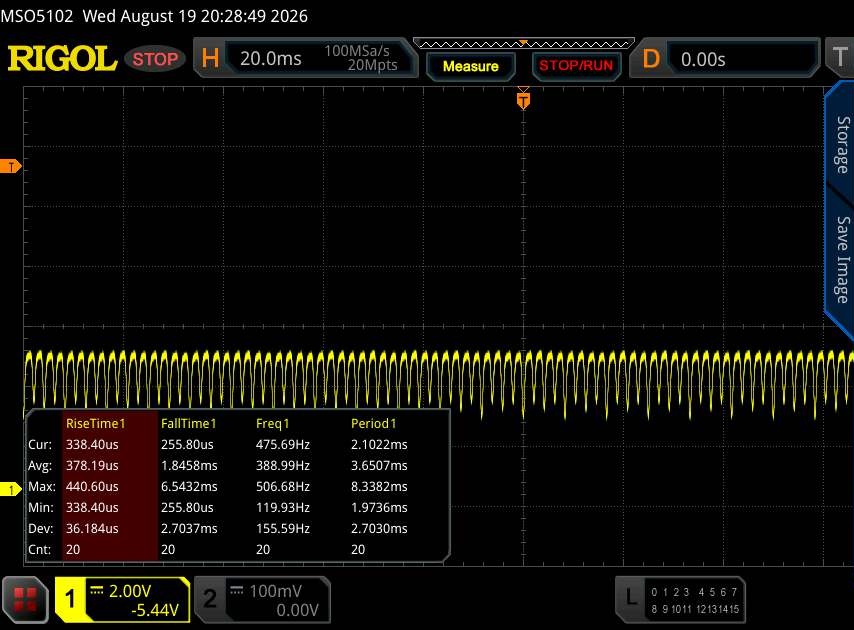 | |
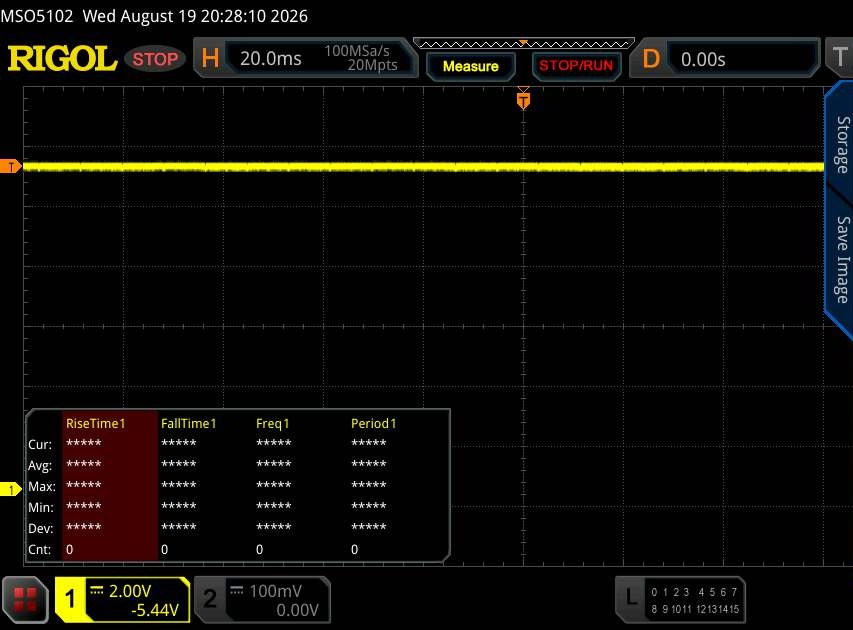
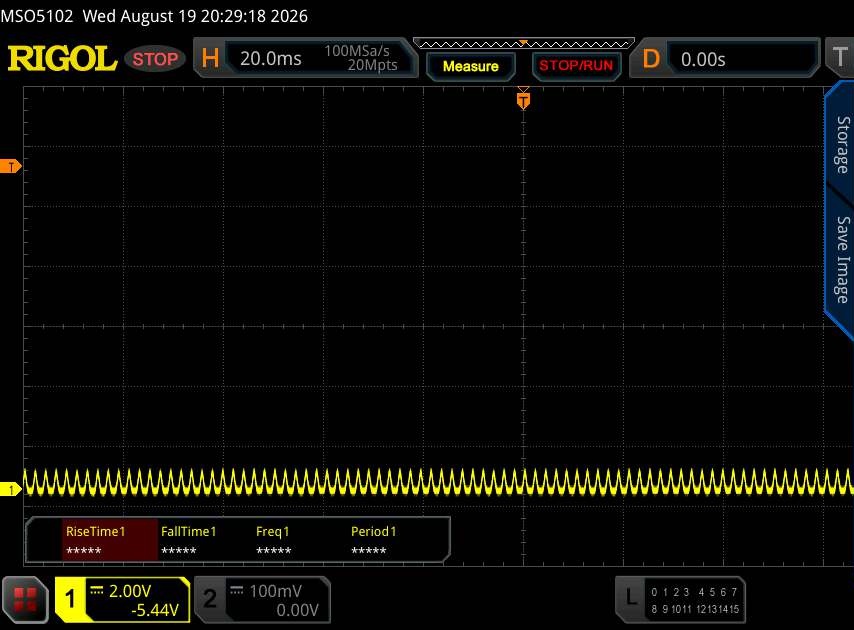
The display backlight flickers at 476 Hz (worst case, e.g., utilizing PWM) . The frequency of 476 Hz is relatively high, so most users sensitive to PWM should not notice any flickering. However, there are reports that some users are still sensitive to PWM at 500 Hz and above, so be aware. In comparison: 52 % of all tested devices do not use PWM to dim the display. If PWM was detected, an average of 7603 (minimum: 5 - maximum: 343500) Hz was measured. | |||
Performance
In terms of performance, we would place the test configuration in the mid-range. HP clearly markets the 14-inch model as a mobile workstation, which also corresponds to the category we use for our evaluation.
Test conditions
The pre-installed myHP software lets users choose between two operating modes. With the exception of the battery test, our measurements were carried out using the “High Performance” profile, which squeezes a little more performance out of the system, as shown in the table below.
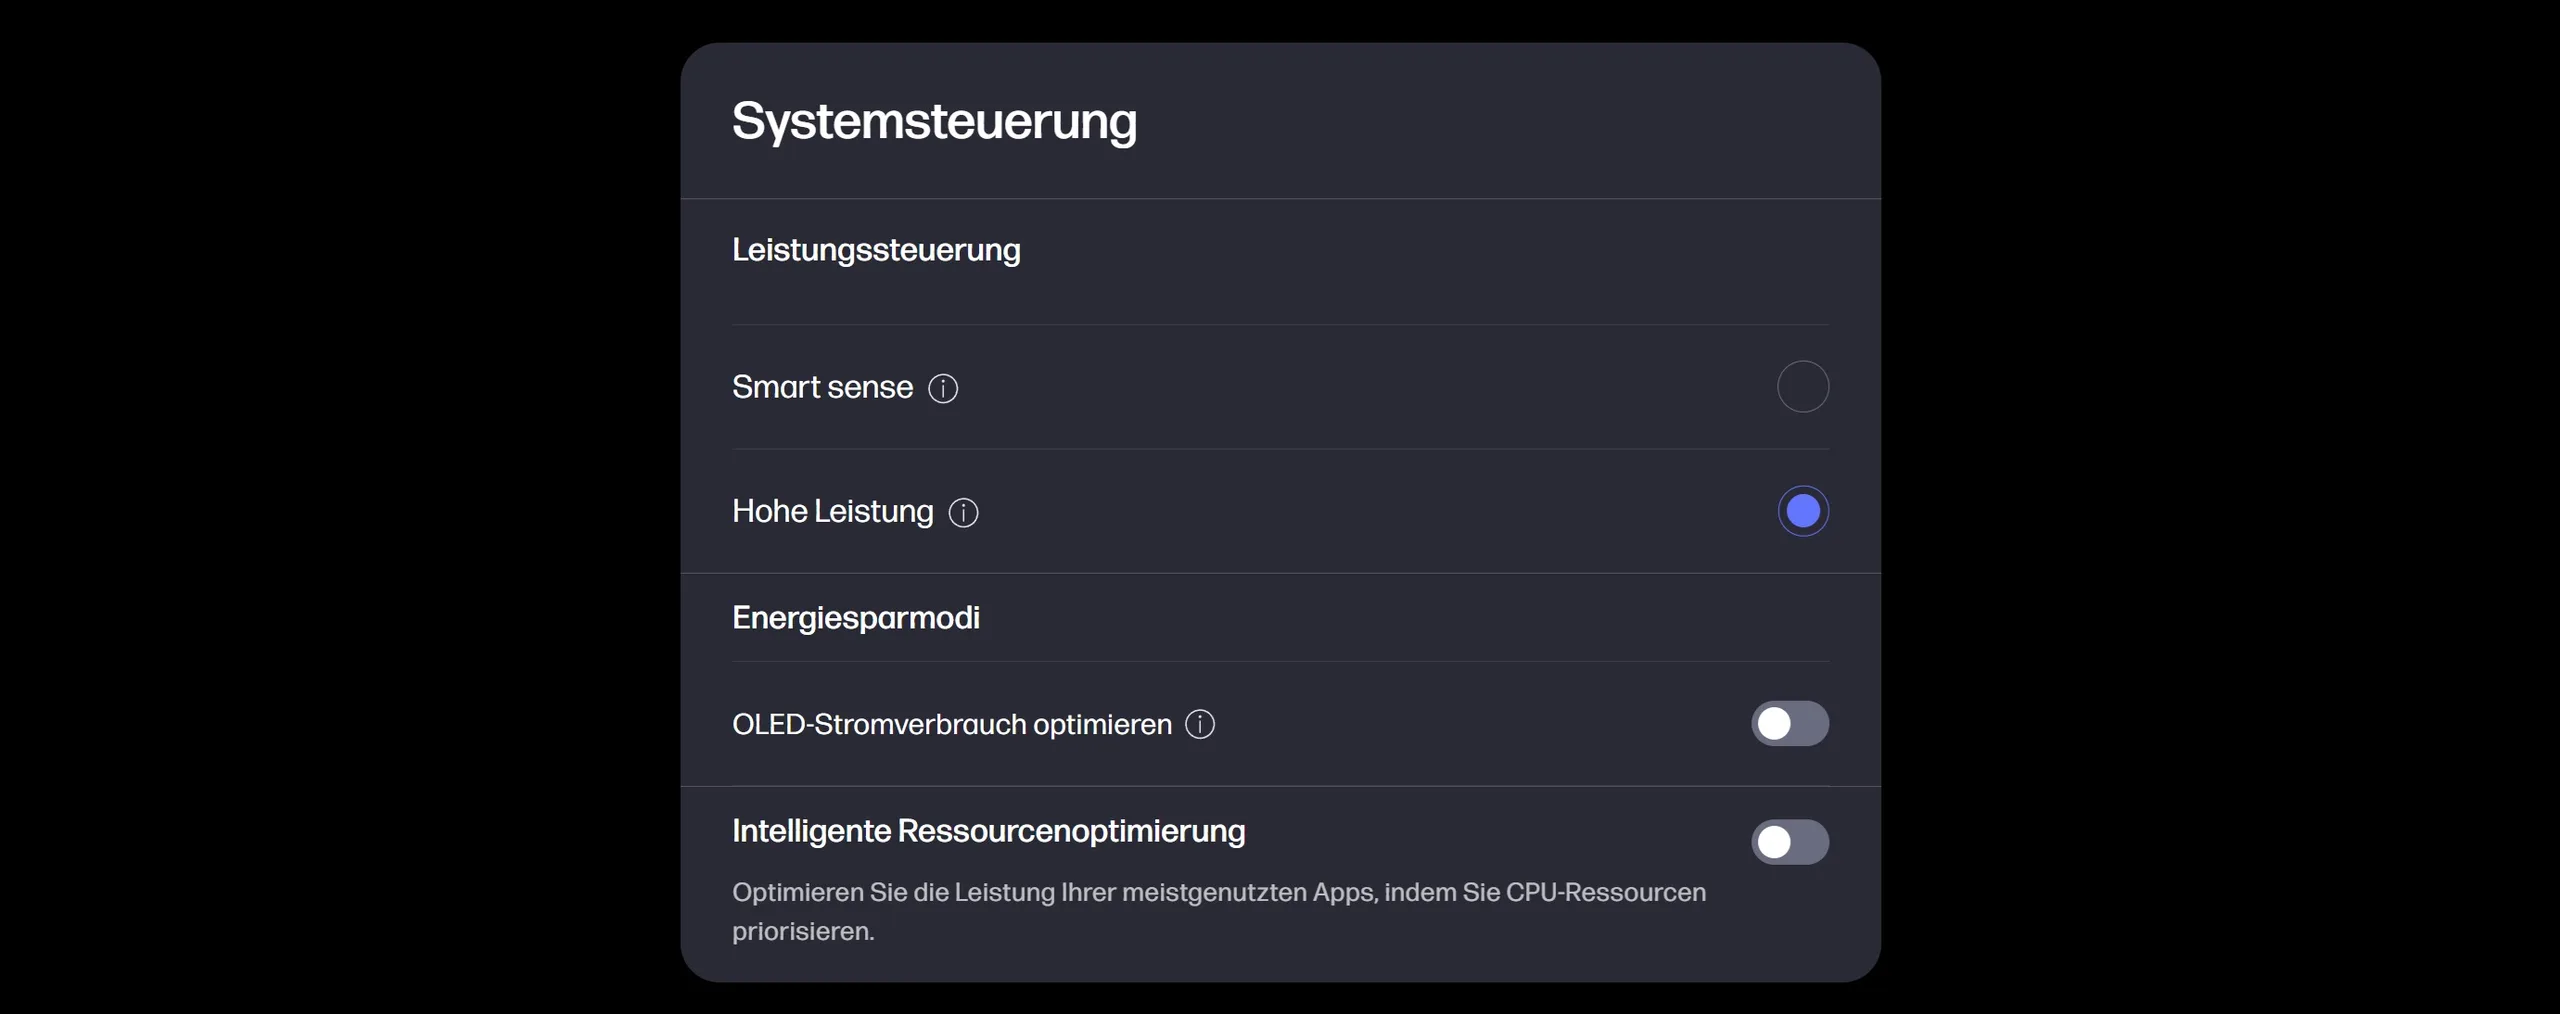
| Mode | Smart Sense | High Performance |
| Cyberpunk 2077 Noise | 43 dB(A) | 46 dB(A) |
| Cyberpunk 2077 Frame Rate (FHD/Ultra) | 31.3 fps | 33.2 fps |
| CPU PL1 | 60 W | 70 W |
| CPU PL2 | 71 W | 81 W |
| Cinebench R15 Multi Score | 2103 points | 2177 points |
Processor performance
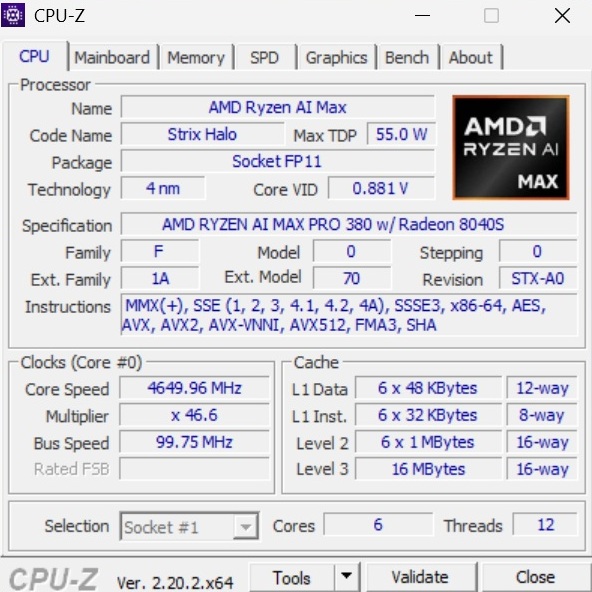
While the Max+ Pro 395 features 16 cores and 32 threads and the Max Pro 390 comes with 12 cores and 24 threads, the Max Pro 380 has to make do with six cores and 12 threads. Unsurprisingly, the chip falls well behind its siblings in our CPU benchmark suite.
Overall, the Max Pro 380 slots in between the slower Core Ultra 7 268V and the faster Ryzen AI 9 HX Pro 375. Intel's Core Ultra X9 388H is faster as well. At least the results remained very consistent throughout the Cinebench loop.
Cinebench R15 Multi Endurance Test
* ... smaller is better
AIDA64: FP32 Ray-Trace | FPU Julia | CPU SHA3 | CPU Queen | FPU SinJulia | FPU Mandel | CPU AES | CPU ZLib | FP64 Ray-Trace | CPU PhotoWorxx | CPU CheckMate
| Performance rating | |
| HP ZBook Ultra G1a 14 -1! | |
| HP ZBook Ultra G1a A3ZQ0ET -1! | |
| Average of class Workstation | |
| HP EliteBook X G1a 14 AI -1! | |
| HP ZBook Ultra G1a 14 B30FBES -1! | |
| Average AMD Ryzen AI Max PRO 380 -1! | |
| HP OmniBook Ultra 14 Core Ultra X9 -1! | |
| HP EliteBook X G1i 14 AI -1! | |
| AIDA64 / FP32 Ray-Trace | |
| HP ZBook Ultra G1a 14 (v6.92.6600) | |
| HP ZBook Ultra G1a A3ZQ0ET (v6.92.6600) | |
| HP ZBook Ultra G1a 14 B30FBES (v8.20.8100) | |
| Average AMD Ryzen AI Max PRO 380 (n=1) | |
| HP EliteBook X G1a 14 AI (v6.92.6600) | |
| Average of class Workstation (16730 - 61611, n=23, last 2 years) | |
| HP OmniBook Ultra 14 Core Ultra X9 (v8.20.8100) | |
| HP EliteBook X G1i 14 AI (v6.92.6600) | |
| AIDA64 / FPU Julia | |
| HP ZBook Ultra G1a 14 (v6.92.6600) | |
| HP ZBook Ultra G1a A3ZQ0ET (v6.92.6600) | |
| HP ZBook Ultra G1a 14 B30FBES (v8.20.8100) | |
| Average AMD Ryzen AI Max PRO 380 (n=1) | |
| Average of class Workstation (89740 - 186971, n=23, last 2 years) | |
| HP EliteBook X G1a 14 AI (v6.92.6600) | |
| HP OmniBook Ultra 14 Core Ultra X9 (v8.20.8100) | |
| HP EliteBook X G1i 14 AI (v6.92.6600) | |
| AIDA64 / CPU SHA3 | |
| HP ZBook Ultra G1a 14 (v6.92.6600) | |
| HP ZBook Ultra G1a A3ZQ0ET (v6.92.6600) | |
| Average of class Workstation (3590 - 8975, n=23, last 2 years) | |
| HP EliteBook X G1a 14 AI (v6.92.6600) | |
| HP OmniBook Ultra 14 Core Ultra X9 (v8.20.8100) | |
| HP ZBook Ultra G1a 14 B30FBES (v8.20.8100) | |
| Average AMD Ryzen AI Max PRO 380 (n=1) | |
| HP EliteBook X G1i 14 AI (v6.92.6600) | |
| AIDA64 / CPU Queen | |
| HP ZBook Ultra G1a 14 (v6.92.6600) | |
| Average of class Workstation (60778 - 144411, n=20, last 2 years) | |
| HP ZBook Ultra G1a A3ZQ0ET (v6.92.6600) | |
| HP EliteBook X G1a 14 AI (v6.92.6600) | |
| HP EliteBook X G1i 14 AI (v6.92.6600) | |
| AIDA64 / FPU SinJulia | |
| HP ZBook Ultra G1a 14 (v6.92.6600) | |
| HP ZBook Ultra G1a A3ZQ0ET (v6.92.6600) | |
| HP EliteBook X G1a 14 AI (v6.92.6600) | |
| Average of class Workstation (7136 - 29343, n=23, last 2 years) | |
| HP ZBook Ultra G1a 14 B30FBES (v8.20.8100) | |
| Average AMD Ryzen AI Max PRO 380 (n=1) | |
| HP OmniBook Ultra 14 Core Ultra X9 (v8.20.8100) | |
| HP EliteBook X G1i 14 AI (v6.92.6600) | |
| AIDA64 / FPU Mandel | |
| HP ZBook Ultra G1a 14 (v6.92.6600) | |
| HP ZBook Ultra G1a A3ZQ0ET (v6.92.6600) | |
| HP ZBook Ultra G1a 14 B30FBES (v8.20.8100) | |
| Average AMD Ryzen AI Max PRO 380 (n=1) | |
| Average of class Workstation (44497 - 98153, n=23, last 2 years) | |
| HP EliteBook X G1a 14 AI (v6.92.6600) | |
| HP OmniBook Ultra 14 Core Ultra X9 (v8.20.8100) | |
| HP EliteBook X G1i 14 AI (v6.92.6600) | |
| AIDA64 / CPU AES | |
| HP ZBook Ultra G1a 14 (v6.92.6600) | |
| HP ZBook Ultra G1a A3ZQ0ET (v6.92.6600) | |
| Average of class Workstation (68072 - 187841, n=23, last 2 years) | |
| HP EliteBook X G1a 14 AI (v6.92.6600) | |
| HP ZBook Ultra G1a 14 B30FBES (v8.20.8100) | |
| Average AMD Ryzen AI Max PRO 380 (n=1) | |
| HP OmniBook Ultra 14 Core Ultra X9 (v8.20.8100) | |
| HP EliteBook X G1i 14 AI (v6.92.6600) | |
| AIDA64 / CPU ZLib | |
| HP ZBook Ultra G1a 14 (v6.92.6600) | |
| HP ZBook Ultra G1a A3ZQ0ET (v6.92.6600) | |
| Average of class Workstation (917 - 2148, n=23, last 2 years) | |
| HP EliteBook X G1a 14 AI (v6.92.6600) | |
| HP OmniBook Ultra 14 Core Ultra X9 (v8.20.8100) | |
| HP ZBook Ultra G1a 14 B30FBES (v8.20.8100) | |
| Average AMD Ryzen AI Max PRO 380 (n=1) | |
| HP EliteBook X G1i 14 AI (v6.92.6600) | |
| AIDA64 / FP64 Ray-Trace | |
| HP ZBook Ultra G1a 14 (v6.92.6600) | |
| HP ZBook Ultra G1a A3ZQ0ET (v6.92.6600) | |
| HP EliteBook X G1a 14 AI (v6.92.6600) | |
| HP ZBook Ultra G1a 14 B30FBES (v8.20.8100) | |
| Average AMD Ryzen AI Max PRO 380 (n=1) | |
| Average of class Workstation (8545 - 32891, n=23, last 2 years) | |
| HP OmniBook Ultra 14 Core Ultra X9 (v8.20.8100) | |
| HP EliteBook X G1i 14 AI (v6.92.6600) | |
| AIDA64 / CPU PhotoWorxx | |
| HP ZBook Ultra G1a 14 (v6.92.6600) | |
| HP ZBook Ultra G1a A3ZQ0ET (v6.92.6600) | |
| HP OmniBook Ultra 14 Core Ultra X9 (v8.20.8100) | |
| HP EliteBook X G1i 14 AI (v6.92.6600) | |
| Average of class Workstation (37482 - 93684, n=23, last 2 years) | |
| HP EliteBook X G1a 14 AI (v6.92.6600) | |
| HP ZBook Ultra G1a 14 B30FBES (v8.20.8100) | |
| Average AMD Ryzen AI Max PRO 380 (n=1) | |
| AIDA64 / CPU CheckMate | |
| HP ZBook Ultra G1a 14 B30FBES (v8.20.8100) | |
| Average AMD Ryzen AI Max PRO 380 (n=1) | |
| Average of class Workstation (4591 - 7823, n=3, last 2 years) | |
| HP OmniBook Ultra 14 Core Ultra X9 (v8.20.8100) | |
System and storage performance
In terms of system performance, the 14-inch model ranks around the middle of the comparison field, while the RAM performs rather poorly, as expected. The installed 512 GB Samsung SSD, on the other hand, delivers typical performance and is broadly in line with most of its competitors.
PCMark 10: Score | Essentials | Productivity | Digital Content Creation
CrossMark: Overall | Productivity | Creativity | Responsiveness
WebXPRT 3: Overall
WebXPRT 4: Overall
Mozilla Kraken 1.1: Total
| Performance rating | |
| HP OmniBook Ultra 14 Core Ultra X9 | |
| Average of class Workstation | |
| HP ZBook Ultra G1a 14 | |
| HP ZBook Ultra G1a A3ZQ0ET | |
| HP ZBook Ultra G1a 14 B30FBES | |
| Average AMD Ryzen AI Max PRO 380, AMD Radeon 8040S | |
| HP EliteBook X G1a 14 AI | |
| HP EliteBook X G1i 14 AI | |
| PCMark 10 / Score | |
| HP OmniBook Ultra 14 Core Ultra X9 | |
| Average of class Workstation (6563 - 10409, n=19, last 2 years) | |
| HP ZBook Ultra G1a 14 | |
| HP ZBook Ultra G1a A3ZQ0ET | |
| HP ZBook Ultra G1a 14 B30FBES | |
| Average AMD Ryzen AI Max PRO 380, AMD Radeon 8040S (n=1) | |
| HP EliteBook X G1a 14 AI | |
| HP EliteBook X G1i 14 AI | |
| PCMark 10 / Essentials | |
| HP OmniBook Ultra 14 Core Ultra X9 | |
| HP EliteBook X G1a 14 AI | |
| HP ZBook Ultra G1a A3ZQ0ET | |
| HP ZBook Ultra G1a 14 | |
| Average of class Workstation (9622 - 11157, n=19, last 2 years) | |
| HP EliteBook X G1i 14 AI | |
| HP ZBook Ultra G1a 14 B30FBES | |
| Average AMD Ryzen AI Max PRO 380, AMD Radeon 8040S (n=1) | |
| PCMark 10 / Productivity | |
| HP OmniBook Ultra 14 Core Ultra X9 | |
| HP ZBook Ultra G1a 14 B30FBES | |
| Average AMD Ryzen AI Max PRO 380, AMD Radeon 8040S (n=1) | |
| Average of class Workstation (8789 - 20616, n=19, last 2 years) | |
| HP EliteBook X G1a 14 AI | |
| HP ZBook Ultra G1a A3ZQ0ET | |
| HP EliteBook X G1i 14 AI | |
| HP ZBook Ultra G1a 14 | |
| PCMark 10 / Digital Content Creation | |
| HP ZBook Ultra G1a 14 | |
| HP OmniBook Ultra 14 Core Ultra X9 | |
| HP ZBook Ultra G1a A3ZQ0ET | |
| Average of class Workstation (8108 - 15631, n=19, last 2 years) | |
| HP EliteBook X G1a 14 AI | |
| HP EliteBook X G1i 14 AI | |
| HP ZBook Ultra G1a 14 B30FBES | |
| Average AMD Ryzen AI Max PRO 380, AMD Radeon 8040S (n=1) | |
| CrossMark / Overall | |
| HP OmniBook Ultra 14 Core Ultra X9 | |
| Average of class Workstation (1307 - 2267, n=22, last 2 years) | |
| HP ZBook Ultra G1a 14 | |
| HP ZBook Ultra G1a A3ZQ0ET | |
| HP ZBook Ultra G1a 14 B30FBES | |
| Average AMD Ryzen AI Max PRO 380, AMD Radeon 8040S (n=1) | |
| HP EliteBook X G1a 14 AI | |
| HP EliteBook X G1i 14 AI | |
| CrossMark / Productivity | |
| HP OmniBook Ultra 14 Core Ultra X9 | |
| Average of class Workstation (1130 - 2122, n=22, last 2 years) | |
| HP ZBook Ultra G1a 14 | |
| HP EliteBook X G1i 14 AI | |
| HP ZBook Ultra G1a 14 B30FBES | |
| Average AMD Ryzen AI Max PRO 380, AMD Radeon 8040S (n=1) | |
| HP EliteBook X G1a 14 AI | |
| HP ZBook Ultra G1a A3ZQ0ET | |
| CrossMark / Creativity | |
| HP ZBook Ultra G1a 14 | |
| HP OmniBook Ultra 14 Core Ultra X9 | |
| HP ZBook Ultra G1a A3ZQ0ET | |
| Average of class Workstation (1657 - 2725, n=22, last 2 years) | |
| HP ZBook Ultra G1a 14 B30FBES | |
| Average AMD Ryzen AI Max PRO 380, AMD Radeon 8040S (n=1) | |
| HP EliteBook X G1a 14 AI | |
| HP EliteBook X G1i 14 AI | |
| CrossMark / Responsiveness | |
| HP OmniBook Ultra 14 Core Ultra X9 | |
| Average of class Workstation (993 - 2096, n=22, last 2 years) | |
| HP ZBook Ultra G1a 14 | |
| HP EliteBook X G1a 14 AI | |
| HP ZBook Ultra G1a 14 B30FBES | |
| Average AMD Ryzen AI Max PRO 380, AMD Radeon 8040S (n=1) | |
| HP ZBook Ultra G1a A3ZQ0ET | |
| HP EliteBook X G1i 14 AI | |
| WebXPRT 3 / Overall | |
| HP OmniBook Ultra 14 Core Ultra X9 | |
| HP EliteBook X G1a 14 AI | |
| Average of class Workstation (260 - 360, n=22, last 2 years) | |
| HP EliteBook X G1i 14 AI | |
| HP ZBook Ultra G1a 14 B30FBES | |
| Average AMD Ryzen AI Max PRO 380, AMD Radeon 8040S (n=1) | |
| HP ZBook Ultra G1a 14 | |
| HP ZBook Ultra G1a A3ZQ0ET | |
| WebXPRT 4 / Overall | |
| HP OmniBook Ultra 14 Core Ultra X9 | |
| HP ZBook Ultra G1a A3ZQ0ET | |
| Average of class Workstation (189.2 - 326, n=23, last 2 years) | |
| HP EliteBook X G1i 14 AI | |
| HP ZBook Ultra G1a 14 B30FBES | |
| Average AMD Ryzen AI Max PRO 380, AMD Radeon 8040S (n=1) | |
| HP EliteBook X G1a 14 AI | |
| HP ZBook Ultra G1a 14 | |
| Mozilla Kraken 1.1 / Total | |
| HP EliteBook X G1i 14 AI | |
| HP ZBook Ultra G1a 14 B30FBES | |
| Average AMD Ryzen AI Max PRO 380, AMD Radeon 8040S (n=1) | |
| HP EliteBook X G1a 14 AI | |
| Average of class Workstation (411 - 538, n=23, last 2 years) | |
| HP ZBook Ultra G1a A3ZQ0ET | |
| HP ZBook Ultra G1a 14 | |
| HP OmniBook Ultra 14 Core Ultra X9 | |
* ... smaller is better
| PCMark 10 Score | 7924 points | |
Help | ||
| AIDA64 / Memory Copy | |
| HP ZBook Ultra G1a A3ZQ0ET | |
| HP ZBook Ultra G1a 14 | |
| HP OmniBook Ultra 14 Core Ultra X9 | |
| HP EliteBook X G1i 14 AI | |
| HP EliteBook X G1a 14 AI | |
| Average of class Workstation (56003 - 164795, n=23, last 2 years) | |
| HP ZBook Ultra G1a 14 B30FBES | |
| Average AMD Ryzen AI Max PRO 380 (n=1) | |
| AIDA64 / Memory Read | |
| HP ZBook Ultra G1a A3ZQ0ET | |
| HP ZBook Ultra G1a 14 | |
| HP OmniBook Ultra 14 Core Ultra X9 | |
| HP EliteBook X G1a 14 AI | |
| HP EliteBook X G1i 14 AI | |
| Average of class Workstation (55795 - 121563, n=23, last 2 years) | |
| HP ZBook Ultra G1a 14 B30FBES | |
| Average AMD Ryzen AI Max PRO 380 (n=1) | |
| AIDA64 / Memory Write | |
| HP ZBook Ultra G1a A3ZQ0ET | |
| HP ZBook Ultra G1a 14 | |
| HP OmniBook Ultra 14 Core Ultra X9 | |
| HP ZBook Ultra G1a 14 B30FBES | |
| Average AMD Ryzen AI Max PRO 380 (n=1) | |
| HP EliteBook X G1i 14 AI | |
| HP EliteBook X G1a 14 AI | |
| Average of class Workstation (55663 - 214520, n=23, last 2 years) | |
| AIDA64 / Memory Latency | |
| HP ZBook Ultra G1a 14 | |
| HP ZBook Ultra G1a A3ZQ0ET | |
| HP ZBook Ultra G1a 14 B30FBES | |
| Average AMD Ryzen AI Max PRO 380 (n=1) | |
| HP EliteBook X G1a 14 AI | |
| Average of class Workstation (84.5 - 165.2, n=23, last 2 years) | |
| HP EliteBook X G1i 14 AI | |
| HP OmniBook Ultra 14 Core Ultra X9 | |
* ... smaller is better

* ... smaller is better
Sustained Read Performance: DiskSpd Read Loop, Queue Depth 8
GPU and gaming performance
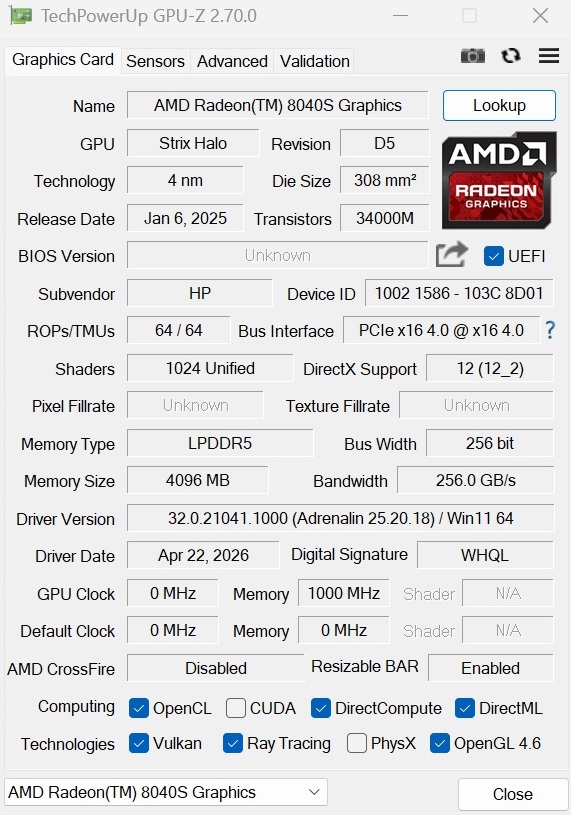
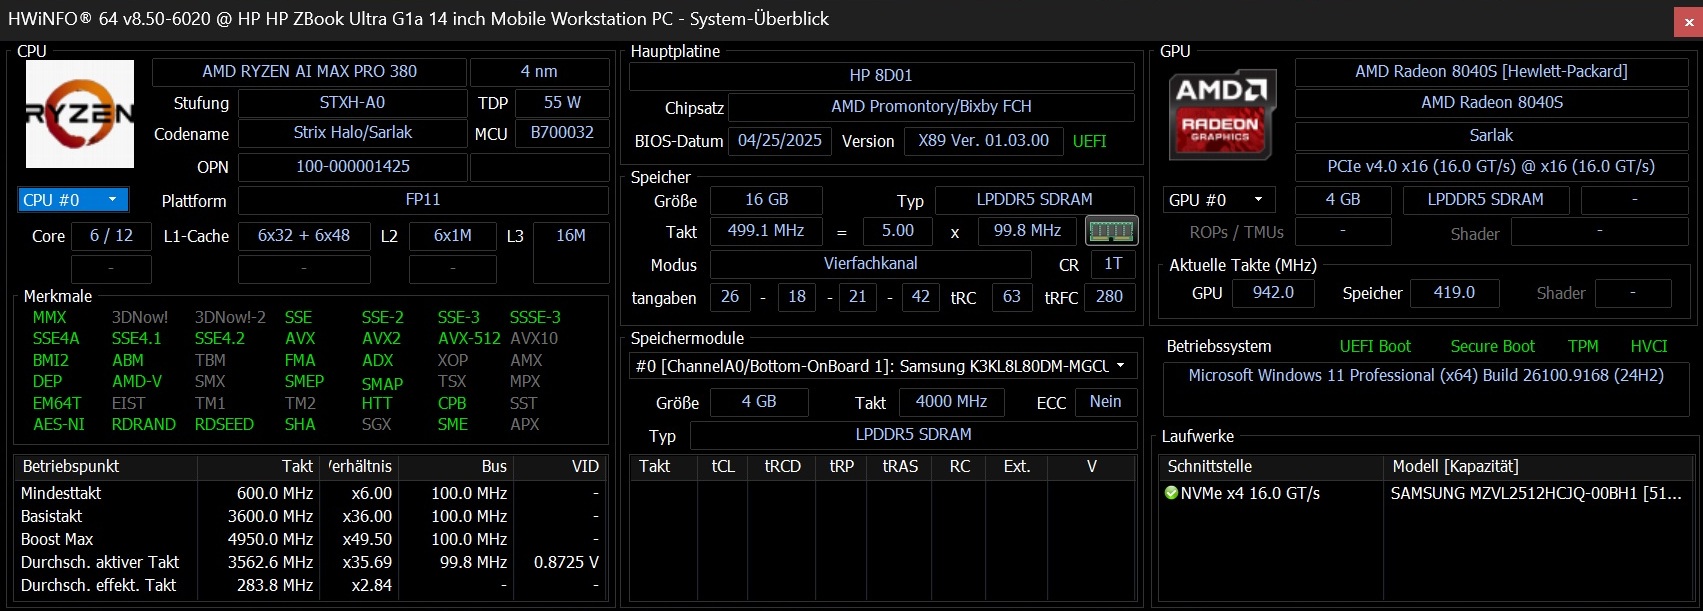
By default, HP configures the 16 GB of system memory so that just 4 GB is available to the Radeon 8040S. These days, at least twice that amount would be preferable, although splitting the memory into 8 GB for the iGPU and 8 GB for the rest of the system would place too much of a burden on overall performance. Even with the existing 4 + 12 GB allocation, the system does not always feel particularly responsive during everyday Windows use. HP would therefore have been well advised to equip this configuration with 32 GB of RAM from the outset, something that could reasonably be expected given the notebook's relatively high price, regardless of current memory costs.
In this configuration, the performance of the Radeon 8040S is only moderately convincing. In both synthetic tests and gaming benchmarks, the Radeon 8050S and Radeon 8060S are usually much faster. The chip also often struggles against Intel's Arc B390, although the gap is considerably smaller here.
Older and/or less demanding titles such as Dota 2 often run smoothly even at high or maximum settings, but current or more demanding games regularly require dropping to 1,920 x 1,080 pixels and minimum to low detail settings. Extreme cases such as Death Stranding 2 and 007 First Light even require FSR to achieve smooth frame rates.
| 3DMark 06 Standard Score | 47073 points | |
| 3DMark Vantage P Result | 51094 points | |
| 3DMark 11 Performance | 17208 points | |
| 3DMark Cloud Gate Standard Score | 39381 points | |
| 3DMark Fire Strike Score | 10931 points | |
| 3DMark Time Spy Score | 4313 points | |
Help | ||
| low | med. | high | ultra | |
|---|---|---|---|---|
| Dota 2 Reborn (2015) | 141.2 | 111.2 | 107.6 | 93.1 |
| X-Plane 11.11 (2018) | 63 | 53.9 | 45 | |
| Baldur's Gate 3 (2023) | 52.9 | 43 | 34.1 | 33.8 |
| Cyberpunk 2077 (2023) | 60.6 | 46 | 36 | 33.2 |
| Doom: The Dark Ages (2025) | 23.2 | 16.4 | 14.5 | 13.1 |
| F1 25 (2025) | 97 | 80 | 60 | |
| Borderlands 4 (2025) | 23.5 | 21 | 16.2 | 10.3 |
| The Outer Worlds 2 (2025) | 40.4 | 33.4 | 25.4 | 12.4 |
| ARC Raiders (2025) | 91.3 | 53.7 | 39.6 | 22.9 |
| Anno 117: Pax Romana (2025) | 41.3 | 29.5 | 21 | 9.5 |
| Call of Duty Black Ops 7 (2025) | 69 | 61 | 46 | |
| Resident Evil Requiem (2026) | 52.7 | 30.6 | 30.3 | 0 () |
| Death Stranding 2 (2026) | 30 | 25.4 | 22.3 | 16.3 |
| Crimson Desert (2026) | 37.6 | 21.7 | 19.2 | 15.8 |
| Pragmata (2026) | 51 | 34 | 19.8 | |
| 007 First Light (2026) | 30.3 | 27 | 24.1 | 20.1 |
| Assassin's Creed Black Flag Resynced (2026) | 36 | 28 | 24 | 13 |
Cyberpunk 2077 Ultra FPS Chart
Emissions & energy
Noise emissions
While the ZBook Ultra G1a generally remains fairly quiet when idling, with the fans occasionally switching off completely, the system can become clearly audible under load, reaching up to 48 dB(A).
Noise level
| Idle |
| 24 / 25 / 26 dB(A) |
| Load |
| 42 / 48 dB(A) |
 | ||
30 dB silent 40 dB(A) audible 50 dB(A) loud |
||
min:  , med: , med:  , max: , max:  Earthworks M23R, Arta (15 cm distance) environment noise: 24 dB(A) Earthworks M23R, Arta (15 cm distance) environment noise: 24 dB(A) | ||
| HP ZBook Ultra G1a 14 B30FBES Ryzen AI Max PRO 380, Radeon 8040S | HP ZBook Ultra G1a A3ZQ0ET Ryzen AI Max PRO 390, Radeon 8050S | HP ZBook Ultra G1a 14 Ryzen AI Max+ PRO 395, Radeon 8060S | HP EliteBook X G1a 14 AI Ryzen AI 9 HX PRO 375, Radeon 890M | HP EliteBook X G1i 14 AI Core Ultra 7 268V, Arc 140V | HP OmniBook Ultra 14 Core Ultra X9 Ultra X9 388H, Arc B390 Panther Lake iGPU | |
|---|---|---|---|---|---|---|
| Noise | 1% | -1% | 10% | -1% | 5% | |
| off / environment * (dB) | 24 | 24.6 -3% | 23.9 -0% | 24 -0% | 28.2 -18% | 23.3 3% |
| Idle Minimum * (dB) | 24 | 24.6 -3% | 23.9 -0% | 24.4 -2% | 28.4 -18% | 23.3 3% |
| Idle Average * (dB) | 25 | 24.6 2% | 23.9 4% | 24.4 2% | 28.4 -14% | 23.3 7% |
| Idle Maximum * (dB) | 26 | 24.6 5% | 26.8 -3% | 24.5 6% | 28.8 -11% | 23.3 10% |
| Load Average * (dB) | 42 | 40.7 3% | 42.2 -0% | 25.4 40% | 33.5 20% | 42.9 -2% |
| Cyberpunk 2077 ultra * (dB) | 46 | 45.4 1% | 49.1 -7% | 39.3 15% | 39.1 15% | 44.4 3% |
| Load Maximum * (dB) | 48 | 45.4 5% | 49.2 -3% | 43.1 10% | 40.4 16% | 44.1 8% |
* ... smaller is better
Temperature
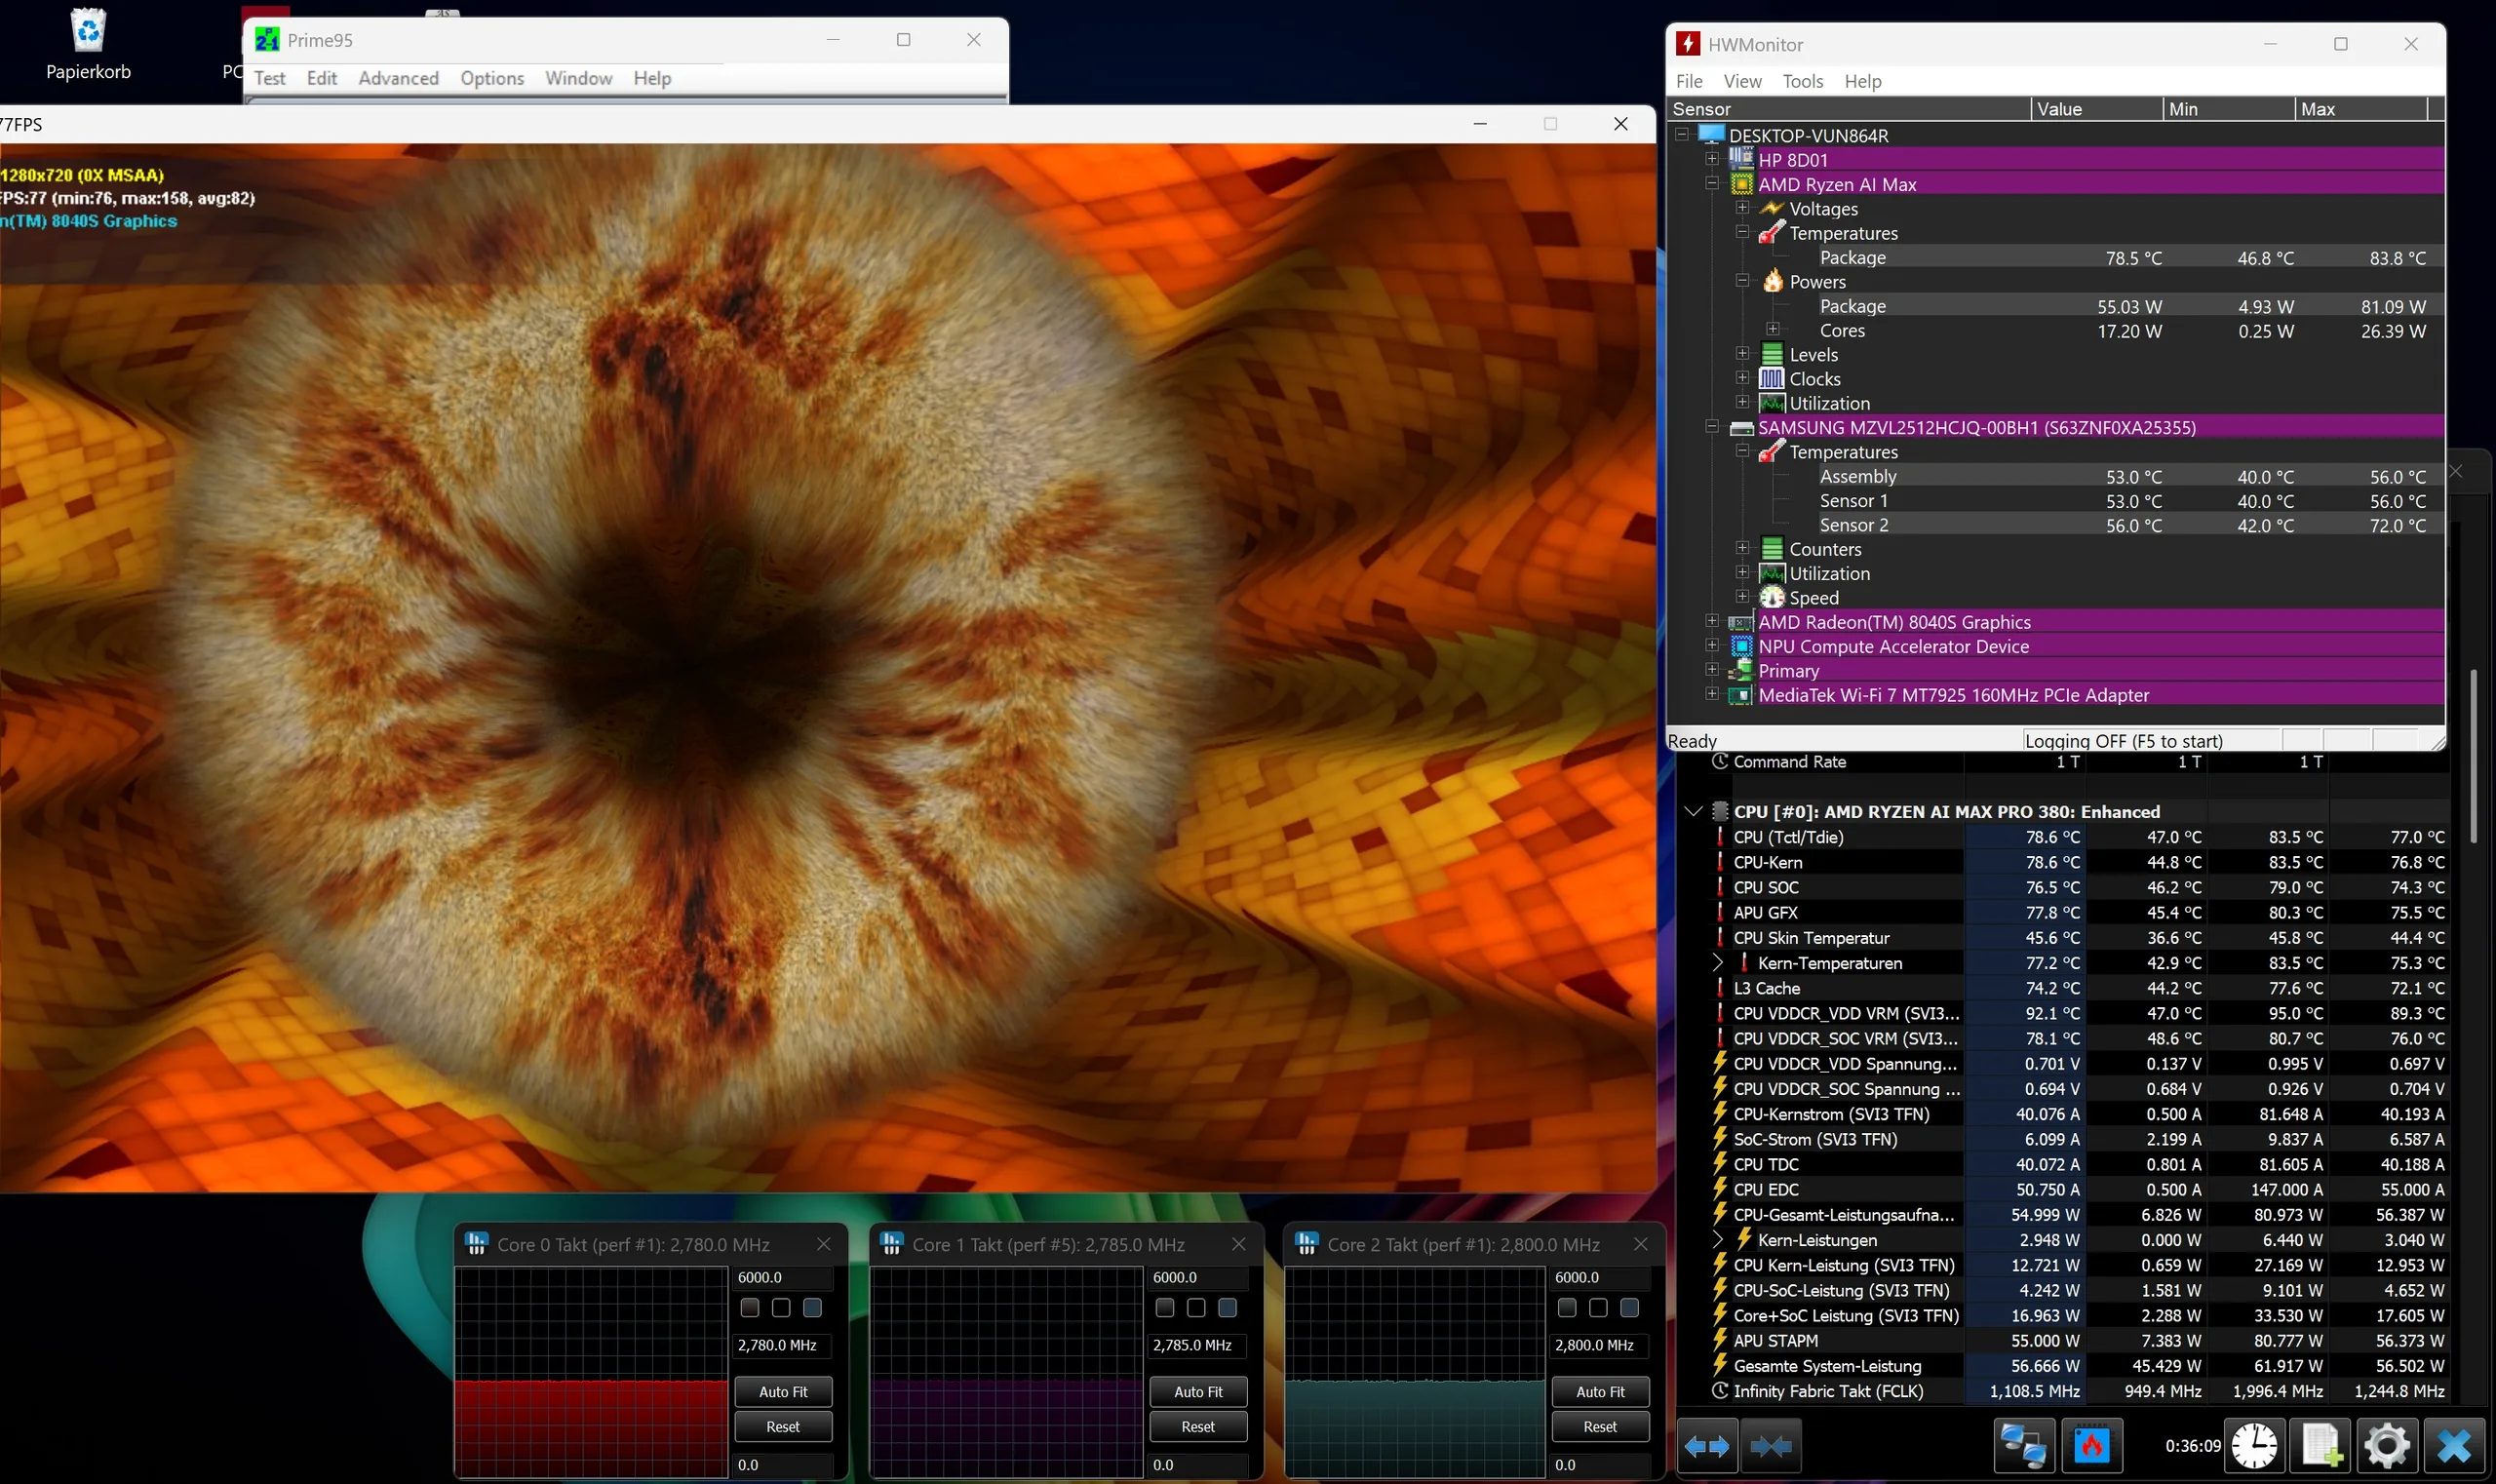
As with the noise levels, temperatures also become noticeable under 3D load. During the stress test with FurMark and Prime95, parts of the chassis exceeded the 50 °C mark. After a while, the APU reached an average temperature of 79 °C, which is still acceptable.
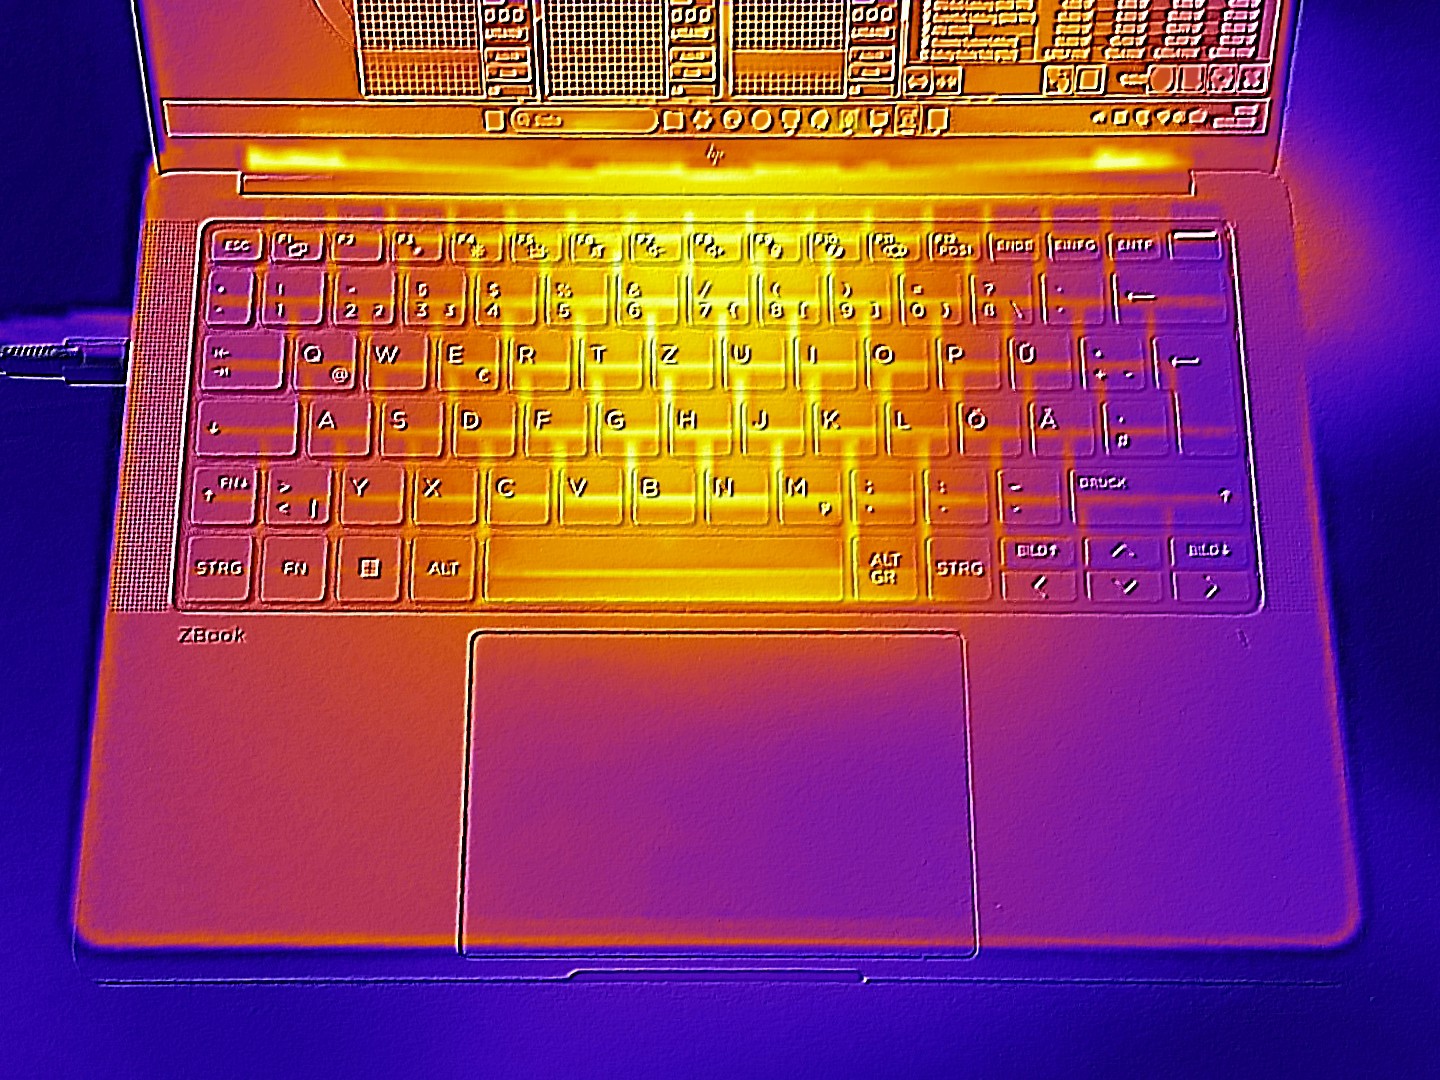
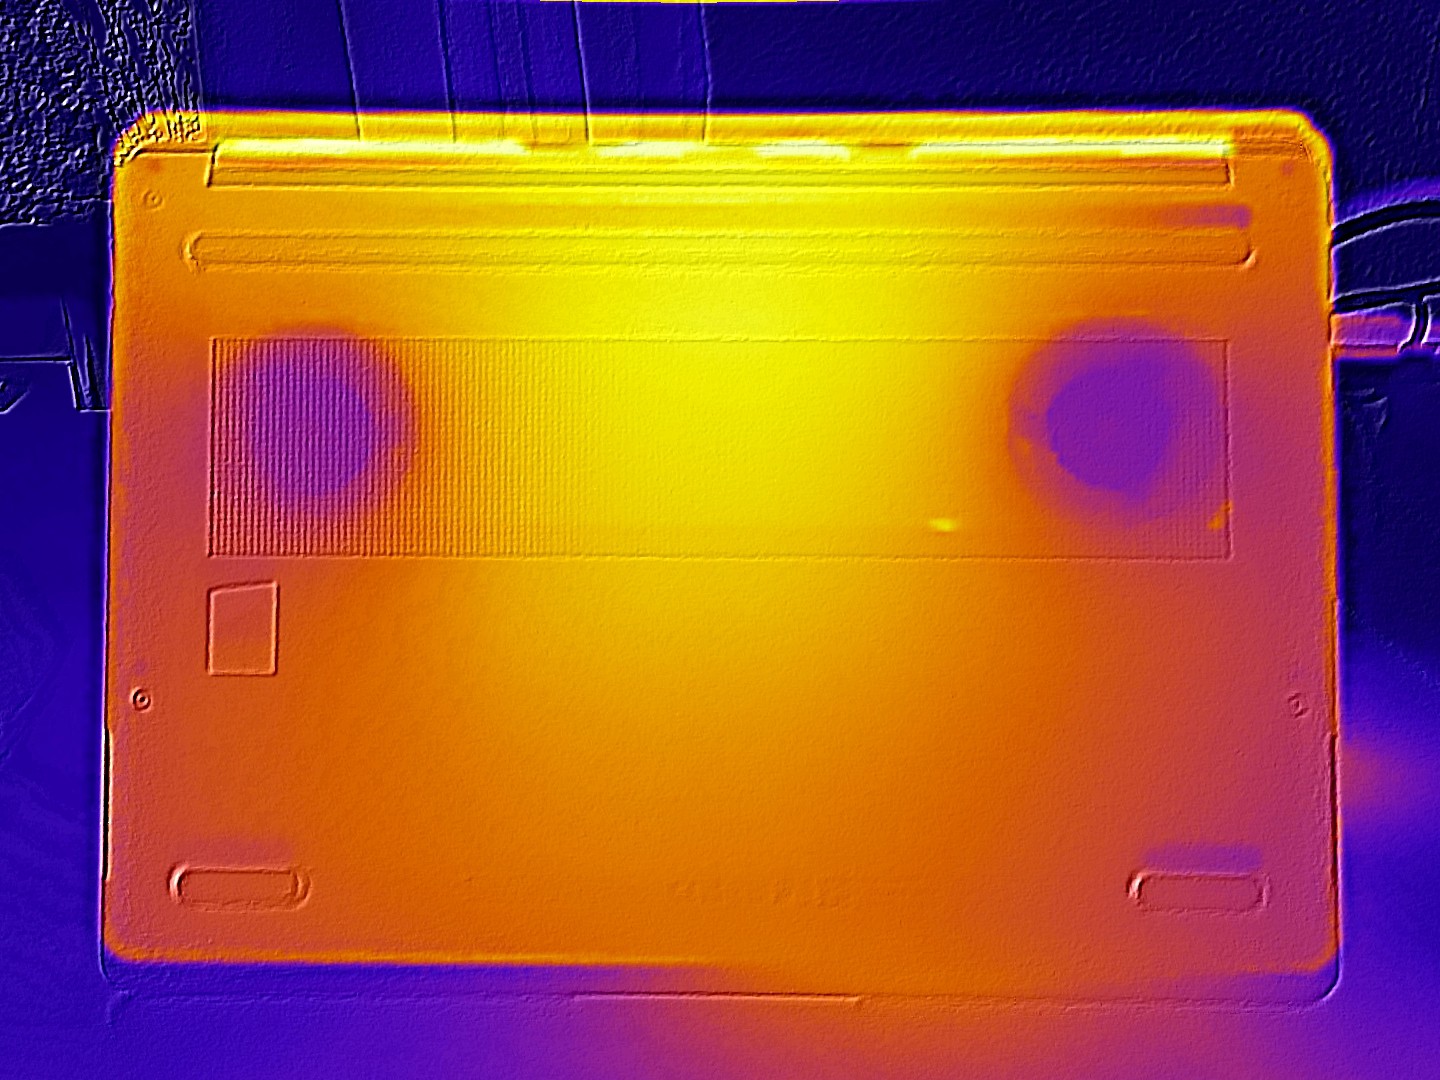
(-) The maximum temperature on the upper side is 50 °C / 122 F, compared to the average of 38.3 °C / 101 F, ranging from 22.2 to 69.8 °C for the class Workstation.
(-) The bottom heats up to a maximum of 51 °C / 124 F, compared to the average of 41.1 °C / 106 F
(±) The palmrests and touchpad can get very hot to the touch with a maximum of 37 °C / 98.6 F.
(-) The average temperature of the palmrest area of similar devices was 27.8 °C / 82 F (-9.2 °C / -16.6 F).
| HP ZBook Ultra G1a 14 B30FBES Ryzen AI Max PRO 380, Radeon 8040S | HP ZBook Ultra G1a A3ZQ0ET Ryzen AI Max PRO 390, Radeon 8050S | HP ZBook Ultra G1a 14 Ryzen AI Max+ PRO 395, Radeon 8060S | HP EliteBook X G1a 14 AI Ryzen AI 9 HX PRO 375, Radeon 890M | HP EliteBook X G1i 14 AI Core Ultra 7 268V, Arc 140V | HP OmniBook Ultra 14 Core Ultra X9 Ultra X9 388H, Arc B390 Panther Lake iGPU | |
|---|---|---|---|---|---|---|
| Heat | 18% | 23% | 31% | 33% | 17% | |
| Maximum Upper Side * (°C) | 50 | 43 14% | 41.4 17% | 36 28% | 35 30% | 40.2 20% |
| Maximum Bottom * (°C) | 51 | 40.4 21% | 36.6 28% | 34.2 33% | 33.4 35% | 44.2 13% |
| Idle Upper Side * (°C) | 31.2 | 34 | 25 | 23.8 | 22.8 | |
| Idle Bottom * (°C) | 32.5 | 33.6 | 25.6 | 24.2 | 23.4 |
* ... smaller is better
Speakers
The ZBook Ultra G1a impresses with surprisingly good sound for a 14-inch laptop. Only the bass could be a little more powerful.
HP ZBook Ultra G1a 14 B30FBES audio analysis
(+) | speakers can play relatively loud (87 dB)
Bass 100 - 315 Hz
(±) | reduced bass - on average 10.2% lower than median
(±) | linearity of bass is average (13.5% delta to prev. frequency)
Mids 400 - 2000 Hz
(±) | higher mids - on average 5.8% higher than median
(+) | mids are linear (3.9% delta to prev. frequency)
Highs 2 - 16 kHz
(+) | balanced highs - only 4.3% away from median
(+) | highs are linear (5.2% delta to prev. frequency)
Overall 100 - 16.000 Hz
(+) | overall sound is linear (11.9% difference to median)
Compared to same class
» 17% of all tested devices in this class were better, 5% similar, 78% worse
» The best had a delta of 7%, average was 17%, worst was 35%
Compared to all devices tested
» 9% of all tested devices were better, 3% similar, 88% worse
» The best had a delta of 4%, average was 23%, worst was 136%
HP ZBook Ultra G1a A3ZQ0ET audio analysis
(+) | speakers can play relatively loud (85.3 dB)
Bass 100 - 315 Hz
(±) | reduced bass - on average 11.2% lower than median
(±) | linearity of bass is average (11.5% delta to prev. frequency)
Mids 400 - 2000 Hz
(±) | higher mids - on average 5.7% higher than median
(+) | mids are linear (5.6% delta to prev. frequency)
Highs 2 - 16 kHz
(+) | balanced highs - only 3.3% away from median
(+) | highs are linear (5.6% delta to prev. frequency)
Overall 100 - 16.000 Hz
(+) | overall sound is linear (11.5% difference to median)
Compared to same class
» 14% of all tested devices in this class were better, 4% similar, 82% worse
» The best had a delta of 7%, average was 17%, worst was 35%
Compared to all devices tested
» 8% of all tested devices were better, 2% similar, 90% worse
» The best had a delta of 4%, average was 23%, worst was 136%
HP ZBook Ultra G1a 14 audio analysis
(+) | speakers can play relatively loud (88.7 dB)
Bass 100 - 315 Hz
(±) | reduced bass - on average 11.8% lower than median
(±) | linearity of bass is average (11% delta to prev. frequency)
Mids 400 - 2000 Hz
(+) | balanced mids - only 4.5% away from median
(+) | mids are linear (3.4% delta to prev. frequency)
Highs 2 - 16 kHz
(+) | balanced highs - only 3.4% away from median
(+) | highs are linear (4.3% delta to prev. frequency)
Overall 100 - 16.000 Hz
(+) | overall sound is linear (10.4% difference to median)
Compared to same class
» 6% of all tested devices in this class were better, 6% similar, 88% worse
» The best had a delta of 7%, average was 17%, worst was 35%
Compared to all devices tested
» 5% of all tested devices were better, 1% similar, 93% worse
» The best had a delta of 4%, average was 23%, worst was 136%
HP EliteBook X G1a 14 AI audio analysis
(+) | speakers can play relatively loud (89.1 dB)
Bass 100 - 315 Hz
(±) | reduced bass - on average 12.5% lower than median
(±) | linearity of bass is average (10.8% delta to prev. frequency)
Mids 400 - 2000 Hz
(±) | higher mids - on average 6% higher than median
(+) | mids are linear (3.9% delta to prev. frequency)
Highs 2 - 16 kHz
(+) | balanced highs - only 3.3% away from median
(+) | highs are linear (5.1% delta to prev. frequency)
Overall 100 - 16.000 Hz
(+) | overall sound is linear (11.5% difference to median)
Compared to same class
» 4% of all tested devices in this class were better, 2% similar, 94% worse
» The best had a delta of 7%, average was 21%, worst was 53%
Compared to all devices tested
» 8% of all tested devices were better, 2% similar, 90% worse
» The best had a delta of 4%, average was 23%, worst was 136%
HP EliteBook X G1i 14 AI audio analysis
(+) | speakers can play relatively loud (90.3 dB)
Bass 100 - 315 Hz
(±) | reduced bass - on average 11% lower than median
(±) | linearity of bass is average (12.1% delta to prev. frequency)
Mids 400 - 2000 Hz
(+) | balanced mids - only 3.9% away from median
(±) | linearity of mids is average (8.9% delta to prev. frequency)
Highs 2 - 16 kHz
(+) | balanced highs - only 4% away from median
(+) | highs are linear (6.5% delta to prev. frequency)
Overall 100 - 16.000 Hz
(+) | overall sound is linear (12% difference to median)
Compared to same class
» 15% of all tested devices in this class were better, 5% similar, 81% worse
» The best had a delta of 5%, average was 18%, worst was 53%
Compared to all devices tested
» 10% of all tested devices were better, 2% similar, 88% worse
» The best had a delta of 4%, average was 23%, worst was 136%
HP OmniBook Ultra 14 Core Ultra X9 audio analysis
(+) | speakers can play relatively loud (85.3 dB)
Bass 100 - 315 Hz
(±) | reduced bass - on average 10% lower than median
(±) | linearity of bass is average (11.6% delta to prev. frequency)
Mids 400 - 2000 Hz
(+) | balanced mids - only 2.6% away from median
(+) | mids are linear (4% delta to prev. frequency)
Highs 2 - 16 kHz
(+) | balanced highs - only 1.3% away from median
(+) | highs are linear (2.6% delta to prev. frequency)
Overall 100 - 16.000 Hz
(+) | overall sound is linear (7.3% difference to median)
Compared to same class
» 1% of all tested devices in this class were better, 1% similar, 98% worse
» The best had a delta of 5%, average was 18%, worst was 53%
Compared to all devices tested
» 1% of all tested devices were better, 0% similar, 99% worse
» The best had a delta of 4%, average was 23%, worst was 136%
Power consumption and battery life
With an average idle consumption of around 7 watts, the test configuration is in line with expectations and proves fairly economical. Under load, we measured a maximum of 126 watts, which poses no problem for the included 140-watt power adapter. However, the Intel-based systems in particular are more restrained in this regard.
In our Wi-Fi test with the display brightness reduced, the battery lasted just under 9 hours. This is a decent result, although many of its competitors manage longer runtimes.
| Off / Standby | 0.1 / 0.7 Watt |
| Idle | 6.2 / 7.3 / 12.8 Watt |
| Load |
82 / 126 Watt |
   
| |
Key:
min: ,
med: ,
max: Metrahit Energy | |
| HP ZBook Ultra G1a 14 B30FBES Ryzen AI Max PRO 380, Radeon 8040S | HP ZBook Ultra G1a A3ZQ0ET Ryzen AI Max PRO 390, Radeon 8050S | HP ZBook Ultra G1a 14 Ryzen AI Max+ PRO 395, Radeon 8060S | HP EliteBook X G1a 14 AI Ryzen AI 9 HX PRO 375, Radeon 890M | HP EliteBook X G1i 14 AI Core Ultra 7 268V, Arc 140V | HP OmniBook Ultra 14 Core Ultra X9 Ultra X9 388H, Arc B390 Panther Lake iGPU | Average of class Workstation | |
|---|---|---|---|---|---|---|---|
| Power Consumption | 11% | -6% | 9% | 52% | 47% | -42% | |
| Idle Minimum * (Watt) | 6.2 | 4.5 27% | 6.9 -11% | 6.5 -5% | 2.5 60% | 2.5 60% | 8.78 ? -42% |
| Idle Average * (Watt) | 7.3 | 7.5 -3% | 7.7 -5% | 8.7 -19% | 5.4 26% | 5.1 30% | 13.2 ? -81% |
| Idle Maximum * (Watt) | 12.8 | 8.3 35% | 14.7 -15% | 10.3 20% | 5.8 55% | 5.8 55% | 17.3 ? -35% |
| Load Average * (Watt) | 82 | 80.7 2% | 83.3 -2% | 75.7 8% | 36.9 55% | 49.8 39% | 96 ? -17% |
| Cyberpunk 2077 ultra * (Watt) | 110 | 106.5 3% | 110.9 -1% | 76.2 31% | 48.5 56% | 55 50% | |
| Load Maximum * (Watt) | 126 | 125.1 1% | 126.3 -0% | 100.7 20% | 54.6 57% | 68 46% | 171.9 ? -36% |
| Cyberpunk 2077 ultra external monitor * (Watt) | 104.1 | 110.5 | 73.1 | 44.9 | 55.1 |
* ... smaller is better
| HP ZBook Ultra G1a 14 B30FBES Ryzen AI Max PRO 380, Radeon 8040S, 74.5 Wh | HP ZBook Ultra G1a A3ZQ0ET Ryzen AI Max PRO 390, Radeon 8050S, 74.5 Wh | HP ZBook Ultra G1a 14 Ryzen AI Max+ PRO 395, Radeon 8060S, 74.5 Wh | HP EliteBook X G1a 14 AI Ryzen AI 9 HX PRO 375, Radeon 890M, 74.5 Wh | HP EliteBook X G1i 14 AI Core Ultra 7 268V, Arc 140V, 68 Wh | HP OmniBook Ultra 14 Core Ultra X9 Ultra X9 388H, Arc B390 Panther Lake iGPU, 70 Wh | Average of class Workstation | |
|---|---|---|---|---|---|---|---|
| Battery runtime | 15% | -23% | 56% | 103% | 38% | 4% | |
| WiFi v1.3 (h) | 9.1 | 10.5 15% | 7 -23% | 14.2 56% | 18.5 103% | 12.6 38% | 9.48 ? 4% |
| Load (h) | 1.2 | 1.386 ? | |||||
| Reader / Idle (h) | 21.2 |
Notebookcheck overall rating
Due to the meager memory configuration and the rather underwhelming performance of the Radeon 8040S, it is difficult to recommend the model tested here. Anyone still interested in the otherwise solid ZBook Ultra G1a 14 would be better off opting for the more powerful version with the Radeon 8050S, which in some cases costs hardly any more.
HP ZBook Ultra G1a 14 B30FBES
- 08/21/2026 v8
Florian Glaser
 Total Sustainability Score:
 Possible alternatives at a glance
Image | Model / Review | Price | Weight | Height | Display |
|---|---|---|---|---|---|
1. 81.6%  | HP ZBook Ultra G1a 14 B30FBES AMD Ryzen AI Max PRO 380 ⎘ AMD Radeon 8040S ⎘ 16 GB Memory, 512 GB SSD | Amazon: 1. $1,950.00 HP ZBook Ultra G1a 14" Mobil... 2. $2,824.99 HP ZBook Ultra G1a 14" Touch... 3. $6,899.21 HP ZBook Ultra G1a 14" Touch... List Price: 2000 EUR | 1.6 kg | 18.5 mm | 14.00" 2880x1800 243 PPI OLED |
2. 85.4%  | HP ZBook Ultra G1a A3ZQ0ET AMD Ryzen AI Max PRO 390 ⎘ AMD Radeon 8050S ⎘ 32 GB Memory, 1024 GB SSD | List Price: 2545 Euro | 1.6 kg | 19 mm | 14.00" 1920x1200 162 PPI IPS LED |
3. 87.4%  | HP ZBook Ultra G1a 14 AMD Ryzen AI Max+ PRO 395 ⎘ AMD Radeon 8060S ⎘ 128 GB Memory, 2048 GB SSD | List Price: 4000 USD | 1.6 kg | 18.5 mm | 14.00" 2880x1800 243 PPI OLED |
4. 88.7%  | HP EliteBook X G1a 14 AI AMD Ryzen AI 9 HX PRO 375 ⎘ AMD Radeon 890M ⎘ 32 GB Memory, 1024 GB SSD | List Price: 2200 USD | 1.5 kg | 13.2 mm | 14.00" 1920x1200 162 PPI IPS |
5. 85.1%  | HP EliteBook X G1i 14 AI Intel Core Ultra 7 268V ⎘ Intel Arc Graphics 140V ⎘ 32 GB Memory, 512 GB SSD | List Price: 3300 USD | 1.2 kg | 15 mm | 14.00" 1920x1200 162 PPI IPS |
6. 87.9%  | HP OmniBook Ultra 14 Core Ultra X9 Intel Core Ultra X9 388H ⎘ Intel Arc B390 12 Xe3 Panther Lake iGPU ⎘ 32 GB Memory | List Price: 2800 USD | 1.3 kg | 10.7 mm | 14.00" 2880x1800 243 PPI OLED |
Transparency
The selection of devices to be reviewed is made by our editorial team. The test sample was provided to the author as a loan by the manufacturer or retailer for the purpose of this review. The lender had no influence on this review, nor did the manufacturer receive a copy of this review before publication. There was no obligation to publish this review. As an independent media company, Notebookcheck is not subjected to the authority of manufacturers, retailers or publishers.
This is how Notebookcheck is testing
Every year, Notebookcheck independently reviews hundreds of laptops and smartphones using standardized procedures to ensure that all results are comparable. We have continuously developed our test methods for around 20 years and set industry standards in the process. In our test labs, high-quality measuring equipment is utilized by experienced technicians and editors. These tests involve a multi-stage validation process. Our complex rating system is based on hundreds of well-founded measurements and benchmarks, which maintains objectivity. Further information on our test methods can be found here.
 Add as a preferred source on Google


