Qualcomm Adreno 690 vs Qualcomm Adreno 642L vs Qualcomm Adreno 618
Qualcomm Adreno 690 ► remove from comparison
The Qualcomm Adreno 690 is an integrated graphics card in the Qualcomm Snapdragon 8cx Gen 3 SoC for Windows laptops. According to Qualcomm, the 690 is up to 60% faster than the previous generation. In our tests with the Lenovo ThinkPad X13s, the Adreno 690 was only on par with a low en Intel UHD Graphics iGPU and not well suited for 3D games.
The chip is manufactured in 5nm at Samsung (5LPE) and suited for fanless laptops.
Qualcomm Adreno 642L ► remove from comparison
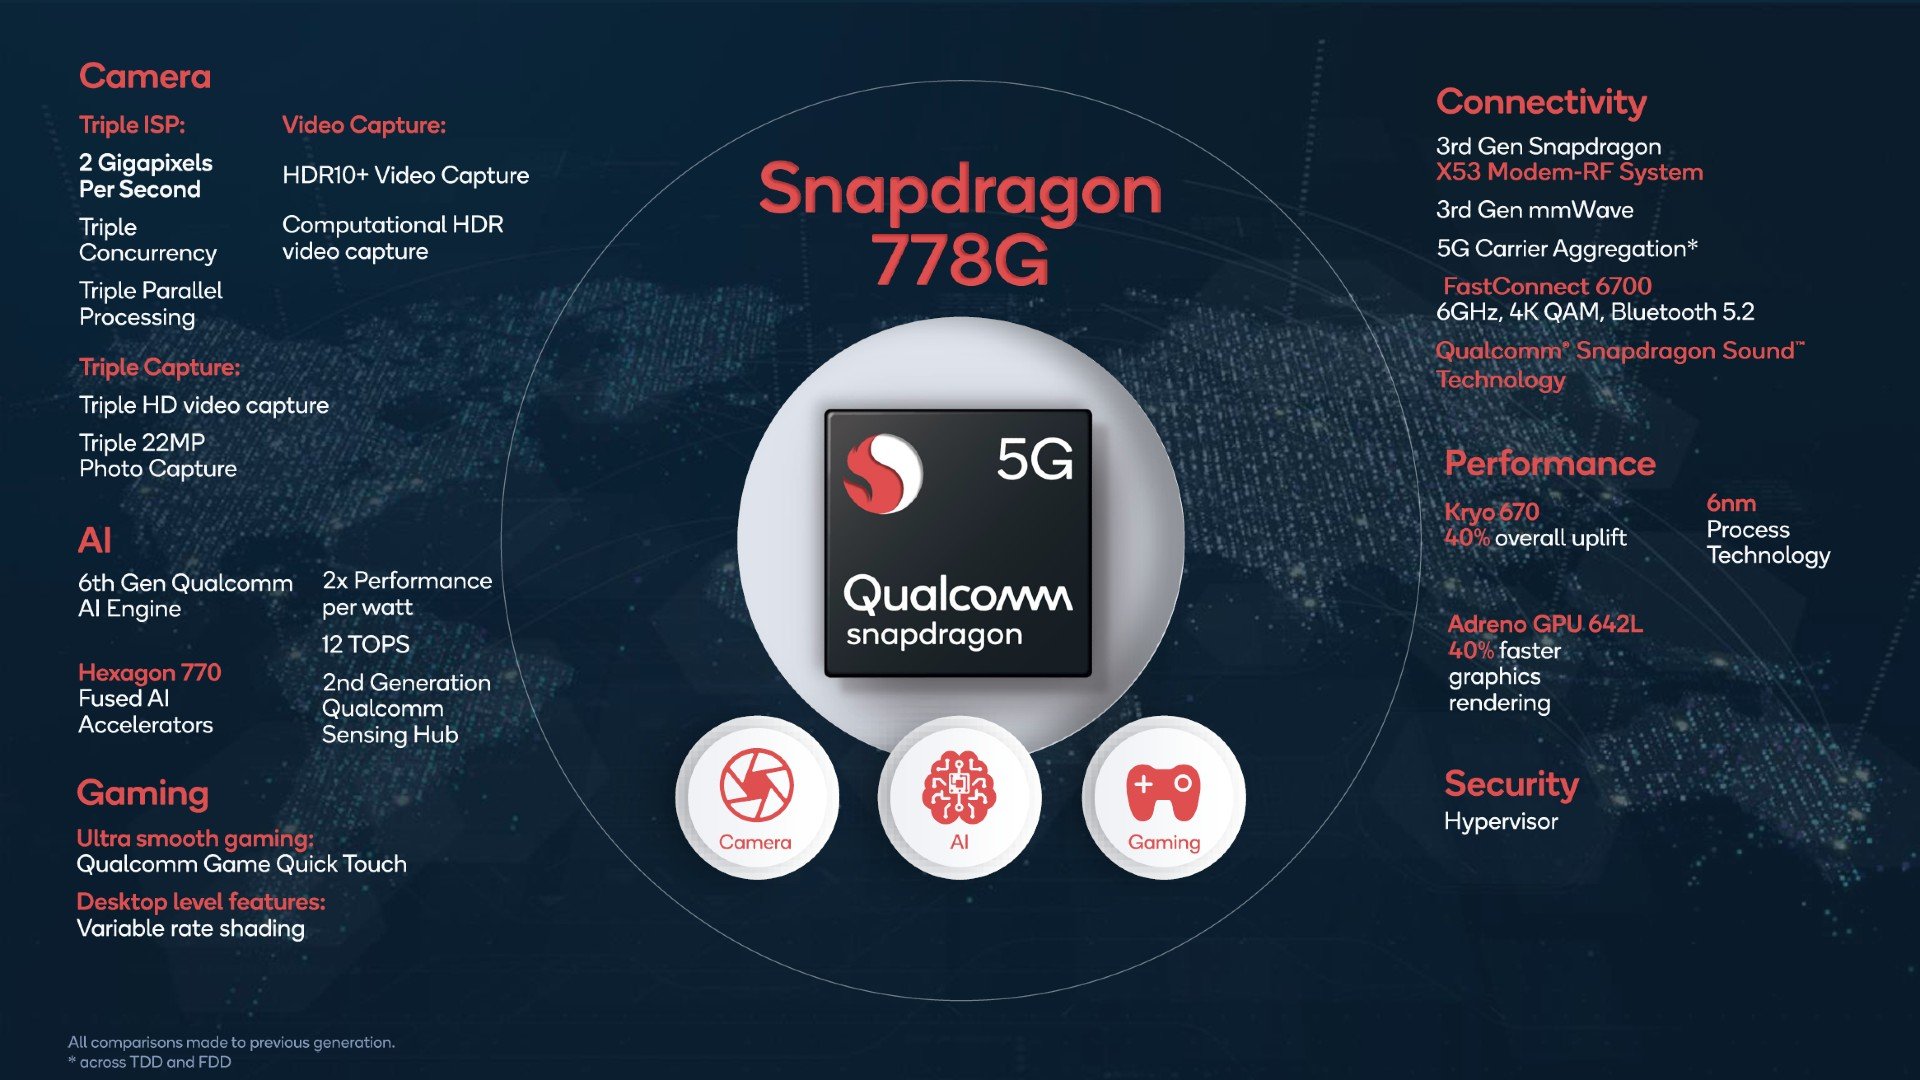
The Qualcomm Adreno 642L is a smartphone and tablet GPU that is integrated within the Qualcomm Snapdragon 778G SoC . The chip will be available from mid 2021 and will be used mainly in upper mid-range Android devices.
According to Qualcomm, the Adreno 642L GPU offers a 40% improved performance over the Adreno 620 (compared to the specified +50% of the 642 in the SD 780G), its predecessor, which is integrated in the Snapdragon 768G SoC. This is also thanks to the fast LPDDR4X-4200 memory support of the SoC.
The Adreno 642L supports OpenCL 2.0 FP, OpenGL ES 3.2 and Vulkan 1.1.
The Snapdragon 778G and therefore also the 642L is manufactured in the modern 6nm UEV process at TSMC that should provide a good power efficiency.
Qualcomm Adreno 618 ► remove from comparison
The Qualcomm Adreno 618 is a mobile graphics card for upper mid-range smartphones and tablets (mostly Android based). It is included in the Qualcomm Snapdragon 730 and 730G SoCs and based on the Adreno 600 architecture (like the Adreno 630, which should be fully compatible in software).
In our benchmarks, the Adreno 618 in the Snapdragon 730 was 14 to 30% faster than the Adreno 616 in the Snapdragon 710. The performance in the 730G should be additional 15% faster, due to higher clock rates.
The GPU supports modern standards like Vulkan 1.0 (according to Wikipedia), OpenGL ES 3.2, OpenCL 2.0 and DirectX 11 (FL 11_1).
Qualcomm Adreno 690 Qualcomm Adreno 642L Qualcomm Adreno 618 Adreno 600 Series Shared Memory yes yes yes API DirectX 12 OpenGL ES 3.2 DirectX 12.1, OpenGL ES 3.2, Vulkan Power Consumption 7 Watt technology 5 nm 6 nm 14 nm Date of Announcement 06.12.2018 07.05.2021 09.04.2019 Features OpenGL ES 3.2, OpenCL 2.0, DirectX 12, Vulkan 1.1 OpenGL ES 3.2, OpenCL 2.0, Direct3D 12 (FL 12_1) Architecture Adreno 600
Benchmarks Performance Rating - 3DMark 11 + Fire Strike + Time Spy - Adreno 690
1.3 pt (4%)
...
...
max:
3DMark - 3DMark Time Spy Score
909 Points (3%)
129 Points (0%)
3DMark - 3DMark Time Spy Graphics
811 Points (2%)
112 Points (0%)
3DMark - 3DMark Ice Storm Unlimited Graphics
min: 88482 avg: 89308 median: 89307.5 (10%) max: 90133 Points
min: 44009 avg: 51701 median: 52650 (6%) max: 56640 Points
3DMark - 3DMark Cloud Gate Score
min: 8602 avg: 9818 median: 9818 (10%) max: 11034 Points
2900 Points (3%)
3DMark - 3DMark Cloud Gate Graphics
min: 13768 avg: 16708 median: 16707.5 (4%) max: 19647 Points
3273 Points (1%)
3DMark - 3DMark Fire Strike Standard Score
min: 2758 avg: 2835 median: 2834.5 (5%) max: 2911 Points
494 Points (1%)
3DMark - 3DMark Fire Strike Standard Graphics
min: 2837 avg: 2933 median: 2932.5 (3%) max: 3028 Points
504 Points (1%)
3DMark - 3DMark Ice Storm Graphics
14652 Points (2%)
3DMark - 3DMark Sling Shot (ES 3.0) Unlimited
min: 6398 avg: 6666 median: 6638 (29%) max: 7281 Points
min: 3002 avg: 3603 median: 3646 (16%) max: 3939 Points
3DMark - 3DMark Sling Shot (ES 3.0) Unlimited Graphics
min: 7199 avg: 7627 median: 7536 (17%) max: 8605 Points
min: 3101 avg: 3734 median: 3753.5 (8%) max: 4256 Points
3DMark - 3DMark Sling Shot Extreme (ES 3.1) Unlimited
min: 5032 avg: 5413 median: 5393.5 (27%) max: 5763 Points
min: 2214 avg: 2624 median: 2626 (13%) max: 2938 Points
3DMark - 3DMark Sling Shot Extreme (ES 3.1) Unlimited Graphics
min: 5103 avg: 5654 median: 5612 (17%) max: 6240 Points
min: 2085 avg: 2495 median: 2471 (7%) max: 2832 Points
3DMark - 3DMark Wild Life Unlimited
min: 2321 avg: 2517 median: 2493.5 (1%) max: 2831 Points
min: 637 avg: 899 median: 934 (0%) max: 1124 Points
3DMark - 3DMark Wild Life Extreme Unlimited
3067 Points (4%)
min: 681 avg: 696 median: 687.5 (1%) max: 768 Points
min: 258 avg: 447 median: 313 (0%) max: 1047 Points
3DMark - 3DMark Night Raid
1921 Points (2%)
3DMark - 3DMark Night Raid Graphics Score
1849 Points (1%)
3DMark 11 - 3DM11 Performance Score
min: 3063 avg: 3085 median: 3077 (4%) max: 3115 Points
min: 624 avg: 639 median: 645 (1%) max: 648 Points
3DMark 11 - 3DM11 Performance GPU
min: 2898 avg: 2930 median: 2912 (3%) max: 2979 Points
min: 572 avg: 590 median: 599 (1%) max: 599 Points
Cinebench R10 Cinebench R10 Shading (32bit) + Qualcomm Adreno 690 Cinebench R10 - Cinebench R10 Shading (32bit)
558 Points (0%)
Cinebench R10 Shading (32bit) + Qualcomm Adreno 618 288 Points (0%)
Cinebench R15 + Qualcomm Adreno 690 Cinebench R15 - Cinebench R15 OpenGL 64 Bit
min: 13.4 avg: 13.7 median: 13.7 (1%) max: 14 fps
Cinebench R15 OpenGL Ref. Match 64 Bit + Qualcomm Adreno 690 Cinebench R15 - Cinebench R15 OpenGL Ref. Match 64 Bit
98 % (98%)
GFXBench - GFXBench 5.0 4K Aztec Ruins High Tier Offscreen
min: 5.9 avg: 6.2 median: 6.1 (2%) max: 6.7 fps
GFXBench - GFXBench 5.0 Aztec Ruins High Tier Offscreen
min: 13 avg: 13.6 median: 13.5 (2%) max: 15 fps
min: 5.4 avg: 7 median: 6.9 (1%) max: 10 fps
GFXBench - GFXBench 5.0 Aztec Ruins Normal Tier Offscreen
min: 34 avg: 36.4 median: 36 (3%) max: 40 fps
min: 15 avg: 18.1 median: 18 (1%) max: 21 fps
GFXBench - GFXBench Car Chase Offscreen
min: 33 avg: 33.7 median: 33 (4%) max: 37 fps
min: 14 avg: 17.1 median: 17 (2%) max: 19 fps
GFXBench 3.1 - GFXBench Manhattan ES 3.1 Offscreen
min: 56 avg: 57.7 median: 57 (1%) max: 64 fps
min: 24 avg: 29.8 median: 30 (1%) max: 33 fps
GFXBench 3.0 - GFXBench 3.0 Manhattan Offscreen
min: 77 avg: 79.1 median: 78 (5%) max: 89 fps
min: 34 avg: 40.9 median: 41 (2%) max: 45 fps
GFXBench (DX / GLBenchmark) 2.7 + Qualcomm Adreno 642L GFXBench (DX / GLBenchmark) 2.7 - GFXBench T-Rex HD Offscreen C24Z16
min: 132 avg: 134.9 median: 133 (1%) max: 148 fps
GFXBench T-Rex HD Offscreen C24Z16 + Qualcomm Adreno 618
min: 67 avg: 83.1 median: 84.5 (1%) max: 91 fps
Antutu v9 - AnTuTu v9 GPU
min: 135972 avg: 157798 median: 157454 (20%) max: 175807 Points
min: 74888 avg: 89032 median: 90943.5 (11%) max: 95350 Points
Basemark GPU 1.2 - Basemark GPU 1.2 Vulkan Official Medium Offscreen 1080
min: 45.96 avg: 49.6 median: 46.9 (0%) max: 54.4 fps
min: 23.89 avg: 26.3 median: 26.3 (0%) max: 28.78 fps
PassMark PerformanceTest Mobile V1 - PerformanceTest Mobile V1 2D Graphics Tests
min: 23666 avg: 31803 median: 30994 (31%) max: 38436 Points
min: 10269 avg: 16045 median: 10289 (10%) max: 27578 Points
PassMark PerformanceTest Mobile V1 - PerformanceTest Mobile V1 3D Graphics Tests
min: 26134 avg: 36660 median: 40236 (70%) max: 43000 Points
min: 3043 avg: 9739 median: 3056 (5%) max: 23117 Points
Power Consumption - Furmark Stress Test Power Consumption - external Monitor *
min: 17 avg: 19.7 median: 19.7 (3%) max: 22.3 Watt
Power Consumption - The Witcher 3 Power Consumption - external Monitor *
15.8 Watt (2%)
Power Consumption - Witcher 3 Power Consumption *
16.4 Watt (4%)
Power Consumption - GFXBench Aztec Ruins Normal Tier Offscreen Power Consumption 150cd *
min: 0 avg: 4.3 median: 4 (2%) max: 9.27 Watt
3.4 Watt (1%)
Average Benchmarks Qualcomm Adreno 690 → 100% n=1 Average Benchmarks Qualcomm Adreno 642L → 22% n=1 Average Benchmarks Qualcomm Adreno 618 → 10% n=1
- Range of benchmark values for this graphics card
- Average benchmark values for this graphics card
* Smaller numbers mean a higher performance
1 This benchmark is not used for the average calculation
Game Benchmarks The following benchmarks stem from our benchmarks of review laptops. The performance depends on the used graphics memory, clock rate, processor, system settings, drivers, and operating systems. So the results don't have to be representative for all laptops with this GPU. For detailed information on the benchmark results, click on the fps number.
Adreno 642L:
59 59 ~ 59 fps
Adreno 642L:
51 60 ~ 56 fps
Adreno 642L:
61 [X] Xiaomi 12 Lite 3.4.0.5930
Qualcomm Snapdragon 778G 5G 1.8GHz
Adreno 642L
min:
57 fps, max:
61 fps
fps
Adreno 642L:
40 40 ~ 40 fps
Adreno 618:
40 40 ~ 40 fps
Adreno 618:
60 [X] Xiaomi Mi 9T 1.18.5
Qualcomm Snapdragon 730 2.2GHz
Adreno 618
min:
1 fps, max:
61 fps
60 ~ 60 fps
Adreno 642L:
30 30 ~ 30 fps
Adreno 642L:
30 30 ~ 30 fps
Adreno 642L:
90 [X] Motorola Edge 30 2.36.0
Qualcomm Snapdragon 778G+ 5G 1.9GHz
Adreno 642L
min:
82 fps, max:
91 fps
fps
Average Gaming Qualcomm Adreno 690 → 100% Average Gaming 30-70 fps → 100%
Average Gaming Qualcomm Adreno 618 → 32% Qualcomm Adreno 690 low med. high ultra QHD 4K F1 22 26 22.5 17 12.6 X-Plane 11.11 14 12 11 Final Fantasy XV Benchmark 19 12.3 7.29 Dota 2 Reborn 58 55 44 37 The Witcher 3 25 16 10 4 GTA V 29.9 < 30 fps < 60 fps < 120 fps ≥ 120 fps 5 1 4 1 4 1 2 1
Qualcomm Adreno 642L low med. high ultra QHD 4K Diablo Immortal 59 56 League of Legends: Wild Rift 61 Armajet 89 PUBG Mobile 58 40 38 Dead Trigger 2 60 Asphalt 9: Legends 30 30 Subway Surfers 90 < 30 fps < 60 fps < 120 fps ≥ 120 fps 3 1 2 3 1 1
Qualcomm Adreno 618 low med. high ultra QHD 4K League of Legends: Wild Rift 114 99 83.5 Call of Duty Mobile 60 58 57 Armajet 56 PUBG Mobile 38 40 30 Arena of Valor 54 55 Shadow Fight 3 60 60 Dota 2 Reborn 27.6 19.7 9.6 8.7 Asphalt 8: Airborne 30 Asphalt 9: Legends 30 30 BioShock Infinite 23 17.6 16.9 Diablo III 20.7 20 17.2 12 < 30 fps < 60 fps < 120 fps ≥ 120 fps 3 3 3 3 1 3 5 2 2 2 1
For more games that might be playable and a list of all games and graphics cards visit our Gaming List
v1.26
log 03. 03:14:00
#0 checking url part for id 11411 +0s ... 0s
#1 checking url part for id 10945 +0s ... 0s
#2 checking url part for id 9900 +0s ... 0s
#3 not redirecting to Ajax server +0s ... 0s
#4 did not recreate cache, as it is less than 5 days old! Created at Wed, 01 May 2024 05:36:19 +0200 +0.001s ... 0.001s
#5 composed specs +0.15s ... 0.15s
#6 did output specs +0s ... 0.15s
#7 start showIntegratedCPUs +0s ... 0.15s
#8 getting avg benchmarks for device 11411 +0.079s ... 0.229s
#9 got single benchmarks 11411 +0.011s ... 0.24s
#10 getting avg benchmarks for device 10945 +0.002s ... 0.241s
#11 got single benchmarks 10945 +0.064s ... 0.306s
#12 getting avg benchmarks for device 9900 +0.002s ... 0.307s
#13 got single benchmarks 9900 +0.074s ... 0.382s
#14 got avg benchmarks for devices +0s ... 0.382s
#15 min, max, avg, median took s +0.254s ... 0.636s
#16 before gaming benchmark output +0s ... 0.636s
#17 Got 169 rows for game benchmarks. +0.045s ... 0.681s
#18 composed SQL query for gamebenchmarks +0s ... 0.681s
#19 got data and put it in $dataArray +0.012s ... 0.693s
#20 benchmarks composed for output. +0.045s ... 0.738s
#21 calculated avg scores. +0s ... 0.738s
#22 return log +0.002s ... 0.741s
Please share our article, every link counts!
Redaktion, 2017-09- 8 (Update: 2023-07- 1)
 Deutsch
 English
 Español
 Français
 Italiano
 Nederlands
 Polski
 Português
 Русский
 Türkçe
 Svenska
 Chinese
 Magyar