Notebookcheck Logo

Intel Arc A350M vs NVIDIA RTX 3000 Ada Generation Laptop GPU vs Intel Arc A550M

Intel Arc A350M

► remove from comparison Intel A350M

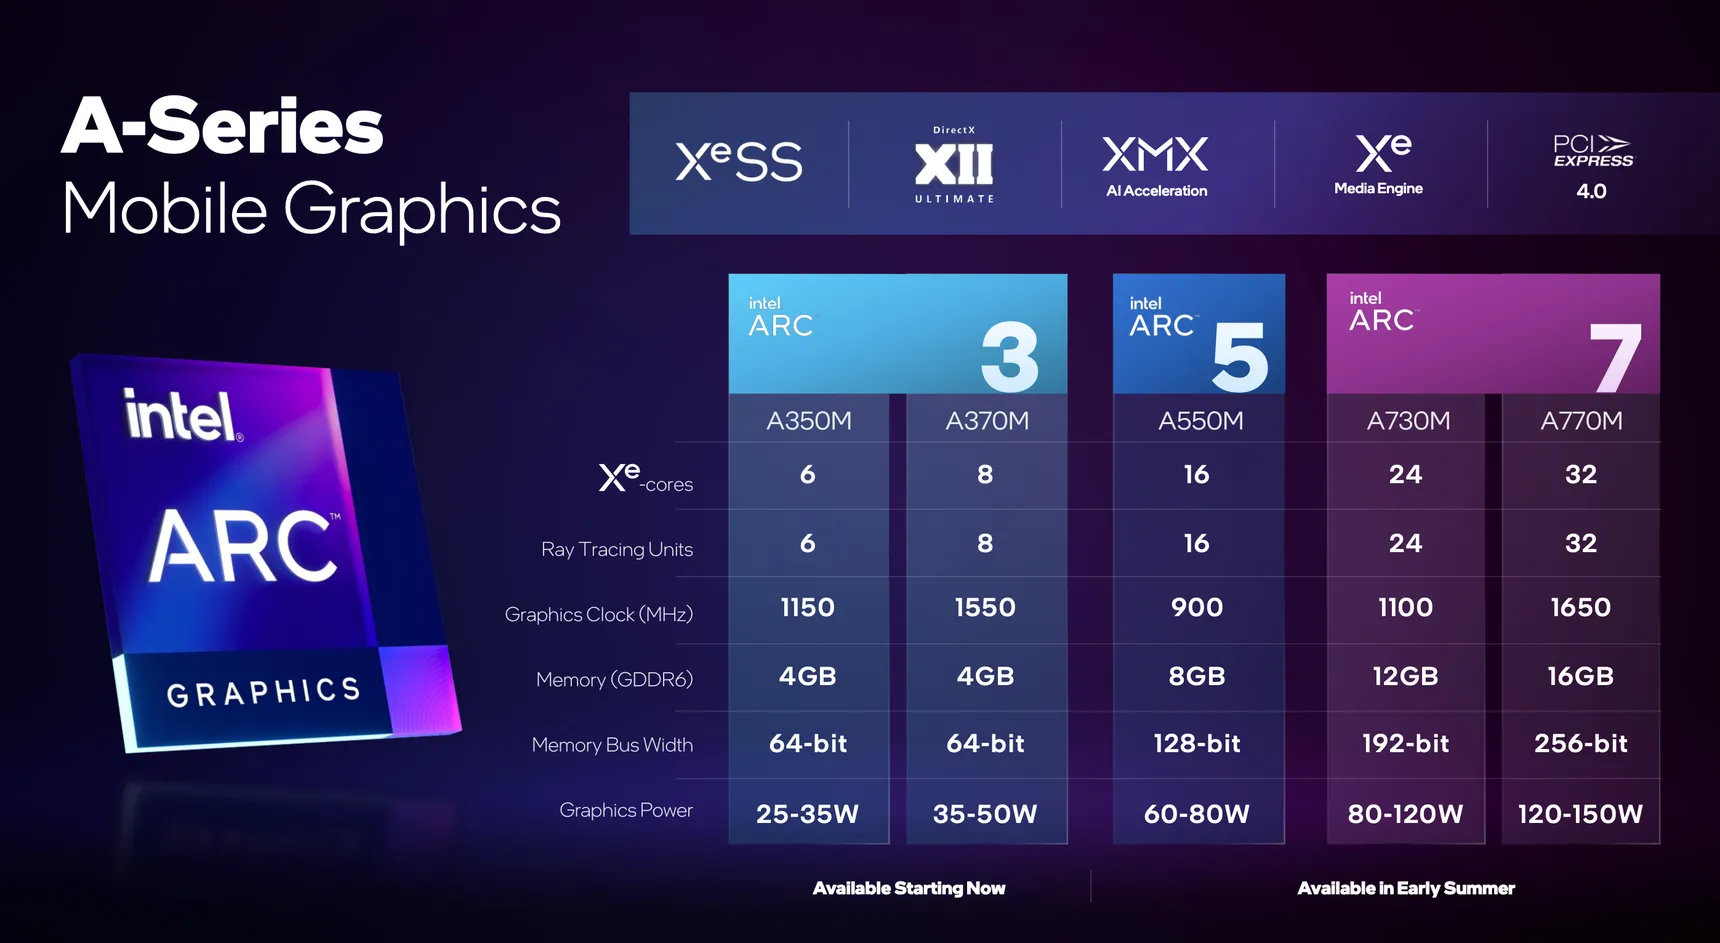
The Intel Arc A350M is a dedicated mobile entry level graphics card for laptops based on Xe HPG microarchitecture. It uses the ACM-G11 chip and offers 6 of the 8 Xe-cores (95 ALUs), 6 of the 8 ray tracing units and a 64-bit memory bus for 4 GB GDDR6 graphics memory. The chip integrates 7.2 billion transistors and the die measures 157 mm2.

The chip also integrates two media engines for VP9, AVC, HEVC, and AV1 8k en- and decoding. The 4 display pipes support up to 4x 4k120 HDR via DMI 2.0B or DisplayPort 2.0 10G. 

The A350M is produced in 6nm at TSMC (N6 process) and supports dynamic power share (using Deep Link) with 12th gen Intel CPUs (Alder Lake).

NVIDIA RTX 3000 Ada Generation Laptop GPU

► remove from comparison NVIDIA NVIDIA RTX 3000 Ada Generation Laptop GPU

The Nvidia RTX 3000 Ada Generation, not to be confused with the A3000, P3000 or RTX 3000 Turing Generation, is a higher-end professional graphics card for use in laptops that sports 4,608 CUDA cores and 8 GB of ECC GDDR6 VRAM (error correction can be turned off if desired). It would be fair to say that this is a GeForce RTX 4070 Laptop in disguise; consequently, the graphics card is fast enough for many games at 1440p with quality set to High. Brought into existence in 2023, the RTX 3000 leverages TSMC's 5 nm process and Nvidia's Ada Lovelace architecture to achieve very decent performance combined with moderate power consumption. The Nvidia-recommended TGP range for the card is very wide at 35 W to 140 W leading to bizarre performance differences between different systems powered by what is supposed to be the same product.

Quadro series graphics cards ship with much different BIOS and drivers than GeForce cards and are targeted at professional use rather than gaming. Commercial product design, large-scale calculations, simulation, data mining, 24 x 7 operation, certified drivers - if any of this sounds familiar, then a Quadro card will make you happy.

Architecture and Features

Ada Lovelace brings a range of improvements over older graphics cards utilizing the outgoing Ampere architecture. It's not just a better manufacturing process and a higher number of CUDA cores that we have here (up to 16,384 versus 10,752); under-the-hood refinements are plentiful, including an immensely larger L2 cache, an optimized ray tracing routine (a smarter technique is used to determine what is transparent and what isn't), and other changes. Naturally, these graphics cards can both encode and decode some of the most widely used video codecs, AVC, HEVC and AV1 included; they also support a host of Nvidia technologies, including Optimus and DLSS 3, and they can certainly be used for various AI tasks.

The RTX 3000 Ada features 36 RT cores of the 3rd generation, 144 Tensor cores of the 4th generation and 4,608 CUDA cores, making it ~11% inferior to the RTX 3500 Ada Generation as long as we disregard clock speed differences. (The 3500 also has more VRAM). The RTX 3000 comes with 8 GB of 128-bit wide ECC GDDR6 memory for throughput of ~256 GB/s. The fact that error correction is present here proves that the graphics adapter is indeed targeted at professional users, and it can be disabled if desired.

Just like Ampere-based cards, the RTX 3000 makes use of the PCI-Express 4 protocol. 8K SUHD monitors are supported, however, DP 1.4a video outputs can potentially prove to be a bottleneck down the line.

Performance

Having reviewed the Dell Precision 5480 and its 50 W RTX 3000 Ada in September 2023, we can firmly say the graphics card is in the same league as the RTX 4060 Laptop and the RTX 4050 Laptop, despite sharing most of its specifications with the RTX 4070 Laptop. 48 seconds in the Blender 3.3 Classroom CUDA test and a 3DMark 11 Performance GPU score of less than 30,000 points are nothing to write home about. The GPU's gaming talents are not mind-blowing, either, although it is certainly capable enough for 1080p gaming.

Nvidia's marketing materials mention "up to 20 TFLOPS" of performance, a very noticeable improvement over 14.5 TFLOPS delivered by the RTX 2000 Ada Generation. Your mileage may vary depending on how competent the cooling solution of your laptop is and how high the TGP power target of the graphics card is. A 100 W RTX 3000 Ada might be able to come close to the average RTX 4070 Laptop.

One other thing worth mentioning is that enabling error correction appears to reduce the amount of video memory that is available to applications and games by up to a gigabyte.

Power consumption

Nvidia no longer divides its laptop graphics cards into Max-Q and non-max-Q models. Instead, laptop makers are free to set the TGP according to their needs, and the range can sometimes be shockingly wide. This is especially the case for the RTX 3000, as the lowest value recommended for it sits at just 35 W while the highest is 300% higher at 140 W (this most likely includes Dynamic Boost). This is the kind of delta that we've be seeing on consumer-grade laptops featuring the latest GeForce RTX cards.

Last but not the least, the improved 5 nm process (TSMC 4N) the RTX 3000 Ada is built with makes for very decent energy efficiency, as of mid 2023.

Intel Arc A550M

► remove from comparison Intel A550M

The Intel Arc A550M (device ID 5692) is a dedicated mobile lower- mid-range graphics card for laptops based on Xe HPG microarchitecture. It uses the ACM-G10 chip and offers 16 of the 32 Xe-cores (256 ALUs), 16 ray tracing units and a 128-bit memory bus for 8 GB GDDR6 graphics memory. The cores can clock from 300 MHz (low frequency mode) to 900 MHz (high frequency) or in short bursts 2050 MHz (short bursts / Turbo). The chip integrates 21.7 billion transistors, uses a BGA2660 package and the die measures 406 mm2.

The performance of the Arc A550M should be between the Radeon RX 6500M and 6600M and therefore well suited even for demanding games in medium to high detail settings and 1080p. The slower Arc A370M is based on the smaller ACM-G11 chip and should be significantly slower.

The chip also integrates two media engines for VP9, AVC, HEVC, and AV1 8k en- and decoding. The 4 display pipes support up to 4x 4k120 HDR via DMI 2.0B or DisplayPort 2.0 10G. 

The A550M is produced in 6nm at TSMC (N6 process) and supports dynamic power share (using Deep Link) with 12th gen Intel CPUs (Alder Lake).

Intel Arc A350MNVIDIA RTX 3000 Ada Generation Laptop GPUIntel Arc A550M
Arc Series
Arc B580 2560 @ 2.67 - 2.67 GHz192 Bit @ 19000 MHz
Arc A770 4096 @ 2.1 - 2.4 GHz256 Bit @ 16000 MHz
Arc A750 3584 @ 2.05 - 2.4 GHz256 Bit @ 16000 MHz
Arc A580 3072 @ 1.7 - 2 GHz256 Bit @ 16000 MHz
A770M 4096 @ 1.65 GHz256 Bit @ 16000 MHz
A730M 3072 @ 1.1 GHz192 Bit @ 14000 MHz
A570M 16 @ 0.9 - 1.3 GHz128 Bit @ 14000 MHz
A550M 16 @ 0.9 - 2.01 GHz128 Bit @ 14000 MHz
A530M 12 @ 0.9 - 1.3 GHz128 Bit @ 14000 MHz
A370M 8 @ 1.55 GHz64 Bit @ 14000 MHz
Arc A380 1024 @ 2 GHz96 Bit @ 15500 MHz
A310 6 @ 2 GHz64 Bit @ 15500 MHz
A350M 6 @ 1.15 GHz64 Bit @ 14000 MHz
NVIDIA RTX 5000 Ada Generation Laptop GPU 9728 @ 0.93 - 1.68 GHz256 Bit @ 20000 MHz
NVIDIA RTX 4000 Ada Generation Laptop GPU 7424 192 Bit @ 16000 MHz
NVIDIA RTX 3500 Ada Generation Laptop GPU 5120 192 Bit @ 16000 MHz
NVIDIA RTX 3000 Ada Generation Laptop GPU 4608 128 Bit @ 16000 MHz
NVIDIA RTX 2000 Ada Generation Laptop GPU 3072 128 Bit @ 16000 MHz
Nvidia RTX 1000 Ada Generation Laptop GPU 2560 96 Bit @ 16000 MHz
Nvidia RTX 500 Ada Generation Laptop GPU 2048 64 Bit @ 12000 MHz
Arc B580 2560 @ 2.67 - 2.67 GHz192 Bit @ 19000 MHz
Arc A770 4096 @ 2.1 - 2.4 GHz256 Bit @ 16000 MHz
Arc A750 3584 @ 2.05 - 2.4 GHz256 Bit @ 16000 MHz
Arc A580 3072 @ 1.7 - 2 GHz256 Bit @ 16000 MHz
A770M 4096 @ 1.65 GHz256 Bit @ 16000 MHz
A730M 3072 @ 1.1 GHz192 Bit @ 14000 MHz
A570M 16 @ 0.9 - 1.3 GHz128 Bit @ 14000 MHz
A550M 16 @ 0.9 - 2.01 GHz128 Bit @ 14000 MHz
A530M 12 @ 0.9 - 1.3 GHz128 Bit @ 14000 MHz
A370M 8 @ 1.55 GHz64 Bit @ 14000 MHz
Arc A380 1024 @ 2 GHz96 Bit @ 15500 MHz
A310 6 @ 2 GHz64 Bit @ 15500 MHz
A350M 6 @ 1.15 GHz64 Bit @ 14000 MHz
CodenameAlchemistAlchemist
ArchitectureXe HPGAda LovelaceXe HPG
Pipelines6 - unified4608 - unified16 - unified
Raytracing Cores63616
Core Speed1150 MHz900 - 2005 (Boost) MHz
CacheL1: 1.1 MB, L2: 4 MBL2: 32 MBL1: 3 MB, L2: 16 MB
Memory Speed14000 MHz16000 effective = 2000 MHz14000 effective = 1750 MHz
Memory Bus Width64 Bit128 Bit128 Bit
Memory TypeGDDR6GDDR6GDDR6
Max. Amount of Memory4 GB8 GB8 GB
Shared Memorynonono
Memory Bandwidth112 GB/s256 GB/s224 GB/s
APIDirectX 12_2, OpenGL 4.6, Vulkan 1.3DirectX 12 Ultimate, Shader 6.7, OpenGL 4.6, OpenCL 3.0, Vulkan 1.3DirectX 12_2, Shader 6.6, OpenGL 4.6, OpenCL 3.0, Vulkan 1.3
Power Consumption35 Watt (25 - 35 Watt TGP)115 Watt (35 - 115 Watt TGP)80 Watt (60 - 80 Watt TGP)
Transistors7.2 Billion21.7 Billion
Die Size 157 mm² 406 mm²
technology6 nm5 nm6 nm
PCIe4 8x4.0 x164 16x
Displays4 Displays (max.), HDMI 2.0b, DisplayPort 2.0 10G Ready4 Displays (max.), HDMI 2.1, DisplayPort 1.4a4 Displays (max.), HDMI 2.0b, DisplayPort 2.0 10G Ready
Date of Announcement30.03.2022 21.03.2023 30.03.2022
Link to Manufacturer Pageark.intel.comimages.nvidia.comark.intel.com
TMUs144128
ROPs4864
Tensor / AI Cores144
Notebook Sizelarge
PredecessorQuadro RTX 3000 (Laptop)

Benchmarks

3DMark - 3DMark Time Spy Score
min: 2976     avg: 3289     median: 3397 (9%)     max: 3494 Points
min: 8254     avg: 9034     median: 8811 (23%)     max: 10036 Points
6320 Points (17%)
3DMark - 3DMark Time Spy Graphics
min: 2731     avg: 2993     median: 3050 (6%)     max: 3197 Points
min: 7959     avg: 8689     median: 8351 (17%)     max: 9757 Points
5830 Points (12%)
3DMark - 3DMark Cloud Gate Score
100%
1 A350M +
min: 23965     avg: 25147     median: 25146.5 (24%)     max: 26328 Points
min: 34703     avg: 40239     median: 40238.5 (38%)     max: 45774 Points
3DMark - 3DMark Cloud Gate Graphics
100%
1 A350M +
min: 28623     avg: 36315     median: 36314.5 (9%)     max: 44006 Points
min: 58392     avg: 70502     median: 70502 (17%)     max: 82612 Points
3DMark - 3DMark Fire Strike Standard Score
min: 5961     avg: 6267     median: 6009 (9%)     max: 6832 Points
min: 18368     avg: 19637     median: 18847 (28%)     max: 21697 Points
12900 Points (19%)
3DMark - 3DMark Fire Strike Standard Graphics
min: 6800     avg: 7088     median: 7147 (7%)     max: 7318 Points
min: 20233     avg: 21691     median: 20908 (19%)     max: 23931 Points
14350 Points (13%)
3DMark - 3DMark Wild Life Unlimited
100%
1 A350M +
19449 Points (10%)
3DMark - 3DMark Wild Life Extreme Unlimited
100%
1 A350M +
min: 5189     avg: 5300     median: 5299.5 (6%)     max: 5410 Points
3DMark 11 - 3DM11 Performance Score
100%
1 A350M +
min: 10123     avg: 10766     median: 10766 (13%)     max: 11409 Points
min: 25317     avg: 27267     median: 27083 (33%)     max: 29401 Points
3DMark 11 - 3DM11 Performance GPU
100%
1 A350M +
min: 10687     avg: 10730     median: 10730 (8%)     max: 10773 Points
min: 28283     avg: 30499     median: 29411 (23%)     max: 33802 Points
3DMark Vantage
3DM Vant. Perf. total + Intel Arc A350M
3DMark Vantage - 3DM Vant. Perf. total
100%
1 A350M +
31023 Points (9%)
3DM Vant. Perf. GPU no PhysX + Intel Arc A350M
3DMark Vantage - 3DM Vant. Perf. GPU no PhysX
100%
1 A350M +
28186 Points (15%)
3DMark 06 3DMark 06 - Standard 1280x1024 + Intel Arc A350M
3DMark 06
100%
1 A350M +
31625 Points (41%)
Unigine Valley 1.0 - Unigine Valley 1.0 DX
100%
1 A350M +
19.5 fps (6%)
Blender - Blender 3.3 Classroom CUDA *
min: 40     avg: 44     median: 44 (7%)     max: 48 Seconds
Blender - Blender 3.3 Classroom OPTIX *
min: 23     avg: 26     median: 27 (10%)     max: 28 Seconds
SPECviewperf 12
specvp12 sw-03 + NVIDIA RTX 3000 Ada Generation Laptop GPU
SPECviewperf 12 - specvp12 sw-03
min: 159.9     avg: 176.8     median: 183.9 (46%)     max: 186.49 fps
specvp12 snx-02 + NVIDIA RTX 3000 Ada Generation Laptop GPU
SPECviewperf 12 - specvp12 snx-02
min: 163.39     avg: 173.7     median: 174.9 (26%)     max: 182.76 fps
specvp12 showcase-01 + NVIDIA RTX 3000 Ada Generation Laptop GPU
SPECviewperf 12 - specvp12 showcase-01
min: 88.34     avg: 94.2     median: 92 (16%)     max: 102.41 fps
specvp12 mediacal-01 + NVIDIA RTX 3000 Ada Generation Laptop GPU
SPECviewperf 12 - specvp12 mediacal-01
84.8 fps (22%)
specvp12 maya-04 + NVIDIA RTX 3000 Ada Generation Laptop GPU
SPECviewperf 12 - specvp12 maya-04
min: 133.1     avg: 143.9     median: 143 (39%)     max: 155.73 fps
specvp12 energy-01 + NVIDIA RTX 3000 Ada Generation Laptop GPU
SPECviewperf 12 - specvp12 energy-01
19 fps (17%)
specvp12 creo-01 + NVIDIA RTX 3000 Ada Generation Laptop GPU
SPECviewperf 12 - specvp12 creo-01
min: 123.21     avg: 144.6     median: 150.3 (60%)     max: 160.25 fps
specvp12 catia-04 + NVIDIA RTX 3000 Ada Generation Laptop GPU
SPECviewperf 12 - specvp12 catia-04
min: 174.33     avg: 197.6     median: 198.5 (33%)     max: 220.09 fps
SPECviewperf 13 specvp13 sw-04 + Intel Arc A350M
SPECviewperf 13 - specvp13 sw-04
100%
1 A350M +
57.6 fps (15%)
specvp13 sw-04 + NVIDIA RTX 3000 Ada Generation Laptop GPU
min: 162.23     avg: 179.5     median: 179.2 (48%)     max: 197.11 fps
specvp13 snx-03 + Intel Arc A350M
SPECviewperf 13 - specvp13 snx-03
100%
1 A350M +
3.2 fps (0%)
specvp13 snx-03 + NVIDIA RTX 3000 Ada Generation Laptop GPU
min: 296.88     avg: 318.8     median: 312.1 (35%)     max: 347.37 fps
specvp13 showcase-02 + Intel Arc A350M
SPECviewperf 13 - specvp13 showcase-02
100%
1 A350M +
27.7 fps (5%)
specvp13 showcase-02 + NVIDIA RTX 3000 Ada Generation Laptop GPU
min: 88.94     avg: 92.9     median: 90.7 (15%)     max: 99.04 fps
specvp13 medical-02 + Intel Arc A350M
SPECviewperf 13 - specvp13 medical-02
100%
1 A350M +
19.9 fps (3%)
specvp13 medical-02 + NVIDIA RTX 3000 Ada Generation Laptop GPU
min: 111.4     avg: 153.3     median: 168.5 (29%)     max: 179.9 fps
specvp13 maya-05 + Intel Arc A350M
SPECviewperf 13 - specvp13 maya-05
100%
1 A350M +
63.6 fps (7%)
specvp13 maya-05 + NVIDIA RTX 3000 Ada Generation Laptop GPU
min: 260.1     avg: 281.8     median: 274.5 (31%)     max: 310.61 fps
specvp13 energy-02 + Intel Arc A350M
SPECviewperf 13 - specvp13 energy-02
100%
1 A350M +
11.8 fps (4%)
specvp13 energy-02 + NVIDIA RTX 3000 Ada Generation Laptop GPU
min: 56.97     avg: 60.1     median: 58.3 (19%)     max: 64.93 fps
specvp13 creo-02 + Intel Arc A350M
SPECviewperf 13 - specvp13 creo-02
100%
1 A350M +
49.1 fps (7%)
specvp13 creo-02 + NVIDIA RTX 3000 Ada Generation Laptop GPU
min: 245.25     avg: 267.7     median: 255.2 (37%)     max: 302.58 fps
specvp13 catia-05 + Intel Arc A350M
SPECviewperf 13 - specvp13 catia-05
100%
1 A350M +
77 fps (9%)
specvp13 catia-05 + NVIDIA RTX 3000 Ada Generation Laptop GPU
min: 273.29     avg: 308.7     median: 310.7 (35%)     max: 342.09 fps
specvp13 3dsmax-06 + Intel Arc A350M
SPECviewperf 13 - specvp13 3dsmax-06
100%
1 A350M +
55.7 fps (9%)
specvp13 3dsmax-06 + NVIDIA RTX 3000 Ada Generation Laptop GPU
min: 189.32     avg: 199     median: 191.7 (30%)     max: 215.94 fps
SPECviewperf 2020 specvp2020 solidworks-05 1080p + Intel Arc A350M
SPECviewperf 2020 - specvp2020 solidworks-05 1080p
100%
1 A350M +
17.2 fps (3%)
specvp2020 solidworks-05 1080p + NVIDIA RTX 3000 Ada Generation Laptop GPU
196.5 fps (36%)
specvp2020 snx-04 1080p + Intel Arc A350M
SPECviewperf 2020 - specvp2020 snx-04 1080p
100%
1 A350M +
3.2 fps (0%)
specvp2020 snx-04 1080p + NVIDIA RTX 3000 Ada Generation Laptop GPU
min: 285.92     avg: 297     median: 290.6 (35%)     max: 314.39 fps
specvp2020 medical-03 1080p + Intel Arc A350M
SPECviewperf 2020 - specvp2020 medical-03 1080p
100%
1 A350M +
9.1 fps (3%)
specvp2020 medical-03 1080p + NVIDIA RTX 3000 Ada Generation Laptop GPU
min: 55.19     avg: 80.8     median: 90.4 (25%)     max: 96.95 fps
specvp2020 maya-06 1080p + Intel Arc A350M
SPECviewperf 2020 - specvp2020 maya-06 1080p
100%
1 A350M +
72 fps (8%)
specvp2020 maya-06 1080p + NVIDIA RTX 3000 Ada Generation Laptop GPU
min: 310.86     avg: 312.5     median: 312.3 (33%)     max: 314.35 fps
specvp2020 energy-03 1080p + Intel Arc A350M
SPECviewperf 2020 - specvp2020 energy-03 1080p
100%
1 A350M +
12 fps (2%)
specvp2020 energy-03 1080p + NVIDIA RTX 3000 Ada Generation Laptop GPU
min: 49.86     avg: 55     median: 57.2 (9%)     max: 57.85 fps
specvp2020 creo-03 1080p + Intel Arc A350M
SPECviewperf 2020 - specvp2020 creo-03 1080p
100%
1 A350M +
30.8 fps (11%)
specvp2020 creo-03 1080p + NVIDIA RTX 3000 Ada Generation Laptop GPU
min: 113.79     avg: 129.1     median: 136.7 (47%)     max: 136.89 fps
specvp2020 catia-06 1080p + Intel Arc A350M
SPECviewperf 2020 - specvp2020 catia-06 1080p
100%
1 A350M +
17.4 fps (8%)
specvp2020 catia-06 1080p + NVIDIA RTX 3000 Ada Generation Laptop GPU
min: 78     avg: 80.2     median: 78.9 (39%)     max: 83.77 fps
specvp2020 3dsmax-07 1080p + Intel Arc A350M
SPECviewperf 2020 - specvp2020 3dsmax-07 1080p
100%
1 A350M +
20.9 fps (6%)
specvp2020 3dsmax-07 1080p + NVIDIA RTX 3000 Ada Generation Laptop GPU
min: 75.05     avg: 80.7     median: 80.9 (21%)     max: 86.19 fps
specvp2020 solidworks-07 4k + NVIDIA RTX 3000 Ada Generation Laptop GPU
SPECviewperf 2020 - specvp2020 solidworks-07 4k
min: 70.11     avg: 74     median: 74 (22%)     max: 77.86 fps
specvp2020 solidworks-07 1080p + NVIDIA RTX 3000 Ada Generation Laptop GPU
SPECviewperf 2020 - specvp2020 solidworks-07 1080p
min: 177.22     avg: 185.4     median: 185.4 (39%)     max: 193.56 fps
specvp2020 solidworks-05 4k + NVIDIA RTX 3000 Ada Generation Laptop GPU
SPECviewperf 2020 - specvp2020 solidworks-05 4k
77.2 fps (19%)
specvp2020 snx-04 4k + NVIDIA RTX 3000 Ada Generation Laptop GPU
SPECviewperf 2020 - specvp2020 snx-04 4k
min: 183.57     avg: 188.3     median: 189.8 (19%)     max: 191.49 fps
specvp2020 medical-03 4k + NVIDIA RTX 3000 Ada Generation Laptop GPU
SPECviewperf 2020 - specvp2020 medical-03 4k
min: 19.91     avg: 30.1     median: 33.8 (22%)     max: 36.49 fps
specvp2020 maya-06 4k + NVIDIA RTX 3000 Ada Generation Laptop GPU
SPECviewperf 2020 - specvp2020 maya-06 4k
min: 131.97     avg: 137.2     median: 138.8 (20%)     max: 140.78 fps
specvp2020 energy-03 4k + NVIDIA RTX 3000 Ada Generation Laptop GPU
SPECviewperf 2020 - specvp2020 energy-03 4k
min: 20     avg: 37.3     median: 41.2 (6%)     max: 50.62 fps
specvp2020 creo-03 4k + NVIDIA RTX 3000 Ada Generation Laptop GPU
SPECviewperf 2020 - specvp2020 creo-03 4k
min: 51.74     avg: 60.8     median: 55.8 (25%)     max: 74.79 fps
specvp2020 catia-06 4k + NVIDIA RTX 3000 Ada Generation Laptop GPU
SPECviewperf 2020 - specvp2020 catia-06 4k
min: 44.03     avg: 44.7     median: 44.9 (29%)     max: 45.26 fps
specvp2020 3dsmax-07 4k + NVIDIA RTX 3000 Ada Generation Laptop GPU
SPECviewperf 2020 - specvp2020 3dsmax-07 4k
min: 47.43     avg: 50.7     median: 51.6 (17%)     max: 53 fps
Cinebench R15
Cinebench R15 OpenGL 64 Bit + Intel Arc A350M
Cinebench R15 - Cinebench R15 OpenGL 64 Bit
100%
1 A350M +
min: 138.13     avg: 149.3     median: 149.3 (9%)     max: 160.4 fps
Cinebench R15 OpenGL 64 Bit + NVIDIA RTX 3000 Ada Generation Laptop GPU
min: 235     avg: 260     median: 257 (15%)     max: 288 fps
Cinebench R15 OpenGL Ref. Match 64 Bit + Intel Arc A350M
Cinebench R15 - Cinebench R15 OpenGL Ref. Match 64 Bit
100%
1 A350M +
97.8 % (98%)
Cinebench R15 OpenGL Ref. Match 64 Bit + NVIDIA RTX 3000 Ada Generation Laptop GPU
99.6 % (100%)
GFXBench - GFXBench 5.0 4K Aztec Ruins High Tier Offscreen
100%
1 A350M +
29.6 fps (11%)
GFXBench - GFXBench 5.0 Aztec Ruins High Tier Offscreen
100%
1 A350M +
62.8 fps (11%)
GFXBench - GFXBench 5.0 Aztec Ruins Normal Tier Offscreen
100%
1 A350M +
160 fps (12%)
GFXBench - GFXBench Car Chase Offscreen
100%
1 A350M +
125 fps (12%)
GFXBench 3.1 - GFXBench Manhattan ES 3.1 Offscreen
100%
1 A350M +
194 fps (4%)
GFXBench 3.0 - GFXBench 3.0 Manhattan Offscreen
100%
1 A350M +
309 fps (13%)
GFXBench (DX / GLBenchmark) 2.7
GFXBench T-Rex HD Offscreen C24Z16 + Intel Arc A350M
GFXBench (DX / GLBenchmark) 2.7 - GFXBench T-Rex HD Offscreen C24Z16
100%
1 A350M +
640 fps (5%)
Basemark GPU 1.2 - Basemark GPU 1.2 Vulkan Official Medium Offscreen 1080
min: 104.6     avg: 637     median: 900 (22%)     max: 905 fps
Basemark GPU 1.2 - Basemark GPU 1.2 Vulkan Official High Offscreen 2160
3.6 fps (1%)
Geekbench 6.4 - Geekbench 6.4 GPU OpenCL
min: 91678     avg: 93566     median: 92413 (24%)     max: 96607 Points
Geekbench 6.4 - Geekbench 6.4 GPU Vulkan
min: 85312     avg: 88785     median: 88420 (22%)     max: 92623 Points
LuxMark v2.0 64Bit - LuxMark v2.0 Room GPU
100%
1 A350M +
1062 Samples/s (4%)
LuxMark v2.0 64Bit - LuxMark v2.0 Sala GPU
100%
1 A350M +
2796 Samples/s (5%)
ComputeMark v2.1 - ComputeMark v2.1 Result
100%
1 A350M +
4447 Points (4%)
Power Consumption - Furmark Stress Test Power Consumption - external Monitor *
100%
1 A350M +
min: 60.5     avg: 69.4     median: 69.4 (9%)     max: 78.3 Watt
min: 79.8     avg: 97.2     median: 97.2 (13%)     max: 114.6 Watt
Power Consumption - The Witcher 3 Power Consumption - external Monitor *
100%
1 A350M +
min: 53.2     avg: 65.1     median: 65.1 (9%)     max: 77 Watt
86.5 Watt (12%)
Power Consumption - Witcher 3 Power Consumption *
100%
1 A350M +
min: 56.7     avg: 71.2     median: 71.2 (16%)     max: 85.6 Watt
min: 90.4     avg: 91.8     median: 91.8 (20%)     max: 93.1 Watt
Power Consumption - Power Efficiency - Witcher 3 ultra
100%
1 A350M +
min: 0.2395     avg: 0.3     median: 0.3 (25%)     max: 0.3245 fps per Watt
min: 0.854     avg: 0.9     median: 0.9 (78%)     max: 0.871 fps per Watt
Power Consumption - Power Efficiency - Witcher 3 ultra external Monitor
100%
1 A350M +
0.3 fps per Watt (29%)
0.9 fps per Watt (75%)
Power Consumption - Cyberpunk 2077 Power Consumption 150cd *
125.4 Watt (37%)
Power Consumption - Cyberpunk 2077 Power Consumption - external Monitor *
120.3 Watt (15%)
Power Consumption - Power Efficiency - Cyberpunk 2077 ultra
0.5 fps per Watt (2%)
Emissions Witcher 3 Fan Noise + Intel Arc A350M
Emissions - Witcher 3 Fan Noise
100%
1 A350M +
47.5 dB(A) (68%)
Witcher 3 Fan Noise + NVIDIA RTX 3000 Ada Generation Laptop GPU
min: 49.9     avg: 50     median: 50 (71%)     max: 50.1 dB(A)

Average Benchmarks Intel Arc A350M → 100% n=4

Average Benchmarks NVIDIA RTX 3000 Ada Generation Laptop GPU → 285% n=4

Average Benchmarks Intel Arc A550M → 198% n=4

- Range of benchmark values for this graphics card
red legend - Average benchmark values for this graphics card
* Smaller numbers mean a higher performance
1 This benchmark is not used for the average calculation

Game Benchmarks

The following benchmarks stem from our benchmarks of review laptops. The performance depends on the used graphics memory, clock rate, processor, system settings, drivers, and operating systems. So the results don't have to be representative for all laptops with this GPU. For detailed information on the benchmark results, click on the fps number.

low 1920x1080
NVIDIA RTX 3000 Ada Generation Laptop GPU:
87.2 104.6 ~ 96 fps
med. 1920x1080
NVIDIA RTX 3000 Ada Generation Laptop GPU:
72.7 87.9 ~ 80 fps
high 1920x1080
NVIDIA RTX 3000 Ada Generation Laptop GPU:
60.7 74.2 ~ 67 fps
ultra 1920x1080
NVIDIA RTX 3000 Ada Generation Laptop GPU:
52.1 64.3 ~ 58 fps
QHD 2560x1440
NVIDIA RTX 3000 Ada Generation Laptop GPU:
39.6  fps
low 1920x1080
NVIDIA RTX 3000 Ada Generation Laptop GPU:
92 130.6 ~ 111 fps
med. 1920x1080
NVIDIA RTX 3000 Ada Generation Laptop GPU:
78.8 111.8 ~ 95 fps
high 1920x1080
NVIDIA RTX 3000 Ada Generation Laptop GPU:
70.1 98.4 ~ 84 fps
ultra 1920x1080
NVIDIA RTX 3000 Ada Generation Laptop GPU:
68.8 96.7 ~ 83 fps
QHD 2560x1440
NVIDIA RTX 3000 Ada Generation Laptop GPU:
68.7  fps
low 1920x1080
100%
A350M:
37.5  fps
med. 1920x1080
100%
A350M:
25  fps
high 1920x1080
100%
A350M:
19.8  fps
ultra 1920x1080
100%
A350M:
15.3  fps
QHD 2560x1440
100%
A350M:
10.1  fps
4K 3840x2160
100%
A350M:
3  fps
low 1920x1080
100%
A350M:
56.3  fps
med. 1920x1080
100%
A350M:
42.6  fps
high 1920x1080
100%
A350M:
36.1  fps
ultra 1920x1080
100%
A350M:
29.7  fps
QHD 2560x1440
100%
A350M:
20.4  fps
low 1920x1080
100%
A350M:
71.9  fps
med. 1920x1080
100%
A350M:
42.6  fps
high 1920x1080
100%
A350M:
38.2  fps
ultra 1920x1080
100%
A350M:
27.8  fps
QHD 2560x1440
100%
A350M:
18.8  fps
4K 3840x2160
100%
A350M:
4.4  fps
low 1920x1080
100%
A350M:
42.1  fps
med. 1920x1080
100%
A350M:
28.3  fps
high 1920x1080
100%
A350M:
12.3  fps
ultra 1920x1080
100%
A350M:
13.9  fps
QHD 2560x1440
100%
A350M:
8.3  fps
4K 3840x2160
100%
A350M:
3.1  fps
low 1920x1080
100%
A350M:
41.5  fps
med. 1920x1080
100%
A350M:
33.2  fps
high 1920x1080
100%
A350M:
25.4  fps
ultra 1920x1080
100%
A350M:
20.4  fps
QHD 2560x1440
100%
A350M:
14.7  fps
4K 3840x2160
100%
A350M:
7.2  fps
low 1920x1080
100%
A350M:
41  fps
med. 1920x1080
100%
A350M:
37  fps
high 1920x1080
100%
A350M:
23  fps
ultra 1920x1080
100%
A350M:
12  fps
QHD 2560x1440
100%
A350M:
7  fps
4K 3840x2160
100%
A350M:
6  fps
low 1920x1080
100%
A350M:
29.9  fps
med. 1920x1080
100%
A350M:
24.3  fps
high 1920x1080
100%
A350M:
20  fps
QHD 2560x1440
100%
A350M:
13.1 16.8 ~ 15 fps
4K 3840x2160
100%
A350M:
6.4  fps
F1 22

F1 22

2022
low 1920x1080
100%
A350M:
52.1  fps
367%
NVIDIA RTX 3000 Ada Generation Laptop GPU:
162.7 183.6 226 ~ 191 fps
med. 1920x1080
100%
A350M:
51.4  fps
350%
NVIDIA RTX 3000 Ada Generation Laptop GPU:
159.6 168 212 ~ 180 fps
high 1920x1080
100%
A350M:
35.5  fps
397%
NVIDIA RTX 3000 Ada Generation Laptop GPU:
127.5 133.4 161.1 ~ 141 fps
ultra 1920x1080
NVIDIA RTX 3000 Ada Generation Laptop GPU:
50.4 51.1 62.8 ~ 55 fps
QHD 2560x1440
NVIDIA RTX 3000 Ada Generation Laptop GPU:
40.7  fps
low 1920x1080
100%
A350M:
80.6  fps
med. 1920x1080
100%
A350M:
64.7  fps
high 1920x1080
100%
A350M:
54.9  fps
ultra 1920x1080
100%
A350M:
49.9  fps
QHD 2560x1440
100%
A350M:
30.6  fps
4K 3840x2160
100%
A350M:
10.8  fps
low 1920x1080
100%
A350M:
32.2  fps
med. 1920x1080
100%
A350M:
30.6  fps
high 1920x1080
100%
A350M:
29.6  fps
ultra 1920x1080
100%
A350M:
29.2  fps
low 1920x1080
NVIDIA RTX 3000 Ada Generation Laptop GPU:
153.9 156 194 ~ 168 fps
med. 1920x1080
NVIDIA RTX 3000 Ada Generation Laptop GPU:
125.4 131.4 157.7 ~ 138 fps
high 1920x1080
NVIDIA RTX 3000 Ada Generation Laptop GPU:
88 88.5 110 ~ 96 fps
ultra 1920x1080
NVIDIA RTX 3000 Ada Generation Laptop GPU:
69 70.2 87.9 ~ 76 fps
QHD 2560x1440
NVIDIA RTX 3000 Ada Generation Laptop GPU:
60.5  fps
low 1920x1080
100%
A350M:
27.4  fps
337%
NVIDIA RTX 3000 Ada Generation Laptop GPU:
92.3  fps
med. 1920x1080
100%
A350M:
18.5  fps
391%
NVIDIA RTX 3000 Ada Generation Laptop GPU:
72.4  fps
high 1920x1080
100%
A350M:
16.2  fps
378%
NVIDIA RTX 3000 Ada Generation Laptop GPU:
61.2  fps
ultra 1920x1080
100%
A350M:
11.6  fps
484%
NVIDIA RTX 3000 Ada Generation Laptop GPU:
56.2  fps
low 1920x1080
100%
A350M:
78  fps
med. 1920x1080
100%
A350M:
56  fps
high 1920x1080
100%
A350M:
41  fps
ultra 1920x1080
100%
A350M:
28  fps
low 1920x1080
100%
A350M:
26.7  fps
med. 1920x1080
100%
A350M:
21.9  fps
high 1920x1080
100%
A350M:
17.8  fps
low 1920x1080
100%
A350M:
68  fps
med. 1920x1080
100%
A350M:
52  fps
high 1920x1080
100%
A350M:
45  fps
ultra 1920x1080
100%
A350M:
30  fps
QHD 2560x1440
100%
A350M:
17  fps
4K 3840x2160
100%
A350M:
2.6  fps
low 1920x1080
100%
A350M:
22  fps
med. 1920x1080
100%
A350M:
18  fps
high 1920x1080
100%
A350M:
15  fps
ultra 1920x1080
100%
A350M:
11  fps
low 1280x720
100%
A350M:
121  fps
med. 1920x1080
100%
A350M:
63  fps
high 1920x1080
100%
A350M:
47  fps
ultra 1920x1080
100%
A350M:
43  fps
low 1280x720
100%
A350M:
108  fps
med. 1920x1080
100%
A350M:
50  fps
high 1920x1080
100%
A350M:
47  fps
ultra 1920x1080
100%
A350M:
11  fps
QHD 2560x1440
100%
A350M:
9  fps
4K 3840x2160
100%
A350M:
6  fps
low 1280x720
100%
A350M:
60  fps
med. 1920x1080
100%
A350M:
32  fps
high 1920x1080
100%
A350M:
25  fps
ultra 1920x1080
100%
A350M:
21  fps
QHD 2560x1440
100%
A350M:
12  fps
4K 3840x2160
100%
A350M:
7  fps
low 1280x720
100%
A350M:
139.3  fps
med. 1920x1080
100%
A350M:
60.2  fps
high 1920x1080
100%
A350M:
48.1  fps
ultra 1920x1080
100%
A350M:
46  fps
QHD 2560x1440
100%
A350M:
31  fps
4K 3840x2160
100%
A350M:
14.9  fps
F1 2021

F1 2021

2021
low 1280x720
100%
A350M:
166.6  fps
med. 1920x1080
100%
A350M:
63.8  fps
high 1920x1080
100%
A350M:
52.2  fps
ultra 1920x1080
100%
A350M:
21.1  fps
low 1280x720
100%
A350M:
65  fps
med. 1920x1080
100%
A350M:
35  fps
high 1920x1080
100%
A350M:
20  fps
ultra 1920x1080
100%
A350M:
16  fps
QHD 2560x1440
100%
A350M:
14  fps
low 1280x720
100%
A350M:
43.1  fps
low 1280x720
100%
A350M:
113.4  fps
med. 1920x1080
100%
A350M:
55.6  fps
low 1280x720
100%
A350M:
92  fps
med. 1920x1080
100%
A350M:
46  fps
high 1920x1080
100%
A350M:
37  fps
ultra 1920x1080
100%
A350M:
27  fps
QHD 2560x1440
100%
A350M:
17  fps
4K 3840x2160
100%
A350M:
7  fps
Strange Brigade

Strange Brigade

2018
low 1280x720
100%
A350M:
138 163.4 ~ 151 fps
242%
NVIDIA RTX 3000 Ada Generation Laptop GPU:
282 400 415 ~ 366 fps
med. 1920x1080
100%
A350M:
59.8 71.6 ~ 66 fps
314%
NVIDIA RTX 3000 Ada Generation Laptop GPU:
182.4 191.3 246 ~ 207 fps
high 1920x1080
100%
A350M:
47.4 58.7 ~ 53 fps
317%
NVIDIA RTX 3000 Ada Generation Laptop GPU:
151.4 160.1 192.8 ~ 168 fps
ultra 1920x1080
100%
A350M:
40.9 49.1 ~ 45 fps
331%
NVIDIA RTX 3000 Ada Generation Laptop GPU:
132.5 140.7 172.6 ~ 149 fps
QHD 2560x1440
100%
A350M:
36.6  fps
324%
NVIDIA RTX 3000 Ada Generation Laptop GPU:
118.6  fps
4K 3840x2160
100%
A350M:
18.8 19.6 ~ 19 fps
Far Cry 5

Far Cry 5

2018
low 1280x720
100%
A350M:
65 89 ~ 77 fps
183%
NVIDIA RTX 3000 Ada Generation Laptop GPU:
115 154 155 ~ 141 fps
med. 1920x1080
100%
A350M:
39 44 ~ 42 fps
281%
NVIDIA RTX 3000 Ada Generation Laptop GPU:
105 116 133 ~ 118 fps
high 1920x1080
100%
A350M:
37 41 ~ 39 fps
290%
NVIDIA RTX 3000 Ada Generation Laptop GPU:
104 106 130 ~ 113 fps
ultra 1920x1080
100%
A350M:
35 38 ~ 37 fps
284%
NVIDIA RTX 3000 Ada Generation Laptop GPU:
96 101 118 ~ 105 fps
QHD 2560x1440
100%
A350M:
25  fps
372%
NVIDIA RTX 3000 Ada Generation Laptop GPU:
93  fps
4K 3840x2160
100%
A350M:
12  fps
low 1280x720
100%
A350M:
33.9 43.9 ~ 39 fps
336%
NVIDIA RTX 3000 Ada Generation Laptop GPU:
109.9 131.3 152 ~ 131 fps
med. 1920x1080
100%
A350M:
29.4 32.2 ~ 31 fps
365%
NVIDIA RTX 3000 Ada Generation Laptop GPU:
102.1 109.7 126.8 ~ 113 fps
high 1920x1080
100%
A350M:
25.8 27.9 ~ 27 fps
330%
NVIDIA RTX 3000 Ada Generation Laptop GPU:
76.7 87.1 102 ~ 89 fps
4K 3840x2160
100%
A350M:
19.6  fps
low 1280x720
100%
A350M:
59.3 64.8 ~ 62 fps
255%
NVIDIA RTX 3000 Ada Generation Laptop GPU:
128.8 155.1 189.4 ~ 158 fps
med. 1920x1080
100%
A350M:
29.8 33.2 ~ 32 fps
344%
NVIDIA RTX 3000 Ada Generation Laptop GPU:
91.9 108 128.7 ~ 110 fps
high 1920x1080
100%
A350M:
18.2 20.7 ~ 19 fps
437%
NVIDIA RTX 3000 Ada Generation Laptop GPU:
72.9 78.9 97 ~ 83 fps
QHD 2560x1440
100%
A350M:
13.6  fps
524%
NVIDIA RTX 3000 Ada Generation Laptop GPU:
71.3  fps
4K 3840x2160
100%
A350M:
7 7.3 ~ 7 fps
low 1280x720
100%
A350M:
102.1 102.9 ~ 103 fps
168%
NVIDIA RTX 3000 Ada Generation Laptop GPU:
168 175.7 176.2 ~ 173 fps
med. 1366x768
100%
A350M:
83.5 85.8 ~ 85 fps
185%
NVIDIA RTX 3000 Ada Generation Laptop GPU:
151.3 159.9 160.8 ~ 157 fps
high 1920x1080
100%
A350M:
60.6 63.9 ~ 62 fps
234%
NVIDIA RTX 3000 Ada Generation Laptop GPU:
136 148.2 151.5 ~ 145 fps
ultra 1920x1080
100%
A350M:
56.1 62.1 ~ 59 fps
232%
NVIDIA RTX 3000 Ada Generation Laptop GPU:
123.3 142.9 143.3 ~ 137 fps
low 1024x768
100%
A350M:
120 140.1 ~ 130 fps
272%
NVIDIA RTX 3000 Ada Generation Laptop GPU:
344 364.1 ~ 354 fps
med. 1366x768
100%
A350M:
76 83.6 ~ 80 fps
308%
NVIDIA RTX 3000 Ada Generation Laptop GPU:
242.5 249.5 ~ 246 fps
high 1920x1080
100%
A350M:
41 45 ~ 43 fps
344%
NVIDIA RTX 3000 Ada Generation Laptop GPU:
145.8 150.1 ~ 148 fps
ultra 1920x1080
100%
A350M:
18.4 20.5 ~ 19 fps
416%
NVIDIA RTX 3000 Ada Generation Laptop GPU:
78.7 79.5 ~ 79 fps
4K 3840x2160
100%
A350M:
15.1  fps
GTA V

GTA V

2015
low 1024x768
100%
A350M:
134.5 170.7 ~ 153 fps
120%
NVIDIA RTX 3000 Ada Generation Laptop GPU:
182.2 183.2 ~ 183 fps
med. 1366x768
100%
A350M:
109.3 156.3 ~ 133 fps
133%
NVIDIA RTX 3000 Ada Generation Laptop GPU:
176 177 ~ 177 fps
high 1920x1080
100%
A350M:
36.5 38 ~ 37 fps
443%
NVIDIA RTX 3000 Ada Generation Laptop GPU:
163.2 164.1 ~ 164 fps
ultra 1920x1080
100%
A350M:
14.7 15.2 ~ 15 fps
613%
NVIDIA RTX 3000 Ada Generation Laptop GPU:
88.2 96.6 ~ 92 fps
QHD 2560x1440
100%
A350M:
10.1  fps
753%
NVIDIA RTX 3000 Ada Generation Laptop GPU:
76.1  fps
4K 3840x2160
100%
A350M:
11.1  fps

Average Gaming Intel Arc A350M → 100%

Average Gaming 30-70 fps → 100%

Average Gaming NVIDIA RTX 3000 Ada Generation Laptop GPU → 337%

Average Gaming 30-70 fps → 431%

Intel Arc A350MNVIDIA RTX 3000 Ada Generation Laptop GPUIntel Arc A550M
lowmed.highultraQHD4Klowmed.highultraQHD4Klowmed.highultraQHD4K
Cyberpunk 2077 2.2 Phantom Liberty9680675839.6
Baldur's Gate 311195848368.7
F1 2252.151.435.51911801415540.7
Tiny Tina's Wonderlands168138967660.5
Cyberpunk 2077 1.627.418.516.211.692.372.461.256.2
Strange Brigade15166534536.619366207168149118.6
Far Cry 577423937251214111811310593
X-Plane 11.1139312719.613111389
Final Fantasy XV Benchmark62321913.671581108371.3
Dota 2 Reborn103856259173157145137
The Witcher 313080431915.135424614879
GTA V153133371510.111.11831771649276.1
Intel Arc A350MNVIDIA RTX 3000 Ada Generation Laptop GPUIntel Arc A550M
lowmed.highultraQHD4Klowmed.highultraQHD4Klowmed.highultraQHD4K
< 30 fps
< 60 fps
< 120 fps
≥ 120 fps
1
2
3
3
1
4
3
1
3
5
1
3
3

3
1

6


< 30 fps
< 60 fps
< 120 fps
≥ 120 fps


3
9


6
6


7
5

3
5
2

2
6


< 30 fps
< 60 fps
< 120 fps
≥ 120 fps


For more games that might be playable and a list of all games and graphics cards visit our Gaming List

v1.33
log 31. 20:03:06

#0 ran 0s before starting gpusingle class +0s ... 0s

#1 checking url part for id 11149 +0s ... 0s

#2 checking url part for id 11603 +0s ... 0s

#3 checking url part for id 11309 +0s ... 0s

#4 redirected to Ajax server, took 1756663386s time from redirect:0 +0s ... 0s

#5 did not recreate cache, as it is less than 5 days old! Created at Sun, 31 Aug 2025 05:18:20 +0200 +0s ... 0s

#6 composed specs +0.032s ... 0.033s

#7 did output specs +0s ... 0.033s

#8 start showIntegratedCPUs +0s ... 0.033s

#9 getting avg benchmarks for device 11149 +0.016s ... 0.049s

#10 got single benchmarks 11149 +0.005s ... 0.054s

#11 getting avg benchmarks for device 11603 +0s ... 0.055s

#12 got single benchmarks 11603 +0.007s ... 0.061s

#13 getting avg benchmarks for device 11309 +0s ... 0.062s

#14 got single benchmarks 11309 +0.003s ... 0.064s

#15 got avg benchmarks for devices +0s ... 0.064s

#16 min, max, avg, median took s +0.053s ... 0.117s

#17 before gaming benchmark output +0s ... 0.117s

#18 Got 301 rows for game benchmarks. +0.016s ... 0.133s

#19 composed SQL query for gamebenchmarks +0s ... 0.133s

#20 got data and put it in $dataArray +0.005s ... 0.138s

#21 benchmarks composed for output. +0.016s ... 0.155s

#22 calculated avg scores. +0s ... 0.155s

#23 return log +0.001s ... 0.155s

Please share our article, every link counts!
Mail Logo
> Expert Reviews and News on Laptops, Smartphones and Tech Innovations > Benchmarks / Tech > Graphics Card Comparison - Head 2 Head
Redaktion, 2017-09- 8 (Update: 2023-07- 1)