 Deutsch
 English
 Español
 Français
 Italiano
 Nederlands
 Polski
 Português
 Русский
 Türkçe
 Svenska
 Chinese
 Magyar
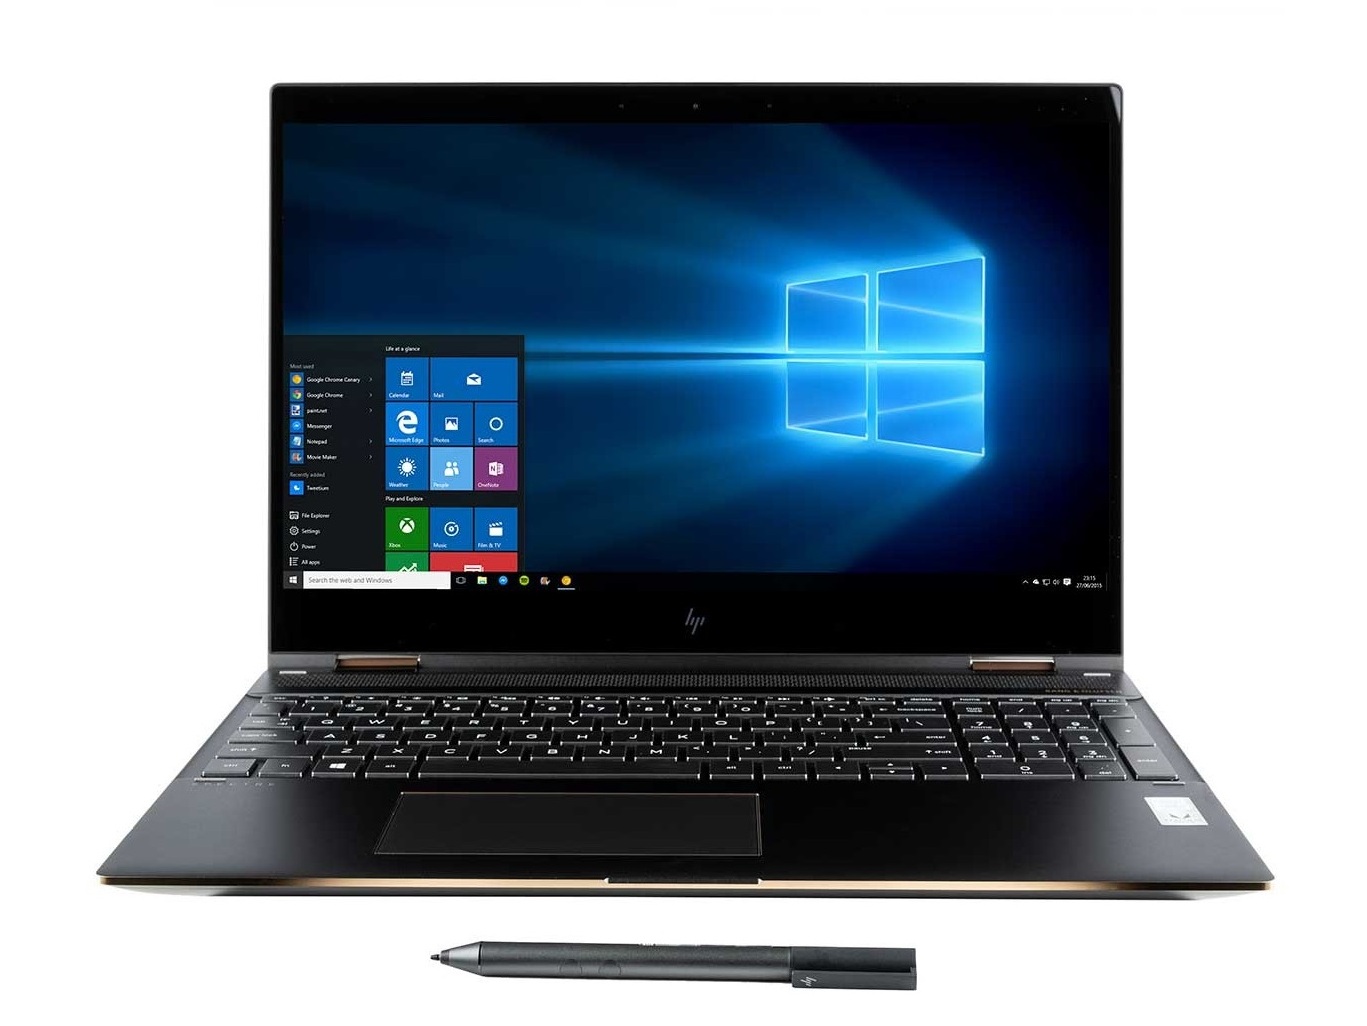
HP Spectre x360 15 (i7-8705G, Radeon RX Vega M GL) Convertible Review
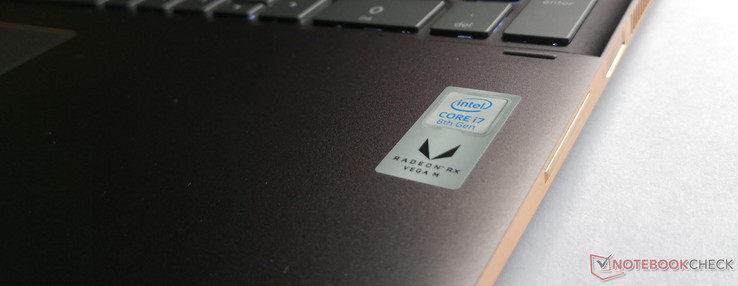
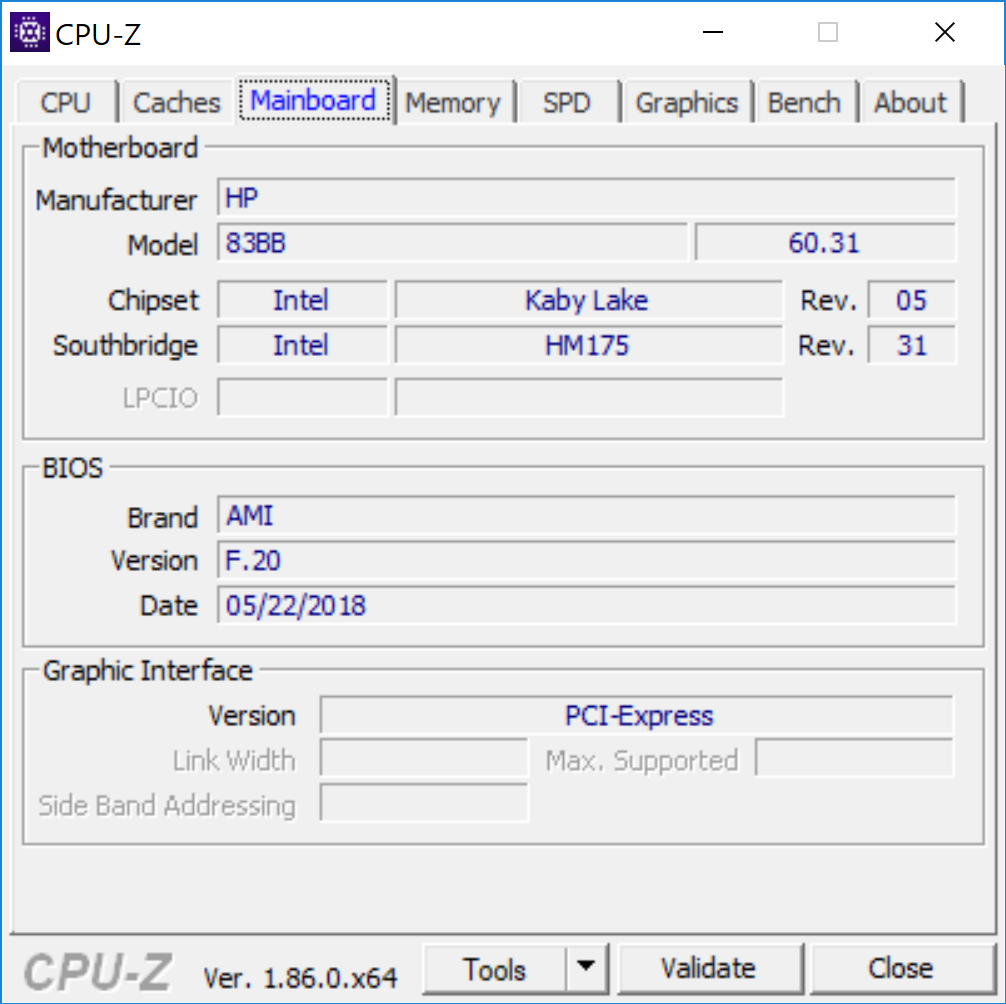
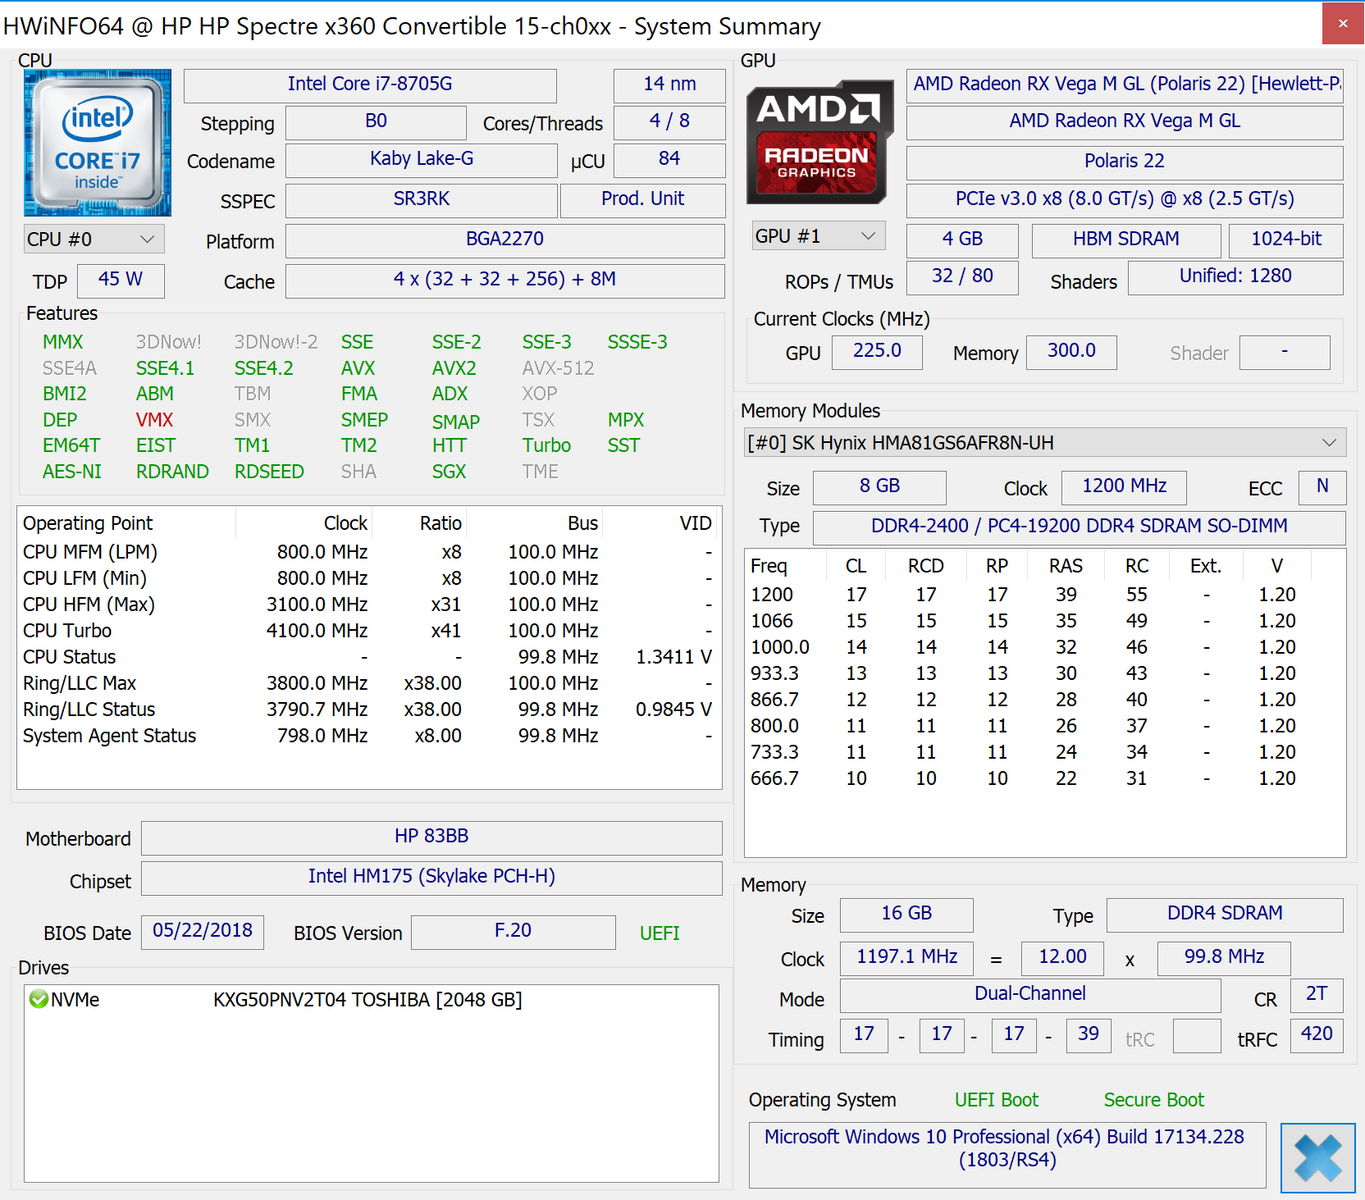
HP unveiled its latest refresh of the flagship Spectre x360 15 series at CES 2018 with not one, but two very distinct configurations. Users have the option of a Kaby Lake-R SKU with the same internal specifications as the 2017 model while the Kaby Lake-G SKU offers the rare Core i7-8705G CPU and discrete Radeon RX Vega M GL GPU. Other than the processor differences, the Kaby Lake-G SKU carries a nearly identical chassis with the same keyboard and touchscreen features as the Kaby Lake-R SKU.
We recommend checking out our existing review on the 2018 Kaby Lake-R version for more information on the Spectre x360 15 series. This review will instead focus on the performance of the Kaby Lake-G SKU and how it differs from the less expensive Kaby Lake-R configuration. The Spectre x360 15 Kaby Lake-G competes directly with the Dell XPS 15 9575 convertible and other high-performance multimedia laptops to a lesser degree like the Asus Zenbook Pro 15, Apple MacBook Pro 15, and Gigabyte Aero 15.
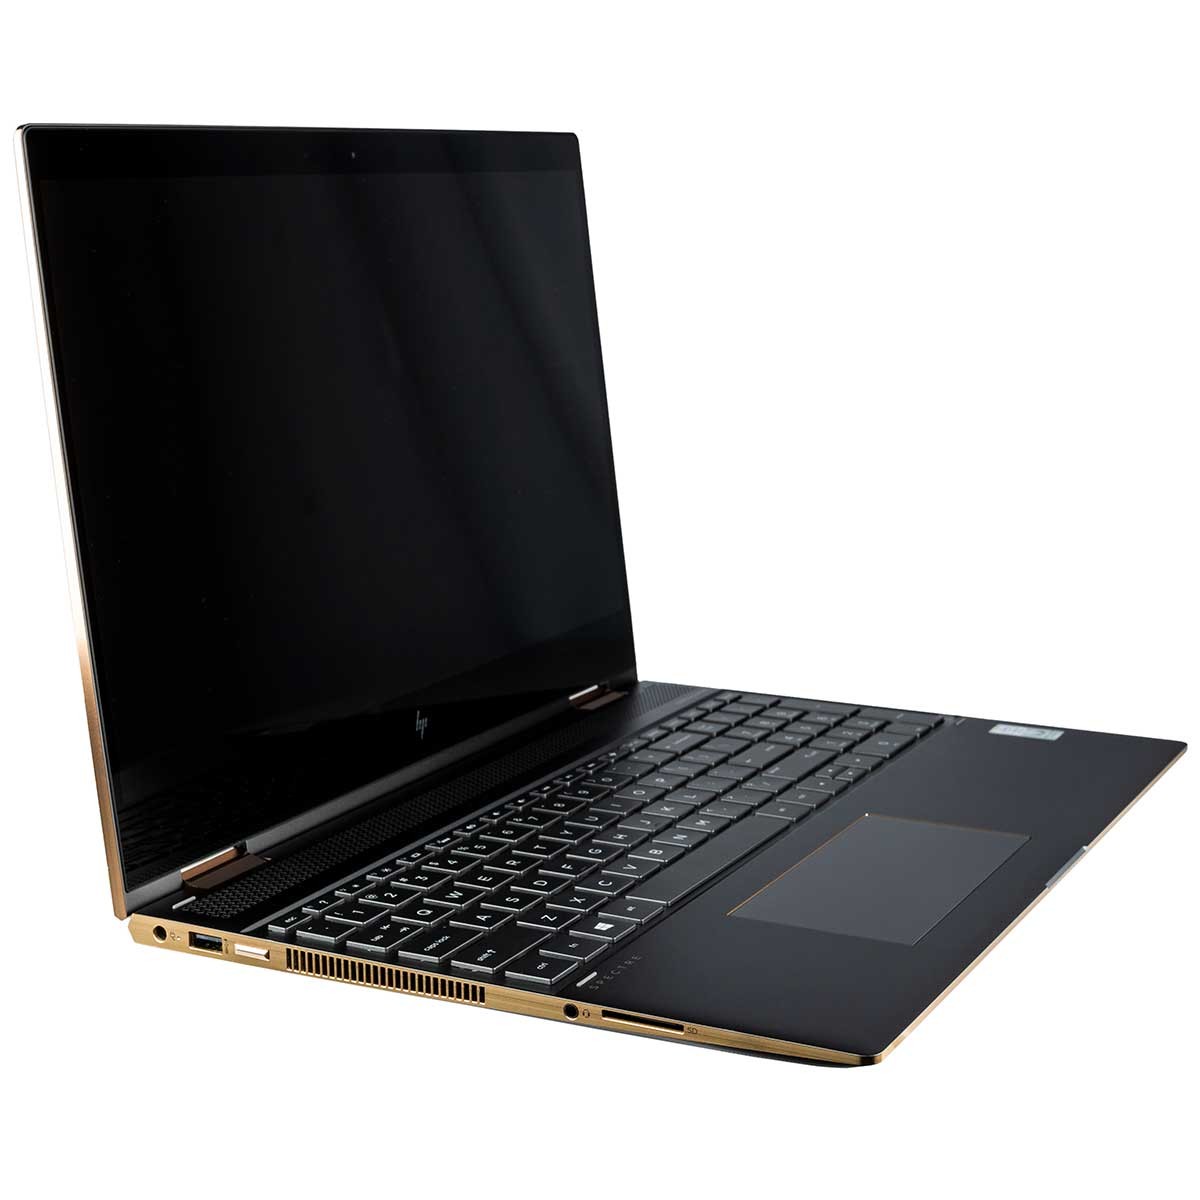
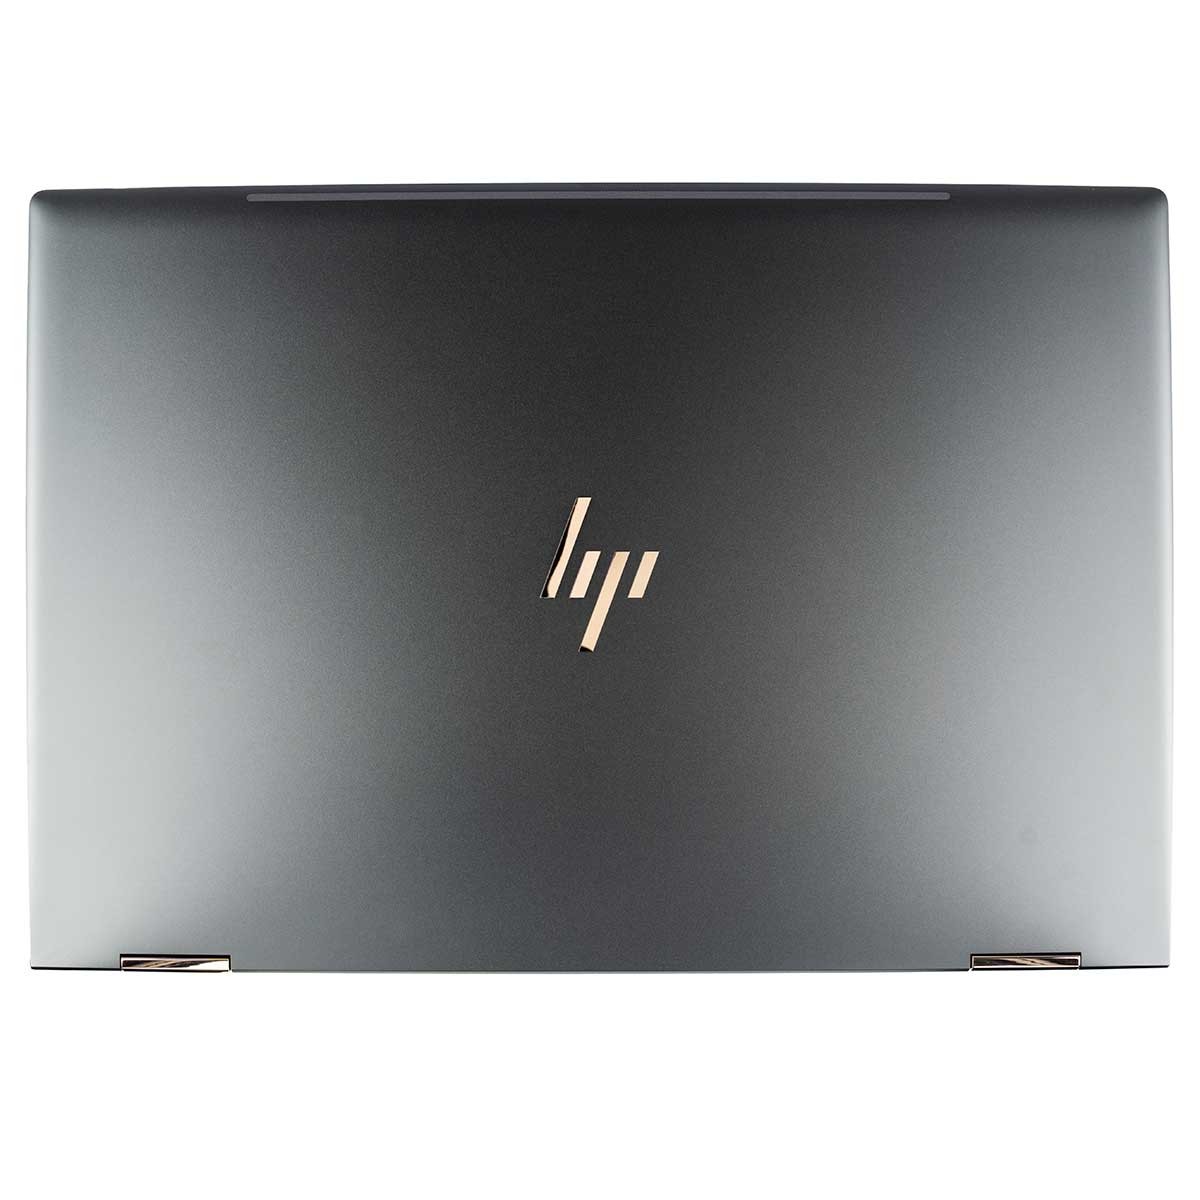
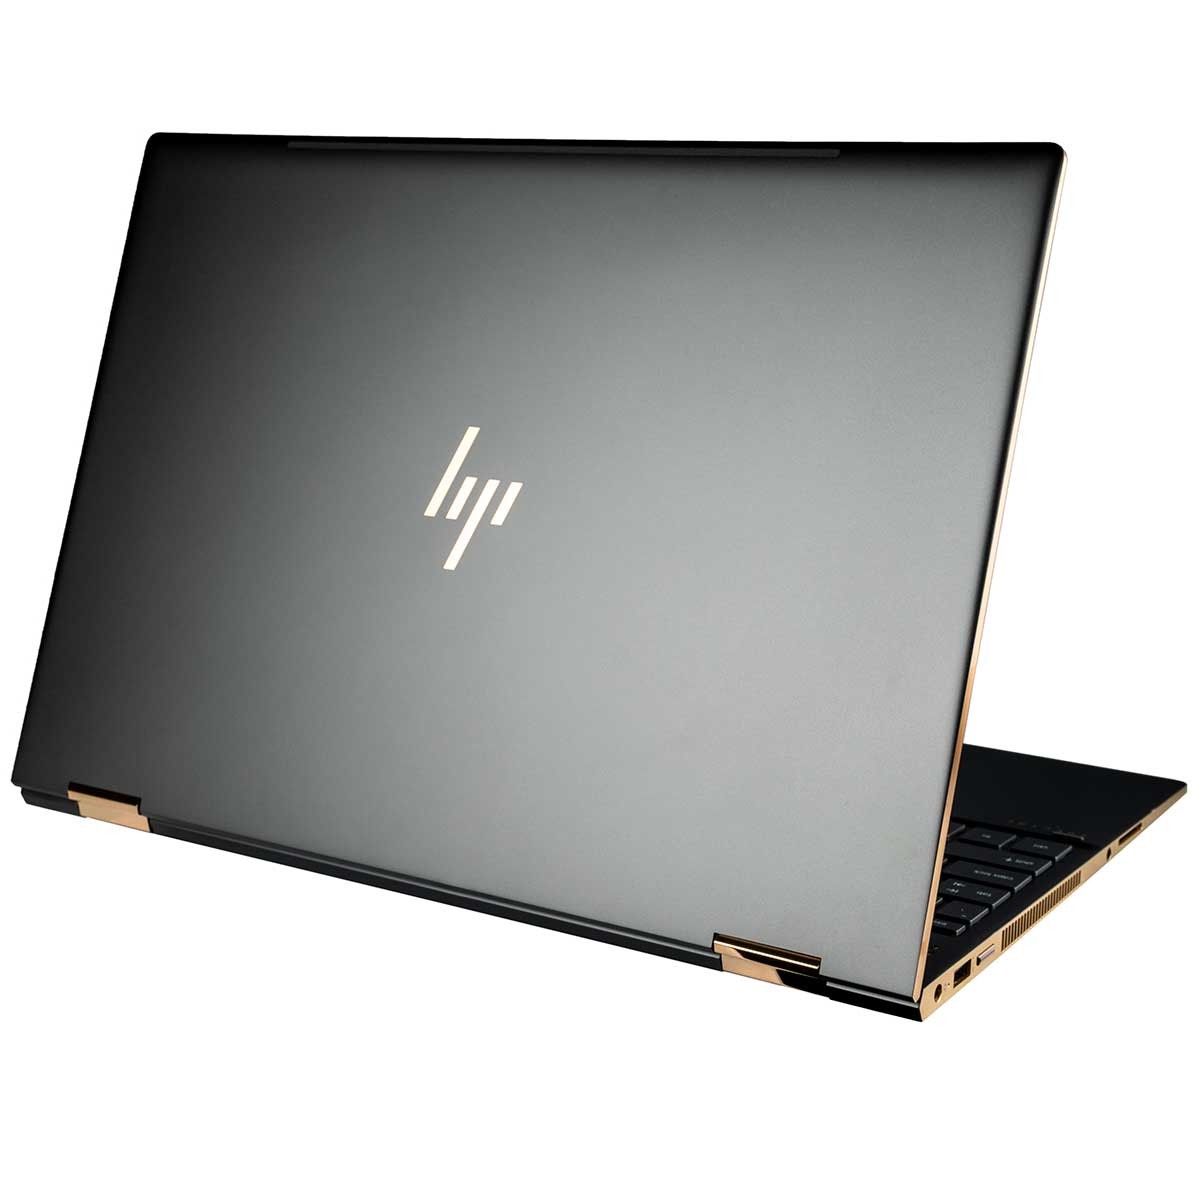
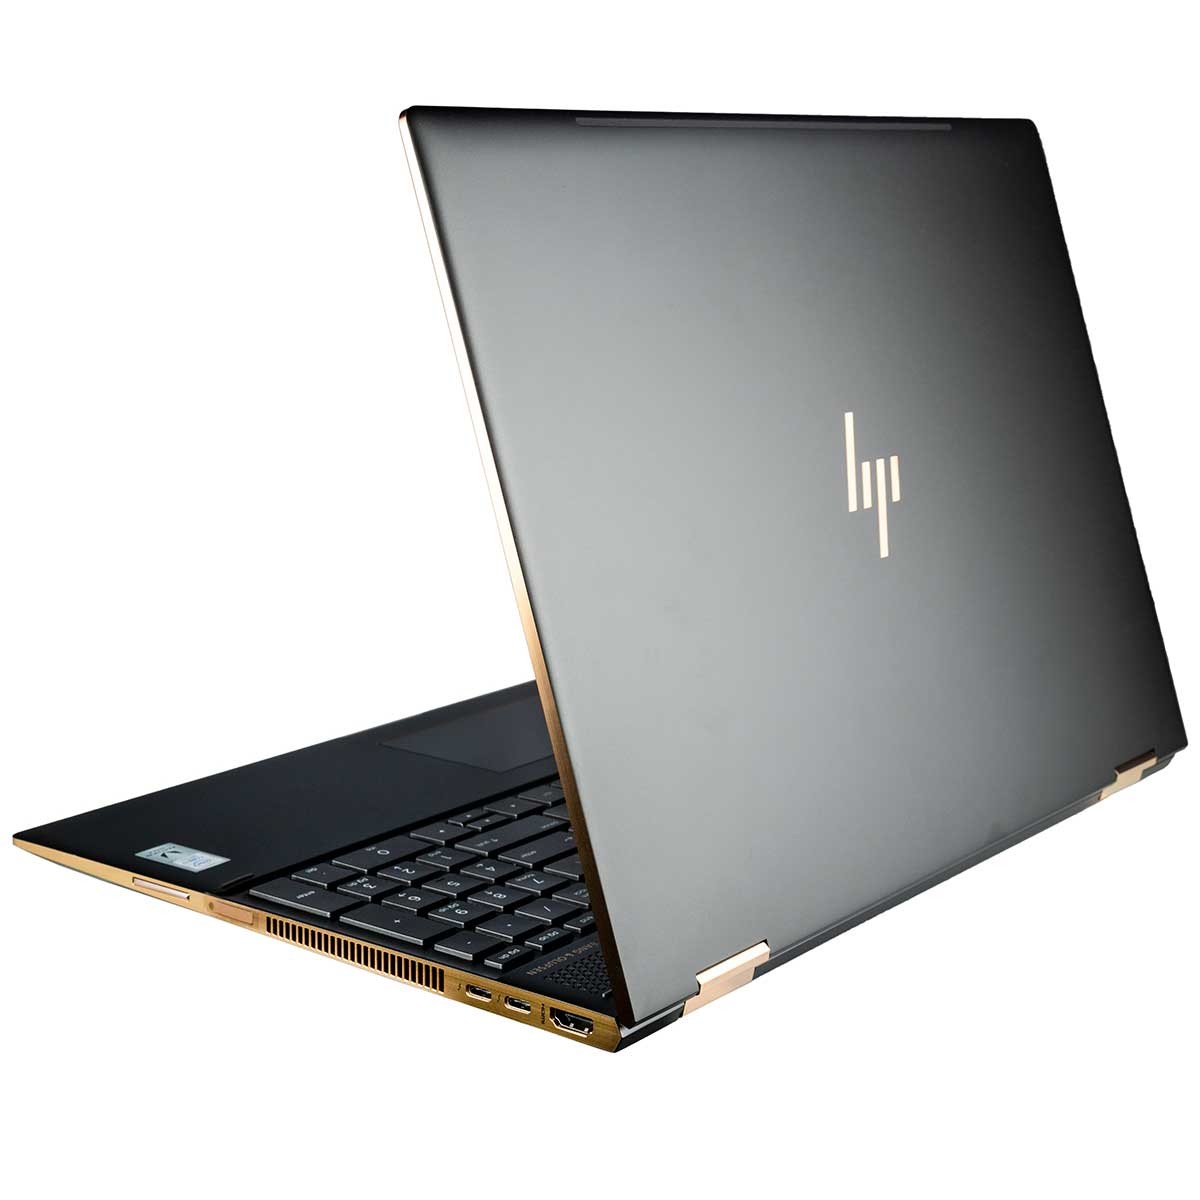
Case
There are no significant superficial differences between the Kaby Lake-G and Kaby Lake-R configurations. The few slight changes are that the Kaby Lake-G SKU comes with two Thunderbolt 3 ports as opposed to just one on the Kaby Lake-R option and it's also slightly heavier by about 50 grams due to some internal changes to accommodate the CPU.
| SD Card Reader | |
| average JPG Copy Test (av. of 3 runs) | |
| HP Spectre x360 15-ch000 (Toshiba Exceria Pro SDXC 64 GB UHS-II) | |
| Dell XPS 15 9575 i7-8705G (Toshiba Exceria Pro M501 UHS-II) | |
| HP Spectre x360 15-bl002xx (Toshiba Exceria Pro SDXC 64 GB UHS-II) | |
| Asus Zenbook Pro UX550VE-DB71T (Toshiba Exceria Pro SDXC 64 GB UHS-II) | |
| MSI GE73 8RF-008 Raider RGB (Toshiba Exceria Pro SDXC 64 GB UHS-II) | |
| maximum AS SSD Seq Read Test (1GB) | |
| HP Spectre x360 15-bl002xx (Toshiba Exceria Pro SDXC 64 GB UHS-II) | |
| HP Spectre x360 15-ch000 (Toshiba Exceria Pro SDXC 64 GB UHS-II) | |
| Dell XPS 15 9575 i7-8705G (Toshiba Exceria Pro M501 UHS-II) | |
| Asus Zenbook Pro UX550VE-DB71T (Toshiba Exceria Pro SDXC 64 GB UHS-II) | |
| MSI GE73 8RF-008 Raider RGB (Toshiba Exceria Pro SDXC 64 GB UHS-II) | |
Security
Unlike the 2017 model, the 2018 refresh includes a fingerprint reader along the right edge. The main issue is that it feels less ergonomic to use than the usual top-facing fingerprint readers found on most other laptops. The combo Power button-fingerprint reader on the XPS 9570, for example, is a more streamlined approach.
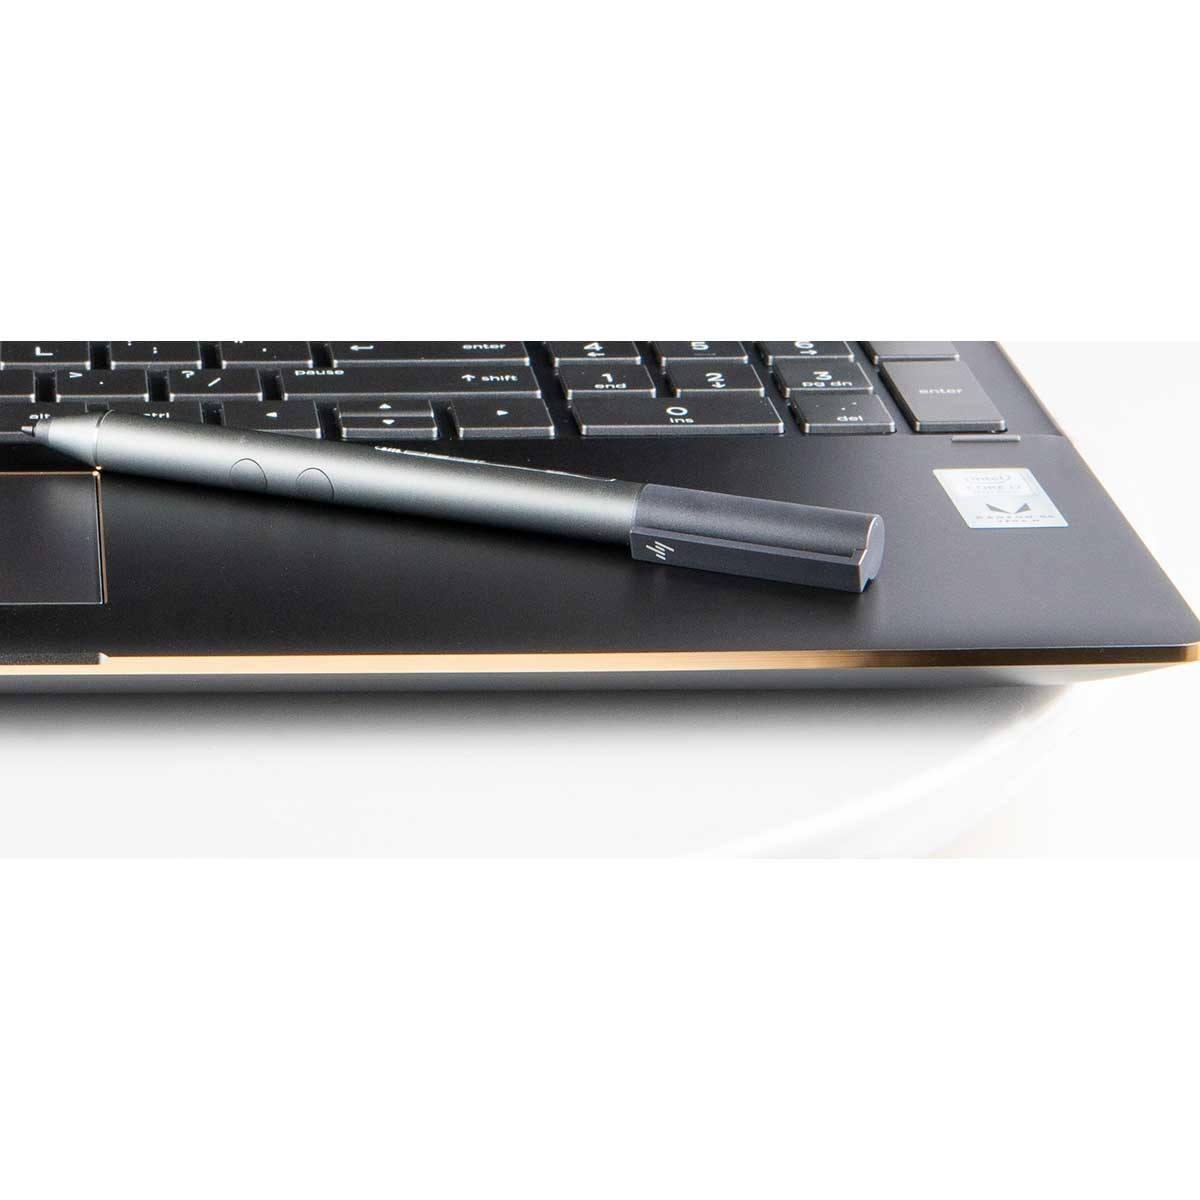
Accessories
Included extras are a Quick Start guide, faux leather case, and an active WACOM stylus worth $50 USD. There is no convenient area around the system or leather case for stowing the stylus.
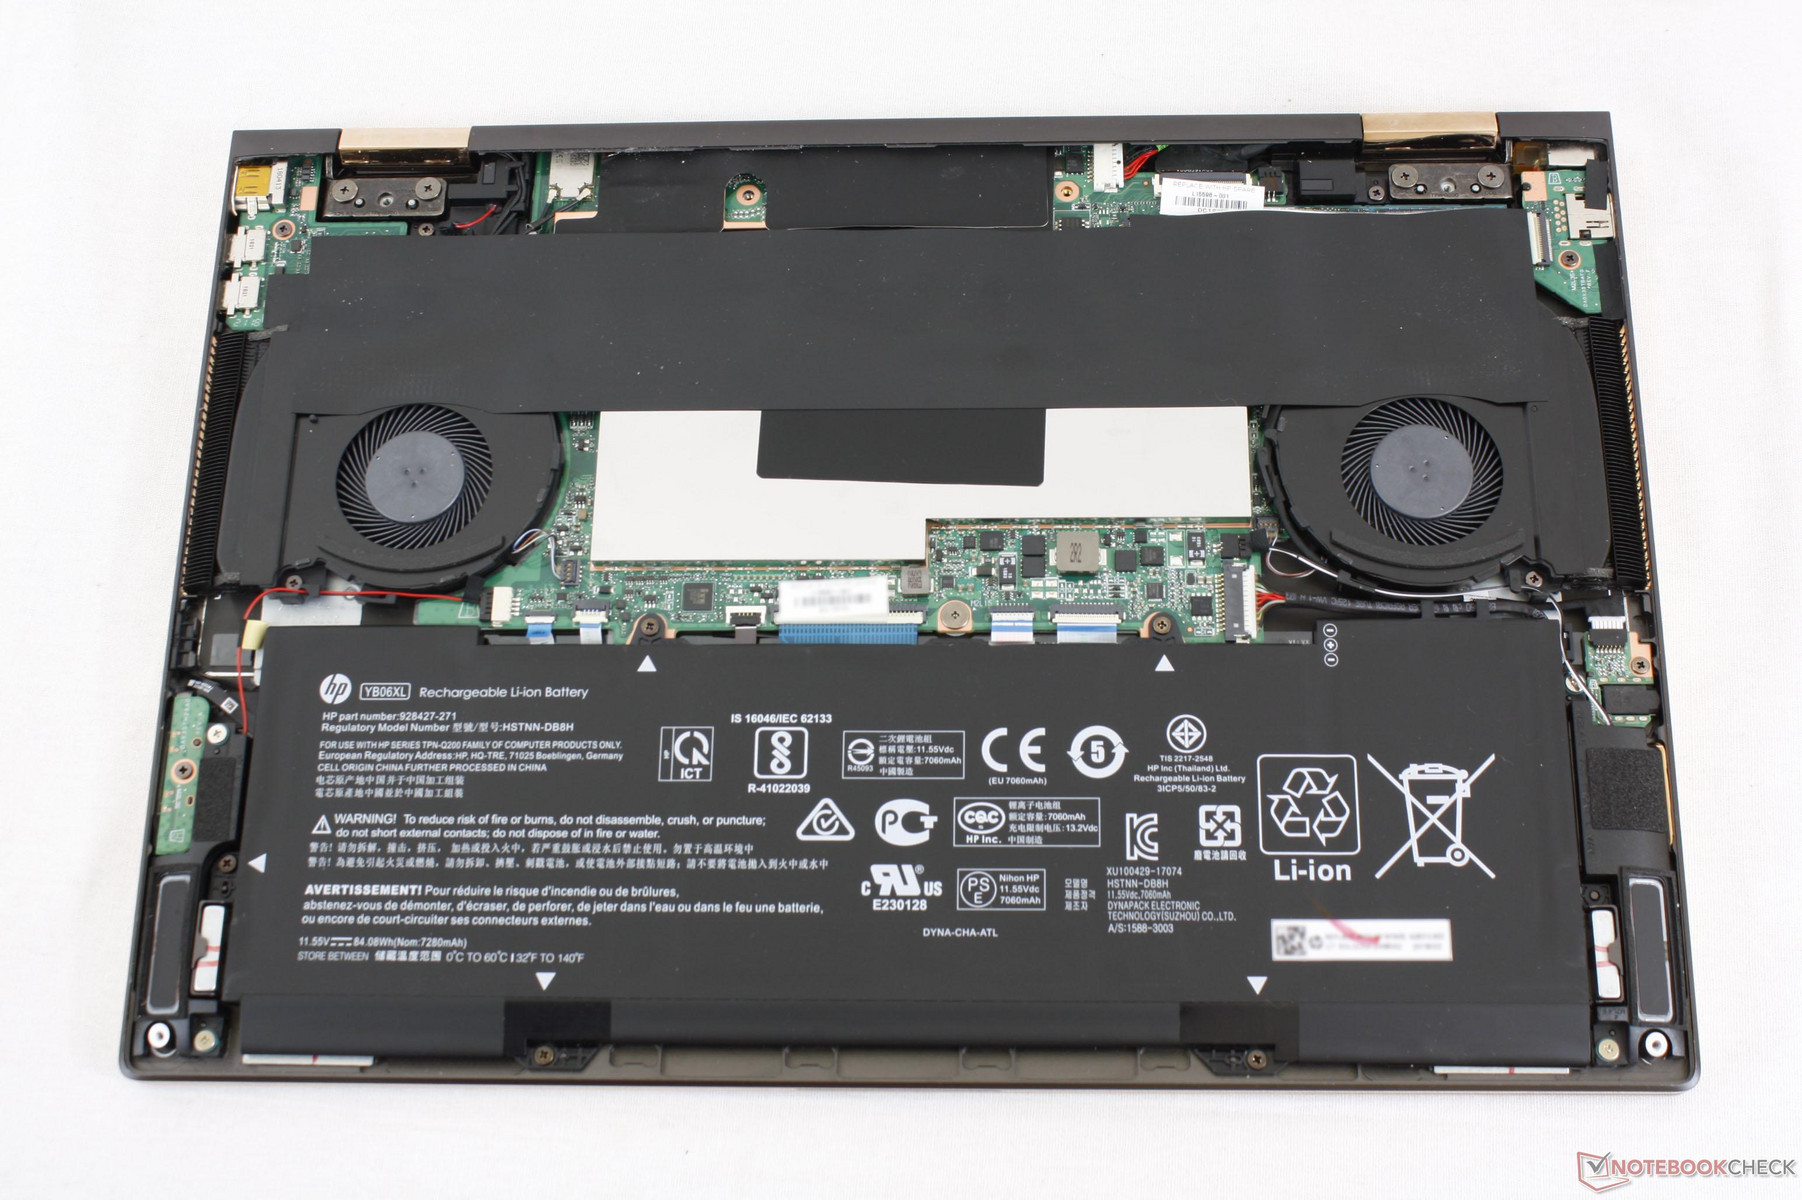
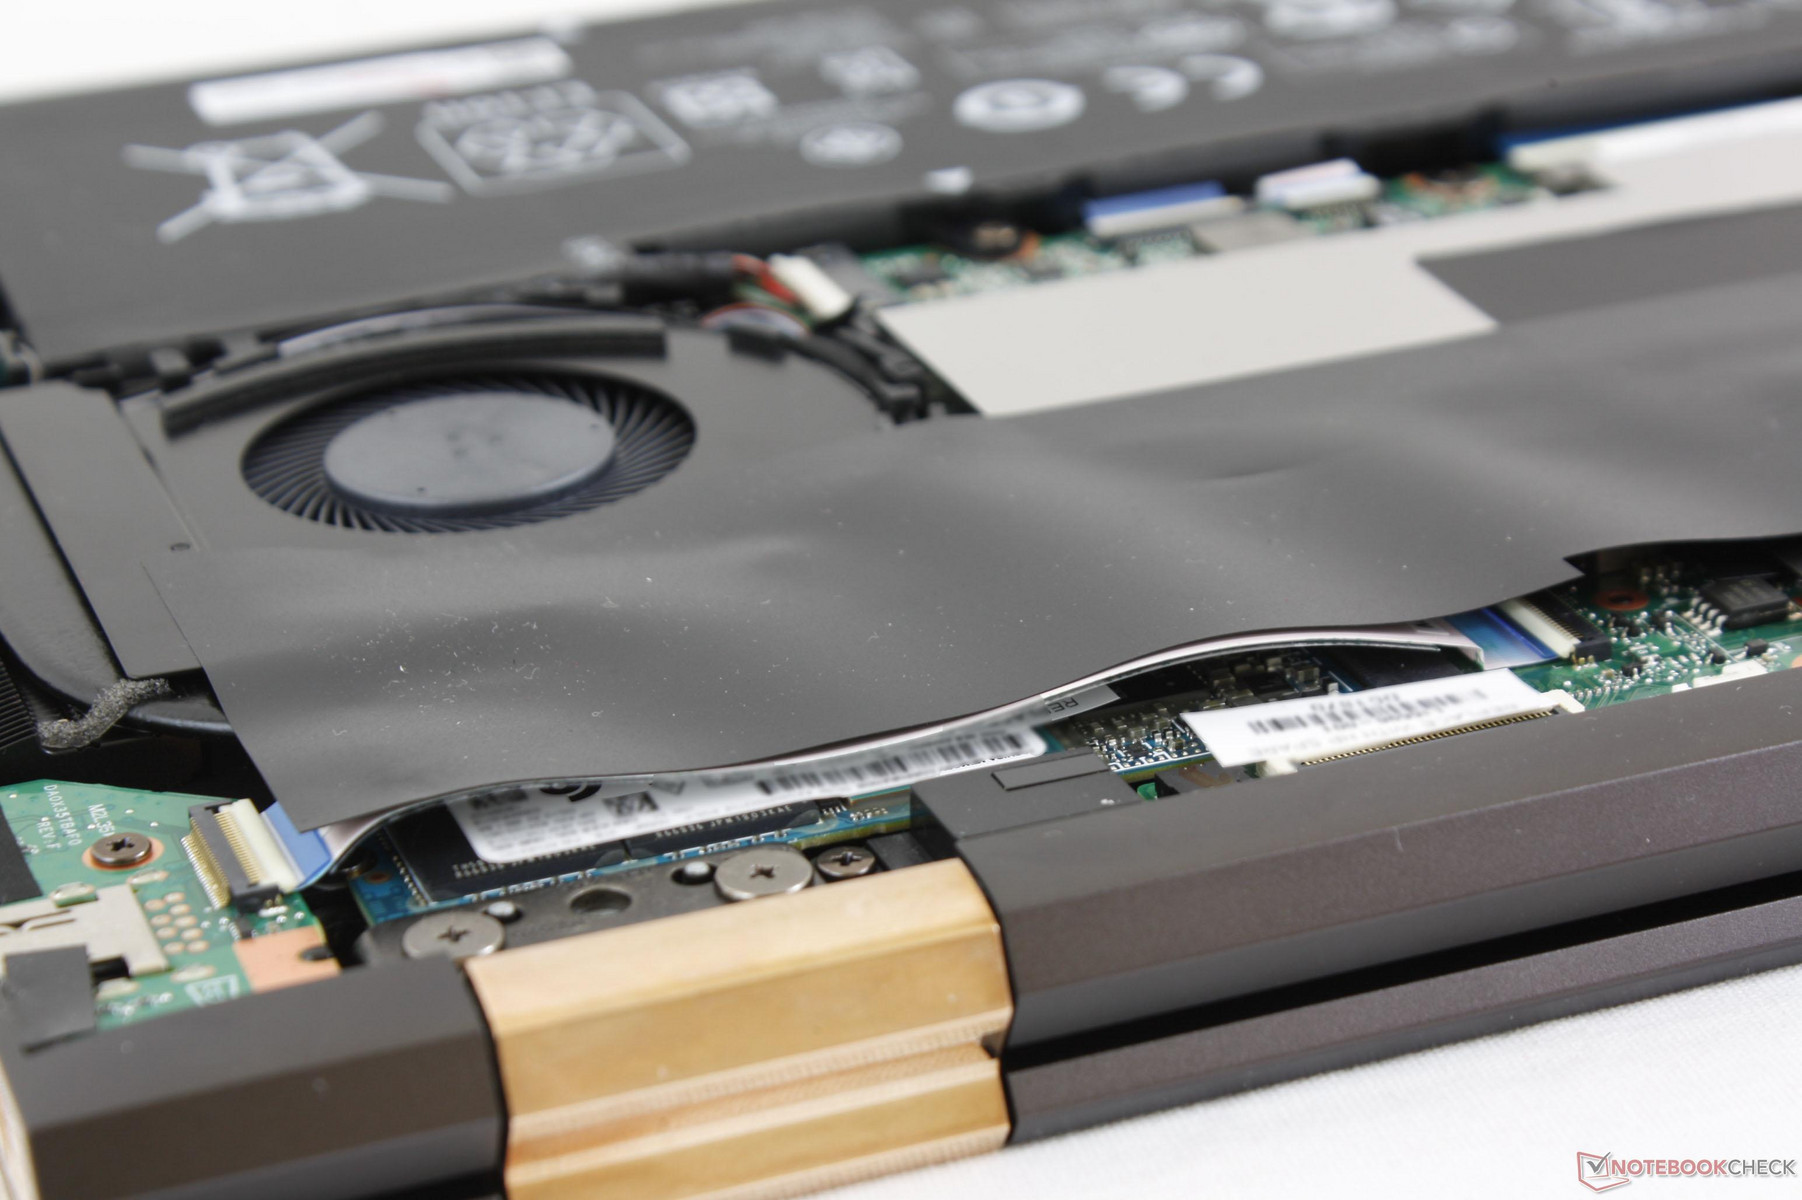
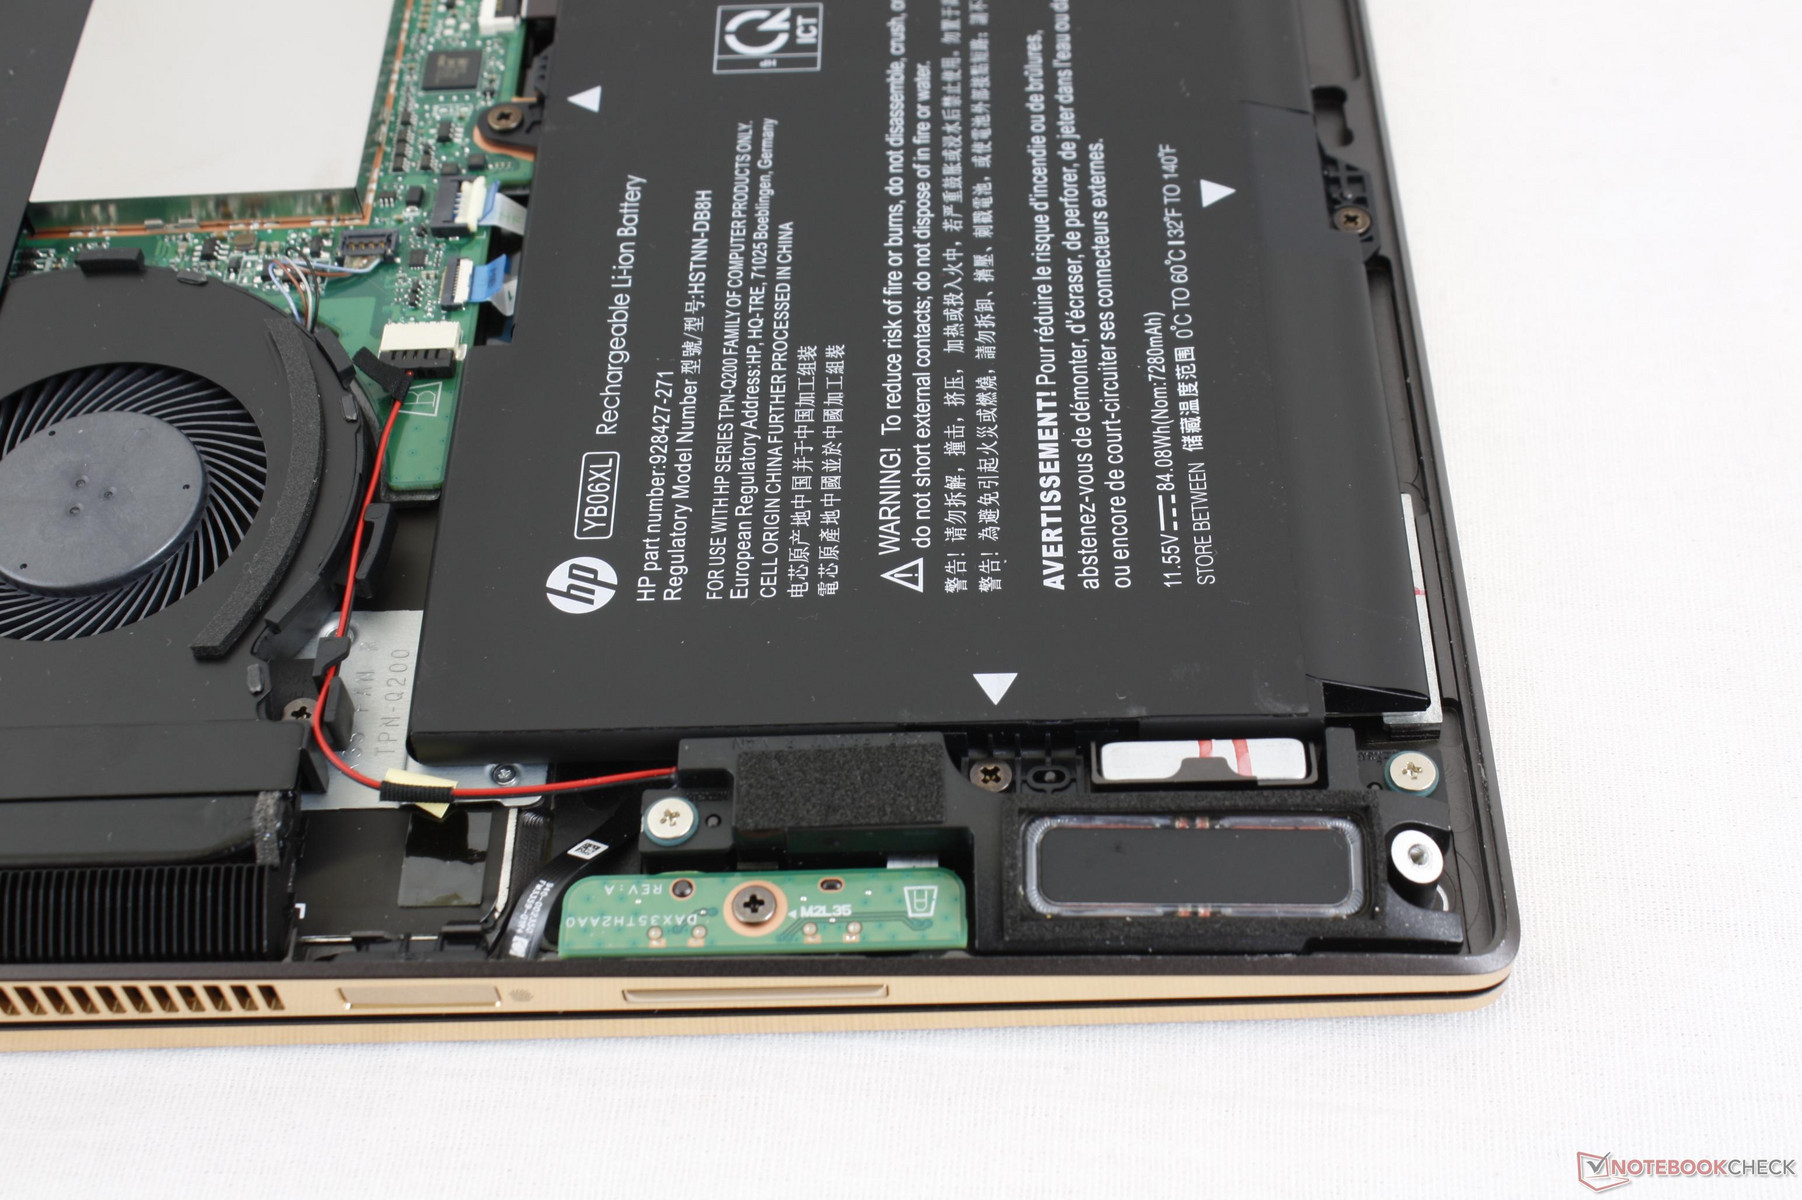
Maintenance
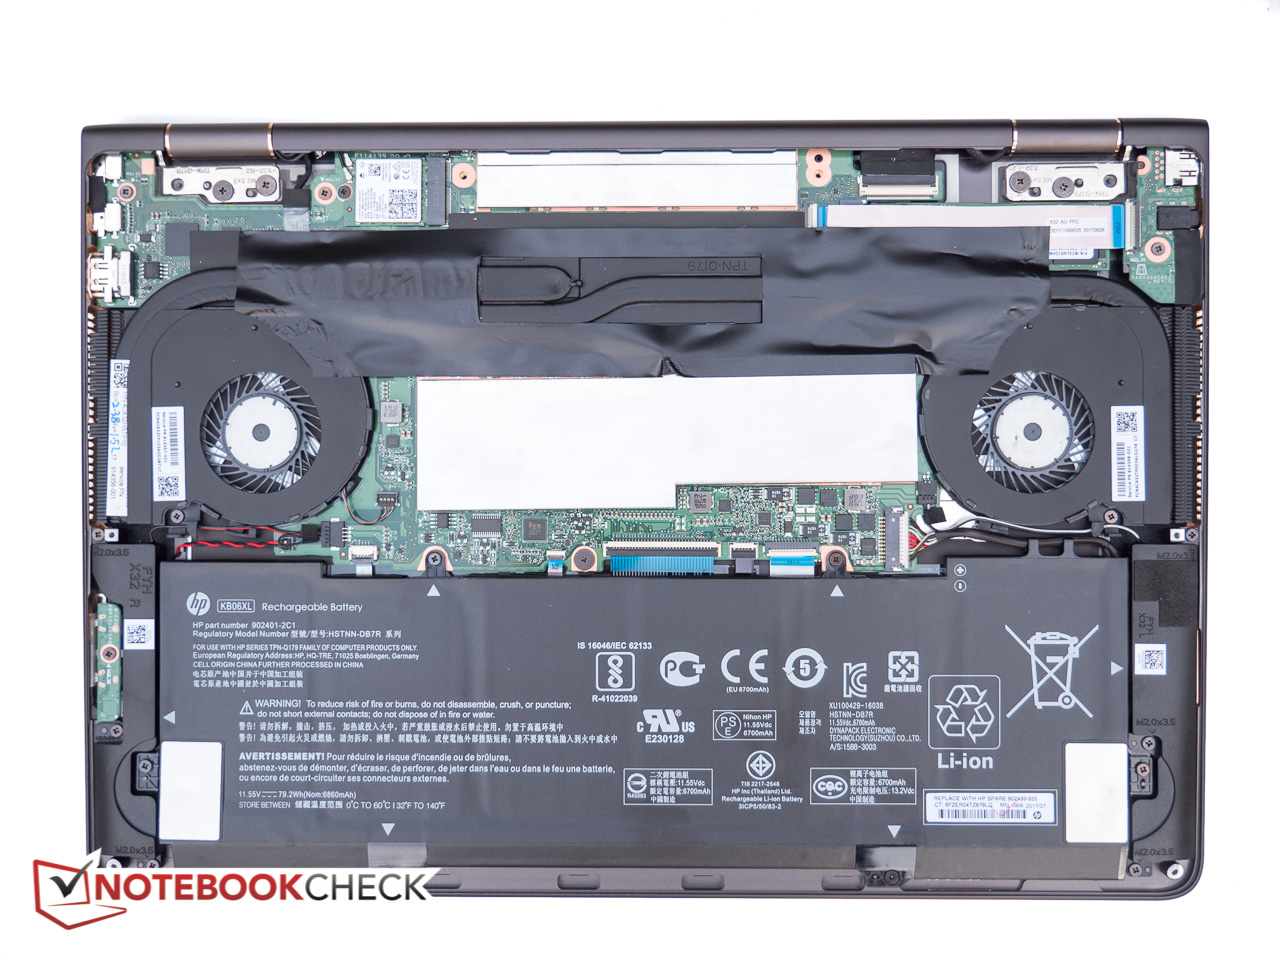
The bottom panel is secured by two Torx screws and four Philips screws hidden underneath the rear rubber footing. Even with these screws removed, however, the bottom panel is still very difficult to detach without damaging the chassis. Its edges and corners are attached tightly (and sharply) to the base to make it clear that end-user servicing wasn't a top priority for HP when designing the latest Spectre.
Once inside, upgradeability is limited. There is more adhesive than expected and the M.2 slot is buried underneath tape and ribbons.
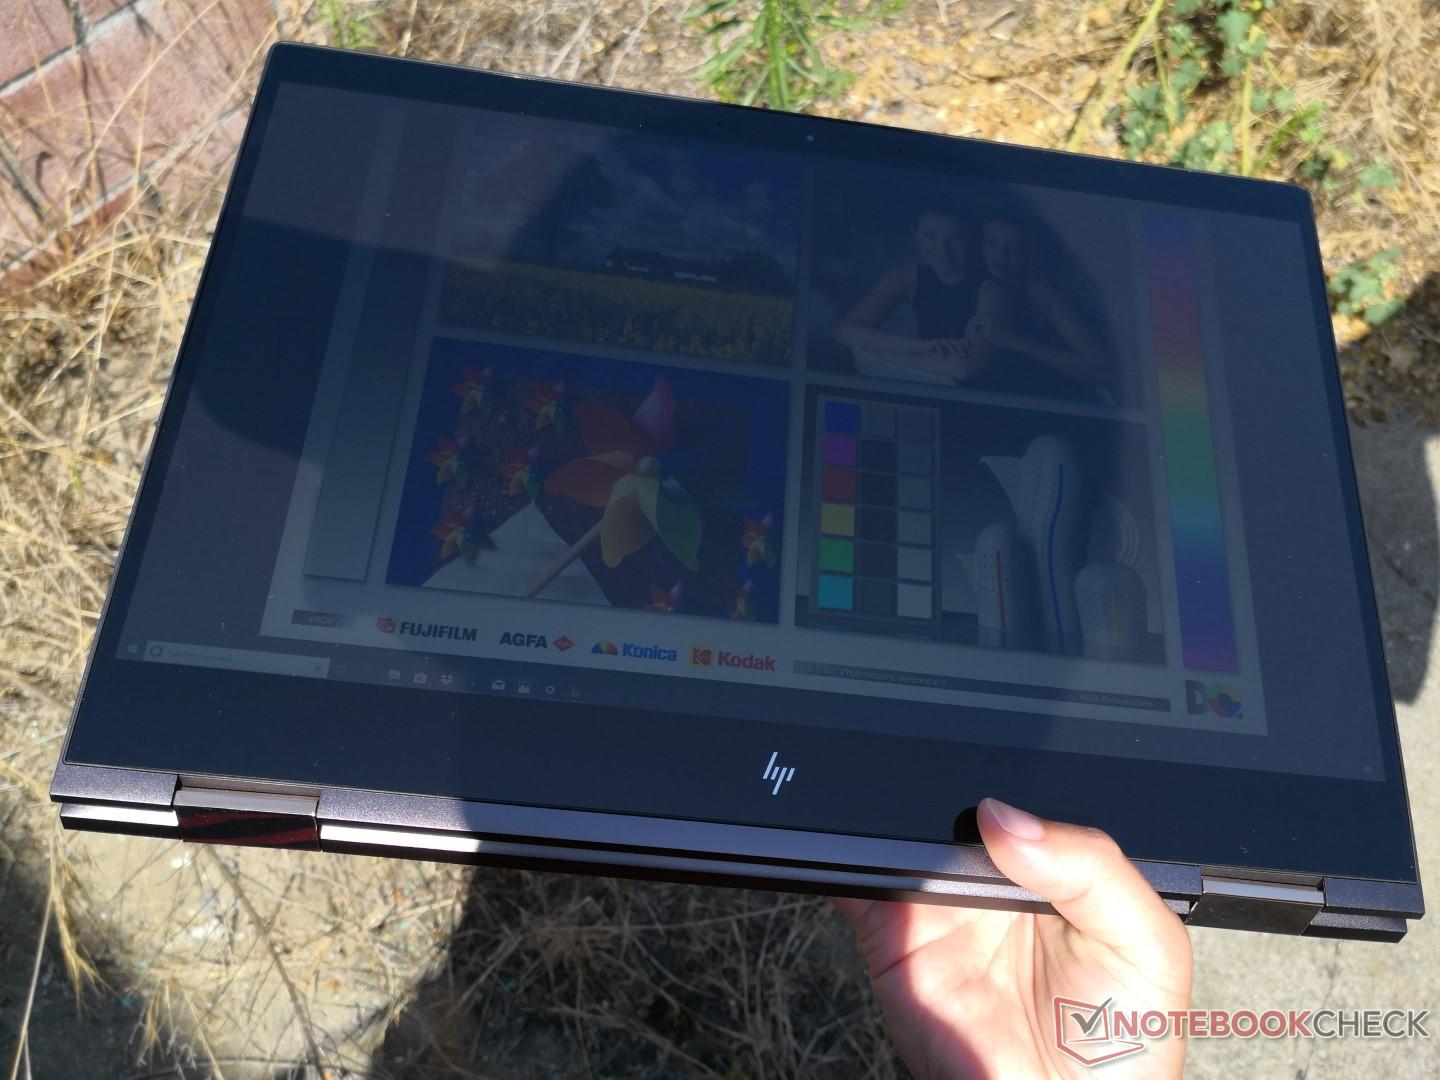
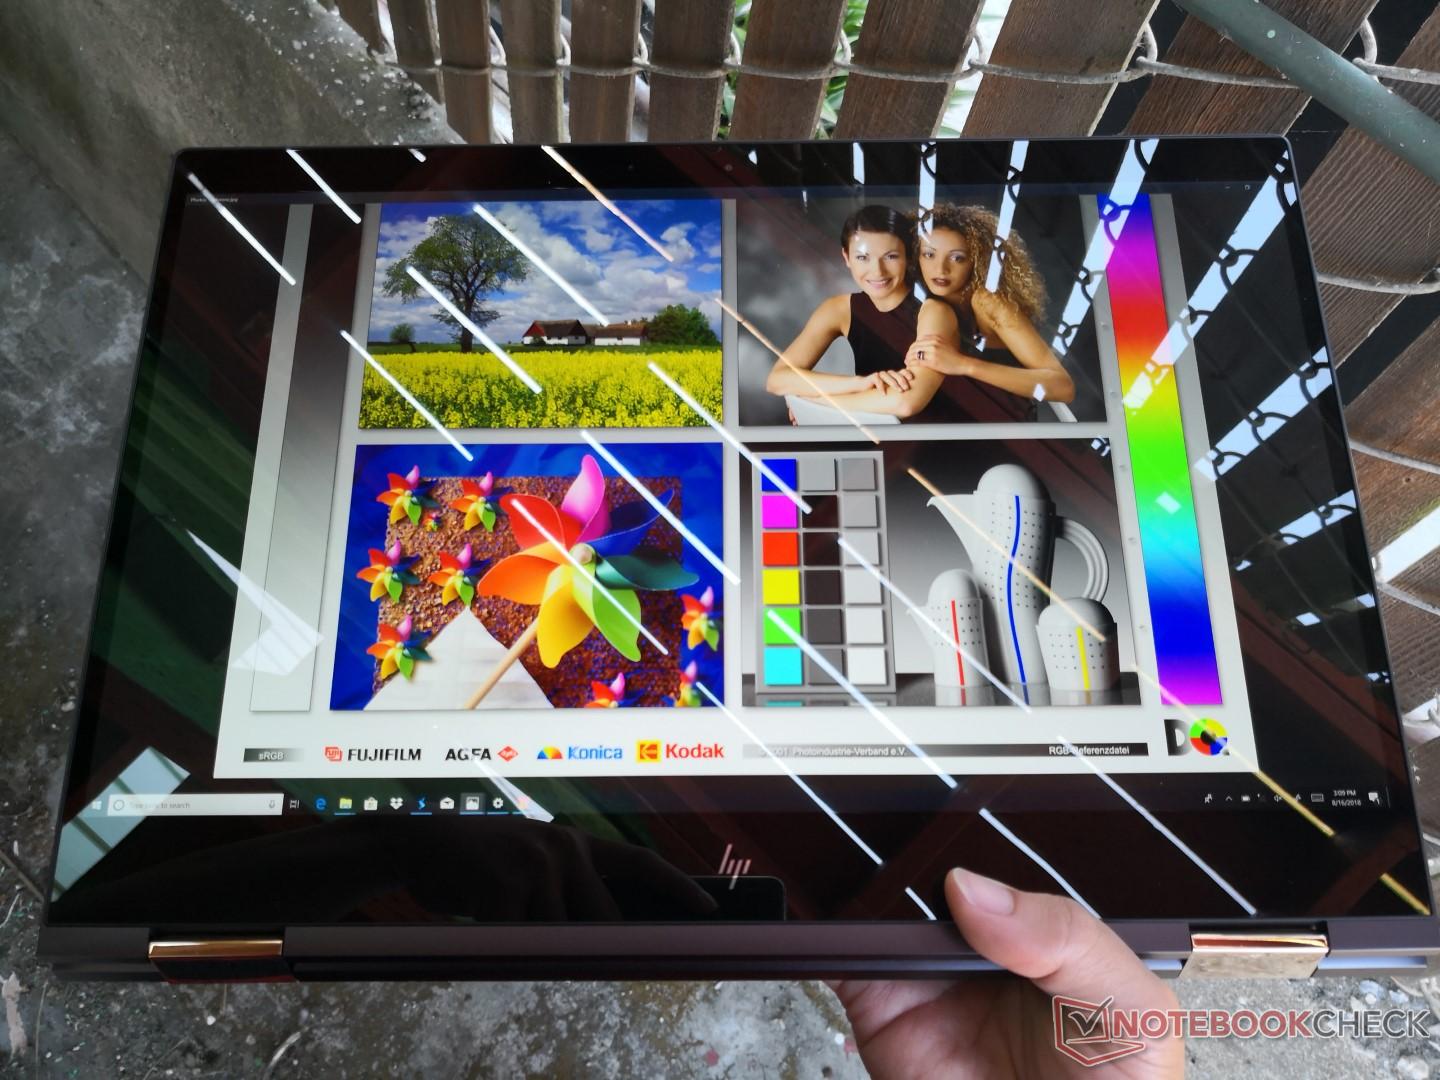
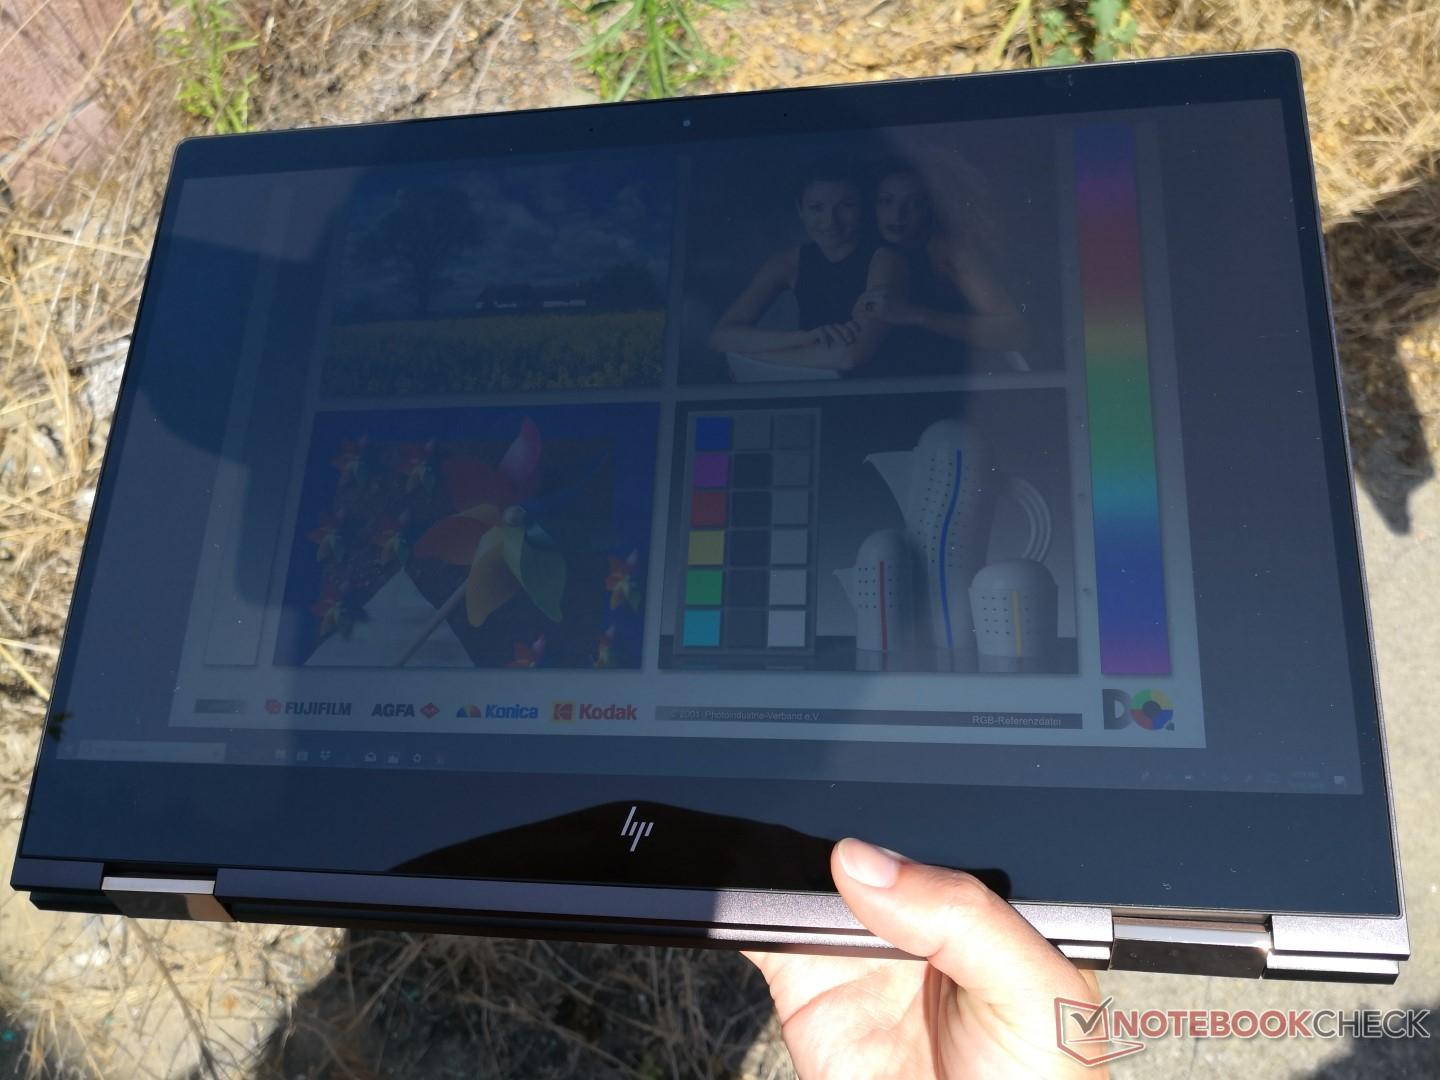
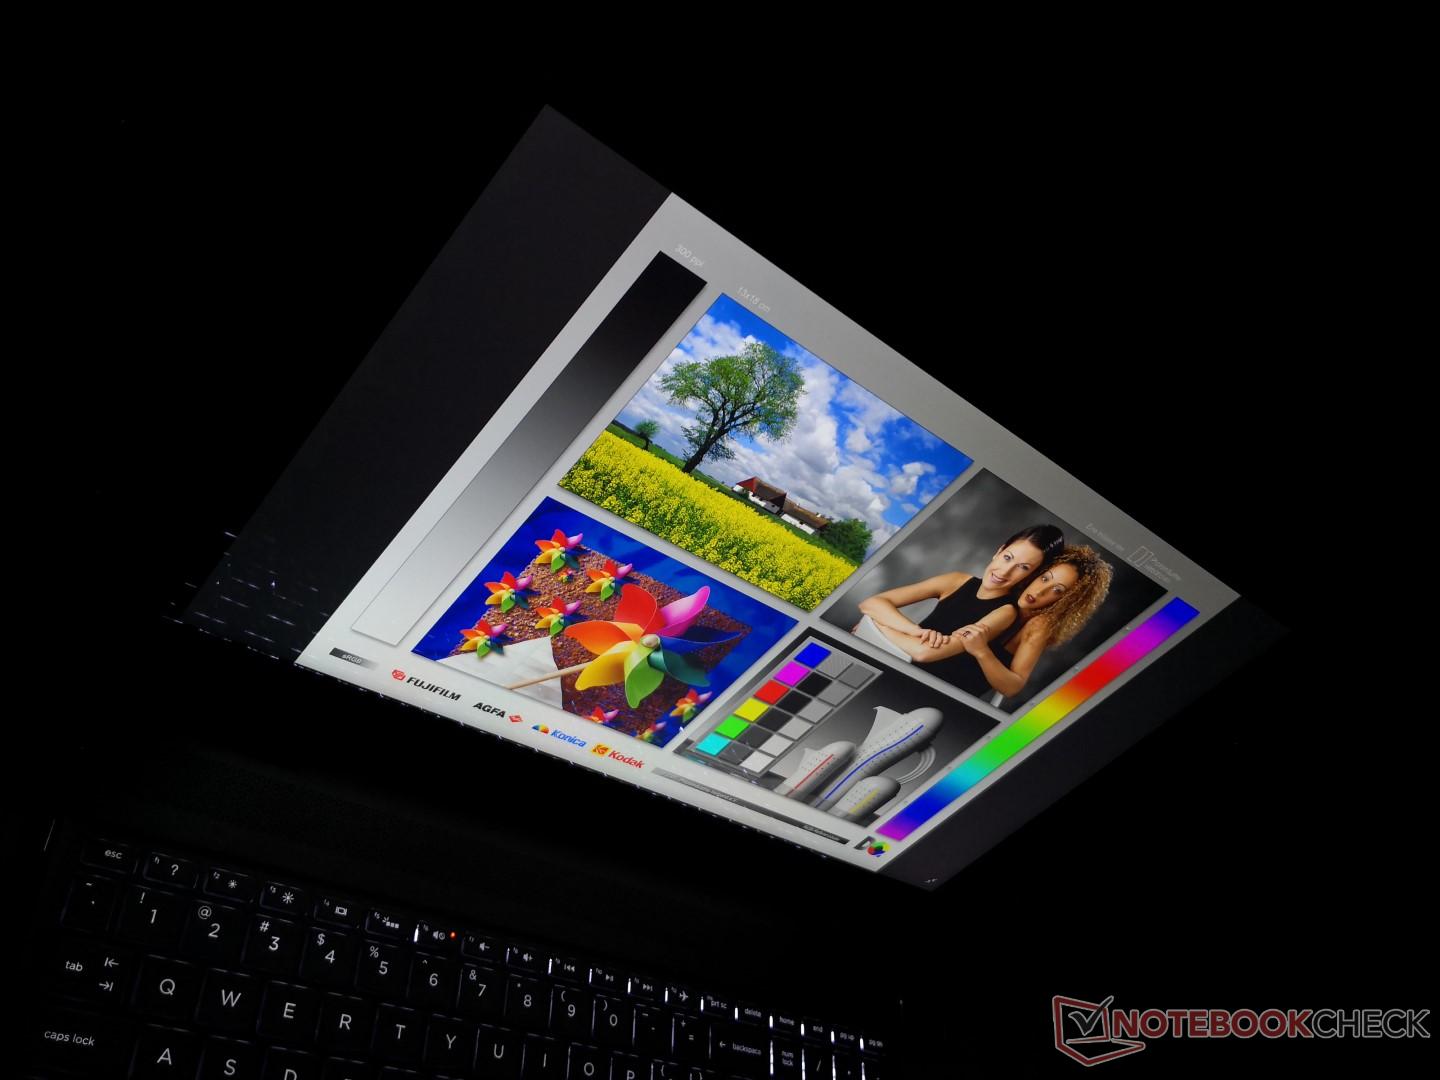
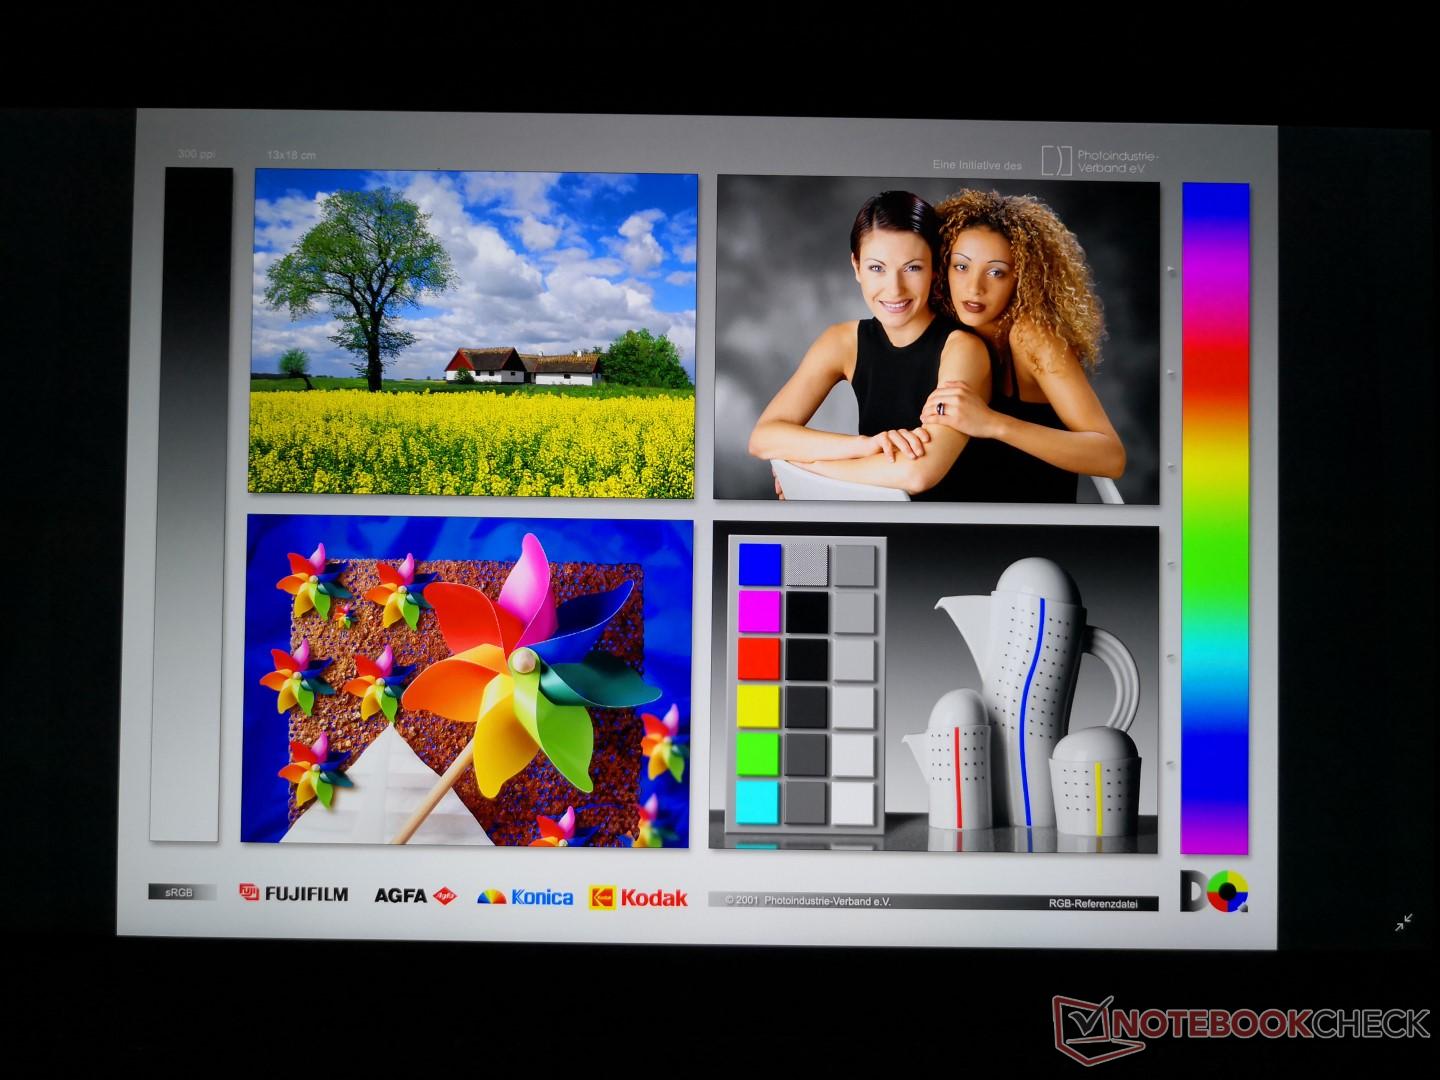
Display
A glossy 4K UHD touchscreen comes standard on the Spectre x360 15 2018 with no other resolution options available. Perhaps unsurprisingly, our Kaby Lake-G configuration utilizes the same BOE0730 4K UHD panel as on the Kaby Lake-R SKU and so contrast, response times, and colors are consequently very similar between them. This unfortunately means that PWM is still present and users sensitive to onscreen flickering may want to avoid this convertible altogether. See our existing review on the Kaby Lake-R configuration for more information on the display.
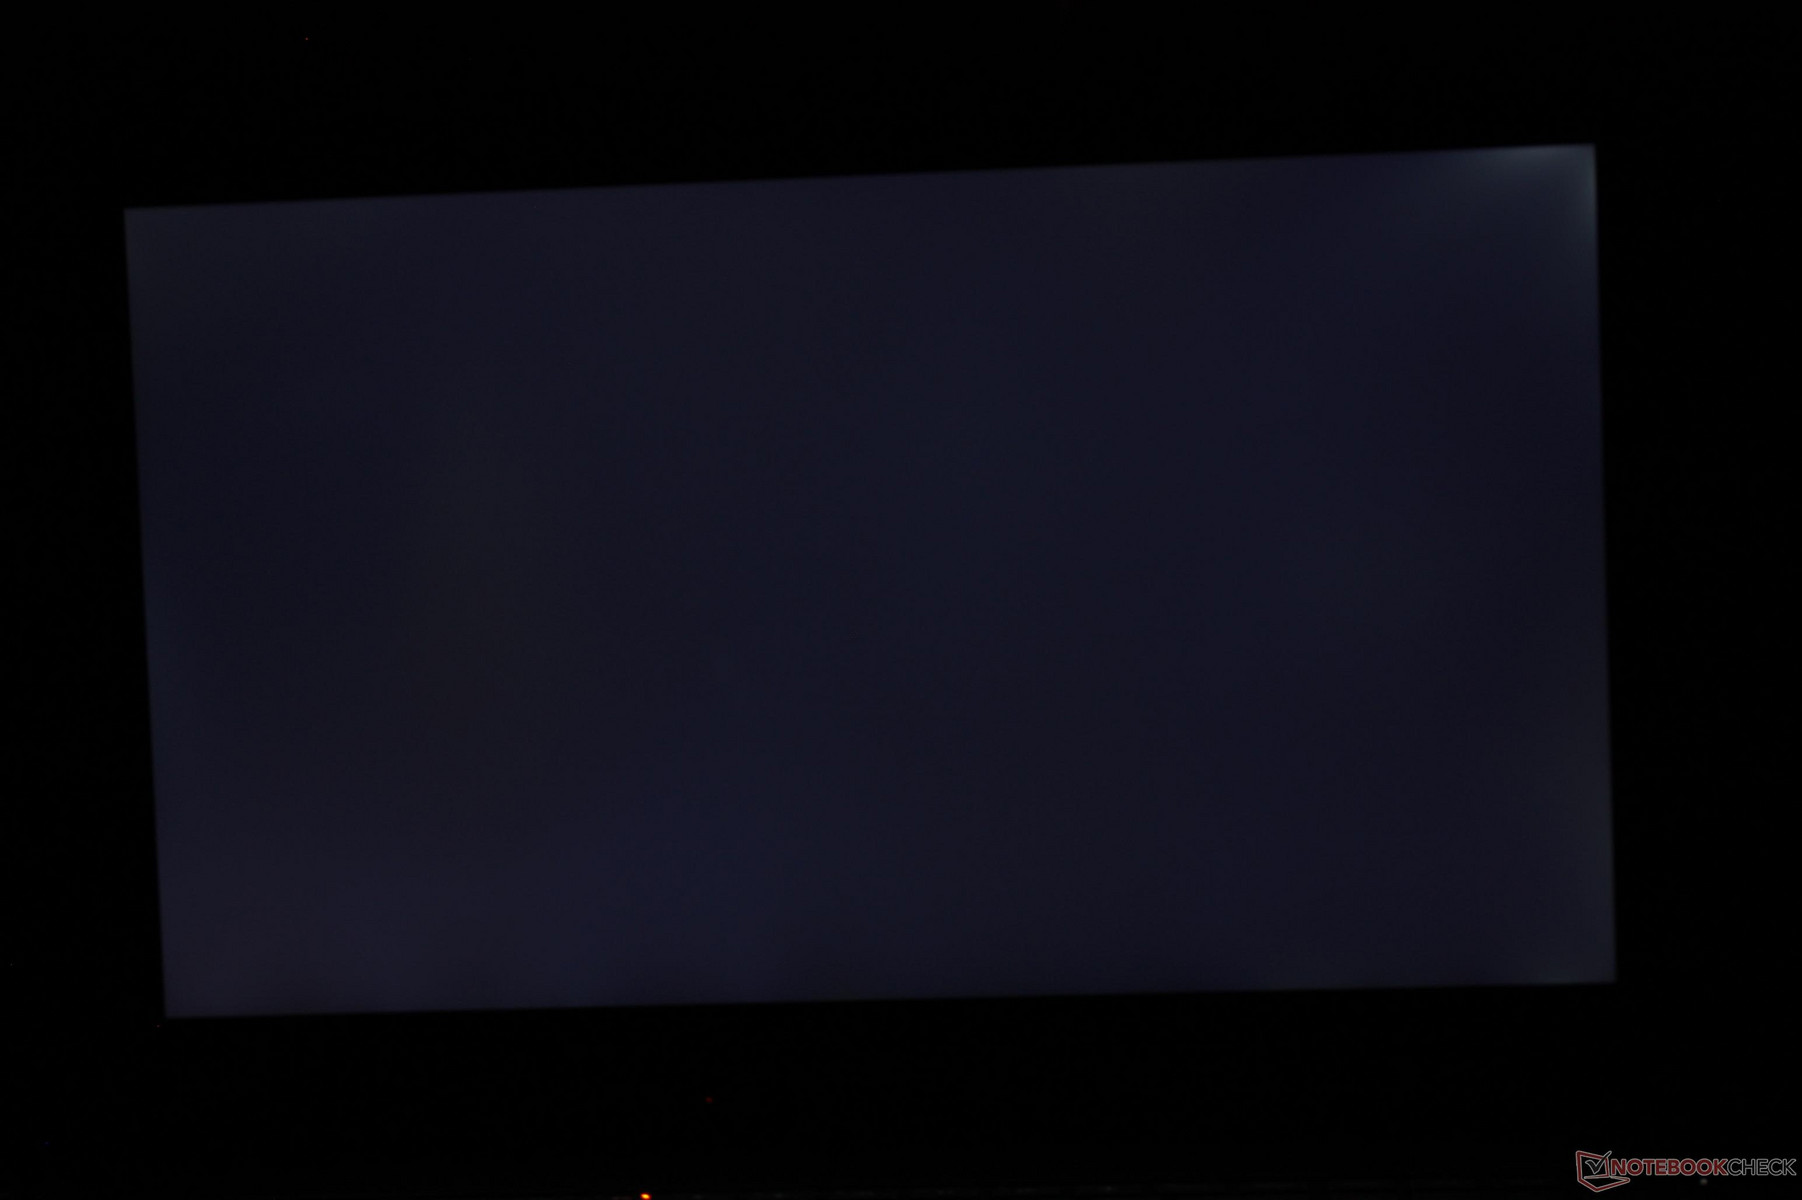
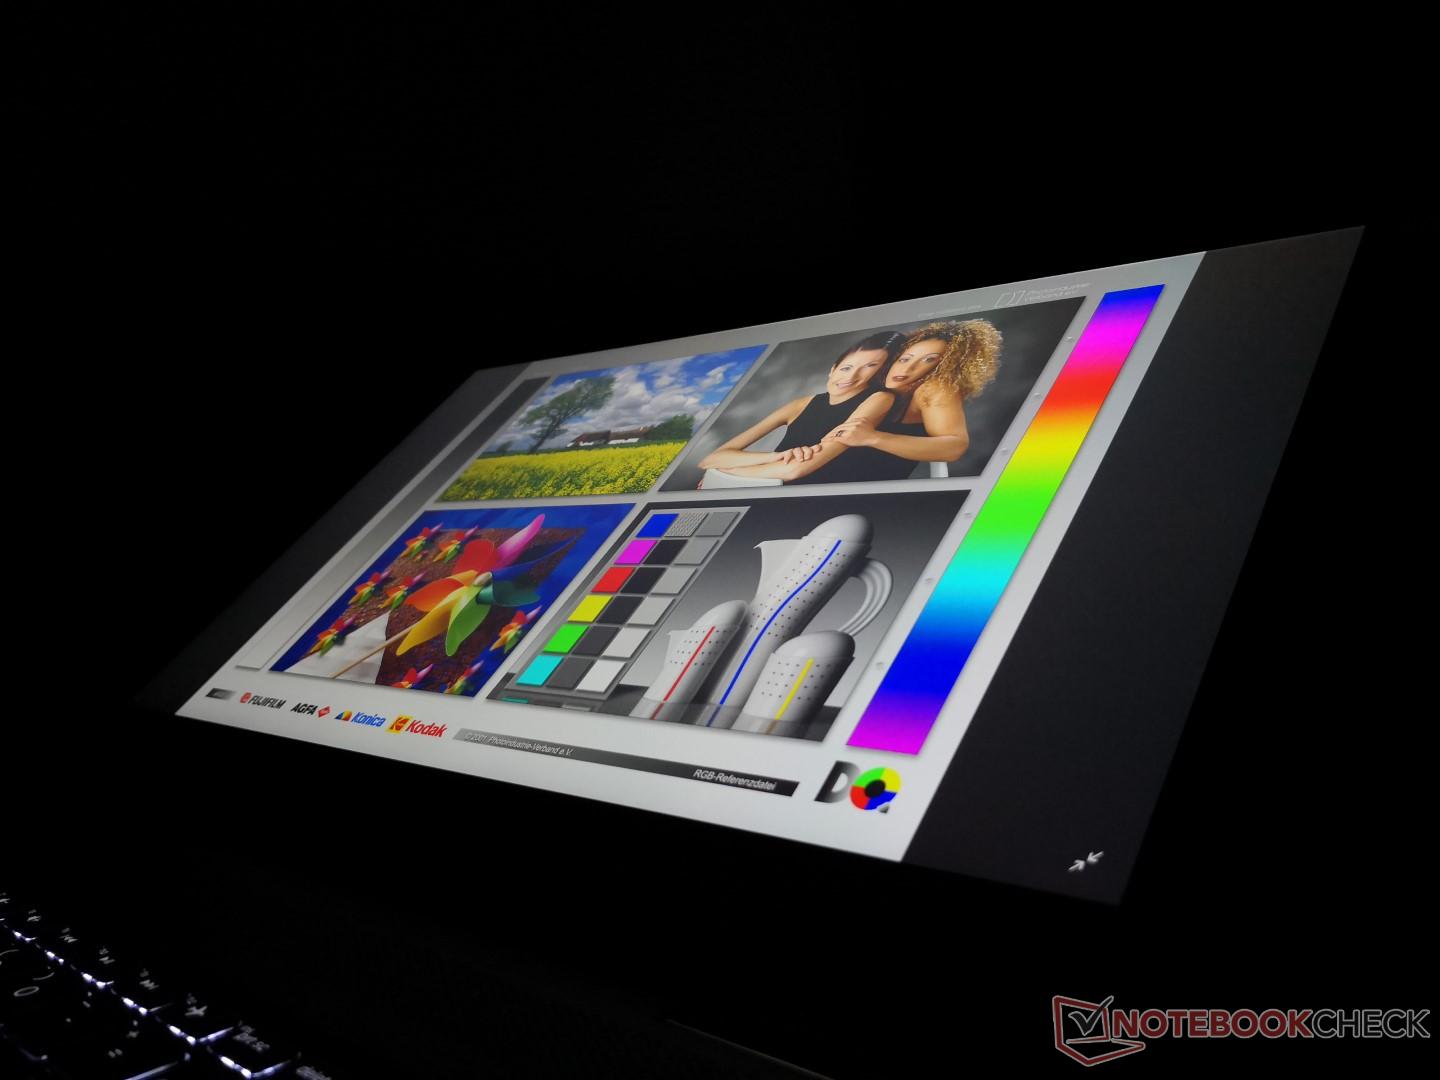
Backlight bleeding is present on the corners of our test unit as shown by the image below. It's actually more acute than on our Kaby Lake-R unit, though thankfully not significant enough to be distracting or very noticeable during video playback.
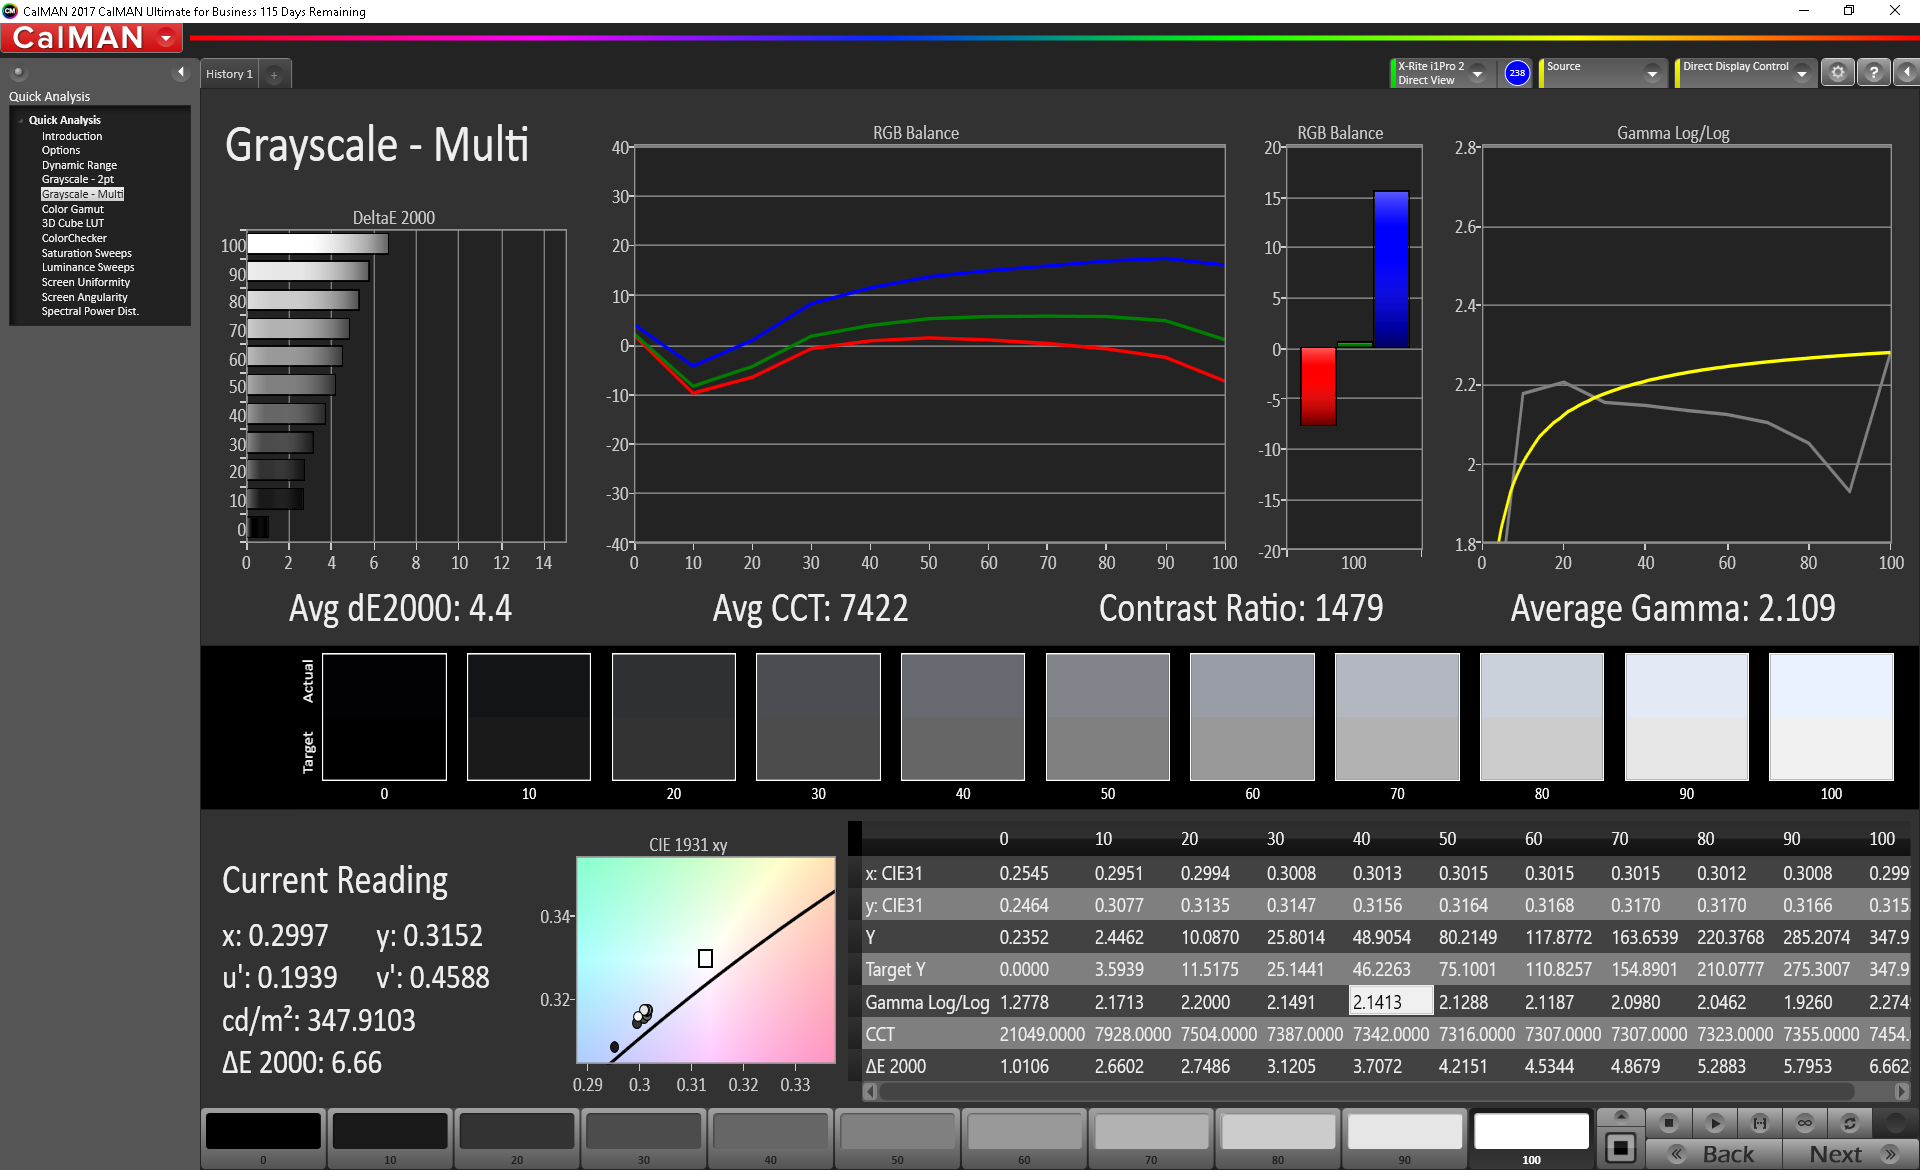
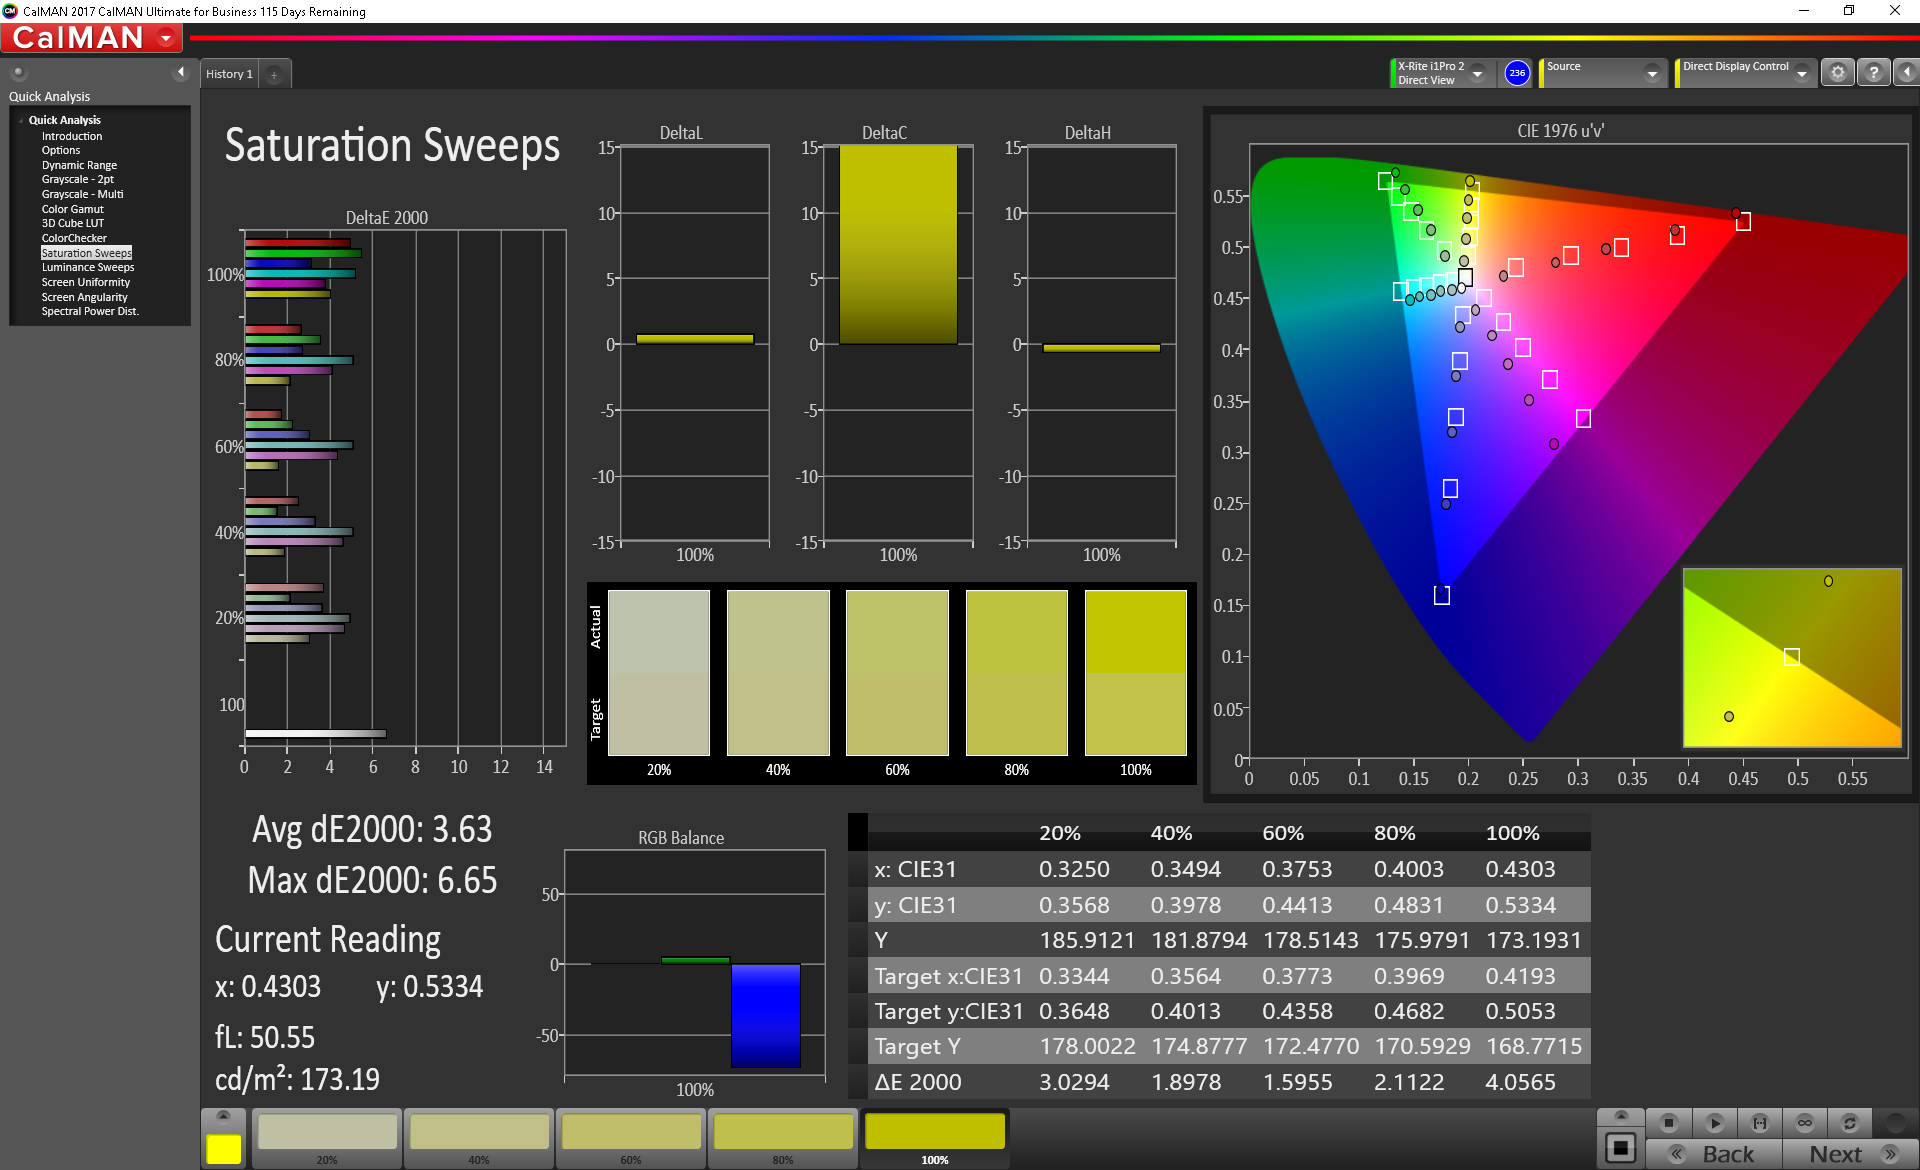
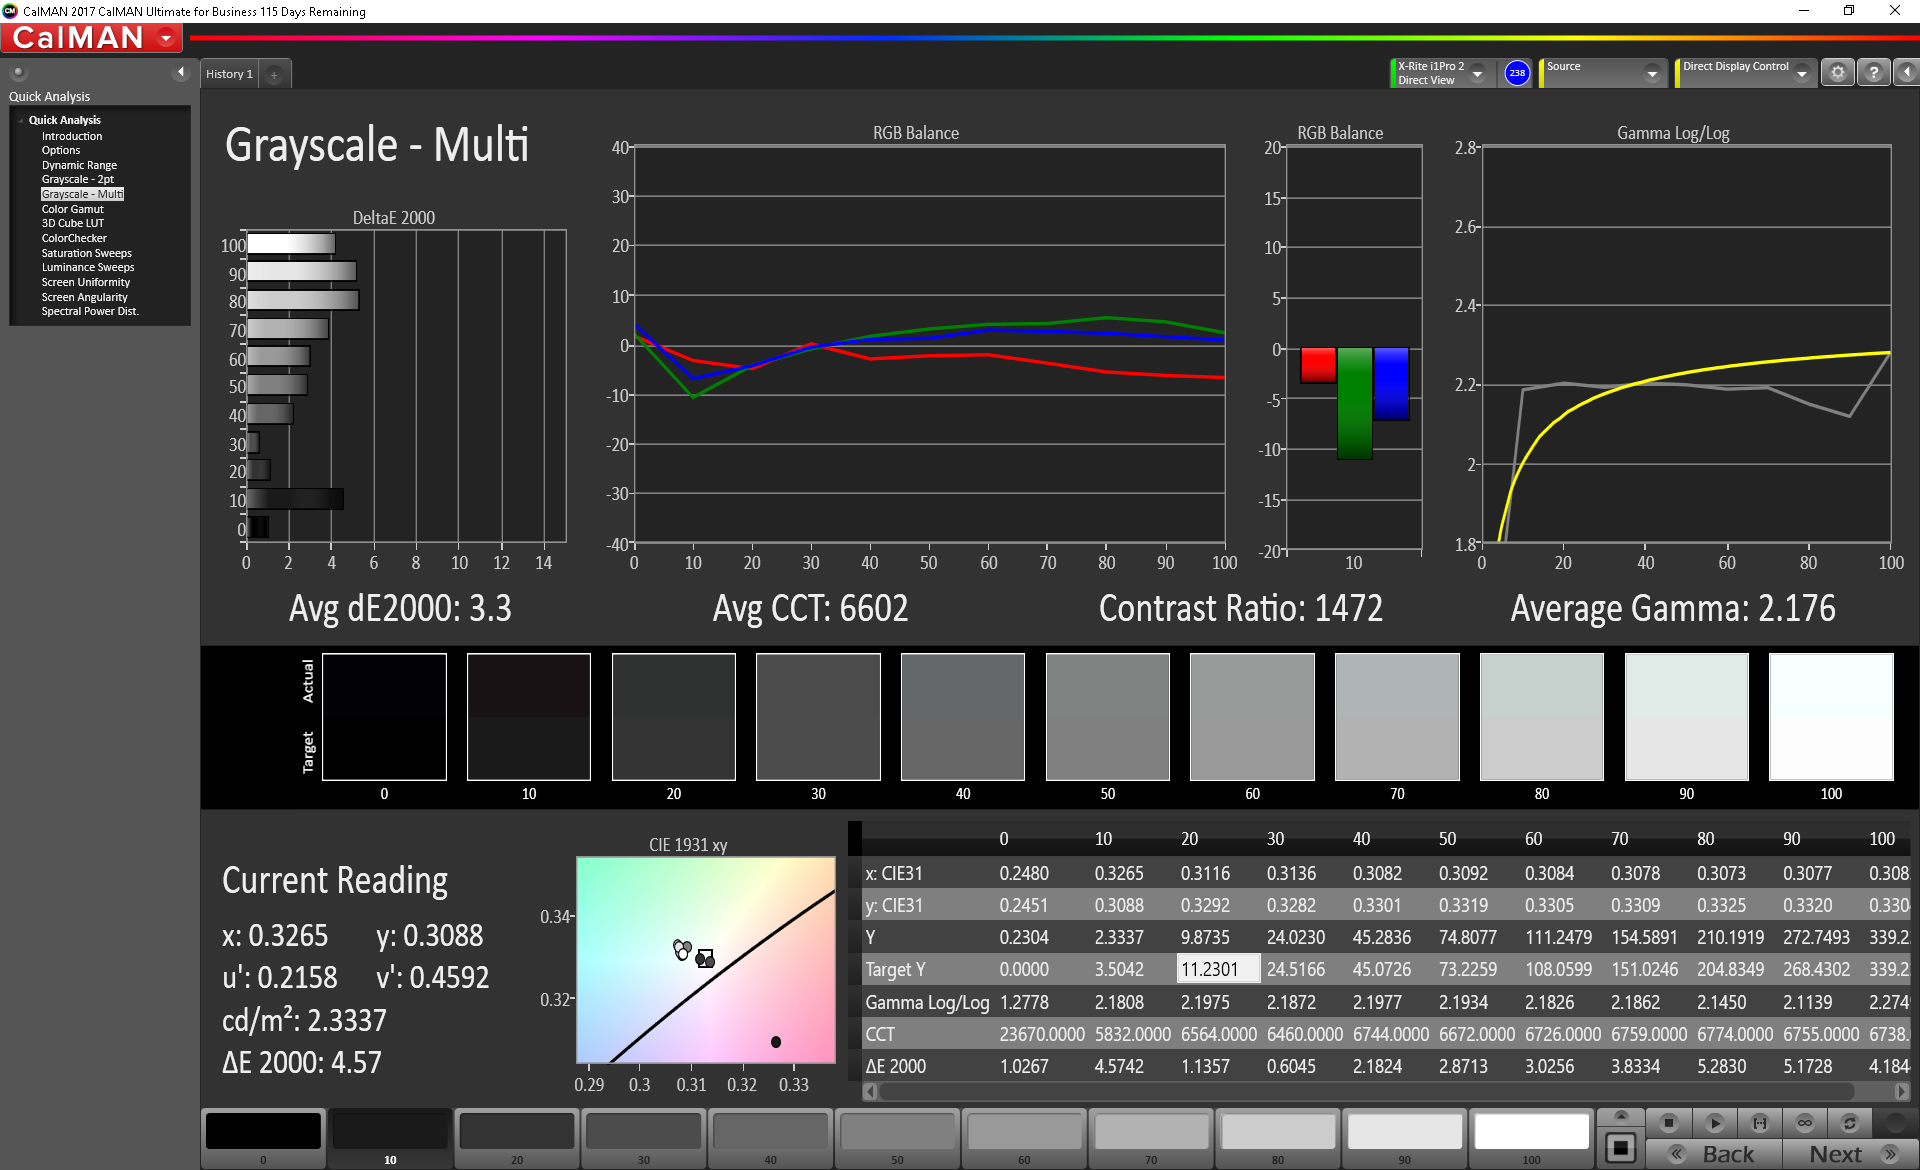
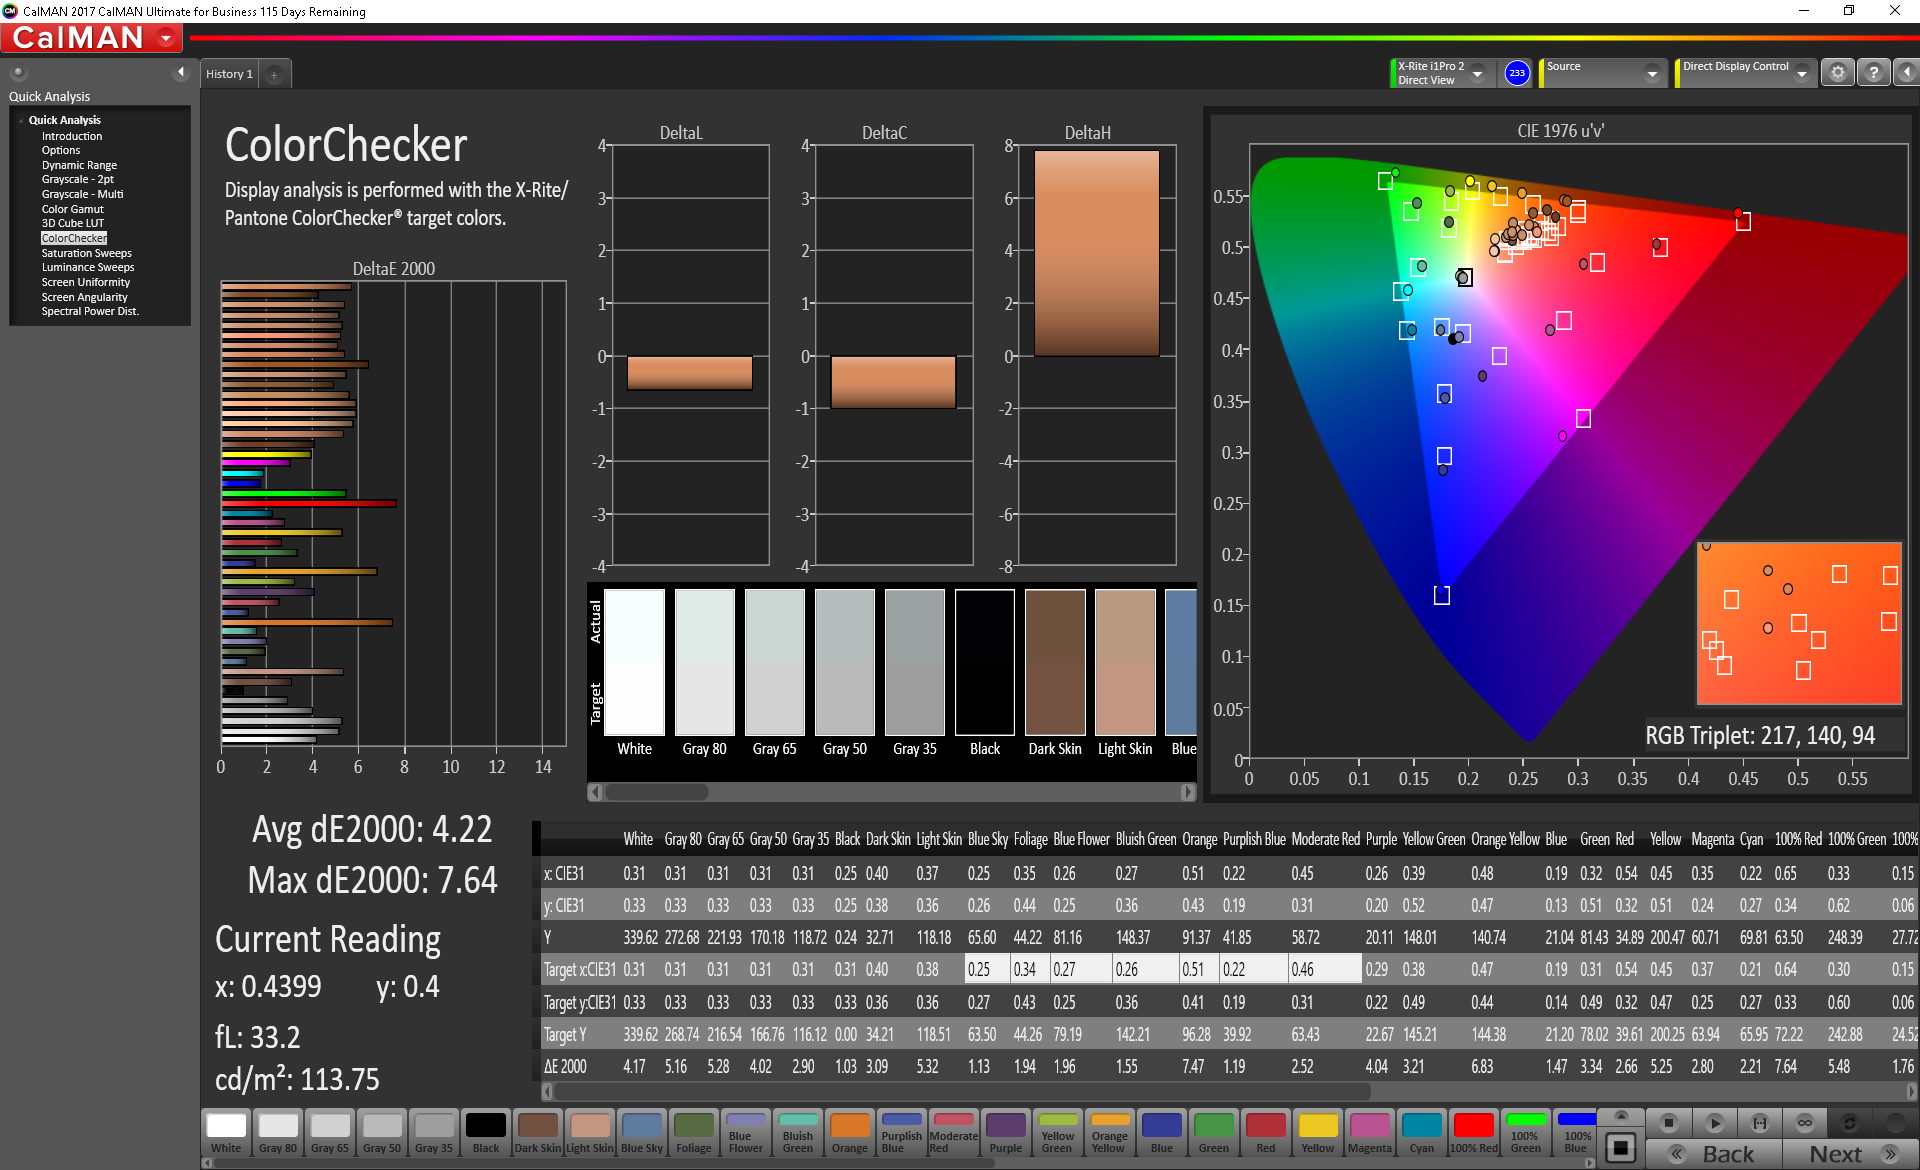
Interestingly, the display on our Kaby Lake-G SKU is better calibrated out-of-the-box than our Kaby Lake-R SKU. We still recommend an end-user calibration for the best possible grayscale and colors.

| |||||||||||||||||||||||||
Brightness Distribution: 90 %
Center on Battery: 349.5 cd/m²
Contrast: 1205:1 (Black: 0.29 cd/m²)
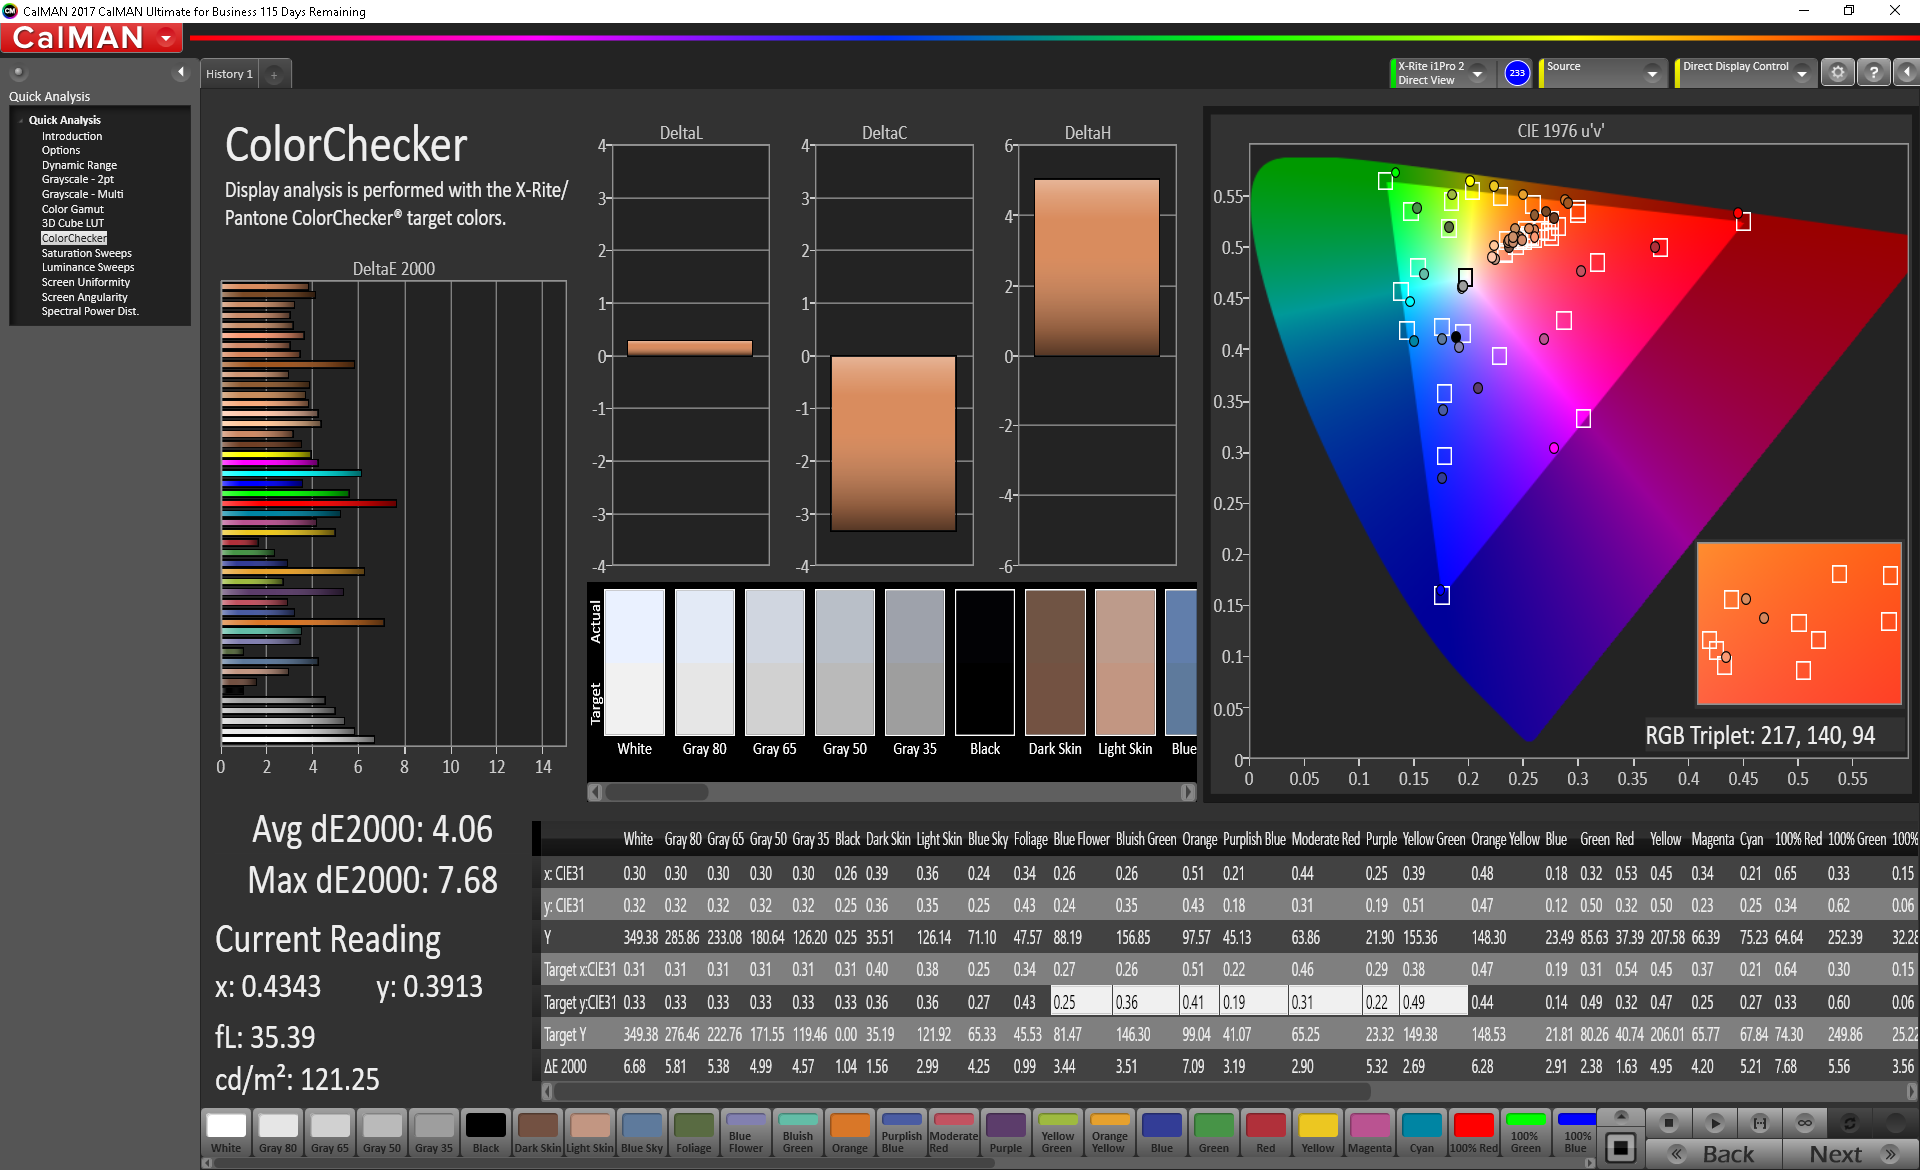
ΔE Color 4.06 | 0.5-29.43 Ø5, calibrated: 4.22
ΔE Greyscale 4.4 | 0.57-98 Ø5.3
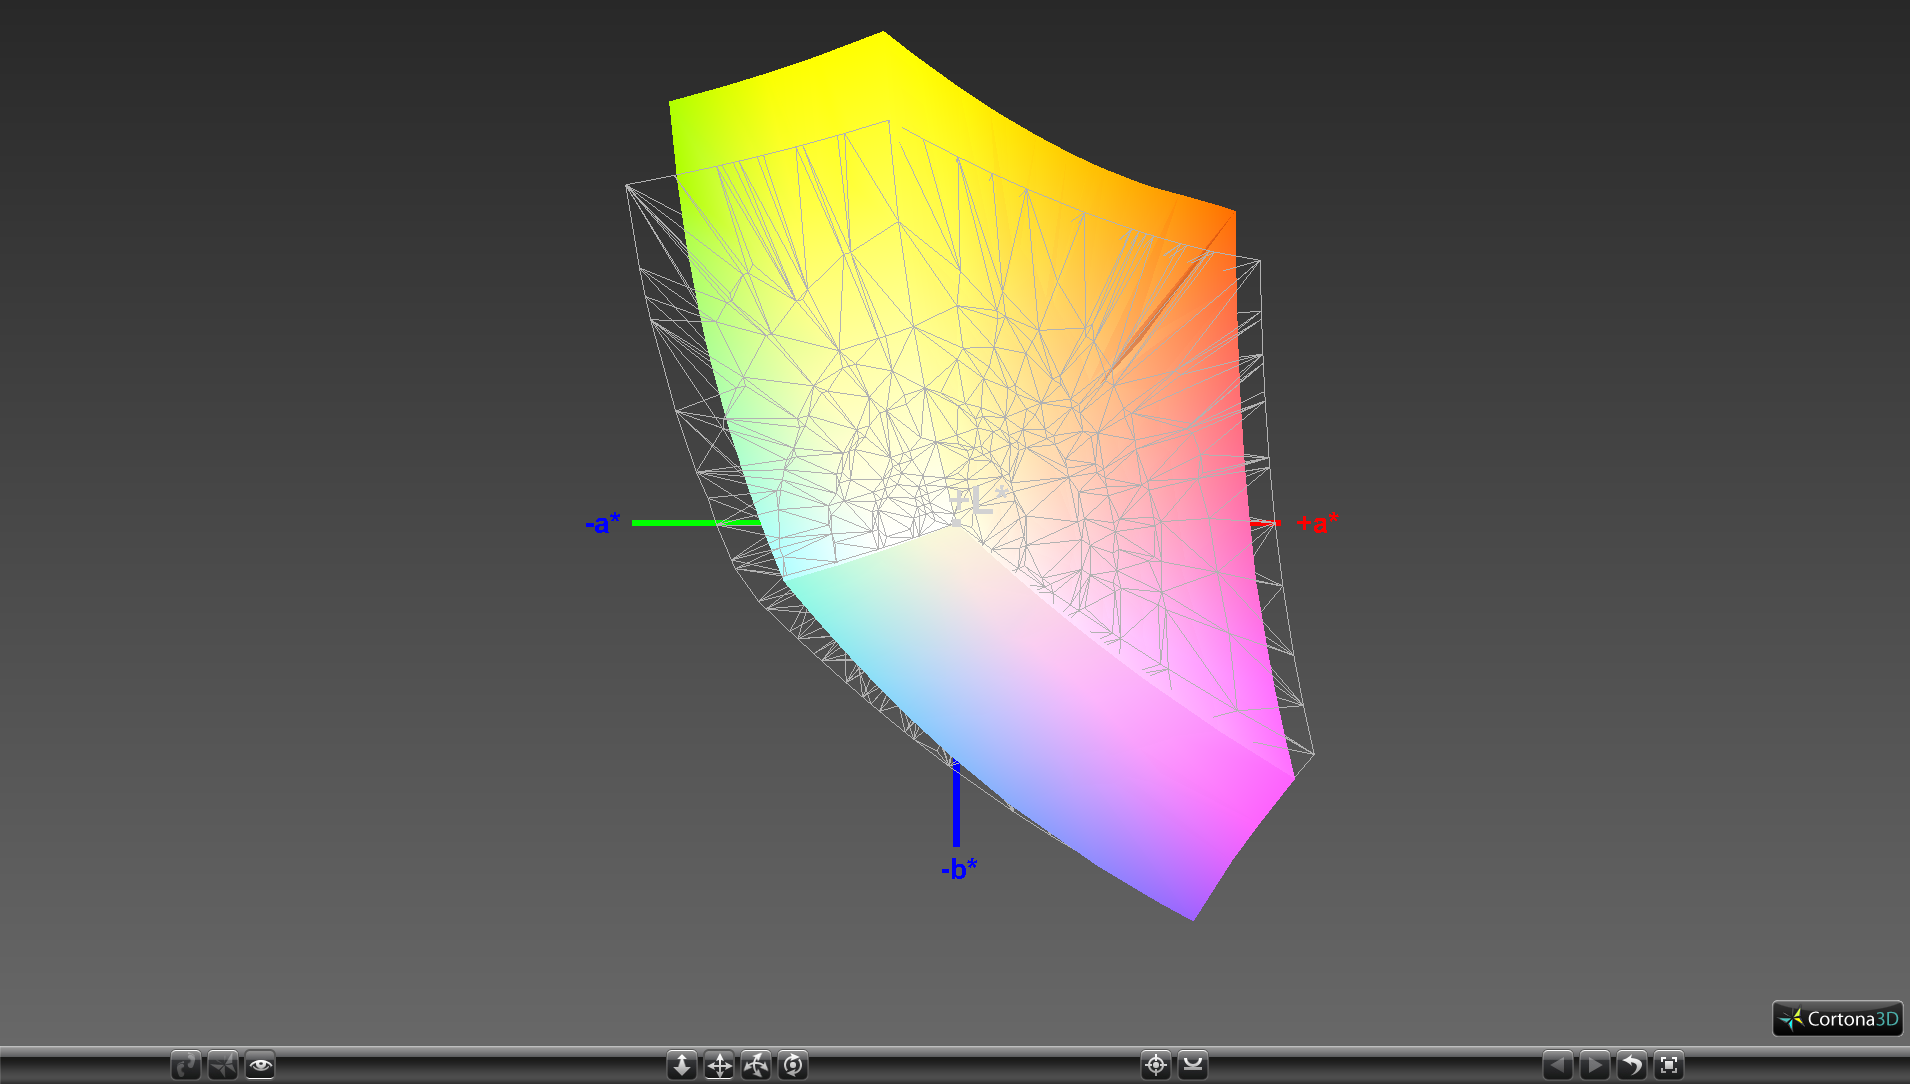
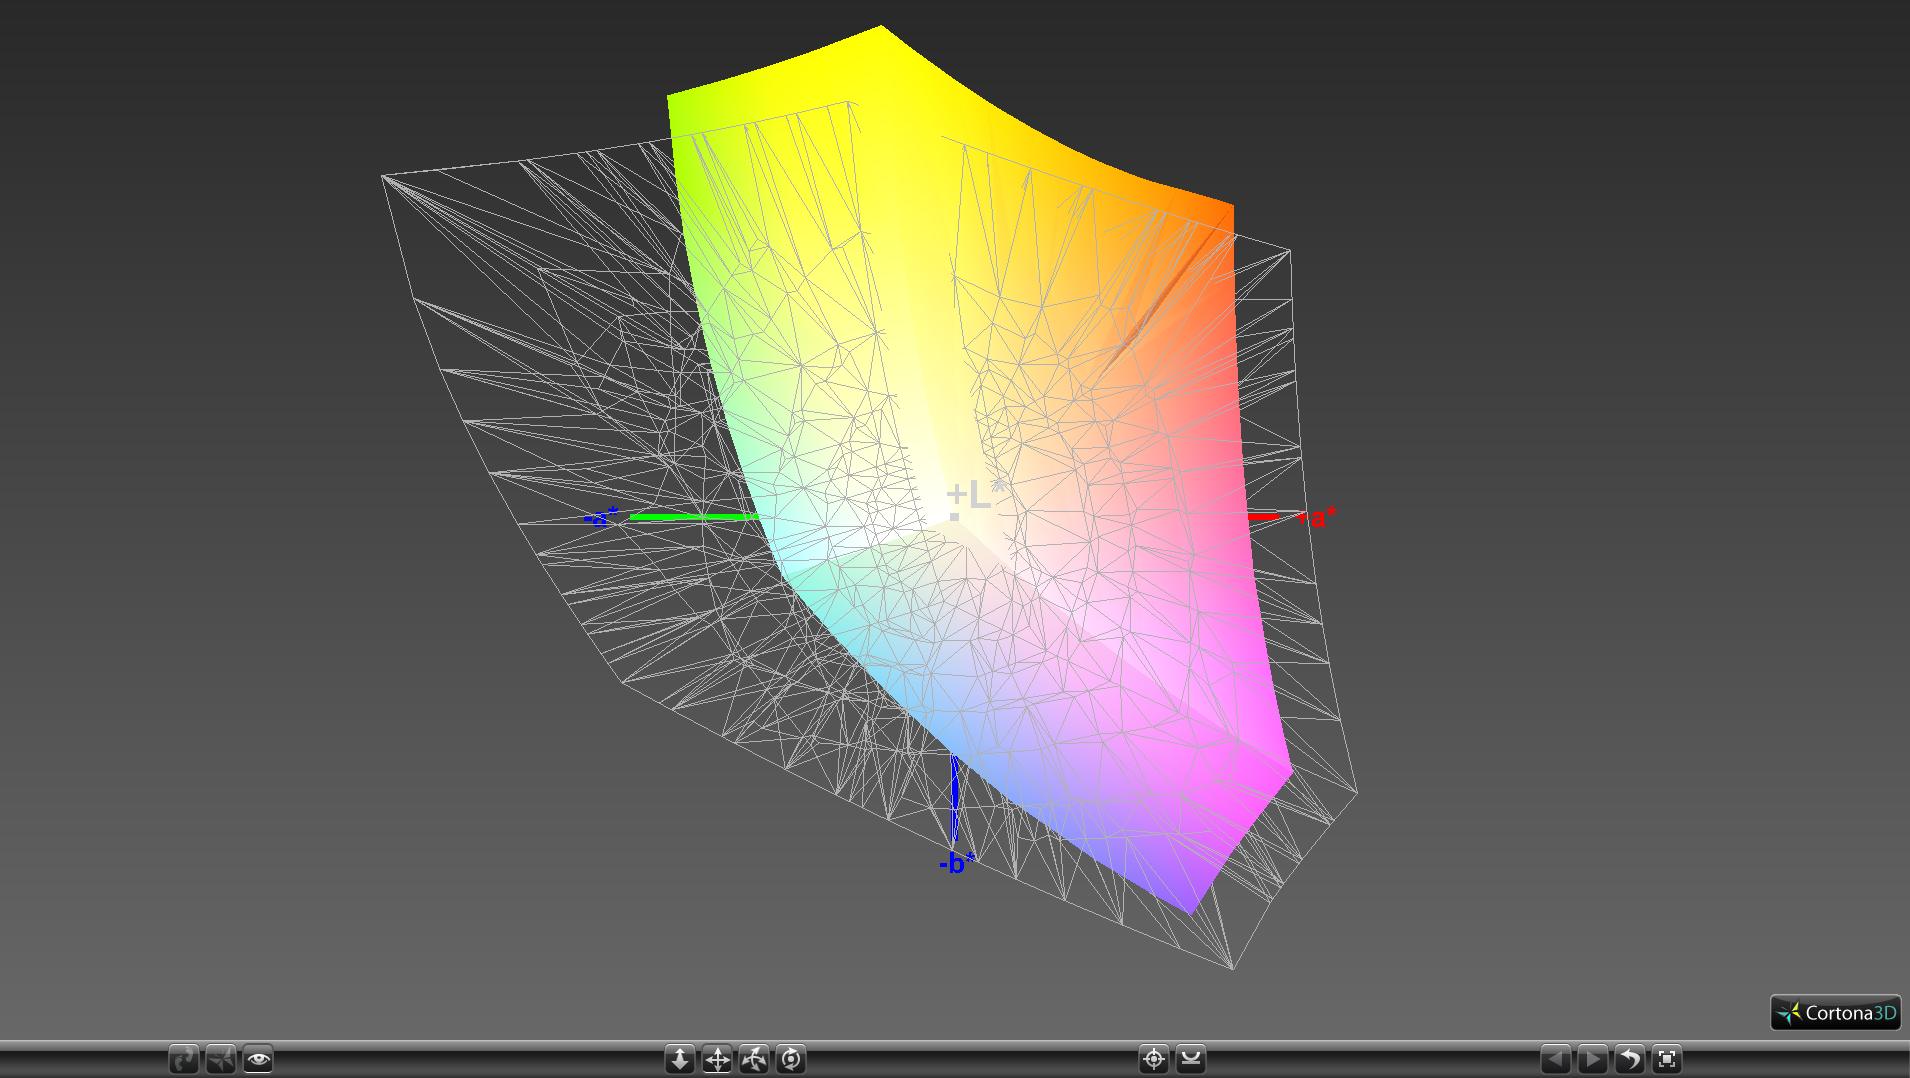
86.9% sRGB (Argyll 1.6.3 3D)
56.5% AdobeRGB 1998 (Argyll 1.6.3 3D)
63.8% AdobeRGB 1998 (Argyll 2.2.0 3D)
87.4% sRGB (Argyll 2.2.0 3D)
66.7% Display P3 (Argyll 2.2.0 3D)
Gamma: 2.11
| HP Spectre x360 15-ch000 BOE0730, IPS, 15.60, 3840x2160 | Asus ZenBook Pro 15 UX580GE AU Optronics B156ZAN03.1, IPS, 15.60, 3840x2160 | Dell XPS 15 9575 i7-8705G Sharp SHP148D, IPS, 15.60, 3840x2160 | HP Spectre x360 15-ch011nr BOE0730, IPS, 15.60, 3840x2160 | MSI GS65 8RF-019DE Stealth Thin AU Optronics B156HAN08.0 (AUO80ED), IPS, 15.60, 1920x1080 | |
|---|---|---|---|---|---|
| Display | 33% | 18% | 4% | 3% | |
| Display P3 Coverage | 66.7 | 85.9 29% | 78.7 18% | 68.5 3% | 66.2 -1% |
| sRGB Coverage | 87.4 | 100 14% | 97.9 12% | 90.7 4% | 92.1 5% |
| AdobeRGB 1998 Coverage | 63.8 | 99.1 55% | 79.2 24% | 66.3 4% | 67.2 5% |
| Response Times | -10% | -25% | -8% | 49% | |
| Response Time Grey 50% / Grey 80% * | 36 ? | 44 ? -22% | 48.4 ? -34% | 38 ? -6% | 17.6 ? 51% |
| Response Time Black / White * | 23.6 ? | 22.8 ? 3% | 34.8 ? -47% | 27.6 ? -17% | 12.8 ? 46% |
| PWM Frequency | 943 ? | 1000 ? 6% | 943 ? 0% | ||
| Screen | 6% | 17% | -15% | 17% | |
| Brightness middle | 349.5 | 357.6 2% | 488 40% | 329.3 -6% | 254 -27% |
| Brightness | 331 | 350 6% | 440 33% | 316 -5% | 262 -21% |
| Brightness Distribution | 90 | 85 -6% | 81 -10% | 84 -7% | 89 -1% |
| Black Level * | 0.29 | 0.35 -21% | 0.3 -3% | 0.31 -7% | 0.22 24% |
| Contrast | 1205 | 1022 -15% | 1627 35% | 1062 -12% | 1155 -4% |
| Colorchecker dE 2000 * | 4.06 | 4.12 -1% | 3.16 22% | 4.78 -18% | 2.37 42% |
| Colorchecker dE 2000 max. * | 7.68 | 9.91 -29% | 8.8 -15% | 11.75 -53% | 4.71 39% |
| Colorchecker dE 2000 calibrated * | 4.22 | 4.23 -0% | 3.51 17% | 1.84 56% | |
| Greyscale dE 2000 * | 4.4 | 1.8 59% | 3.3 25% | 7.9 -80% | 1.58 64% |
| Gamma | 2.11 104% | 2.17 101% | 2.178 101% | 2.24 98% | 2.48 89% |
| CCT | 7422 88% | 6613 98% | 6811 95% | 8323 78% | 6785 96% |
| Color Space (Percent of AdobeRGB 1998) | 56.5 | 87.5 55% | 71.7 27% | 58.8 4% | 60 6% |
| Color Space (Percent of sRGB) | 86.9 | 100 15% | 97.9 13% | 90.4 4% | 92 6% |
| Total Average (Program / Settings) | 10% /
9% | 3% /
9% | -6% /
-10% | 23% /
18% |
* ... smaller is better

Display Response Times
| ↔ Response Time Black to White | ||
|---|---|---|
| 23.6 ms ... rise ↗ and fall ↘ combined | ↗ 12 ms rise | 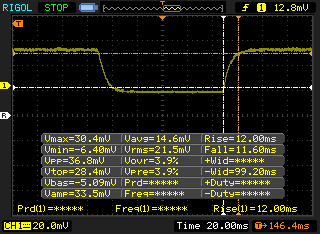 |
| ↘ 11.6 ms fall | ||
| The screen shows good response rates in our tests, but may be too slow for competitive gamers. In comparison, all tested devices range from 0.1 (minimum) to 240 (maximum) ms. » 48 % of all devices are better. This means that the measured response time is similar to the average of all tested devices (21.5 ms). | ||
| ↔ Response Time 50% Grey to 80% Grey | ||
| 36 ms ... rise ↗ and fall ↘ combined | ↗ 18 ms rise | 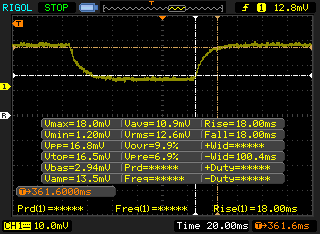 |
| ↘ 18 ms fall | ||
| The screen shows slow response rates in our tests and will be unsatisfactory for gamers. In comparison, all tested devices range from 0.2 (minimum) to 636 (maximum) ms. » 44 % of all devices are better. This means that the measured response time is similar to the average of all tested devices (33.8 ms). | ||
Screen Flickering / PWM (Pulse-Width Modulation)
| Screen flickering / PWM detected | 943 Hz | ≤ 99 % brightness setting | 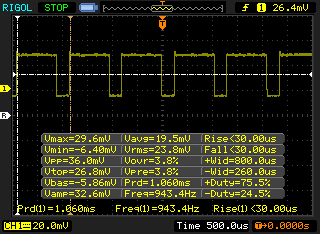 |
The display backlight flickers at 943 Hz (worst case, e.g., utilizing PWM) Flickering detected at a brightness setting of 99 % and below. There should be no flickering or PWM above this brightness setting. The frequency of 943 Hz is quite high, so most users sensitive to PWM should not notice any flickering. In comparison: 53 % of all tested devices do not use PWM to dim the display. If PWM was detected, an average of 17942 (minimum: 5 - maximum: 3846000) Hz was measured. | |||
Performance
Unlike the XPS 15 9575 and its two Kaby Lake-G options, the Spectre x360 15 does not carry the slower i5-8305G CPU. Nonetheless, it aims for a similar audience who may desire very fast multimedia performance in a versatile 2-in-1 form factor. Most convertible notebooks are limited to integrated UHD Graphics and are thus very slow for gaming and video editing purposes compared to our Spectre.
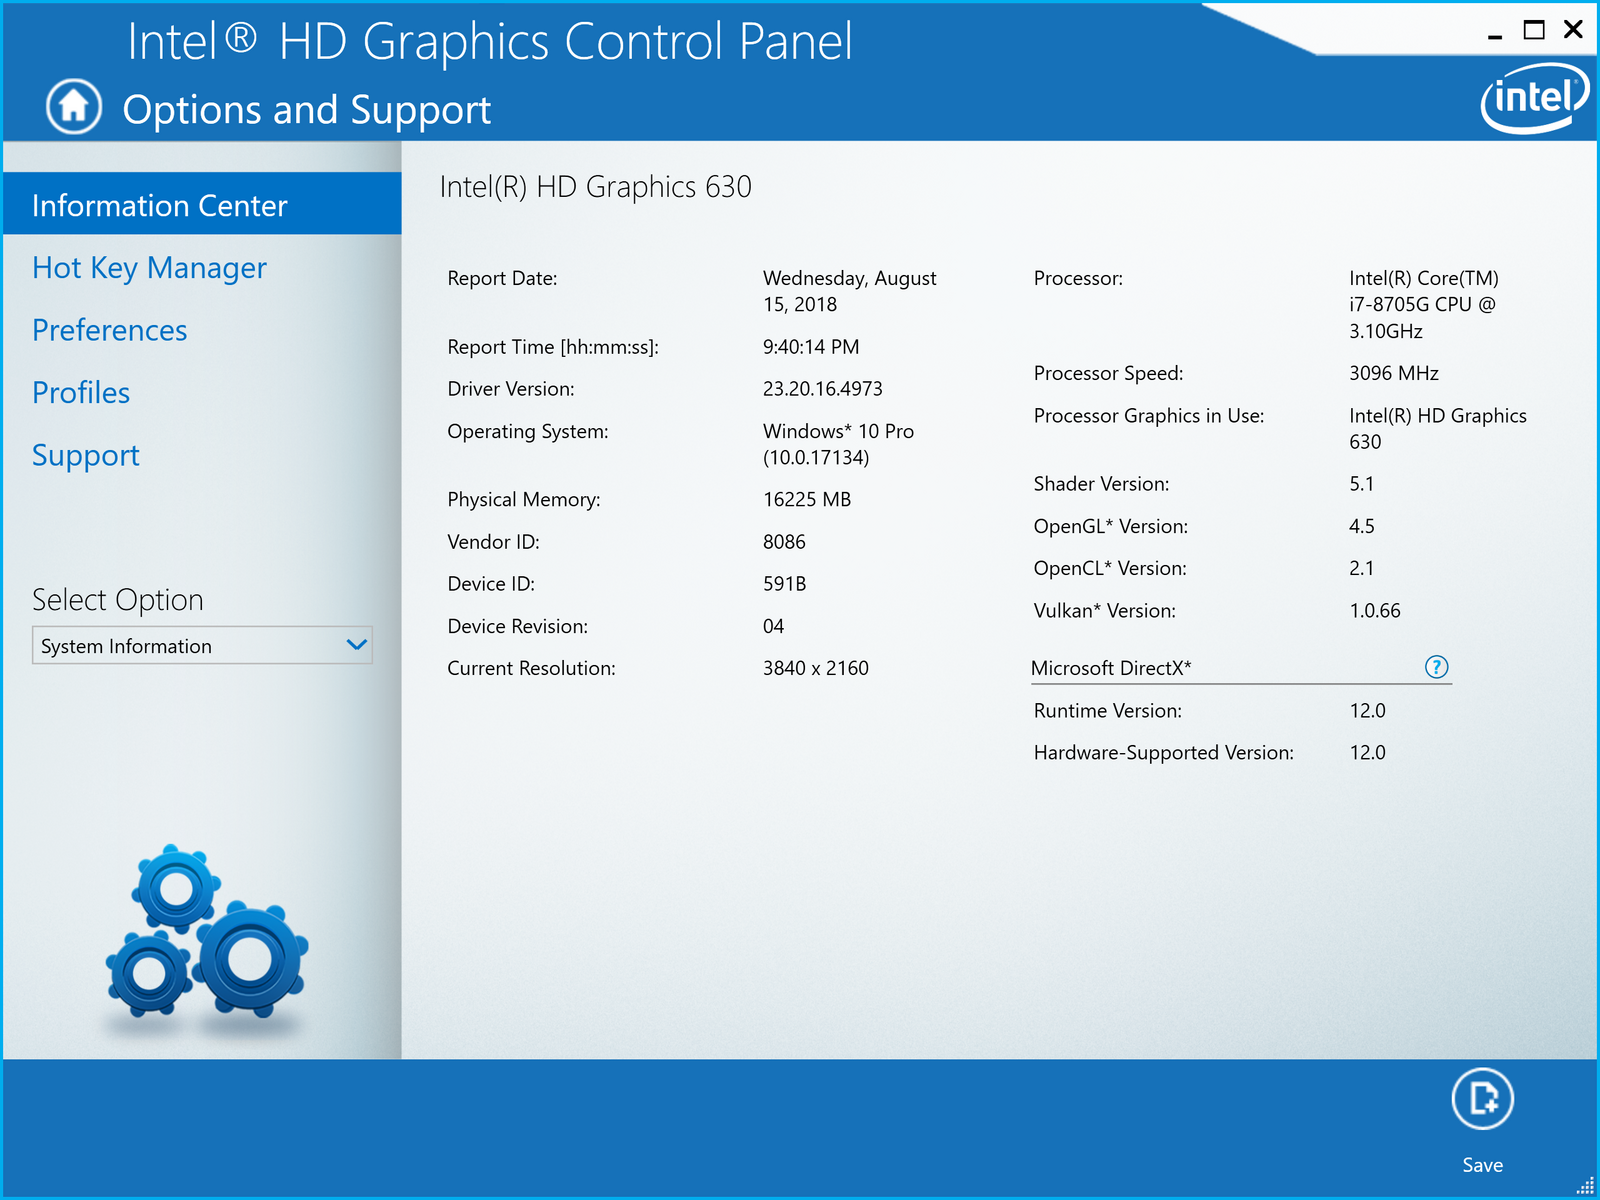
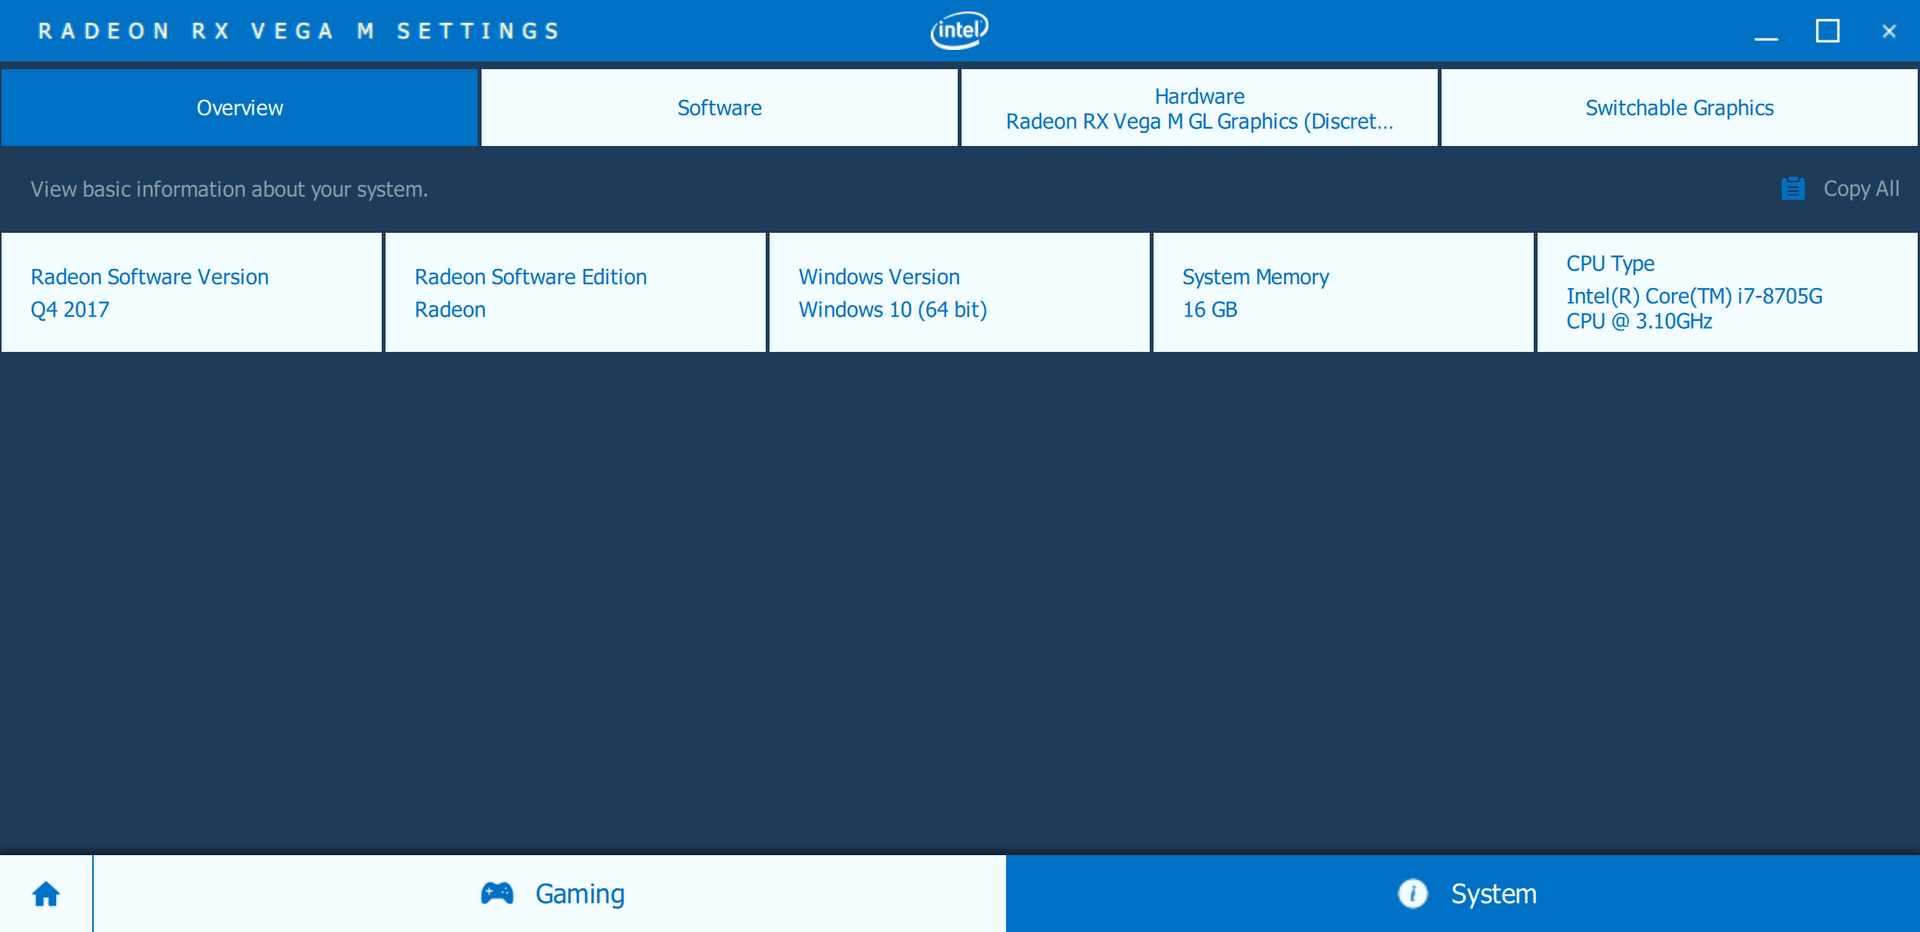
There is no Optimus graphics switching since both the integrated Intel GPU and discrete AMD GPU are always active.
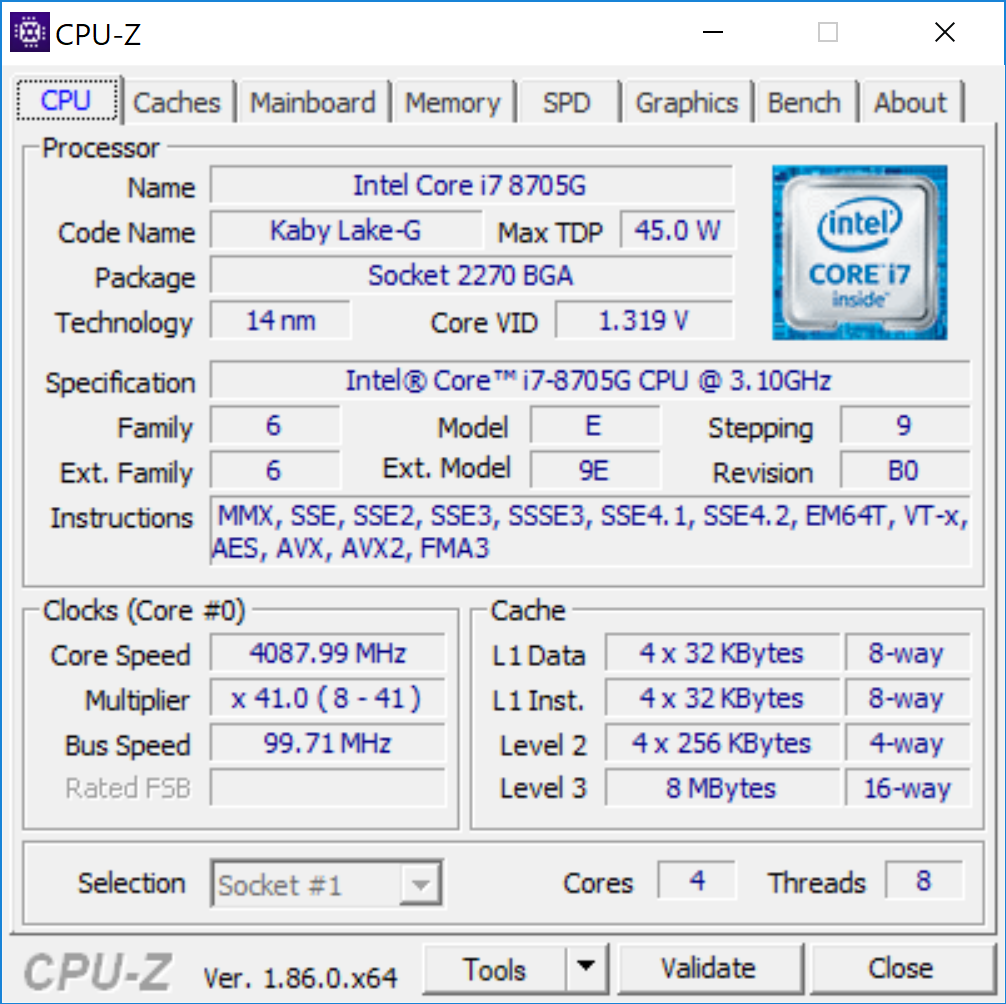
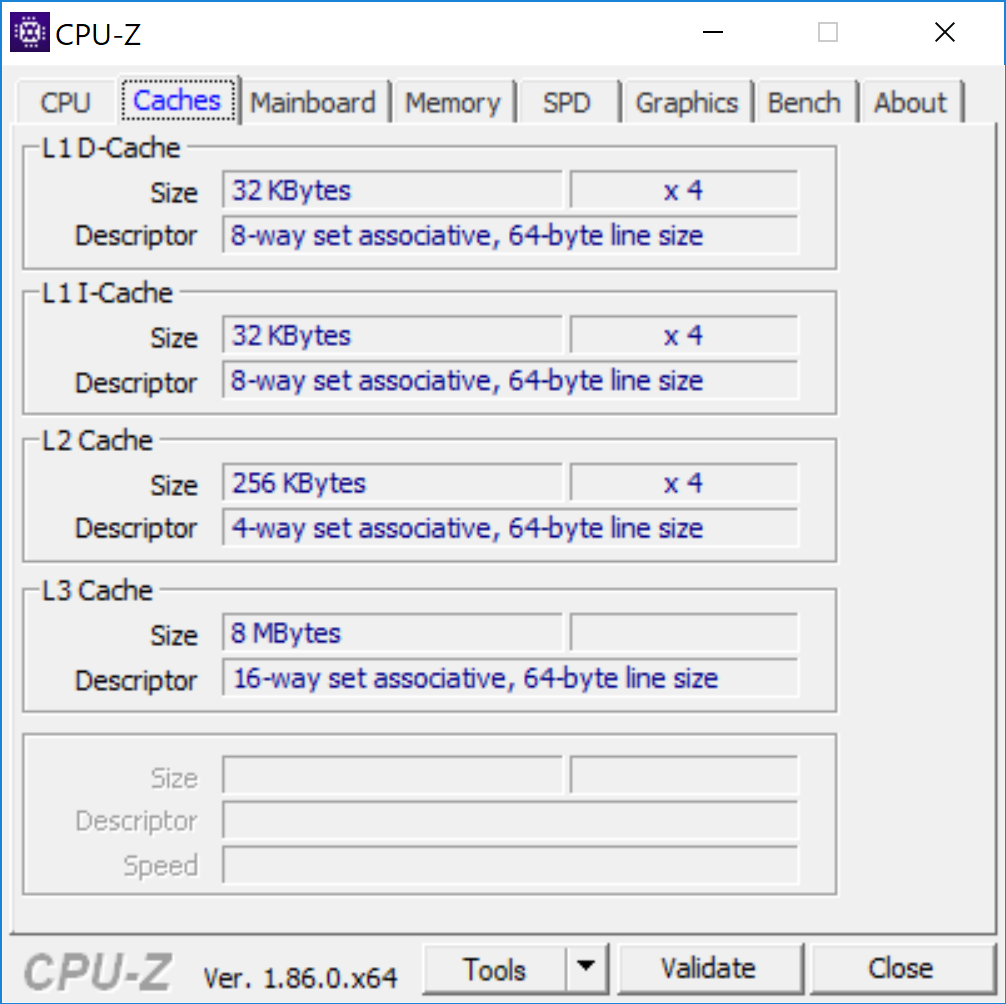
Processor
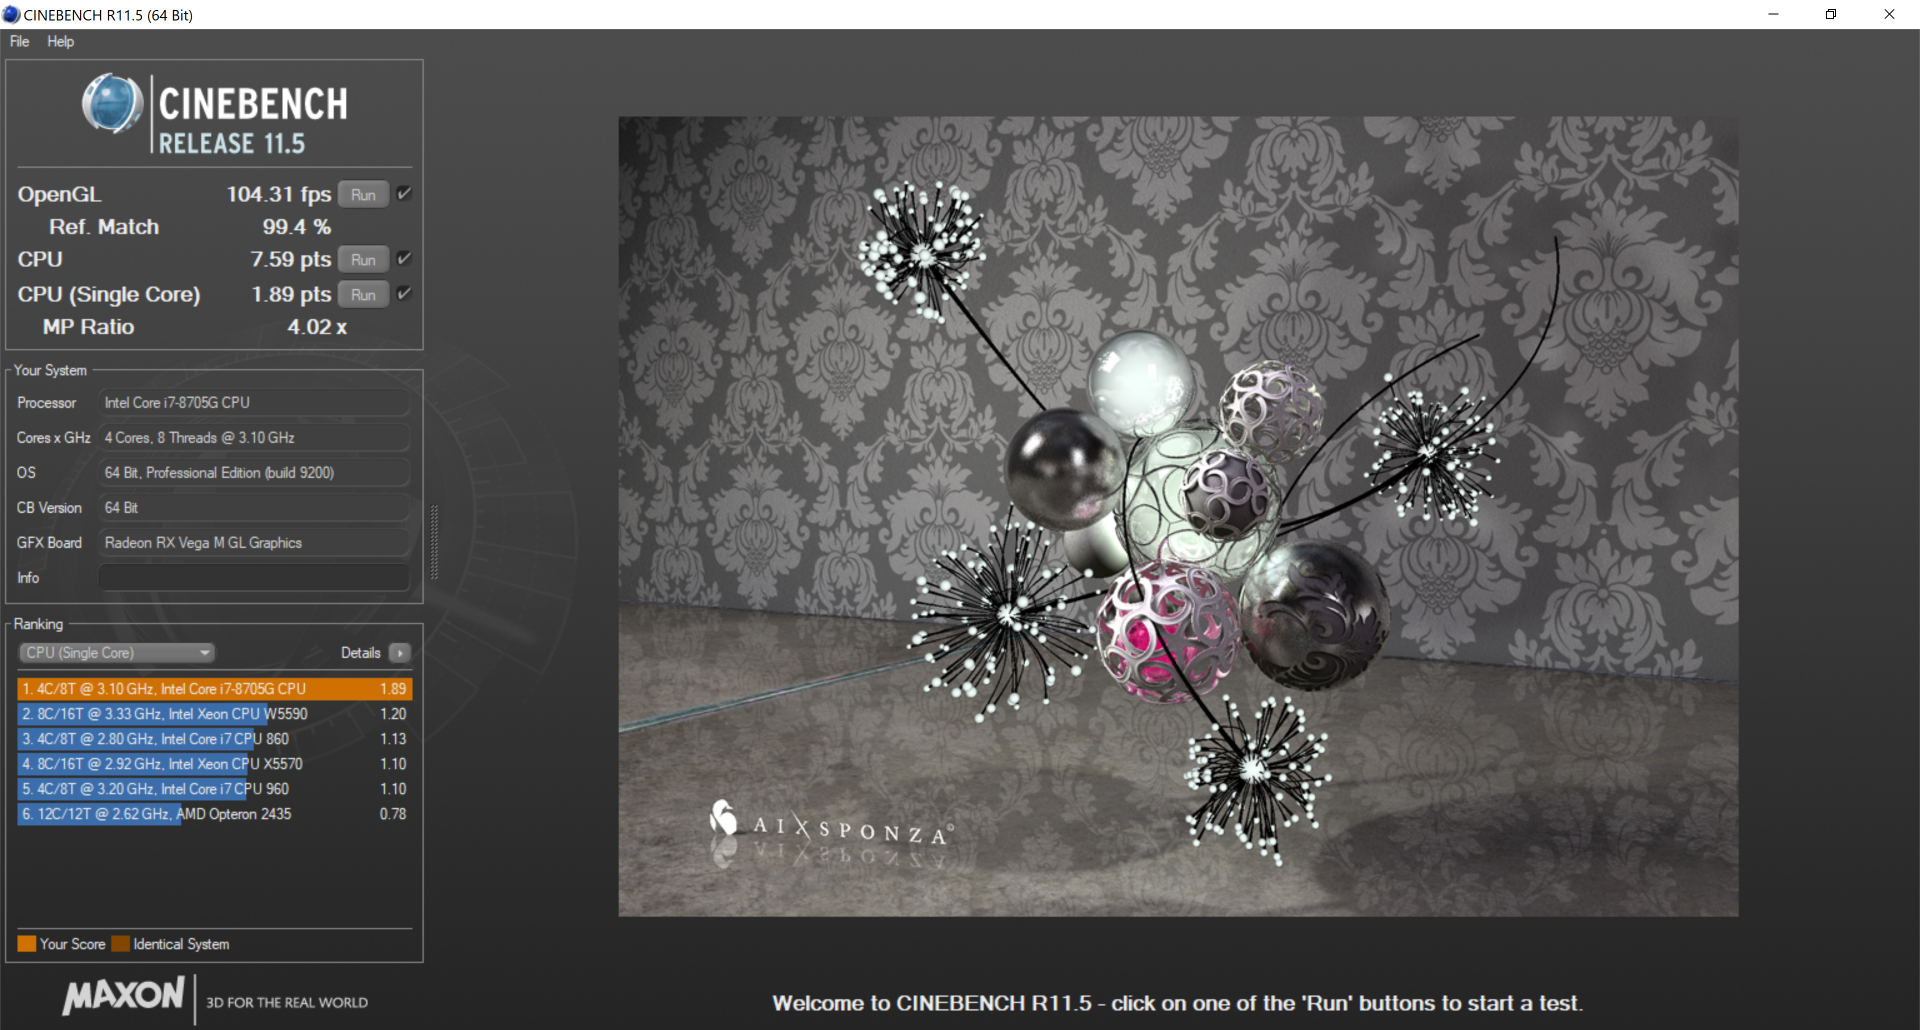
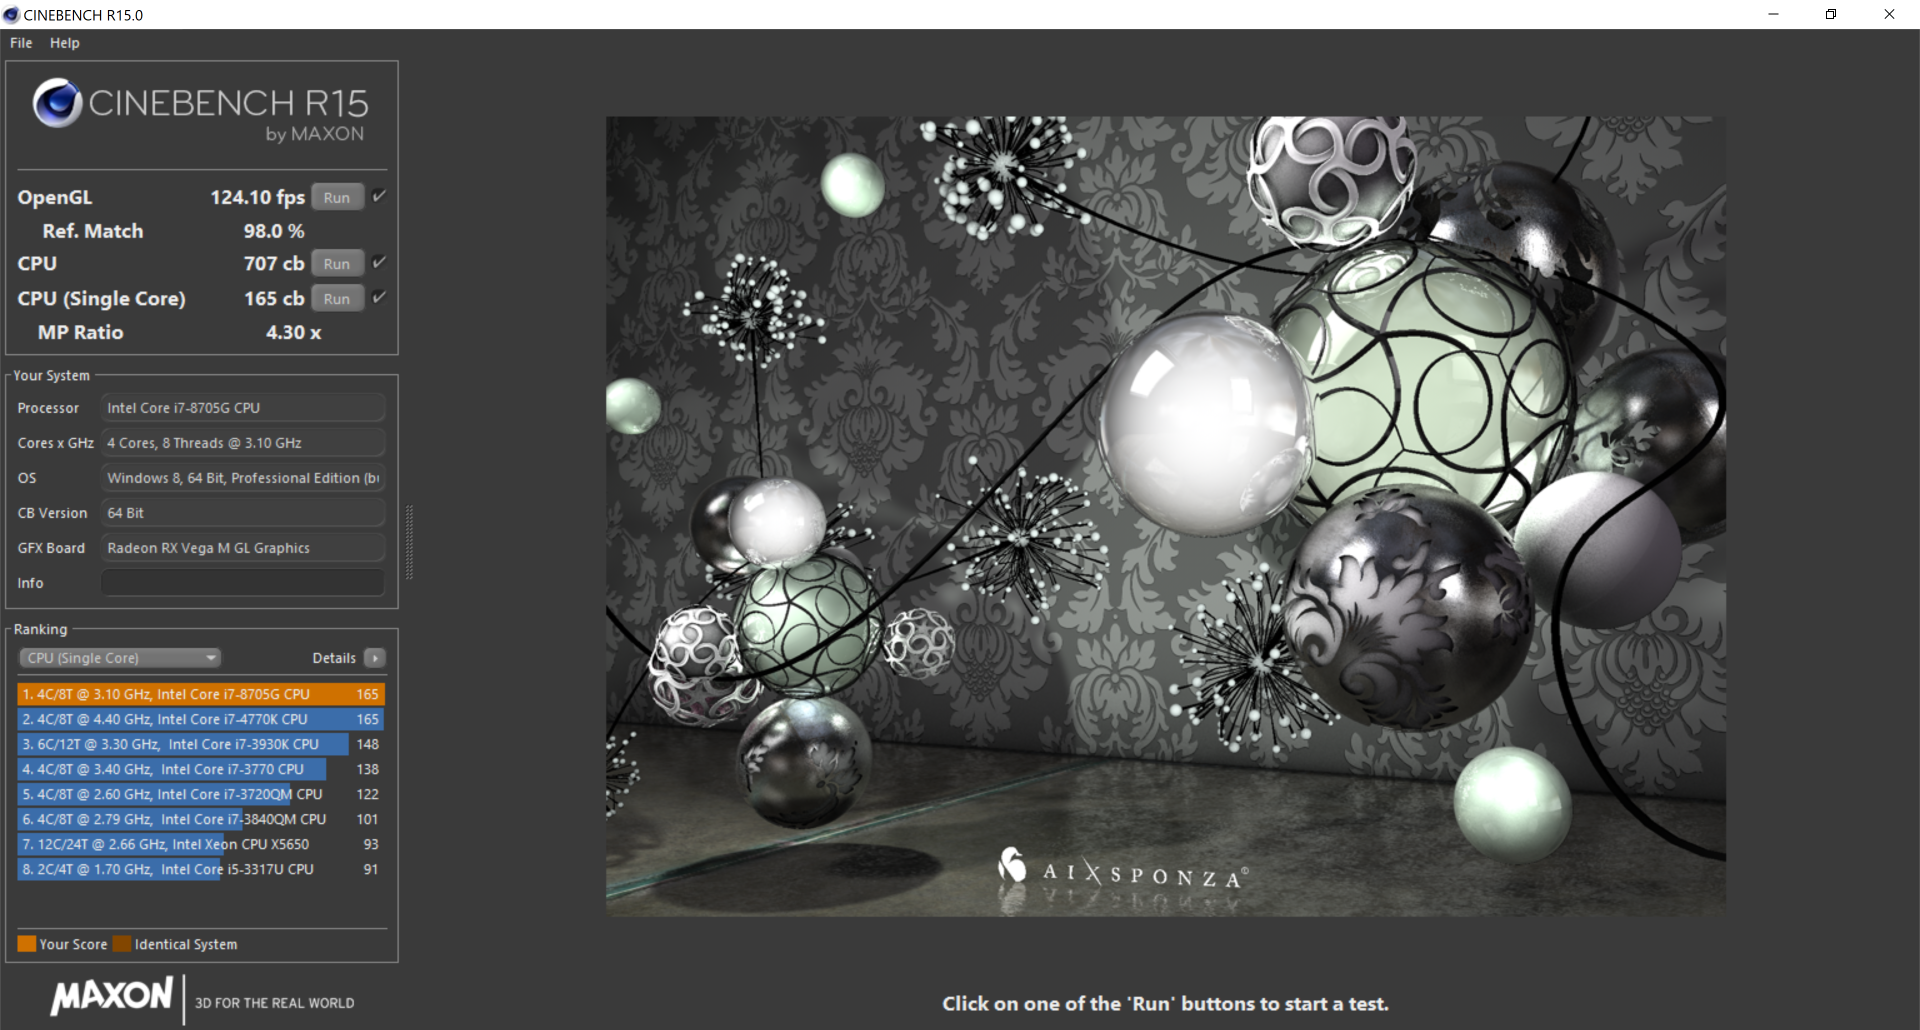
The 65 W Core i7-8705G stands neck-to-neck with the 45 W Core i7-7700HQ in both single- and multi-threaded benchmarks. The i7-7700HQ was a very popular CPU on gaming laptops before the introduction of Coffee Lake-H and so it's impressive to see the Spectre x360 15 offer a similar level of CPU performance in a much more portable form factor. It's worth mentioning that overall performance is just a few percentage points higher than the i5-8305G while the 100 W i7-8809G is faster by about 22 percent in multi-threaded workloads. Meanwhile, the less expensive Spectre SKU with the i7-8550U is 26 percent slower than our Kaby Lake-G configuration.
Unfortunately, performance sustainability is quite poor. By running CineBench R15 Multi-Thread in a loop, we can observe how the CPU can perform over time when exposed to non-stop stress. Our graph below reveals a steady decline in performance from the initial score of 732 points to a low of only 593 points by the 10th loop to represent a drop of 19 percent. Scores cycle from about 600 to 650 points thereafter, but they never quite return to the initial peak at the start of the test. The results are disappointing because the i7-8550U Spectre SKU does not suffer from as sharp of a performance drop even though Kaby Lake-R CPU is generally slower than the i7-8705G.
See our dedicated CPU page on the Core i7-8705G for more technical information and benchmark comparisons.
System Performance
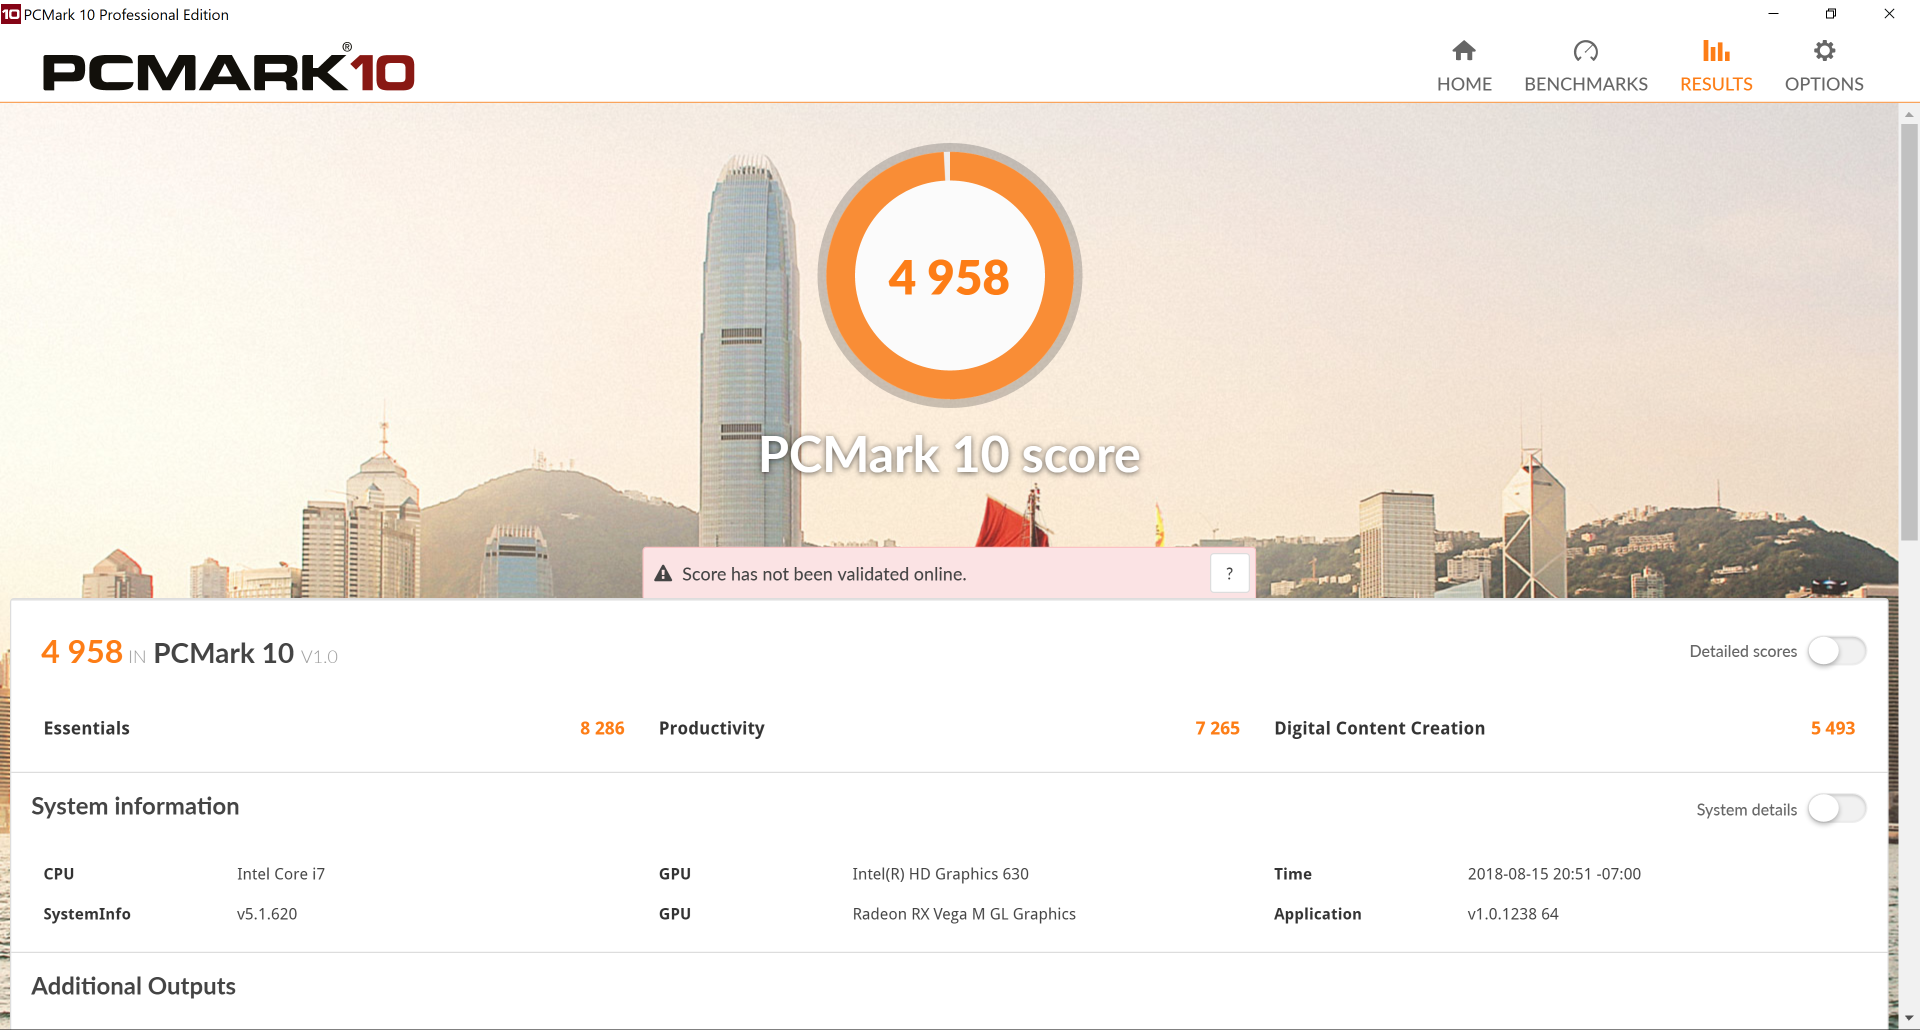
PCMark scores rank our Kaby Lake-G Spectre 5 to 26 percent faster than the Kaby Lake-R Spectre depending on the benchmark. Results are almost exactly the same as on the XPS 15 9575 and over 30 percent higher than the average Multimedia notebook in our database due to the relatively fast GPU for the category.
We experienced no strange software hitches on our test unit save for a single crash when waking from Sleep that we were not able to reproduce.
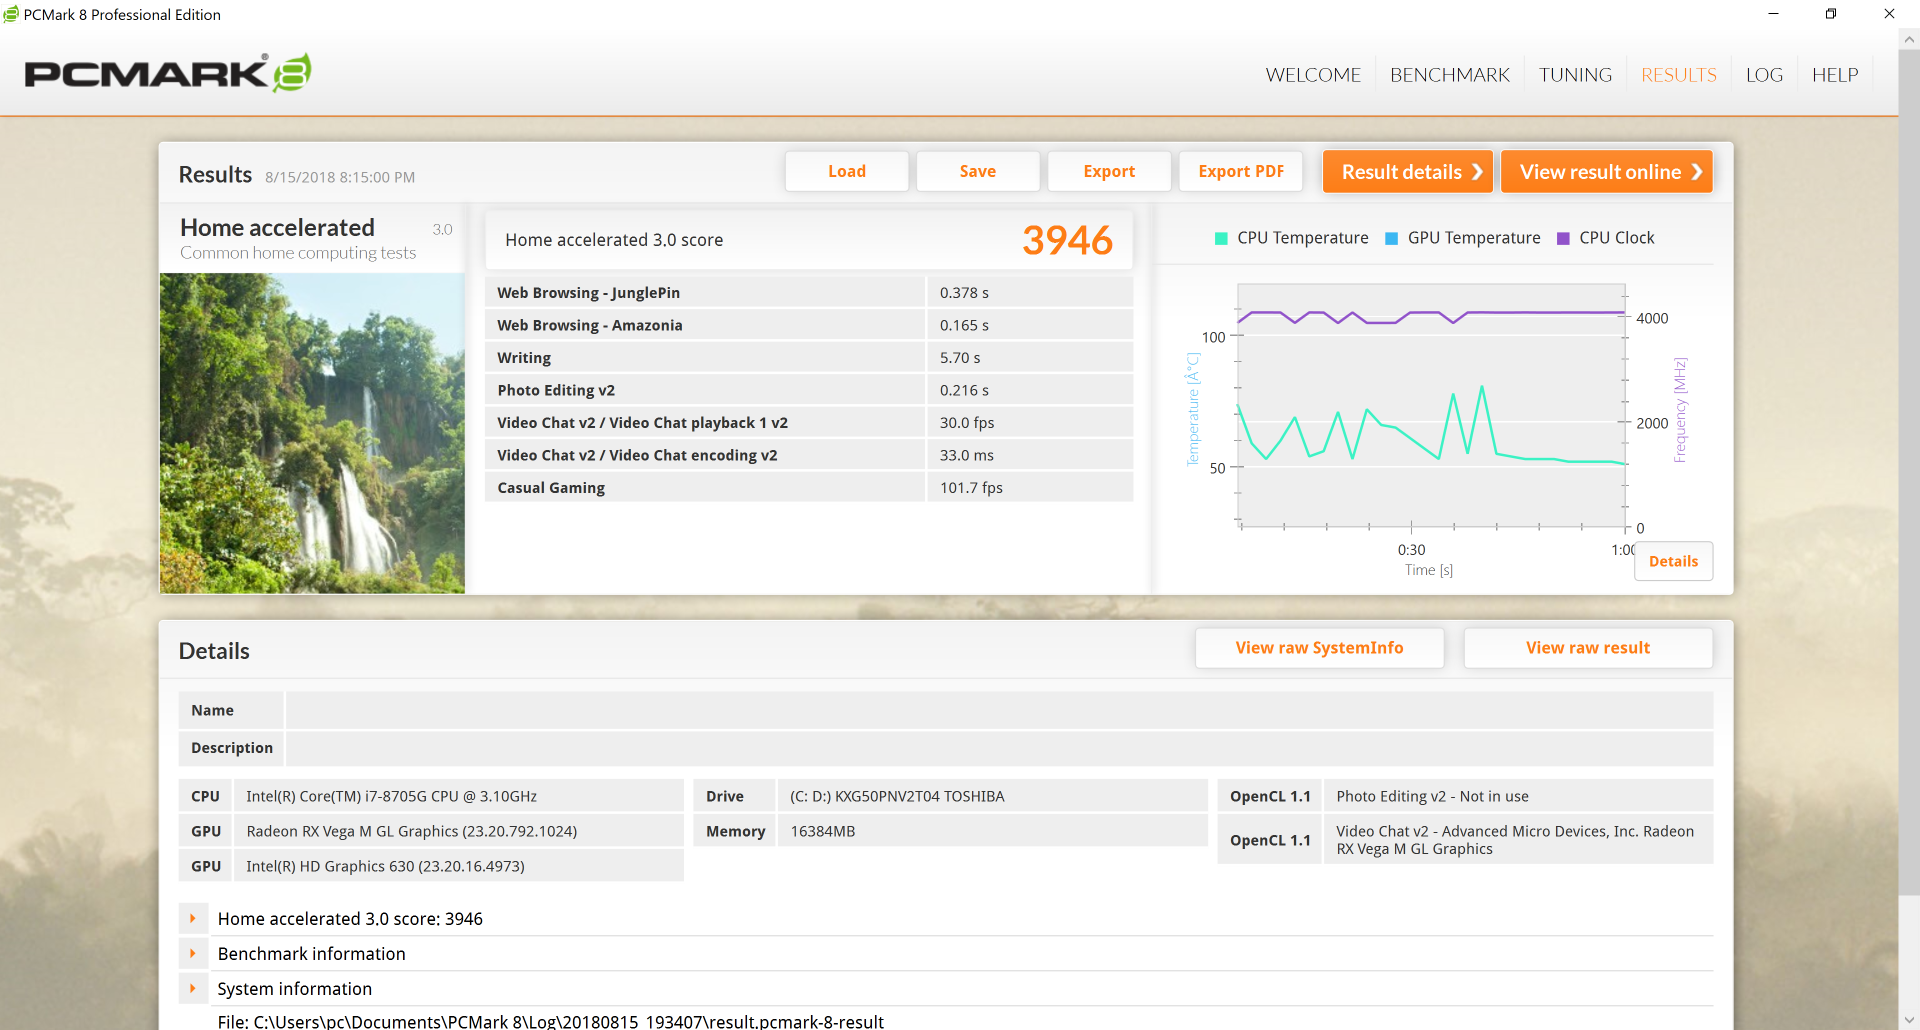
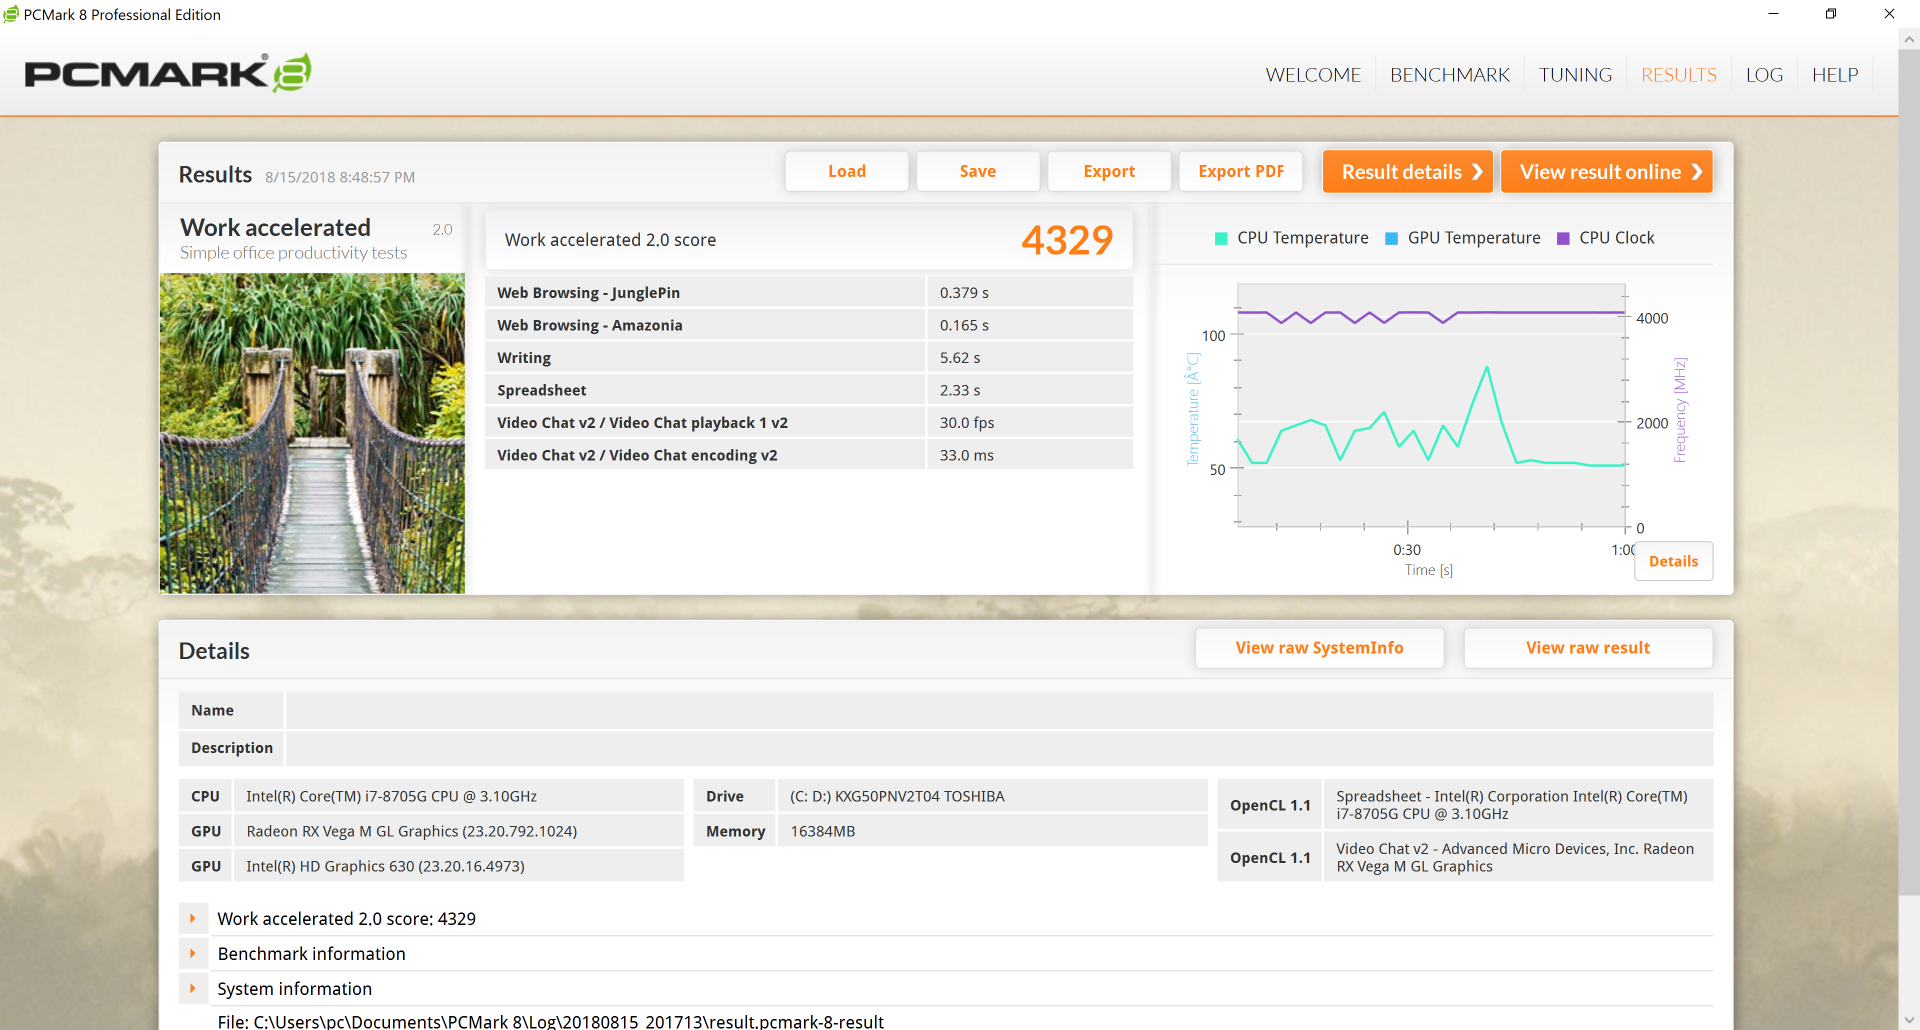
| PCMark 8 Home Score Accelerated v2 | 3946 points | |
| PCMark 8 Work Score Accelerated v2 | 4329 points | |
| PCMark 10 Score | 4958 points | |
Help | ||
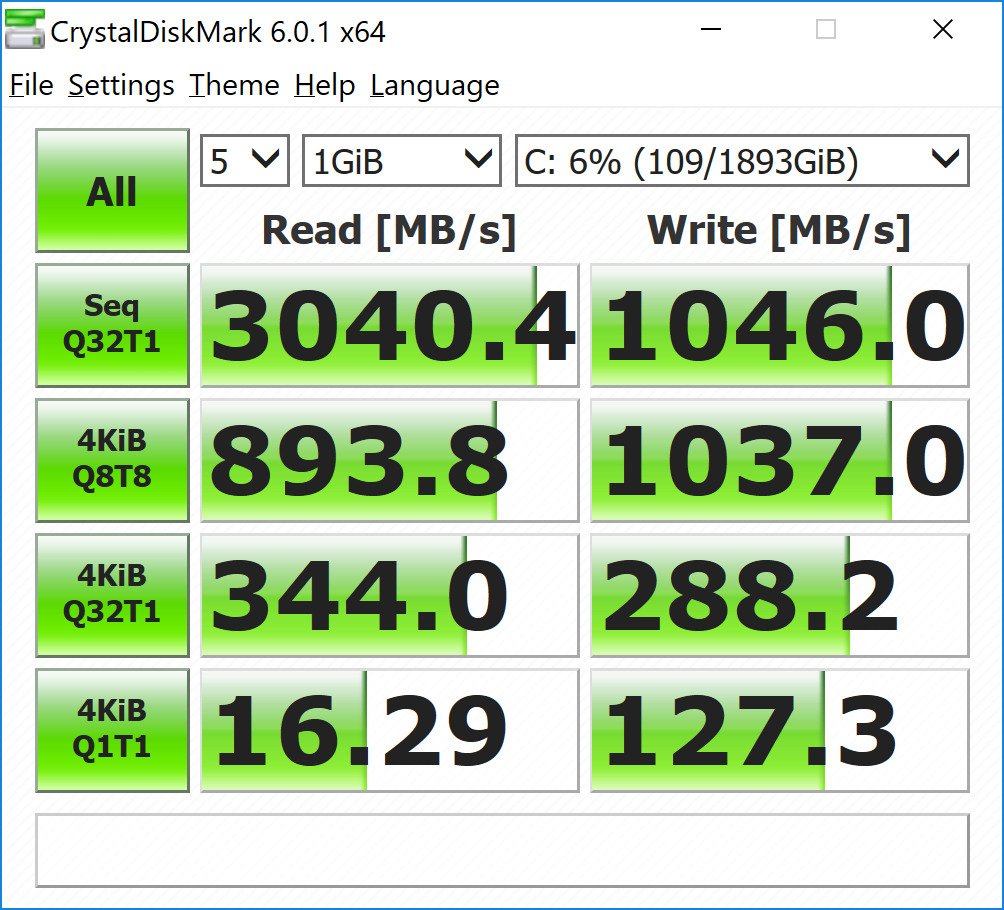
Storage Devices
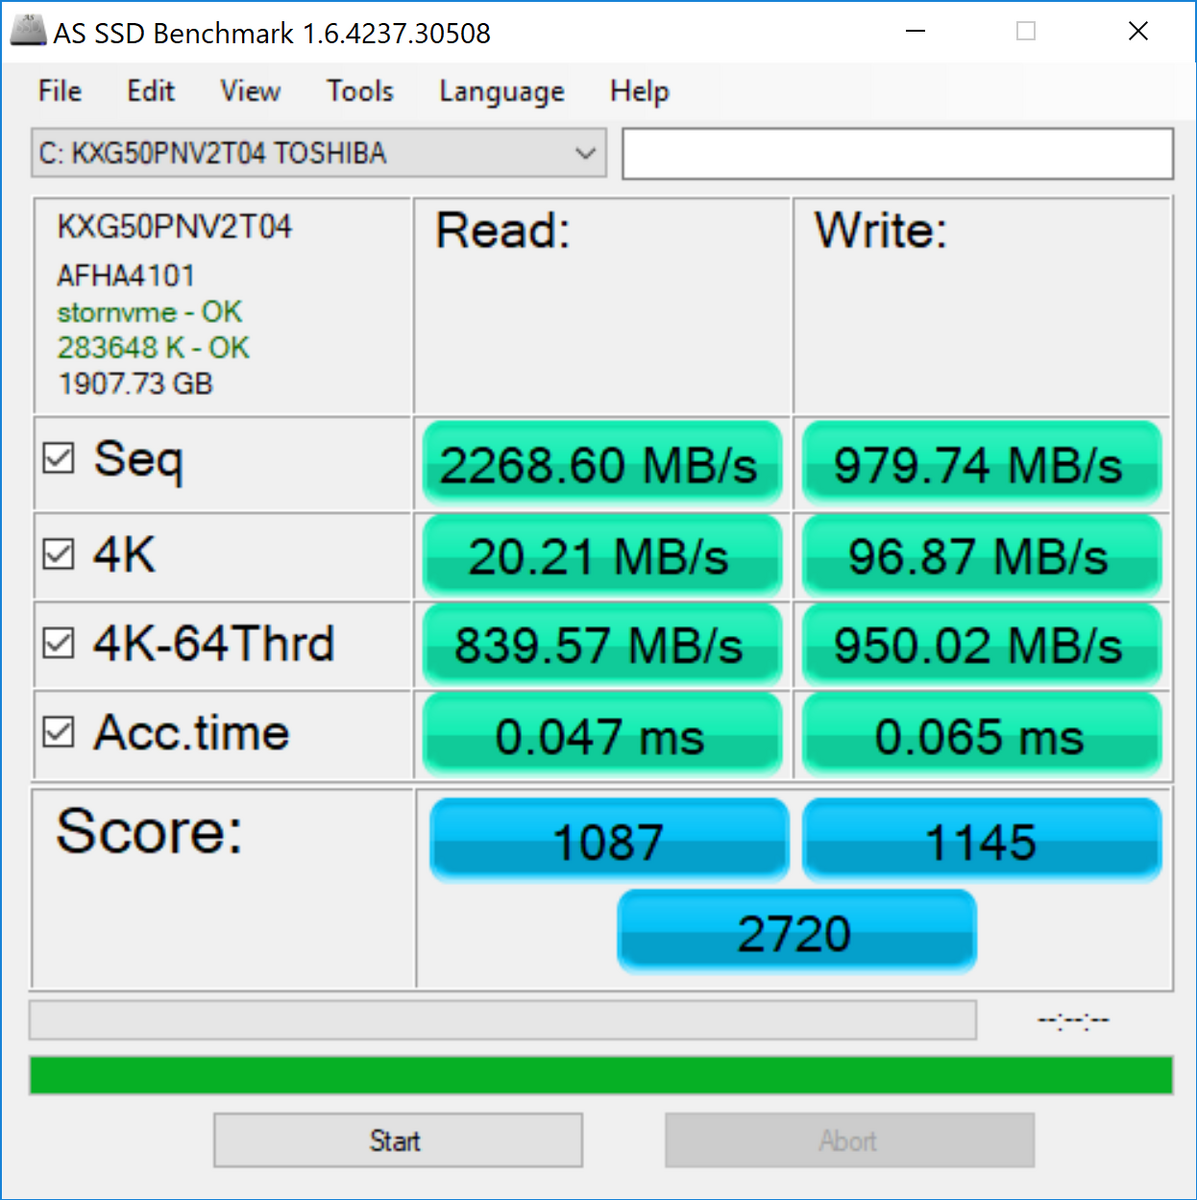
Our test unit is configured with a 2 TB Toshiba NVMe SSD for sequential read and write rates of 3000 MB/s and 1000 MB/s, respectively, according to CrystalDiskMark to suggest a PCIe x4 interface instead of PCIe x2. The write rate is disappointingly just half of the 2200 MB/s specification that Toshiba advertises for this particular drive.
Only a single internal M.2 2280 slot is available. Drive space can thus become pricey since there is no secondary HDD option that many other 15-inch multimedia laptops tend to have.
See our table of HDDs and SSDs for more benchmark comparisons.
| HP Spectre x360 15-ch000 Toshiba XG5-P KXG50PNV2T04 | Asus ZenBook Pro 15 UX580GE Samsung SSD PM961 1TB M.2 PCIe 3.0 x4 NVMe (MZVLW1T0) | Dell XPS 15 9575 i7-8705G SK hynix PC401 NVMe 500 GB | HP Spectre x360 15-ch011nr SK hynix PC401 NVMe 500 GB | Apple MacBook Pro 15 2018 (2.6 GHz, 560X) Apple SSD AP0512 | HP Omen 15t-ce000 Samsung PM961 NVMe MZVLW128HEGR | |
|---|---|---|---|---|---|---|
| AS SSD | 30% | 1% | 0% | -60% | -19% | |
| Copy Game MB/s | 698 | 728 4% | 944 35% | 1042 49% | 736 5% | |
| Copy Program MB/s | 463.7 | 430.9 -7% | 487.9 5% | 486.8 5% | 195.4 -58% | |
| Copy ISO MB/s | 1674 | 1045 -38% | 1523 -9% | 1668 0% | 1087 -35% | |
| Score Total | 2720 | 4065 49% | 2132 -22% | 2037 -25% | 2119 -22% | 1515 -44% |
| Score Write | 1145 | 1547 35% | 807 -30% | 757 -34% | 347 -70% | 361 -68% |
| Score Read | 1087 | 1679 54% | 921 -15% | 859 -21% | 1199 10% | 789 -27% |
| Access Time Write * | 0.065 | 0.036 45% | 0.051 22% | 0.051 22% | 0.034 48% | |
| Access Time Read * | 0.047 | 0.04 15% | 0.044 6% | 0.054 -15% | 0.225 -379% | 0.071 -51% |
| 4K-64 Write | 950 | 1273 34% | 637 -33% | 545 -43% | 163.5 -83% | 175.9 -81% |
| 4K-64 Read | 840 | 1431 70% | 649 -23% | 646 -23% | 965 15% | 568 -32% |
| 4K Write | 96.9 | 100.9 4% | 94.3 -3% | 93.2 -4% | 18.78 -81% | 111.2 15% |
| 4K Read | 20.21 | 37.78 87% | 41.38 105% | 38.76 92% | 9.46 -53% | 43.09 113% |
| Seq Write | 980 | 1729 76% | 752 -23% | 1189 21% | 1644 68% | 743 -24% |
| Seq Read | 2269 | 2099 -7% | 2302 1% | 1739 -23% | 2239 -1% | 1774 -22% |
* ... smaller is better

GPU Performance
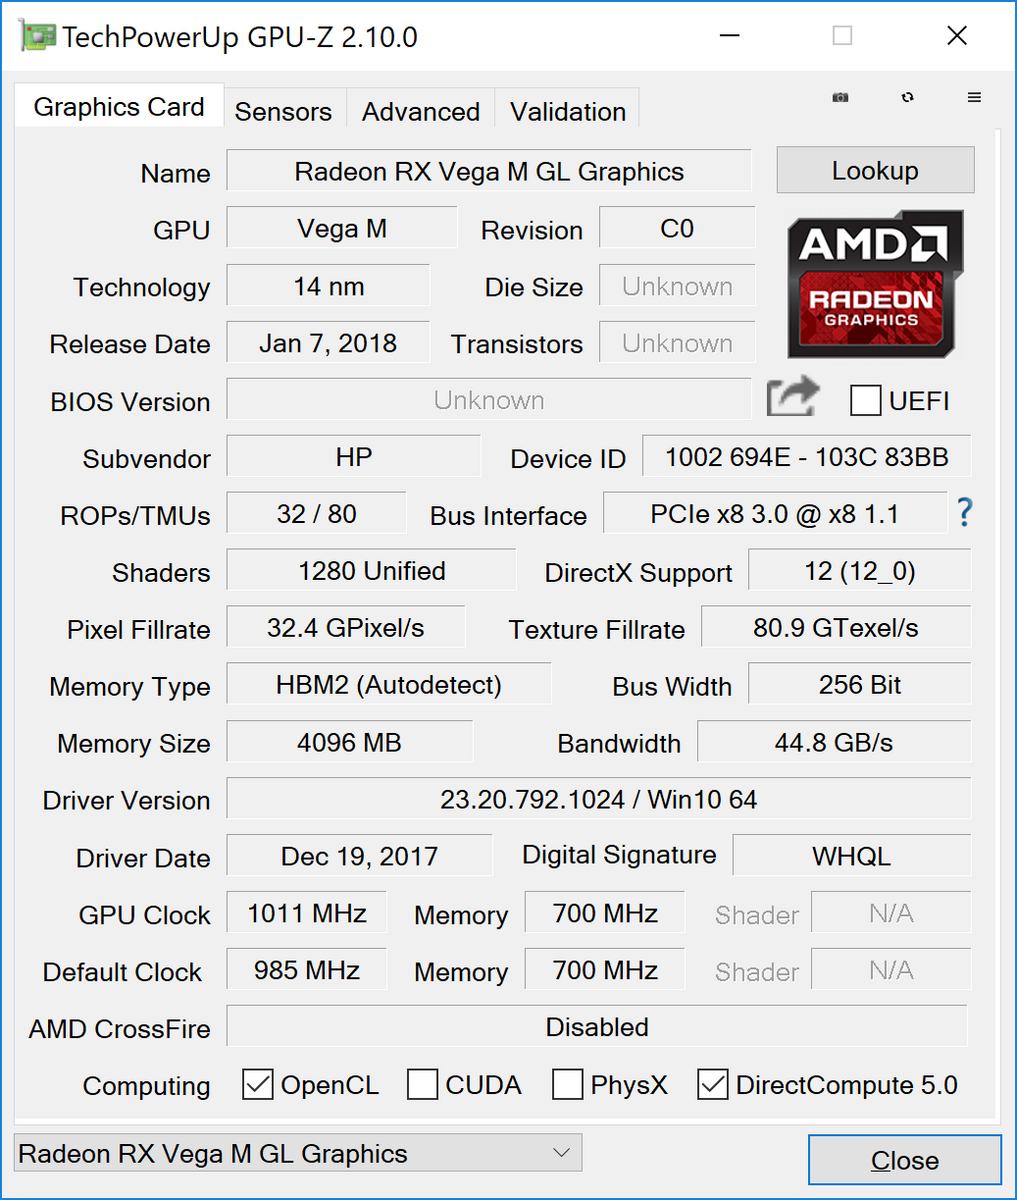
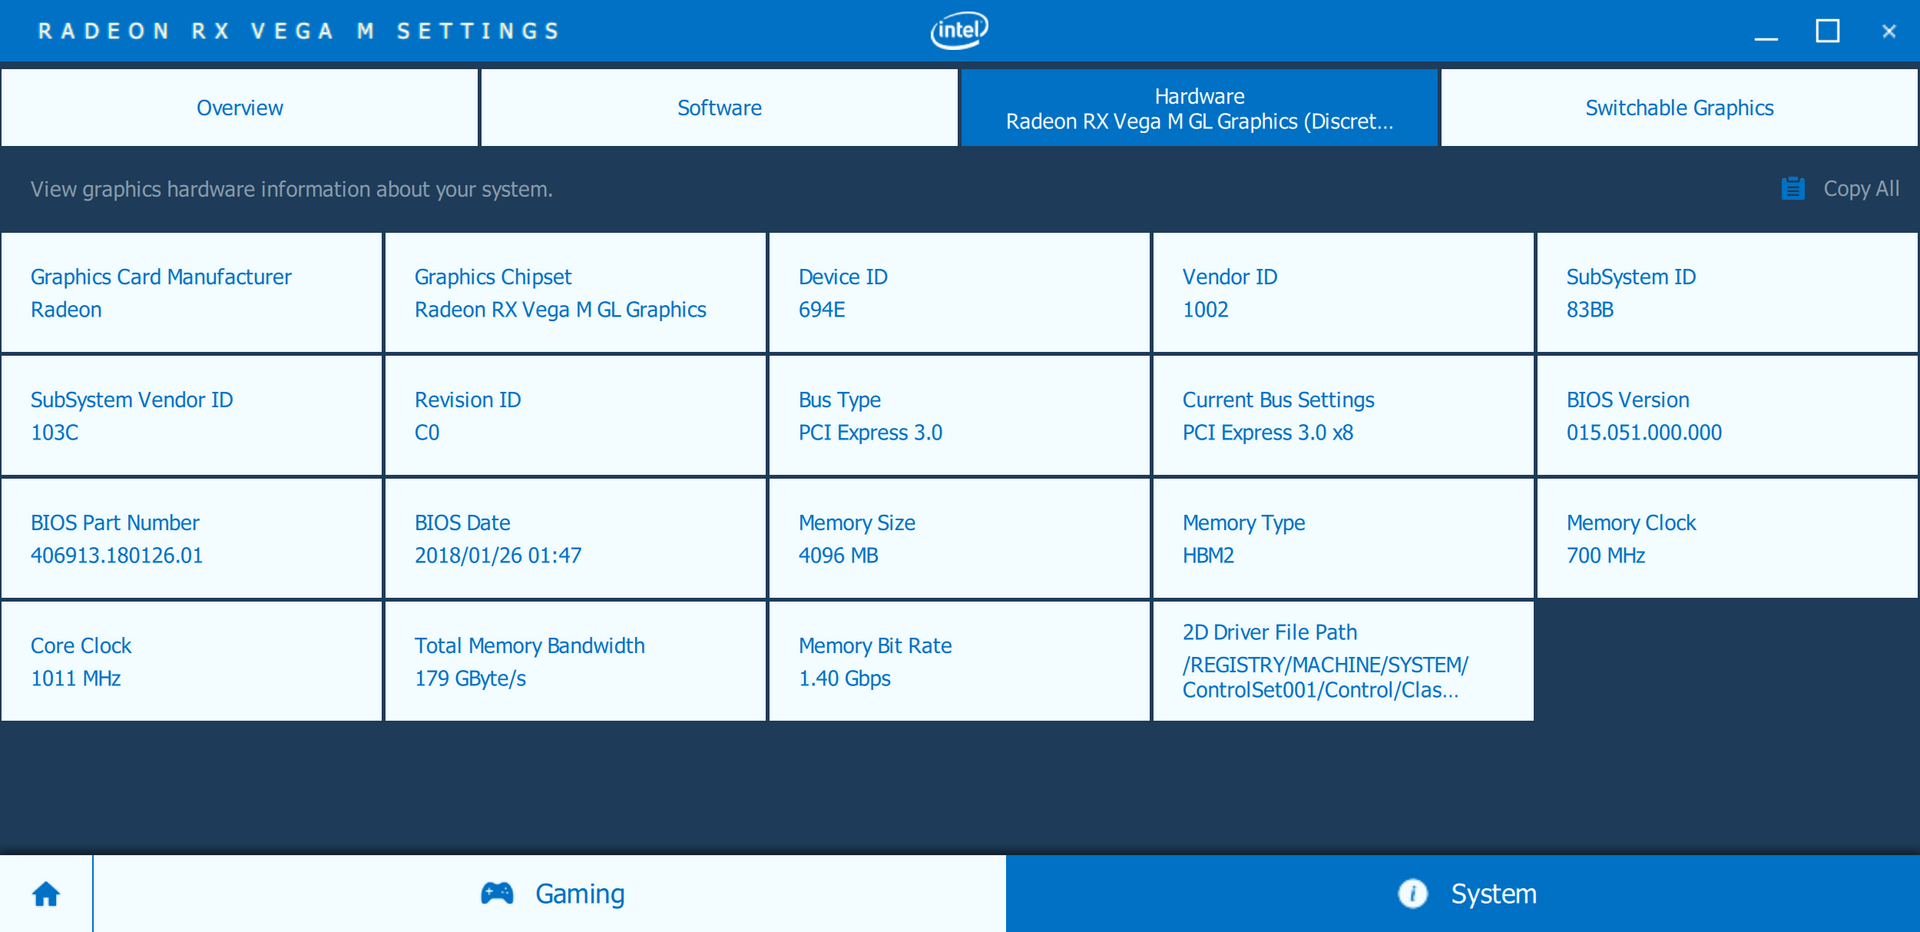
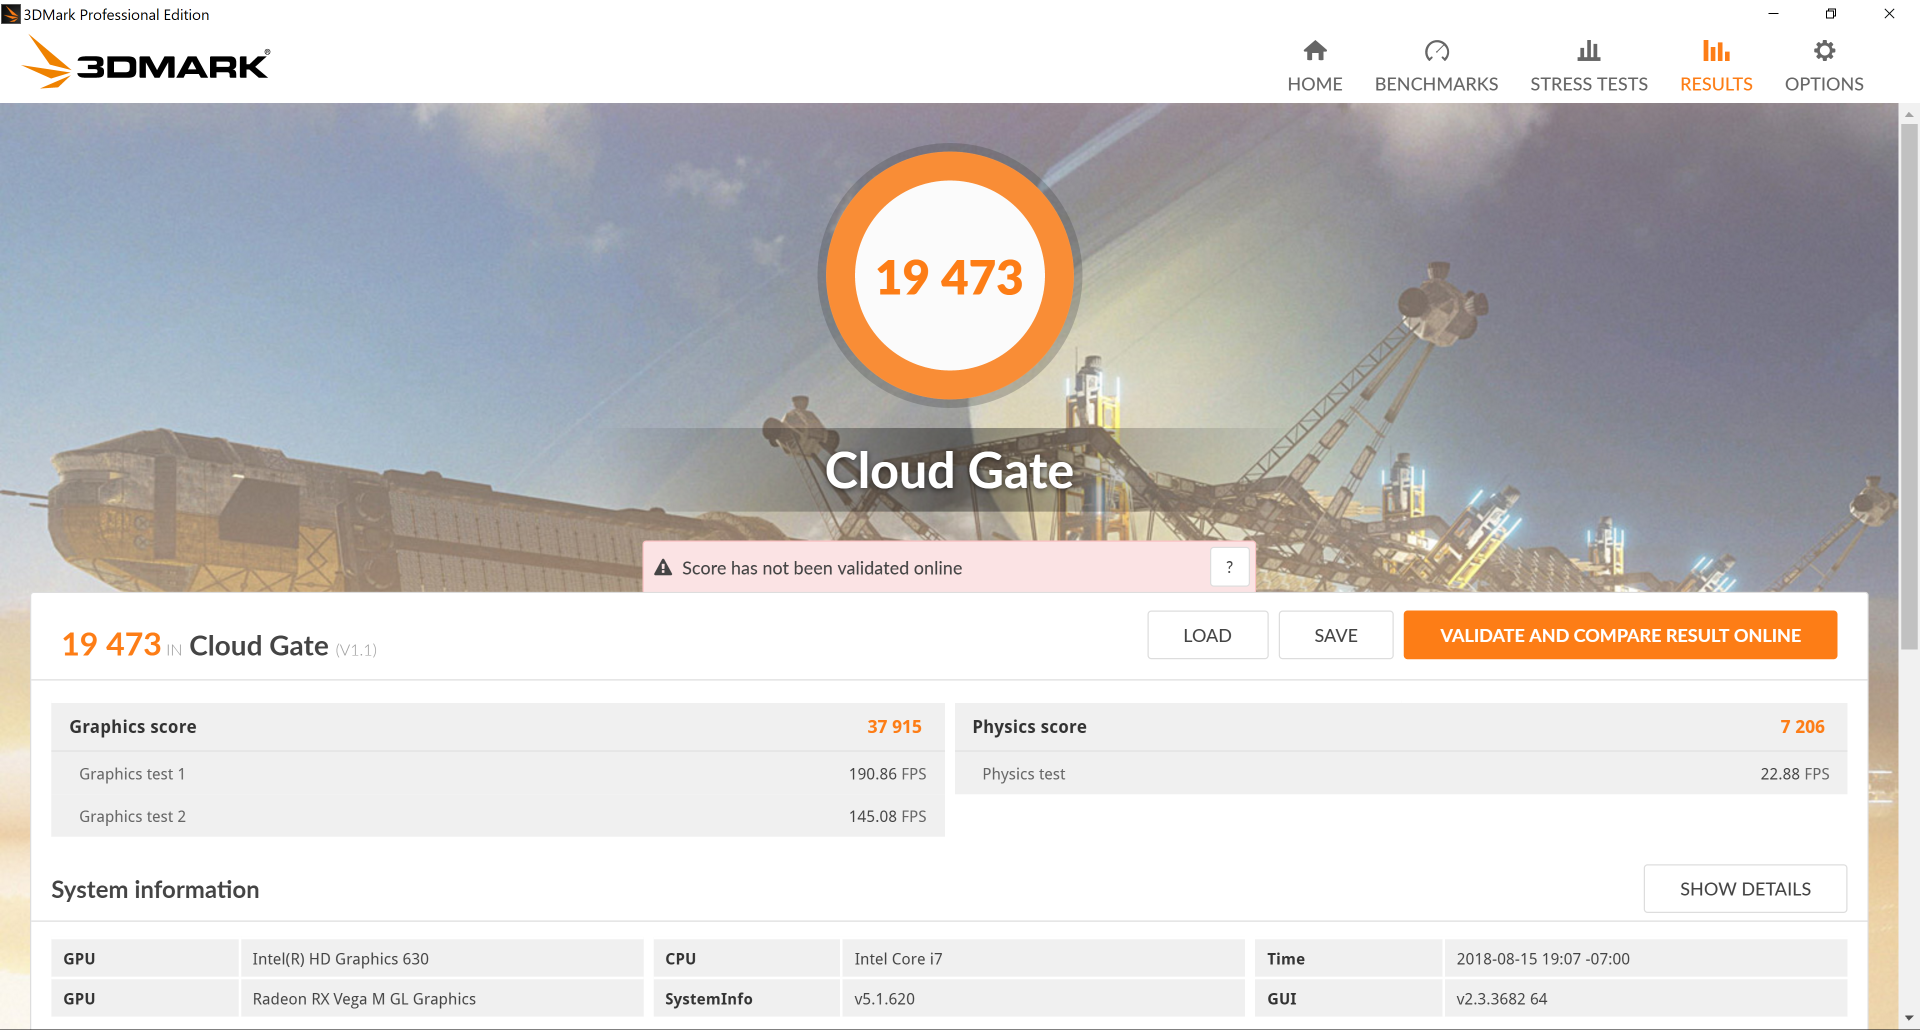
The Radeon RX Vega M GL sits comfortably in between the GTX 1050 and GTX 1050 Ti in raw graphics performance. The result is an astounding 100 percent performance boost over the GeForce MX150 in the less expensive Kaby Lake-R SKU while being about 35 percent slower than the Vega M GH and GTX 1060 Max-Q. When considering that it takes Nvidia an entirely separate processor to achieve the same graphical horsepower, it's impressive to see what Intel and AMD have accomplished with the very efficient Kaby Lake-G platform.
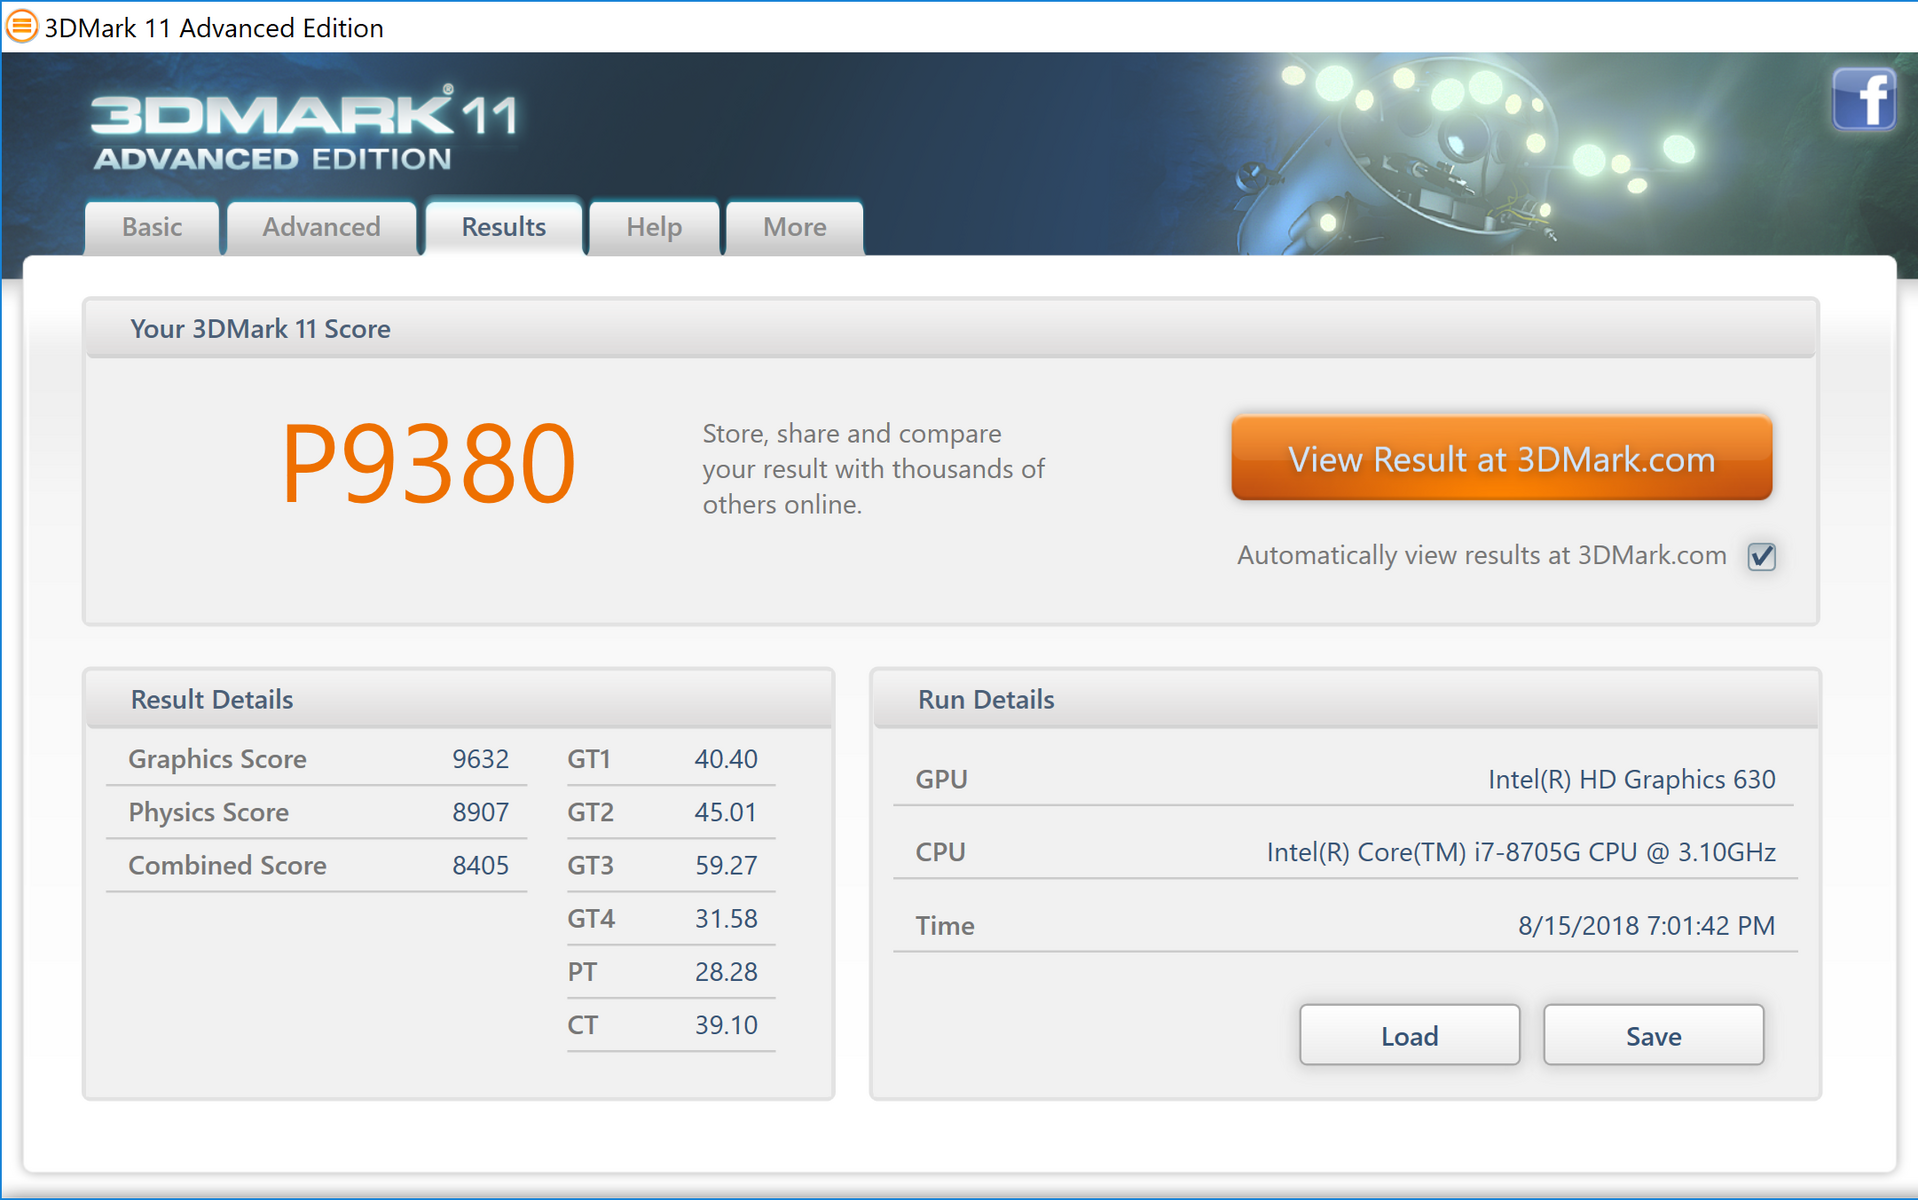
| 3DMark 11 Performance | 9380 points | |
| 3DMark Cloud Gate Standard Score | 19473 points | |
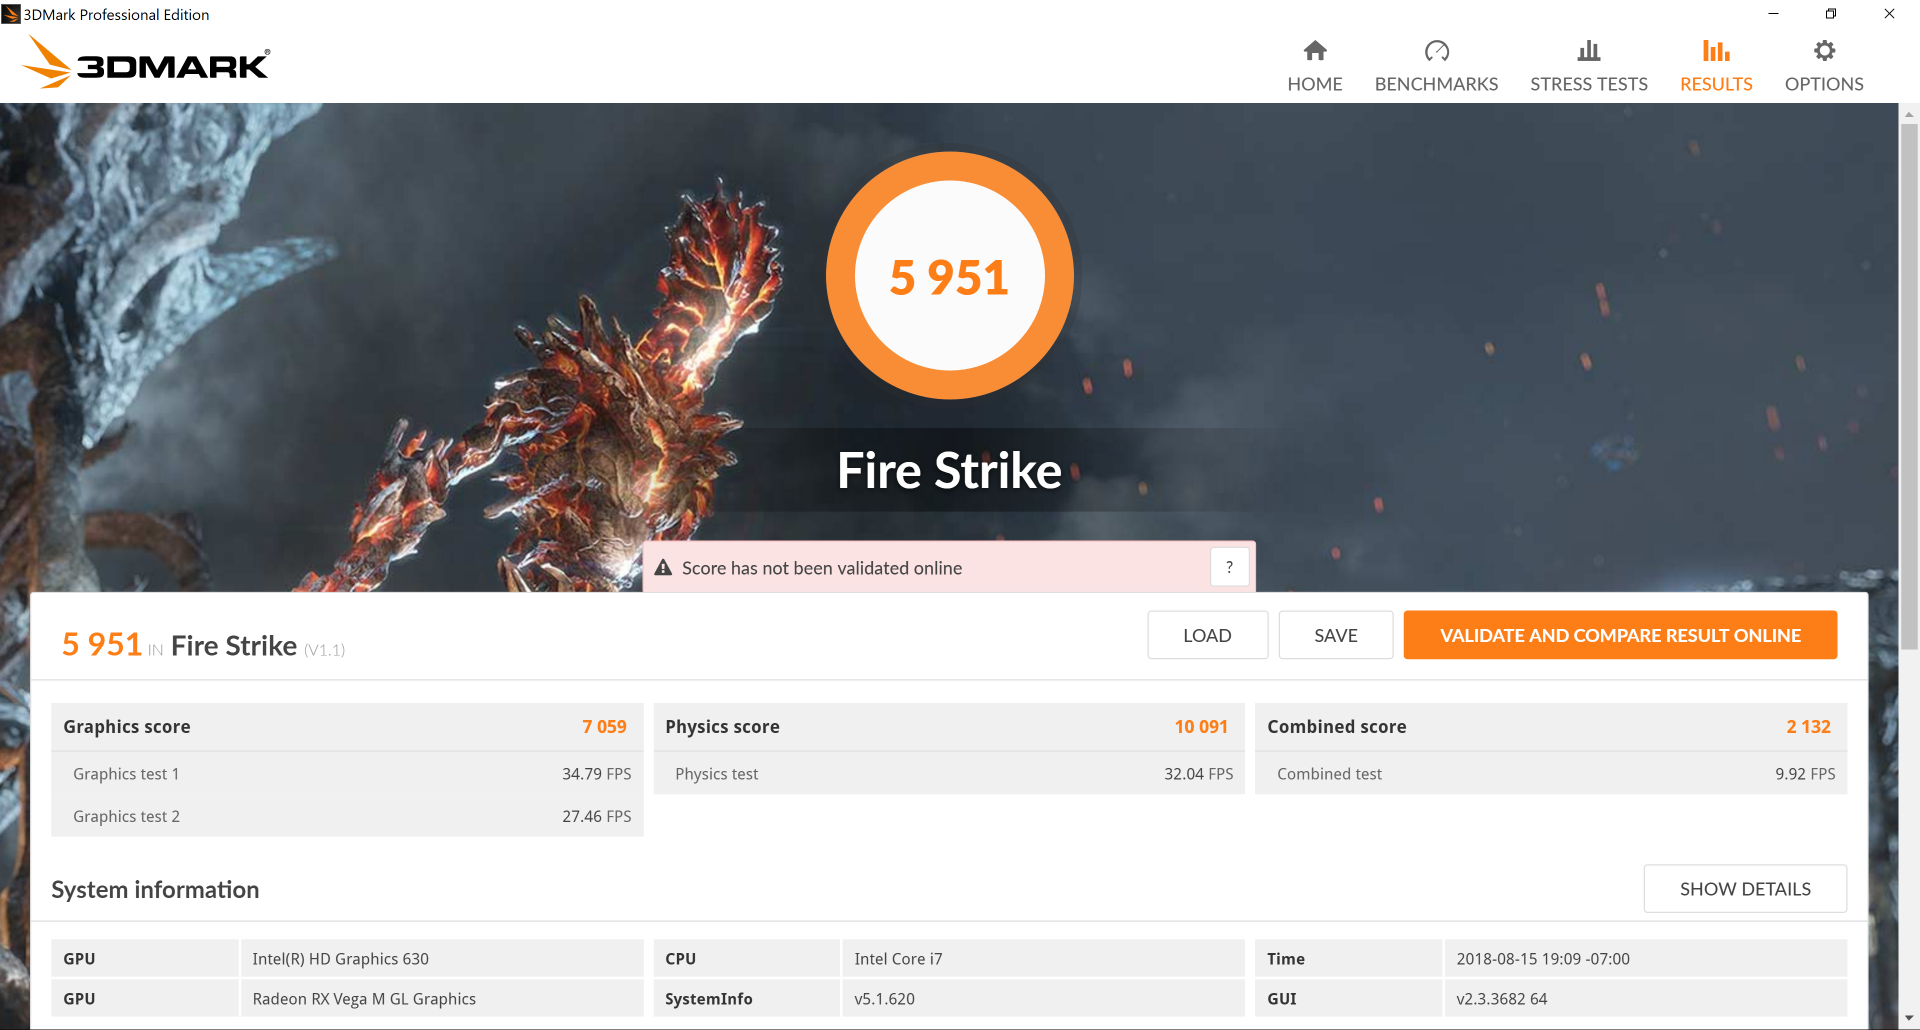
| 3DMark Fire Strike Score | 5951 points | |
Help | ||
Gaming Performance
Real-world gaming performance is much more variable. While Fire Strike scores suggest a performance level similar to the GTX 1050, frame rates when running actual games can be almost as slow as the last generation GTX 960M depending on the title. Expect gaming performance to be about 50 percent faster than the GeForce MX150 even though the synthetic tests above suggest higher deltas.
See our dedicated GPU page on the Radeon RX Vega M GL for more technical information and benchmark comparisons.
| Rise of the Tomb Raider - 1920x1080 Very High Preset AA:FX AF:16x | |
| Asus Strix GL502VT-DS74 | |
| Intel Hades Canyon NUC8i7HVK | |
| Dell G3 15 3579 | |
| Average Intel Core i7-8705G, AMD Radeon RX Vega M GL / 870 (26.9 - 32.8, n=2) | |
| Alienware 13 R3 (i5-7300HQ, GTX 1050 Ti) | |
| HP Spectre x360 15-ch000 | |
| Asus GL552VW-DH74 | |
| HP Spectre x360 15-ch011nr | |
| low | med. | high | ultra | 4K | |
| BioShock Infinite (2013) | 208 | 177.3 | 157 | 51.7 | |
| The Witcher 3 (2015) | 79 | 40.8 | 21.5 | 13 | |
| Rise of the Tomb Raider (2016) | 80.2 | 35 | 26.9 | 12 |
Stress Test
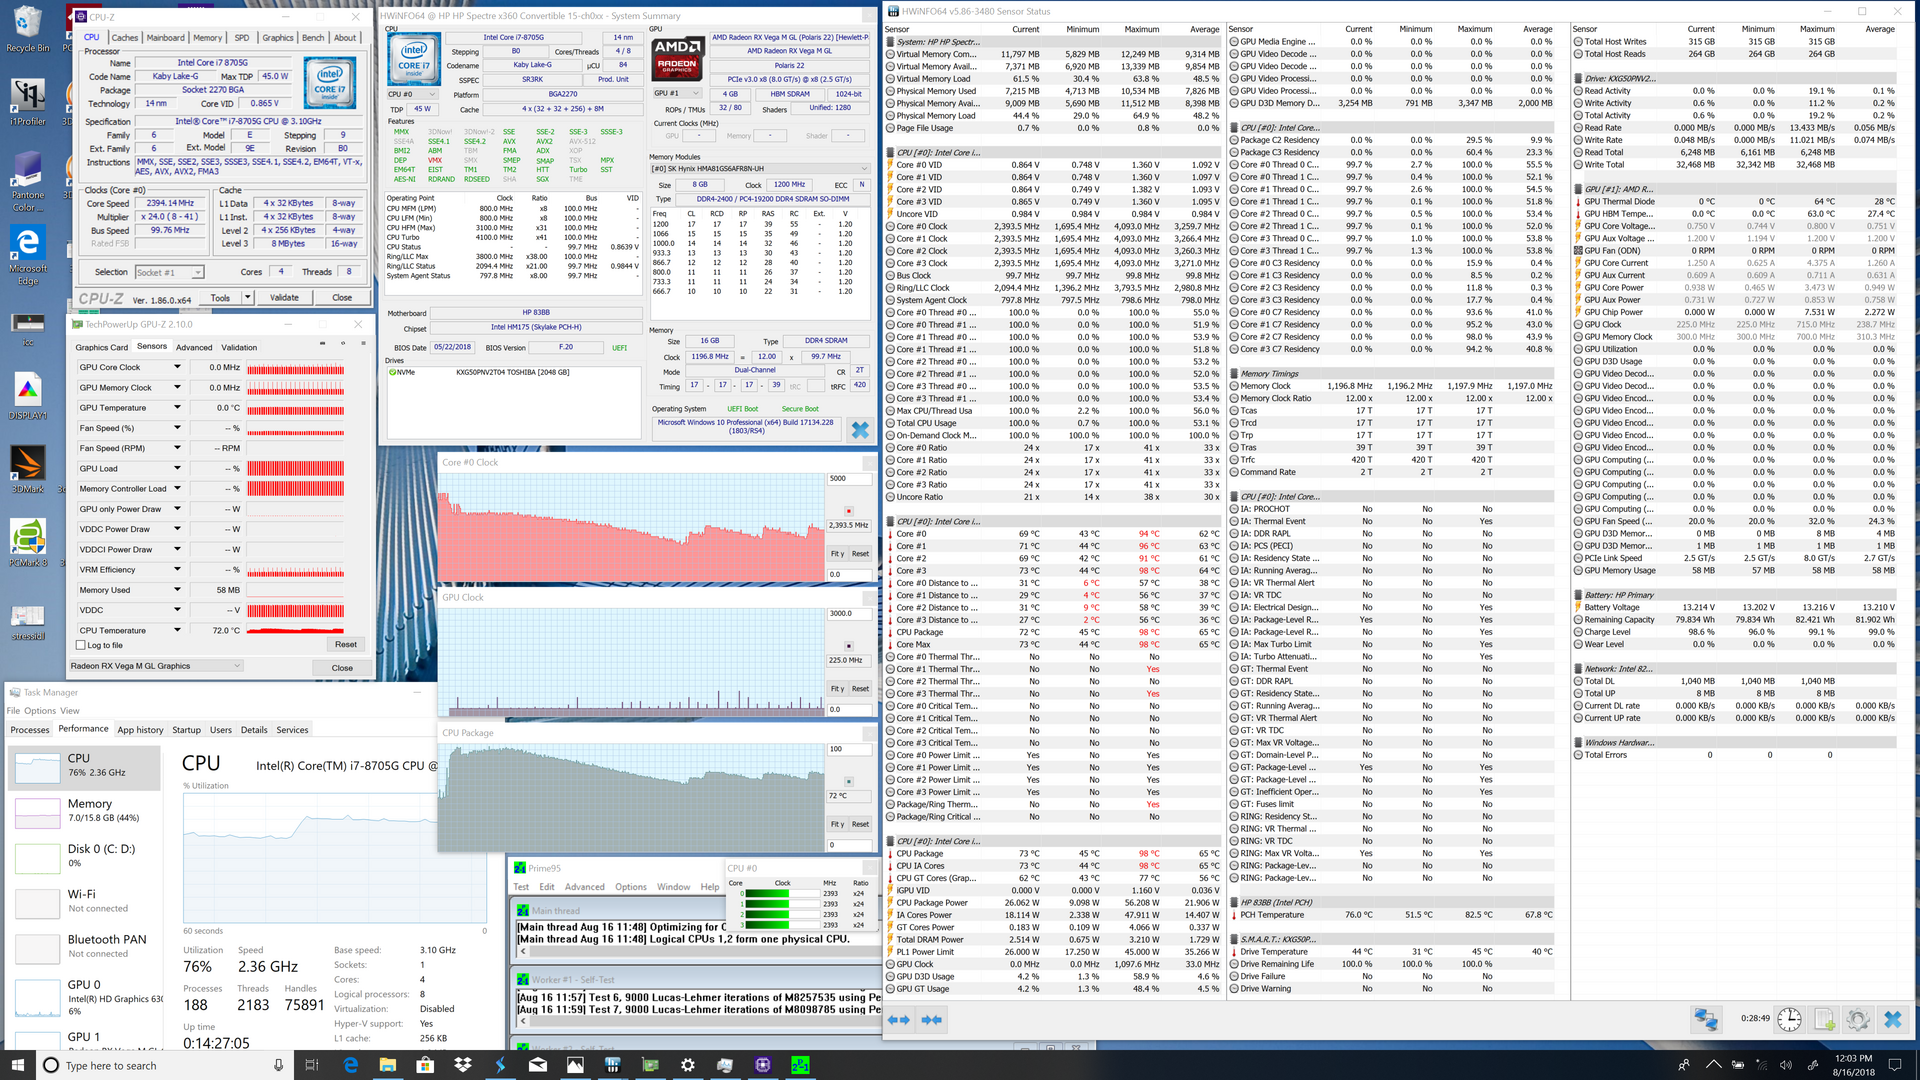
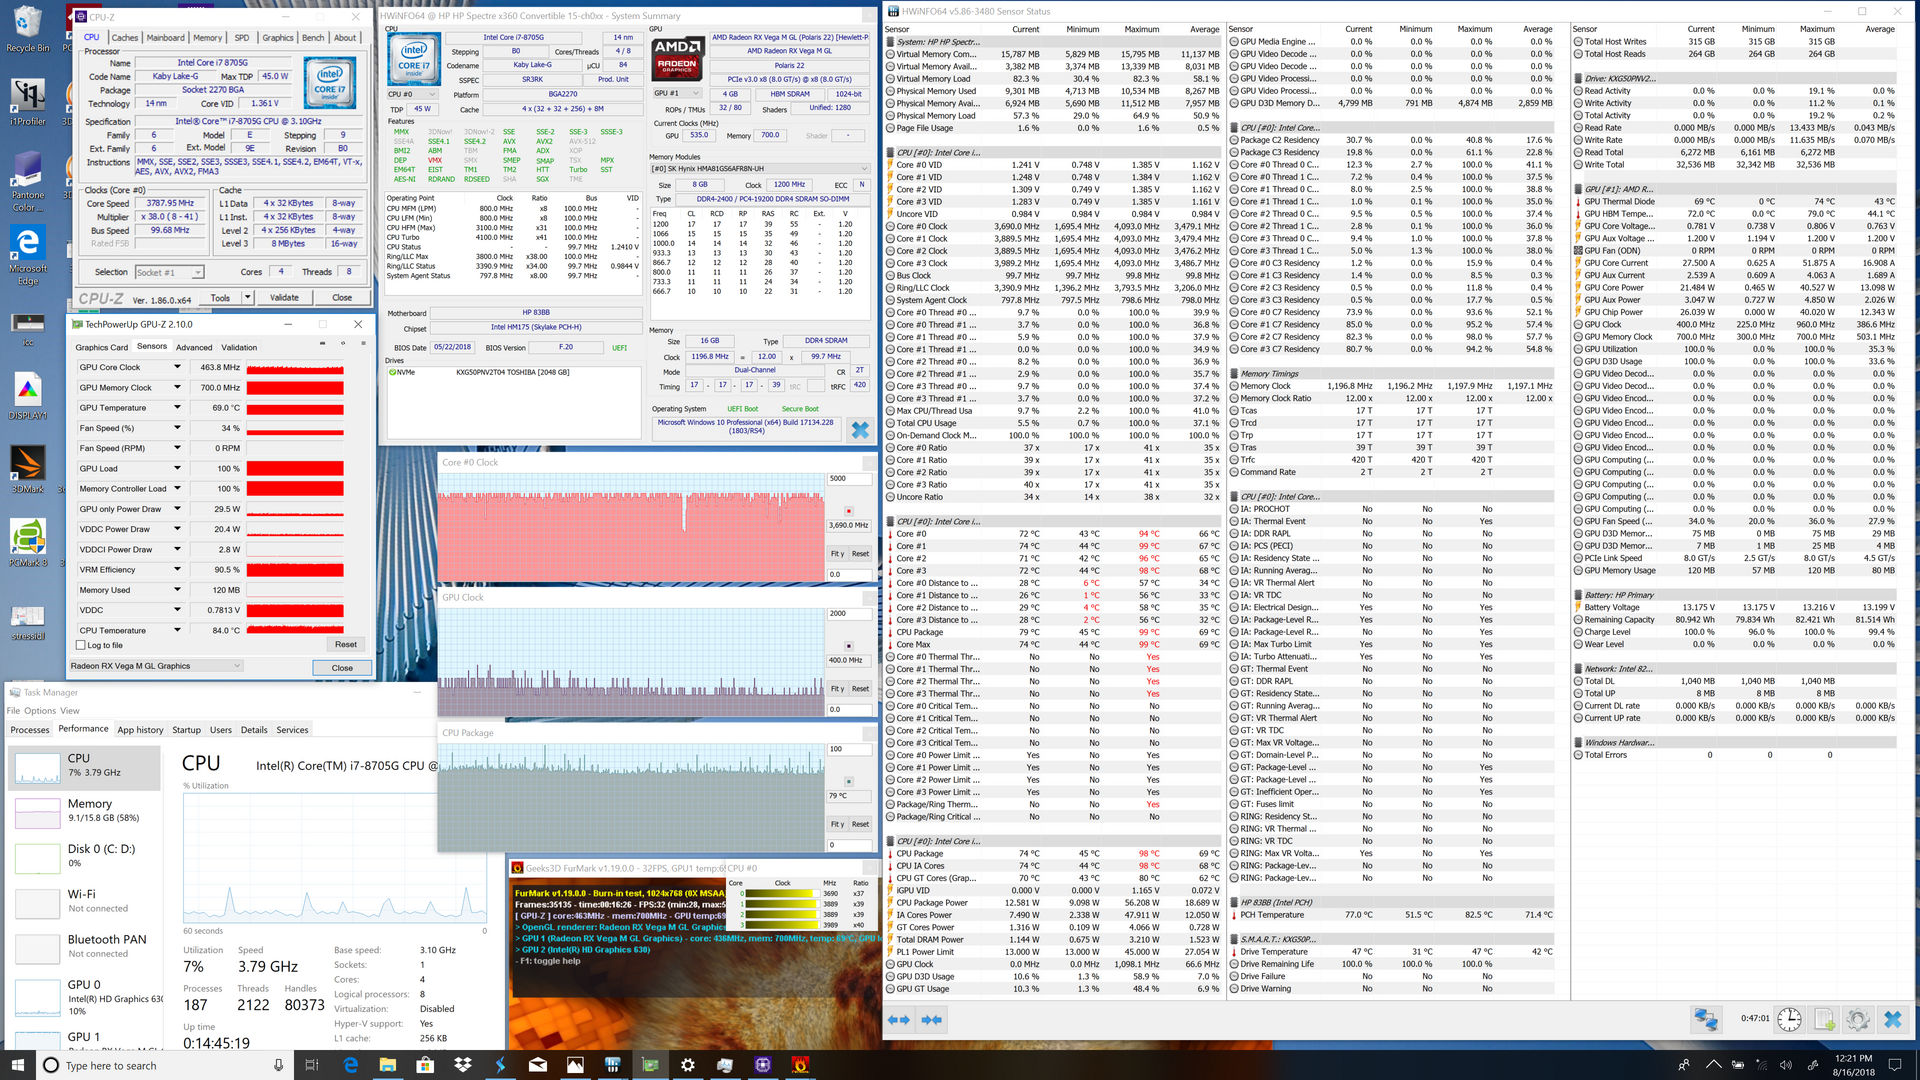
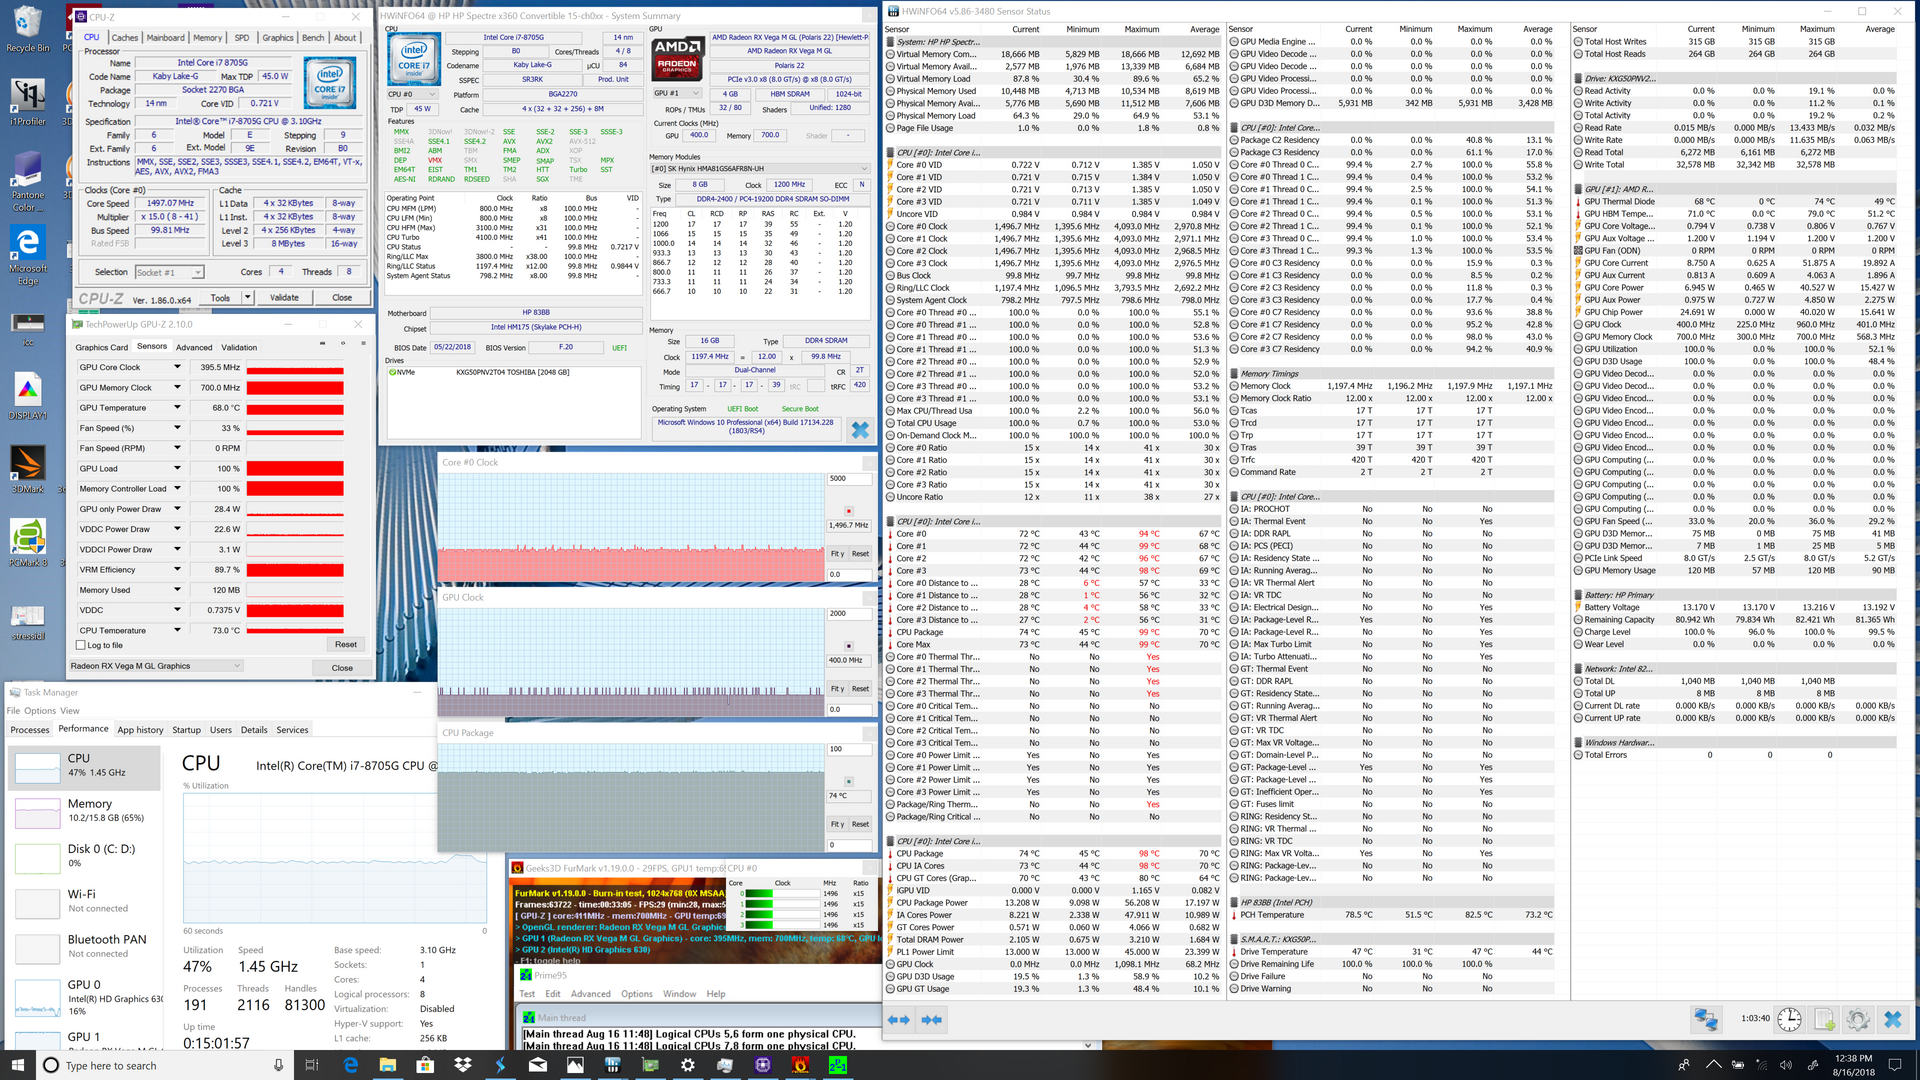
We stress the Spectre with synthetic benchmarks to test performance sustainability and it is here where the system begins to crumble. When running Prime95, the CPU can be observed operating as high as 3.6 GHz for the first few seconds until core temperature reaches 97 C. Once this temperature threshold is reached, clock rates steadily fall to the 2.0 GHz to 2.7 GHz range — far below the base 3.1 GHz clock rate — with core temperature cycling between 67 C and 74 C. The strange behavior mirrors our CineBench loop test above where scores are highest only on the first few runs before dropping and stabilizing in a sinusoidal behavior. This is uncommon on most notebooks where core clock rates and temperatures usually fall to flat rates should throttling be necessary. Running both Prime95 and FurMark simultaneously to stress the CPU and GPU results in steeper throttling and a core temperature in the low 70 C range for both processors.
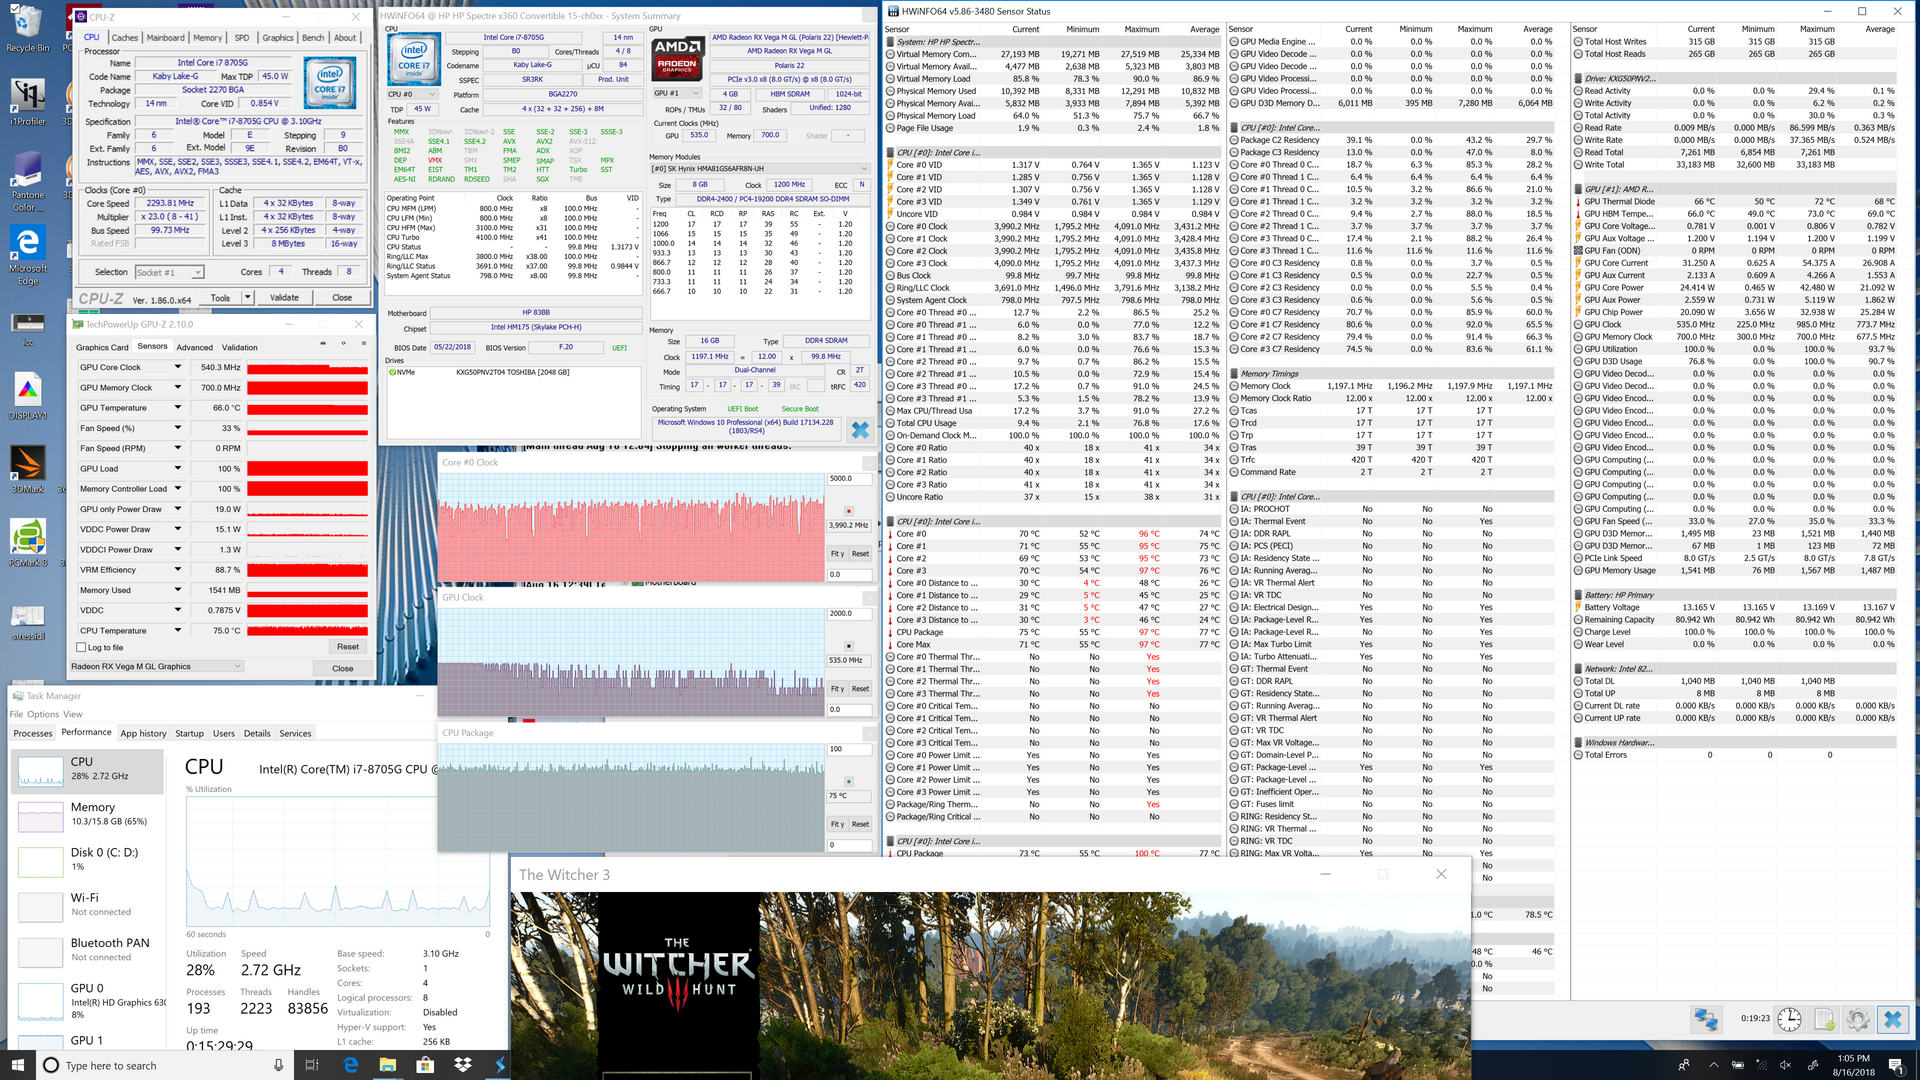
Running Witcher 3 is more representative of real-world gaming load. Unfortunately, the Spectre is unable to maintain steady performance yet again and frame rates suffer as a result. As shown by our screenshot below, GPU clock rates start out at 985 MHz before inexplicably falling to as low as 400 MHz. Frame rates fall from 40 FPS to just 20 FPS after 10 or 15 minutes of gameplay.
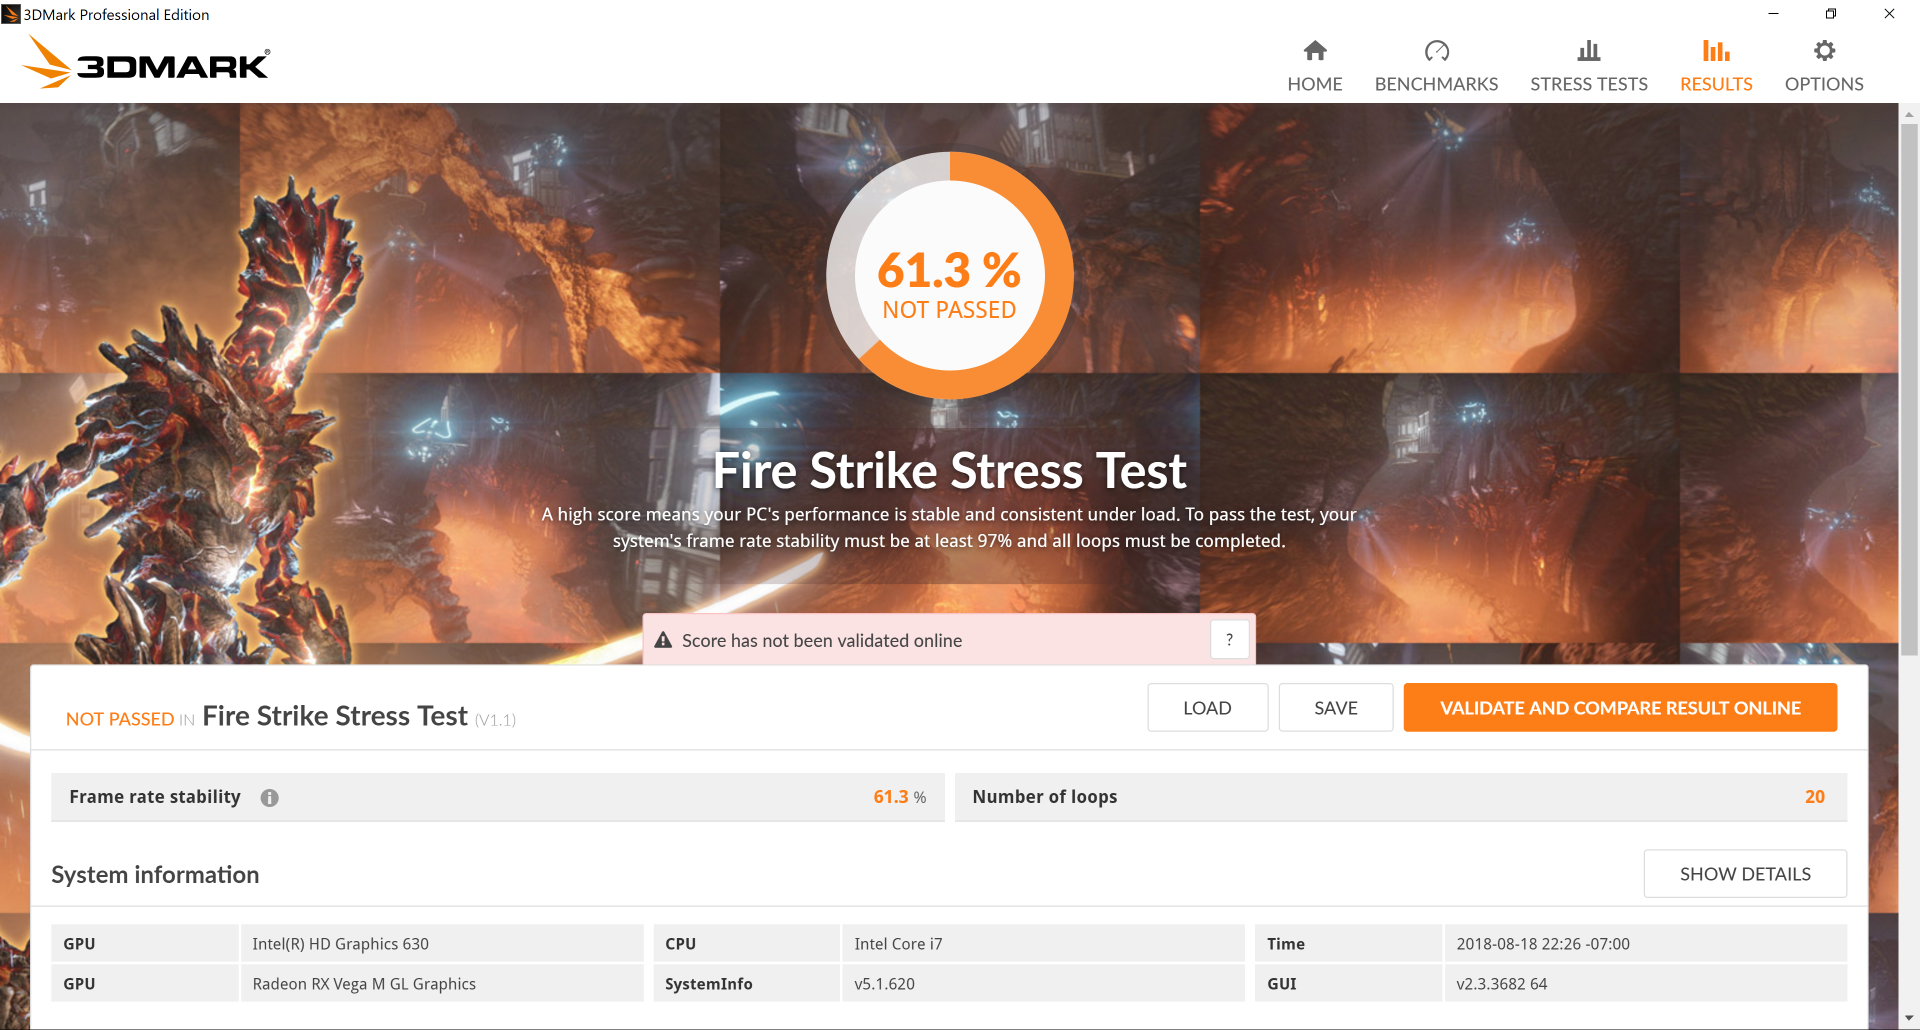
The results are disappointing and do not change despite updating our unit with the latest drivers from HP, Windows, and Intel and disabling the Radeon Chill feature. We double-checked our findings by running our Witcher 3 stress test thrice and recorded no differences. The system even fails the 3DMark Fire Strike Stress Test with a score of just 61.3 percent.
Running on battery power limits overall performance. A 3DMark 11 run on batteries returns Physics and Graphics scores of 8273 and 6030 points, respectively, compared to 8907 and 9632 points when on mains.
| CPU Clock (GHz) | GPU Clock (MHz) | Average CPU Temperature (°C) | Average GPU Temperature (°C) | |
| Prime95 Stress | 2.0 - 2.7 | -- | 67 - 74 | -- |
| FurMark Stress | -- | 400 - 464 | -- | 69 |
| Prime95 + FurMark Stress | 1.5 | 400 | 74 | 68 |
| Witcher 3 Stress | ~4.0 | 400 - 535 | 75 | 66 |
Emissions
System Noise
As suspected, the system is louder than the Kaby Lake-R SKU when gaming. Running Witcher 3 induces a fan noise of 48 dB(A) compared to just 38 dB(A) on the Kaby Lake-R alternative. The difference is significant to the point where volume will have to be turned up in order to overpower the fans. This may not be a gaming laptop per se, but its fans are definitely as loud as one.
The internal fans are always active no matter the loud. Fortunately, they're hardly noticeable during low loads like browsing or streaming. Background activity like OS updates or installations will quickly bump fans to higher nosie levels in the mid 30 dB(A) range.
We can notice no electronic noise or coil whine from our test unit.
Noise Level
| Idle |
| 30.8 / 30.9 / 30.9 dB(A) |
| Load |
| 31.8 / 44.2 dB(A) |
 | ||
30 dB silent 40 dB(A) audible 50 dB(A) loud |
||
min: | ||
| HP Spectre x360 15-ch000 Vega M GL / 870, i7-8705G, Toshiba XG5-P KXG50PNV2T04 | Asus ZenBook Pro 15 UX580GE GeForce GTX 1050 Ti Mobile, i9-8950HK, Samsung SSD PM961 1TB M.2 PCIe 3.0 x4 NVMe (MZVLW1T0) | HP Spectre x360 15-ch011nr GeForce MX150, i5-8550U, SK hynix PC401 NVMe 500 GB | Dell XPS 15 9575 i7-8705G Vega M GL / 870, i7-8705G, SK hynix PC401 NVMe 500 GB | MSI GS65 8RF-019DE Stealth Thin GeForce GTX 1070 Max-Q, i7-8750H, Samsung SSD PM981 MZVLB512HAJQ | Dell G7 15-7588 GeForce GTX 1060 Max-Q, i7-8750H, SK hynix SC311 SATA | |
|---|---|---|---|---|---|---|
| Noise | -2% | 6% | 5% | -5% | -4% | |
| off / environment * | 28.1 | 28 -0% | 28.6 -2% | 28.2 -0% | 30 -7% | 28.1 -0% |
| Idle Minimum * | 30.8 | 28.6 7% | 29.2 5% | 28.2 8% | 30 3% | 29 6% |
| Idle Average * | 30.9 | 29.9 3% | 29.2 6% | 28.2 9% | 31 -0% | 29 6% |
| Idle Maximum * | 30.9 | 30.5 1% | 29.2 6% | 28.2 9% | 34 -10% | 29.2 6% |
| Load Average * | 31.8 | 42.5 -34% | 29.2 8% | 29 9% | 43 -35% | 40.6 -28% |
| Witcher 3 ultra * | 48.1 | 44.8 7% | 38.4 20% | 44.7 7% | 42 13% | 49.8 -4% |
| Load Maximum * | 44.2 | 44.8 -1% | 45.7 -3% | 47.4 -7% | 44 -0% | 49.8 -13% |
* ... smaller is better
Temperature
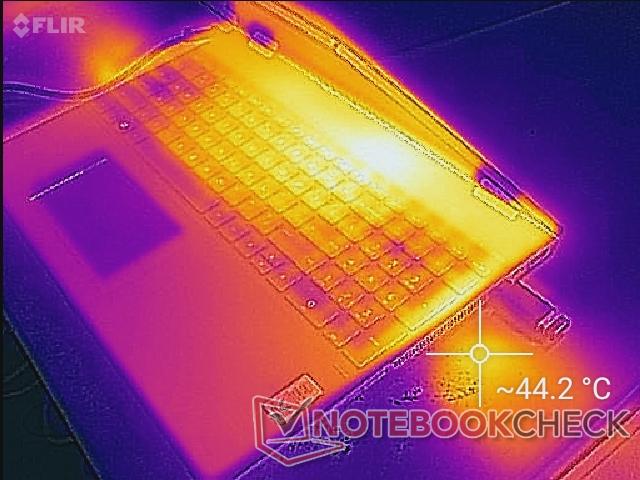
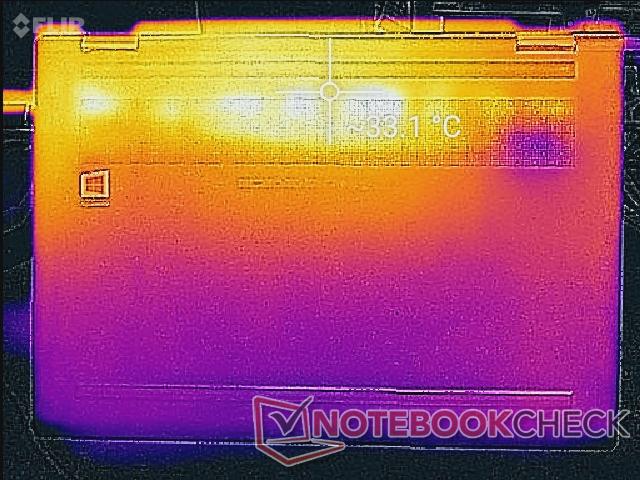
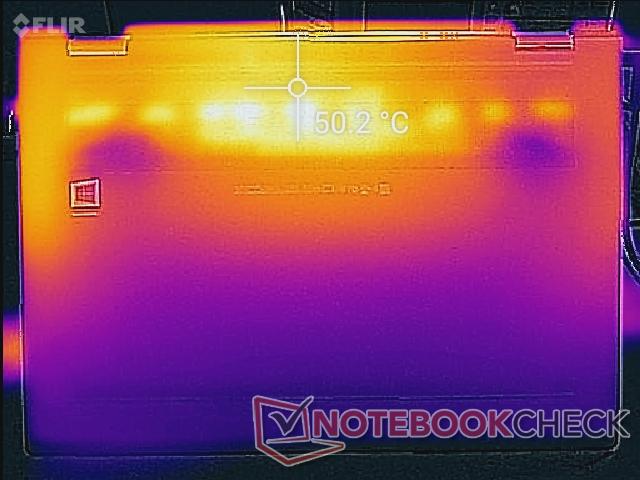
Surprisingly, surface temperatures are very similar to the Kaby Lake-R SKU even though the Kaby Lake-G configuration is equipped with much faster hardware. The louder fan noise from above is likely the culprit here for the balanced temperature gradient. The palm rests can become quite toasty while the WASD keys remain relatively cool no matter the load for comfortable gaming. This symmetrical temperature profile is in contrast to the XPS 15 9575 where the left half of the system will become much warmer than the right when under similar loads.
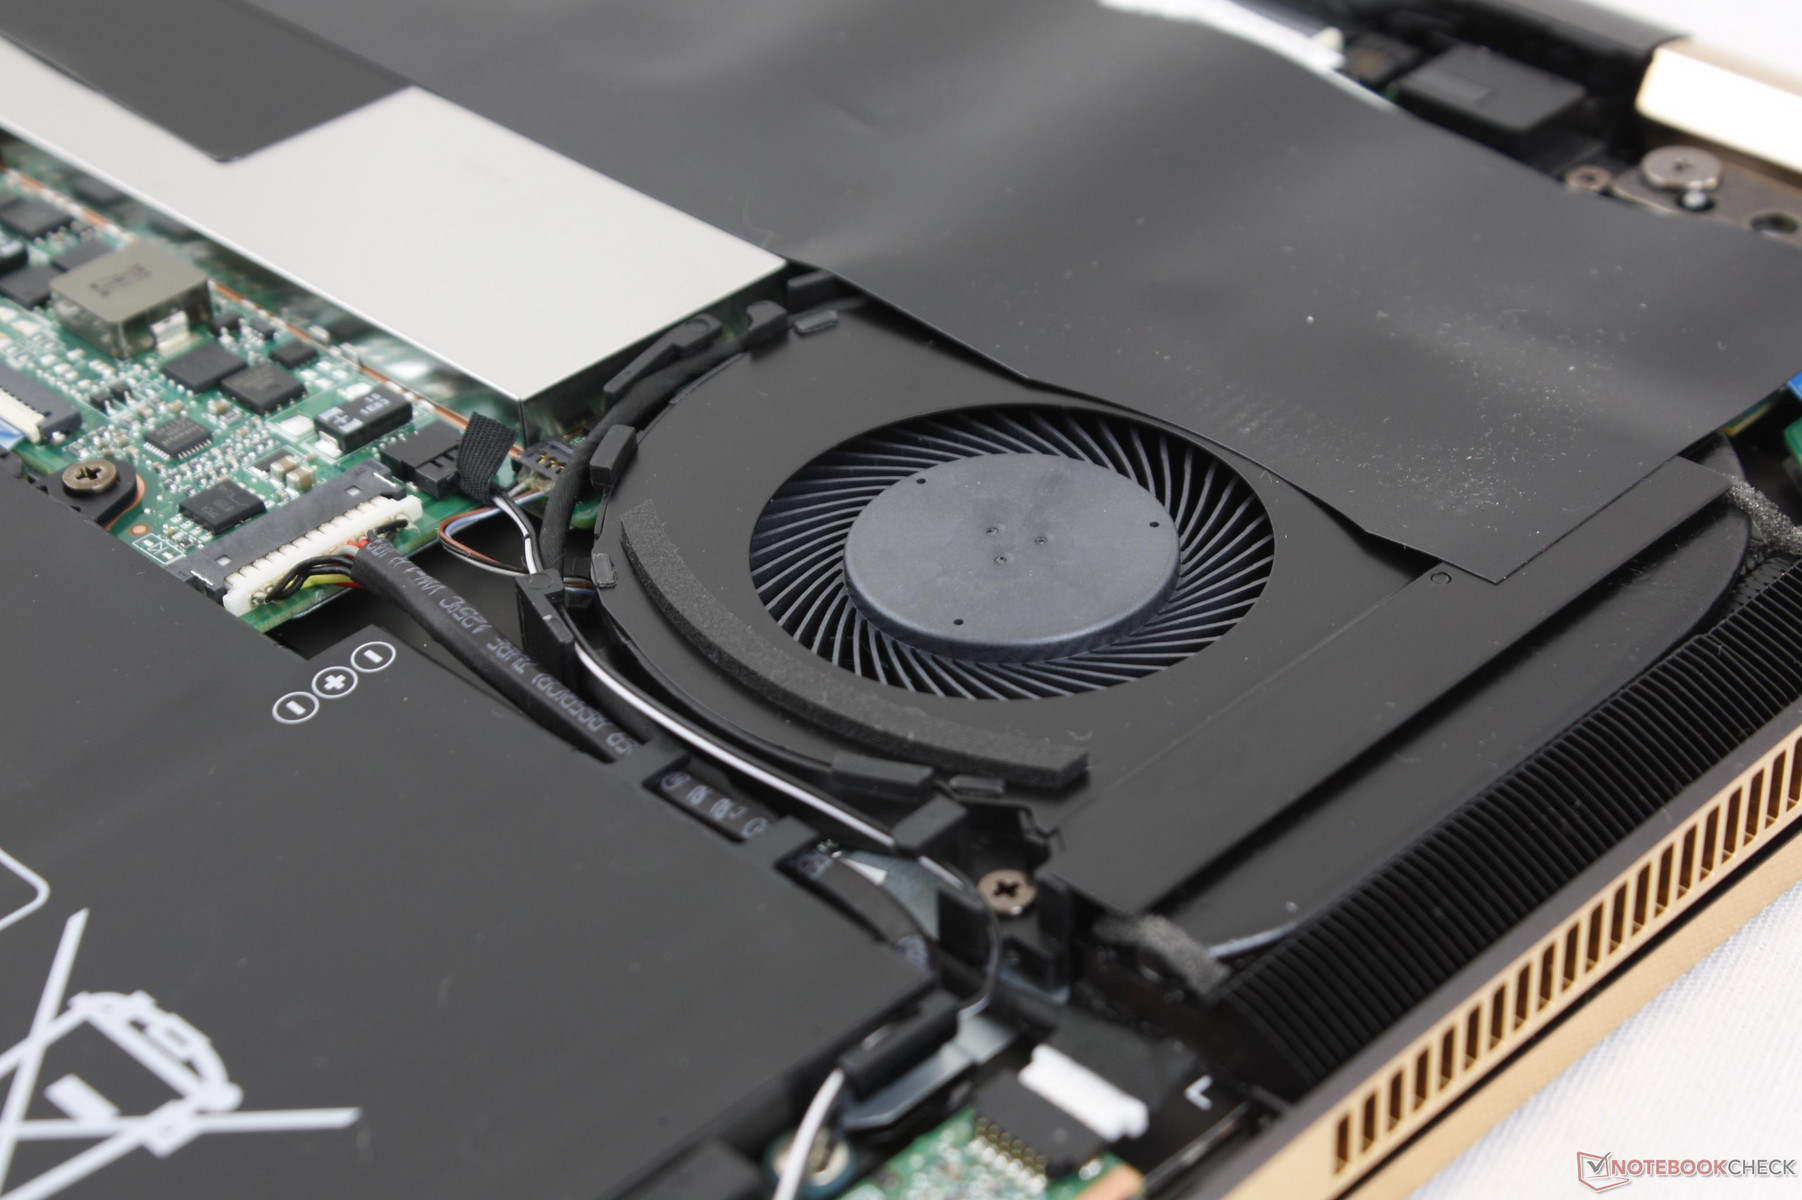
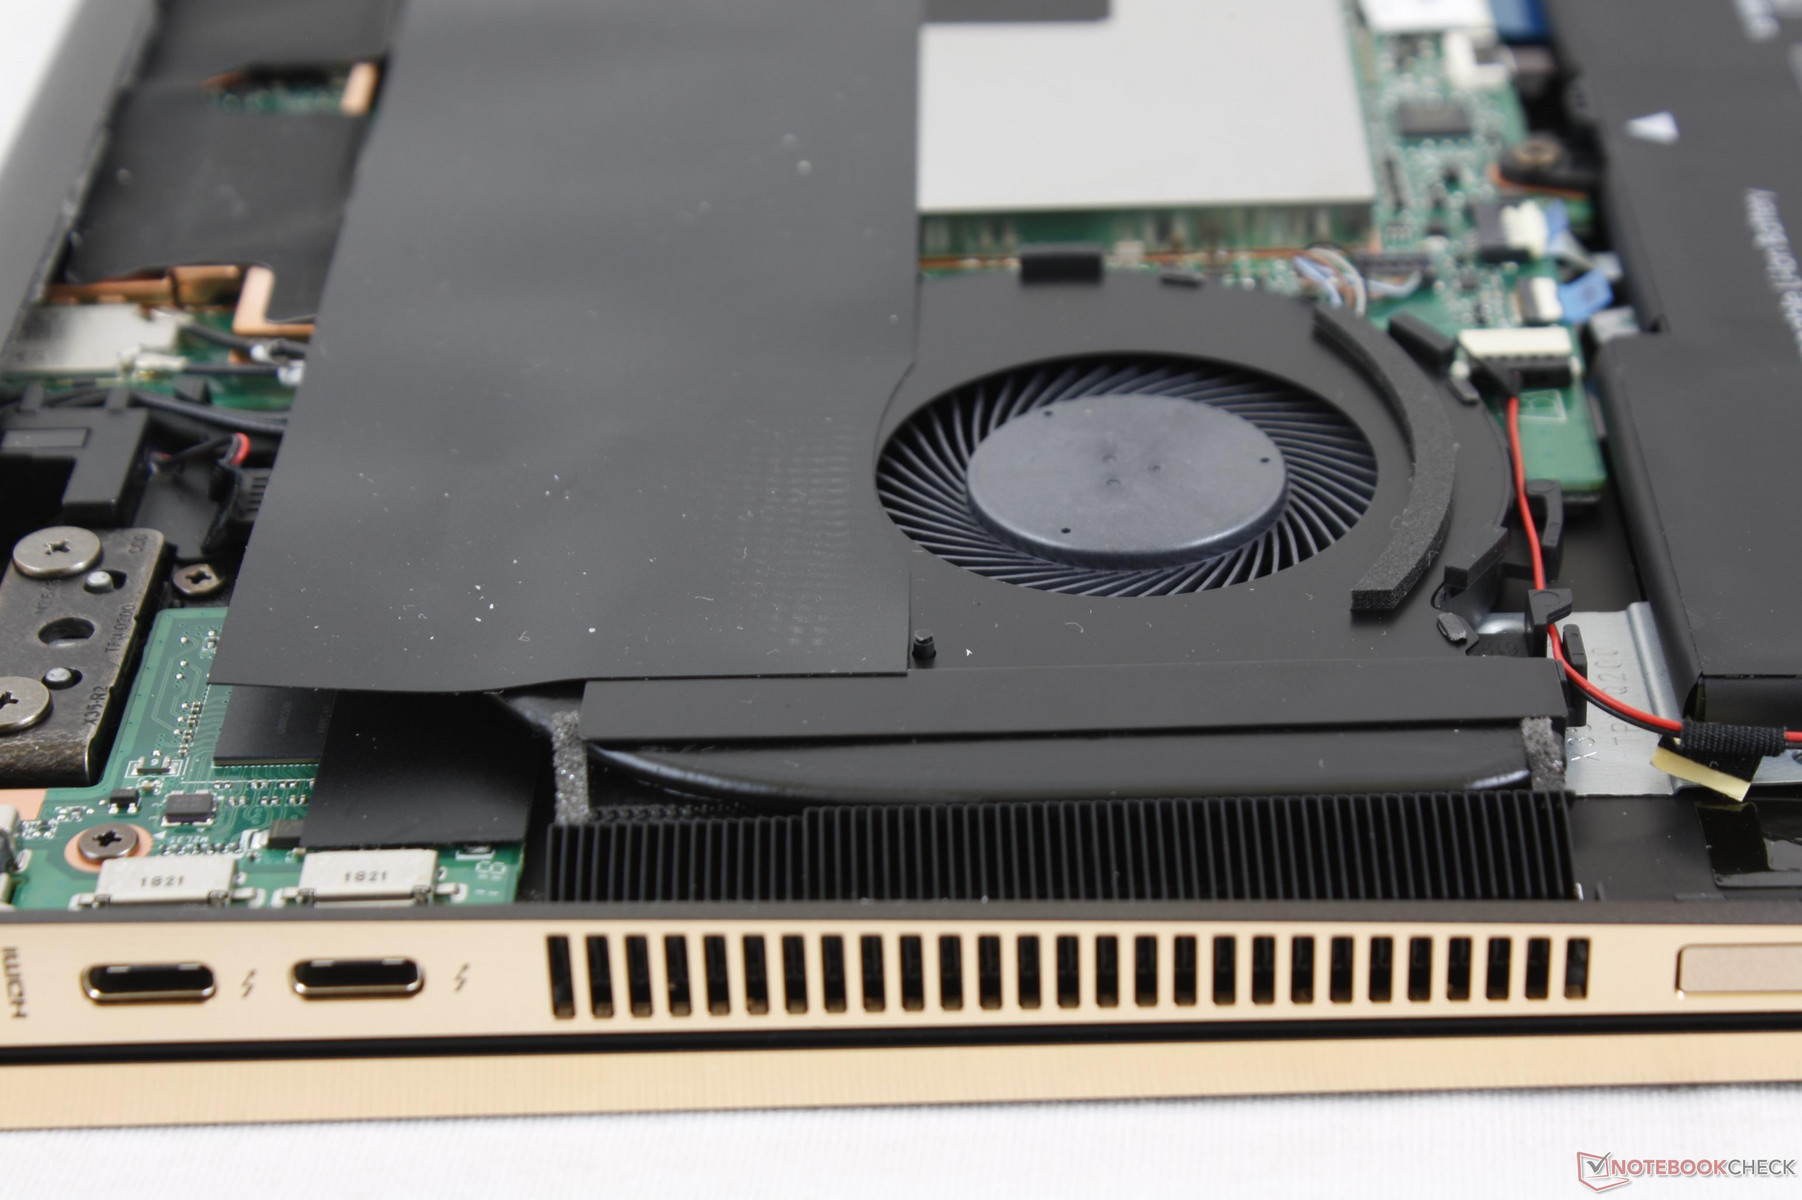
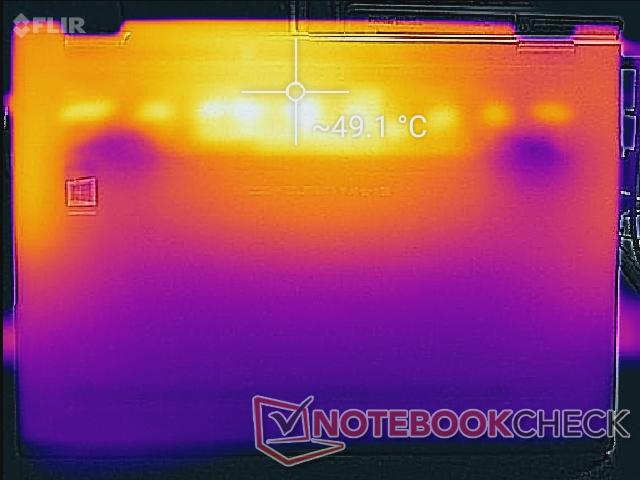
One interesting characteristic of the Spectre worth mentioning is its exhaust ports. While most high-performance laptops have dual rear-facing ventilation ports, the Spectre has them towards the left and right hand edges instead. Expect a warm hand if gaming with an external mouse.
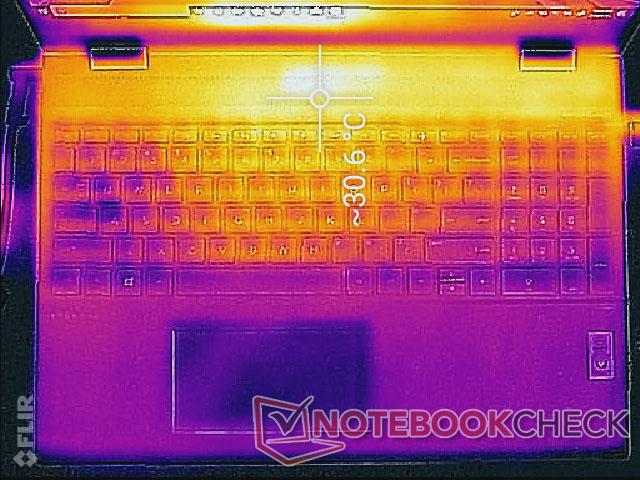
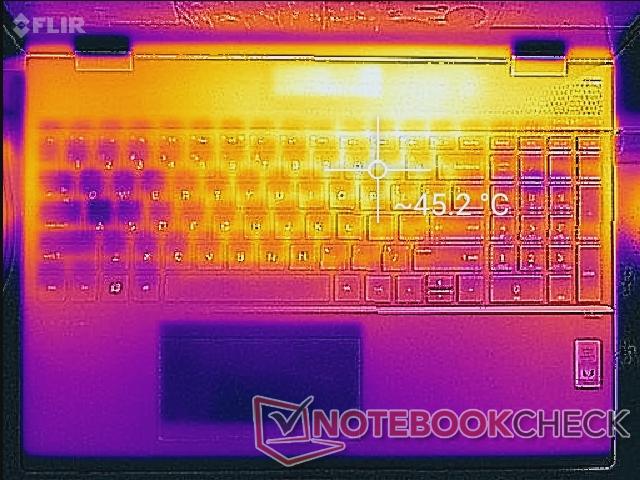
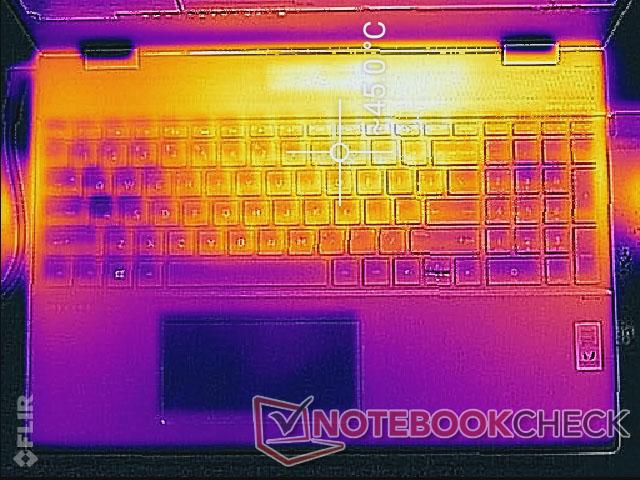
(-) The maximum temperature on the upper side is 46.4 °C / 116 F, compared to the average of 36.9 °C / 98 F, ranging from 21.1 to 71 °C for the class Multimedia.
(-) The bottom heats up to a maximum of 49.2 °C / 121 F, compared to the average of 39.1 °C / 102 F
(+) In idle usage, the average temperature for the upper side is 28 °C / 82 F, compared to the device average of 31.2 °C / 88 F.
(±) Playing The Witcher 3, the average temperature for the upper side is 36.8 °C / 98 F, compared to the device average of 31.2 °C / 88 F.
(+) The palmrests and touchpad are reaching skin temperature as a maximum (32.4 °C / 90.3 F) and are therefore not hot.
(-) The average temperature of the palmrest area of similar devices was 28.8 °C / 83.8 F (-3.6 °C / -6.5 F).
Speakers

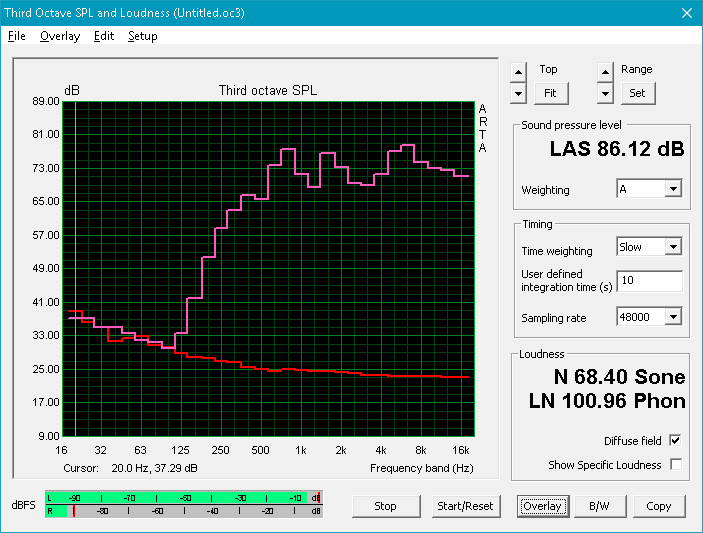
HP Spectre x360 15-ch000 audio analysis
(±) | speaker loudness is average but good (78.6 dB)
Bass 100 - 315 Hz
(-) | nearly no bass - on average 24.7% lower than median
(±) | linearity of bass is average (12.3% delta to prev. frequency)
Mids 400 - 2000 Hz
(+) | balanced mids - only 3.7% away from median
(±) | linearity of mids is average (10.1% delta to prev. frequency)
Highs 2 - 16 kHz
(+) | balanced highs - only 3.2% away from median
(+) | highs are linear (5.9% delta to prev. frequency)
Overall 100 - 16.000 Hz
(±) | linearity of overall sound is average (18.9% difference to median)
Compared to same class
» 54% of all tested devices in this class were better, 8% similar, 38% worse
» The best had a delta of 5%, average was 18%, worst was 45%
Compared to all devices tested
» 38% of all tested devices were better, 8% similar, 54% worse
» The best had a delta of 4%, average was 25%, worst was 134%
Apple MacBook 12 (Early 2016) 1.1 GHz audio analysis
(+) | speakers can play relatively loud (83.6 dB)
Bass 100 - 315 Hz
(±) | reduced bass - on average 11.3% lower than median
(±) | linearity of bass is average (14.2% delta to prev. frequency)
Mids 400 - 2000 Hz
(+) | balanced mids - only 2.4% away from median
(+) | mids are linear (5.5% delta to prev. frequency)
Highs 2 - 16 kHz
(+) | balanced highs - only 2% away from median
(+) | highs are linear (4.5% delta to prev. frequency)
Overall 100 - 16.000 Hz
(+) | overall sound is linear (10.2% difference to median)
Compared to same class
» 5% of all tested devices in this class were better, 2% similar, 93% worse
» The best had a delta of 5%, average was 19%, worst was 53%
Compared to all devices tested
» 3% of all tested devices were better, 1% similar, 96% worse
» The best had a delta of 4%, average was 25%, worst was 134%
Energy Management
Power Consumption
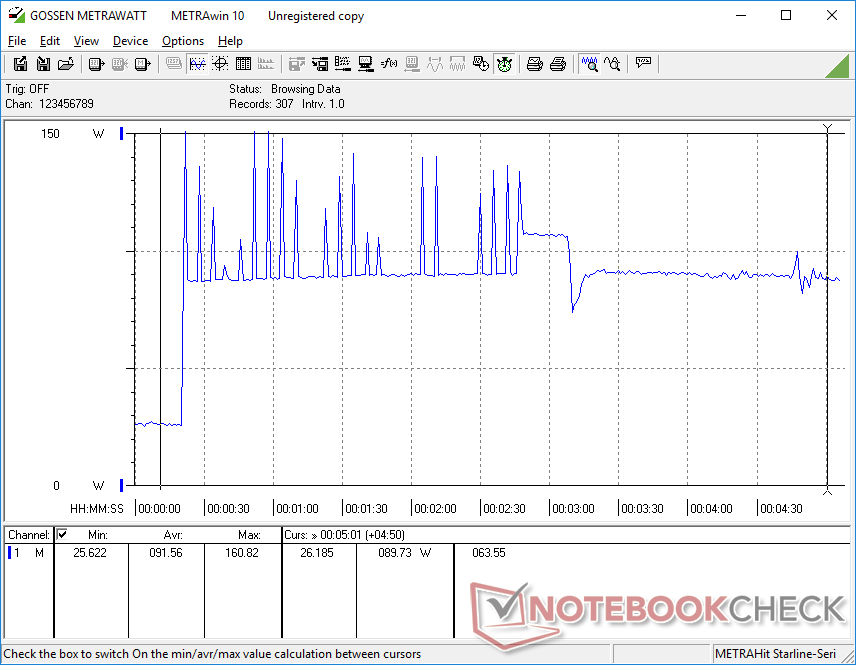
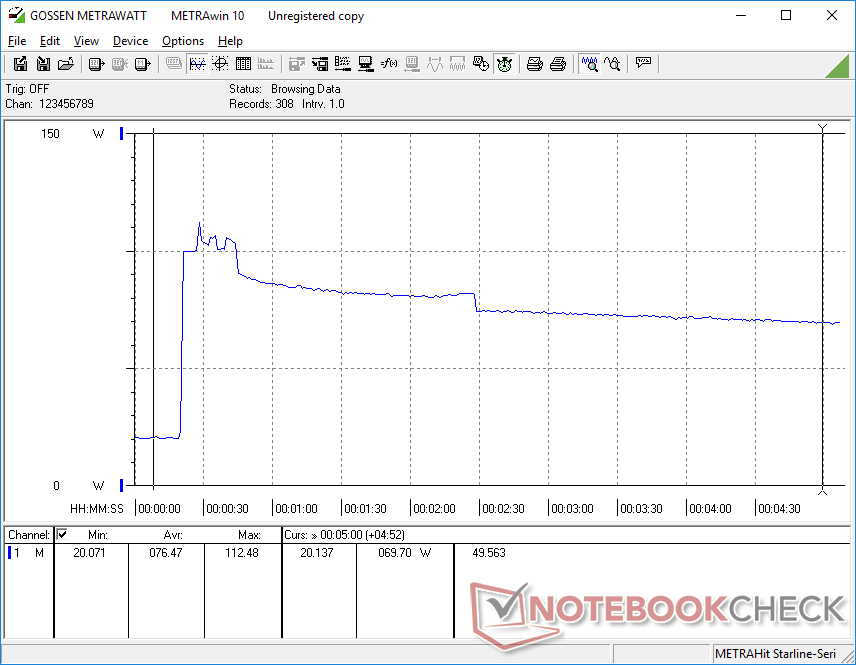
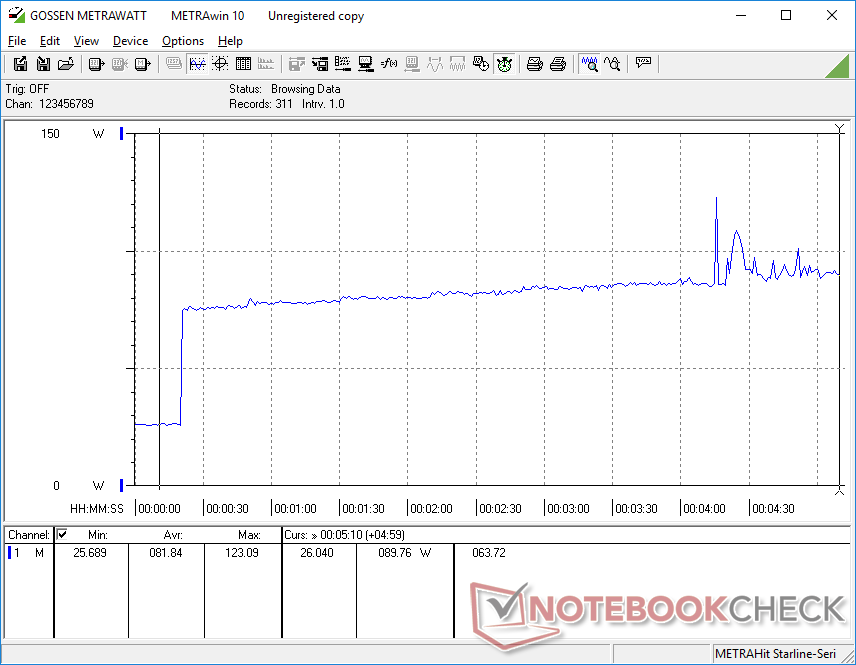
The Kaby Lake-G Spectre exhibits odd behavior when idling on desktop. The system would have periodic spikes in power consumption every 30 seconds or so possibly due to background activity. Such a behavior never occurred on our Kaby Lake-R SKU or XPS 15 9575 and so our power consumption readings for our Kaby Lake-G Spectre below are generally higher.
When under medium to high loads, average power consumption is just 11 to 22 percent higher than the Kaby Lake-R SKU. The results are actually very impressive considering that the i7-8705G CPU and Vega M GL GPU are roughly 35 percent and 100 percent faster than the i7-8550U and GeForce MX150 on paper, respectively. Its performance-per-Watt scales very well when compared to competing laptops with GTX 1050 or GTX 1050 Ti graphics.
The system ships with a 150 W AC adapter as opposed to the 90 W adapter on the Kaby Lake-R configuration. To our surprise, it's the same small physical size (~13.8 x 6.5 x 2.3 cm) as the 90 W adapter for the Kaby Lake-R configuration. We are able to record a draw of 160 W for a very short period when the system is subjected to extreme (prime95+FurMark) load.

| Off / Standby | |
| Idle | |
| Load |
|
| HP Spectre x360 15-ch000 i7-8705G, Vega M GL / 870, Toshiba XG5-P KXG50PNV2T04, IPS, 3840x2160, 15.60 | Dell XPS 15 9575 i7-8705G i7-8705G, Vega M GL / 870, SK hynix PC401 NVMe 500 GB, IPS, 3840x2160, 15.60 | HP Spectre x360 15-ch011nr i5-8550U, GeForce MX150, SK hynix PC401 NVMe 500 GB, IPS, 3840x2160, 15.60 | Razer Blade 15 GTX 1060 i7-8750H, GeForce GTX 1060 Max-Q, Samsung SSD PM981 MZVLB512HAJQ, IPS, 1920x1080, 15.60 | Asus ZenBook Pro 15 UX580GE i9-8950HK, GeForce GTX 1050 Ti Mobile, Samsung SSD PM961 1TB M.2 PCIe 3.0 x4 NVMe (MZVLW1T0), IPS, 3840x2160, 15.60 | Apple MacBook Pro 15 2018 (2.6 GHz, 560X) i7-8850H, Radeon Pro 560X, Apple SSD AP0512, IPS, 2880x1800, 15.40 | |
|---|---|---|---|---|---|---|
| Power Consumption | 17% | 30% | -23% | -14% | 27% | |
| Idle Minimum * | 11.7 | 6.2 47% | 5.3 55% | 14.9 -27% | 11.7 -0% | 3.4 71% |
| Idle Average * | 16.8 | 12.9 23% | 9.8 42% | 17.5 -4% | 18.5 -10% | 11 35% |
| Idle Maximum * | 18.9 | 13.6 28% | 12.6 33% | 19.2 -2% | 22.8 -21% | 14.9 21% |
| Load Average * | 82.3 | 76.1 8% | 73 11% | 103.2 -25% | 97.5 -18% | 78.9 4% |
| Witcher 3 ultra * | 87.2 | 84.3 3% | 67.6 22% | 123.1 -41% | 102.9 -18% | |
| Load Maximum * | 94.9 | 99.4 -5% | 80 16% | 132.7 -40% | 111.1 -17% | 91.2 4% |
* ... smaller is better
Battery Life
Runtimes are significantly shorter than the Kaby Lake-R SKU by as much as several hours when subjected to similar WLAN loads. Expect about 6 hours of constant web browsing compared to over 10 hours on the Kaby Lake-R alternative.
Charging from near empty to full capacity takes just under 2 hours.
| HP Spectre x360 15-ch000 i7-8705G, Vega M GL / 870, 84 Wh | Asus ZenBook Pro 15 UX580GE i9-8950HK, GeForce GTX 1050 Ti Mobile, 71 Wh | Dell XPS 15 9575 i7-8705G i7-8705G, Vega M GL / 870, 75 Wh | HP Spectre x360 15-ch011nr i5-8550U, GeForce MX150, 84 Wh | Razer Blade 15 GTX 1060 i7-8750H, GeForce GTX 1060 Max-Q, 80 Wh | Apple MacBook Pro 15 2018 (2.6 GHz, 560X) i7-8850H, Radeon Pro 560X, 83 Wh | |
|---|---|---|---|---|---|---|
| Battery Runtime | 27% | 14% | 86% | 17% | 78% | |
| Reader / Idle | 540 | 842 56% | 673 25% | 927 72% | ||
| WiFi v1.3 | 344 | 375 9% | 420 22% | 625 82% | 402 17% | 614 78% |
| Load | 66 | 76 15% | 63 -5% | 135 105% | ||
| Witcher 3 ultra | 88 |
Pros
Cons
Verdict

A 15-inch convertible is hard to crack simply because the large screen size innately makes tablet mode more cumbersome compared to smaller options. The HP Spectre x360 15 may be slightly larger than the competing XPS 15 9575, but its design and quality feel second to none in its category.
Dig deeper into the performance of the Kaby Lake-G Spectre and the system begins to disappoint when compared to the Kaby Lake-R configuration. On paper, the Core i7-8705G and Radeon RX Vega M GL should be significantly faster than the i7-8550U and GeForce MX150. In practice, however, the Kaby Lake-G SKU suffers from considerable throttling issues that ultimately mitigate much of the performance advantages that the chipset brings to the table. Owners who intend to use the notebook for mostly word processing, streaming, or browsing will not notice the throttling, but running demanding sustained loads like games will bring the system to its knees.
The lower power profiles of the i7-8550U and GeForce MX150 also work in favor of the less expensive Kaby Lake-R configuration. Our Kaby Lake-G unit is generally louder and with a much shorter battery life than the Kaby Lake-R version.
If you plan on doing a lot of gaming or are sensitive to onscreen flickering, then you'd be better off with the XPS 15 9575 or a dedicated mainstream gaming laptop with GTX 1050 Ti graphics if the 2-in-1 functionality is of little interest. If browsing and light multimedia are your intention, then the Kaby Lake-R Spectre will be more than sufficient.
Kaby Lake-G is an impressive piece of technology as proven by the Intel Hades Canyon NUC and Dell XPS 15 9575. The Spectre x360 15 is the least impressive implementation of the chipset we've seen thus far. If you want Kaby Lake-G, then the Dell equivalent is the better option. Otherwise, spare yourself from the performance throttling issues by going for the less expensive and more stable Kaby Lake-R Spectre x360 15 configuration.
HP Spectre x360 15-ch000
-
08/20/2018 v6(old)
Allen Ngo
Pricecompare
