

AMD Ryzen 9 5900X vs AMD A8-3550MX
AMD Ryzen 9 5900X
► remove from comparison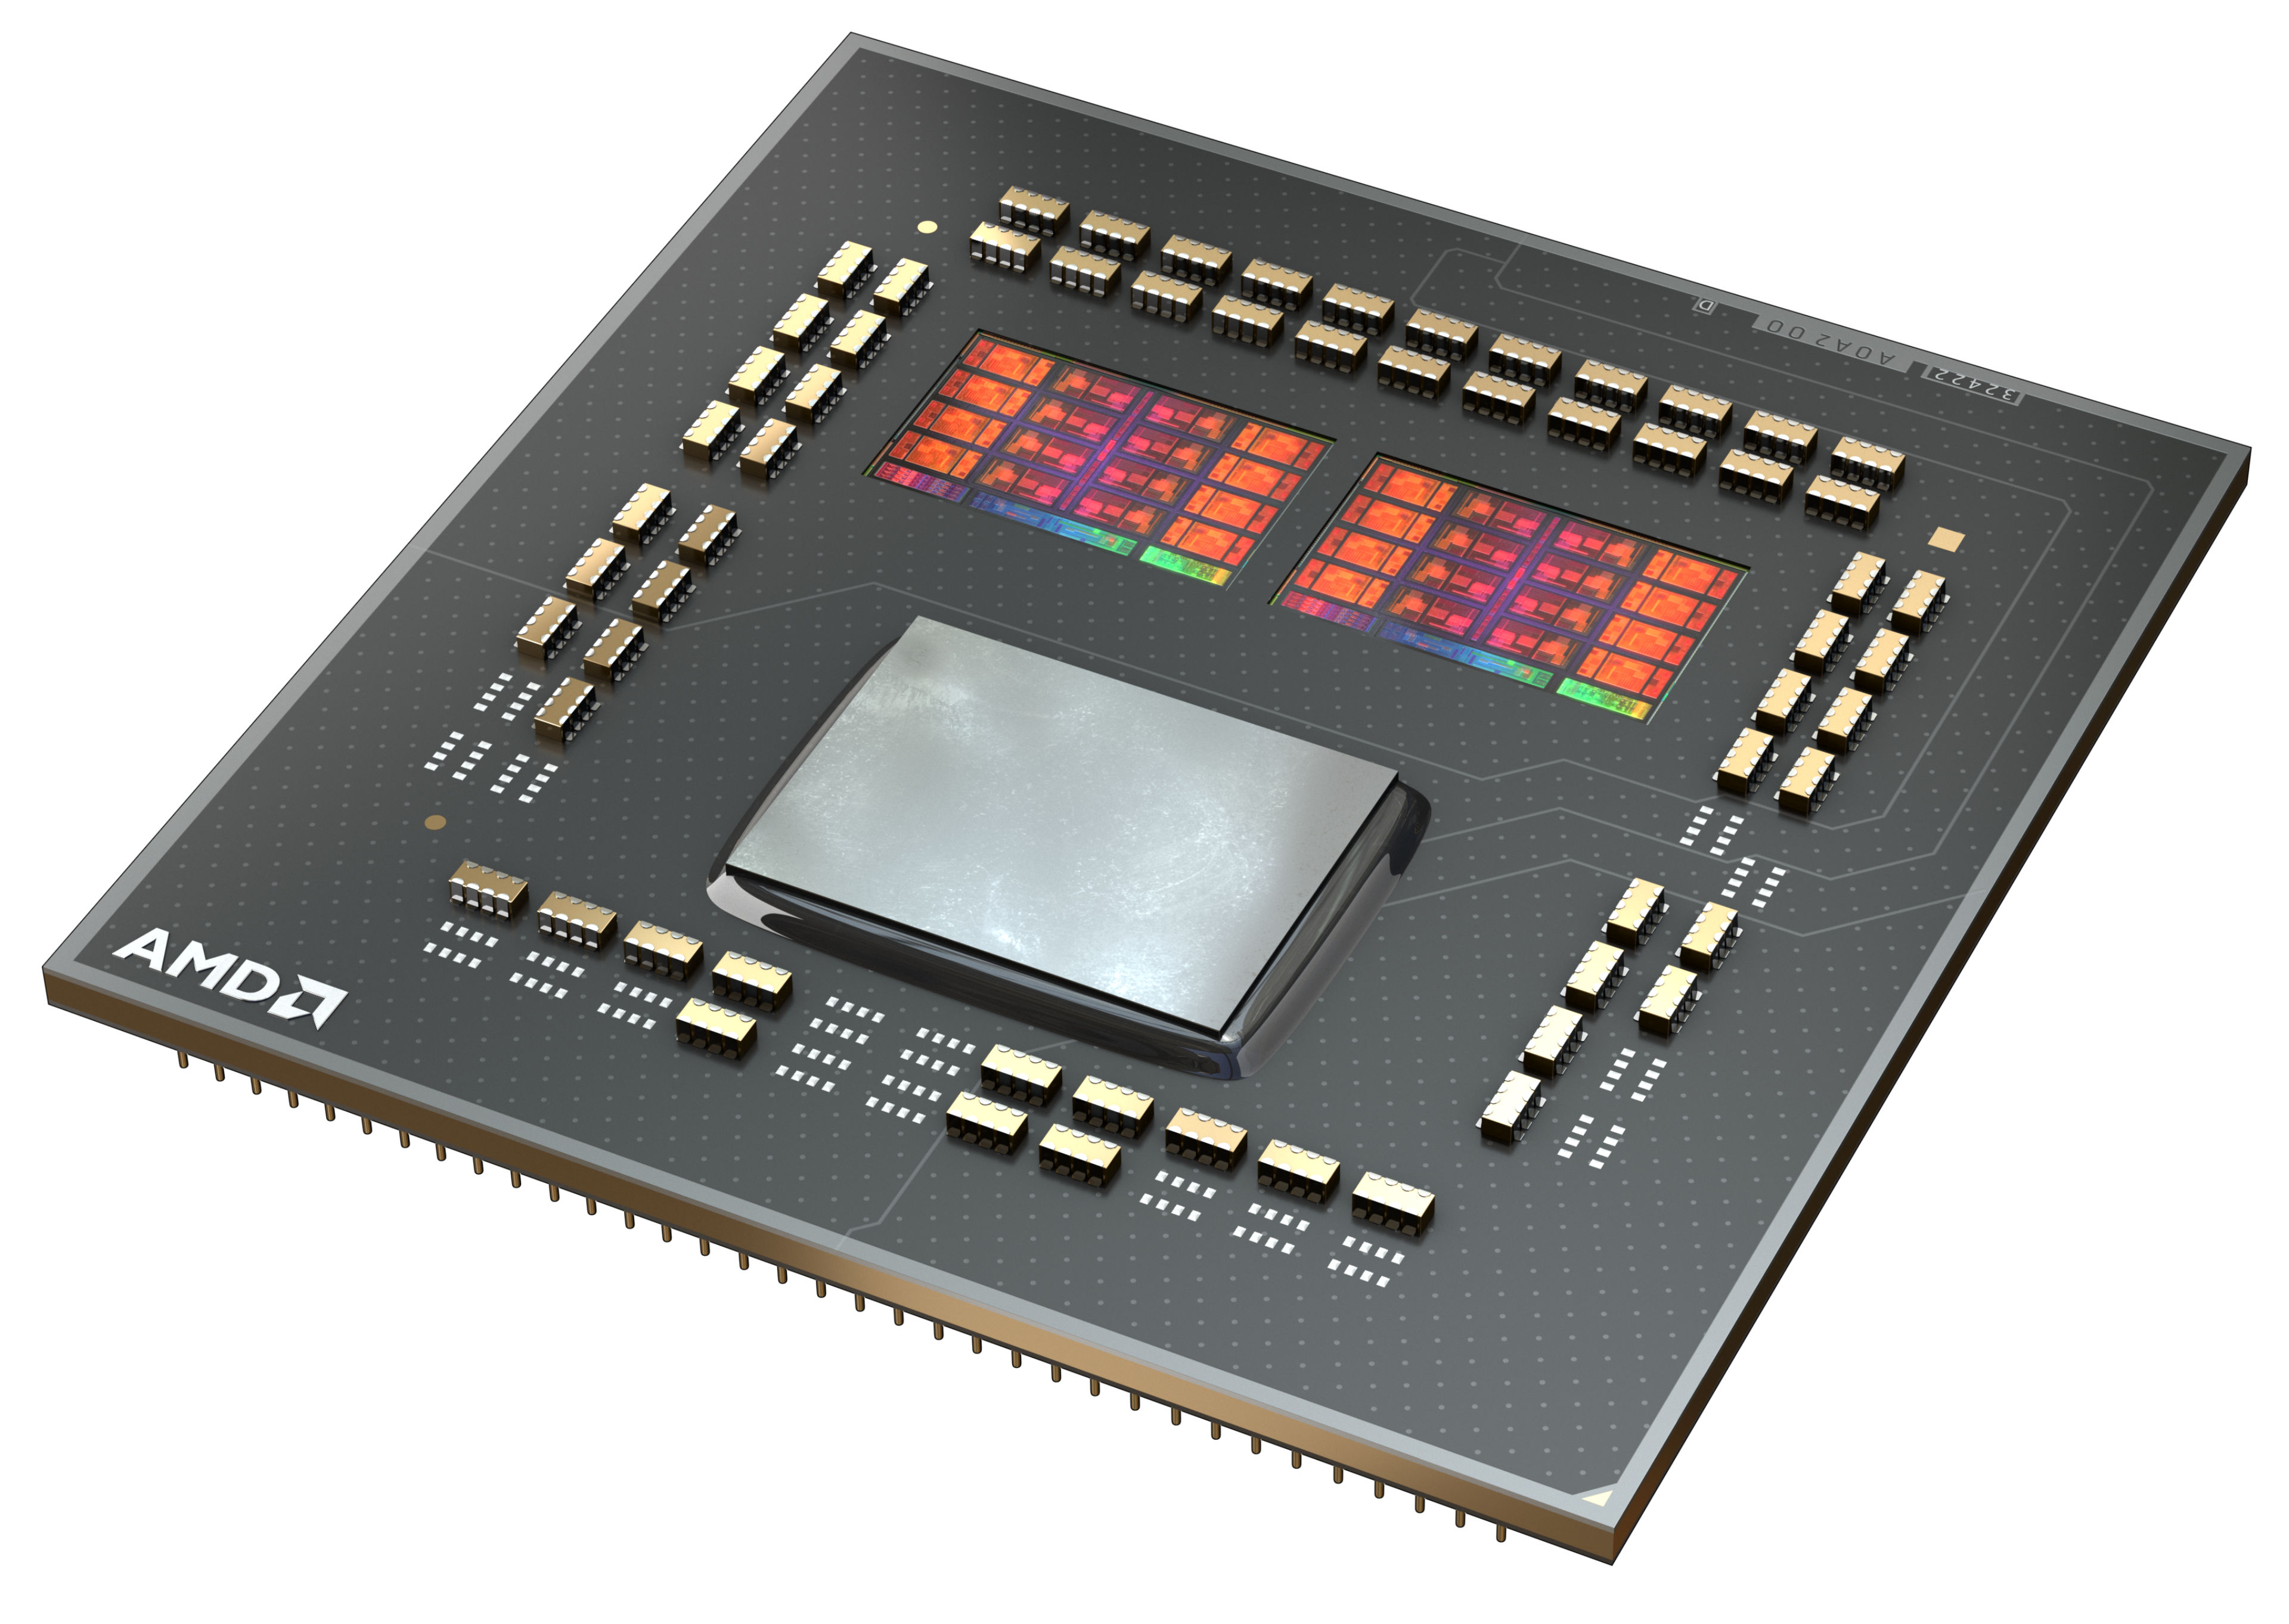
The AMD Ryzen 9 5900X is a high-end 12-core, hyperthreaded (SMT) Vermeer series desktop processor that can process 24 threads simultaneously. Introduced on October 8, 2020, the Ryzen 9 5900X is the fastest 12-core processor and is specified at 105 watts TDP. The top model, the AMD Ryzen 9 5950X, offers even more power and at the same time offers another 4 cores and 8 threads.
The Ryzen 9 5900X clocks with 3.7 GHz base clock and reaches up to 4.8 GHz on one core in turbo mode. However, when all 12 cores are loaded, up to 4.5 GHz is still possible.
The performance of the AMD Ryzen 9 5900X is consistently excellent in all applications and significantly better than the AMD Ryzen 9 3900X. AMD has been able to significantly improve its single thread performance in particular and even beats the Intel Core i9-10900K in this discipline. The multi-thread performance could also be improved. In an in-house duel, the AMD Ryzen 9 5900X can even take on an AMD Threadripper 2950X.
The internal structure of the processor has not changed fundamentally at first glance. The CCX structure has changed a bit compared to Zen2, because now a CCX consists of up to 8 CPU cores. So each individual core can access the complete L3 cache (32 MByte). Furthermore the CCX modules are connected to each other via the same I/O die, which we already know from Zen2. According to AMD, the Infinity-Fabric should now reach clock rates of up to 2 GHz, which in turn allows a RAM clock of 4.000 MHz without performance loss.
For the manufacturing processes, AMD also relies on TSCM for the Vermeer processors for the 7nm production of the CPU cores, although the I/O die is still supplied in 12nm by Globalfoundries.
In games, the AMD Ryzen 9 5900X is convincing thanks to the significantly improved IPC. With the AMD Ryzen 9 5900X, streaming can be done simultaneously with gaming. But if you only want to play games, you are well advised to take a closer look at the AMD Ryzen 7 5800X or the AMD Ryzen 5 5600X.
AMD A8-3550MX
► remove from comparison
The AMD A6-3550MX (Codename Llano, A-Series) is a quad-core processor for mid-range laptops. It is part of the Fusion family of APUs (=Accelerated Processing Units) and features an integrated Radeon HD 6620G graphics card. The processor core is clocked at 2 GHz base clock speed and is able to automatically overclock up to 2.7 GHz (TurboCore, depending on temperature and processor load).
The processor core is based on the Husky familiy 12h. Compared to the older Phenom II mobile processors, the Husky core is very similar but features an additional hardware divider. However, the performance per clock should be similar to the old Turion II, Athlon II, Phenom II mobile processors (as the Llano APU they did not feature a Level 3 cache).
The performance of the processor part depends on the used cores. Due to Turbo Core, a single core can be clocked up to 2.7 GHz leading to a performance of a AMD Turion II N570 (2.7 GHz 2MB L2 Cache). Using all four cores, the performance is in the range of the Phenom II X4 N950 (2.1 GHz 2MB L2 Cache).
The Llano APUs feature an integrated DirectX 11 capable graphics card with a maximum of 400 cores. The AMD Radeon HD 6620G called version in the A8-Series offers all 320 cores at 444MHz. It has no dedicated memory and also is not able to use the integrated cache (in difference to the Intel HD 3000). Furthermore the APU also features an integrated UVD3 video processor to fully decode most used HD videos (like H.264, VC-1, MPEG4).
The A8-3550MX also features an integrated dual-channel memory controller with support for DDR3-1600 or DDR3L-1333 memory and a PCIe 2.0 controller.
The TDP of 45 Watt for the APU (including graphics card and memory controller) makes it best suited for 15-inch+ laptops.
| Model | AMD Ryzen 9 5900X | AMD A8-3550MX | ||||||||||||||||||||||||||||||||||||||||||||||||||||||||||||||||
| Codename | Vermeer (Zen3) | Llano | ||||||||||||||||||||||||||||||||||||||||||||||||||||||||||||||||
| Series | AMD Vermeer (Ryzen 5000) | AMD AMD A-Series | ||||||||||||||||||||||||||||||||||||||||||||||||||||||||||||||||
| Series: AMD A-Series Llano |
|
| ||||||||||||||||||||||||||||||||||||||||||||||||||||||||||||||||
| Clock | 3700 - 4800 MHz | 2000 - 2700 MHz | ||||||||||||||||||||||||||||||||||||||||||||||||||||||||||||||||
| L1 Cache | 768 KB | 512 KB | ||||||||||||||||||||||||||||||||||||||||||||||||||||||||||||||||
| L2 Cache | 6 MB | 4 MB | ||||||||||||||||||||||||||||||||||||||||||||||||||||||||||||||||
| L3 Cache | 64 MB | |||||||||||||||||||||||||||||||||||||||||||||||||||||||||||||||||
| Cores / Threads | 12 / 24 | 4 / 4 | ||||||||||||||||||||||||||||||||||||||||||||||||||||||||||||||||
| TDP | 105 Watt | 45 Watt | ||||||||||||||||||||||||||||||||||||||||||||||||||||||||||||||||
| Technology | 7 nm | 32 nm | ||||||||||||||||||||||||||||||||||||||||||||||||||||||||||||||||
| Die Size | 2x 80.7 + 125 (I/O) mm2 | 218 mm2 | ||||||||||||||||||||||||||||||||||||||||||||||||||||||||||||||||
| Socket | AM4 (1331) | |||||||||||||||||||||||||||||||||||||||||||||||||||||||||||||||||
| Features | MMX(+), SSE, SSE2, SSE3, SSSE3, SSE4.1, SSE4.2, SSE4A, x86-64, AMD-V, AES, AVX, AVX2, FMA3, SHA, Precision Boost 2 | 3DNow!, MMX, SSE, SSE2, SSE3, SSE4a, Radeon HD 6620G, DDR3(L)-1333/1600 Memory Controller | ||||||||||||||||||||||||||||||||||||||||||||||||||||||||||||||||
| Architecture | x86 | x86 | ||||||||||||||||||||||||||||||||||||||||||||||||||||||||||||||||
| $549 U.S. | ||||||||||||||||||||||||||||||||||||||||||||||||||||||||||||||||||
| Announced | ||||||||||||||||||||||||||||||||||||||||||||||||||||||||||||||||||
| Transistors | 1000 Million | |||||||||||||||||||||||||||||||||||||||||||||||||||||||||||||||||
| iGPU | AMD Radeon HD 6620G (444 MHz) | |||||||||||||||||||||||||||||||||||||||||||||||||||||||||||||||||
| Manufacturer | products.amd.com |

Benchmarks

Average Benchmarks AMD Ryzen 9 5900X → 0% n=0
* Smaller numbers mean a higher performance
1 This benchmark is not used for the average calculation