Notebookcheck Logo

AMD Ryzen 7 9800X3D vs AMD Ryzen 5 8645HS vs AMD Ryzen 5 9600X

AMD Ryzen 7 9800X3D

► remove from comparison AMD R7 9800X3D

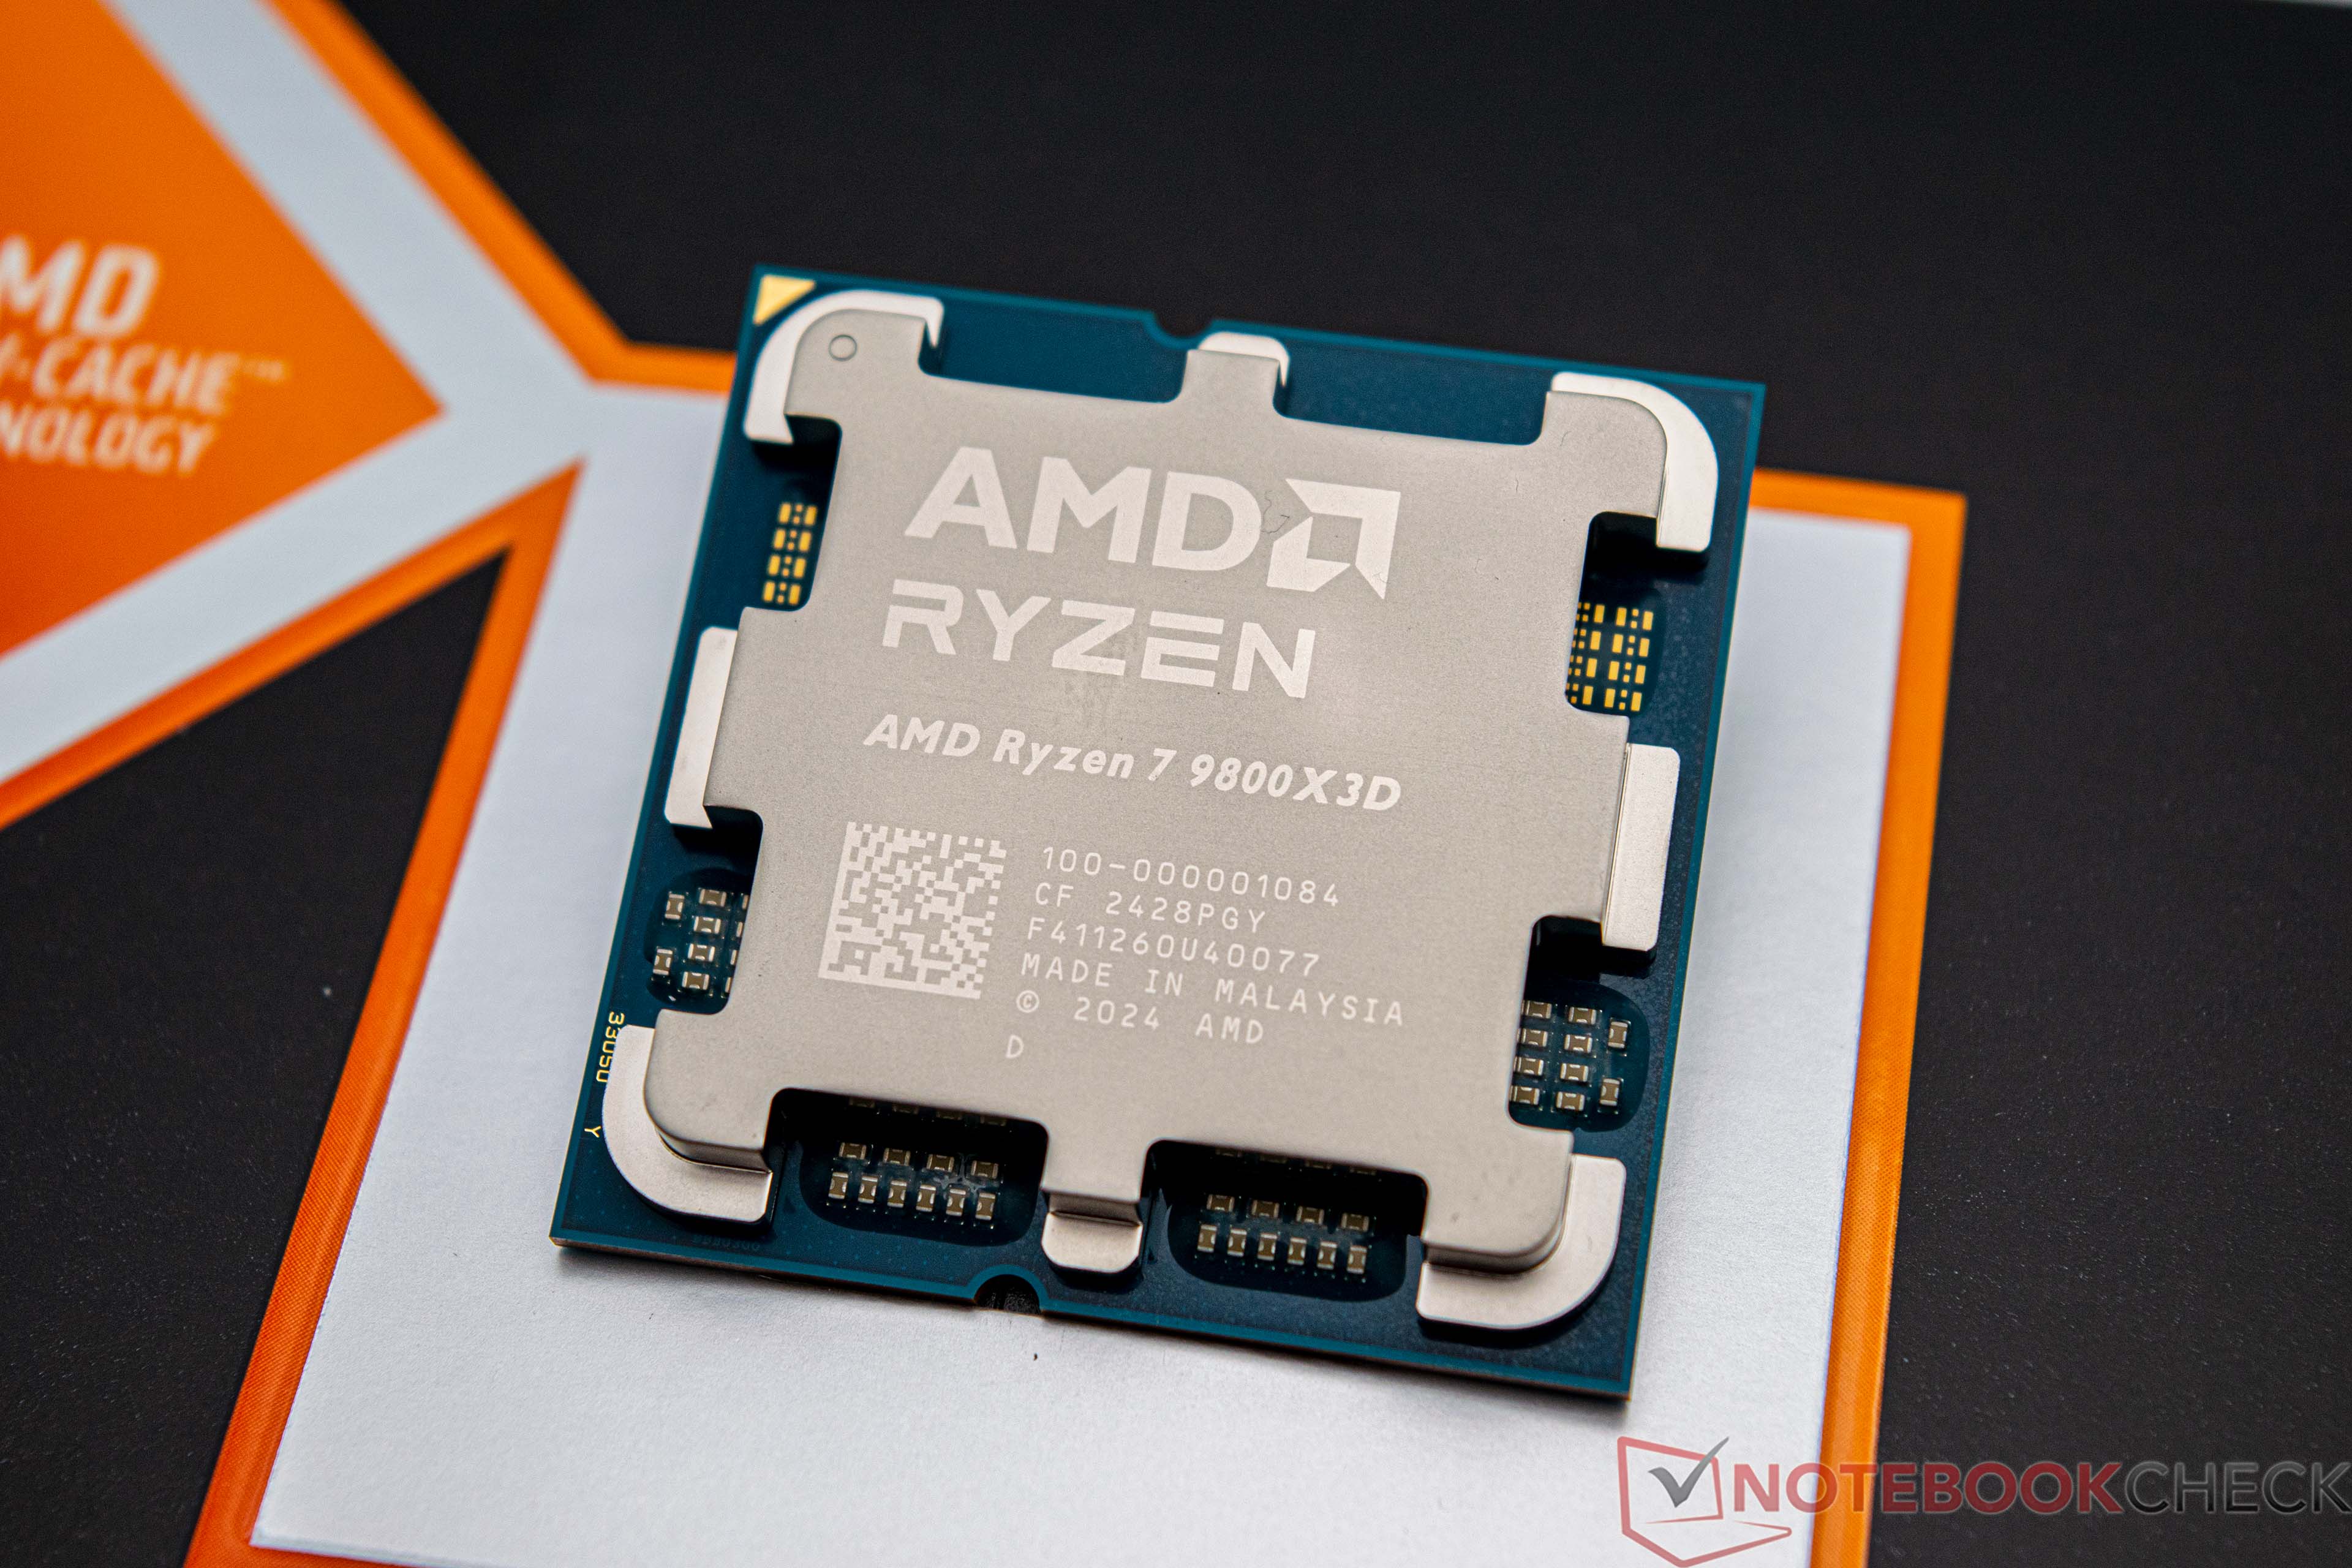
Der AMD Ryzen 7 9800X3D ist ein High-End-Prozessor, der speziell für Gamer und anspruchsvolle Anwender entwickelt wurde. Er basiert auf der neuesten Zen-5-Architektur von AMD und wird im fortschrittlichen 4-nm-Verfahren gefertigt, was nicht nur höhere Effizienz, sondern auch eine bessere Leistung ermöglicht. Mit seinen 8 Kernen und 16 Threads bietet der 9800X3D eine solide Basis für rechenintensive Anwendungen.

Der größte Vorteil des AMD Ryzen 7 9800X3D ist die 3D V-Cache-Technologie, die komplett überarbeitet wurde und sich signifikant von den Modellen der 7000er-Serie unterscheidet. Die Änderungen resultieren in einer deutlich gesteigerten Taktfrequenz und einer besseren Wärmeverteilung. Der interne Aufbau besteht weiterhin aus einem I/O-Die sowie einem CCD. Letzterer beinhaltet die 8 Kerne sowie den 3D V-Cache und wird im 4nm-Prozess hergestellt. Beim I/O-Die hält AMD weiterhin am 6nm-Herstellungsprozess fest. Die Taktraten steigen im Vergleich zum Vorgängermodell spürbar. So beträgt der Basistakt 4,7 GH/z, wenngleich im Turbo bis zu 5,2 GH/s möglich sind.

Neben der überragenden Gaming-Performance überzeugt der AMD Ryzen 7 9800X3D auch in produktiven Anwendungen. Während er speziell auf Spieleoptimierung ausgelegt ist, schneidet er in Anwendungen wie 3D-Modellierung, Videobearbeitung und anderen kreativen Workloads spürbar besser ab als ein AMD Ryzen 7 7800X3D.

Die Leistungsaufnahme des AMD Ryzen 7 9800X3D beträgt 120 Watt, welche als PPT maximal 162 Watt beträgt. Damit gibt es in diesem Punkt keine Änderungen im Vergleich zum AMD Ryzen 7 7800X3D. Aufgrund gesteigerter Leistung kann die Effizienz des AMD Ryzen 7 9800X3D spürbar gesteigert werden. An die Effizienz der Arrow-Lake-Prozessoren kommt AMD allerdings trotz deutlich besserer Gaming-Leistung nicht heran.

Hier geht es zu unserem Test des AMD Ryzen 7 9800X3D.

AMD Ryzen 5 8645HS

► remove from comparison AMD R5 8645HS

The Ryzen 5 8645HS is an upper mid-range processor (APU) of the Hawk Point family. This isn't an entirely new chip; instead, the 8645HS is a rebadged Ryzen 5 7640HS with higher clock speeds on the Ryzen AI NPU. The 8645HS was brought to life in Q4 2023 and it has 6 SMT-enabled Zen 4 cores (12 threads) running at 4.3 GHz to 5.0 GHz. The Radeon 760M iGPU is responsible for carrying out 3D calculations and similar duties.

Architecture & Features

Hawk Point family chips are powered by the Zen 4 architecture, much like Phoenix and Dragon Range family chips are. That's not to say there is no difference between the three. With Hawk Point, AMD is betting big on generative AI; these chips are promised to deliver an up to 40% increase in generative AI performance over 7040 series APUs making apps like DaVinci Resolve and Adobe Photoshop even more powerful.

Unlike Zen 3, Zen 4 features AVX512 support and, thanks to a plethora of other improvements including larger caches/registers/buffers across the board, is slated to bring a double-digit IPC improvement over the former.

Elsewhere, the 8645HS has 16 MB of L3 cache and a super-fast DDR5-5600 / LPDDR5x-7500 RAM controller. USB 4 (and thus Thunderbolt) is supported natively and so is PCIe 4. In fact, 20 PCIe 4 lanes are on offer; data transfer speeds of up to 7.8 GB/s will be possible provided a sufficiently fast NVMe SSD is used.

Systems powered by this Ryzen 5 series chip are expected to run 64-bit Windows 11, 64-bit Windows 10, or Linux. Please note that the APU is not overclockable and neither will you be able to replace it with a faster one as it gets soldered to the motherboard permanently (FP7, FP7r2, FP8 socket interfaces).

Performance

Since the 8645HX is an 7640HS in disguise, it is safe to expect the APU to be about as fast as the Ryzen 9 5900HX, Ryzen 7 6800H, Ryzen 7 7736U and also the Core i5-12500H, as far as multi-thread performance is concerned.

Your mileage may vary depending on how high the CPU power limits are and how competent the cooling solution of your system is.

Graphics

The Radeon 760M has 8 CUs (512 shaders) running at up to 2,600 MHz. While this is not the best graphics adapter for gaming as it's only just fast enough for low quality settings and resolutions such as 1600 x 900, it will let you connect up to four SUHD 4320p monitors and it also HW-encodes and HW-decodes the most widely used video codecs such as AV1, HEVC and AVC without breaking a sweat.

Power consumption

The 8645HS has a long-term power limit (default TDP) of 35 W to 54 W, giving laptop makers a choice between improving battery life and giving the system they are working on more oomph. Either way, an active cooling solution is a must for any system powered by the chip.

This Ryzen 5 series APU is built with TSMC's 4 nm process for high, as of late 2023, energy efficiency.

AMD Ryzen 5 9600X

► remove from comparison AMD Ryzen 5 9600X

The AMD Ryzen 5 9600X is a mid-range desktop CPU of the Granite Ridge product family that sports 6 Zen 5 cores (12 threads) running at 3.9 GHz to 5.4 GHz along with PCIe 5 support and a basic RDNA 2 architecture iGPU. The Ryzen was launched in June 2024, with sales slated to start some time in August.

Architecture and Features

Like Strix Point APUs, Granite Ridge processors make use of the new Zen 5 microarchitecture. However, there are no efficient cores here; all of 9600X's cores are full Zen 5 cores with a "proper" Zen 5 implementation, not the simplified mobile version that has a lower AVX-512 performance. Furthermore, Granite Ridge is a multi-die design with only the CPU cores produced using a fairly modern 4 nm TSMC process. Strix Point processors are a single-die design, from what we know.

According to AMD, Zen 5 delivers a 16% IPC uplift over Zen 4 thanks to branch prediction improvements and other refinements.

Elsewhere, the 9600X has 32 MB of L3 cache and 24 direct PCIe 5 lanes (3.93 GB/s throughput per lane) with up to 12 additional PCIe 4 lanes available depending on the motherboard. It supports DDR5 RAM as fast as 5,600 MT/s (up to 8,000 MT/s if overclocked).

The Ryzen 5 is unlocked for overclocking. Naturally, this AM5 socket CPU fully supports Windows 11, 64-bit Windows 10 as well as many Linux distros.

Performance

In our review, the 9600X delivered multi-thread performance similar to what the Intel Core Ultra 9 185H, AMD Ryzen AI 9 365, Core i5-12600K, Ryzen 7 8700G as well as the octa-core AMD Ryzen 7 7800X3D deliver which is pretty impressive considering the price.

Graphics

The Radeon 610M comes equipped with just 128 unified shaders running at up to 2,200 MHz. Its gaming performance is extremely low but still sufficient for competitive titles (Counter-Strike 2 is perfectly playable at 1080p / Low) as well as really old titles (pre-2019).

It can HW-decode many popular video codecs including first and foremost AVC, HEVC, VP9, AV1.

Power consumption

The CPU cores are built with TSMC's N4P process which delivers a good, as of mid 2024, power efficiency. (Apple is the leader in this regard with the second-generation 3 nm process.)

The Ryzen 5's long-term TDP is either 65 W or 105 W, with each user free to make their own choice. Overclocking the chip will cause its power consumption figures to go up significantly.

ModelAMD Ryzen 7 9800X3DAMD Ryzen 5 8645HSAMD Ryzen 5 9600X
CodenameGranite RidgeHawk Point-HS (Zen 4)Granite Ridge
SeriesAMD Granite Ridge (Zen 5, AM5)AMD Hawk Point (Zen 4/4c)AMD Granite Ridge (Zen 5, AM5)
Series: Granite Ridge (Zen 5, AM5) Granite Ridge
AMD Ryzen 9 9950X3D4.3 - 5.7 GHz16 / 32 cores128 MB L3
AMD Ryzen 9 9950X4.3 - 5.7 GHz16 / 32 cores64 MB L3
AMD Ryzen 9 9900X4.4 - 5.6 GHz12 / 24 cores64 MB L3
AMD Ryzen 7 9700X3.8 - 5.5 GHz8 / 16 cores32 MB L3
AMD Ryzen 7 9800X3D « 4.7 - 5.2 GHz8 / 16 cores96 MB L3
AMD Ryzen 5 9600X3.9 - 5.4 GHz6 / 12 cores32 MB L3
AMD Ryzen 9 H 2704 - 5.2 GHz8 / 16 cores16 MB L3
AMD Ryzen 9 2704 - 5.2 GHz8 / 16 cores16 MB L3
AMD Ryzen 9 8945H4 - 5.2 GHz8 / 16 cores16 MB L3
AMD Ryzen 9 8945HS4 - 5.2 GHz8 / 16 cores16 MB L3
AMD Ryzen 9 PRO 8945HS4 - 5.2 GHz8 / 16 cores16 MB L3
AMD Ryzen 7 2603.8 - 5.1 GHz8 / 16 cores16 MB L3
AMD Ryzen 7 H 2603.8 - 5.1 GHz8 / 16 cores16 MB L3
AMD Ryzen 7 8845HS3.8 - 5.1 GHz8 / 16 cores16 MB L3
AMD Ryzen 7 8745HS3.8 - 4.9 GHz8 / 16 cores16 MB L3
AMD Ryzen 7 8840HS3.3 - 5.1 GHz8 / 16 cores16 MB L3
AMD Ryzen 7 PRO 8840HS3.3 - 5.1 GHz8 / 16 cores16 MB L3
AMD Ryzen 5 2404.3 - 5 GHz6 / 12 cores16 MB L3
AMD Ryzen 5 8645HS « 4.3 - 5 GHz6 / 12 cores16 MB L3
AMD Ryzen 5 8640HS3.5 - 4.9 GHz6 / 12 cores16 MB L3
AMD Ryzen 9 9950X3D4.3 - 5.7 GHz16 / 32 cores128 MB L3
AMD Ryzen 9 9950X4.3 - 5.7 GHz16 / 32 cores64 MB L3
AMD Ryzen 9 9900X4.4 - 5.6 GHz12 / 24 cores64 MB L3
AMD Ryzen 7 9700X3.8 - 5.5 GHz8 / 16 cores32 MB L3
AMD Ryzen 7 9800X3D4.7 - 5.2 GHz8 / 16 cores96 MB L3
AMD Ryzen 5 9600X « 3.9 - 5.4 GHz6 / 12 cores32 MB L3
Clock4700 - 5200 MHz4300 - 5000 MHz3900 - 5400 MHz
L1 Cache640 KB384 KB
L2 Cache8 MB6 MB6 MB
L3 Cache96 MB16 MB32 MB
Cores / Threads8 / 16
8 x 5.2 GHz AMD Zen 5
6 / 12
6 x 5.0 GHz AMD Zen 4
6 / 12
6 x 5.4 GHz AMD Zen 5
TDP120 Watt45 Watt65 Watt
TDP Turbo PL2162 Watt
Transistors9970 Million
Technology4 nm4 nm4 nm & 6 nm
Voltage1.28 - 1.31 (nominal), 1.4 (max) V
Die Size192.6 mm2178 mm2
max. Temp.95 °C100 °C95 °C
SocketAM5 (LGA 1718)FP7/FP7r2/FP8AM5
FeaturesDDR5-5600 RAM (incl. ECC), PCIe 5, MMX, SSE, SSE2, SSE3, SSSE3, SSE4.1, SSE4.2, SSE4A, AES, AVX, AVX2, AVX512, BMI1, BMI2, F16C, FMA3, EVP, SMAP, SMEP, SMT, SHA, XFR2DDR5-5600/LPDDR5x-7500 RAM, PCIe 4, Ryzen AI, AES, AVX, AVX2, AVX512, FMA3, MMX (+), SHA, SSE, SSE2, SSE3, SSE4.1, SSE4.2, SSE4A, SSSE3DDR5-5600 RAM, PCIe 5 + PCIe 4, SMT, AES, AVX, AVX2, AVX512, FMA3, MMX (+), SHA, SSE, SSE2, SSE3, SSSE3, SSE4.1, SSE4.2, SSE4A
iGPUAMD Radeon 610M ( - 2200 MHz)AMD Radeon 760M ( - 2600 MHz)AMD Radeon 610M ( - 2200 MHz)
Architecturex86x86x86
$479 U.S.
Announced
Manufacturerwww.amd.comwww.amd.comwww.amd.com

Benchmarks

Performance Rating - CB R15 + R20 + 7-Zip + X265 + Blender + 3DM11 CPU - R7 9800X3D
47.3 pt (79%)
Restrict / Search: Model: Max. age: years
Performance Rating - CB R15 + R20 + 7-Zip + X265 + Blender + 3DM11 CPU - R5 8645HS
38.5 pt (64%)
Restrict / Search: Model: Max. age: years
Performance Rating - CB R15 + R20 + 7-Zip + X265 + Blender + 3DM11 CPU - Ryzen 5 9600X
46.1 pt (77%)
Restrict / Search: Model: Max. age: years
Cinebench 2024 - Cinebench 2024 CPU Single Core
132 Points (74%)
99.7 Points (56%)
min: 134     avg: 134.5     median: 134.5 (76%)     max: 135 Points
Cinebench 2024 - Cinebench 2024 CPU Multi Core
1358 Points (25%)
727 Points (14%)
min: 986     avg: 999     median: 999 (19%)     max: 1012 Points
Cinebench R23 - Cinebench R23 Multi Core
23230 Points (22%)
13220 Points (12%)
min: 17176     avg: 17529     median: 17528.5 (16%)     max: 17881 Points
Cinebench R23 - Cinebench R23 Single Core
2080 Points (88%)
1714 Points (72%)
min: 2180     avg: 2184     median: 2183.5 (92%)     max: 2187 Points
Cinebench R20 - Cinebench R20 CPU (Single Core)
818 Points (89%)
668 Points (73%)
858 Points (93%)
Cinebench R20 - Cinebench R20 CPU (Multi Core)
9057 Points (22%)
5121 Points (12%)
min: 6719     avg: 6847     median: 6846.5 (17%)     max: 6974 Points
Cinebench R15 - Cinebench R15 CPU Multi 64 Bit
3647 Points (23%)
2094 Points (13%)
min: 2630     avg: 2691     median: 2691 (17%)     max: 2752 Points
Cinebench R15 - Cinebench R15 CPU Single 64 Bit
328 Points (91%)
270 Points (75%)
min: 341     avg: 342     median: 342 (95%)     max: 343 Points
Cinebench R11.5 - Cinebench R11.5 CPU Multi 64 Bit
41.7 Points (54%)
min: 30.86     avg: 31.4     median: 31.4 (41%)     max: 31.99 Points
Cinebench R11.5 - Cinebench R11.5 CPU Single 64 Bit
3.8 Points (91%)
min: 4     avg: 4     median: 4 (95%)     max: 4.21 Points
Cinebench R10 - Cinebench R10 Rend. Single (32bit)
8933 Points (54%)
min: 9324     avg: 9333     median: 9332.5 (56%)     max: 9341 Points
Cinebench R10 - Cinebench R10 Rend. Multi (32bit)
60825 Points (44%)
min: 54599     avg: 55406     median: 55406 (40%)     max: 56213 Points
Cinebench R10 - Cinebench R10 Rend. Multi (64bit)
119288 Points (76%)
min: 100227     avg: 101401     median: 101401 (65%)     max: 102575 Points
Cinebench R10 - Cinebench R10 Rend. Single (64bit)
16618 Points (20%)
min: 17470     avg: 17506     median: 17505.5 (21%)     max: 17541 Points
wPrime 2.10 - wPrime 2.0 1024m *
54.3 s (1%)
89.7 s (1%)
min: 71.513     avg: 72     median: 72 (1%)     max: 72.546 s
wPrime 2.10 - wPrime 2.0 32m *
2.3 s (0%)
3.3 s (1%)
min: 2.571     avg: 2.6     median: 2.6 (1%)     max: 2.617 s
WinRAR - WinRAR 4.0
15574 Points (25%)
6695 Points (11%)
min: 14438     avg: 14629     median: 14628.5 (23%)     max: 14819 Points
7-Zip 18.03 - 7-Zip 18.03 Multi Thread 4 runs
min: 90226     avg: 90604     median: 90354 (52%)     max: 91233 MIPS
55608 MIPS (32%)
min: 68220     avg: 68266     median: 68266 (39%)     max: 68312 MIPS
7-Zip 18.03 - 7-Zip 18.03 Single Thread 4 runs
min: 8346     avg: 8407     median: 8392 (99%)     max: 8484 MIPS
6190 MIPS (73%)
min: 7724     avg: 7760     median: 7760 (91%)     max: 7796 MIPS
X264 HD Benchmark 4.0 - x264 Pass 2
203 fps (68%)
121.8 fps (41%)
min: 154     avg: 157     median: 157 (53%)     max: 160.05 fps
X264 HD Benchmark 4.0 - x264 Pass 1
375.5 fps (87%)
281.5 fps (65%)
min: 364     avg: 368.8     median: 368.8 (85%)     max: 373.5 fps
HWBOT x265 Benchmark v2.2 - HWBOT x265 4k Preset
30.6 fps (54%)
17.2 fps (30%)
min: 23.2     avg: 23.4     median: 23.4 (41%)     max: 23.6 fps
TrueCrypt - TrueCrypt Serpent
1.7 GB/s (50%)
1 GB/s (28%)
min: 1.3     avg: 1.4     median: 1.4 (40%)     max: 1.4 GB/s
TrueCrypt - TrueCrypt Twofish
2.9 GB/s (50%)
1.5 GB/s (26%)
min: 2.2     avg: 2.3     median: 2.3 (39%)     max: 2.3 GB/s
TrueCrypt - TrueCrypt AES
17.8 GB/s (46%)
11 GB/s (29%)
min: 13.4     avg: 13.5     median: 13.5 (35%)     max: 13.6 GB/s
Blender - Blender 3.3 Classroom CPU *
204 Seconds (3%)
389 Seconds (5%)
min: 281     avg: 285     median: 285 (4%)     max: 289 Seconds
Blender - Blender 2.79 BMW27 CPU *
137 Seconds (1%)
241 Seconds (2%)
min: 184     avg: 184.5     median: 184.5 (1%)     max: 185 Seconds
R Benchmark 2.5 - R Benchmark 2.5 *
0.3 sec (7%)
0.4 sec (10%)
min: 0.3389     avg: 0.3     median: 0.3 (7%)     max: 0.3426 sec
3DMark 06 - CPU - 3DMark 06 - CPU
min: 17855     avg: 18319     median: 18341.5 (39%)     max: 18804 Points
14055 Points (30%)
min: 17706     avg: 17737     median: 17736.5 (38%)     max: 17767 Points
Super Pi mod 1.5 XS 1M - Super Pi mod 1.5 XS 1M *
8 s (2%)
8.3 s (2%)
min: 7.614     avg: 7.6     median: 7.6 (2%)     max: 7.672 s
Super Pi mod 1.5 XS 2M - Super Pi mod 1.5 XS 2M *
17.1 s (1%)
20.4 s (1%)
min: 16.336     avg: 16.4     median: 16.3 (1%)     max: 16.363 s
Super Pi Mod 1.5 XS 32M - Super Pi mod 1.5 XS 32M *
718 s (3%)
min: 359.798     avg: 360.1     median: 360.1 (2%)     max: 360.414 s
3DMark Vantage - 3DM Vant. Perf. CPU no Physx
min: 106182     avg: 108581     median: 108660 (83%)     max: 109721 Points
min: 83540     avg: 84299     median: 84299 (65%)     max: 85058 Points
3DMark 11 - 3DM11 Performance Physics
min: 34973     avg: 38174     median: 38568 (95%)     max: 40357 Points
18811 Points (46%)
min: 25717     avg: 25914     median: 25914 (64%)     max: 26111 Points
3DMark - 3DMark Ice Storm Physics
min: 104270     avg: 105635     median: 105729 (86%)     max: 107334 Points
min: 113587     avg: 113789     median: 113788 (92%)     max: 113990 Points
3DMark - 3DMark Ice Storm Extreme Physics
min: 104072     avg: 105578     median: 105670 (86%)     max: 107578 Points
min: 113517     avg: 113785     median: 113785 (92%)     max: 114053 Points
3DMark - 3DMark Ice Storm Unlimited Physics
min: 106846     avg: 109007     median: 108655 (87%)     max: 112948 Points
min: 116109     avg: 117823     median: 117822 (95%)     max: 119536 Points
3DMark - 3DMark Cloud Gate Physics
min: 28550     avg: 29255     median: 29271.5 (74%)     max: 29952 Points
min: 21053     avg: 21073     median: 21073 (53%)     max: 21093 Points
3DMark - 3DMark Fire Strike Standard Physics
min: 38742     avg: 39187     median: 39248 (70%)     max: 39893 Points
21505 Points (38%)
min: 33449     avg: 33456     median: 33455.5 (60%)     max: 33462 Points
3DMark - 3DMark Time Spy CPU
min: 14848     avg: 15759     median: 15803 (67%)     max: 16218 Points
8081 Points (34%)
min: 10821     avg: 10941     median: 10941 (46%)     max: 11061 Points
Geekbench 6.4 - Geekbench 6.4 Single-Core
min: 3213     avg: 3278     median: 3285 (82%)     max: 3337 Points
2570 Points (64%)
3320 Points (83%)
Geekbench 6.4 - Geekbench 6.4 Multi-Core
min: 17704     avg: 18164     median: 18202 (71%)     max: 18579 Points
10882 Points (42%)
15378 Points (60%)
Geekbench 6.0 - Geekbench 6.0 Single-Core
3105 Points (99%)
3105 Points (99%)
Geekbench 6.0 - Geekbench 6.0 Multi-Core
21003 Points (86%)
21003 Points (86%)
Geekbench 5.5 - Geekbench 5.1 - 5.5 64 Bit Single-Core
min: 2382     avg: 2425     median: 2428.5 (95%)     max: 2450 Points
1915 Points (75%)
min: 2490     avg: 2507     median: 2506.5 (98%)     max: 2523 Points
Geekbench 5.5 - Geekbench 5.1 - 5.5 64 Bit Multi-Core
min: 15973     avg: 16469     median: 16531 (30%)     max: 16726 Points
9420 Points (17%)
min: 12751     avg: 12840     median: 12839.5 (23%)     max: 12928 Points
Geekbench 5.0 - Geekbench 5.0 64 Bit Single-Core
min: 2176     avg: 2275     median: 2282 (10%)     max: 2316 Points
min: 2305     avg: 2351     median: 2351 (10%)     max: 2397 Points
Geekbench 5.0 - Geekbench 5.0 64 Bit Multi-Core
min: 15903     avg: 16448     median: 16524.5 (52%)     max: 16773 Points
min: 12556     avg: 12779     median: 12779 (40%)     max: 13002 Points
Geekbench 4.4 - Geekbench 4.1 - 4.4 64 Bit Single-Core
min: 9107     avg: 9442     median: 9444 (94%)     max: 9739 Points
min: 9634     avg: 9696     median: 9695.5 (97%)     max: 9757 Points
Geekbench 4.4 - Geekbench 4.1 - 4.4 64 Bit Multi-Core
min: 64532     avg: 68545     median: 68717 (68%)     max: 70460 Points
min: 51644     avg: 52536     median: 52536 (52%)     max: 53428 Points
Mozilla Kraken 1.1 - Kraken 1.1 Total Score *
401 ms (0%)
547 ms (1%)
min: 389     avg: 390     median: 390 (0%)     max: 391 ms
Octane V2 - Octane V2 Total Score
93292 Points (68%)
WebXPRT 4 - WebXPRT 4 Score
337 Points (93%)
248 Points (68%)
min: 338     avg: 338.5     median: 338.5 (93%)     max: 339 Points
WebXPRT 3 - WebXPRT 3 Score
353 Points (63%)
295 Points (53%)
min: 364     avg: 380     median: 380 (68%)     max: 396 Points
CrossMark - CrossMark Overall
min: 2210     avg: 2279     median: 2278.5 (85%)     max: 2347 Points
1765 Points (66%)
min: 2103     avg: 2109     median: 2108.5 (79%)     max: 2114 Points
Power Consumption - Prime95 Power Consumption - external Monitor *
272 Watt (47%)
114.2 Watt (20%)
min: 213     avg: 239     median: 239 (41%)     max: 265 Watt
Power Consumption - Cinebench R15 Multi Power Consumption - external Monitor *
238 Watt (43%)
min: 210     avg: 239.3     median: 243 (44%)     max: 265 Watt
Power Consumption - Idle Power Consumption - external Monitor *
min: 87.4     avg: 105.4     median: 104.1 (69%)     max: 137.9 Watt
19.5 Watt (13%)
min: 117.7     avg: 119.8     median: 119.8 (79%)     max: 121.8 Watt
Power Consumption - Idle Power Consumption 150cd 1min *
11 Watt (12%)
Power Consumption - Power Efficiency - Cinebench R15 Multi external Monitor
15.3 Points per Watt (11%)
min: 10.4     avg: 11.5     median: 11.5 (9%)     max: 12.5 Points per Watt

Average Benchmarks AMD Ryzen 7 9800X3D → 100% n=36

Average Benchmarks AMD Ryzen 5 8645HS → 67% n=36

Average Benchmarks AMD Ryzen 5 9600X → 88% n=36

- Range of benchmark values for this graphics card
red legend - Average benchmark values for this graphics card
* Smaller numbers mean a higher performance
1 This benchmark is not used for the average calculation

v1.33
log 23. 17:33:26

#0 ran 0s before starting gpusingle class +0s ... 0s

#1 checking url part for id 18494 +0s ... 0s

#2 checking url part for id 16403 +0s ... 0s

#3 checking url part for id 17988 +0s ... 0s

#4 redirected to Ajax server, took 1755963206s time from redirect:0 +0s ... 0s

#5 did not recreate cache, as it is less than 5 days old! Created at Fri, 22 Aug 2025 05:18:47 +0200 +0s ... 0s

#6 composed specs +0.009s ... 0.009s

#7 did output specs +0s ... 0.009s

#8 getting avg benchmarks for device 18494 +0.004s ... 0.013s

#9 got single benchmarks 18494 +0.042s ... 0.055s

#10 getting avg benchmarks for device 16403 +0.003s ... 0.059s

#11 got single benchmarks 16403 +0.001s ... 0.059s

#12 getting avg benchmarks for device 17988 +0.003s ... 0.063s

#13 got single benchmarks 17988 +0.006s ... 0.068s

#14 got avg benchmarks for devices +0s ... 0.068s

#15 min, max, avg, median took s +0.076s ... 0.145s

#16 return log +0s ... 0.145s

Please share our article, every link counts!
Mail Logo
> Expert Reviews and News on Laptops, Smartphones and Tech Innovations > Benchmarks / Tech > Processor Comparison - Head 2 Head
Redaktion, 2017-09- 8 (Update: 2023-07- 1)