Notebookcheck Logo
Teaser

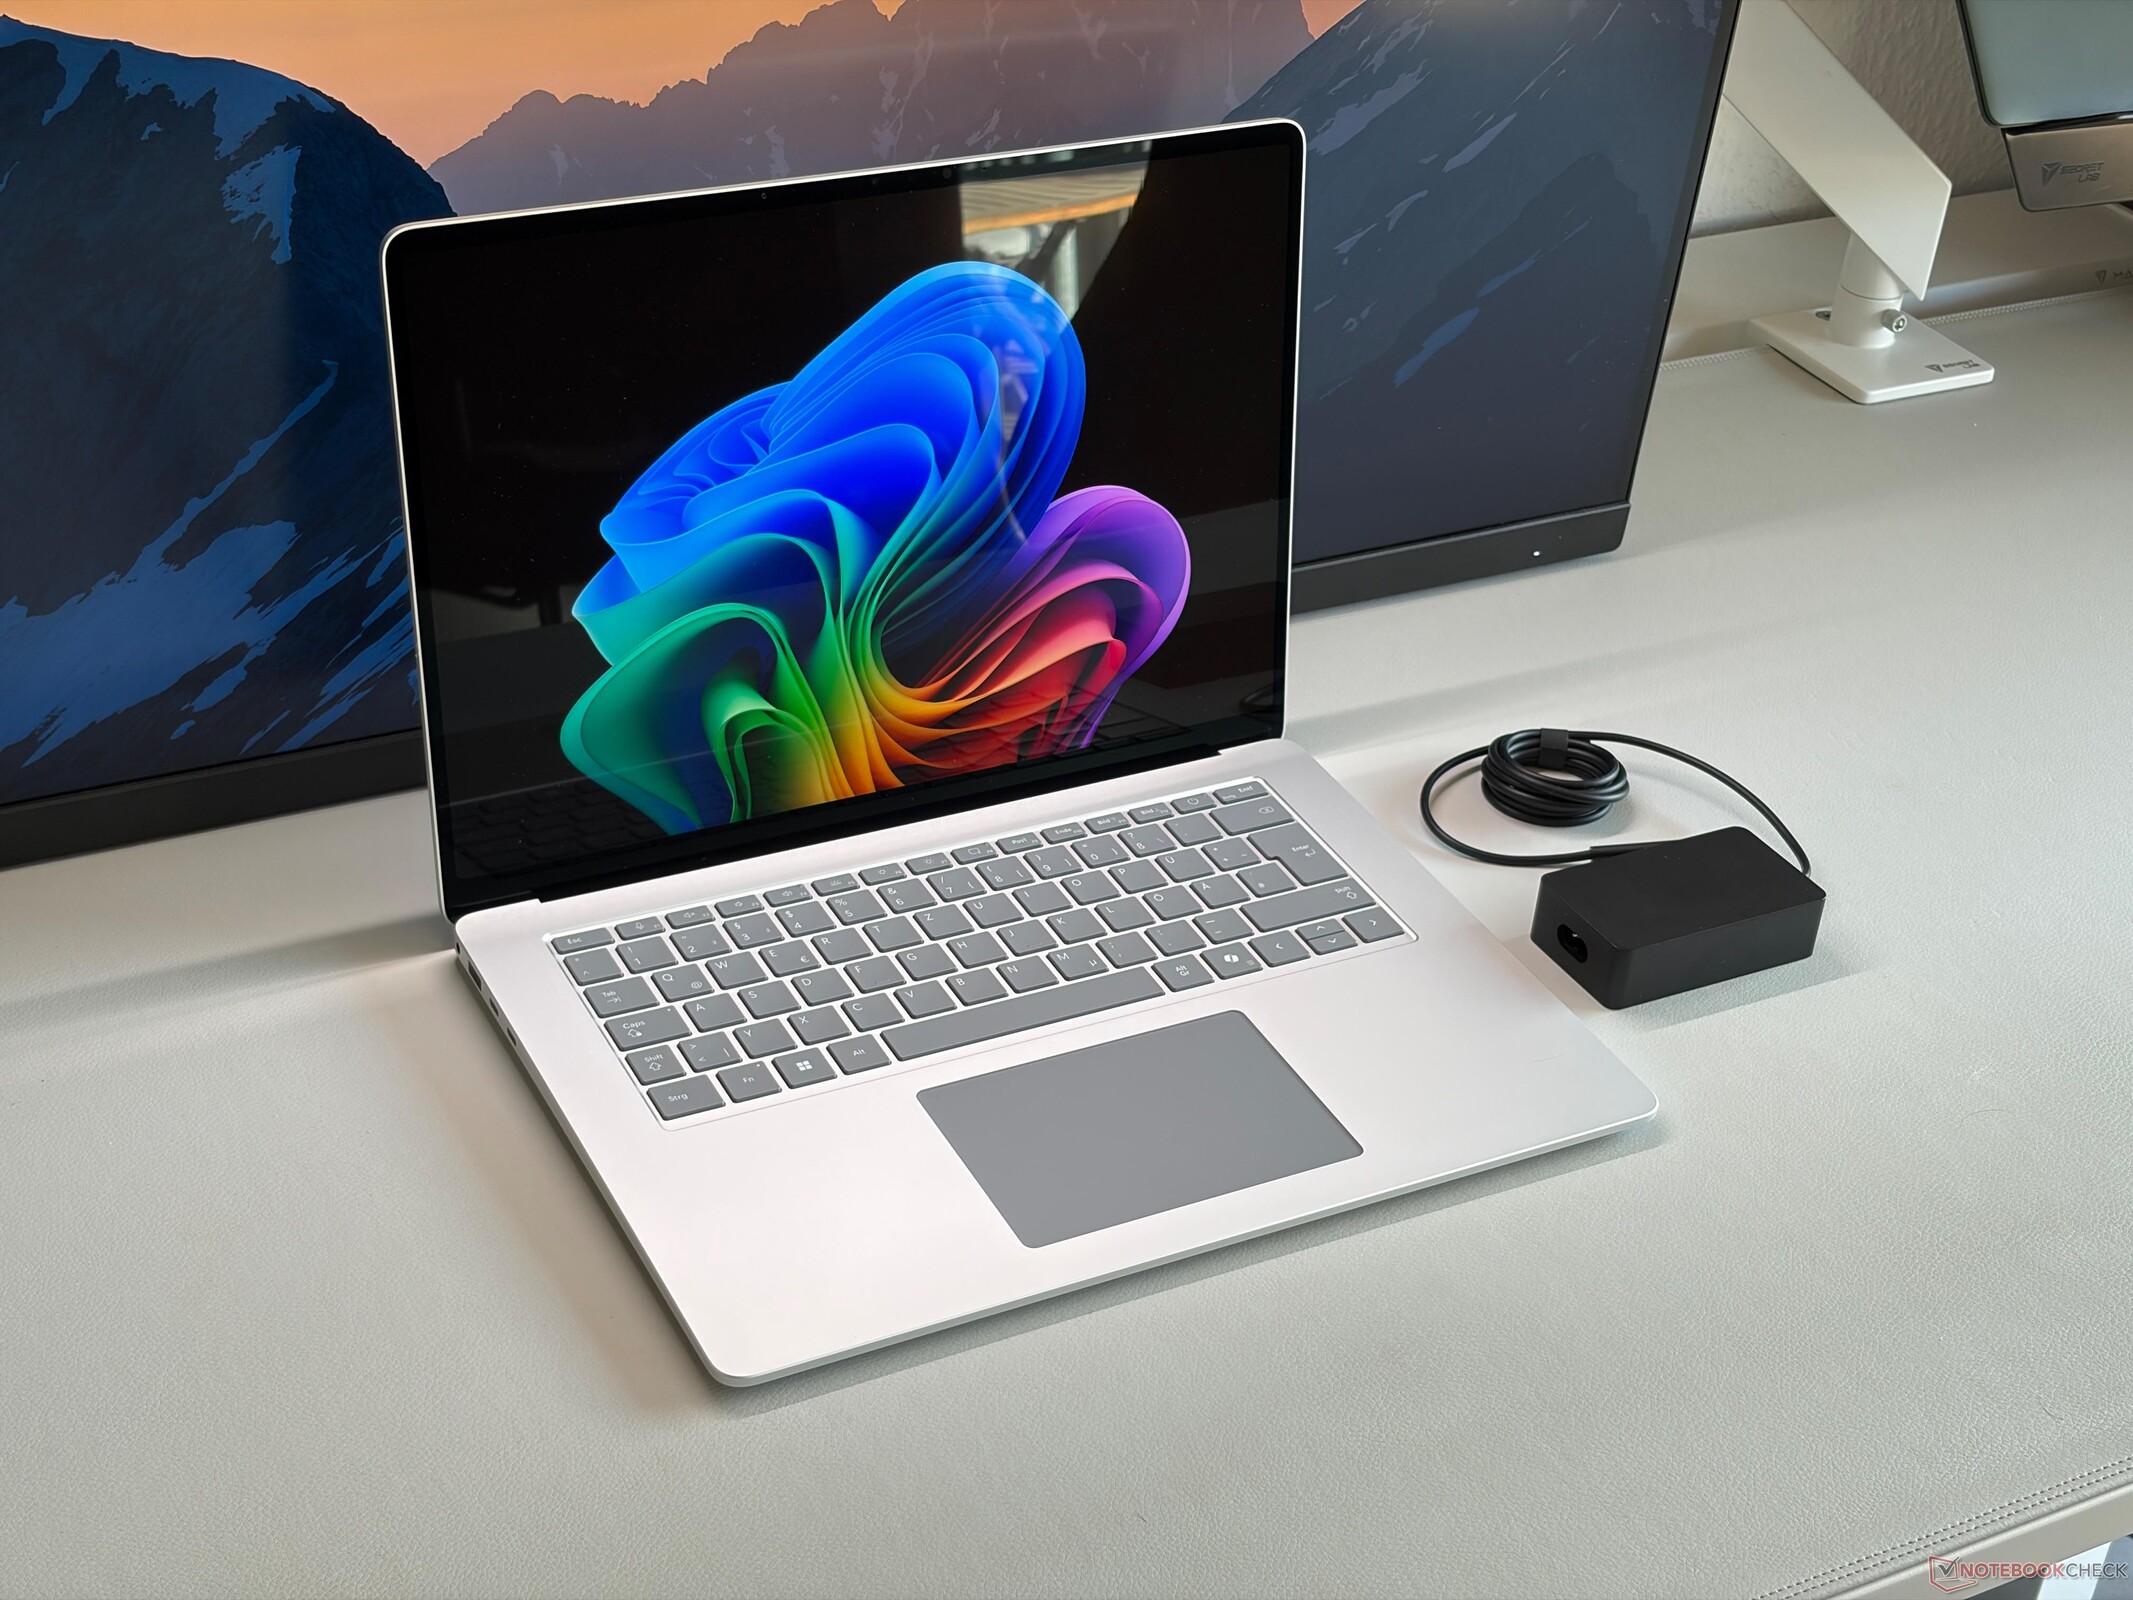
Microsoft's best laptop uses an Intel CPU - Surface Laptop 15 Gen 8 Review

Core Ultra X vs. Snapdragon X2.

Microsoft's current Surface Laptop 15 for Business is available with Intel's powerful Core Ultra X CPUs, which also includes the fast Arc B390 iGPU. The result is the best laptop you can currently get from Windows, and it is also superior to the Snapdragon models for private customers.
Andreas Osthoff 👁 Published
Arc Business Laptop MS Surface Microsoft Panther Lake Thunderbolt Touchscreen Wi-Fi 7 Windows

Verdict - Surface Laptop 15 is better with Intel

The Surface Laptop 15 Gen 8 is a good multimedia laptop and the Intel version offers more GPU performance, better compatibility with apps and games as well as Thunderbolt 4 connectivity. The raw CPU performance is probably better on the Snapdragon SKU, but the overall package of the Intel version with the superior iGPU is definitely better for the majority of users. Microsoft's approach with Snapdragon models for private users is wrong in our opinion and we think users should be able to choose with competitive prices, which is usually not the case with the business models (even though they can be purchased by private users as well).

We like the premium build quality, the comfortable keyboard, good speakers and the webcam quality. It is also one of the few premium devices with an IPS touchscreen. It offers good image quality with accurate colors, 120 Hz and there is no PWM flickering, which is great when you are sensitive to the flickering on OLED screens. The battery runtime of the Intel SKU is also very good (Microsoft actually advertises slightly shorter battery runtimes for the Snapdragon model).

This does not mean the Surface Laptop 15 is the perfect device, because there are definitely issues. The cooling performance with the single fan is not great and the sustained performance suffers a bit. It was fine for the old Lunar Lake processor, but it cannot utilize the full potential of the fast Panther Lake chip. The 65W power adapter is also insufficient under load, at least for a few minutes before the performance is reduced. We would also like regular M.2-2280 SSDs since there is plenty of free space inside the chassis. The Surface Connect port is quite large and we would prefer another USB-C port and maybe a regular SD-card reader instead of microSD. The prices for RAM and storage upgrades are also astronomical.

All in all, the Surface Laptop 15 Gen 8 is a good multimedia laptop and the Intel version is the better choice for most users, but rivals like the Lenovo ThinkPad X9-15p offer better overall packages. We hope Microsoft will update the device next year and fix some of the mentioned issues and not only focus on the upcoming Surface Laptop Ultra with RTX Spark.

Pros

+ high-quality and stable case
+ good system performance
+ good battery runtimes
+ fast microSD-Express card reader
+ comfortable input devices
+ excellent color profiles ex works
+ very quiet during everyday use
+ good maintenance options/access

Cons

- RAM can't be upgraded
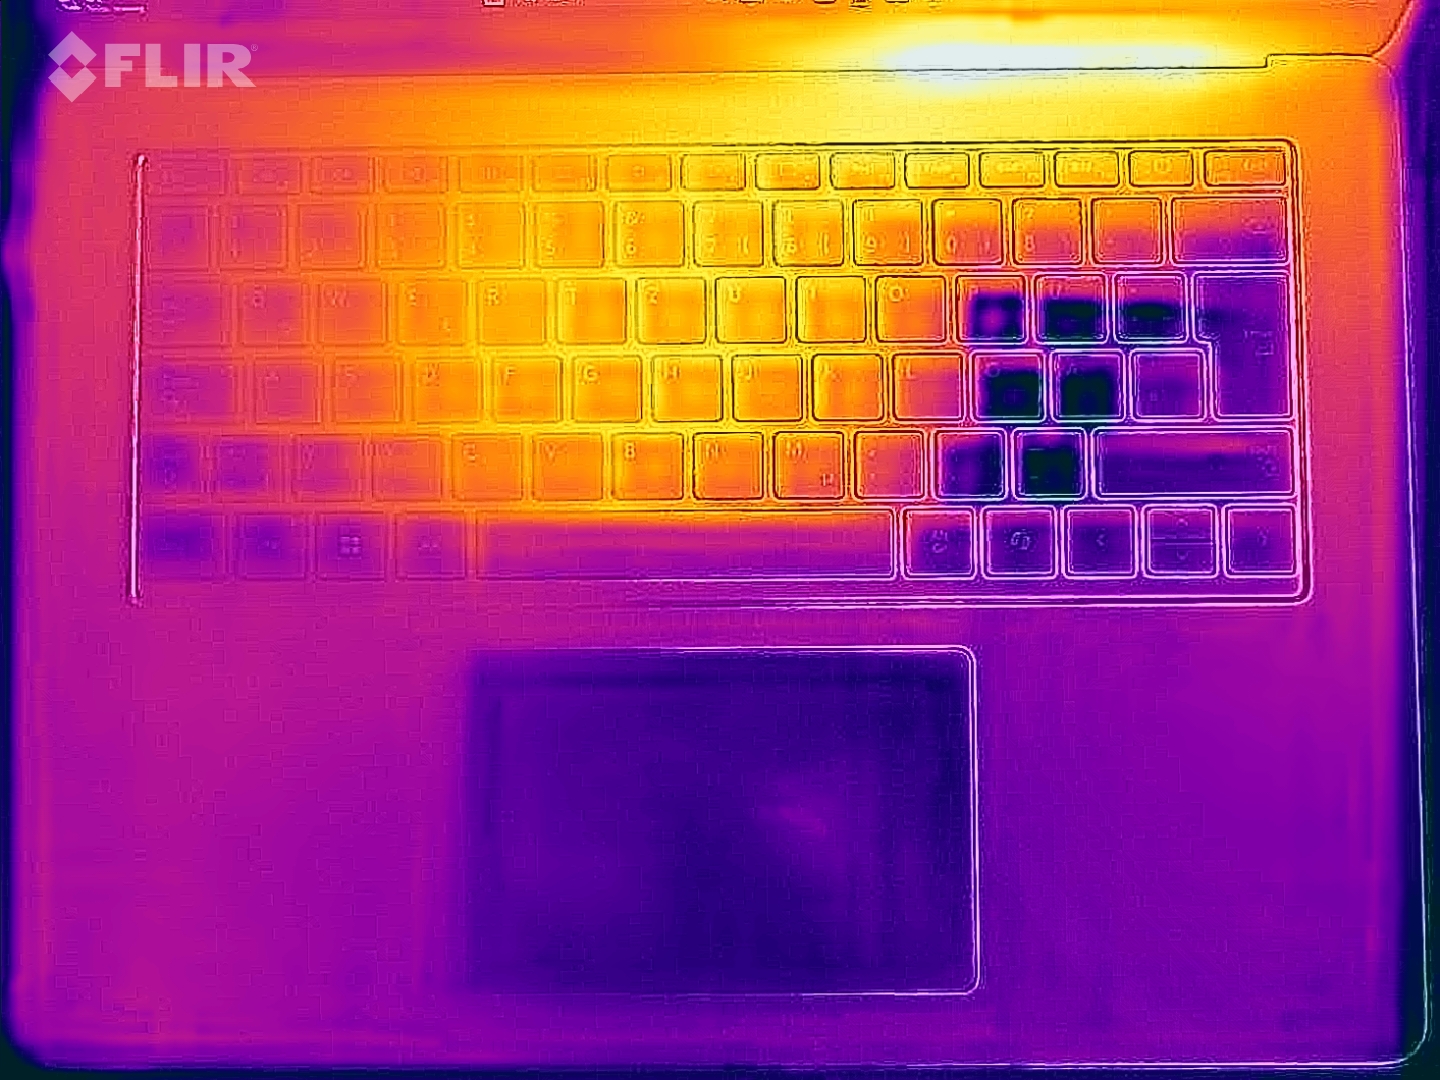
- keyboard gets noticeably warm under load
- coil whine
- insufficient PSU
- expensive upgrades
- no WWAN module
- only 1-year warranty

Price and Availability

You can order the Surface Laptop 8 15 for Business with the Core Ultra X CPU directly from Microsoft starting from $2749.99.

Amazon Logo
  • $238.94
    Microsoft Surface Laptop 3 15" Touch-Screen - CORE I5 1035G7 - 8GB Memory - 128GB Solid State Drive Platinum (Renewed)
  • $483.98
    Microsoft Surface Laptop 5 13.5" Touchscreen Notebook - 2256 x 1504 - Intel Core i7 12th Gen i7-1265U - Intel Evo Platform - 16 GB Total RAM - 512 GB SSD (Platinum) (Renewed)
  • $685.00
    Microsoft Surface Laptop 4 15” Touch-Screen – Intel Core i7 - 32GB - 1TB Solid State Drive - Matte Black

Specifications

Microsoft Surface Laptop 15 Gen 8 (Surface Laptop Series)
Processor
Intel Core Ultra X7 368H 16c/16t, 4 x 4.9 GHz Intel Cougar Cove P-Core, 8 x 4.0 GHz Intel Darkmont E-Core, 4 x 3.6 GHz Intel Darkmont E-Core, 65 W PL2 / Short Burst, 35 W PL1 / Sustained, Panther Lake
Graphics adapter
Intel Arc B390 12 Xe3 Panther Lake iGPU, Core: 2500 MHz, RAM: 800 MHz, 32.0.101.8738
Memory
16 GB 
, LPDDR5x-8533, Dual-Channel, onboard
Display
15.00 inch 3:2, 3270 x 2180 pixel 262 PPI, capacitive, LP150UD2-SPA1, IPS, glossy: yes, 120 Hz
Mainboard
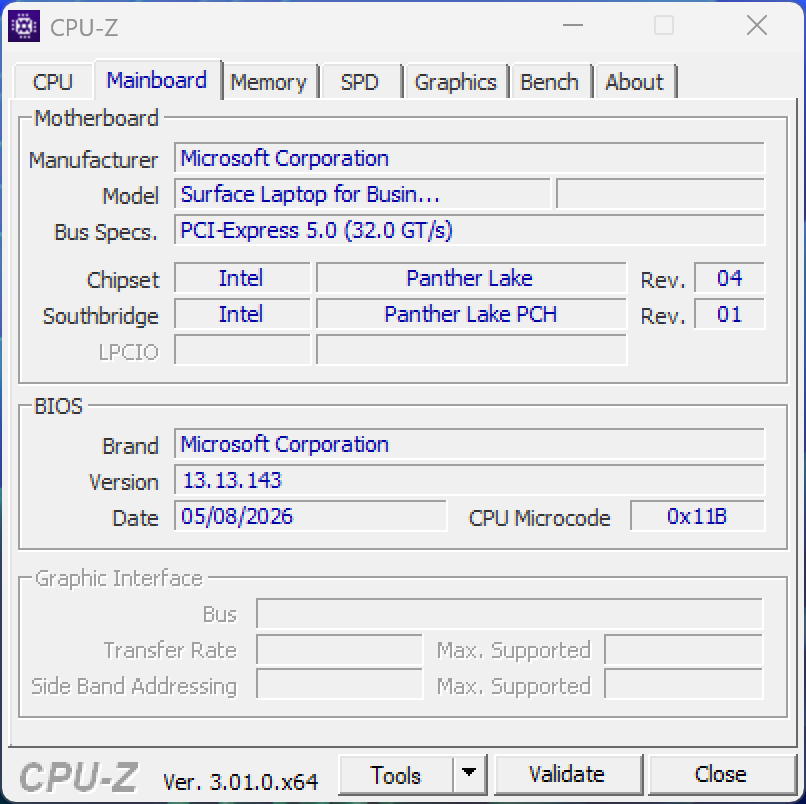
Intel Panther Lake-H PCH
Storage
SK hynix PVC10 HFS256GEM4X182N, 256 GB 
, 188 GB free
Soundcard
Intel Panther Lake-H PCH - High Definition Audio - AVS (Audio, Voice, Speech)
Connections
1 USB 3.0 / 3.1 Gen1, 2 Thunderbolt 4, USB-C Power Delivery (PD), 2 DisplayPort, 1 Docking Station Port, Audio Connections: 3.5 mm stereo, Card Reader: microSD Express, Brightness Sensor
Networking
Intel BE201 320MHz (a/b/g/h/n = Wi-Fi 4/ac = Wi-Fi 5/ax = Wi-Fi 6/ Wi-Fi 6E 6 GHz be = Wi-Fi 7), Bluetooth 5.4
Size
height x width x depth (in mm): 18.3 x 329 x 239 ( = 0.72 x 12.95 x 9.41 in)
Battery
66 Wh Lithium-Polymer
Operating System
Microsoft Windows 11 Home
Camera
Webcam: IR
Primary Camera: 2 MPix
Additional features
Speakers: Stereo, Keyboard: Chiclet, 65W PSU, 12 Months Warranty
Weight
1.651 kg ( = 58.24 oz / 3.64 pounds), Power Supply: 255 g ( = 8.99 oz / 0.56 pounds)
Price
2400 Euro
Note: The manufacturer may use components from different suppliers including display panels, drives or memory sticks with similar specifications.


Case, Connectivity and Input Devices

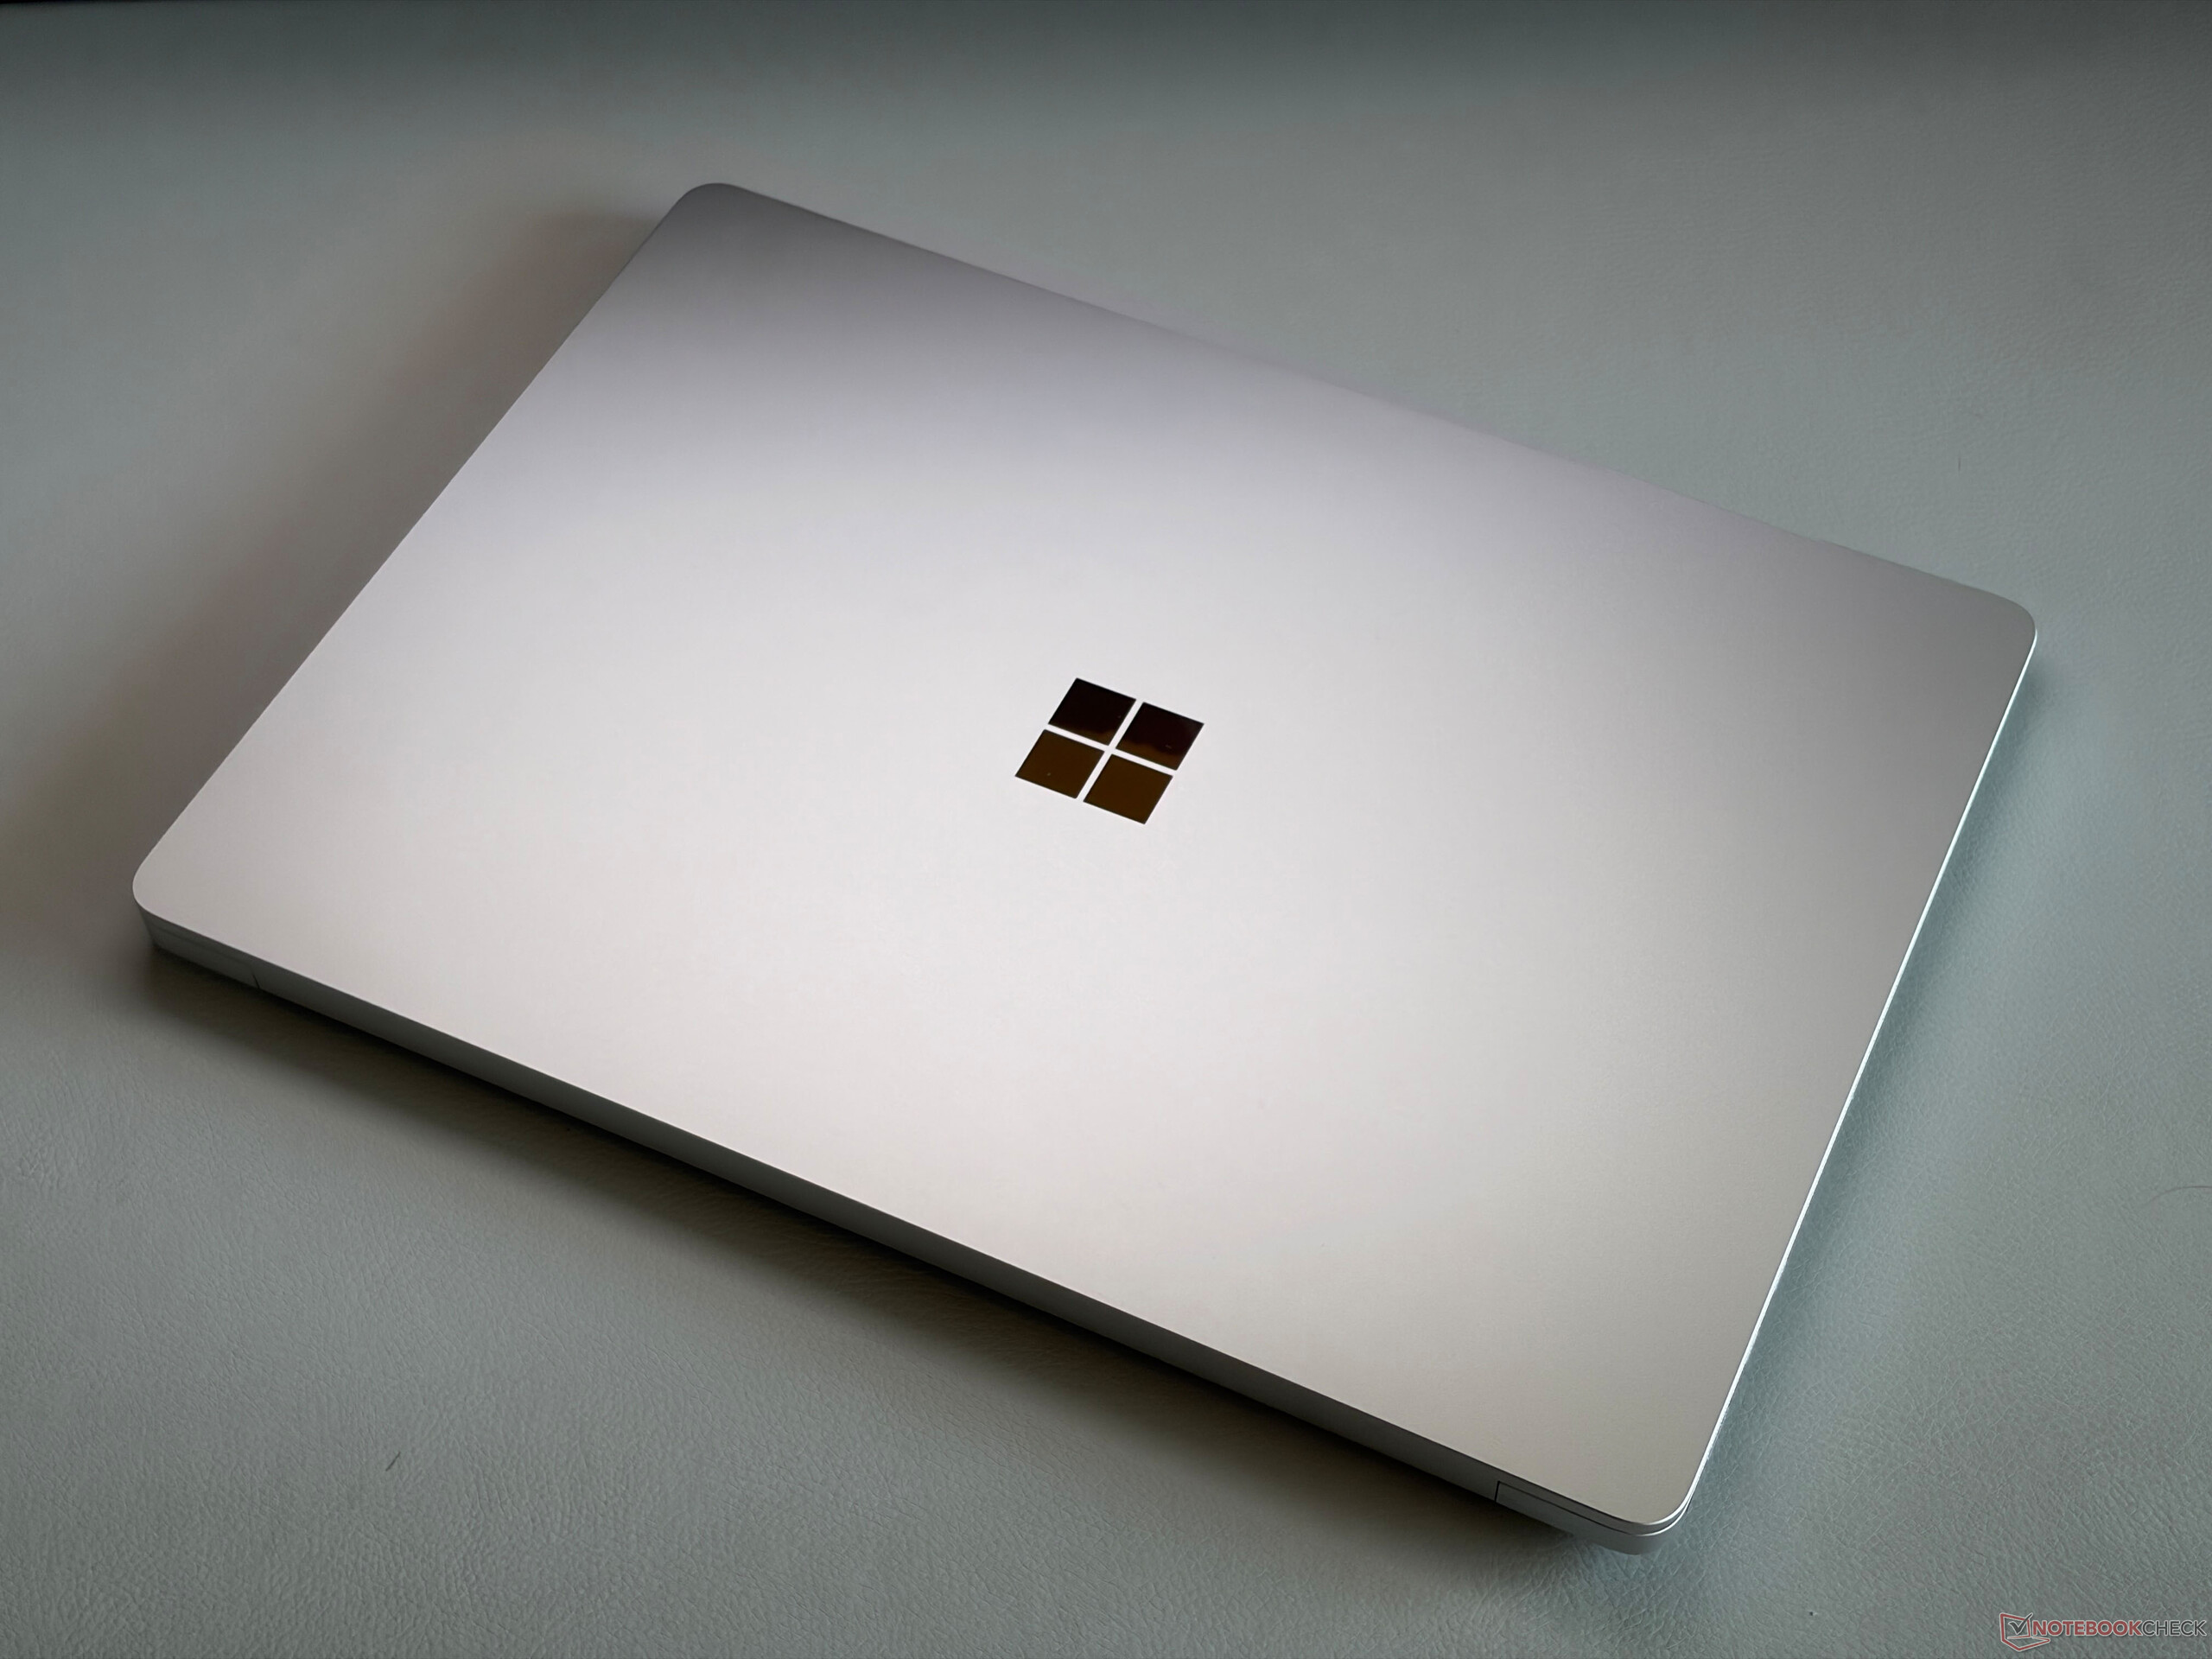
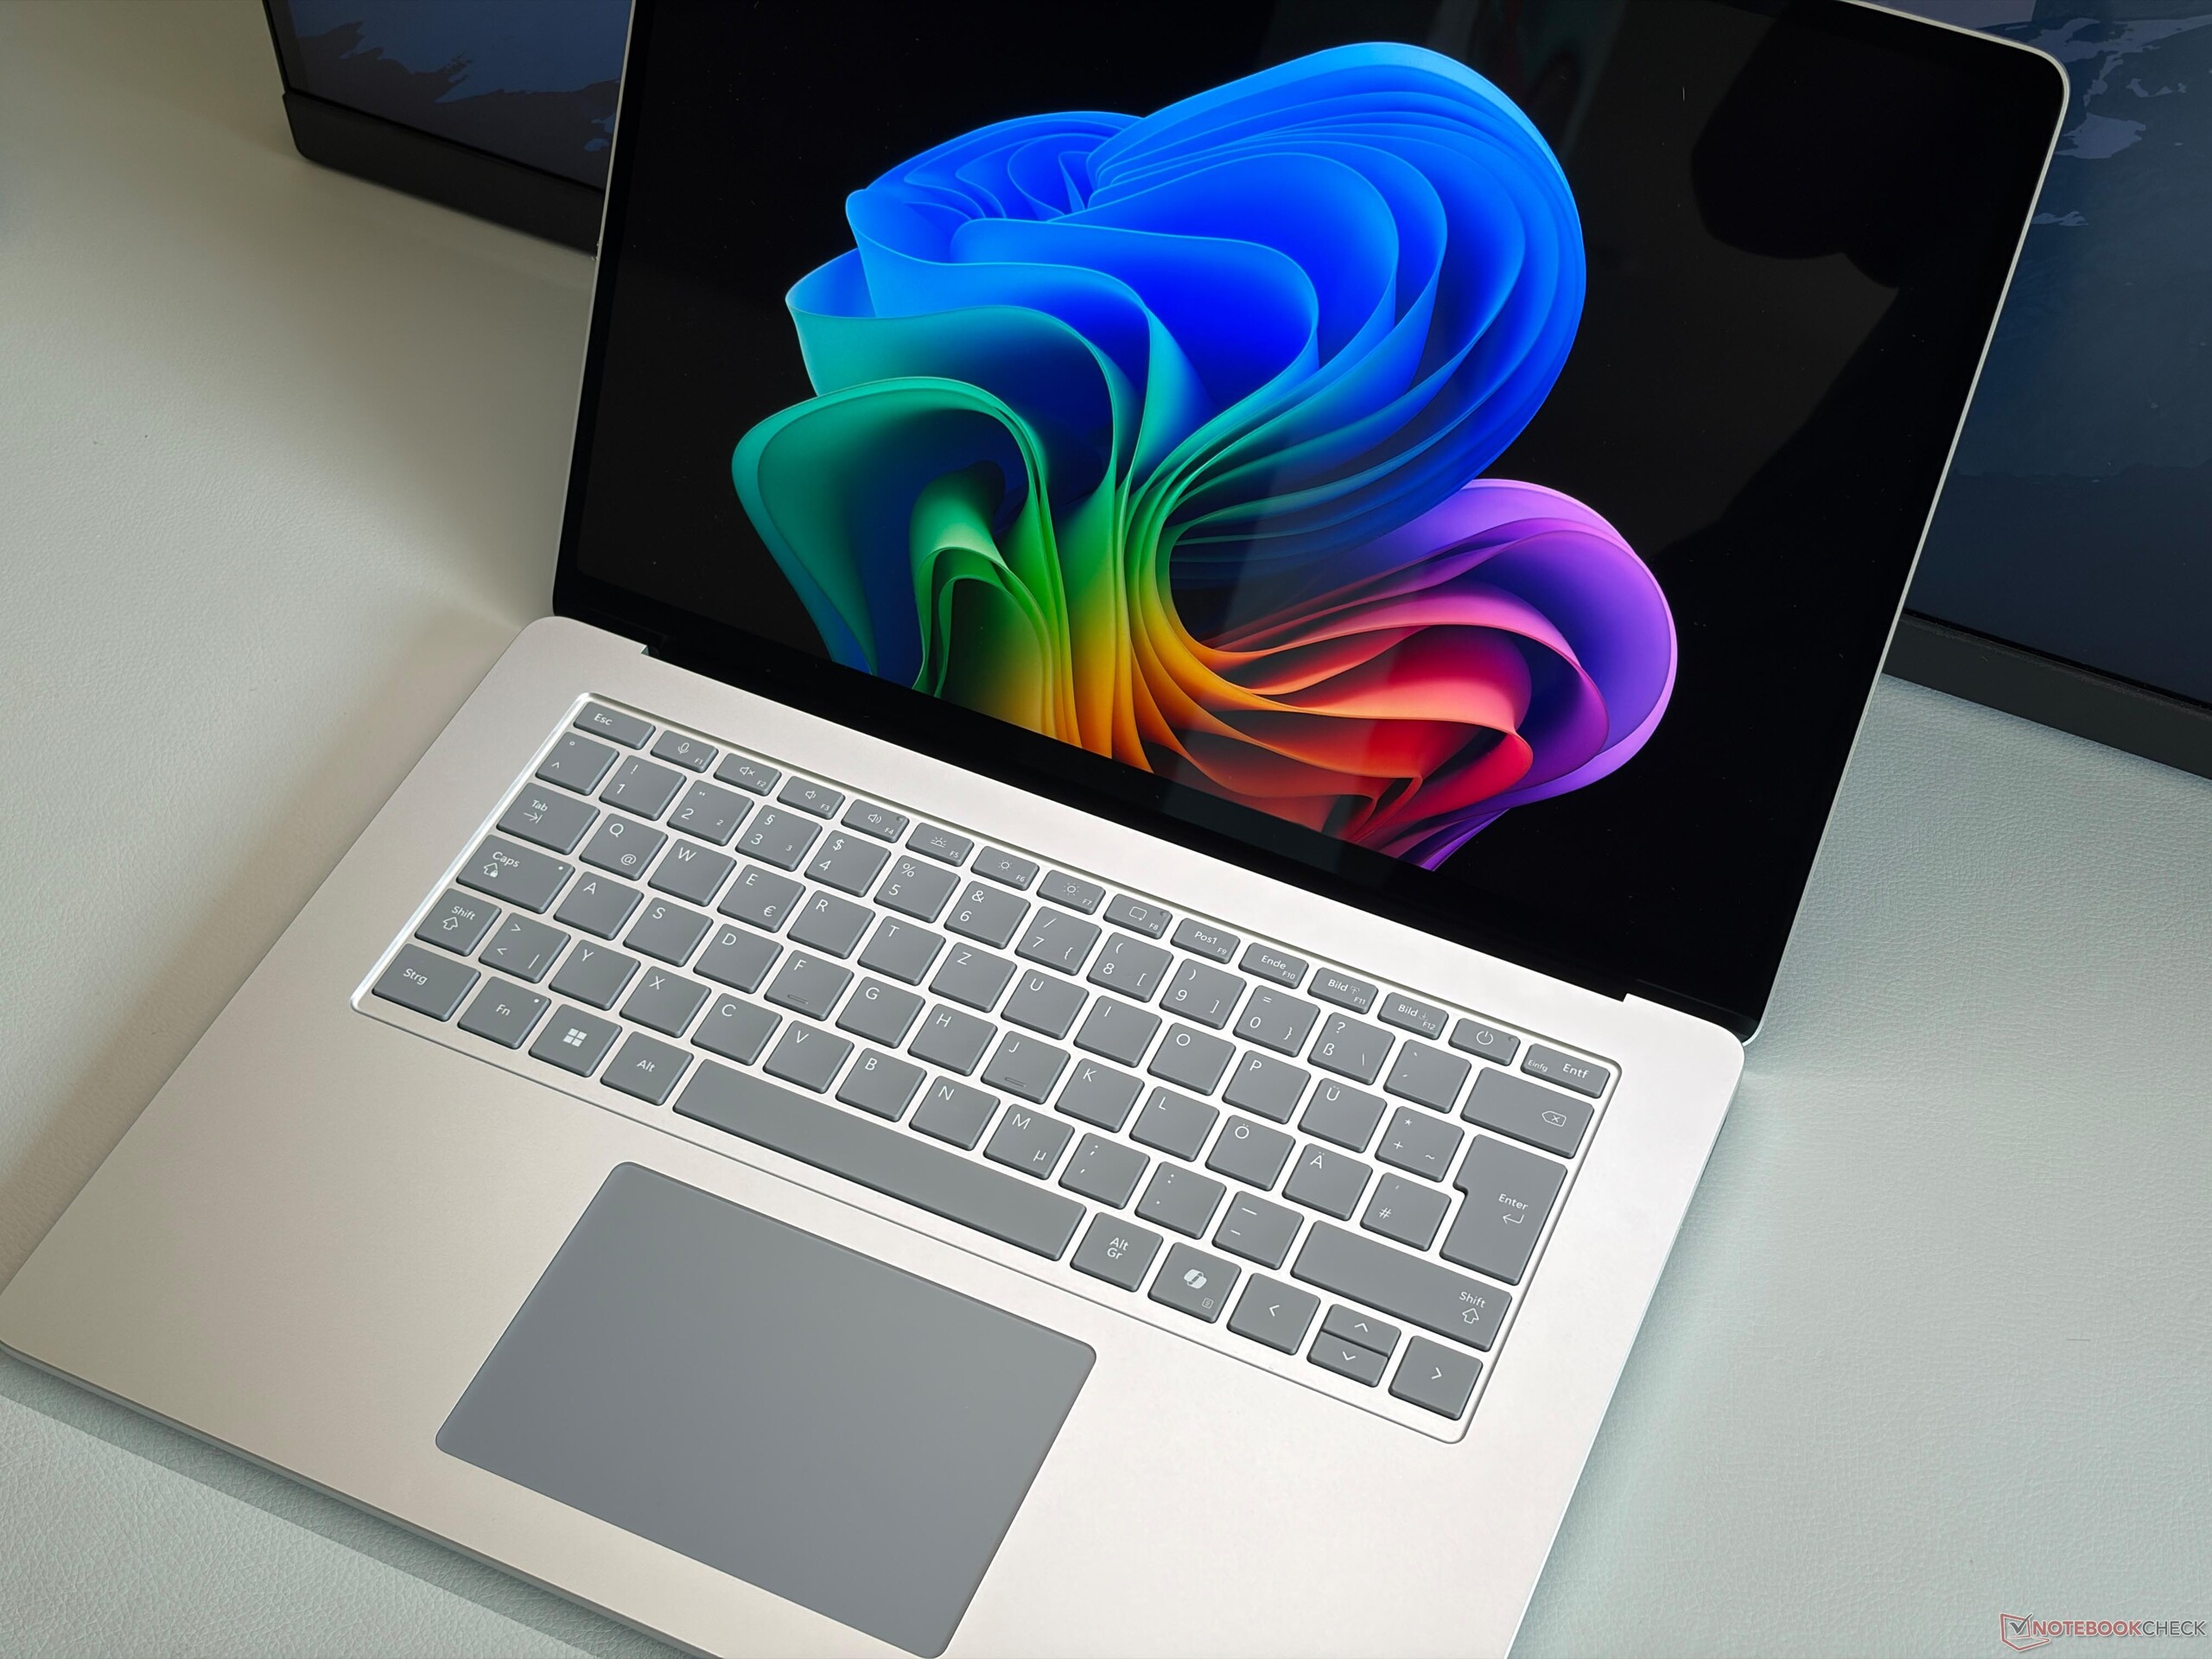
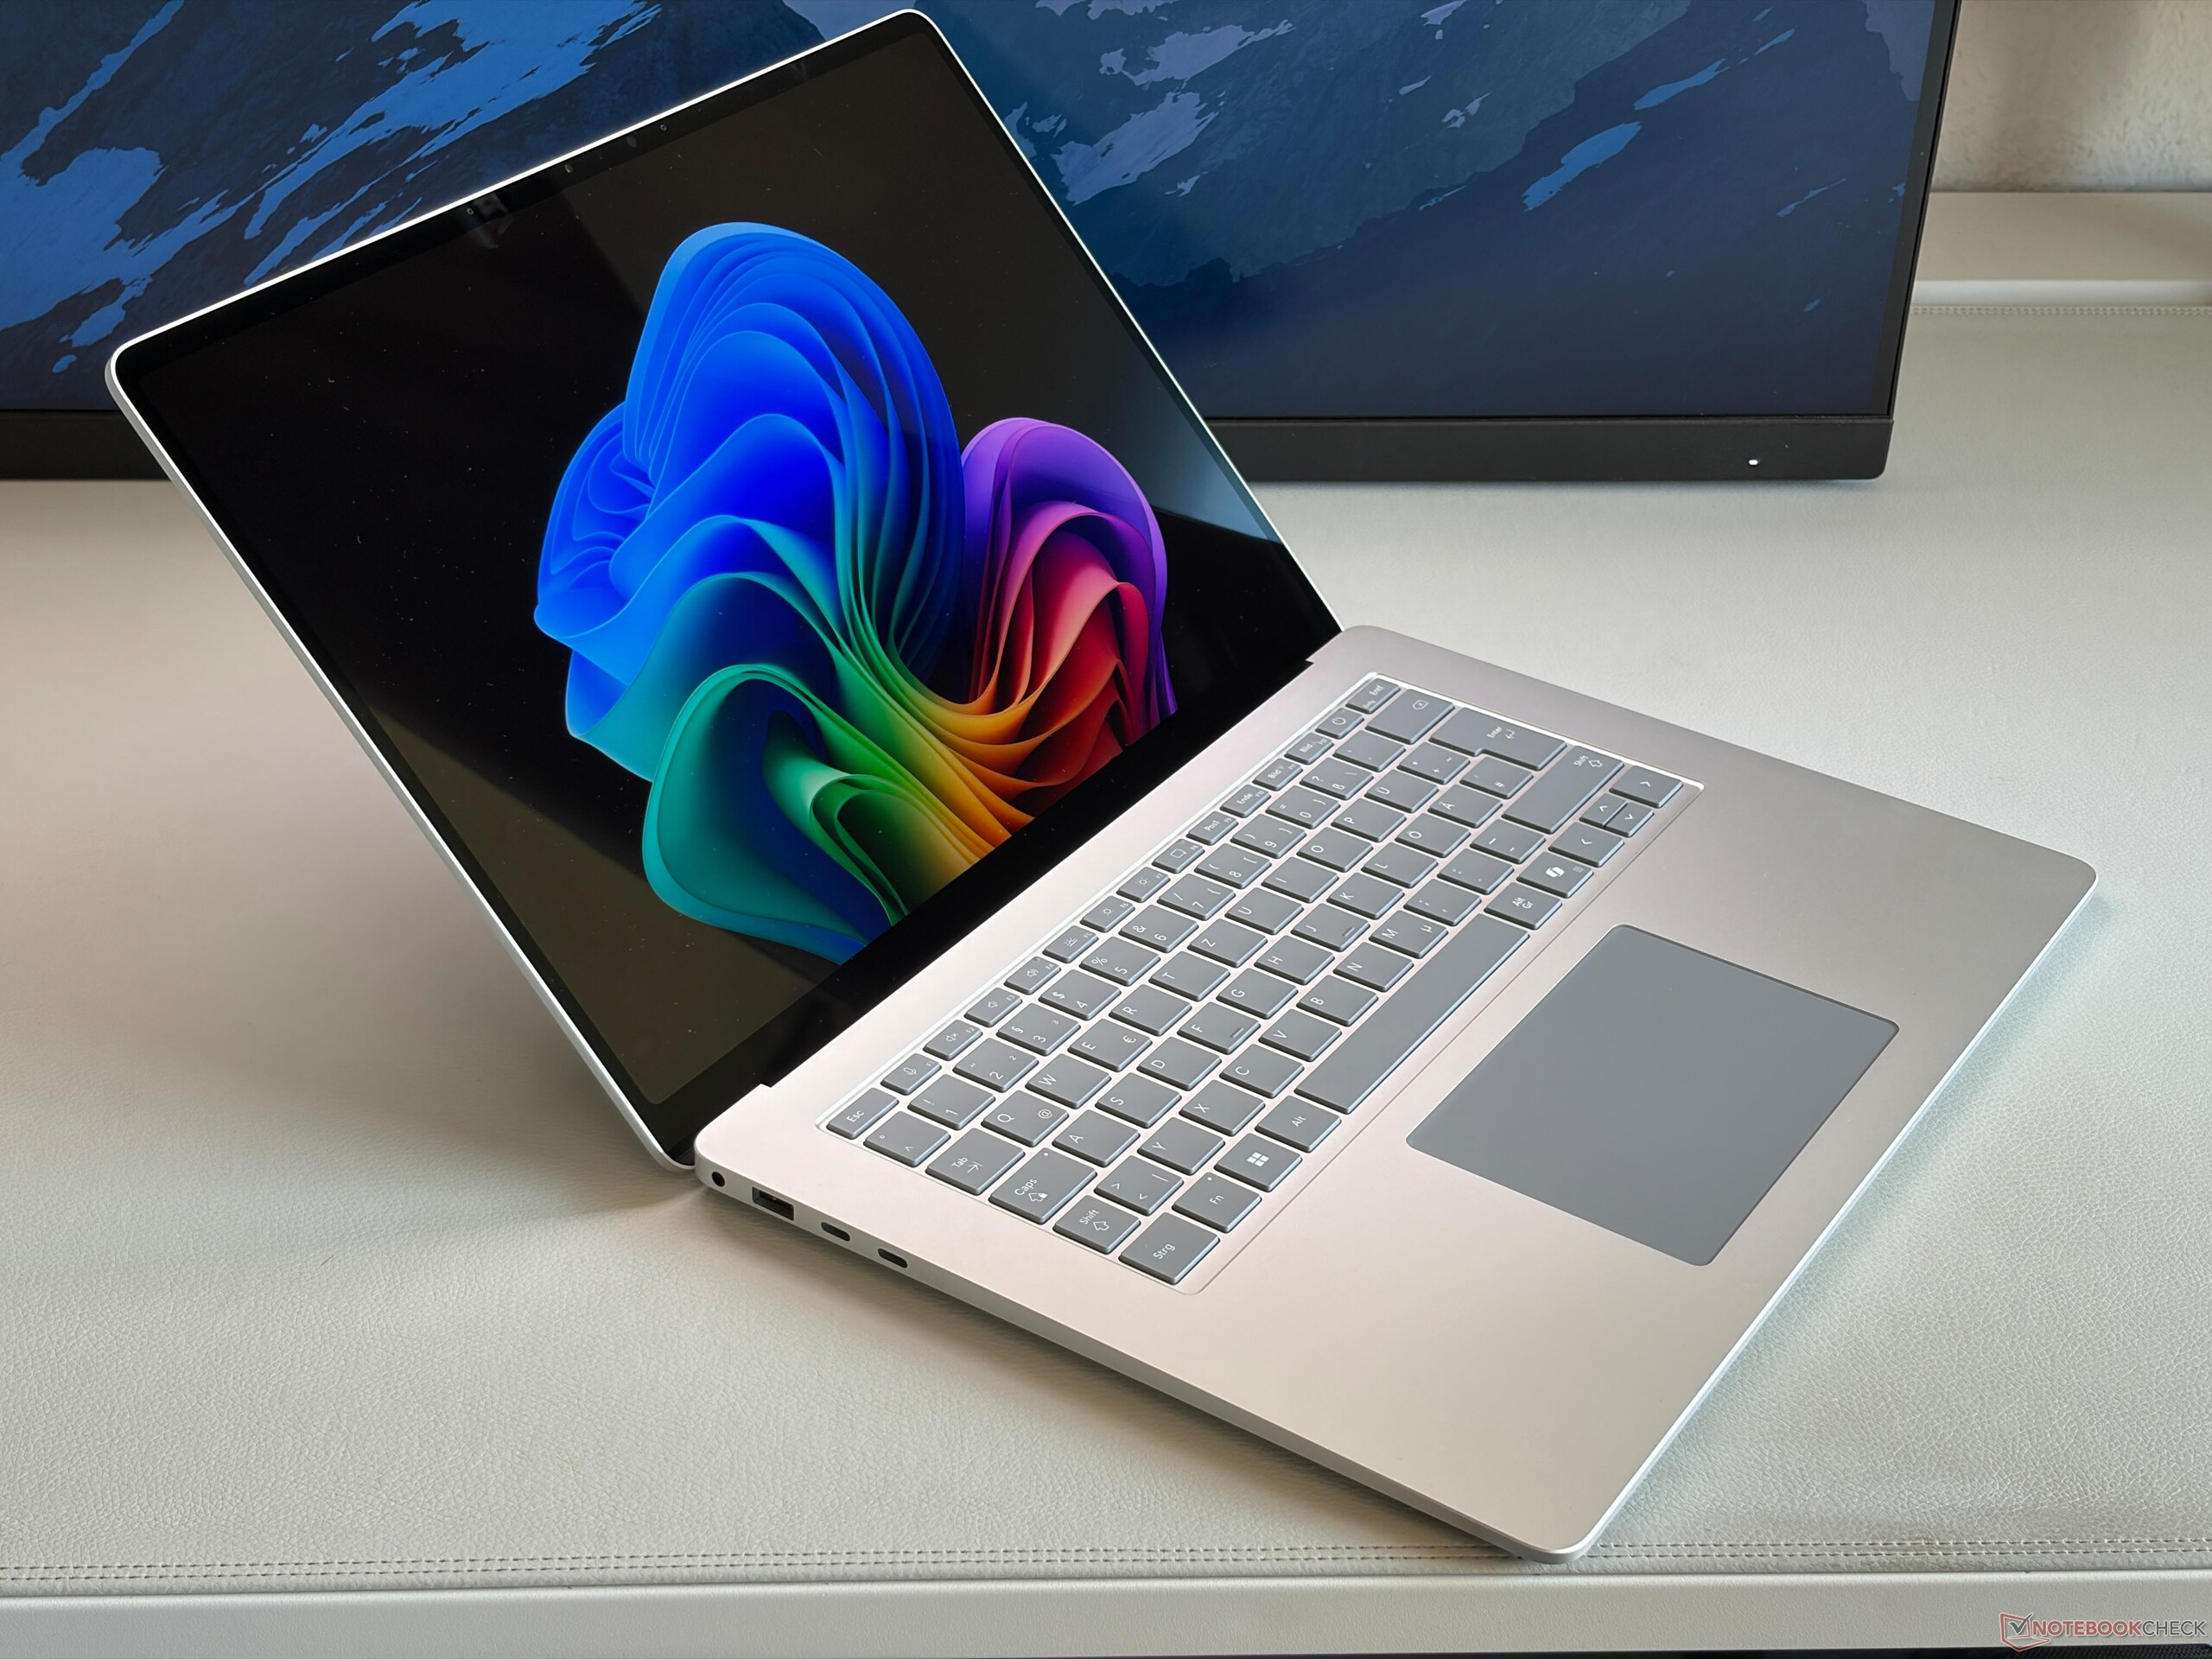
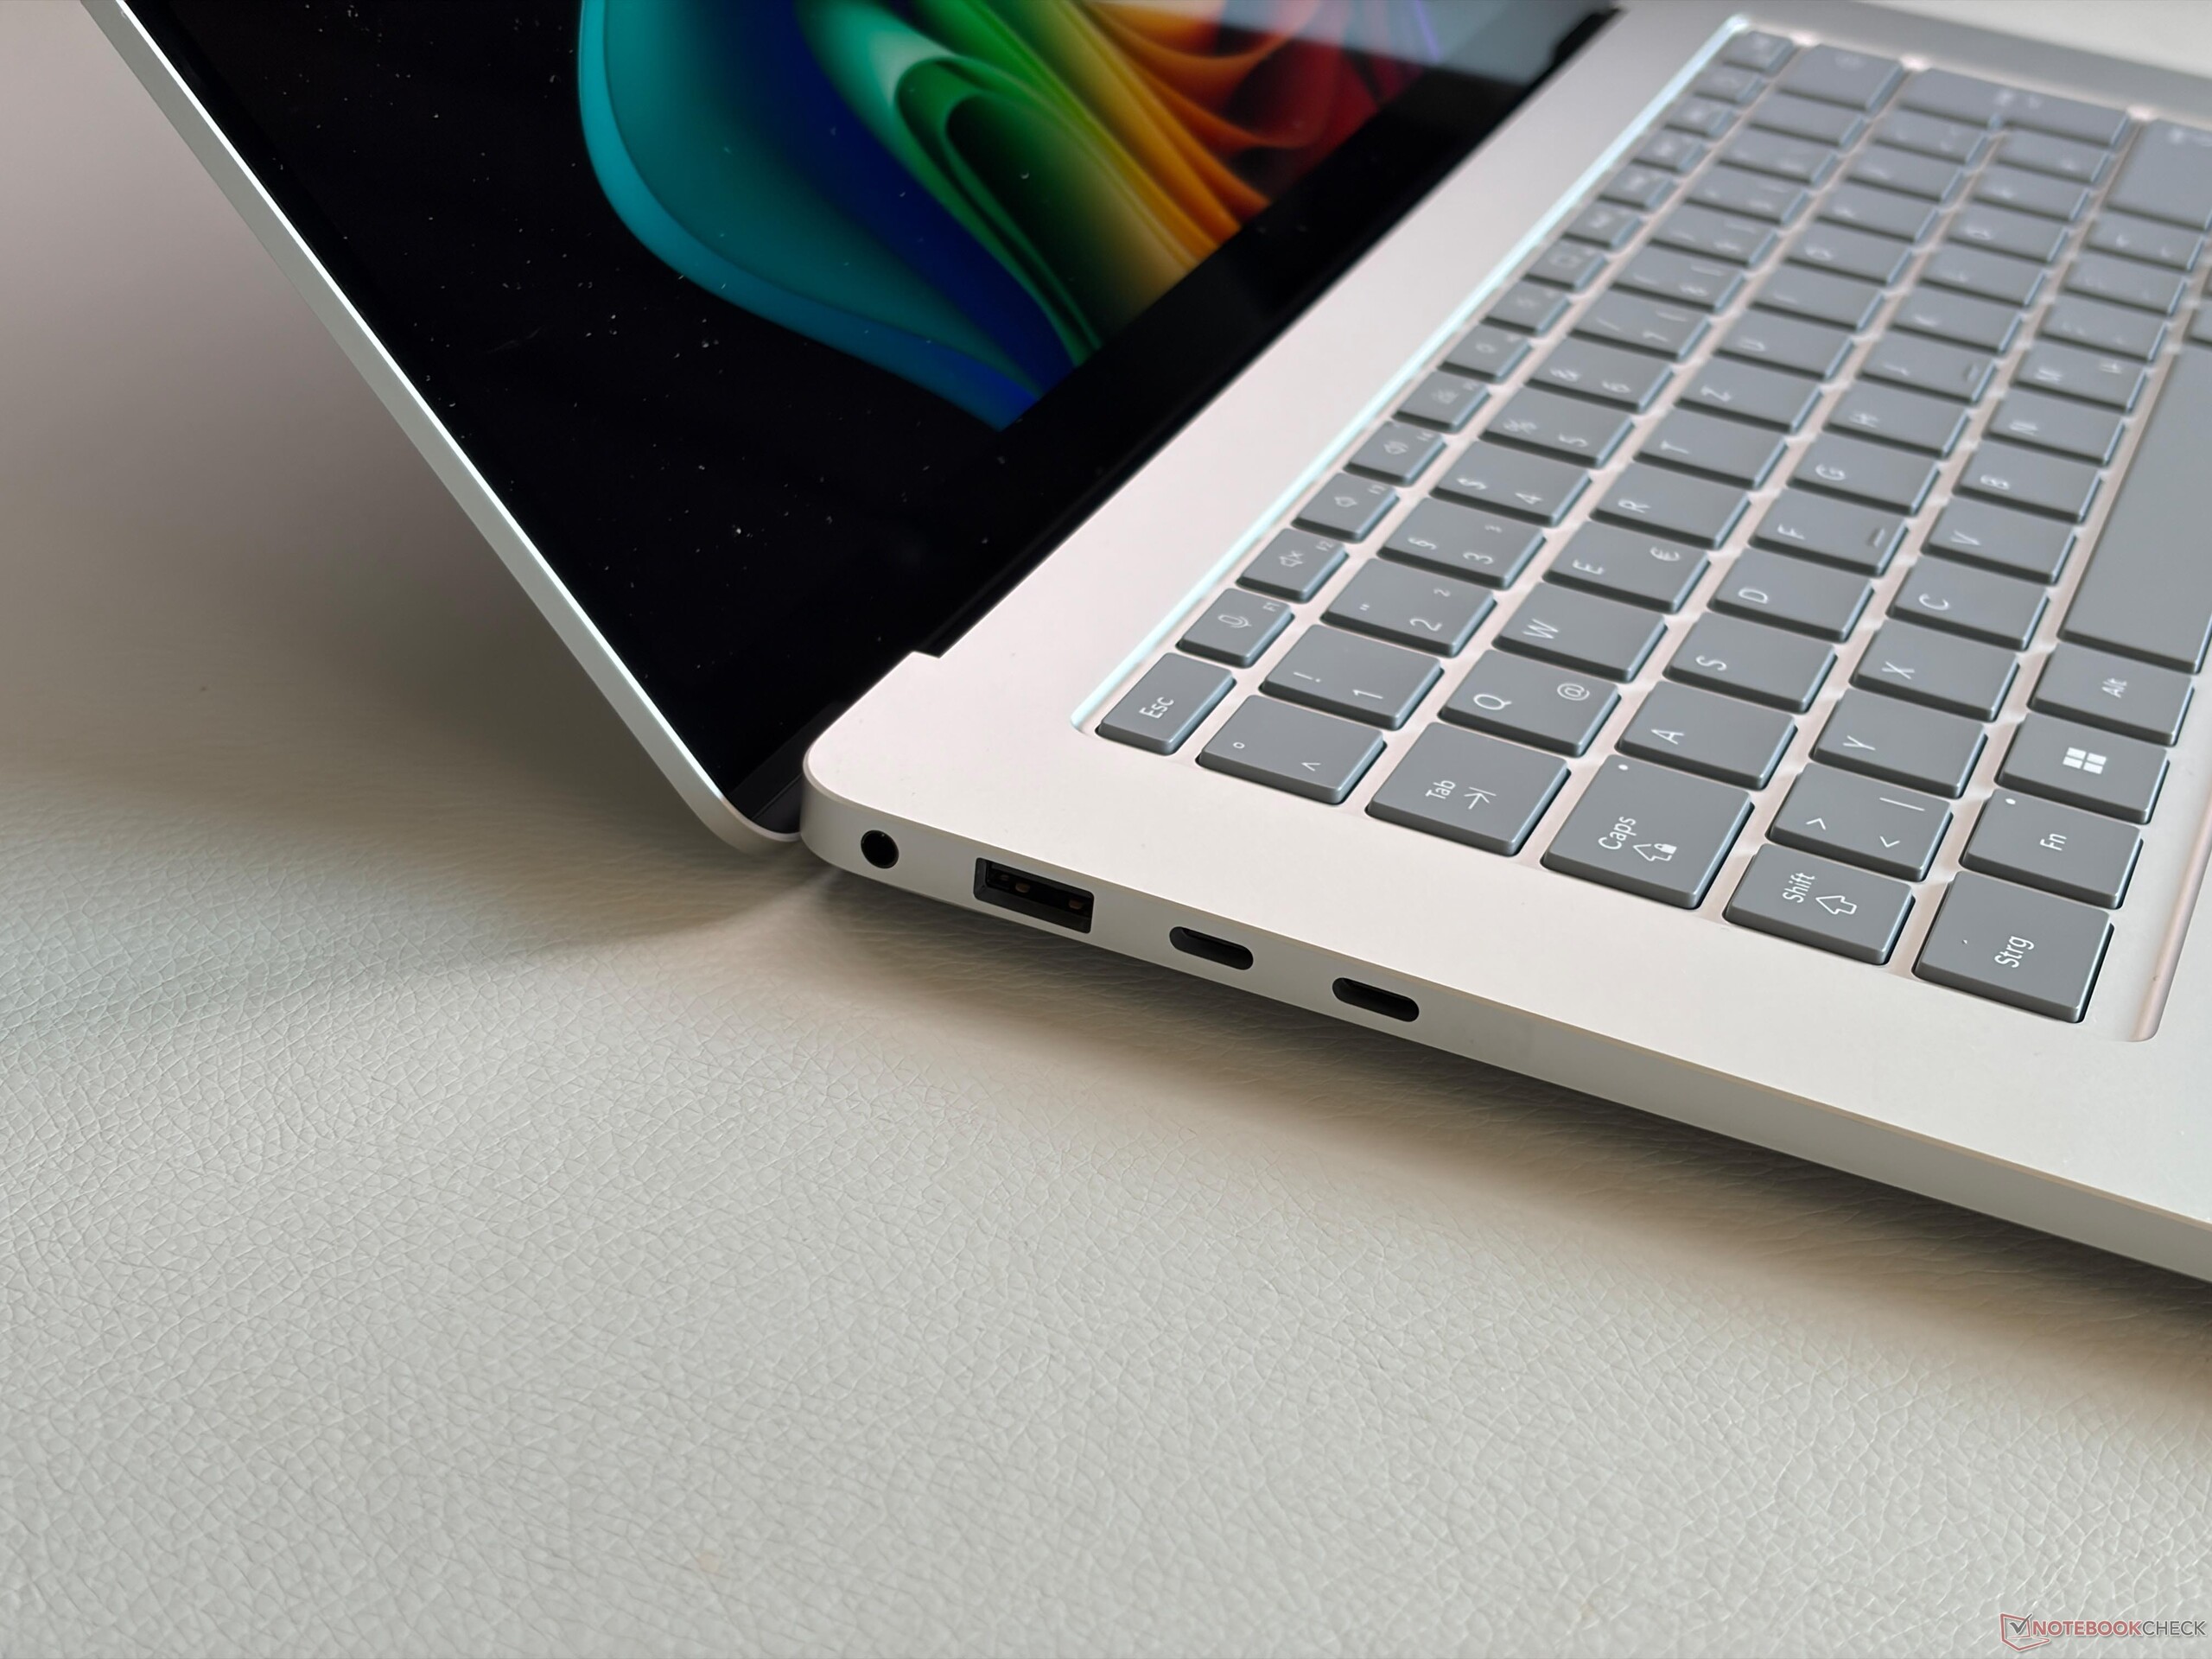
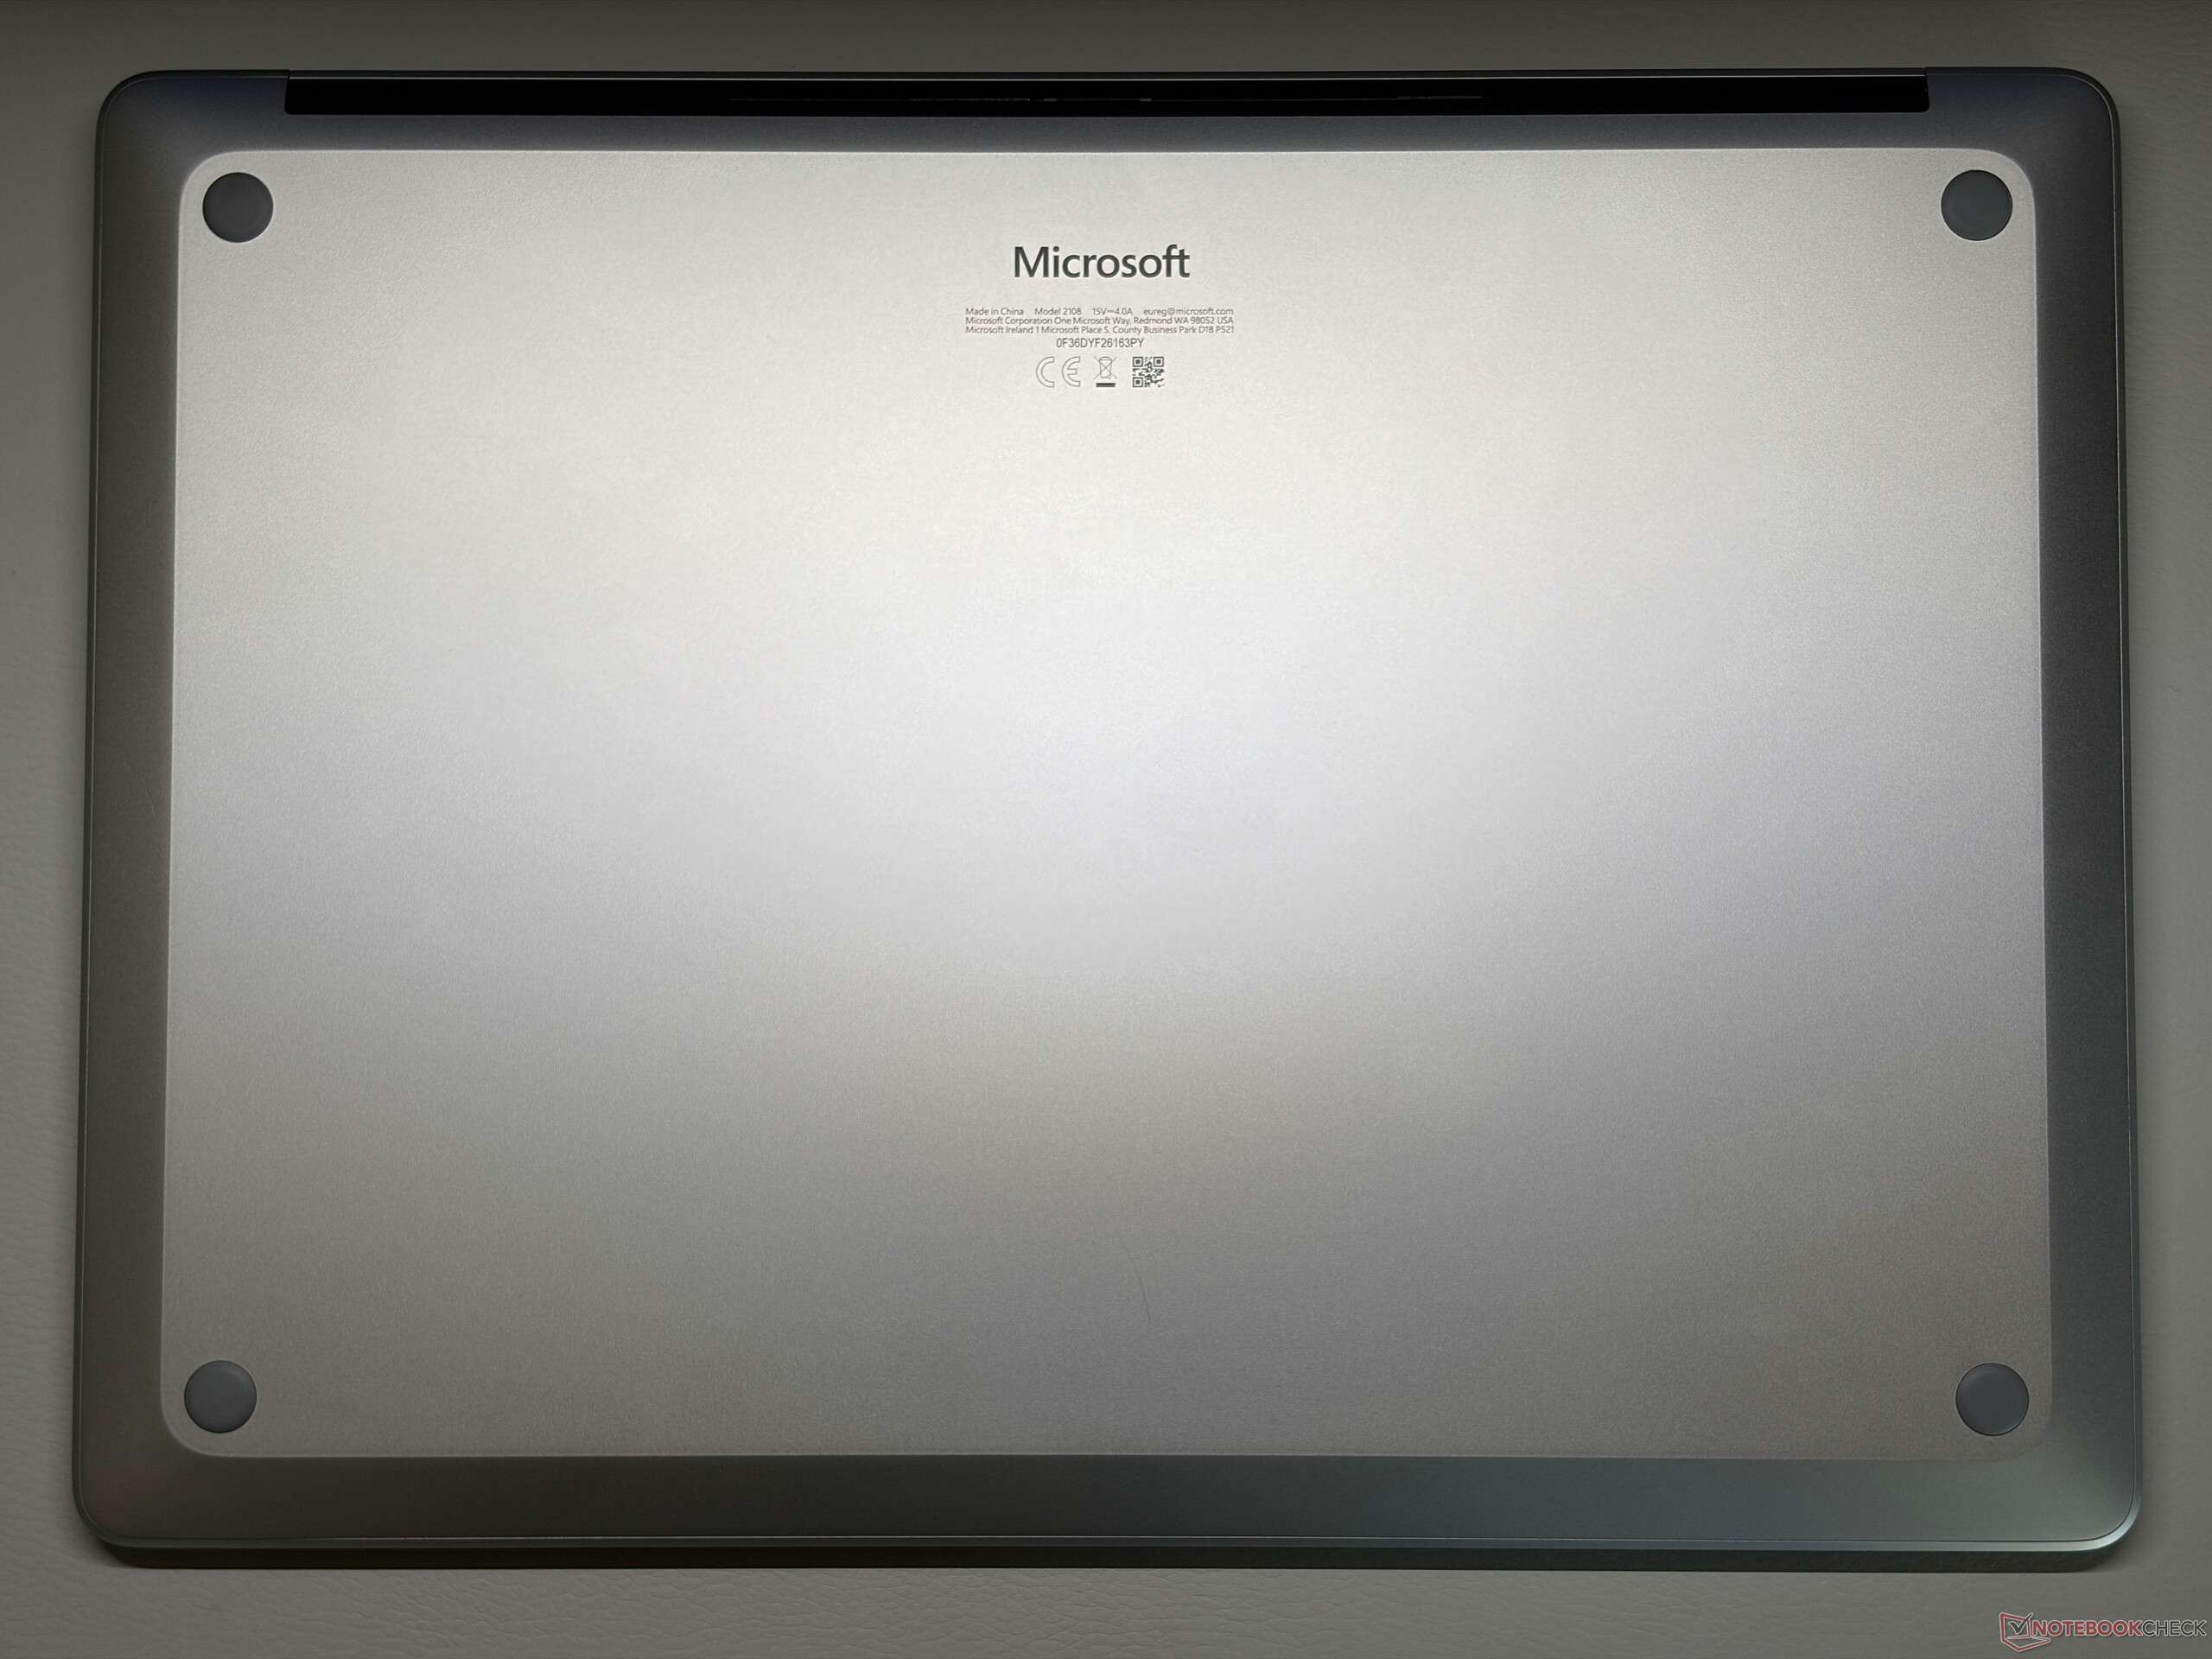
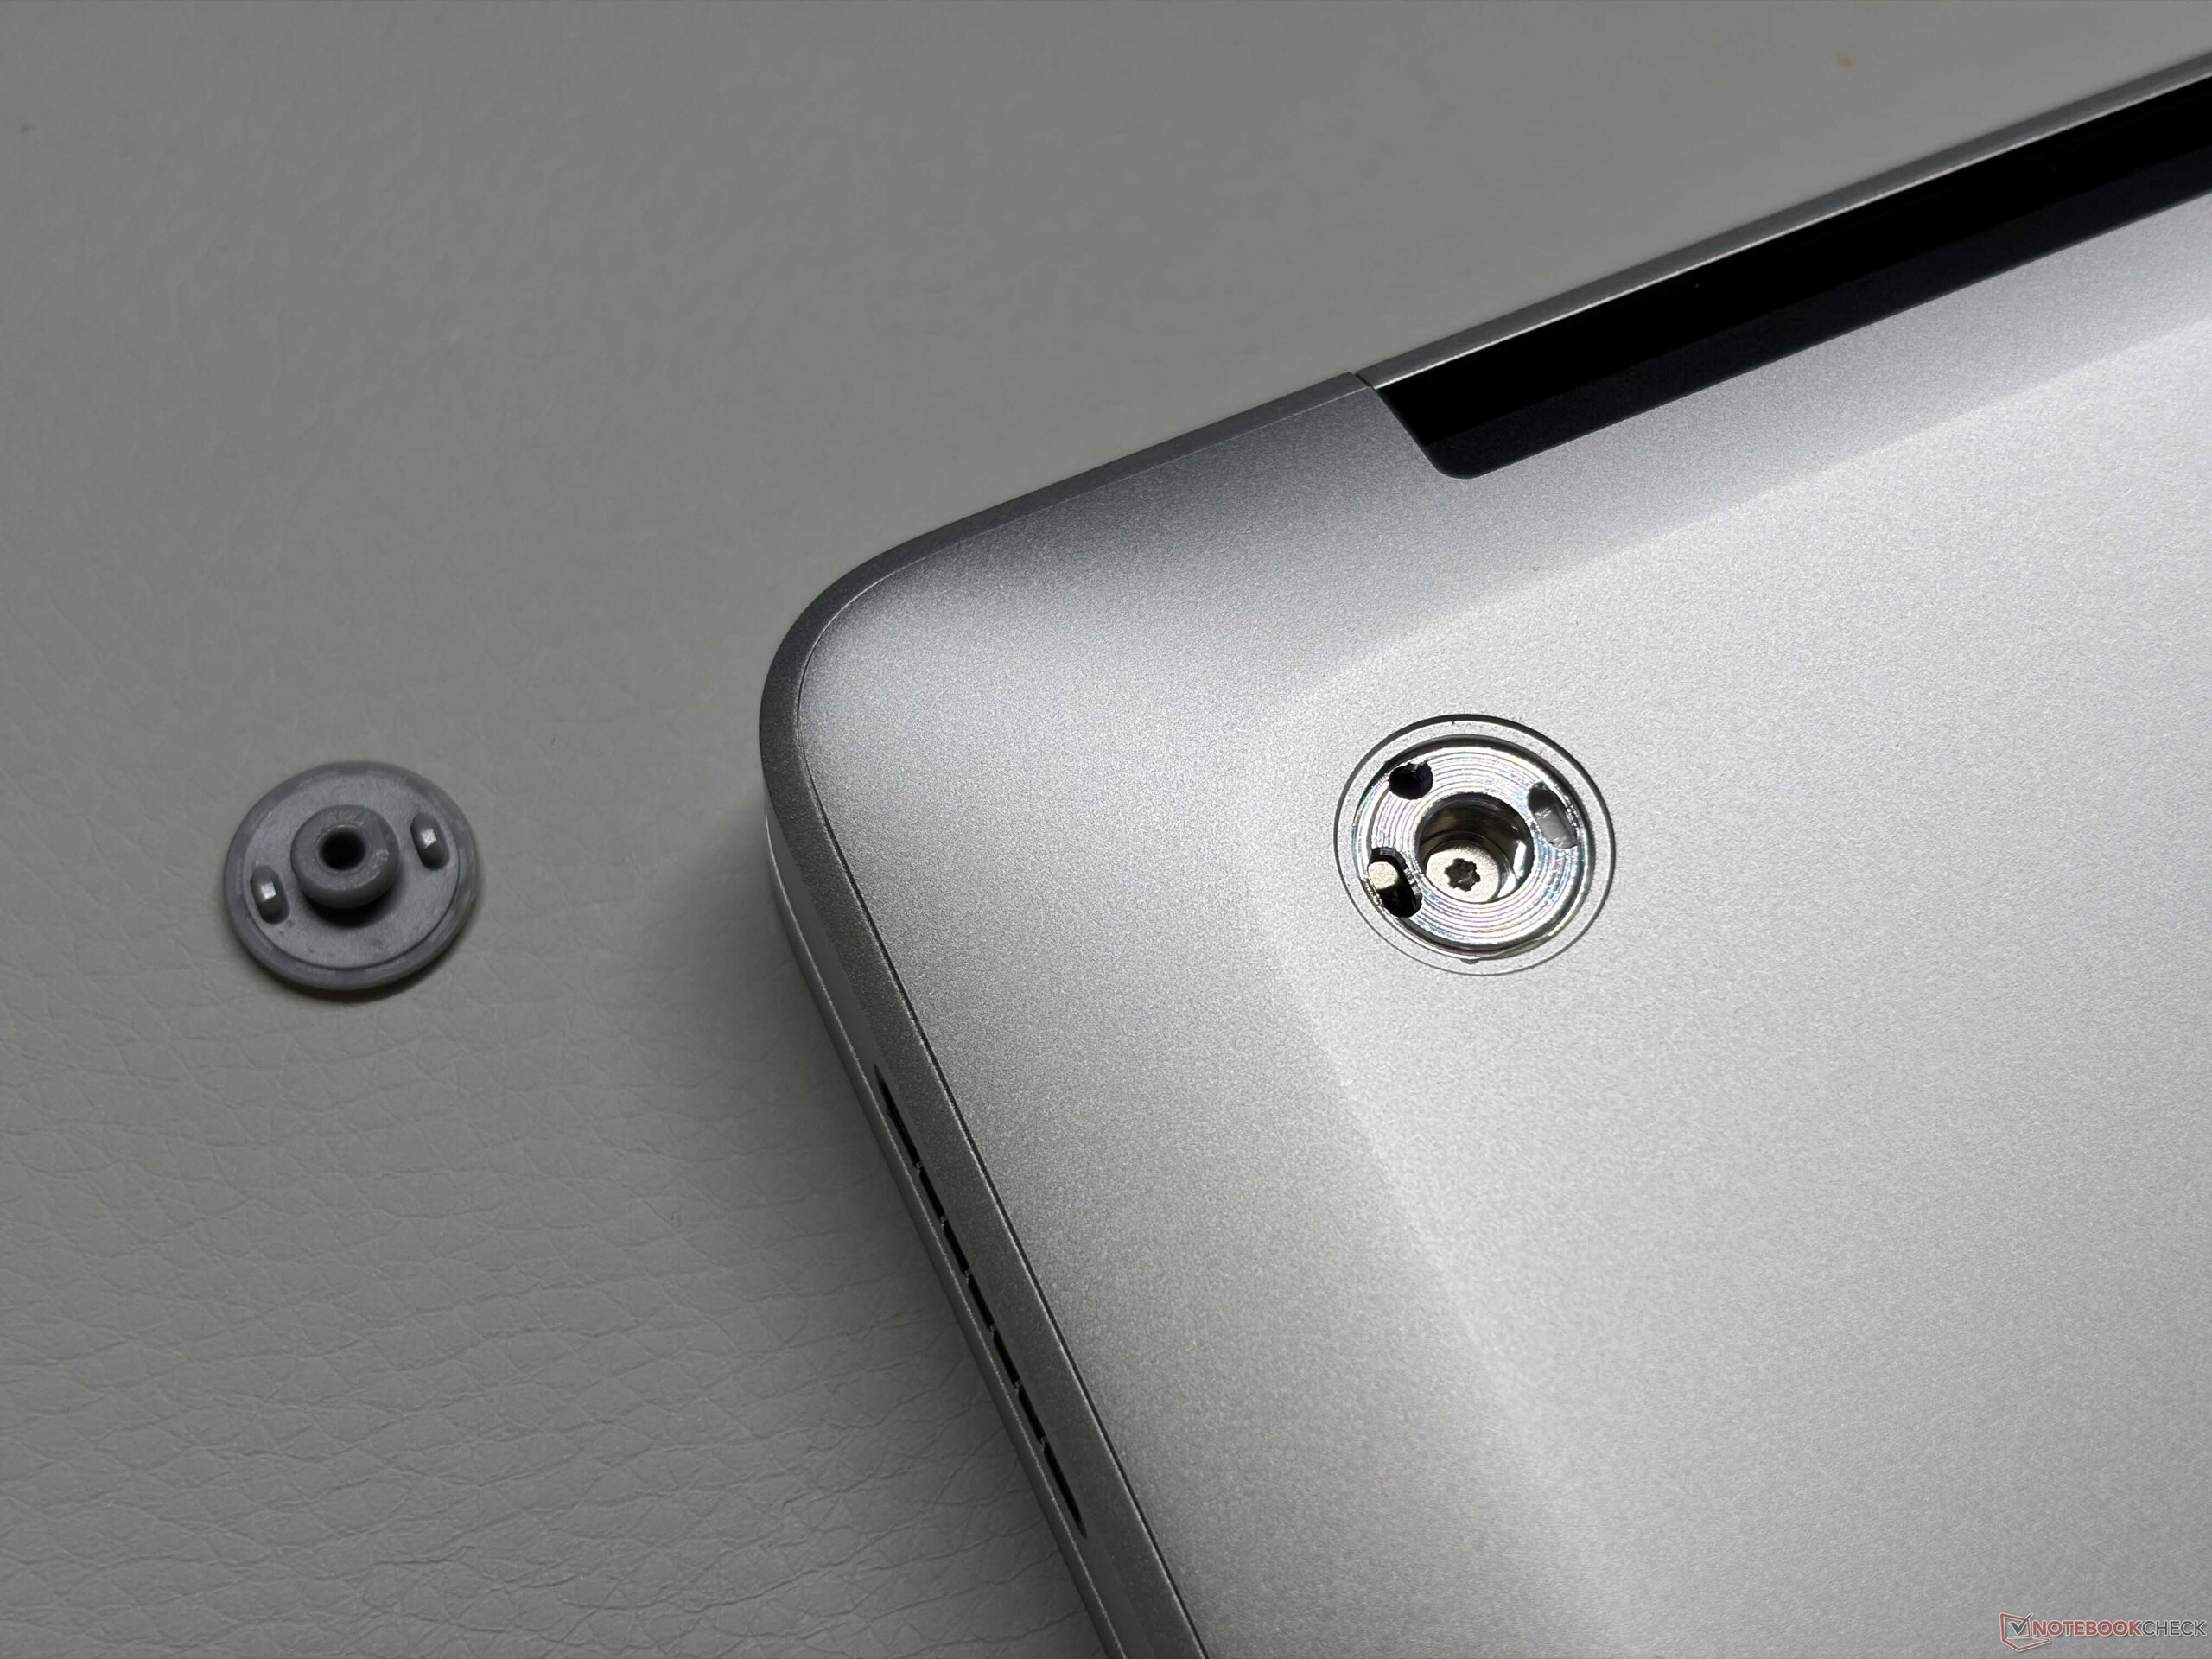
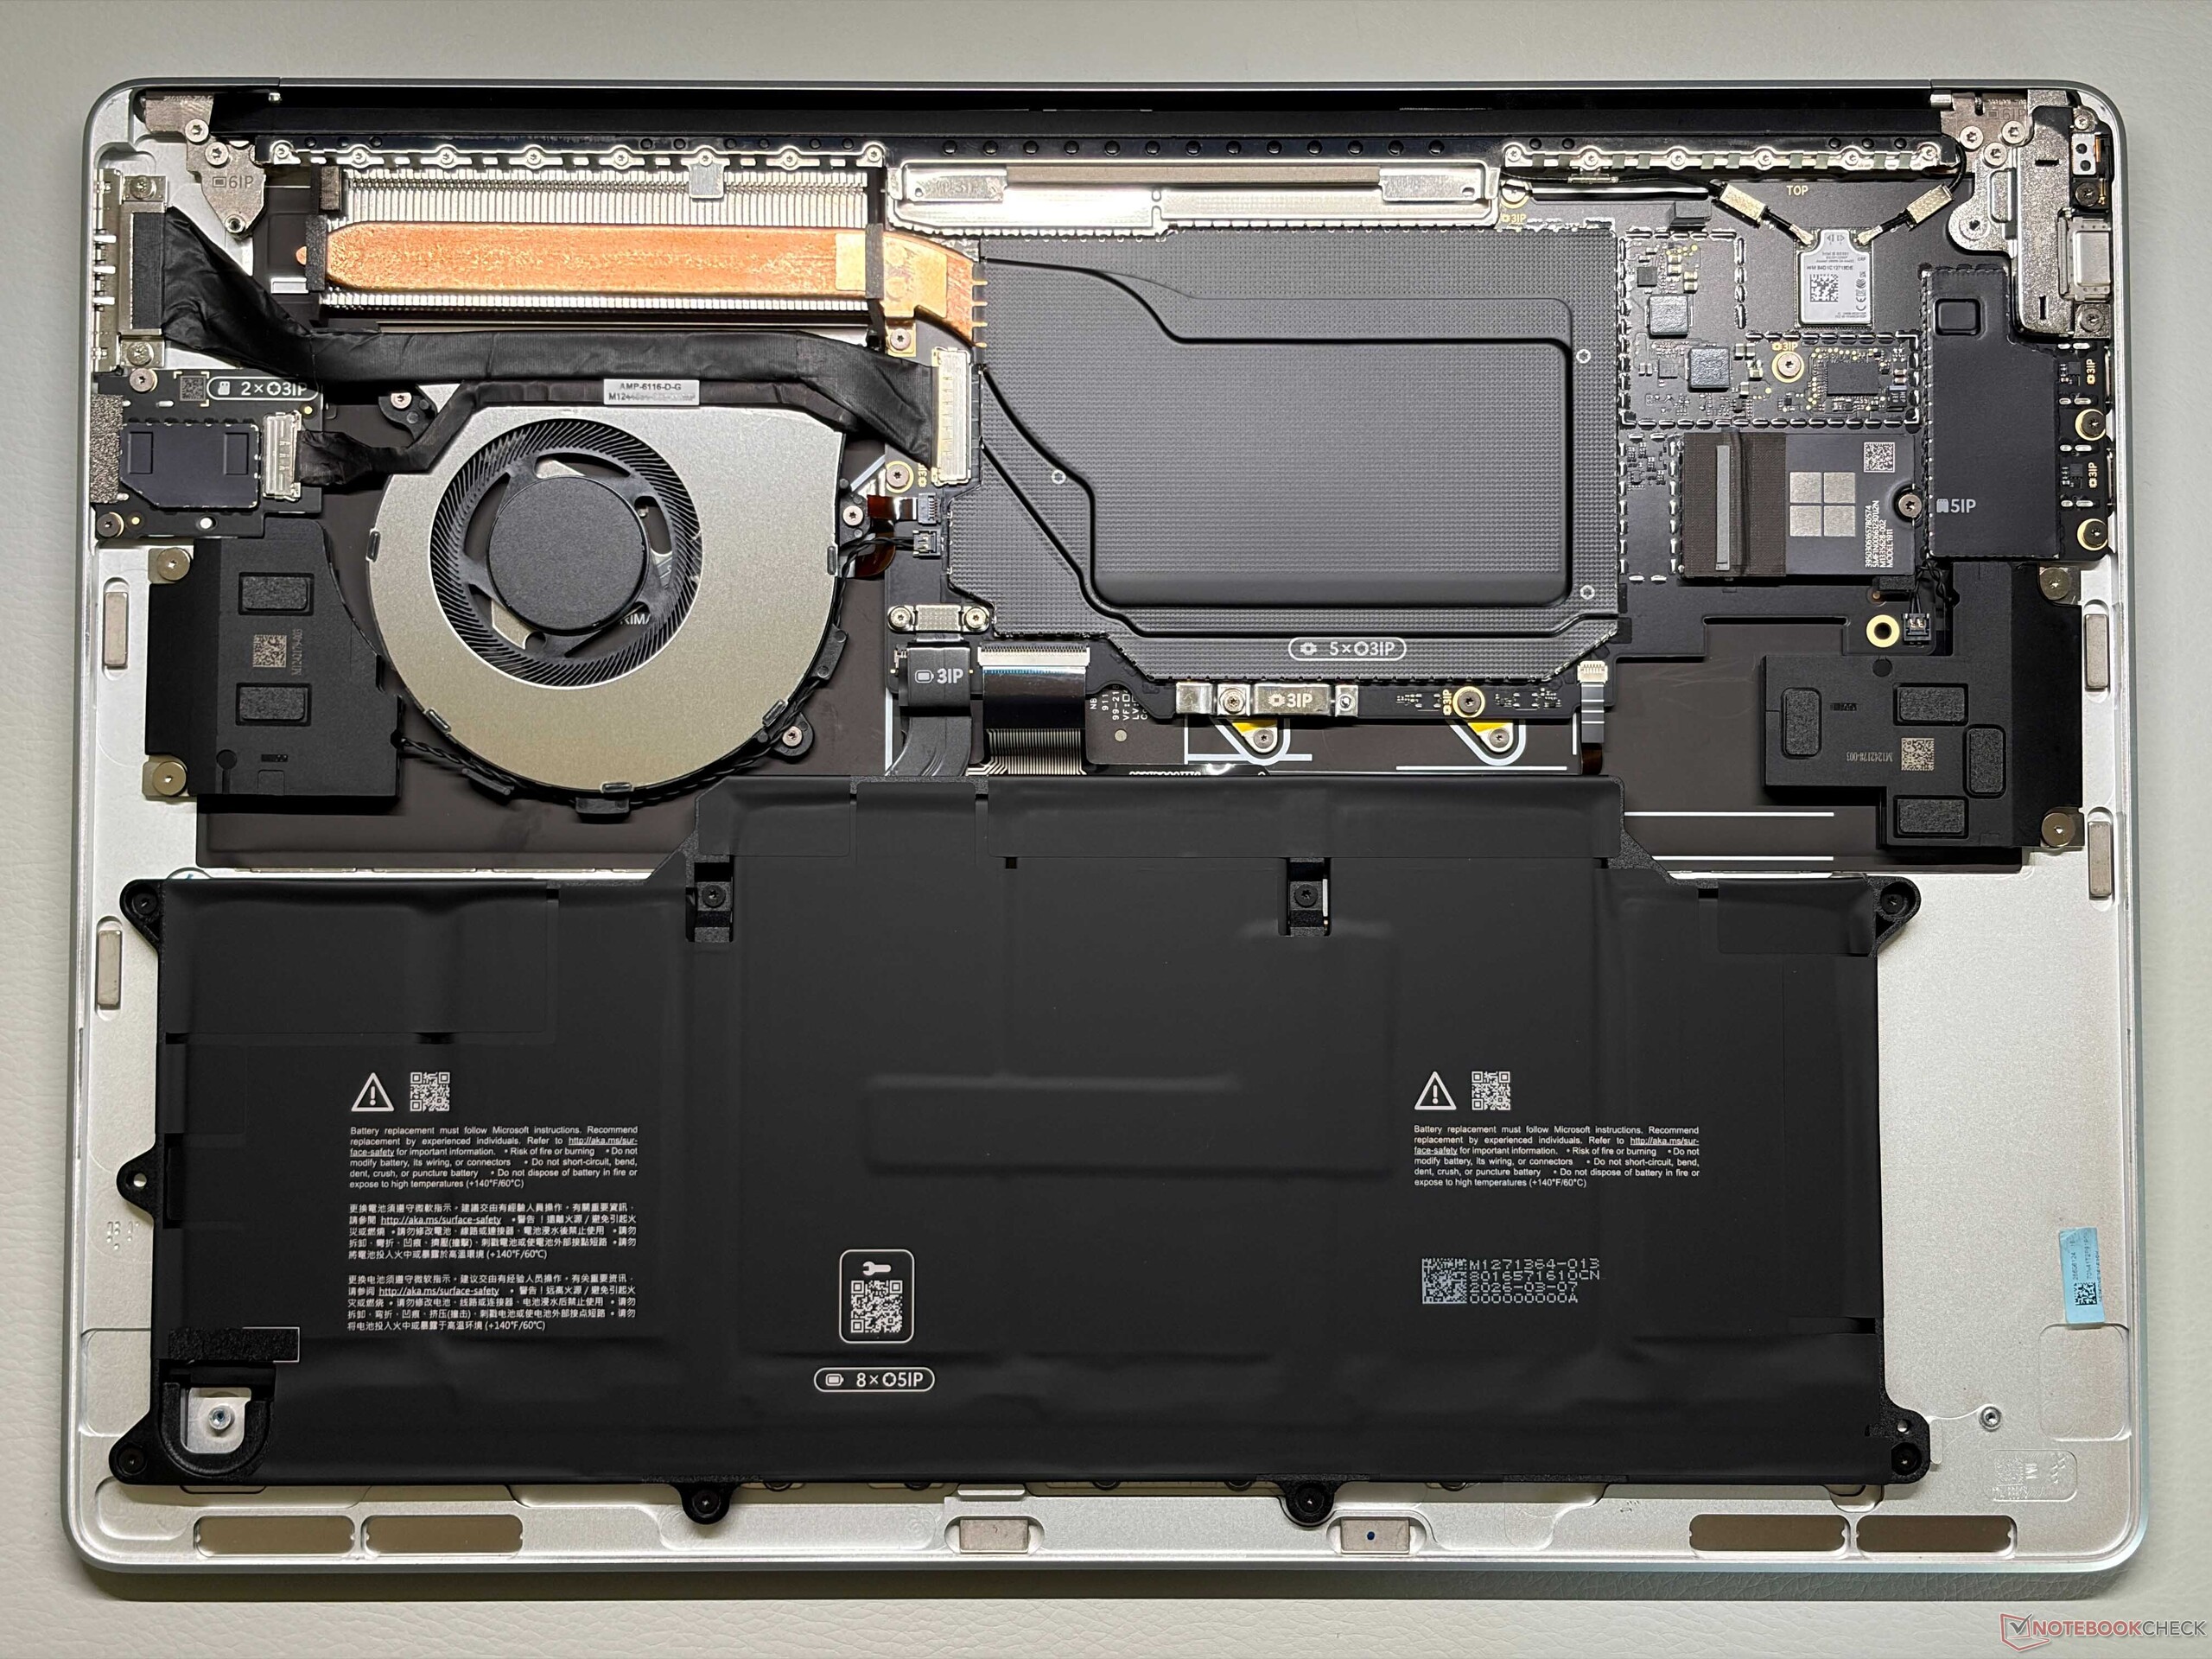
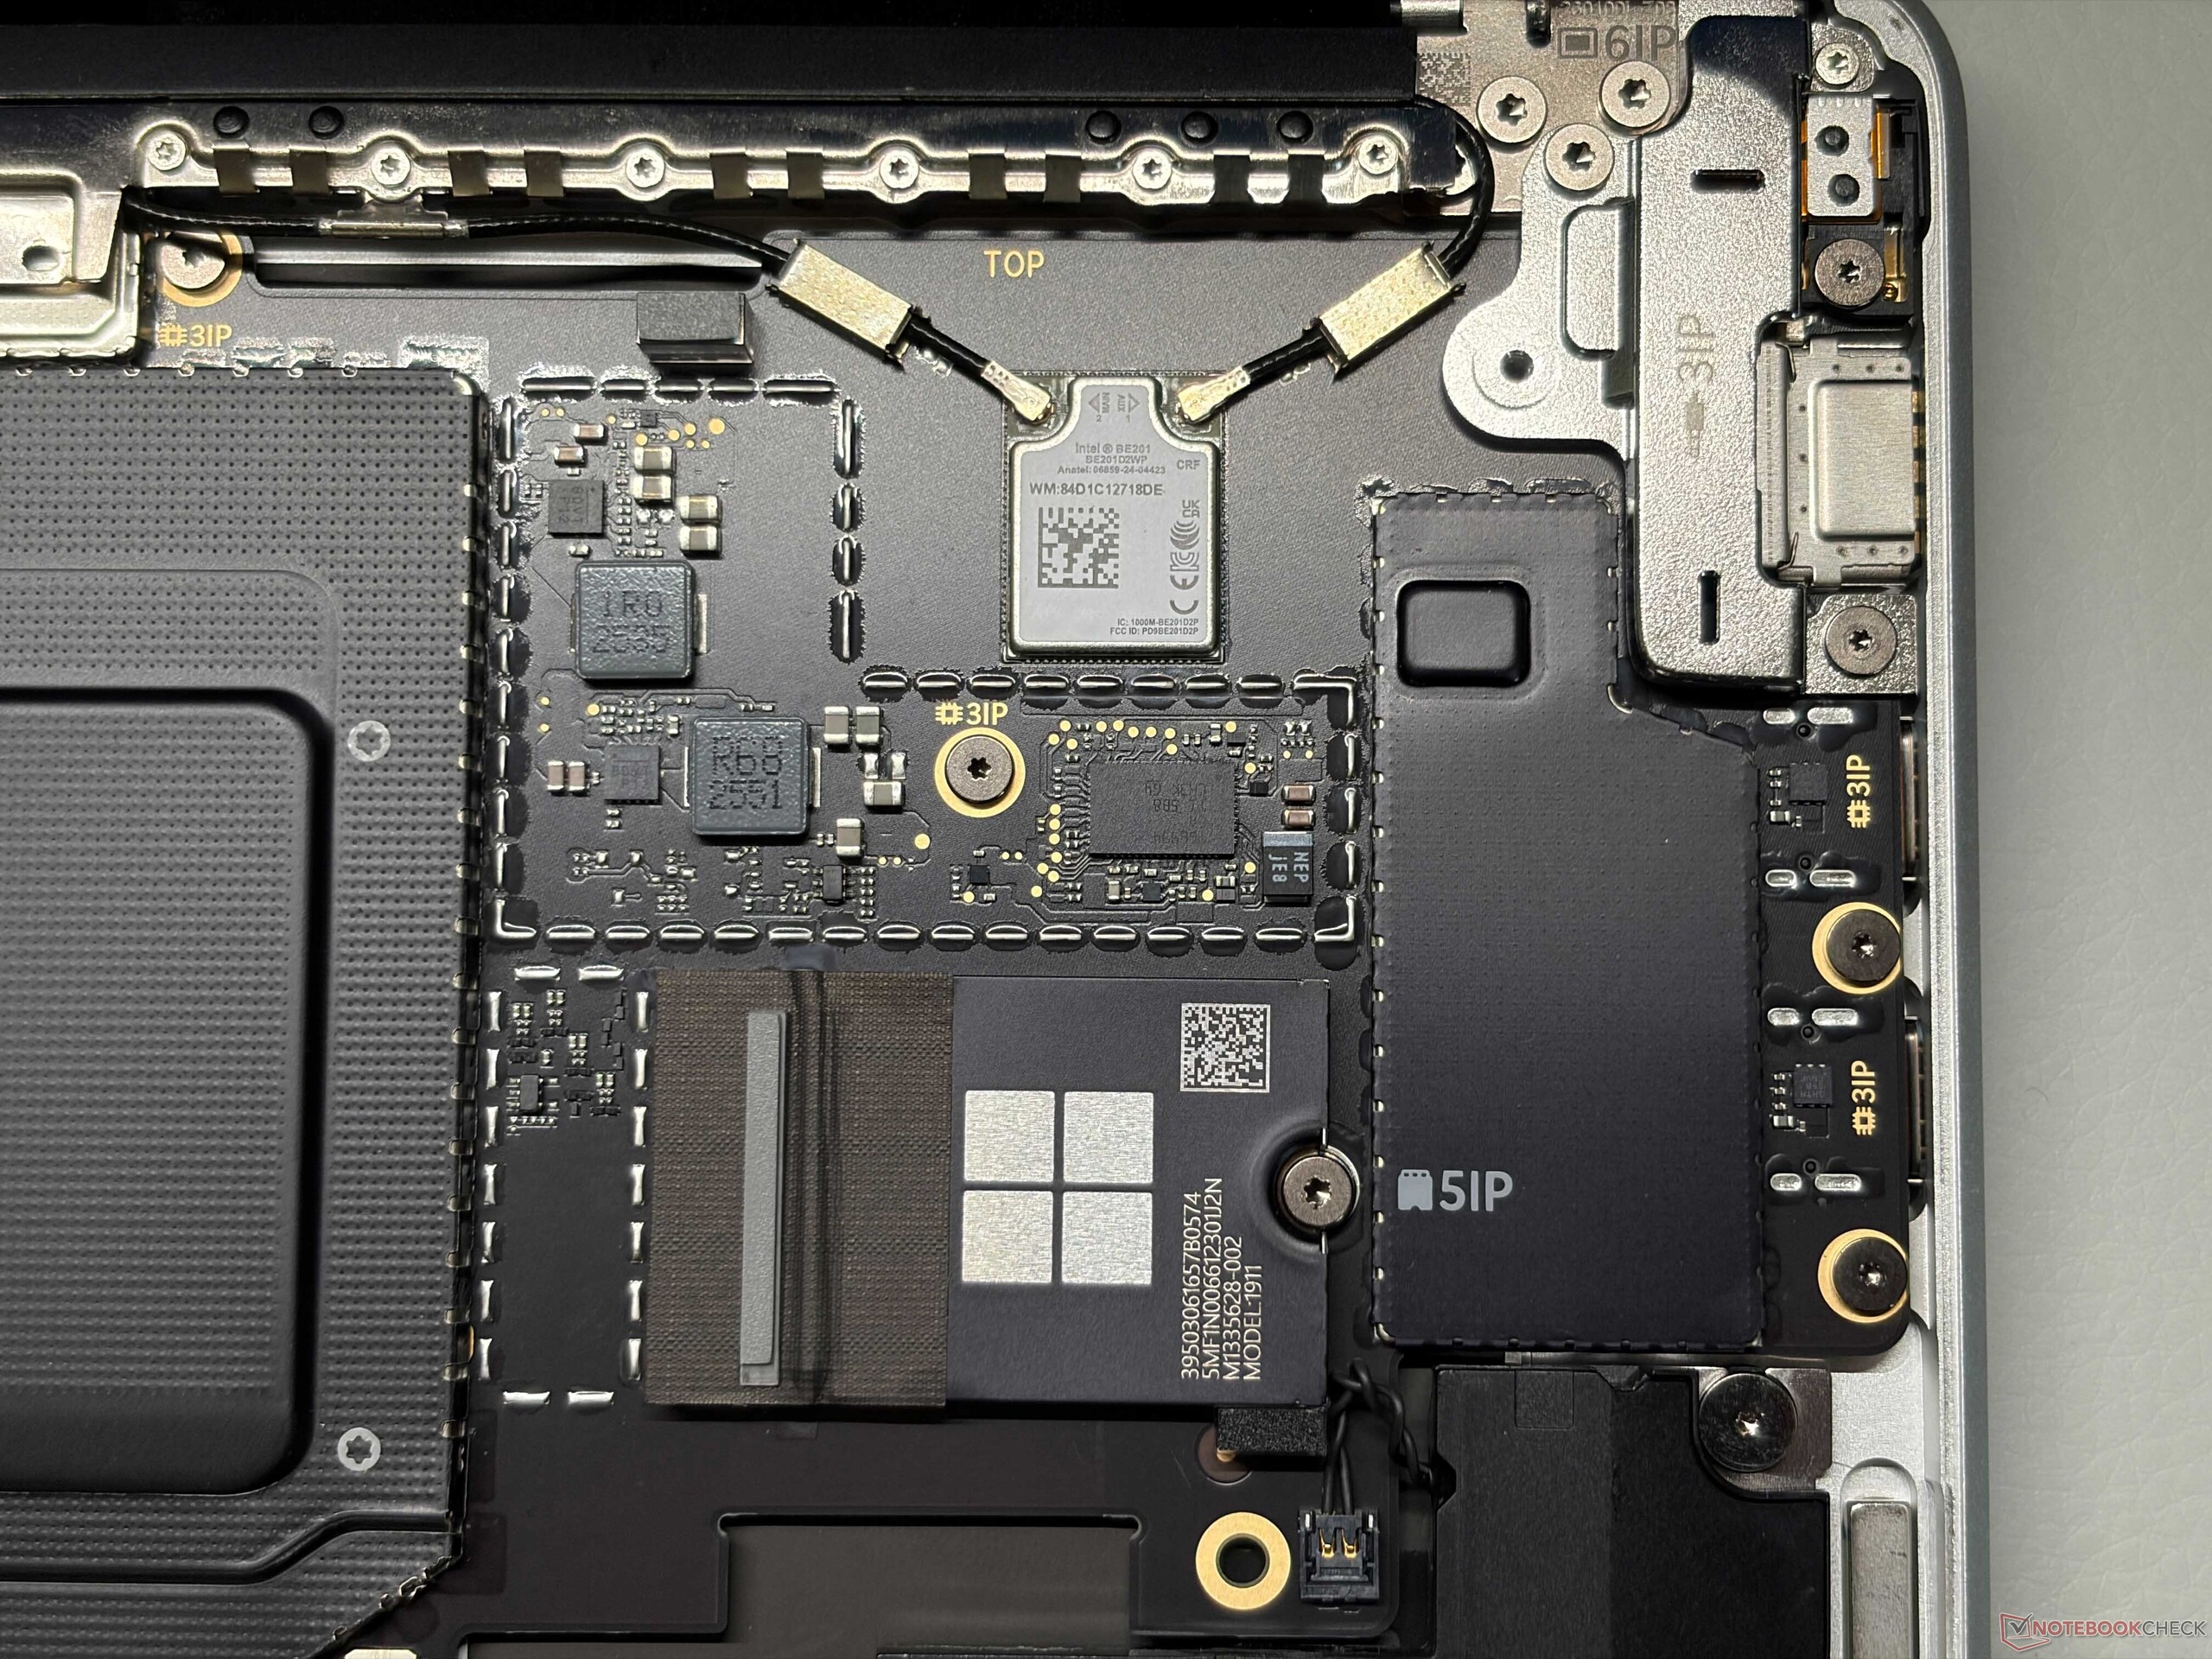
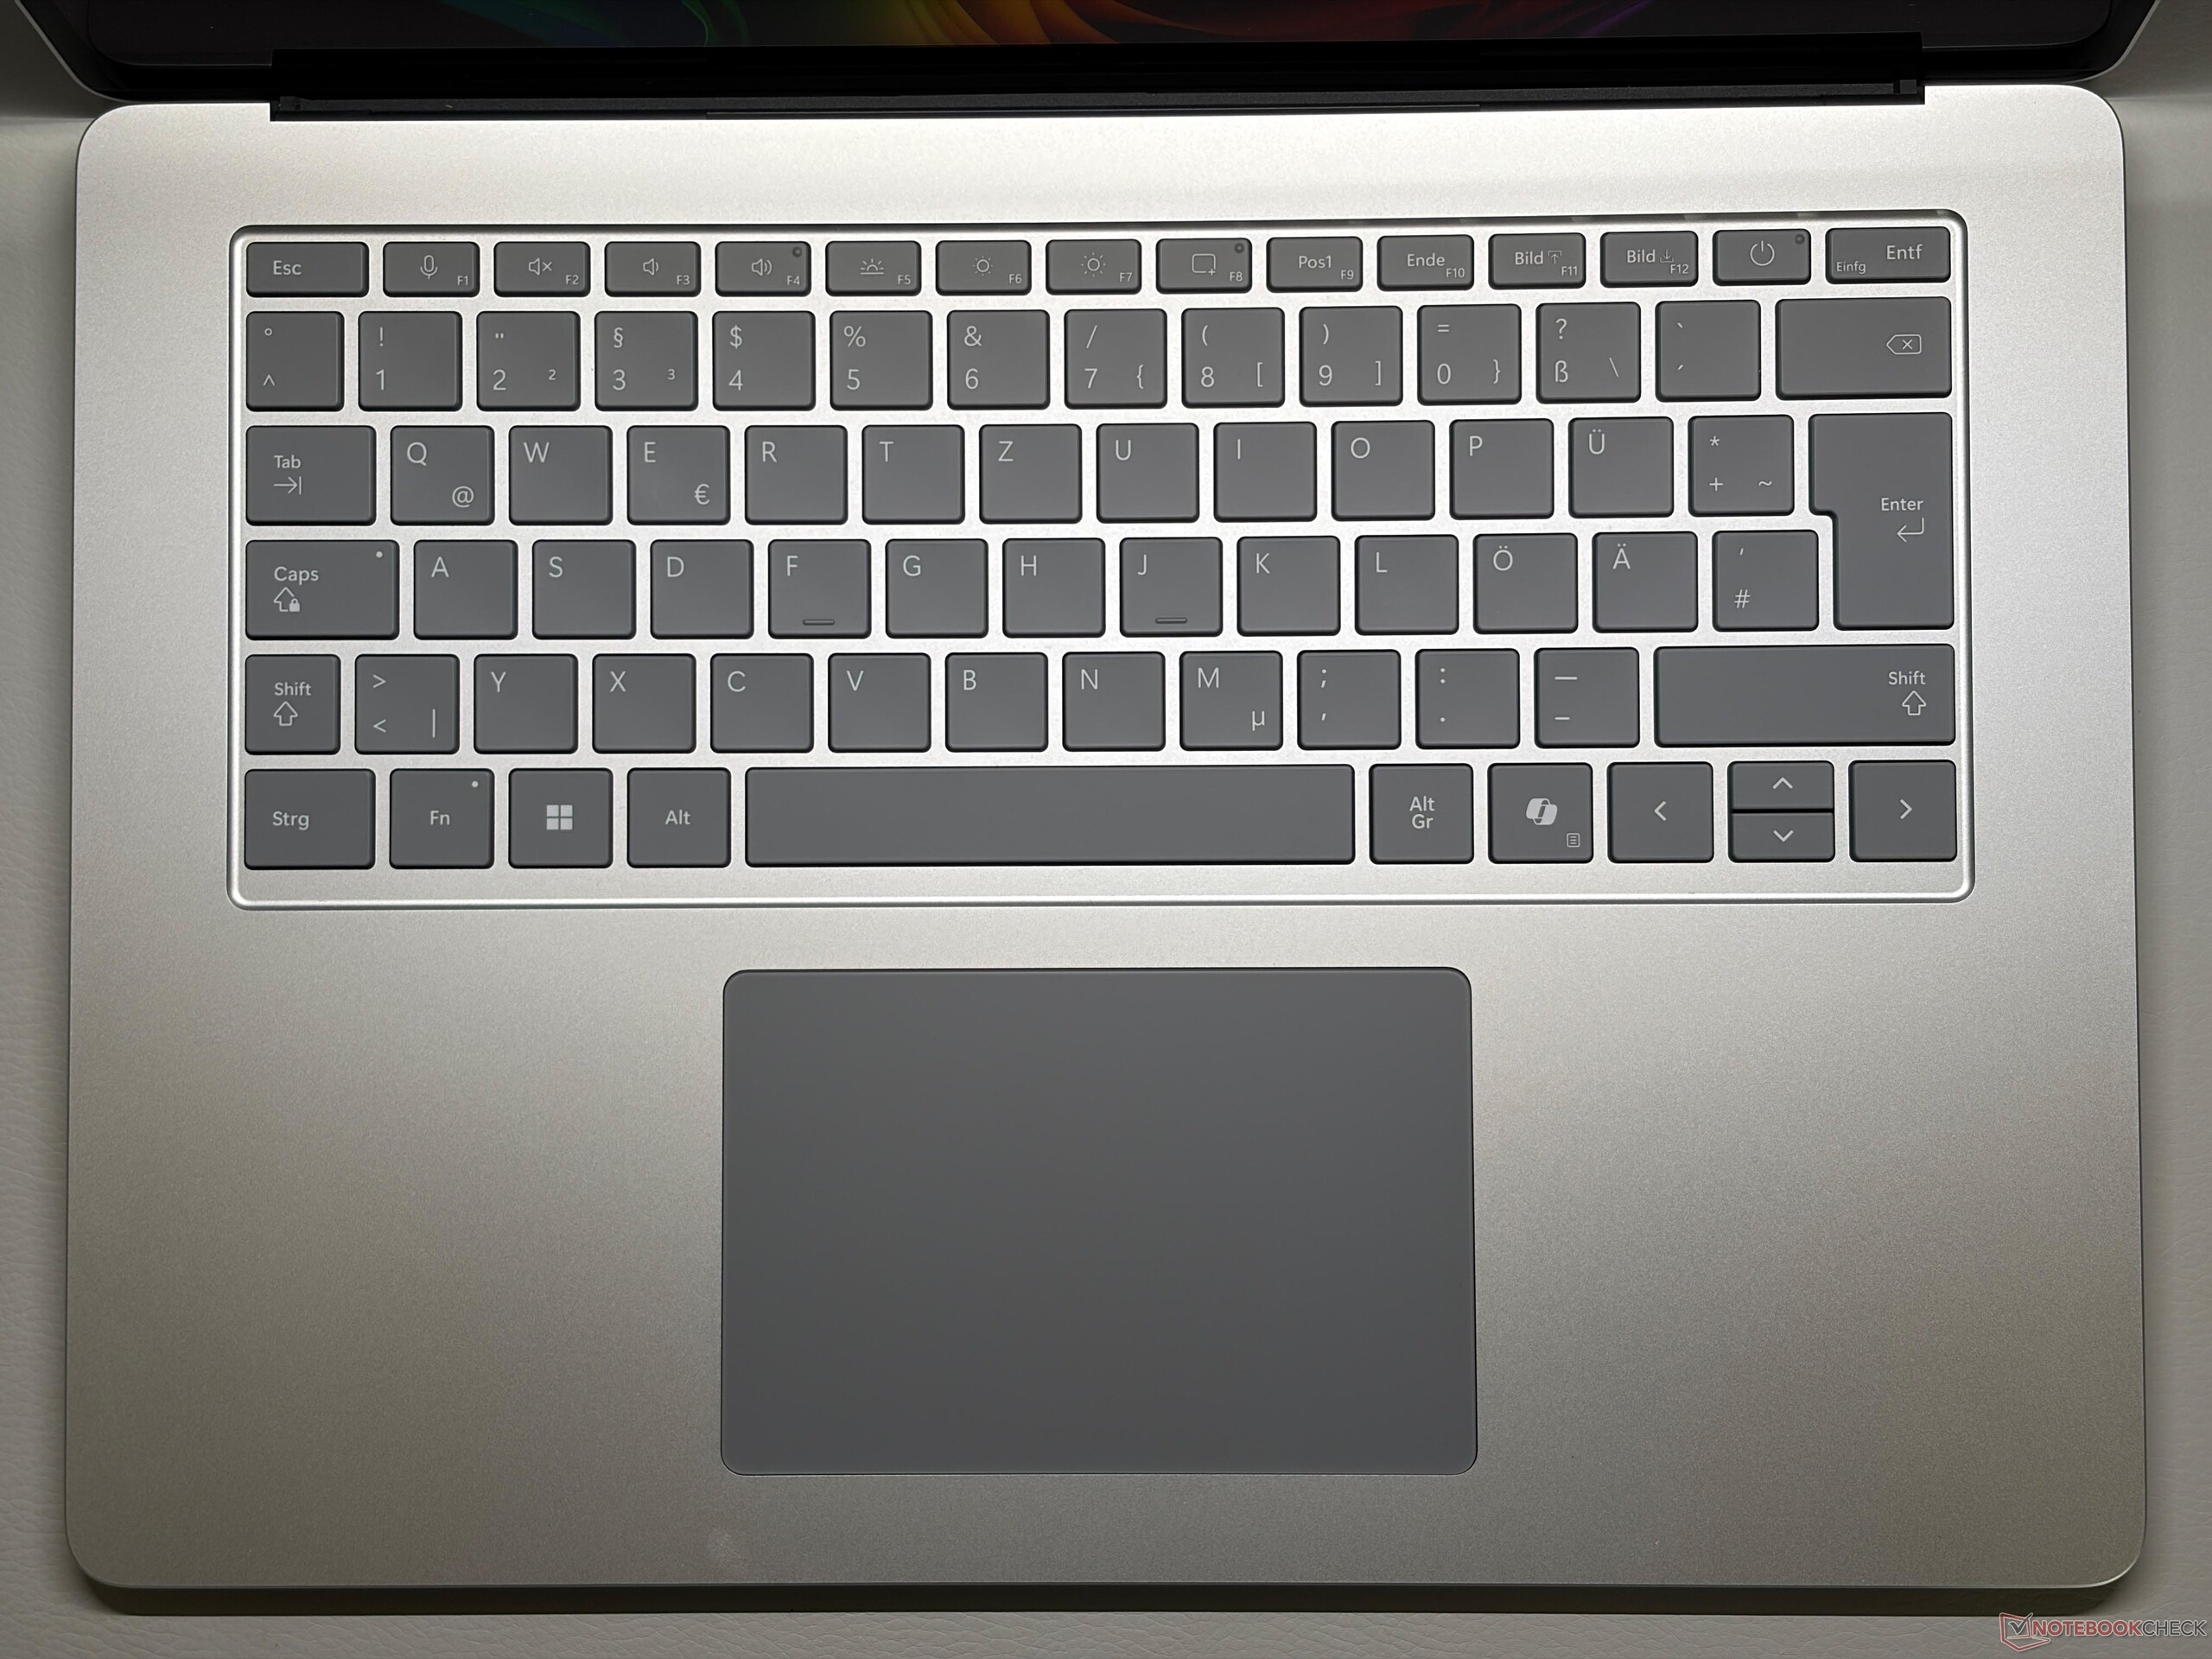
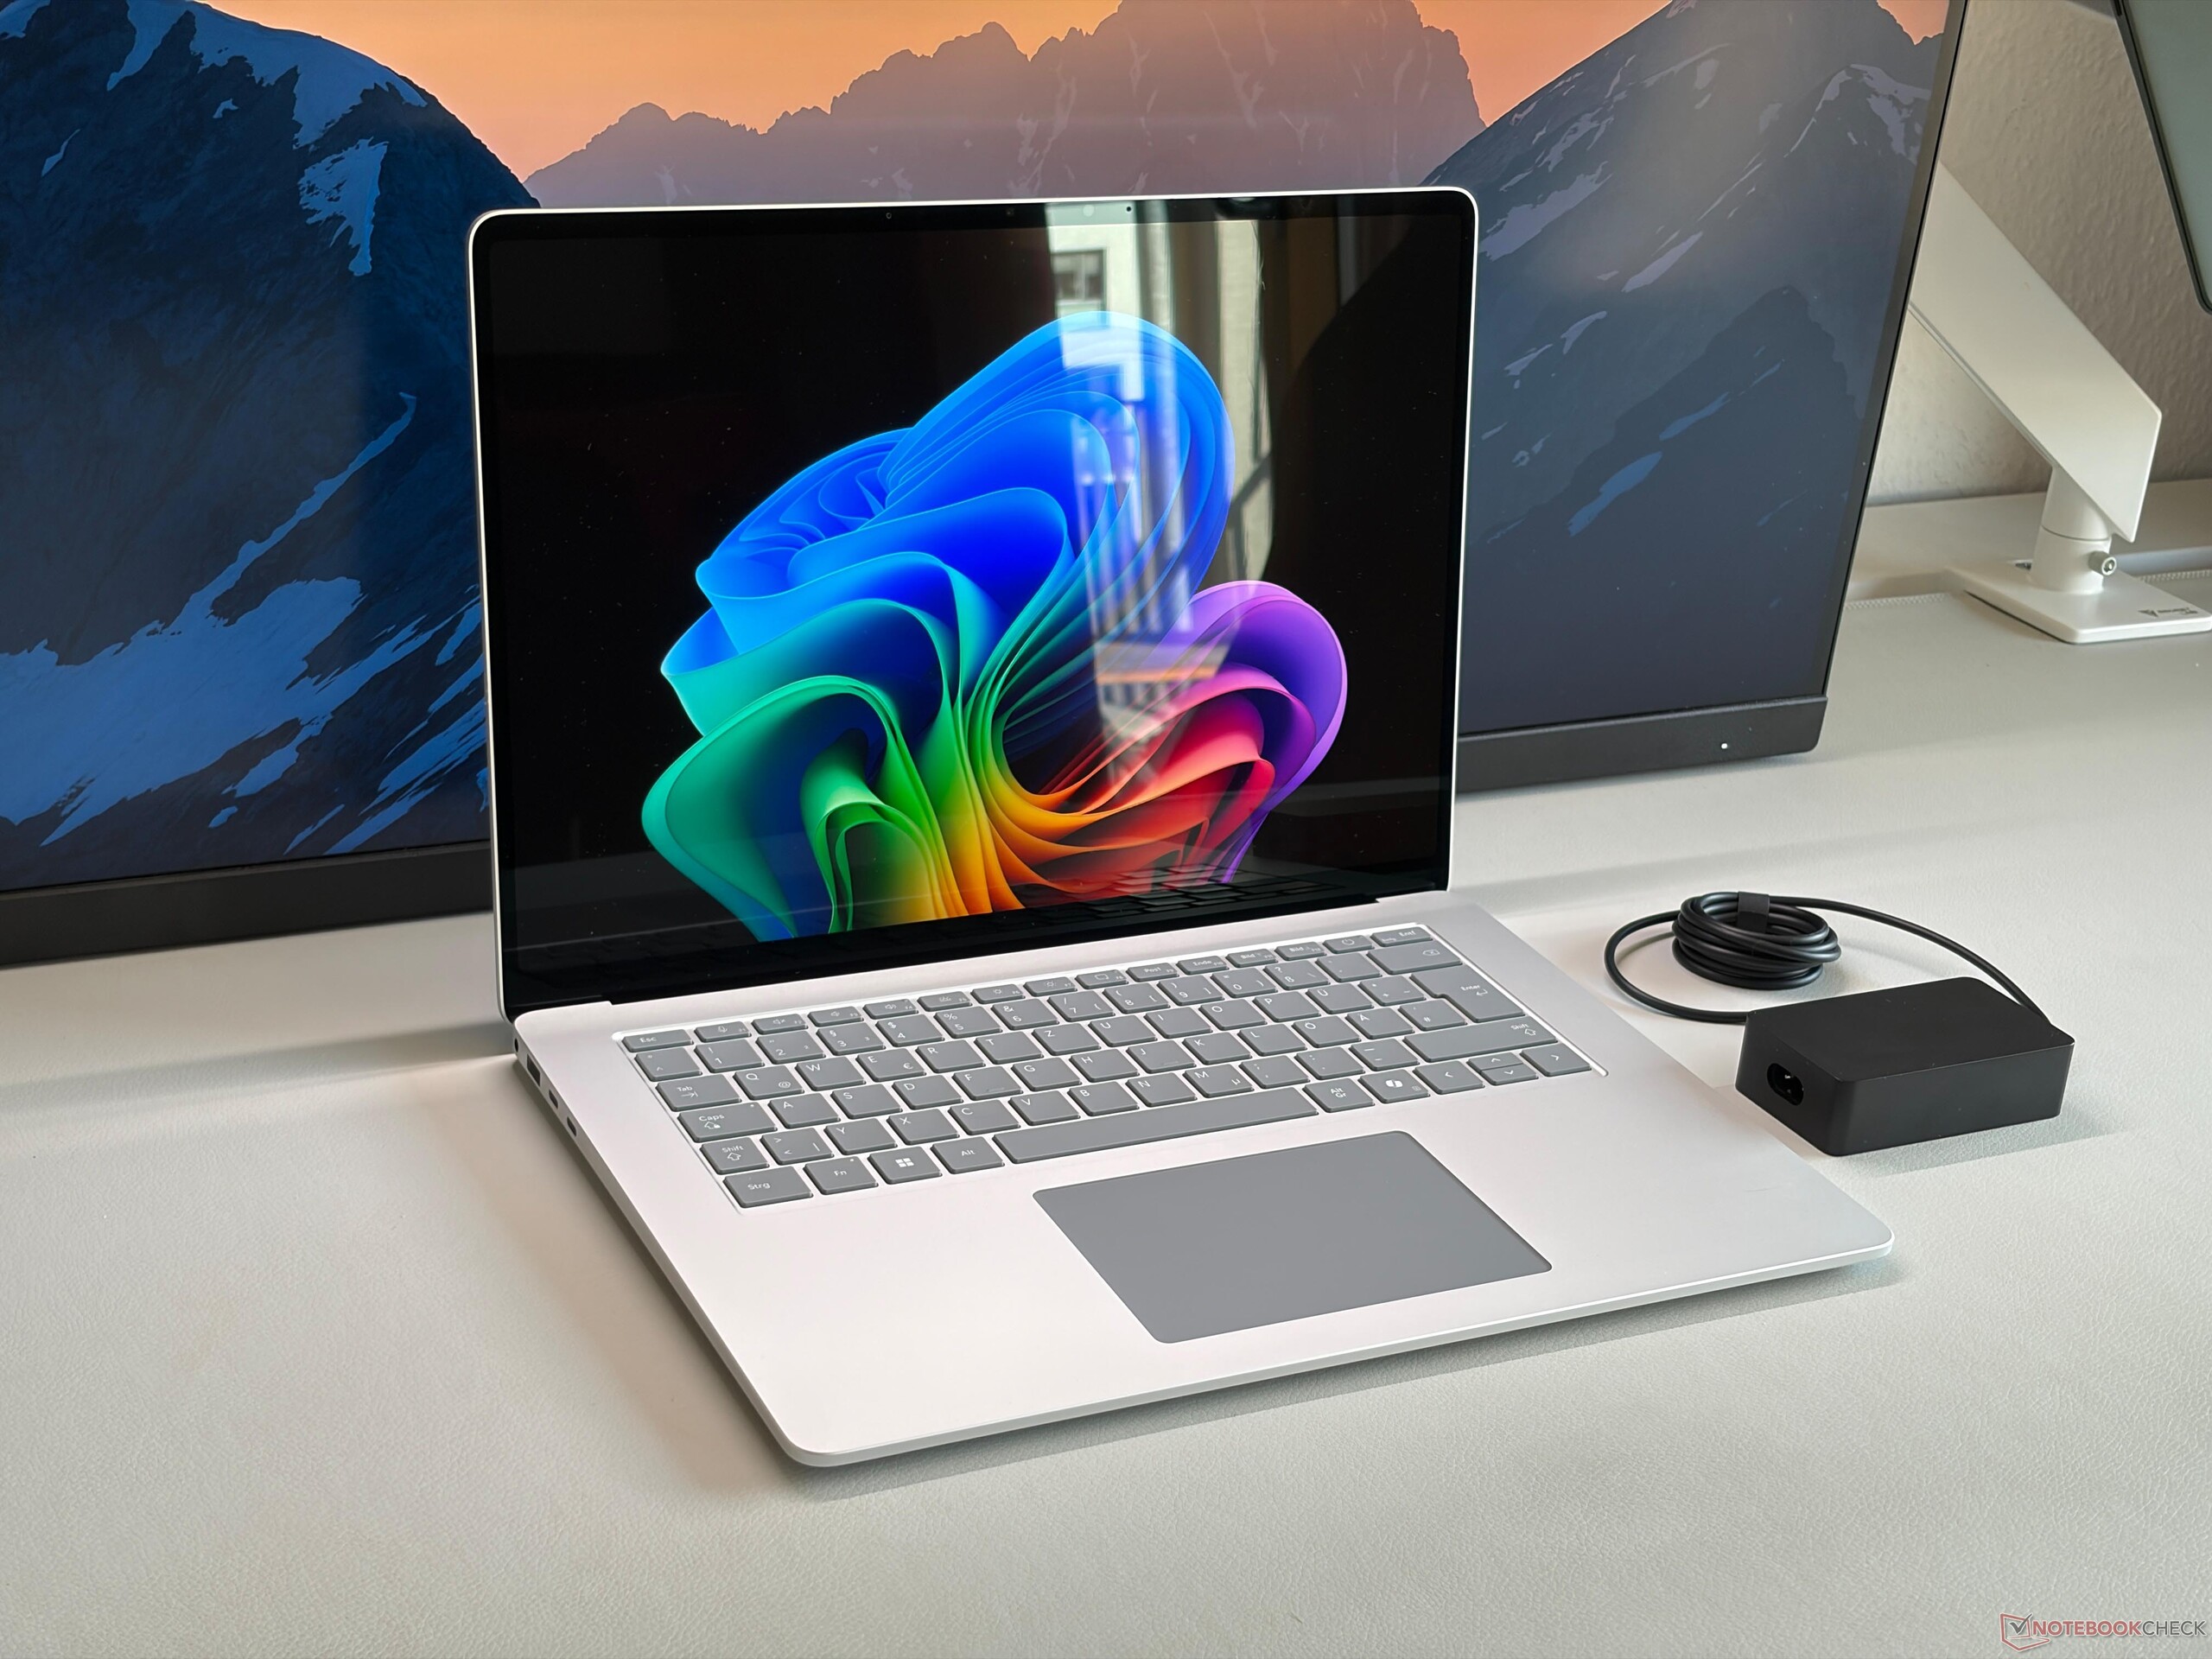
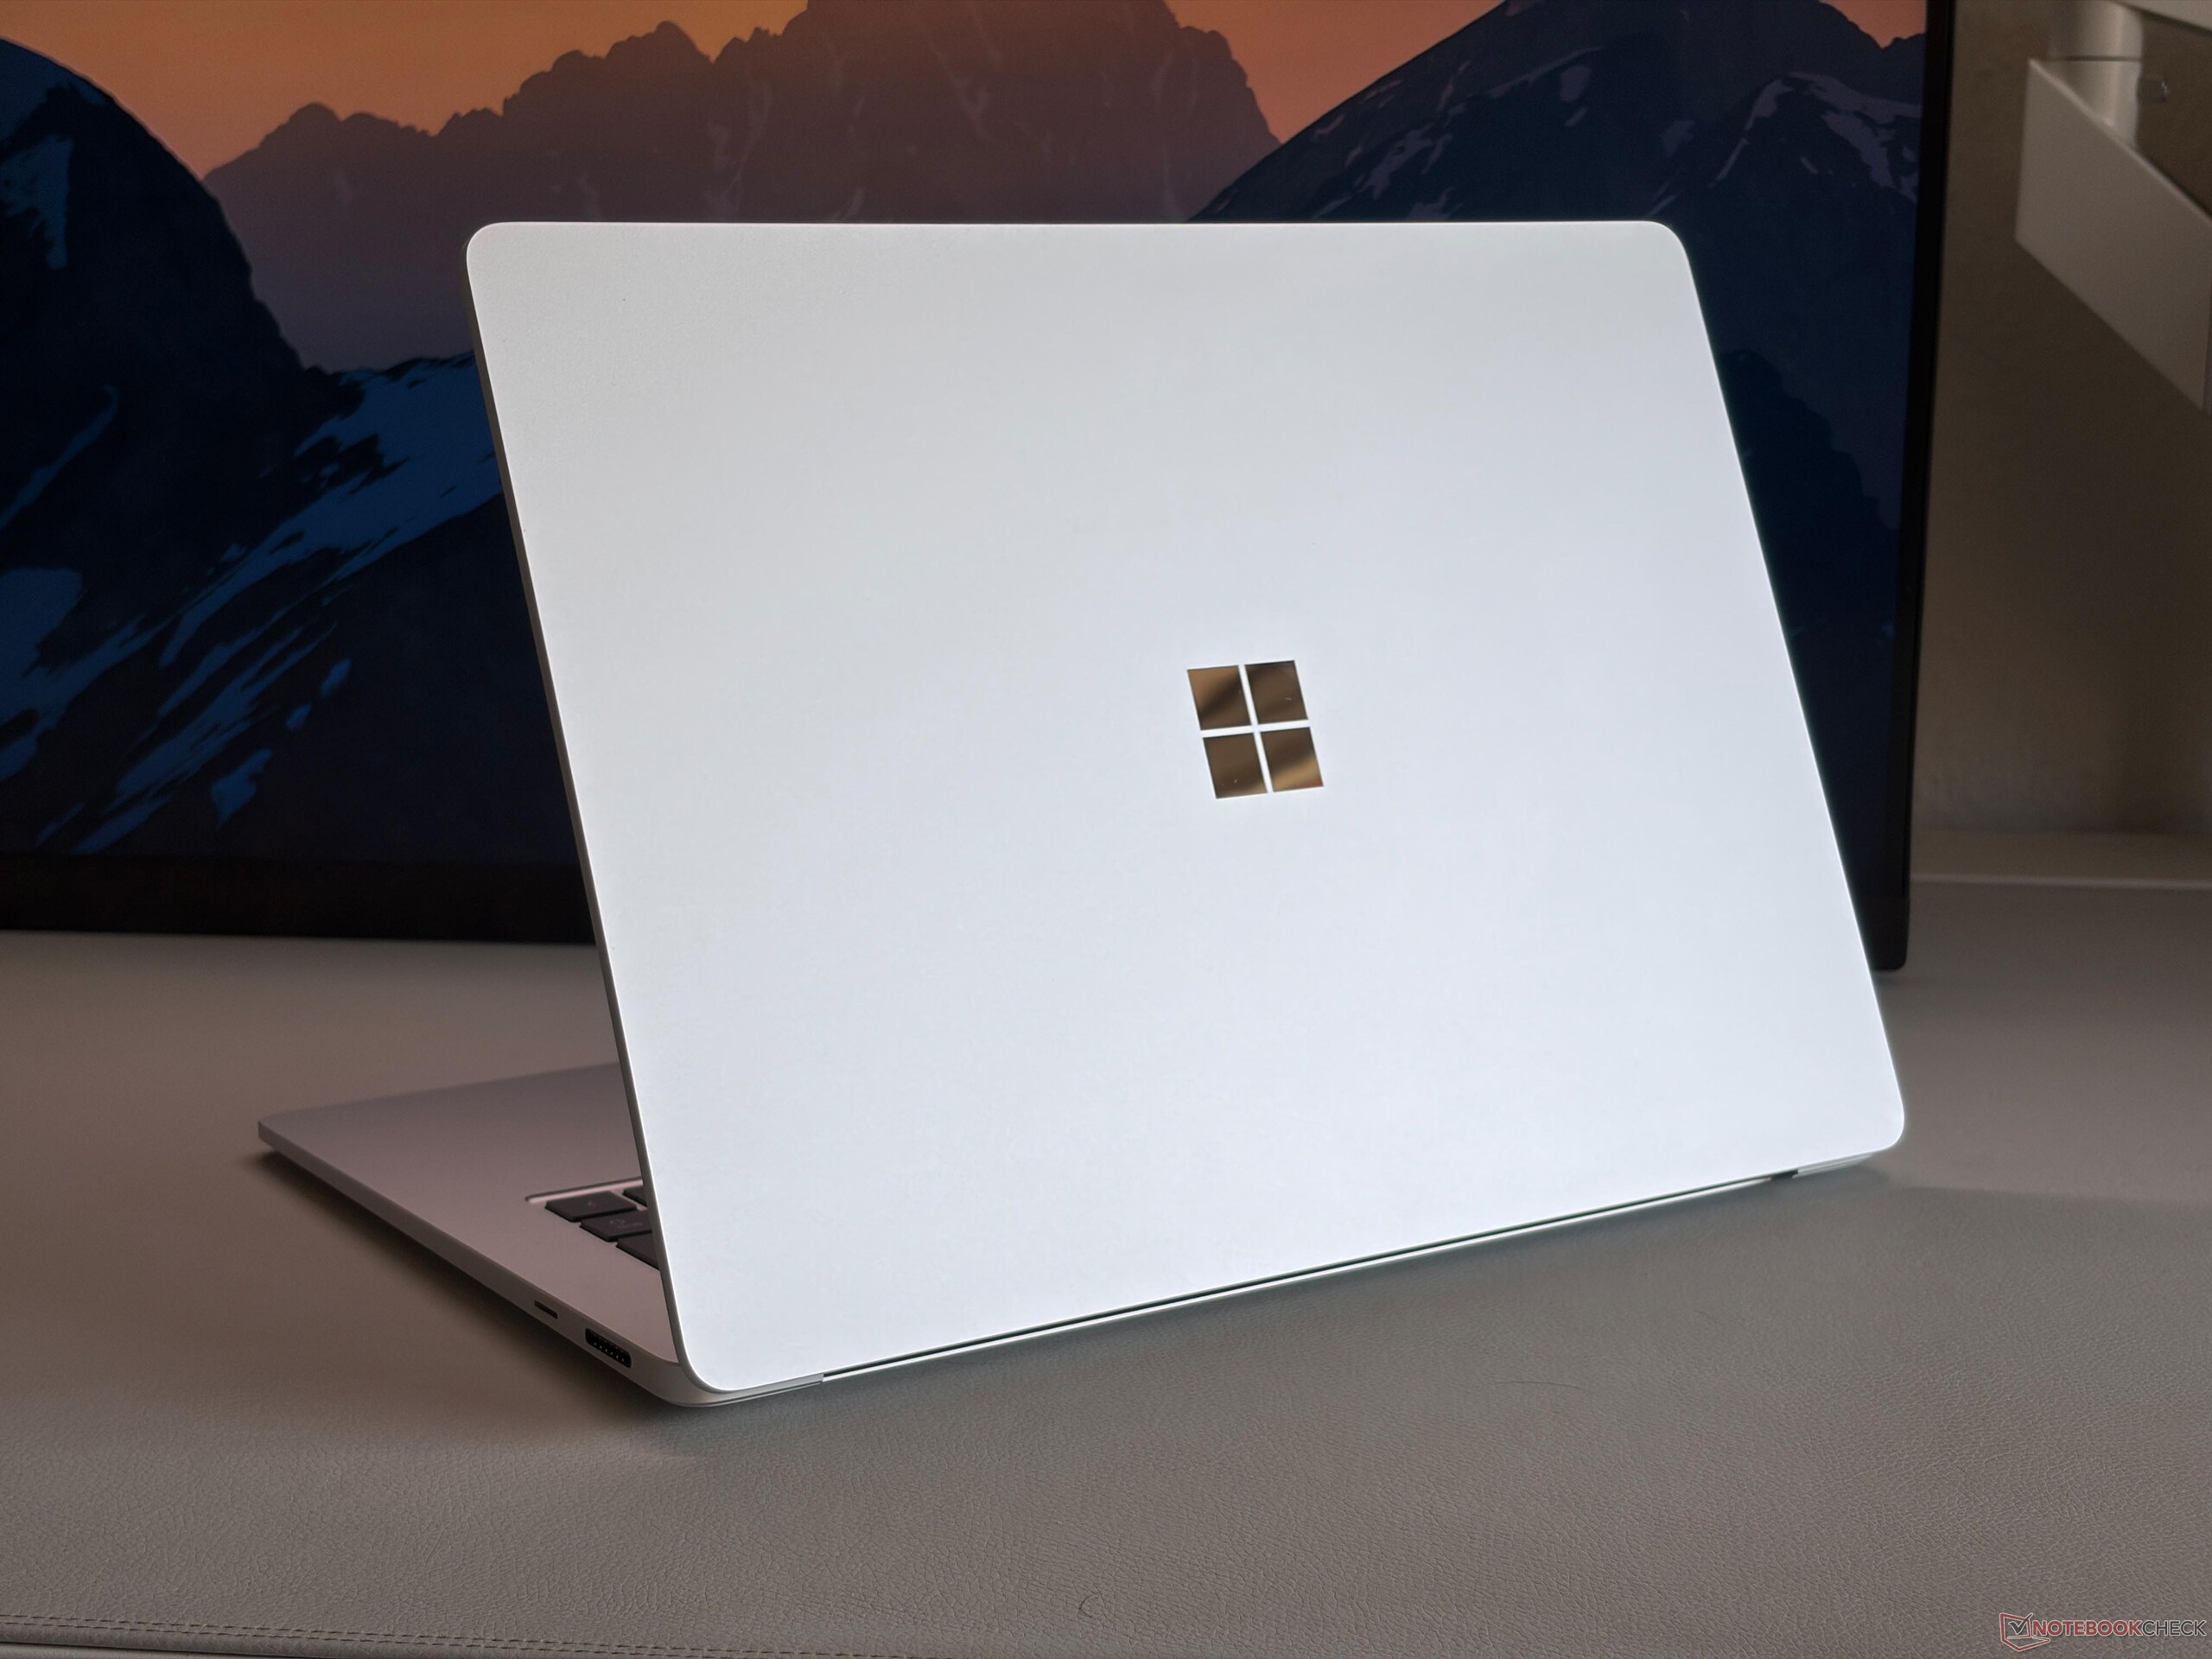
Microsoft did not change the chassis of the Surface Laptop 15, so you still get a premium aluminum chassis with excellent stability and build quality. The typing experience is very comfortable and the haptic trackpad works very well, even though it could be a bit larger. The screen is also very stable, but the hinges could be a bit firmer. Our silver review unit does not show fingerprints. The internals are easy to access and you can replace the M.2-2242 SSD, but you also notice that there is plenty of unused space, which could either be used for additional ports, a regular M.2-2280 SSD or an additional cooling fan.

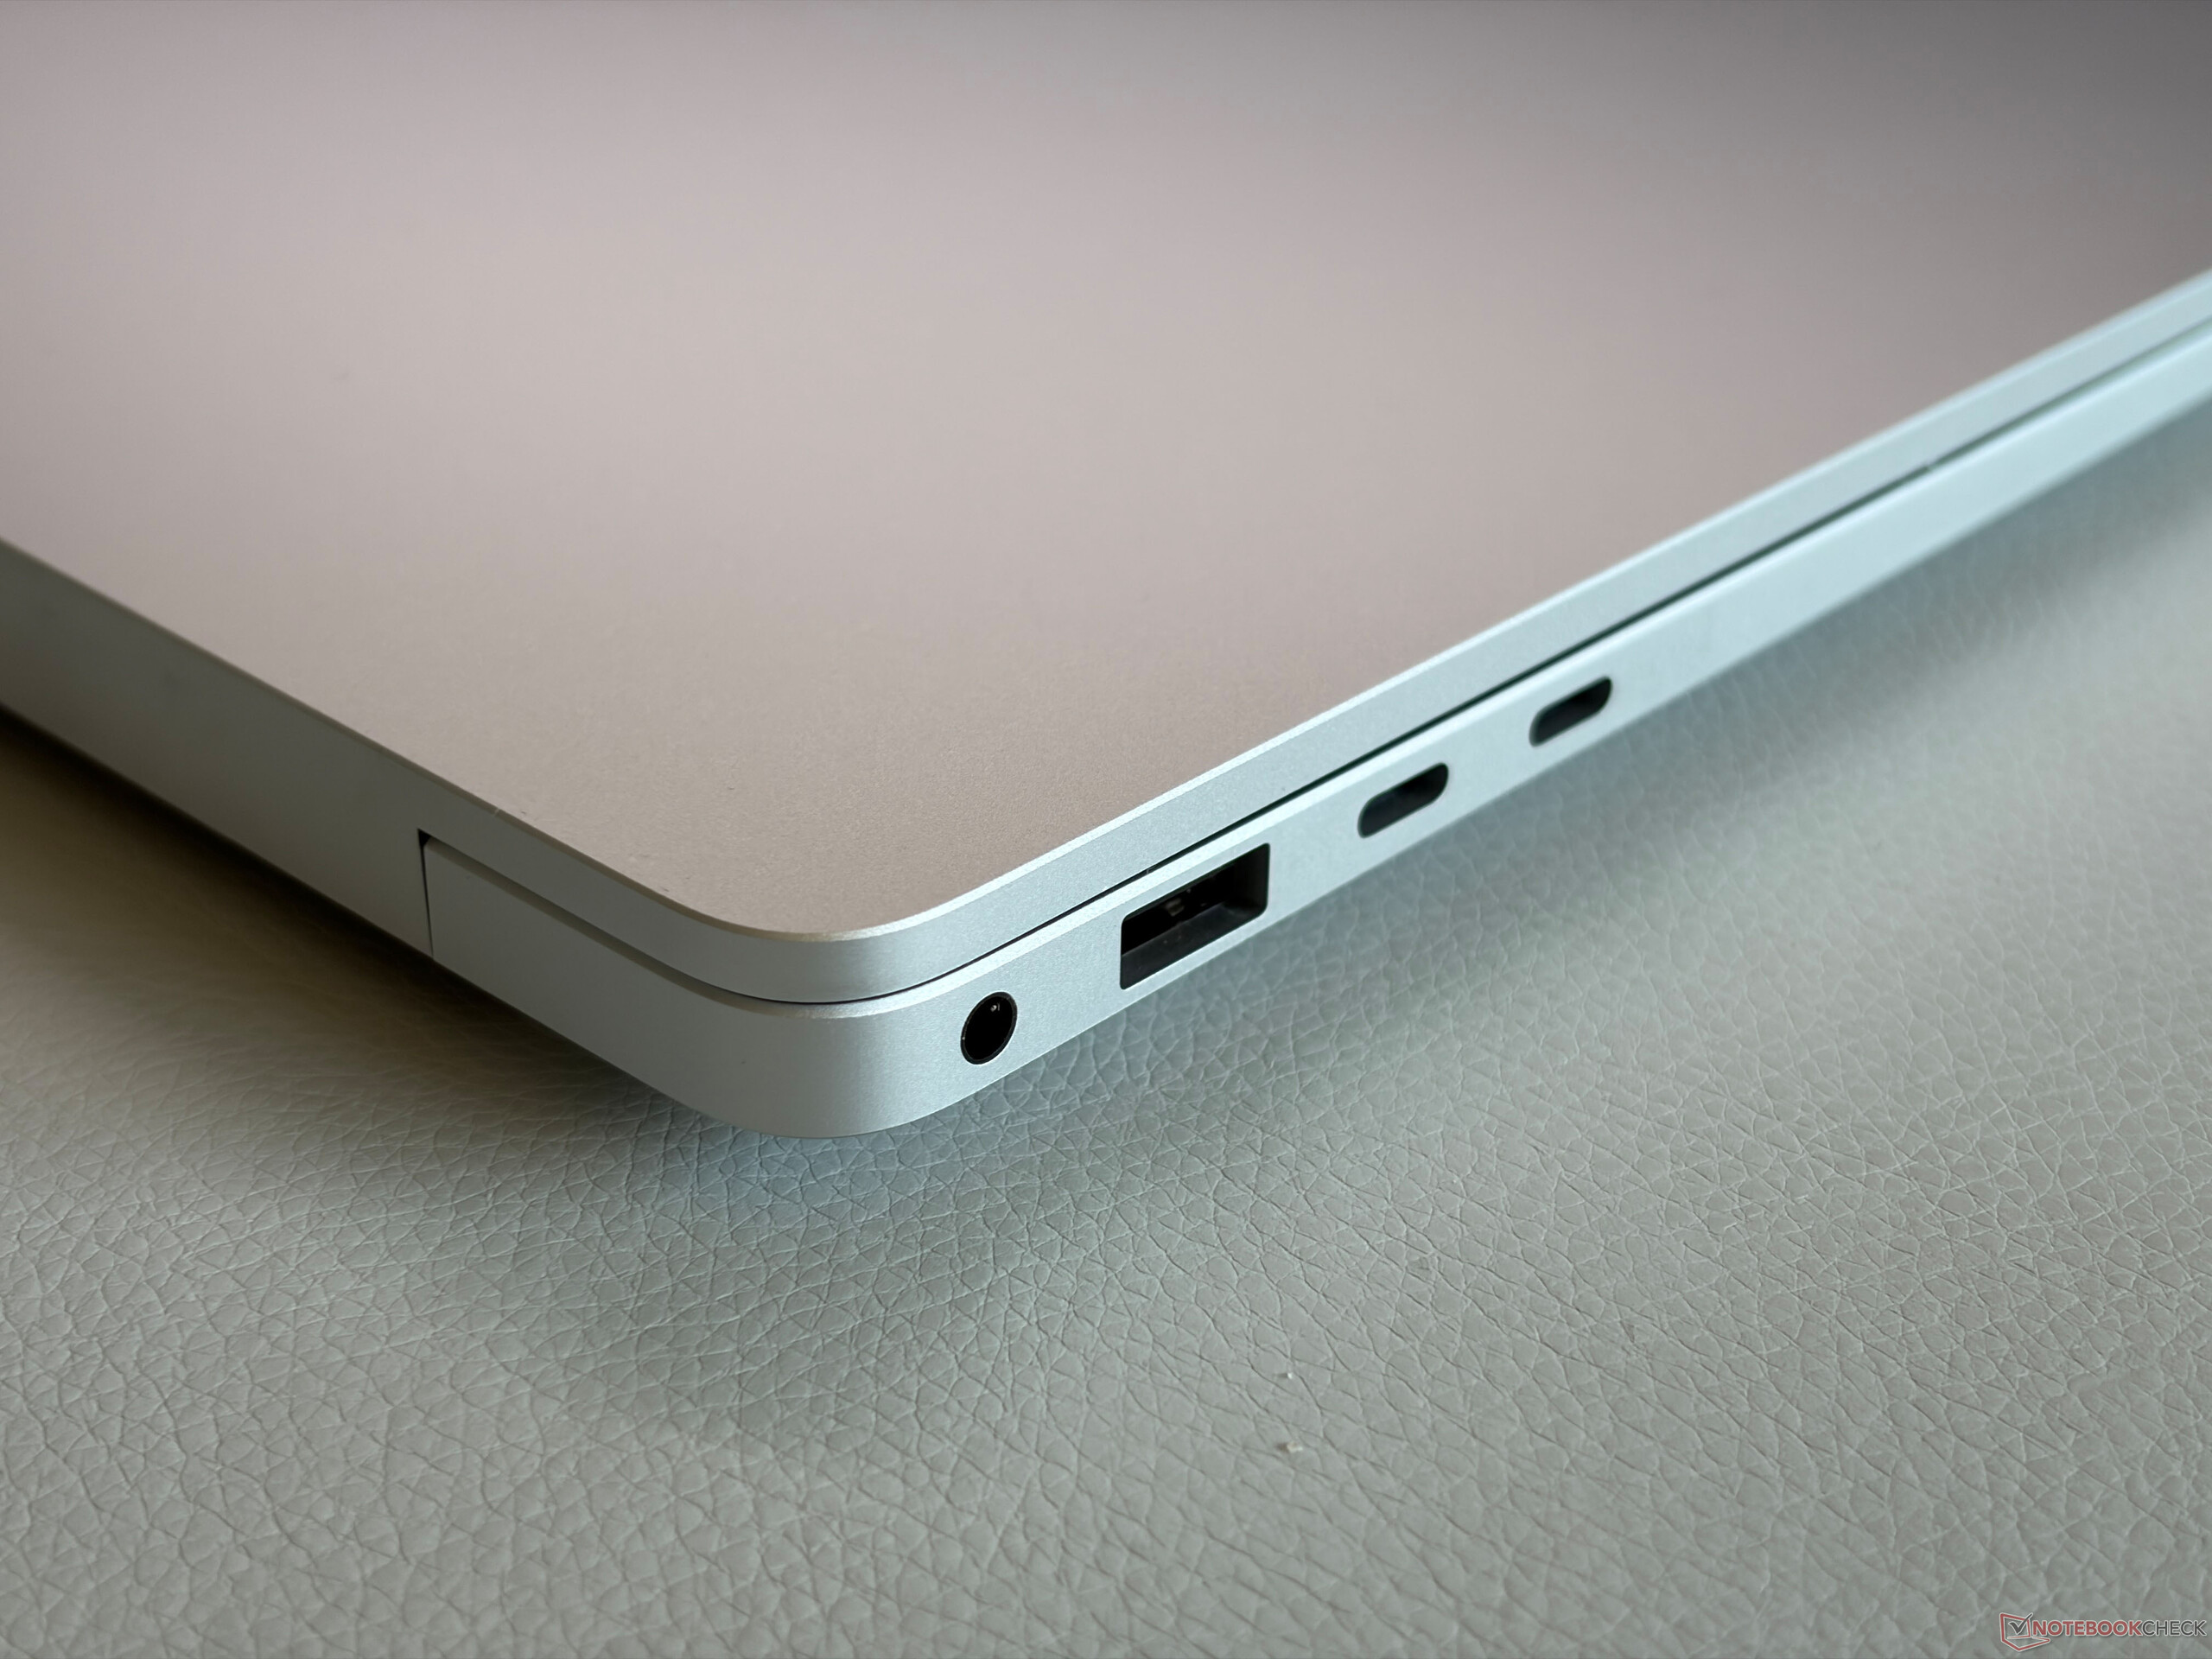
The Intel model offers dual Thunderbolt 4 ports (Snapdragon only USB 4) and can even be equipped with a SmartCard reader. The Surface Connect port on the right side is a bit outdated in our opinion and is also quite large; we would have preferred an additional USB-C port and maybe a regular SD-card reader. The microSD version is still very fast (transfer rates up to 834 MB/s) thanks to SD-Express support and the camera quality is very good. The Wi-Fi 7 module manages stable transfer rates.
Size Comparison

❌
353.5 mm / 13.9 in 242.4 mm / 9.54 in 16.5 mm / 0.65 in 1.2 kg2.67 lbs352.58 mm / 13.9 in 237.47 mm / 9.35 in 14.62 mm / 0.576 in 1.7 kg3.79 lbs339.5 mm / 13.4 in 228.5 mm / 9 in 18 mm / 0.709 in 1.5 kg3.38 lbs340.4 mm / 13.4 in 237.6 mm / 9.35 in 11.5 mm / 0.4528 in 1.5 kg3.33 lbs329 mm / 13 in 239 mm / 9.41 in 18.3 mm / 0.72 in 1.7 kg3.64 lbs329 mm / 13 in 239 mm / 9.41 in 18.3 mm / 0.72 in 1.7 kg3.66 lbs297 mm / 11.7 in 210 mm / 8.27 in 1 mm / 0.03937 in 5.7 g0.01257 lbs
Left: 3.5-mm audio, USB-A 3.2 Gen 1 (5 Gbit/s), 2x USB-C 4.0 with Thunderbolt 4 (40 Gbit/s, DisplayPort ALT Mode 2.1, Power Delivery 3.0)
Right: microSD-Express card reader, Surface Connect port
SD Card Reader
average JPG Copy Test (av. of 3 runs)
Microsoft Surface Laptop 15 Gen 8
Intel Core Ultra X7 368H (SanDisk microSD Express 256 GB)
567 MB/s
Asus Zenbook A16 UX3607
Qualcomm Snapdragon X2 Elite Extreme X2E-94-100 (Angelbird AV Pro V60)
211 MB/s -63%
Average of class Multimedia
  (22.3 - 567, n=34, last 2 years)
140.2 MB/s -75%
Microsoft Surface Laptop 7 15 Lunar Lake
Intel Core Ultra 7 268V (Angelbird AV Pro V60)
86.2 MB/s -85%
Lenovo ThinkPad X9-15p Gen 1
Intel Core Ultra X7 358H
22.3 MB/s -96%
maximum AS SSD Seq Read Test (1GB)
Microsoft Surface Laptop 15 Gen 8
Intel Core Ultra X7 368H (SanDisk microSD Express 256 GB)
833.8 MB/s
Asus Zenbook A16 UX3607
Qualcomm Snapdragon X2 Elite Extreme X2E-94-100 (Angelbird AV Pro V60)
246.4 MB/s -70%
Average of class Multimedia
  (37.3 - 1455, n=33, last 2 years)
218 MB/s -74%
Lenovo ThinkPad X9-15p Gen 1
Intel Core Ultra X7 358H
91.9 MB/s -89%
Microsoft Surface Laptop 7 15 Lunar Lake
Intel Core Ultra 7 268V (Angelbird AV Pro V60)
88.5 MB/s -89%
Networking
Microsoft Surface Laptop 15 Gen 8
Intel BE201 320MHz
iperf3 transmit Wi-Fi6/7 RT-BE96U
2440 (min: 2250) MBit/s ∼67%
iperf3 receive Wi-Fi6/7 RT-BE96U
2038 (min: 1980) MBit/s ∼71%
Lenovo ThinkPad X9-15p Gen 1
Intel Wi-Fi 7 BE211 320MHz
iperf3 transmit Wi-Fi6/7 RT-BE96U
3618 (min: 2749) MBit/s ∼100%
iperf3 receive Wi-Fi6/7 RT-BE96U
2878 (min: 2594) MBit/s ∼100%
Dell XPS 16 Core Ultra X7 358H
Intel Wi-Fi 7 BE211 320MHz
iperf3 receive AXE11000 6GHz
1735 (min: 1715) MBit/s ∼100%
iperf3 transmit AXE11000 6GHz
1619 (min: 1525) MBit/s ∼100%
iperf3 receive AXE11000
852 (min: 701) MBit/s ∼47%
iperf3 transmit AXE11000
875 (min: 459) MBit/s ∼49%
Apple MacBook Air 15 M5
Wi-Fi 7
iperf3 receive AXE11000
1827 (min: 1707) MBit/s ∼100%
iperf3 transmit AXE11000
1794 (min: 1717) MBit/s ∼100%
Microsoft Surface Laptop 7 15 Lunar Lake
Intel BE201 320MHz
iperf3 receive AXE11000
1562 (min: 1469) MBit/s ∼85%
iperf3 transmit AXE11000
1640 (min: 1449) MBit/s ∼91%
01002003004005006007008009001000110012001300140015001600170018001900200021002200230024002500Tooltip
Microsoft Surface Laptop 15 Gen 8; iperf3 transmit Wi-Fi6/7 RT-BE96U; iperf 3.1.3: Ø2440 (2250-2581) MBit/s
Microsoft Surface Laptop 15 Gen 8; iperf3 receive Wi-Fi6/7 RT-BE96U; iperf 3.1.3: Ø2038 (1980-2077) MBit/s
ColorChecker
10.8 ∆E
10.6 ∆E
14.9 ∆E
12.7 ∆E
10.3 ∆E
10.4 ∆E
9.7 ∆E
17.1 ∆E
13.9 ∆E
7.8 ∆E
11.8 ∆E
6.6 ∆E
9.7 ∆E
13.2 ∆E
18.6 ∆E
4.4 ∆E
12.9 ∆E
15.9 ∆E
5 ∆E
4.9 ∆E
8.6 ∆E
9.4 ∆E
4.3 ∆E
4.2 ∆E
ColorChecker Microsoft Surface Laptop 15 Gen 8: 10.32 ∆E min: 4.22 - max: 18.55 ∆E

Display - IPS touchscreen with higher resolution

Subpixel array
Subpixel array
Only minor backlight bleeding

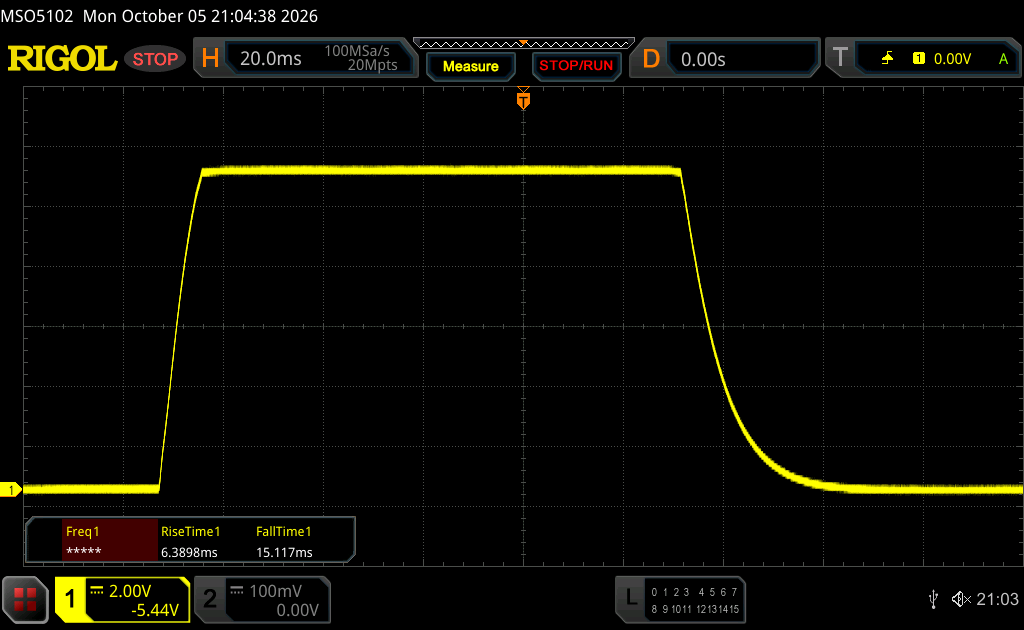
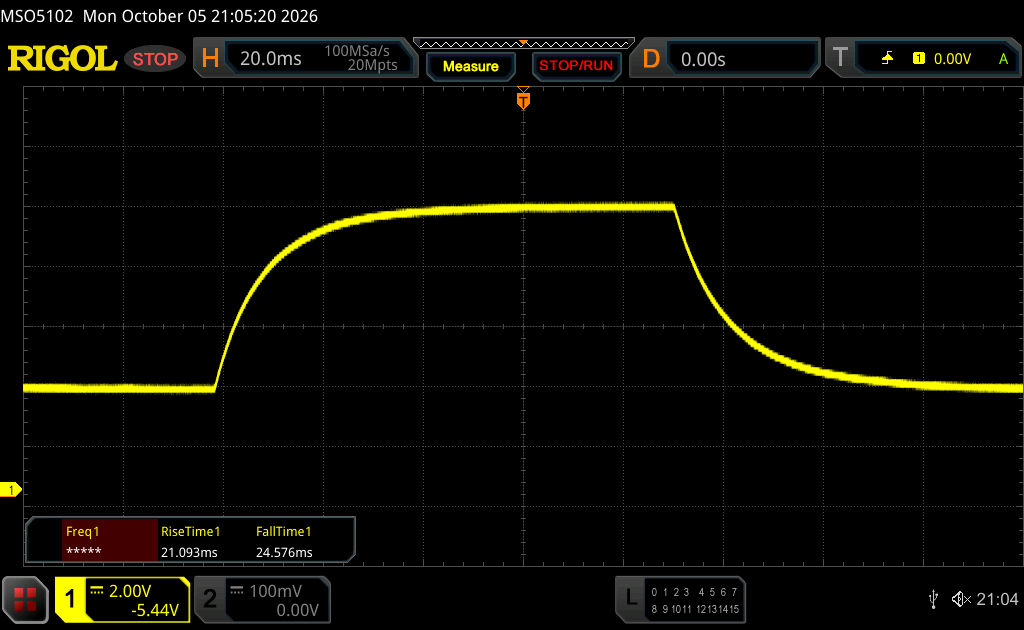
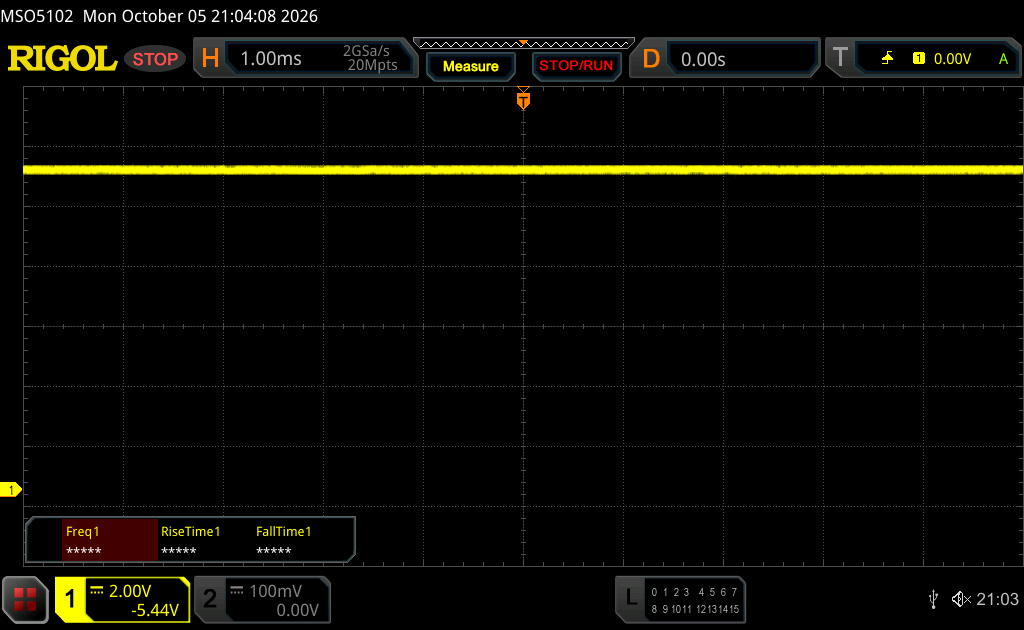
Microsoft has updated the glossy IPS touchscreen. The aspect ratio is still 3:2, but the resolution is higher at 3270 x 2180 pixels. The subjective image impression is very good with crisp images and rich colors, but black levels obviously cannot compete with OLED rivals. The panel supports 120 Hz, but we still notice some ghosting due to slow response times. There is no PWM flickering and we backlight bleeding is no issue, either. The screen is very glossy, which is a real challenge outdoors and in bright environments. Both the brightness and the color can be adjusted automatically.

Our analysis with the professional CalMAN software reveals accurate colors out of the box (accurate profiles for sRGB and P3) and the contrast ratio is better than advertised at ~1800:1, but the maximum brightness is lower compared to last year's model. We measure up to 537 nits and 520 on average. HDR is supported, but the brightness is not increased.

530
cd/m²
516
cd/m²
505
cd/m²
533
cd/m²
537
cd/m²
505
cd/m²
534
cd/m²
525
cd/m²
498
cd/m²
Distribution of brightness
LP150UD2-SPA1 tested with X-Rite i1Pro 3
Maximum: 537 cd/m² (Nits) Average: 520.3 cd/m² Minimum: 1.7 cd/m²
Brightness Distribution: 93 %
Center on Battery: 537 cd/m²
Contrast: 1852:1 (Black: 0.29 cd/m²)
ΔE ColorChecker Calman: 1 | ∀{0.5-29.43 Ø4.69}
ΔE Greyscale Calman: 1.6 | ∀{0.09-98 Ø4.94}
86.3% AdobeRGB 1998 (Argyll 3D)
100% sRGB (Argyll 3D)
97.9% Display P3 (Argyll 3D)
Gamma: 2.2
CCT: 6804 K
Microsoft Surface Laptop 15 Gen 8
LP150UD2-SPA1, IPS, 3270x2180, 15", 120 Hz
Lenovo ThinkPad X9-15p Gen 1
ATNA53JB03-0, OLED, 2880x1800, 15.3", 120 Hz
Asus Zenbook A16 UX3607
ATNA60HR07-0, OLED, 2880x1800, 16", 120 Hz
Dell XPS 16 Core Ultra X7 358H
LG Philips 160WV1, OLED, 3200x2000, 16", 120 Hz
Apple MacBook Air 15 M5
IPS, 2880x1864, 15.3", 60 Hz
Microsoft Surface Laptop 7 15 Lunar Lake
LQ150P1JX61, IPS, 2496x1664, 15", 120 Hz
Display
3%
2%
5%
-1%
0%
HDR Peak Brightness (cd/m²)
518
Display P3 Coverage (%)
97.9
99.1
1%
99.8
2%
99.5
2%
97.5
0%
98.1
0%
sRGB Coverage (%)
100
100
0%
100
0%
100
0%
98.3
-2%
100
0%
AdobeRGB 1998 Coverage (%)
86.3
94.3
9%
89
3%
96.5
12%
86.3
0%
87.2
1%
Response Times
96%
97%
98%
34%
30%
Response Time Grey 50% / Grey 80% * (ms)
45.7
1.1 ?(0.5, 0.6)
98%
2 ?(1, 1)
96%
0.65 ?(0.36, 0.29)
99%
26.9 ?(13.4, 13.5)
41%
33.4 ?(12.5, 20.9)
27%
Response Time Black / White * (ms)
21.5
1.4 ?(0.7, 0.7)
93%
0.48 ?(0.23, 0.25)
98%
0.87 ?(0.43, 0.44)
96%
15.9 ?(4.9, 11)
26%
14.7 ?(5.5, 9.2)
32%
PWM Frequency (Hz)
1194 ?(100)
960 ?(100)
240.2 ?(100)
PWM Amplitude * (%)
35
56
31
Screen
-112%
152%
-95%
-46%
18%
Brightness middle (cd/m²)
537
489
-9%
493
-8%
395.4
-26%
538
0%
599
12%
Brightness (cd/m²)
520
492
-5%
495
-5%
392
-25%
521
0%
590
13%
Brightness Distribution (%)
93
98
5%
98
5%
95
2%
90
-3%
93
0%
Black Level * (cd/m²)
0.29
0.02
93%
0.44
-52%
0.4
-38%
Contrast (:1)
1852
24650
1231%
1223
-34%
1498
-19%
Colorchecker dE 2000 *
1
4.6
-360%
1.1
-10%
3.69
-269%
2.1
-110%
0.5
50%
Colorchecker dE 2000 max. *
2.4
8.2
-242%
3.9
-63%
7.94
-231%
4.1
-71%
0.9
62%
Greyscale dE 2000 *
1.6
2.6
-63%
2.1
-31%
1.9
-19%
3.1
-94%
0.6
63%
Gamma
2.2 100%
2.18 101%
2.15 102%
2.28 96%
2.19 100%
2.16 102%
CCT
6804 96%
6334 103%
6544 99%
6274 104%
7075 92%
6543 99%
Colorchecker dE 2000 calibrated *
5
0.68
0.7
Total Average (Program / Settings)
-4% / -43%
84% / 109%
3% / -33%
-4% / -23%
16% / 16%

* ... smaller is better

CalMAN Grayscale
CalMAN Grayscale
CalMAN Colorchecker
CalMAN Colorchecker
vs. sRGB
vs. sRGB
vs. P3
vs. P3
vs. AdobeRGB
vs. AdobeRGB

Display Response Times

ℹ
Display response times show how fast the screen is able to change from one color to the next. Slow response times can lead to afterimages and can cause moving objects to appear blurry (ghosting). Gamers of fast-paced 3D titles should pay special attention to fast response times.
   ↔    Response Time Black to White
21.5 ms ... rise ↗ and fall ↘ combined↗ ms rise
↘ ms fall
The screen shows good response rates in our tests, but may be too slow for competitive gamers.
In comparison, all tested devices range from 0.1 (minimum) to 240 (maximum) ms. » 48 % of all devices are better.
This means that the measured response time is similar to the average of all tested devices (19.7 ms).
   ↔    Response Time 50% Grey to 80% Grey
45.7 ms ... rise ↗ and fall ↘ combined↗ ms rise
↘ ms fall
The screen shows slow response rates in our tests and will be unsatisfactory for gamers.
In comparison, all tested devices range from 0.13 (minimum) to 636 (maximum) ms. » 79 % of all devices are better.
This means that the measured response time is worse than the average of all tested devices (30.7 ms).

Screen Flickering / PWM (Pulse-Width Modulation)

ℹ
To dim the screen, some notebooks will simply cycle the backlight on and off in rapid succession - a method called Pulse Width Modulation (PWM) . This cycling frequency should ideally be undetectable to the human eye. If said frequency is too low, users with sensitive eyes may experience strain or headaches or even notice the flickering altogether.
Screen flickering / PWM not detected

In comparison: 52 % of all tested devices do not use PWM to dim the display. If PWM was detected, an average of 7611 (minimum: 5 - maximum: 343500) Hz was measured.

In the sun
In the sun
Outdoors (bright day, no direct sunlight)
Viewing angles
Viewing angles

Performance - Intel Core Ultra X7
Testing Conditions

We used Best Performance mode for our benchmarks and measurements.

Processor Performance

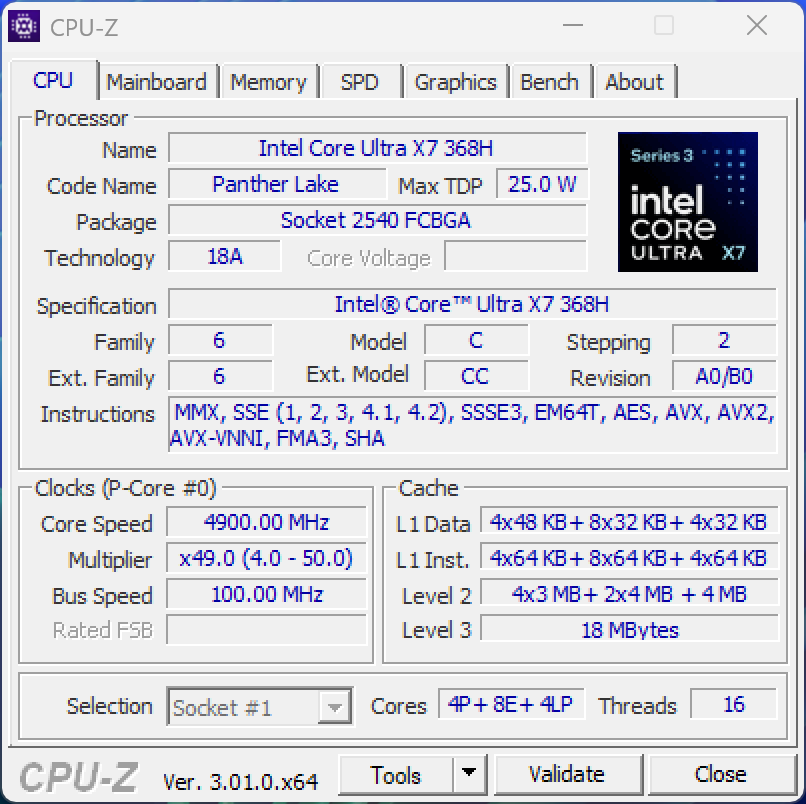
The Intel Core Ultra X7 368H is one of the fastest Panther Lake mobile processors and it can consume 65/35 Watts. This is not great for a 15-inch laptop and the multi-core performance could be a bit better. However, Panther Lake has a bigger focus on efficiency and not raw multi-core performance. The performance is very similar to the Dell XPS 16 with comparable power limits. The Snapdragon model uses Snapdragon X2 Plus or X2 Elite (X2E-78-100) CPUs, which should offer slightly more multi-core CPU performance. 

CPU Performance rating: Percent
Cinebench 2024: CPU Multi Core | CPU Single Core
Geekbench 6.7: Multi-Core | Single-Core
CPU Performance rating
Asus Zenbook A16 UX3607
Qualcomm Snapdragon X2 Elite Extreme X2E-94-100
91.8 pt
Apple MacBook Air 15 M5
Apple M5 10-Core
82 pt
Lenovo ThinkPad X9-15p Gen 1 -2!
Intel Core Ultra X7 358H
70.9 pt
Microsoft Surface Pro 13 OLED
Qualcomm Snapdragon X2 Elite X2E-78-100
67.9 pt
Average of class Multimedia
 
67.1 pt
Microsoft Surface Laptop 15 Gen 8
Intel Core Ultra X7 368H
65.6 pt
Dell XPS 16 Core Ultra X7 358H
Intel Core Ultra X7 358H
65.3 pt
Average Intel Core Ultra X7 368H
 
65 pt
Microsoft Surface Laptop 8 13.8
Qualcomm Snapdragon X2 Plus X2P-64-100
63.8 pt
Microsoft Surface Laptop 7 15 Lunar Lake
Intel Core Ultra 7 268V
53.3 pt
Cinebench 2024 / CPU Multi Core
Asus Zenbook A16 UX3607
Qualcomm Snapdragon X2 Elite Extreme X2E-94-100
1761 Points +83%
Average of class Multimedia
  (327 - 2490, n=61, last 2 years)
1120 Points +17%
Microsoft Surface Pro 13 OLED
Qualcomm Snapdragon X2 Elite X2E-78-100
1078 Points +12%
Average Intel Core Ultra X7 368H
  (960 - 1104, n=2)
1032 Points +8%
Dell XPS 16 Core Ultra X7 358H
Intel Core Ultra X7 358H
1004 Points +5%
Apple MacBook Air 15 M5
Apple M5 10-Core
962 Points 0%
Microsoft Surface Laptop 15 Gen 8
Intel Core Ultra X7 368H
960 Points
Microsoft Surface Laptop 8 13.8
Qualcomm Snapdragon X2 Plus X2P-64-100
854 Points -11%
Microsoft Surface Laptop 7 15 Lunar Lake
Intel Core Ultra 7 268V
600 Points -37%
Cinebench 2024 / CPU Single Core
Apple MacBook Air 15 M5
Apple M5 10-Core
199 Points +57%
Asus Zenbook A16 UX3607
Qualcomm Snapdragon X2 Elite Extreme X2E-94-100
151 Points +19%
Microsoft Surface Laptop 8 13.8
Qualcomm Snapdragon X2 Plus X2P-64-100
134 Points +5%
Microsoft Surface Pro 13 OLED
Qualcomm Snapdragon X2 Elite X2E-78-100
133 Points +5%
Average of class Multimedia
  (72.5 - 201, n=55, last 2 years)
130.6 Points +3%
Average Intel Core Ultra X7 368H
  (127.1 - 128.8, n=2)
128 Points +1%
Microsoft Surface Laptop 15 Gen 8
Intel Core Ultra X7 368H
127.1 Points
Dell XPS 16 Core Ultra X7 358H
Intel Core Ultra X7 358H
123.7 Points -3%
Microsoft Surface Laptop 7 15 Lunar Lake
Intel Core Ultra 7 268V
123.3 Points -3%
Geekbench 6.7 / Multi-Core
Asus Zenbook A16 UX3607
Qualcomm Snapdragon X2 Elite Extreme X2E-94-100
23204 Points +37%
Apple MacBook Air 15 M5
Apple M5 10-Core
16995 Points 0%
Dell XPS 16 Core Ultra X7 358H
Intel Core Ultra X7 358H
16943 Points 0%
Microsoft Surface Laptop 15 Gen 8
Intel Core Ultra X7 368H
16943 Points
Lenovo ThinkPad X9-15p Gen 1
Intel Core Ultra X7 358H
16876 Points 0%
Average of class Multimedia
  (4983 - 30057, n=61, last 2 years)
15748 Points -7%
Average Intel Core Ultra X7 368H
  (12050 - 17352, n=4)
15438 Points -9%
Microsoft Surface Pro 13 OLED
Qualcomm Snapdragon X2 Elite X2E-78-100
15102 Points -11%
Microsoft Surface Laptop 8 13.8
Qualcomm Snapdragon X2 Plus X2P-64-100
14277 Points -16%
Microsoft Surface Laptop 7 15 Lunar Lake
Intel Core Ultra 7 268V
11279 Points -33%
Geekbench 6.7 / Single-Core
Apple MacBook Air 15 M5
Apple M5 10-Core
4195 Points +41%
Asus Zenbook A16 UX3607
Qualcomm Snapdragon X2 Elite Extreme X2E-94-100
3826 Points +28%
Microsoft Surface Pro 13 OLED
Qualcomm Snapdragon X2 Elite X2E-78-100
3287 Points +10%
Microsoft Surface Laptop 8 13.8
Qualcomm Snapdragon X2 Plus X2P-64-100
3265 Points +10%
Average of class Multimedia
  (1591 - 4336, n=61, last 2 years)
2990 Points 0%
Microsoft Surface Laptop 15 Gen 8
Intel Core Ultra X7 368H
2980 Points
Average Intel Core Ultra X7 368H
  (2924 - 2983, n=3)
2962 Points -1%
Dell XPS 16 Core Ultra X7 358H
Intel Core Ultra X7 358H
2903 Points -3%
Lenovo ThinkPad X9-15p Gen 1
Intel Core Ultra X7 358H
2901 Points -3%
Microsoft Surface Laptop 7 15 Lunar Lake
Intel Core Ultra 7 268V
2871 Points -4%

Cinebench R15 Multi Loop

075150225300375450525600675750825900975105011251200127513501425150015751650172518001875195020252100217522502325240024752550262527002775285029253000307531503225330033753450352536003675Tooltip
Microsoft Surface Laptop 15 Gen 8 Intel Core Ultra X7 368H: Ø2462 (2121.79-3156.32) Points
Lenovo ThinkPad X9-15p Gen 1 Intel Core Ultra X7 358H: Ø2913 (2846.57-3015.45) Points
Asus Zenbook A16 UX3607 Qualcomm Snapdragon X2 Elite Extreme X2E-94-100: Ø3638 (3524.54-3682.9) Points
Dell XPS 16 Core Ultra X7 358H Intel Core Ultra X7 358H: Ø2543 (2491.75-2985.52) Points
Microsoft Surface Laptop 7 15 Lunar Lake Intel Core Ultra 7 268V: Ø1469 (1435.9-1615.7) Points
CPU Performance rating: Percent
Cinebench R23: Multi Core | Single Core
Cinebench R20: CPU (Multi Core) | CPU (Single Core)
Cinebench R15: CPU Multi 64Bit | CPU Single 64Bit
Blender: v2.79 BMW27 CPU
7-Zip 18.03: 7z b 4 | 7z b 4 -mmt1
HWBOT x265 Benchmark v2.2: 4k Preset
LibreOffice : 20 Documents To PDF
R Benchmark 2.5: Overall mean
CPU Performance rating
Lenovo ThinkPad X9-15p Gen 1
Intel Core Ultra X7 358H
77.9 pt
Average Intel Core Ultra X7 368H
 
76.2 pt
Microsoft Surface Laptop 15 Gen 8
Intel Core Ultra X7 368H
75.8 pt
Dell XPS 16 Core Ultra X7 358H
Intel Core Ultra X7 358H
75.2 pt
Average of class Multimedia
 
69.1 pt
Asus Zenbook A16 UX3607 -1!
Qualcomm Snapdragon X2 Elite Extreme X2E-94-100
68.9 pt
Microsoft Surface Laptop 7 15 Lunar Lake
Intel Core Ultra 7 268V
53.1 pt
Cinebench R23 / Multi Core
Lenovo ThinkPad X9-15p Gen 1
Intel Core Ultra X7 358H
19360 Points +14%
Asus Zenbook A16 UX3607
Qualcomm Snapdragon X2 Elite Extreme X2E-94-100
19037 Points +12%
Dell XPS 16 Core Ultra X7 358H
Intel Core Ultra X7 358H
17884 (15984.6min - 17883.7max) Points +5%
Average Intel Core Ultra X7 368H
  (17052 - 17350, n=2)
17201 Points +1%
Microsoft Surface Laptop 15 Gen 8
Intel Core Ultra X7 368H
17052 Points
Average of class Multimedia
  (4861 - 33362, n=60, last 2 years)
17050 Points 0%
Microsoft Surface Laptop 7 15 Lunar Lake
Intel Core Ultra 7 268V
10535 Points -38%
Cinebench R23 / Single Core
Average Intel Core Ultra X7 368H
  (2140 - 2169, n=2)
2155 Points +1%
Microsoft Surface Laptop 15 Gen 8
Intel Core Ultra X7 368H
2140 Points
Dell XPS 16 Core Ultra X7 358H
Intel Core Ultra X7 358H
2087 Points -2%
Lenovo ThinkPad X9-15p Gen 1
Intel Core Ultra X7 358H
2080 Points -3%
Average of class Multimedia
  (1237 - 2459, n=59, last 2 years)
1982 Points -7%
Microsoft Surface Laptop 7 15 Lunar Lake
Intel Core Ultra 7 268V
1910 Points -11%
Asus Zenbook A16 UX3607
Qualcomm Snapdragon X2 Elite Extreme X2E-94-100
1622 Points -24%
Cinebench R20 / CPU (Multi Core)
Lenovo ThinkPad X9-15p Gen 1
Intel Core Ultra X7 358H
7531 Points +13%
Average Intel Core Ultra X7 368H
  (6681 - 7938, n=2)
7310 Points +9%
Asus Zenbook A16 UX3607
Qualcomm Snapdragon X2 Elite Extreme X2E-94-100
7298 Points +9%
Dell XPS 16 Core Ultra X7 358H
Intel Core Ultra X7 358H
7195 Points +8%
Microsoft Surface Laptop 15 Gen 8
Intel Core Ultra X7 368H
6681 Points
Average of class Multimedia
  (1887 - 12912, n=51, last 2 years)
6585 Points -1%
Microsoft Surface Laptop 7 15 Lunar Lake
Intel Core Ultra 7 268V
4129 Points -38%
Cinebench R20 / CPU (Single Core)
Average Intel Core Ultra X7 368H
  (809 - 820, n=2)
815 Points +1%
Microsoft Surface Laptop 15 Gen 8
Intel Core Ultra X7 368H
809 Points
Lenovo ThinkPad X9-15p Gen 1
Intel Core Ultra X7 358H
785 Points -3%
Dell XPS 16 Core Ultra X7 358H
Intel Core Ultra X7 358H
780 Points -4%
Average of class Multimedia
  (482 - 833, n=51, last 2 years)
744 Points -8%
Microsoft Surface Laptop 7 15 Lunar Lake
Intel Core Ultra 7 268V
736 Points -9%
Asus Zenbook A16 UX3607
Qualcomm Snapdragon X2 Elite Extreme X2E-94-100
620 Points -23%
Cinebench R15 / CPU Multi 64Bit
Asus Zenbook A16 UX3607
Qualcomm Snapdragon X2 Elite Extreme X2E-94-100
3683 (3524.54min - 3682.9max) Points +17%
Microsoft Surface Laptop 15 Gen 8
Intel Core Ultra X7 368H
3156 (2121.79min - 3156.32max) Points
Average Intel Core Ultra X7 368H
  (2976 - 3156, n=2)
3066 Points -3%
Lenovo ThinkPad X9-15p Gen 1
Intel Core Ultra X7 358H
3015 (2846.57min - 3015.45max) Points -4%
Dell XPS 16 Core Ultra X7 358H
Intel Core Ultra X7 358H
2986 (2491.75min - 2985.52max) Points -5%
Average of class Multimedia
  (856 - 5224, n=56, last 2 years)
2713 Points -14%
Microsoft Surface Laptop 7 15 Lunar Lake
Intel Core Ultra 7 268V
1616 (1435.9min - 1615.7max) Points -49%
Cinebench R15 / CPU Single 64Bit
Average Intel Core Ultra X7 368H
  (308 - 323, n=2)
316 Points +3%
Microsoft Surface Laptop 15 Gen 8
Intel Core Ultra X7 368H
308 Points
Dell XPS 16 Core Ultra X7 358H
Intel Core Ultra X7 358H
304 Points -1%
Asus Zenbook A16 UX3607
Qualcomm Snapdragon X2 Elite Extreme X2E-94-100
303 Points -2%
Lenovo ThinkPad X9-15p Gen 1
Intel Core Ultra X7 358H
299 Points -3%
Microsoft Surface Laptop 7 15 Lunar Lake
Intel Core Ultra 7 268V
287 Points -7%
Average of class Multimedia
  (184.8 - 326, n=53, last 2 years)
285 Points -7%
Blender / v2.79 BMW27 CPU
Microsoft Surface Laptop 7 15 Lunar Lake
Intel Core Ultra 7 268V
337 Seconds * -66%
Average of class Multimedia
  (100 - 557, n=52, last 2 years)
239 Seconds * -18%
Microsoft Surface Laptop 15 Gen 8
Intel Core Ultra X7 368H
203 Seconds *
Dell XPS 16 Core Ultra X7 358H
Intel Core Ultra X7 358H
196 Seconds * +3%
Average Intel Core Ultra X7 368H
  (179 - 203, n=2)
191 Seconds * +6%
Lenovo ThinkPad X9-15p Gen 1
Intel Core Ultra X7 358H
175 Seconds * +14%
Asus Zenbook A16 UX3607
Qualcomm Snapdragon X2 Elite Extreme X2E-94-100
172 Seconds * +15%
7-Zip 18.03 / 7z b 4
Lenovo ThinkPad X9-15p Gen 1
Intel Core Ultra X7 358H
68930 MIPS +11%
Dell XPS 16 Core Ultra X7 358H
Intel Core Ultra X7 358H
64852 MIPS +4%
Average Intel Core Ultra X7 368H
  (62173 - 63679, n=2)
62926 MIPS +1%
Microsoft Surface Laptop 15 Gen 8
Intel Core Ultra X7 368H
62173 MIPS
Average of class Multimedia
  (26062 - 130368, n=49, last 2 years)
58487 MIPS -6%
Microsoft Surface Laptop 7 15 Lunar Lake
Intel Core Ultra 7 268V
35687 MIPS -43%
7-Zip 18.03 / 7z b 4 -mmt1
Microsoft Surface Laptop 15 Gen 8
Intel Core Ultra X7 368H
6637 MIPS
Average Intel Core Ultra X7 368H
  (6434 - 6637, n=2)
6536 MIPS -2%
Lenovo ThinkPad X9-15p Gen 1
Intel Core Ultra X7 358H
6449 MIPS -3%
Dell XPS 16 Core Ultra X7 358H
Intel Core Ultra X7 358H
6441 MIPS -3%
Asus Zenbook A16 UX3607
Qualcomm Snapdragon X2 Elite Extreme X2E-94-100
6247 MIPS -6%
Microsoft Surface Laptop 7 15 Lunar Lake
Intel Core Ultra 7 268V
6021 MIPS -9%
Average of class Multimedia
  (4526 - 7337, n=50, last 2 years)
5944 MIPS -10%
HWBOT x265 Benchmark v2.2 / 4k Preset
Lenovo ThinkPad X9-15p Gen 1
Intel Core Ultra X7 358H
22.1 fps +18%
Dell XPS 16 Core Ultra X7 358H
Intel Core Ultra X7 358H
21 fps +12%
Average of class Multimedia
  (6.08 - 36.1, n=50, last 2 years)
19.3 fps +3%
Microsoft Surface Laptop 15 Gen 8
Intel Core Ultra X7 368H
18.7 fps
Average Intel Core Ultra X7 368H
  (14.1 - 18.7, n=2)
16.4 fps -12%
Asus Zenbook A16 UX3607
Qualcomm Snapdragon X2 Elite Extreme X2E-94-100
13.6 fps -27%
Microsoft Surface Laptop 7 15 Lunar Lake
Intel Core Ultra 7 268V
12.9 fps -31%
LibreOffice / 20 Documents To PDF
Dell XPS 16 Core Ultra X7 358H
Intel Core Ultra X7 358H
49.5 s * -22%
Microsoft Surface Laptop 7 15 Lunar Lake
Intel Core Ultra 7 268V
48 s * -19%
Average of class Multimedia
  (23.9 - 72.5, n=51, last 2 years)
47.9 s * -18%
Lenovo ThinkPad X9-15p Gen 1
Intel Core Ultra X7 358H
47.6 s * -18%
Asus Zenbook A16 UX3607
Qualcomm Snapdragon X2 Elite Extreme X2E-94-100
44.2 s * -9%
Microsoft Surface Laptop 15 Gen 8
Intel Core Ultra X7 368H
40.5 s *
Average Intel Core Ultra X7 368H
  (39.1 - 40.5, n=2)
39.8 s * +2%
R Benchmark 2.5 / Overall mean
Asus Zenbook A16 UX3607
Qualcomm Snapdragon X2 Elite Extreme X2E-94-100
0.507 sec * -22%
Microsoft Surface Laptop 7 15 Lunar Lake
Intel Core Ultra 7 268V
0.4565 sec * -10%
Average of class Multimedia
  (0.3903 - 0.609, n=50, last 2 years)
0.4464 sec * -8%
Lenovo ThinkPad X9-15p Gen 1
Intel Core Ultra X7 358H
0.4236 sec * -2%
Dell XPS 16 Core Ultra X7 358H
Intel Core Ultra X7 358H
0.4216 sec * -2%
Microsoft Surface Laptop 15 Gen 8
Intel Core Ultra X7 368H
0.4144 sec *
Average Intel Core Ultra X7 368H
  (0.4137 - 0.4144, n=2)
0.4141 sec * -0%

* ... smaller is better

Cinebench R15 CPU Multi 64Bit
3156 Points
Cinebench R15 OpenGL 64Bit
253 fps
Cinebench R15 Ref. Match 64Bit
97.8 %
Cinebench R15 CPU Single 64Bit
308 Points
Cinebench R20 CPU (Multi Core)
6681 Points
Cinebench R20 CPU (Single Core)
809 Points
Cinebench R23 Single Core
2140 Points
Cinebench R23 Multi Core
17052 Points
Cinebench 2024 CPU Single Core
127.1 Points
Cinebench 2024 CPU Multi Core
960 Points
Help
Performance rating
Lenovo ThinkPad X9-15p Gen 1 -1!
Intel Core Ultra X7 358H, Arc B390 Panther Lake iGPU
91.4 pt
Average Intel Core Ultra X7 368H -1!
 
84.2 pt
Average of class Multimedia
 
83.6 pt
Dell XPS 16 Core Ultra X7 358H -1!
Intel Core Ultra X7 358H, Arc B390 Panther Lake iGPU
82.6 pt
Microsoft Surface Laptop 15 Gen 8 -1!
Intel Core Ultra X7 368H, Arc B390 Panther Lake iGPU
79.2 pt
Asus Zenbook A16 UX3607 -1!
Qualcomm Snapdragon X2 Elite Extreme X2E-94-100, X2-90
70 pt
Microsoft Surface Laptop 7 15 Lunar Lake -1!
Intel Core Ultra 7 268V, Arc 140V
55 pt
AIDA64 / FP32 Ray-Trace
Lenovo ThinkPad X9-15p Gen 1
Intel Core Ultra X7 358H, Arc B390 Panther Lake iGPU (v8.20.8100)
18710 KRay/s +21%
Average of class Multimedia
  (2214 - 50388, n=48, last 2 years)
18202 KRay/s +18%
Average Intel Core Ultra X7 368H
  (15419 - 17245, n=2)
16332 KRay/s +6%
Dell XPS 16 Core Ultra X7 358H
Intel Core Ultra X7 358H, Arc B390 Panther Lake iGPU (v8.20.8100)
15681 KRay/s +2%
Microsoft Surface Laptop 15 Gen 8
Intel Core Ultra X7 368H, Arc B390 Panther Lake iGPU (v8.20.8100)
15419 KRay/s
Asus Zenbook A16 UX3607
Qualcomm Snapdragon X2 Elite Extreme X2E-94-100, X2-90 (v8.20.8100)
12578 KRay/s -18%
Microsoft Surface Laptop 7 15 Lunar Lake
Intel Core Ultra 7 268V, Arc 140V (v6.92.6600)
11547 KRay/s -25%
AIDA64 / FPU Julia
Lenovo ThinkPad X9-15p Gen 1
Intel Core Ultra X7 358H, Arc B390 Panther Lake iGPU (v8.20.8100)
96559 Points +15%
Average Intel Core Ultra X7 368H
  (84167 - 90689, n=2)
87428 Points +4%
Average of class Multimedia
  (12867 - 201874, n=48, last 2 years)
85899 Points +2%
Microsoft Surface Laptop 15 Gen 8
Intel Core Ultra X7 368H, Arc B390 Panther Lake iGPU (v8.20.8100)
84167 Points
Dell XPS 16 Core Ultra X7 358H
Intel Core Ultra X7 358H, Arc B390 Panther Lake iGPU (v8.20.8100)
83114 Points -1%
Microsoft Surface Laptop 7 15 Lunar Lake
Intel Core Ultra 7 268V, Arc 140V (v6.92.6600)
56299 Points -33%
Asus Zenbook A16 UX3607
Qualcomm Snapdragon X2 Elite Extreme X2E-94-100, X2-90 (v8.20.8100)
49008 Points -42%
AIDA64 / CPU SHA3
Asus Zenbook A16 UX3607
Qualcomm Snapdragon X2 Elite Extreme X2E-94-100, X2-90 (v8.20.8100)
5433 MB/s +34%
Lenovo ThinkPad X9-15p Gen 1
Intel Core Ultra X7 358H, Arc B390 Panther Lake iGPU (v8.20.8100)
4955 MB/s +22%
Average Intel Core Ultra X7 368H
  (4052 - 4537, n=2)
4295 MB/s +6%
Dell XPS 16 Core Ultra X7 358H
Intel Core Ultra X7 358H, Arc B390 Panther Lake iGPU (v8.20.8100)
4200 MB/s +4%
Microsoft Surface Laptop 15 Gen 8
Intel Core Ultra X7 368H, Arc B390 Panther Lake iGPU (v8.20.8100)
4052 MB/s
Average of class Multimedia
  (626 - 8623, n=48, last 2 years)
3988 MB/s -2%
Microsoft Surface Laptop 7 15 Lunar Lake
Intel Core Ultra 7 268V, Arc 140V (v6.92.6600)
2538 MB/s -37%
AIDA64 / CPU Queen
Average of class Multimedia
  (13483 - 181505, n=31, last 2 years)
70972 Points
Microsoft Surface Laptop 7 15 Lunar Lake
Intel Core Ultra 7 268V, Arc 140V (v6.92.6600)
49645 Points
AIDA64 / FPU SinJulia
Average of class Multimedia
  (886 - 28794, n=48, last 2 years)
8498 Points +26%
Average Intel Core Ultra X7 368H
  (6765 - 7511, n=2)
7138 Points +6%
Lenovo ThinkPad X9-15p Gen 1
Intel Core Ultra X7 358H, Arc B390 Panther Lake iGPU (v8.20.8100)
7033 Points +4%
Dell XPS 16 Core Ultra X7 358H
Intel Core Ultra X7 358H, Arc B390 Panther Lake iGPU (v8.20.8100)
6892 Points +2%
Microsoft Surface Laptop 15 Gen 8
Intel Core Ultra X7 368H, Arc B390 Panther Lake iGPU (v8.20.8100)
6765 Points
Microsoft Surface Laptop 7 15 Lunar Lake
Intel Core Ultra 7 268V, Arc 140V (v6.92.6600)
4426 Points -35%
Asus Zenbook A16 UX3607
Qualcomm Snapdragon X2 Elite Extreme X2E-94-100, X2-90 (v8.20.8100)
4199 Points -38%
AIDA64 / FPU Mandel
Lenovo ThinkPad X9-15p Gen 1
Intel Core Ultra X7 358H, Arc B390 Panther Lake iGPU (v8.20.8100)
50766 Points +13%
Average Intel Core Ultra X7 368H
  (44784 - 48562, n=2)
46673 Points +4%
Average of class Multimedia
  (6395 - 105740, n=48, last 2 years)
45242 Points +1%
Microsoft Surface Laptop 15 Gen 8
Intel Core Ultra X7 368H, Arc B390 Panther Lake iGPU (v8.20.8100)
44784 Points
Dell XPS 16 Core Ultra X7 358H
Intel Core Ultra X7 358H, Arc B390 Panther Lake iGPU (v8.20.8100)
44733 Points 0%
Microsoft Surface Laptop 7 15 Lunar Lake
Intel Core Ultra 7 268V, Arc 140V (v6.92.6600)
29637 Points -34%
Asus Zenbook A16 UX3607
Qualcomm Snapdragon X2 Elite Extreme X2E-94-100, X2-90 (v8.20.8100)
26387 Points -41%
AIDA64 / CPU AES
Asus Zenbook A16 UX3607
Qualcomm Snapdragon X2 Elite Extreme X2E-94-100, X2-90 (v8.20.8100)
110260 MB/s +88%
Lenovo ThinkPad X9-15p Gen 1
Intel Core Ultra X7 358H, Arc B390 Panther Lake iGPU (v8.20.8100)
68737 MB/s +17%
Average of class Multimedia
  (8171 - 126790, n=48, last 2 years)
64193 MB/s +10%
Average Intel Core Ultra X7 368H
  (58572 - 68180, n=2)
63376 MB/s +8%
Dell XPS 16 Core Ultra X7 358H
Intel Core Ultra X7 358H, Arc B390 Panther Lake iGPU (v8.20.8100)
61102 MB/s +4%
Microsoft Surface Laptop 15 Gen 8
Intel Core Ultra X7 368H, Arc B390 Panther Lake iGPU (v8.20.8100)
58572 MB/s
Microsoft Surface Laptop 7 15 Lunar Lake
Intel Core Ultra 7 268V, Arc 140V (v6.92.6600)
38706 MB/s -34%
AIDA64 / CPU ZLib
Asus Zenbook A16 UX3607
Qualcomm Snapdragon X2 Elite Extreme X2E-94-100, X2-90 (v8.20.8100)
1337 MB/s +67%
Lenovo ThinkPad X9-15p Gen 1
Intel Core Ultra X7 358H, Arc B390 Panther Lake iGPU (v8.20.8100)
1111 MB/s +38%
Dell XPS 16 Core Ultra X7 358H
Intel Core Ultra X7 358H, Arc B390 Panther Lake iGPU (v8.20.8100)
991 MB/s +23%
Average of class Multimedia
  (143.8 - 2022, n=48, last 2 years)
982 MB/s +22%
Average Intel Core Ultra X7 368H
  (803 - 1130, n=2)
967 MB/s +20%
Microsoft Surface Laptop 15 Gen 8
Intel Core Ultra X7 368H, Arc B390 Panther Lake iGPU (v8.20.8100)
803 MB/s
Microsoft Surface Laptop 7 15 Lunar Lake
Intel Core Ultra 7 268V, Arc 140V (v6.92.6600)
583 MB/s -27%
AIDA64 / FP64 Ray-Trace
Average of class Multimedia
  (1014 - 26875, n=48, last 2 years)
9692 KRay/s +19%
Lenovo ThinkPad X9-15p Gen 1
Intel Core Ultra X7 358H, Arc B390 Panther Lake iGPU (v8.20.8100)
9612 KRay/s +18%
Average Intel Core Ultra X7 368H
  (8151 - 9131, n=2)
8641 KRay/s +6%
Dell XPS 16 Core Ultra X7 358H
Intel Core Ultra X7 358H, Arc B390 Panther Lake iGPU (v8.20.8100)
8285 KRay/s +2%
Microsoft Surface Laptop 15 Gen 8
Intel Core Ultra X7 368H, Arc B390 Panther Lake iGPU (v8.20.8100)
8151 KRay/s
Asus Zenbook A16 UX3607
Qualcomm Snapdragon X2 Elite Extreme X2E-94-100, X2-90 (v8.20.8100)
6811 KRay/s -16%
Microsoft Surface Laptop 7 15 Lunar Lake
Intel Core Ultra 7 268V, Arc 140V (v6.92.6600)
6214 KRay/s -24%
AIDA64 / CPU PhotoWorxx
Lenovo ThinkPad X9-15p Gen 1
Intel Core Ultra X7 358H, Arc B390 Panther Lake iGPU (v8.20.8100)
88533 MPixel/s +17%
Dell XPS 16 Core Ultra X7 358H
Intel Core Ultra X7 358H, Arc B390 Panther Lake iGPU (v8.20.8100)
88154 MPixel/s +16%
Average Intel Core Ultra X7 368H
  (75761 - 84065, n=2)
79913 MPixel/s +5%
Microsoft Surface Laptop 15 Gen 8
Intel Core Ultra X7 368H, Arc B390 Panther Lake iGPU (v8.20.8100)
75761 MPixel/s
Asus Zenbook A16 UX3607
Qualcomm Snapdragon X2 Elite Extreme X2E-94-100, X2-90 (v8.20.8100)
66951 MPixel/s -12%
Microsoft Surface Laptop 7 15 Lunar Lake
Intel Core Ultra 7 268V, Arc 140V (v6.92.6600)
53540 MPixel/s -29%
Average of class Multimedia
  (8187 - 88533, n=48, last 2 years)
53006 MPixel/s -30%
AIDA64 / CPU CheckMate
Average Intel Core Ultra X7 368H
  (4328 - 4613, n=2)
4471 MP/s +3%
Microsoft Surface Laptop 15 Gen 8
Intel Core Ultra X7 368H, Arc B390 Panther Lake iGPU (v8.20.8100)
4328 MP/s
Lenovo ThinkPad X9-15p Gen 1
Intel Core Ultra X7 358H, Arc B390 Panther Lake iGPU (v8.20.8100)
4279 MP/s -1%
Dell XPS 16 Core Ultra X7 358H
Intel Core Ultra X7 358H, Arc B390 Panther Lake iGPU (v8.20.8100)
4269 MP/s -1%
Average of class Multimedia
  (569 - 4742, n=20, last 2 years)
3548 MP/s -18%
Asus Zenbook A16 UX3607
Qualcomm Snapdragon X2 Elite Extreme X2E-94-100, X2-90 (v8.20.8100)
1570 MP/s -64%

System and Storage Devices

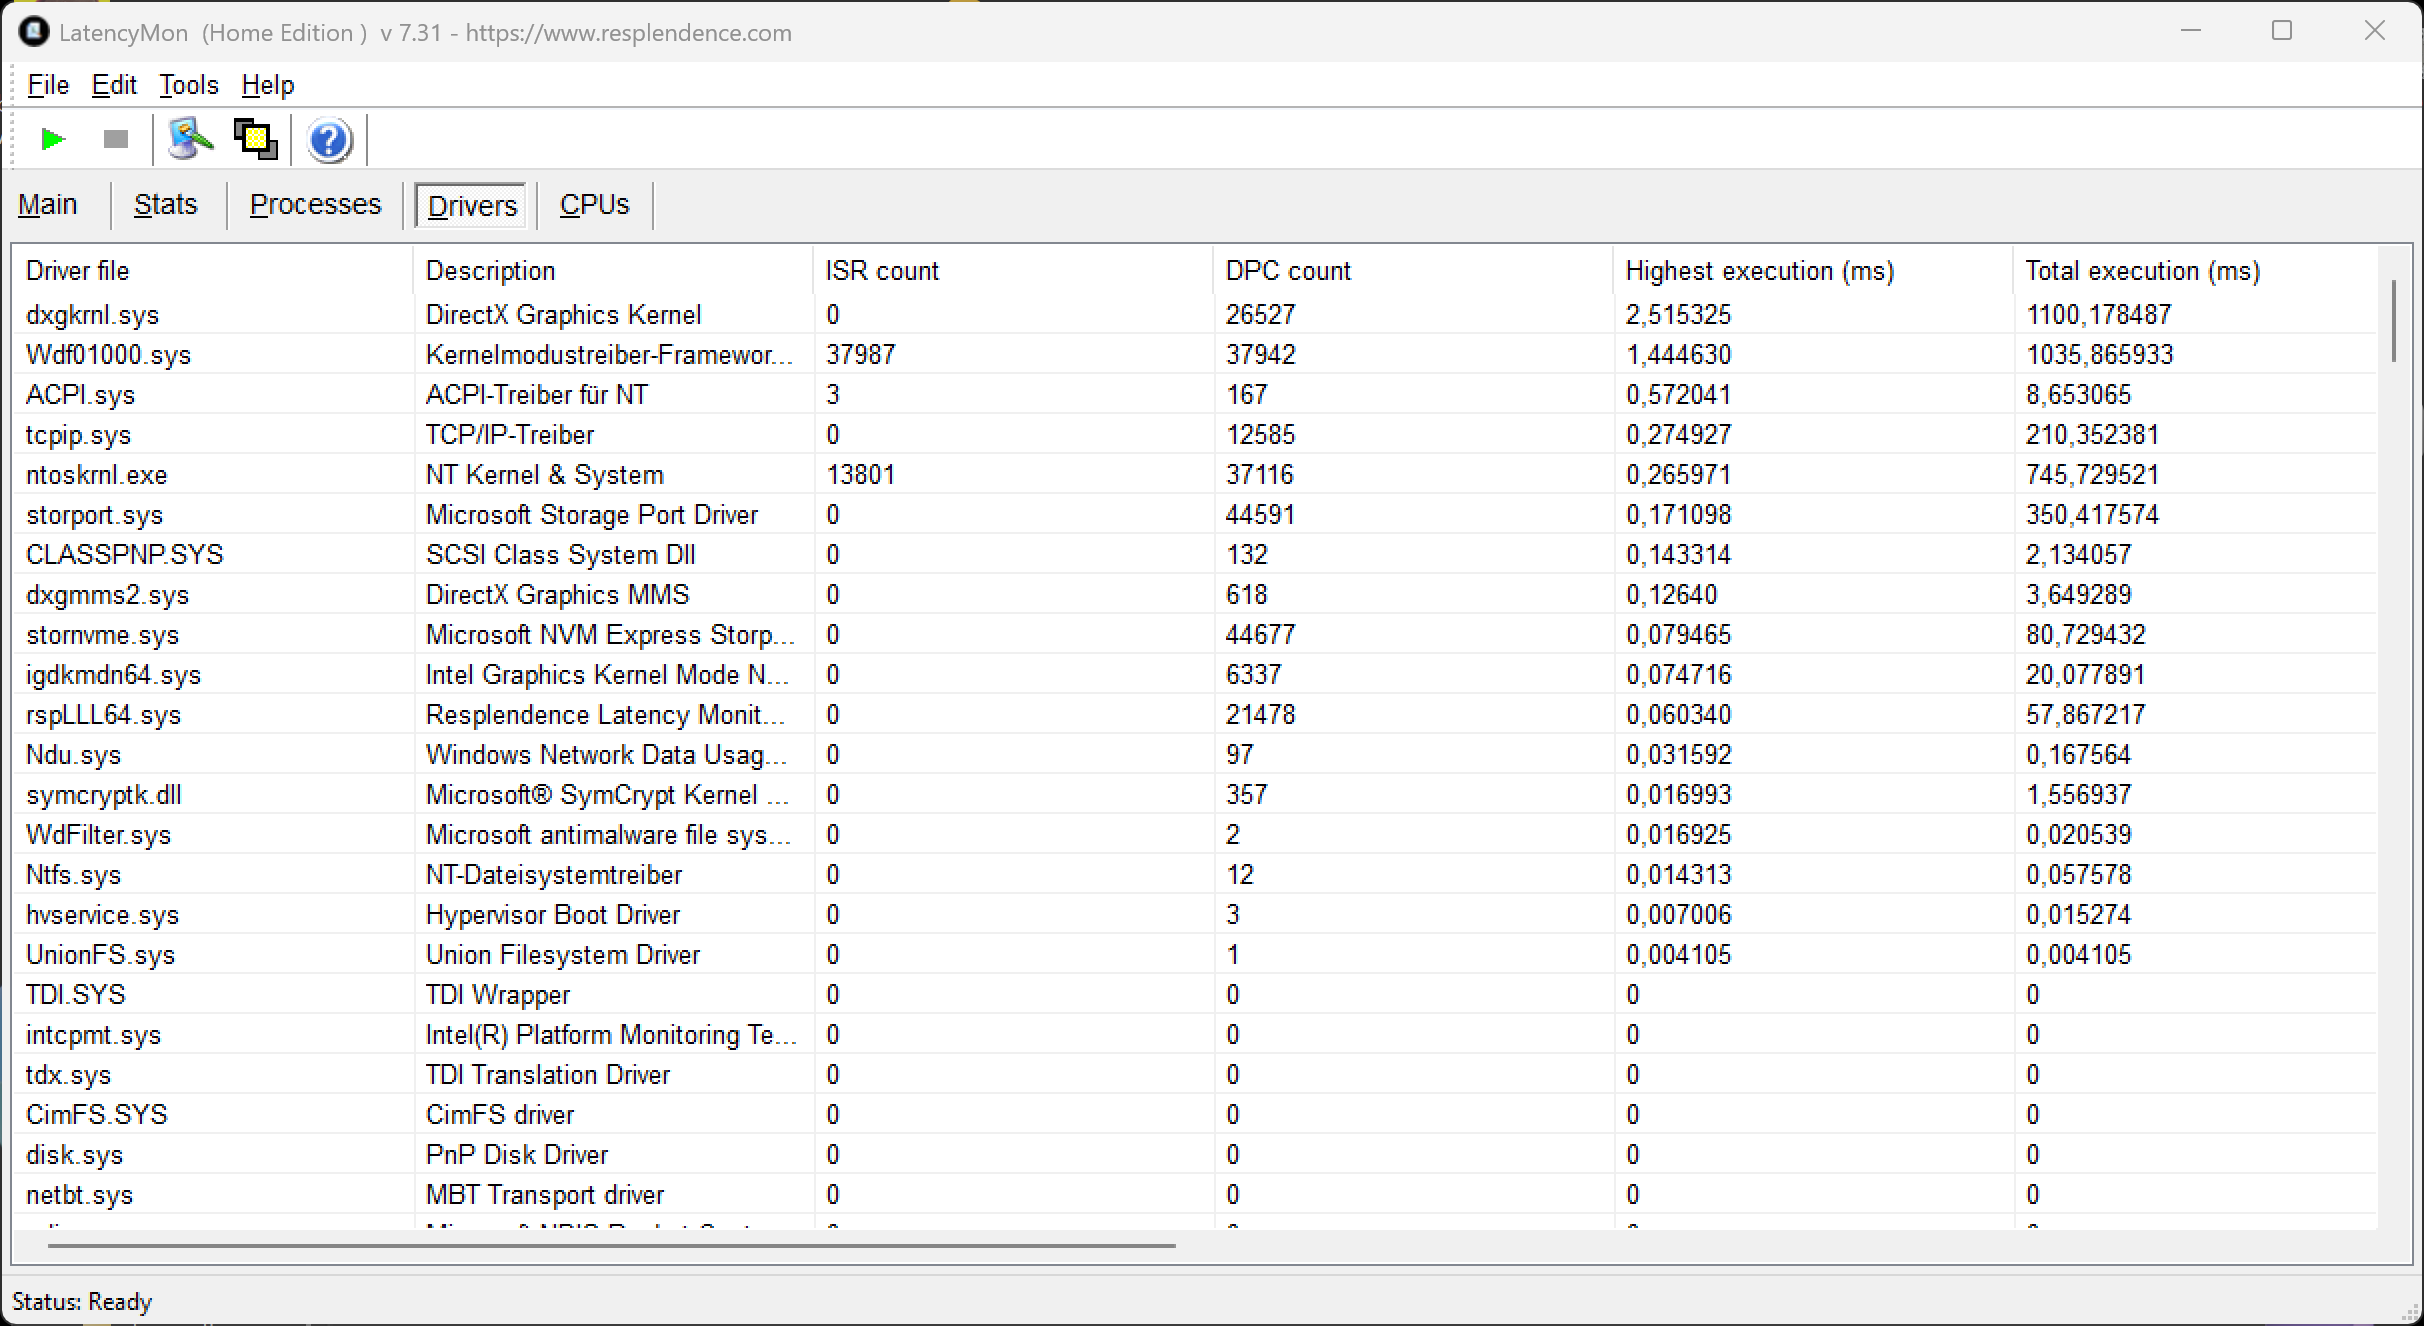
Overall system performance is excellent and we did not notice any stability issues, either. There are obviously no compatibility issues with the Intel SKU, which is an advantage over the Snapdragon version. Our review unit only offers 16 GB RAM, but we did not experience any issues and if you keep it light with multi-tasking, this cheaper version should be fine. 32 GB would obviously be better (you can configure up to 64 GB), but additional prices are high. Our latency test revealed some issues for real-time audio applications. The SSD performance (PCIe 4.0) is good and stable.

Performance rating: Percent
PCMark 10: Score | Essentials | Productivity | Digital Content Creation
CrossMark: Overall | Productivity | Creativity | Responsiveness
WebXPRT 3: Overall
WebXPRT 4: Overall
Mozilla Kraken 1.1: Total
Performance rating
Apple MacBook Air 15 M5 -4!
M5 10-Core GPU, M5 10-Core, Apple SSD AP2048Z
91.1 pt
Asus Zenbook A16 UX3607 -4!
X2-90, X2E-94-100, Samsung PM9C1b MZVL81T0HFLB-00BTW
83.5 pt
Microsoft Surface Laptop 15 Gen 8
Arc B390 Panther Lake iGPU, Ultra X7 368H, SK hynix PVC10 HFS256GEM4X182N
83.3 pt
Average Intel Core Ultra X7 368H, Intel Arc B390 12 Xe3 Panther Lake iGPU
 
83.1 pt
Lenovo ThinkPad X9-15p Gen 1
Arc B390 Panther Lake iGPU, Ultra X7 358H, Samsung PM9E1 1 TB MZVLC1T0HFLU
80.6 pt
Dell XPS 16 Core Ultra X7 358H
Arc B390 Panther Lake iGPU, Ultra X7 358H
80 pt
Average of class Multimedia
 
72.5 pt
Microsoft Surface Laptop 7 15 Lunar Lake
Arc 140V, Core Ultra 7 268V, Samsung PM9C1a MZ9L81T0HDLB
64.9 pt
PCMark 10 / Score
Average Intel Core Ultra X7 368H, Intel Arc B390 12 Xe3 Panther Lake iGPU
  (9923 - 10456, n=2)
10190 Points +3%
Microsoft Surface Laptop 15 Gen 8
Arc B390 Panther Lake iGPU, Ultra X7 368H, SK hynix PVC10 HFS256GEM4X182N
9923 Points
Dell XPS 16 Core Ultra X7 358H
Arc B390 Panther Lake iGPU, Ultra X7 358H
9717 Points -2%
Lenovo ThinkPad X9-15p Gen 1
Arc B390 Panther Lake iGPU, Ultra X7 358H, Samsung PM9E1 1 TB MZVLC1T0HFLU
9303 Points -6%
Average of class Multimedia
  (4325 - 10386, n=48, last 2 years)
8022 Points -19%
Microsoft Surface Laptop 7 15 Lunar Lake
Arc 140V, Core Ultra 7 268V, Samsung PM9C1a MZ9L81T0HDLB
7236 Points -27%
PCMark 10 / Essentials
Average Intel Core Ultra X7 368H, Intel Arc B390 12 Xe3 Panther Lake iGPU
  (11288 - 11715, n=2)
11502 Points +2%
Microsoft Surface Laptop 15 Gen 8
Arc B390 Panther Lake iGPU, Ultra X7 368H, SK hynix PVC10 HFS256GEM4X182N
11288 Points
Dell XPS 16 Core Ultra X7 358H
Arc B390 Panther Lake iGPU, Ultra X7 358H
11122 Points -1%
Lenovo ThinkPad X9-15p Gen 1
Arc B390 Panther Lake iGPU, Ultra X7 358H, Samsung PM9E1 1 TB MZVLC1T0HFLU
10762 Points -5%
Microsoft Surface Laptop 7 15 Lunar Lake
Arc 140V, Core Ultra 7 268V, Samsung PM9C1a MZ9L81T0HDLB
10701 Points -5%
Average of class Multimedia
  (8025 - 11664, n=47, last 2 years)
10507 Points -7%
PCMark 10 / Productivity
Average Intel Core Ultra X7 368H, Intel Arc B390 12 Xe3 Panther Lake iGPU
  (17463 - 18738, n=2)
18101 Points +4%
Microsoft Surface Laptop 15 Gen 8
Arc B390 Panther Lake iGPU, Ultra X7 368H, SK hynix PVC10 HFS256GEM4X182N
17463 Points
Dell XPS 16 Core Ultra X7 358H
Arc B390 Panther Lake iGPU, Ultra X7 358H
16422 Points -6%
Lenovo ThinkPad X9-15p Gen 1
Arc B390 Panther Lake iGPU, Ultra X7 358H, Samsung PM9E1 1 TB MZVLC1T0HFLU
14870 Points -15%
Average of class Multimedia
  (7323 - 18233, n=47, last 2 years)
12568 Points -28%
Microsoft Surface Laptop 7 15 Lunar Lake
Arc 140V, Core Ultra 7 268V, Samsung PM9C1a MZ9L81T0HDLB
9217 Points -47%
PCMark 10 / Digital Content Creation
Average Intel Core Ultra X7 368H, Intel Arc B390 12 Xe3 Panther Lake iGPU
  (13454 - 14129, n=2)
13792 Points +3%
Lenovo ThinkPad X9-15p Gen 1
Arc B390 Panther Lake iGPU, Ultra X7 358H, Samsung PM9E1 1 TB MZVLC1T0HFLU
13652 Points +1%
Dell XPS 16 Core Ultra X7 358H
Arc B390 Panther Lake iGPU, Ultra X7 358H
13633 Points +1%
Microsoft Surface Laptop 15 Gen 8
Arc B390 Panther Lake iGPU, Ultra X7 368H, SK hynix PVC10 HFS256GEM4X182N
13454 Points
Average of class Multimedia
  (3738 - 16240, n=47, last 2 years)
10853 Points -19%
Microsoft Surface Laptop 7 15 Lunar Lake
Arc 140V, Core Ultra 7 268V, Samsung PM9C1a MZ9L81T0HDLB
10427 Points -22%
CrossMark / Overall
Apple MacBook Air 15 M5
M5 10-Core GPU, M5 10-Core, Apple SSD AP2048Z
2356 Points +8%
Lenovo ThinkPad X9-15p Gen 1
Arc B390 Panther Lake iGPU, Ultra X7 358H, Samsung PM9E1 1 TB MZVLC1T0HFLU
2182 Points 0%
Microsoft Surface Laptop 15 Gen 8
Arc B390 Panther Lake iGPU, Ultra X7 368H, SK hynix PVC10 HFS256GEM4X182N
2182 Points
Dell XPS 16 Core Ultra X7 358H
Arc B390 Panther Lake iGPU, Ultra X7 358H
2114 Points -3%
Average Intel Core Ultra X7 368H, Intel Arc B390 12 Xe3 Panther Lake iGPU
  (2032 - 2182, n=2)
2107 Points -3%
Asus Zenbook A16 UX3607
X2-90, X2E-94-100, Samsung PM9C1b MZVL81T0HFLB-00BTW
1978 Points -9%
Average of class Multimedia
  (866 - 3231, n=56, last 2 years)
1949 Points -11%
Microsoft Surface Laptop 7 15 Lunar Lake
Arc 140V, Core Ultra 7 268V, Samsung PM9C1a MZ9L81T0HDLB
1738 Points -20%
CrossMark / Productivity
Apple MacBook Air 15 M5
M5 10-Core GPU, M5 10-Core, Apple SSD AP2048Z
2277 Points +14%
Microsoft Surface Laptop 15 Gen 8
Arc B390 Panther Lake iGPU, Ultra X7 368H, SK hynix PVC10 HFS256GEM4X182N
1995 Points
Lenovo ThinkPad X9-15p Gen 1
Arc B390 Panther Lake iGPU, Ultra X7 358H, Samsung PM9E1 1 TB MZVLC1T0HFLU
1960 Points -2%
Average Intel Core Ultra X7 368H, Intel Arc B390 12 Xe3 Panther Lake iGPU
  (1916 - 1995, n=2)
1956 Points -2%
Dell XPS 16 Core Ultra X7 358H
Arc B390 Panther Lake iGPU, Ultra X7 358H
1898 Points -5%
Average of class Multimedia
  (931 - 2677, n=56, last 2 years)
1817 Points -9%
Asus Zenbook A16 UX3607
X2-90, X2E-94-100, Samsung PM9C1b MZVL81T0HFLB-00BTW
1732 Points -13%
Microsoft Surface Laptop 7 15 Lunar Lake
Arc 140V, Core Ultra 7 268V, Samsung PM9C1a MZ9L81T0HDLB
1680 Points -16%
CrossMark / Creativity
Apple MacBook Air 15 M5
M5 10-Core GPU, M5 10-Core, Apple SSD AP2048Z
2743 Points +8%
Lenovo ThinkPad X9-15p Gen 1
Arc B390 Panther Lake iGPU, Ultra X7 358H, Samsung PM9E1 1 TB MZVLC1T0HFLU
2563 Points +1%
Microsoft Surface Laptop 15 Gen 8
Arc B390 Panther Lake iGPU, Ultra X7 368H, SK hynix PVC10 HFS256GEM4X182N
2530 Points
Dell XPS 16 Core Ultra X7 358H
Arc B390 Panther Lake iGPU, Ultra X7 358H
2529 Points 0%
Average Intel Core Ultra X7 368H, Intel Arc B390 12 Xe3 Panther Lake iGPU
  (2241 - 2530, n=2)
2386 Points -6%
Asus Zenbook A16 UX3607
X2-90, X2E-94-100, Samsung PM9C1b MZVL81T0HFLB-00BTW
2327 Points -8%
Average of class Multimedia
  (907 - 4522, n=56, last 2 years)
2261 Points -11%
Microsoft Surface Laptop 7 15 Lunar Lake
Arc 140V, Core Ultra 7 268V, Samsung PM9C1a MZ9L81T0HDLB
1976 Points -22%
CrossMark / Responsiveness
Lenovo ThinkPad X9-15p Gen 1
Arc B390 Panther Lake iGPU, Ultra X7 358H, Samsung PM9E1 1 TB MZVLC1T0HFLU
1855 Points +1%
Microsoft Surface Laptop 15 Gen 8
Arc B390 Panther Lake iGPU, Ultra X7 368H, SK hynix PVC10 HFS256GEM4X182N
1832 Points
Average Intel Core Ultra X7 368H, Intel Arc B390 12 Xe3 Panther Lake iGPU
  (1808 - 1832, n=2)
1820 Points -1%
Asus Zenbook A16 UX3607
X2-90, X2E-94-100, Samsung PM9C1b MZVL81T0HFLB-00BTW
1811 Points -1%
Dell XPS 16 Core Ultra X7 358H
Arc B390 Panther Lake iGPU, Ultra X7 358H
1706 Points -7%
Apple MacBook Air 15 M5
M5 10-Core GPU, M5 10-Core, Apple SSD AP2048Z
1657 Points -10%
Average of class Multimedia
  (605 - 2073, n=56, last 2 years)
1568 Points -14%
Microsoft Surface Laptop 7 15 Lunar Lake
Arc 140V, Core Ultra 7 268V, Samsung PM9C1a MZ9L81T0HDLB
1311 Points -28%
WebXPRT 3 / Overall
Apple MacBook Air 15 M5
M5 10-Core GPU, M5 10-Core, Apple SSD AP2048Z
530 Points +57%
Asus Zenbook A16 UX3607
X2-90, X2E-94-100, Samsung PM9C1b MZVL81T0HFLB-00BTW
514 Points +52%
Lenovo ThinkPad X9-15p Gen 1
Arc B390 Panther Lake iGPU, Ultra X7 358H, Samsung PM9E1 1 TB MZVLC1T0HFLU
350 Points +4%
Average of class Multimedia
  (197.4 - 622, n=59, last 2 years)
346 Points +2%
Average Intel Core Ultra X7 368H, Intel Arc B390 12 Xe3 Panther Lake iGPU
  (338 - 342, n=2)
340 Points +1%
Microsoft Surface Laptop 15 Gen 8
Arc B390 Panther Lake iGPU, Ultra X7 368H, SK hynix PVC10 HFS256GEM4X182N
338 Points
Microsoft Surface Laptop 7 15 Lunar Lake
Arc 140V, Core Ultra 7 268V, Samsung PM9C1a MZ9L81T0HDLB
310 Points -8%
Dell XPS 16 Core Ultra X7 358H
Arc B390 Panther Lake iGPU, Ultra X7 358H
304 Points -10%
WebXPRT 4 / Overall
Asus Zenbook A16 UX3607
X2-90, X2E-94-100, Samsung PM9C1b MZVL81T0HFLB-00BTW
383 Points +22%
Apple MacBook Air 15 M5
M5 10-Core GPU, M5 10-Core, Apple SSD AP2048Z
378 Points +20%
Microsoft Surface Laptop 15 Gen 8
Arc B390 Panther Lake iGPU, Ultra X7 368H, SK hynix PVC10 HFS256GEM4X182N
314 Points
Average Intel Core Ultra X7 368H, Intel Arc B390 12 Xe3 Panther Lake iGPU
  (304 - 314, n=2)
309 Points -2%
Lenovo ThinkPad X9-15p Gen 1
Arc B390 Panther Lake iGPU, Ultra X7 358H, Samsung PM9E1 1 TB MZVLC1T0HFLU
307 Points -2%
Dell XPS 16 Core Ultra X7 358H
Arc B390 Panther Lake iGPU, Ultra X7 358H
300 Points -4%
Average of class Multimedia
  (167.3 - 415, n=59, last 2 years)
295 Points -6%
Microsoft Surface Laptop 7 15 Lunar Lake
Arc 140V, Core Ultra 7 268V, Samsung PM9C1a MZ9L81T0HDLB
287 Points -9%
Mozilla Kraken 1.1 / Total
Microsoft Surface Laptop 7 15 Lunar Lake
Arc 140V, Core Ultra 7 268V, Samsung PM9C1a MZ9L81T0HDLB
475 ms * -11%
Lenovo ThinkPad X9-15p Gen 1
Arc B390 Panther Lake iGPU, Ultra X7 358H, Samsung PM9E1 1 TB MZVLC1T0HFLU
465 ms * -8%
Dell XPS 16 Core Ultra X7 358H
Arc B390 Panther Lake iGPU, Ultra X7 358H
450 ms * -5%
Average of class Multimedia
  (228 - 835, n=60, last 2 years)
440 ms * -3%
Average Intel Core Ultra X7 368H, Intel Arc B390 12 Xe3 Panther Lake iGPU
  (429 - 437, n=2)
433 ms * -1%
Microsoft Surface Laptop 15 Gen 8
Arc B390 Panther Lake iGPU, Ultra X7 368H, SK hynix PVC10 HFS256GEM4X182N
429 ms *
Asus Zenbook A16 UX3607
X2-90, X2E-94-100, Samsung PM9C1b MZVL81T0HFLB-00BTW
261.4 ms * +39%
Apple MacBook Air 15 M5
M5 10-Core GPU, M5 10-Core, Apple SSD AP2048Z
238.6 ms * +44%

* ... smaller is better

PCMark 10 Score
9923 points
Help
AIDA64 / Memory Copy
Dell XPS 16 Core Ultra X7 358H
Intel Core Ultra X7 358H, Arc B390 Panther Lake iGPU
132135 MB/s +20%
Lenovo ThinkPad X9-15p Gen 1
Intel Core Ultra X7 358H, Arc B390 Panther Lake iGPU
129389 MB/s +18%
Average Intel Core Ultra X7 368H
  (109931 - 114339, n=2)
112135 MB/s +2%
Microsoft Surface Laptop 15 Gen 8
Intel Core Ultra X7 368H, Arc B390 Panther Lake iGPU
109931 MB/s
Microsoft Surface Laptop 7 15 Lunar Lake
Intel Core Ultra 7 268V, Arc 140V
107108 MB/s -3%
Asus Zenbook A16 UX3607
Qualcomm Snapdragon X2 Elite Extreme X2E-94-100, X2-90
104879 MB/s -5%
Average of class Multimedia
  (11299 - 132135, n=48, last 2 years)
85254 MB/s -22%
AIDA64 / Memory Read
Asus Zenbook A16 UX3607
Qualcomm Snapdragon X2 Elite Extreme X2E-94-100, X2-90
174586 MB/s +55%
Lenovo ThinkPad X9-15p Gen 1
Intel Core Ultra X7 358H, Arc B390 Panther Lake iGPU
120727 MB/s +7%
Dell XPS 16 Core Ultra X7 358H
Intel Core Ultra X7 358H, Arc B390 Panther Lake iGPU
118888 MB/s +6%
Microsoft Surface Laptop 15 Gen 8
Intel Core Ultra X7 368H, Arc B390 Panther Lake iGPU
112338 MB/s
Average Intel Core Ultra X7 368H
  (106702 - 112338, n=2)
109520 MB/s -3%
Microsoft Surface Laptop 7 15 Lunar Lake
Intel Core Ultra 7 268V, Arc 140V
88341 MB/s -21%
Average of class Multimedia
  (11624 - 174586, n=48, last 2 years)
81379 MB/s -28%
AIDA64 / Memory Write
Dell XPS 16 Core Ultra X7 358H
Intel Core Ultra X7 358H, Arc B390 Panther Lake iGPU
134998 MB/s +12%
Lenovo ThinkPad X9-15p Gen 1
Intel Core Ultra X7 358H, Arc B390 Panther Lake iGPU
134848 MB/s +12%
Average Intel Core Ultra X7 368H
  (120698 - 120732, n=2)
120715 MB/s 0%
Microsoft Surface Laptop 15 Gen 8
Intel Core Ultra X7 368H, Arc B390 Panther Lake iGPU
120698 MB/s
Microsoft Surface Laptop 7 15 Lunar Lake
Intel Core Ultra 7 268V, Arc 140V
117888 MB/s -2%
Average of class Multimedia
  (11755 - 134998, n=48, last 2 years)
86357 MB/s -28%
Asus Zenbook A16 UX3607
Qualcomm Snapdragon X2 Elite Extreme X2E-94-100, X2-90
73995 MB/s -39%
AIDA64 / Memory Latency
Average of class Multimedia
  (84.1 - 535, n=47, last 2 years)
127.5 ns * -43%
Microsoft Surface Laptop 7 15 Lunar Lake
Intel Core Ultra 7 268V, Arc 140V
97.4 ns * -10%
Average Intel Core Ultra X7 368H
  (88.9 - 90.3, n=2)
89.6 ns * -1%
Microsoft Surface Laptop 15 Gen 8
Intel Core Ultra X7 368H, Arc B390 Panther Lake iGPU
88.9 ns *
Dell XPS 16 Core Ultra X7 358H
Intel Core Ultra X7 358H, Arc B390 Panther Lake iGPU
84.6 ns * +5%
Lenovo ThinkPad X9-15p Gen 1
Intel Core Ultra X7 358H, Arc B390 Panther Lake iGPU
84.1 ns * +5%

* ... smaller is better

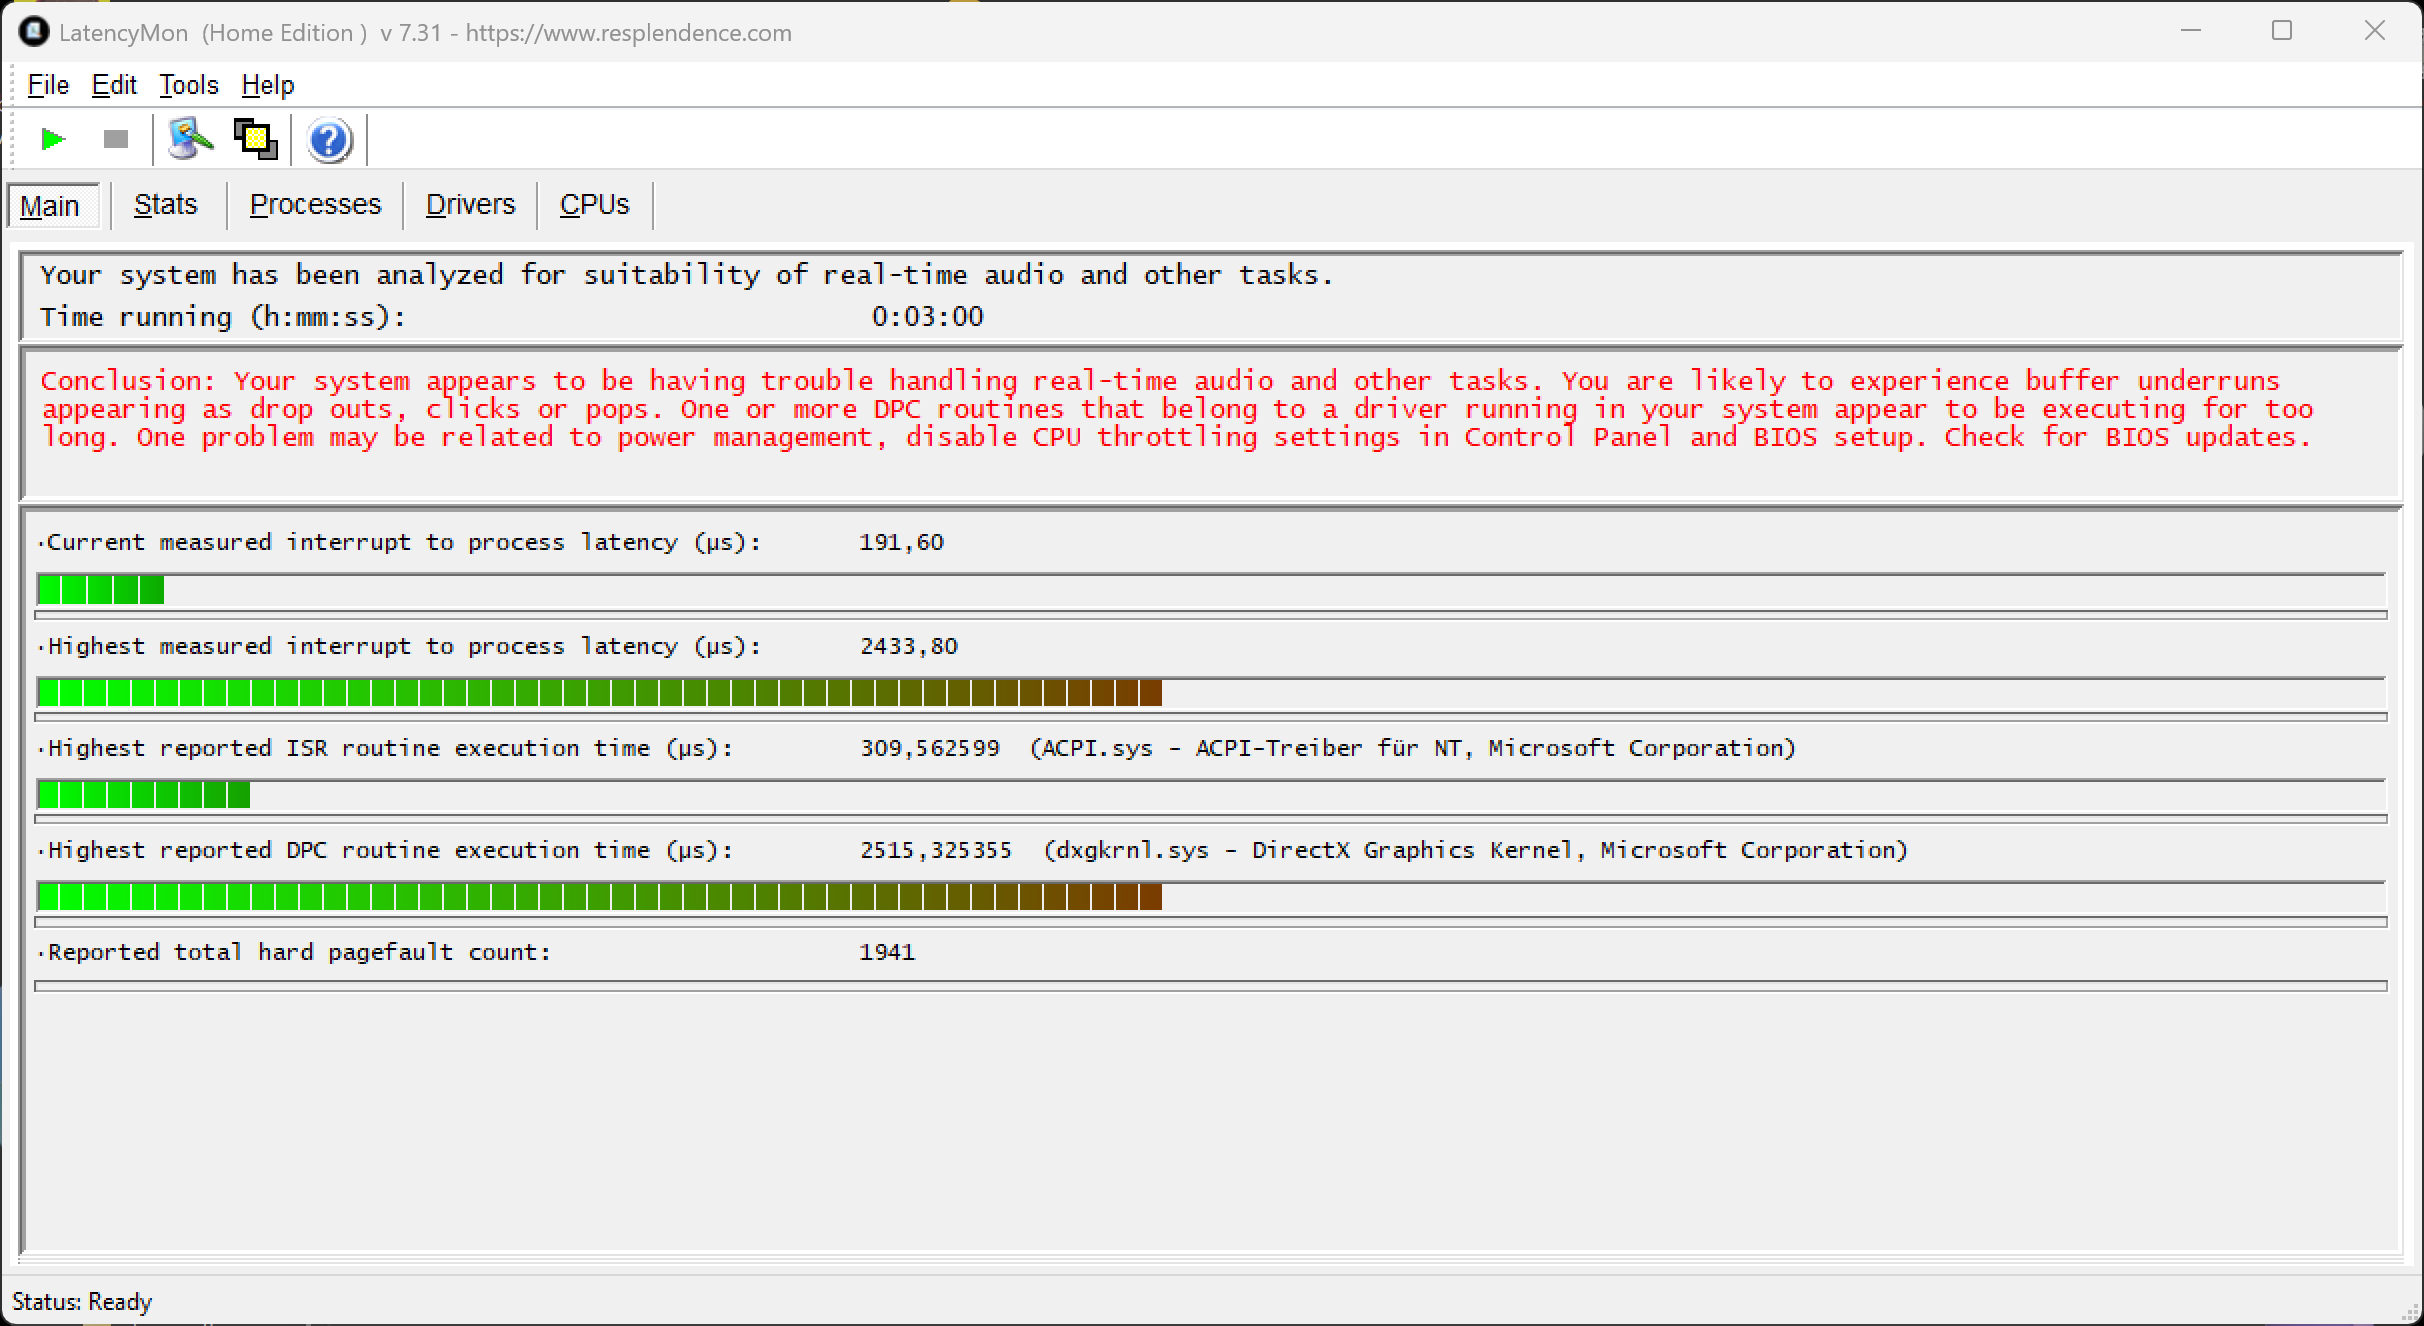
LatencyMon - Overview
LatencyMon - Drivers
DPC Latencies / LatencyMon - interrupt to process latency (max), Web, Youtube, Prime95
Lenovo ThinkPad X9-15p Gen 1
Arc B390 Panther Lake iGPU, Ultra X7 358H, Samsung PM9E1 1 TB MZVLC1T0HFLU
3844.3 μs * -58%
Microsoft Surface Laptop 15 Gen 8
Arc B390 Panther Lake iGPU, Ultra X7 368H, SK hynix PVC10 HFS256GEM4X182N
2433.8 μs *
Average of class Multimedia
  (327 - 7067, n=46, last 2 years)
1815 μs * +25%
Microsoft Surface Laptop 7 15 Lunar Lake
Arc 140V, Core Ultra 7 268V, Samsung PM9C1a MZ9L81T0HDLB
891.9 μs * +63%
Dell XPS 16 Core Ultra X7 358H
Arc B390 Panther Lake iGPU, Ultra X7 358H
513.7 μs * +79%

* ... smaller is better

SK hynix PVC10 HFS256GEM4X182N
CDM 5/6 Read Seq Q32T1: 5688 MB/s
CDM 5/6 Write Seq Q32T1: 2845 MB/s
CDM 5/6 Read 4K Q32T1: 602 MB/s
CDM 5/6 Write 4K Q32T1: 766 MB/s
CDM 5/6 Read 4K: 81.8 MB/s
CDM 5/6 Write 4K: 151.3 MB/s
CDM 6 Write 4K Q8T8: 2141 MB/s
CDM 6 Read 4K Q8T8: 1777 MB/s
Drive Performance rating - Percent
Lenovo ThinkPad X9-15p Gen 1
Samsung PM9E1 1 TB MZVLC1T0HFLU
93.3 pt
Asus Zenbook A16 UX3607
Samsung PM9C1b MZVL81T0HFLB-00BTW
54.4 pt
Microsoft Surface Laptop 15 Gen 8
SK hynix PVC10 HFS256GEM4X182N
51.3 pt
Average of class Multimedia
 
47.5 pt
Dell XPS 16 Core Ultra X7 358H
 
43.4 pt
Microsoft Surface Laptop 7 15 Lunar Lake
Samsung PM9C1a MZ9L81T0HDLB
42.9 pt
Average SK hynix PVC10 HFS256GEM4X182N
 
41.3 pt
DiskSpd
seq read
Lenovo ThinkPad X9-15p Gen 1
Samsung PM9E1 1 TB MZVLC1T0HFLU
7663 (7579.05min - 7663.4max) MB/s +241%
Dell XPS 16 Core Ultra X7 358H
 
3600 (3100.64min - 3600.18max) MB/s +60%
Asus Zenbook A16 UX3607
Samsung PM9C1b MZVL81T0HFLB-00BTW
3256 (3194.8min - 3255.62max) MB/s +45%
Average of class Multimedia
  (453 - 7811, n=51, last 2 years)
3140 MB/s +40%
Average SK hynix PVC10 HFS256GEM4X182N
  (2249 - 3278, n=2)
2764 MB/s +23%
Microsoft Surface Laptop 7 15 Lunar Lake
Samsung PM9C1a MZ9L81T0HDLB
2302 (2064.86min - 2301.62max) MB/s +2%
Microsoft Surface Laptop 15 Gen 8
SK hynix PVC10 HFS256GEM4X182N
2249 (2210.19min - 2248.78max) MB/s
seq write
Lenovo ThinkPad X9-15p Gen 1
Samsung PM9E1 1 TB MZVLC1T0HFLU
9312 (3040.03min - 9311.98max) MB/s +433%
Asus Zenbook A16 UX3607
Samsung PM9C1b MZVL81T0HFLB-00BTW
3644 (3588.65min - 3643.8max) MB/s +109%
Average of class Multimedia
  (384 - 9952, n=51, last 2 years)
3319 MB/s +90%
Dell XPS 16 Core Ultra X7 358H
 
2599 (796.92min - 2599.25max) MB/s +49%
Average SK hynix PVC10 HFS256GEM4X182N
  (1747 - 2155, n=2)
1951 MB/s +12%
Microsoft Surface Laptop 15 Gen 8
SK hynix PVC10 HFS256GEM4X182N
1747 (1666.63min - 1747.42max) MB/s
Microsoft Surface Laptop 7 15 Lunar Lake
Samsung PM9C1a MZ9L81T0HDLB
1718 (1595.51min - 1717.99max) MB/s -2%
seq q8 t1 read
Lenovo ThinkPad X9-15p Gen 1
Samsung PM9E1 1 TB MZVLC1T0HFLU
14162 (13273.2min - 14161.6max) MB/s +133%
Dell XPS 16 Core Ultra X7 358H
 
7039 (5536.1min - 7039.48max) MB/s +16%
Asus Zenbook A16 UX3607
Samsung PM9C1b MZVL81T0HFLB-00BTW
6940 (5727.82min - 6940.07max) MB/s +14%
Microsoft Surface Laptop 7 15 Lunar Lake
Samsung PM9C1a MZ9L81T0HDLB
6158 (5002.91min - 6158.13max) MB/s +1%
Average of class Multimedia
  (467 - 14162, n=51, last 2 years)
6122 MB/s +1%
Microsoft Surface Laptop 15 Gen 8
SK hynix PVC10 HFS256GEM4X182N
6074 (4968.99min - 6073.77max) MB/s
Average SK hynix PVC10 HFS256GEM4X182N
  (5911 - 6074, n=2)
5993 MB/s -1%
seq q8 t1 write
Lenovo ThinkPad X9-15p Gen 1
Samsung PM9E1 1 TB MZVLC1T0HFLU
13512 (13475.9min - 13511.8max) MB/s +305%
Dell XPS 16 Core Ultra X7 358H
 
6101 (5938.22min - 6101.03max) MB/s +83%
Average of class Multimedia
  (247 - 13512, n=51, last 2 years)
5102 MB/s +53%
Asus Zenbook A16 UX3607
Samsung PM9C1b MZVL81T0HFLB-00BTW
4986 (4743.29min - 4986.07max) MB/s +50%
Microsoft Surface Laptop 7 15 Lunar Lake
Samsung PM9C1a MZ9L81T0HDLB
4651 (3142.37min - 4651.2max) MB/s +40%
Microsoft Surface Laptop 15 Gen 8
SK hynix PVC10 HFS256GEM4X182N
3333 (2050.9min - 3333.21max) MB/s
Average SK hynix PVC10 HFS256GEM4X182N
  (3041 - 3333, n=2)
3187 MB/s -4%
4k q1 t1 read
Lenovo ThinkPad X9-15p Gen 1
Samsung PM9E1 1 TB MZVLC1T0HFLU
85.1 (79.62min - 85.09max) MB/s +35%
Asus Zenbook A16 UX3607
Samsung PM9C1b MZVL81T0HFLB-00BTW
81.4 (73.37min - 81.4max) MB/s +29%
Average SK hynix PVC10 HFS256GEM4X182N
  (63 - 68, n=2)
65.5 MB/s +4%
Average of class Multimedia
  (18.8 - 94.1, n=51, last 2 years)
64.4 MB/s +2%
Microsoft Surface Laptop 15 Gen 8
SK hynix PVC10 HFS256GEM4X182N
63 (62.83min - 63max) MB/s
Dell XPS 16 Core Ultra X7 358H
 
59.1 (53.74min - 59.08max) MB/s -6%
Microsoft Surface Laptop 7 15 Lunar Lake
Samsung PM9C1a MZ9L81T0HDLB
55 (51.05min - 55.02max) MB/s -13%
4k q1 t1 write
Asus Zenbook A16 UX3607
Samsung PM9C1b MZVL81T0HFLB-00BTW
249 (236.18min - 248.88max) MB/s +33%
Lenovo ThinkPad X9-15p Gen 1
Samsung PM9E1 1 TB MZVLC1T0HFLU
206 (194.33min - 205.81max) MB/s +10%
Microsoft Surface Laptop 15 Gen 8
SK hynix PVC10 HFS256GEM4X182N
186.6 (149.98min - 186.58max) MB/s
Average of class Multimedia
  (40.3 - 278, n=51, last 2 years)
161.6 MB/s -13%
Average SK hynix PVC10 HFS256GEM4X182N
  (115.1 - 186.6, n=2)
150.9 MB/s -19%
Dell XPS 16 Core Ultra X7 358H
 
145.5 (139.46min - 145.49max) MB/s -22%
Microsoft Surface Laptop 7 15 Lunar Lake
Samsung PM9C1a MZ9L81T0HDLB
113.9 (108.41min - 113.89max) MB/s -39%
4k q32 t16 read
Lenovo ThinkPad X9-15p Gen 1
Samsung PM9E1 1 TB MZVLC1T0HFLU
5278 (5224.04min - 5277.98max) MB/s +116%
Microsoft Surface Laptop 15 Gen 8
SK hynix PVC10 HFS256GEM4X182N
2446 (2400.1min - 2445.99max) MB/s
Average SK hynix PVC10 HFS256GEM4X182N
  (1450 - 2446, n=2)
1948 MB/s -20%
Average of class Multimedia
  (190.3 - 6121, n=51, last 2 years)
1626 MB/s -34%
Microsoft Surface Laptop 7 15 Lunar Lake
Samsung PM9C1a MZ9L81T0HDLB
1546 (1446.52min - 1545.71max) MB/s -37%
Asus Zenbook A16 UX3607
Samsung PM9C1b MZVL81T0HFLB-00BTW
1184 (1174.4min - 1183.69max) MB/s -52%
Dell XPS 16 Core Ultra X7 358H
 
652 (602.16min - 651.54max) MB/s -73%
4k q32 t16 write
Lenovo ThinkPad X9-15p Gen 1
Samsung PM9E1 1 TB MZVLC1T0HFLU
3134 (3116.91min - 3133.98max) MB/s +30%
Microsoft Surface Laptop 15 Gen 8
SK hynix PVC10 HFS256GEM4X182N
2414 (735.3min - 2413.9max) MB/s
Average SK hynix PVC10 HFS256GEM4X182N
  (635 - 2414, n=2)
1525 MB/s -37%
Microsoft Surface Laptop 7 15 Lunar Lake
Samsung PM9C1a MZ9L81T0HDLB
1244 (771.44min - 1244.07max) MB/s -48%
Average of class Multimedia
  (154.9 - 4447, n=51, last 2 years)
1148 MB/s -52%
Asus Zenbook A16 UX3607
Samsung PM9C1b MZVL81T0HFLB-00BTW
805 (790.83min - 804.52max) MB/s -67%
Dell XPS 16 Core Ultra X7 358H
 
447 (308.53min - 447.08max) MB/s -81%
AS SSD
Score Total
Lenovo ThinkPad X9-15p Gen 1
Samsung PM9E1 1 TB MZVLC1T0HFLU
11377 Points +108%
Microsoft Surface Laptop 15 Gen 8
SK hynix PVC10 HFS256GEM4X182N
5467 Points
Average of class Multimedia
  (482 - 11377, n=49, last 2 years)
5379 Points -2%
Dell XPS 16 Core Ultra X7 358H
 
5309 Points -3%
Asus Zenbook A16 UX3607
Samsung PM9C1b MZVL81T0HFLB-00BTW
5124 Points -6%
Average SK hynix PVC10 HFS256GEM4X182N
  (2859 - 5467, n=2)
4163 Points -24%
Microsoft Surface Laptop 7 15 Lunar Lake
Samsung PM9C1a MZ9L81T0HDLB
3869 Points -29%
Score Read
Lenovo ThinkPad X9-15p Gen 1
Samsung PM9E1 1 TB MZVLC1T0HFLU
4351 Points +99%
Microsoft Surface Laptop 15 Gen 8
SK hynix PVC10 HFS256GEM4X182N
2182 Points
Average SK hynix PVC10 HFS256GEM4X182N
  (1628 - 2182, n=2)
1905 Points -13%
Average of class Multimedia
  (192 - 4351, n=49, last 2 years)
1761 Points -19%
Microsoft Surface Laptop 7 15 Lunar Lake
Samsung PM9C1a MZ9L81T0HDLB
1470 Points -33%
Dell XPS 16 Core Ultra X7 358H
 
1423 Points -35%
Asus Zenbook A16 UX3607
Samsung PM9C1b MZVL81T0HFLB-00BTW
1188 Points -46%
Score Write
Lenovo ThinkPad X9-15p Gen 1
Samsung PM9E1 1 TB MZVLC1T0HFLU
4851 Points +113%
Asus Zenbook A16 UX3607
Samsung PM9C1b MZVL81T0HFLB-00BTW
3402 Points +49%
Dell XPS 16 Core Ultra X7 358H
 
3277 Points +44%
Average of class Multimedia
  (191 - 4851, n=49, last 2 years)
2777 Points +22%
Microsoft Surface Laptop 15 Gen 8
SK hynix PVC10 HFS256GEM4X182N
2278 Points
Microsoft Surface Laptop 7 15 Lunar Lake
Samsung PM9C1a MZ9L81T0HDLB
1716 Points -25%
Average SK hynix PVC10 HFS256GEM4X182N
  (506 - 2278, n=2)
1392 Points -39%
Seq Read
Lenovo ThinkPad X9-15p Gen 1
Samsung PM9E1 1 TB MZVLC1T0HFLU
10401 MB/s +120%
Asus Zenbook A16 UX3607
Samsung PM9C1b MZVL81T0HFLB-00BTW
5391 MB/s +14%
Dell XPS 16 Core Ultra X7 358H
 
5083.41 MB/s +7%
Average of class Multimedia
  (484 - 10494, n=49, last 2 years)
4775 MB/s +1%
Microsoft Surface Laptop 15 Gen 8
SK hynix PVC10 HFS256GEM4X182N
4734 MB/s
Microsoft Surface Laptop 7 15 Lunar Lake
Samsung PM9C1a MZ9L81T0HDLB
4668 MB/s -1%
Average SK hynix PVC10 HFS256GEM4X182N
  (3681 - 4734, n=2)
4208 MB/s -11%
Seq Write
Lenovo ThinkPad X9-15p Gen 1
Samsung PM9E1 1 TB MZVLC1T0HFLU
9596 MB/s +329%
Asus Zenbook A16 UX3607
Samsung PM9C1b MZVL81T0HFLB-00BTW
3527 MB/s +58%
Average of class Multimedia
  (344 - 9596, n=49, last 2 years)
3353 MB/s +50%
Microsoft Surface Laptop 7 15 Lunar Lake
Samsung PM9C1a MZ9L81T0HDLB
3049 MB/s +36%
Dell XPS 16 Core Ultra X7 358H
 
2509.02 MB/s +12%
Microsoft Surface Laptop 15 Gen 8
SK hynix PVC10 HFS256GEM4X182N
2239 MB/s
Average SK hynix PVC10 HFS256GEM4X182N
  (1427 - 2239, n=2)
1833 MB/s -18%
4K Read
Microsoft Surface Laptop 15 Gen 8
SK hynix PVC10 HFS256GEM4X182N
80.7 MB/s
Lenovo ThinkPad X9-15p Gen 1
Samsung PM9E1 1 TB MZVLC1T0HFLU
78.9 MB/s -2%
Asus Zenbook A16 UX3607
Samsung PM9C1b MZVL81T0HFLB-00BTW
65.7 MB/s -19%
Average SK hynix PVC10 HFS256GEM4X182N
  (47.2 - 80.7, n=2)
64 MB/s -21%
Average of class Multimedia
  (17.5 - 89.9, n=49, last 2 years)
63.4 MB/s -21%
Microsoft Surface Laptop 7 15 Lunar Lake
Samsung PM9C1a MZ9L81T0HDLB
57.6 MB/s -29%
Dell XPS 16 Core Ultra X7 358H
 
52.53 MB/s -35%
4K Write
Asus Zenbook A16 UX3607
Samsung PM9C1b MZVL81T0HFLB-00BTW
225 MB/s +50%
Lenovo ThinkPad X9-15p Gen 1
Samsung PM9E1 1 TB MZVLC1T0HFLU
181.3 MB/s +20%
Average of class Multimedia
  (43.1 - 265, n=49, last 2 years)
181 MB/s +20%
Microsoft Surface Laptop 15 Gen 8
SK hynix PVC10 HFS256GEM4X182N
150.5 MB/s
Average SK hynix PVC10 HFS256GEM4X182N
  (110.8 - 150.5, n=2)
130.7 MB/s -13%
Microsoft Surface Laptop 7 15 Lunar Lake
Samsung PM9C1a MZ9L81T0HDLB
130.6 MB/s -13%
Dell XPS 16 Core Ultra X7 358H
 
125.58 MB/s -17%
4K-64 Read
Lenovo ThinkPad X9-15p Gen 1
Samsung PM9E1 1 TB MZVLC1T0HFLU
3232 MB/s +99%
Microsoft Surface Laptop 15 Gen 8
SK hynix PVC10 HFS256GEM4X182N
1628 MB/s
Average SK hynix PVC10 HFS256GEM4X182N
  (1213 - 1628, n=2)
1421 MB/s -13%
Average of class Multimedia
  (125.7 - 3394, n=49, last 2 years)
1220 MB/s -25%
Microsoft Surface Laptop 7 15 Lunar Lake
Samsung PM9C1a MZ9L81T0HDLB
945 MB/s -42%
Dell XPS 16 Core Ultra X7 358H
 
862.49 MB/s -47%
Asus Zenbook A16 UX3607
Samsung PM9C1b MZVL81T0HFLB-00BTW
583 MB/s -64%
4K-64 Write
Lenovo ThinkPad X9-15p Gen 1
Samsung PM9E1 1 TB MZVLC1T0HFLU
3710 MB/s +95%
Dell XPS 16 Core Ultra X7 358H
 
2900.39 MB/s +52%
Asus Zenbook A16 UX3607
Samsung PM9C1b MZVL81T0HFLB-00BTW
2825 MB/s +48%
Average of class Multimedia
  (75.2 - 4042, n=49, last 2 years)
2261 MB/s +19%
Microsoft Surface Laptop 15 Gen 8
SK hynix PVC10 HFS256GEM4X182N
1903 MB/s
Microsoft Surface Laptop 7 15 Lunar Lake
Samsung PM9C1a MZ9L81T0HDLB
1281 MB/s -33%
Average SK hynix PVC10 HFS256GEM4X182N
  (252 - 1903, n=2)
1078 MB/s -43%
Access Time Read
Average SK hynix PVC10 HFS256GEM4X182N
  (0.087 - 0.162, n=2)
0.1245 ms * -43%
Microsoft Surface Laptop 15 Gen 8
SK hynix PVC10 HFS256GEM4X182N
0.087 ms *
Lenovo ThinkPad X9-15p Gen 1
Samsung PM9E1 1 TB MZVLC1T0HFLU
0.077 ms * +11%
Asus Zenbook A16 UX3607
Samsung PM9C1b MZVL81T0HFLB-00BTW
0.075 ms * +14%
Average of class Multimedia
  (0.018 - 0.168, n=49, last 2 years)
0.06484 ms * +25%
Dell XPS 16 Core Ultra X7 358H
 
0.059 ms * +32%
Microsoft Surface Laptop 7 15 Lunar Lake
Samsung PM9C1a MZ9L81T0HDLB
0.034 ms * +61%
Access Time Write
Dell XPS 16 Core Ultra X7 358H
 
0.082 ms * -273%
Average of class Multimedia
  (0.015 - 0.754, n=49, last 2 years)
0.0771 ms * -250%
Average SK hynix PVC10 HFS256GEM4X182N
  (0.022 - 0.045, n=2)
0.0335 ms * -52%
Microsoft Surface Laptop 7 15 Lunar Lake
Samsung PM9C1a MZ9L81T0HDLB
0.03 ms * -36%
Microsoft Surface Laptop 15 Gen 8
SK hynix PVC10 HFS256GEM4X182N
0.022 ms *
Lenovo ThinkPad X9-15p Gen 1
Samsung PM9E1 1 TB MZVLC1T0HFLU
0.021 ms * +5%
Asus Zenbook A16 UX3607
Samsung PM9C1b MZVL81T0HFLB-00BTW
0.019 ms * +14%

* ... smaller is better

Disk Throttling: DiskSpd Read Loop, Queue Depth 8

0285570855114014251710199522802565285031353420370539904275456048455130541557005985627065556840712574107695798082658550883591209405969099751026010545108301111511400116851197012255125401282513110133951368013965Tooltip
Microsoft Surface Laptop 15 Gen 8 SK hynix PVC10 HFS256GEM4X182N; diskspd 2.0.17 f: Ø6131 (5502.51-6156.25) MB/s
Lenovo ThinkPad X9-15p Gen 1 Samsung PM9E1 1 TB MZVLC1T0HFLU; diskspd 2.0.17 f: Ø8537 (5788.93-14160.38) MB/s
Asus Zenbook A16 UX3607 Samsung PM9C1b MZVL81T0HFLB-00BTW; diskspd 2.0.17 f: Ø6739 (2925.13-6893.49) MB/s
Dell XPS 16 Core Ultra X7 358H  ; diskspd 2.0.17 f: Ø7017 (6000.16-7049.37) MB/s
Microsoft Surface Laptop 7 15 Lunar Lake Samsung PM9C1a MZ9L81T0HDLB; diskspd 2.0.17 f: Ø6146 (4937.32-6171.08) MB/s

GPU and Gaming Performance

The highlight of the Core Ultra X CPU is the powerful Arc B390 iGPU, which is much faster than the Adreno X2-85 you get with the Snapdragon SKUs. However, the Surface Laptop cannot utilize the full potential due to the drop to 35 Watts under sustained workloads, which results in a performance drop of around 20 % after a couple of minutes, which is also clearly noticeable in our Cyberpunk gaming test. This is not ideal, but the Arc B390 is still the better choice for a multimedia laptop and there are no compatibility issues with games, either. 

3DMark Performance rating - Percent
Lenovo ThinkPad X9-15p Gen 1 -2!
Intel Arc B390 12 Xe3 Panther Lake iGPU, Intel Core Ultra X7 358H
98.5 pt
Dell XPS 16 Core Ultra X7 358H -2!
Intel Arc B390 12 Xe3 Panther Lake iGPU, Intel Core Ultra X7 358H
95.4 pt
Average of class Multimedia
 
94.8 pt
Average Intel Arc B390 12 Xe3 Panther Lake iGPU
 
85.4 pt
Microsoft Surface Laptop 15 Gen 8
Intel Arc B390 12 Xe3 Panther Lake iGPU, Intel Core Ultra X7 368H
83.5 pt
Asus Zenbook A16 UX3607
Qualcomm Adreno X2-90, Qualcomm Snapdragon X2 Elite Extreme X2E-94-100
64.5 pt
Apple MacBook Air 15 M5 -3!
Apple M5 10-Core GPU, Apple M5 10-Core
57.2 pt
Microsoft Surface Laptop 7 15 Lunar Lake
Intel Arc Graphics 140V, Intel Core Ultra 7 268V
54.7 pt
Microsoft Surface Pro 13 OLED
Qualcomm Adreno X2-85, Qualcomm Snapdragon X2 Elite X2E-78-100
40 pt
Microsoft Surface Laptop 8 13.8
Qualcomm SD X2 Adreno X2-45, Qualcomm Snapdragon X2 Plus X2P-64-100
34.8 pt
3DMark 11 - 1280x720 Performance GPU
Average of class Multimedia
  (3749 - 60002, n=49, last 2 years)
19892 Points +3%
Microsoft Surface Laptop 15 Gen 8
Intel Arc B390 12 Xe3 Panther Lake iGPU, Intel Core Ultra X7 368H
19256 Points
Lenovo ThinkPad X9-15p Gen 1
Intel Arc B390 12 Xe3 Panther Lake iGPU, Intel Core Ultra X7 358H
18972 Points -1%
Average Intel Arc B390 12 Xe3 Panther Lake iGPU
  (14637 - 19804, n=16)
18495 Points -4%
Dell XPS 16 Core Ultra X7 358H
Intel Arc B390 12 Xe3 Panther Lake iGPU, Intel Core Ultra X7 358H
18308 Points -5%
Asus Zenbook A16 UX3607
Qualcomm Adreno X2-90, Qualcomm Snapdragon X2 Elite Extreme X2E-94-100
13847 Points -28%
Microsoft Surface Laptop 7 15 Lunar Lake
Intel Arc Graphics 140V, Intel Core Ultra 7 268V
12772 Points -34%
Microsoft Surface Pro 13 OLED
Qualcomm Adreno X2-85, Qualcomm Snapdragon X2 Elite X2E-78-100
8565 Points -56%
Microsoft Surface Laptop 8 13.8
Qualcomm SD X2 Adreno X2-45, Qualcomm Snapdragon X2 Plus X2P-64-100
7647 Points -60%
3DMark
1920x1080 Fire Strike Graphics
Lenovo ThinkPad X9-15p Gen 1
Intel Arc B390 12 Xe3 Panther Lake iGPU, Intel Core Ultra X7 358H
17351 Points +3%
Dell XPS 16 Core Ultra X7 358H
Intel Arc B390 12 Xe3 Panther Lake iGPU, Intel Core Ultra X7 358H
17018 Points +1%
Microsoft Surface Laptop 15 Gen 8
Intel Arc B390 12 Xe3 Panther Lake iGPU, Intel Core Ultra X7 368H
16839 Points
Average Intel Arc B390 12 Xe3 Panther Lake iGPU
  (13410 - 18327, n=16)
16743 Points -1%
Average of class Multimedia
  (2328 - 48907, n=53, last 2 years)
15695 Points -7%
Asus Zenbook A16 UX3607
Qualcomm Adreno X2-90, Qualcomm Snapdragon X2 Elite Extreme X2E-94-100
11834 Points -30%
Microsoft Surface Laptop 7 15 Lunar Lake
Intel Arc Graphics 140V, Intel Core Ultra 7 268V
10476 Points -38%
Microsoft Surface Pro 13 OLED
Qualcomm Adreno X2-85, Qualcomm Snapdragon X2 Elite X2E-78-100
7617 Points -55%
Microsoft Surface Laptop 8 13.8
Qualcomm SD X2 Adreno X2-45, Qualcomm Snapdragon X2 Plus X2P-64-100
6626 Points -61%
2560x1440 Time Spy Graphics
Lenovo ThinkPad X9-15p Gen 1
Intel Arc B390 12 Xe3 Panther Lake iGPU, Intel Core Ultra X7 358H
7257 Points +13%
Dell XPS 16 Core Ultra X7 358H
Intel Arc B390 12 Xe3 Panther Lake iGPU, Intel Core Ultra X7 358H
6972 Points +9%
Average Intel Arc B390 12 Xe3 Panther Lake iGPU
  (4567 - 7257, n=23)
6497 Points +1%
Microsoft Surface Laptop 15 Gen 8
Intel Arc B390 12 Xe3 Panther Lake iGPU, Intel Core Ultra X7 368H
6407 Points
Average of class Multimedia
  (696 - 19403, n=53, last 2 years)
6065 Points -5%
Microsoft Surface Laptop 7 15 Lunar Lake
Intel Arc Graphics 140V, Intel Core Ultra 7 268V
4415 Points -31%
Asus Zenbook A16 UX3607
Qualcomm Adreno X2-90, Qualcomm Snapdragon X2 Elite Extreme X2E-94-100
4064 Points -37%
Microsoft Surface Pro 13 OLED
Qualcomm Adreno X2-85, Qualcomm Snapdragon X2 Elite X2E-78-100
2605 Points -59%
Microsoft Surface Laptop 8 13.8
Qualcomm SD X2 Adreno X2-45, Qualcomm Snapdragon X2 Plus X2P-64-100
2262 Points -65%
Steel Nomad Score
Average of class Multimedia
  (342 - 4959, n=39, last 2 years)
2011 Points +55%
Average Intel Arc B390 12 Xe3 Panther Lake iGPU
  (1301 - 1667, n=11)
1539 Points +18%
Microsoft Surface Laptop 15 Gen 8
Intel Arc B390 12 Xe3 Panther Lake iGPU, Intel Core Ultra X7 368H
1301 Points
Asus Zenbook A16 UX3607
Qualcomm Adreno X2-90, Qualcomm Snapdragon X2 Elite Extreme X2E-94-100
1264 Points -3%
Apple MacBook Air 15 M5
Apple M5 10-Core GPU, Apple M5 10-Core
1070 Points -18%
Microsoft Surface Laptop 7 15 Lunar Lake
Intel Arc Graphics 140V, Intel Core Ultra 7 268V
910 Points -30%
Microsoft Surface Pro 13 OLED
Qualcomm Adreno X2-85, Qualcomm Snapdragon X2 Elite X2E-78-100
711 Points -45%
Microsoft Surface Laptop 8 13.8
Qualcomm SD X2 Adreno X2-45, Qualcomm Snapdragon X2 Plus X2P-64-100
622 Points -52%
Steel Nomad Light Score
Average of class Multimedia
  (2001 - 21012, n=38, last 2 years)
8315 Points +41%
Average Intel Arc B390 12 Xe3 Panther Lake iGPU
  (5562 - 6338, n=8)
5927 Points +1%
Microsoft Surface Laptop 15 Gen 8
Intel Arc B390 12 Xe3 Panther Lake iGPU, Intel Core Ultra X7 368H
5878 Points
Asus Zenbook A16 UX3607
Qualcomm Adreno X2-90, Qualcomm Snapdragon X2 Elite Extreme X2E-94-100
5492 Points -7%
Apple MacBook Air 15 M5
Apple M5 10-Core GPU, Apple M5 10-Core
5084 Points -14%
Microsoft Surface Laptop 7 15 Lunar Lake
Intel Arc Graphics 140V, Intel Core Ultra 7 268V
3555 Points -40%
Microsoft Surface Pro 13 OLED
Qualcomm Adreno X2-85, Qualcomm Snapdragon X2 Elite X2E-78-100
3464 Points -41%
Microsoft Surface Laptop 8 13.8
Qualcomm SD X2 Adreno X2-45, Qualcomm Snapdragon X2 Plus X2P-64-100
2935 Points -50%
3DMark 11 Performance
18531 points
3DMark Fire Strike Score
13306 points
3DMark Time Spy Score
6854 points
3DMark Steel Nomad Score
1301 points
3DMark Steel Nomad Light Score
5878 points
Help
Blender / v3.3 Classroom CPU
Microsoft Surface Laptop 7 15 Lunar Lake
Intel Arc Graphics 140V, Intel Core Ultra 7 268V
555 Seconds * -62%
Average of class Multimedia
  (133 - 1042, n=57, last 2 years)
372 Seconds * -8%
Apple MacBook Air 15 M5
Apple M5 10-Core GPU, Apple M5 10-Core
344 Seconds * -0%
Microsoft Surface Laptop 15 Gen 8
Intel Arc B390 12 Xe3 Panther Lake iGPU, Intel Core Ultra X7 368H
343 Seconds *
Dell XPS 16 Core Ultra X7 358H
Intel Arc B390 12 Xe3 Panther Lake iGPU, Intel Core Ultra X7 358H
328 Seconds * +4%
Average Intel Arc B390 12 Xe3 Panther Lake iGPU
  (282 - 409, n=16)
327 Seconds * +5%
Asus Zenbook A16 UX3607
Qualcomm Adreno X2-90, Qualcomm Snapdragon X2 Elite Extreme X2E-94-100
320 Seconds * +7%
Lenovo ThinkPad X9-15p Gen 1
Intel Arc B390 12 Xe3 Panther Lake iGPU, Intel Core Ultra X7 358H
288 Seconds * +16%
Blender / v3.3 Classroom METAL
Apple MacBook Air 15 M5
Apple M5 10-Core GPU, Apple M5 10-Core
76.3 Seconds *
Average of class Multimedia
  (17.8 - 68, n=6, last 2 years)
37.2 Seconds *
Blender / v3.3 Classroom oneAPI/Intel
Average of class Multimedia
  (105 - 492, n=17, last 2 years)
249 Seconds *
Average Intel Arc B390 12 Xe3 Panther Lake iGPU
  (105 - 254, n=6)
131.5 Seconds *
Dell XPS 16 Core Ultra X7 358H
Intel Arc B390 12 Xe3 Panther Lake iGPU, Intel Core Ultra X7 358H
105 Seconds *

* ... smaller is better

Performance rating - Percent
Average of class Multimedia
 
95 pt
Lenovo ThinkPad X9-15p Gen 1 -1!
Intel Core Ultra X7 358H, Intel Arc B390 12 Xe3 Panther Lake iGPU
93 pt
Dell XPS 16 Core Ultra X7 358H
Intel Core Ultra X7 358H, Intel Arc B390 12 Xe3 Panther Lake iGPU
88.9 pt
Microsoft Surface Laptop 15 Gen 8
Intel Core Ultra X7 368H, Intel Arc B390 12 Xe3 Panther Lake iGPU
79.3 pt
Asus Zenbook A16 UX3607
Qualcomm Snapdragon X2 Elite Extreme X2E-94-100, Qualcomm Adreno X2-90
73.1 pt
Microsoft Surface Laptop 7 15 Lunar Lake
Intel Core Ultra 7 268V, Intel Arc Graphics 140V
60.5 pt
Apple MacBook Air 15 M5 -5!
Apple M5 10-Core, Apple M5 10-Core GPU
58.3 pt
Cyberpunk 2077 - 1920x1080 Ultra Preset (FSR off)
Lenovo ThinkPad X9-15p Gen 1
Intel Core Ultra X7 358H, Intel Arc B390 12 Xe3 Panther Lake iGPU
50.4 (41.6min, 39.8P1) fps +19%
Dell XPS 16 Core Ultra X7 358H
Intel Core Ultra X7 358H, Intel Arc B390 12 Xe3 Panther Lake iGPU
48.7 (40min, 37.6P1) fps +15%
Average of class Multimedia
  (6.41 - 112.3, n=64, last 2 years)
45.3 fps +7%
Microsoft Surface Laptop 15 Gen 8
Intel Core Ultra X7 368H, Intel Arc B390 12 Xe3 Panther Lake iGPU
42.3 (33.3min) fps
Asus Zenbook A16 UX3607
Qualcomm Snapdragon X2 Elite Extreme X2E-94-100, Qualcomm Adreno X2-90
38.2 (30.9min) fps -10%
Microsoft Surface Laptop 7 15 Lunar Lake
Intel Core Ultra 7 268V, Intel Arc Graphics 140V
29.6 (25min) fps -30%
Apple MacBook Air 15 M5
Apple M5 10-Core, Apple M5 10-Core GPU
23.3 fps -45%
Baldur's Gate 3 - 1920x1080 Ultra Preset AA:T
Average of class Multimedia
  (7.8 - 158.7, n=61, last 2 years)
56 fps +20%
Dell XPS 16 Core Ultra X7 358H
Intel Core Ultra X7 358H, Intel Arc B390 12 Xe3 Panther Lake iGPU
54.3 (48.6min, 49.6P0.1, 51P1) fps +17%
Lenovo ThinkPad X9-15p Gen 1
Intel Core Ultra X7 358H, Intel Arc B390 12 Xe3 Panther Lake iGPU
50.1 (29.6min, 29.8P0.1, 29.9P1) fps +8%
Microsoft Surface Laptop 15 Gen 8
Intel Core Ultra X7 368H, Intel Arc B390 12 Xe3 Panther Lake iGPU
46.6 (42.1min, 42.2P0.1, 43.4P1) fps
Asus Zenbook A16 UX3607
Qualcomm Snapdragon X2 Elite Extreme X2E-94-100, Qualcomm Adreno X2-90
42.5 (28.7min, 29.8P0.1, 39.3P1) fps -9%
Apple MacBook Air 15 M5
Apple M5 10-Core, Apple M5 10-Core GPU
39.4 fps -15%
Microsoft Surface Laptop 7 15 Lunar Lake
Intel Core Ultra 7 268V, Intel Arc Graphics 140V
27.4 fps -41%
GTA V - 1920x1080 Highest AA:4xMSAA + FX AF:16x
Average of class Multimedia
  (7.92 - 141.6, n=48, last 2 years)
55 fps +66%
Lenovo ThinkPad X9-15p Gen 1
Intel Core Ultra X7 358H, Intel Arc B390 12 Xe3 Panther Lake iGPU
46.2 (9.48min, 35.7P1) fps +39%
Dell XPS 16 Core Ultra X7 358H
Intel Core Ultra X7 358H, Intel Arc B390 12 Xe3 Panther Lake iGPU
45.2 (6.18min, 34.5P1) fps +36%
Asus Zenbook A16 UX3607
Qualcomm Snapdragon X2 Elite Extreme X2E-94-100, Qualcomm Adreno X2-90
41.1 (4.34min, 23.8P1) fps +24%
Microsoft Surface Laptop 15 Gen 8
Intel Core Ultra X7 368H, Intel Arc B390 12 Xe3 Panther Lake iGPU
33.2 (4.78min, 24.4P1) fps
Microsoft Surface Laptop 7 15 Lunar Lake
Intel Core Ultra 7 268V, Intel Arc Graphics 140V
25.3 (11.4min, 14.5P1) fps -24%
Final Fantasy XV Benchmark - 1920x1080 High Quality
Lenovo ThinkPad X9-15p Gen 1
Intel Core Ultra X7 358H, Intel Arc B390 12 Xe3 Panther Lake iGPU
57.9 fps +16%
Dell XPS 16 Core Ultra X7 358H
Intel Core Ultra X7 358H, Intel Arc B390 12 Xe3 Panther Lake iGPU
56.2 fps +12%
Average of class Multimedia
  (7.61 - 144.4, n=51, last 2 years)
55.6 fps +11%
Microsoft Surface Laptop 15 Gen 8
Intel Core Ultra X7 368H, Intel Arc B390 12 Xe3 Panther Lake iGPU
50 fps
Microsoft Surface Laptop 7 15 Lunar Lake
Intel Core Ultra 7 268V, Intel Arc Graphics 140V
36.4 fps -27%
Asus Zenbook A16 UX3607
Qualcomm Snapdragon X2 Elite Extreme X2E-94-100, Qualcomm Adreno X2-90
34.5 fps -31%
Strange Brigade - 1920x1080 ultra AA:ultra AF:16
Average of class Multimedia
  (13.3 - 303, n=50, last 2 years)
100.4 fps +13%
Dell XPS 16 Core Ultra X7 358H
Intel Core Ultra X7 358H, Intel Arc B390 12 Xe3 Panther Lake iGPU
90.6 (24.7min, 39.3P1) fps +2%
Microsoft Surface Laptop 15 Gen 8
Intel Core Ultra X7 368H, Intel Arc B390 12 Xe3 Panther Lake iGPU
89.2 (28.1min, 39.2P1) fps
Asus Zenbook A16 UX3607
Qualcomm Snapdragon X2 Elite Extreme X2E-94-100, Qualcomm Adreno X2-90
81.7 (17min, 25.1P1) fps -8%
Microsoft Surface Laptop 7 15 Lunar Lake
Intel Core Ultra 7 268V, Intel Arc Graphics 140V
61.7 (41.5min, 46.9P1) fps -31%
Dota 2 Reborn - 1920x1080 ultra (3/3) best looking
Lenovo ThinkPad X9-15p Gen 1
Intel Core Ultra X7 358H, Intel Arc B390 12 Xe3 Panther Lake iGPU
117.2 (87.1min) fps +47%
Dell XPS 16 Core Ultra X7 358H
Intel Core Ultra X7 358H, Intel Arc B390 12 Xe3 Panther Lake iGPU
96.9 (57min) fps +21%
Average of class Multimedia
  (30.3 - 170.9, n=52, last 2 years)
92.8 fps +16%
Microsoft Surface Laptop 7 15 Lunar Lake
Intel Core Ultra 7 268V, Intel Arc Graphics 140V
82.4 (50.6min) fps +3%
Microsoft Surface Laptop 15 Gen 8
Intel Core Ultra X7 368H, Intel Arc B390 12 Xe3 Panther Lake iGPU
80 (48.4min) fps
Asus Zenbook A16 UX3607
Qualcomm Snapdragon X2 Elite Extreme X2E-94-100, Qualcomm Adreno X2-90
70.7 (51.1min) fps -12%
X-Plane 11.11 - 1920x1080 high (fps_test=3)
Average of class Multimedia
  (16.9 - 103, n=50, last 2 years)
50.6 fps +19%
Lenovo ThinkPad X9-15p Gen 1
Intel Core Ultra X7 358H, Intel Arc B390 12 Xe3 Panther Lake iGPU
42.8 fps +1%
Asus Zenbook A16 UX3607
Qualcomm Snapdragon X2 Elite Extreme X2E-94-100, Qualcomm Adreno X2-90
42.6 fps 0%
Microsoft Surface Laptop 15 Gen 8
Intel Core Ultra X7 368H, Intel Arc B390 12 Xe3 Panther Lake iGPU
42.4 fps
Dell XPS 16 Core Ultra X7 358H
Intel Core Ultra X7 358H, Intel Arc B390 12 Xe3 Panther Lake iGPU
38.8 fps -8%
Microsoft Surface Laptop 7 15 Lunar Lake
Intel Core Ultra 7 268V, Intel Arc Graphics 140V
37.9 fps -11%

Cyberpunk 2077 ultra FPS Chart

051015202530354045Tooltip
Microsoft Surface Laptop 15 Gen 8 Ultra X7 368H, Arc B390 Panther Lake iGPU: Ø34.9 (28.4-37.5) fps
Lenovo ThinkPad X9-15p Gen 1 Ultra X7 358H, Arc B390 Panther Lake iGPU: Ø44.9 (42.5-46.2) fps
Asus Zenbook A16 UX3607 X2E-94-100, X2-90: Ø32.7 (31.5-33.5) fps
Dell XPS 16 Core Ultra X7 358H Ultra X7 358H, Arc B390 Panther Lake iGPU: Ø46 (42.5-47) fps
Microsoft Surface Laptop 7 15 Lunar Lake Core Ultra 7 268V, Arc 140V: Ø26.8 (25-28) fps
lowmed.highultra
GTA V (2015) 176.4 170.4 87.7 33.2
Dota 2 Reborn (2015) 127 85.6 86.9 80
Final Fantasy XV Benchmark (2018) 116.7 68.7 50
X-Plane 11.11 (2018) 61.8 50.2 42.4
Strange Brigade (2018) 307 120.8 101.7 89.2
Baldur's Gate 3 (2023) 71.6 54.3 47.7 46.6
Cyberpunk 2077 (2023) 67.9 60.4 50 42.3
F1 24 (2024) 111.5 109.1 82 28.5

Emissions & Power Consumption

System Noise

Cooling unit
Cooling unit

The Surface Laptop 15 is a very quiet laptop in general, but cooling unit with the single fan has problems with the high short-term TDP of 65 Watts, so the fan will be audible quite quickly under higher workloads. While gaming and during our stress test, we measure up to 41.3 dB(A) and around 36-37 dB(A) in the two less powerful operating modes. GPU load also resulted in some coil whine on our test system.

Noise level

Idle
24.9 / 24.9 / 24.9 dB(A)
Load
32.2 / 41.3 dB(A)
  red to green bar
 
 
30 dB
silent
40 dB(A)
audible
50 dB(A)
loud
 
min: dark, med: mid, max: light   Earthworks M23R, Arta (15 cm distance)   environment noise: 24.9 dB(A)
dB(A) 0102030405060708090Deep BassMiddle BassHigh BassLower RangeMidsHigher MidsLower HighsMid HighsUpper HighsSuper Highs2042.340.438.242.72533.333.93533.93138.940.440.136.14040.841.439.639.55039.139.237.339.16335.735.832.532.18031.430.826.925.110028.632.927.324.612525.130.120.822.316025.527.52220.820026.228.524.121.225026.130.624.321.831528.42518.319.14003121.514.416.350031.422.312.614.163030.522.612.413.880028211112.1100027.319.810.912.8125029.319.910.712.616003320.710.412.2200032.62110.111.8250031.520.610.411.8315028.514.910.812.1400025.313.911.212.3500024.71811.512.4630023.816.911.812.6800027.713.711.612.61000018.213.211.612.41250015.313.311.412.21600013.212.410.611.5SPL41.332.224.925.5N3.81.70.70.7median 27.7median 20.7median 11.6median 12.6Delta2.66.13.32.9hearing rangehide median Fan NoiseMicrosoft Surface Laptop 15 Gen 8
Microsoft Surface Laptop 15 Gen 8
Ultra X7 368H, Arc B390 Panther Lake iGPU
Lenovo ThinkPad X9-15p Gen 1
Ultra X7 358H, Arc B390 Panther Lake iGPU
Asus Zenbook A16 UX3607
X2E-94-100, X2-90
Dell XPS 16 Core Ultra X7 358H
Ultra X7 358H, Arc B390 Panther Lake iGPU
Apple MacBook Air 15 M5
M5 10-Core, M5 10-Core GPU
Microsoft Surface Laptop 7 15 Lunar Lake
Core Ultra 7 268V, Arc 140V
Noise
3%
-5%
-2%
3%
off / environment * (dB)
24.9
22.9
8%
24.9
-0%
23.3
6%
23.9
4%
Idle Minimum * (dB)
24.9
22.9
8%
24.9
-0%
23.4
6%
23.9
4%
Idle Average * (dB)
24.9
22.9
8%
24.9
-0%
23.4
6%
23.9
4%
Idle Maximum * (dB)
24.9
22.9
8%
24.9
-0%
25.8
-4%
23.9
4%
Load Average * (dB)
32.2
31.4
2%
27.9
13%
38
-18%
31.8
1%
Cyberpunk 2077 ultra * (dB)
41.3
43.8
-6%
51.1
-24%
38.1
8%
38
8%
Load Maximum * (dB)
41.3
43.7
-6%
51.1
-24%
48.6
-18%
41.9
-1%

* ... smaller is better

Temperature

The aluminum surfaces can get quite warm under heavy loads, and you can definitely feel it while typing. The bottom panel stays noticeably cooler and it is no problem to put it on your lap. During our stress test, the CPU quickly levels off at 28 Watts (~79 °C).

CPU/iGPU data stress test
Max. Load
40.7 °C
105 F
44.2 °C
112 F
43 °C
109 F
40.2 °C
104 F
41.5 °C
107 F
35.6 °C
96 F
31.7 °C
89 F
29.2 °C
85 F
30.7 °C
87 F
Maximum: 44.2 °C = 112 F
Average: 37.4 °C = 99 F
39.9 °C
104 F
41 °C
106 F
39.4 °C
103 F
37.2 °C
99 F
38.2 °C
101 F
37.2 °C
99 F
31.7 °C
89 F
32.5 °C
91 F
32 °C
90 F
Maximum: 40.3 °C = 105 F
Average: 36.3 °C = 97 F
Power Supply (max.)  42.4 °C = 108 F | Room Temperature 21 °C = 70 F | Fluke t3000FC (calibrated), Voltcraft IR-900
(±) The average temperature for the upper side under maximal load is 37.4 °C / 99 F, compared to the average of 31.3 °C / 88 F for the devices in the class Multimedia.
(±) The maximum temperature on the upper side is 44.2 °C / 112 F, compared to the average of 36.8 °C / 98 F, ranging from 21 to 71 °C for the class Multimedia.
(±) The bottom heats up to a maximum of 40.3 °C / 105 F, compared to the average of 39.1 °C / 102 F
(+) In idle usage, the average temperature for the upper side is 25.4 °C / 78 F, compared to the device average of 31.3 °C / 88 F.
(±) 3: The average temperature for the upper side is 37.1 °C / 99 F, compared to the average of 31.3 °C / 88 F for the class Multimedia.
(+) The palmrests and touchpad are cooler than skin temperature with a maximum of 31.7 °C / 89.1 F and are therefore cool to the touch.
(-) The average temperature of the palmrest area of similar devices was 28.7 °C / 83.7 F (-3 °C / -5.4 F).
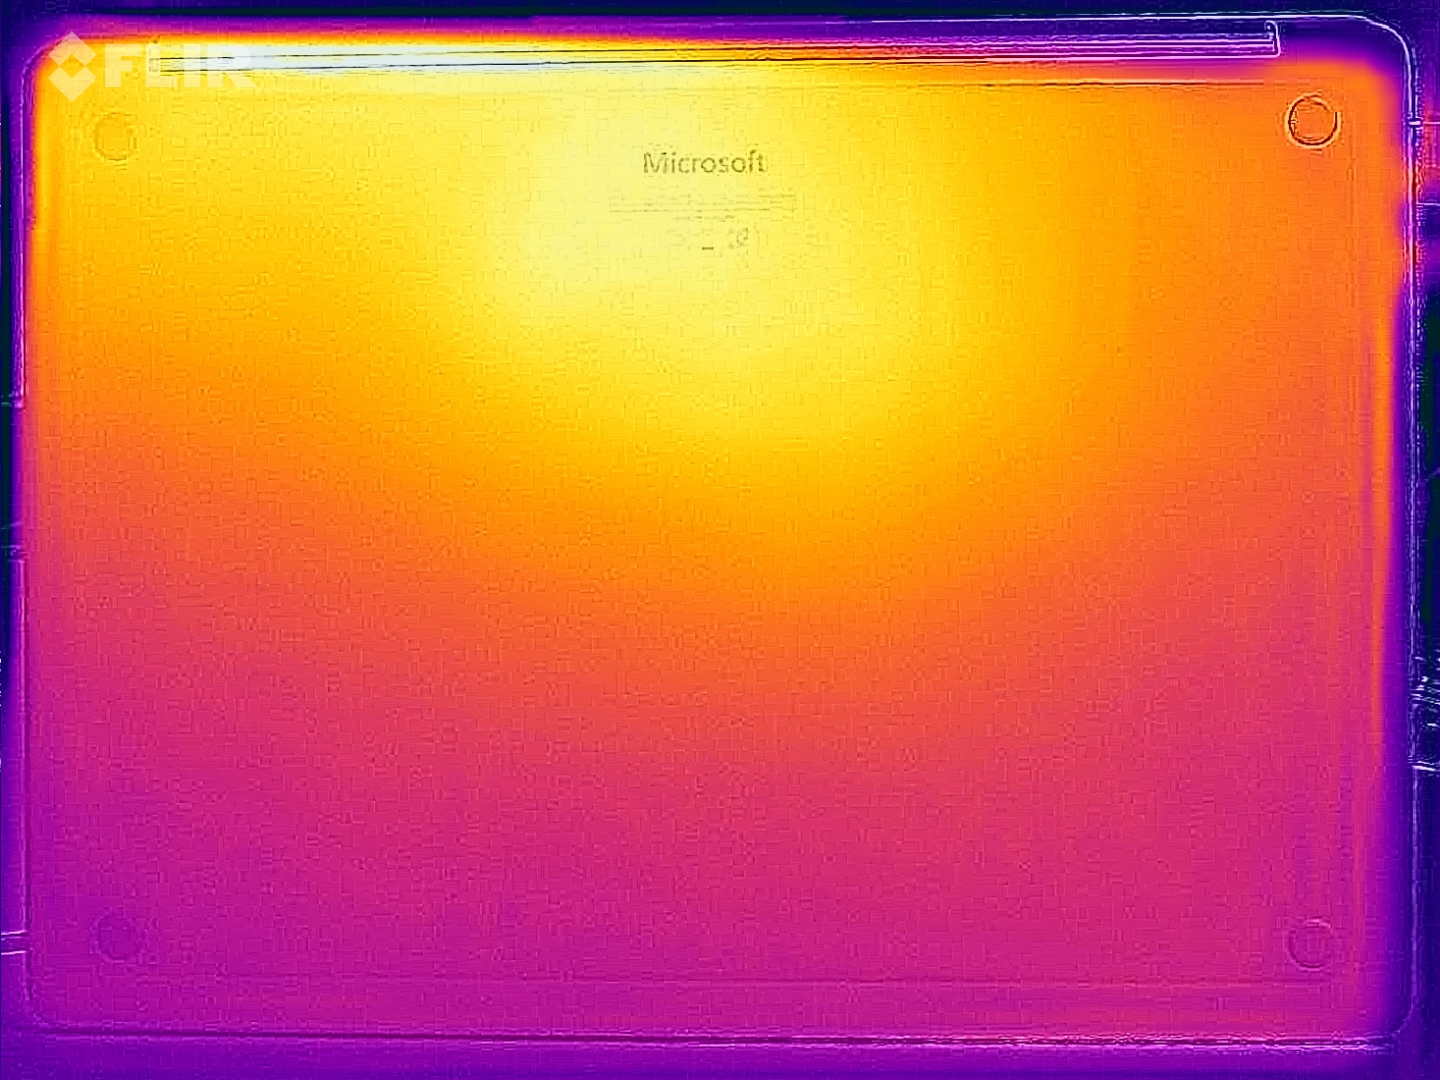
Heatmap stress test (top)
Heatmap stress test (bottom)
Microsoft Surface Laptop 15 Gen 8
Ultra X7 368H, Arc B390 Panther Lake iGPU
Lenovo ThinkPad X9-15p Gen 1
Ultra X7 358H, Arc B390 Panther Lake iGPU
Asus Zenbook A16 UX3607
X2E-94-100, X2-90
Dell XPS 16 Core Ultra X7 358H
Ultra X7 358H, Arc B390 Panther Lake iGPU
Apple MacBook Air 15 M5
M5 10-Core, M5 10-Core GPU
Microsoft Surface Laptop 7 15 Lunar Lake
Core Ultra 7 268V, Arc 140V
Heat
-9%
-2%
7%
2%
3%
Maximum Upper Side * (°C)
44.2
43.3
2%
43.2
2%
40.6
8%
44.1
-0%
45.7
-3%
Maximum Bottom * (°C)
40.3
38.6
4%
43.3
-7%
39.8
1%
43.1
-7%
42.9
-6%
Idle Upper Side * (°C)
26
32.6
-25%
26.7
-3%
23.2
11%
24
8%
23.6
9%
Idle Bottom * (°C)
25.8
30.4
-18%
26
-1%
23.8
8%
23.9
7%
23.1
10%

* ... smaller is better

Speakers

The sound system is still very good, even though the rivals are slightly superior.

dB(A) 0102030405060708090Deep BassMiddle BassHigh BassLower RangeMidsHigher MidsLower HighsMid HighsUpper HighsSuper Highs2038.242.4253533.43140.140.54039.642.15037.339.66332.534.68026.937.110027.34212520.847.51602251.320024.158.125024.360.531518.364.740014.463.150012.665.963012.464.68001168.4100010.971.6125010.770.8160010.471.1200010.170250010.468.3315010.871.7400011.267500011.565.1630011.866.2800011.665.31000011.662.11250011.4621600010.661.8SPL24.980.8N0.750.4median 11.6median 65.1Delta3.34.332.233.127.830.126.326.32829.135.135.621.822.81941.718.454.715.761.618.464.914.470.320.167.112.468.91371.31369.512.373.31275.411.971.312.367.712.467.911.762.812.461.312.360.512.760.612.660.112.664.714.566.412.465.812.370.11270.225.180.30.651.3median 12.4median 67.10.74.337.338.429.33024.725.526.131.42729.526.136.121.545.418.953.61860.116.76219.268.721.570.415.473.313.269.410.469.51173.19.978.510.574.610.874.710.574.410.672.811.972.512.871.913.669.41465.314.466.11468.713.26013.458.413.25524.984.50.665median 13.2median 69.435.134.430.125.621.323.921.219.421.428.424.821.432.619.852.916.560.314.161.514.464.614.464.11468.914.274.212.473.710.977.910.373.110.274.49.475.29.675.41073.41070.510.8731172.611.473.312.369.412.167.712.766.112.772.712.672.812.472.323.485.10.570median 12.3median 72.71.82.744.343.434.933.735.236.733.532.227.330.334.739.425.149.92254.918.260.918.159.720.466.322.268.41770.414.568.413.368.613.370.412.268.11267.911.773.211.773.911.571.31270.212.36912.373.612.775.112.775.912.876.612.973.612.870.212.759.625.284.80.766.8median 12.8median 70.223.240.442.830.834.230.432.534.935.728.63326.533.92139.318.84418.650.916.350.71857.918.761.215.564.912.562.711.366.411.467.210.769.910.168.710.368.810.670.210.969.711.365.311.46611.964.412.263.912.159.912.158.612.260.712.261.811.859.123.978.80.545.3median 12.1median 63.92.14.1hearing rangehide median Pink NoiseMicrosoft Surface Laptop 15 Gen 8Lenovo ThinkPad X9-15p Gen 1Asus Zenbook A16 UX3607Dell XPS 16 Core Ultra X7 358HApple MacBook Air 15 M5Microsoft Surface Laptop 7 15 Lunar Lake
Frequency diagram (checkboxes can be checked and unchecked to compare devices)
Microsoft Surface Laptop 15 Gen 8 audio analysis

(±) | speaker loudness is average but good (80.8 dB)
Bass 100 - 315 Hz
(±) | reduced bass - on average 11.1% lower than median
(±) | linearity of bass is average (8.6% delta to prev. frequency)
Mids 400 - 2000 Hz
(+) | balanced mids - only 3.7% away from median
(+) | mids are linear (3.5% delta to prev. frequency)
Highs 2 - 16 kHz
(+) | balanced highs - only 2.3% away from median
(+) | highs are linear (4.5% delta to prev. frequency)
Overall 100 - 16.000 Hz
(+) | overall sound is linear (11.1% difference to median)
Compared to same class
» 17% of all tested devices in this class were better, 3% similar, 80% worse
» The best had a delta of 5%, average was 17%, worst was 45%
Compared to all devices tested
» 7% of all tested devices were better, 2% similar, 91% worse
» The best had a delta of 4%, average was 23%, worst was 136%

Lenovo ThinkPad X9-15p Gen 1 audio analysis

(±) | speaker loudness is average but good (80.3 dB)
Bass 100 - 315 Hz
(+) | good bass - only 4.2% away from median
(±) | linearity of bass is average (10.2% delta to prev. frequency)
Mids 400 - 2000 Hz
(+) | balanced mids - only 3.9% away from median
(+) | mids are linear (5.2% delta to prev. frequency)
Highs 2 - 16 kHz
(+) | balanced highs - only 4.3% away from median
(+) | highs are linear (2.6% delta to prev. frequency)
Overall 100 - 16.000 Hz
(+) | overall sound is linear (8.9% difference to median)
Compared to same class
» 11% of all tested devices in this class were better, 2% similar, 87% worse
» The best had a delta of 5%, average was 17%, worst was 45%
Compared to all devices tested
» 3% of all tested devices were better, 1% similar, 96% worse
» The best had a delta of 4%, average was 23%, worst was 136%

Asus Zenbook A16 UX3607 audio analysis

(+) | speakers can play relatively loud (84.5 dB)
Bass 100 - 315 Hz
(±) | reduced bass - on average 6.4% lower than median
(±) | linearity of bass is average (8.3% delta to prev. frequency)
Mids 400 - 2000 Hz
(+) | balanced mids - only 3.9% away from median
(+) | mids are linear (4.2% delta to prev. frequency)
Highs 2 - 16 kHz
(+) | balanced highs - only 3.3% away from median
(+) | highs are linear (5% delta to prev. frequency)
Overall 100 - 16.000 Hz
(+) | overall sound is linear (9.8% difference to median)
Compared to same class
» 14% of all tested devices in this class were better, 2% similar, 84% worse
» The best had a delta of 5%, average was 17%, worst was 45%
Compared to all devices tested
» 4% of all tested devices were better, 1% similar, 95% worse
» The best had a delta of 4%, average was 23%, worst was 136%

Dell XPS 16 Core Ultra X7 358H audio analysis

(+) | speakers can play relatively loud (85.1 dB)
Bass 100 - 315 Hz
(±) | reduced bass - on average 7.6% lower than median
(+) | bass is linear (6.1% delta to prev. frequency)
Mids 400 - 2000 Hz
(+) | balanced mids - only 2.1% away from median
(+) | mids are linear (3.4% delta to prev. frequency)
Highs 2 - 16 kHz
(+) | balanced highs - only 2.3% away from median
(+) | highs are linear (4.1% delta to prev. frequency)
Overall 100 - 16.000 Hz
(+) | overall sound is linear (6.2% difference to median)
Compared to same class
» 4% of all tested devices in this class were better, 0% similar, 96% worse
» The best had a delta of 5%, average was 17%, worst was 45%
Compared to all devices tested
» 0% of all tested devices were better, 0% similar, 99% worse
» The best had a delta of 4%, average was 23%, worst was 136%

Apple MacBook Air 15 M5 audio analysis

(+) | speakers can play relatively loud (84.8 dB)
Bass 100 - 315 Hz
(±) | reduced bass - on average 6.8% lower than median
(+) | bass is linear (6.6% delta to prev. frequency)
Mids 400 - 2000 Hz
(+) | balanced mids - only 2% away from median
(+) | mids are linear (3.3% delta to prev. frequency)
Highs 2 - 16 kHz
(+) | balanced highs - only 3.6% away from median
(+) | highs are linear (3.2% delta to prev. frequency)
Overall 100 - 16.000 Hz
(+) | overall sound is linear (7.7% difference to median)
Compared to same class
» 2% of all tested devices in this class were better, 0% similar, 98% worse
» The best had a delta of 5%, average was 18%, worst was 53%
Compared to all devices tested
» 1% of all tested devices were better, 0% similar, 98% worse
» The best had a delta of 4%, average was 23%, worst was 136%

Microsoft Surface Laptop 7 15 Lunar Lake audio analysis

(±) | speaker loudness is average but good (78.8 dB)
Bass 100 - 315 Hz
(±) | reduced bass - on average 9.3% lower than median
(±) | linearity of bass is average (8.4% delta to prev. frequency)
Mids 400 - 2000 Hz
(+) | balanced mids - only 4.4% away from median
(+) | mids are linear (3% delta to prev. frequency)
Highs 2 - 16 kHz
(+) | balanced highs - only 2.4% away from median
(+) | highs are linear (4.1% delta to prev. frequency)
Overall 100 - 16.000 Hz
(+) | overall sound is linear (11.4% difference to median)
Compared to same class
» 4% of all tested devices in this class were better, 2% similar, 95% worse
» The best had a delta of 7%, average was 21%, worst was 53%
Compared to all devices tested
» 8% of all tested devices were better, 2% similar, 90% worse
» The best had a delta of 4%, average was 23%, worst was 136%

Power Consumption and Battery Life

The 65W PSU is insufficient.

The Panther Lake SKU is more efficient while idling compared to the old Lunar Lake model, despite the updated display. The battery runtime in our Wi-Fi test is still a bit shorter, which is a result of the higher short-term TDP. However, the results are still very good with almost 16 hours in our Wi-Fi test at 150 nits and 8.5 hours at maximum brightness. The 65W power adapter, however, is insufficient, which is hardly surprising considering the short-term TDP of 65 Watts. This means the battery has to be used in peak load scenarios. We also tried a 140W power adapter, but the device simply does not accept more power.

Power Consumption
Off / Standbydarklight 0.28 / 0.38 Watt
Idledarkmidlight 2 / 7.6 / 8.1 Watt
Load midlight 54.4 / 62.6 Watt
 color bar
Key: min: dark, med: mid, max: light        Metrahit Energy

Power Consumption Cyberpunk / Stress Test

051015202530354045505560Tooltip
Microsoft Surface Laptop 15 Gen 8; 1280x720 Prime95 28.10 and Furmark 1.25: Ø51.8 (46.4-62.3) Watt
Microsoft Surface Laptop 15 Gen 8; Idle 150cd/m2: Ø4.01 (3.89-4.61) Watt
Microsoft Surface Laptop 15 Gen 8; Cyberpunk 2077 FHD ultra no FSR 150cd: Ø51.1 (47.7-57.2) Watt

Power Consumption external Monitor

051015202530354045505560Tooltip
Microsoft Surface Laptop 15 Gen 8; Prime95 V2810 Stress (external Monitor): Ø54.6 (38.9-62.5) Watt
Microsoft Surface Laptop 15 Gen 8; Cinebench R23 Single (external Monitor): Ø25.1 (23.8-34.4) Watt
Microsoft Surface Laptop 15 Gen 8; Cinebench R23 Multi (external Monitor): Ø57.3 (53.5-62.6) Watt
Microsoft Surface Laptop 15 Gen 8; 1280x720 FurMark 1.19 GPU Stress Test (external Monitor): Ø56.4 (50.3-61.2) Watt
Microsoft Surface Laptop 15 Gen 8; Idle 1min (external Monitor): Ø6.93 (6.67-7.61) Watt
Microsoft Surface Laptop 15 Gen 8; Cyberpunk 2077 FHD ultra no FSR (external Monitor): Ø51.8 (50.9-55.1) Watt
Battery Runtime
WiFi Websurfing
15h 46min
WiFi Websurfing max. Brightness
8h 35min
Battery Runtime
WiFi Websurfing
Lenovo ThinkPad X9-15p Gen 1
Ultra X7 358H, Arc B390 Panther Lake iGPU, 88 Wh (Edge 150, 60 Hz)
18.3 h +16%
Microsoft Surface Laptop 7 15 Lunar Lake
Core Ultra 7 268V, Arc 140V, 64 Wh
17.7 h +12%
Apple MacBook Air 15 M5
M5 10-Core, M5 10-Core GPU, 66.5 Wh
17.2 h +9%
Microsoft Surface Laptop 15 Gen 8
Ultra X7 368H, Arc B390 Panther Lake iGPU, 66 Wh
15.8 h
Asus Zenbook A16 UX3607
X2E-94-100, X2-90, 70 Wh
13 h -18%
Average of class Multimedia
  (4.37 - 26.6, n=59, last 2 years)
13 h -18%
Dell XPS 16 Core Ultra X7 358H
Ultra X7 358H, Arc B390 Panther Lake iGPU, 70 Wh
10.3 h -35%
WiFi Websurfing max. Brightness
Lenovo ThinkPad X9-15p Gen 1
Ultra X7 358H, Arc B390 Panther Lake iGPU, 88 Wh (Edge 150, 30 - 120 Hz VRR)
9.6 h +12%
Lenovo ThinkPad X9-15p Gen 1
Ultra X7 358H, Arc B390 Panther Lake iGPU, 88 Wh (Edge 150, 60 Hz)
9.2 h +7%
Microsoft Surface Laptop 7 15 Lunar Lake
Core Ultra 7 268V, Arc 140V, 64 Wh
8.8 h +2%
Microsoft Surface Laptop 15 Gen 8
Ultra X7 368H, Arc B390 Panther Lake iGPU, 66 Wh
8.6 h
Average of class Multimedia
  (3.53 - 11.6, n=30, last 2 years)
7.28 h -15%
Apple MacBook Air 15 M5
M5 10-Core, M5 10-Core GPU, 66.5 Wh
6.7 h -22%
Asus Zenbook A16 UX3607
X2E-94-100, X2-90, 70 Wh
6.4 h -26%

Notebookcheck Rating

Microsoft Surface Laptop 15 Gen 8 - 10/05/2026 v8
Andreas Osthoff

Chassis
84 / 98 → 86%
Keyboard
85%
Pointing Device
94%
Connectivity
75 / 80 → 93%
Weight
67 / 20-74 → 87%
Battery
90 / 95 → 95%
Display
84%
Games Performance
58 / 88 → 65%
Application Performance
89 / 92 → 96%
AI Performance
90%
Temperature
91%
Noise
77 / 95 → 81%
Audio
87%
Camera
40 / 75 → 53%
Average
75%
85%
Multimedia - Weighted Average
CO2 Emissions
77.1%
Materials
50%
Packaging
100%
Power Use
88.7%
Repairability
60%
Software Updates
22.3%
Recycle Logo Total Sustainability Score: 66.4%

Potential Competitors in Comparison

Image
Model / Review
Price
Weight
Height
Display
1.
85.3%
Microsoft Surface Laptop 15 Gen 8
Intel Core Ultra X7 368H ⎘
Intel Arc B390 12 Xe3 Panther Lake iGPU ⎘
16 GB Memory, 256 GB SSD
Amazon:
1. $238.94
Microsoft Surface Laptop 3 1...
2. $483.98
Microsoft Surface Laptop 5 1...
3. $685.00
Microsoft Surface Laptop 4 1...
List Price: 2400€
1.7 kg18.3 mm15.00"
3270x2180
262 PPI
IPS
2.
89.9%
Lenovo ThinkPad X9-15p Gen 1
Intel Core Ultra X7 358H ⎘
Intel Arc B390 12 Xe3 Panther Lake iGPU ⎘
32 GB Memory, 1024 GB SSD
List Price: 2500 Euro1.5 kg18 mm15.30"
2880x1800
222 PPI
OLED
3.
87.5%
Asus Zenbook A16 UX3607
Qualcomm Snapdragon X2 Elite Extreme X2E-94-100 ⎘
Qualcomm Adreno X2-90 ⎘
48 GB Memory, 1000 GB SSD
Amazon:
1. $2,299.99
ASUS Zenbook A16 16" Laptop,...
2. $2,299.99
ASUS Zenbook A16 AI Laptop, ...
3. $1,999.00
EXCaliberPC [2026] ASUS Zenb...
1.2 kg16.5 mm16.00"
2880x1800
212 PPI
OLED
4.
87.2%
Dell XPS 16 Core Ultra X7 358H
Intel Core Ultra X7 358H ⎘
Intel Arc B390 12 Xe3 Panther Lake iGPU ⎘
32 GB Memory
Amazon:
1. $1,977.99
Dell Premium 16 (Previously ...
2. $1,999.00
Dell Premium 16 (Previously ...
3. $1,849.99
Dell XPS 14 Premium Laptop 1...
List Price: 2350 USD
1.7 kg14.62 mm16.00"
3200x2000
236 PPI
OLED
5.
91.6%
Apple MacBook Air 15 M5
Apple M5 10-Core ⎘
Apple M5 10-Core GPU ⎘
32 GB Memory, 2048 GB SSD
1.5 kg11.5 mm15.30"
2880x1864
224 PPI
IPS
6.
87.4%
Microsoft Surface Laptop 7 15 Lunar Lake
Intel Core Ultra 7 268V ⎘
Intel Arc Graphics 140V ⎘
32 GB Memory, 1024 GB SSD
List Price: 2760€1.7 kg18.3 mm15.00"
2496x1664
200 PPI
IPS

Transparency

The selection of devices to be reviewed is made by our editorial team. The test sample was provided to the author as a loan by the manufacturer or retailer for the purpose of this review. The lender had no influence on this review, nor did the manufacturer receive a copy of this review before publication. There was no obligation to publish this review. As an independent media company, Notebookcheck is not subjected to the authority of manufacturers, retailers or publishers.

This is how Notebookcheck is testing

Every year, Notebookcheck independently reviews hundreds of laptops and smartphones using standardized procedures to ensure that all results are comparable. We have continuously developed our test methods for around 20 years and set industry standards in the process. In our test labs, high-quality measuring equipment is utilized by experienced technicians and editors. These tests involve a multi-stage validation process. Our complex rating system is based on hundreds of well-founded measurements and benchmarks, which maintains objectivity. Further information on our test methods can be found here.

Google LogoAdd as a preferred source on Google
Mail Logo

No comments for this article

Got questions or something to add to our article? Even without registering you can post in the comments!
No comments for this article / reply

static version load dynamic
Loading Comments
> Expert reviews and news on laptops, smartphones and tech innovations > Reviews > Microsoft's best laptop uses an Intel CPU - Surface Laptop 15 Gen 8 Review
Andreas Osthoff, 2026-10- 5 (Update: 2026-10- 5)