Verdict
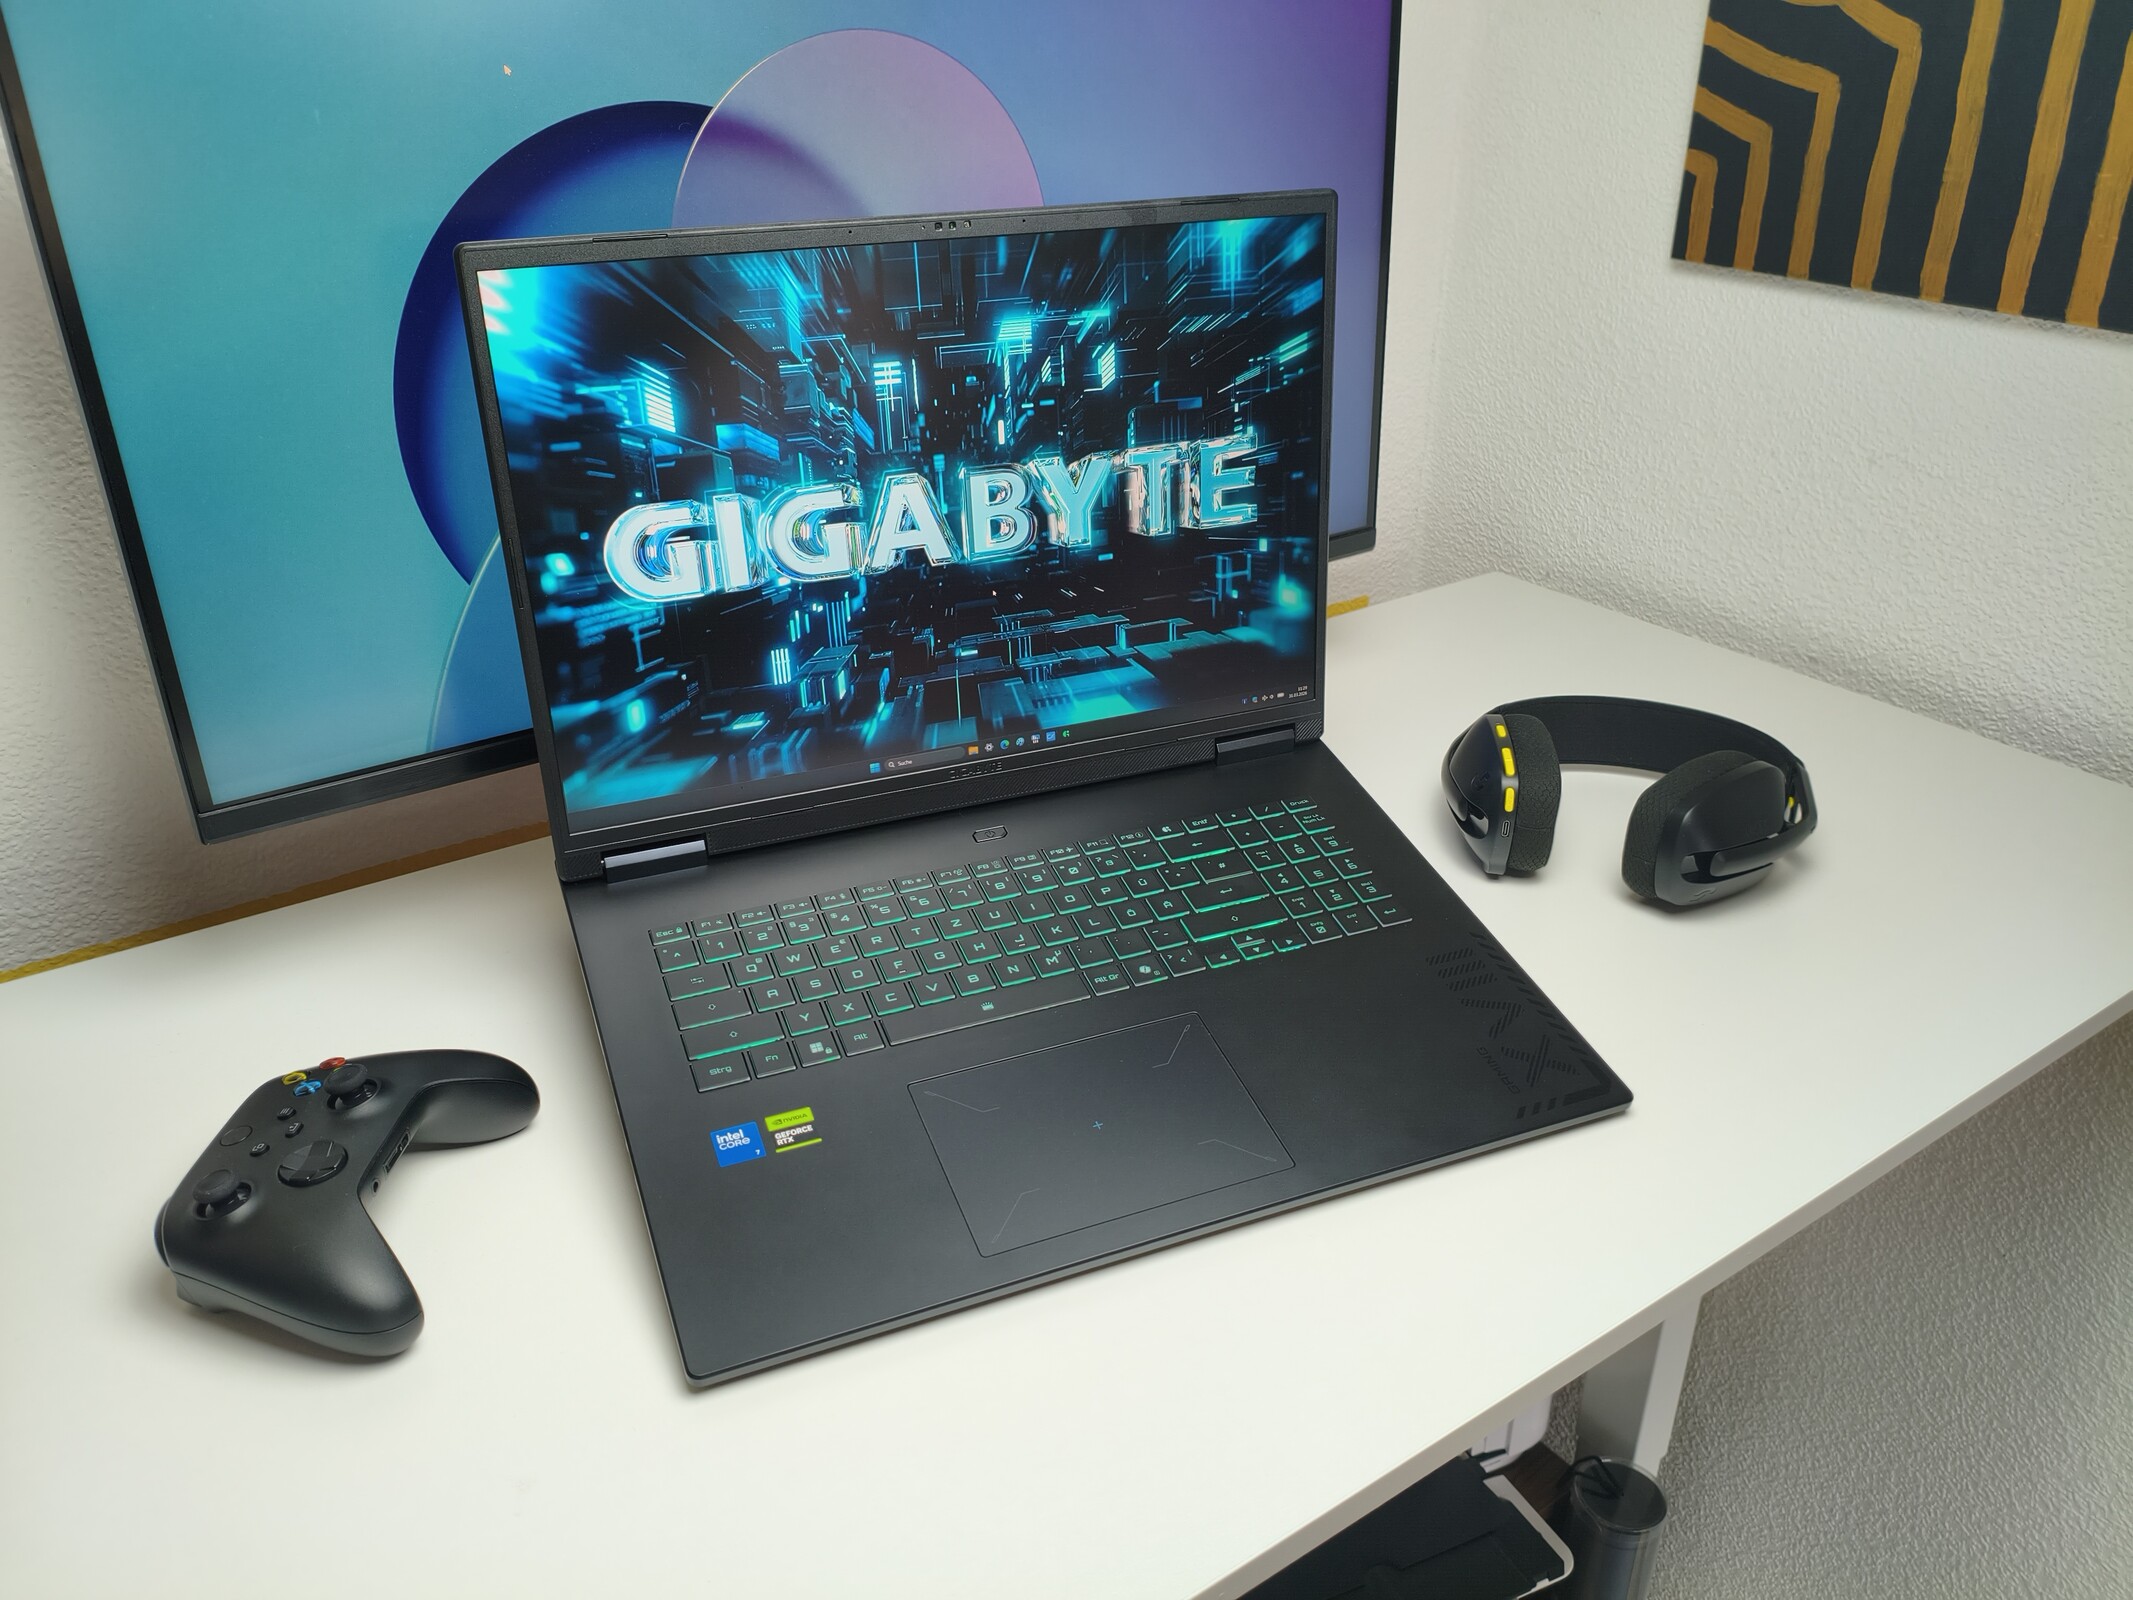
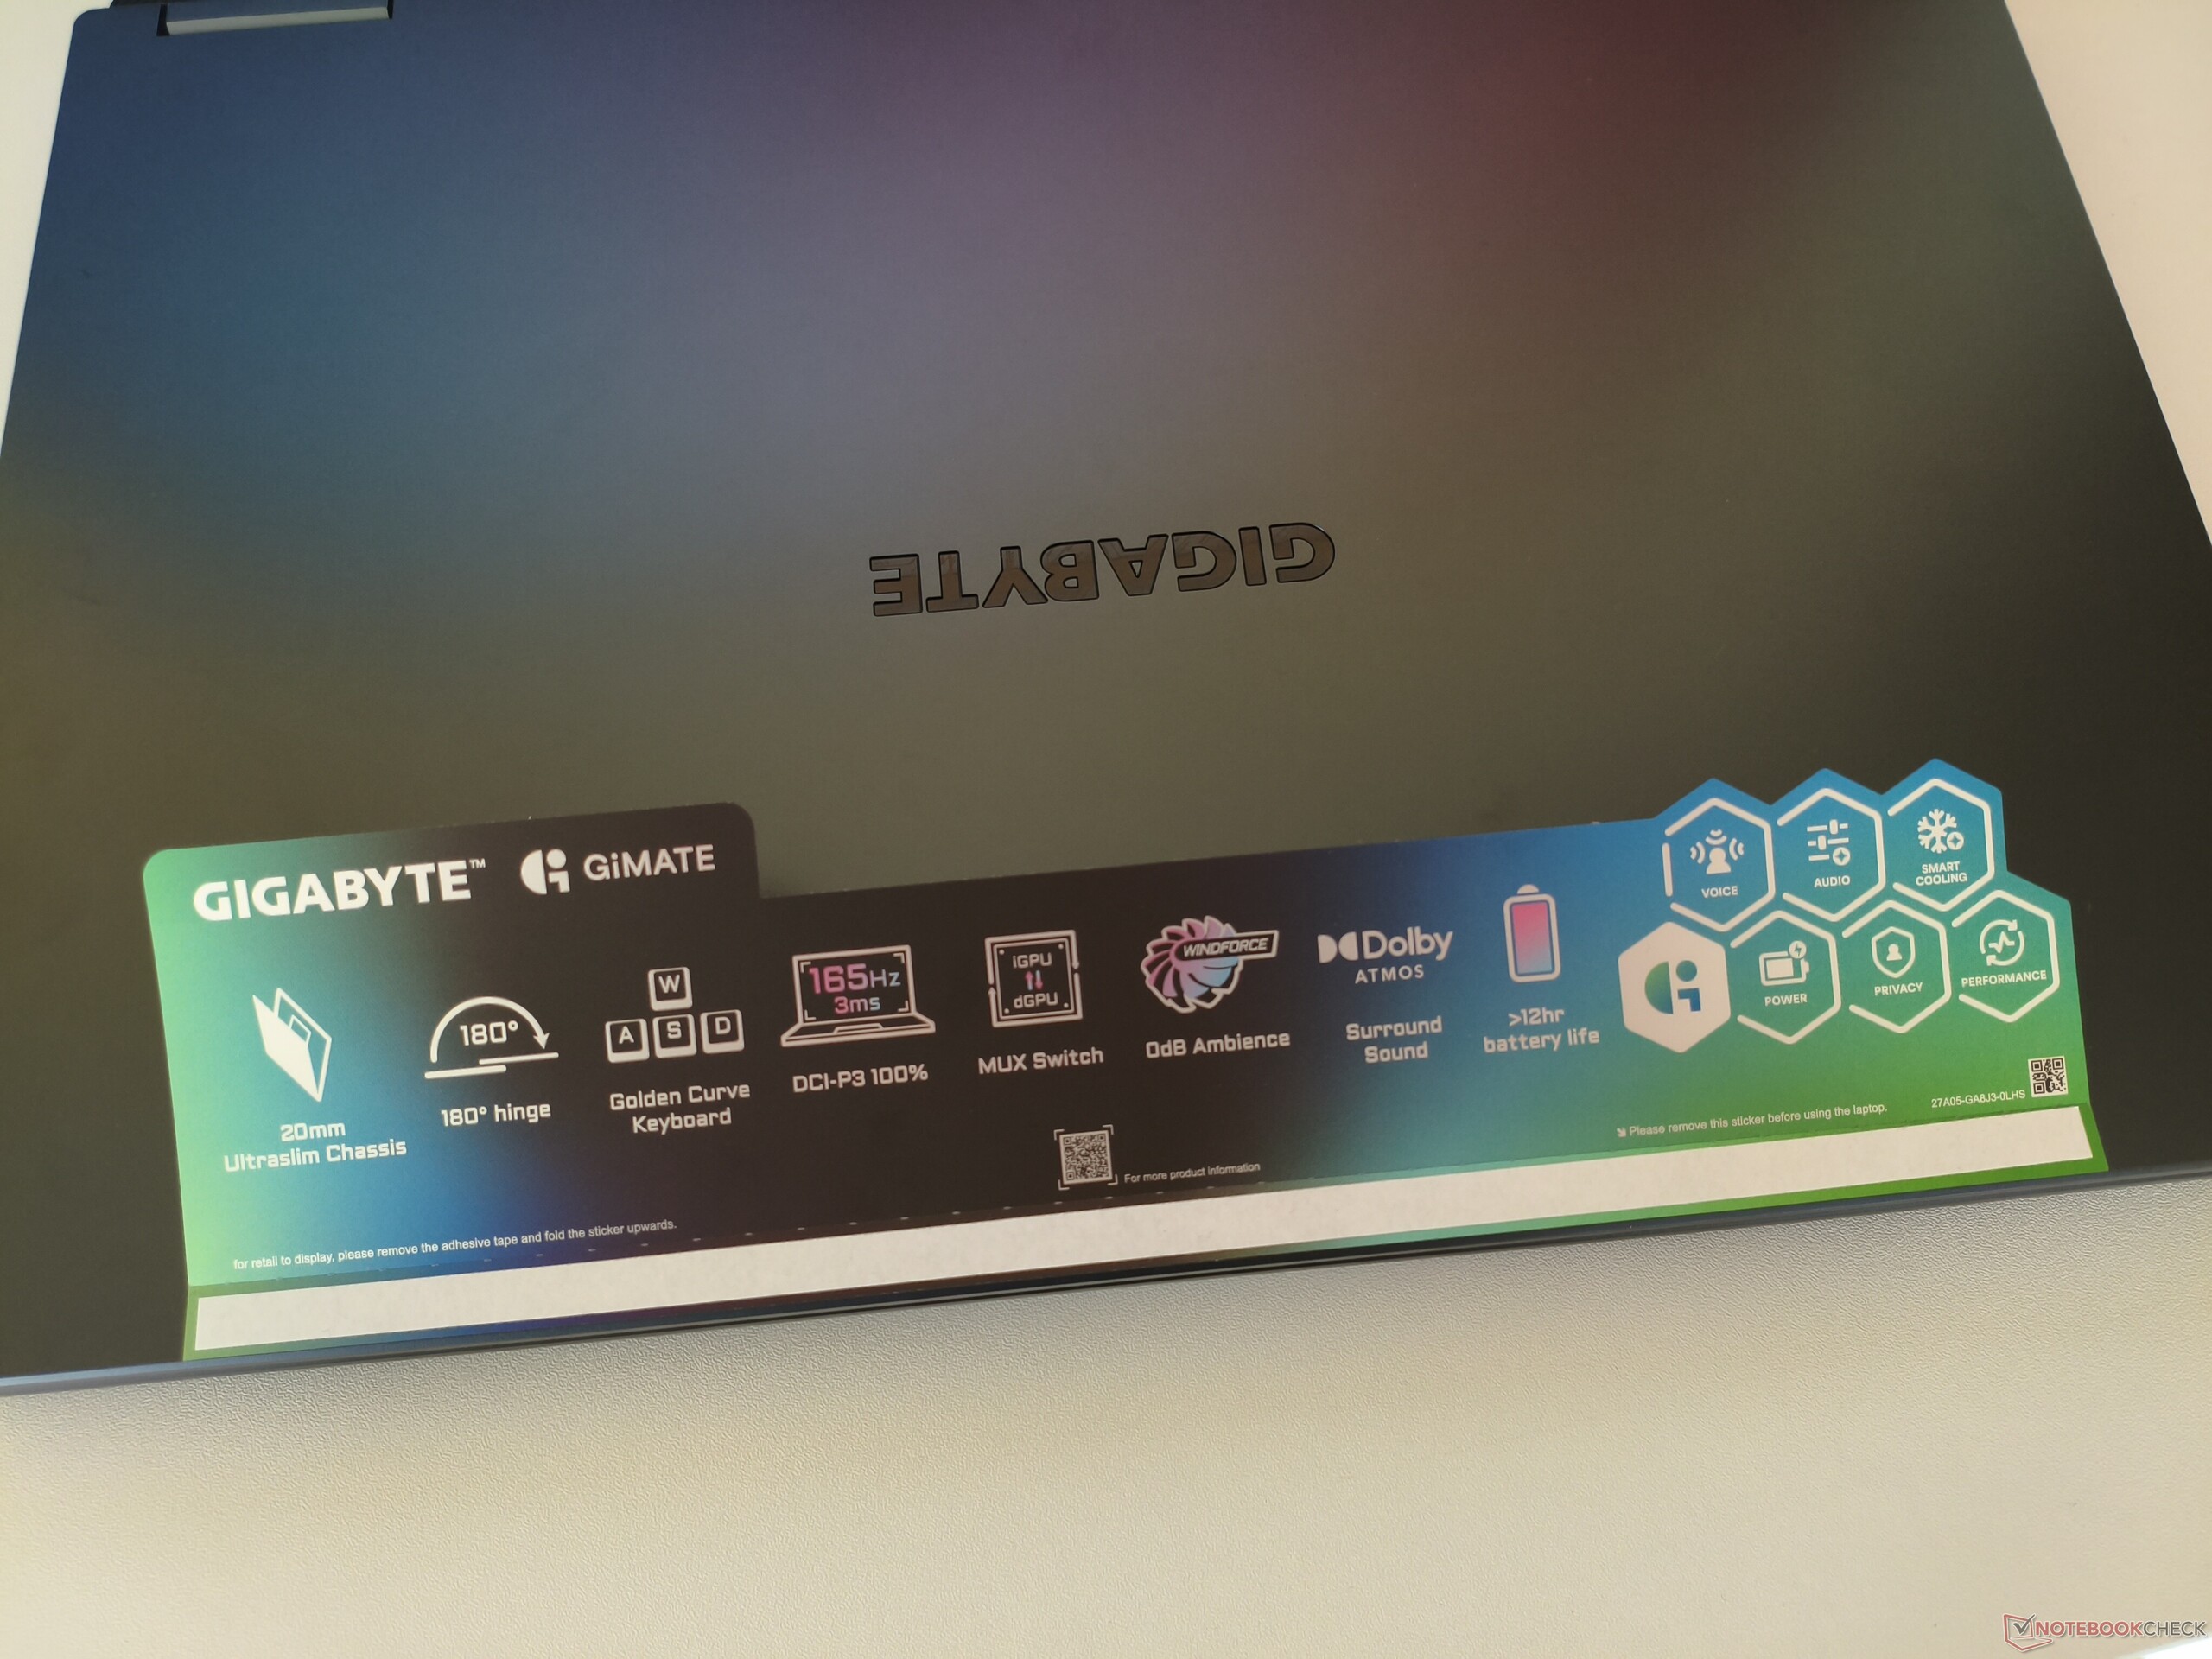
While 18-inch notebooks were quite rare just a few years ago, more and more large-screen models are now entering the market. After recently testing the 16-inch Gigabyte Gaming A16 Pro, we turned our attention to its bigger sibling, the 18-inch version. Although the case is made entirely of plastic, the chassis leaves a solid visual impression. Combined with its slim design, the laptop doesn’t feel overly bulky despite its generous size. The display quality is decent, though not particularly outstanding. The 165 Hz panel offers a wide color gamut and ample screen real estate, but aspects such as brightness could still be improved.
In other areas, the Gigabyte laptop also struggles to keep up with the competition. While its performance in gaming mode is respectable, the device becomes extremely loud. Noise levels are more tolerable with Balanced profile, but this comes at the cost of significantly reduced 3D performance. To achieve a higher overall rating, Gigabyte should also improve the connectivity options (no card reader, no Thunderbolt/USB 4), the speakers, and the battery capacity. Furthermore, the soldered RAM limits the device’s long-term upgradability. On the plus side, the 18-inch laptop offers relatively moderate power consumption for a gaming device, a large touchpad, and an unoccupied M.2 slot.
Pros
Cons
Price and availability
According to Gigabyte, the test configuration with a Core 7 240H and RTX 5070 Ti is expected to cost around $1,850. For comparison, the already available non-Pro version featuring a Ryzen 7 260 and a GeForce RTX 5070 currently retails for approximately $2,000.
- $1,573.99GIGABYTE Gaming A18 Gaming Laptop - 165Hz 2560x1600 WQXGA - NVIDIA GeForce RTX 5060 - AMD Ryzen 7 260-1TB SSD with 32GB DDR5 RAM - Windows 11 Home - Black Steel
- $1,999.99GIGABYTE Gaming A18 Gaming Laptop - 165Hz 2560x1600 WQXGA - NVIDIA GeForce RTX 5070 - AMD Ryzen 7 260-1TB SSD with 32GB DDR5 RAM - Windows 11 Home - Black Steel
- $1,909.00GIGABYTE Gaming A18 Gaming Laptop, 2026, 18" 2560x1600 165Hz, AMD 8-Core Ryzen 7 260, NVIDIA GeForce RTX 5060, 32GB DDR5, 2TB SSD, Win11 Pro, RGB Backlit KB, Wi-Fi 6E, BT 5.2, 1080p IR Camera, Black
For this article, we selected the Asus TUF Gaming A18 and the Acer Nitro 18 AI (both equipped with an RTX 5070), the MSI Vector A18 HX (RTX 5070 Ti), and the current 18-inch reference model, the Lenovo Legion 9 18 (RTX 5080) as competitors.
Specifications
Case
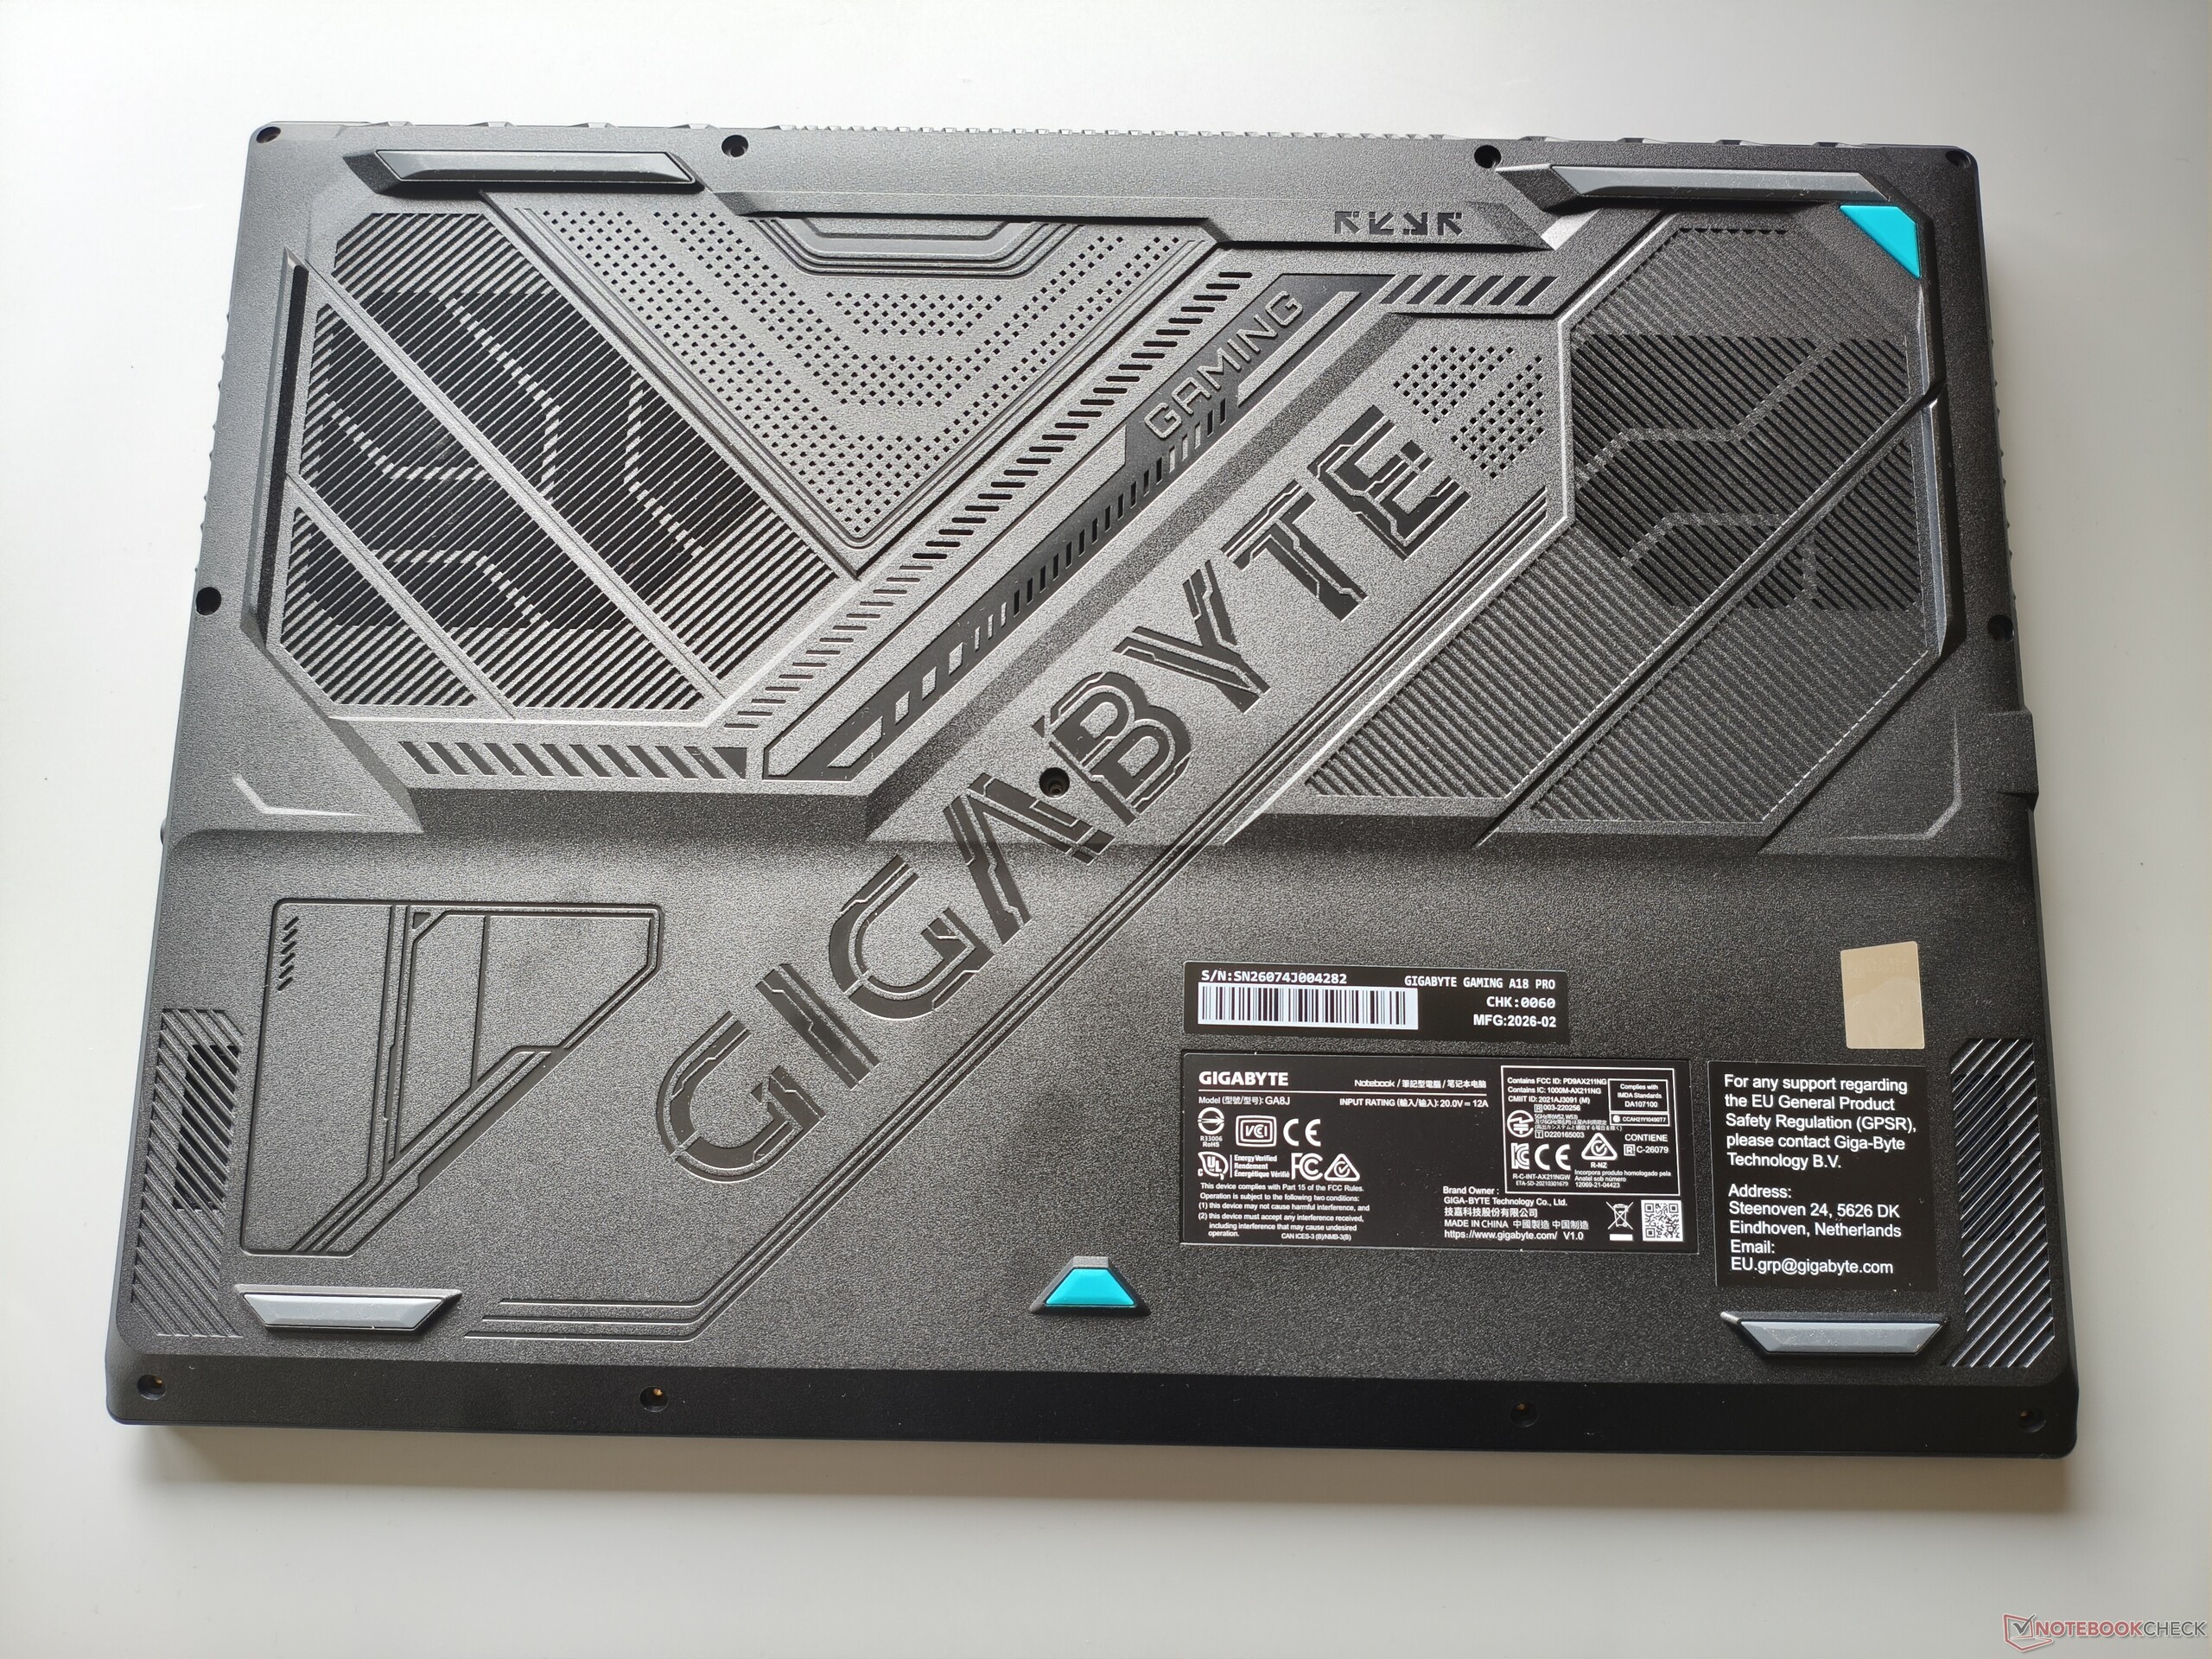
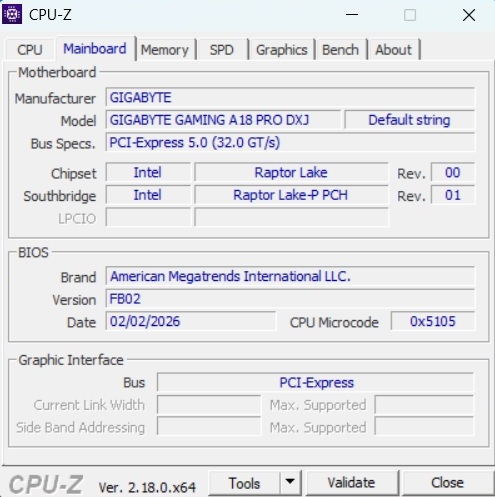
Gigabyte has opted for a rather clean design with the Gaming A18 Pro, which, apart from the boldly designed underside of the chassis, avoids any major experimentation. The dark gray surfaces feel solid and stable in most areas, and the hinges—allowing the display to open up to 180°—perform their function unobtrusively for the most part. The same applies to the build quality, which leaves little to be desired.
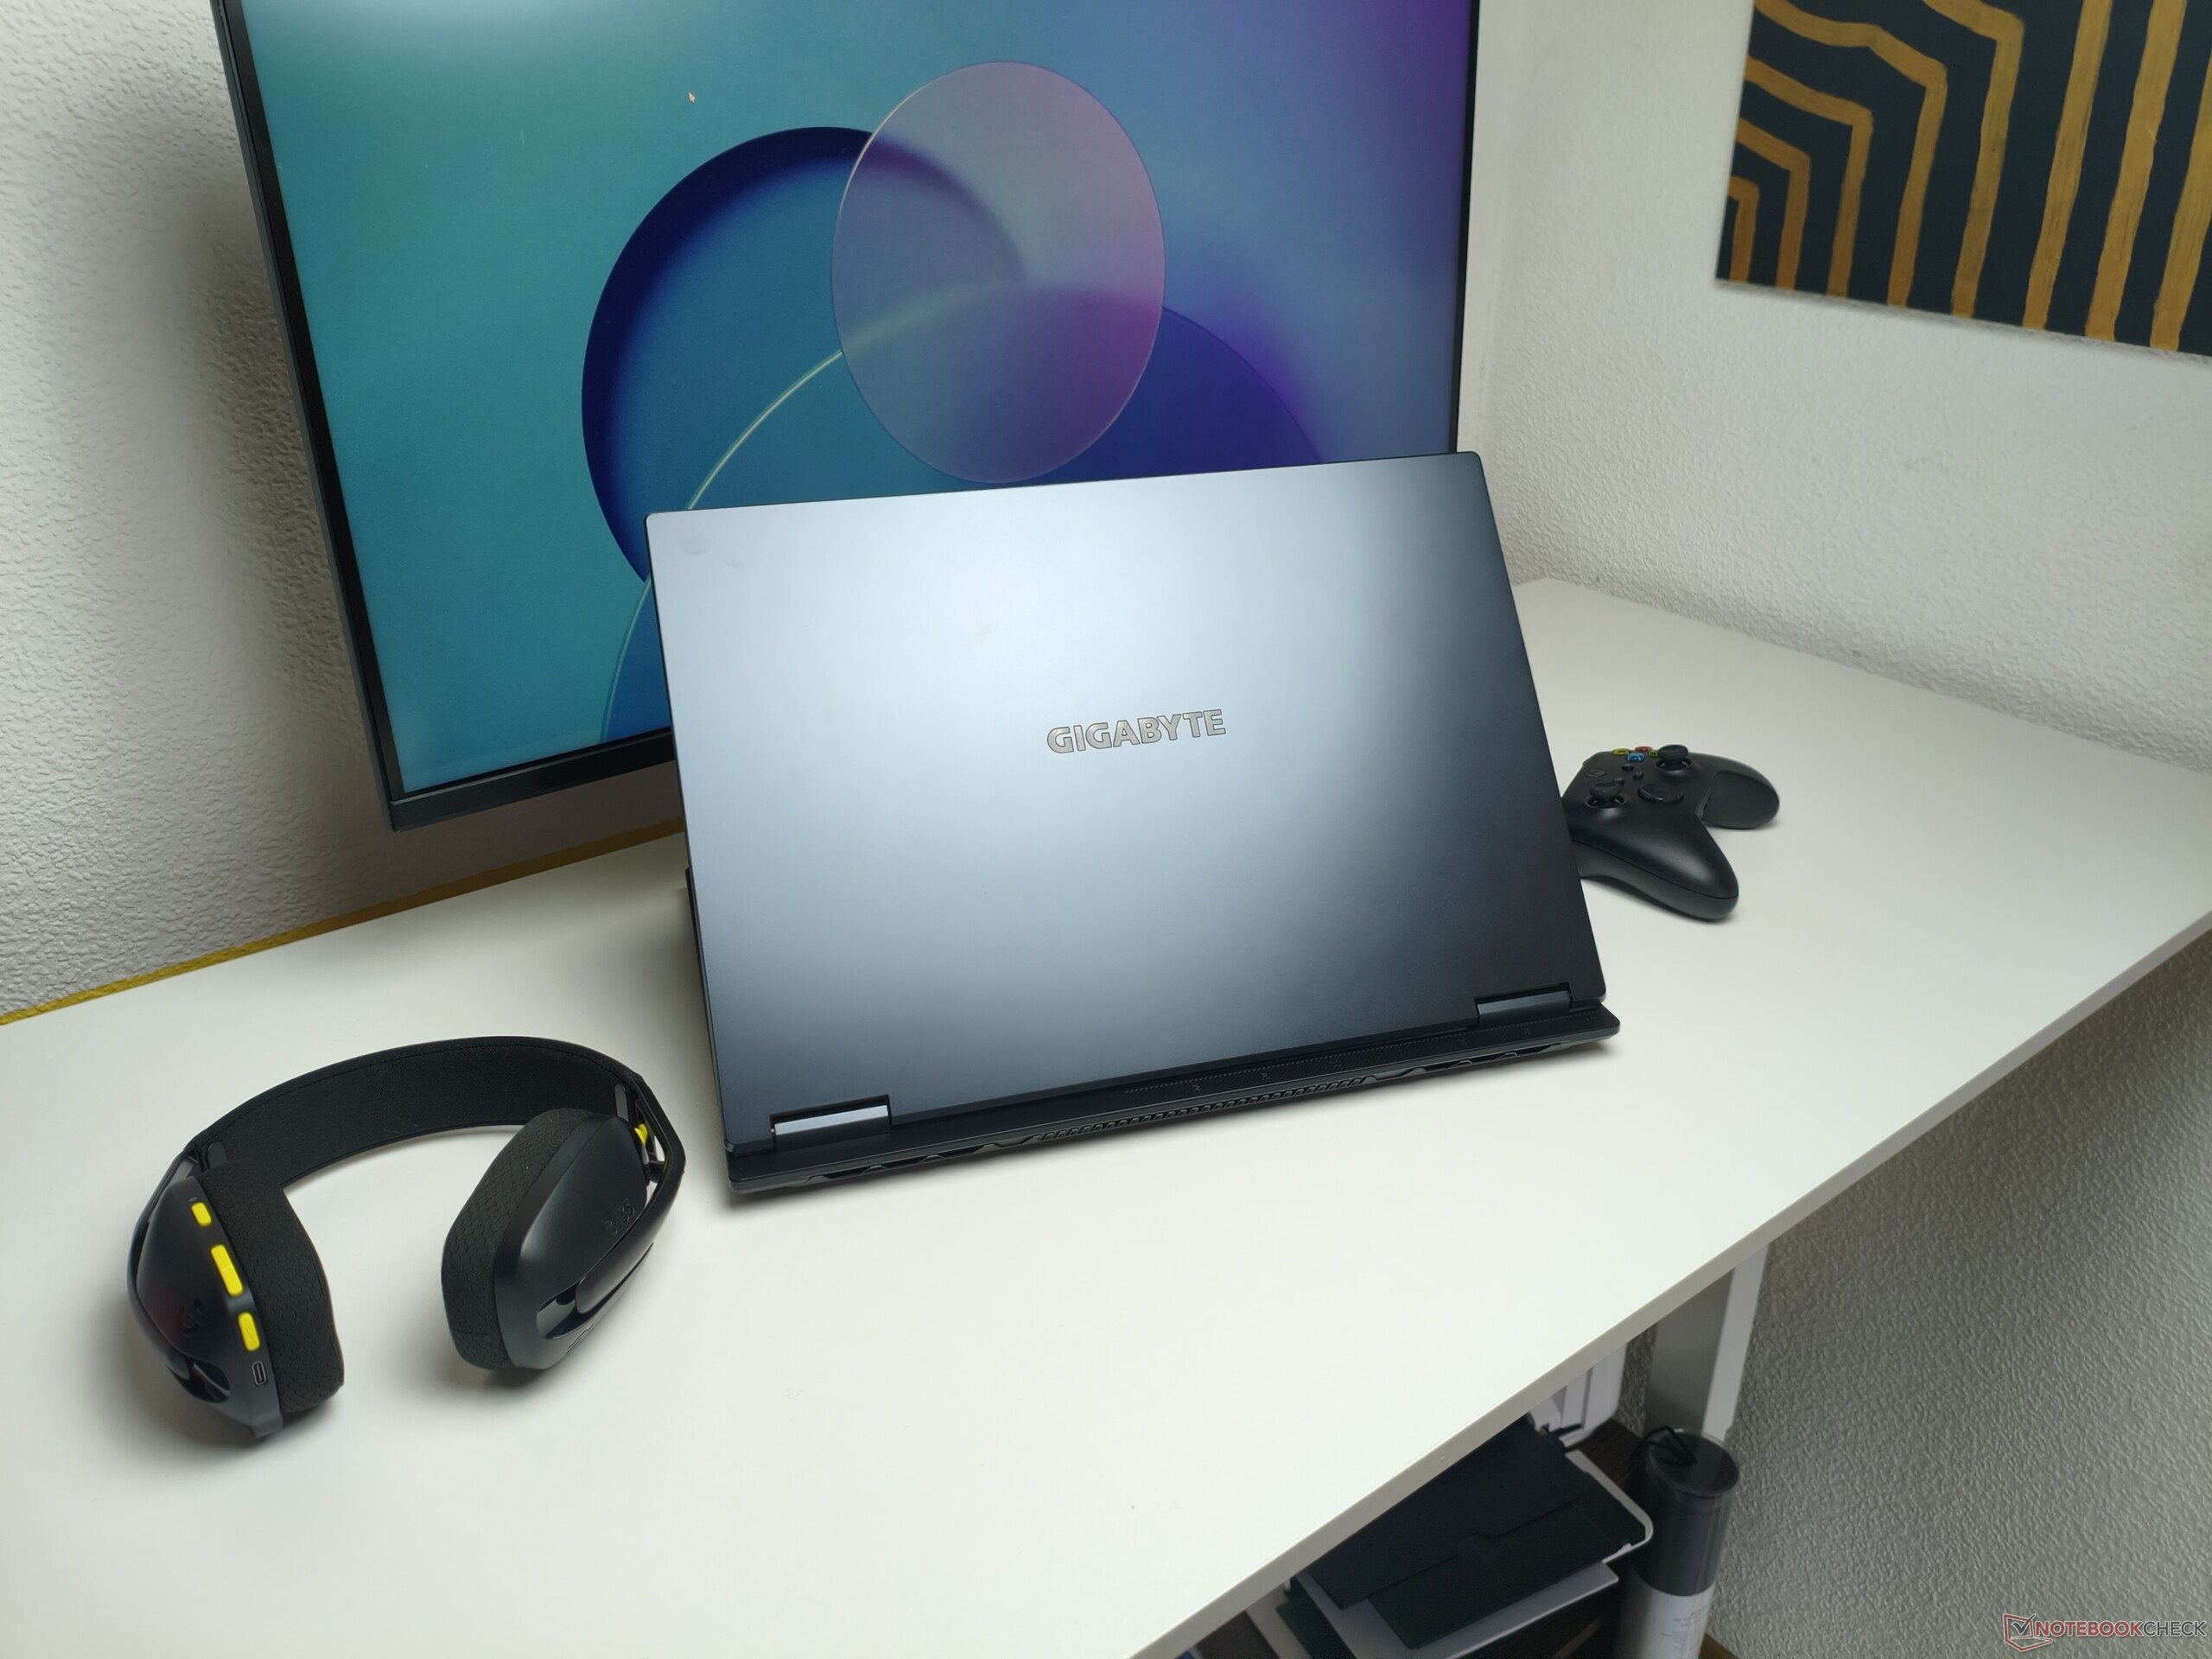
Weighing just over 6.4 lbs, the 18-inch laptop is certainly no featherweight, but it is still lighter than some competitors such as the MSI Vector A18 and the Lenovo Legion 9 18 (both around 7.7 lbs).
Connectivity
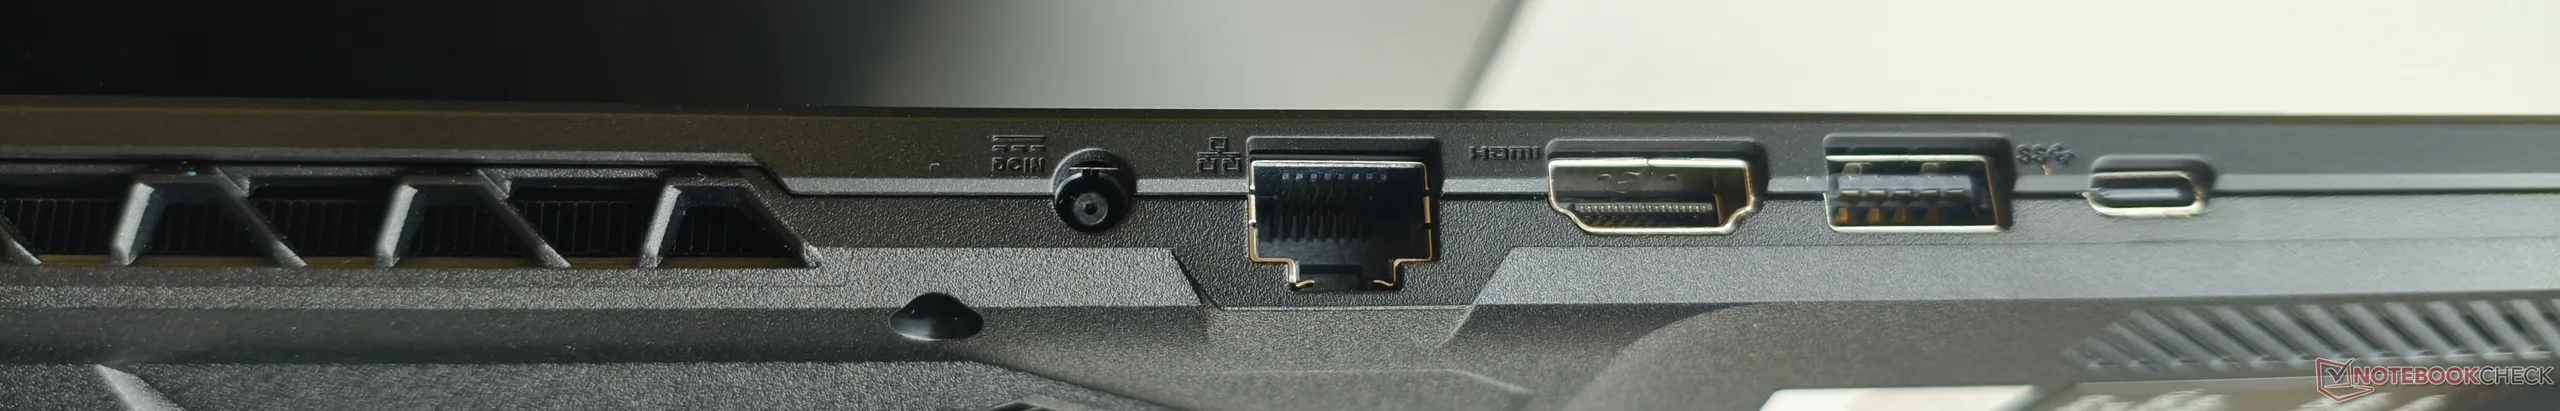
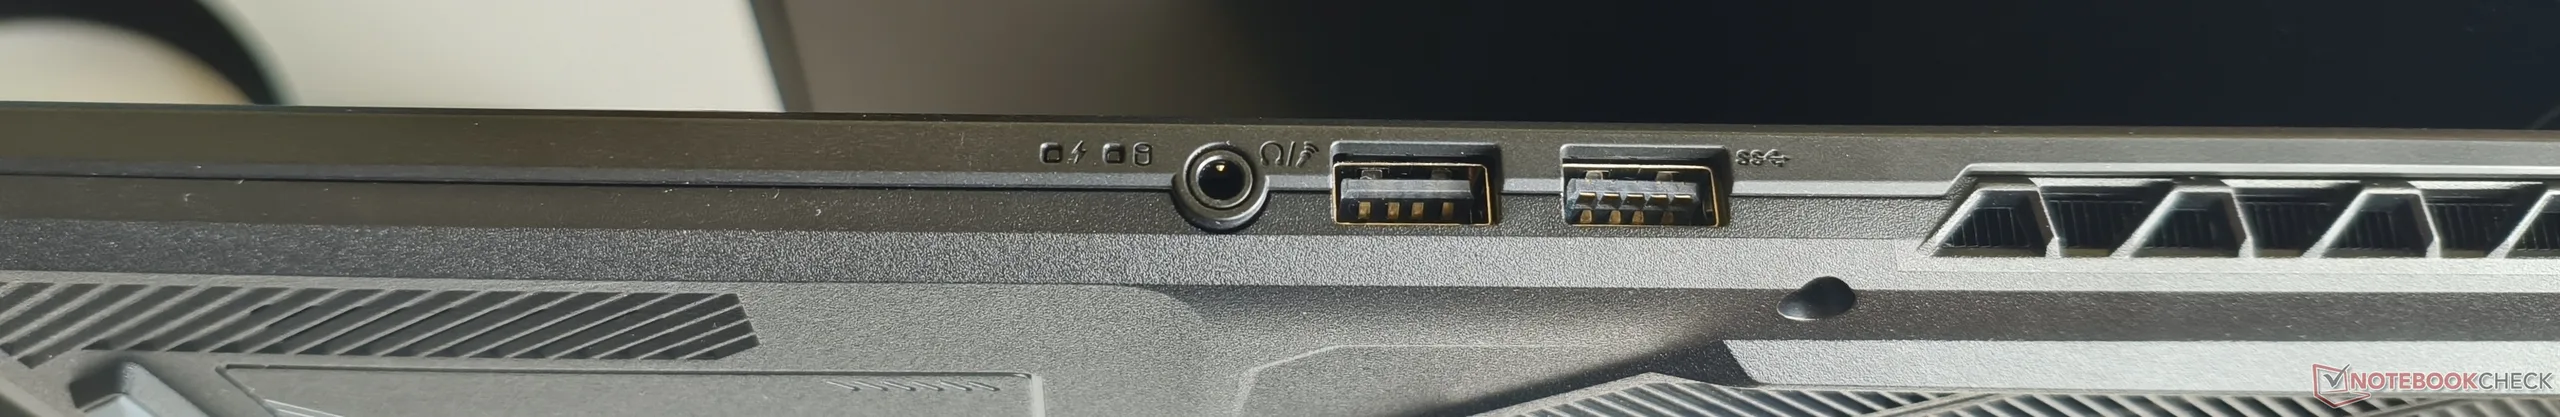
Interfaces
For an 18-inch laptop, the port selection is not particularly generous. While four USB ports are certainly adequate, we would have preferred more than one Type-C port, especially since USB 4 is not supported. The absence of a card reader is also a drawback.
Communication
Intel’s Wi-Fi 6E module (AX211) delivers its usual strong performance. Since we recently updated our reference router, directly comparable results from rival laptops are not available at this time.
| Networking | |
| iperf3 transmit RT-BE96U WiFi7 | |
| Average of class Gaming (1989 - 4088, n=3, last 2 years) | |
| Lenovo Yoga Slim 7a 14AGP11 | |
| Gigabyte Gaming A18 Pro | |
| Average Intel Wi-Fi 6E AX211 (n=1) | |
| iperf3 receive RT-BE96U WiFi7 | |
| Average of class Gaming (1471 - 3144, n=3, last 2 years) | |
| Lenovo Yoga Slim 7a 14AGP11 | |
| Gigabyte Gaming A18 Pro | |
| Average Intel Wi-Fi 6E AX211 (n=1) | |
Webcam
Mediocre color accuracy aside, the Full HD webcam performs surprisingly well, particularly in terms of image sharpness. The image appears noticeably less washed out than on other notebooks.


Accessories
The laptop comes with a few user manuals and a 240-watt power supply weighing just under 1.1 lbs.
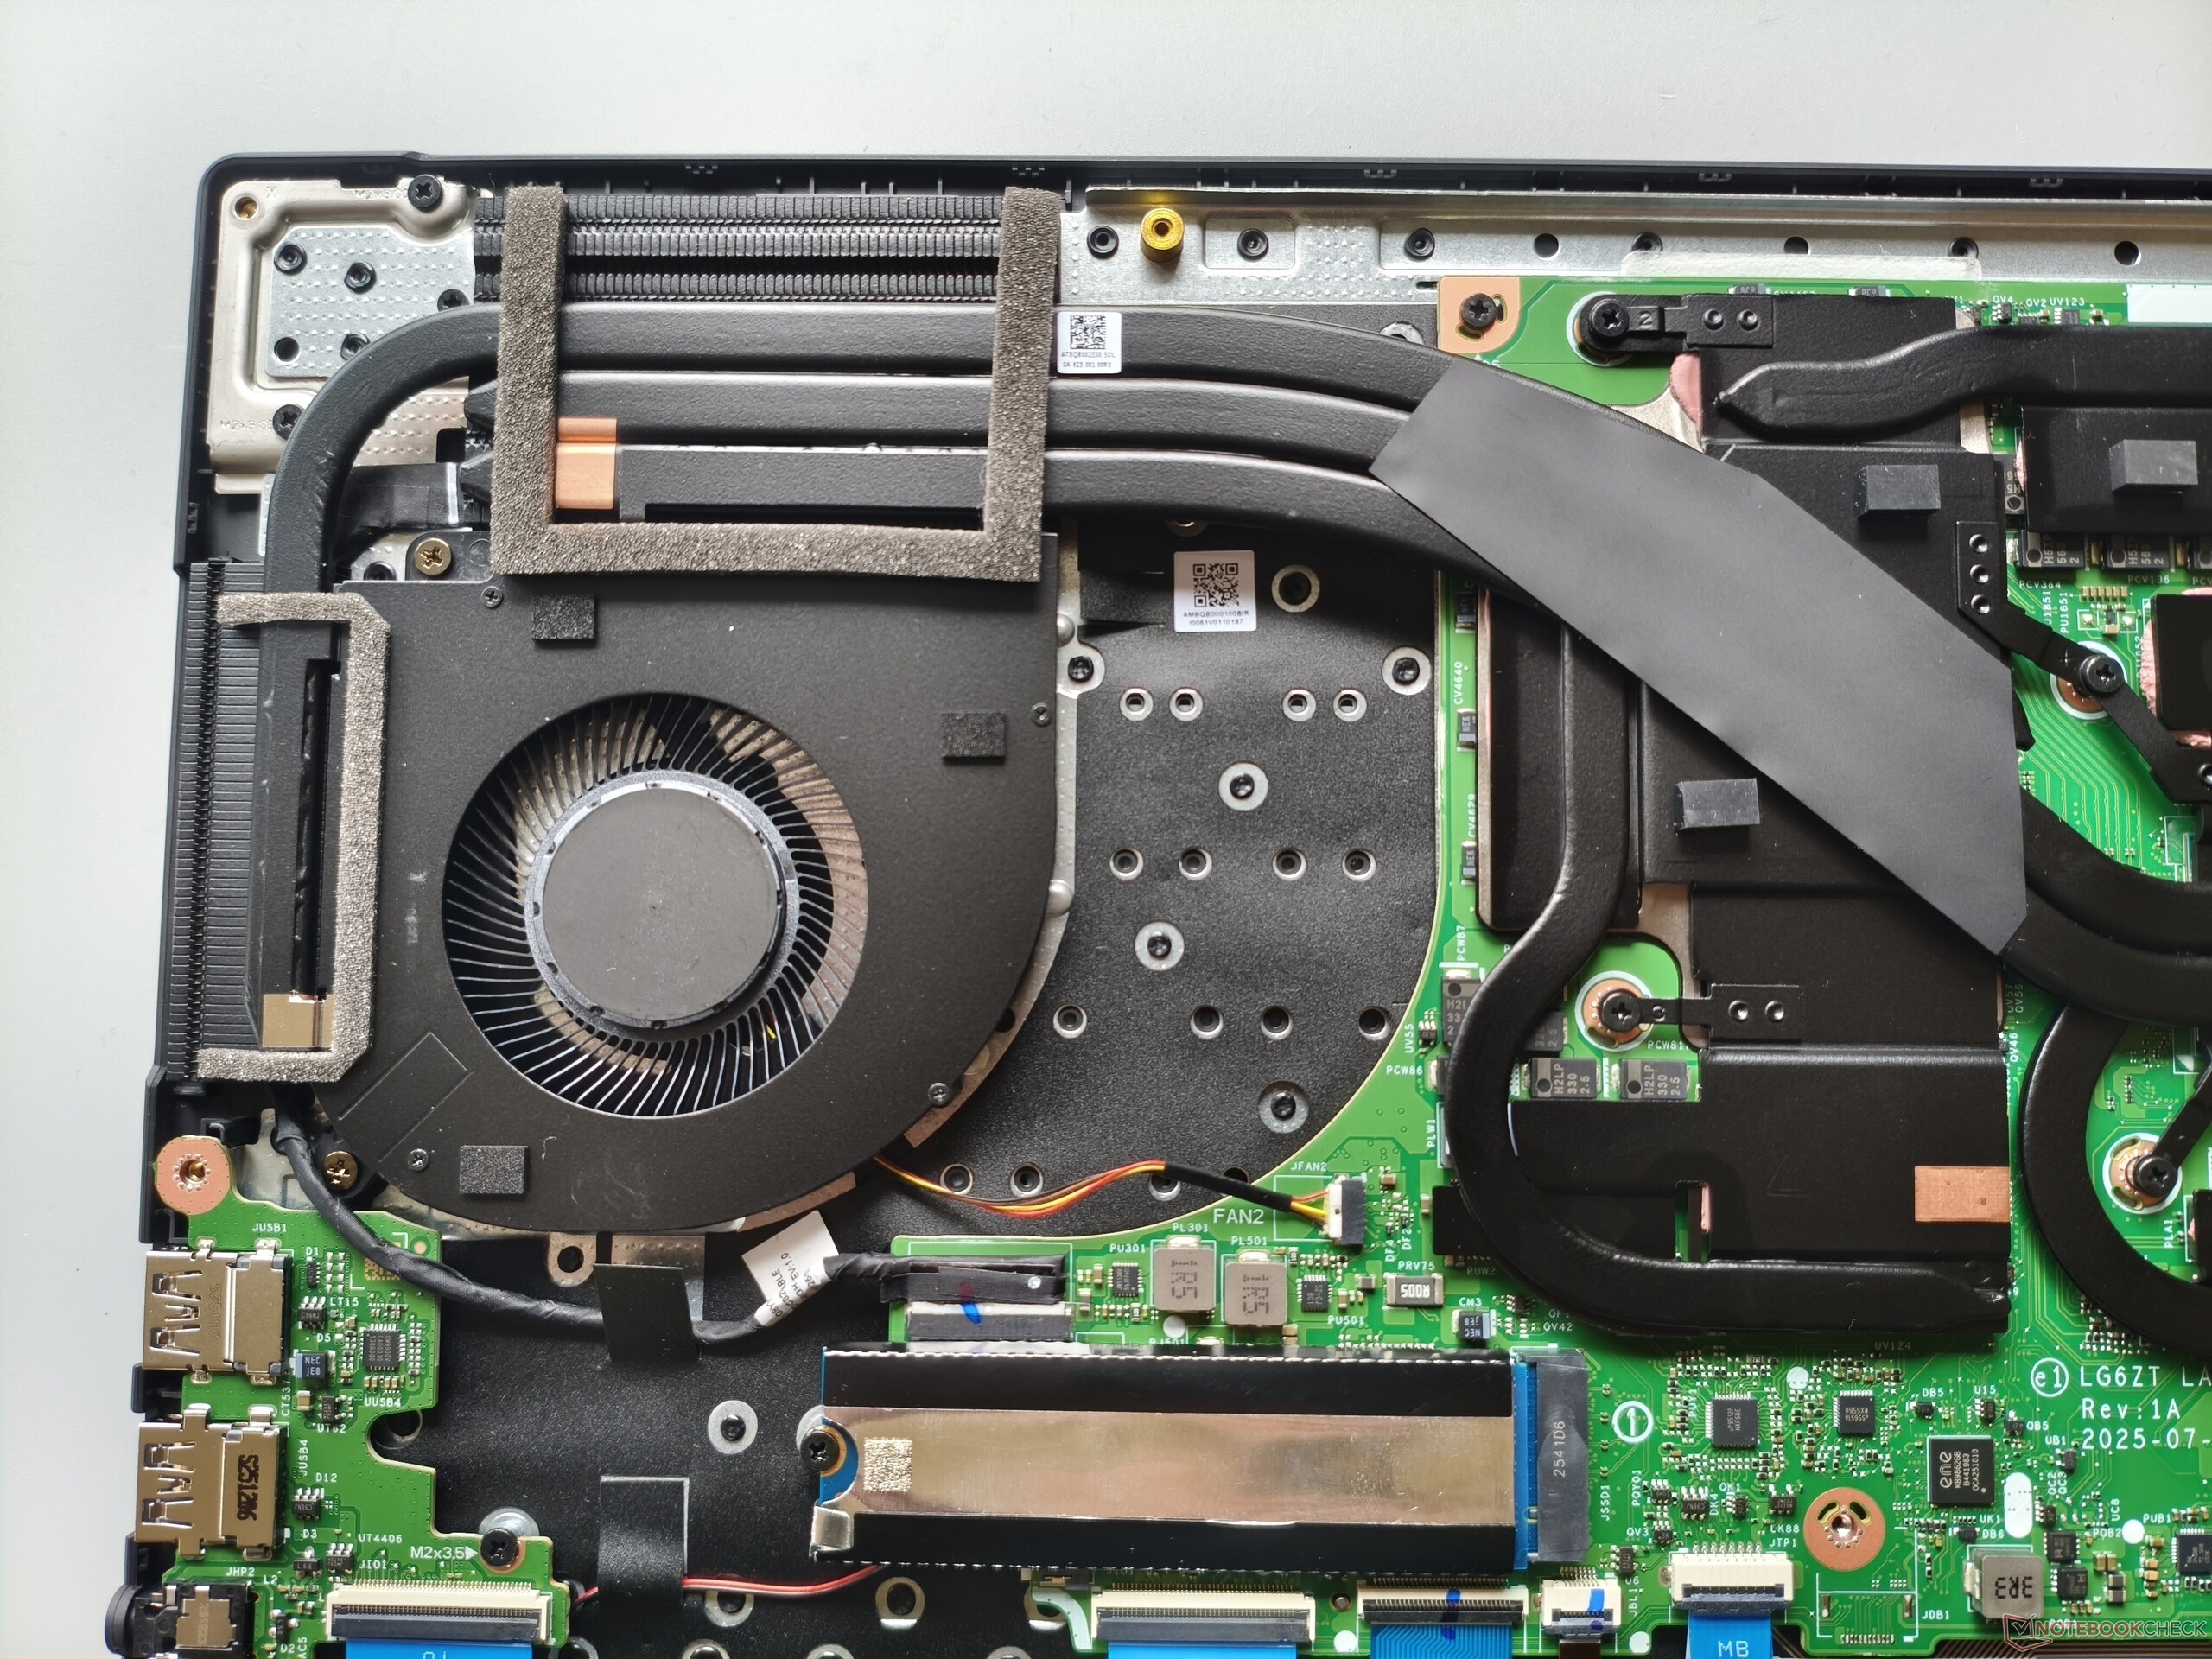
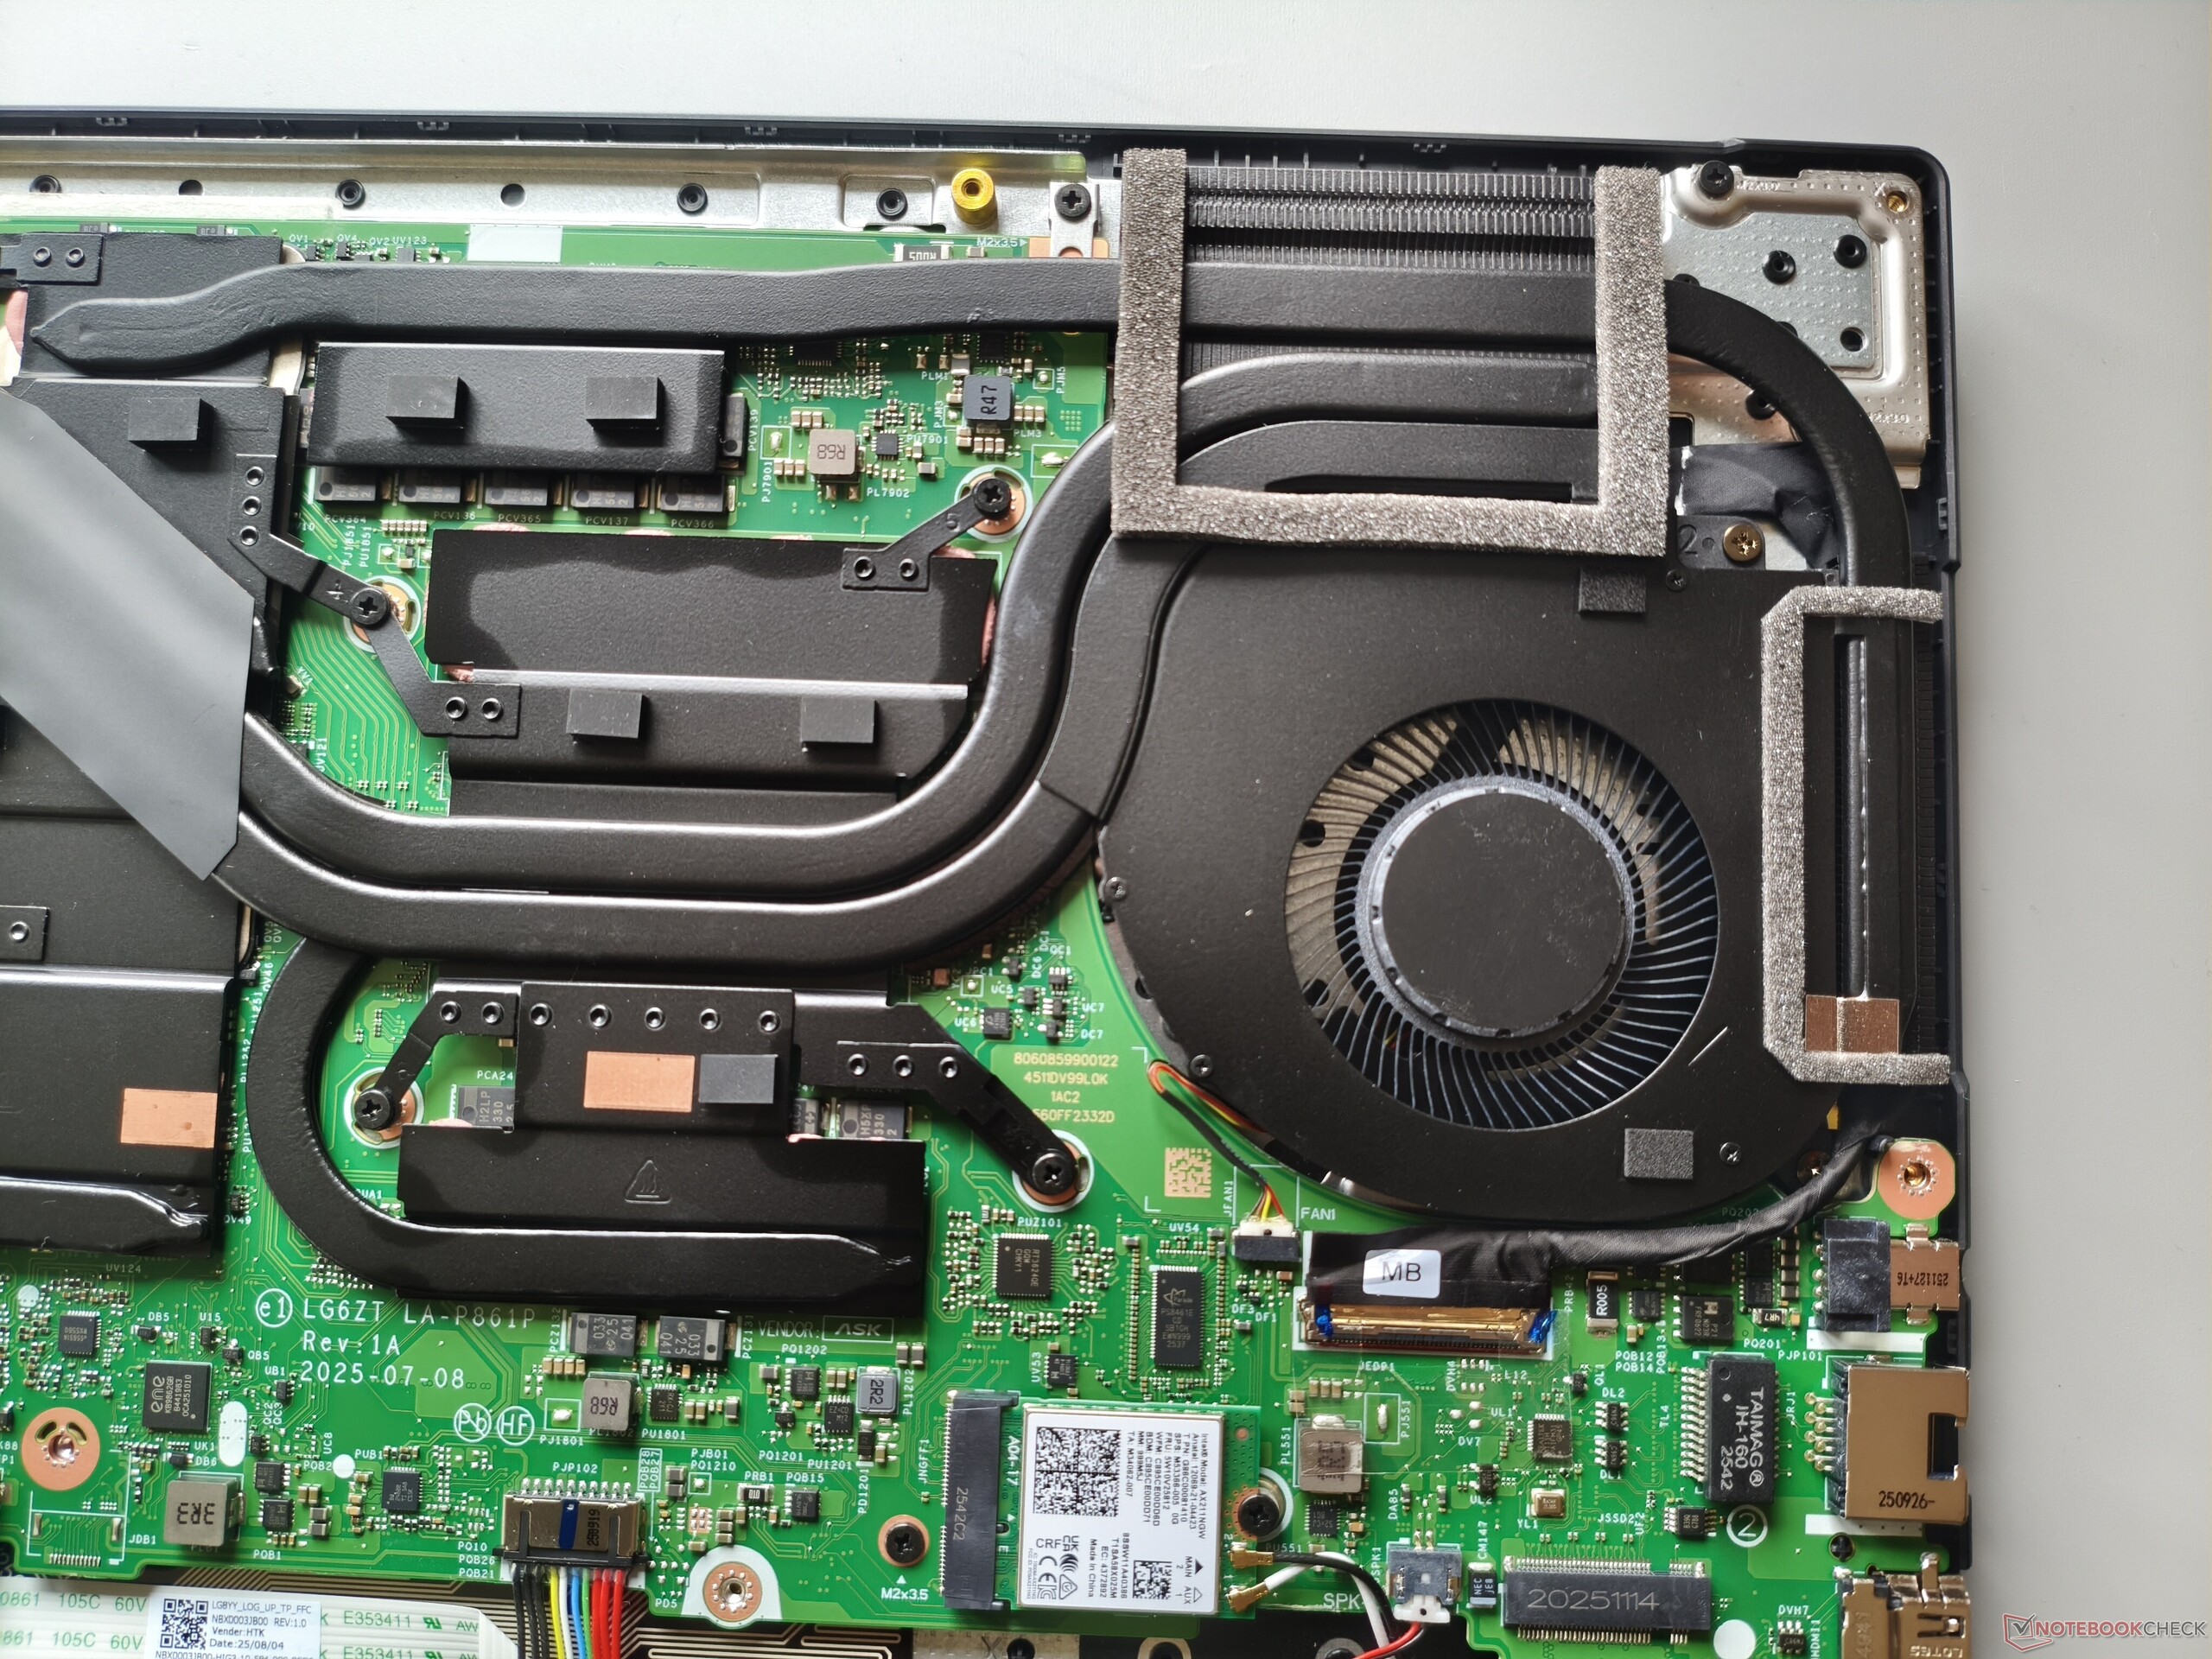
Maintenance
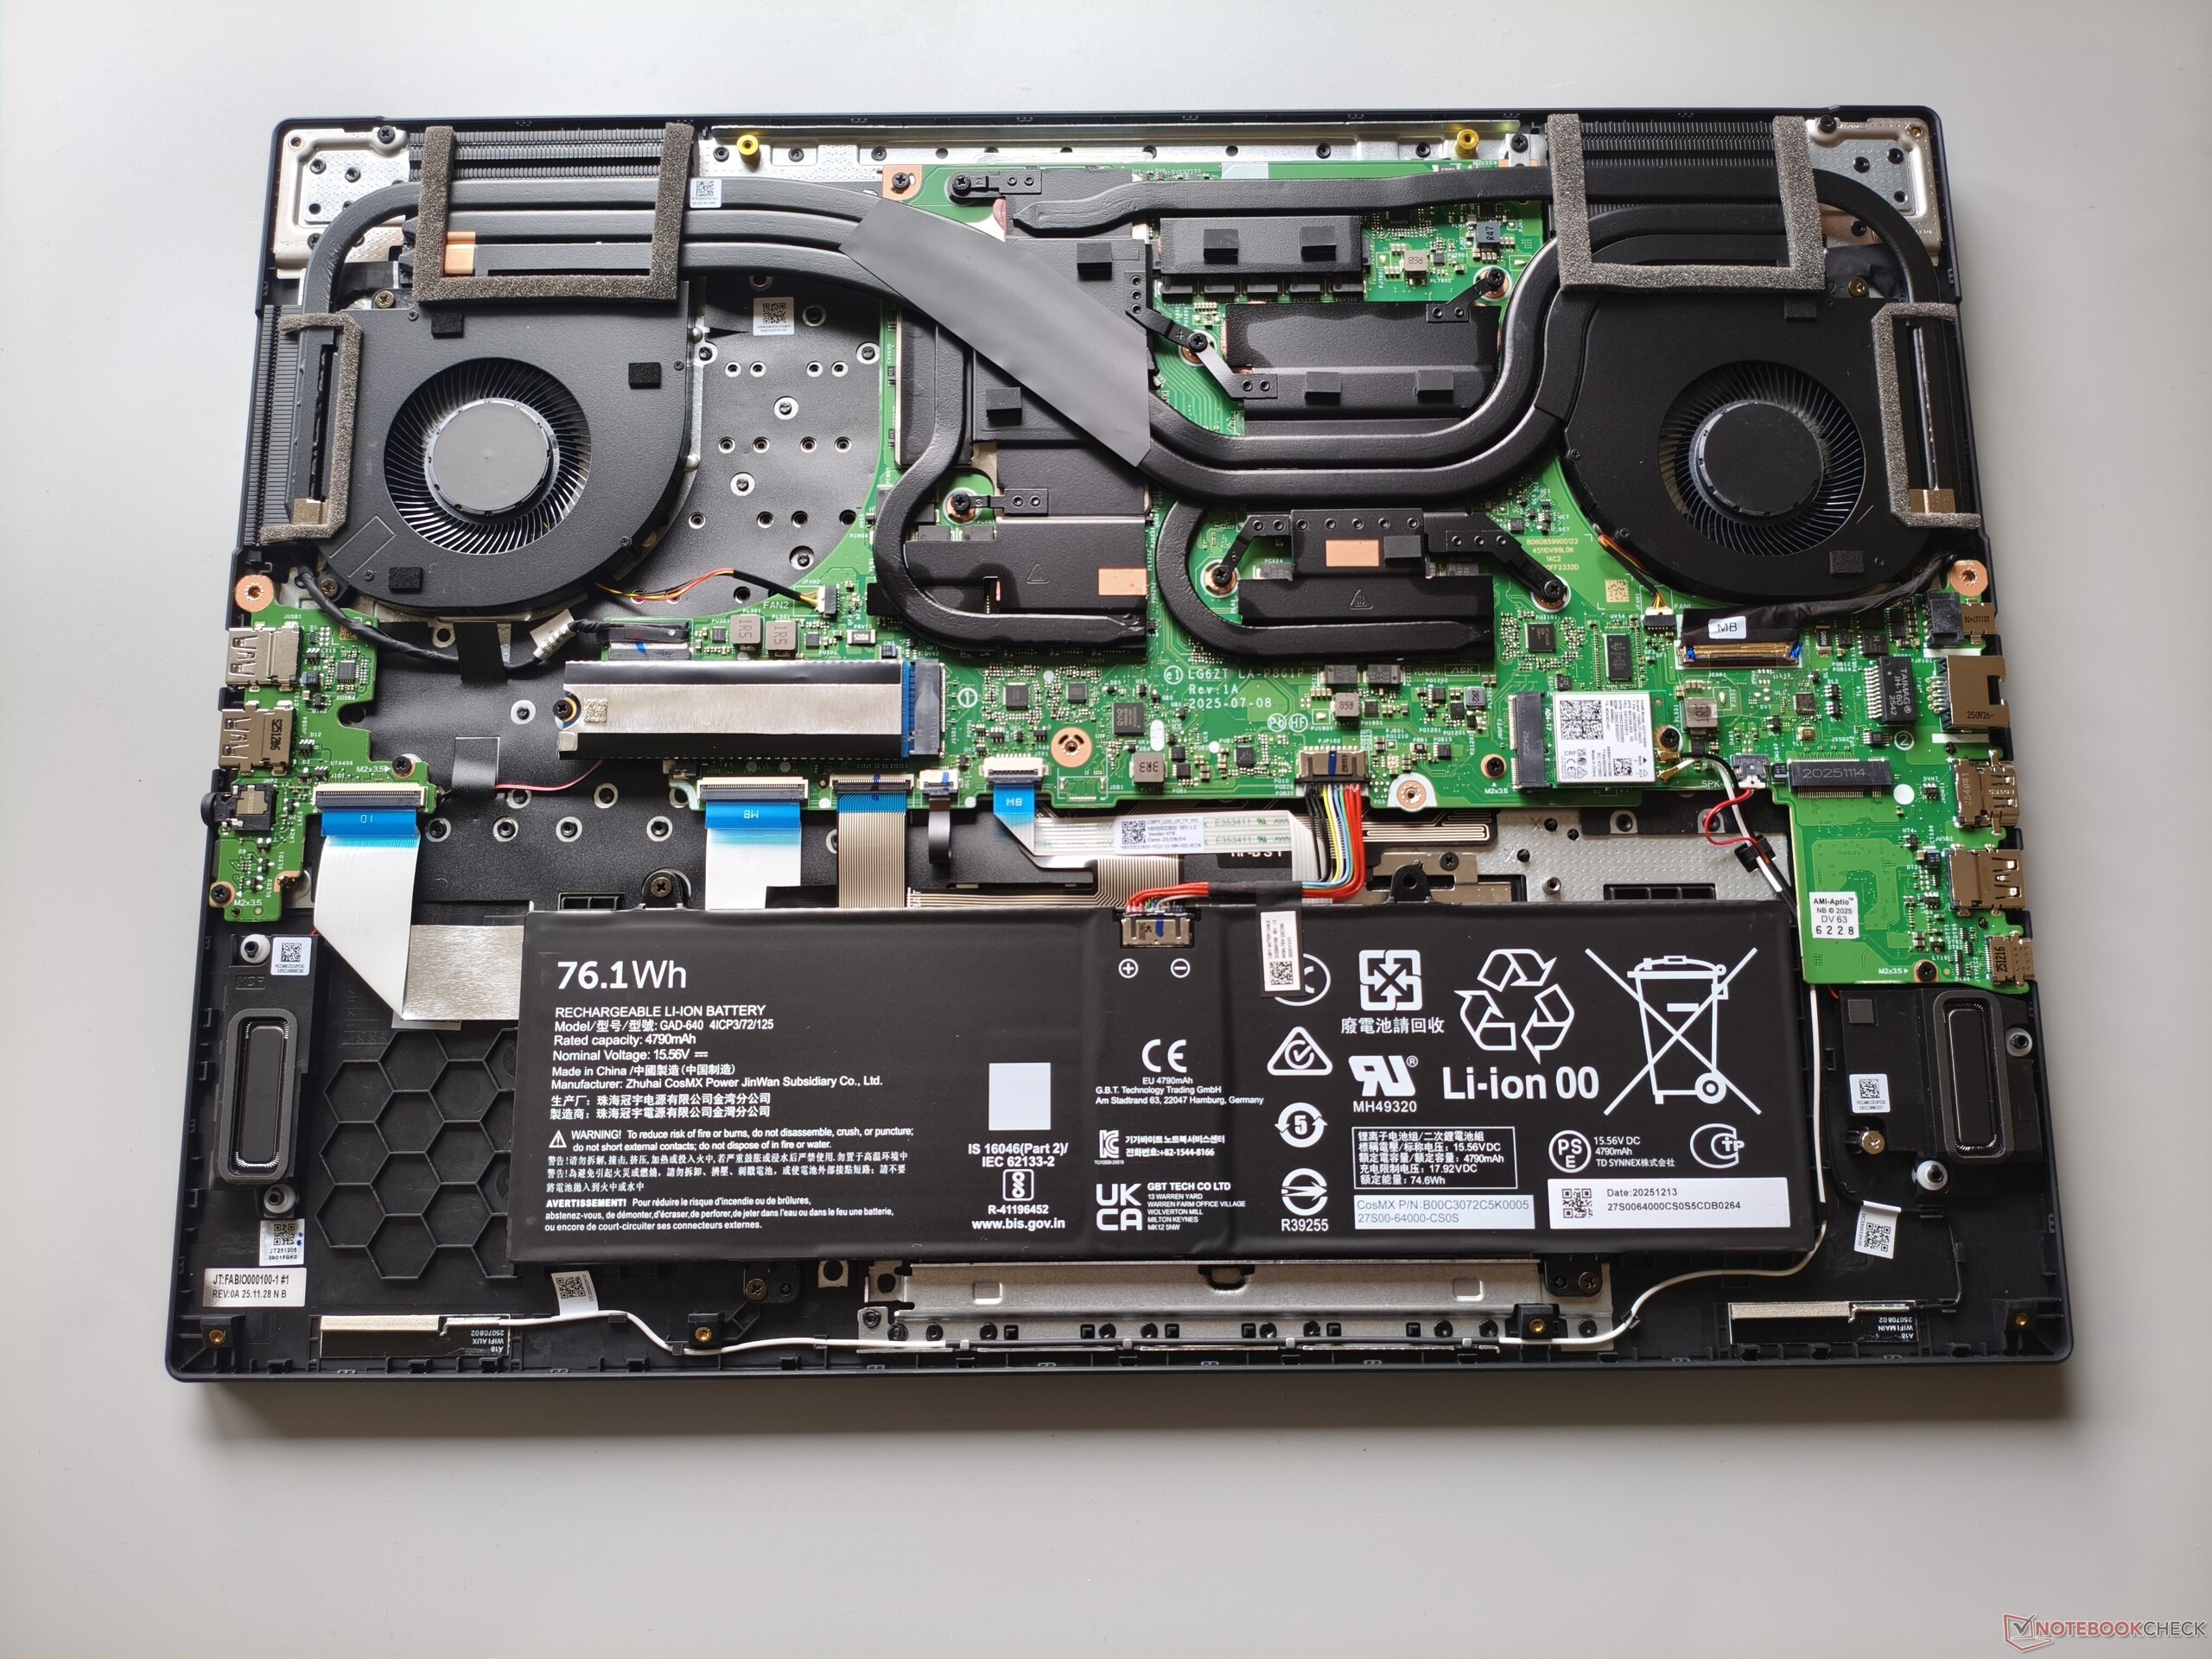
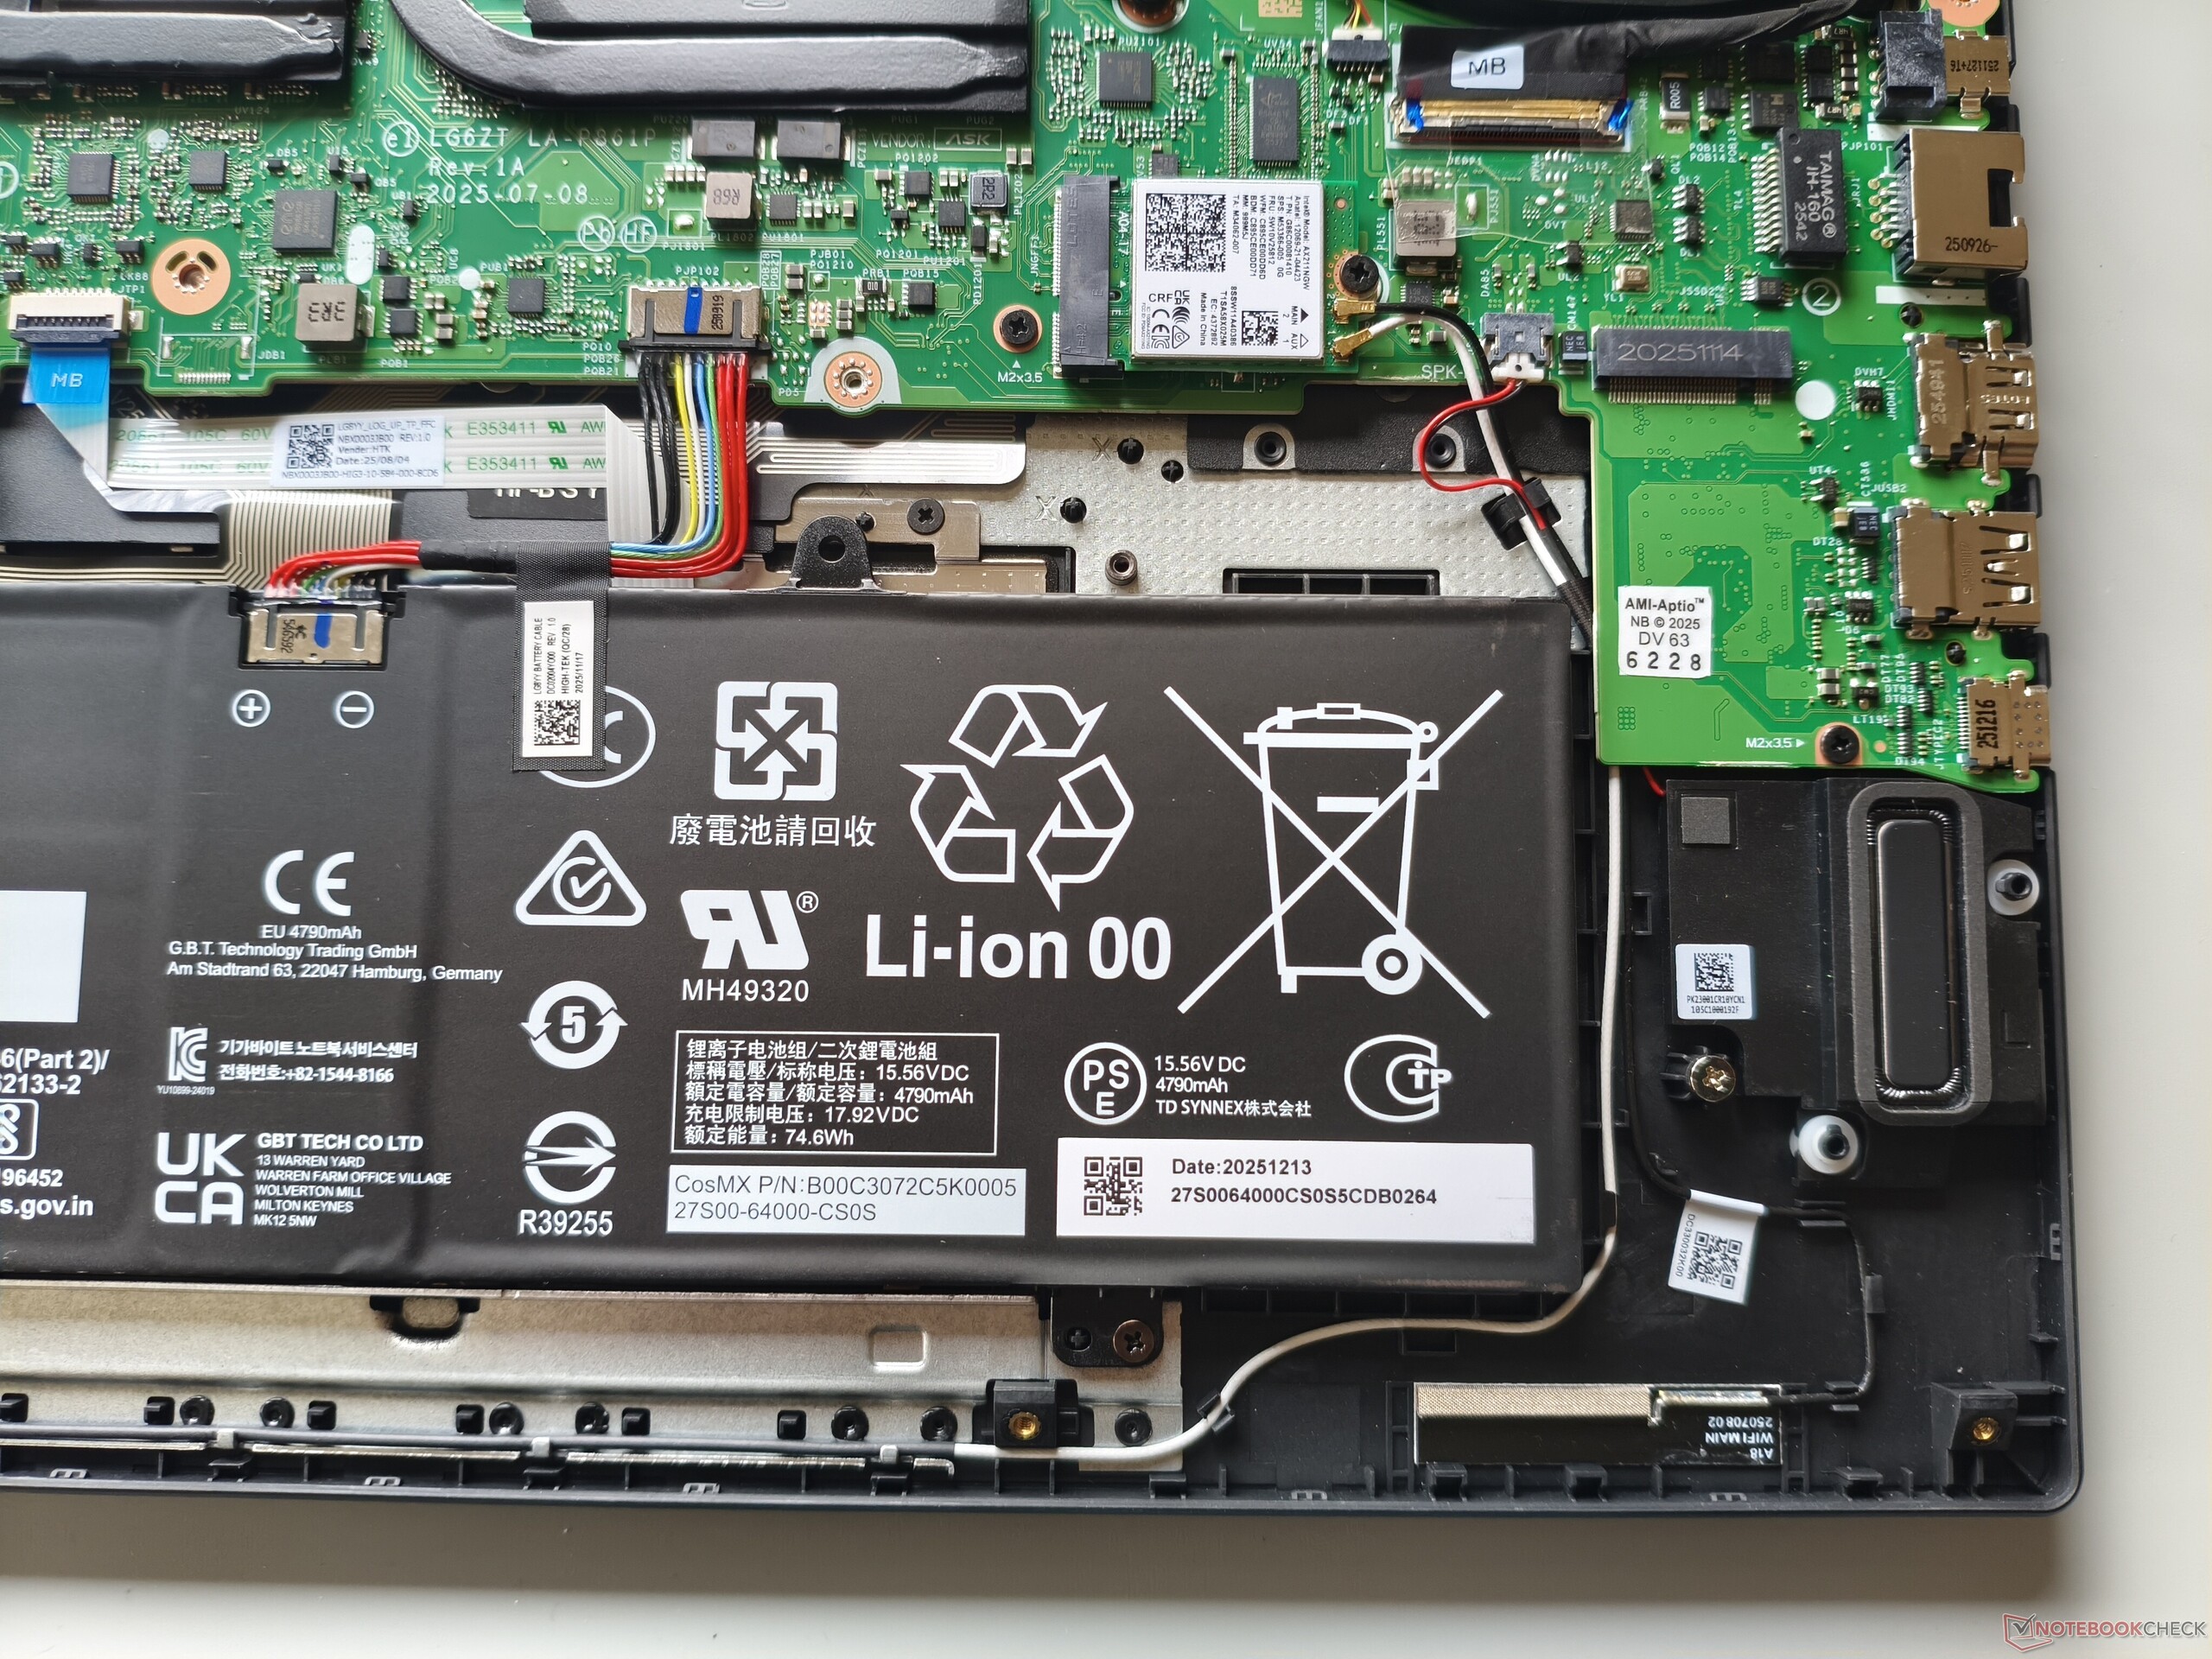
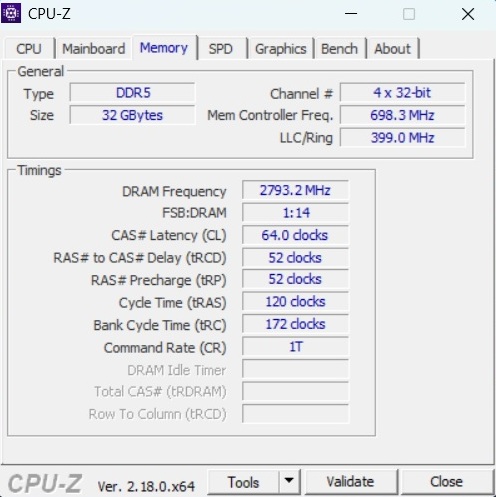
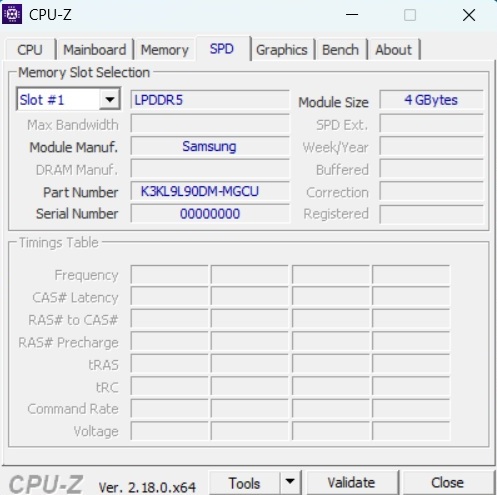
The bottom panel can be removed after loosening 11 Phillips screws. Underneath, it becomes clear that there is room for a larger battery. Two M.2 slots for SSDs (one of which is still free for the user to take advantage of) are quite decent, but the soldered RAM and the lack of SO-DIMM slots are a drawback from an upgrade perspective.

Sustainability
The packaging is primarily made of cardboard. Only the notebook sleeve and keyboard cover are made of plastic.
Input devices
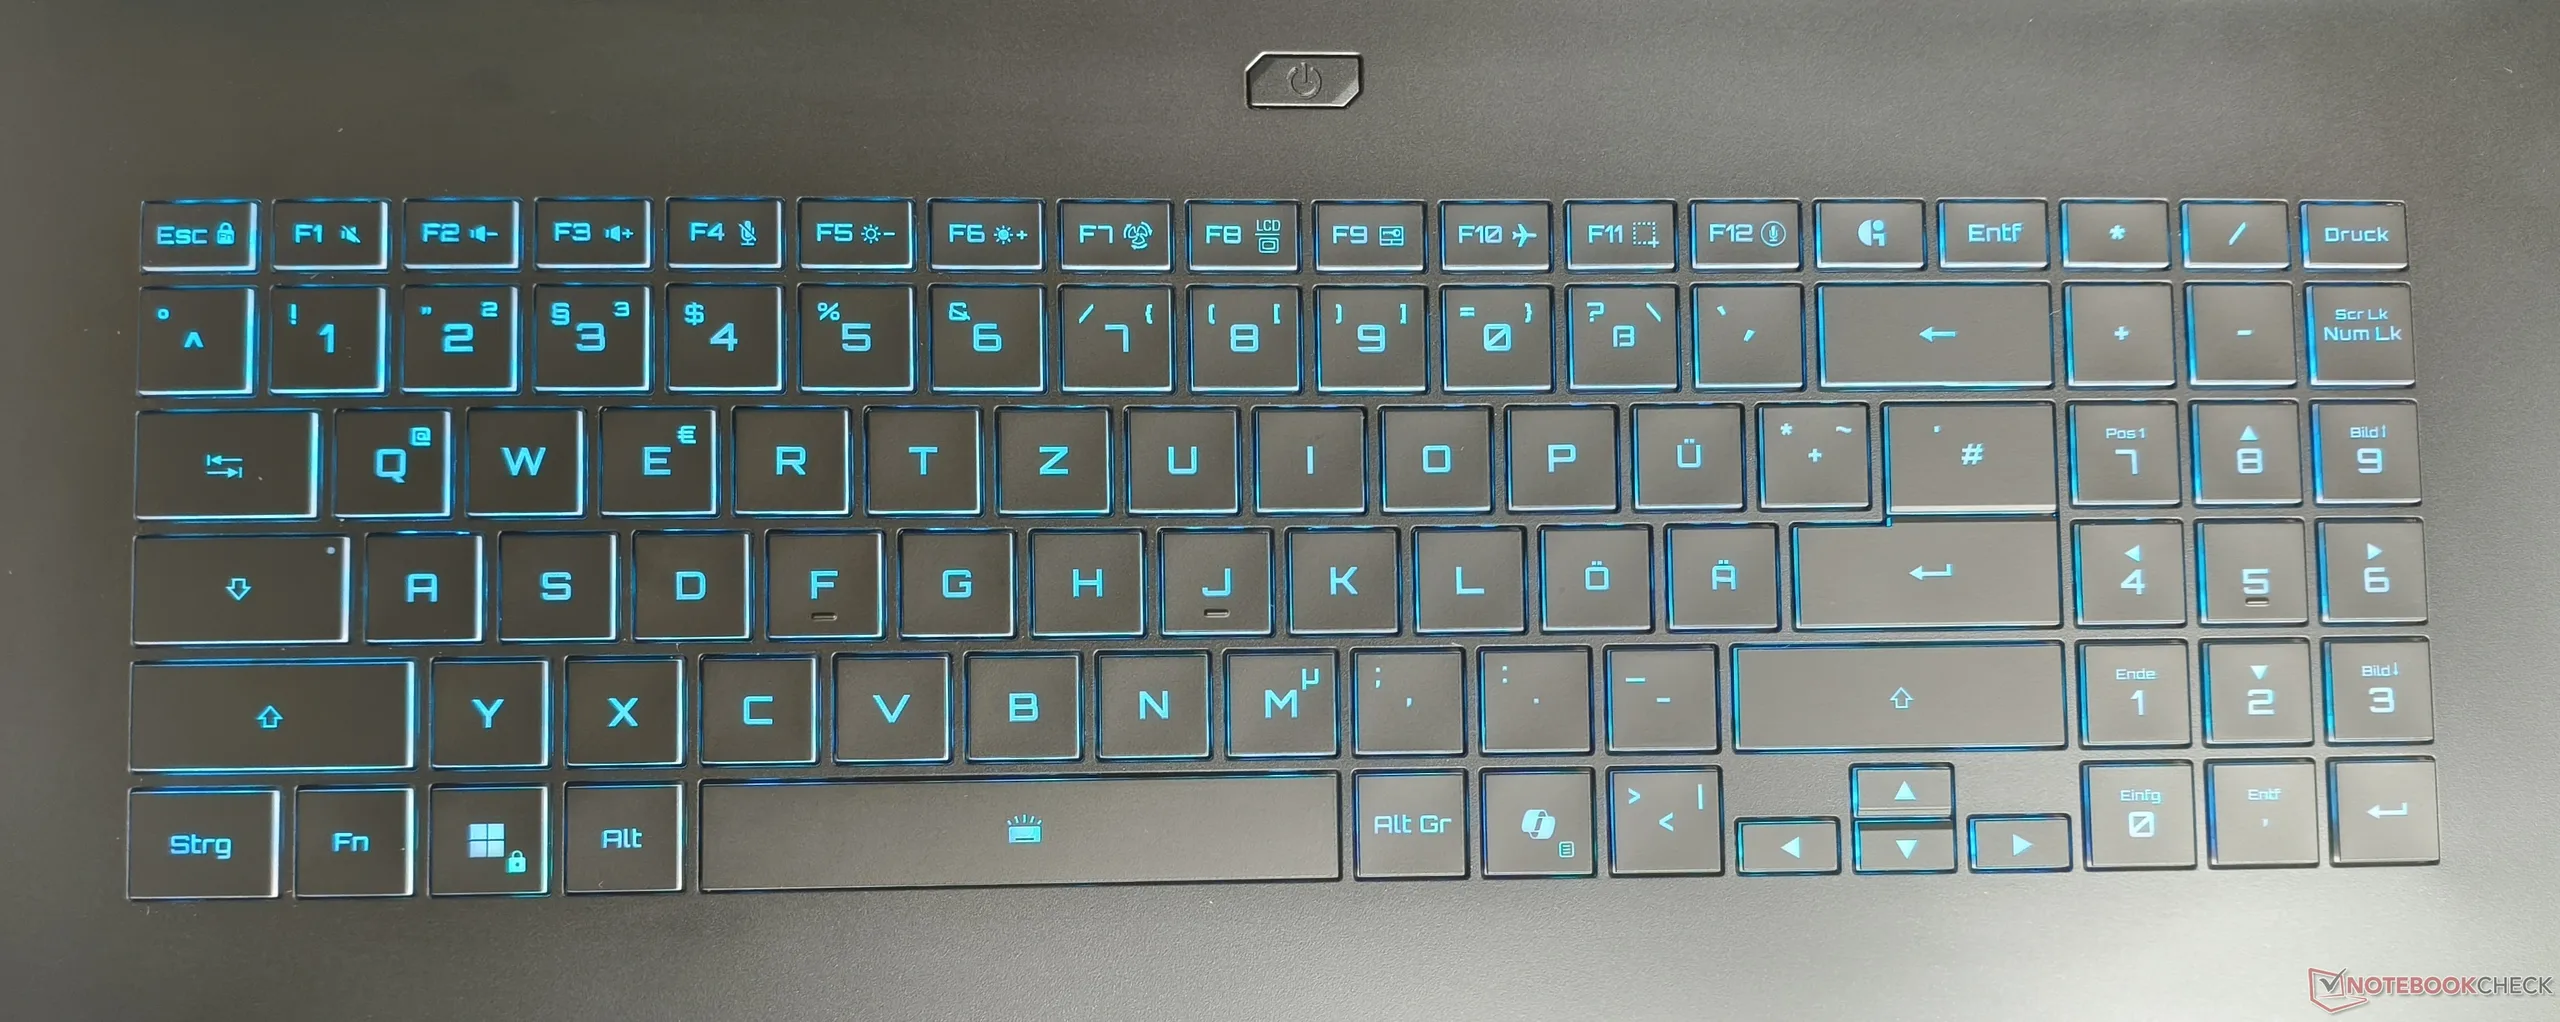
Keyboard
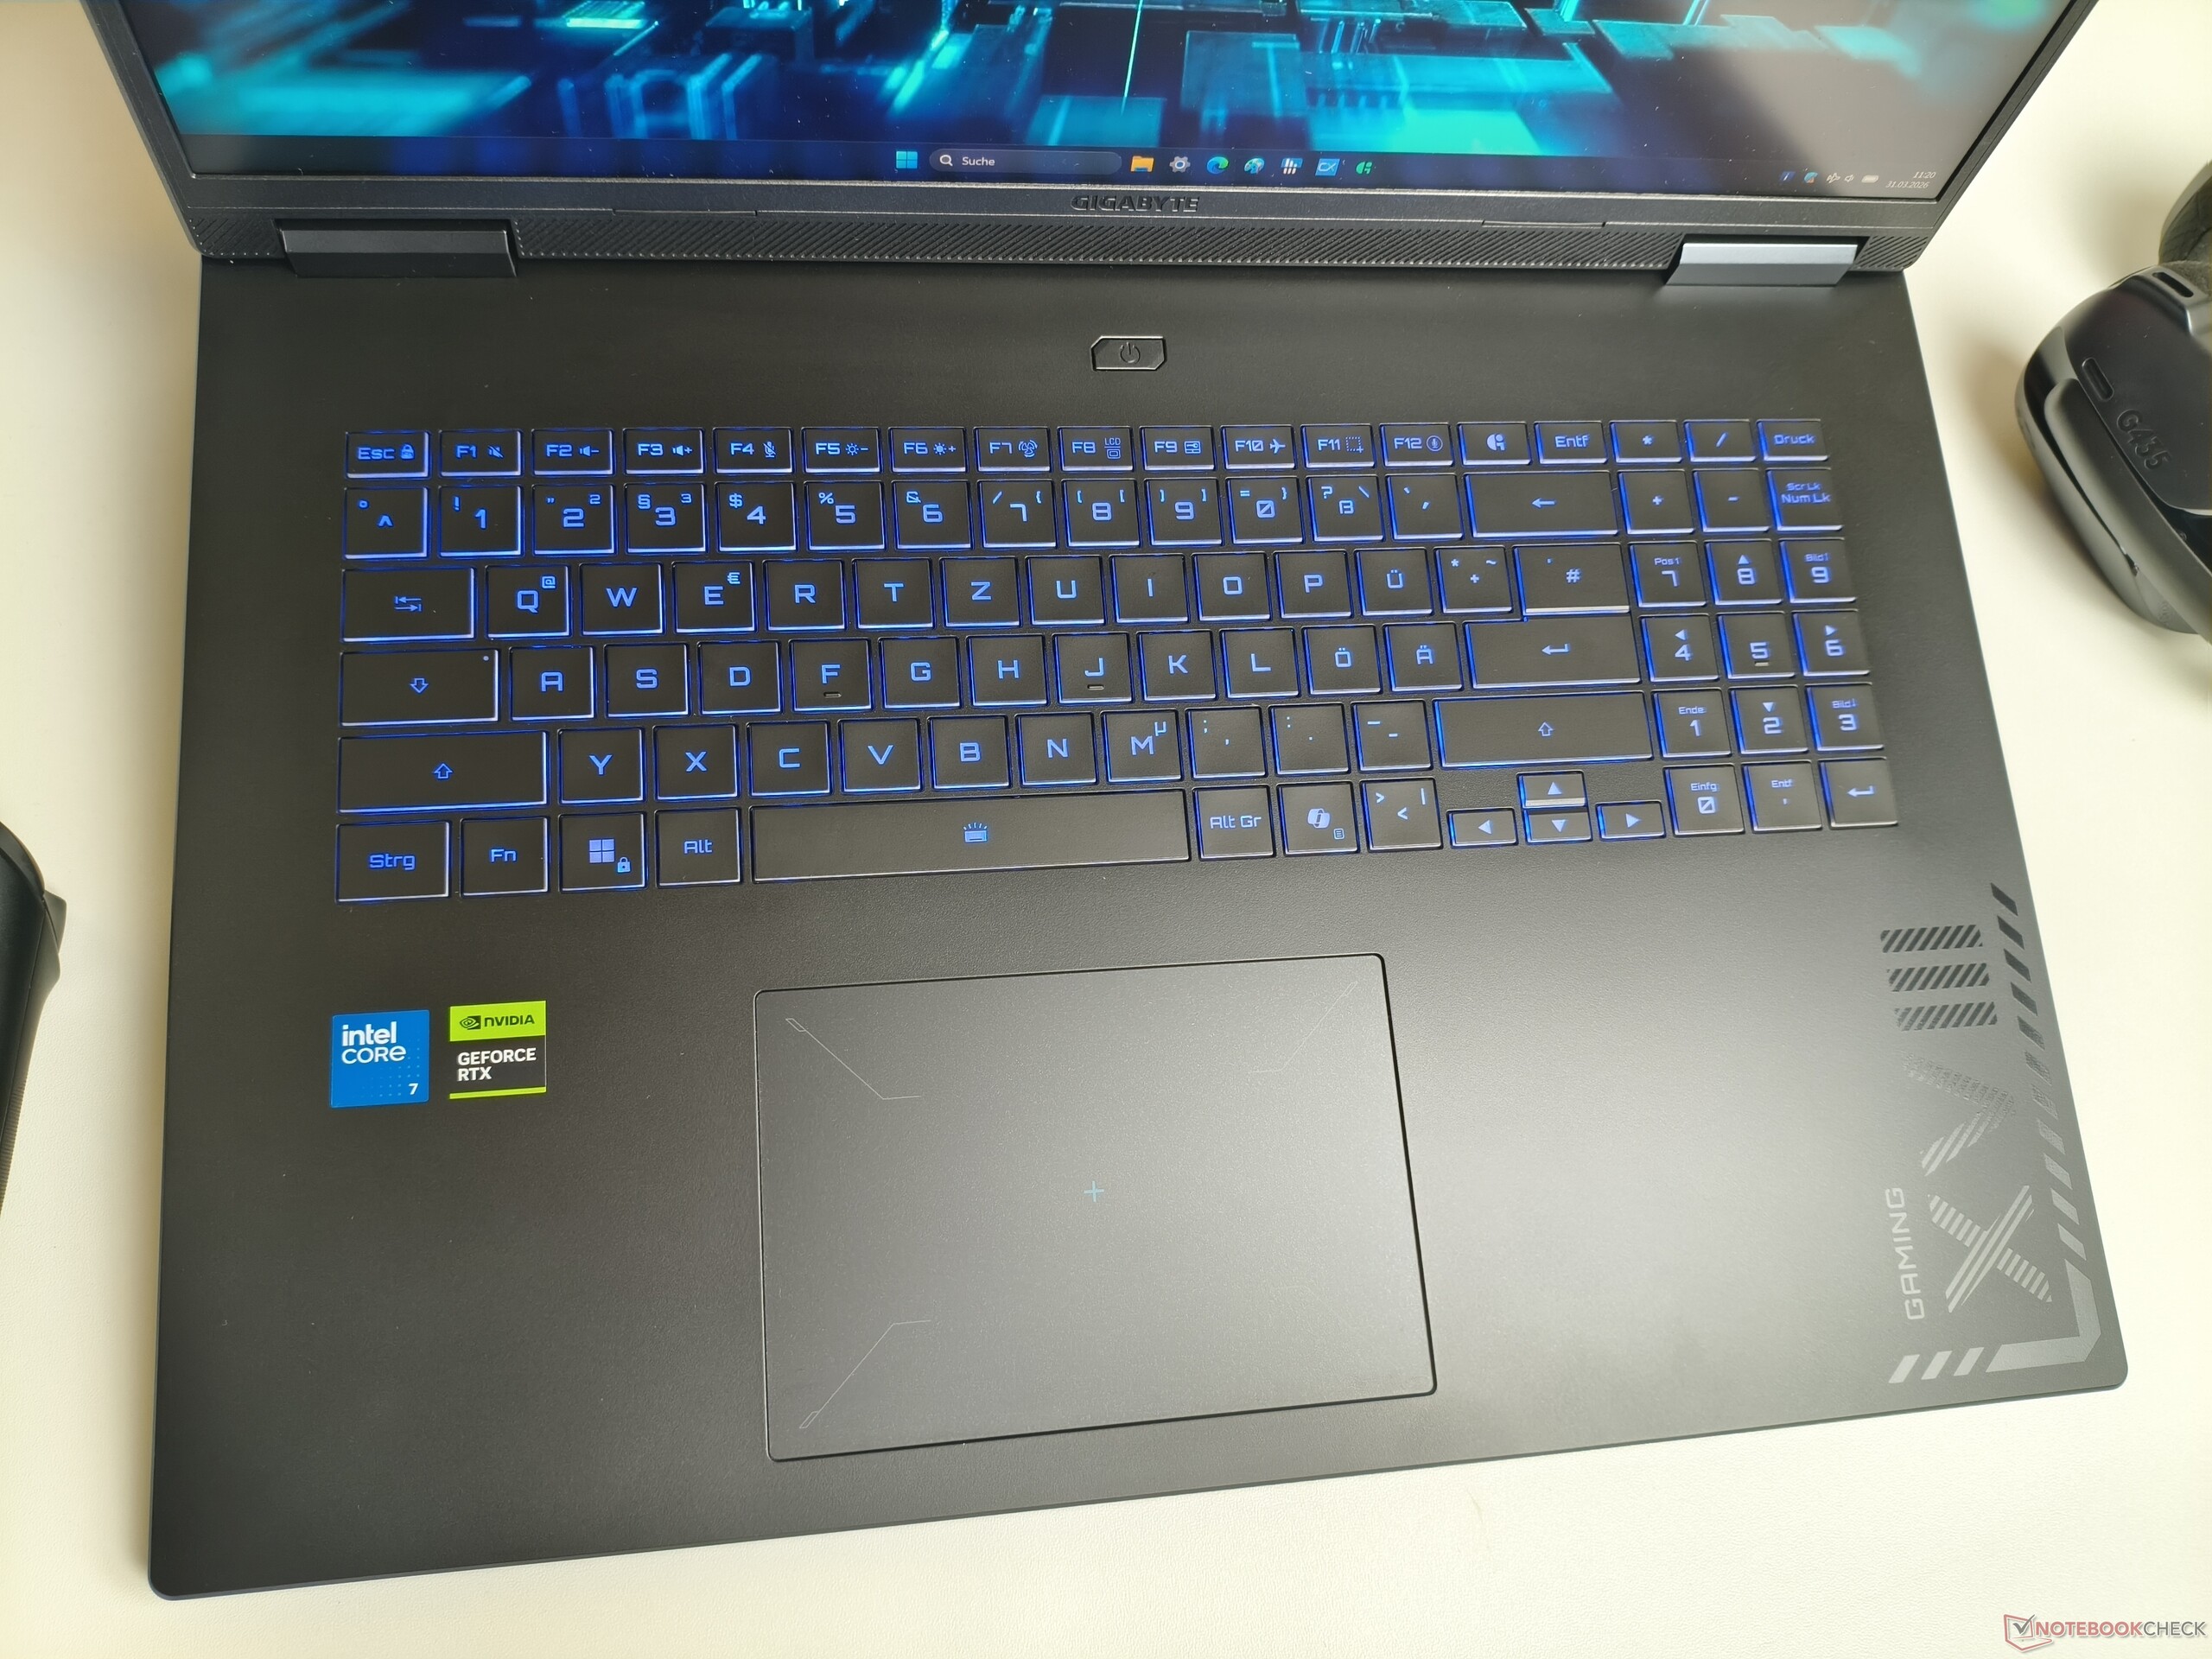
Similar to the Gaming A16 Pro, this Gigabyte machine's input devices left us impressed. The keyboard offers solid feedback and a tactile feel, as well as multi-level adjustable RGB lighting. However, the layout does not seem entirely optimal; for example, the number pad, despite having ample space, only has three columns instead of four.
Touchpad
The touchpad, measuring about 5.3 × 3.5 inches, is more than adequately sized. In practice, the mouse replacement remains largely unobtrusive and offers good precision along with smooth gesture support. The smooth surface also ensures excellent gliding performance.
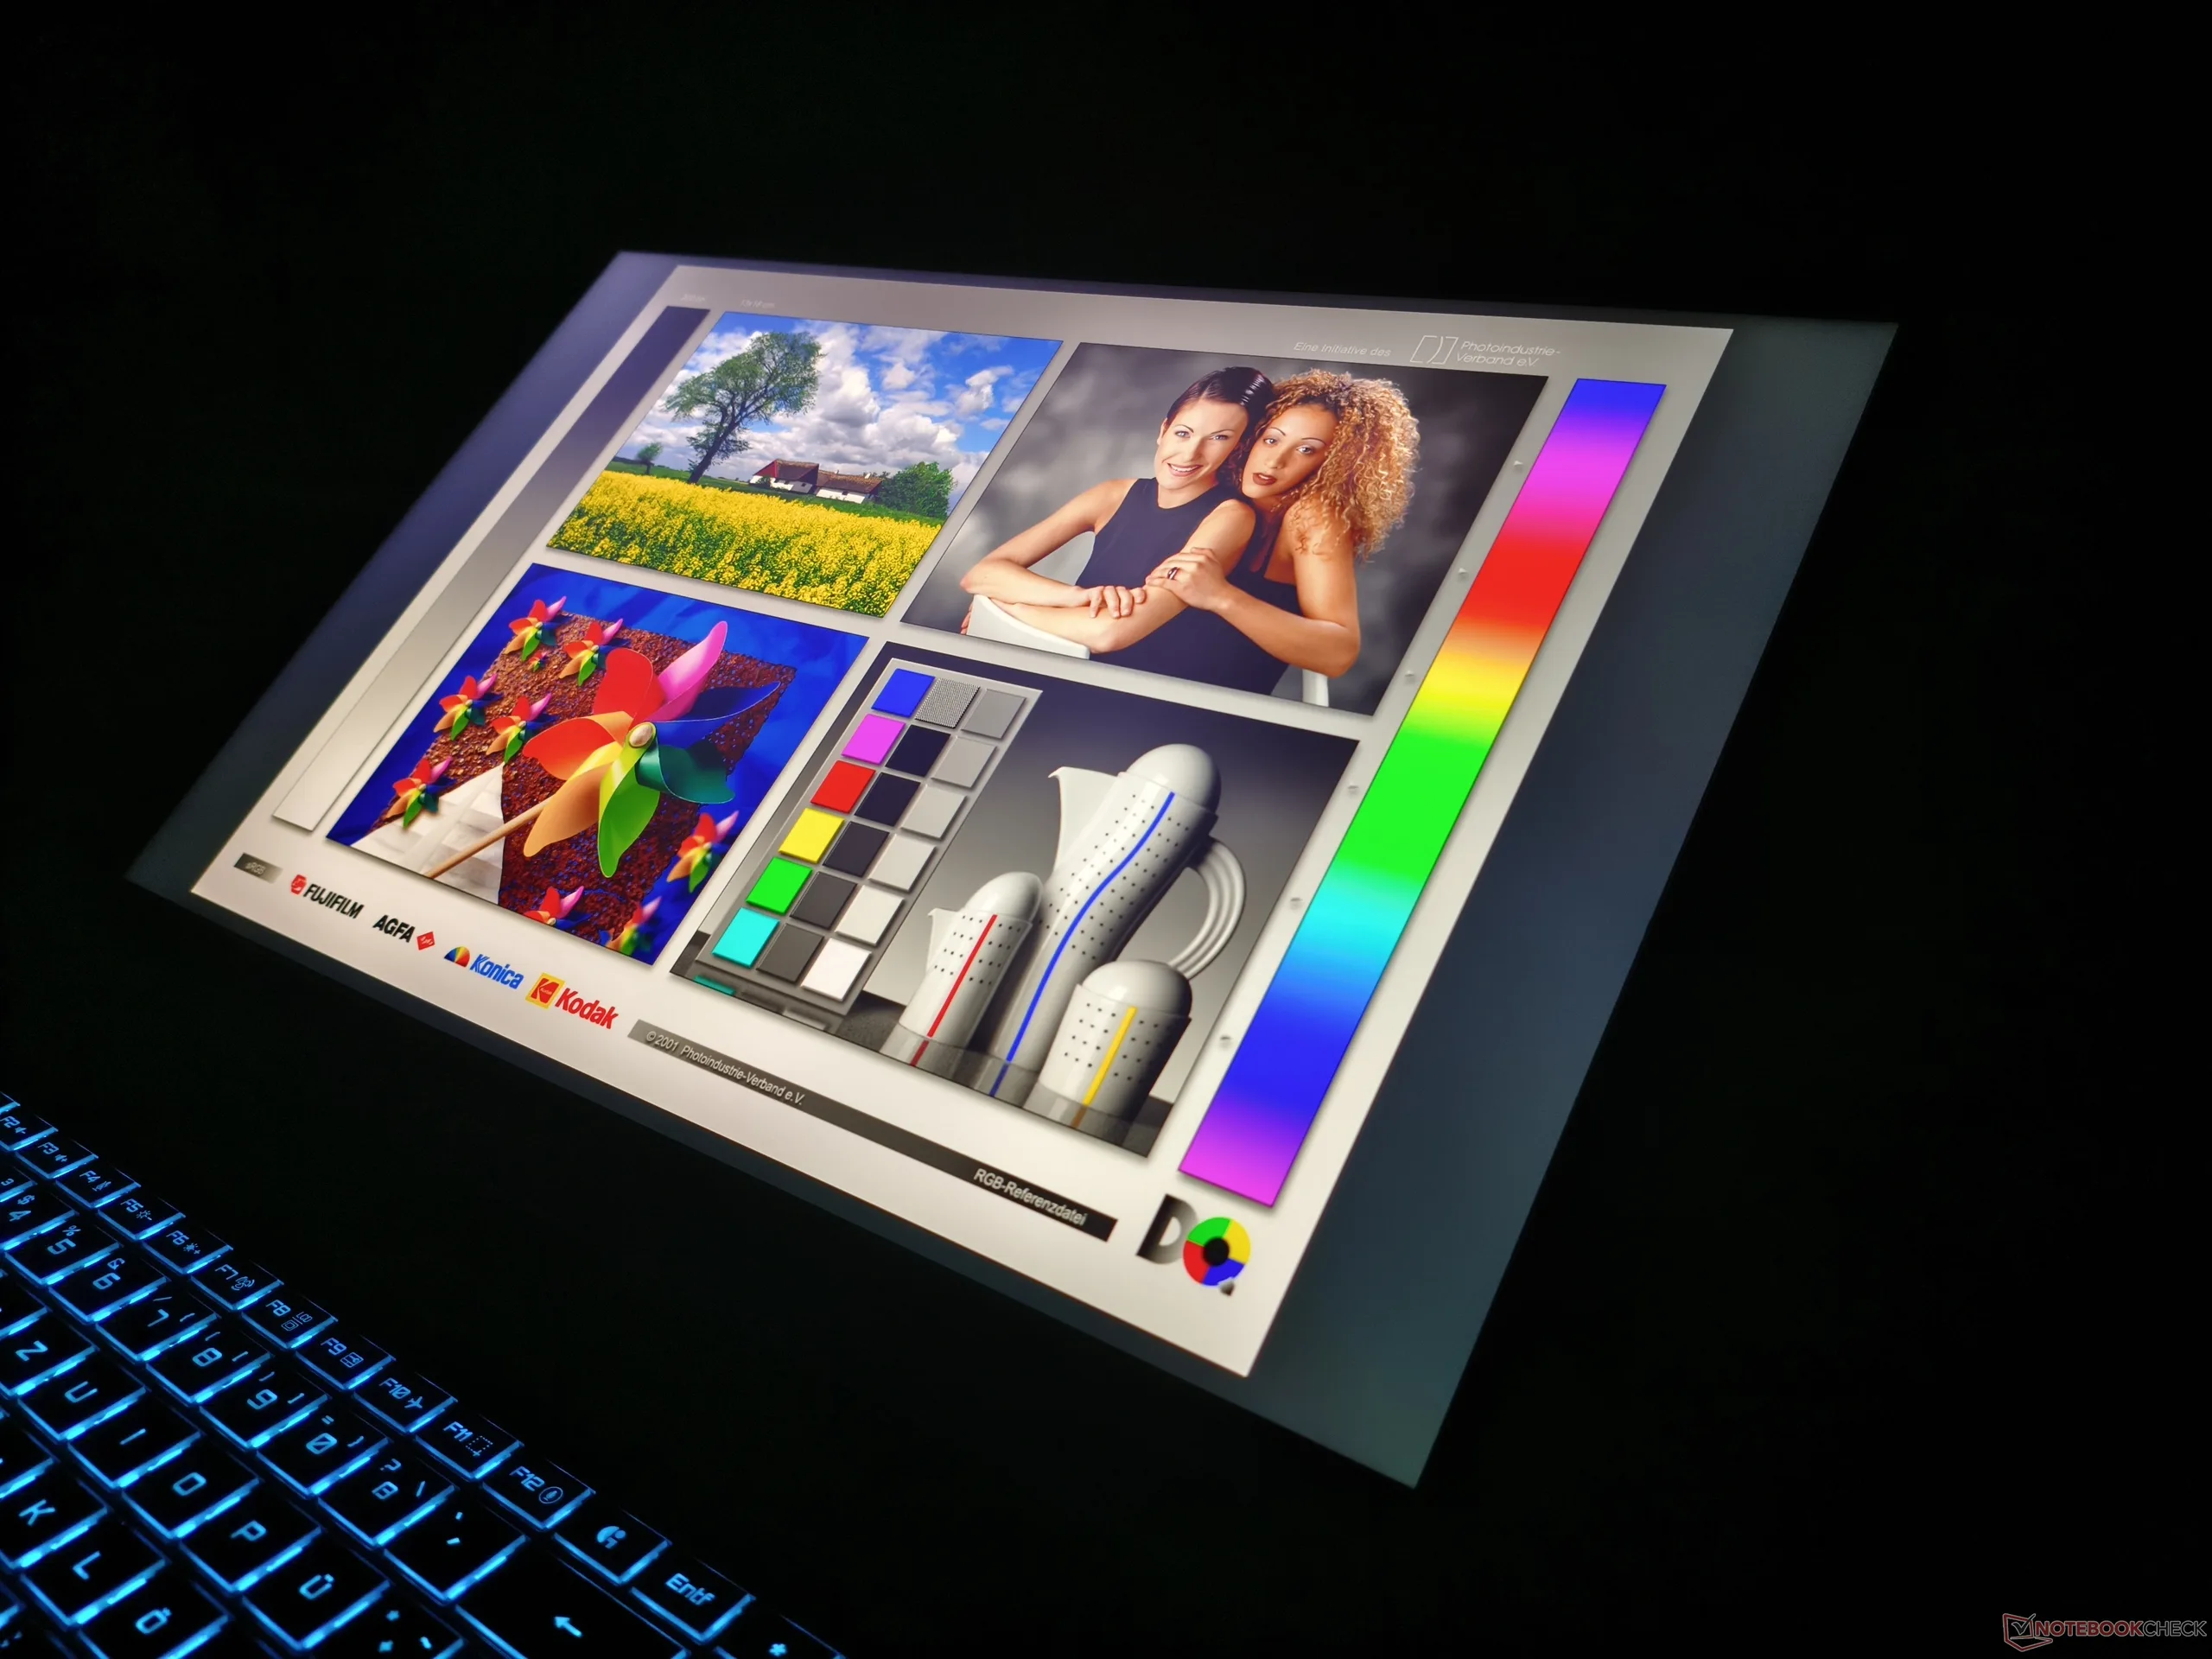
Display
Gigabyte has opted for an IPS panel with 2,560 × 1,600 pixels, which performs unremarkably in almost all areas. Thanks to its solid black level of 0.29 cd/m², the screen achieves a contrast ratio of 1,000:1; IPS panels naturally cannot compete with OLED displays in this regard.
| |||||||||||||||||||||||||
Brightness Distribution: 88 %
Center on Battery: 317 cd/m²
Contrast: 1093:1 (Black: 0.29 cd/m²)
ΔE ColorChecker Calman: 5.29 | ∀{0.5-29.43 Ø4.72}
calibrated: 0.64
ΔE Greyscale Calman: 7.5 | ∀{0.09-98 Ø4.97}
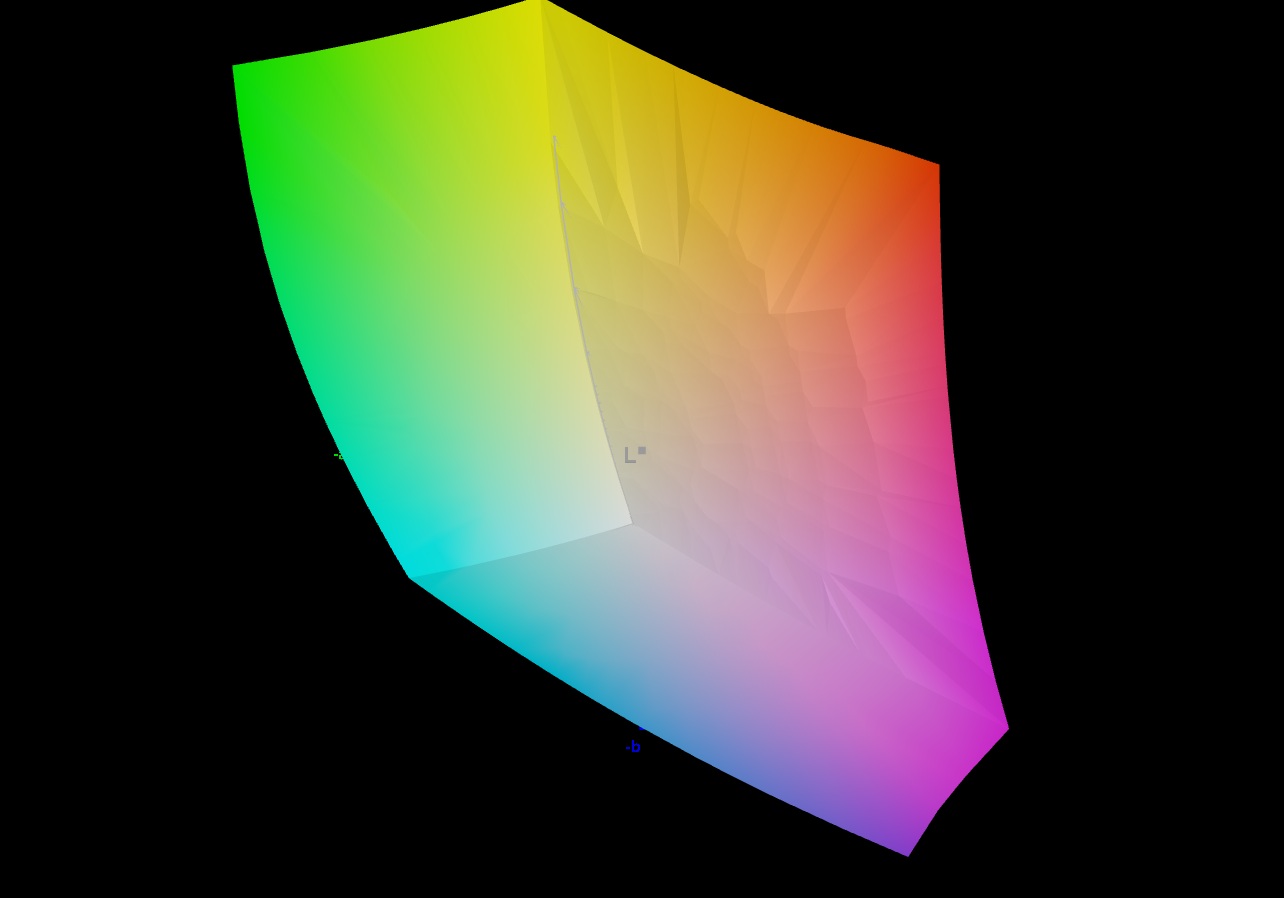
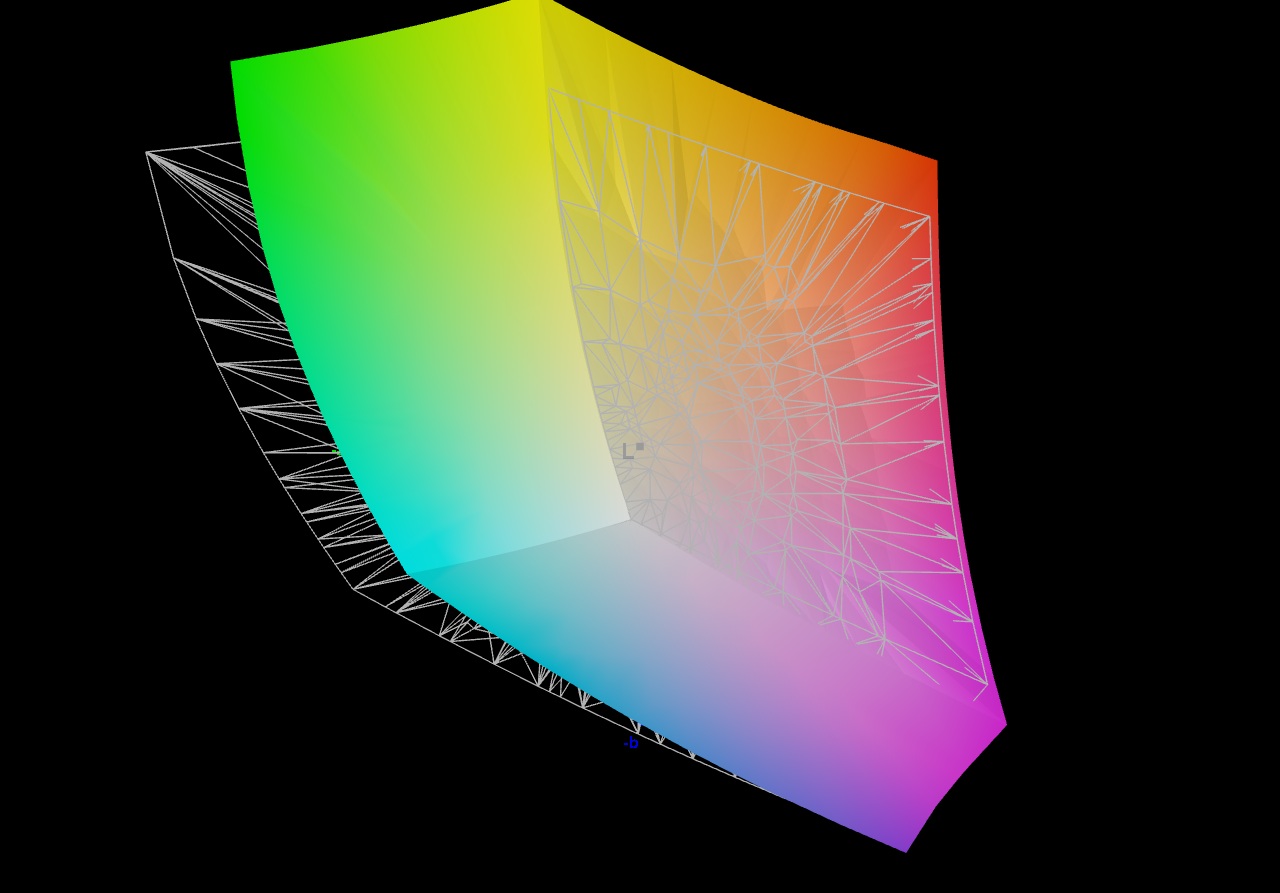
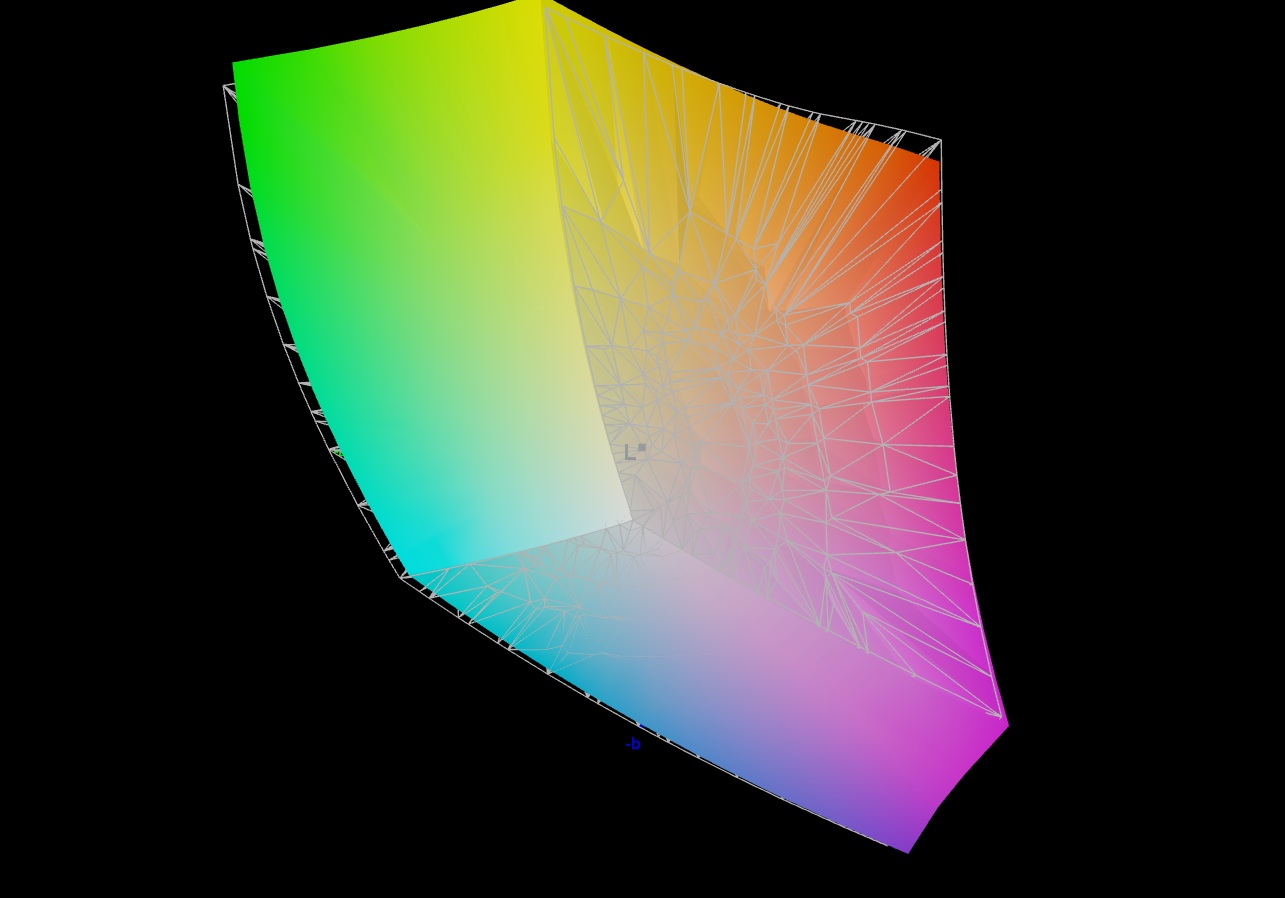
84.6% AdobeRGB 1998 (Argyll 3D)
100% sRGB (Argyll 3D)
96.9% Display P3 (Argyll 3D)
Gamma: 2.267
CCT: 6824 K
| Gigabyte Gaming A18 Pro BOE NE180QD1-MY0, IPS, 2560x1600, 18", 165 Hz | Lenovo Legion 9 18IAX10 BOE NE180QAM-NZ2, IPS, 3840x2400, 18", 240 Hz | MSI Vector A18 HX A9W AU Optronics B180QAN01.0, IPS, 2560x1600, 18", 240 Hz | Asus TUF Gaming A18 FA808UP-S8022W NE180WUM-NY3 (BOE0CEF), IPS, 1920x1200, 18", 144 Hz | Acer Nitro 18 AI AN18-61-R10V BOEhydis NE180QDM-NY1, IPS, 2560x1600, 18", 165 Hz | |
|---|---|---|---|---|---|
| Display | 1% | 1% | -17% | 0% | |
| Display P3 Coverage (%) | 96.9 | 96 -1% | 98.1 1% | 69.3 -28% | 97.2 0% |
| sRGB Coverage (%) | 100 | 100 0% | 99.9 0% | 98.1 -2% | 99.9 0% |
| AdobeRGB 1998 Coverage (%) | 84.6 | 88.8 5% | 86.3 2% | 67.9 -20% | 84.8 0% |
| Response Times | -4% | 31% | -5% | 8% | |
| Response Time Grey 50% / Grey 80% * (ms) | 7.6 ? | 9.7 ? -28% | 4.3 ? 43% | 8 ? -5% | 6.8 ? 11% |
| Response Time Black / White * (ms) | 9.9 ? | 7.8 ? 21% | 8.1 ? 18% | 10.4 ? -5% | 9.4 ? 5% |
| PWM Frequency (Hz) | |||||
| Screen | 26% | 19% | 15% | -20% | |
| Brightness middle (cd/m²) | 317 | 479.7 51% | 543 71% | 351 11% | 317 0% |
| Brightness (cd/m²) | 291 | 465 60% | 502 73% | 332 14% | 288 -1% |
| Brightness Distribution (%) | 88 | 86 -2% | 86 -2% | 89 1% | 87 -1% |
| Black Level * (cd/m²) | 0.29 | 0.27 7% | 0.56 -93% | 0.26 10% | 0.28 3% |
| Contrast (:1) | 1093 | 1777 63% | 970 -11% | 1350 24% | 1132 4% |
| Colorchecker dE 2000 * | 5.29 | 3.14 41% | 3.41 36% | 2.89 45% | 5.16 2% |
| Colorchecker dE 2000 max. * | 12.02 | 6.48 46% | 6.4 47% | 7.91 34% | 0.75 94% |
| Colorchecker dE 2000 calibrated * | 0.64 | 1.17 -83% | 0.66 -3% | 0.93 -45% | 2.42 -278% |
| Greyscale dE 2000 * | 7.5 | 3.8 49% | 3.4 55% | 4.46 41% | 7.4 1% |
| Gamma | 2.267 97% | 2.18 101% | 2.3 96% | 2.46 89% | 2.093 105% |
| CCT | 6824 95% | 7301 89% | 6070 107% | 7132 91% | 6553 99% |
| Total Average (Program / Settings) | 8% /
16% | 17% /
17% | -2% /
5% | -4% /
-11% |
* ... smaller is better
Professional users, on the other hand, can look forward to (almost) complete coverage of the sRGB and DCI-P3 color spaces. Adobe RGB is covered at around 85%. Gigabyte could, however, improve the brightness; an average of 291 cd/m² is rather low for a notebook in this price range and is generally suitable only for indoor use.
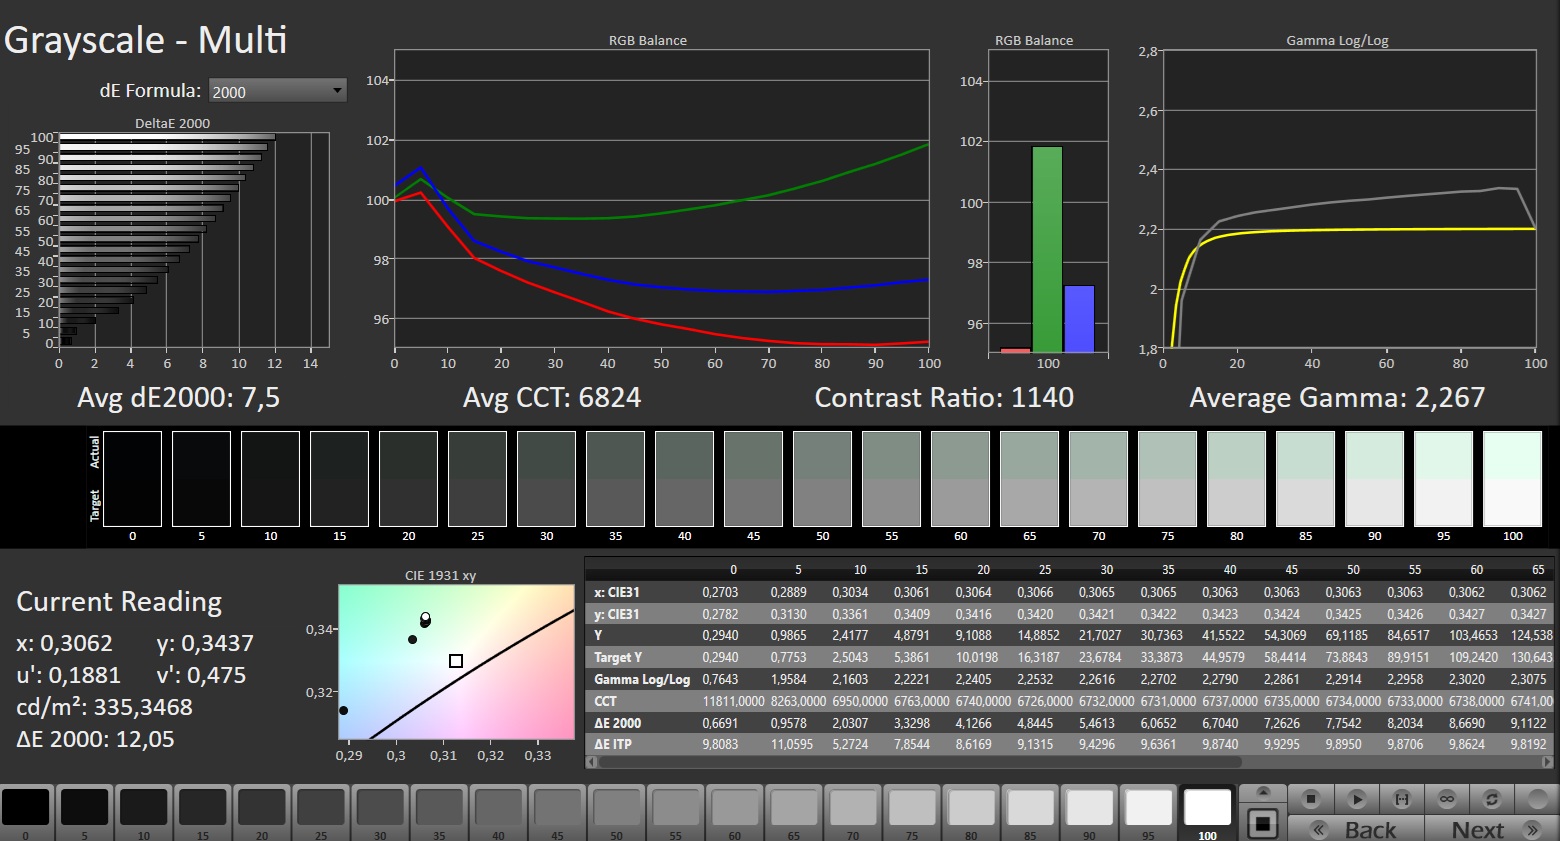
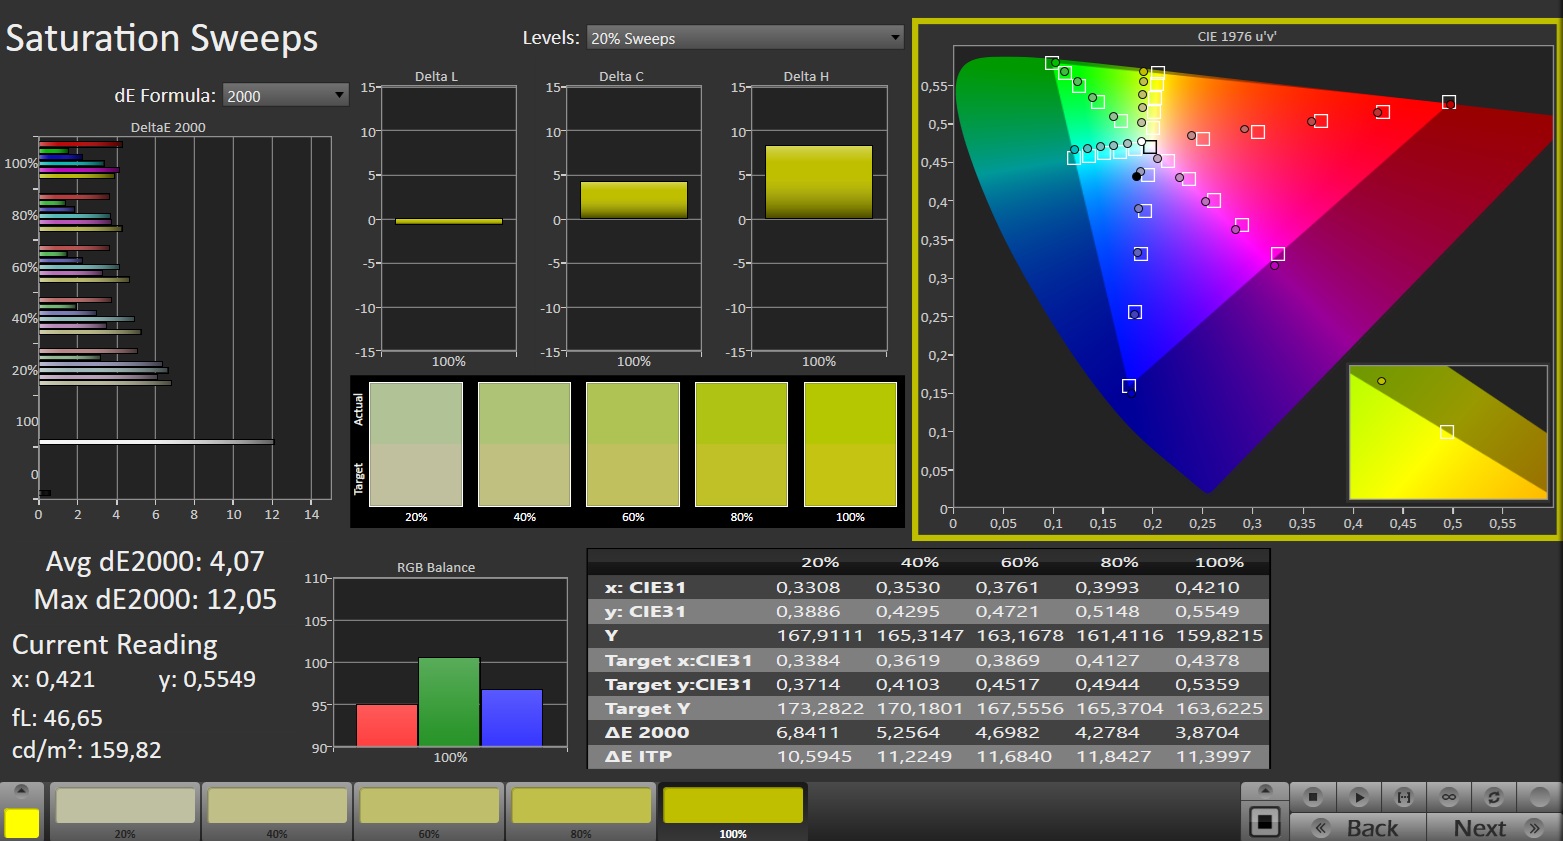
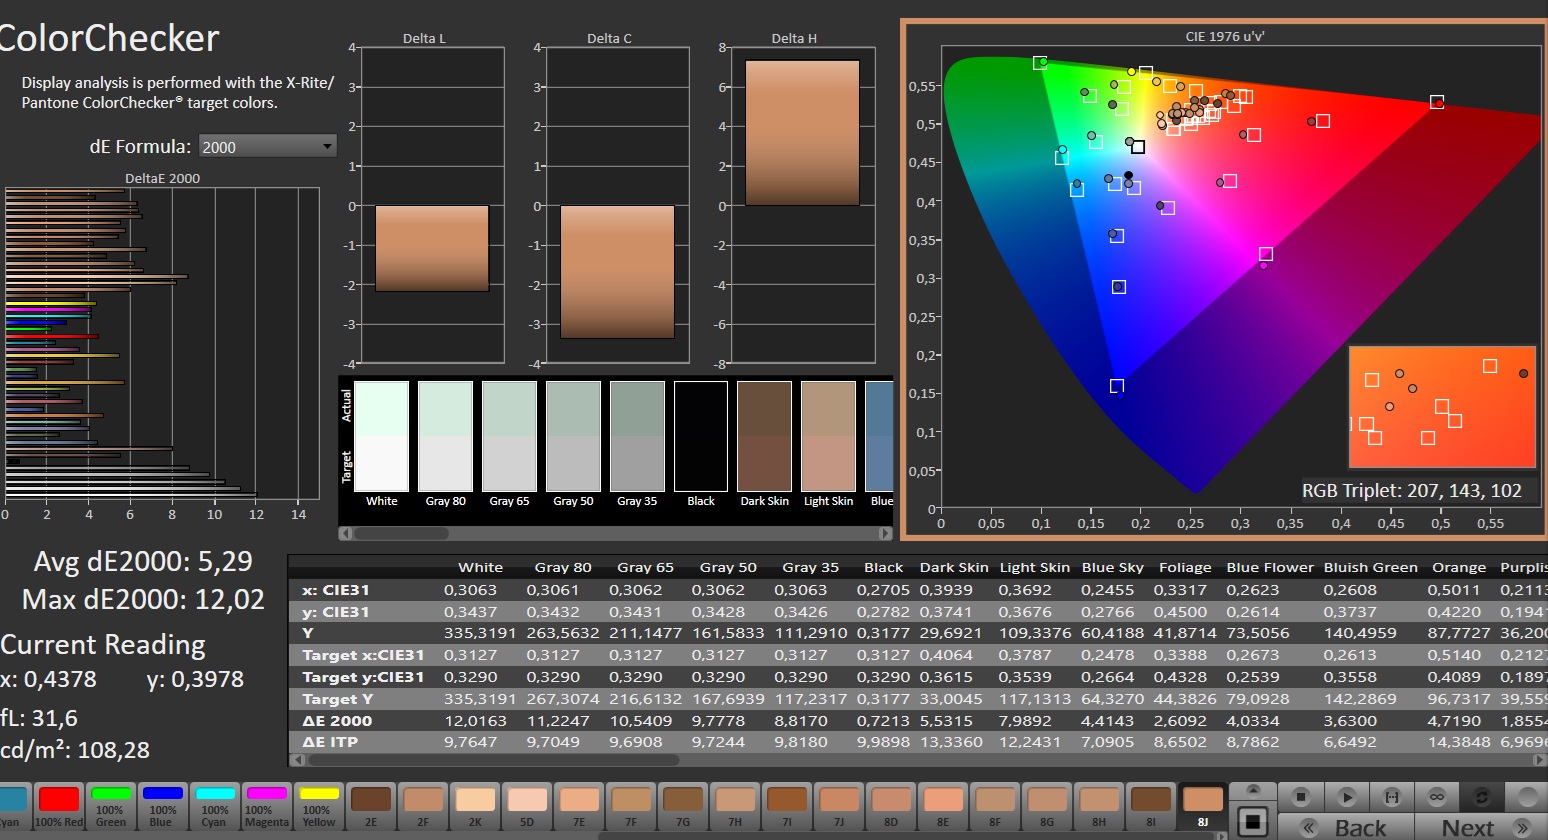
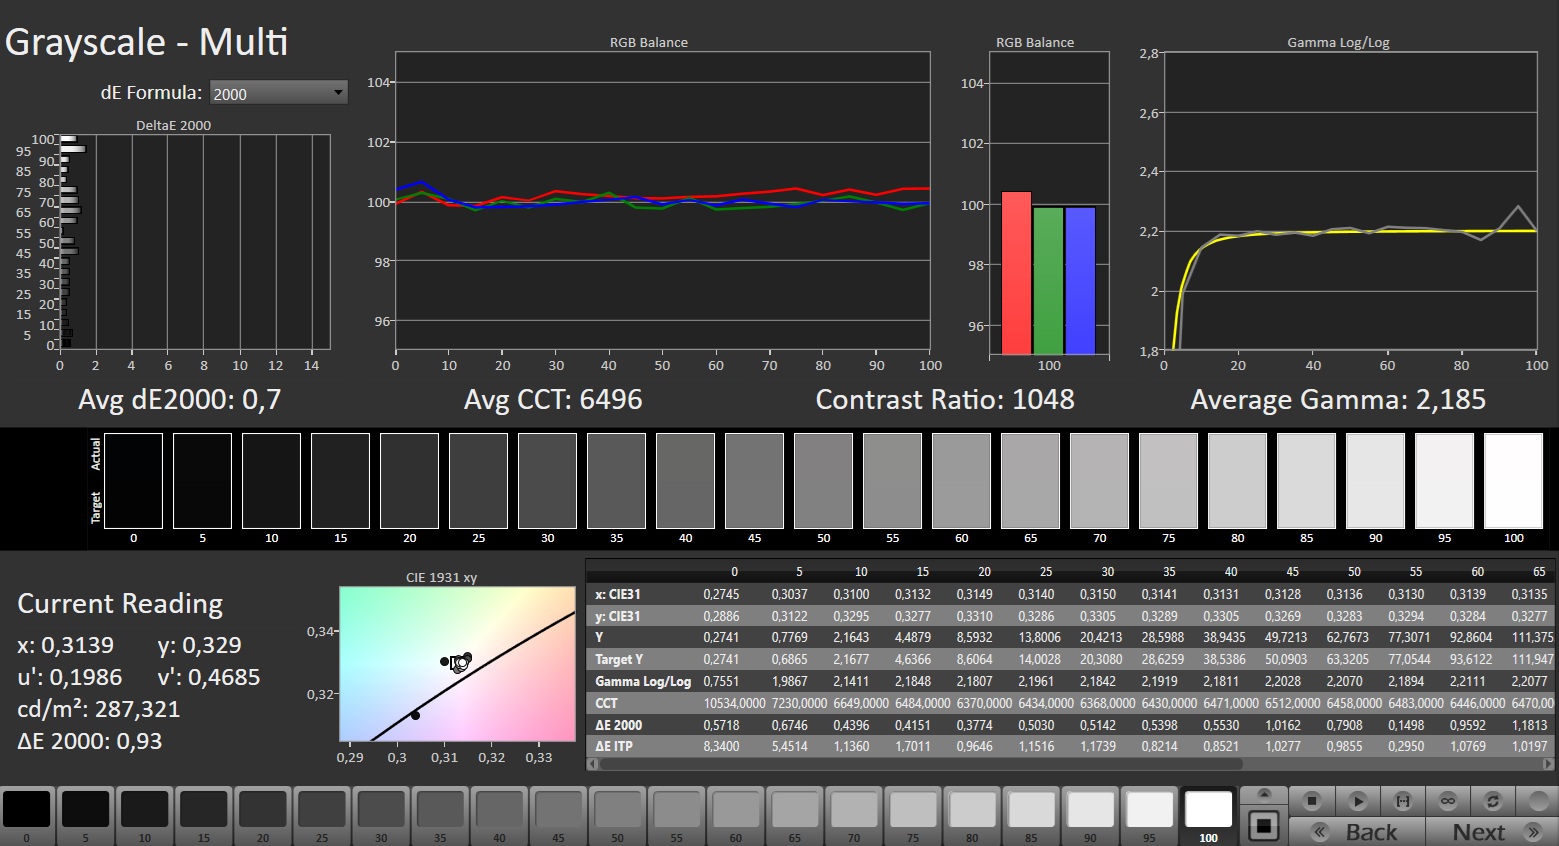
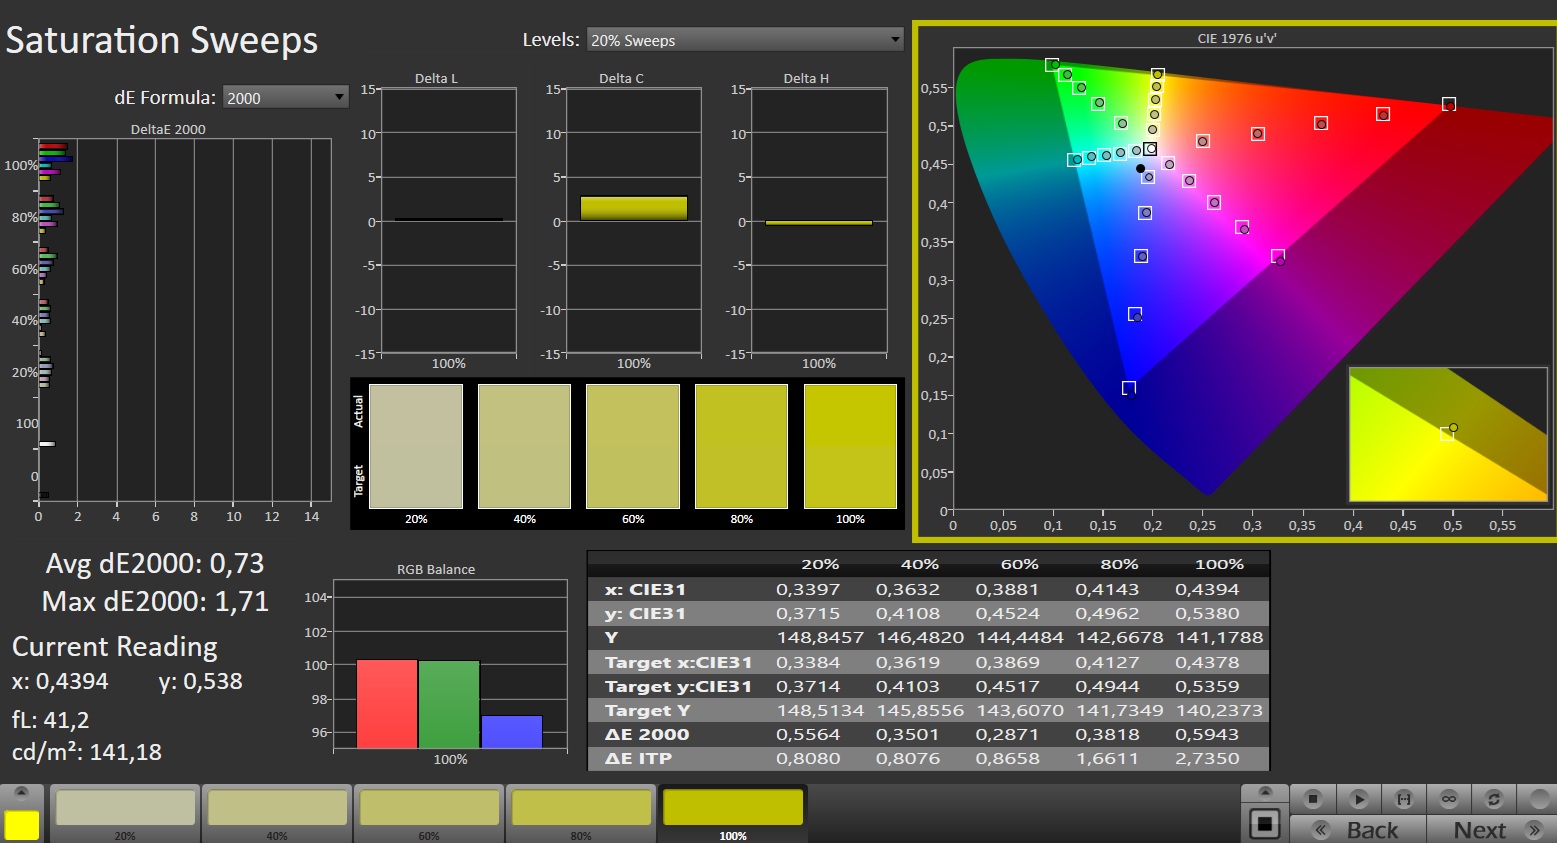
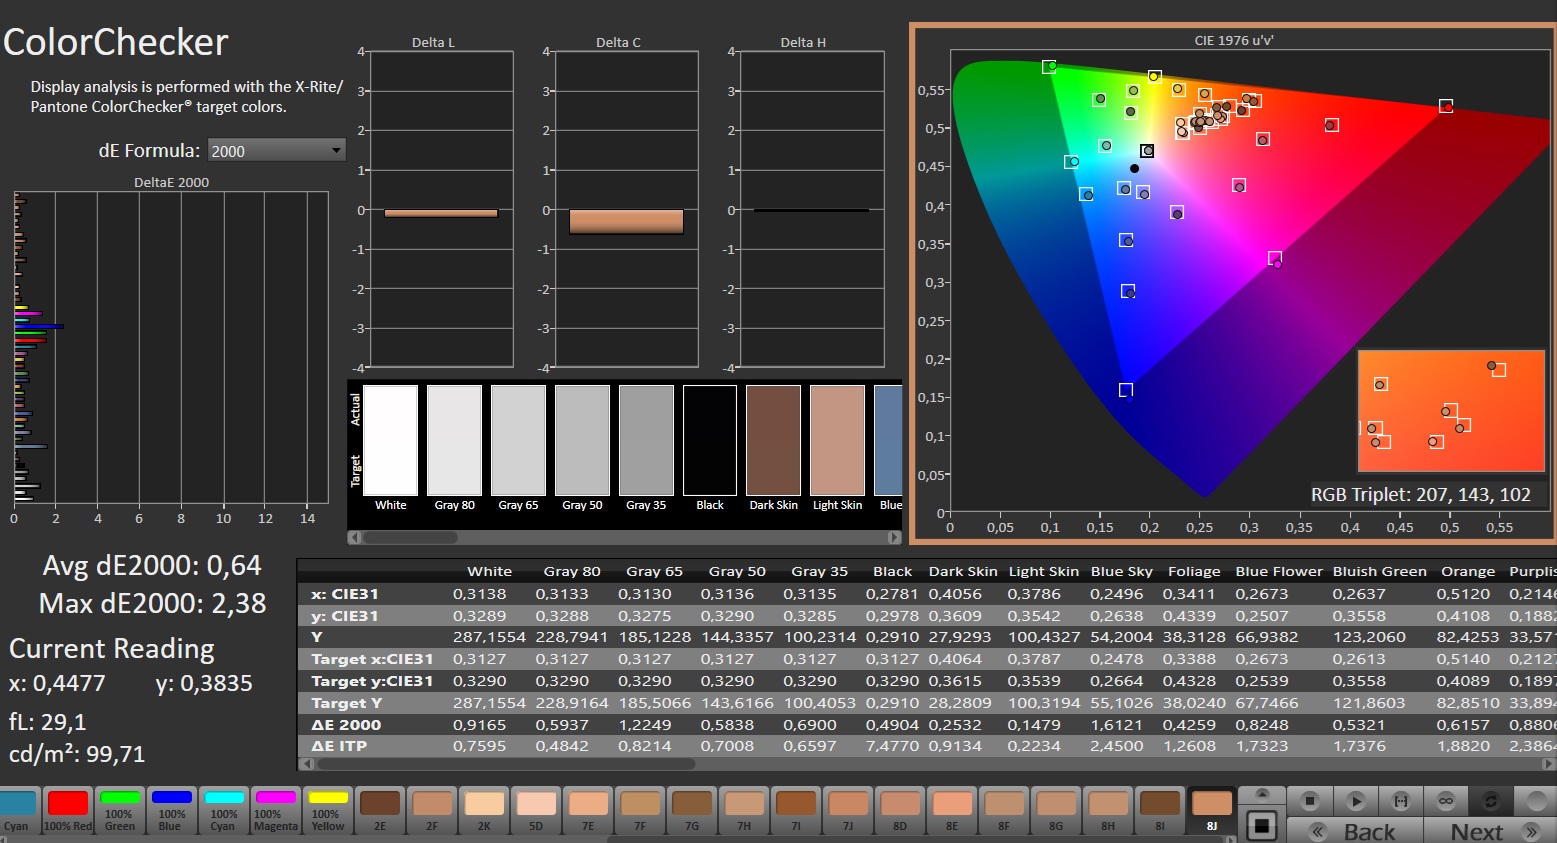
Color accuracy is also not a strong suit of the display—at least not with its factory settings. However, after calibration (our ICC profile is linked above, to the right of the luminance graph), the image becomes very color accurate.
Its viewing angles and response times are at a level typical for IPS panels.

Display Response Times
| ↔ Response Time Black to White | ||
|---|---|---|
| 9.9 ms ... rise ↗ and fall ↘ combined | ↗ 4.7 ms rise | 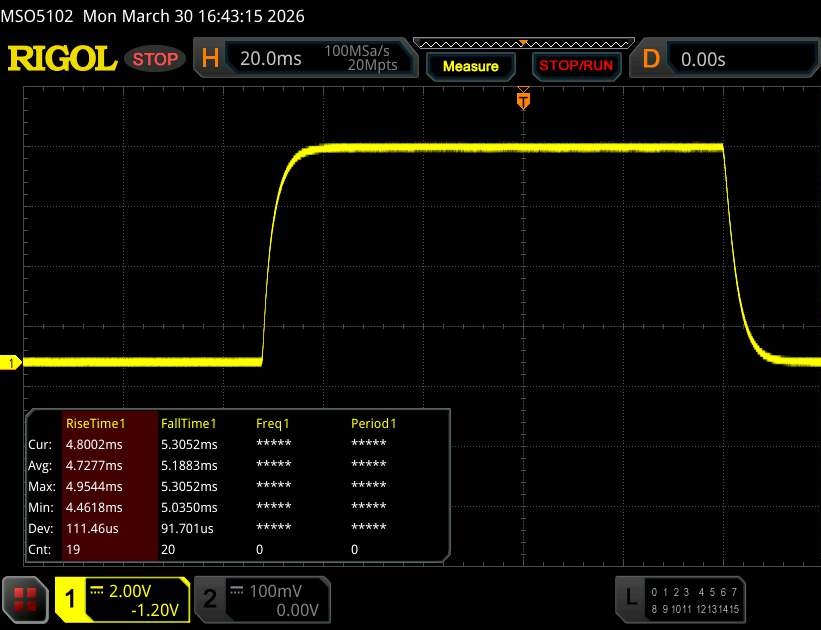 |
| ↘ 5.2 ms fall | ||
| The screen shows fast response rates in our tests and should be suited for gaming. In comparison, all tested devices range from 0.1 (minimum) to 240 (maximum) ms. » 27 % of all devices are better. This means that the measured response time is better than the average of all tested devices (19.8 ms). | ||
| ↔ Response Time 50% Grey to 80% Grey | ||
| 7.6 ms ... rise ↗ and fall ↘ combined | ↗ 3.6 ms rise | 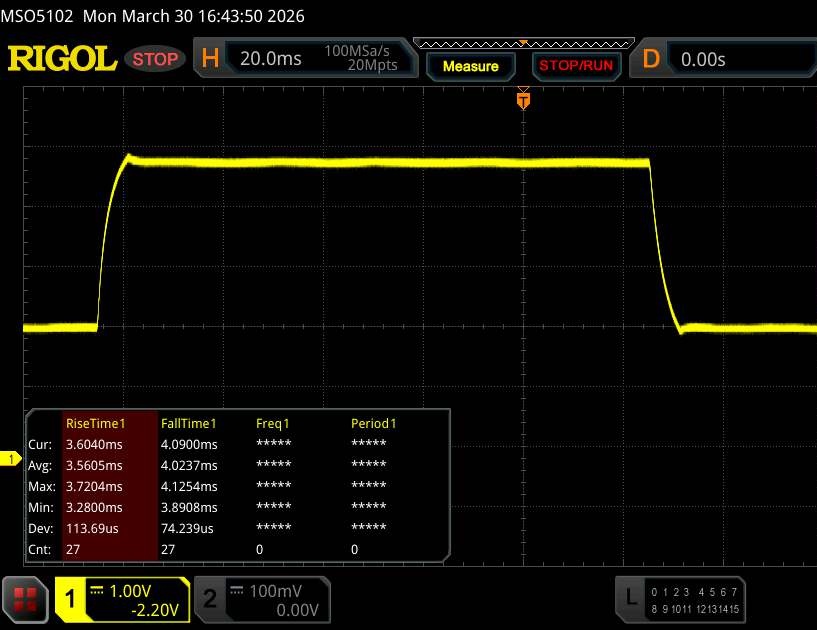 |
| ↘ 4 ms fall | ||
| The screen shows very fast response rates in our tests and should be very well suited for fast-paced gaming. In comparison, all tested devices range from 0.165 (minimum) to 636 (maximum) ms. » 20 % of all devices are better. This means that the measured response time is better than the average of all tested devices (31 ms). | ||
Screen Flickering / PWM (Pulse-Width Modulation)
| Screen flickering / PWM not detected |  | ||
In comparison: 52 % of all tested devices do not use PWM to dim the display. If PWM was detected, an average of 7765 (minimum: 5 - maximum: 343500) Hz was measured. | |||

Performance
The Gaming A18 Pro is positioned in the (upper) mid-range in terms of both CPU and GPU performance. 32 GB of RAM should be sufficient for most users for the next few years, and the 1 TB of storage can be easily expanded thanks through the second M.2 slot.
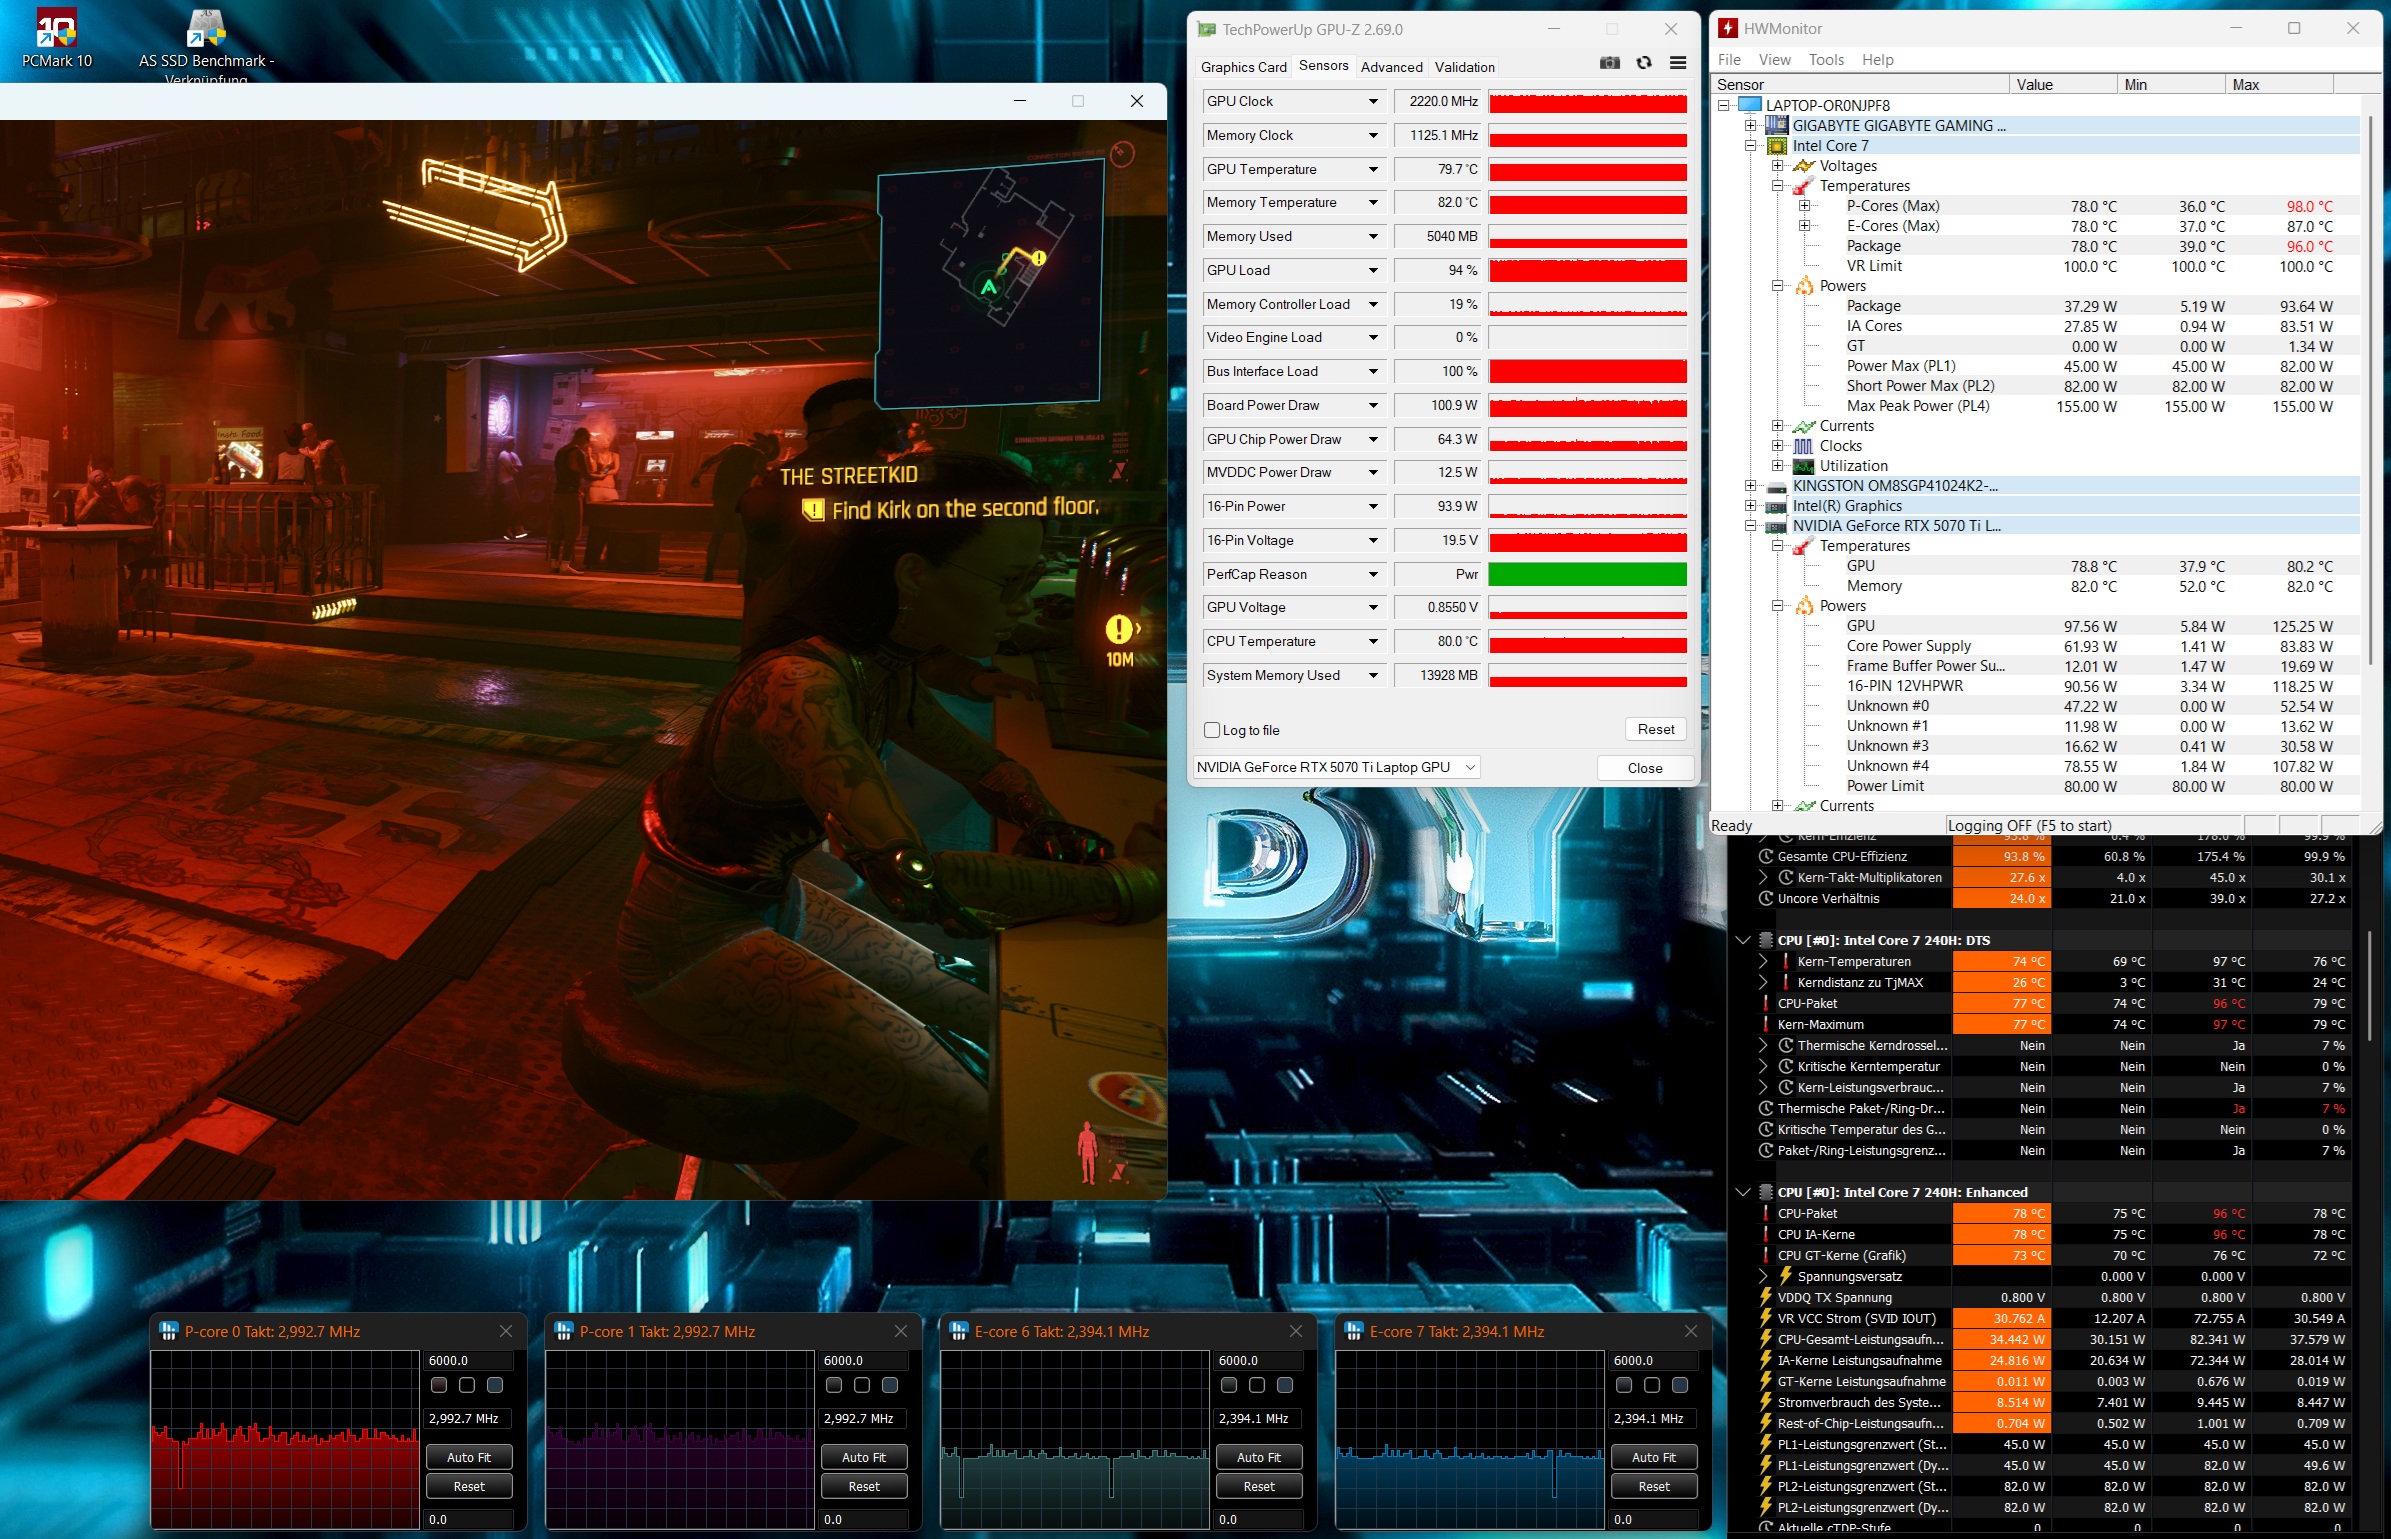
Testing conditions
The 18-inch system offers five operating modes, three of which are compared in the table below. For the measurements, we used Game mode, which prioritizes performance at the expense of increased noise levels.
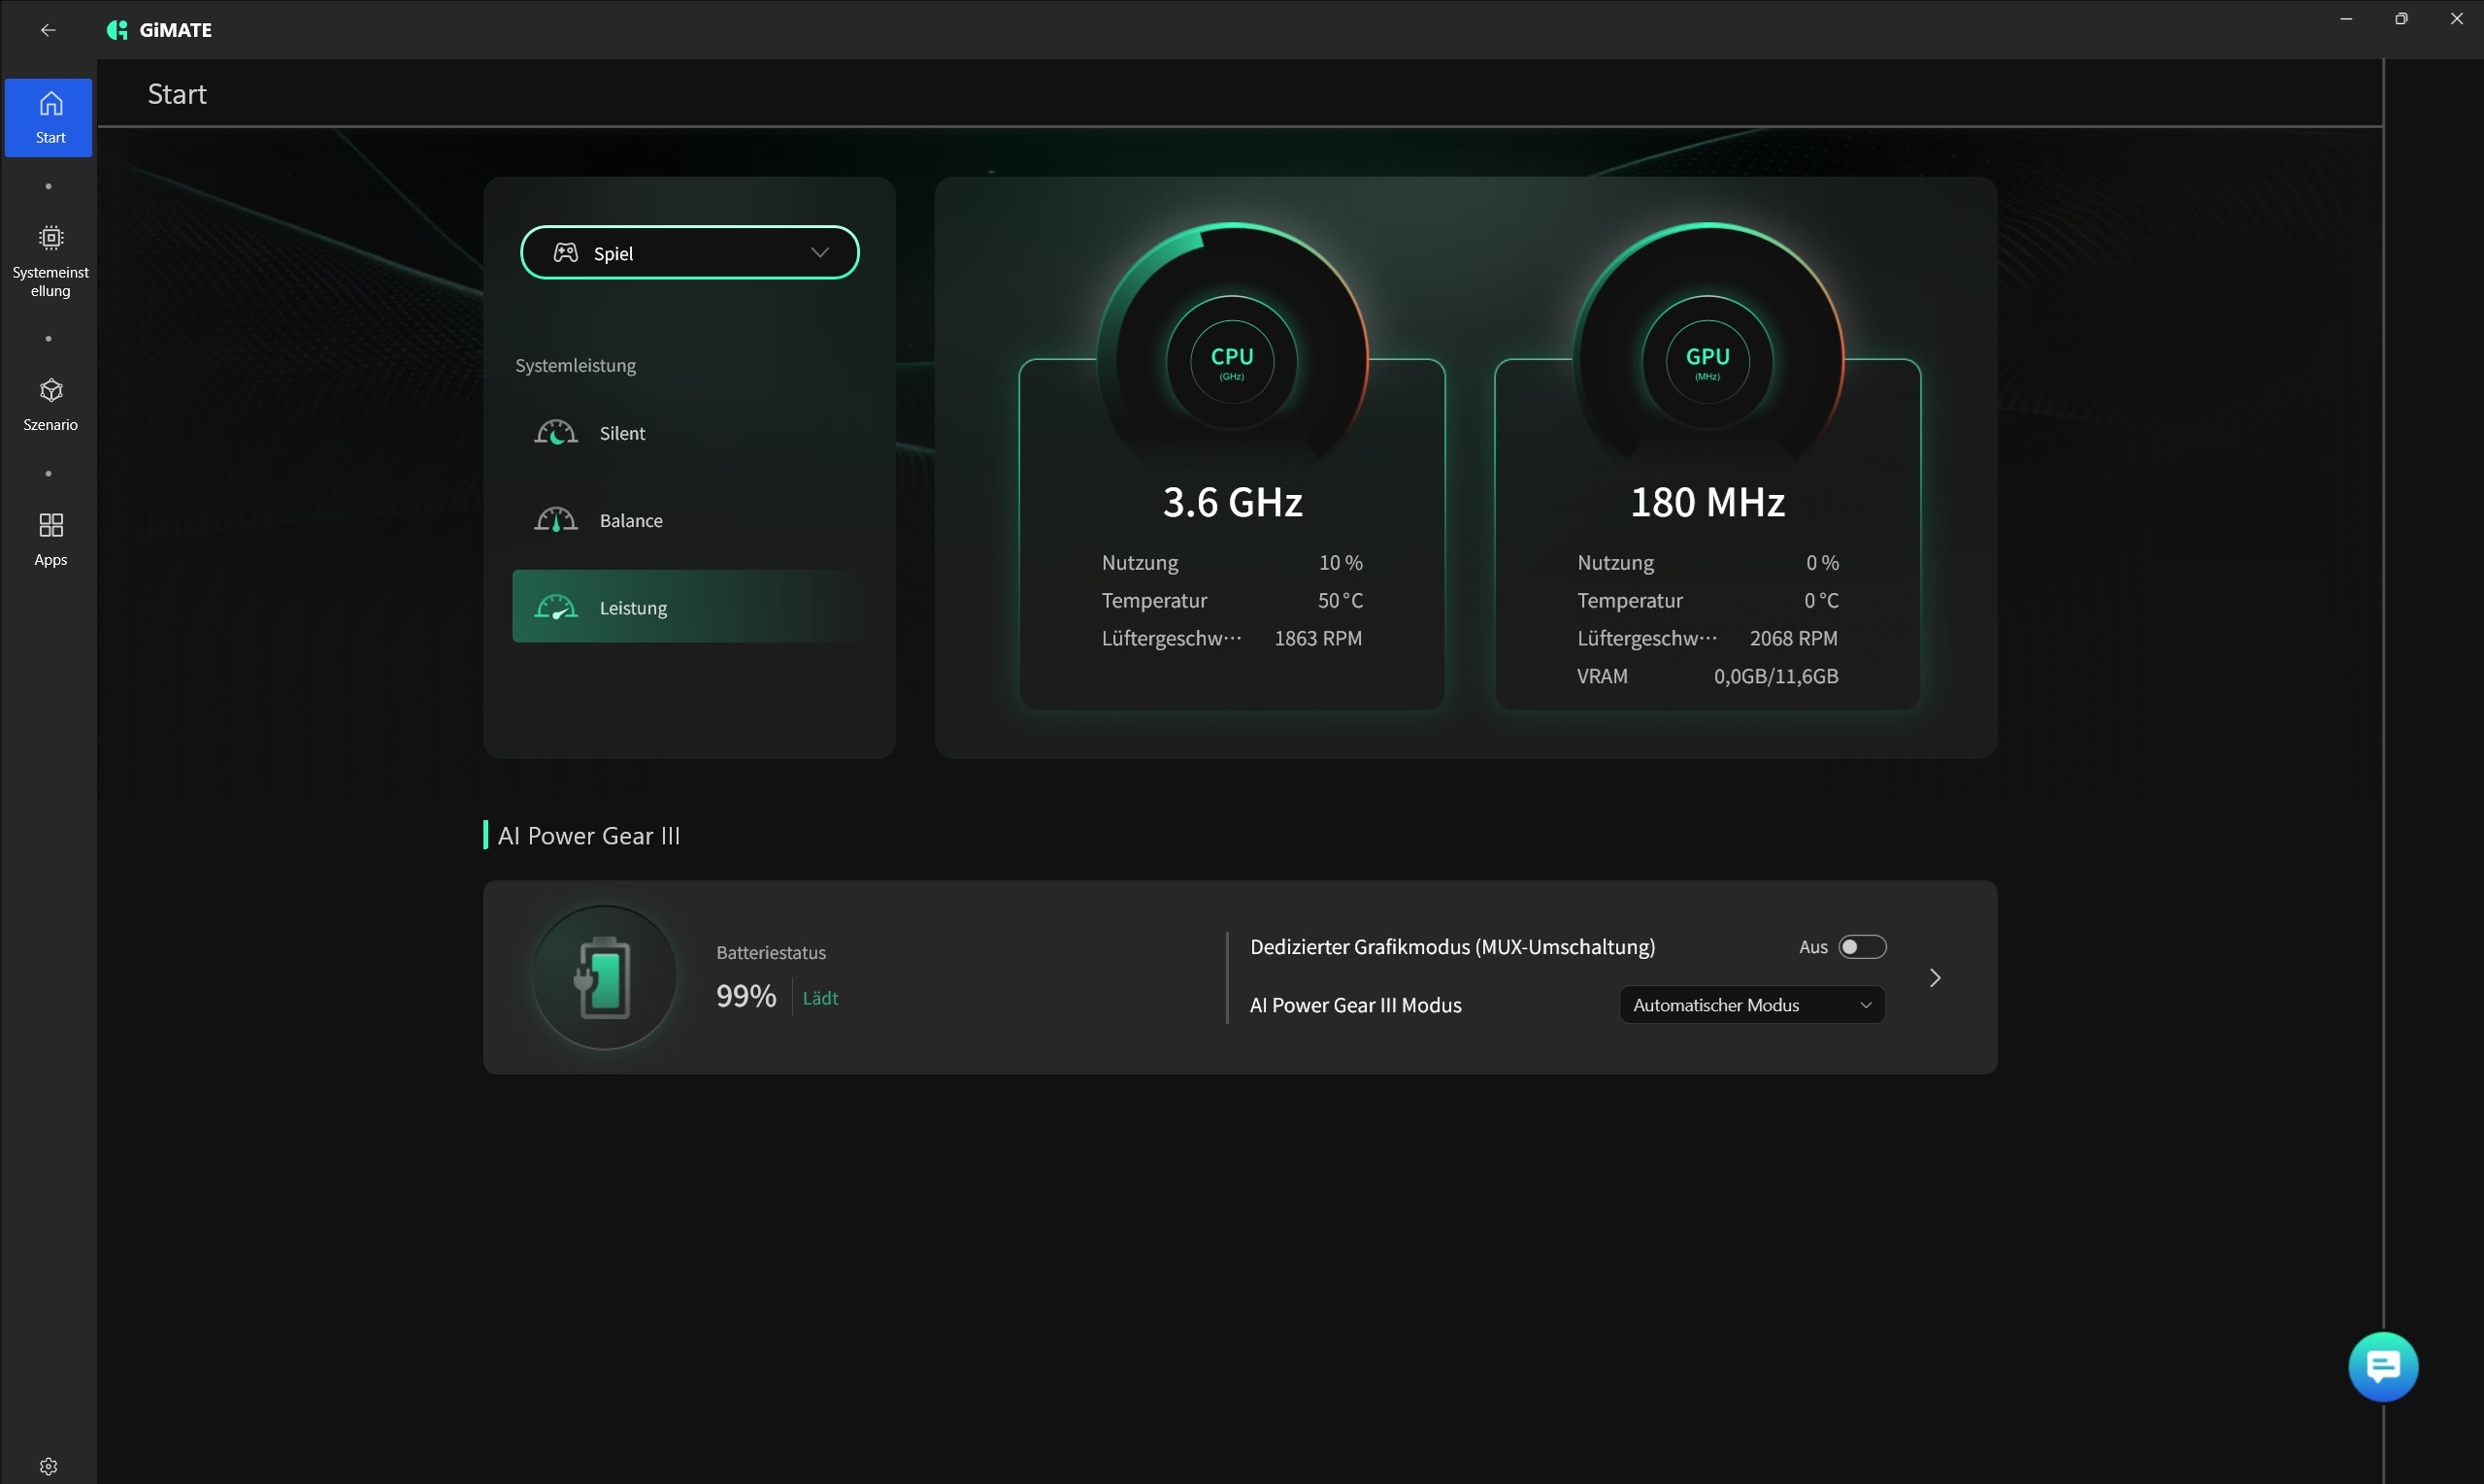
| Mode | Game | Balanced | Energy Saving |
| Cyberpunk 2077 Noise | 57 dB(A) | 48 dB(A) | 34 dB(A) |
| Cyberpunk 2077 Framerate (FHD/Ultra) | 107.6 fps | 89 fps | 59.5 fps |
| GPU Power Draw | ~105 W | ~85 W | ~35 W |
| CPU PL1 | 82 W | 55 W | 45 W |
| CPU PL2 | 82 W | 82 W | 60 W |
| Cinebench R15 Multi Score | 2,397 points | 2,390 points | 2,155 points |
Processor
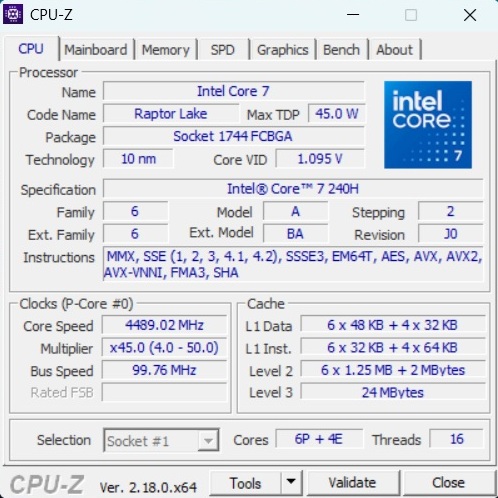
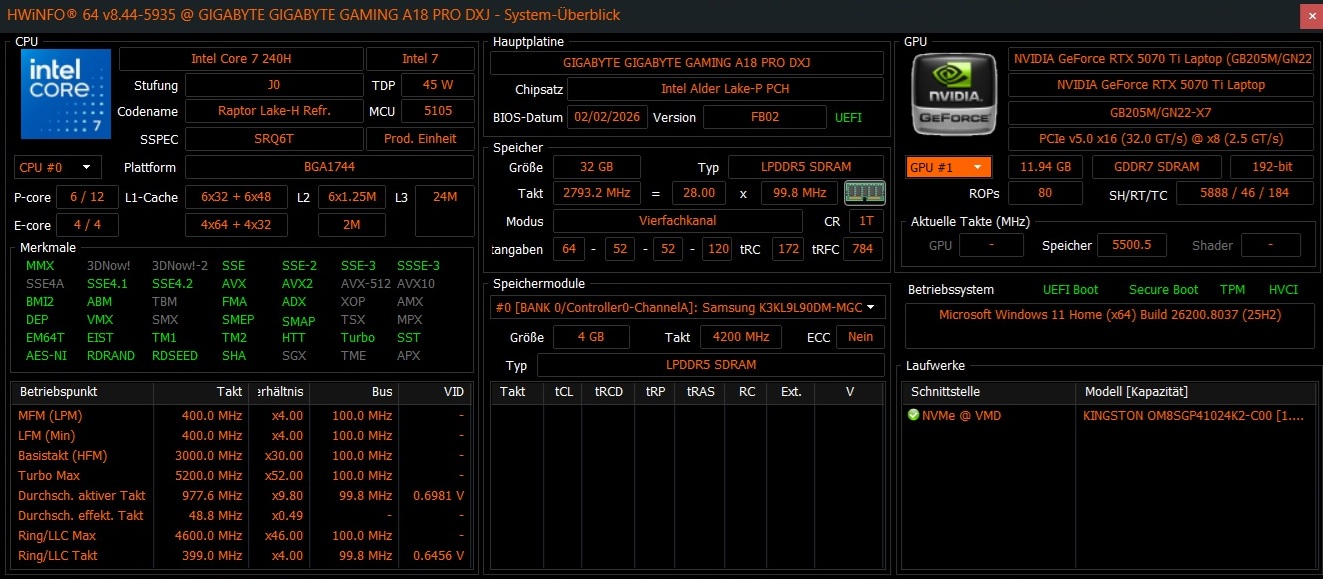
The Core 7 240H is a mid-range chip from the Raptor Lake generation, featuring six performance cores with Hyper-Threading and four efficiency cores without it, for a total of 16 threads. In CPU benchmarks, the 240H performs roughly on par with its AMD counterparts, the Ryzen 7 260 and Ryzen AI 7 350, with the latter holding a slight advantage. However, the Gaming A18 Pro cannot compete with higher-end processors such as the Core Ultra 9 275HX and Ryzen 9 9955HX found in some competing 18-inch laptops.
Cinebench R15 Multi continuous test
* ... smaller is better
AIDA64: FP32 Ray-Trace | FPU Julia | CPU SHA3 | CPU Queen | FPU SinJulia | FPU Mandel | CPU AES | CPU ZLib | FP64 Ray-Trace | CPU PhotoWorxx | CPU CheckMate
| Performance rating | |
| MSI Vector A18 HX A9W -1! | |
| Lenovo Legion 9 18IAX10 -1! | |
| Average of class Gaming | |
| Asus TUF Gaming A18 FA808UP-S8022W -1! | |
| Acer Nitro 18 AI AN18-61-R10V -1! | |
| Gigabyte Gaming A18 Pro -1! | |
| Average Intel Core 7 240H | |
| AIDA64 / FP32 Ray-Trace | |
| MSI Vector A18 HX A9W (v6.92.6600) | |
| Lenovo Legion 9 18IAX10 (v6.92.6600) | |
| Average of class Gaming (10227 - 85542, n=107, last 2 years) | |
| Acer Nitro 18 AI AN18-61-R10V (v6.92.6600) | |
| Asus TUF Gaming A18 FA808UP-S8022W (v6.92.6600) | |
| Gigabyte Gaming A18 Pro (v8.20.8100) | |
| Average Intel Core 7 240H (11867 - 15972, n=5) | |
| AIDA64 / FPU Julia | |
| MSI Vector A18 HX A9W (v6.92.6600) | |
| Lenovo Legion 9 18IAX10 (v6.92.6600) | |
| Average of class Gaming (51376 - 238426, n=107, last 2 years) | |
| Asus TUF Gaming A18 FA808UP-S8022W (v6.92.6600) | |
| Acer Nitro 18 AI AN18-61-R10V (v6.92.6600) | |
| Gigabyte Gaming A18 Pro (v8.20.8100) | |
| Average Intel Core 7 240H (59260 - 80238, n=5) | |
| AIDA64 / CPU SHA3 | |
| Lenovo Legion 9 18IAX10 (v6.92.6600) | |
| MSI Vector A18 HX A9W (v6.92.6600) | |
| Average of class Gaming (2180 - 9817, n=107, last 2 years) | |
| Asus TUF Gaming A18 FA808UP-S8022W (v6.92.6600) | |
| Acer Nitro 18 AI AN18-61-R10V (v6.92.6600) | |
| Gigabyte Gaming A18 Pro (v8.20.8100) | |
| Average Intel Core 7 240H (2455 - 3287, n=5) | |
| AIDA64 / CPU Queen | |
| MSI Vector A18 HX A9W (v6.92.6600) | |
| Lenovo Legion 9 18IAX10 (v6.92.6600) | |
| Asus TUF Gaming A18 FA808UP-S8022W (v6.92.6600) | |
| Average of class Gaming (49785 - 173351, n=95, last 2 years) | |
| Average Intel Core 7 240H (75356 - 86602, n=3) | |
| Acer Nitro 18 AI AN18-61-R10V (v6.92.6600) | |
| AIDA64 / FPU SinJulia | |
| MSI Vector A18 HX A9W (v6.92.6600) | |
| Asus TUF Gaming A18 FA808UP-S8022W (v6.92.6600) | |
| Average of class Gaming (4424 - 33636, n=107, last 2 years) | |
| Lenovo Legion 9 18IAX10 (v6.92.6600) | |
| Acer Nitro 18 AI AN18-61-R10V (v6.92.6600) | |
| Gigabyte Gaming A18 Pro (v8.20.8100) | |
| Average Intel Core 7 240H (7777 - 9366, n=5) | |
| AIDA64 / FPU Mandel | |
| MSI Vector A18 HX A9W (v6.92.6600) | |
| Lenovo Legion 9 18IAX10 (v6.92.6600) | |
| Average of class Gaming (25115 - 128721, n=107, last 2 years) | |
| Asus TUF Gaming A18 FA808UP-S8022W (v6.92.6600) | |
| Acer Nitro 18 AI AN18-61-R10V (v6.92.6600) | |
| Gigabyte Gaming A18 Pro (v8.20.8100) | |
| Average Intel Core 7 240H (29381 - 39967, n=5) | |
| AIDA64 / CPU AES | |
| Lenovo Legion 9 18IAX10 (v6.92.6600) | |
| MSI Vector A18 HX A9W (v6.92.6600) | |
| Average of class Gaming (39258 - 247074, n=107, last 2 years) | |
| Asus TUF Gaming A18 FA808UP-S8022W (v6.92.6600) | |
| Acer Nitro 18 AI AN18-61-R10V (v6.92.6600) | |
| Gigabyte Gaming A18 Pro (v8.20.8100) | |
| Average Intel Core 7 240H (50528 - 67855, n=5) | |
| AIDA64 / CPU ZLib | |
| MSI Vector A18 HX A9W (v6.92.6600) | |
| Lenovo Legion 9 18IAX10 (v6.92.6600) | |
| Average of class Gaming (574 - 2531, n=107, last 2 years) | |
| Acer Nitro 18 AI AN18-61-R10V (v6.92.6600) | |
| Asus TUF Gaming A18 FA808UP-S8022W (v6.92.6600) | |
| Gigabyte Gaming A18 Pro (v8.20.8100) | |
| Average Intel Core 7 240H (725 - 951, n=5) | |
| AIDA64 / FP64 Ray-Trace | |
| MSI Vector A18 HX A9W (v6.92.6600) | |
| Lenovo Legion 9 18IAX10 (v6.92.6600) | |
| Average of class Gaming (5509 - 45446, n=107, last 2 years) | |
| Asus TUF Gaming A18 FA808UP-S8022W (v6.92.6600) | |
| Acer Nitro 18 AI AN18-61-R10V (v6.92.6600) | |
| Gigabyte Gaming A18 Pro (v8.20.8100) | |
| Average Intel Core 7 240H (6389 - 8569, n=5) | |
| AIDA64 / CPU PhotoWorxx | |
| Lenovo Legion 9 18IAX10 (v6.92.6600) | |
| Gigabyte Gaming A18 Pro (v8.20.8100) | |
| Average of class Gaming (12271 - 89891, n=107, last 2 years) | |
| MSI Vector A18 HX A9W (v6.92.6600) | |
| Asus TUF Gaming A18 FA808UP-S8022W (v6.92.6600) | |
| Average Intel Core 7 240H (21710 - 44874, n=5) | |
| Acer Nitro 18 AI AN18-61-R10V (v6.92.6600) | |
| AIDA64 / CPU CheckMate | |
| Average of class Gaming (2930 - 11788, n=11, last 2 years) | |
| Average Intel Core 7 240H (2930 - 2938, n=2) | |
| Gigabyte Gaming A18 Pro (v8.20.8100) | |
System Performance
In terms of overall system performance, the Gigabyte model positions itself between the Nitro 18 AI and the TUF Gaming A18, which is a solid result.
PCMark 10: Score | Essentials | Productivity | Digital Content Creation
CrossMark: Overall | Productivity | Creativity | Responsiveness
WebXPRT 3: Overall
WebXPRT 4: Overall
Mozilla Kraken 1.1: Total
| Performance rating | |
| MSI Vector A18 HX A9W | |
| Lenovo Legion 9 18IAX10 | |
| Acer Nitro 18 AI AN18-61-R10V -1! | |
| Average of class Gaming | |
| Gigabyte Gaming A18 Pro | |
| Average Intel Core 7 240H, NVIDIA GeForce RTX 5070 Ti Laptop | |
| Asus TUF Gaming A18 FA808UP-S8022W | |
| PCMark 10 / Score | |
| MSI Vector A18 HX A9W | |
| Acer Nitro 18 AI AN18-61-R10V | |
| Average of class Gaming (5828 - 11574, n=95, last 2 years) | |
| Average Intel Core 7 240H, NVIDIA GeForce RTX 5070 Ti Laptop (8234 - 8407, n=2) | |
| Gigabyte Gaming A18 Pro | |
| Lenovo Legion 9 18IAX10 | |
| Asus TUF Gaming A18 FA808UP-S8022W | |
| PCMark 10 / Essentials | |
| Lenovo Legion 9 18IAX10 | |
| MSI Vector A18 HX A9W | |
| Average of class Gaming (8810 - 12600, n=99, last 2 years) | |
| Acer Nitro 18 AI AN18-61-R10V | |
| Asus TUF Gaming A18 FA808UP-S8022W | |
| Gigabyte Gaming A18 Pro | |
| Average Intel Core 7 240H, NVIDIA GeForce RTX 5070 Ti Laptop (9053 - 9807, n=2) | |
| PCMark 10 / Productivity | |
| Acer Nitro 18 AI AN18-61-R10V | |
| Gigabyte Gaming A18 Pro | |
| Average Intel Core 7 240H, NVIDIA GeForce RTX 5070 Ti Laptop (13391 - 13612, n=2) | |
| Average of class Gaming (6845 - 21327, n=97, last 2 years) | |
| MSI Vector A18 HX A9W | |
| Lenovo Legion 9 18IAX10 | |
| Asus TUF Gaming A18 FA808UP-S8022W | |
| PCMark 10 / Digital Content Creation | |
| MSI Vector A18 HX A9W | |
| Average of class Gaming (7602 - 19657, n=97, last 2 years) | |
| Asus TUF Gaming A18 FA808UP-S8022W | |
| Acer Nitro 18 AI AN18-61-R10V | |
| Average Intel Core 7 240H, NVIDIA GeForce RTX 5070 Ti Laptop (11348 - 13301, n=2) | |
| Gigabyte Gaming A18 Pro | |
| Lenovo Legion 9 18IAX10 | |
| CrossMark / Overall | |
| Lenovo Legion 9 18IAX10 | |
| MSI Vector A18 HX A9W | |
| Average of class Gaming (1366 - 2409, n=96, last 2 years) | |
| Gigabyte Gaming A18 Pro | |
| Average Intel Core 7 240H, NVIDIA GeForce RTX 5070 Ti Laptop (1740 - 1852, n=2) | |
| Asus TUF Gaming A18 FA808UP-S8022W | |
| Acer Nitro 18 AI AN18-61-R10V | |
| CrossMark / Productivity | |
| Lenovo Legion 9 18IAX10 | |
| MSI Vector A18 HX A9W | |
| Average of class Gaming (1386 - 2254, n=96, last 2 years) | |
| Gigabyte Gaming A18 Pro | |
| Average Intel Core 7 240H, NVIDIA GeForce RTX 5070 Ti Laptop (1613 - 1732, n=2) | |
| Asus TUF Gaming A18 FA808UP-S8022W | |
| Acer Nitro 18 AI AN18-61-R10V | |
| CrossMark / Creativity | |
| MSI Vector A18 HX A9W | |
| Lenovo Legion 9 18IAX10 | |
| Average of class Gaming (1343 - 2729, n=96, last 2 years) | |
| Gigabyte Gaming A18 Pro | |
| Asus TUF Gaming A18 FA808UP-S8022W | |
| Average Intel Core 7 240H, NVIDIA GeForce RTX 5070 Ti Laptop (1925 - 1996, n=2) | |
| Acer Nitro 18 AI AN18-61-R10V | |
| CrossMark / Responsiveness | |
| Lenovo Legion 9 18IAX10 | |
| Gigabyte Gaming A18 Pro | |
| Average Intel Core 7 240H, NVIDIA GeForce RTX 5070 Ti Laptop (1611 - 1809, n=2) | |
| Average of class Gaming (1226 - 2334, n=96, last 2 years) | |
| MSI Vector A18 HX A9W | |
| Asus TUF Gaming A18 FA808UP-S8022W | |
| Acer Nitro 18 AI AN18-61-R10V | |
| WebXPRT 3 / Overall | |
| Lenovo Legion 9 18IAX10 | |
| MSI Vector A18 HX A9W | |
| Average of class Gaming (220 - 532, n=100, last 2 years) | |
| Acer Nitro 18 AI AN18-61-R10V | |
| Asus TUF Gaming A18 FA808UP-S8022W | |
| Average Intel Core 7 240H, NVIDIA GeForce RTX 5070 Ti Laptop (257 - 264, n=2) | |
| Gigabyte Gaming A18 Pro | |
| WebXPRT 4 / Overall | |
| Lenovo Legion 9 18IAX10 | |
| MSI Vector A18 HX A9W | |
| Average of class Gaming (165 - 354, n=101, last 2 years) | |
| Acer Nitro 18 AI AN18-61-R10V | |
| Asus TUF Gaming A18 FA808UP-S8022W | |
| Gigabyte Gaming A18 Pro | |
| Average Intel Core 7 240H, NVIDIA GeForce RTX 5070 Ti Laptop (238 - 239, n=2) | |
| Mozilla Kraken 1.1 / Total | |
| Asus TUF Gaming A18 FA808UP-S8022W | |
| Average Intel Core 7 240H, NVIDIA GeForce RTX 5070 Ti Laptop (552 - 555, n=2) | |
| Gigabyte Gaming A18 Pro | |
| Average of class Gaming (391 - 590, n=105, last 2 years) | |
| Lenovo Legion 9 18IAX10 | |
| MSI Vector A18 HX A9W | |
* ... smaller is better
| PCMark 10 Score | 8234 points | |
Help | ||
| AIDA64 / Memory Copy | |
| Lenovo Legion 9 18IAX10 | |
| Average of class Gaming (21750 - 129946, n=107, last 2 years) | |
| Asus TUF Gaming A18 FA808UP-S8022W | |
| Gigabyte Gaming A18 Pro | |
| MSI Vector A18 HX A9W | |
| Average Intel Core 7 240H (34965 - 69215, n=5) | |
| Acer Nitro 18 AI AN18-61-R10V | |
| AIDA64 / Memory Read | |
| Lenovo Legion 9 18IAX10 | |
| Average of class Gaming (22956 - 118858, n=107, last 2 years) | |
| MSI Vector A18 HX A9W | |
| Gigabyte Gaming A18 Pro | |
| Average Intel Core 7 240H (39706 - 71870, n=5) | |
| Asus TUF Gaming A18 FA808UP-S8022W | |
| Acer Nitro 18 AI AN18-61-R10V | |
| AIDA64 / Memory Write | |
| Lenovo Legion 9 18IAX10 | |
| Asus TUF Gaming A18 FA808UP-S8022W | |
| Gigabyte Gaming A18 Pro | |
| Average of class Gaming (22297 - 135096, n=107, last 2 years) | |
| MSI Vector A18 HX A9W | |
| Average Intel Core 7 240H (33560 - 80488, n=5) | |
| Acer Nitro 18 AI AN18-61-R10V | |
| AIDA64 / Memory Latency | |
| Gigabyte Gaming A18 Pro | |
| Lenovo Legion 9 18IAX10 | |
| Average of class Gaming (75.3 - 259, n=107, last 2 years) | |
| Average Intel Core 7 240H (97.1 - 125.6, n=5) | |
| MSI Vector A18 HX A9W | |
| Asus TUF Gaming A18 FA808UP-S8022W | |
| Acer Nitro 18 AI AN18-61-R10V | |
* ... smaller is better
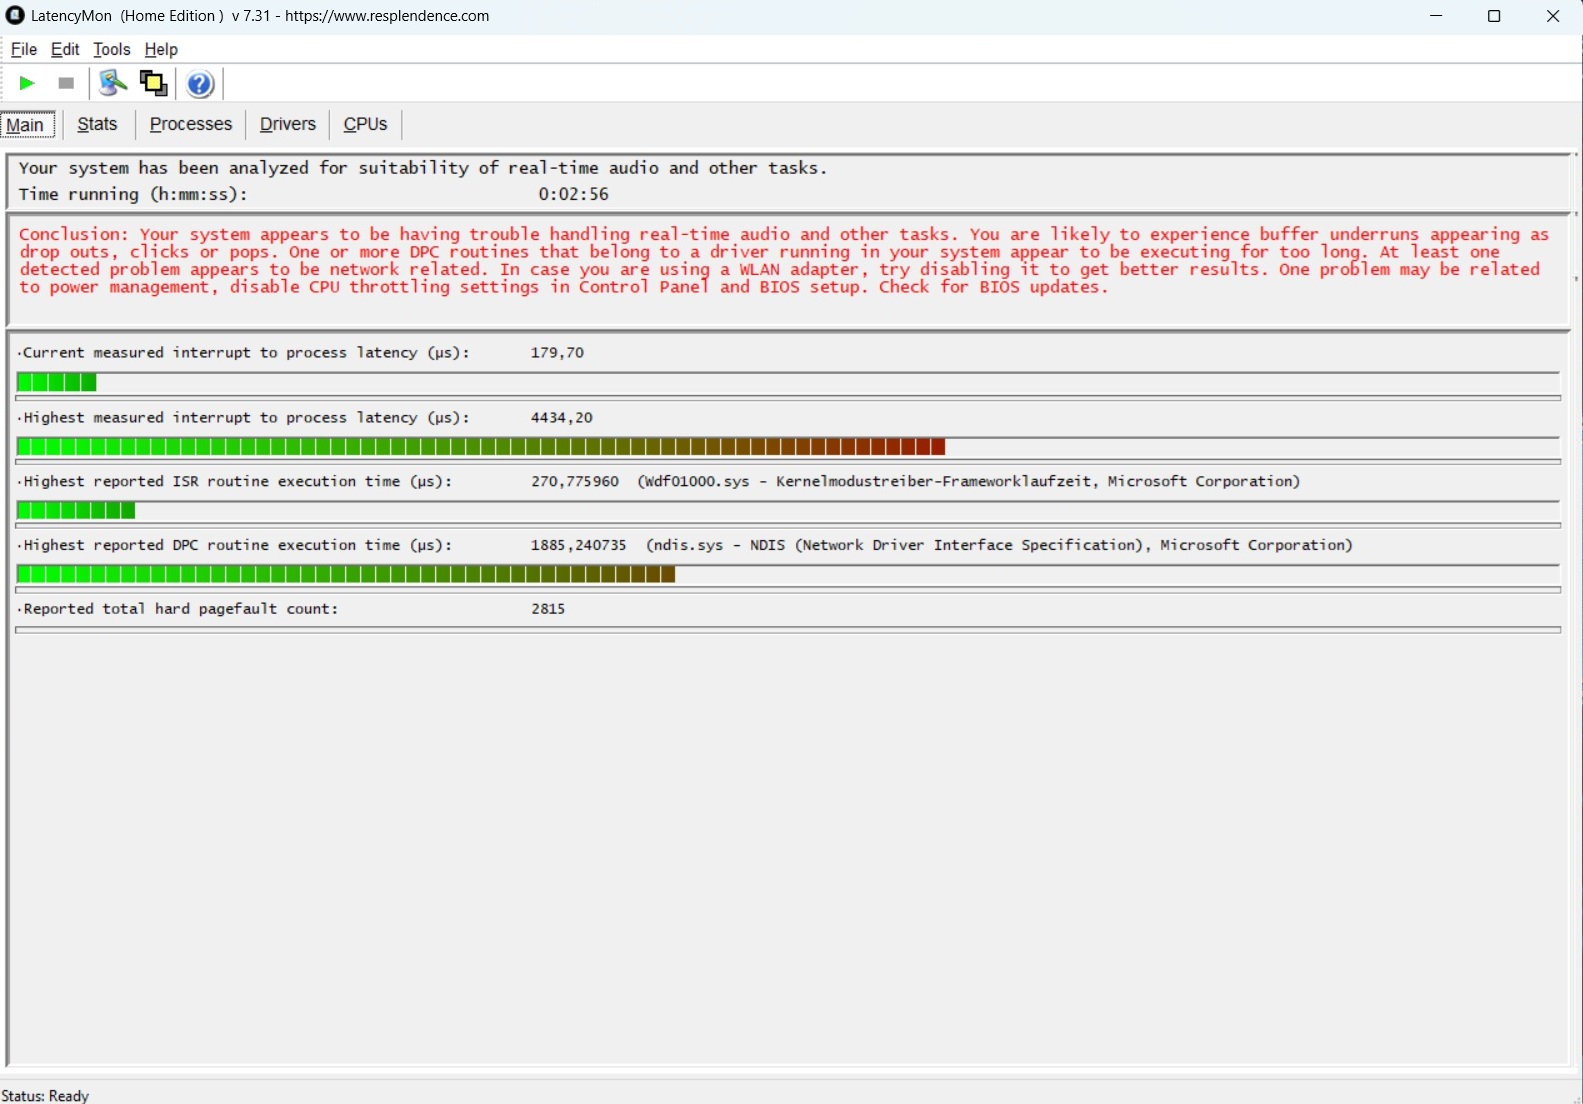
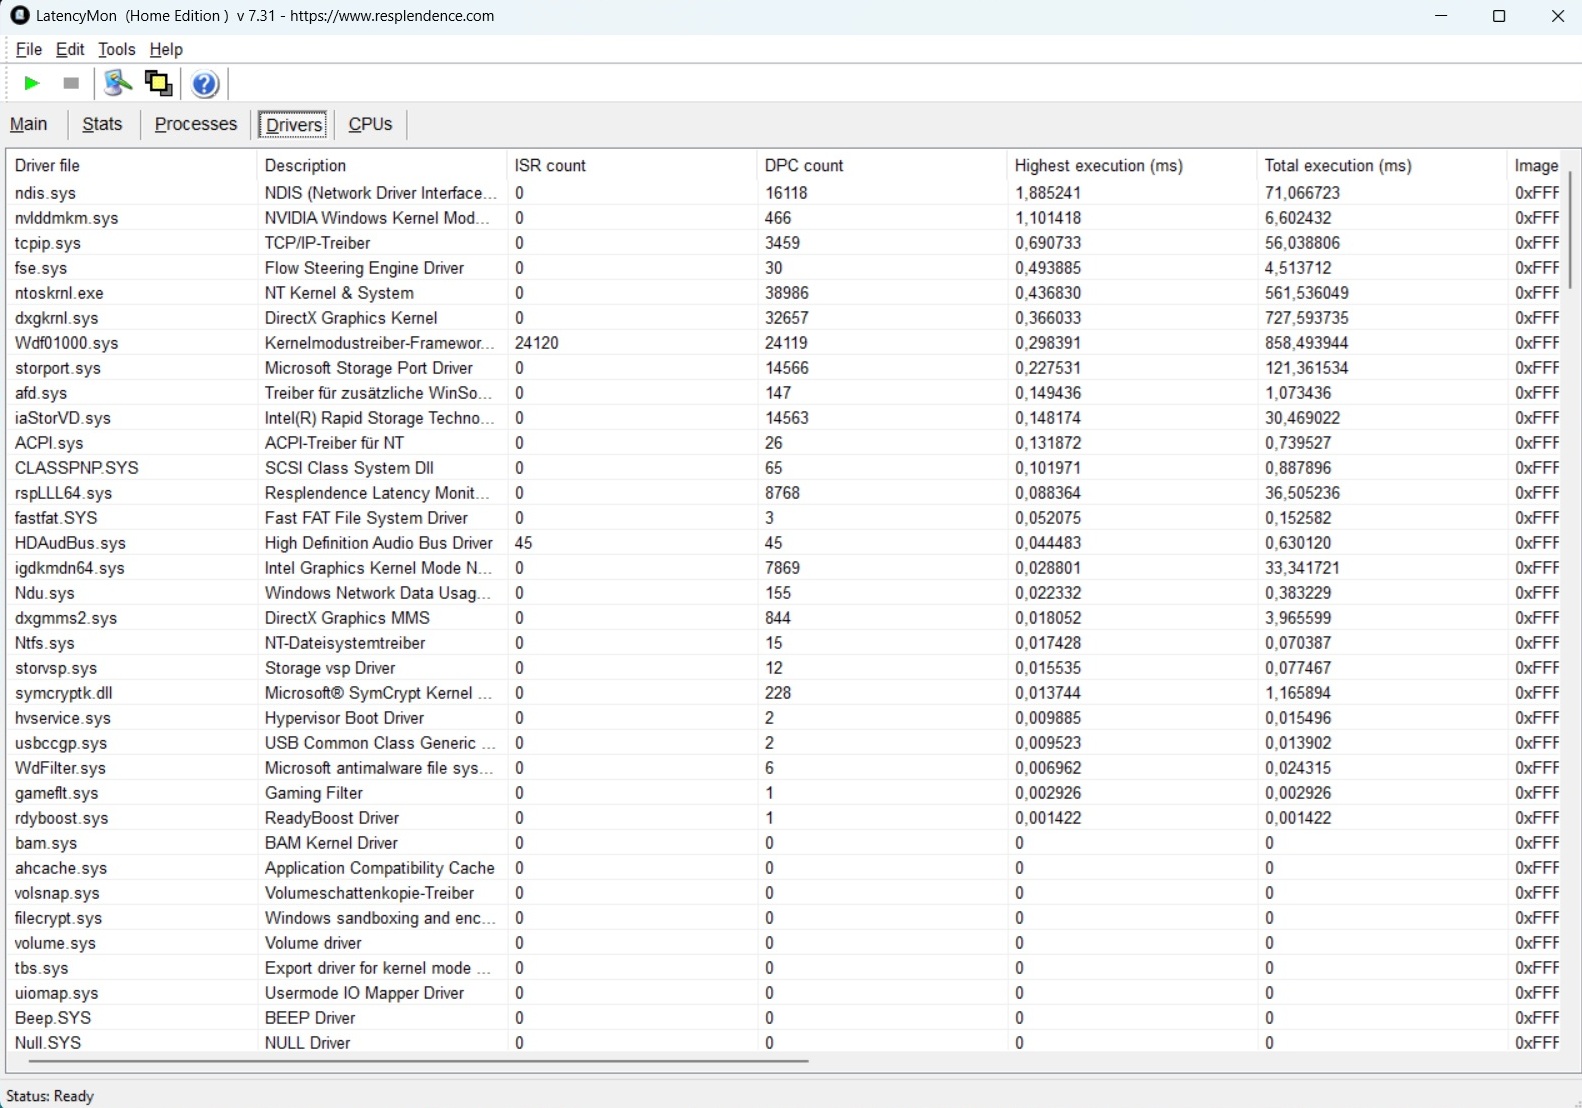
DPC latencies
The latencies, as with so many laptops, could and probably should be improved. The LatencyMon tool indicates potential issues in certain applications or usage scenarios (e.g., brief dropouts) are likely.
| DPC Latencies / LatencyMon - interrupt to process latency (max), Web, Youtube, Prime95 | |
| Acer Nitro 18 AI AN18-61-R10V | |
| Gigabyte Gaming A18 Pro | |
| Lenovo Legion 9 18IAX10 | |
| Asus TUF Gaming A18 FA808UP-S8022W | |
| MSI Vector A18 HX A9W | |
* ... smaller is better
Storage devices
The internal 1 TB SSD is unfortunately not entirely stable, performance-wise. In our loop test, we observed moderate fluctuations at a certain point, which is not the case with most competitors. However, the Kingston drive’s overall performance is relatively strong, particularly with read operations.

* ... smaller is better
SSD throttling check: DiskSpd Read Loop, Queue Depth 8
GPU performance
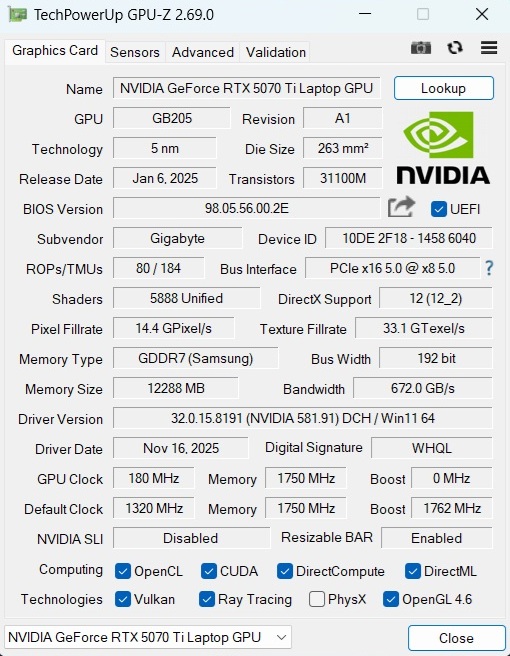
The mobile GeForce RTX 5070 Ti, with its 12 GB of GDDR7 VRAM and 5,888 shader units, comfortably positions itself between the mid-range and high-end segments. According to 3DMark, its GPU performance is roughly in line with the average RTX 5070 Ti laptop GPU in our database, with only minor deviations. The competing MSI Vector A18 HX is more than 10% faster, despite featuring a less noisy cooling system.
| 3DMark 11 Performance | 38610 points | |
| 3DMark Fire Strike Score | 29047 points | |
| 3DMark Time Spy Score | 14753 points | |
Help | ||
* ... smaller is better
Gaming performance
While the Core 7 240H can occasionally become the limiting factor at moderate resolutions or settings—particularly in older titles—modern and demanding games are almost exclusively GPU-bound. With the exception of poorly optimized games such as Borderlands 4, most titles run smoothly here at QHD resolution with high to maximum settings. As usual, upscaling can provide additional headroom when needed. Using DLSS Balanced, just as an example, we achieved 50 fps instead of 44 fps in Death Stranding 2 (2560 × 1440, Very High preset). With 4× frame generation enabled, the average frame rate increased to a very smooth 149 fps.
| GTA V - 1920x1080 Highest AA:4xMSAA + FX AF:16x | |
| Average NVIDIA GeForce RTX 5070 Ti Laptop (98 - 166.3, n=14) | |
| Average of class Gaming (48.3 - 186.9, n=98, last 2 years) | |
| Acer Nitro 18 AI AN18-61-R10V | |
| Asus TUF Gaming A18 FA808UP-S8022W | |
| Gigabyte Gaming A18 Pro | |
| Final Fantasy XV Benchmark - 1920x1080 High Quality | |
| Lenovo Legion 9 18IAX10 | |
| MSI Vector A18 HX A9W | |
| Average NVIDIA GeForce RTX 5070 Ti Laptop (108.9 - 181.4, n=15) | |
| Average of class Gaming (41 - 215, n=99, last 2 years) | |
| Asus TUF Gaming A18 FA808UP-S8022W | |
| Gigabyte Gaming A18 Pro | |
| Strange Brigade - 1920x1080 ultra AA:ultra AF:16 | |
| Lenovo Legion 9 18IAX10 | |
| MSI Vector A18 HX A9W | |
| Average NVIDIA GeForce RTX 5070 Ti Laptop (136.4 - 353, n=12) | |
| Average of class Gaming (76.3 - 456, n=89, last 2 years) | |
| Gigabyte Gaming A18 Pro | |
| Asus TUF Gaming A18 FA808UP-S8022W | |
| low | med. | high | ultra | QHD | |
|---|---|---|---|---|---|
| GTA V (2015) | 167.8 | 153.8 | 102.7 | ||
| Dota 2 Reborn (2015) | 130.8 | 122.3 | 115.5 | ||
| Final Fantasy XV Benchmark (2018) | 123.2 | 111.3 | |||
| X-Plane 11.11 (2018) | 93.9 | 79.3 | |||
| Strange Brigade (2018) | 328 | 301 | 279 | ||
| Baldur's Gate 3 (2023) | 146.1 | 128.3 | 125.2 | ||
| Cyberpunk 2077 (2023) | 135.9 | 119.7 | 107.6 | ||
| Monster Hunter Wilds (2025) | 63.8 | 63.2 | 56 | 48.8 | |
| Borderlands 4 (2025) | 63.3 | 55.4 | 34.5 | 23.9 | |
| The Outer Worlds 2 (2025) | 79.6 | 69.8 | 53.9 | 36.1 | |
| ARC Raiders (2025) | 155.7 | 129.2 | 89.5 | 64 | |
| Anno 117: Pax Romana (2025) | 99 | 74.6 | 42.3 | 30.3 | |
| Resident Evil Requiem (2026) | 93.1 | 90.9 | 60.1 | 40.4 | |
| Death Stranding 2 (2026) | 64.7 | 62.8 | 49.9 | 43.8 | |
| Crimson Desert (2026) | 72.9 | 70.1 | 66.1 | 52.1 |
| Resident Evil Requiem | |
| 2560x1440 Max Settings + High Ray Tracing (no upscaling) | |
| Tuxedo Stellaris 16 | |
| Average NVIDIA GeForce RTX 5070 Ti Laptop (40.4 - 42.1, n=2) | |
| Gigabyte Gaming A18 Pro | |
| Average of class Gaming (26.6 - 42.1, n=3, last 2 years) | |
| Acer Nitro 18 AI AN18-61-R10V | |
| 1920x1080 Max Settings + High Ray Tracing (no upscaling) | |
| Tuxedo Stellaris 16 | |
| Average NVIDIA GeForce RTX 5070 Ti Laptop (60.1 - 65.4, n=2) | |
| Gigabyte Gaming A18 Pro | |
| Average of class Gaming (47.7 - 65.4, n=4, last 2 years) | |
| Acer Nitro 18 AI AN18-61-R10V | |
| Crimson Desert | |
| 2560x1440 Cinematic Preset | |
| Tuxedo Stellaris 16 | |
| Average NVIDIA GeForce RTX 5070 Ti Laptop (52.1 - 60.3, n=2) | |
| Average of class Gaming (52.1 - 60.3, n=2, last 2 years) | |
| Gigabyte Gaming A18 Pro | |
| 1920x1080 Cinematic Preset | |
| Tuxedo Stellaris 16 | |
| Average NVIDIA GeForce RTX 5070 Ti Laptop (66.1 - 78, n=2) | |
| Average of class Gaming (60.1 - 78, n=3, last 2 years) | |
| Gigabyte Gaming A18 Pro | |
| Death Stranding 2 | |
| 2560x1440 Very High Preset | |
| Tuxedo Stellaris 16 | |
| Average NVIDIA GeForce RTX 5070 Ti Laptop (43.8 - 56.6, n=2) | |
| Gigabyte Gaming A18 Pro | |
| Average of class Gaming (5.49 - 56.6, n=3, last 2 years) | |
| 1920x1080 Very High Preset | |
| Tuxedo Stellaris 16 | |
| Average NVIDIA GeForce RTX 5070 Ti Laptop (49.9 - 74.3, n=2) | |
| Gigabyte Gaming A18 Pro | |
| Average of class Gaming (7.22 - 74.3, n=4, last 2 years) | |
| ARC Raiders | |
| 2560x1440 Epic Preset + Epic Raytracing AA:TSR | |
| Tuxedo Stellaris 16 | |
| Gigabyte Gaming A18 Pro | |
| Average NVIDIA GeForce RTX 5070 Ti Laptop (58 - 68.3, n=3) | |
| Acer Nitro 18 AI AN18-61-R10V | |
| Average of class Gaming (47.8 - 68.3, n=5, last 2 years) | |
| 1920x1080 Epic Preset + Epic Raytracing AA:TSR | |
| Tuxedo Stellaris 16 | |
| Gigabyte Gaming A18 Pro | |
| Average NVIDIA GeForce RTX 5070 Ti Laptop (79.8 - 98.6, n=3) | |
| Acer Nitro 18 AI AN18-61-R10V | |
| Average of class Gaming (43.5 - 98.6, n=11, last 2 years) | |
| The Outer Worlds 2 | |
| 2560x1440 Very High Preset AA:T | |
| Tuxedo Stellaris 16 | |
| Gigabyte Gaming A18 Pro | |
| Average NVIDIA GeForce RTX 5070 Ti Laptop (33.4 - 37.8, n=3) | |
| Average of class Gaming (21.5 - 37.8, n=6, last 2 years) | |
| Acer Nitro 18 AI AN18-61-R10V | |
| 1920x1080 Very High Preset AA:T | |
| Tuxedo Stellaris 16 | |
| Average NVIDIA GeForce RTX 5070 Ti Laptop (49.9 - 58.4, n=3) | |
| Gigabyte Gaming A18 Pro | |
| Acer Nitro 18 AI AN18-61-R10V | |
| Average of class Gaming (26.4 - 58.4, n=11, last 2 years) | |
| Borderlands 4 | |
| 2560x1440 Badass Preset AA:FX | |
| Tuxedo Stellaris 16 | |
| Average NVIDIA GeForce RTX 5070 Ti Laptop (22.4 - 31.4, n=3) | |
| Gigabyte Gaming A18 Pro | |
| Average of class Gaming (7.97 - 37.1, n=6, last 2 years) | |
| Acer Nitro 18 AI AN18-61-R10V | |
| 1920x1080 Badass Preset AA:FX | |
| Tuxedo Stellaris 16 | |
| Average NVIDIA GeForce RTX 5070 Ti Laptop (31.1 - 44.5, n=3) | |
| Gigabyte Gaming A18 Pro | |
| Acer Nitro 18 AI AN18-61-R10V | |
| Average of class Gaming (16 - 54, n=13, last 2 years) | |
| Monster Hunter Wilds | |
| 2560x1440 ultra, RT: high, no upscaling | |
| Lenovo Legion 9 18IAX10 | |
| Average of class Gaming (13.9 - 80.5, n=24, last 2 years) | |
| MSI Vector A18 HX A9W | |
| Average NVIDIA GeForce RTX 5070 Ti Laptop (48.8 - 55, n=3) | |
| Gigabyte Gaming A18 Pro | |
| 1920x1080 ultra, RT: high, no upscaling | |
| Lenovo Legion 9 18IAX10 | |
| MSI Vector A18 HX A9W | |
| Average of class Gaming (16.6 - 95.3, n=27, last 2 years) | |
| Average NVIDIA GeForce RTX 5070 Ti Laptop (56 - 70.8, n=3) | |
| Gigabyte Gaming A18 Pro | |
Performance sustainability of the GPU was tested with Cyberpunk 2077. There were no anomalies and the frame rate was fairly stable over the entire period.
Cyberpunk 2077 ultra FPS diagram
Emissions
System noise
As mentioned earlier, the 18-inch laptop becomes quite loud in higher performance modes. At 57 dB(A) during a Cyberpunk 2077 session, it reaches a value higher than any of its direct rivals, resulting in a disturbingly high noise level that effectively necessitates the use of headphones. A slightly thicker chassis with a more capable cooling system would likely have brought improvements.
At idle, the two fans are significantly quieter, aside from occasional bursts of speed. Noise levels of 28 to 34 dB(A) are still higher than those of competing models.
Noise level
| Idle |
| 28 / 31 / 34 dB(A) |
| Load |
| 49 / 58 dB(A) |
 | ||
30 dB silent 40 dB(A) audible 50 dB(A) loud |
||
min: | ||
| Gigabyte Gaming A18 Pro Core 7 240H, GeForce RTX 5070 Ti Laptop | Lenovo Legion 9 18IAX10 Ultra 9 275HX, GeForce RTX 5080 Laptop | MSI Vector A18 HX A9W R9 9955HX, GeForce RTX 5070 Ti Laptop | Asus TUF Gaming A18 FA808UP-S8022W R7 260, GeForce RTX 5070 Laptop | Acer Nitro 18 AI AN18-61-R10V Ryzen AI 7 350, GeForce RTX 5070 Laptop | |
|---|---|---|---|---|---|
| Noise | 14% | 8% | 24% | 4% | |
| off / environment * (dB) | 26 | 23.3 10% | 22.5 13% | 23 12% | 24 8% |
| Idle Minimum * (dB) | 28 | 23.3 17% | 26 7% | 23 18% | 28 -0% |
| Idle Average * (dB) | 31 | 23.3 25% | 26 16% | 23 26% | 29 6% |
| Idle Maximum * (dB) | 34 | 29.1 14% | 32 6% | 23 32% | 31 9% |
| Load Average * (dB) | 49 | 46.8 4% | 44.4 9% | 32.58 34% | 49 -0% |
| Cyberpunk 2077 ultra * (dB) | 57 | 49.6 13% | 49.8 13% | 45.13 21% | 54 5% |
| Load Maximum * (dB) | 58 | 49.6 14% | 61.6 -6% | 56 3% |
* ... smaller is better
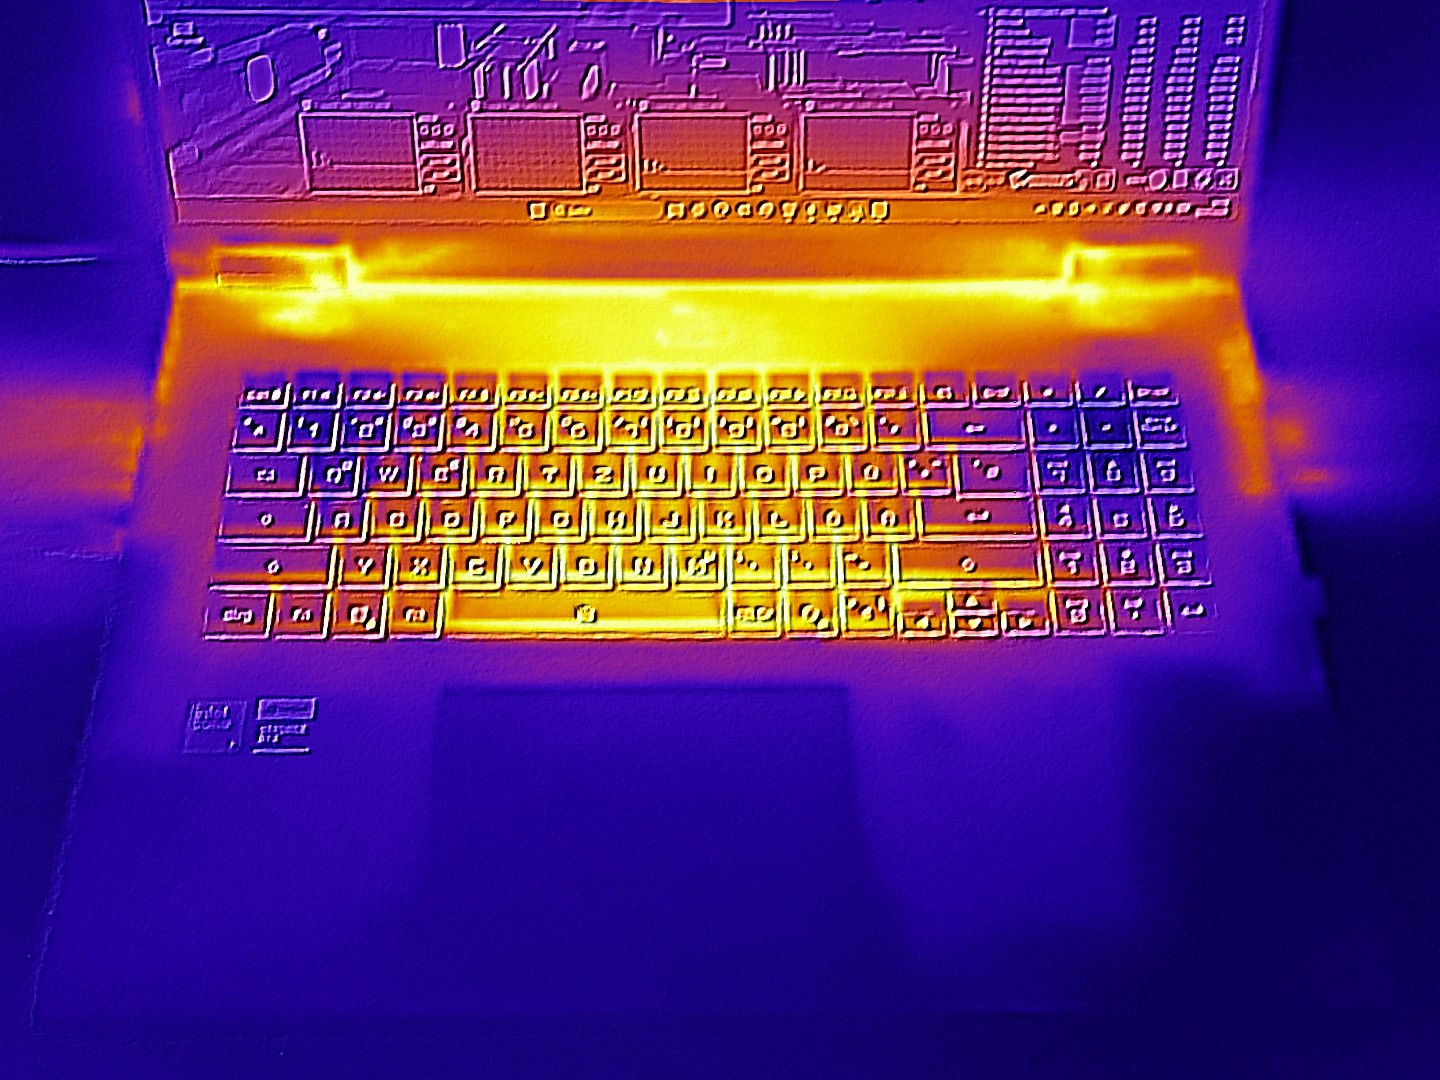
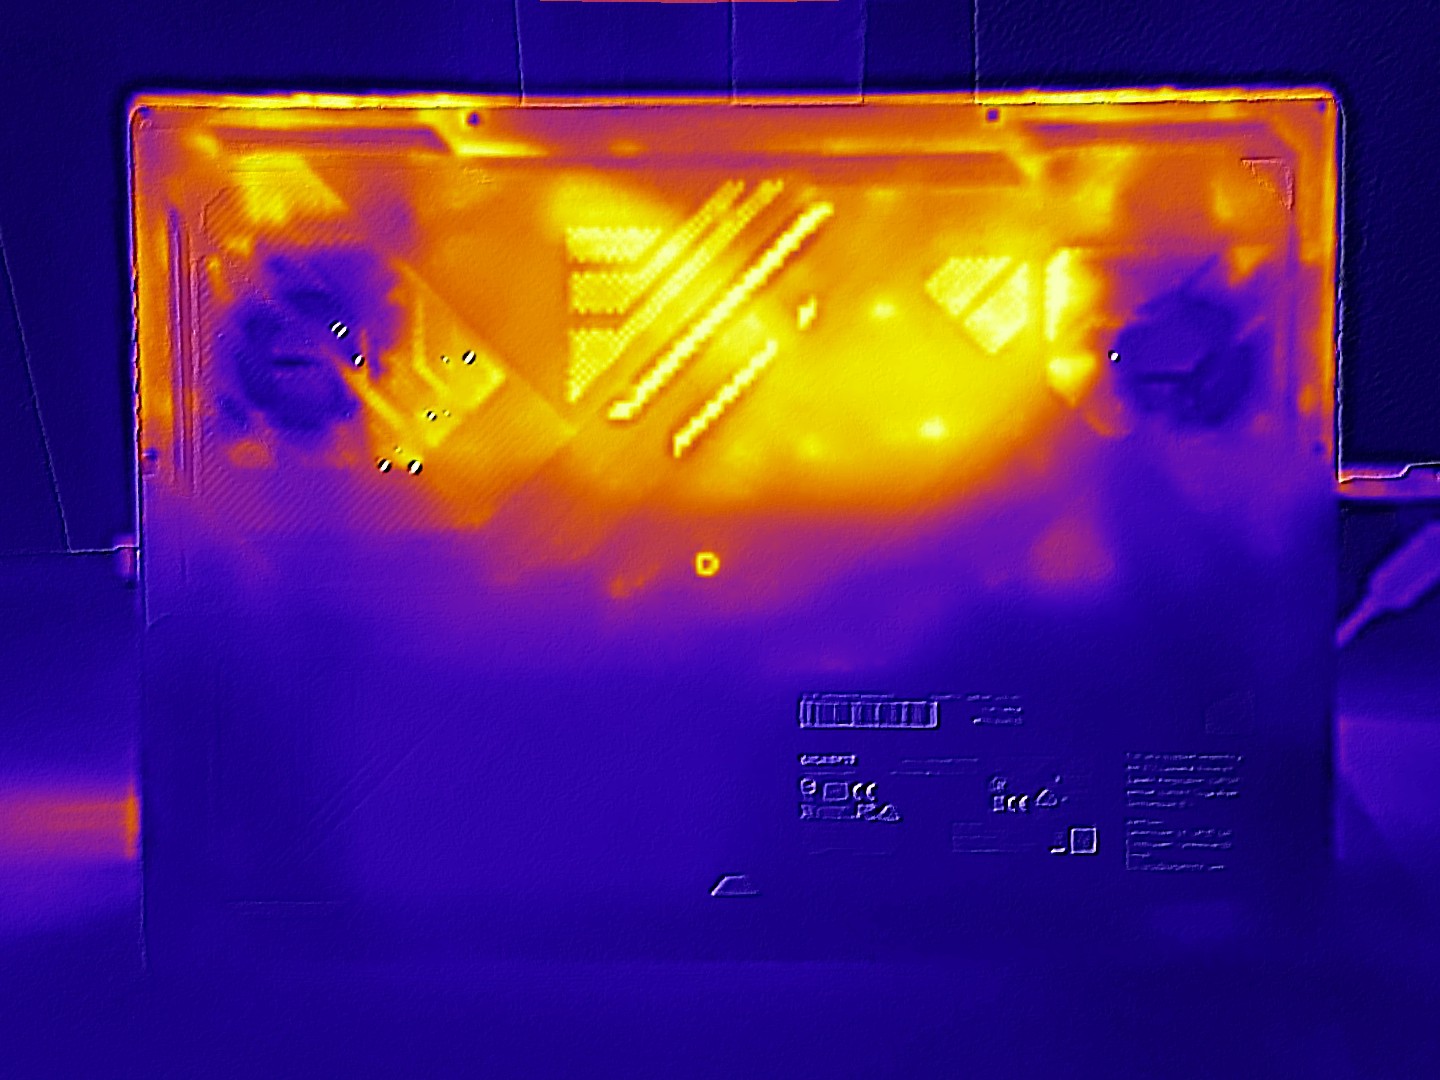
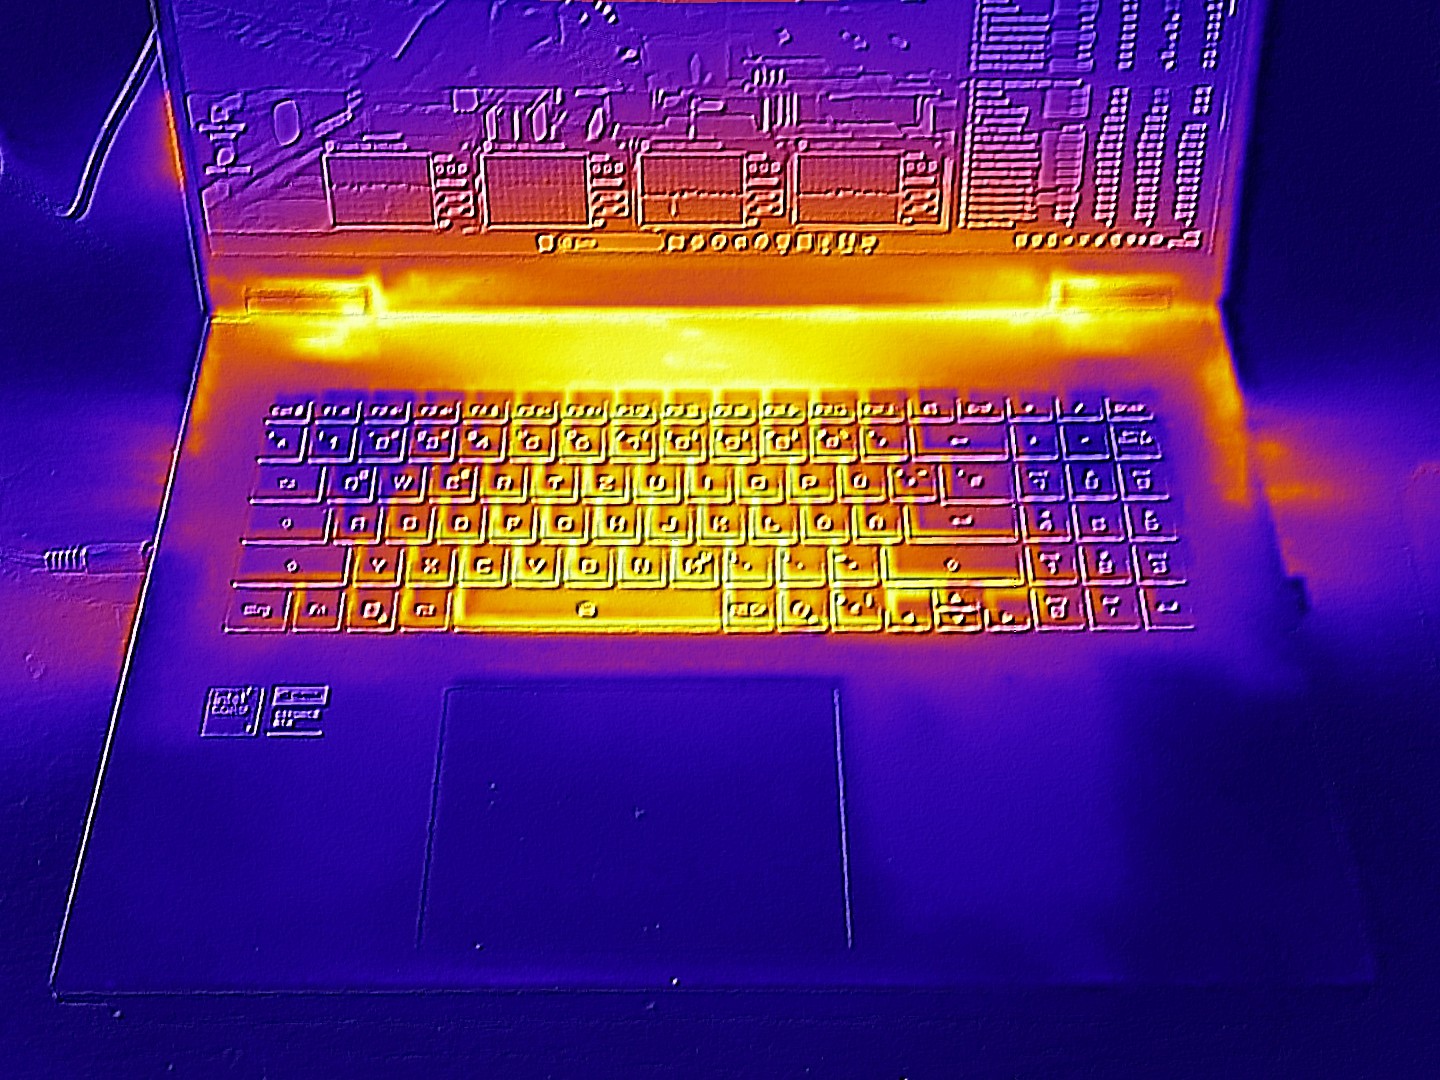
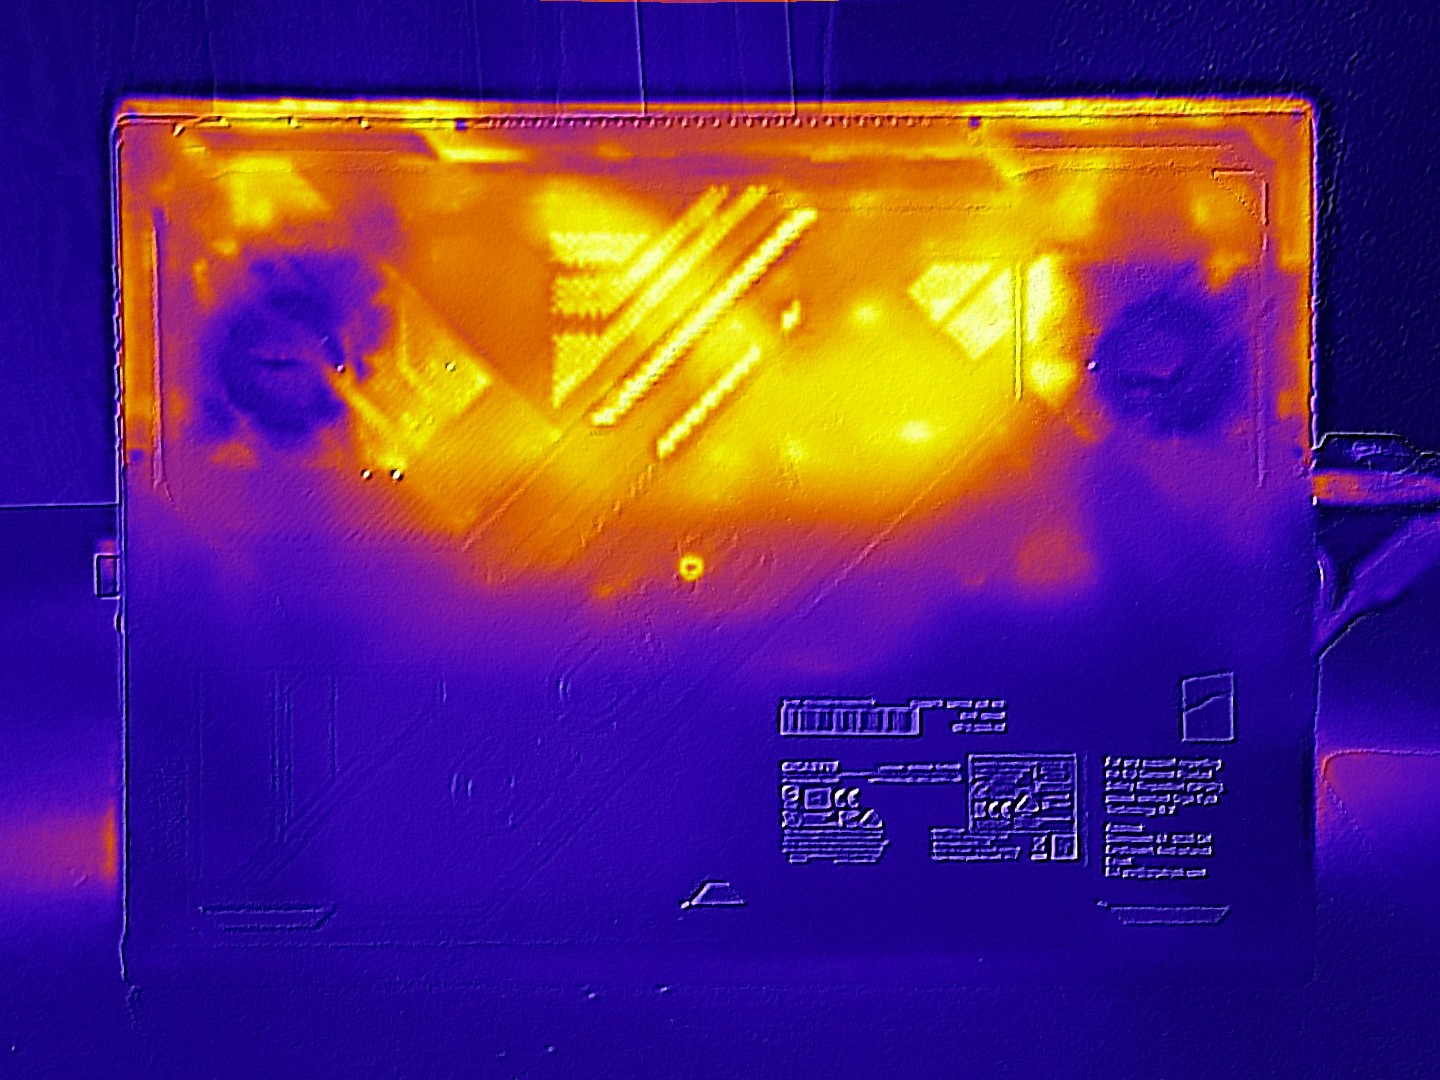
Temperature
The thermals are within the expected range. A maximum of about 118°F on the top and ~120°F on the bottom of the chassis are typical for machines of this performance class. At idle, most of the chassis remains below 86°F, so it still feels very comfortable to the touch.
(-) The maximum temperature on the upper side is 48 °C / 118 F, compared to the average of 40.4 °C / 105 F, ranging from 21.2 to 68.8 °C for the class Gaming.
(-) The bottom heats up to a maximum of 49 °C / 120 F, compared to the average of 43.2 °C / 110 F
(+) In idle usage, the average temperature for the upper side is 27.6 °C / 82 F, compared to the device average of 33.9 °C / 93 F.
(±) 3: The average temperature for the upper side is 38 °C / 100 F, compared to the average of 33.9 °C / 93 F for the class Gaming.
(+) The palmrests and touchpad are cooler than skin temperature with a maximum of 27 °C / 80.6 F and are therefore cool to the touch.
(±) The average temperature of the palmrest area of similar devices was 28.8 °C / 83.8 F (+1.8 °C / 3.2 F).
| Gigabyte Gaming A18 Pro Core 7 240H, GeForce RTX 5070 Ti Laptop | Lenovo Legion 9 18IAX10 Ultra 9 275HX, GeForce RTX 5080 Laptop | Medion Erazer Beast 18 X1 MD62731 Ultra 9 275HX, GeForce RTX 5080 Laptop | MSI Vector A18 HX A9W R9 9955HX, GeForce RTX 5070 Ti Laptop | Asus TUF Gaming A18 FA808UP-S8022W R7 260, GeForce RTX 5070 Laptop | Acer Nitro 18 AI AN18-61-R10V Ryzen AI 7 350, GeForce RTX 5070 Laptop | |
|---|---|---|---|---|---|---|
| Heat | -3% | -1% | 3% | 12% | 4% | |
| Maximum Upper Side * (°C) | 48 | 43 10% | 47 2% | 46.6 3% | 39 19% | 44 8% |
| Maximum Bottom * (°C) | 49 | 41.8 15% | 48 2% | 45.6 7% | 41 16% | 57 -16% |
| Idle Upper Side * (°C) | 30 | 37 -23% | 29 3% | 31.2 -4% | 27 10% | 25 17% |
| Idle Bottom * (°C) | 30 | 34.2 -14% | 33 -10% | 28.6 5% | 29 3% | 28 7% |
* ... smaller is better
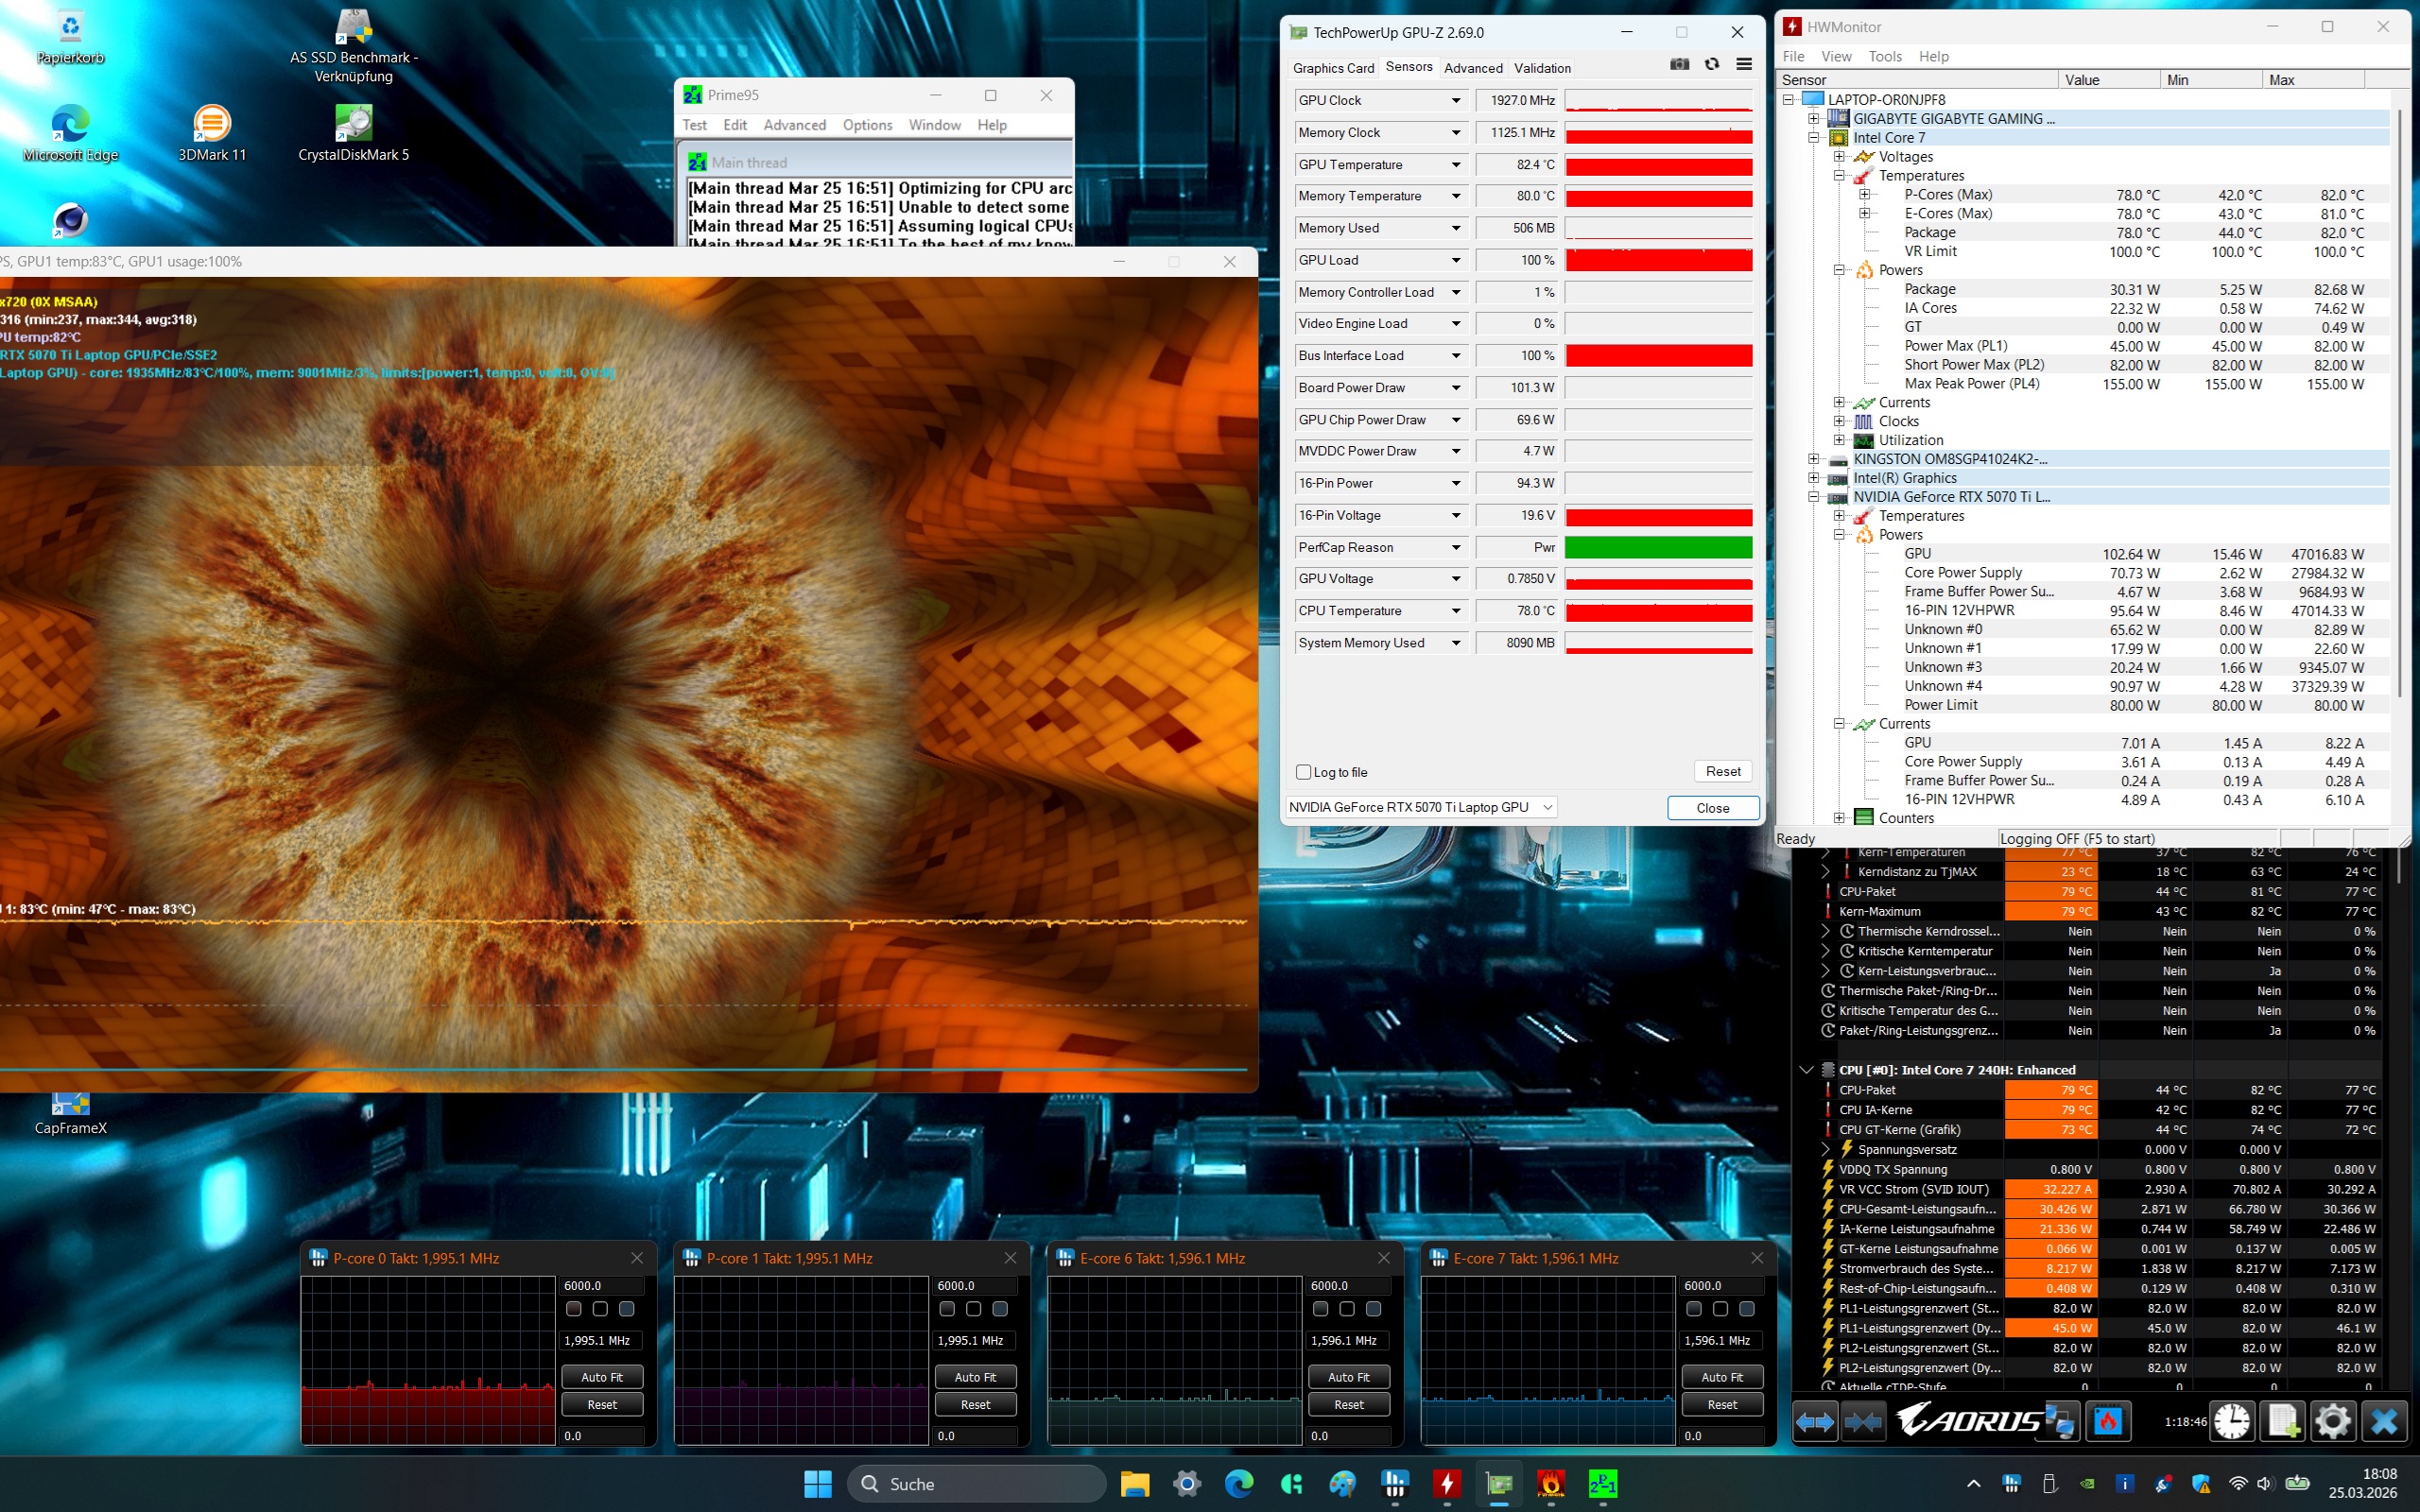
Stress test
The stress test using FurMark and Prime95 resulted in the CPU and GPU reaching around 176°F, which is neither particularly low nor especially high.
Speakers
The sound quality of the built-in 2.0 system is solid and on par with the MSI Vector A18. Its weaknesses—typical of most laptops—are primarily in the bass range. The maximum volume could also be higher.
Gigabyte Gaming A18 Pro audio analysis
(±) | speaker loudness is average but good (78 dB)
Bass 100 - 315 Hz
(±) | reduced bass - on average 7.9% lower than median
(±) | linearity of bass is average (9.2% delta to prev. frequency)
Mids 400 - 2000 Hz
(±) | higher mids - on average 5.8% higher than median
(+) | mids are linear (5.8% delta to prev. frequency)
Highs 2 - 16 kHz
(+) | balanced highs - only 2.6% away from median
(±) | linearity of highs is average (9.2% delta to prev. frequency)
Overall 100 - 16.000 Hz
(+) | overall sound is linear (13.5% difference to median)
Compared to same class
» 20% of all tested devices in this class were better, 7% similar, 73% worse
» The best had a delta of 6%, average was 18%, worst was 132%
Compared to all devices tested
» 14% of all tested devices were better, 4% similar, 82% worse
» The best had a delta of 4%, average was 24%, worst was 134%
MSI Vector A18 HX A9W audio analysis
(+) | speakers can play relatively loud (86.2 dB)
Bass 100 - 315 Hz
(-) | nearly no bass - on average 16% lower than median
(±) | linearity of bass is average (10.9% delta to prev. frequency)
Mids 400 - 2000 Hz
(±) | higher mids - on average 5.7% higher than median
(±) | linearity of mids is average (7.2% delta to prev. frequency)
Highs 2 - 16 kHz
(+) | balanced highs - only 3.3% away from median
(+) | highs are linear (6.8% delta to prev. frequency)
Overall 100 - 16.000 Hz
(+) | overall sound is linear (13.5% difference to median)
Compared to same class
» 20% of all tested devices in this class were better, 7% similar, 73% worse
» The best had a delta of 6%, average was 18%, worst was 132%
Compared to all devices tested
» 14% of all tested devices were better, 4% similar, 82% worse
» The best had a delta of 4%, average was 24%, worst was 134%
Power management
Power consumption
Thanks to the relatively energy-efficient processor, power consumption remains moderate. Idle consumption of 10 to 20 watts and high load consumption of 95 to 179 watts are respectable compared to the competition.
| Off / Standby | |
| Idle | |
| Load |
|
Key:
min: | |
| Gigabyte Gaming A18 Pro Core 7 240H, GeForce RTX 5070 Ti Laptop | Lenovo Legion 9 18IAX10 Ultra 9 275HX, GeForce RTX 5080 Laptop | MSI Vector A18 HX A9W R9 9955HX, GeForce RTX 5070 Ti Laptop | Asus TUF Gaming A18 FA808UP-S8022W R7 260, GeForce RTX 5070 Laptop | Acer Nitro 18 AI AN18-61-R10V Ryzen AI 7 350, GeForce RTX 5070 Laptop | Average of class Gaming | |
|---|---|---|---|---|---|---|
| Power Consumption | -149% | -123% | 13% | 12% | -33% | |
| Idle Minimum * (Watt) | 10 | 34.5 -245% | 20.8 -108% | 6.7 33% | 5.9 41% | 13.2 ? -32% |
| Idle Average * (Watt) | 12.5 | 44.1 -253% | 52.8 -322% | 11.6 7% | 9.6 23% | 18.9 ? -51% |
| Idle Maximum * (Watt) | 19.7 | 53.3 -171% | 54.5 -177% | 17.7 10% | 17 14% | 24.5 ? -24% |
| Load Average * (Watt) | 95 | 140.9 -48% | 146.6 -54% | 85 11% | 89 6% | 108.8 ? -15% |
| Cyberpunk 2077 ultra * (Watt) | 170.2 | 360 -112% | 285 -67% | 144 15% | 160.4 6% | |
| Cyberpunk 2077 ultra external monitor * (Watt) | 169.6 | 353 -108% | 278 -64% | 139 18% | 154.6 9% | |
| Load Maximum * (Watt) | 179 | 367.5 -105% | 297.3 -66% | 187 -4% | 210 -17% | 254 ? -42% |
* ... smaller is better
Power consumption Cyberpunk / stress test
Power consumption with external monitor
Runtimes
While its competitors all feature battery capacities over 90 Wh, the Gaming A18 Pro has to make do with 76 Wh. Nevertheless, the measured battery life is quite respectable. At nearly 8 hours in our Wi-Fi Web browsing test, it lands in the middle of the ranking.
| Gigabyte Gaming A18 Pro Core 7 240H, GeForce RTX 5070 Ti Laptop, 76 Wh | Lenovo Legion 9 18IAX10 Ultra 9 275HX, GeForce RTX 5080 Laptop, 99.9 Wh | MSI Vector A18 HX A9W R9 9955HX, GeForce RTX 5070 Ti Laptop, 99 Wh | Asus TUF Gaming A18 FA808UP-S8022W R7 260, GeForce RTX 5070 Laptop, 90 Wh | Acer Nitro 18 AI AN18-61-R10V Ryzen AI 7 350, GeForce RTX 5070 Laptop, 90 Wh | Average of class Gaming | |
|---|---|---|---|---|---|---|
| Battery runtime | -30% | -52% | 49% | 39% | -13% | |
| WiFi v1.3 (h) | 8 | 5.6 -30% | 3.8 -52% | 11.9 49% | 11.1 39% | 6.96 ? -13% |
| Reader / Idle (h) | 7 | 8.71 ? |
Notebookcheck rating
Minor and more significant shortcomings, such as the considerable noise levels, prevent the Gigabyte Gaming A18 Pro from competing at the very top of the 18-inch notebook market. MSI’s Vector A18 HX, which also features an RTX 5070 Ti, ultimately performs slightly better but currently comes at a higher price.
Gigabyte Gaming A18 Pro
- 03/31/2026 v8
Florian Glaser
 Total Sustainability Score:
 Comparable alternatives
Image | Model / Review | Price | Weight | Height | Display |
|---|---|---|---|---|---|
1. 78.7%  | Gigabyte Gaming A18 Pro Intel Core 7 240H ⎘ NVIDIA GeForce RTX 5070 Ti Laptop ⎘ 32 GB Memory, 1024 GB SSD | Amazon: 1. $1,573.99 GIGABYTE Gaming A18 Gaming L... 2. $1,999.99 GIGABYTE Gaming A18 Gaming L... 3. $1,909.00 GIGABYTE Gaming A18 Gaming L... List Price: 2399 EUR | 2.9 kg | 25 mm | 18.00" 2560x1600 168 PPI IPS |
2. 89.1%  | Lenovo Legion 9 18IAX10 Intel Core Ultra 9 275HX ⎘ NVIDIA GeForce RTX 5080 Laptop ⎘ 64 GB Memory, 2048 GB SSD | Amazon: List Price: 3800 USD | 3.5 kg | 27.95 mm | 18.00" 3840x2400 252 PPI IPS |
3. 84.8%  | MSI Vector A18 HX A9W AMD Ryzen 9 9955HX ⎘ NVIDIA GeForce RTX 5070 Ti Laptop ⎘ 32 GB Memory | Amazon: List Price: 3200 USD | 3.5 kg | 32.05 mm | 18.00" 2560x1600 189 PPI IPS |
4. 83.8%  | Asus TUF Gaming A18 FA808UP-S8022W AMD Ryzen 7 260 ⎘ NVIDIA GeForce RTX 5070 Laptop ⎘ 32 GB Memory, 1024 GB SSD | Amazon: List Price: 2199 Euro | 2.6 kg | 26.7 mm | 18.00" 1920x1200 126 PPI IPS |
5. 81.2%  | Acer Nitro 18 AI AN18-61-R10V AMD Ryzen AI 7 350 ⎘ NVIDIA GeForce RTX 5070 Laptop ⎘ 16 GB Memory, 1000 GB SSD | Amazon: List Price: 1900 EUR | 3 kg | 25 mm | 18.00" 2560x1600 168 PPI IPS |
Transparency
The selection of devices to be reviewed is made by our editorial team. The test sample was provided to the author as a loan by the manufacturer or retailer for the purpose of this review. The lender had no influence on this review, nor did the manufacturer receive a copy of this review before publication. There was no obligation to publish this review. As an independent media company, Notebookcheck is not subjected to the authority of manufacturers, retailers or publishers.
This is how Notebookcheck is testing
Every year, Notebookcheck independently reviews hundreds of laptops and smartphones using standardized procedures to ensure that all results are comparable. We have continuously developed our test methods for around 20 years and set industry standards in the process. In our test labs, high-quality measuring equipment is utilized by experienced technicians and editors. These tests involve a multi-stage validation process. Our complex rating system is based on hundreds of well-founded measurements and benchmarks, which maintains objectivity. Further information on our test methods can be found here.

