

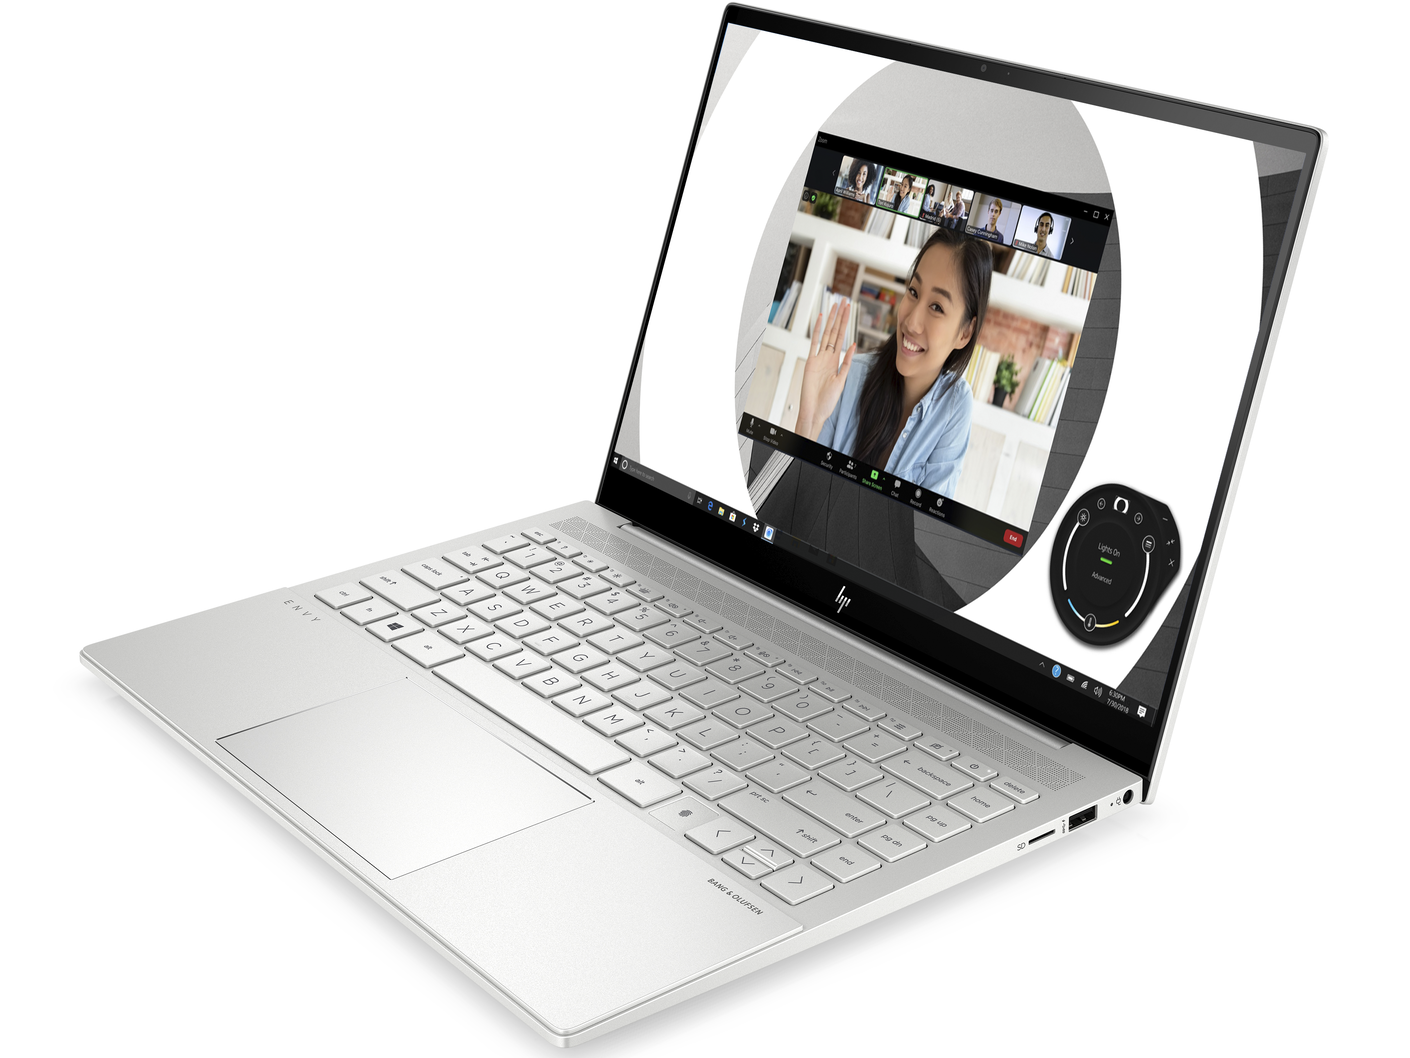
2021 HP Envy 14 Laptop Review: Tiger Lake, 16:10 and GeForce GTX 1650 Ti Max-Q All-In-One
The new Envy 14 is the 14-inch version of the 15.6-inch Envy 15 released early last year. We loved the 15.6-inch model because it integrated gaming-class hardware and features including Core H-series CPUs, GeForce RTX 2060 graphics, and even vapor chamber cooling all in a professional MacBook Pro-like chassis. Understandably, the Envy 14 drops the vapor chamber and comes with slower Core U-series CPUs and a GeForce GTX 1650 Ti GPU instead, but it is still no slouch especially when considering its small screen size.
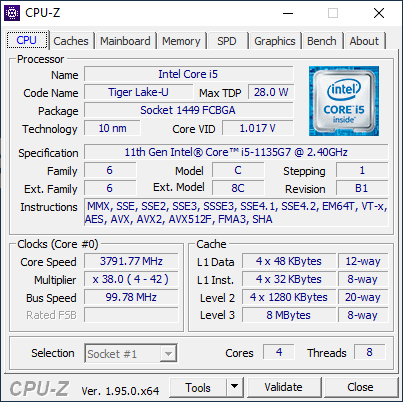
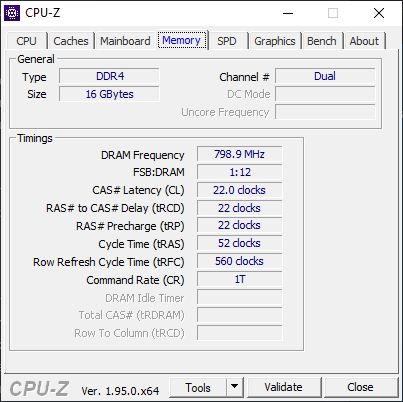
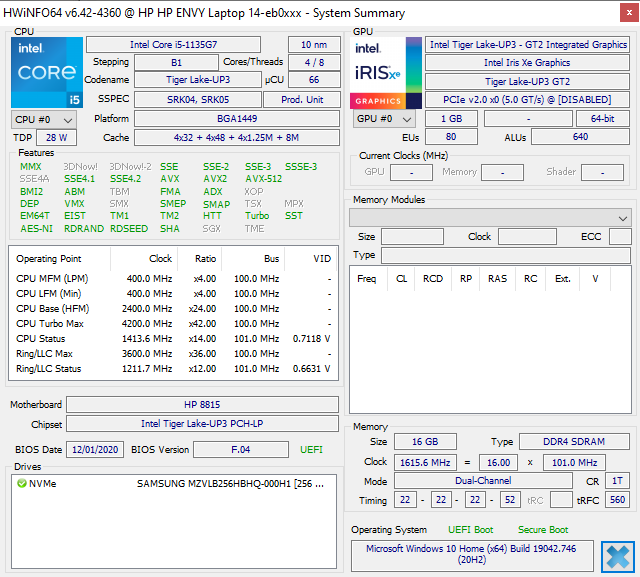
Current SKUs range include either the 11th gen Core i5-1135G7 or Core i7-1165G7 with integrated Iris Xe graphics and optional GTX 1650 Ti Max-Q, 8 GB to 16 GB of soldered RAM, and 256 GB to 2 TB of M.2 NVMe SSD storage. All configurations come with the same 16:10 1920 x 1200 IPS touchscreen. Our specific unit can be found online for about $1250 USD.
Competitors to the Envy 14 include other flagship 14-inch laptops like the MSI Prestige 14, Asus ZenBook Duo 14, or the Huawei MateBook 14. Many, however, lack the same GTX 1650 Ti Max-Q option that makes the Envy 14 so special for its form factor. The 13.3-inch Razer Blade Stealth and 15.6-inch MSI E15 Summit are some more examples with the same GeForce GTX 1650 Ti Max-Q.
We recommend checking out our review on the 2020 Envy 15 since the Envy 14 shares similar physical features.
More HP reviews:
potential competitors in comparison
Rating | Date | Model | Weight | Height | Size | Resolution | Price |
|---|---|---|---|---|---|---|---|
| 86.5 % v7 (old) | 02 / 2021 | HP Envy 14-eb0010nr i5-1135G7, GeForce GTX 1650 Ti Max-Q | 1.6 kg | 17.9 mm | 14.00" | 1920x1200 | |
| 84.2 % v7 (old) | 01 / 2021 | Lenovo IdeaPad Slim 9i 14ITL5 i7-1165G7, Iris Xe G7 96EUs | 1.3 kg | 14.6 mm | 14.00" | 3840x2160 | |
| 85.1 % v7 (old) | 01 / 2021 | Asus ZenBook Duo 14 UX482EA i7-1165G7, Iris Xe G7 96EUs | 1.6 kg | 16.9 mm | 14.00" | 1920x1080 | |
| 89.4 % v7 (old) | 12 / 2020 | HP Spectre x360 14t-ea000 i7-1165G7, Iris Xe G7 96EUs | 1.3 kg | 17.2 mm | 13.50" | 1920x1280 | |
| 74.5 % v7 (old) | 01 / 2020 | Dell Inspiron 14 3493-4KWCF i7-1065G7, GeForce MX230 | 1.8 kg | 21 mm | 14.00" | 1920x1080 | |
| 86.3 % v7 (old) | 12 / 2020 | Huawei MateBook 14 2020 Intel i7-10510U, GeForce MX350 | 1.5 kg | 15.9 mm | 14.00" | 2160x1440 |
Case
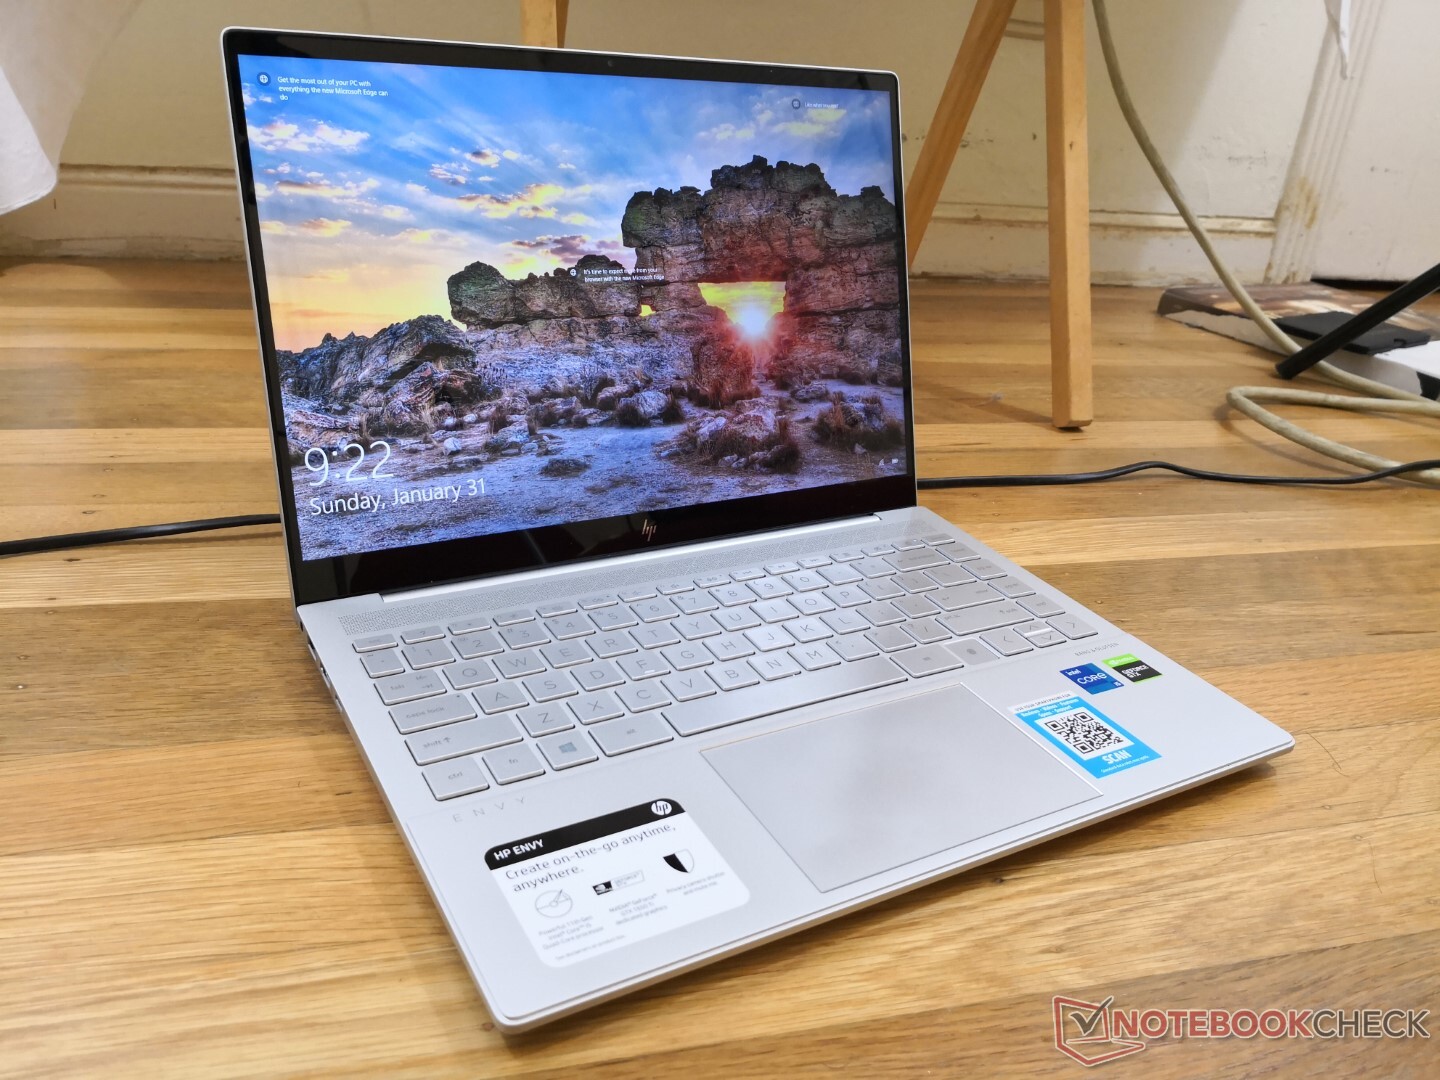
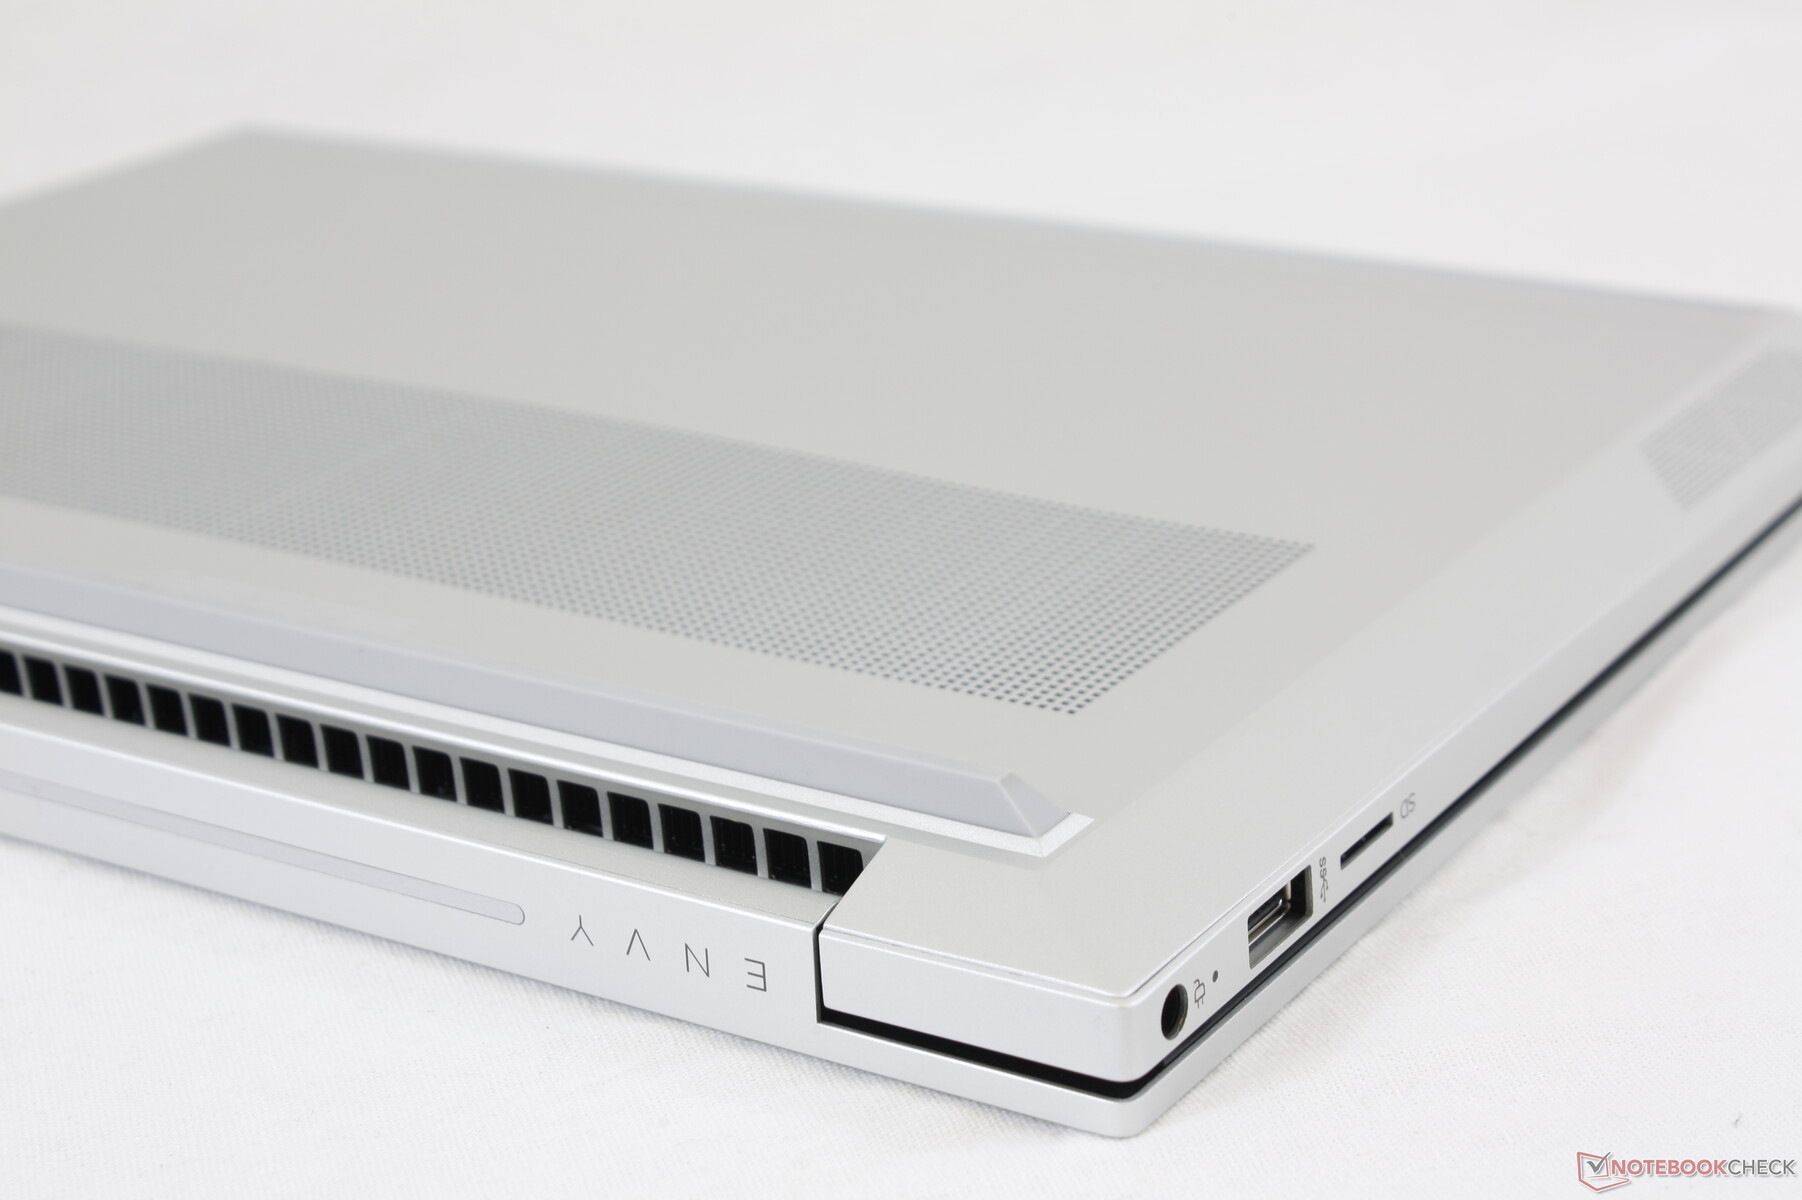
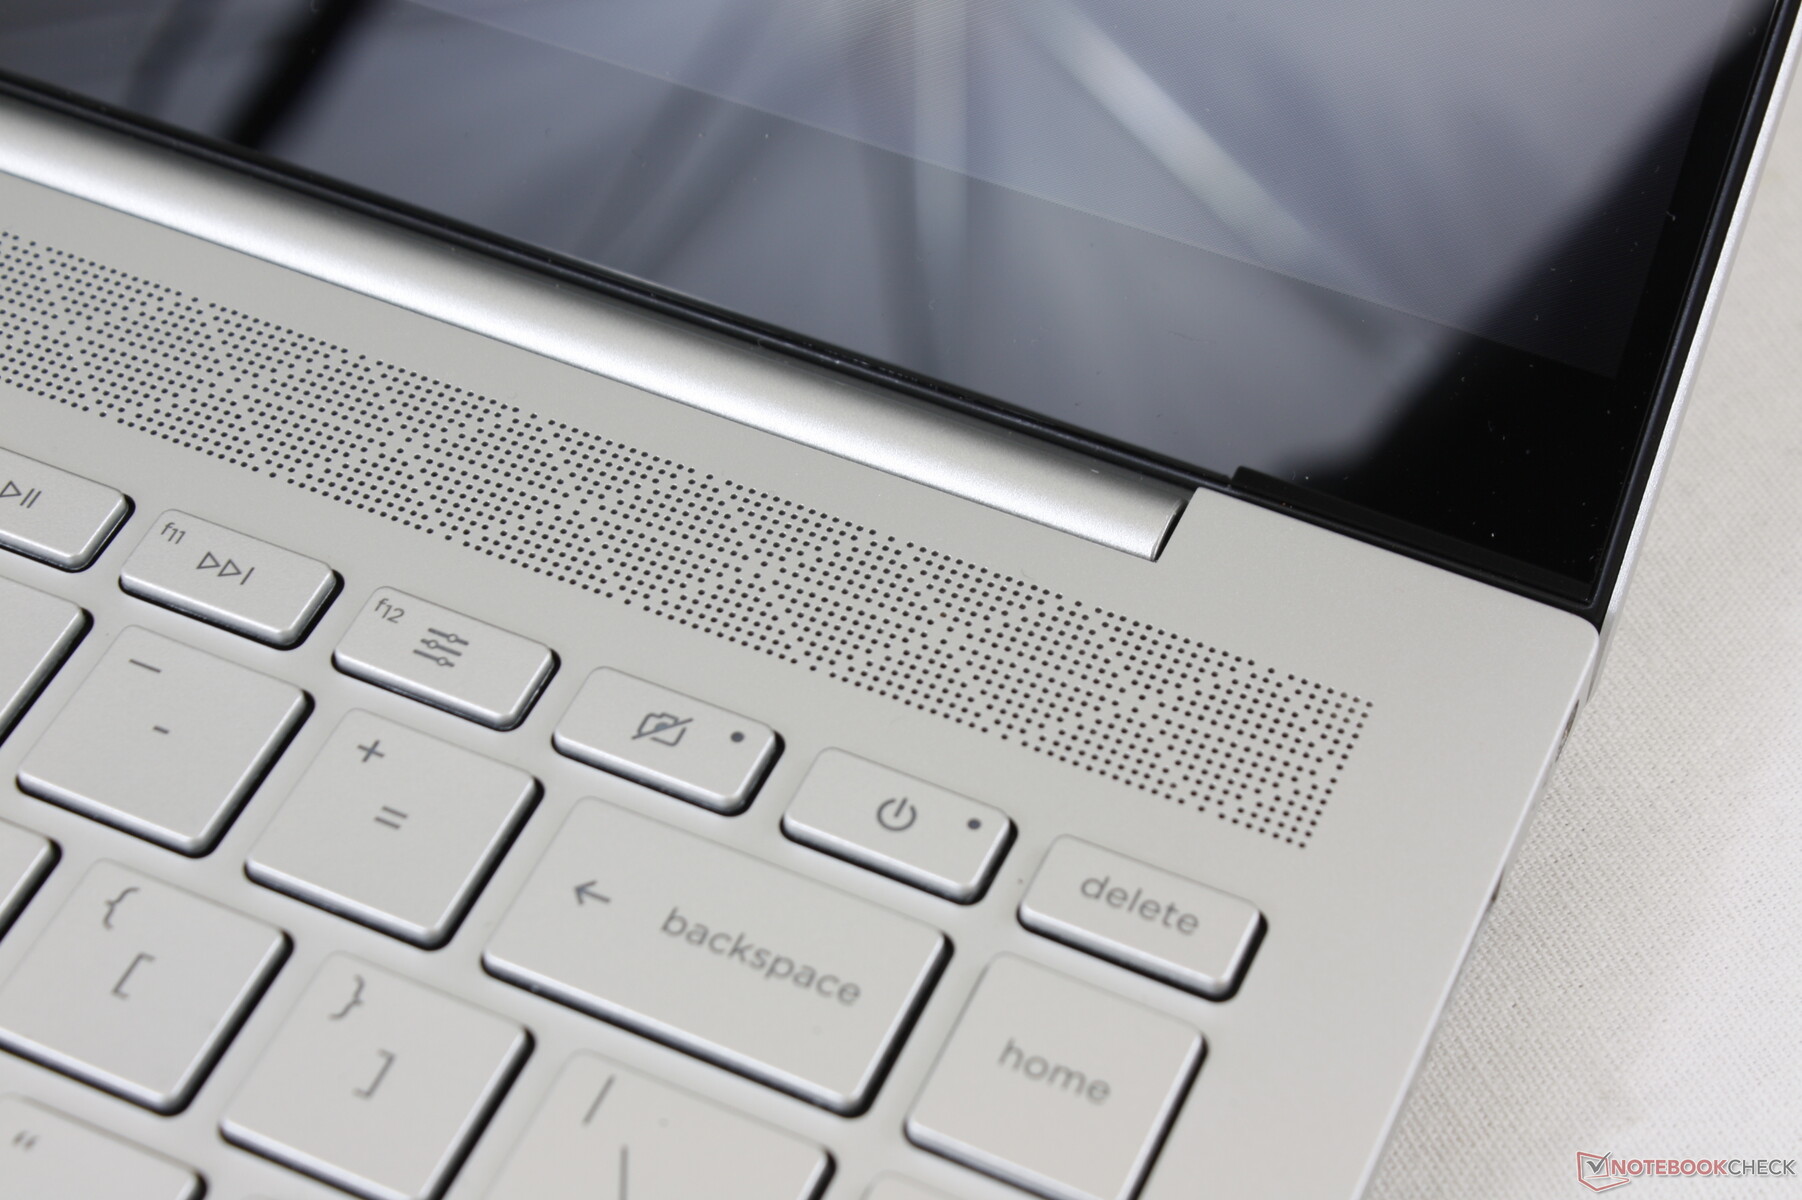
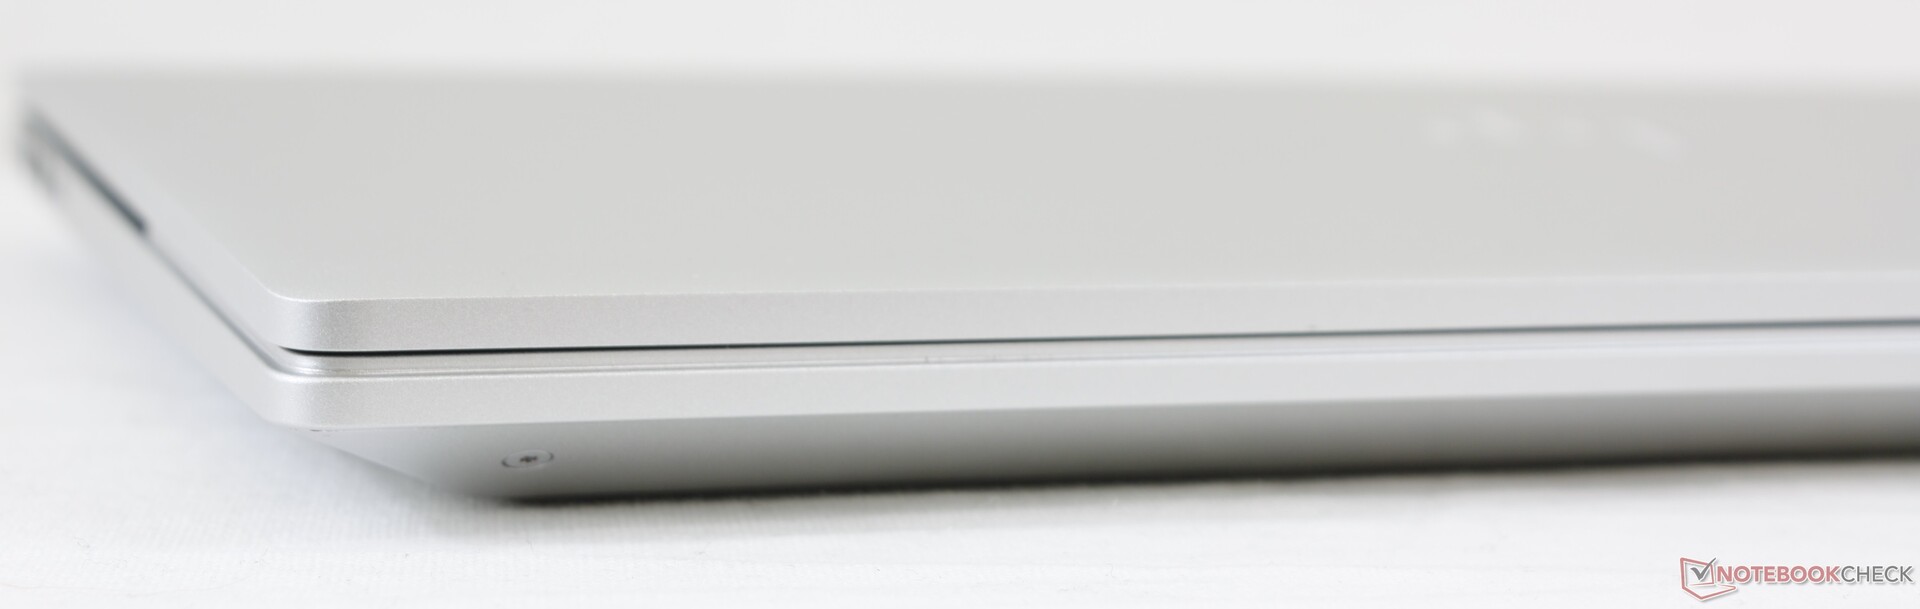
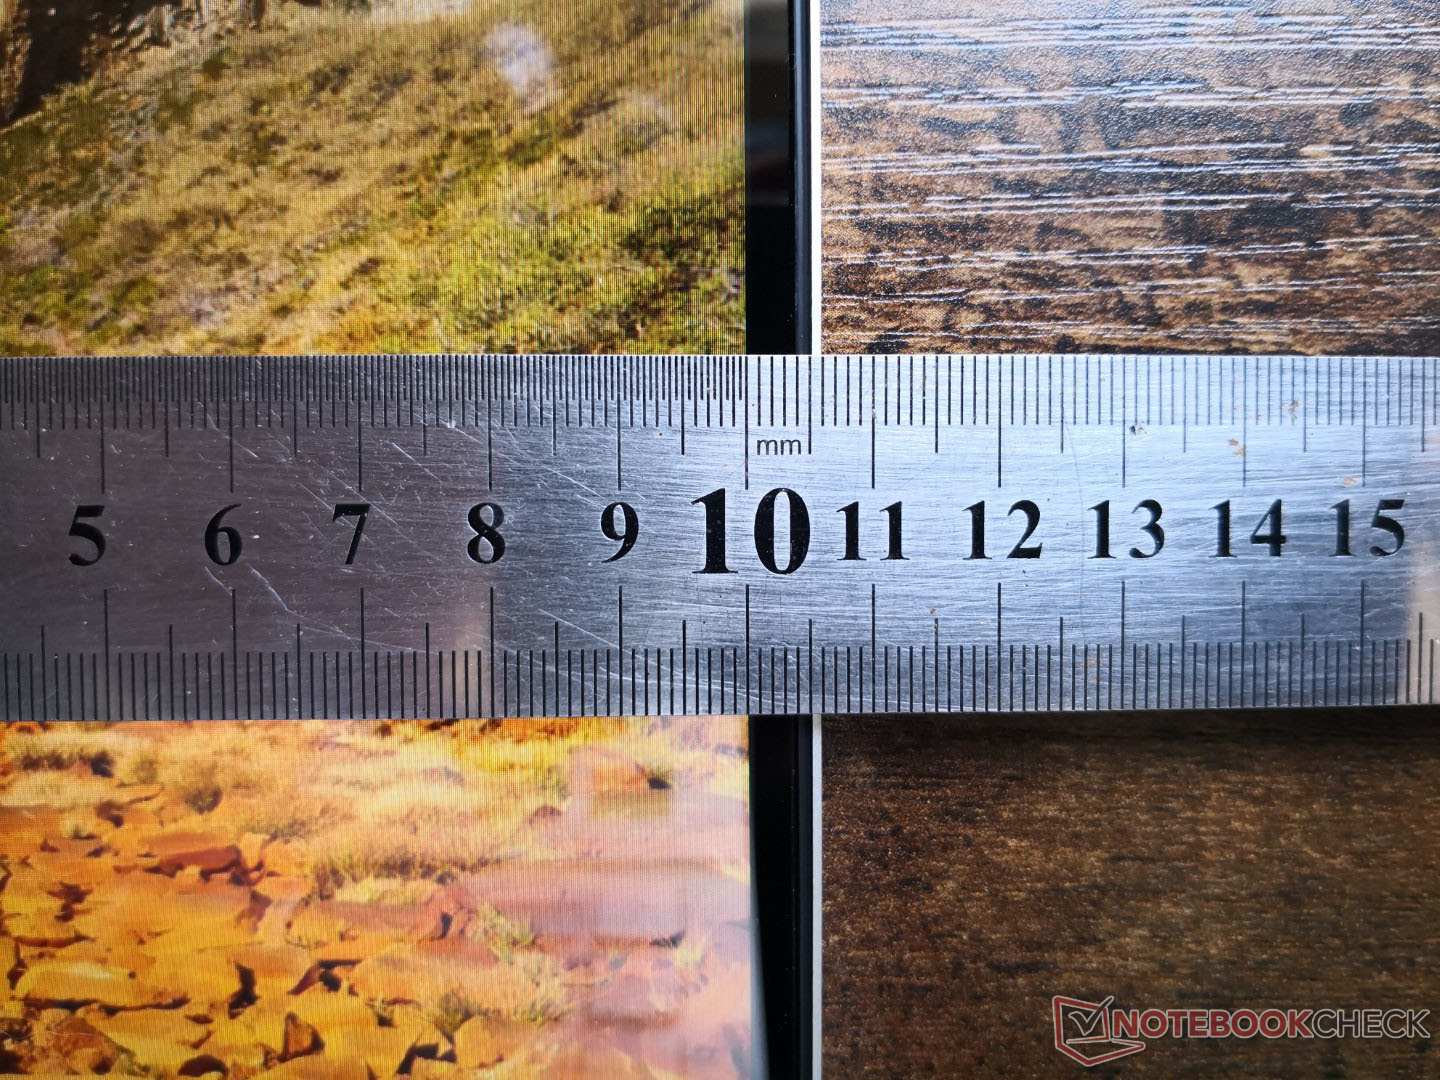
The Envy 14 chassis materials and design are derived from the late Envy 15 Creator for similar characteristics between them. The base feels rigid for stronger first impressions than the Lenovo IdeaPad Slim 9i or MSI Prestige 14. However, the lid and hinges could have been stiffer as they feel weaker than the hinges of the HP Spectre x360 14. Furthermore, there is very little resistance when the lid is opened to its maximum angle meaning it is easy to accidentally open the lid too wide and damage the hinges.
Build quality is not perfect on our test unit. The rear corners of the bottom plate protrude slightly instead of resting flat against the base leading to visible gaps along the edges. We suspect that this is because the bottom plate lacks additional screws near the corners which would have fixed the issue.
At 1.6 kg, the Envy 14 is slightly thicker and noticeably heavier than many of its 14-inch peers by at least 100 g. The system is slightly longer in length as well due in part to its squarer 16:10 aspect ratio instead of the usual 16:9. When considering the extra graphics horsepower the system provides, however, the girth may be worth it.
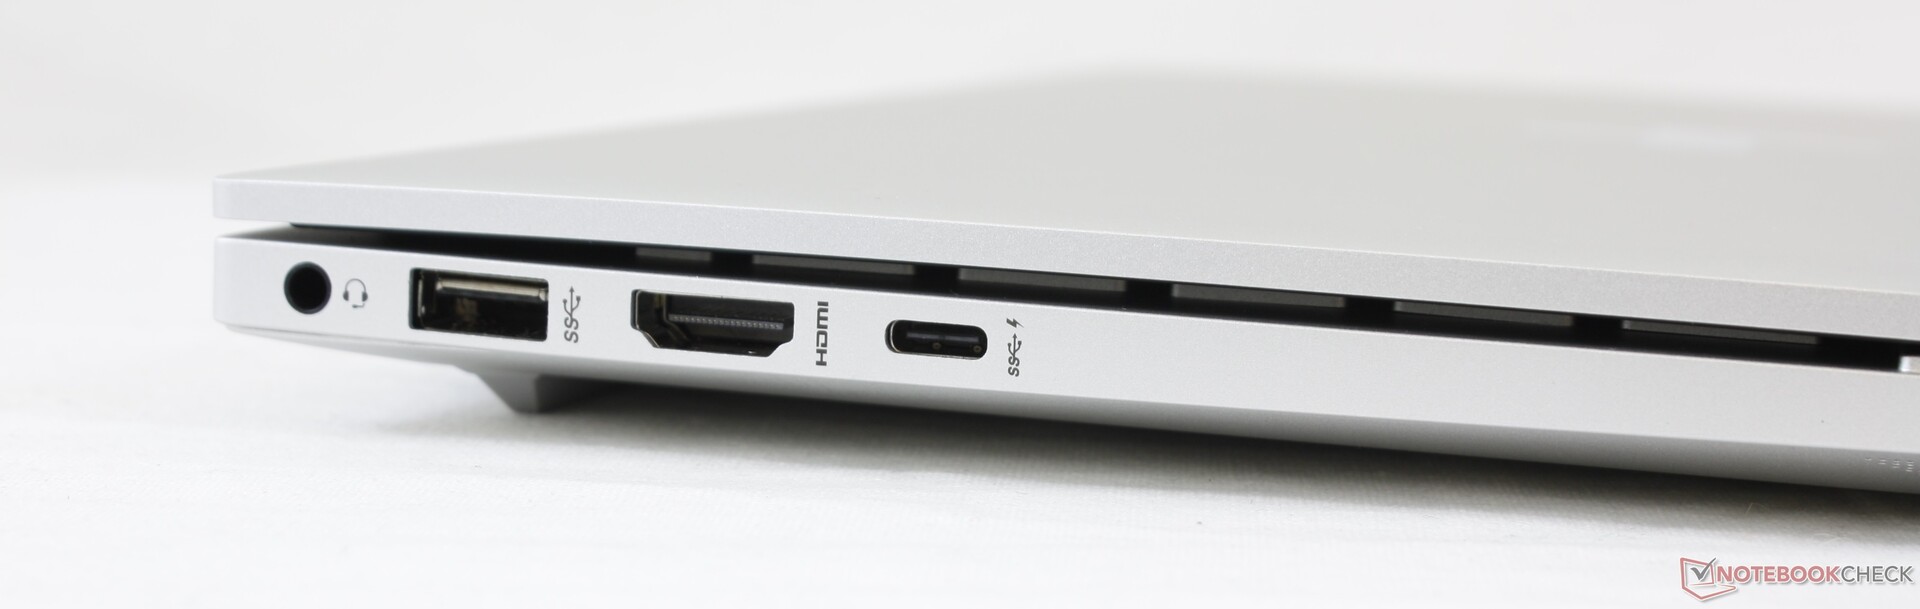
Connectivity
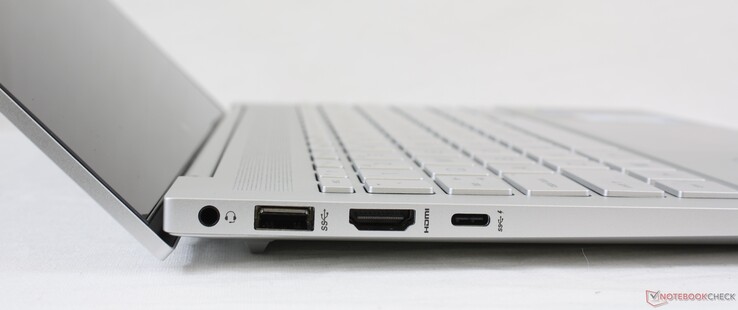
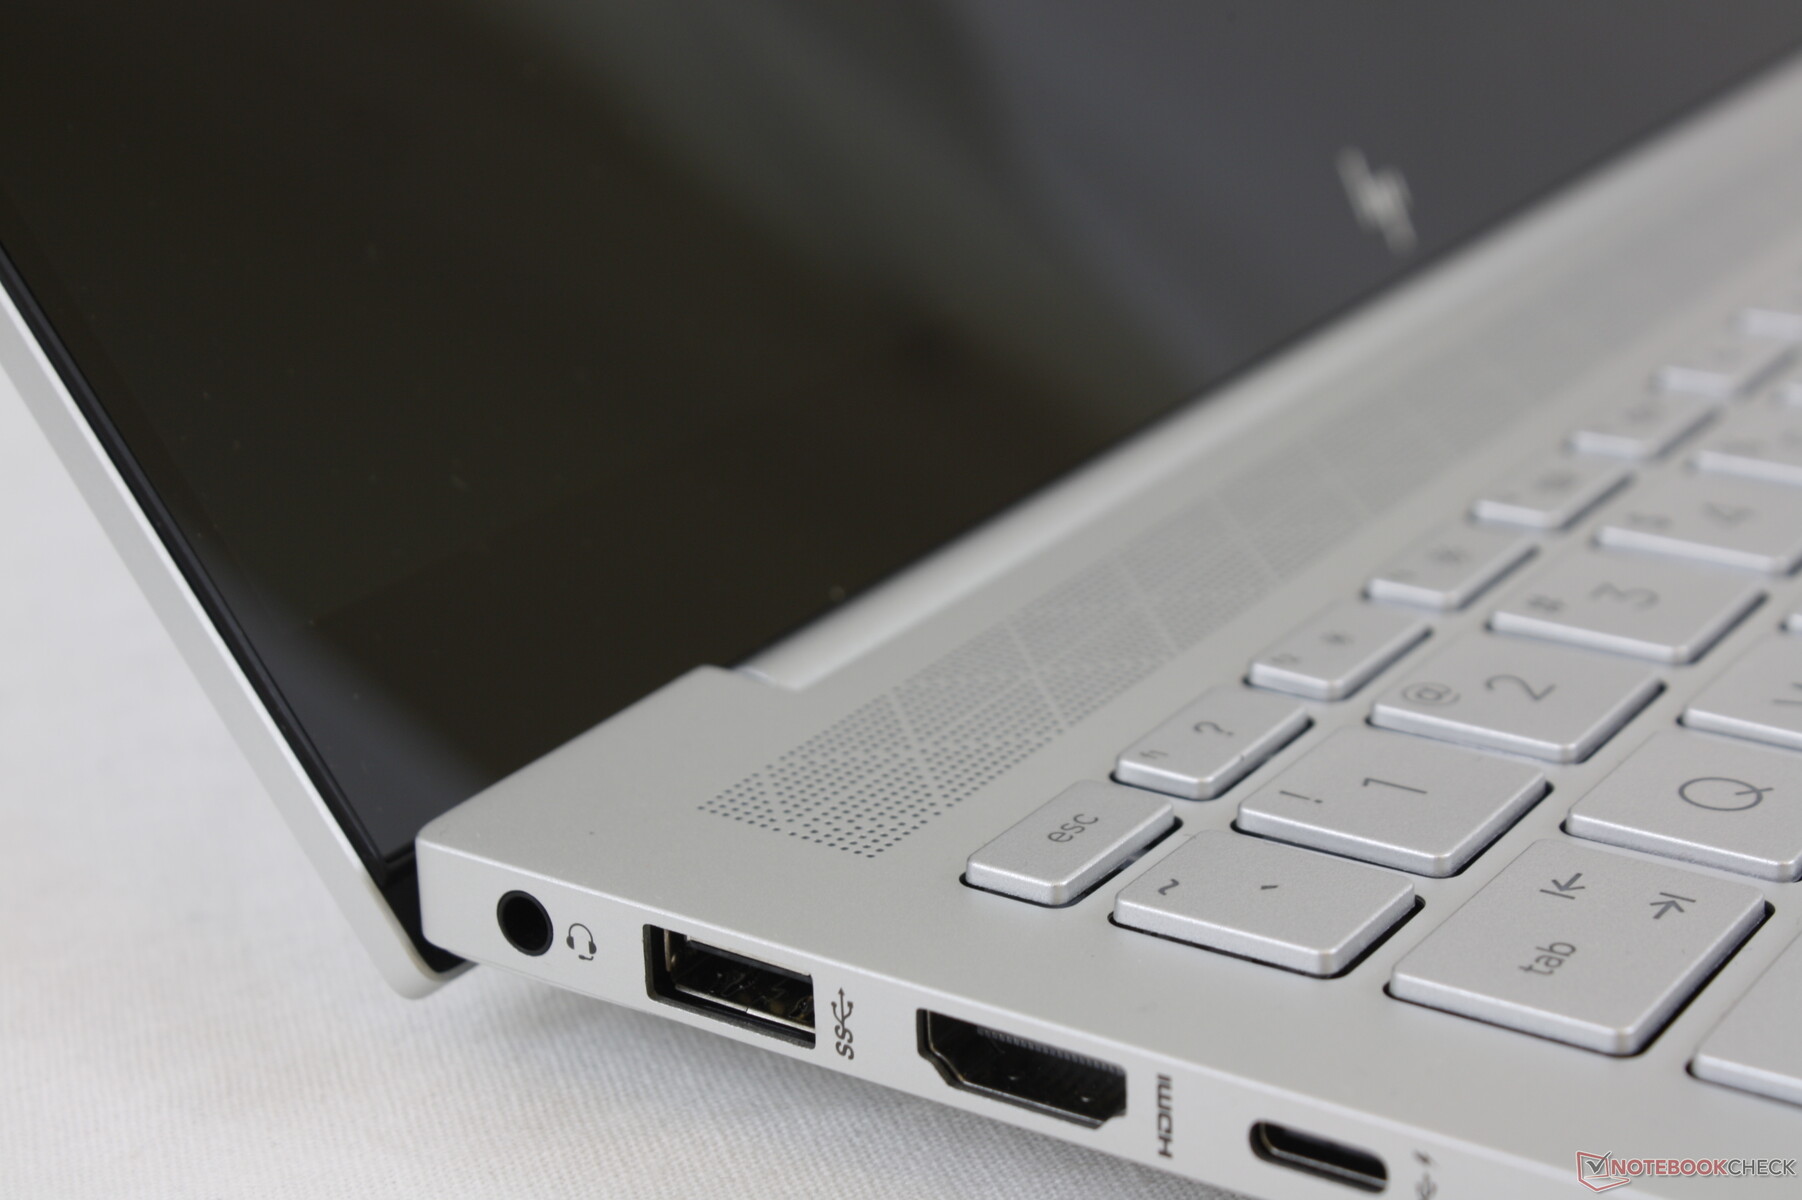
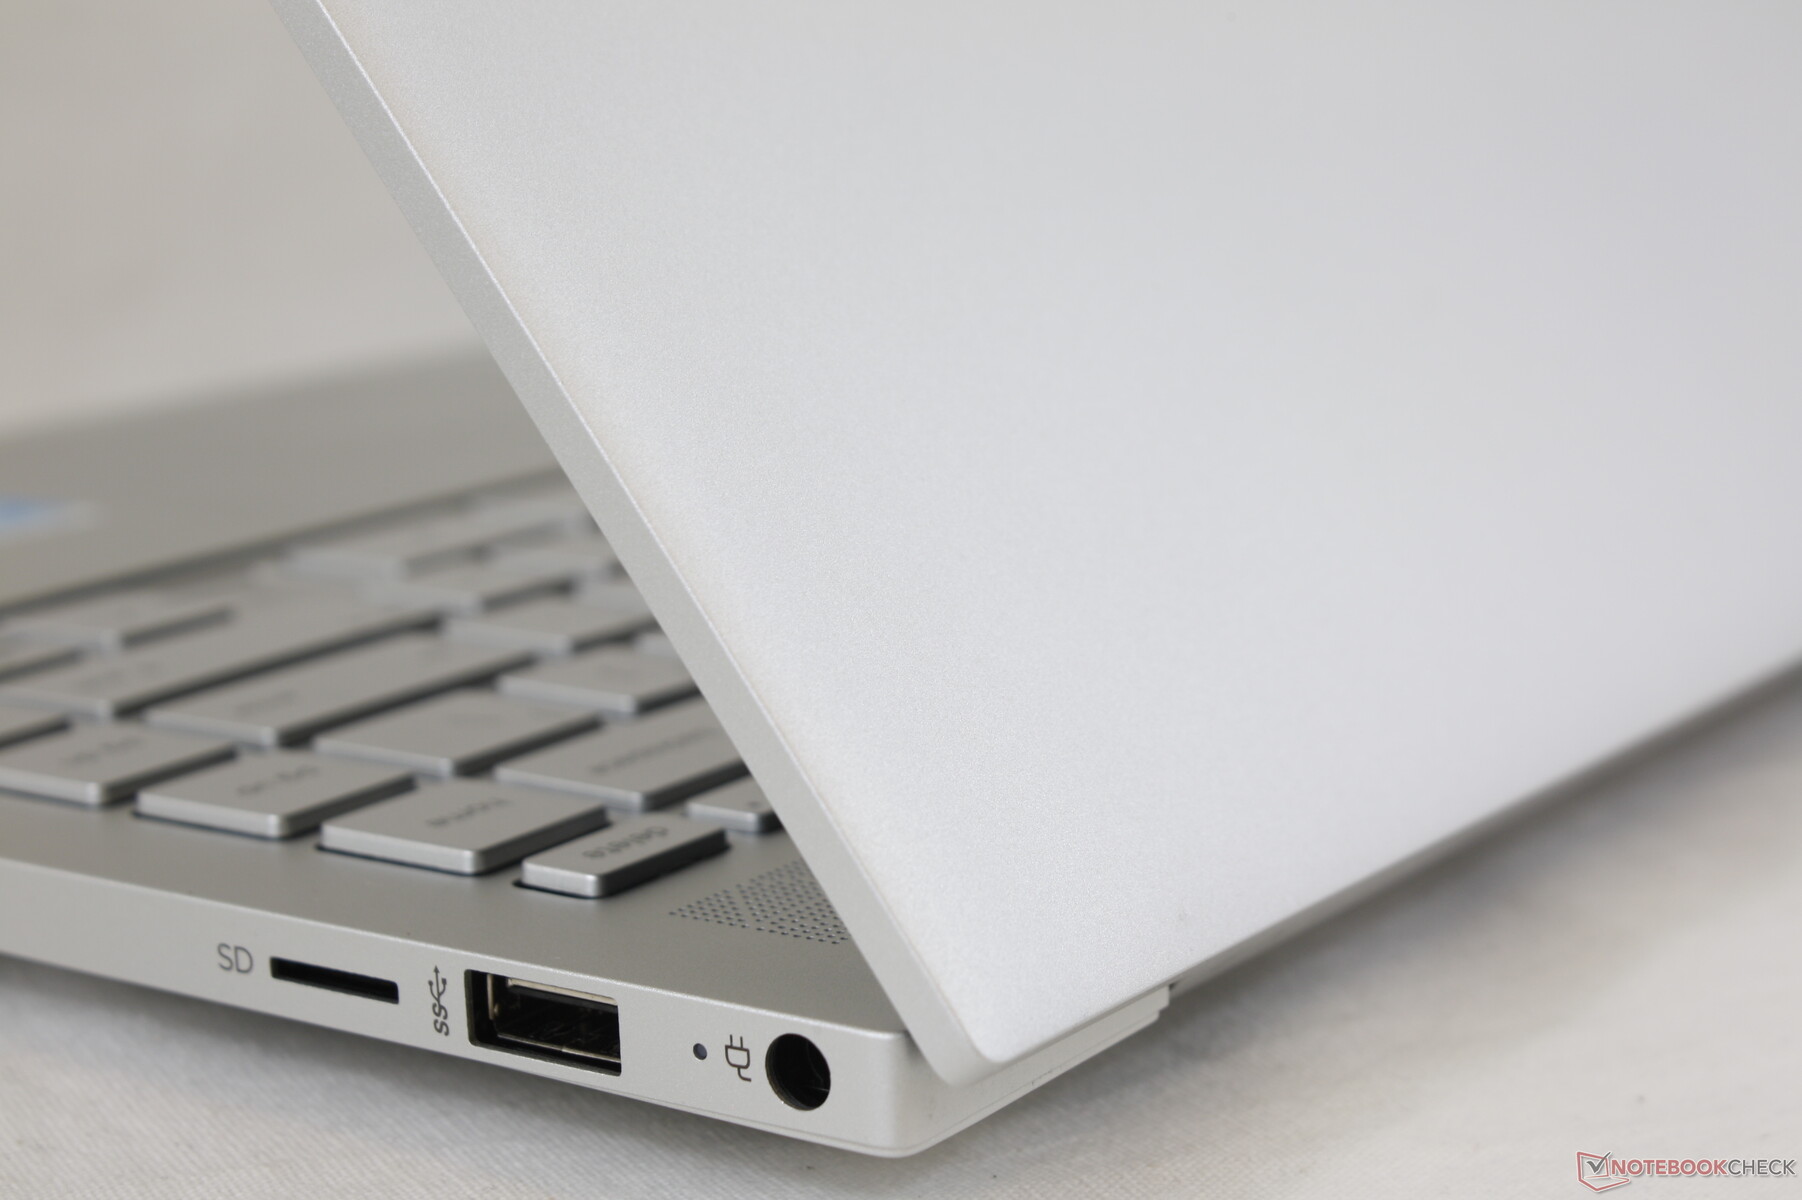
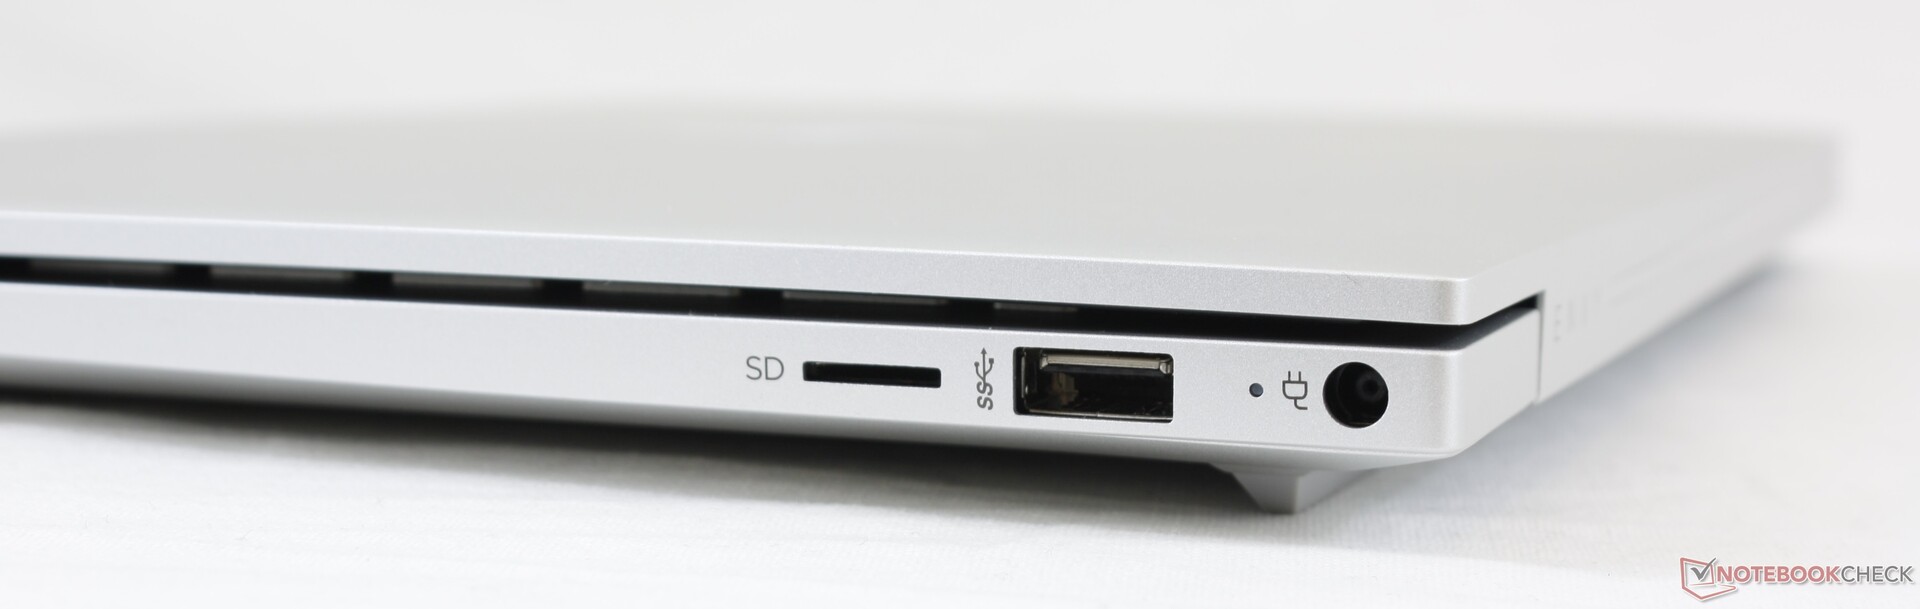
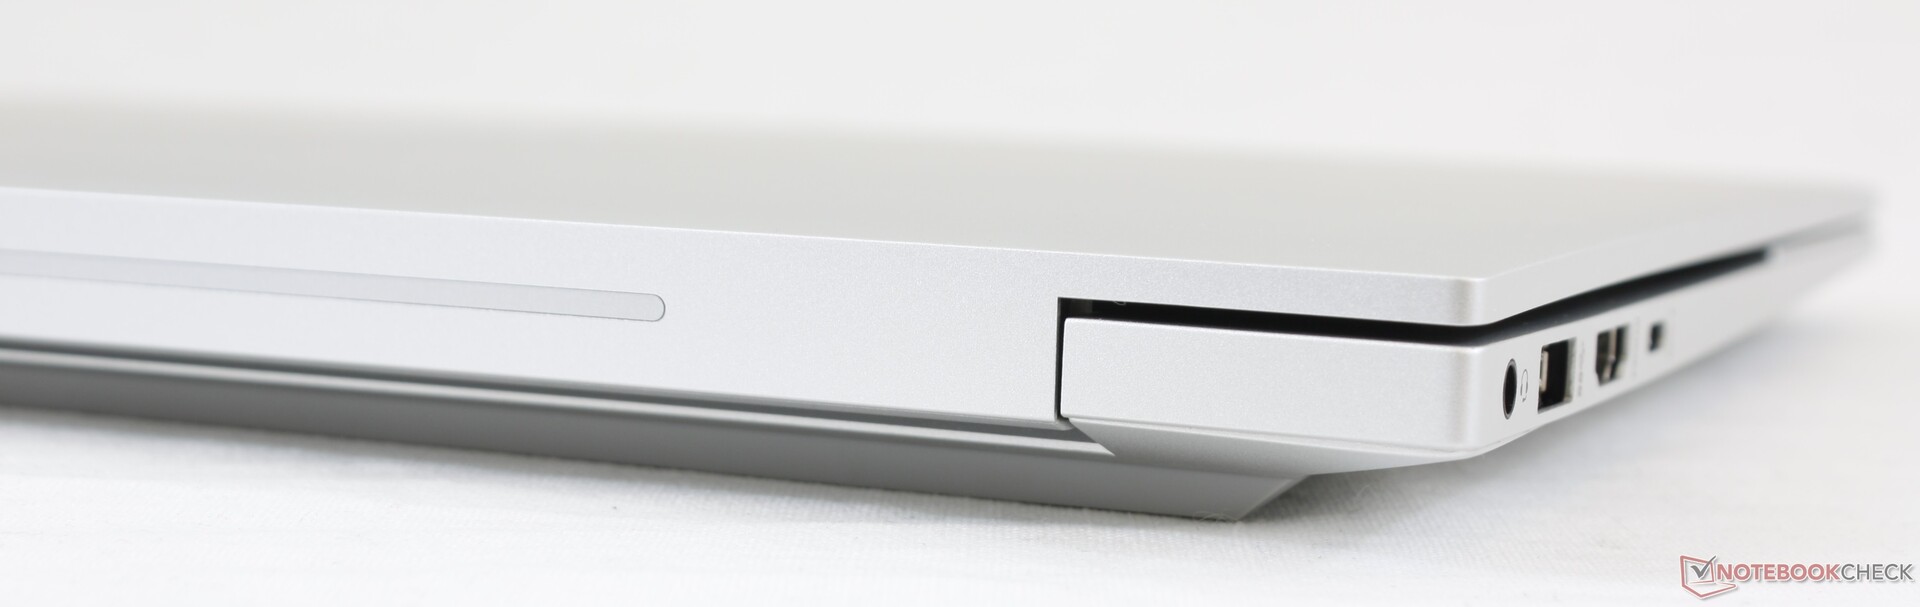
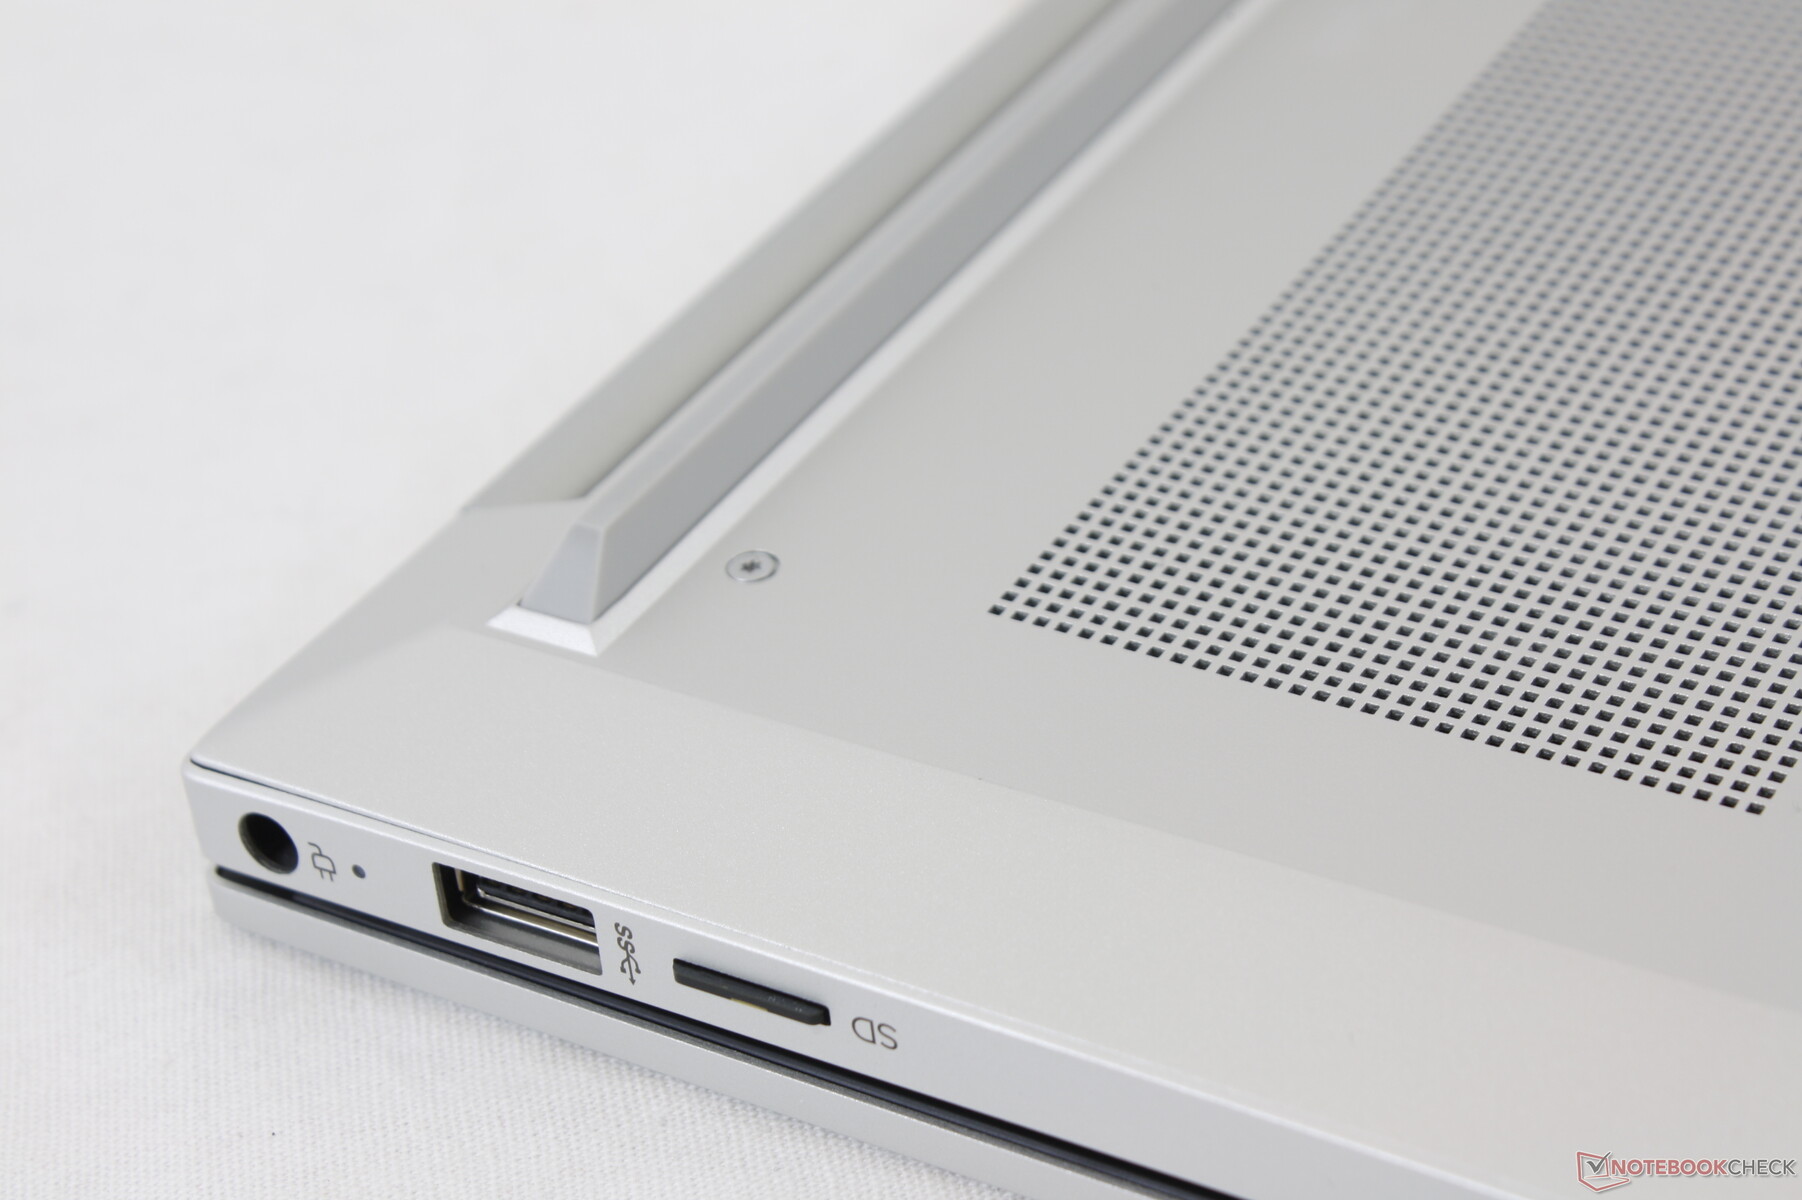
Port options are identical to the larger Envy 15 but with one Thunderbolt 4 port instead of two Thunderbolt 3. Even so, this isn't an issue as there are still more ports than on most other laptops in this size category. All ports are near the back corners of the chassis for easier cable management.
SD Card Reader
The spring-loaded MicroSD reader offers decent transfer rates. Moving 1 GB of pictures from our UHS-II test card to desktop takes about 14 seconds compared to half that on the XPS 13.
| SD Card Reader | |
| average JPG Copy Test (av. of 3 runs) | |
| HP Spectre x360 14t-ea000 (Toshiba Exceria Pro M501 microSDXC 32GB) | |
| HP Envy 14-eb0010nr (Toshiba Exceria Pro M501 microSDXC 32GB) | |
| Asus ZenBook Duo 14 UX482EA (Toshiba Exceria Pro M501 microSDXC 32GB) | |
| maximum AS SSD Seq Read Test (1GB) | |
| HP Spectre x360 14t-ea000 (Toshiba Exceria Pro M501 microSDXC 32GB) | |
| HP Envy 14-eb0010nr (Toshiba Exceria Pro M501 microSDXC 32GB) | |
| Asus ZenBook Duo 14 UX482EA (Toshiba Exceria Pro M501 microSDXC 32GB) | |
Communication
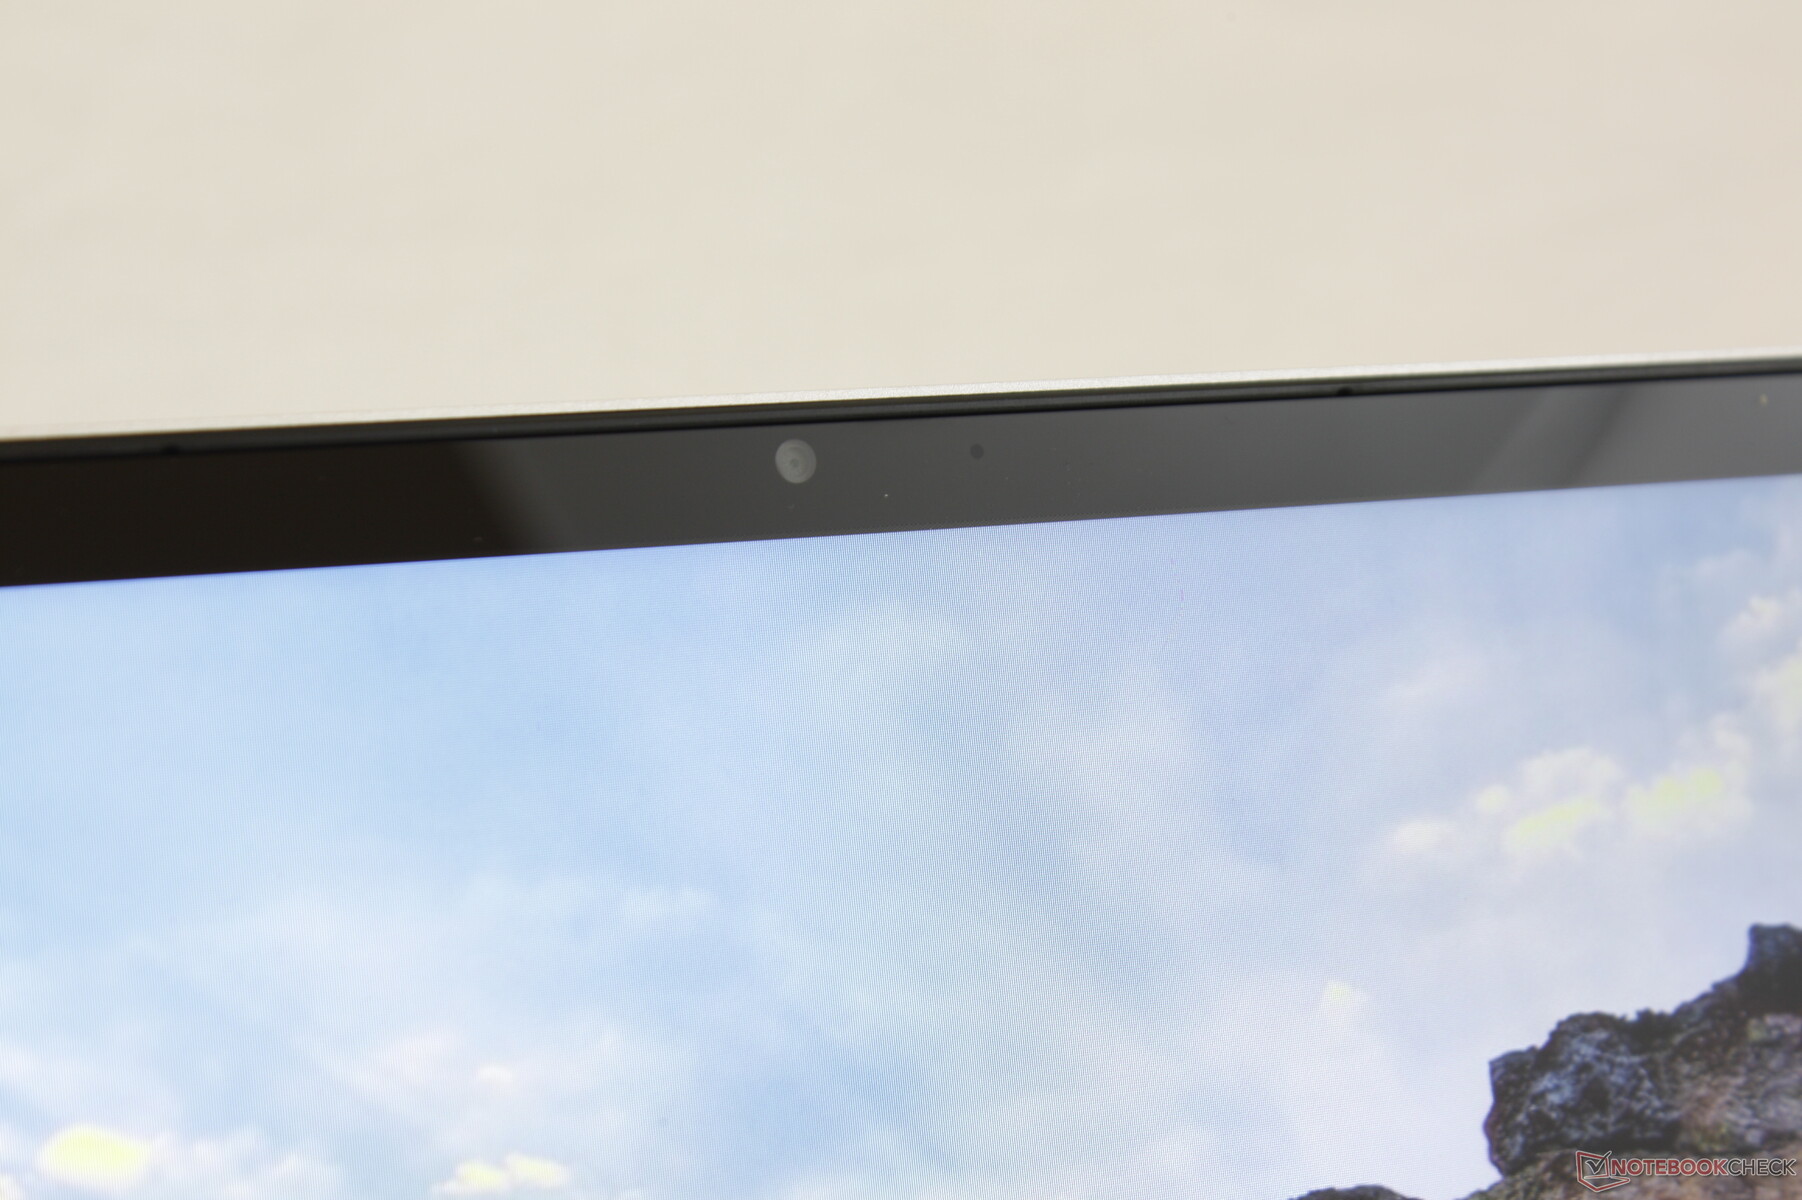
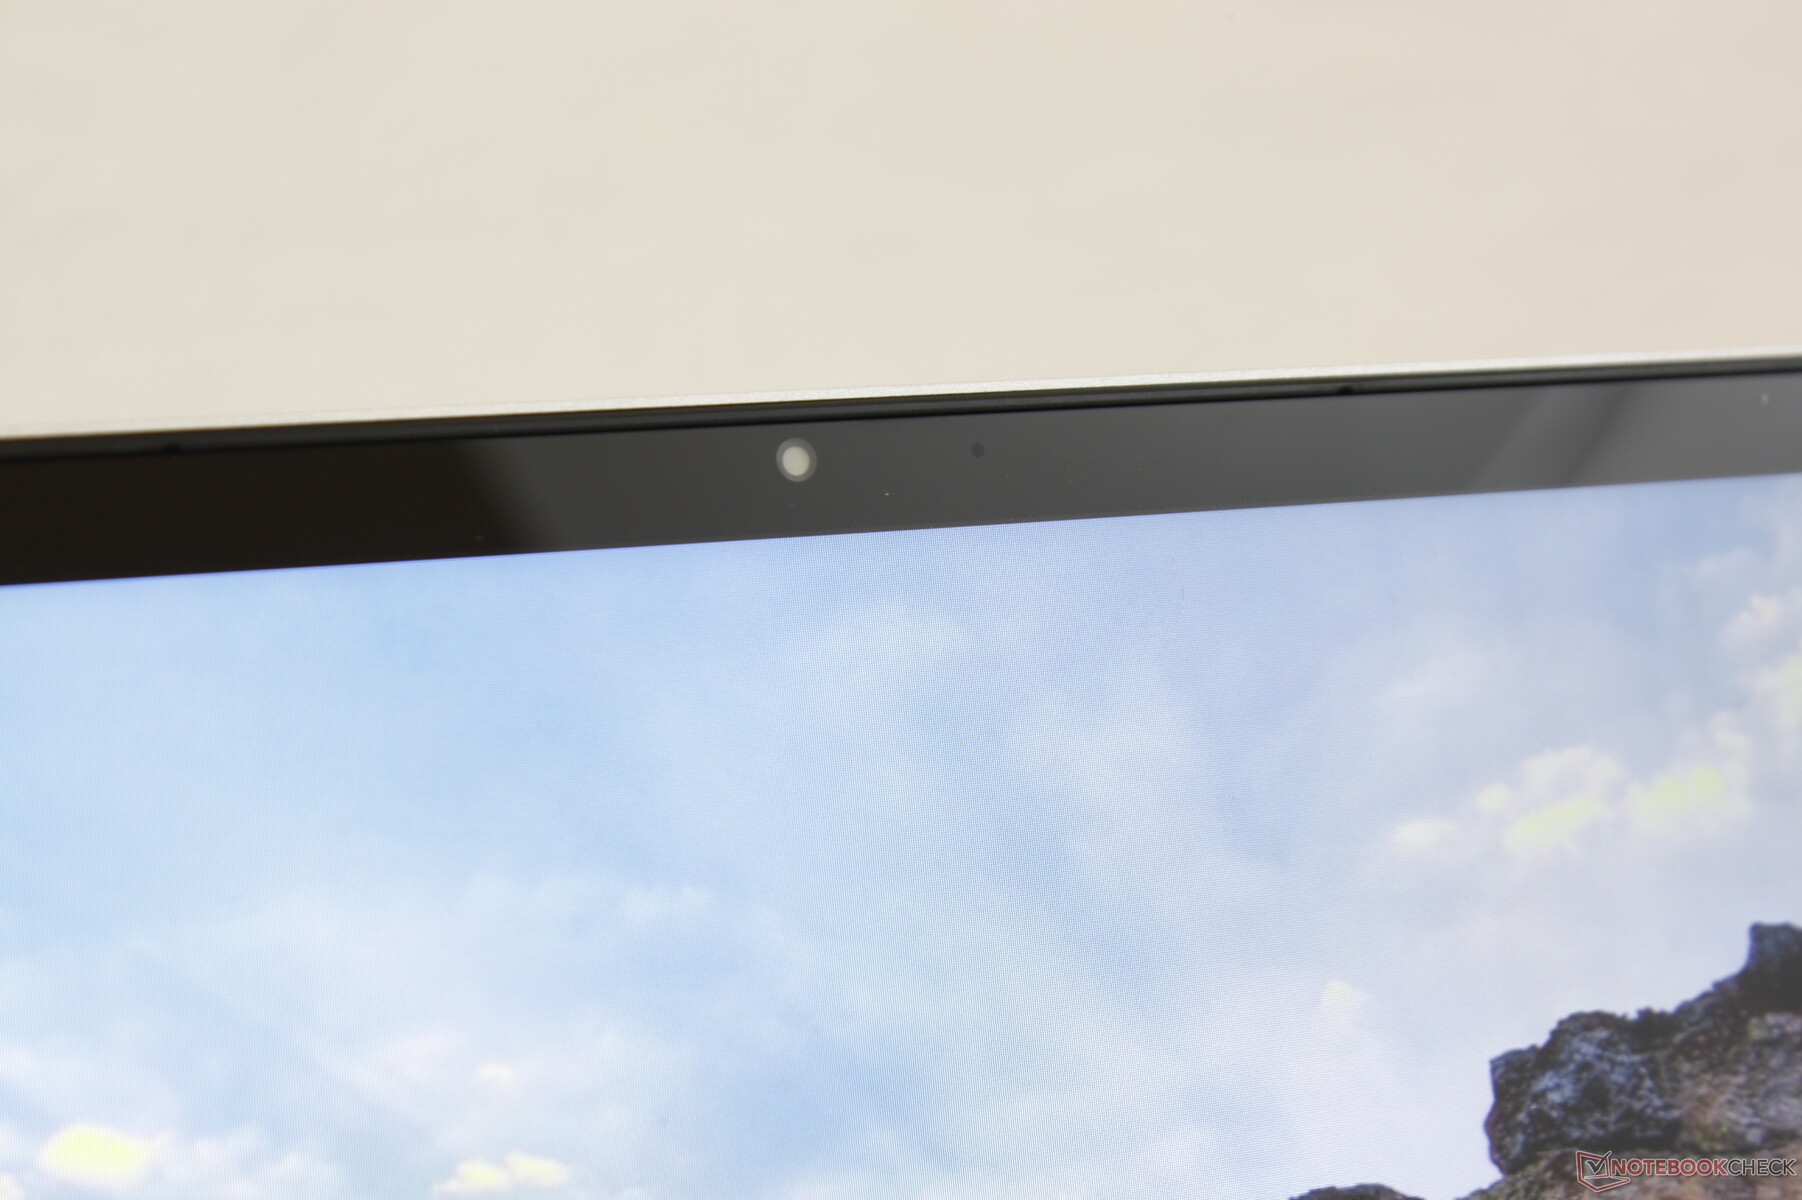
Webcam


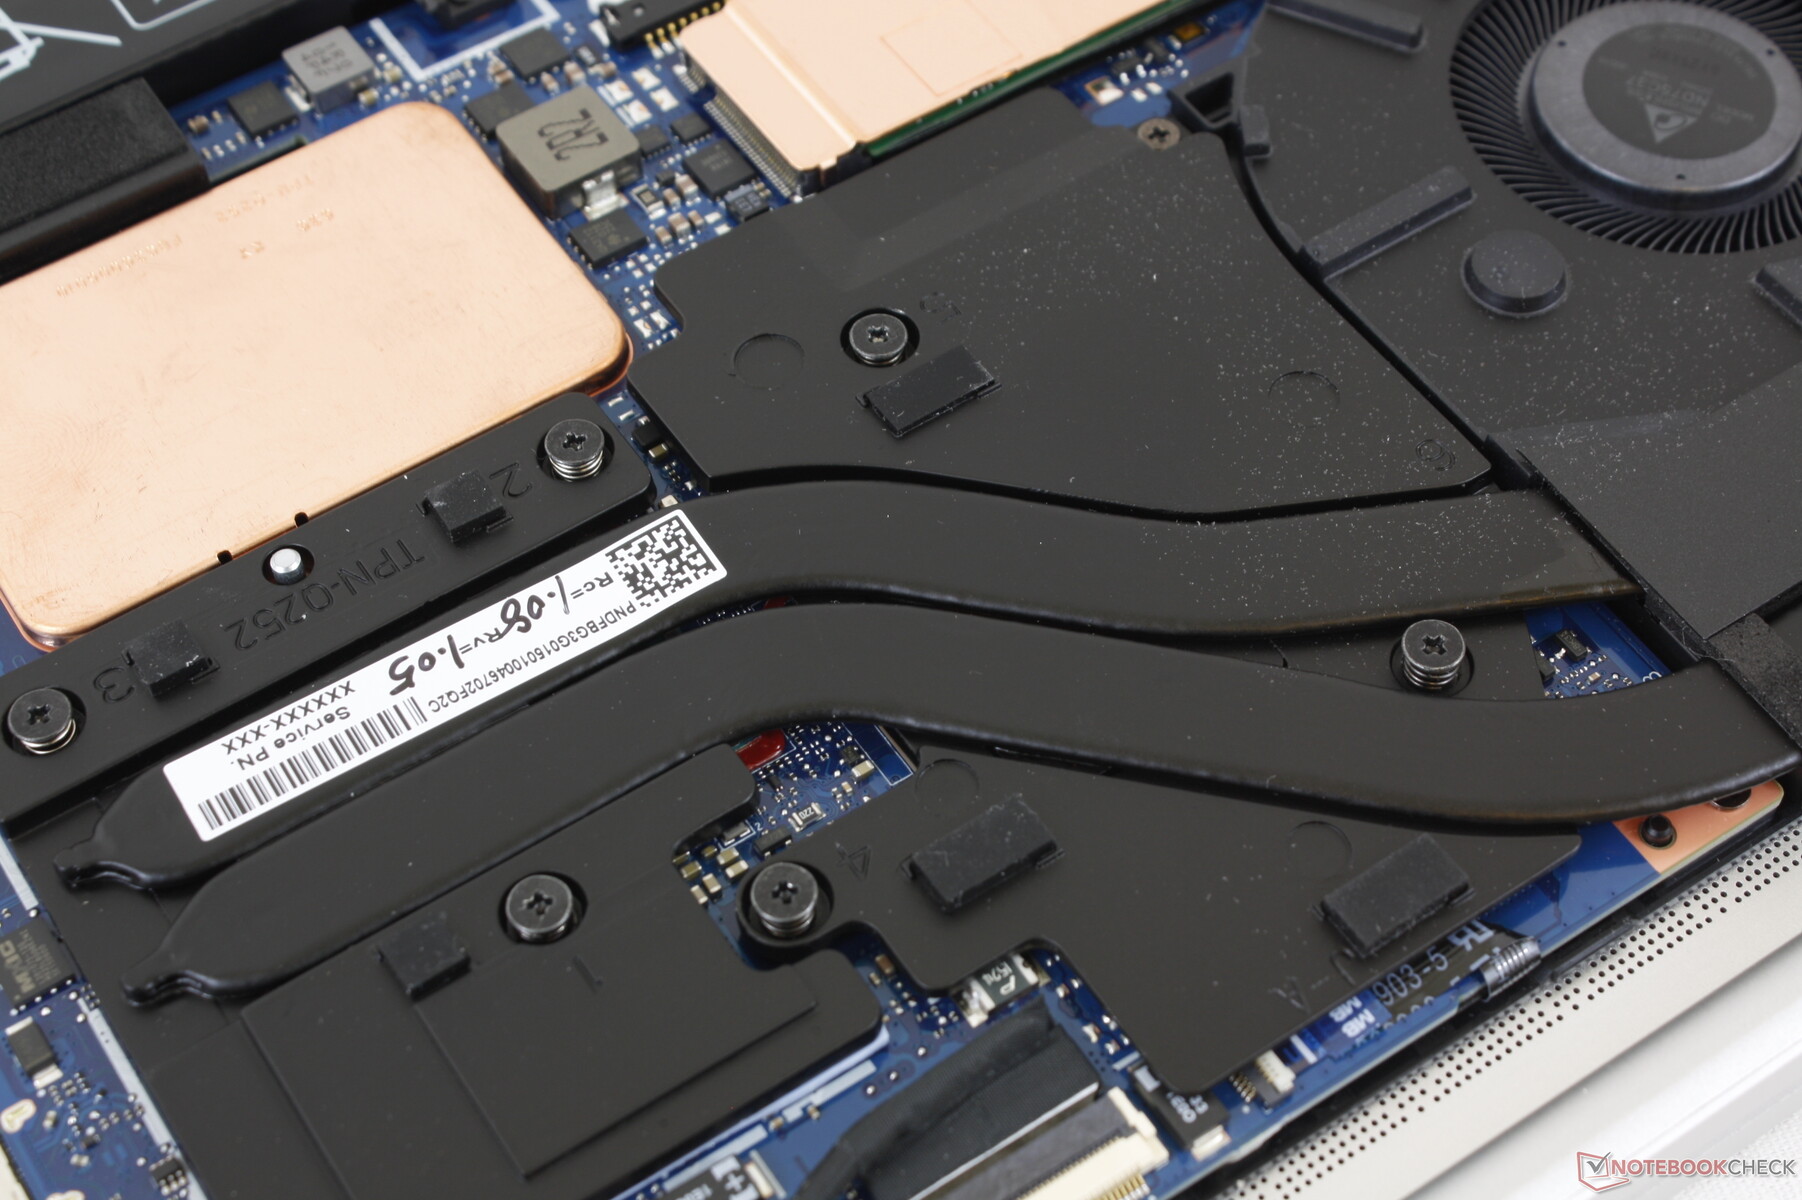
Maintenance
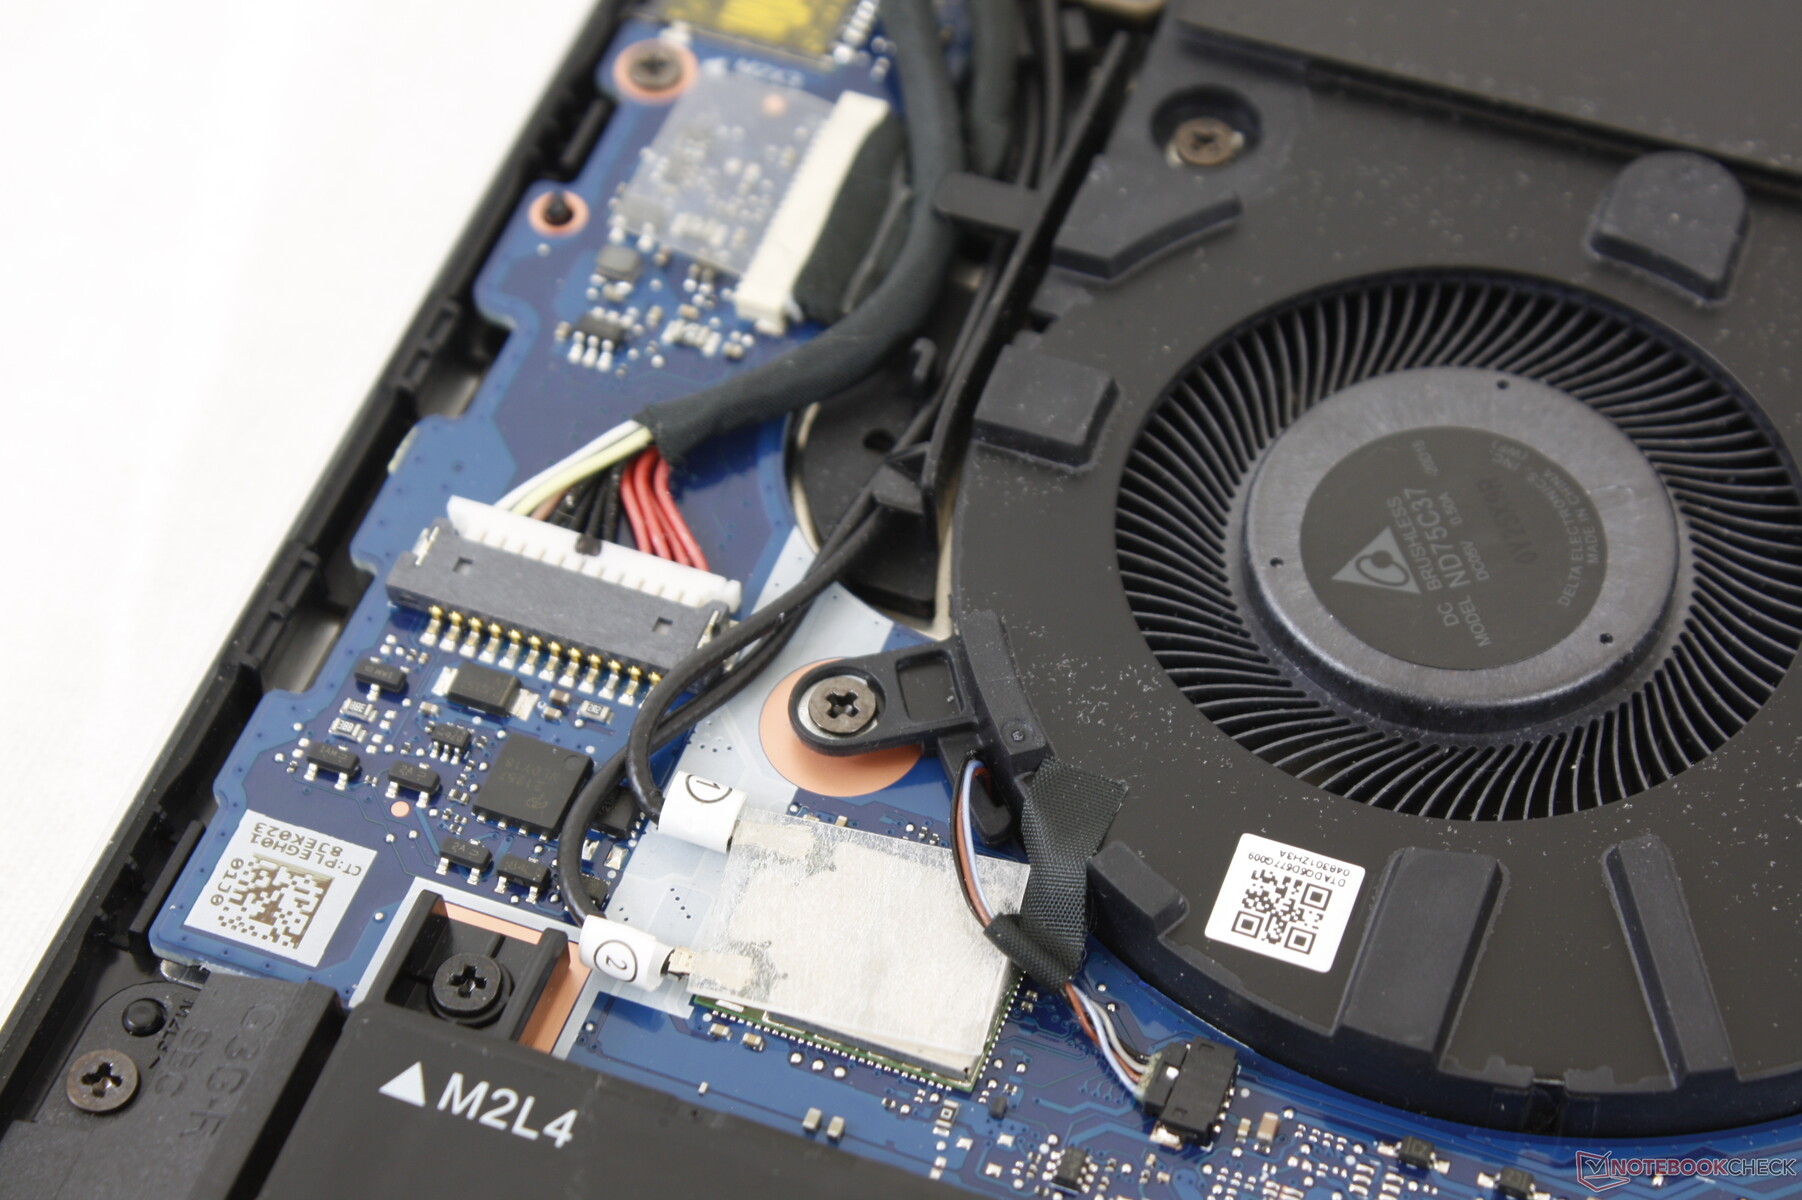
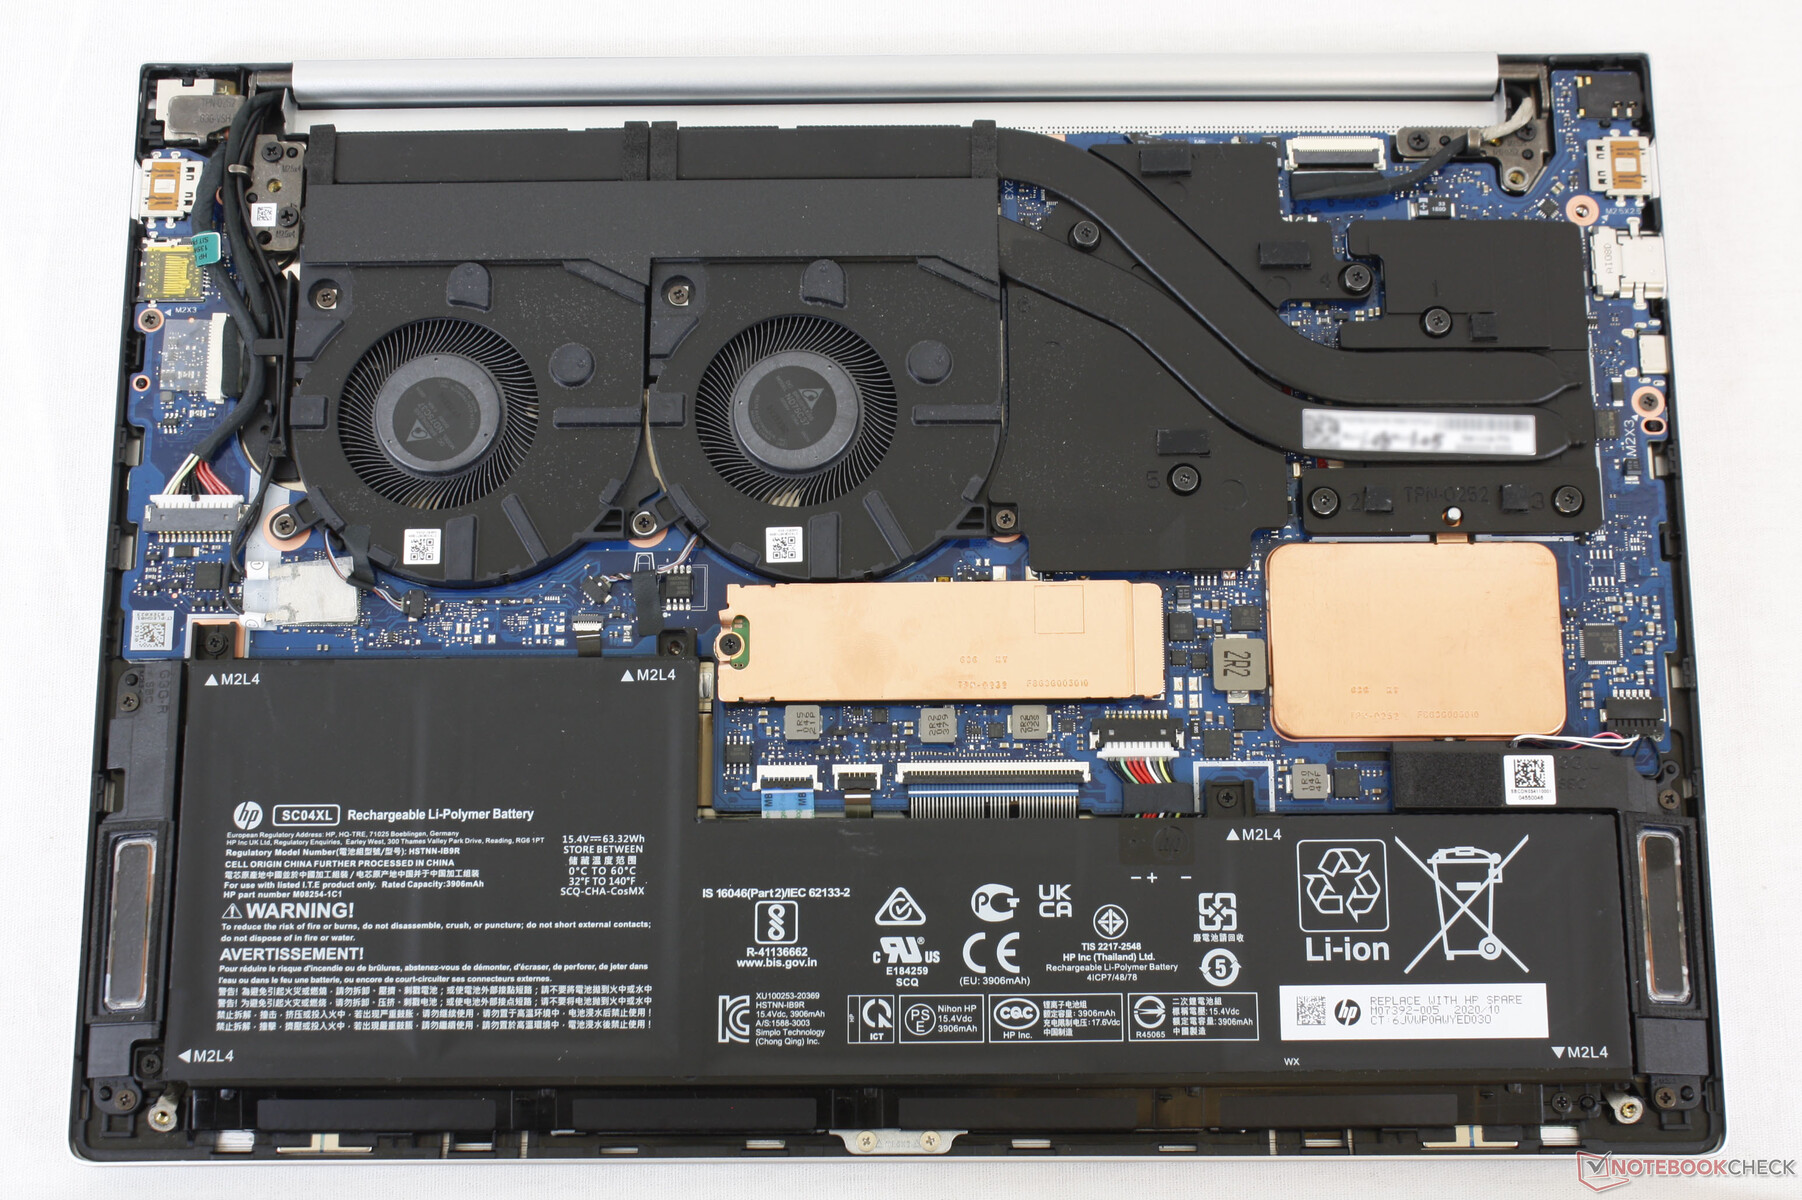
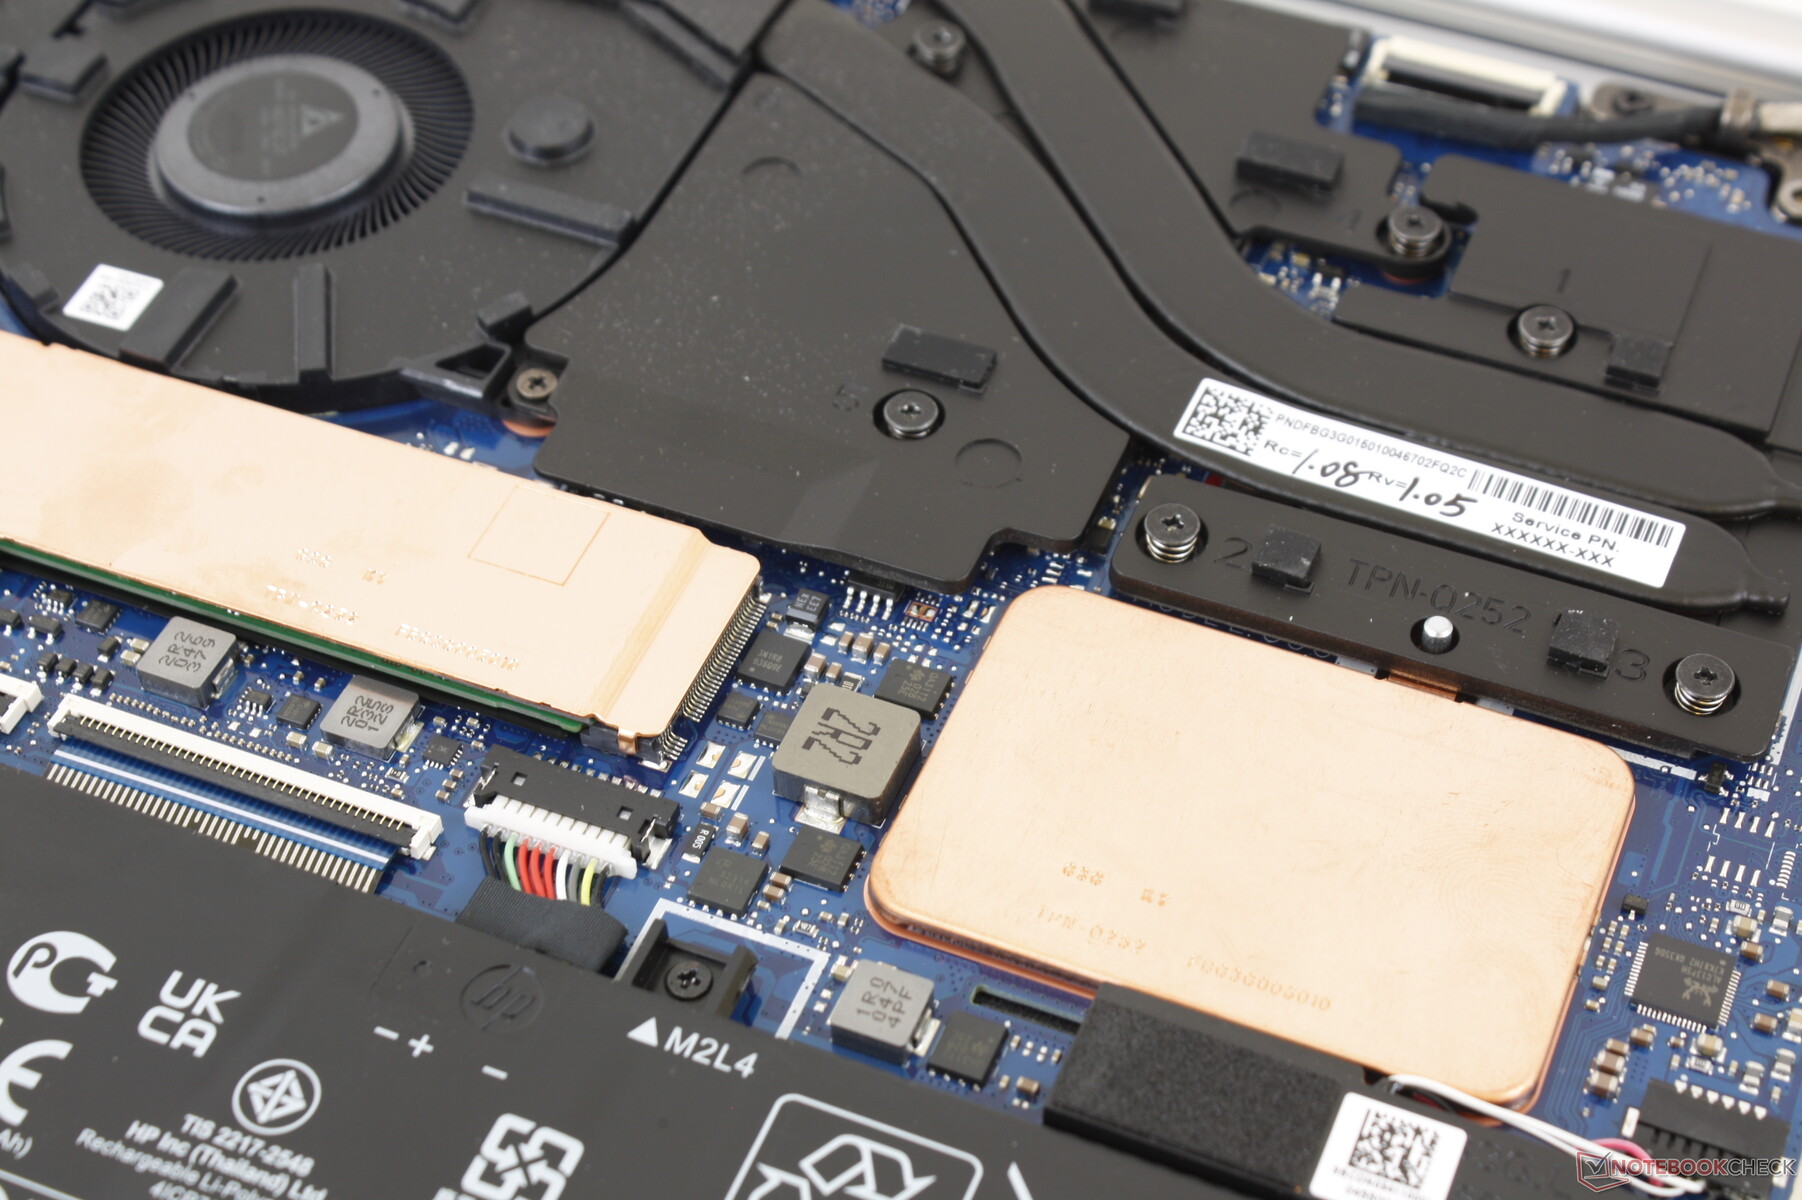
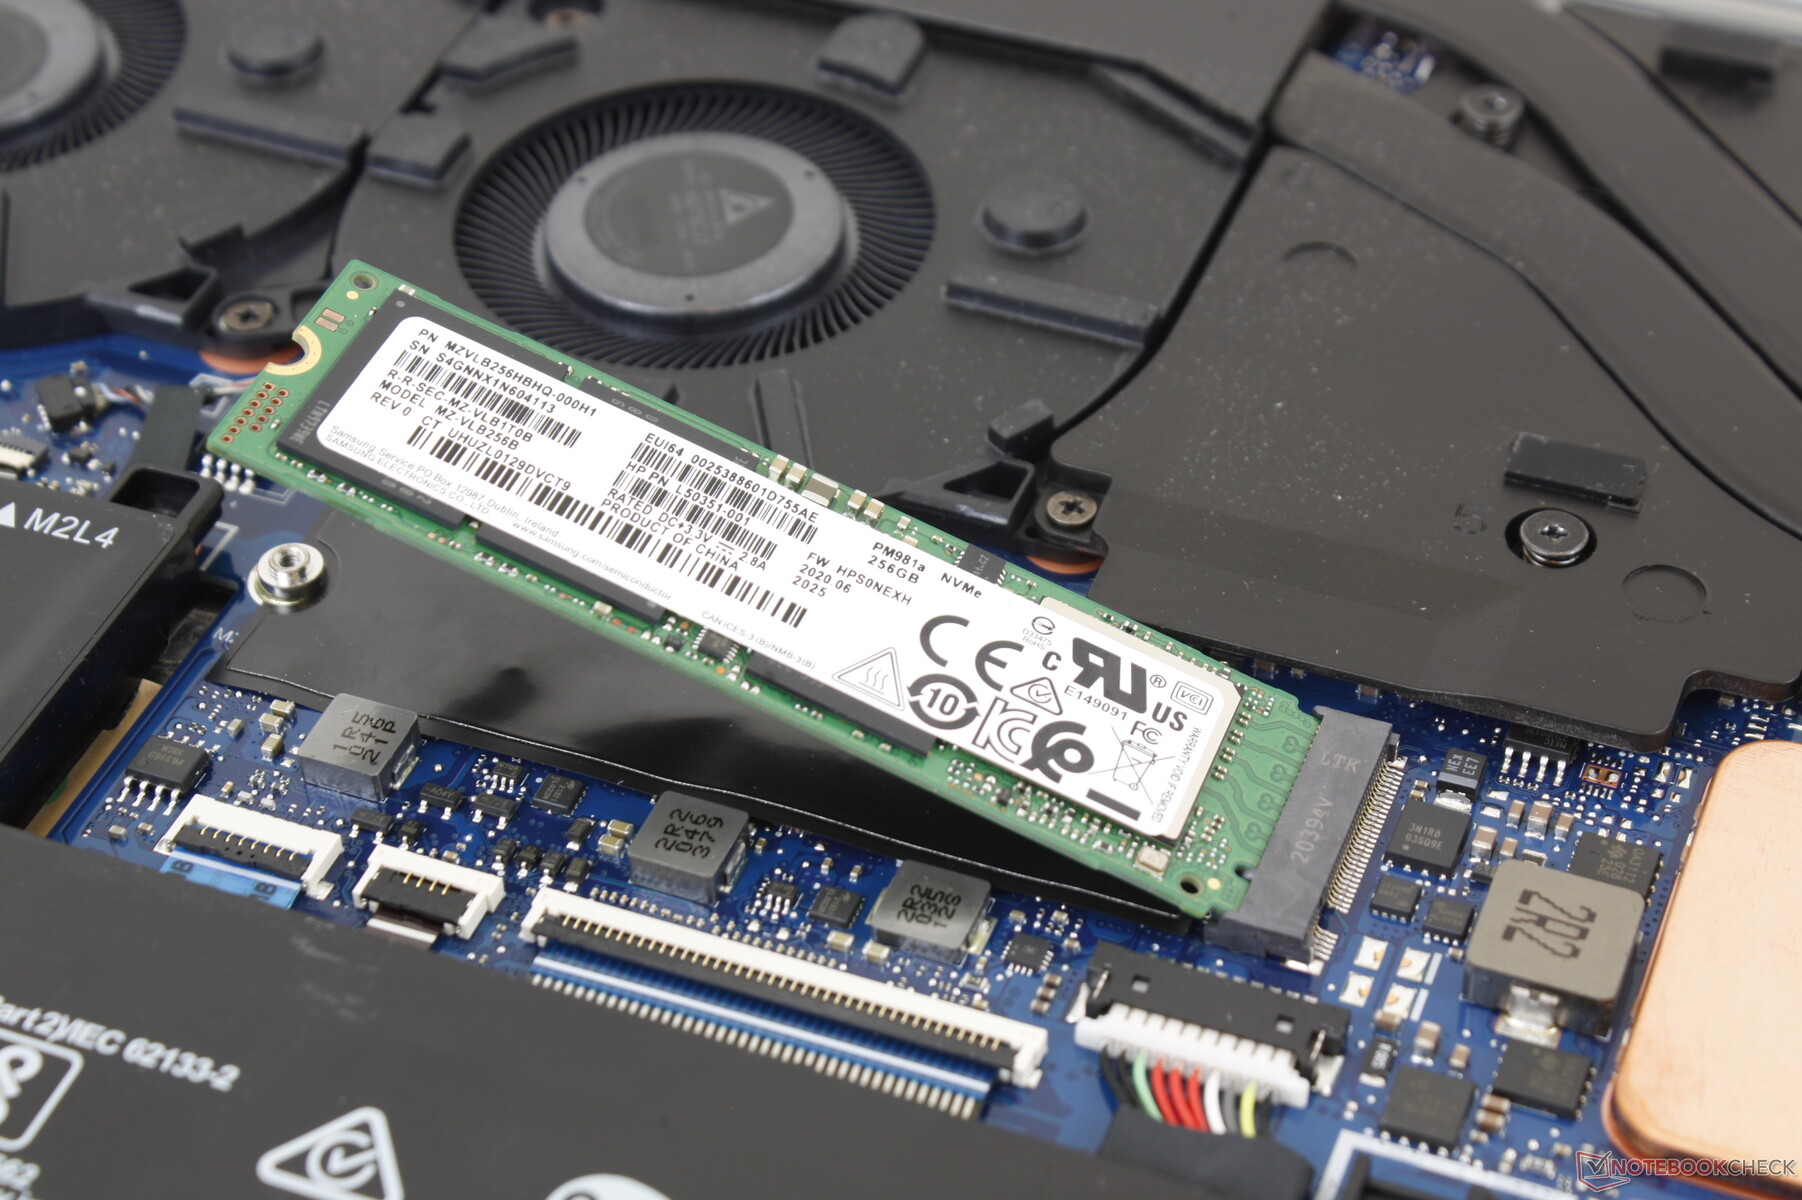
HP boasted about the easy serviceability of the 2020 Envy 15 Creator and we're happy to see this carry over to the Envy 14. The bottom panel is secured by just four T5 Torx screws and none are underneath any rubber feet unlike on the recent Lenovo IdeaPad Slim 9i 14.
Unfortunately, serviceable components are limited as both RAM and WLAN are soldered. The single M.2 SSD can be swapped without impacting warranty.
Accessories and Warranty
The retail box includes no additional extras beyond the paperwork and AC adapter. The usual one-year limited manufacturer warranty applies.
Input Devices
Keyboard and Touchpad
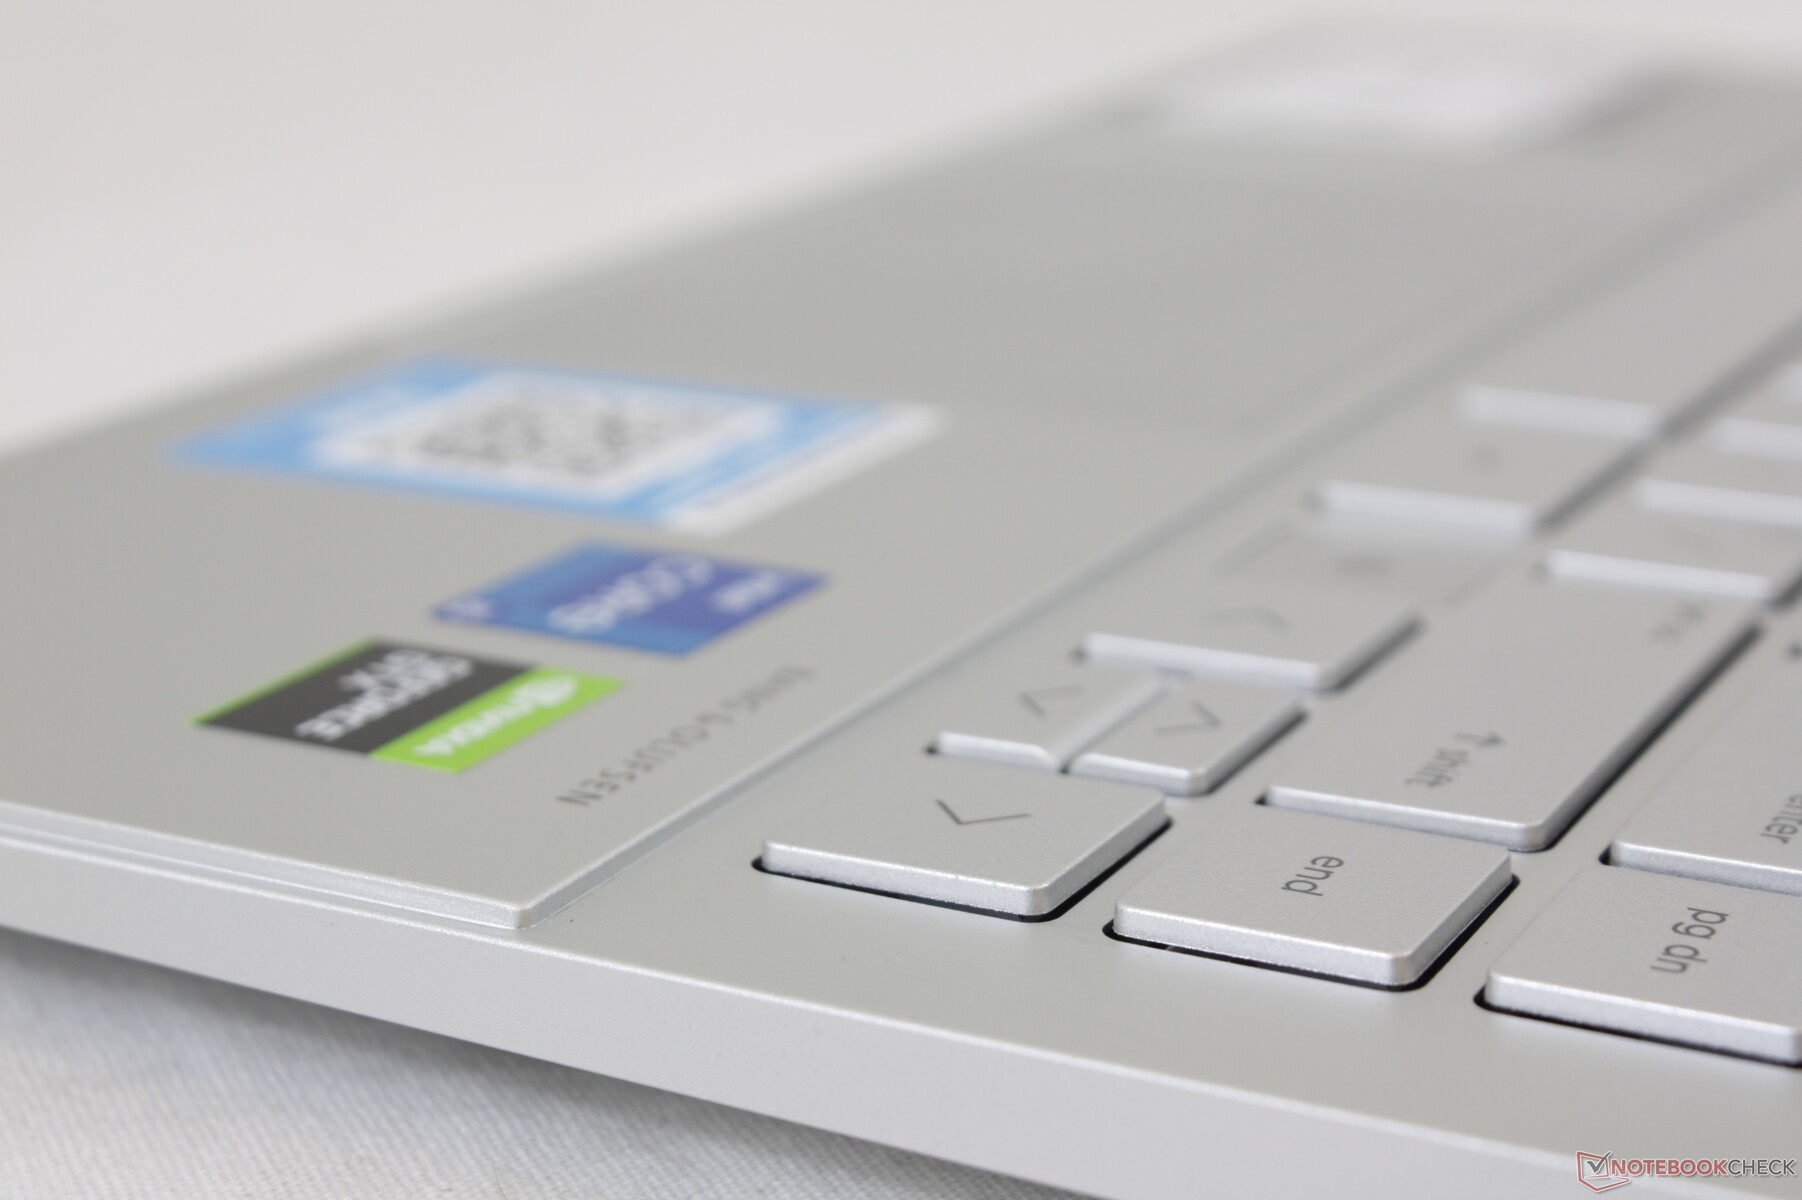
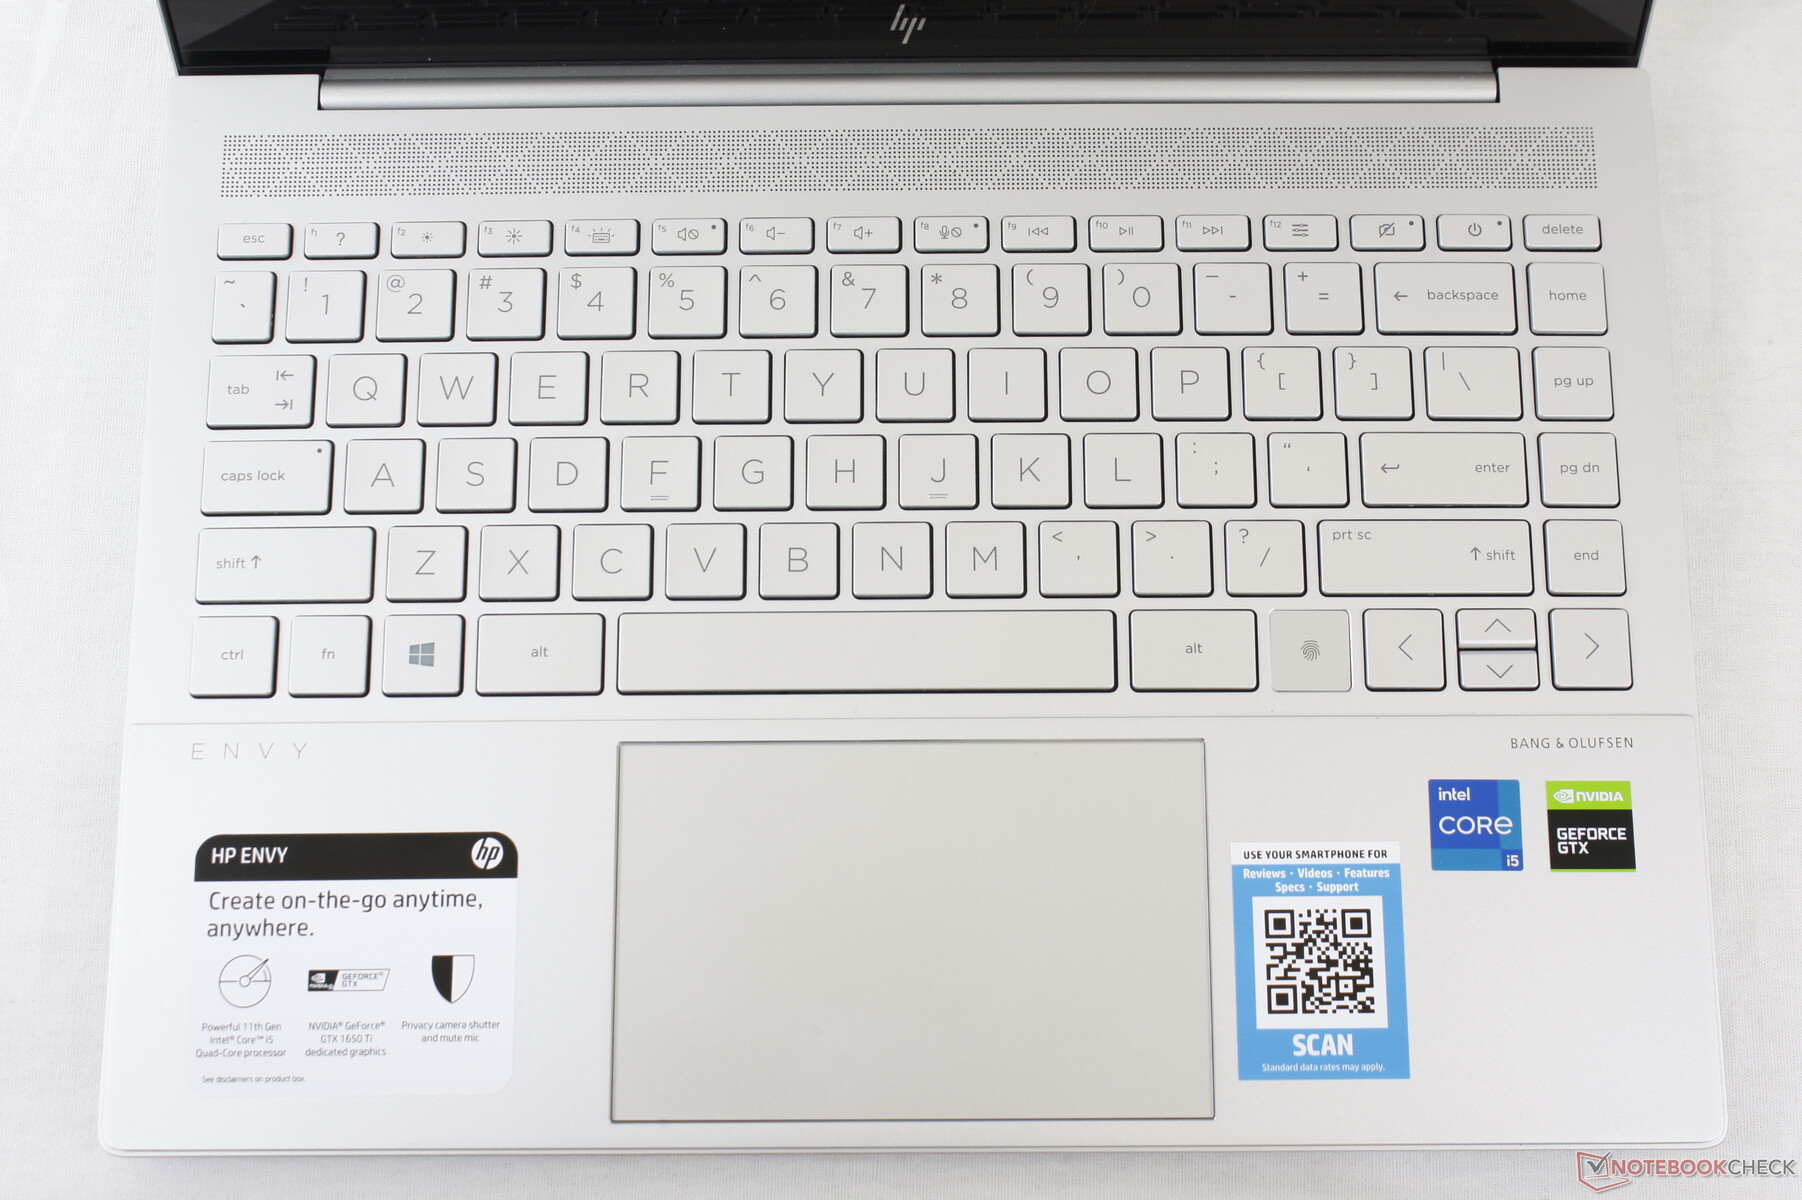
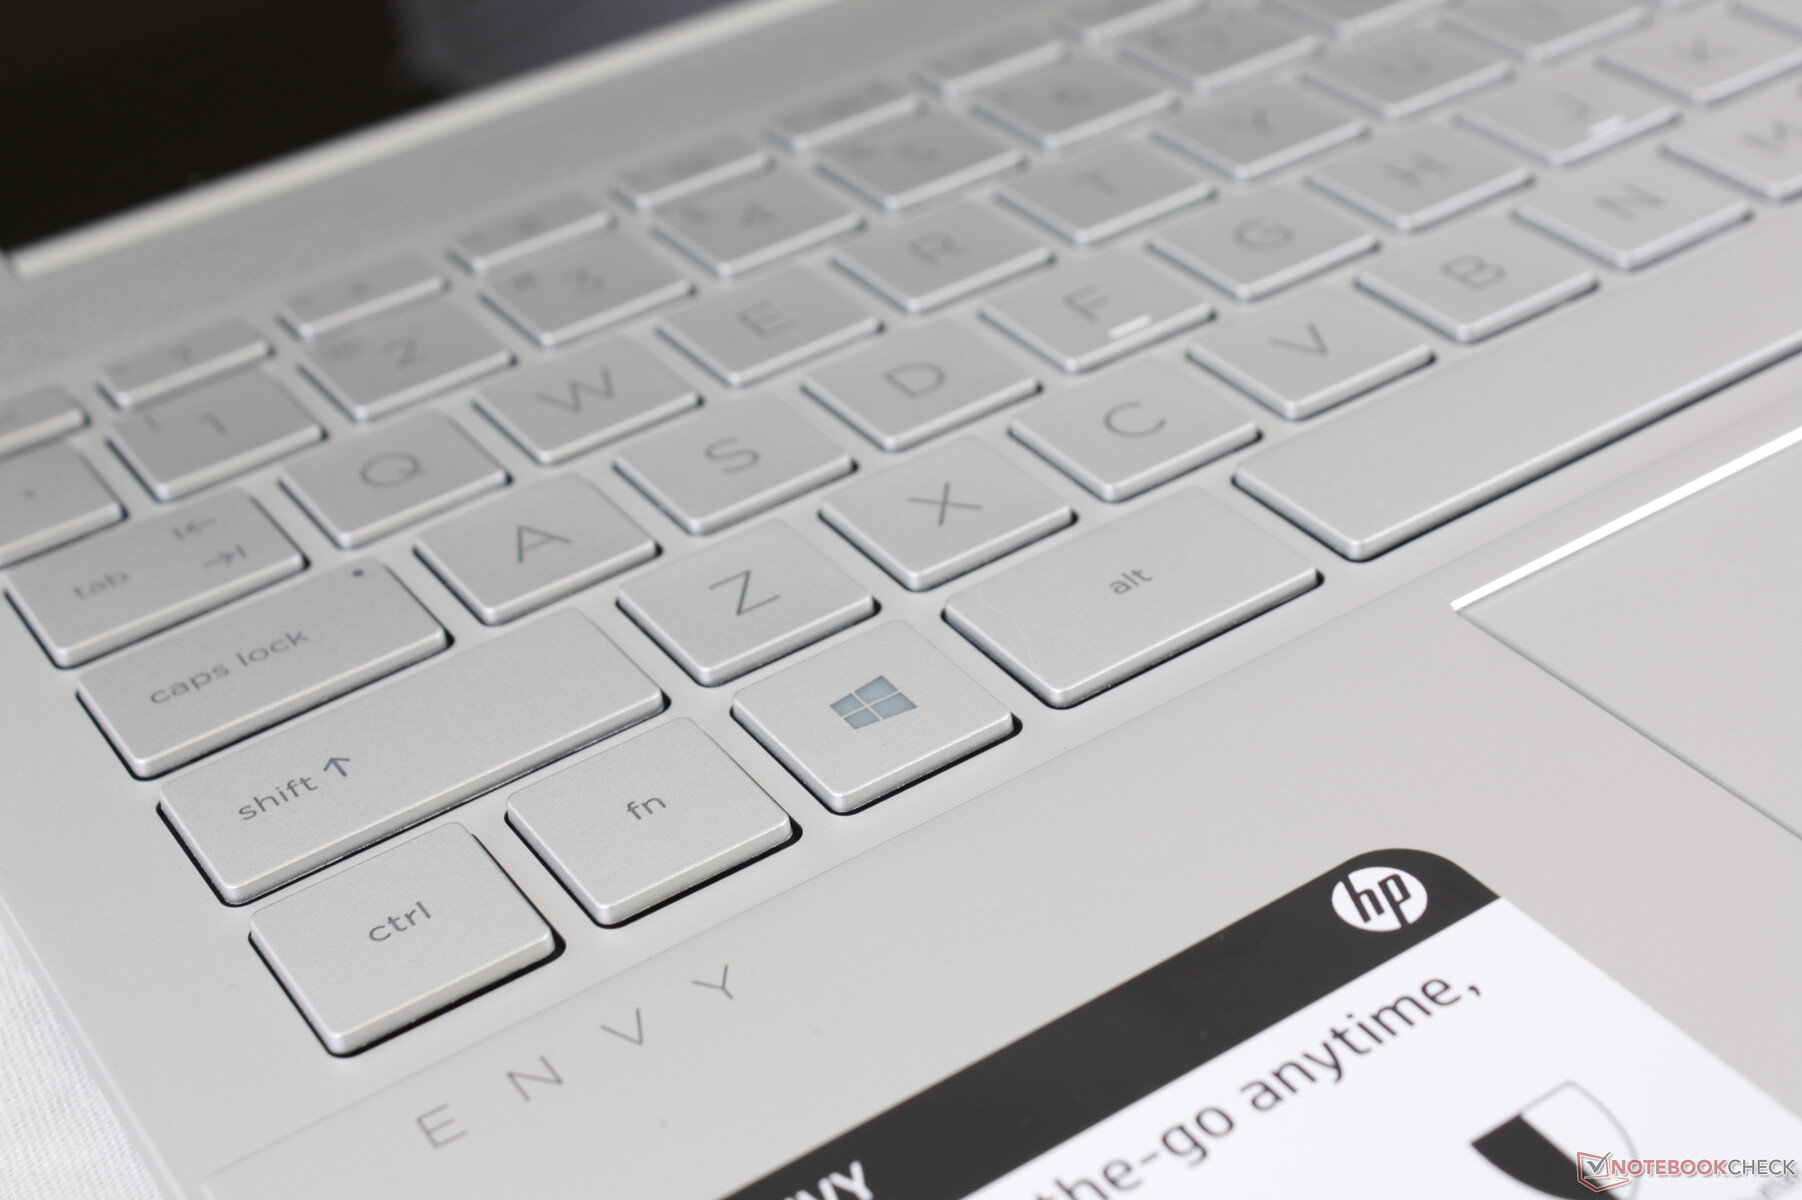
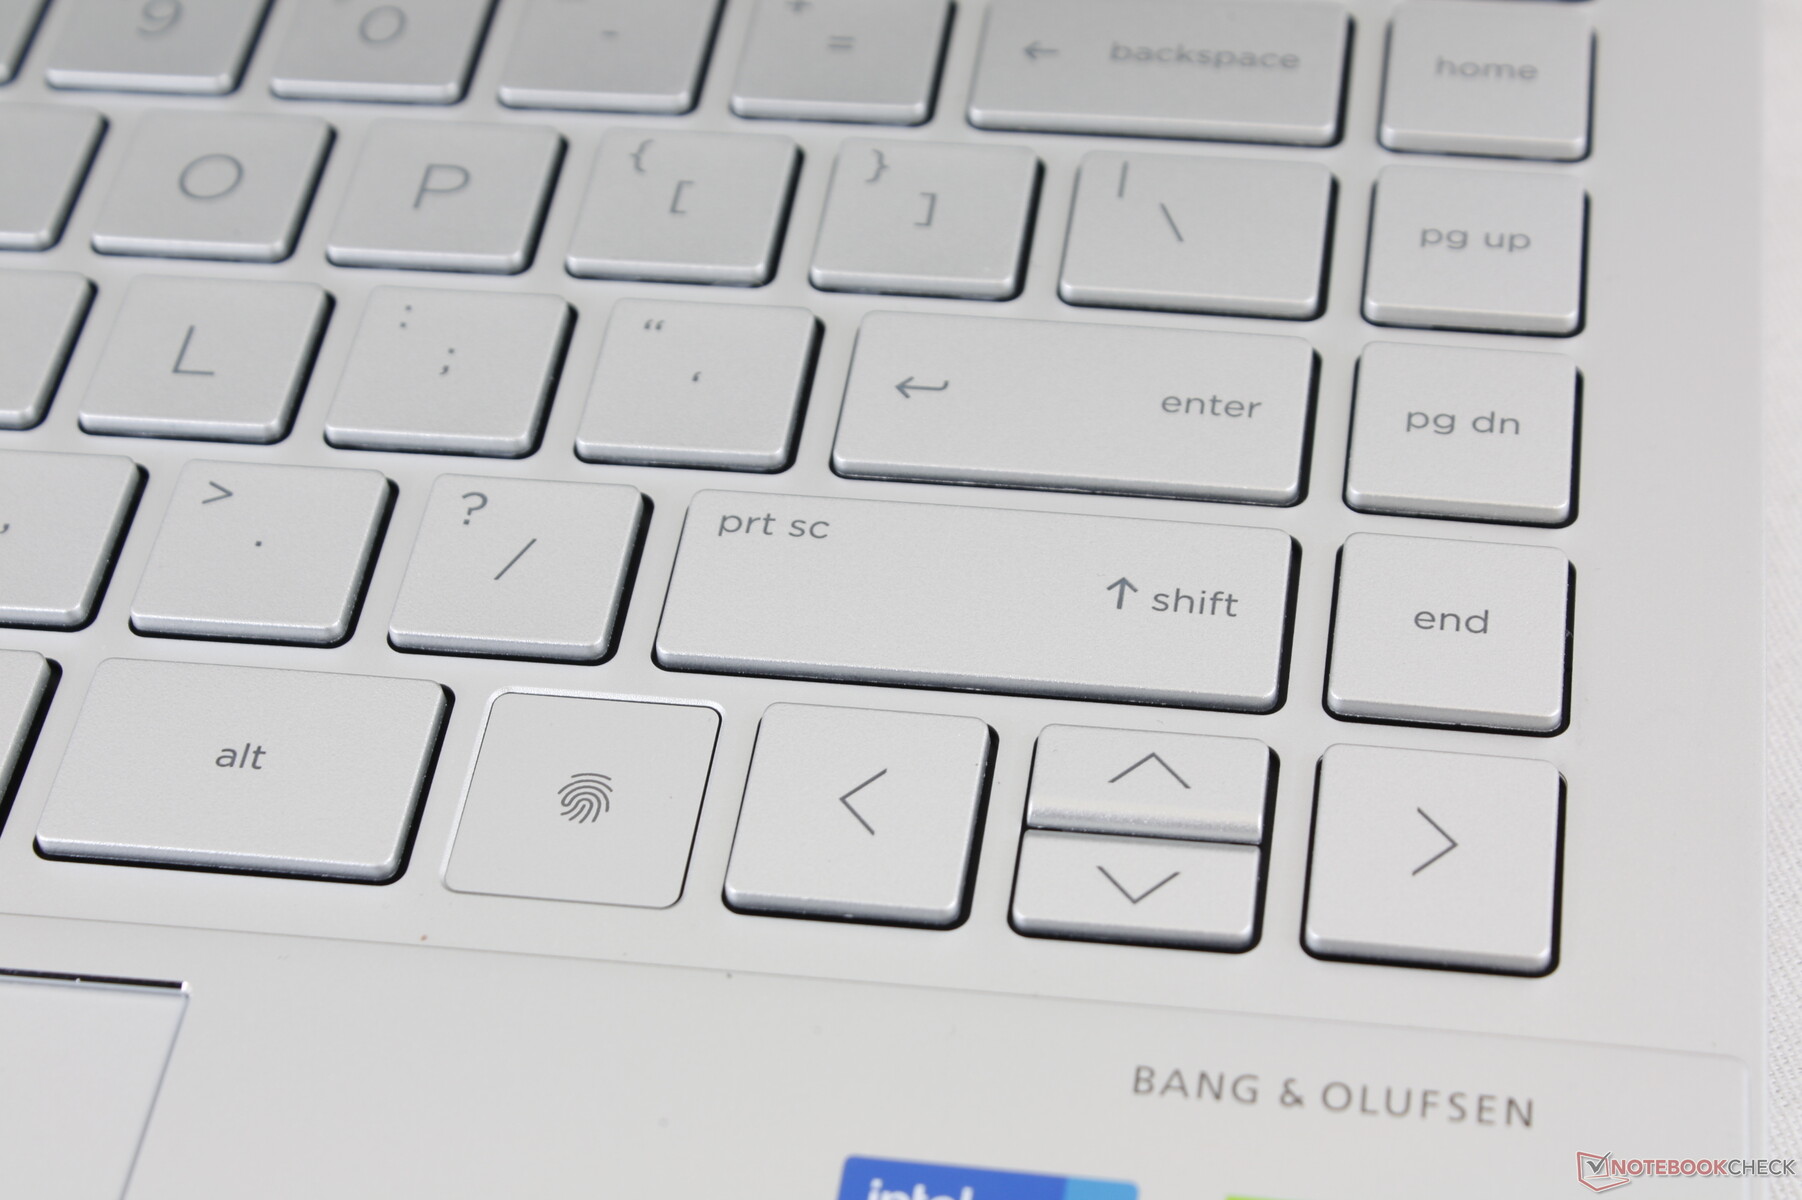
The Envy 14 and Envy 15 share the same keyboard and touchpad down to their font, feel and individual dimensions. Keys are crisp and with stronger feedback than most other Ultrabooks, but clatter is slightly louder as a result. The Enter and Space keys in particular are louder than the same keys on the XPS 13 or Asus ZenBook 14. The typing experience is thankfully much closer to the HP Spectre than to a cheaper Pavilion.
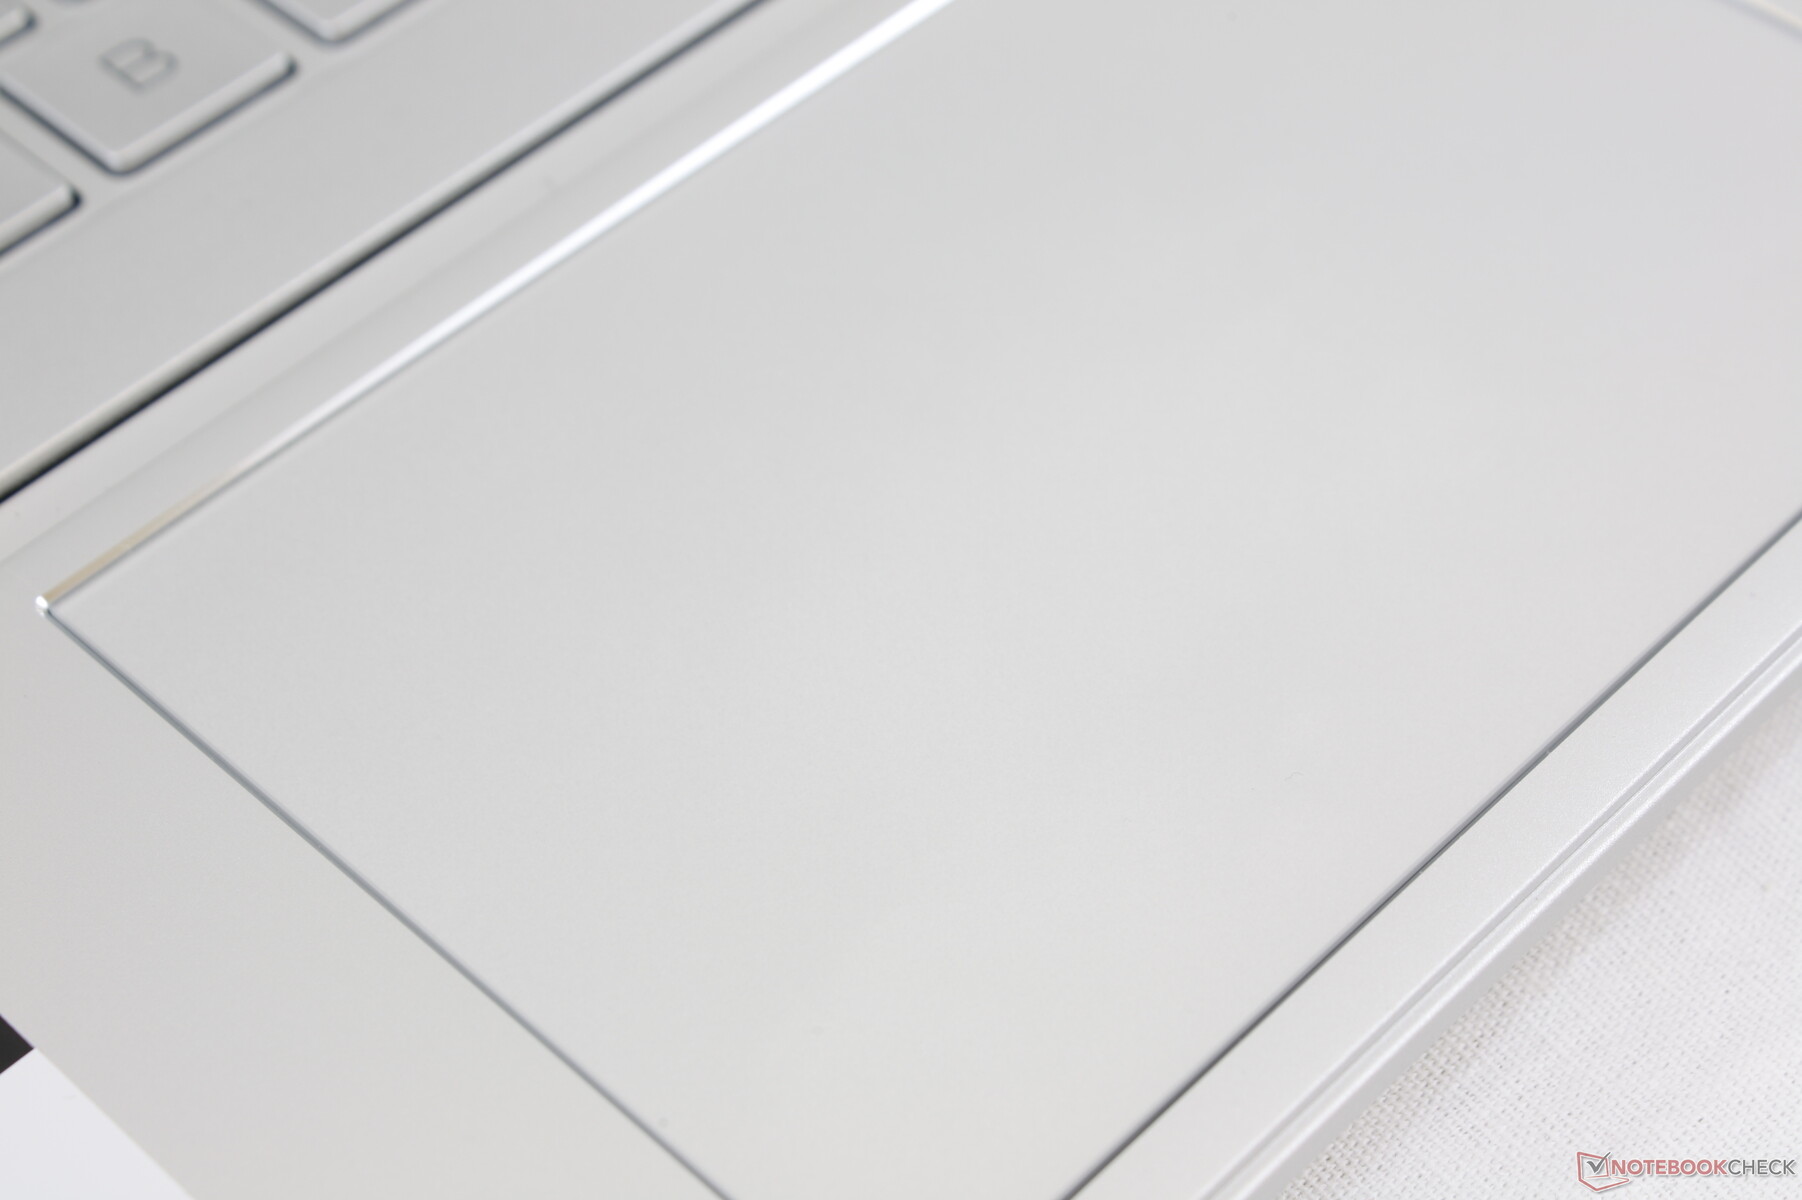
Meanwhile, the glass clickpad is spacious for a 14-inch laptop with very little sticking even if gliding at slow speeds. Its integrated mouse clicks, however, are spongy and less impressive. It would've been perfect to see the Envy 14 come with the same dedicated mouse buttons as on the EliteBook 840 G7 series.
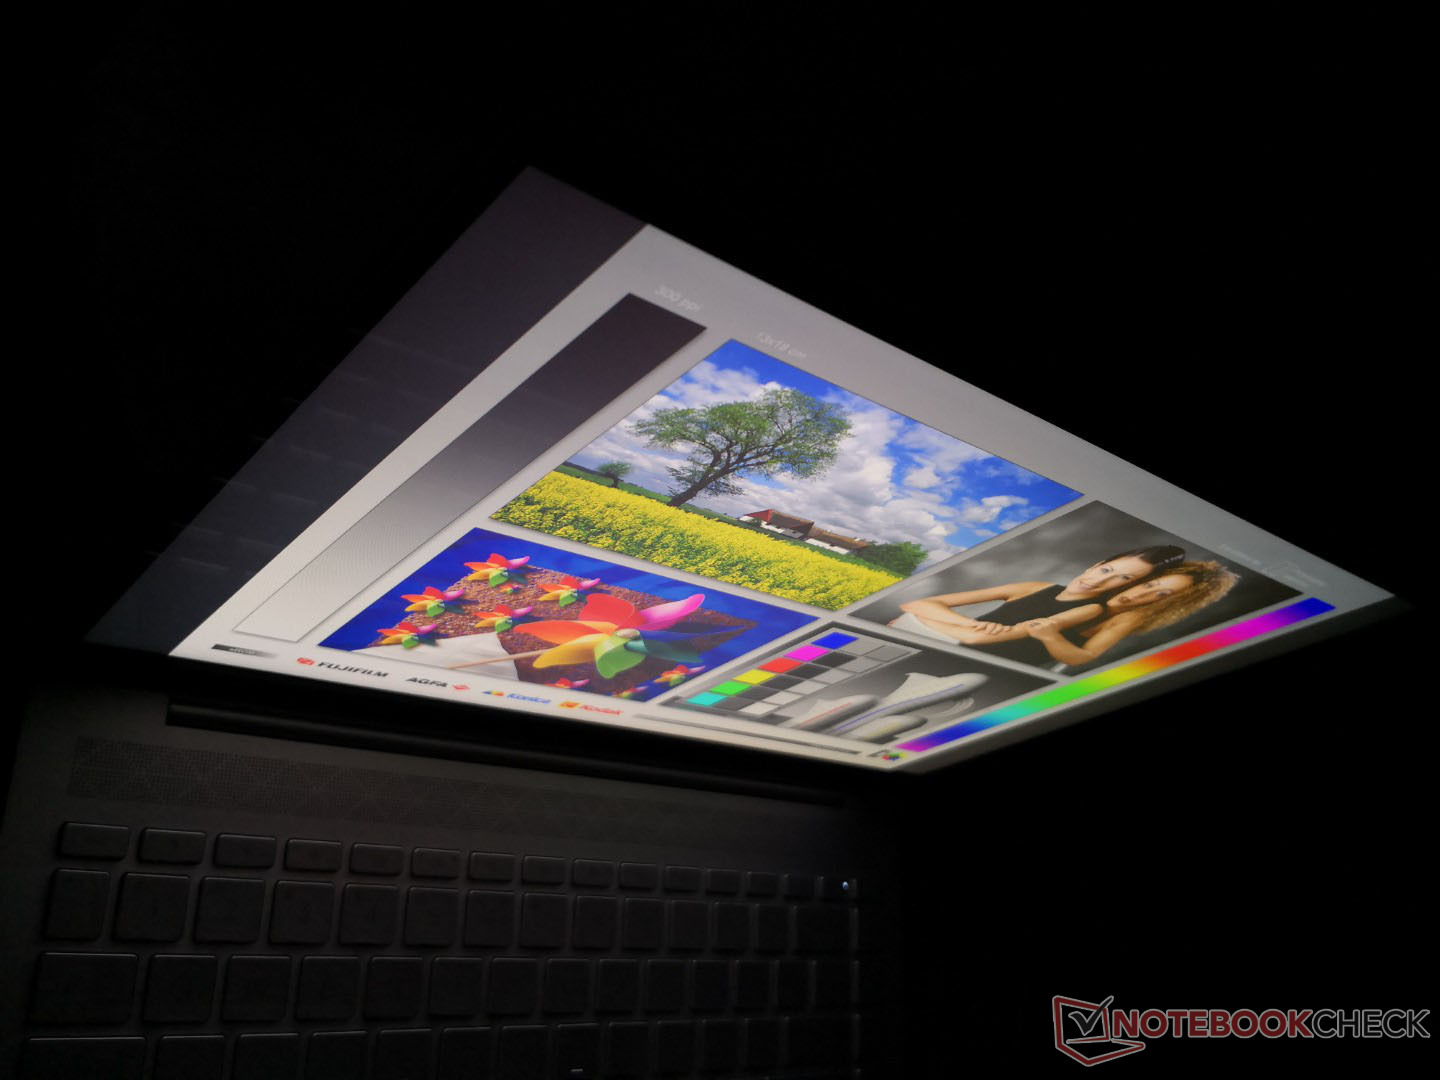
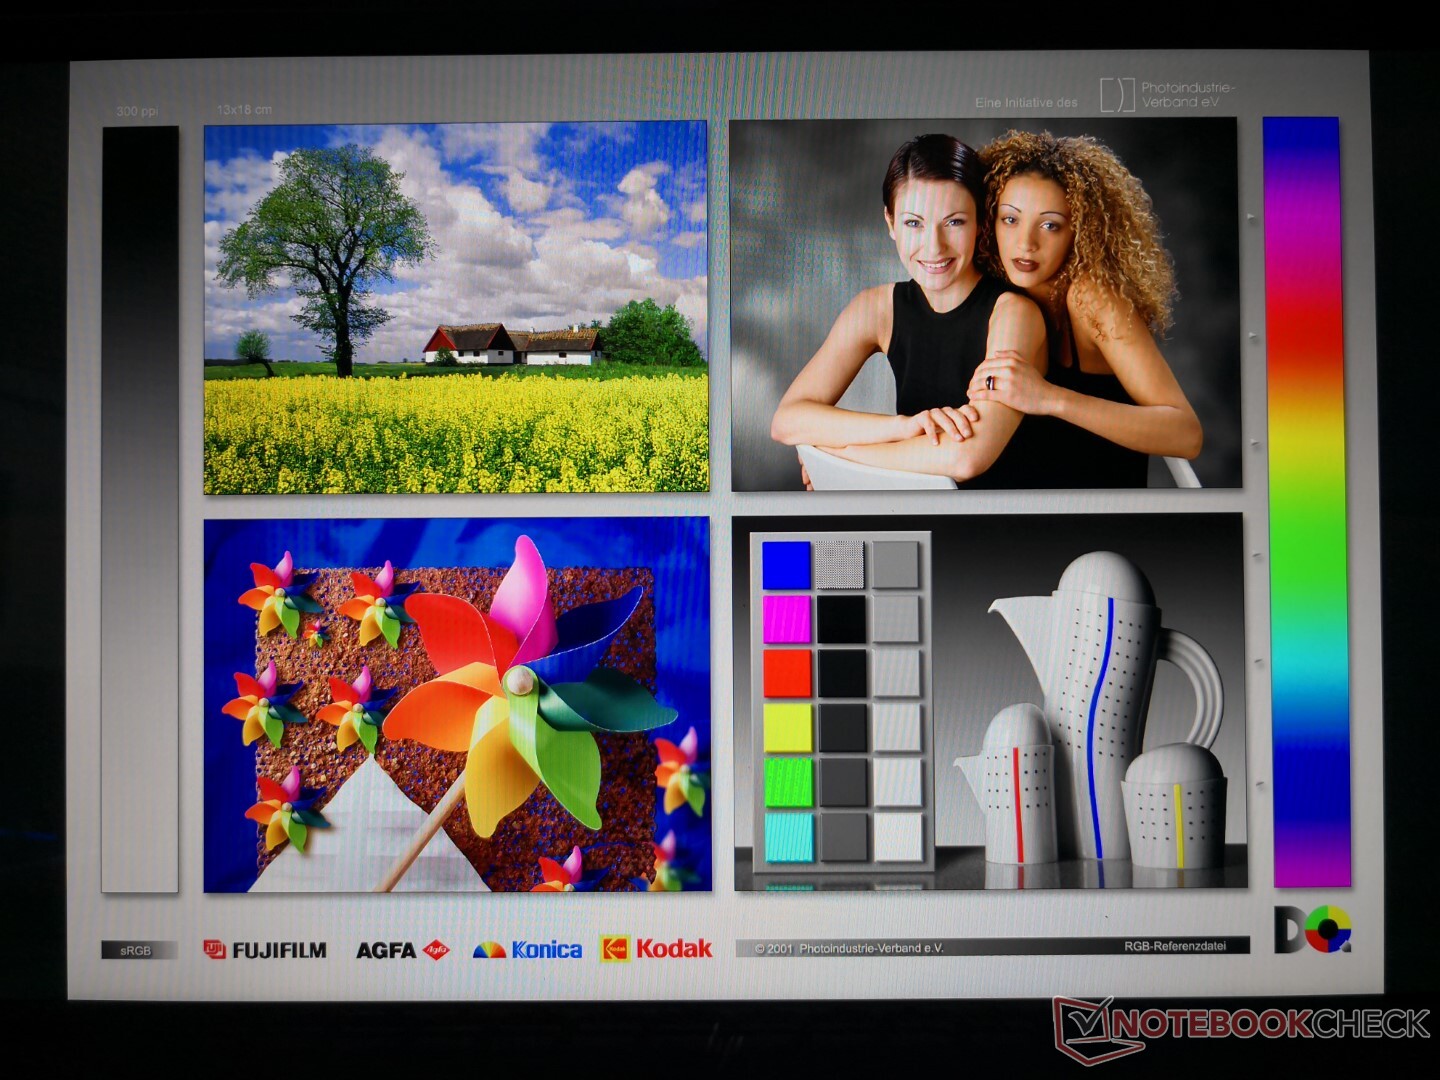
Display
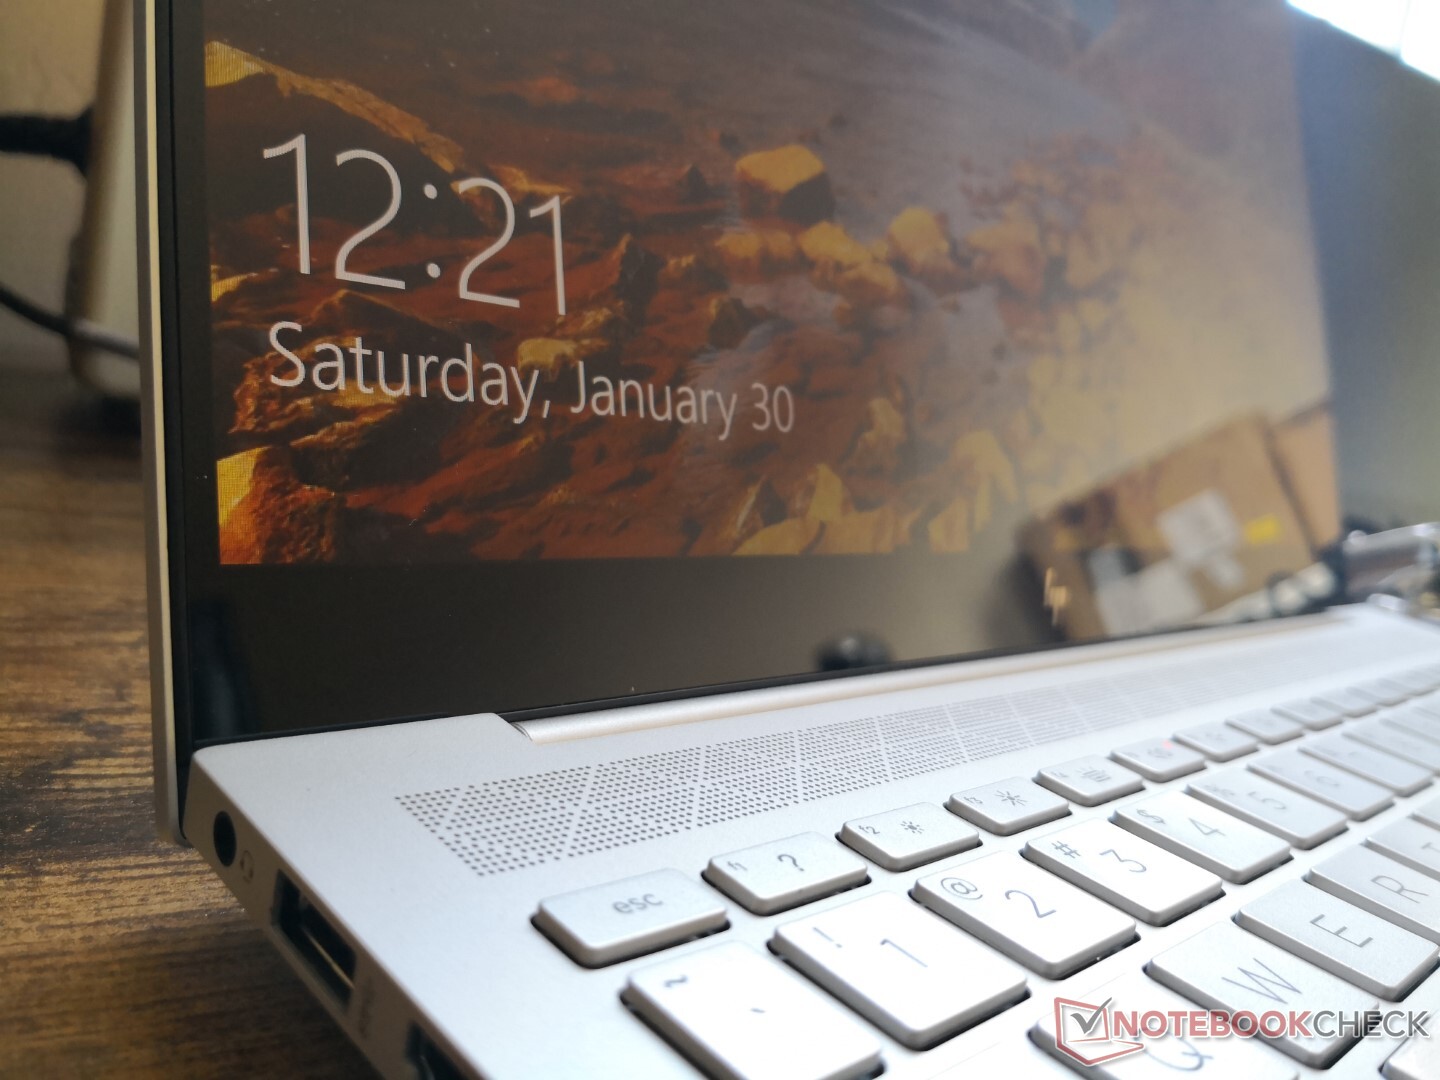
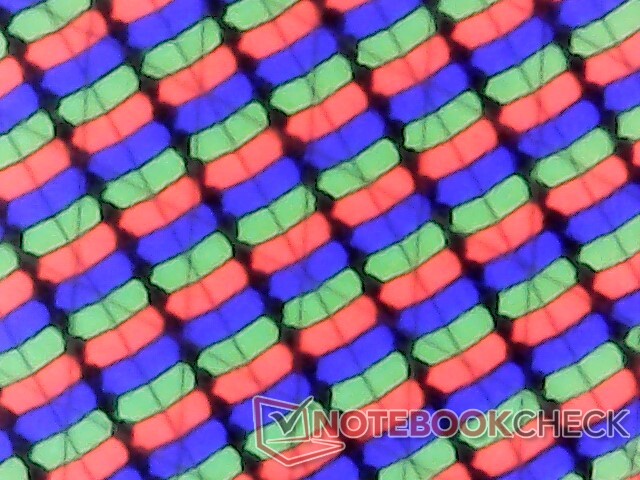
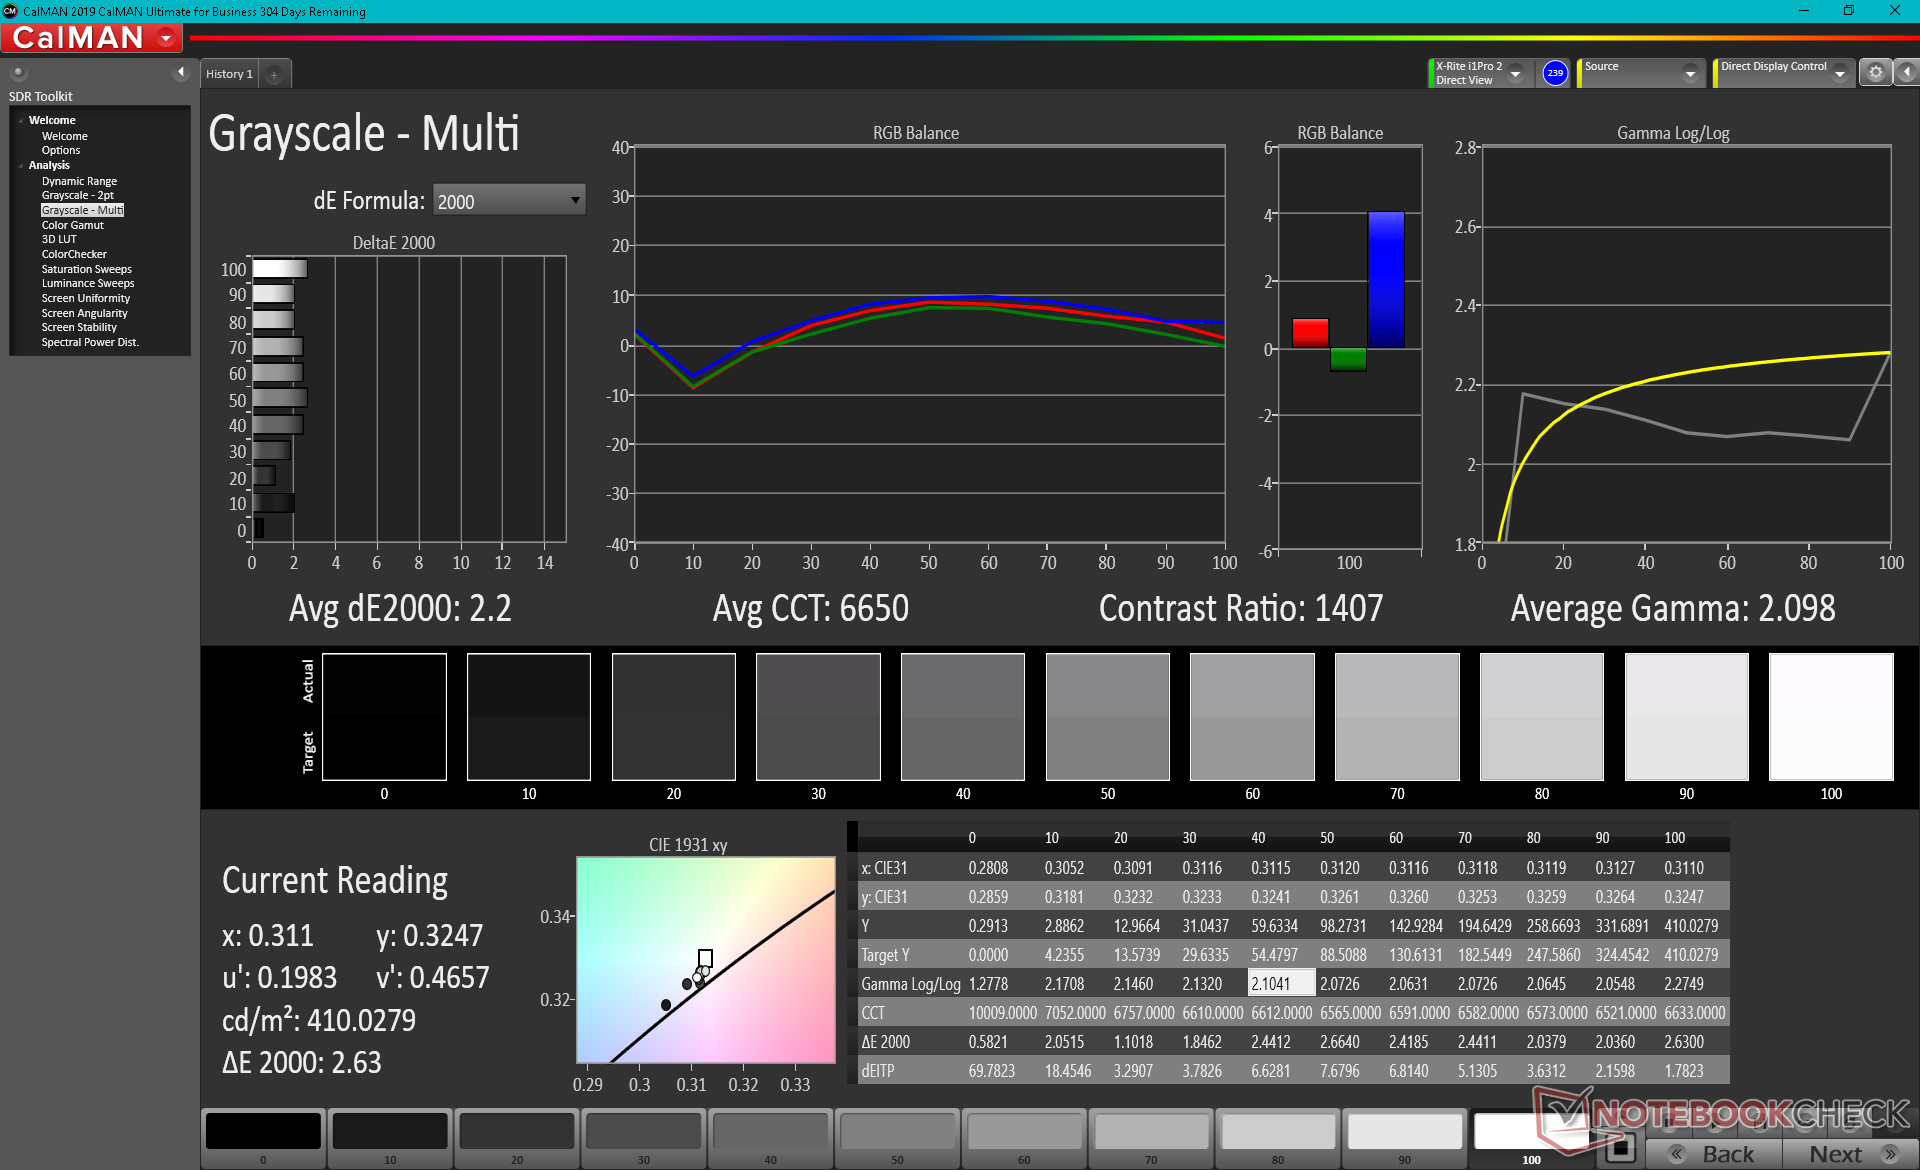
The 16:10 1200p IPS display is bright and with both excellent colors and low black levels for high quality images in line with other flagship Ultrabooks. Black-white response times are slow for noticeable ghosting, but this is a common drawback on many narrow-bezel Ultrabooks. Fast-moving 3D games like Overwatch are not recommended on this machine even though it is well-equipped to run them.
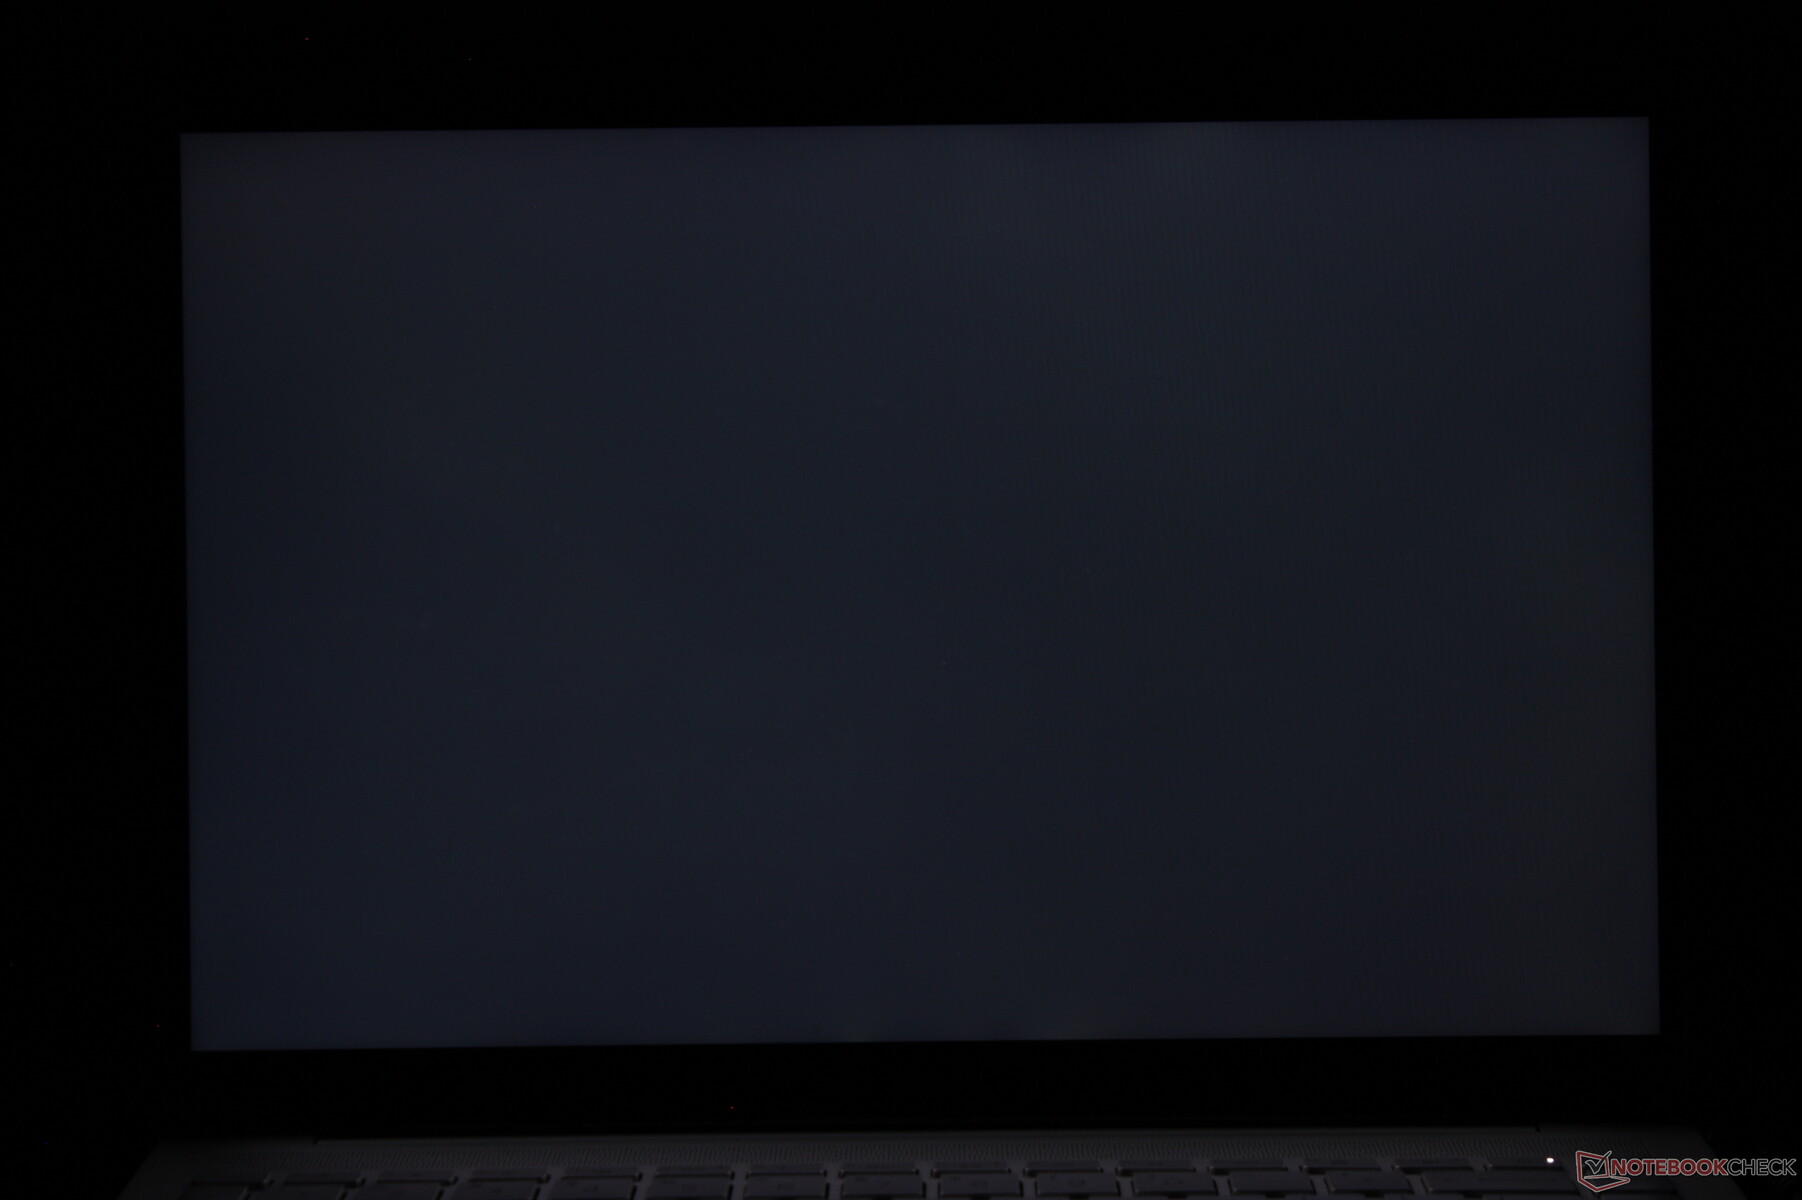
Brightness distribution could have been more uniform as the top edge of the screen is measurably brighter than the bottom edge (453 nits vs 380 nits). It's thankfully not very noticeable during use and so it's only a minor nitpick.
| |||||||||||||||||||||||||
Brightness Distribution: 81 %
Center on Battery: 412 cd/m²
Contrast: 1288:1 (Black: 0.32 cd/m²)
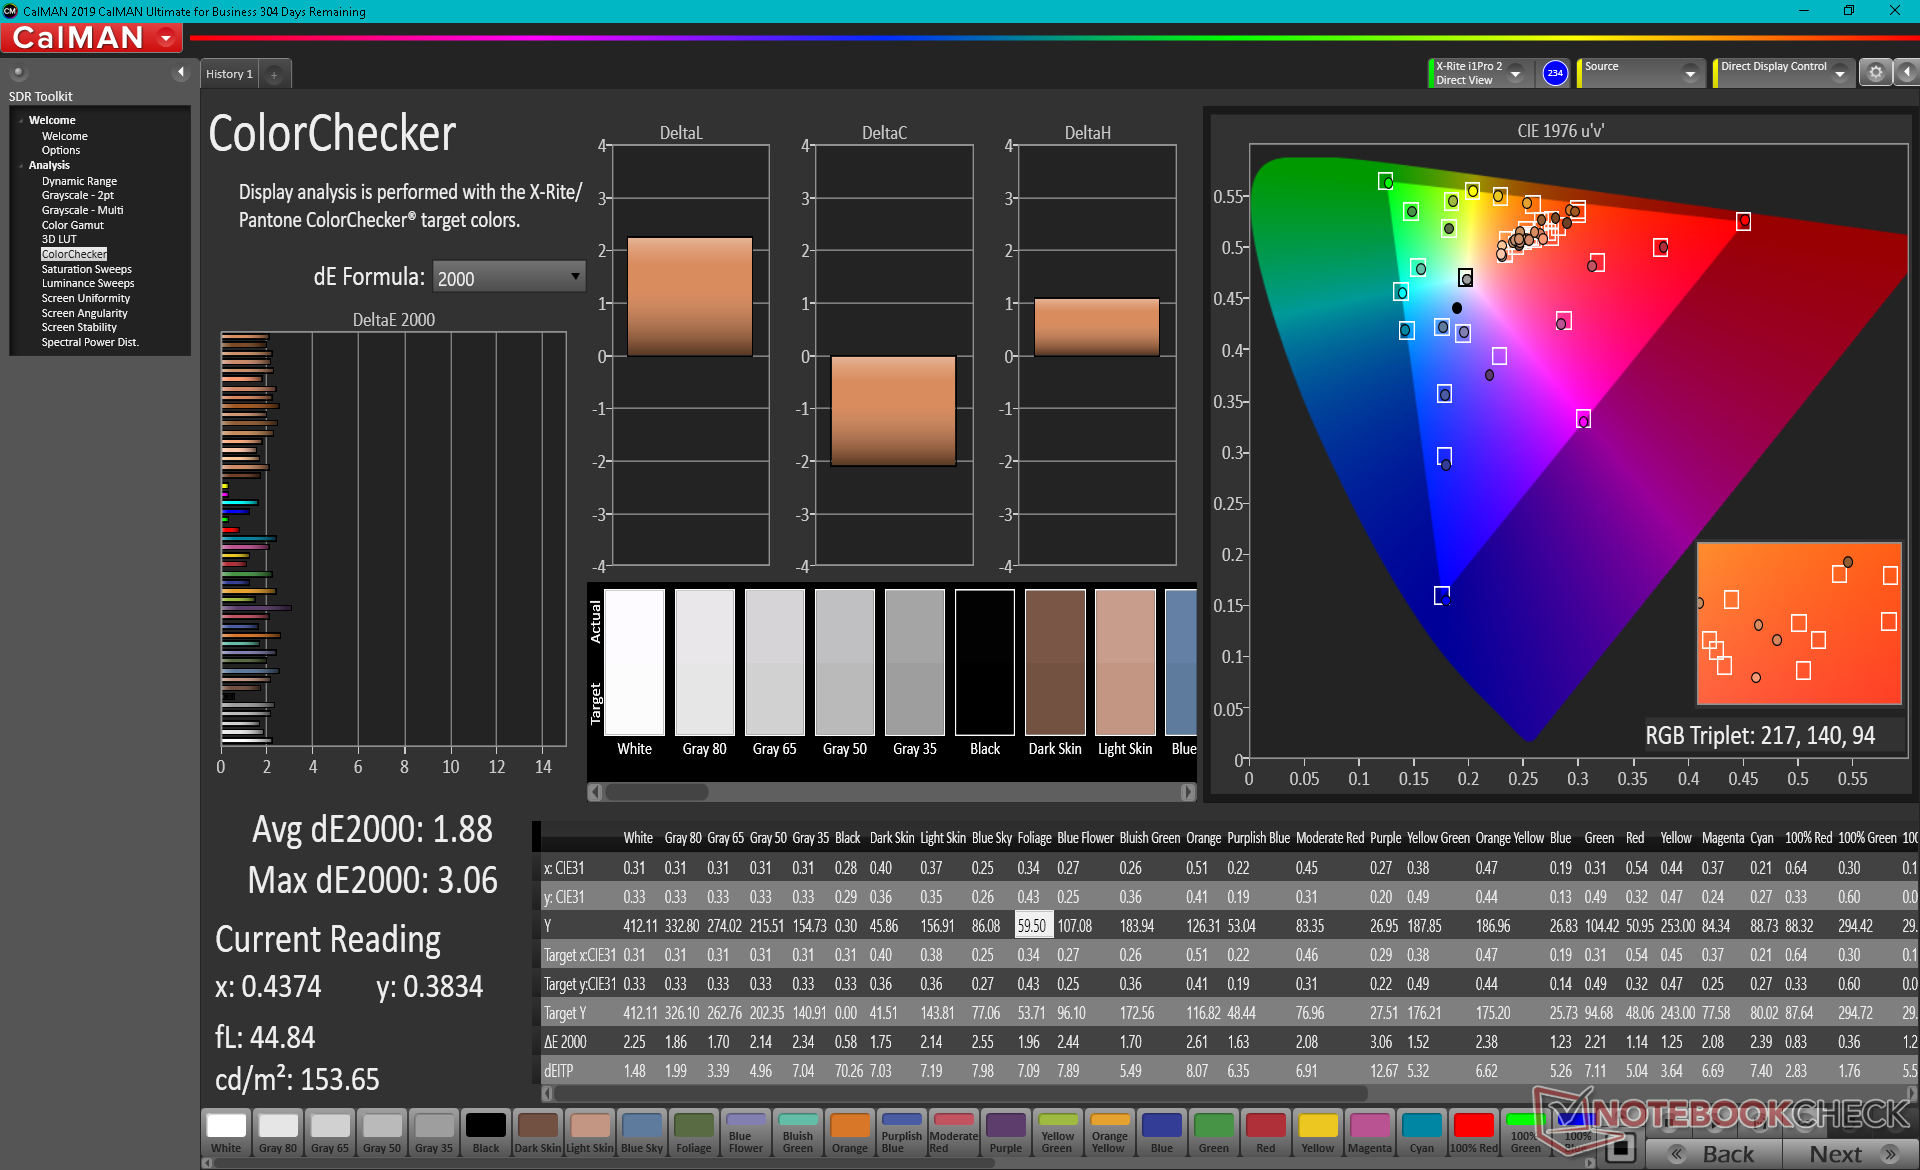
ΔE ColorChecker Calman: 1.88 | ∀{0.5-29.43 Ø4.78}
calibrated: 1.96
ΔE Greyscale Calman: 2.2 | ∀{0.09-98 Ø5}
99.8% sRGB (Argyll 1.6.3 3D)
68.7% AdobeRGB 1998 (Argyll 1.6.3 3D)
76.7% AdobeRGB 1998 (Argyll 3D)
99.8% sRGB (Argyll 3D)
77.1% Display P3 (Argyll 3D)
Gamma: 2.1
CCT: 6650 K
| HP Envy 14-eb0010nr AU Optronics AUOF392, IPS, 14", 1920x1200 | Lenovo IdeaPad Slim 9i 14ITL5 B140ZAN01.7, IPS, 14", 3840x2160 | Asus ZenBook Duo 14 UX482EA AU Optronics B140HAN06.8, IPS, 14", 1920x1080 | HP Spectre x360 14t-ea000 LG Philips LGD0663, IPS, 13.5", 1920x1280 | Dell Inspiron 14 3493-4KWCF Chi Mei 140HCA, IPS, 14", 1920x1080 | Huawei MateBook 14 2020 Intel TV140WTM-NH0, IPS LED, 14", 2160x1440 | |
|---|---|---|---|---|---|---|
| Display | 6% | -6% | -9% | -43% | -8% | |
| Display P3 Coverage (%) | 77.1 | 87.4 13% | 69 -11% | 65.8 -15% | 41.84 -46% | 67.1 -13% |
| sRGB Coverage (%) | 99.8 | 99.9 0% | 99.1 -1% | 98.2 -2% | 62.3 -38% | 99.1 -1% |
| AdobeRGB 1998 Coverage (%) | 76.7 | 81.1 6% | 71 -7% | 67.9 -11% | 43.33 -44% | 69 -10% |
| Response Times | 20% | 4% | 7% | 33% | 45% | |
| Response Time Grey 50% / Grey 80% * (ms) | 61.2 ? | 48.4 ? 21% | 56.4 ? 8% | 62 ? -1% | 41 ? 33% | 37.6 ? 39% |
| Response Time Black / White * (ms) | 46 ? | 37.2 ? 19% | 46 ? -0% | 39.6 ? 14% | 31 ? 33% | 22.4 ? 51% |
| PWM Frequency (Hz) | 2500 ? | 59520 ? | ||||
| Screen | -32% | 8% | -3% | -98% | -20% | |
| Brightness middle (cd/m²) | 412 | 475.8 15% | 361.8 -12% | 443.5 8% | 226 -45% | 458 11% |
| Brightness (cd/m²) | 392 | 463 18% | 351 -10% | 394 1% | 214 -45% | 448 14% |
| Brightness Distribution (%) | 81 | 89 10% | 90 11% | 78 -4% | 92 14% | 89 10% |
| Black Level * (cd/m²) | 0.32 | 0.44 -38% | 0.28 12% | 0.17 47% | 0.17 47% | 0.25 22% |
| Contrast (:1) | 1288 | 1081 -16% | 1292 0% | 2609 103% | 1329 3% | 1832 42% |
| Colorchecker dE 2000 * | 1.88 | 3.81 -103% | 1.44 23% | 2.7 -44% | 5.21 -177% | 3.4 -81% |
| Colorchecker dE 2000 max. * | 3.06 | 6.96 -127% | 3.3 -8% | 4.36 -42% | 22.15 -624% | 6.7 -119% |
| Colorchecker dE 2000 calibrated * | 1.96 | 2.55 -30% | 1.24 37% | 2.61 -33% | 4.43 -126% | 1.7 13% |
| Greyscale dE 2000 * | 2.2 | 4.1 -86% | 1.3 41% | 3.4 -55% | 3.27 -49% | 4.9 -123% |
| Gamma | 2.1 105% | 2.14 103% | 2.15 102% | 2.09 105% | 2.36 93% | 2.16 102% |
| CCT | 6650 98% | 6564 99% | 6411 101% | 6144 106% | 6538 99% | 7704 84% |
| Color Space (Percent of AdobeRGB 1998) (%) | 68.7 | 72.4 5% | 64.9 -6% | 62.1 -10% | 40 -42% | 63.5 -8% |
| Color Space (Percent of sRGB) (%) | 99.8 | 99.9 0% | 99.3 -1% | 98.5 -1% | 62 -38% | 99.1 -1% |
| Total Average (Program / Settings) | -2% /
-18% | 2% /
5% | -2% /
-3% | -36% /
-72% | 6% /
-10% |
* ... smaller is better
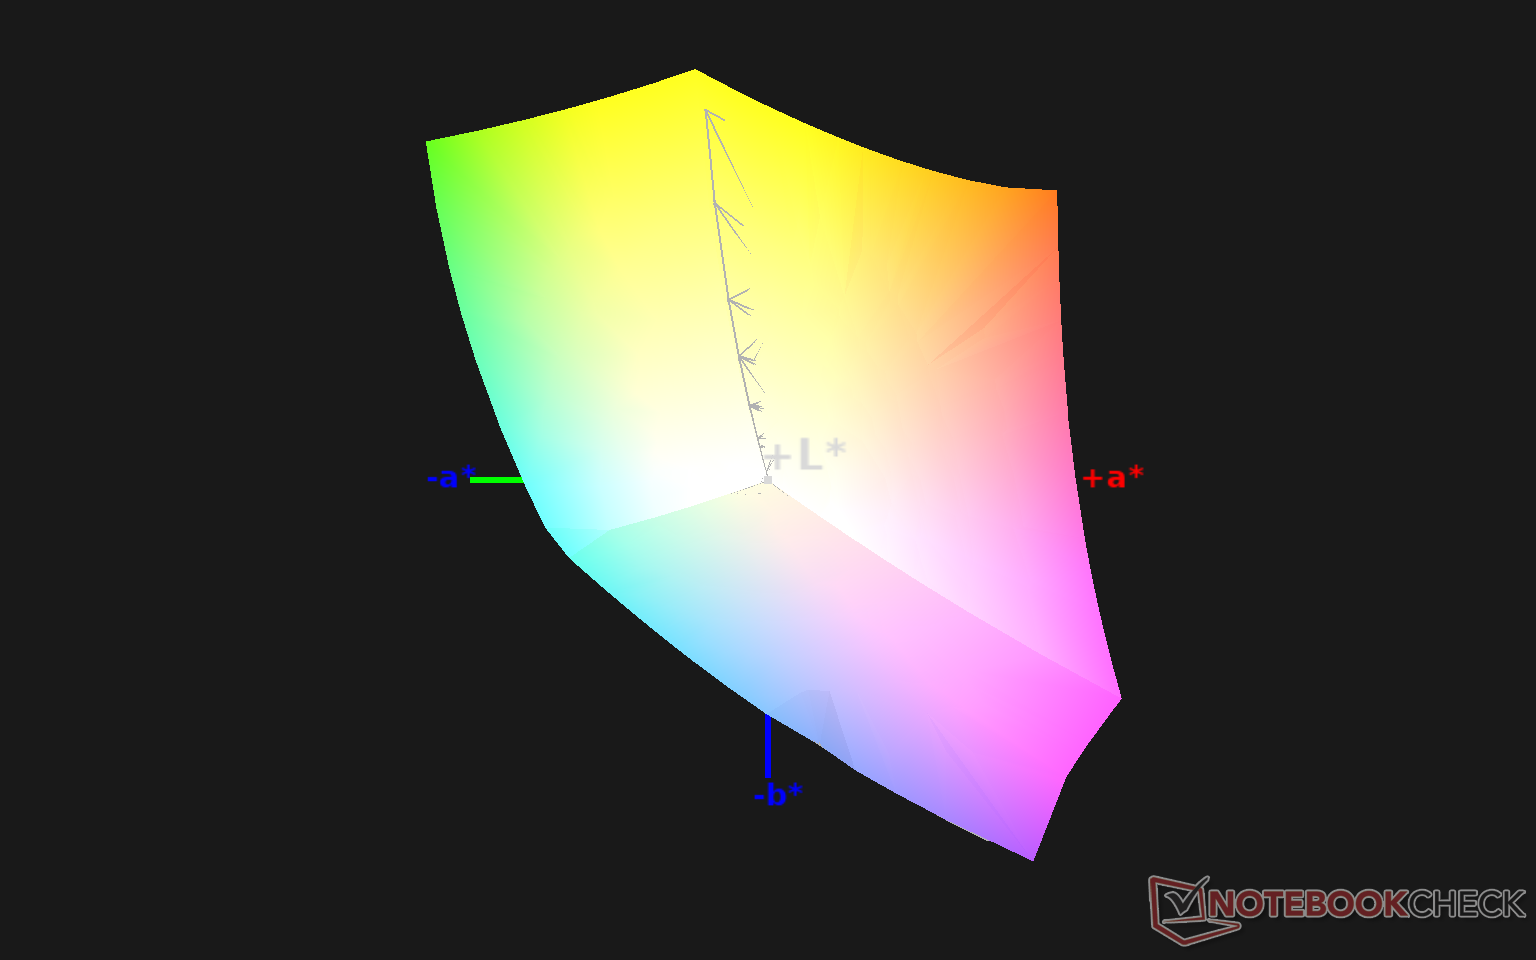
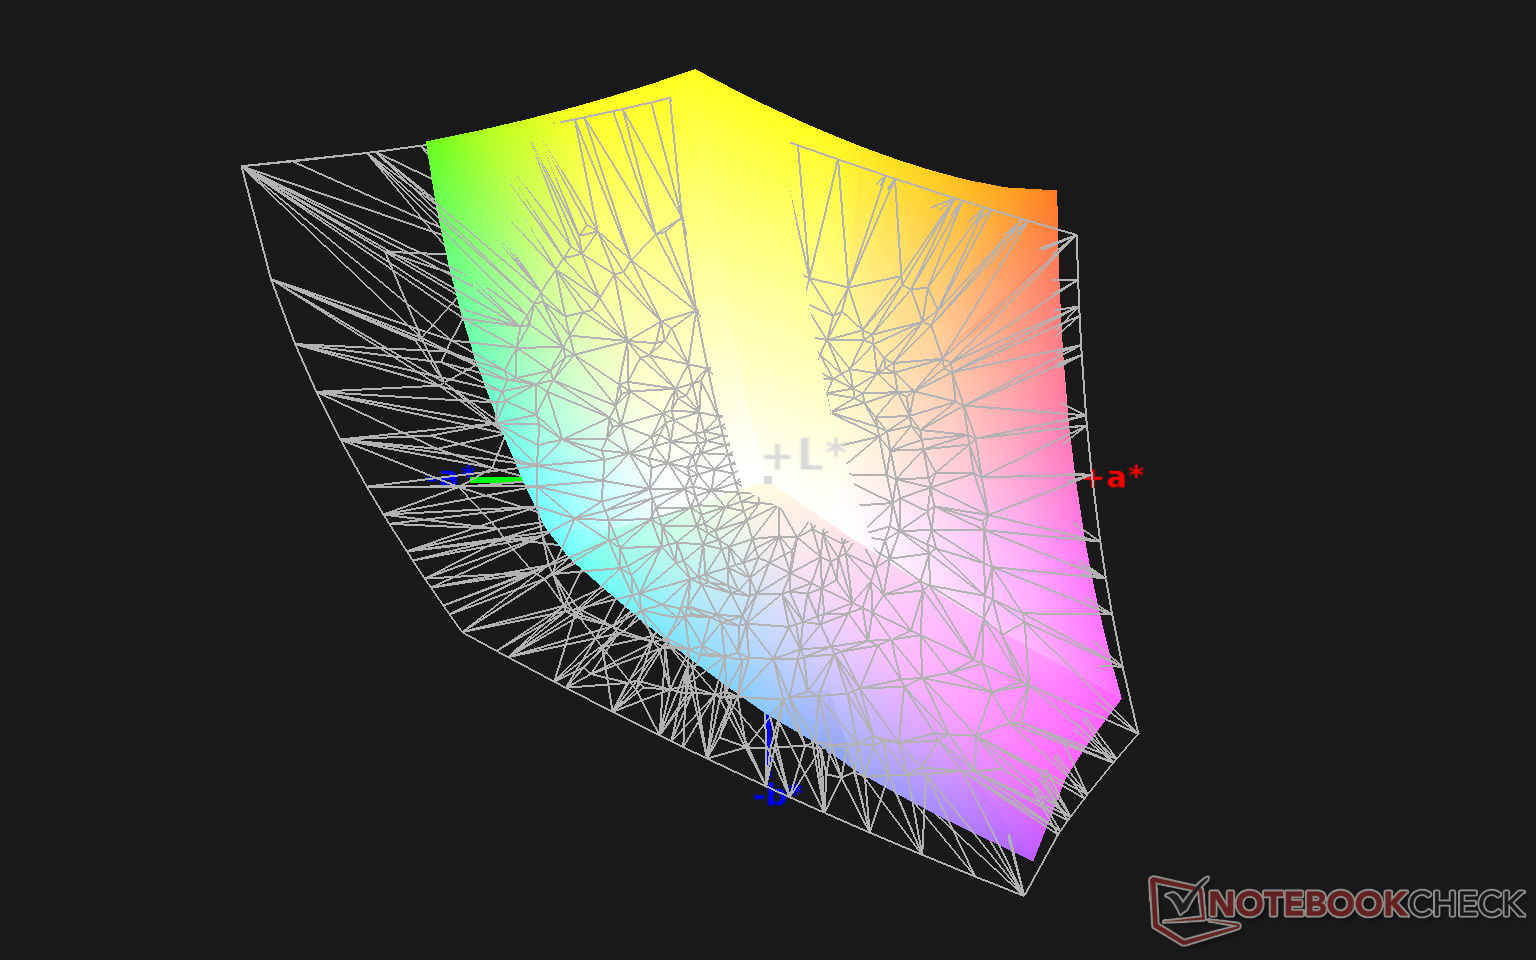
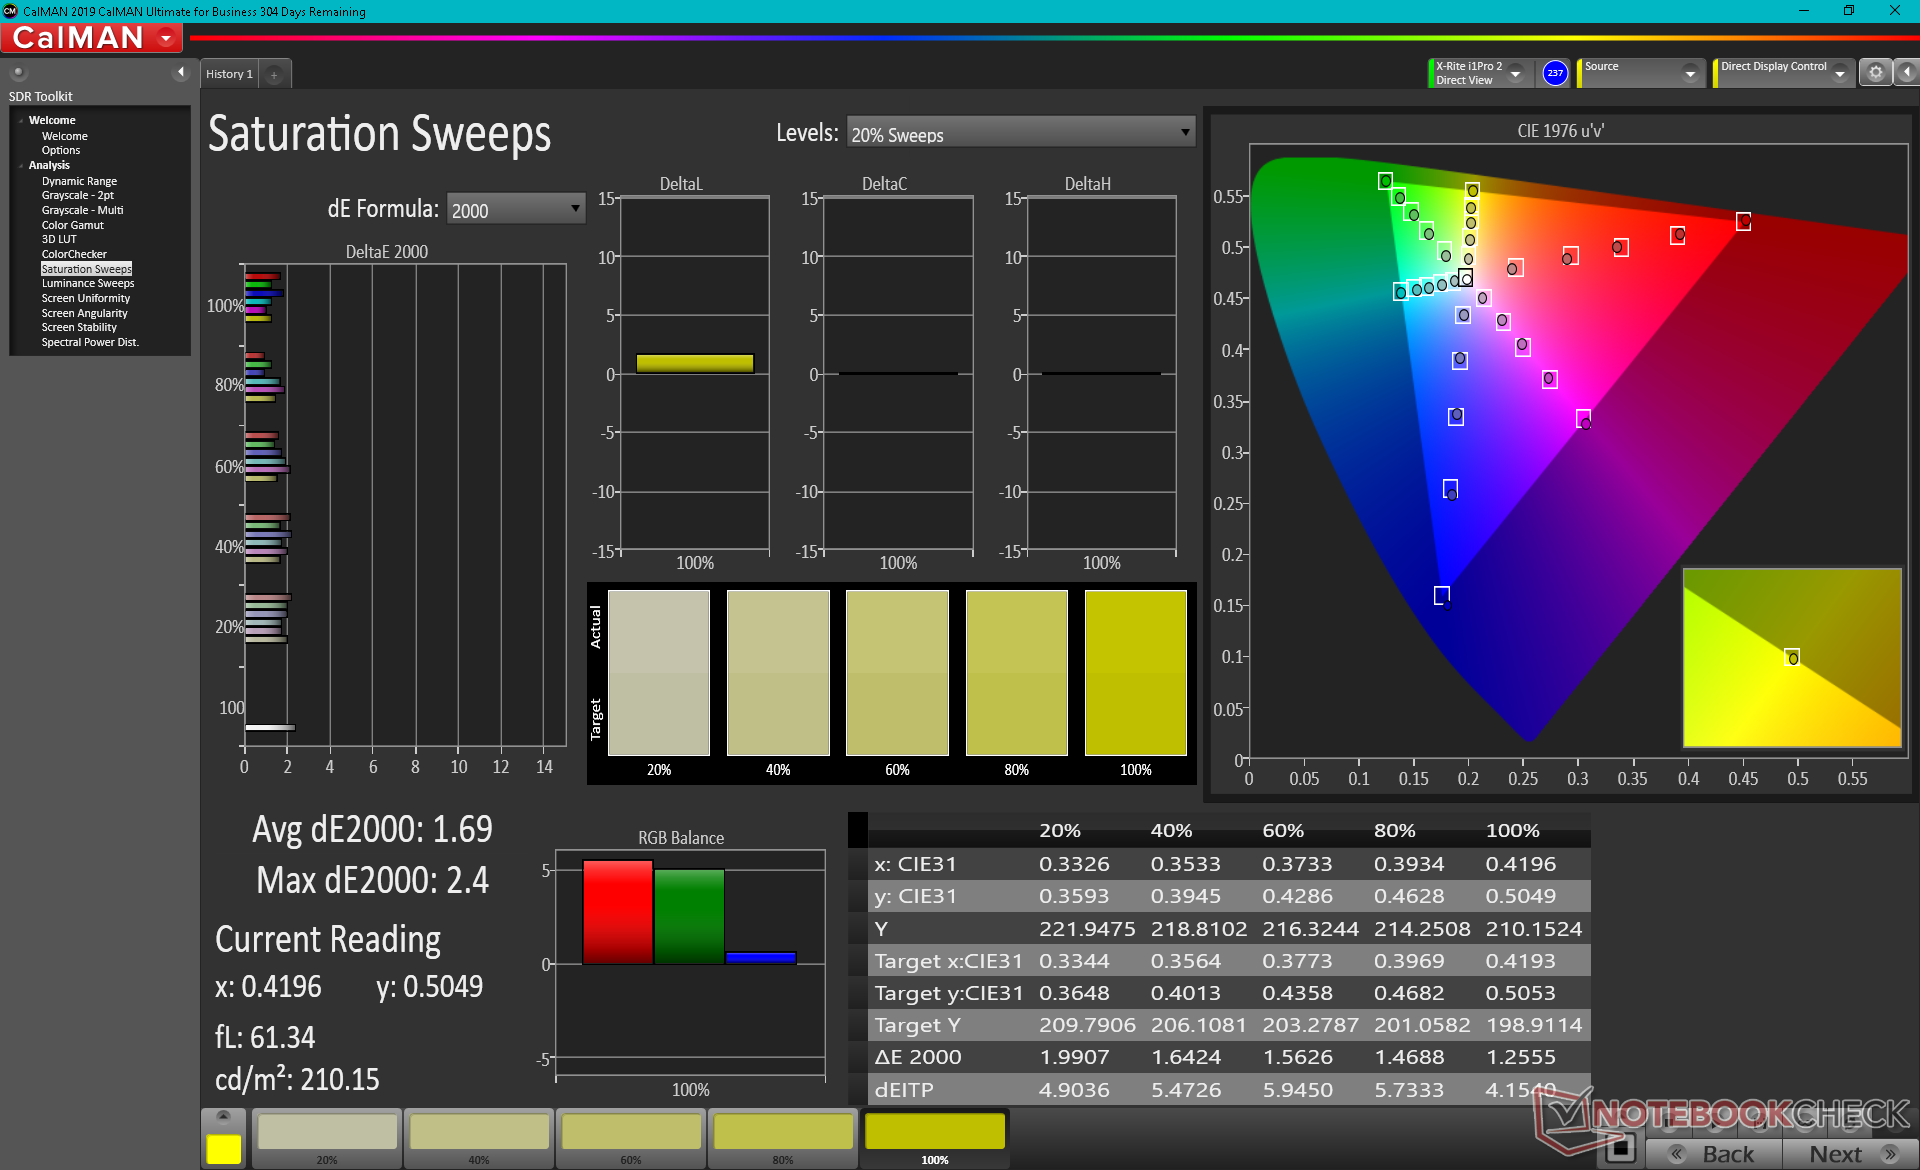
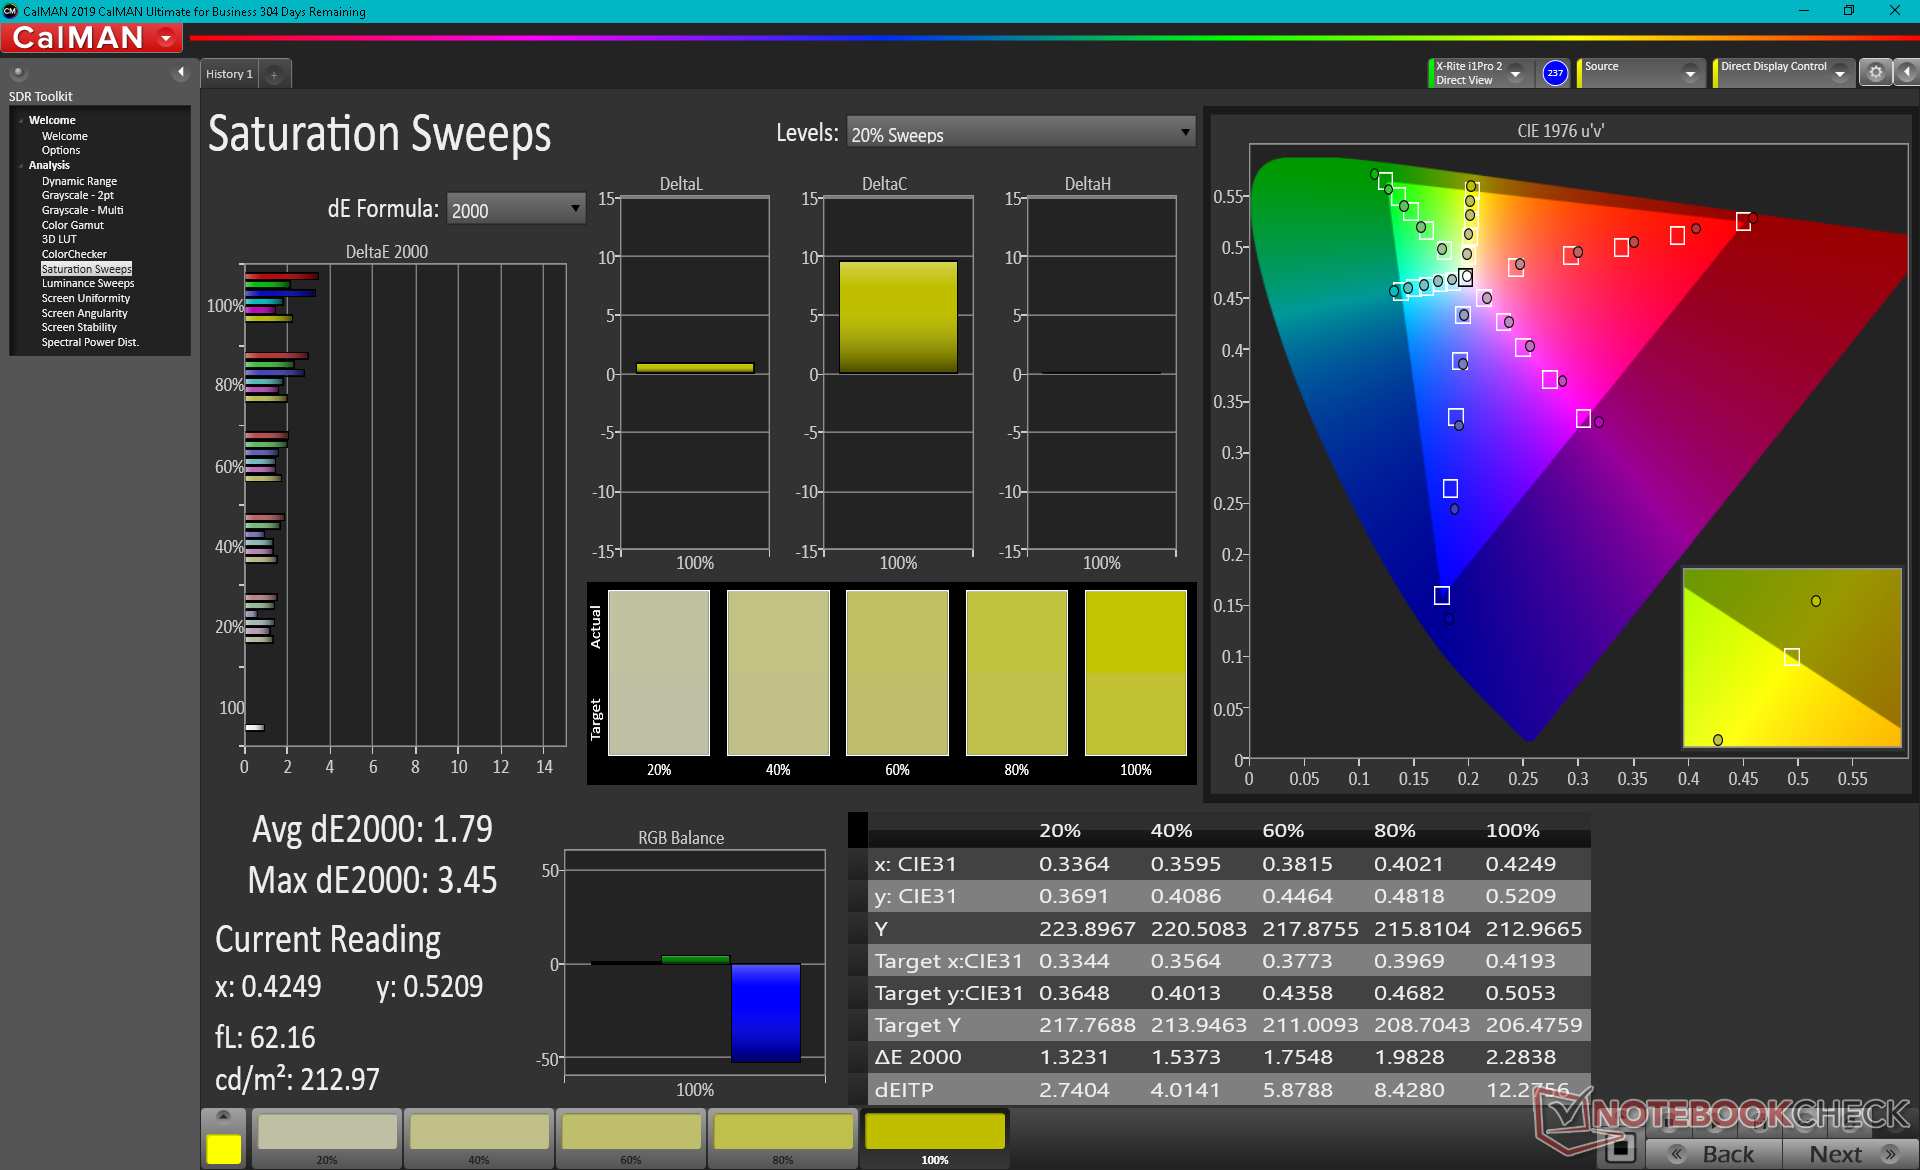
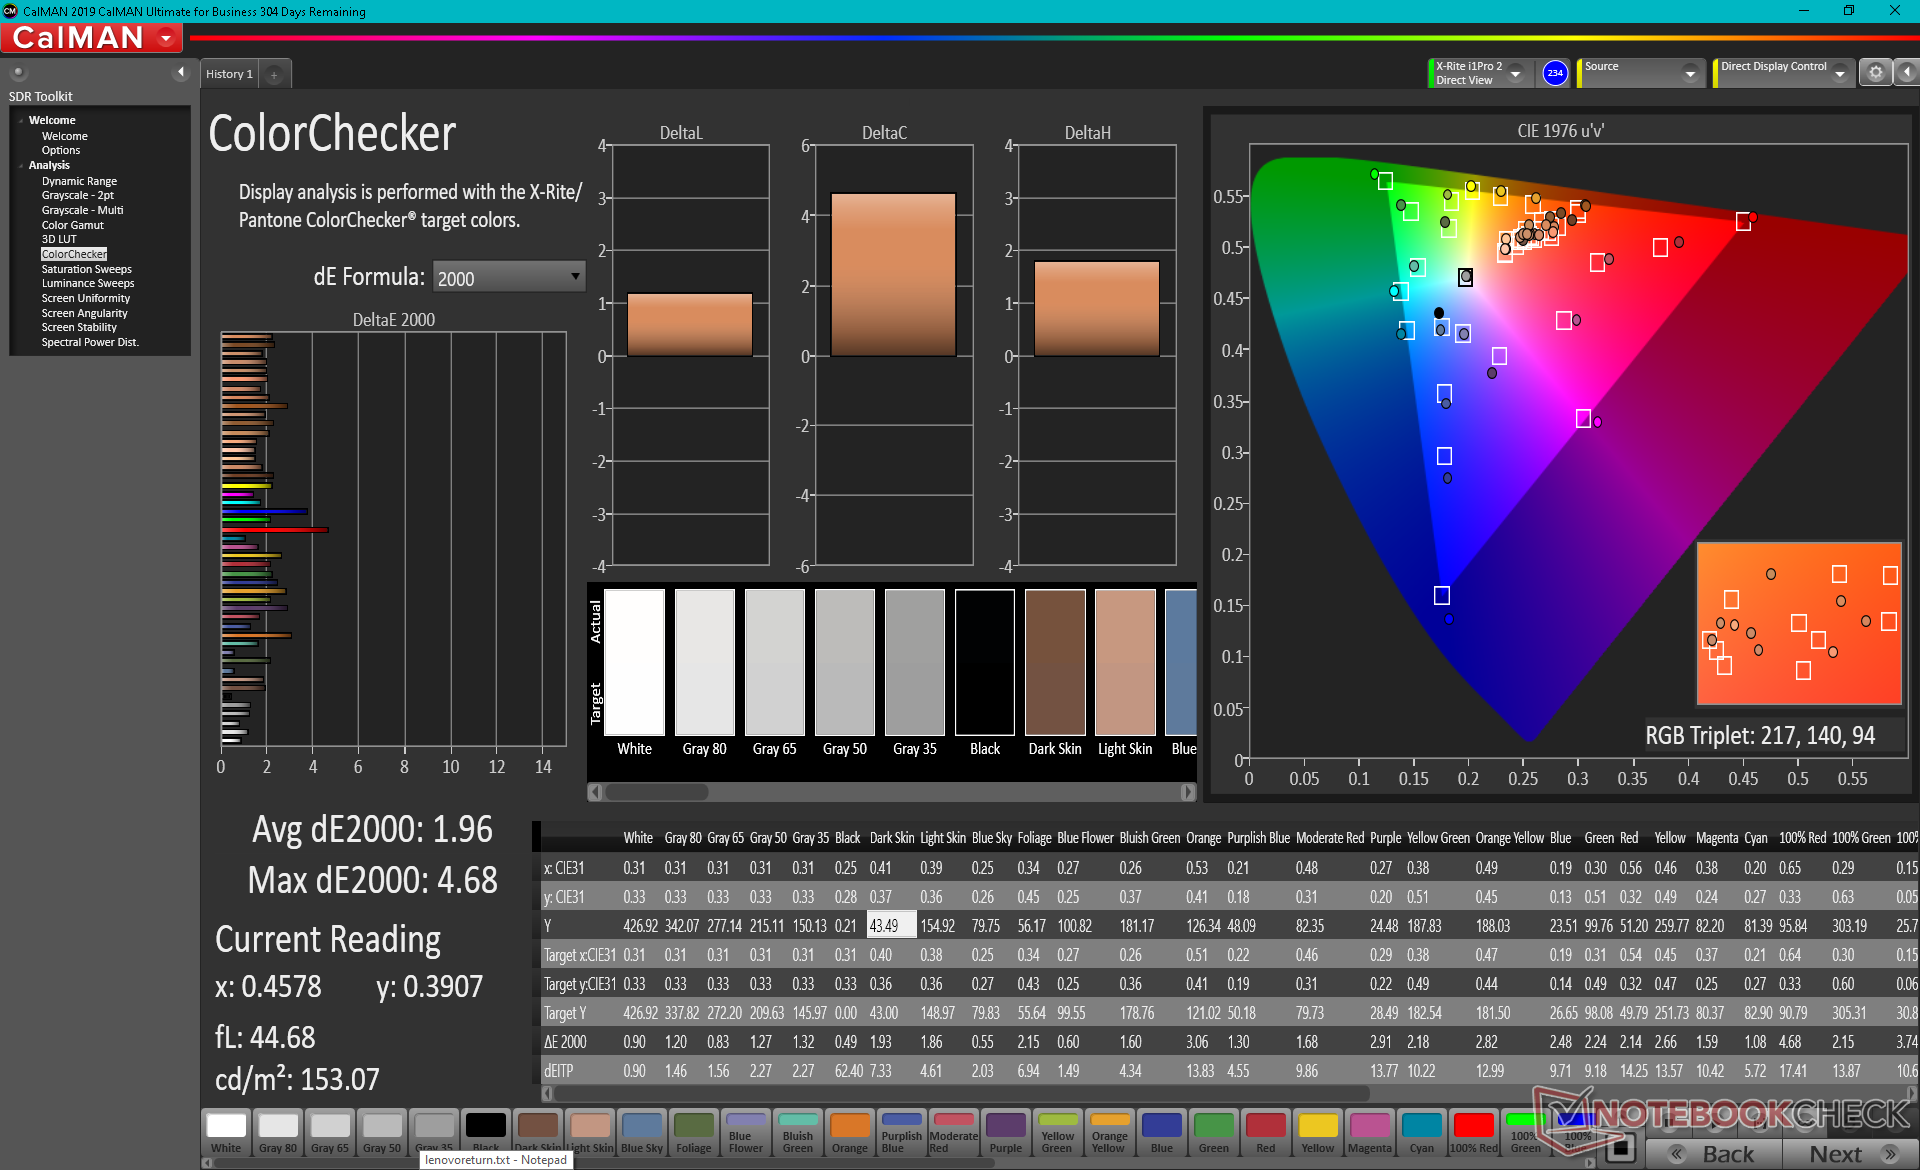
Color space covers 69 percent of AdobeRGB and essentially all of sRGB to be similar to most flagship Ultrabooks. Users demanding DCI-P3 or AdobeRGB coverage will have to look at the larger Envy 15 or Spectre x360 15 instead as no such options are available on the Envy 14.
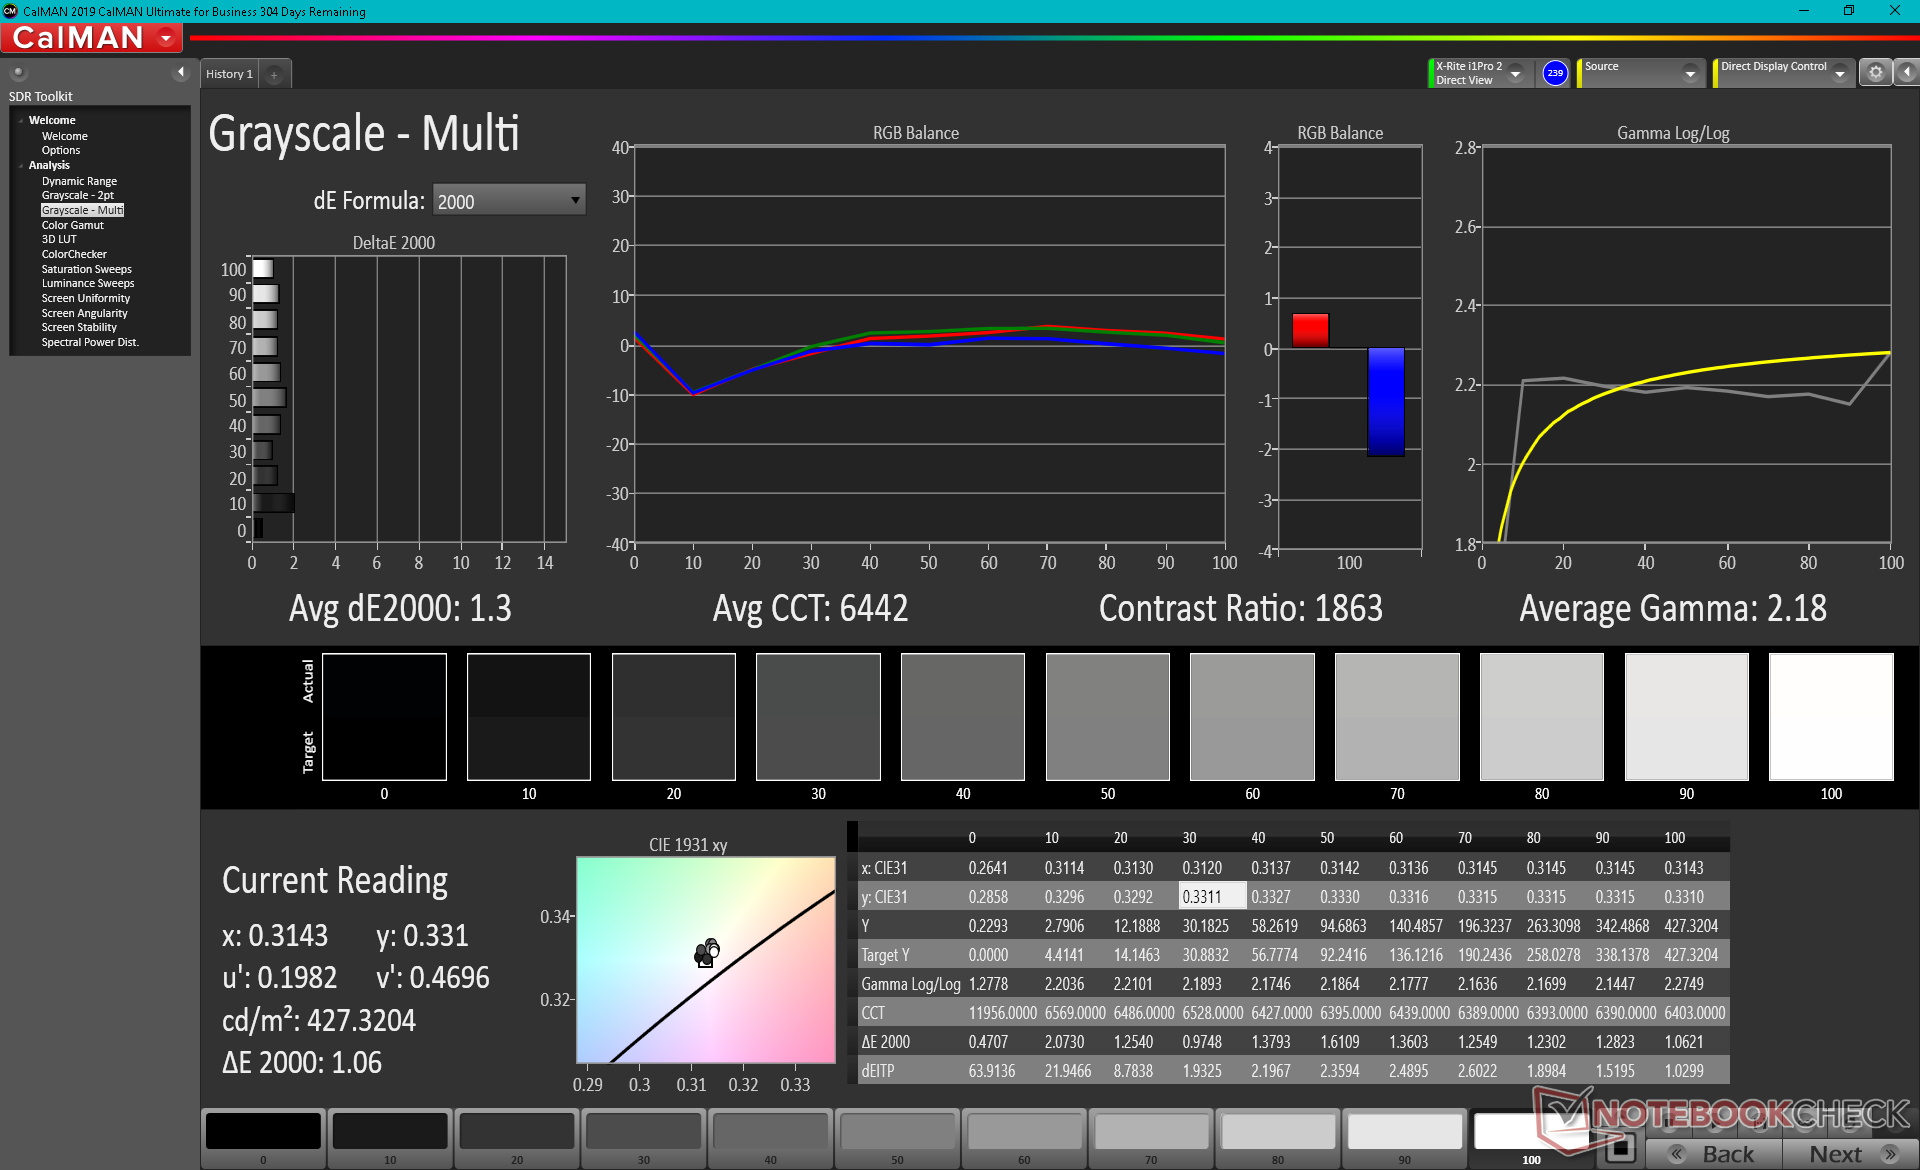
The panel comes pre-calibrated out-of-the-box and so no end-user tinkering is required to get the most out of the display. Grayscale and color deltaE values are excellent at just 2.2 and 1.88, respectively.
Display Response Times
| ↔ Response Time Black to White | ||
|---|---|---|
| 46 ms ... rise ↗ and fall ↘ combined | ↗ 24 ms rise | 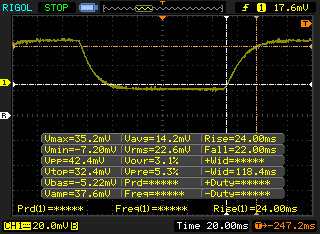 |
| ↘ 22 ms fall | ||
| The screen shows slow response rates in our tests and will be unsatisfactory for gamers. In comparison, all tested devices range from 0.1 (minimum) to 240 (maximum) ms. » 99 % of all devices are better. This means that the measured response time is worse than the average of all tested devices (20.2 ms). | ||
| ↔ Response Time 50% Grey to 80% Grey | ||
| 61.2 ms ... rise ↗ and fall ↘ combined | ↗ 30 ms rise | 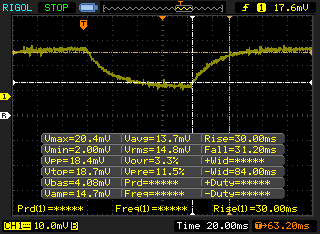 |
| ↘ 31.2 ms fall | ||
| The screen shows slow response rates in our tests and will be unsatisfactory for gamers. In comparison, all tested devices range from 0.165 (minimum) to 636 (maximum) ms. » 96 % of all devices are better. This means that the measured response time is worse than the average of all tested devices (31.6 ms). | ||
Screen Flickering / PWM (Pulse-Width Modulation)
| Screen flickering / PWM not detected | 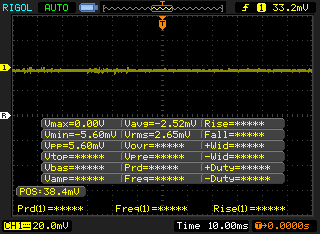 | ||
In comparison: 53 % of all tested devices do not use PWM to dim the display. If PWM was detected, an average of 8108 (minimum: 5 - maximum: 343500) Hz was measured. | |||
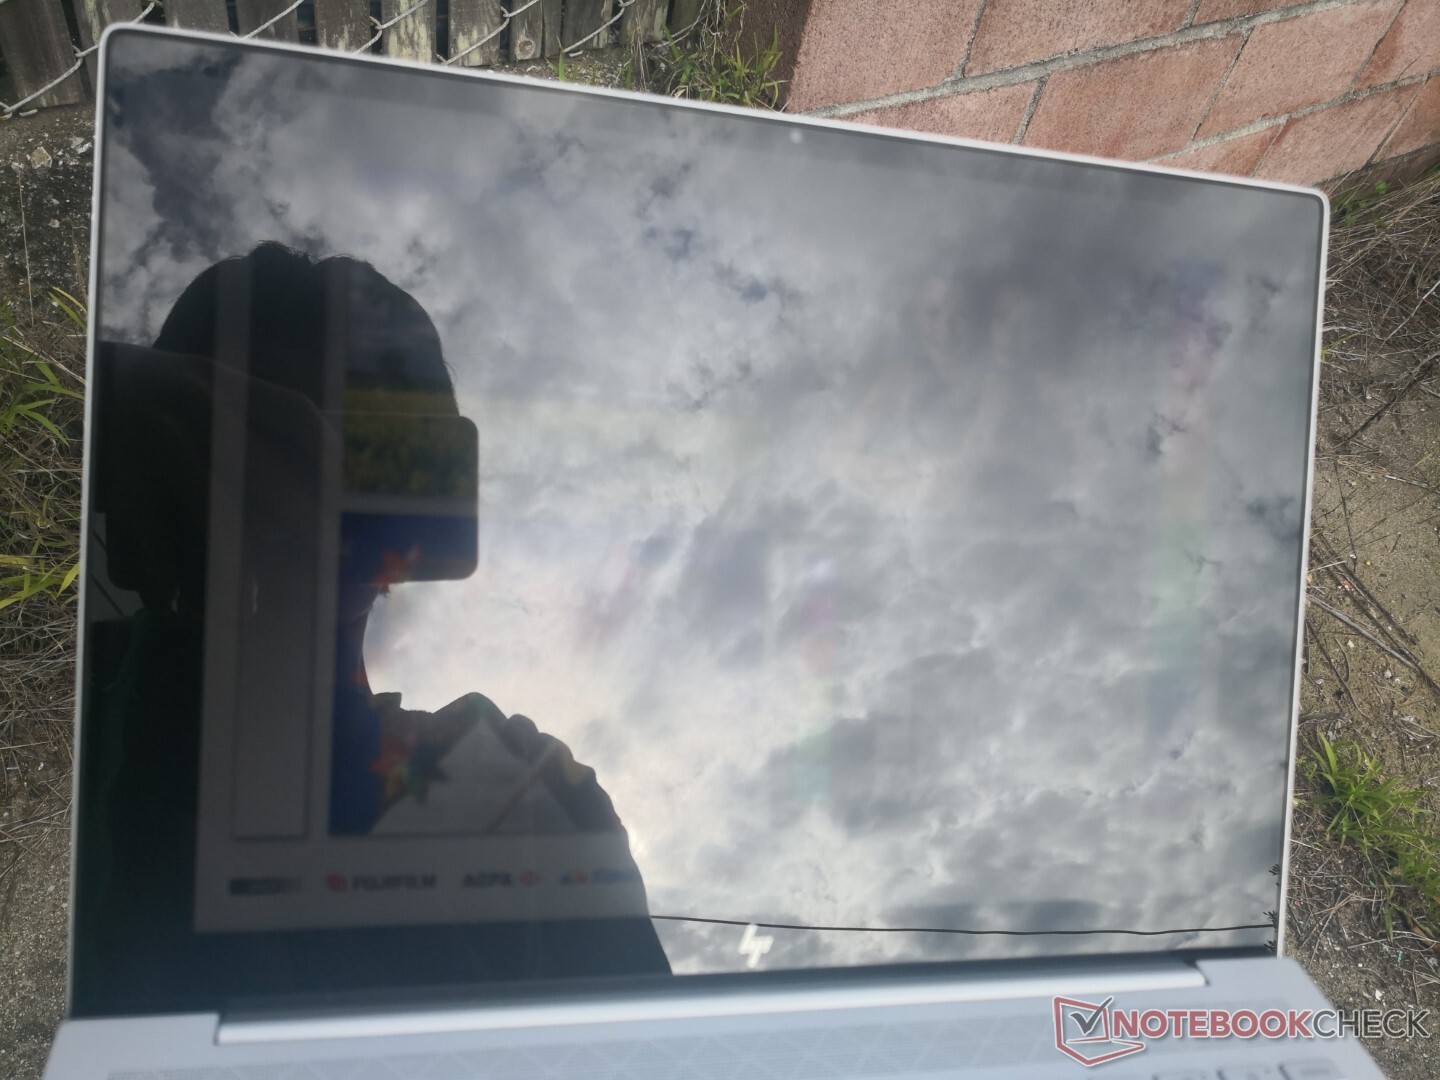
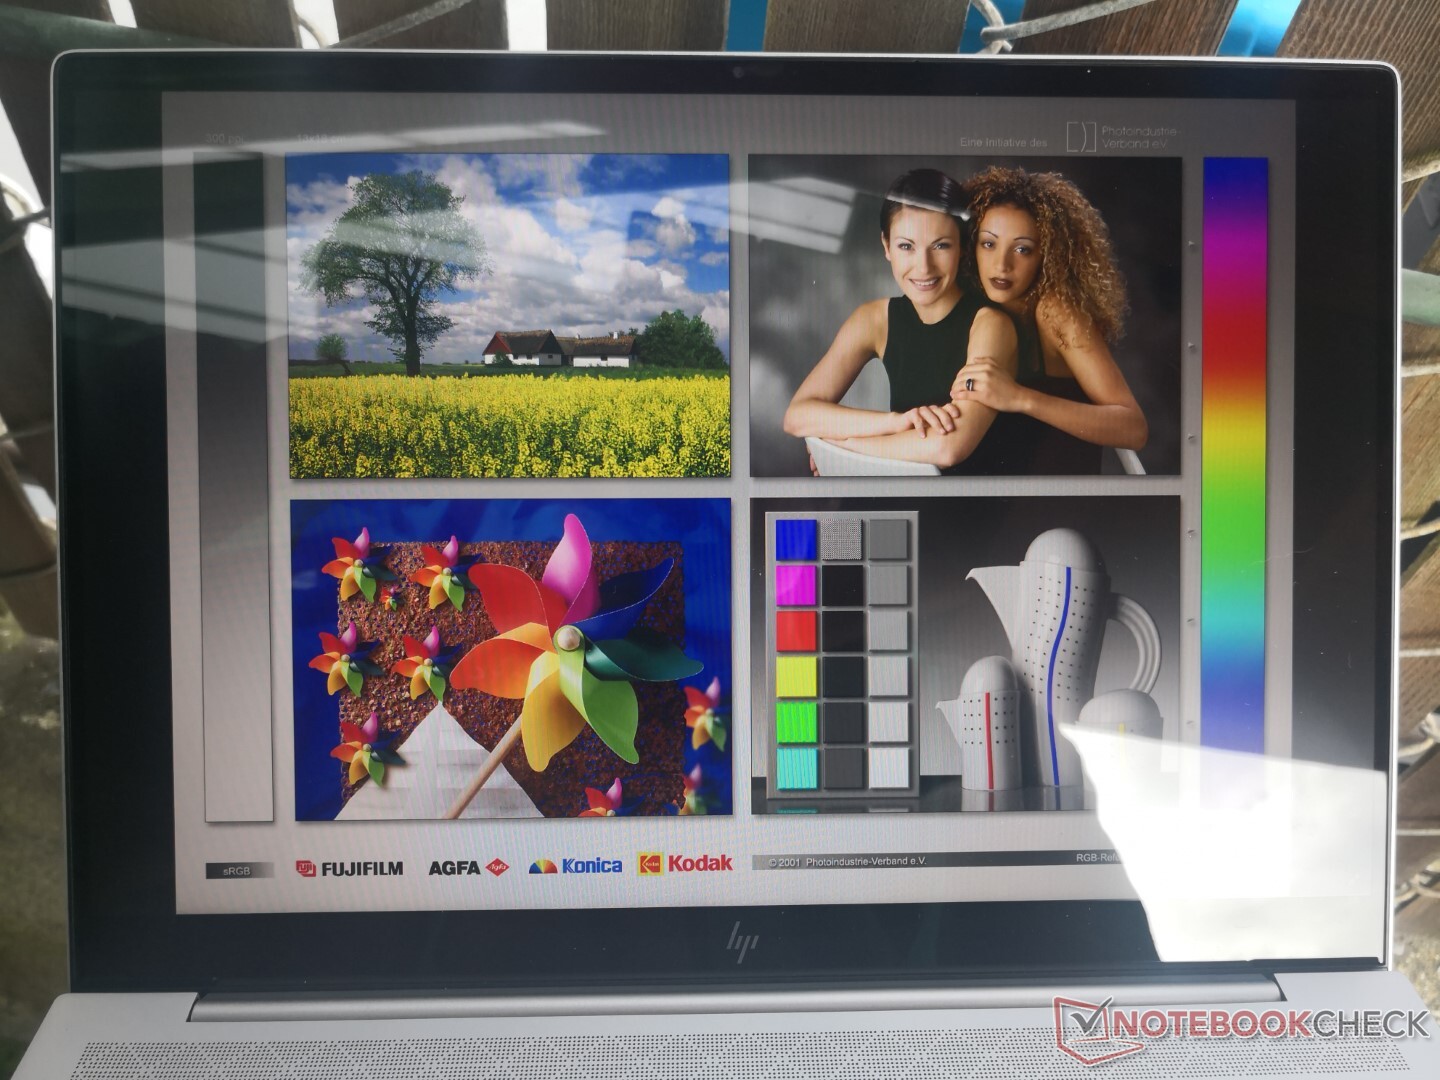
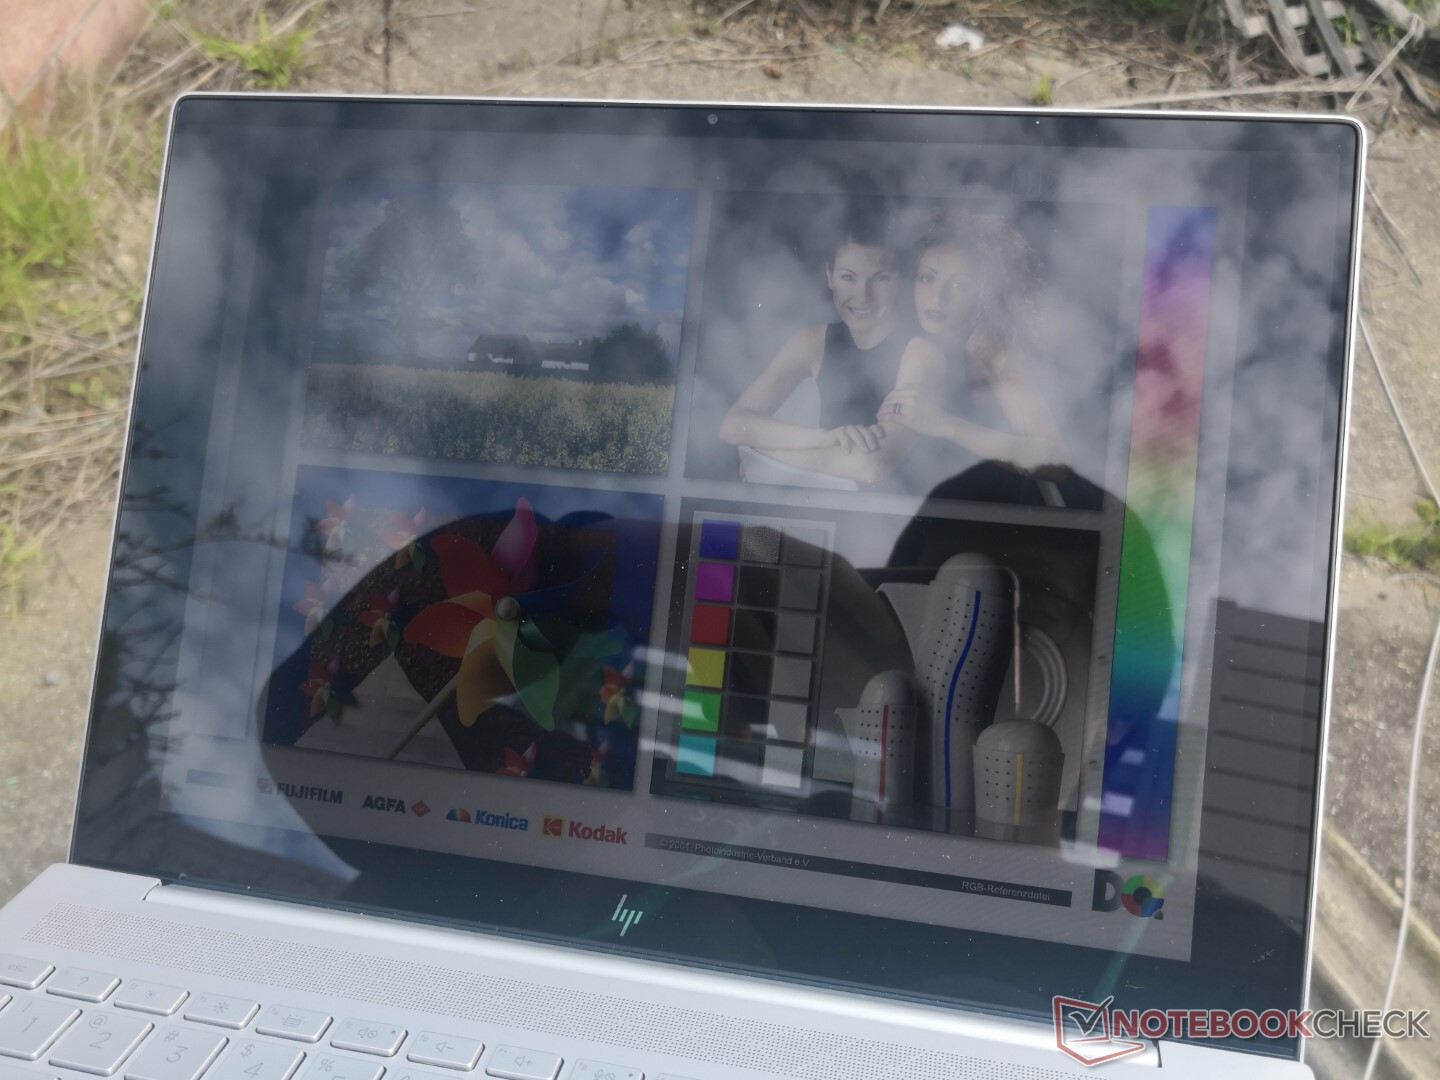
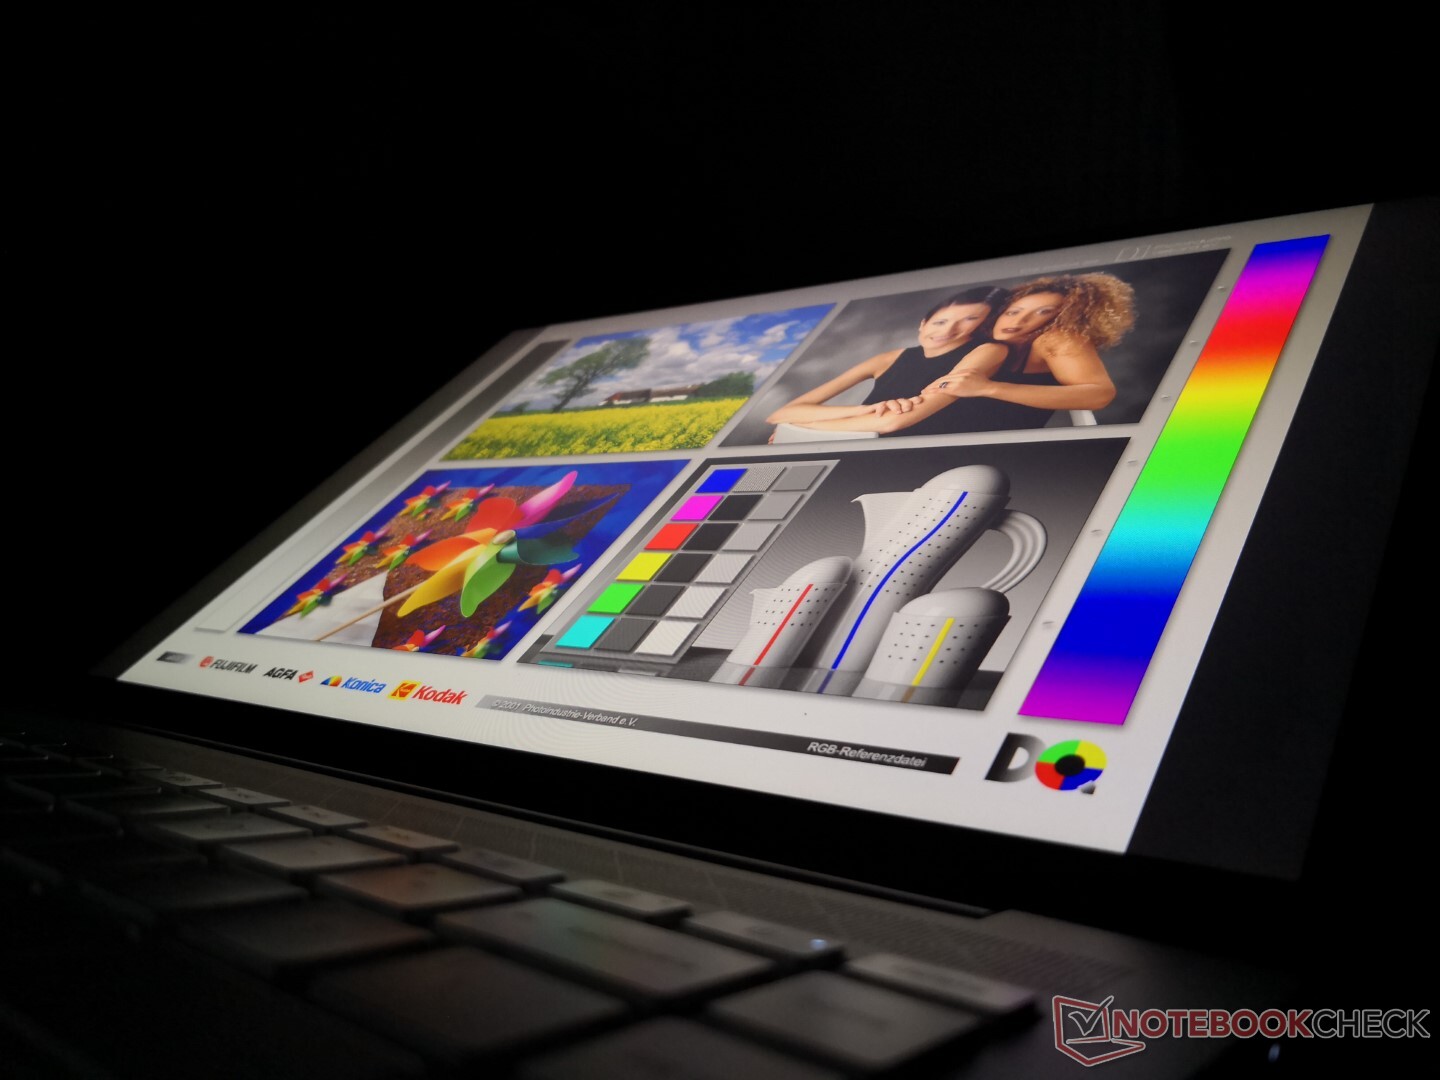
Though the display is sufficiently bright for indoor conditions, outdoor visibility is merely average due to the glossy overlay. Expect a lot of glare even if working under shade. Keep in mind that maximum brightness on battery power will automatically drop unless if the Display Power Settings is toggled off via Intel Graphics Command Center.
Performance
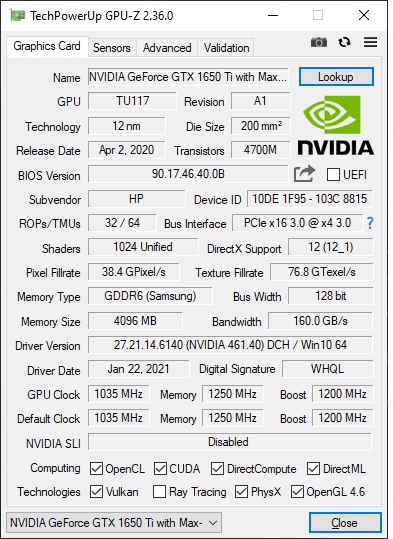
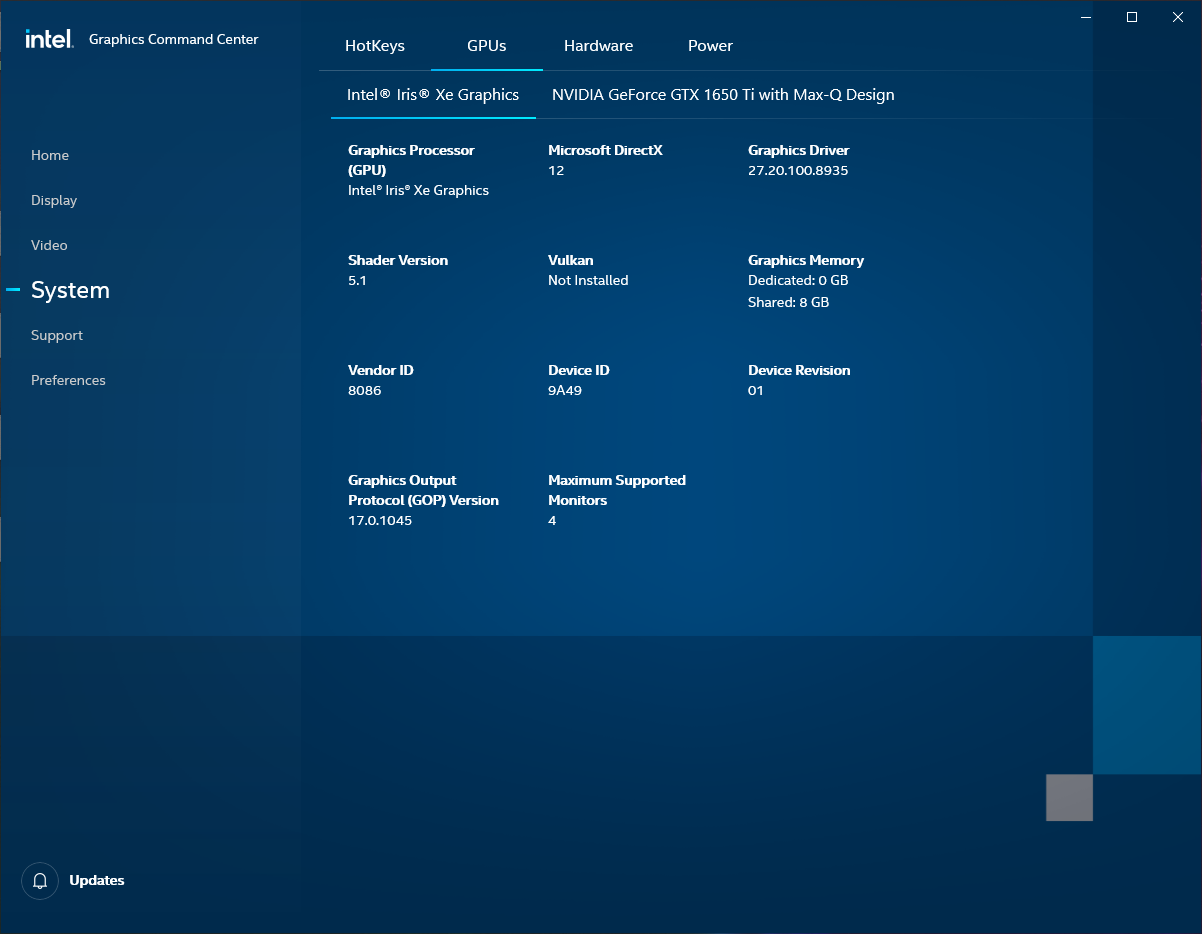
All SKUs come with either the 11th gen Core i5-1135G7 or Core i7-1165G7 alongside an optional GeForce GTX 1650 Ti Max-Q for users demanding gaming-level graphics. The pairing of a U-series CPU with a GeForce GTX GPU is rare for 14-inch laptops where GeForce MX options are much more common. The Envy 14 is therefore better suited for graphics-heavy tasks when compared to most others in its size category.
Users looking for an even faster 14-inch laptop may want to consider the Asus Zephyrus G14 instead.
We set our unit to Performance mode via HP Command Center prior to running our performance benchmarks below. Owners should become familiar with the software as HP-specific features can be toggled here.
Processor
The Envy 14 comes with the fastest iteration of the Core i5-1135G7 yet in our database. CineBench xT results are 17 to 27 percent higher than the average laptop with the same Core i5-1135G7 CPU which is enough to outperform some laptops with the "faster" Core i7-1165G7 or Core i7-1185G7. Performance sustainability is also excellent as shown by our CineBench R15 xT loop test results below.
The impressive performance is likely due to the proficient cooling solution in the Envy 14 which includes an IR thermopile sensor and the HP Dynamic Power monitor to better allocate power resources between the CPU and GPU.
Upgrading to the Core i7-1165G7 SKU should, on paper, bring a 10 to 15 percent boost in processor performance.
Cinebench R15: CPU Multi 64Bit | CPU Single 64Bit
Blender: v2.79 BMW27 CPU
7-Zip 18.03: 7z b 4 -mmt1 | 7z b 4
Geekbench 5.5: Single-Core | Multi-Core
HWBOT x265 Benchmark v2.2: 4k Preset
LibreOffice : 20 Documents To PDF
R Benchmark 2.5: Overall mean
Cinebench R15: CPU Multi 64Bit | CPU Single 64Bit
Blender: v2.79 BMW27 CPU
7-Zip 18.03: 7z b 4 -mmt1 | 7z b 4
Geekbench 5.5: Single-Core | Multi-Core
HWBOT x265 Benchmark v2.2: 4k Preset
LibreOffice : 20 Documents To PDF
R Benchmark 2.5: Overall mean
* ... smaller is better
System Performance
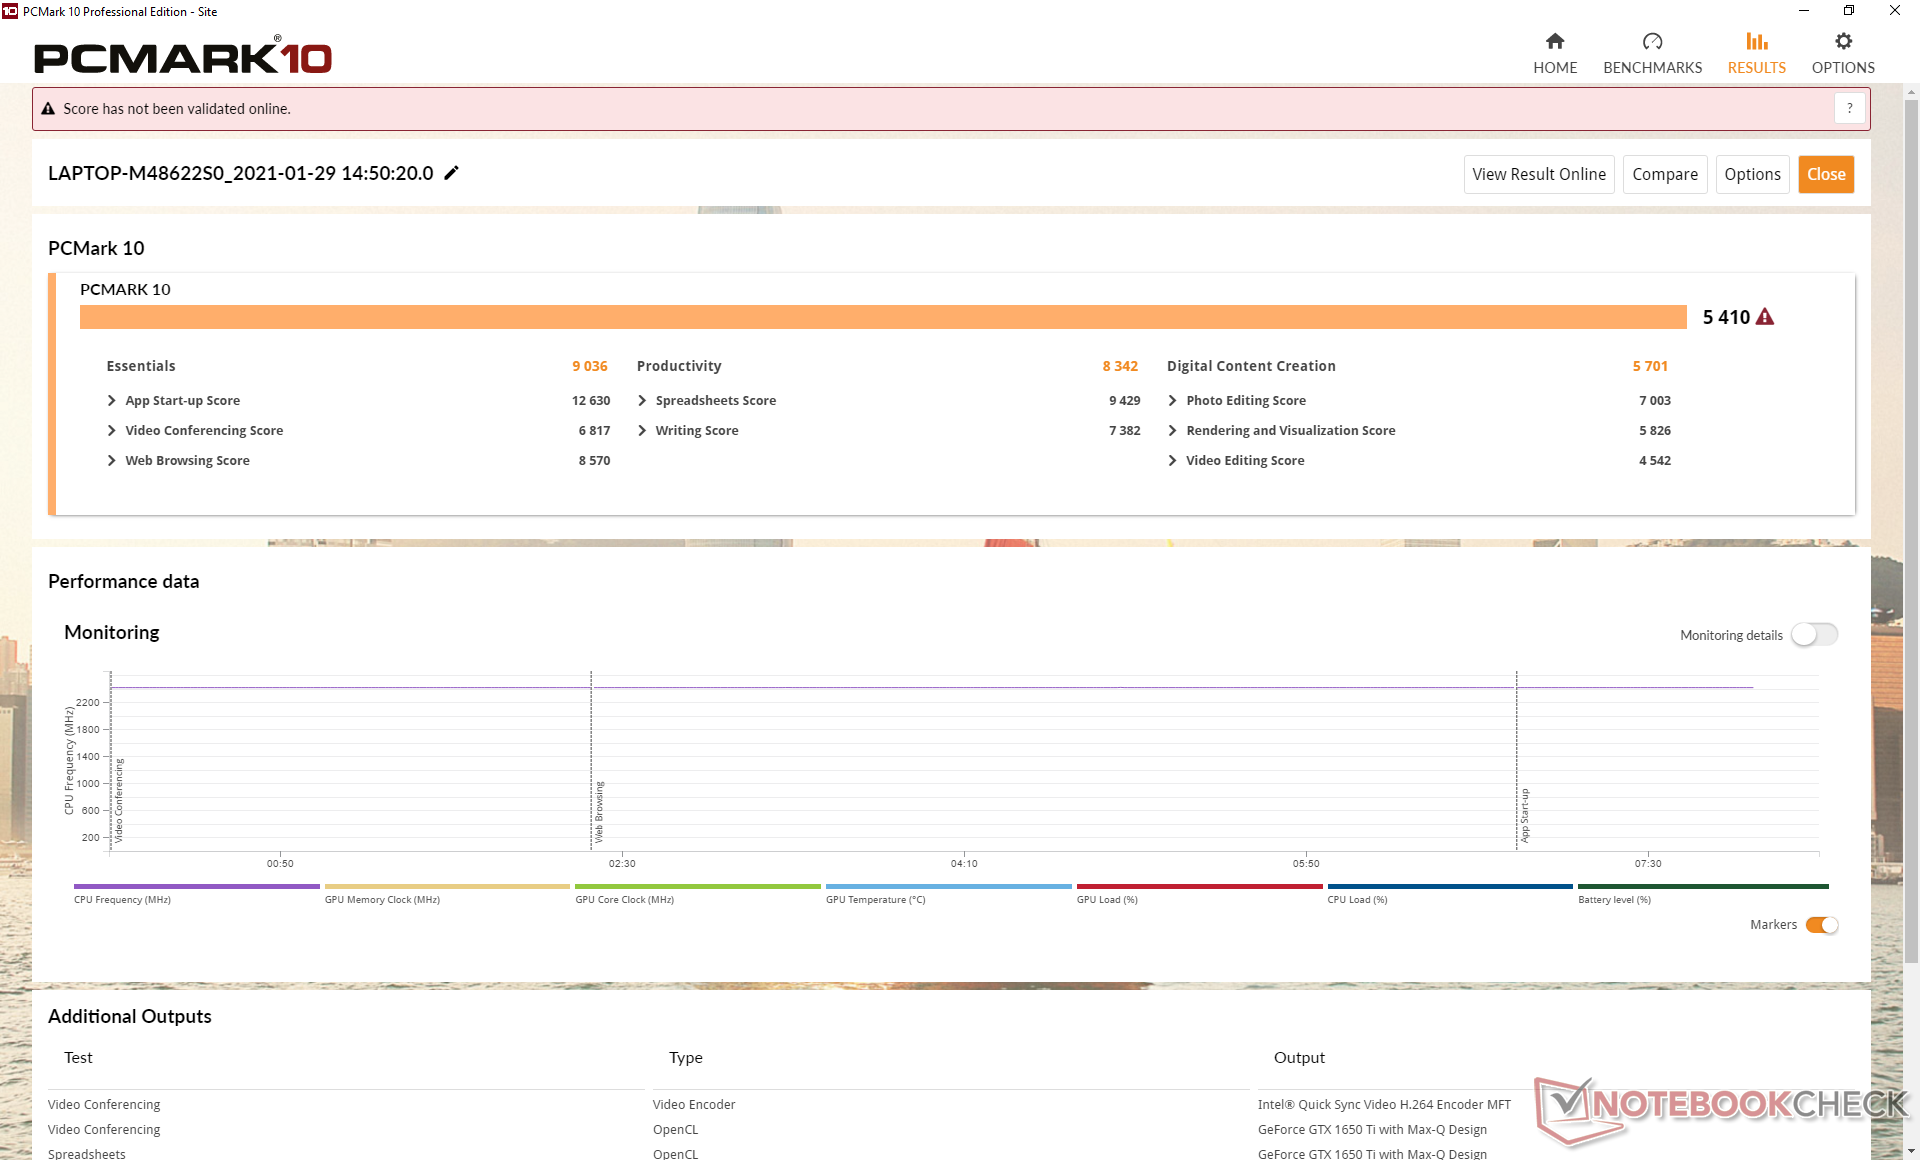
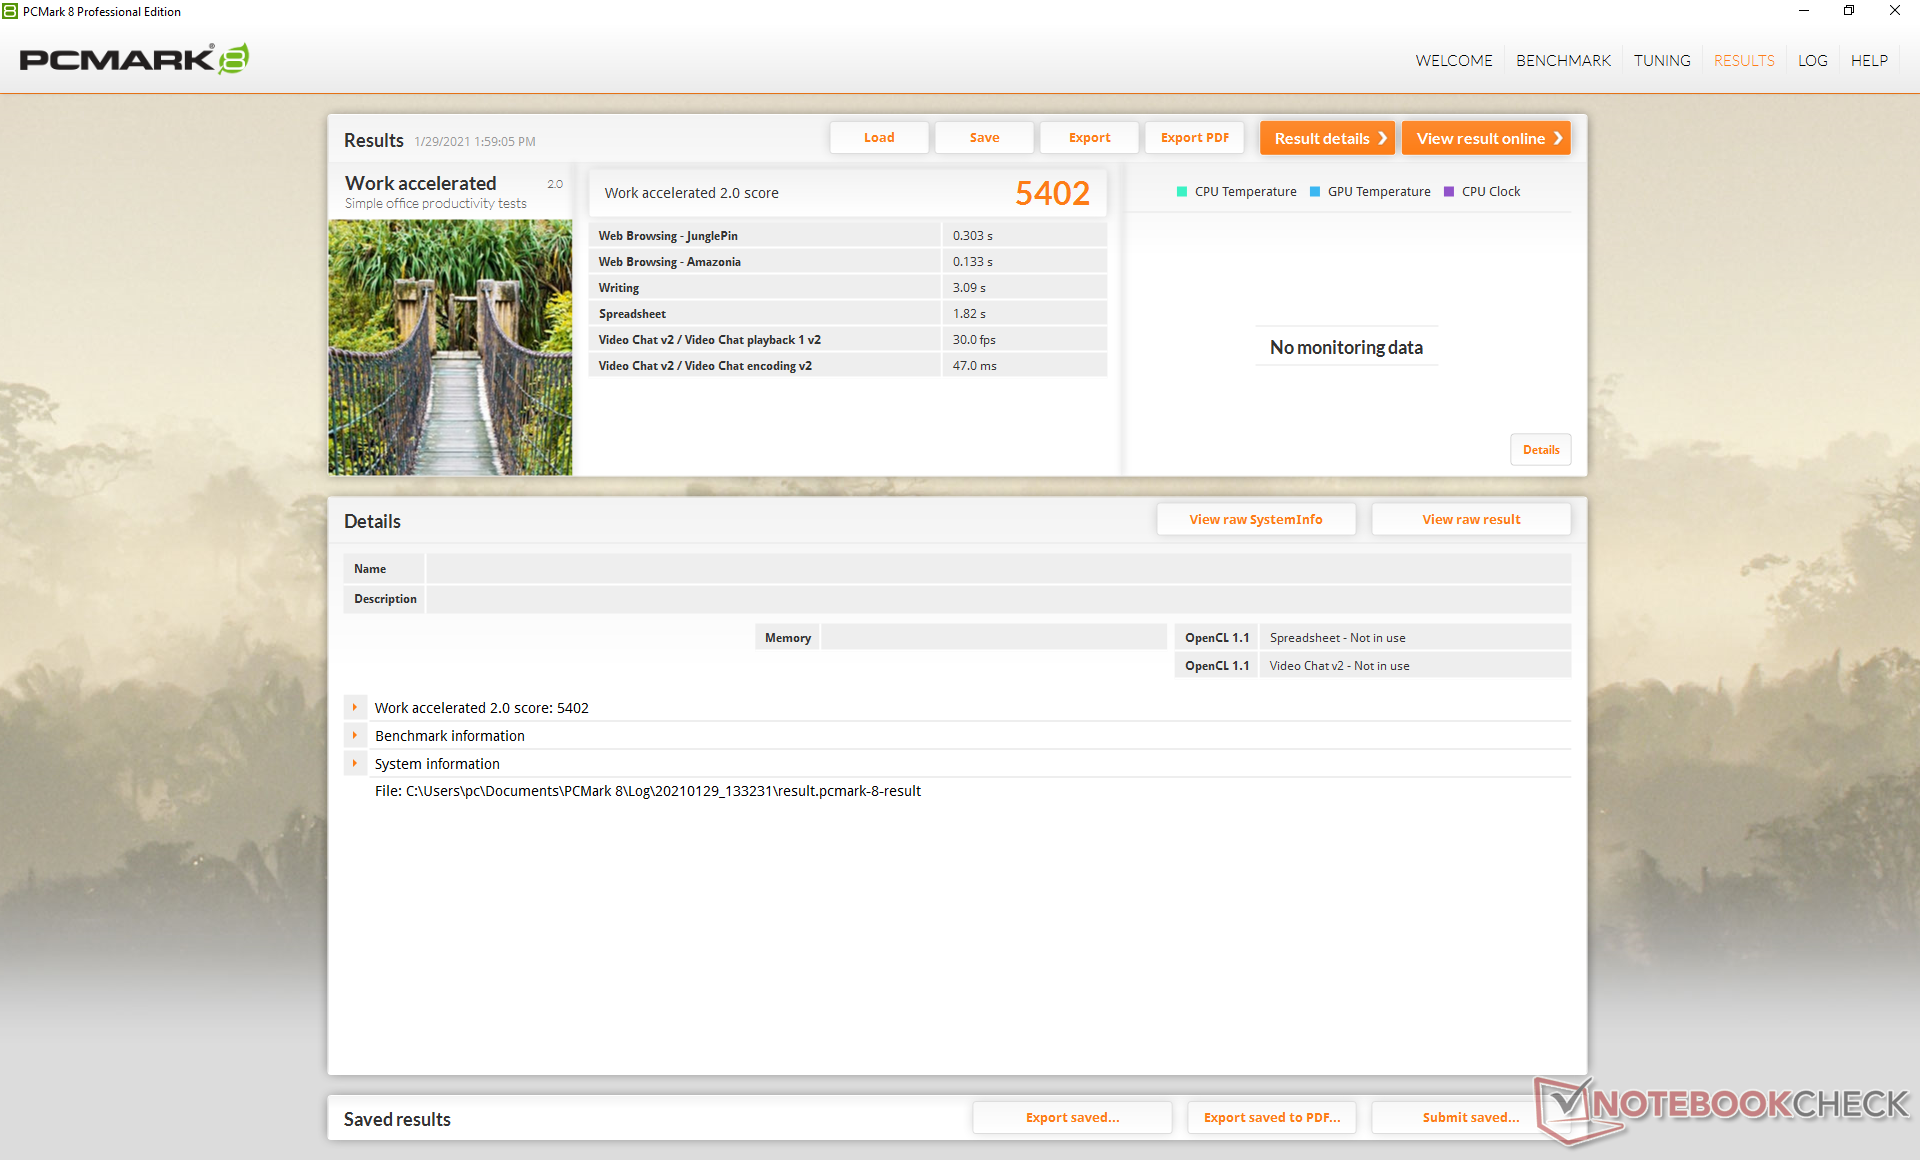
PCMark results are excellent and consistently higher than most other Ultrabooks in performance-heavy tasks due to the discrete Nvidia GeForce GTX GPU.
It's worth noting that the retail unit comes pre-loaded with a handful of software. While many are from HP and worth keeping, others are bloatware and can be safely removed. We recommend uninstalling them to reduce pop-ups and save on space especially since the 256 GB storage size is fairly limited.
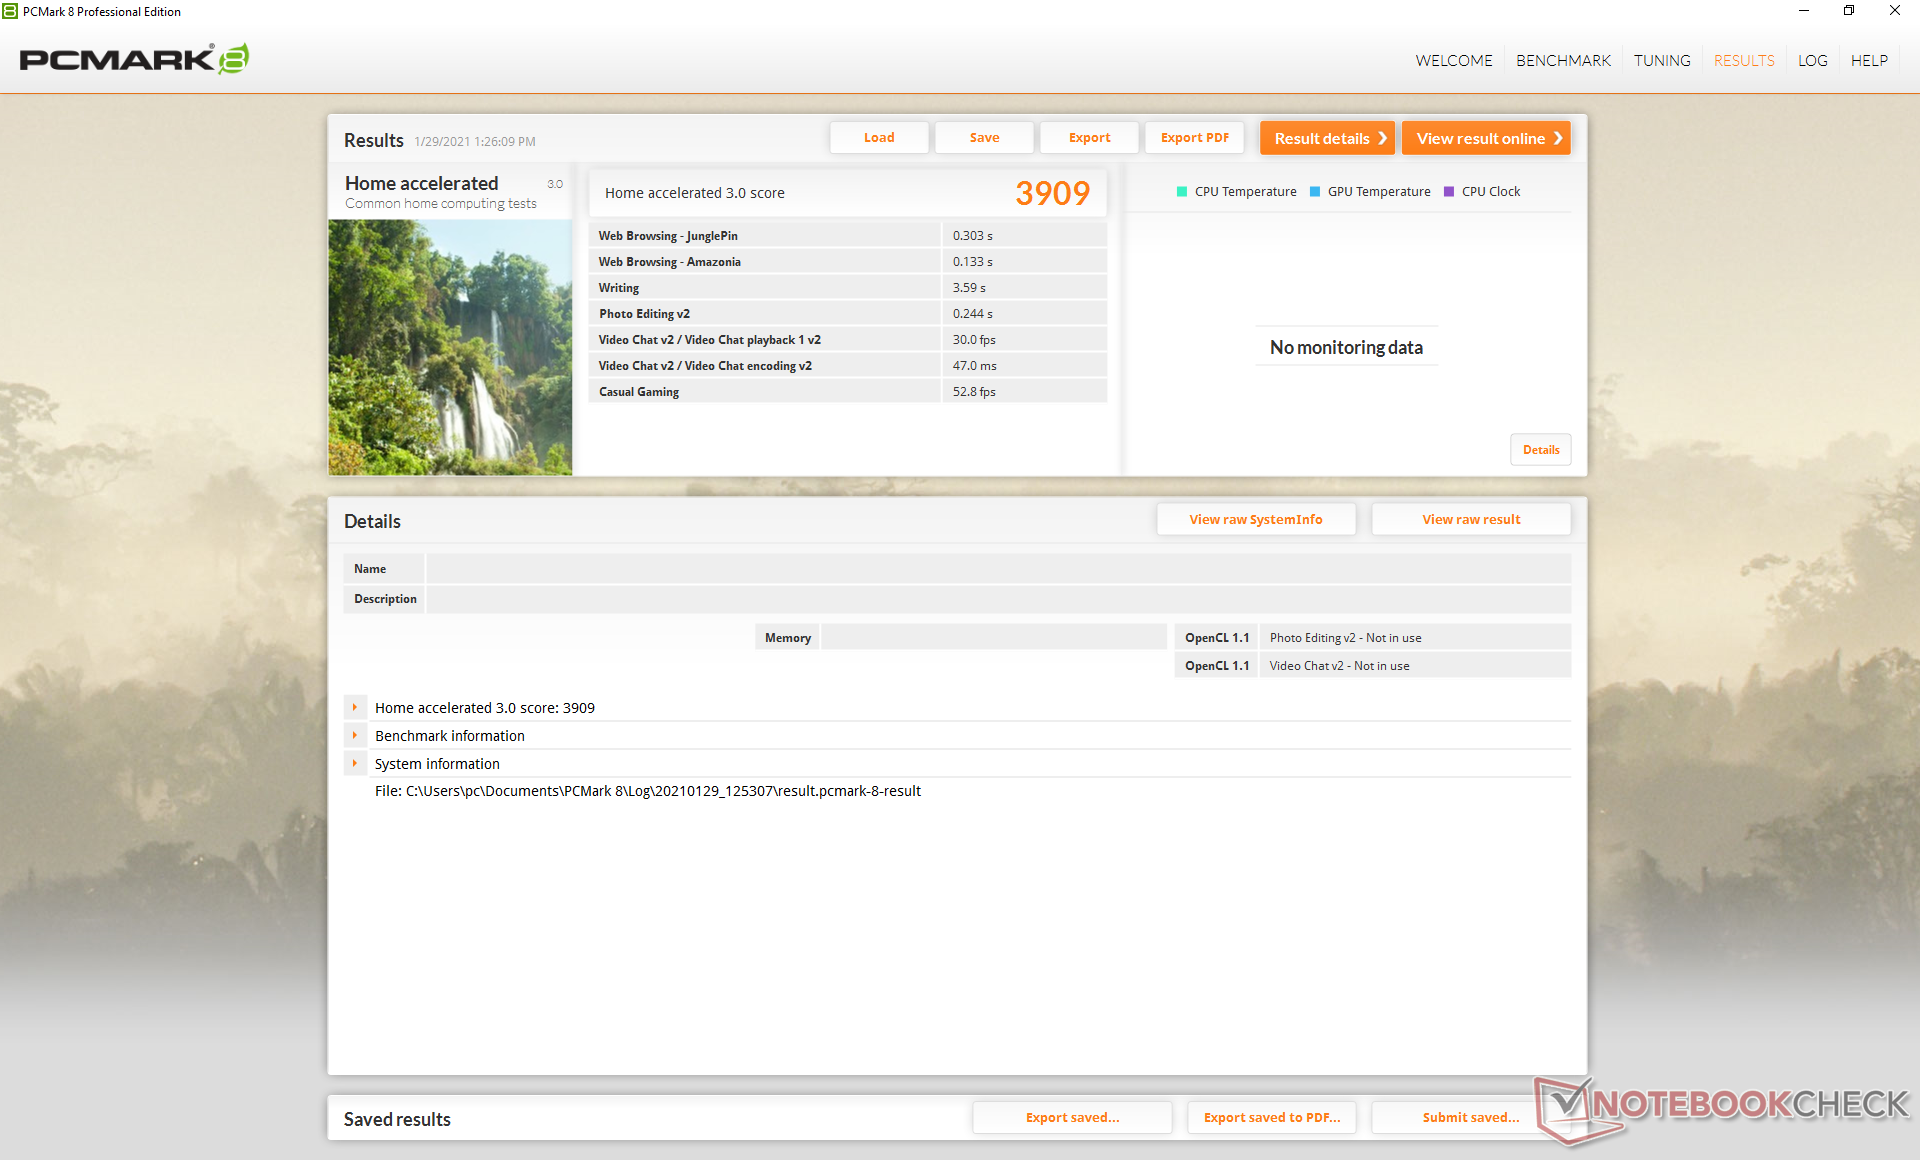
| PCMark 8 Home Score Accelerated v2 | 3909 points | |
| PCMark 8 Work Score Accelerated v2 | 5402 points | |
| PCMark 10 Score | 5410 points | |
Help | ||
DPC Latency
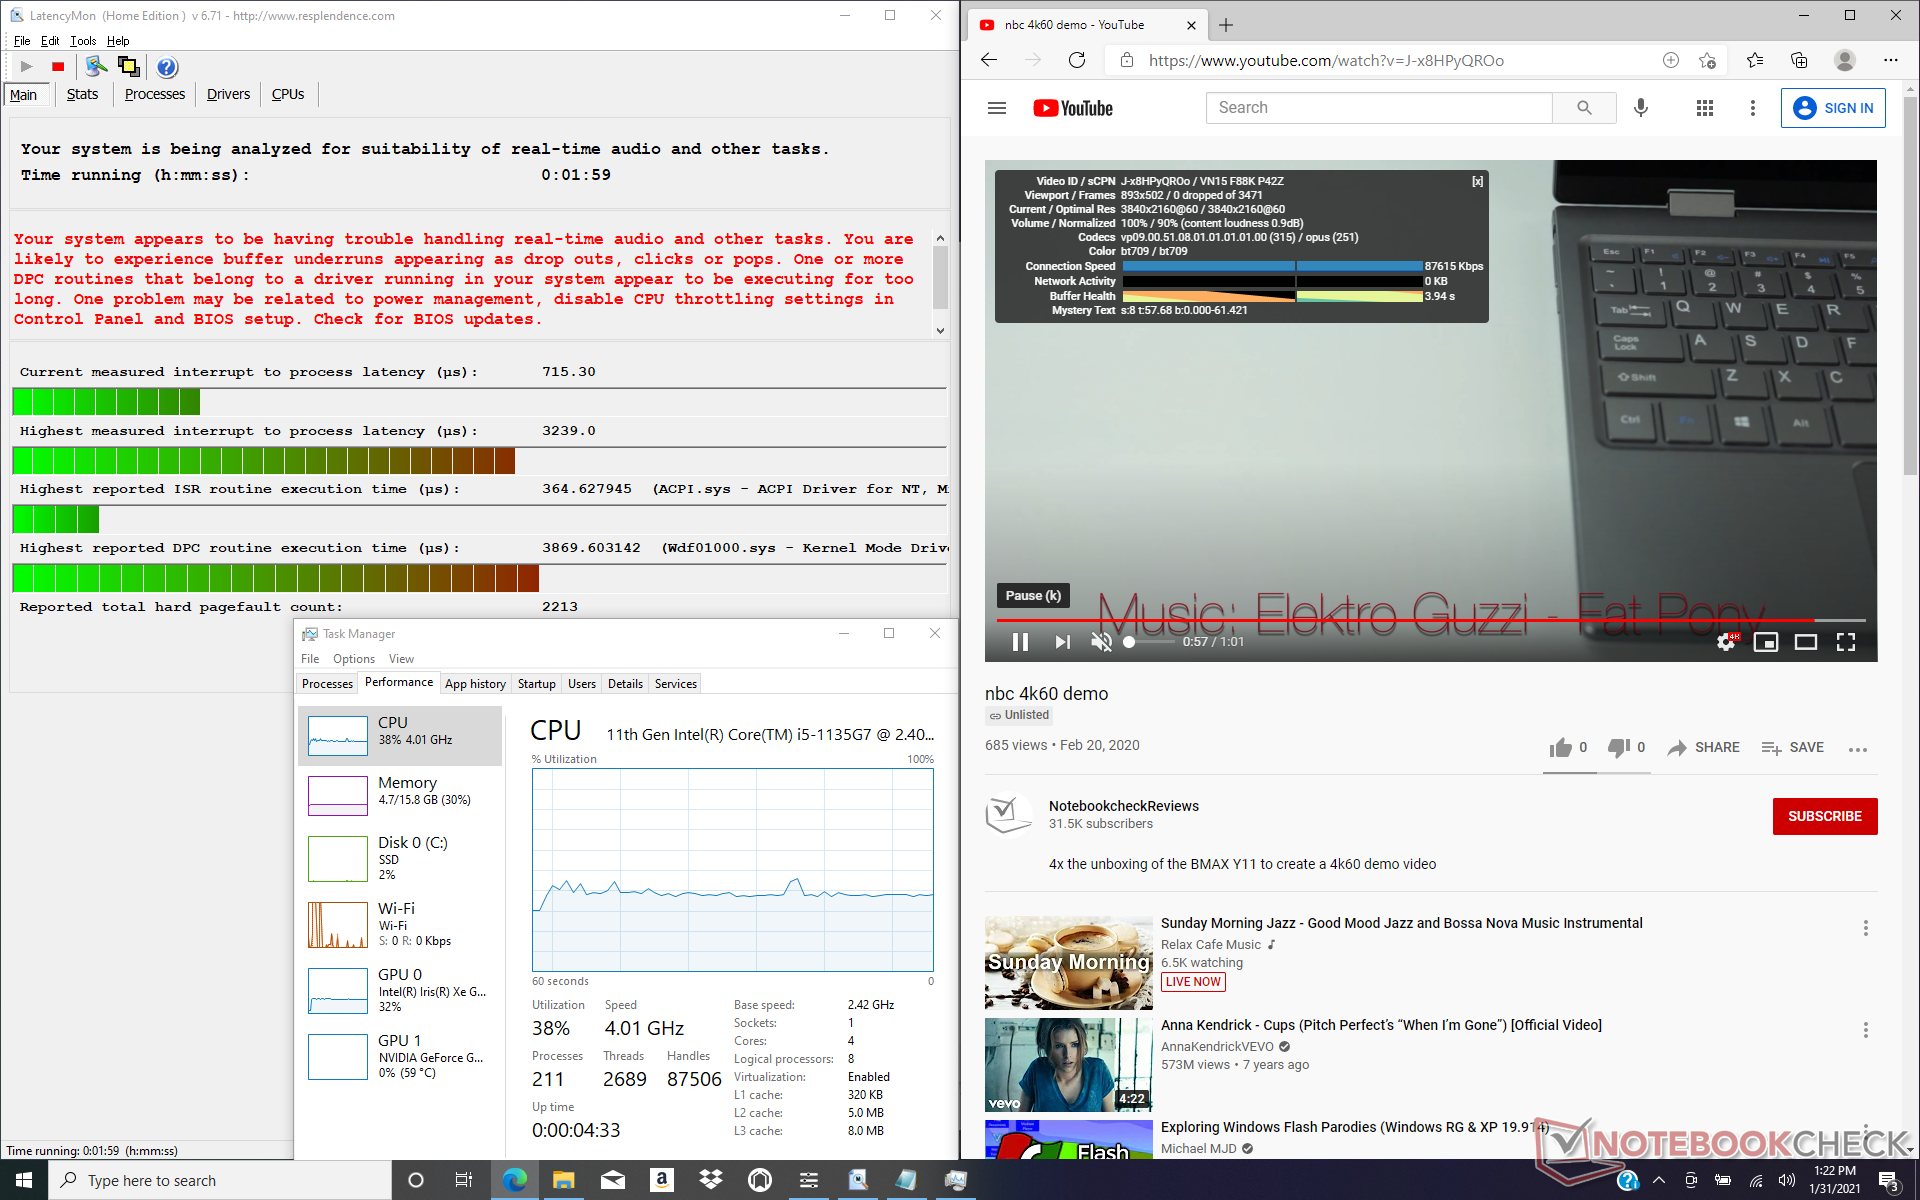
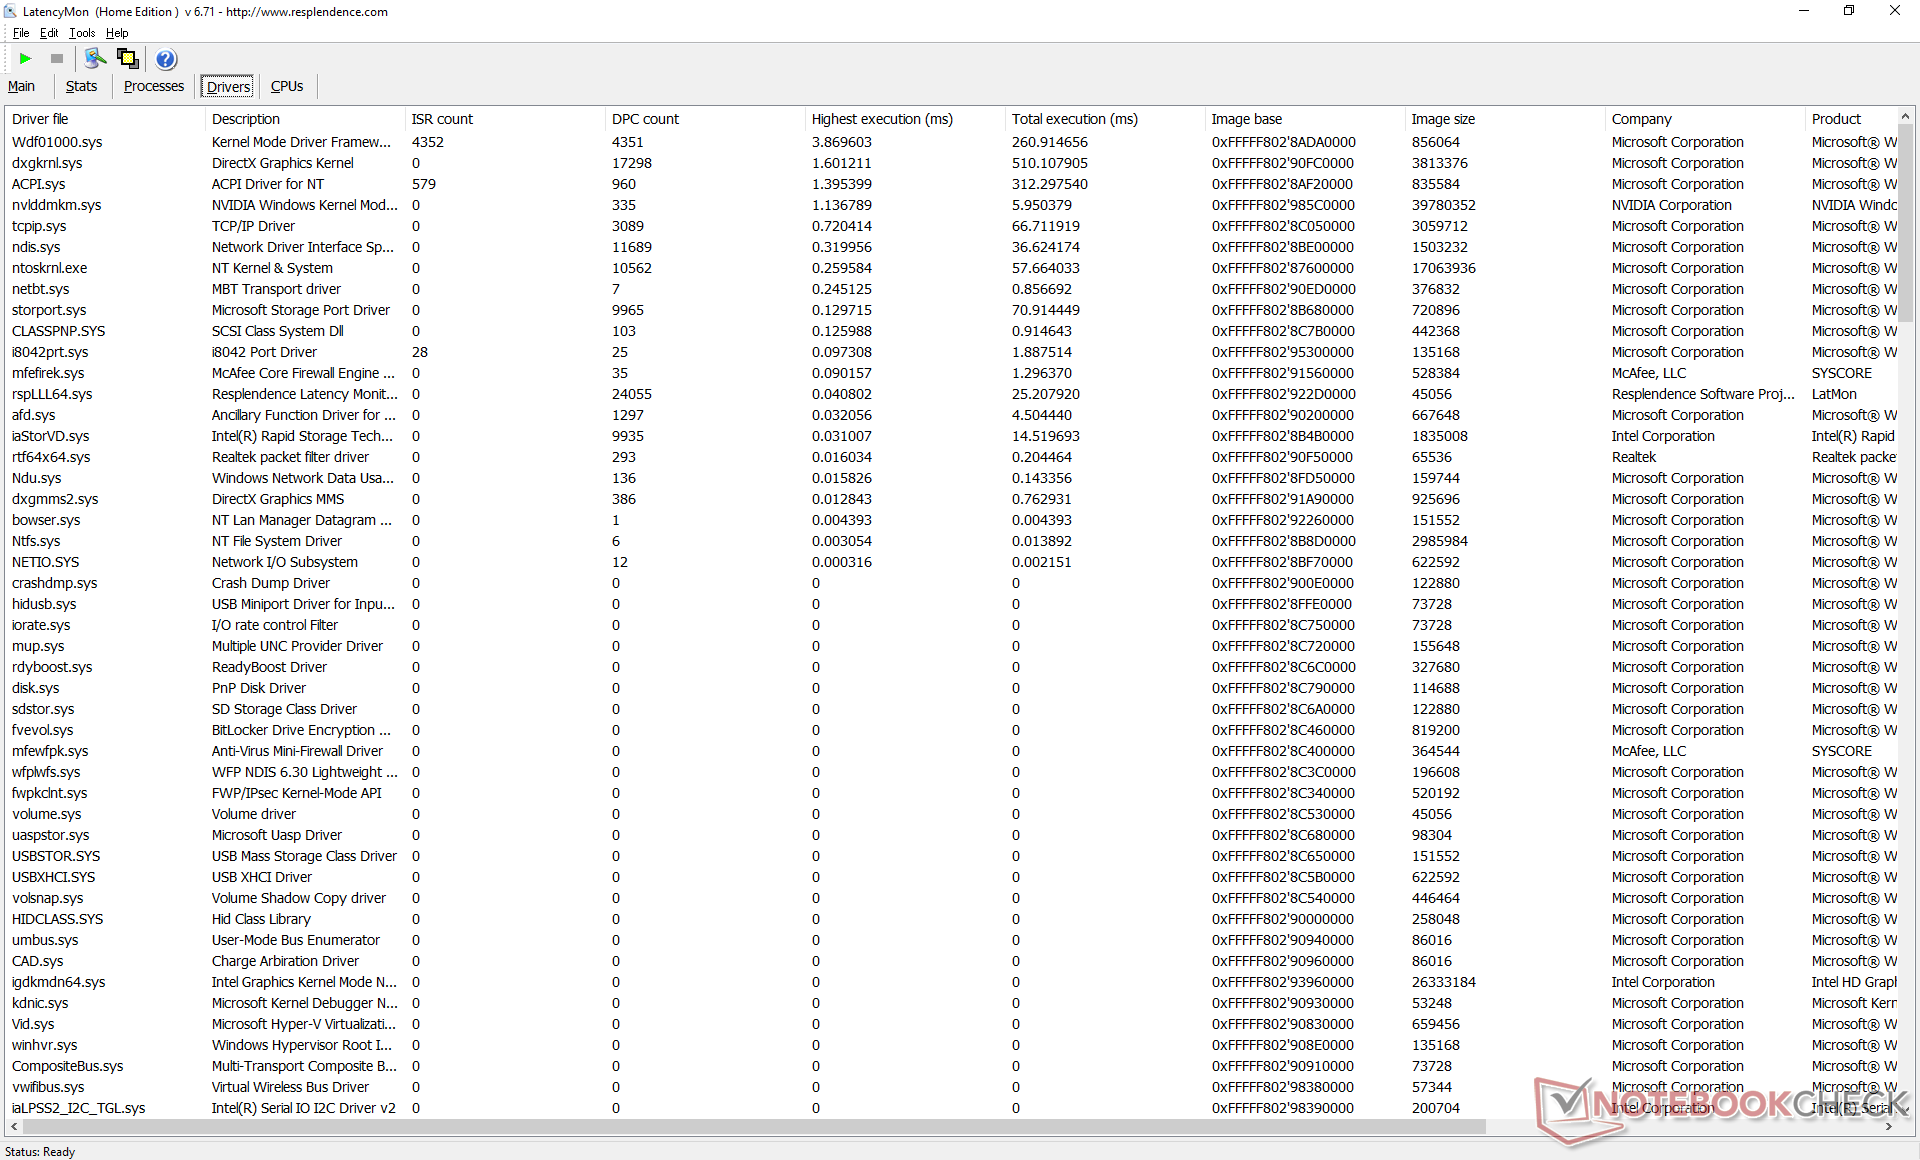
LatencyMon shows severe DPC latency issues when opening multiple tabs on our homepage even after multiple retests which is a shame since the Envy 14 is marketed for creators. 4K video playback at 60 FPS is otherwise smooth and with no dropped frames, but CPU utilization would be unusually high at 38 percent when it should only be in the single-digit range. Task Manager reveals SysMain to be the culprit of the high CPU usage.
| DPC Latencies / LatencyMon - interrupt to process latency (max), Web, Youtube, Prime95 | |
| HP Envy 14-eb0010nr | |
| HP Spectre x360 14t-ea000 | |
| Lenovo IdeaPad Slim 9i 14ITL5 | |
| Asus ZenBook Duo 14 UX482EA | |
| Huawei MateBook 14 2020 Intel | |
* ... smaller is better
Storage Devices
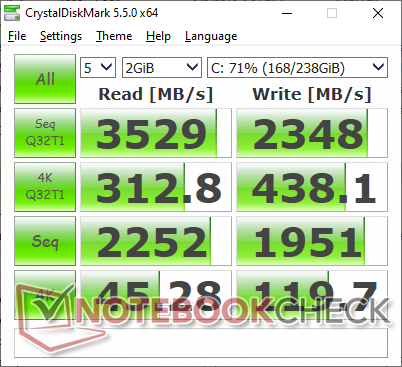
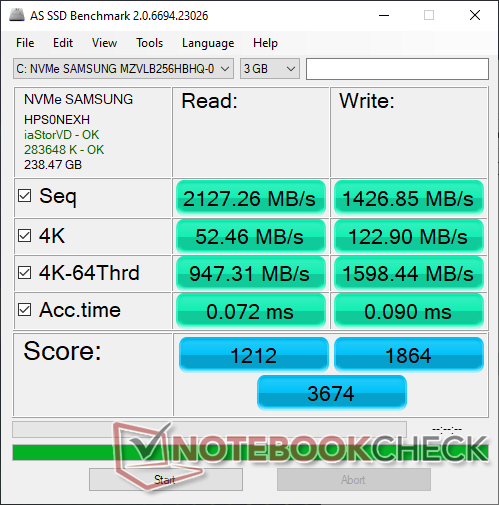
We're glad to see a high-end Samsung PM981a NVMe SSD even though our configuration comes with the lowest-end storage option. Other OEMs would sometimes equip their least expensive SKUs with slower Lite-On or Toshiba NVMe SSDs while saving the faster SSDs for the higher-end SKUs. We're able to record sustained read rates approaching 3500 MB/s to confirm a PCIe x4 interface.
| HP Envy 14-eb0010nr Samsung SSD PM981a MZVLB256HBHQ | Lenovo IdeaPad Slim 9i 14ITL5 WDC PC SN730 SDBPNTY-512G | Asus ZenBook Duo 14 UX482EA SK Hynix HFM512GD3JX013N | Dell Inspiron 14 3493-4KWCF Toshiba KBG40ZNS512G NVMe | Huawei MateBook 14 2020 Intel Lite-On CA5-8D512 | |
|---|---|---|---|---|---|
| AS SSD | 1% | -1% | -43% | 4% | |
| Seq Read (MB/s) | 2127 | 2068 -3% | 2088 -2% | 2074 -2% | 2933 38% |
| Seq Write (MB/s) | 1427 | 1414 -1% | 1311 -8% | 775 -46% | 810 -43% |
| 4K Read (MB/s) | 52.5 | 46.99 -10% | 58.2 11% | 37.81 -28% | 56.6 8% |
| 4K Write (MB/s) | 122.9 | 211.9 72% | 128.4 4% | 101.3 -18% | 147.6 20% |
| 4K-64 Read (MB/s) | 947 | 1027 8% | 1039 10% | 1265 34% | 856 -10% |
| 4K-64 Write (MB/s) | 1598 | 978 -39% | 1238 -23% | 383.5 -76% | 1099 -31% |
| Access Time Read * (ms) | 0.072 | 0.057 21% | 0.045 37% | 0.081 -13% | 0.046 36% |
| Access Time Write * (ms) | 0.09 | 0.066 27% | 0.088 2% | 0.263 -192% | 0.028 69% |
| Score Read (Points) | 1212 | 1281 6% | 1306 8% | 1510 25% | 1206 0% |
| Score Write (Points) | 1864 | 1331 -29% | 1497 -20% | 562 -70% | 1328 -29% |
| Score Total (Points) | 3674 | 3243 -12% | 3446 -6% | 2781 -24% | 3059 -17% |
| Copy ISO MB/s (MB/s) | 1605 | 1891 18% | 2248 40% | 716 -55% | |
| Copy Program MB/s (MB/s) | 847 | 604 -29% | 559 -34% | 335.4 -60% | |
| Copy Game MB/s (MB/s) | 1632 | 1422 -13% | 1087 -33% | 484.8 -70% | |
| CrystalDiskMark 5.2 / 6 | 3% | -3% | -3% | 23% | |
| Write 4K (MB/s) | 119.7 | 131.5 10% | 72.1 -40% | 159.6 33% | 161.8 35% |
| Read 4K (MB/s) | 45.28 | 36.83 -19% | 41.1 -9% | 53.5 18% | 60.6 34% |
| Write Seq (MB/s) | 1951 | 1614 -17% | 1949 0% | 1174 -40% | 2209 13% |
| Read Seq (MB/s) | 2252 | 2030 -10% | 1989 -12% | 1648 -27% | 2473 10% |
| Write 4K Q32T1 (MB/s) | 438.1 | 516 18% | 413.8 -6% | 420.8 -4% | 514 17% |
| Read 4K Q32T1 (MB/s) | 312.8 | 419.7 34% | 384.2 23% | 564 80% | 586 87% |
| Write Seq Q32T1 (MB/s) | 2348 | 2705 15% | 2816 20% | 1231 -48% | 2205 -6% |
| Read Seq Q32T1 (MB/s) | 3529 | 3390 -4% | 3534 0% | 2274 -36% | 3352 -5% |
| Total Average (Program / Settings) | 2% /
2% | -2% /
-2% | -23% /
-28% | 14% /
12% |
* ... smaller is better

Disk Throttling: DiskSpd Read Loop, Queue Depth 8
GPU Performance
Graphics performance is about 15 to 25 percent slower than the mobile GeForce GTX 1060 to be in line with other laptops equipped with the same GTX 1650 Ti Max-Q GPU. When gaming, owners can expect roughly 2x to 2.5x the frame rates compared to the integrated Iris Xe or GeForce MX as found on most of the latest Ultrabooks like the Dell XPS 13 or Asus ZenBook UX series.
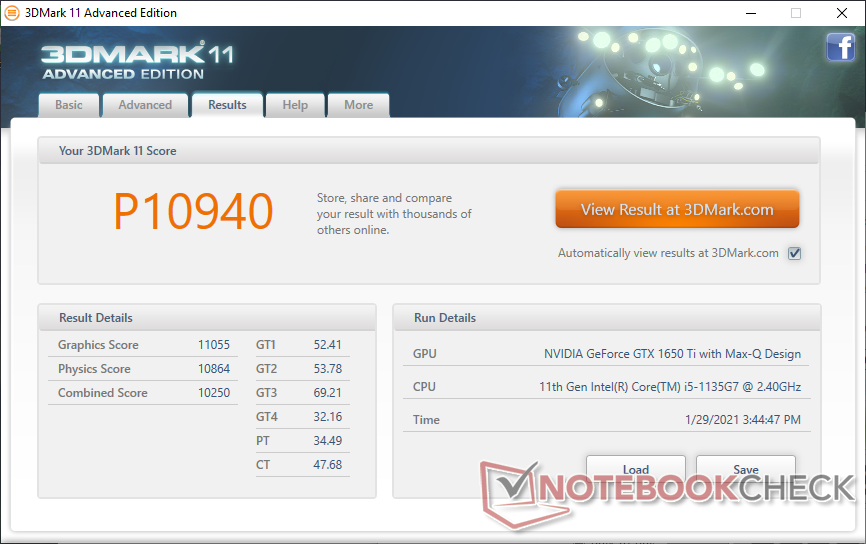
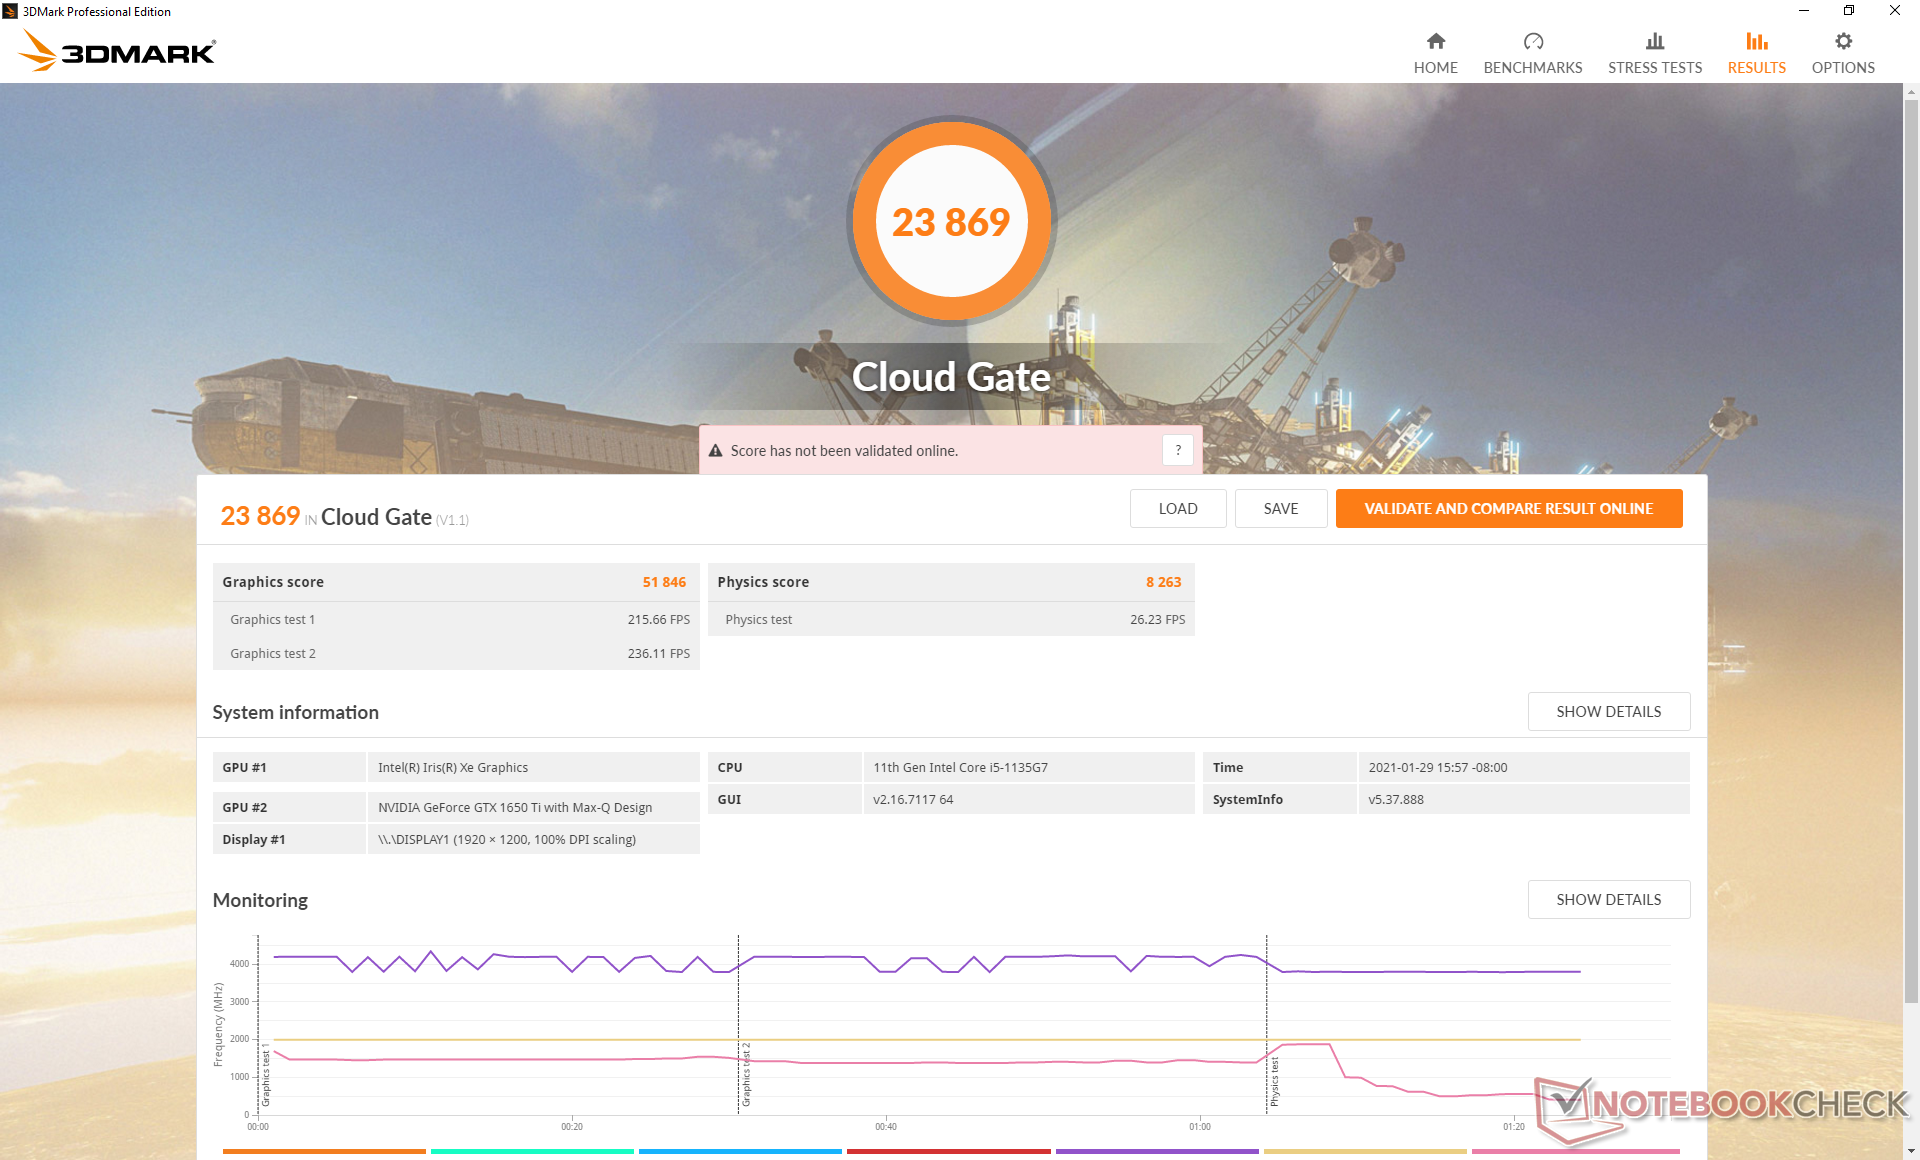
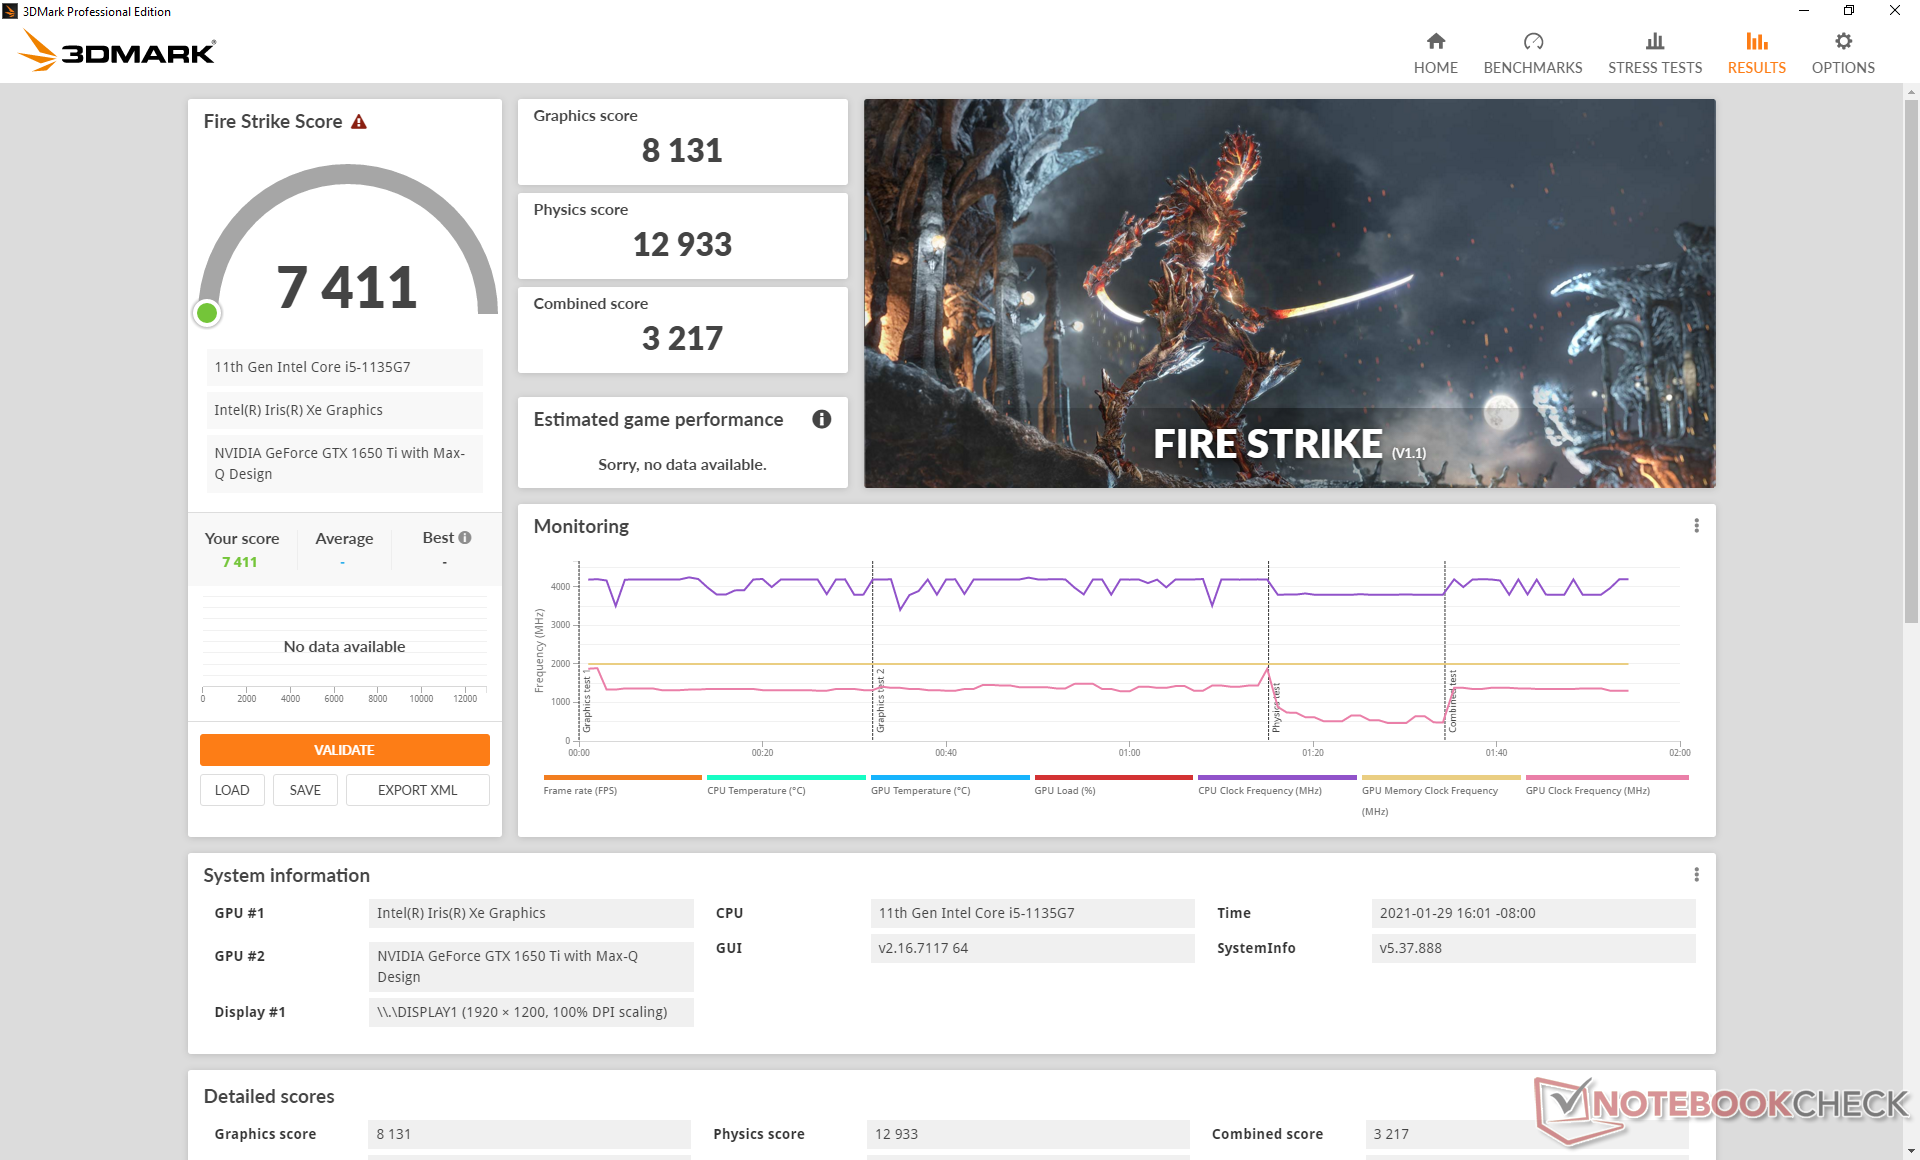
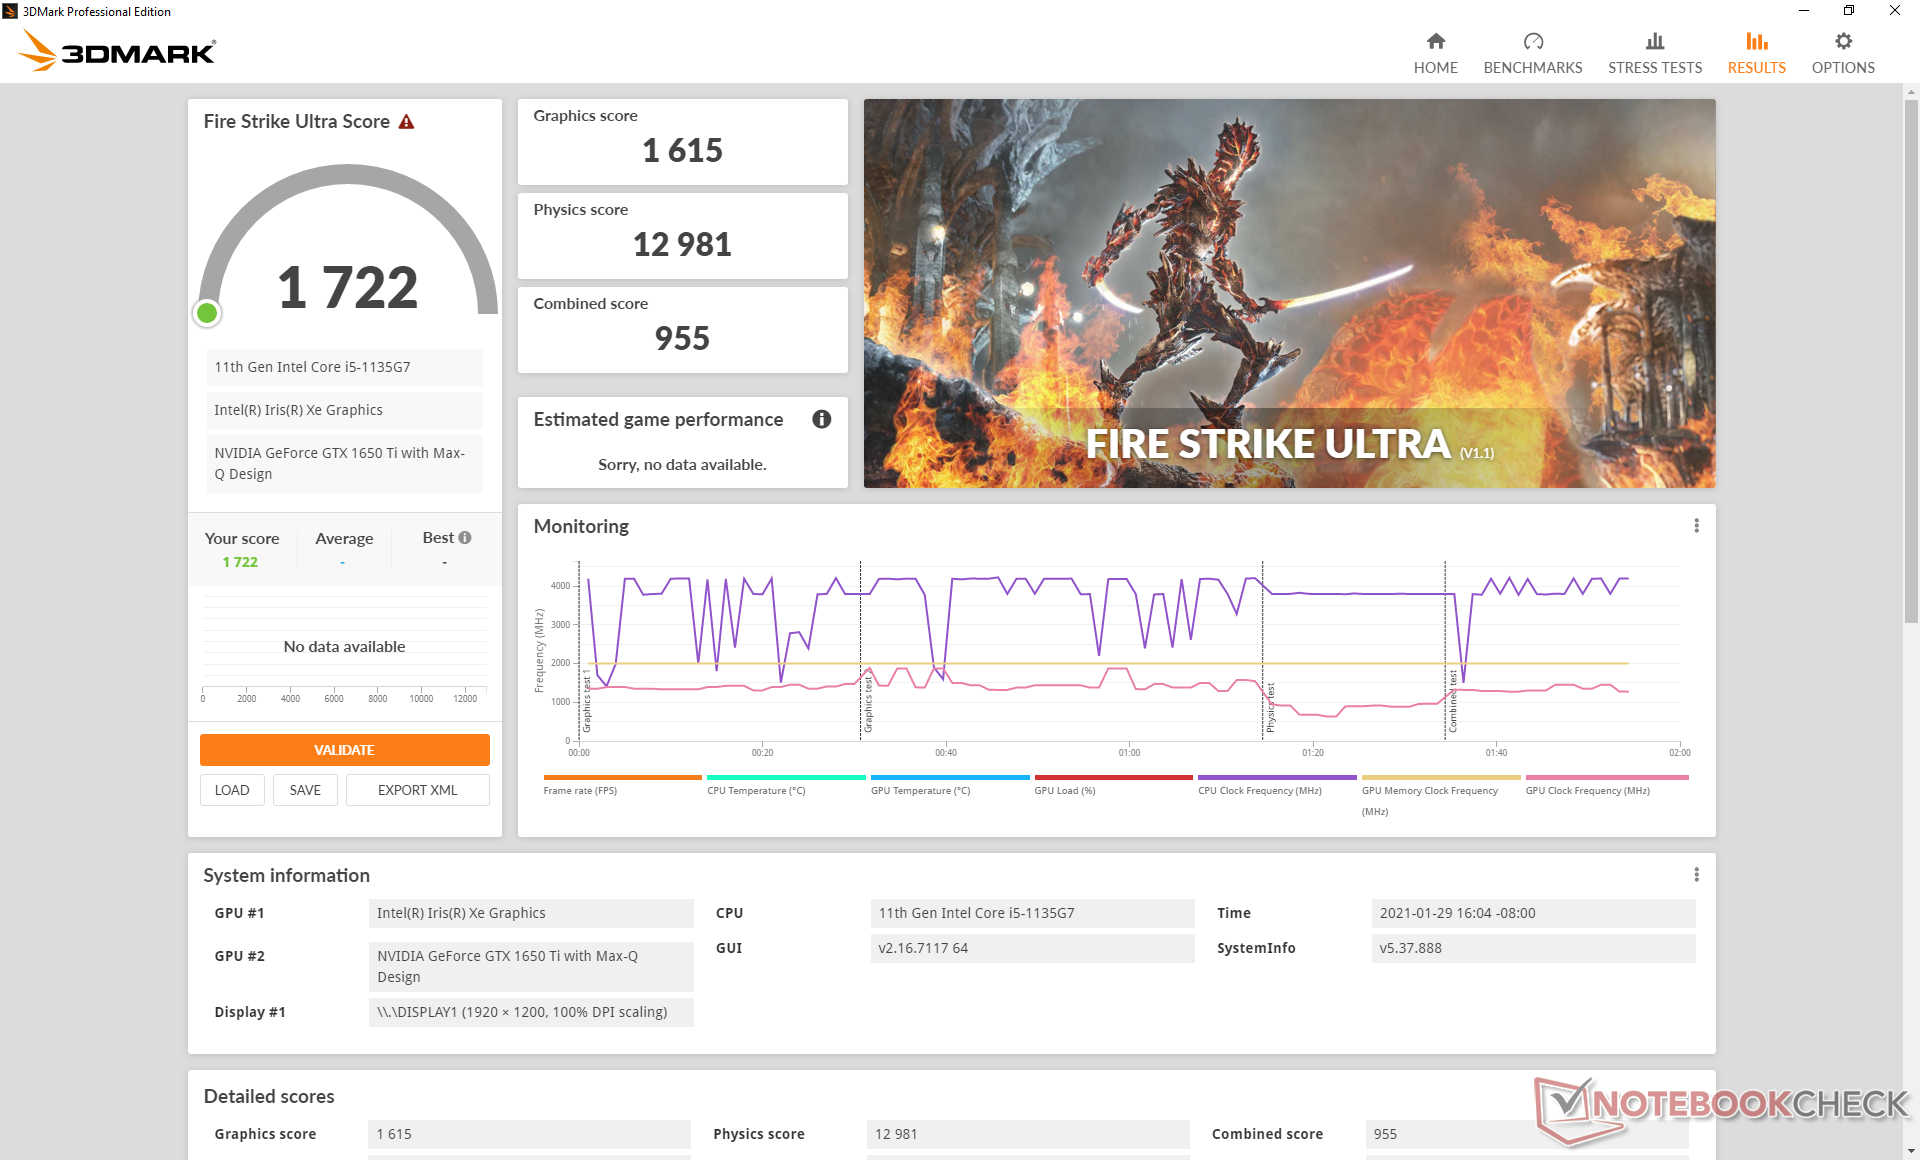
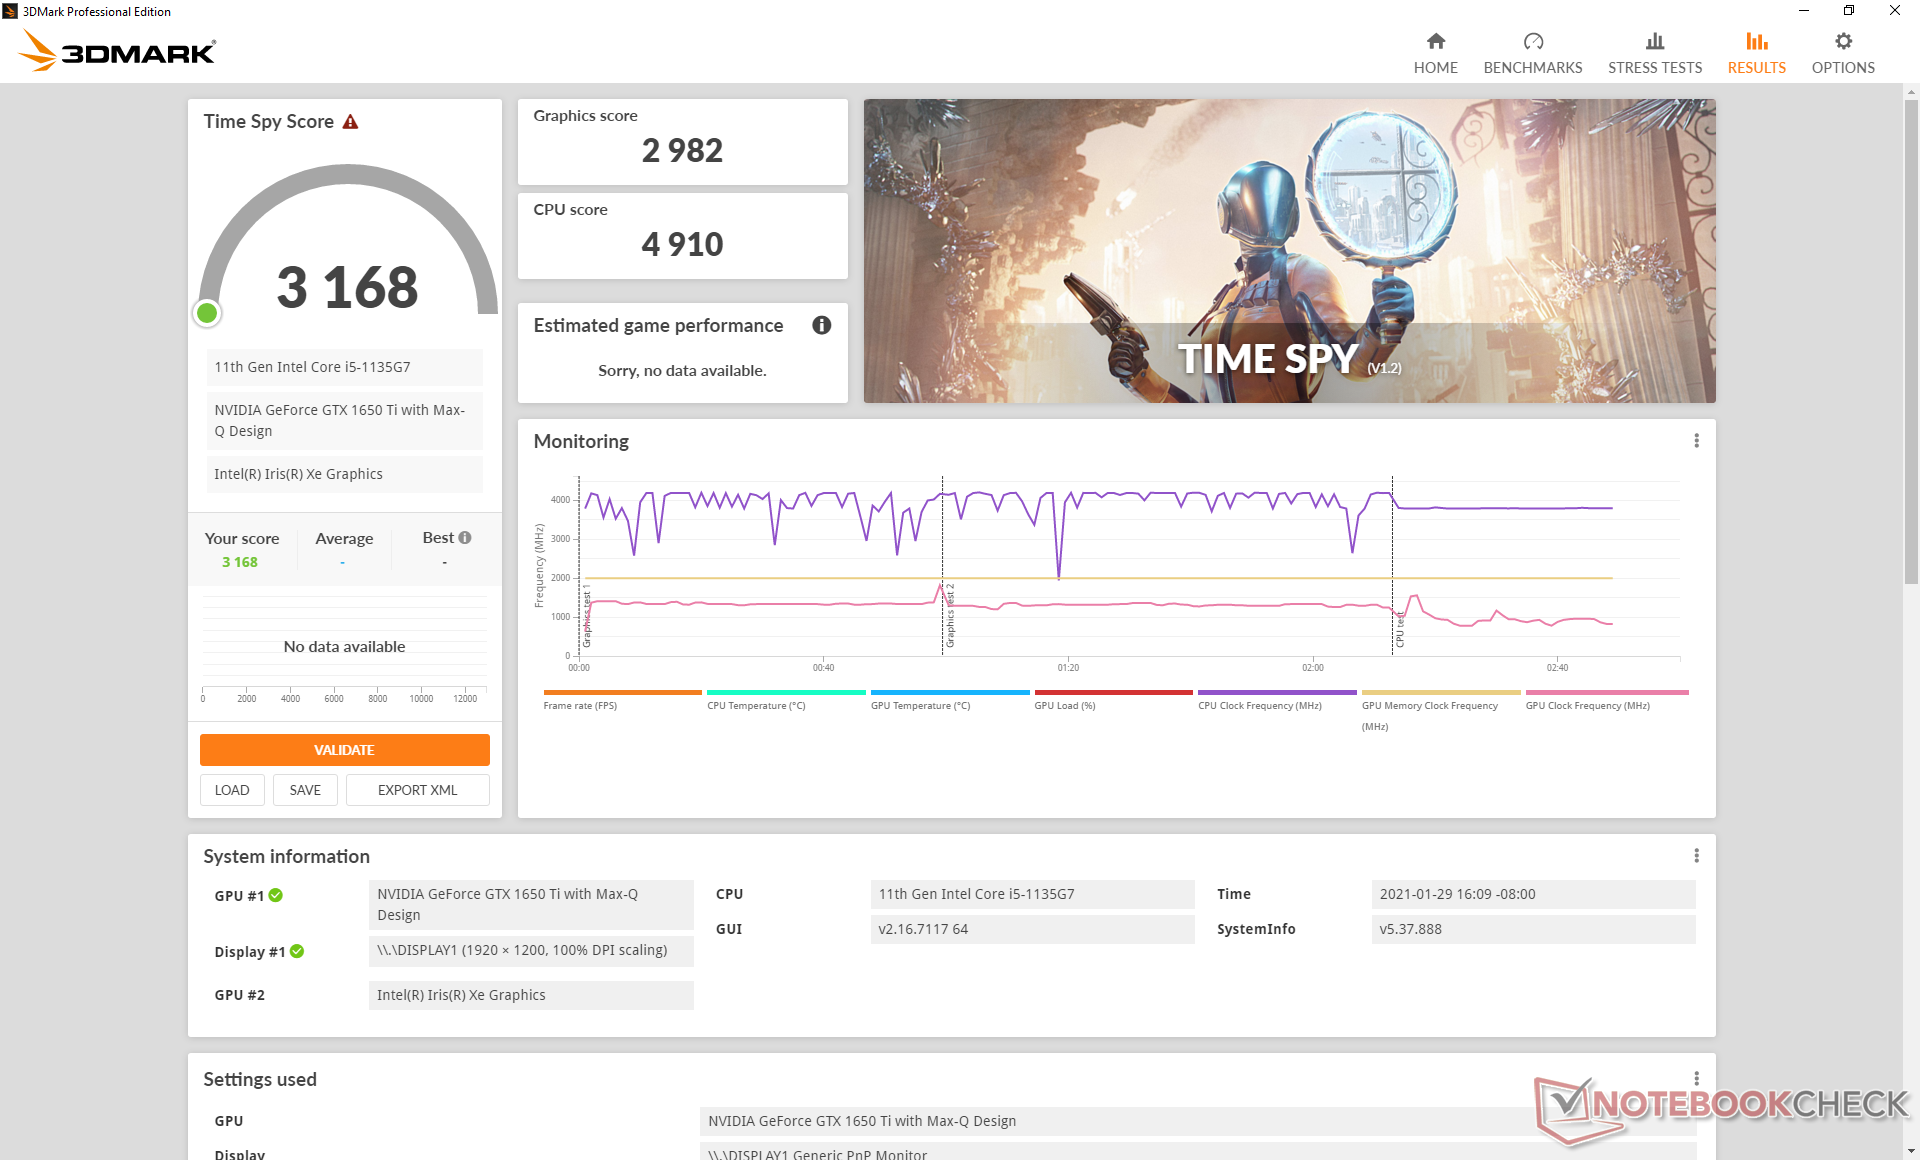
| 3DMark 11 Performance | 10940 points | |
| 3DMark Cloud Gate Standard Score | 23869 points | |
| 3DMark Fire Strike Score | 7411 points | |
| 3DMark Time Spy Score | 3168 points | |
Help | ||
| low | med. | high | ultra | |
|---|---|---|---|---|
| GTA V (2015) | 156 | 145 | 88.1 | 45.3 |
| The Witcher 3 (2015) | 156.8 | 90 | 53.6 | 31.5 |
| Dota 2 Reborn (2015) | 128 | 116 | 109 | 105 |
| Final Fantasy XV Benchmark (2018) | 90.1 | 46.3 | 32.5 | |
| X-Plane 11.11 (2018) | 86.8 | 73.5 | 62.7 | |
| Strange Brigade (2018) | 188 | 76.5 | 62.2 | 53.6 |
Emissions
System Noise
Fan behavior is a mixed bag. When idle or during low loads, the Envy 14 is essentially silent even if set to Performance mode. When running Witcher 3, however, fan noise would annoyingly cycle between silent and 34.9 dB(A) instead of remaining steady state. More CPU intensive games will bump fan noise temporarily to as high as 46 dB(A) while full CPU and GPU utilization will induce a fan noise of 48.7 dB(A). Expect louder fan noise than most other subnotebooks when running extreme loads and fluctuating RPMs when gaming.
| HP Envy 14-eb0010nr GeForce GTX 1650 Ti Max-Q, i5-1135G7, Samsung SSD PM981a MZVLB256HBHQ | Lenovo IdeaPad Slim 9i 14ITL5 Iris Xe G7 96EUs, i7-1165G7, WDC PC SN730 SDBPNTY-512G | Asus ZenBook Duo 14 UX482EA Iris Xe G7 96EUs, i7-1165G7, SK Hynix HFM512GD3JX013N | Dell Inspiron 14 3493-4KWCF GeForce MX230, i7-1065G7, Toshiba KBG40ZNS512G NVMe | Huawei MateBook 14 2020 Intel GeForce MX350, i7-10510U, Lite-On CA5-8D512 | |
|---|---|---|---|---|---|
| Noise | -3% | 0% | -13% | -6% | |
| off / environment * (dB) | 25.9 | 26.7 -3% | 26.3 -2% | 30.3 -17% | 29.3 -13% |
| Idle Minimum * (dB) | 26 | 26.7 -3% | 26.5 -2% | 30.3 -17% | 29.3 -13% |
| Idle Average * (dB) | 26 | 26.7 -3% | 26.5 -2% | 30.3 -17% | 29.3 -13% |
| Idle Maximum * (dB) | 26 | 26.7 -3% | 26.5 -2% | 30.3 -17% | 30.8 -18% |
| Load Average * (dB) | 34.9 | 34 3% | 26.7 23% | 42.9 -23% | 35.7 -2% |
| Witcher 3 ultra * (dB) | 34.5 | 43.5 -26% | 40.7 -18% | 35.7 -3% | |
| Load Maximum * (dB) | 48.7 | 43.5 11% | 45.6 6% | 43.3 11% | 37.9 22% |
* ... smaller is better
Noise level
| Idle |
| 26 / 26 / 26 dB(A) |
| Load |
| 34.9 / 48.7 dB(A) |
 | ||
30 dB silent 40 dB(A) audible 50 dB(A) loud |
||
min: | ||
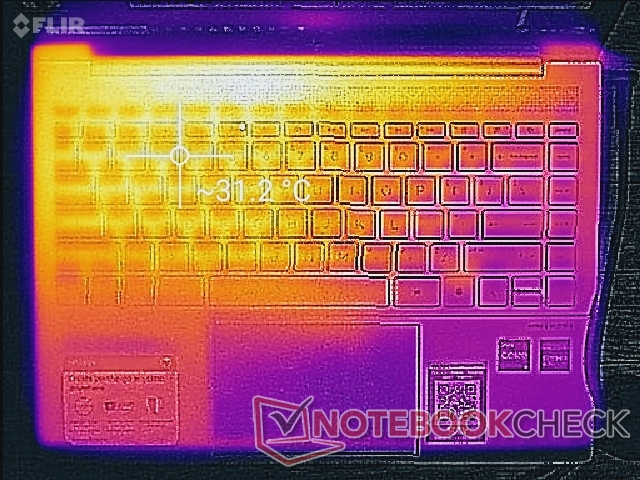
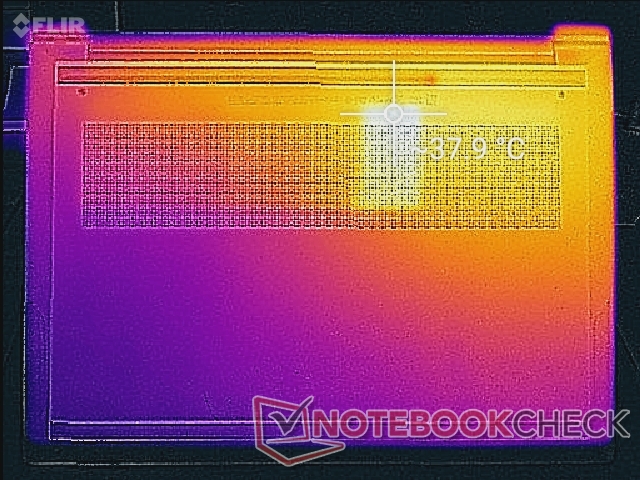
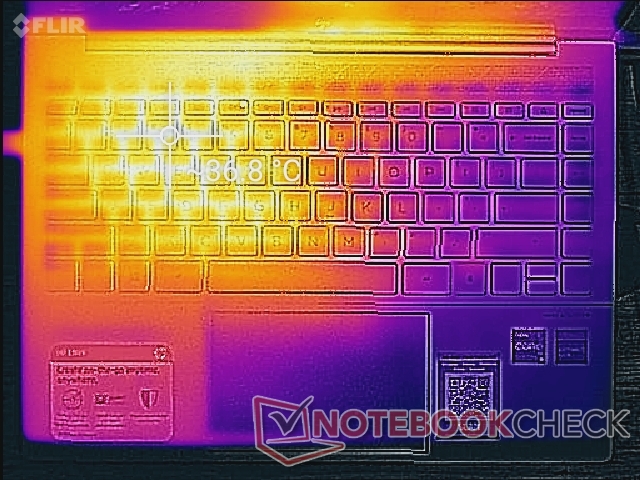
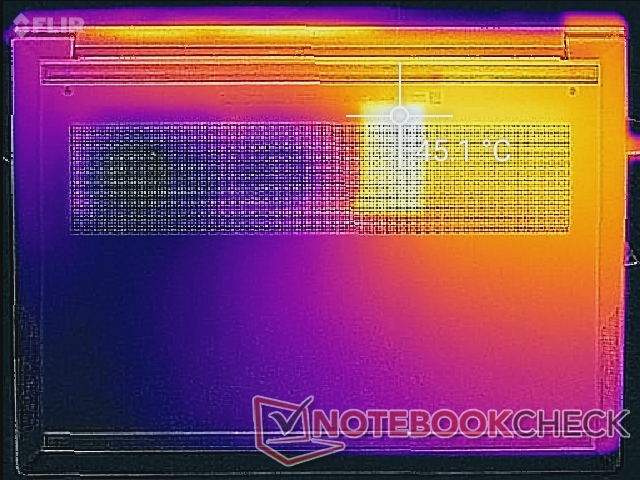
Temperature
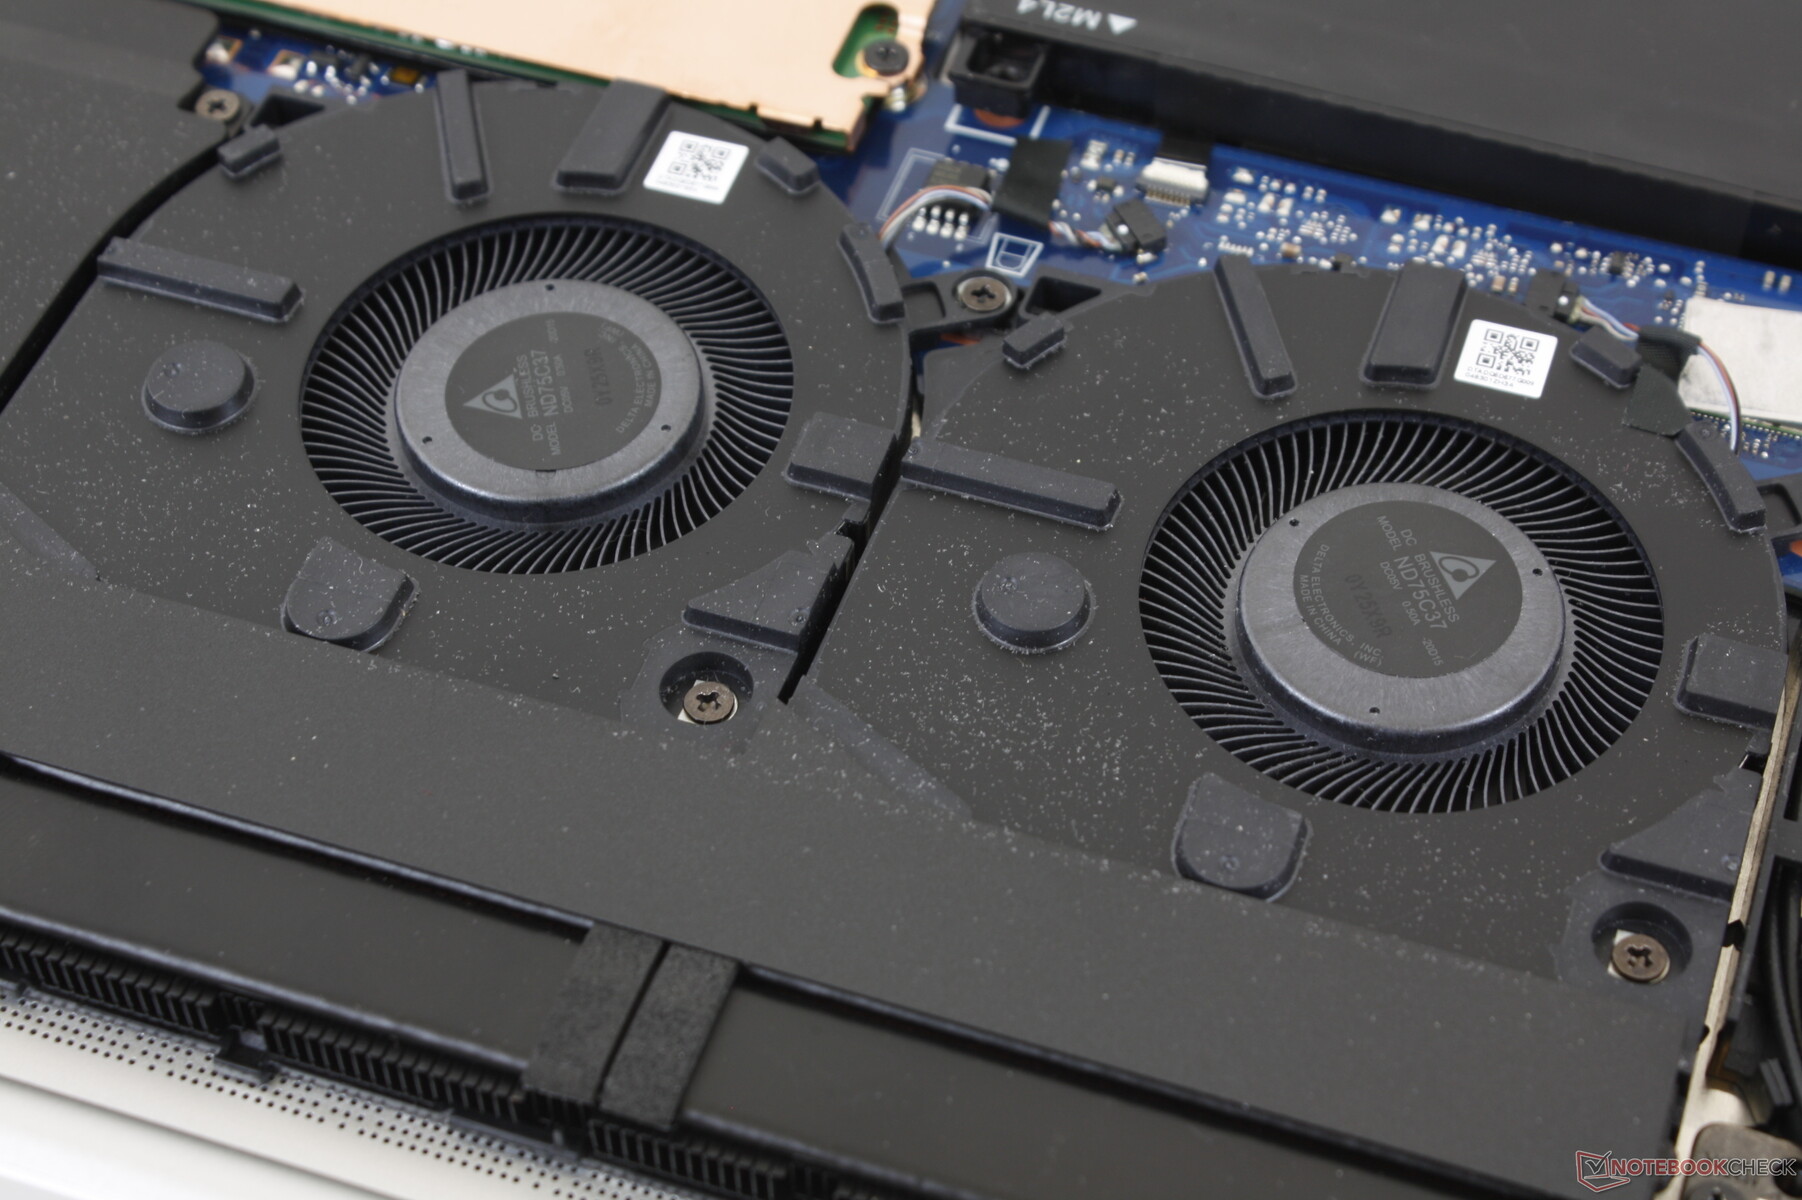
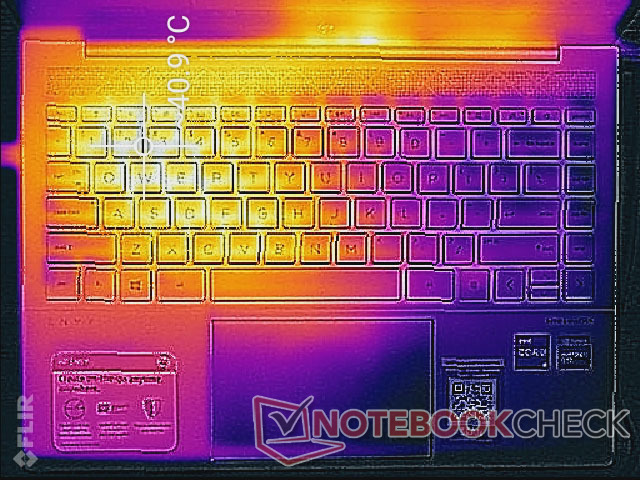
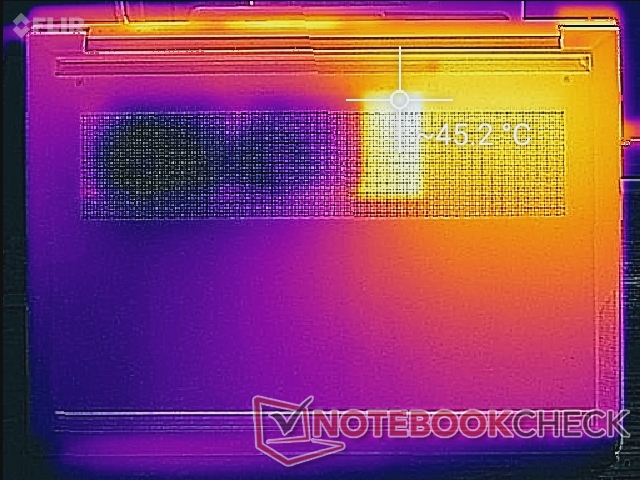
Surface temperatures are warmer on the left half of the laptop than the right due to how the processors are positioned inside. Interestingly, the cooling solution in the Envy 14 is asymmetric whereas it is symmetric in the Envy 15 resulting in very different surface temperature profiles between them. A more symmetrical gradient is preferable in order to keep the commonly used WASD keys as cool as possible and the palm rests at roughly equal temperatures when running high loads. Expect a slightly sweaty left hand during longer gaming sessions on the Envy.
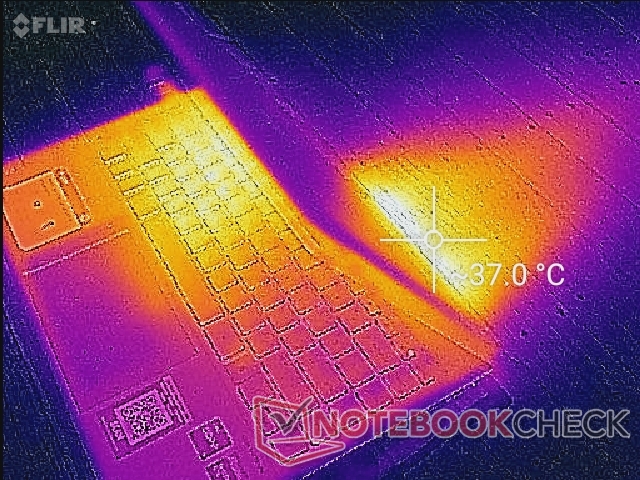
(±) The maximum temperature on the upper side is 41.2 °C / 106 F, compared to the average of 36.9 °C / 98 F, ranging from 21.1 to 71 °C for the class Multimedia.
(-) The bottom heats up to a maximum of 45.6 °C / 114 F, compared to the average of 39.2 °C / 103 F
(+) In idle usage, the average temperature for the upper side is 27.1 °C / 81 F, compared to the device average of 31.3 °C / 88 F.
(+) Playing The Witcher 3, the average temperature for the upper side is 29.6 °C / 85 F, compared to the device average of 31.3 °C / 88 F.
(+) The palmrests and touchpad are cooler than skin temperature with a maximum of 29.4 °C / 84.9 F and are therefore cool to the touch.
(±) The average temperature of the palmrest area of similar devices was 28.7 °C / 83.7 F (-0.7 °C / -1.2 F).
Stress Test
We stress the system with synthetic loads to identify for any potential throttling or stability issues. When running Prime95, the CPU would boost to 3.8 GHz before falling slightly to the 3.4 to 3.6 GHz range. Core temperature would sit comfortably at 80 C to be warmer than on most other Ultrabooks with U-series CPUs. The Core i7-1165G7 in the Lenovo IdeaPad Slim 9i, for example, would stabilize at just 70 C when under similar conditions albeit at slower clock rates. CPU and GPU temperatures stabilize at about 60 C each when running Witcher 3.
Running on battery power will limit graphics performance. A Fire Strike test on batteries would return Physics and Graphics scores of 12780 and 7227 points, respectively, compared to 12933 and 8131 points when on mains.
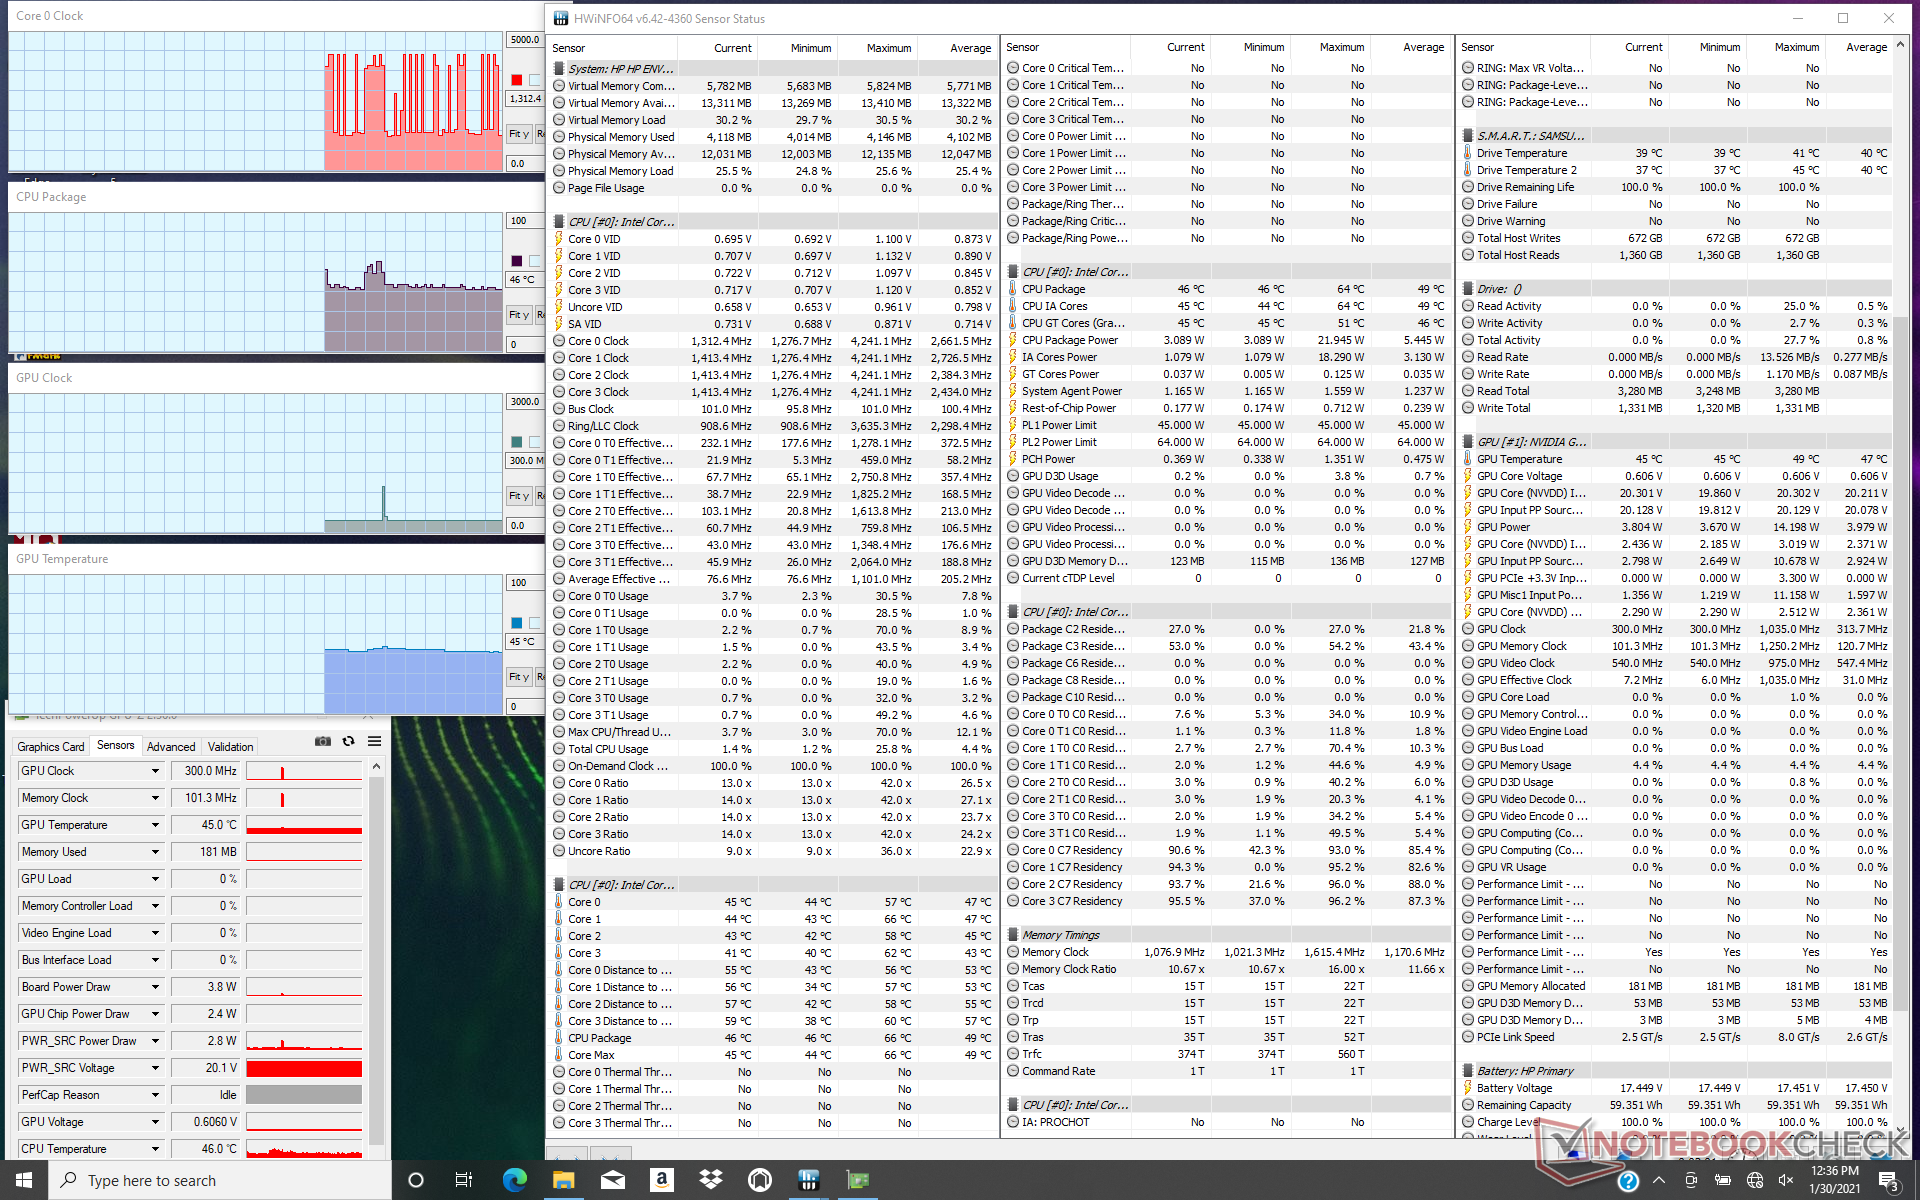
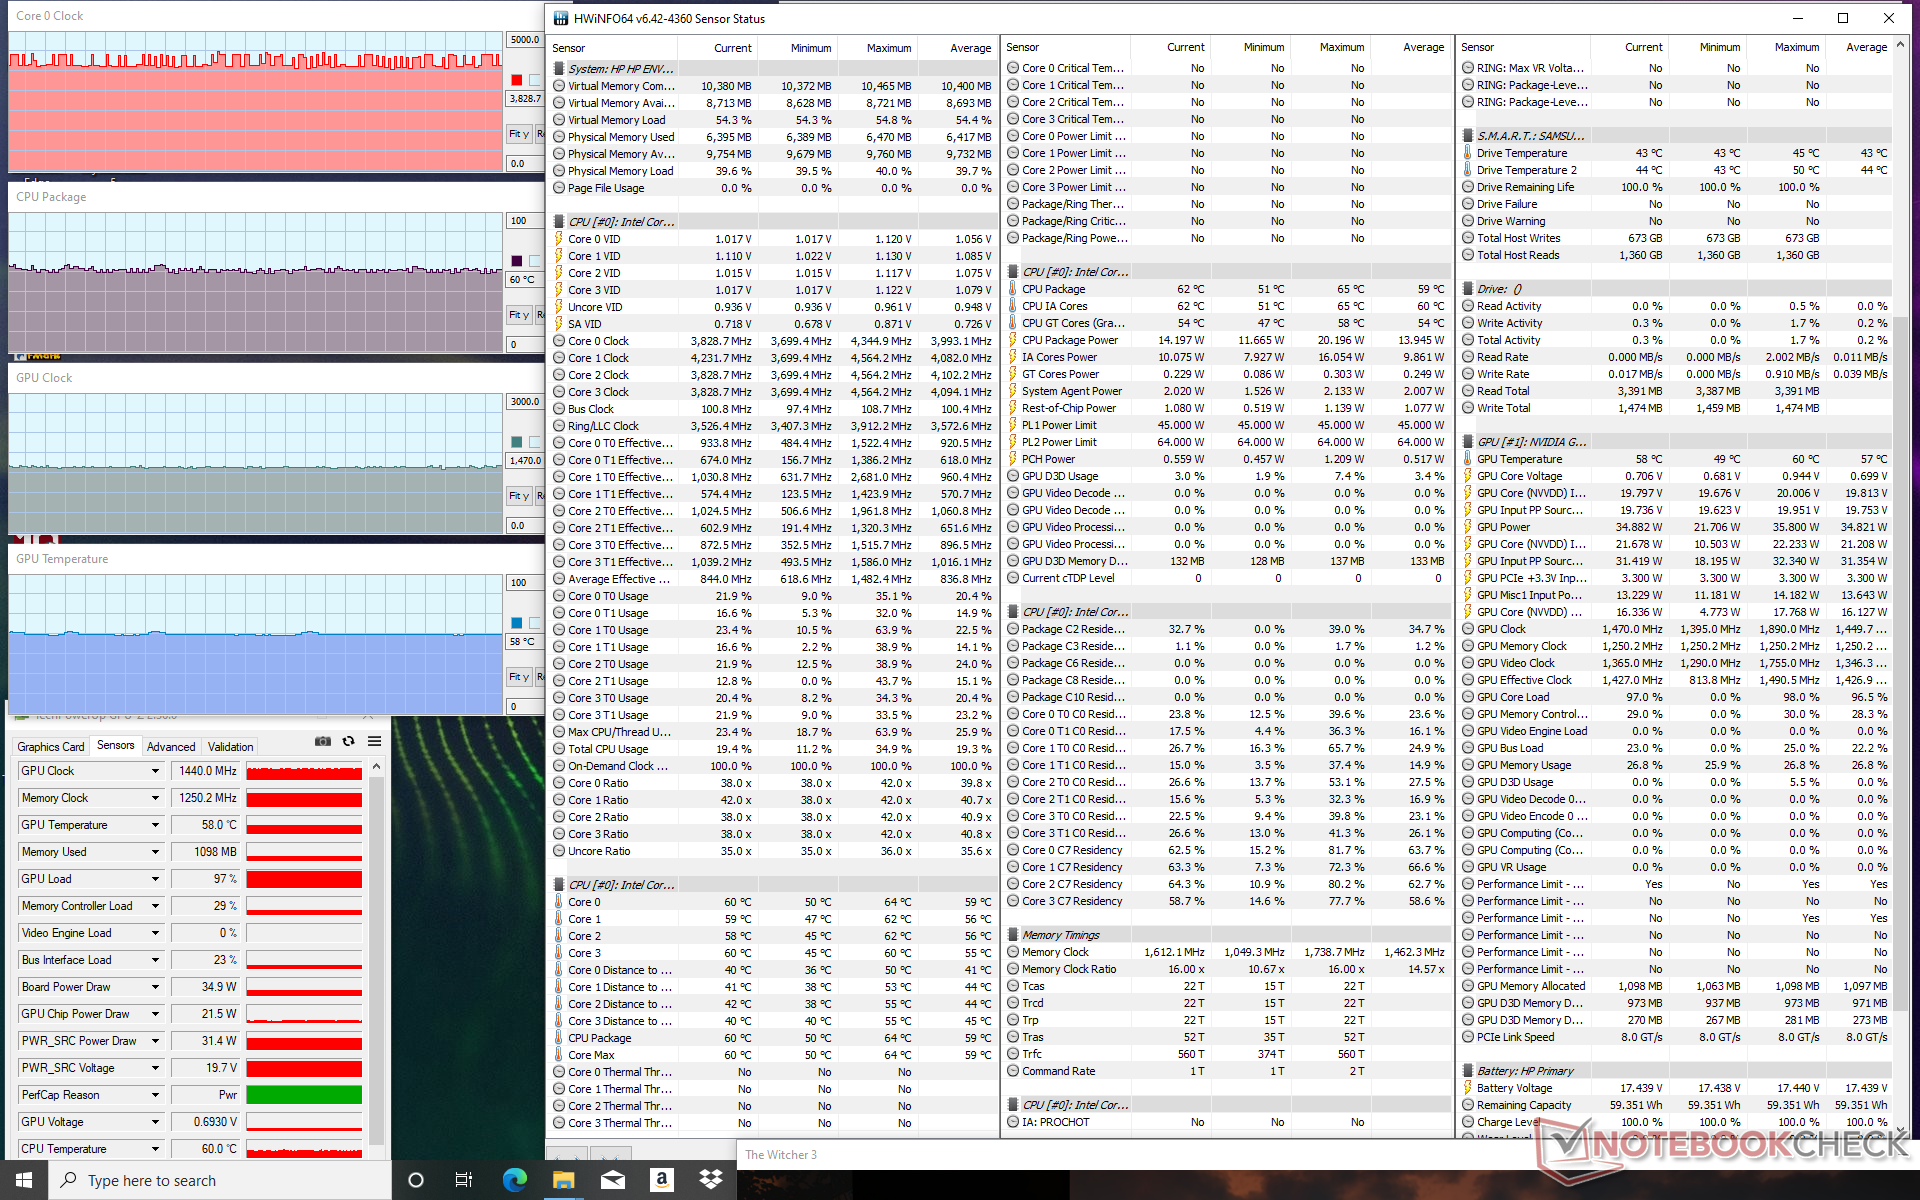
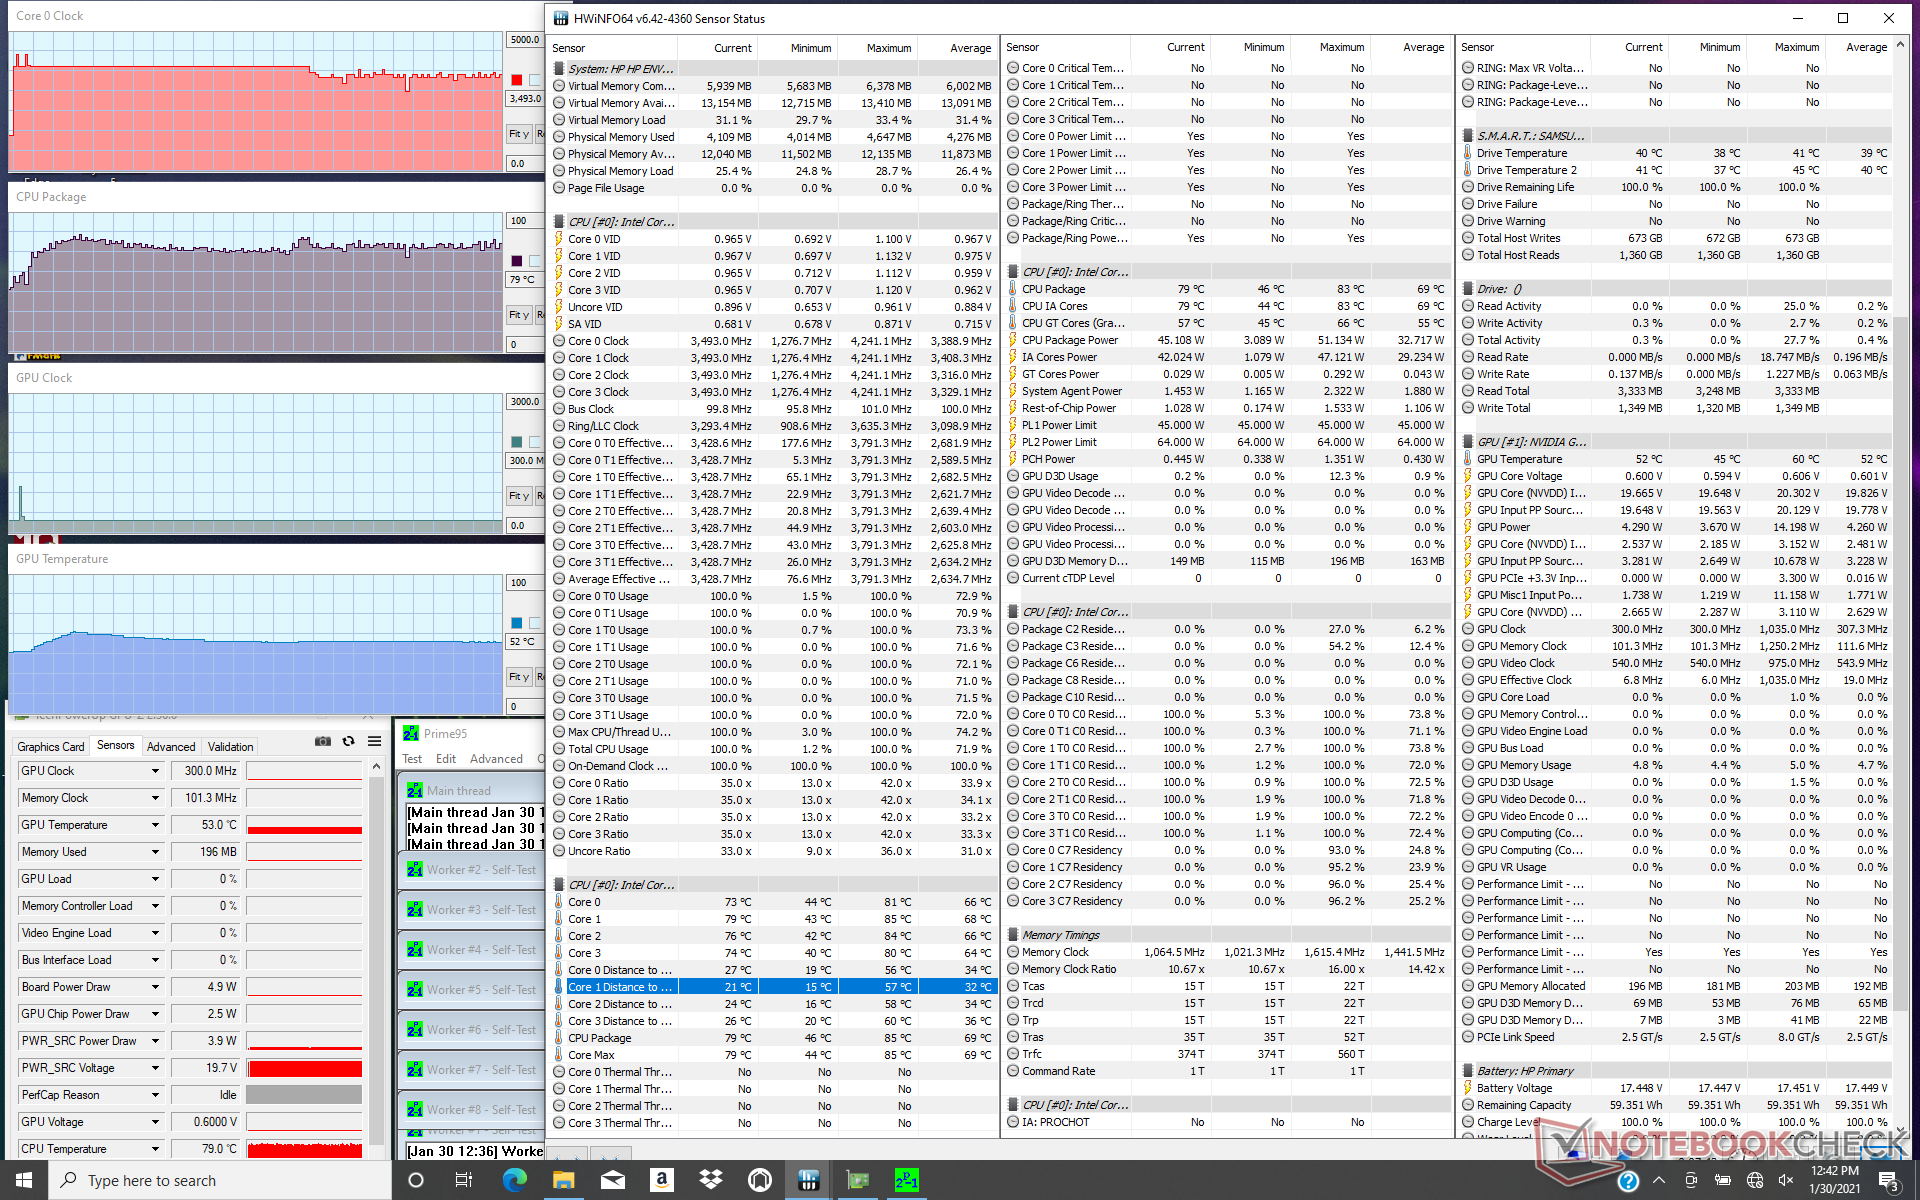
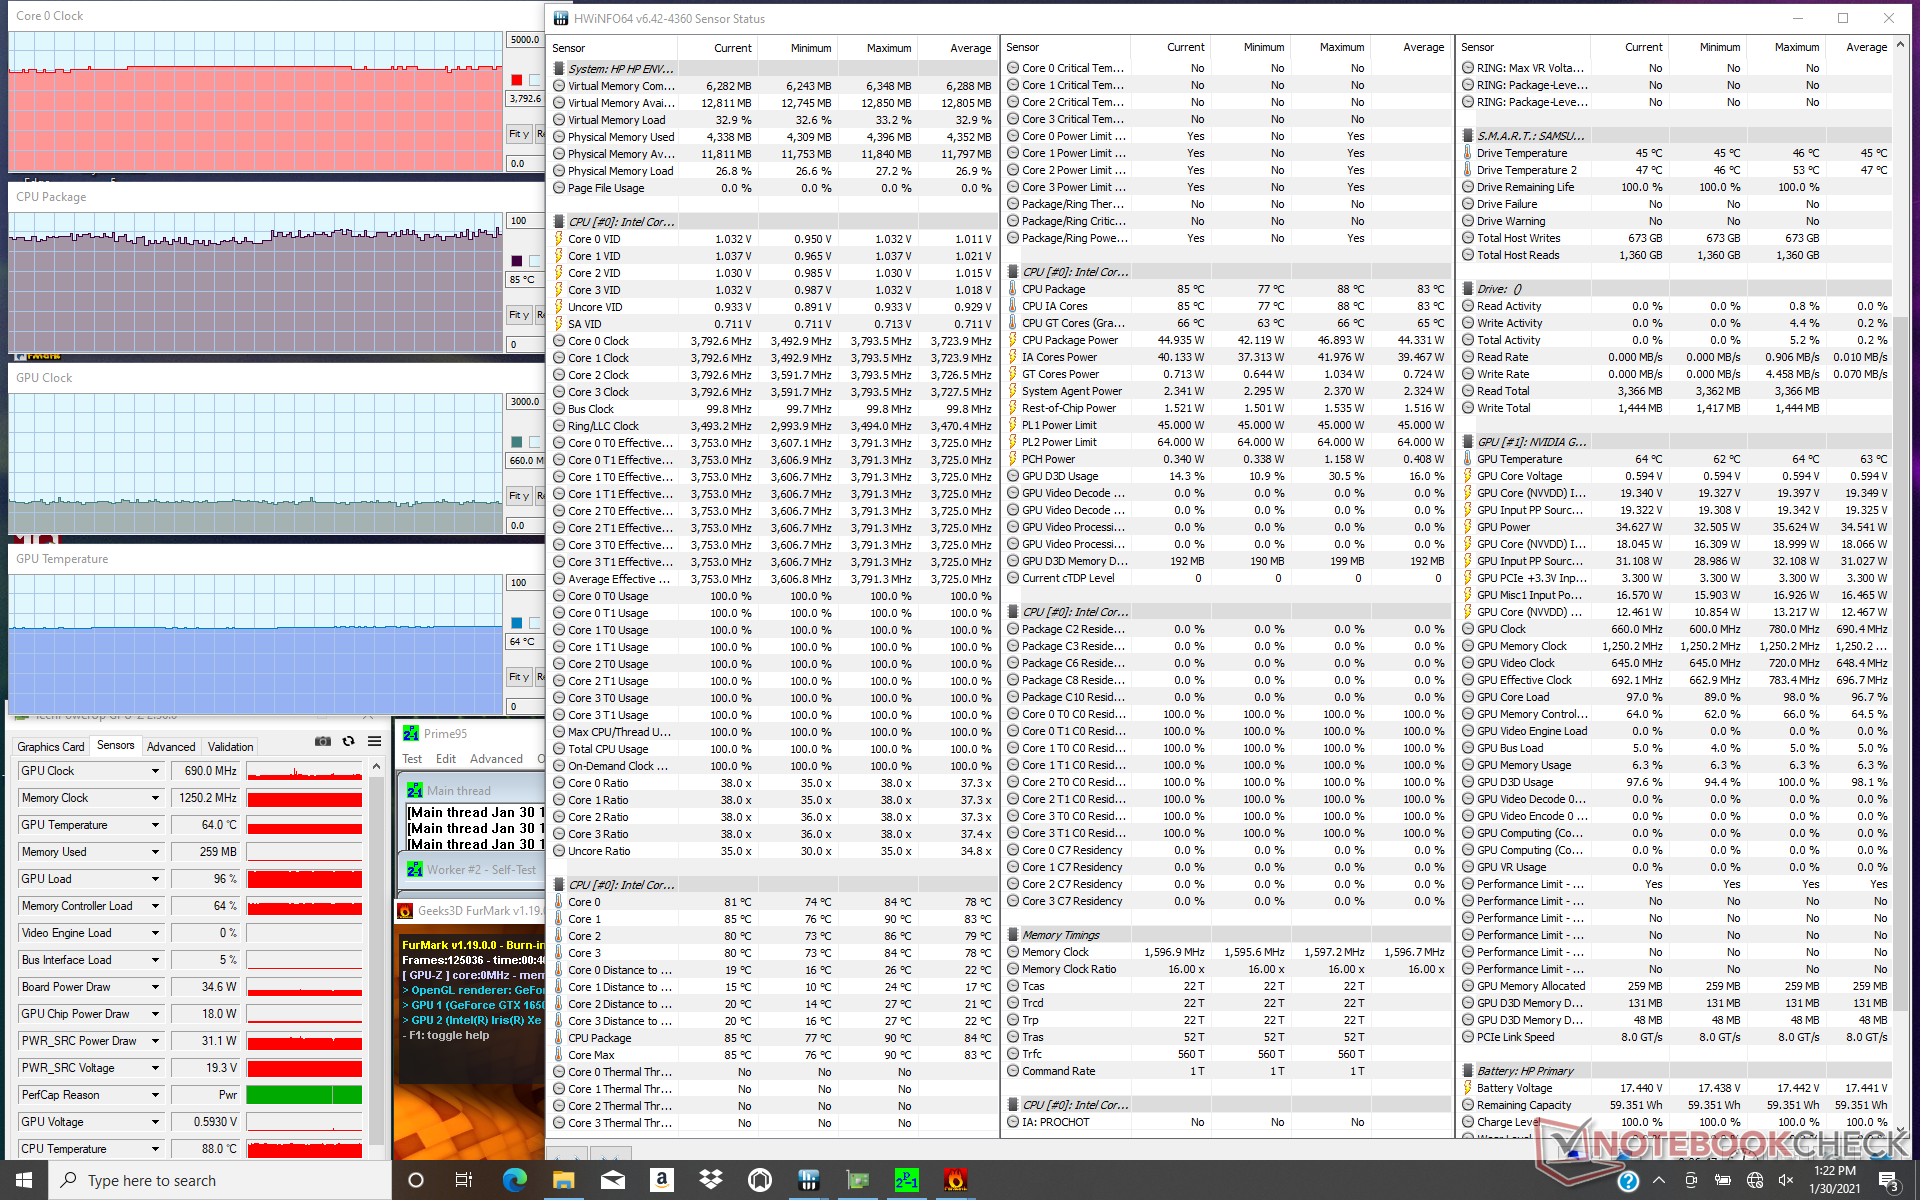
| CPU Clock (GHz) | GPU Clock (MHz) | Average CPU Temperature (°C) | Average GPU Temperature (°C) | |
| System Idle | -- | -- | 46 | 45 |
| Prime95 Stress | 3.4 - 3.6 | -- | ~80 | 52 |
| Prime95 + FurMark Stress | 3.7 - 3.8 | 690 | ~85 | 64 |
| Witcher 3 Stress | ~3.8 | 1440 | 60 | 58 |
Speakers


HP Envy 14-eb0010nr audio analysis
(+) | speakers can play relatively loud (82.8 dB)
Bass 100 - 315 Hz
(±) | reduced bass - on average 14.4% lower than median
(±) | linearity of bass is average (12.3% delta to prev. frequency)
Mids 400 - 2000 Hz
(+) | balanced mids - only 4.8% away from median
(+) | mids are linear (6.8% delta to prev. frequency)
Highs 2 - 16 kHz
(+) | balanced highs - only 2.8% away from median
(+) | highs are linear (3.3% delta to prev. frequency)
Overall 100 - 16.000 Hz
(+) | overall sound is linear (13.6% difference to median)
Compared to same class
» 27% of all tested devices in this class were better, 5% similar, 68% worse
» The best had a delta of 5%, average was 17%, worst was 45%
Compared to all devices tested
» 14% of all tested devices were better, 4% similar, 82% worse
» The best had a delta of 4%, average was 24%, worst was 134%
Apple MacBook 12 (Early 2016) 1.1 GHz audio analysis
(+) | speakers can play relatively loud (83.6 dB)
Bass 100 - 315 Hz
(±) | reduced bass - on average 11.3% lower than median
(±) | linearity of bass is average (14.2% delta to prev. frequency)
Mids 400 - 2000 Hz
(+) | balanced mids - only 2.4% away from median
(+) | mids are linear (5.5% delta to prev. frequency)
Highs 2 - 16 kHz
(+) | balanced highs - only 2% away from median
(+) | highs are linear (4.5% delta to prev. frequency)
Overall 100 - 16.000 Hz
(+) | overall sound is linear (10.2% difference to median)
Compared to same class
» 7% of all tested devices in this class were better, 2% similar, 91% worse
» The best had a delta of 5%, average was 18%, worst was 53%
Compared to all devices tested
» 4% of all tested devices were better, 1% similar, 94% worse
» The best had a delta of 4%, average was 24%, worst was 134%
Energy Management
Power Consumption
Idling on desktop demands between 4 W and 20 W depending on the brightness setting, power setting, and whether the integrated GPU or discrete GPU is active. It's certainly recommended to reduce these settings if simply web browsing or video streaming to extend battery life.
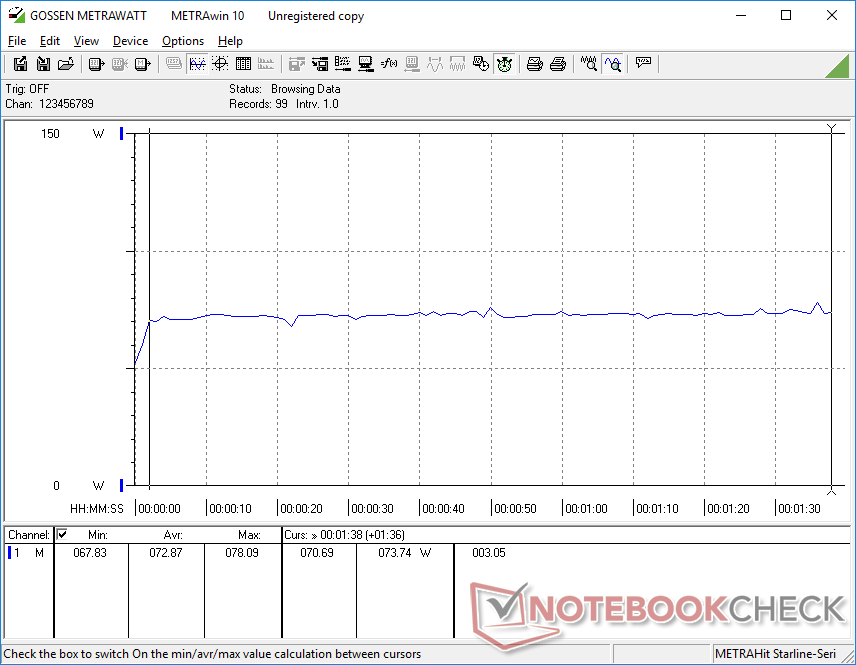
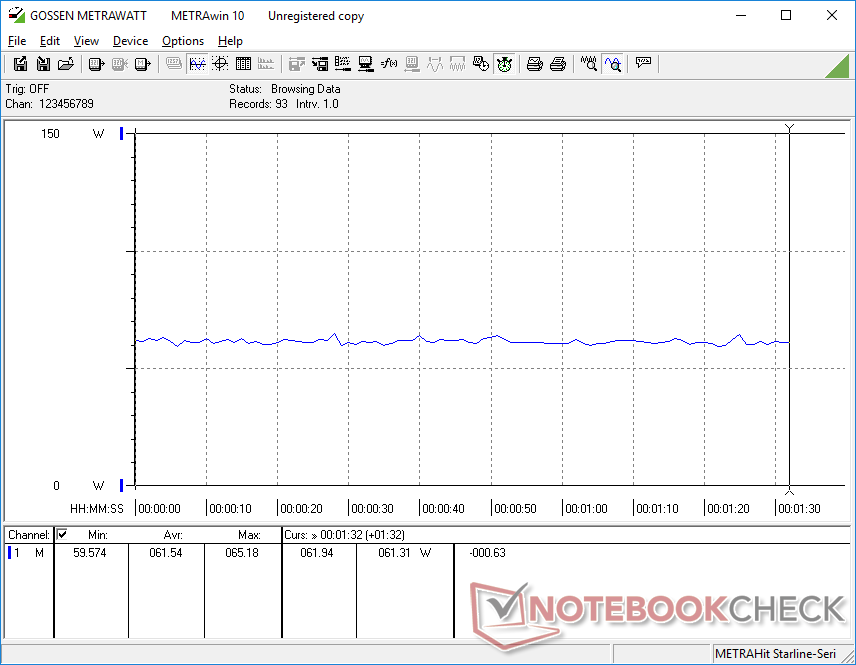
Gaming will demand between 62 W to 72 W to be about 75 percent more than most Ultrabooks powered solely by a U-series Tiger Lake CPU and its integrated Iris Xe GPU. Of course, users get roughly 2x the graphics boost in return.
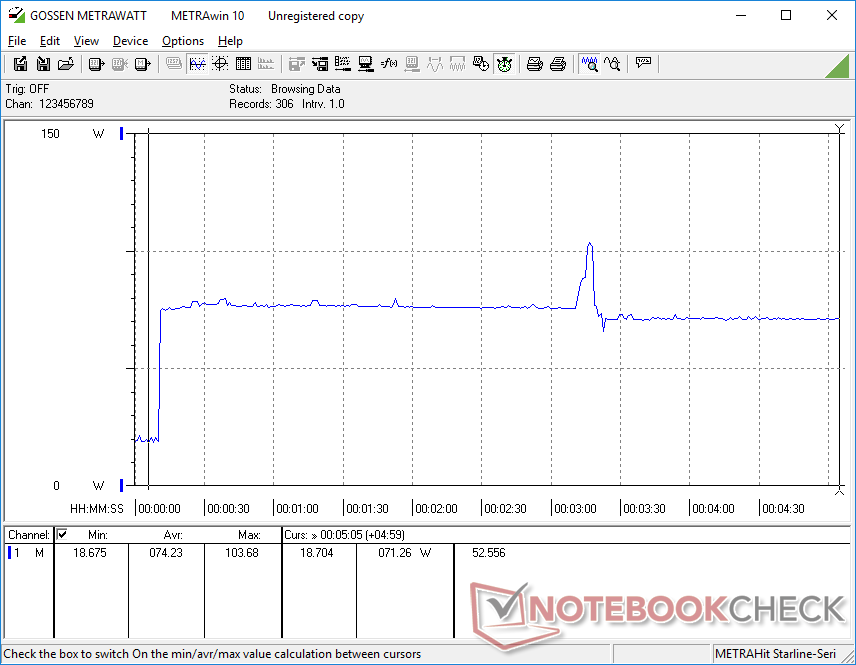
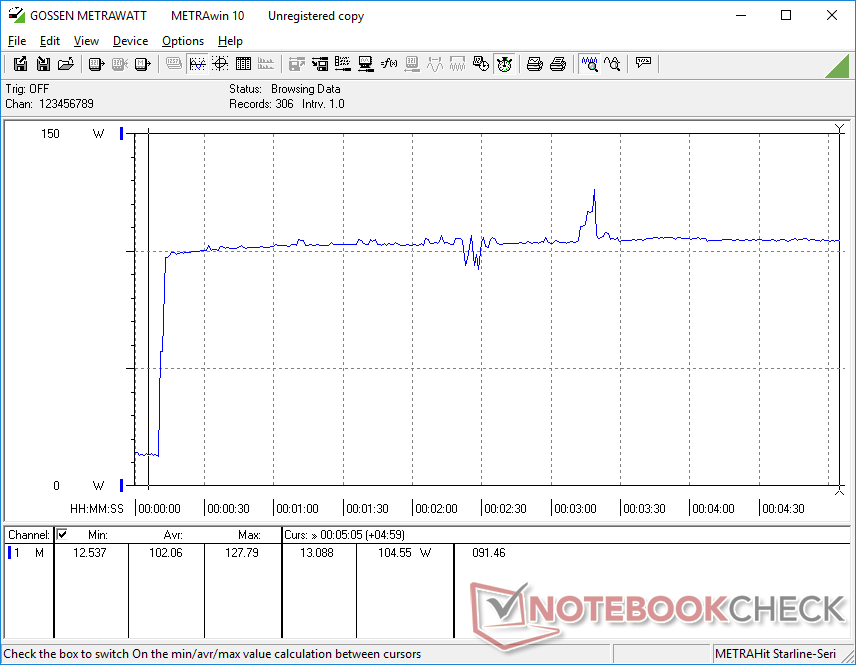
It's worth noting that power consumption doesn't dip when running extreme processing loads as shown by our graphs below to indicate excellent Turbo Boost sustainability. Most other laptops with U-series CPUs would exhibit strong initial spikes in power consumption before falling steeply due to the more limited thermal soak of their cooling solutions.
| Off / Standby | |
| Idle | |
| Load |
|
Key:
min: | |
| HP Envy 14-eb0010nr i5-1135G7, GeForce GTX 1650 Ti Max-Q, Samsung SSD PM981a MZVLB256HBHQ, IPS, 1920x1200, 14" | Lenovo IdeaPad Slim 9i 14ITL5 i7-1165G7, Iris Xe G7 96EUs, WDC PC SN730 SDBPNTY-512G, IPS, 3840x2160, 14" | Asus ZenBook Duo 14 UX482EA i7-1165G7, Iris Xe G7 96EUs, SK Hynix HFM512GD3JX013N, IPS, 1920x1080, 14" | HP Spectre x360 14t-ea000 i7-1165G7, Iris Xe G7 96EUs, Samsung SSD PM981a MZVLB512HBJQ, IPS, 1920x1280, 13.5" | Dell Inspiron 14 3493-4KWCF i7-1065G7, GeForce MX230, Toshiba KBG40ZNS512G NVMe, IPS, 1920x1080, 14" | Huawei MateBook 14 2020 Intel i7-10510U, GeForce MX350, Lite-On CA5-8D512, IPS LED, 2160x1440, 14" | |
|---|---|---|---|---|---|---|
| Power Consumption | 33% | 39% | 51% | 39% | 33% | |
| Idle Minimum * (Watt) | 4.2 | 4.5 -7% | 3.6 14% | 3 29% | 4.7 -12% | 3 29% |
| Idle Average * (Watt) | 18.3 | 10.5 43% | 9.3 49% | 5.1 72% | 6.6 64% | 9 51% |
| Idle Maximum * (Watt) | 19.2 | 10.6 45% | 10 48% | 6.4 67% | 5.9 69% | 11 43% |
| Load Average * (Watt) | 72.9 | 44.2 39% | 40.6 44% | 39.6 46% | 56 23% | 60.8 17% |
| Witcher 3 ultra * (Watt) | 61.5 | 45.8 26% | 44.3 28% | 39.6 36% | 56 9% | |
| Load Maximum * (Watt) | 127.8 | 61.9 52% | 62.4 51% | 56.2 56% | 60.2 53% | 65.6 49% |
* ... smaller is better
Battery Life
Runtimes are excellent at almost 11 hours of real-world WLAN use. However, be sure to select Balanced mode or lower via HP Command Center and enable the integrated GPU via Nvidia Control Panel to reduce unnecessary power consumption or else runtimes will be shorter.
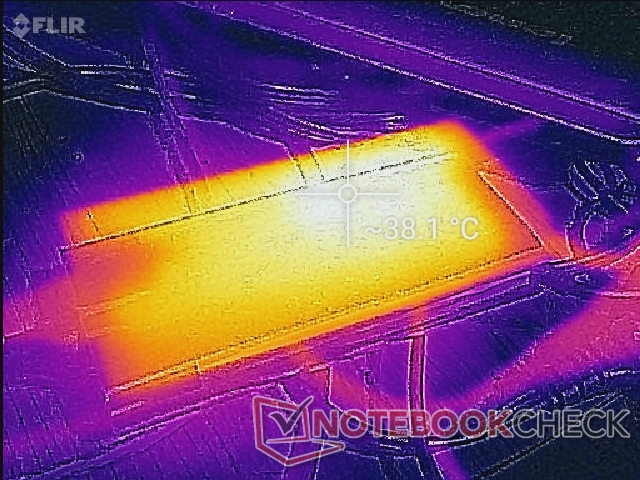
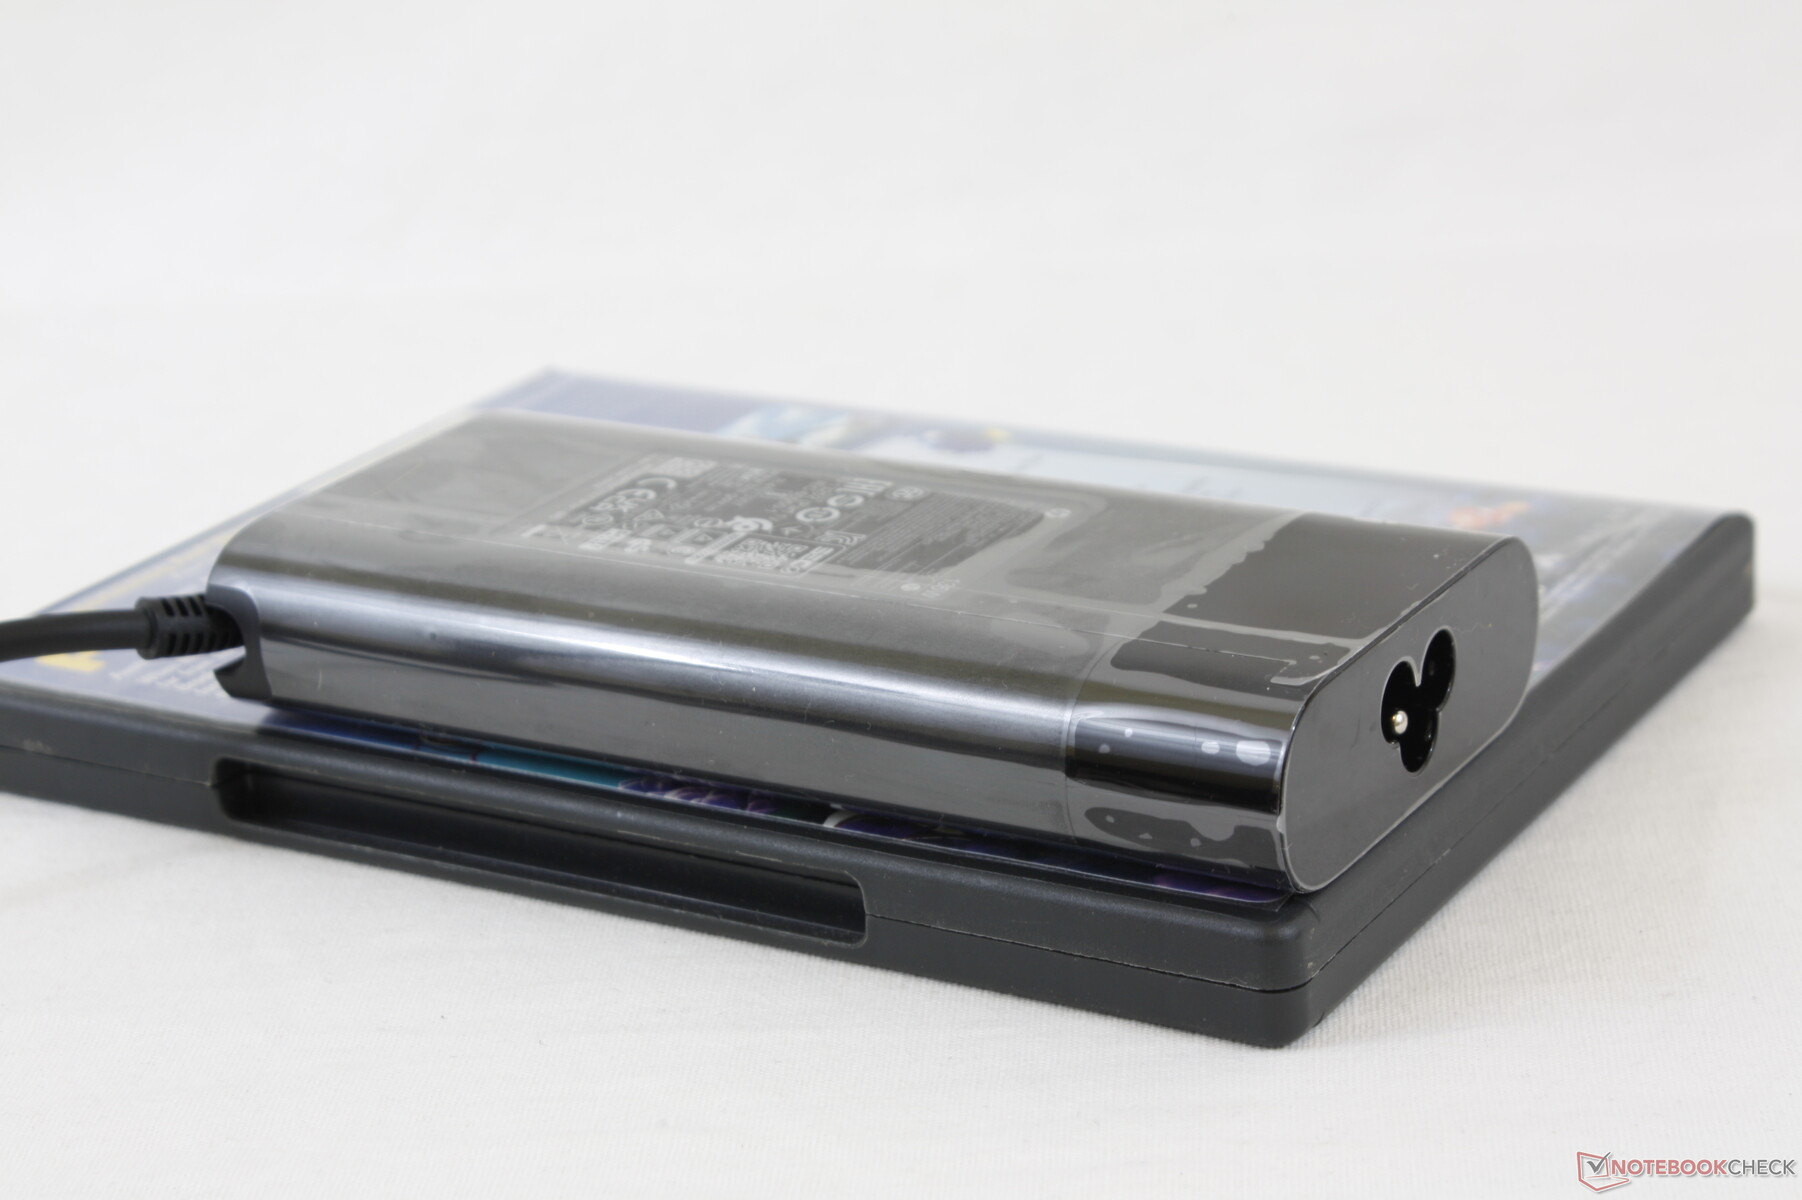
Charging from empty to full takes just over 1.5 hours. Generic USB-C power adapters can also recharge the laptop albeit at a slower rate than the proprietary (~13.7 x 6.5 x 2.2 cm) 135 W AC adapter. Running extreme loads will not slowly drain the battery when the 135 W adapter is connected.
| HP Envy 14-eb0010nr i5-1135G7, GeForce GTX 1650 Ti Max-Q, 63.3 Wh | Lenovo IdeaPad Slim 9i 14ITL5 i7-1165G7, Iris Xe G7 96EUs, 63.5 Wh | Asus ZenBook Duo 14 UX482EA i7-1165G7, Iris Xe G7 96EUs, 70 Wh | HP Spectre x360 14t-ea000 i7-1165G7, Iris Xe G7 96EUs, 66 Wh | Dell Inspiron 14 3493-4KWCF i7-1065G7, GeForce MX230, 42 Wh | Huawei MateBook 14 2020 Intel i7-10510U, GeForce MX350, 56 Wh | |
|---|---|---|---|---|---|---|
| Battery runtime | 27% | 68% | 33% | -28% | 26% | |
| Reader / Idle (h) | 27.7 | 40.1 45% | 36.8 33% | 36.4 31% | 13.8 -50% | |
| WiFi v1.3 (h) | 10.8 | 11 2% | 8.4 -22% | 11.8 9% | 6.5 -40% | 12.8 19% |
| Load (h) | 1.5 | 2 33% | 4.4 193% | 2.4 60% | 1.6 7% | 2 33% |
Pros
Cons
Verdict
Almost every Ultrabook smaller than 15.6-inches with a Core U-series CPU will have limited CPU Turbo Boost sustainability and low-power integrated or GeForce MX graphics. Though this isn't an issue for most users, power users who want stronger CPU and GPU performance would typically have to settle for larger 15.6-inch models where powerful GeForce GTX options are more readily available. The 2021 Envy 14 is one of the few 14-inch laptops to properly exploit the high Turbo Boost clock rates of Tiger Lake and support the same GeForce GTX options as the larger Spectre x360 15 and Dell XPS 15 series. If you want the fastest 14-inch 16:10 laptop available, then look no further.
The Envy 14 strikes a great balance between the portability of a 14-inch subnotebook and the high performance of a 15.6-inch multimedia laptop. If you like to do a lot of heavy graphics work while traveling or jumping between classes, then this compact HP will be right at home.
Aside from the strong performance, other physical features deserve praise including the firm keyboard keys, easy serviceability, and healthy selection of integrated ports. The "USB-C only" trend with difficult-to-access SSDs are making many other 14-inch or 13-inch laptops overly reliant on USB-C adapters.
The system isn't perfect as exemplified by our long list of cons. In particular, the hinges could be stiffer at wider angles while the bottom plate could be tighter around its corners. Some users might not like the positioning of the fingerprint reader and an IR camera is conspicuously missing for Windows Hello support. Owners should expect louder fan noise and warmer temperatures than most other subnotebooks when running demanding loads which shouldn't be a surprising revelation due to the high performance target of the Envy 14.

Price and availability
Our exact configuration with the Core i5-1135G7 CPU, 256 GB SSD, and GeForce GTX 1650 Ti Max-Q GPU is currently available on Best Buy and Amazon for about $1250 USD. Newegg has the system for $1630. The official HP online store also has this configuration alongside many more starting at $999.
Notebookcheck may receive commissions from purchases made through our affiliate links
HP Envy 14-eb0010nr
- 02/02/2021 v7 (old)
Allen Ngo
Price comparison
