 Deutsch
 English
 Español
 Français
 Italiano
 Nederlands
 Polski
 Português
 Русский
 Türkçe
 Svenska
 Chinese
 Magyar
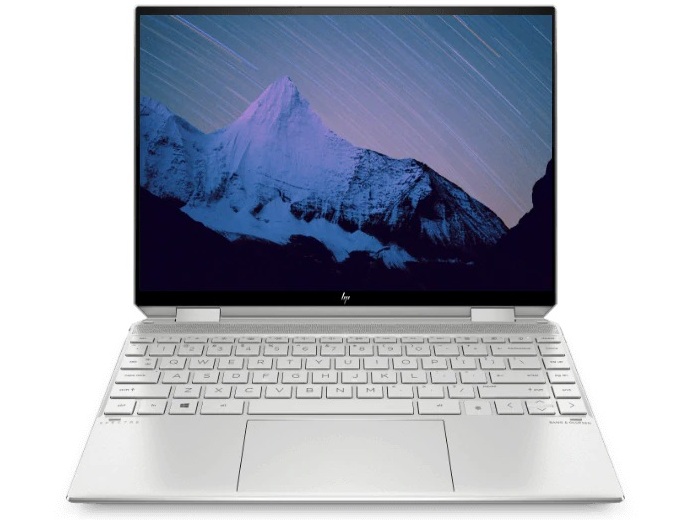
HP Spectre x360 14 Convertible Review: An Instant Favorite
The Spectre x360 14 is HP's latest flagship convertible in its high-end Spectre series joining the existing 13.3-inch Spectre x360 13 and 15.6-inch Spectre x360 15. Despite what its name may suggest, the Spectre x360 14 utilizes a 13.5-inch display instead of a 14-inch one but in a squarer 3:2 form factor that's becoming increasingly common on newer Ultrabooks. HP is hoping to capture a wider audience of professionals and office users with the new aspect ratio as opposed to the traditional 16:9.
Current configurations range from FHD (1920 x 1280) to OLED (3000 x 2000) with 400 nit or 1000 nit options, the Core i5-1135G7 or Core i7-1165G7 CPU, 8 GB to 16 GB of RAM, and up to 2 TB of SSD storage starting at $1300 to over $1700 USD. All options come with integrated Iris Xe graphics only. Our specific test unit is a middle configuration sporting the Core i7 CPU, 400-nit FHD touchscreen, and 512 GB SSD for approximately $1500 USD.
Competitors in this space include other 16:10 or 3:2 subnotebooks like the Huawei MateBook X Pro, Microsoft Surface Laptop 3 13, Dell XPS 13 9300, Razer Book 13, or Asus ZenBook S.
More HP reviews:
potential competitors in comparison
Rating | Date | Model | Weight | Height | Size | Resolution | Best Price |
|---|---|---|---|---|---|---|---|
| 89.4 % | 12/2020 | HP Spectre x360 14t-ea000 i7-1165G7, Iris Xe G7 96EUs | 1.3 kg | 17.2 mm | 13.50" | 1920x1280 | |
| 88.4 % | 12/2019 | HP Spectre x360 13-aw0013dx i7-1065G7, Iris Plus Graphics G7 (Ice Lake 64 EU) | 1.2 kg | 16.9 mm | 13.30" | 1920x1080 | |
| 86.3 % | 10/2019 | Dell XPS 13 7390 2-in-1 Core i7 i7-1065G7, Iris Plus Graphics G7 (Ice Lake 64 EU) | 1.3 kg | 13 mm | 13.40" | 1920x1200 | |
| 86.3 % | 12/2020 | Huawei MateBook 14 2020 Intel i7-10510U, GeForce MX350 | 1.5 kg | 15.9 mm | 14.00" | 2160x1440 | |
| 85.1 % | 10/2020 | Asus Zenbook S UX393JA i7-1065G7, Iris Plus Graphics G7 (Ice Lake 64 EU) | 1.4 kg | 15.7 mm | 13.90" | 3300x2200 | |
| 87.1 % | 12/2020 | Lenovo Yoga 9i 14ITL5 i5-1135G7, Iris Xe G7 80EUs | 1.4 kg | 15.7 mm | 14.00" | 1920x1080 |
Case
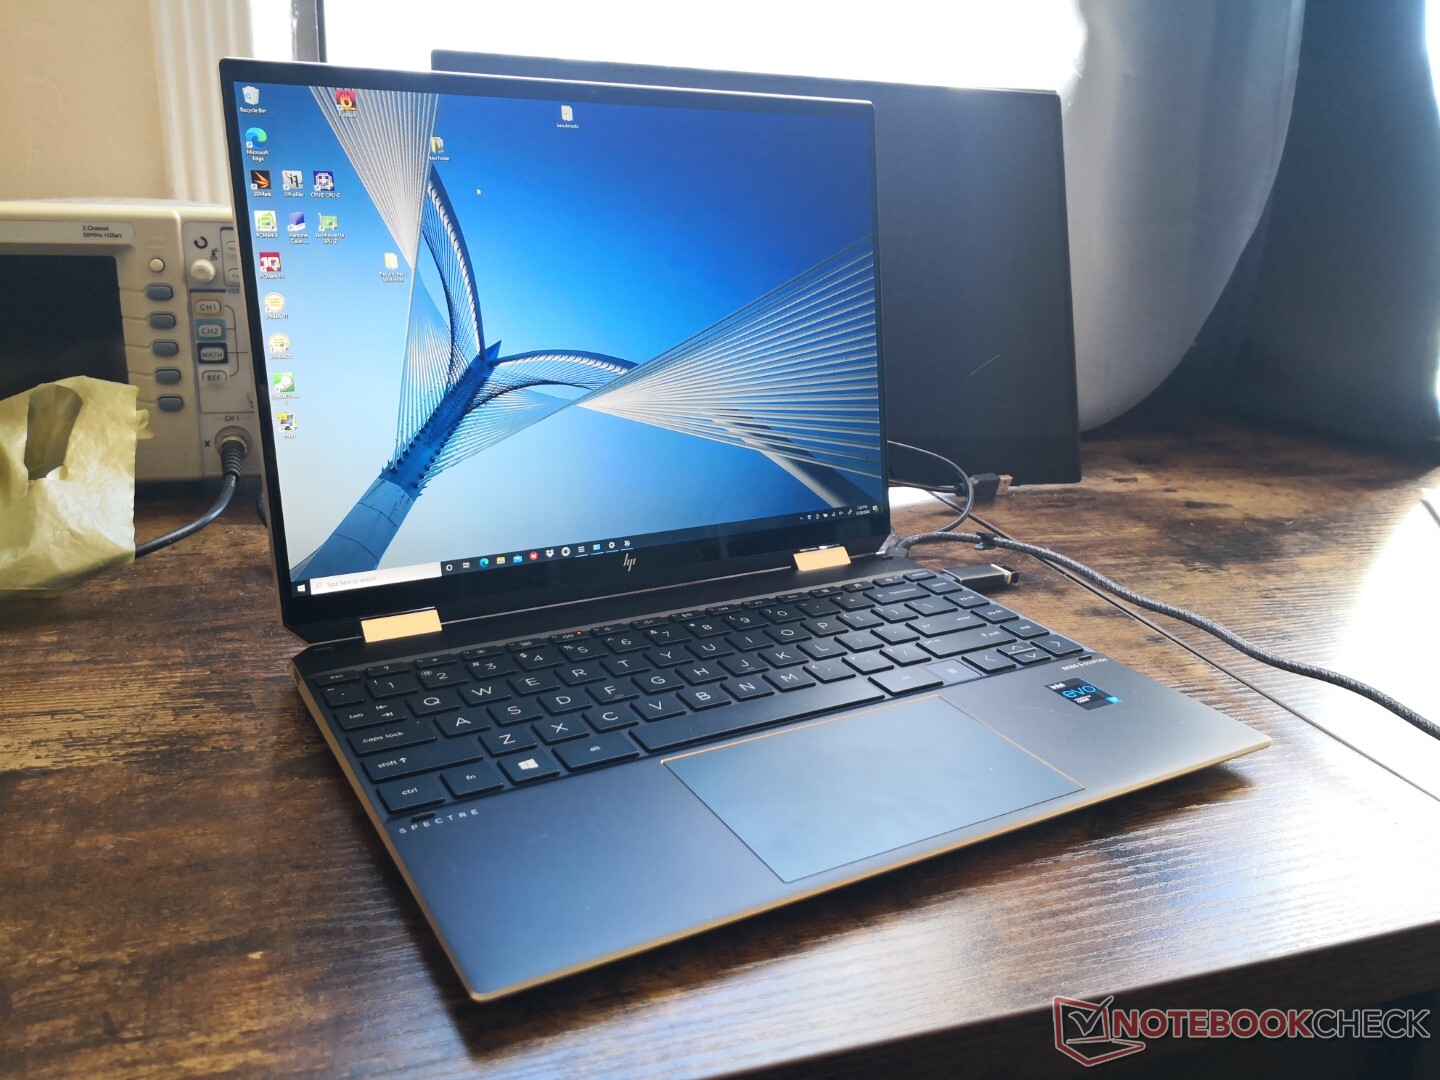
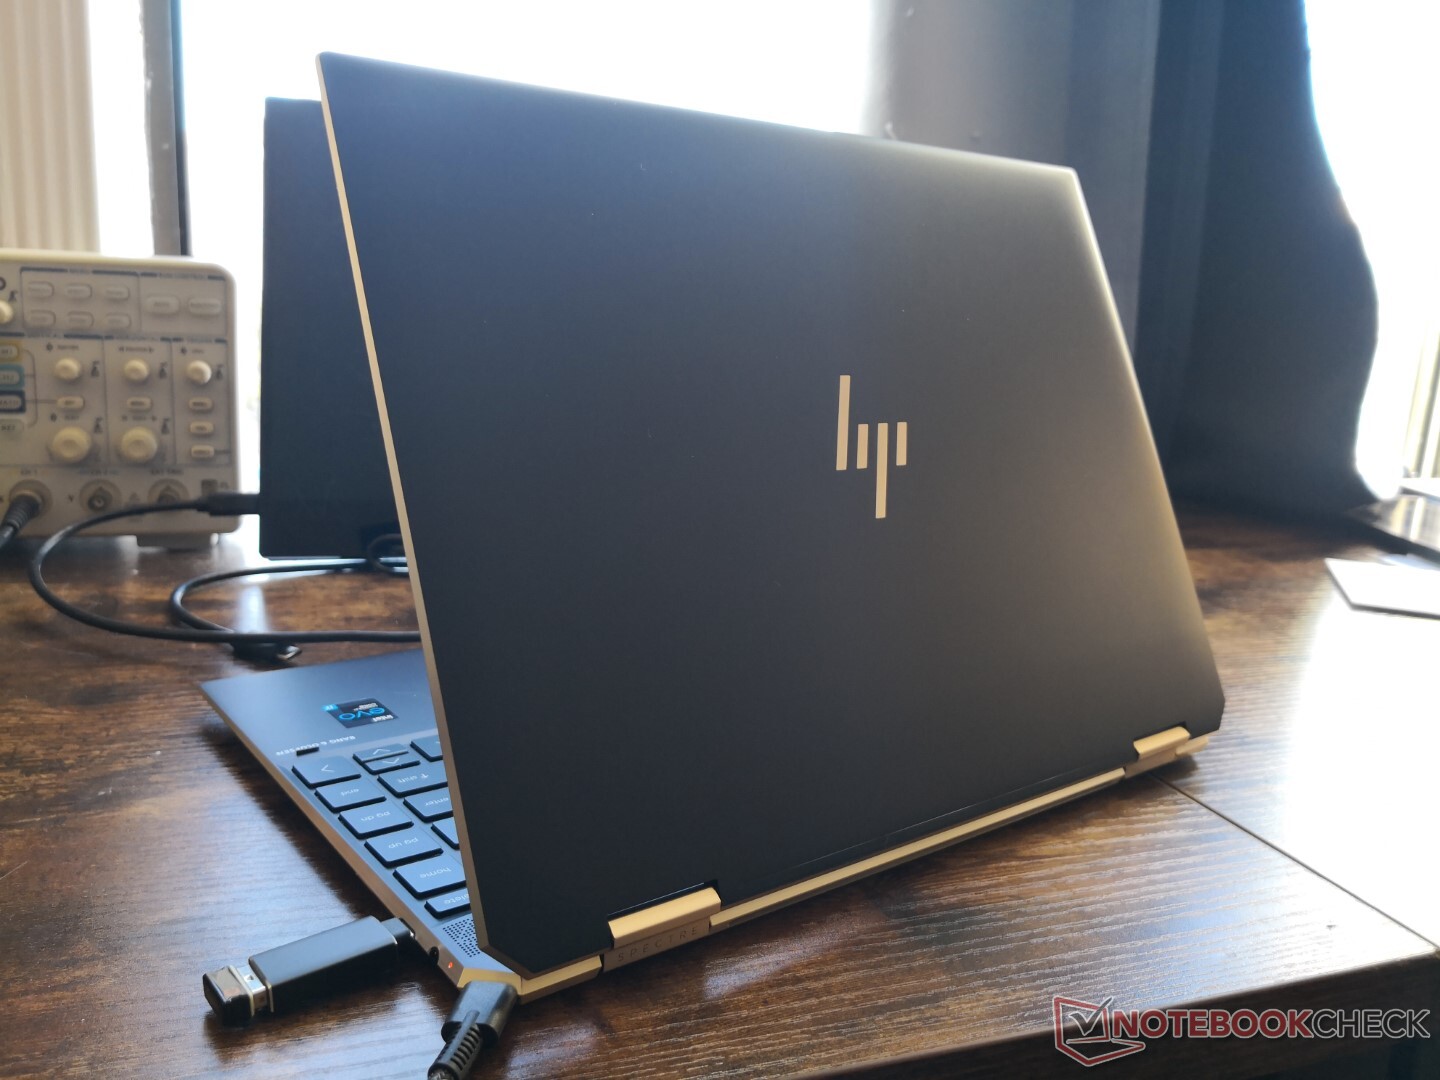
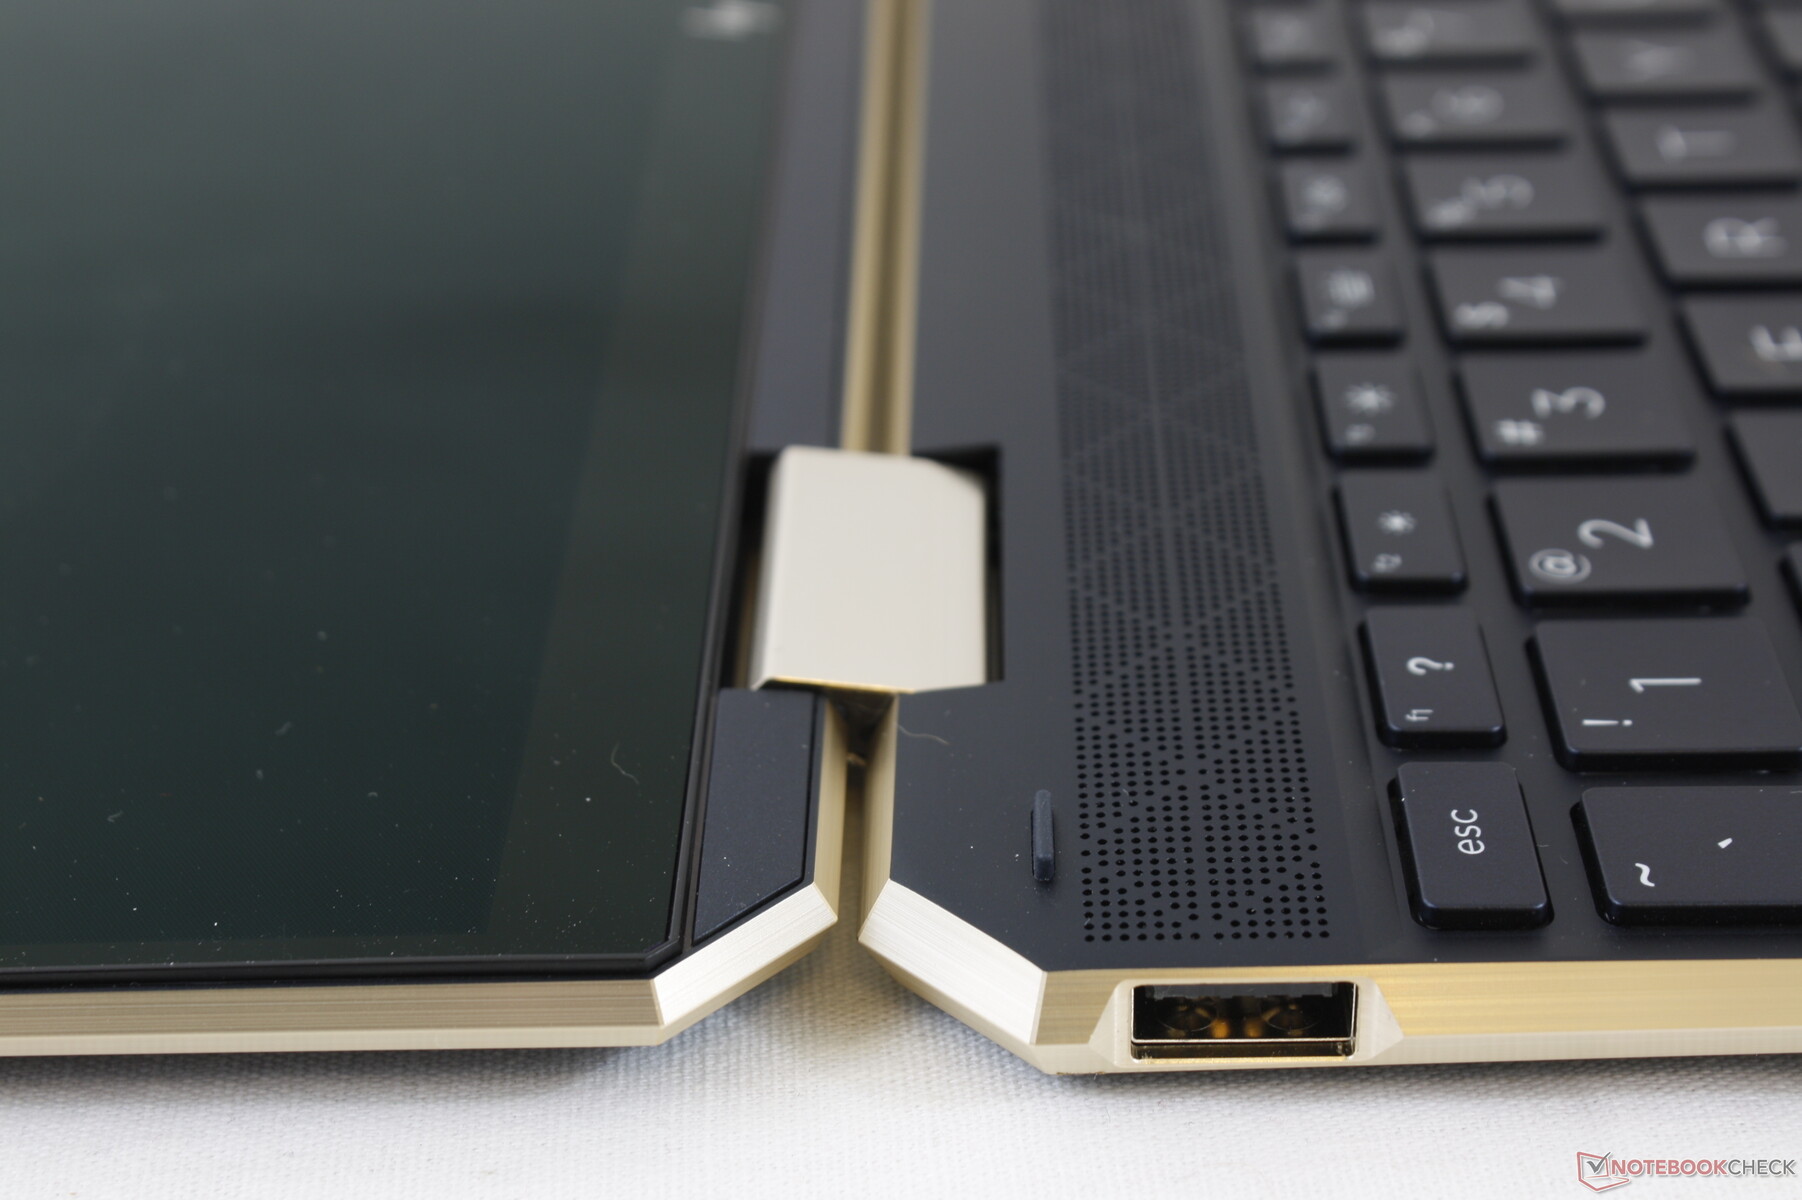
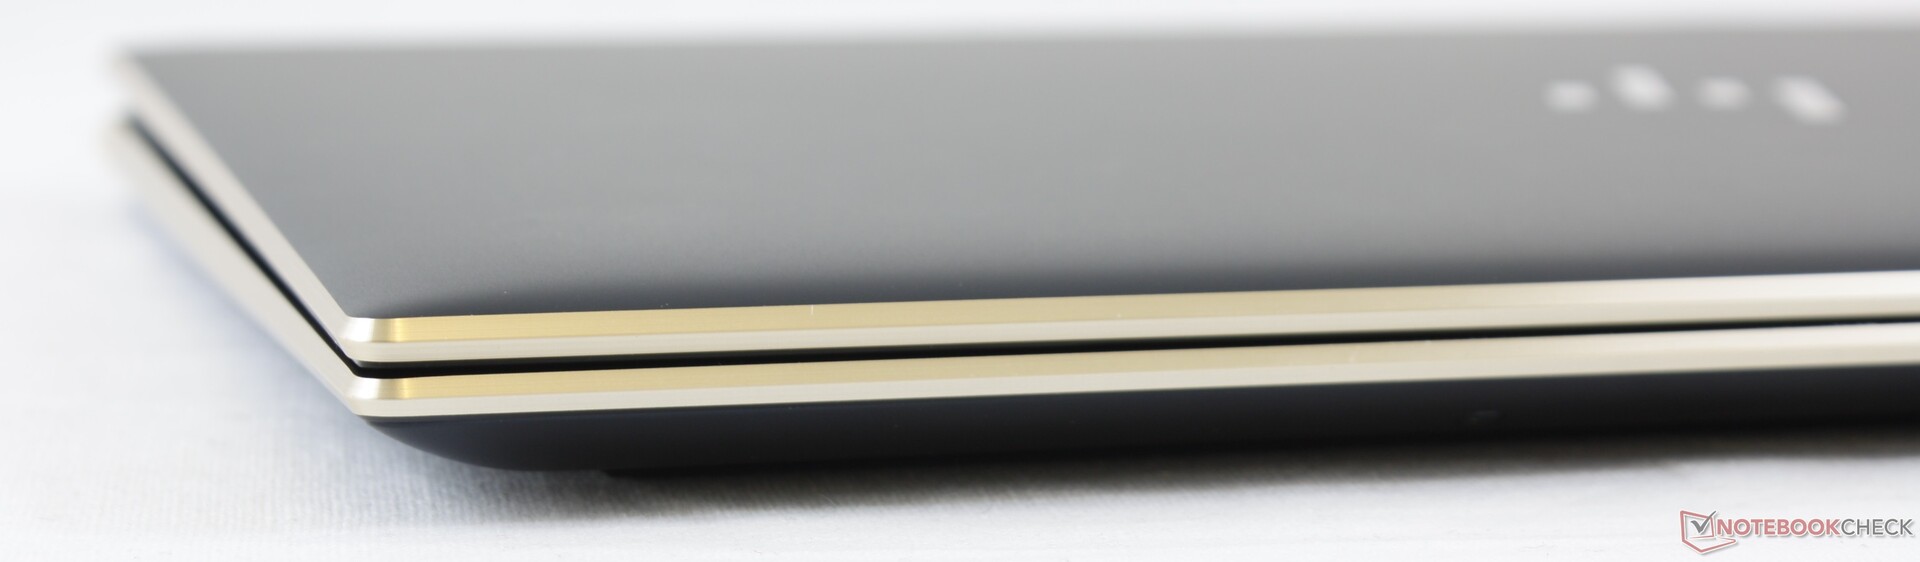
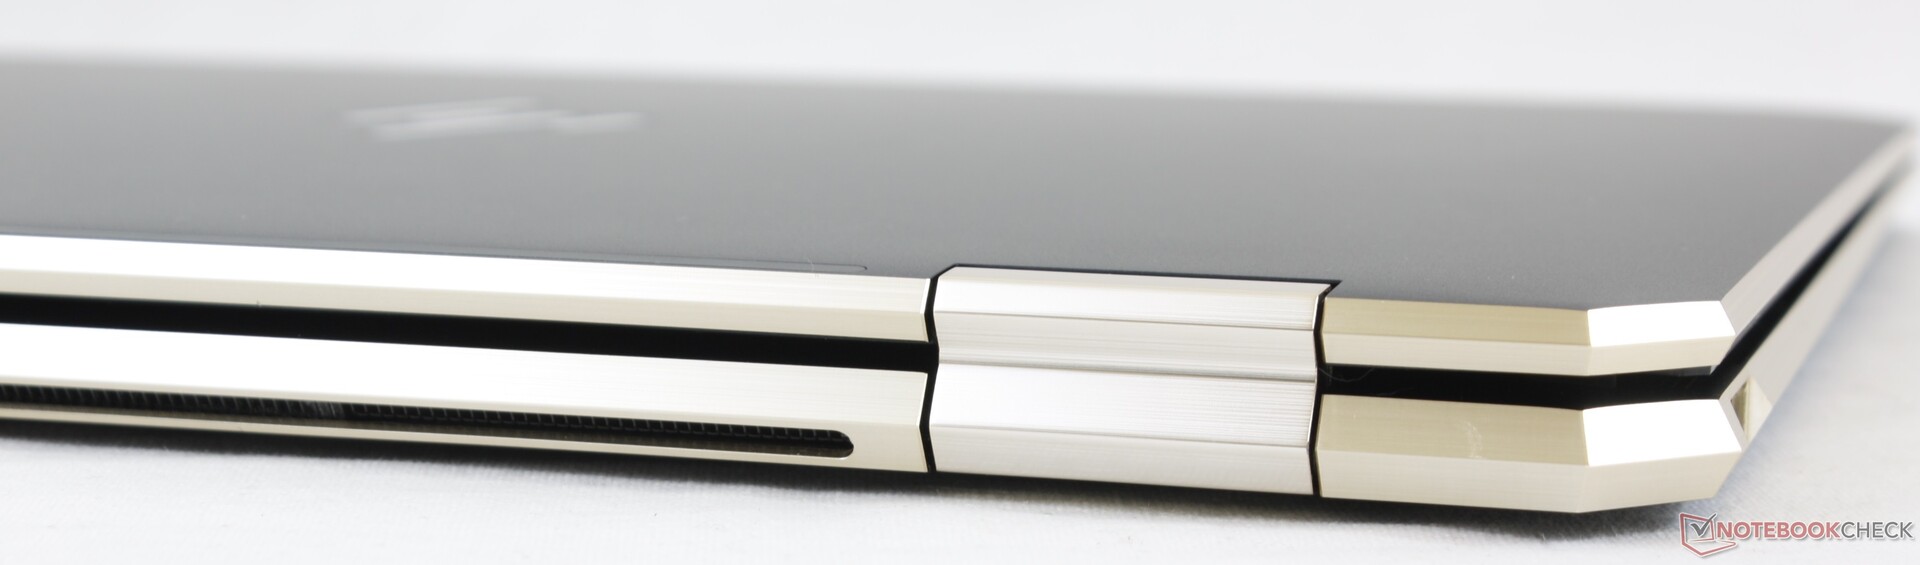
If you've handled a Spectre x360 13 or 15 in the past, then you'll know exactly what to expect from the Spectre x360 14. HP has translated the existing luxurious Spectre design and metal materials to the new 3:2 form factor without any surprises. Both the base and lid exhibit little flexing and no creaking when attempting to twist their corners or depress their surfaces. Chassis rigidity doesn't feel any better or worse than the Asus ZenBook S or XPS 13, but its gold trims are arguably classier.
One thing we would improve is the rigidity of the hinges at certain angles. The lid falls over too easily once it reaches past 120 degrees which can be annoying when typing or transporting the laptop. This also doesn't give a good sense of longevity as the hinges will inevitably become weaker over time.
The system is larger and slightly heavier than the 13.3-inch Spectre x360 13 and so tablet mode is a bit more cumbersome to handle as a result. Of course, owners get a larger display in return without needing to opt for the even bigger Spectre x360 15. Note that the Dell XPS 13 9300 is smaller than our Spectre x360 14 in every dimension due in part to its smaller 13.4-inch 16:10 display.
Connectivity
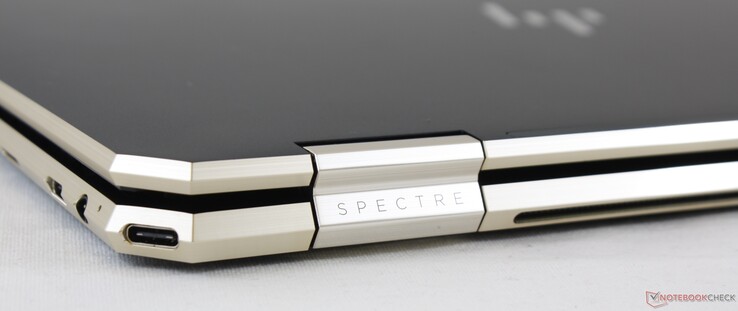
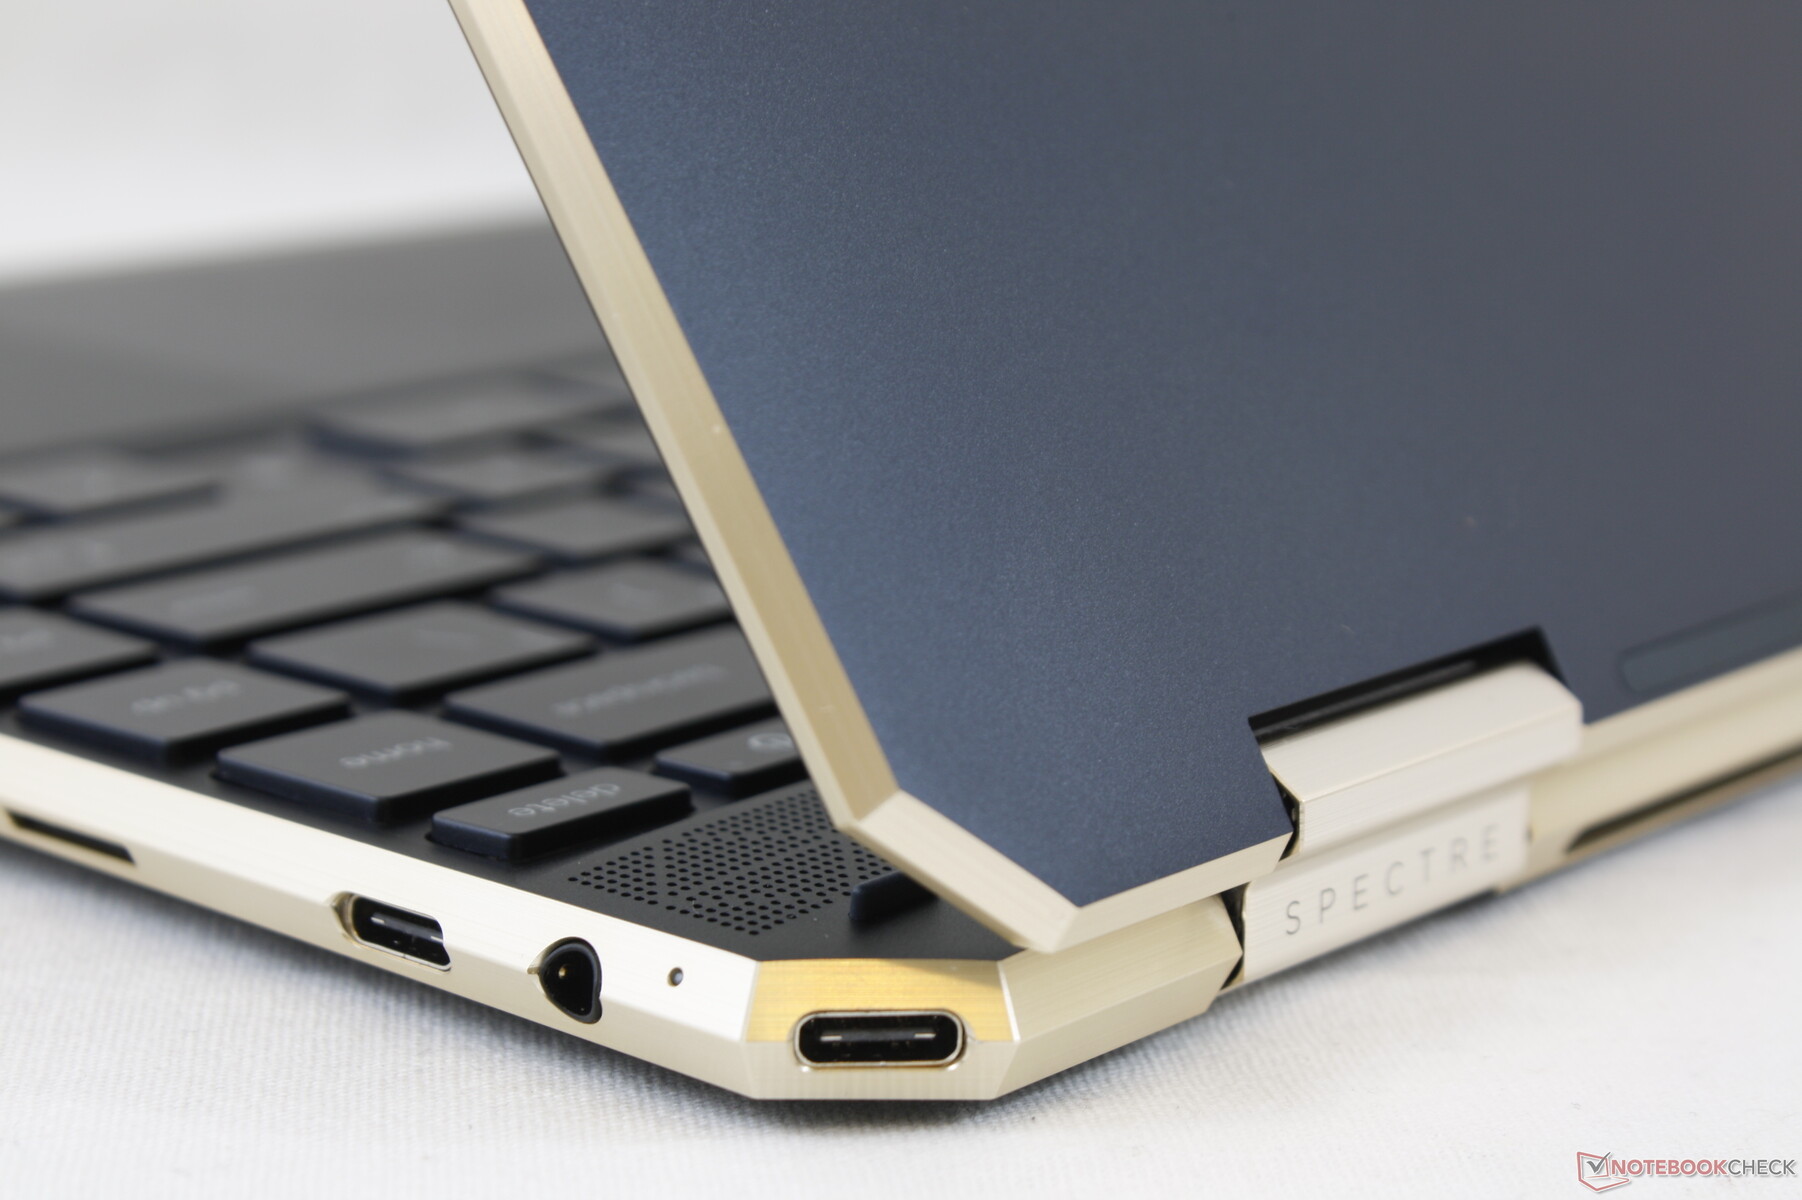
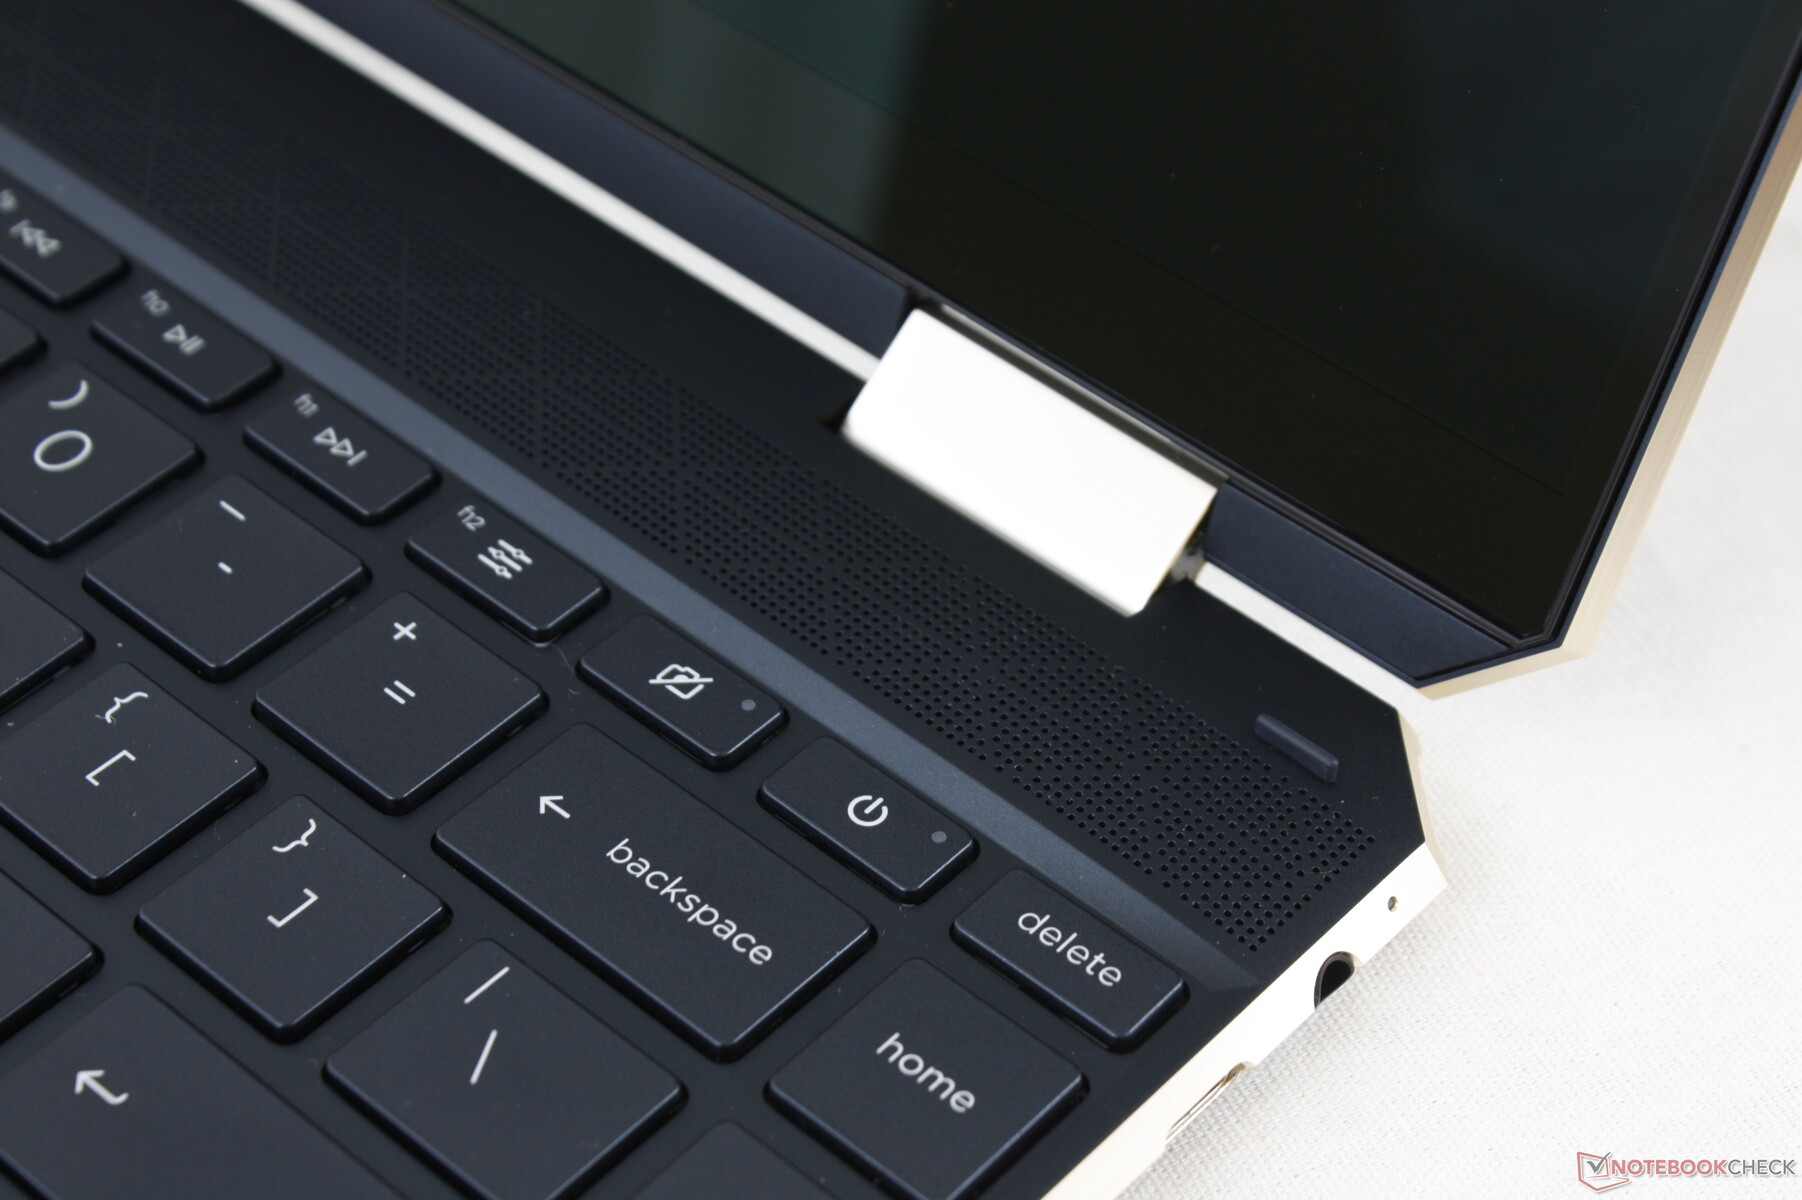
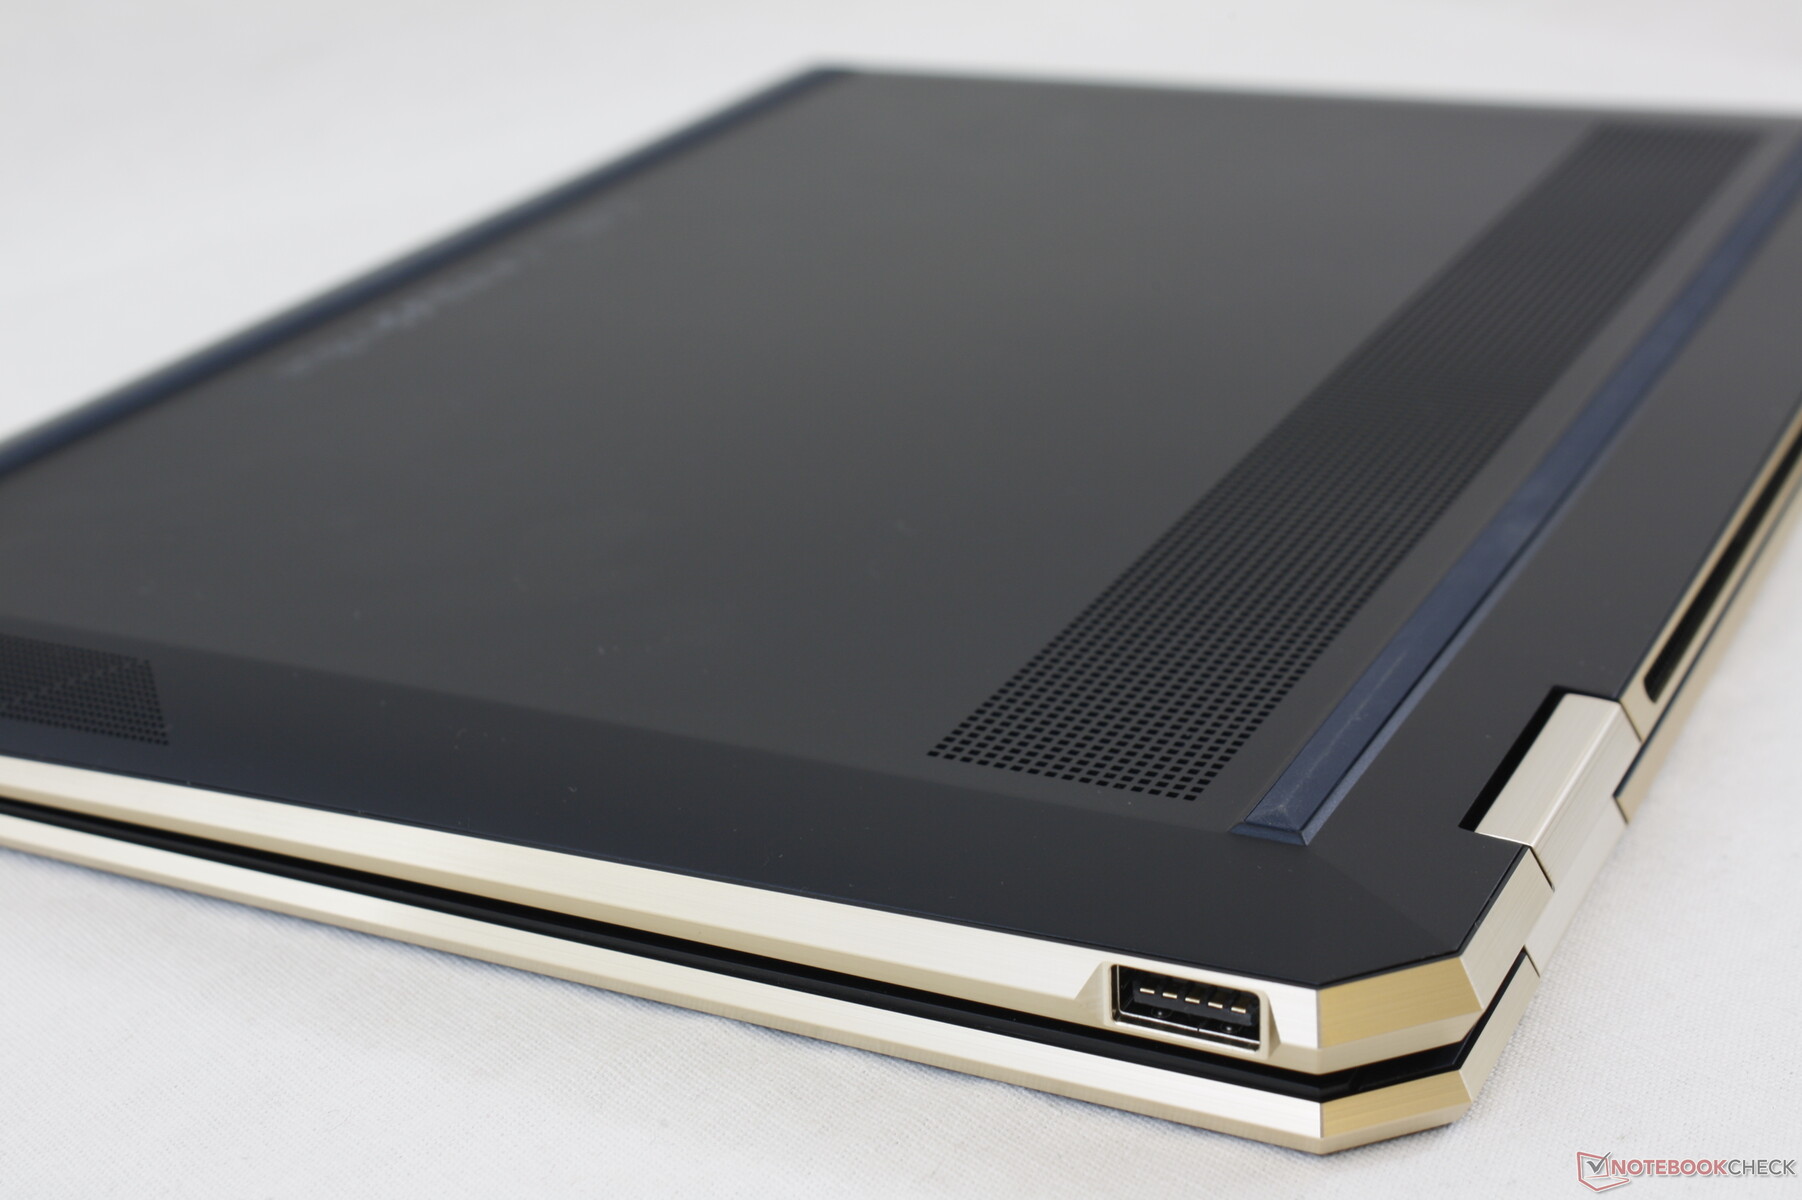
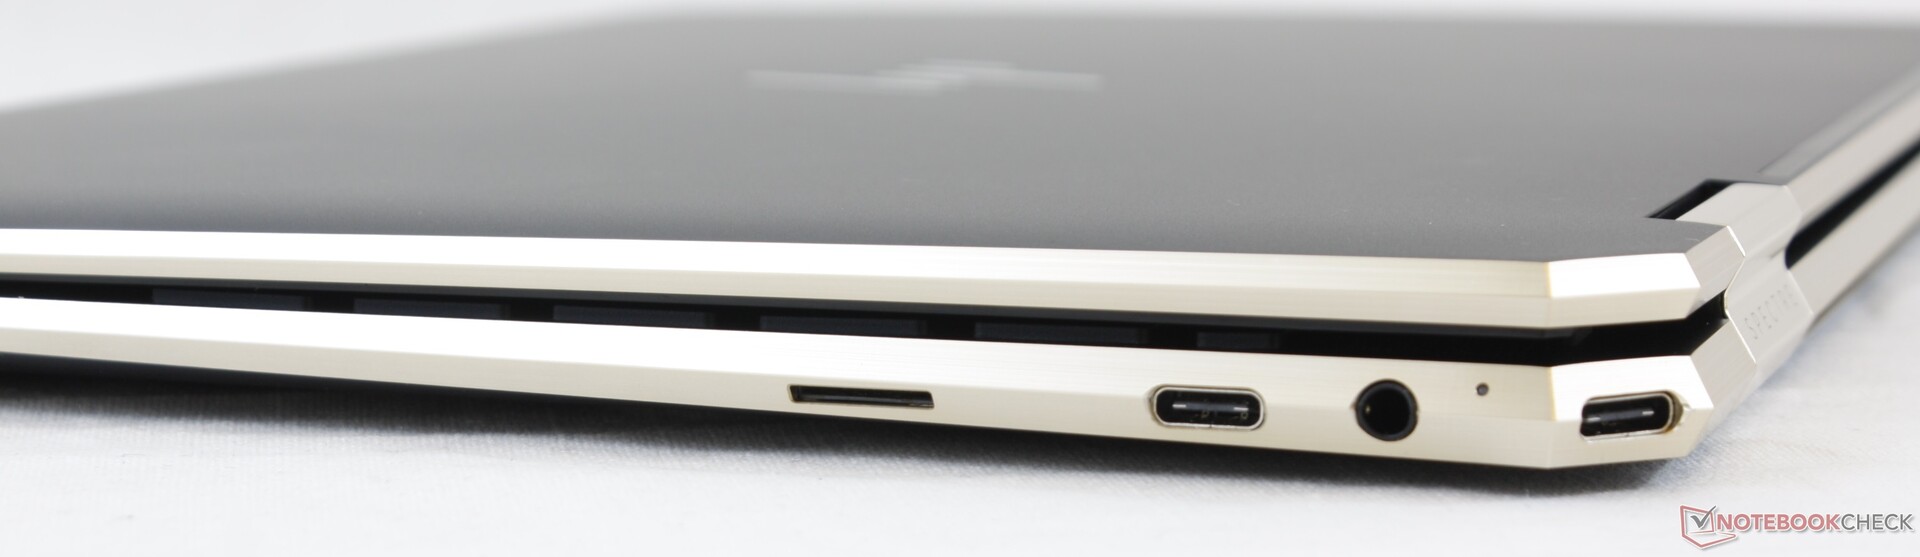
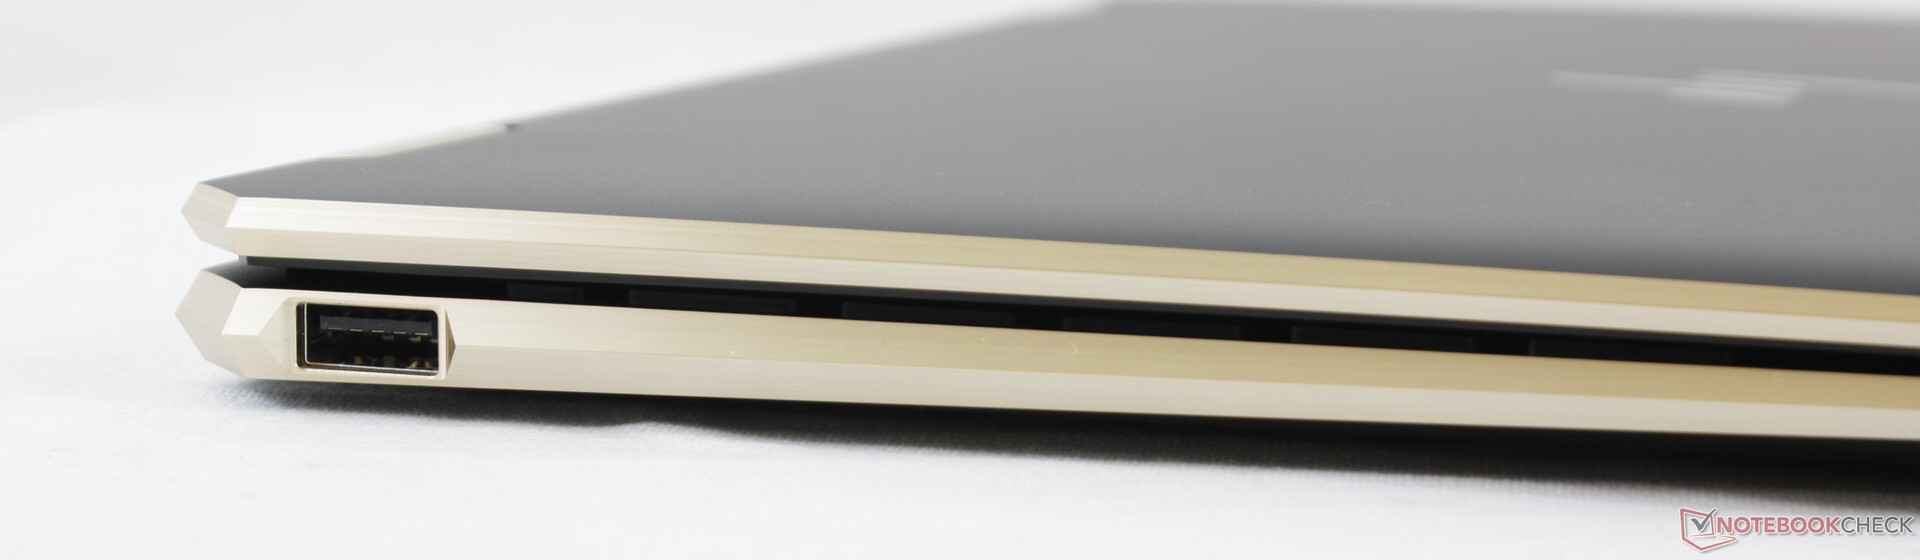
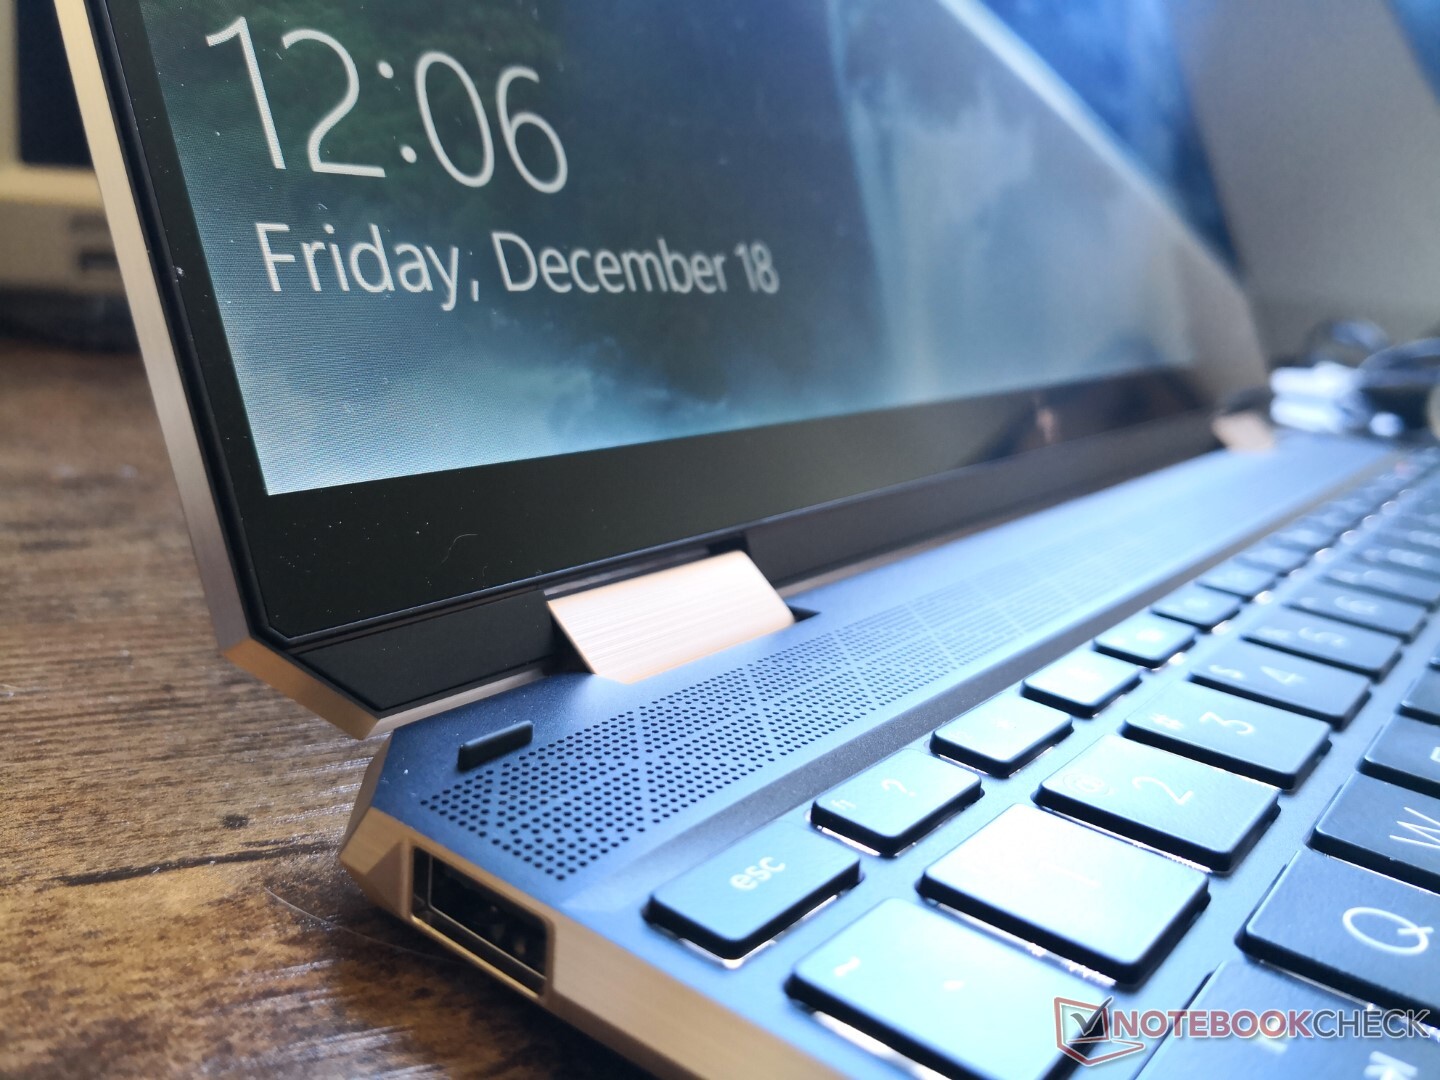
Port options are identical to the Spectre x360 13 but with a couple of minor changes. Firstly, both the power button and camera kill switch are now directly on the keyboard instead of the rear corner or right edge of the chassis, respectively. Secondly, both USB-C ports now support Thunderbolt 4 in addition to Thunderbolt 3 for users who can take advantage of the extra bandwidth.
The corner USB-C port can feel a little weird at first. We would've preferred a USB-C port on both the left-hand and right-hand edges so users can charge the laptop on either side much like on the Razer Book 13.
SD Card Reader

| SD Card Reader | |
| average JPG Copy Test (av. of 3 runs) | |
| HP Spectre x360 14t-ea000 (Toshiba Exceria Pro M501 microSDXC 32GB) | |
| HP Spectre x360 13-aw0013dx (Toshiba Exceria Pro M501 microSDXC 64GB) | |
| Dell XPS 13 7390 2-in-1 Core i7 (Toshiba Exceria Pro M501 64 GB UHS-II) | |
| Asus Zenbook S UX393JA (Toshiba Exceria Pro M501 64 GB UHS-II) | |
| maximum AS SSD Seq Read Test (1GB) | |
| HP Spectre x360 14t-ea000 (Toshiba Exceria Pro M501 microSDXC 32GB) | |
| Dell XPS 13 7390 2-in-1 Core i7 (Toshiba Exceria Pro M501 64 GB UHS-II) | |
| HP Spectre x360 13-aw0013dx (Toshiba Exceria Pro M501 microSDXC 64GB) | |
| Asus Zenbook S UX393JA (Toshiba Exceria Pro M501 64 GB UHS-II) | |
Communication
The Intel AX201 comes standard for Wi-Fi 6 and Bluetooth 5.1 connectivity. We experienced no issues when connected to our Netgear RAX200 test router.
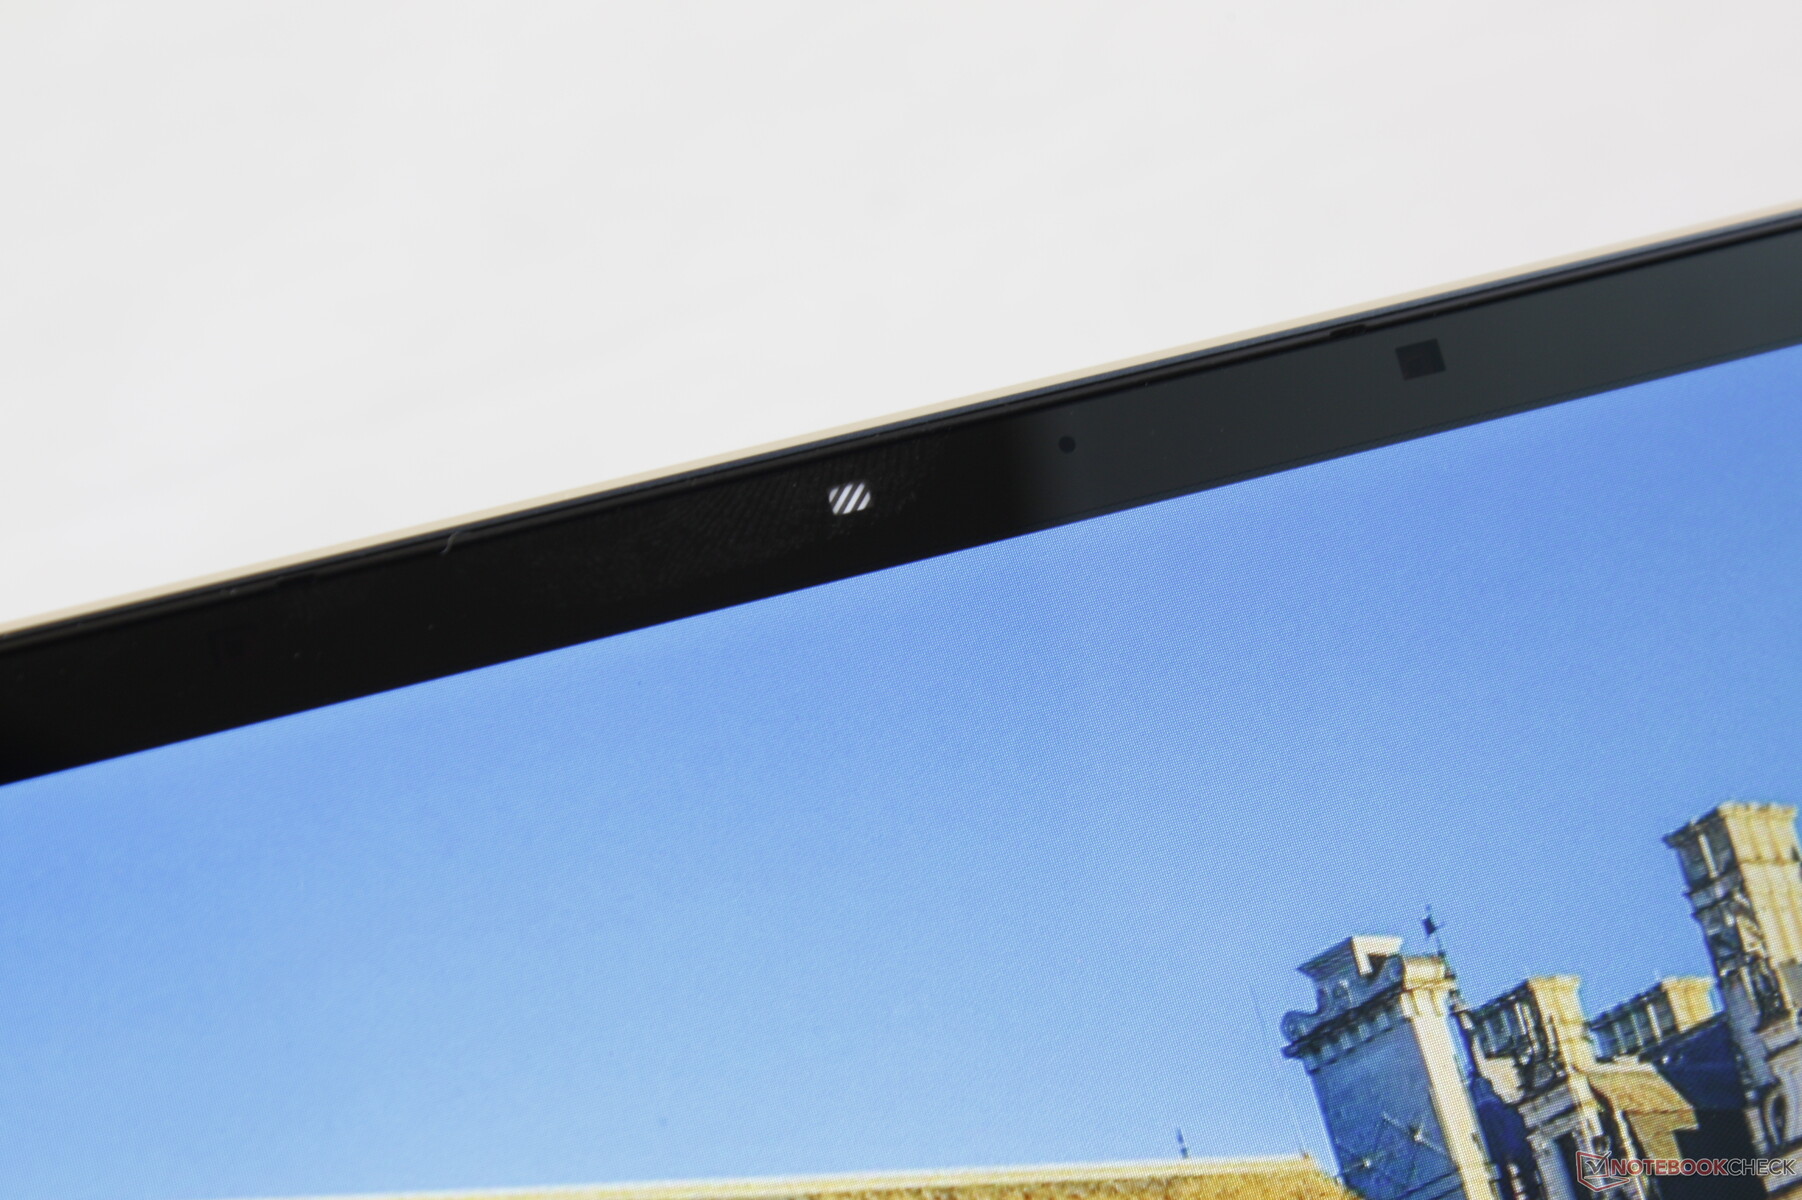
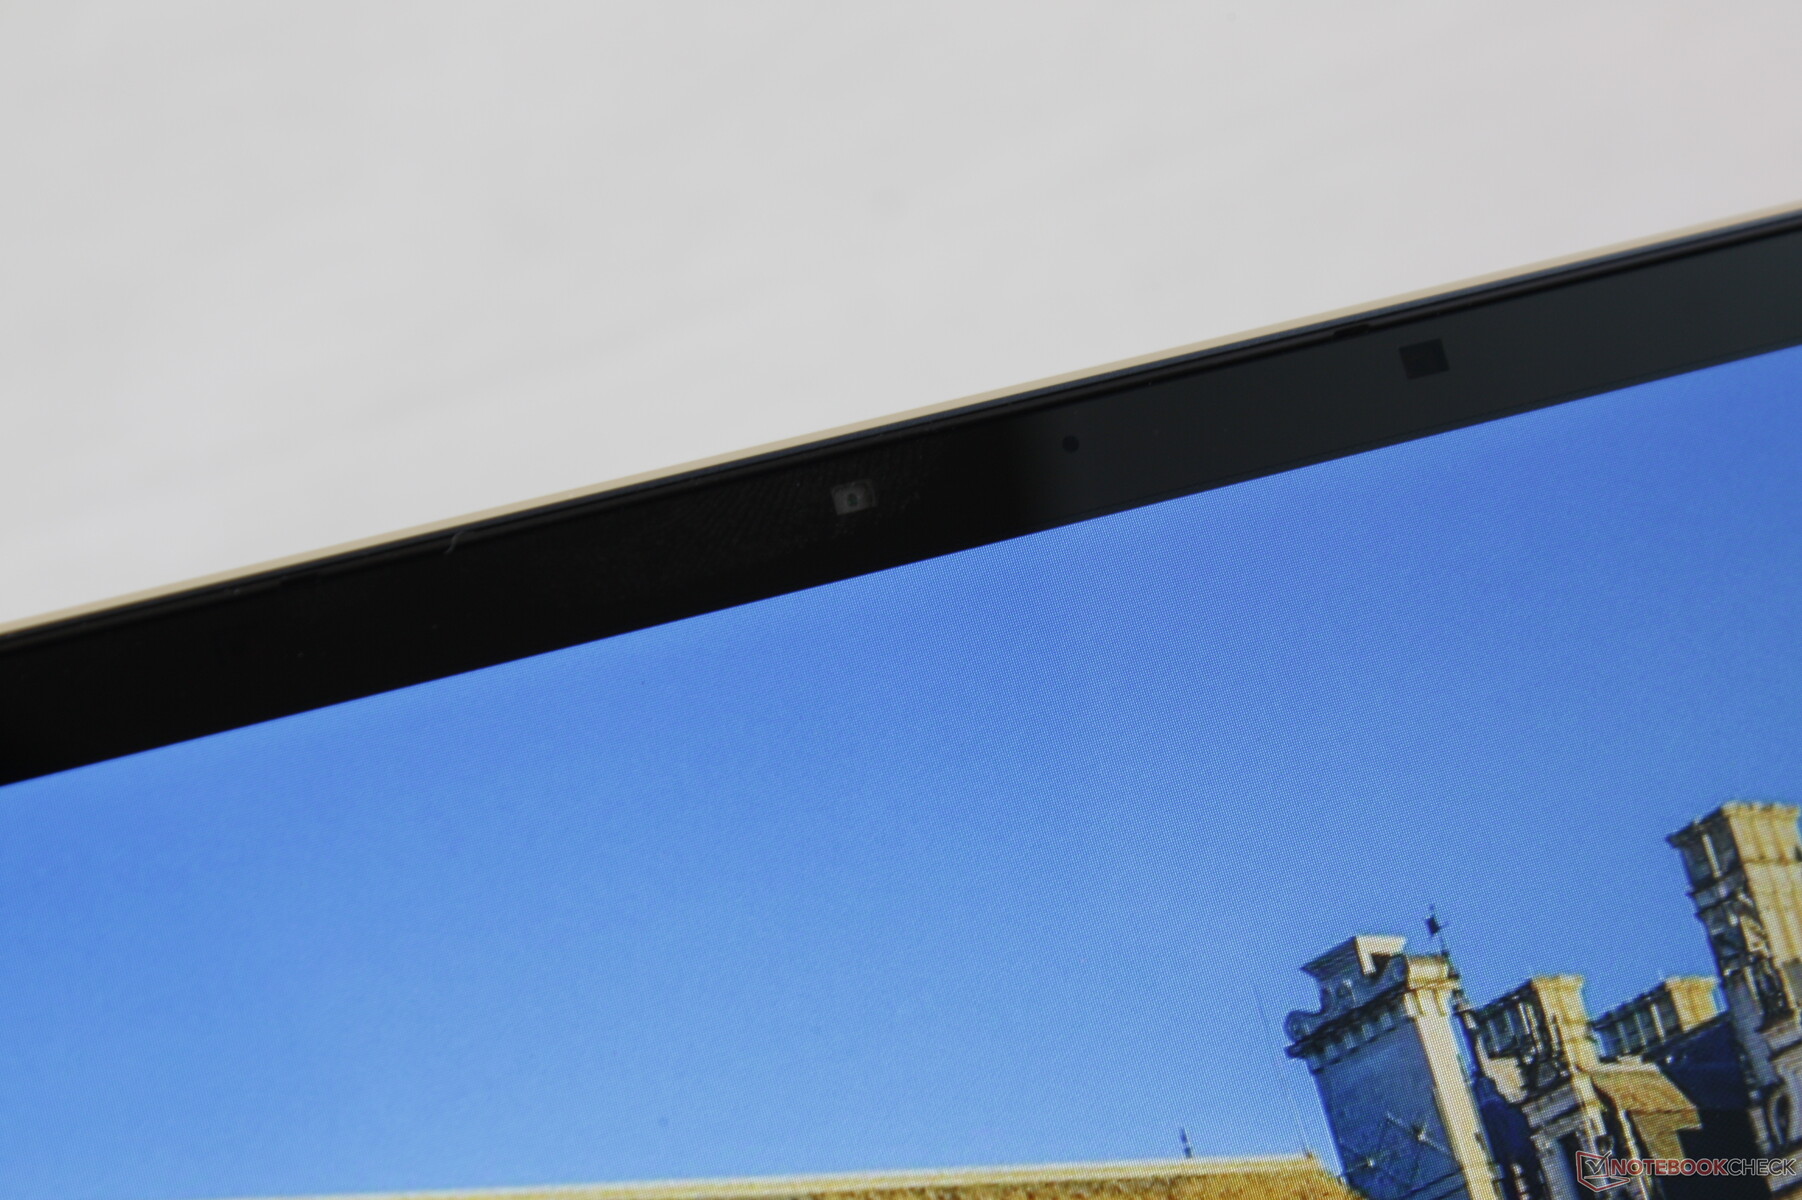
Webcam


Maintenance
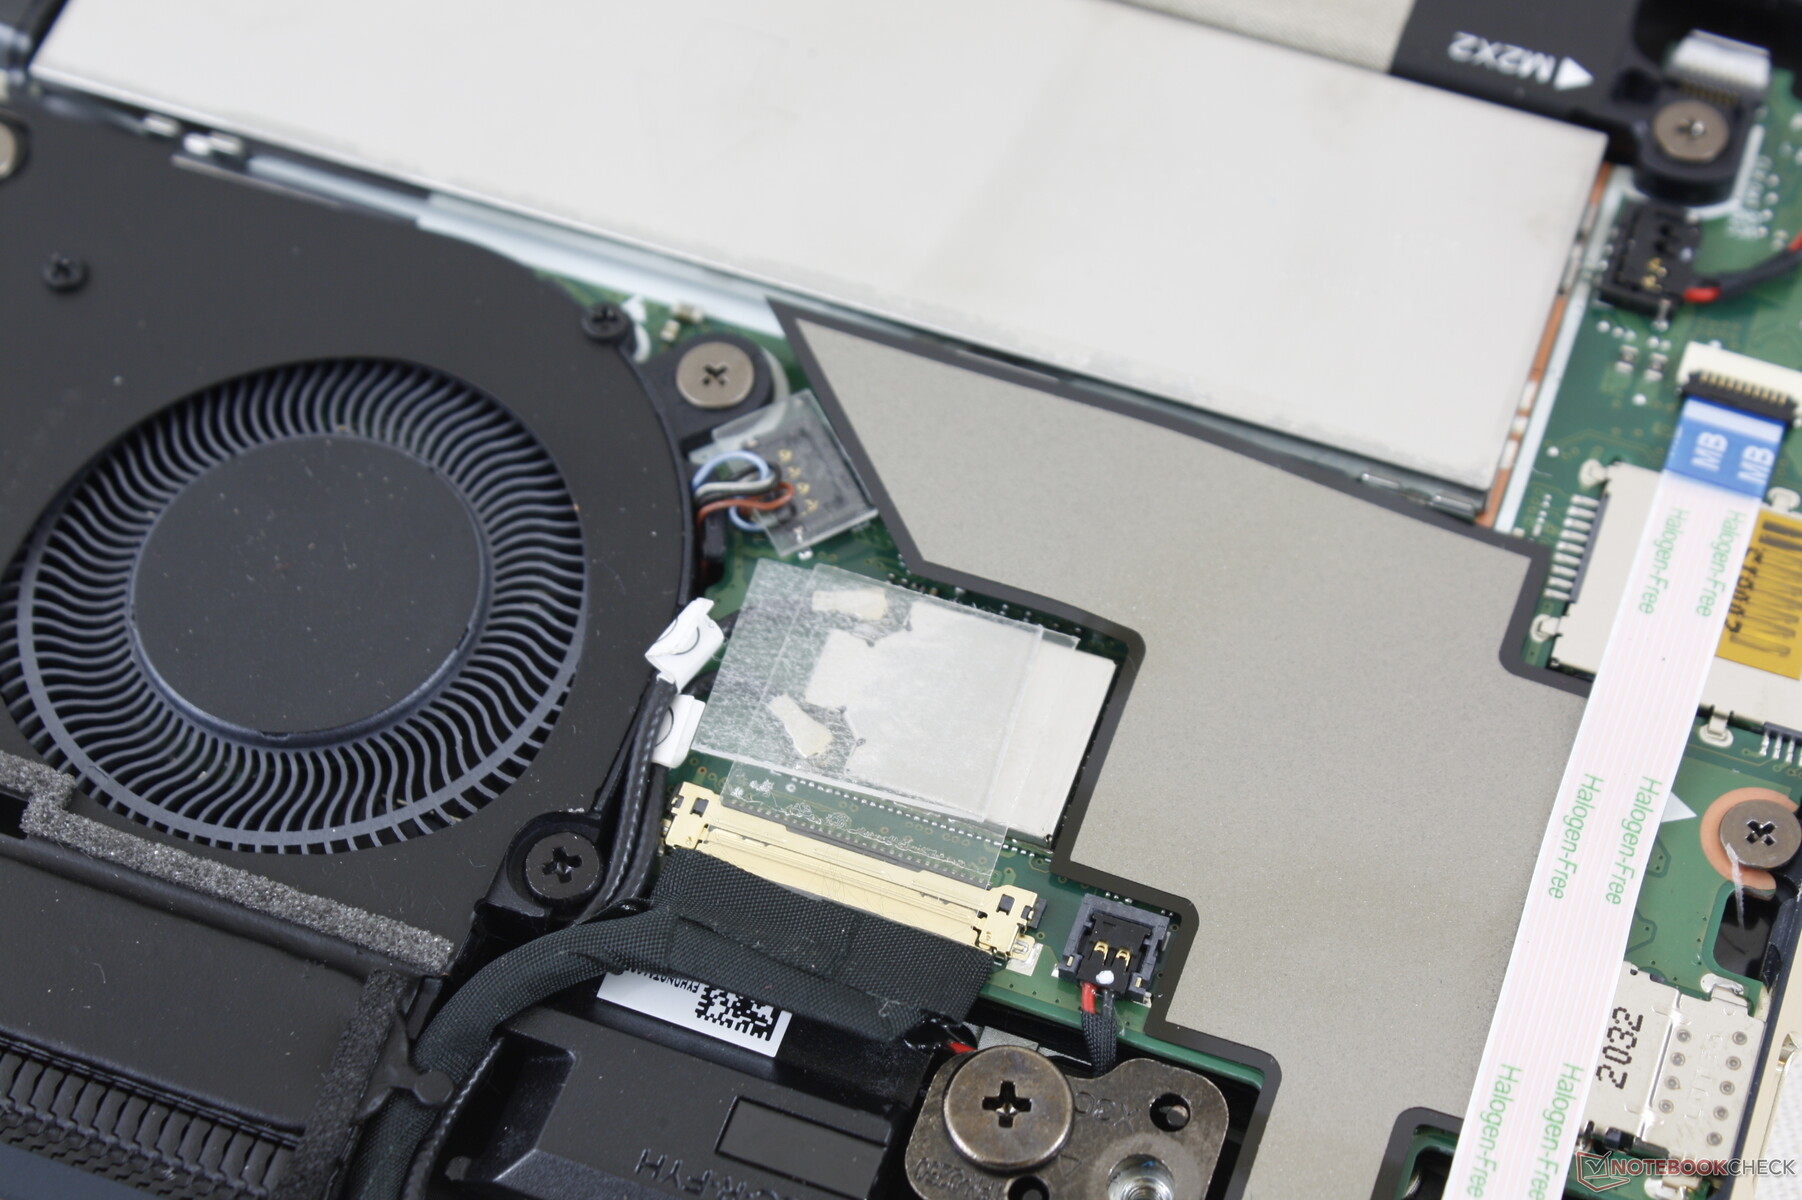
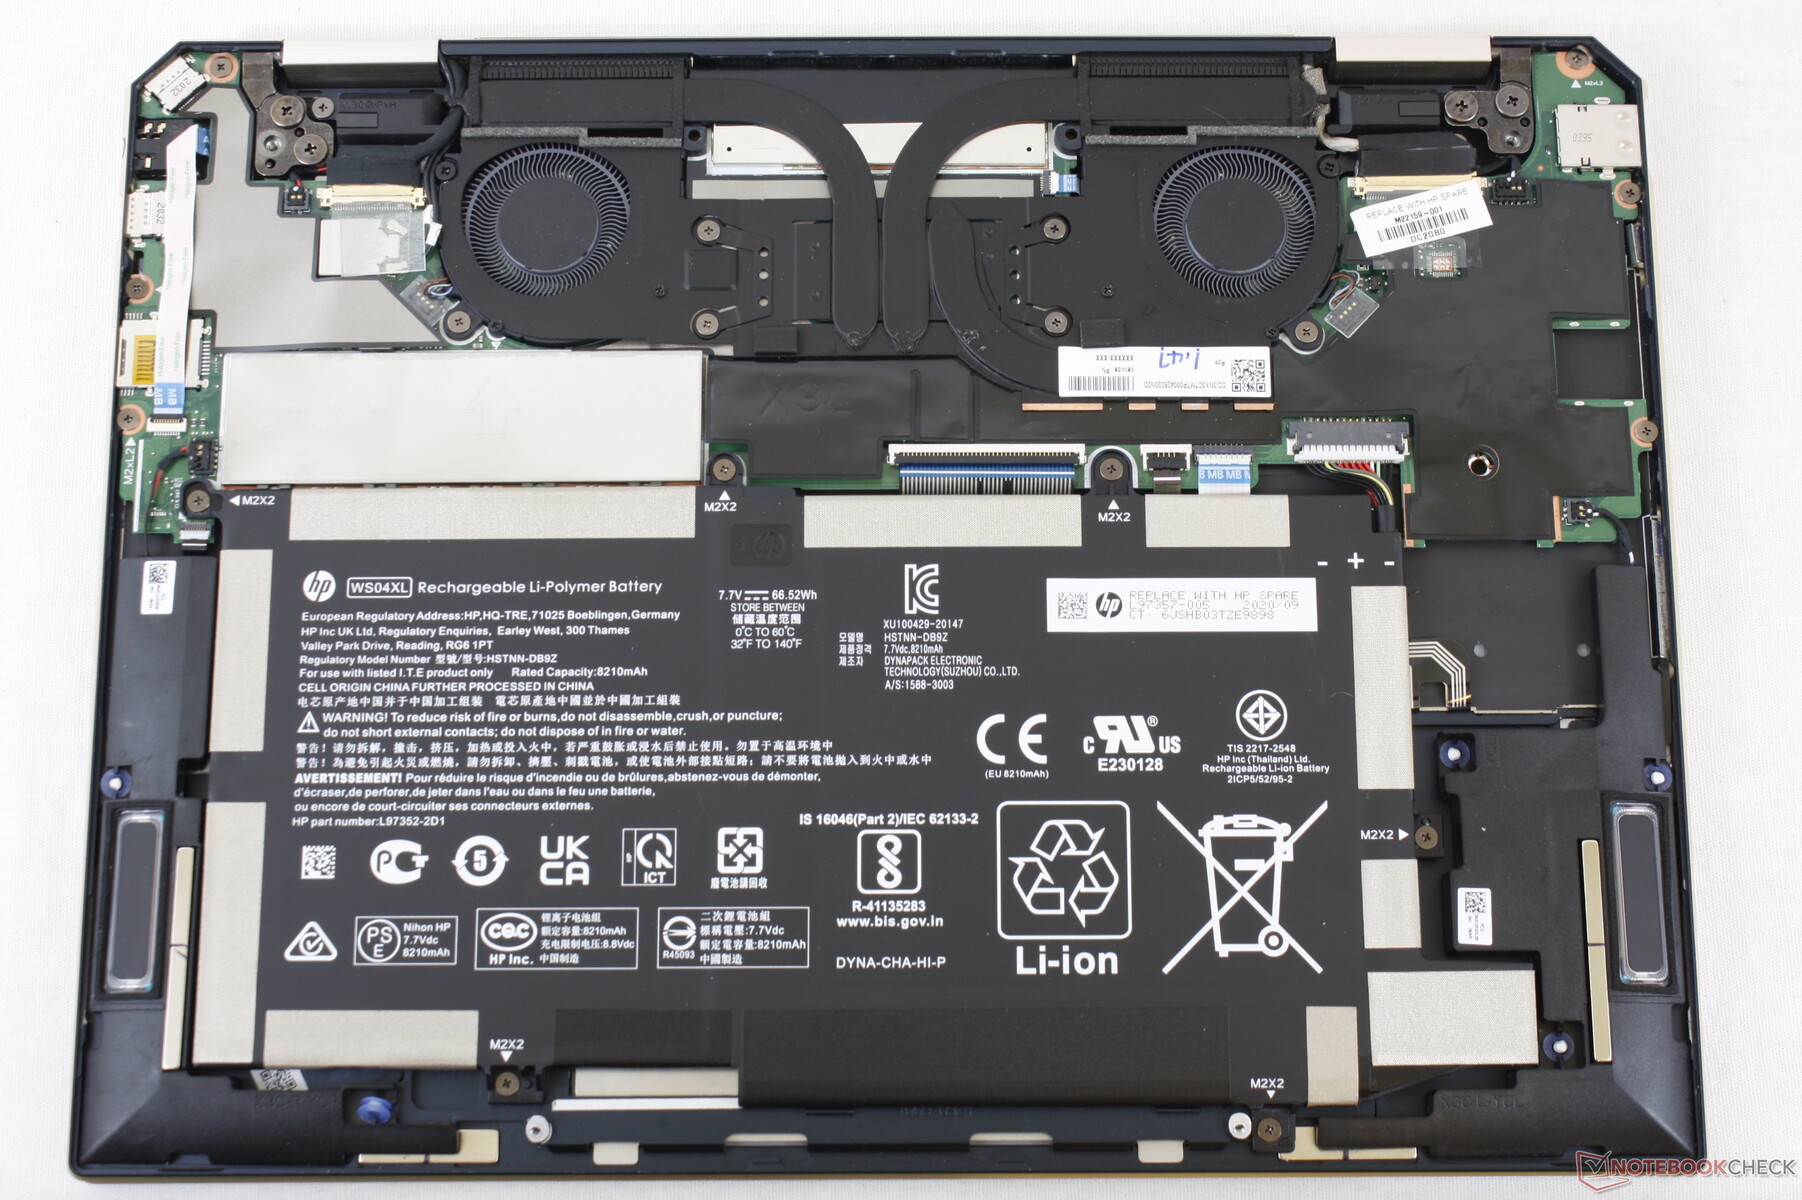
The bottom panel is secured by two T5 Torx screws and four Philips screws hidden underneath the rear rubber feet. These latter screws are annoyingly difficult to access which can make simple SSD upgrades more involved than it needs to be. Both RAM and WLAN are soldered.
Accessories and Warranty
The retail packaging include a carrying sleeve and the HP MPP2.0 active pen free of charge. The standard one-year limited warranty applies with plenty of extension options if ordered directly from HP.com.
Input Devices
Keyboard
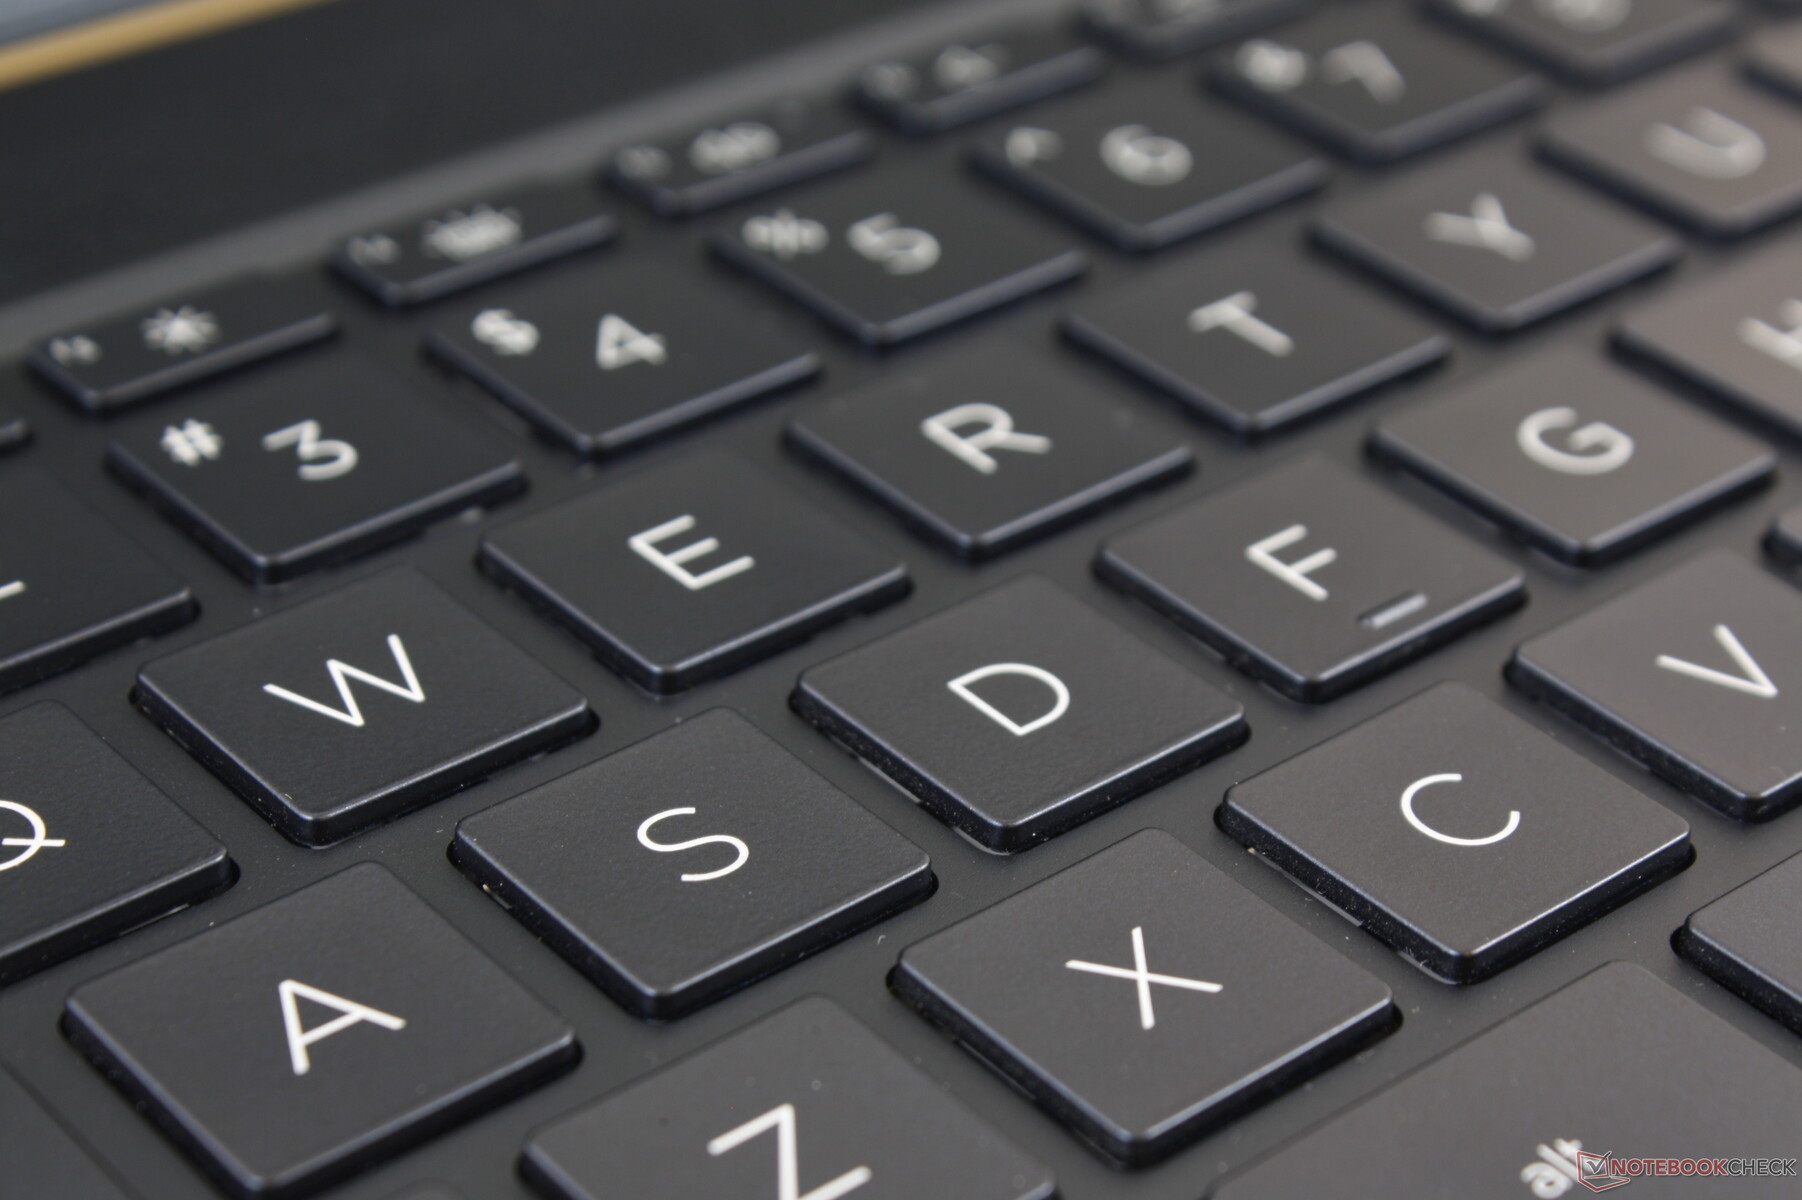
HP has some of the best laptop keyboards for its Spectre and EliteBook families. Feedback feels crisper and deeper for a more satisfying typing experience when compared to the oftentimes shallower and spongier keyboards on most other Ultrabooks. keys on the XPS 13 keyboard, for example, are shallower and with lighter input pressure. It all comes down to user preference, of course. We recommend testing out the keyboards on the Spectre x360 13 or 15 to get a good sense of what the Spectre x360 14 keyboard feels like.
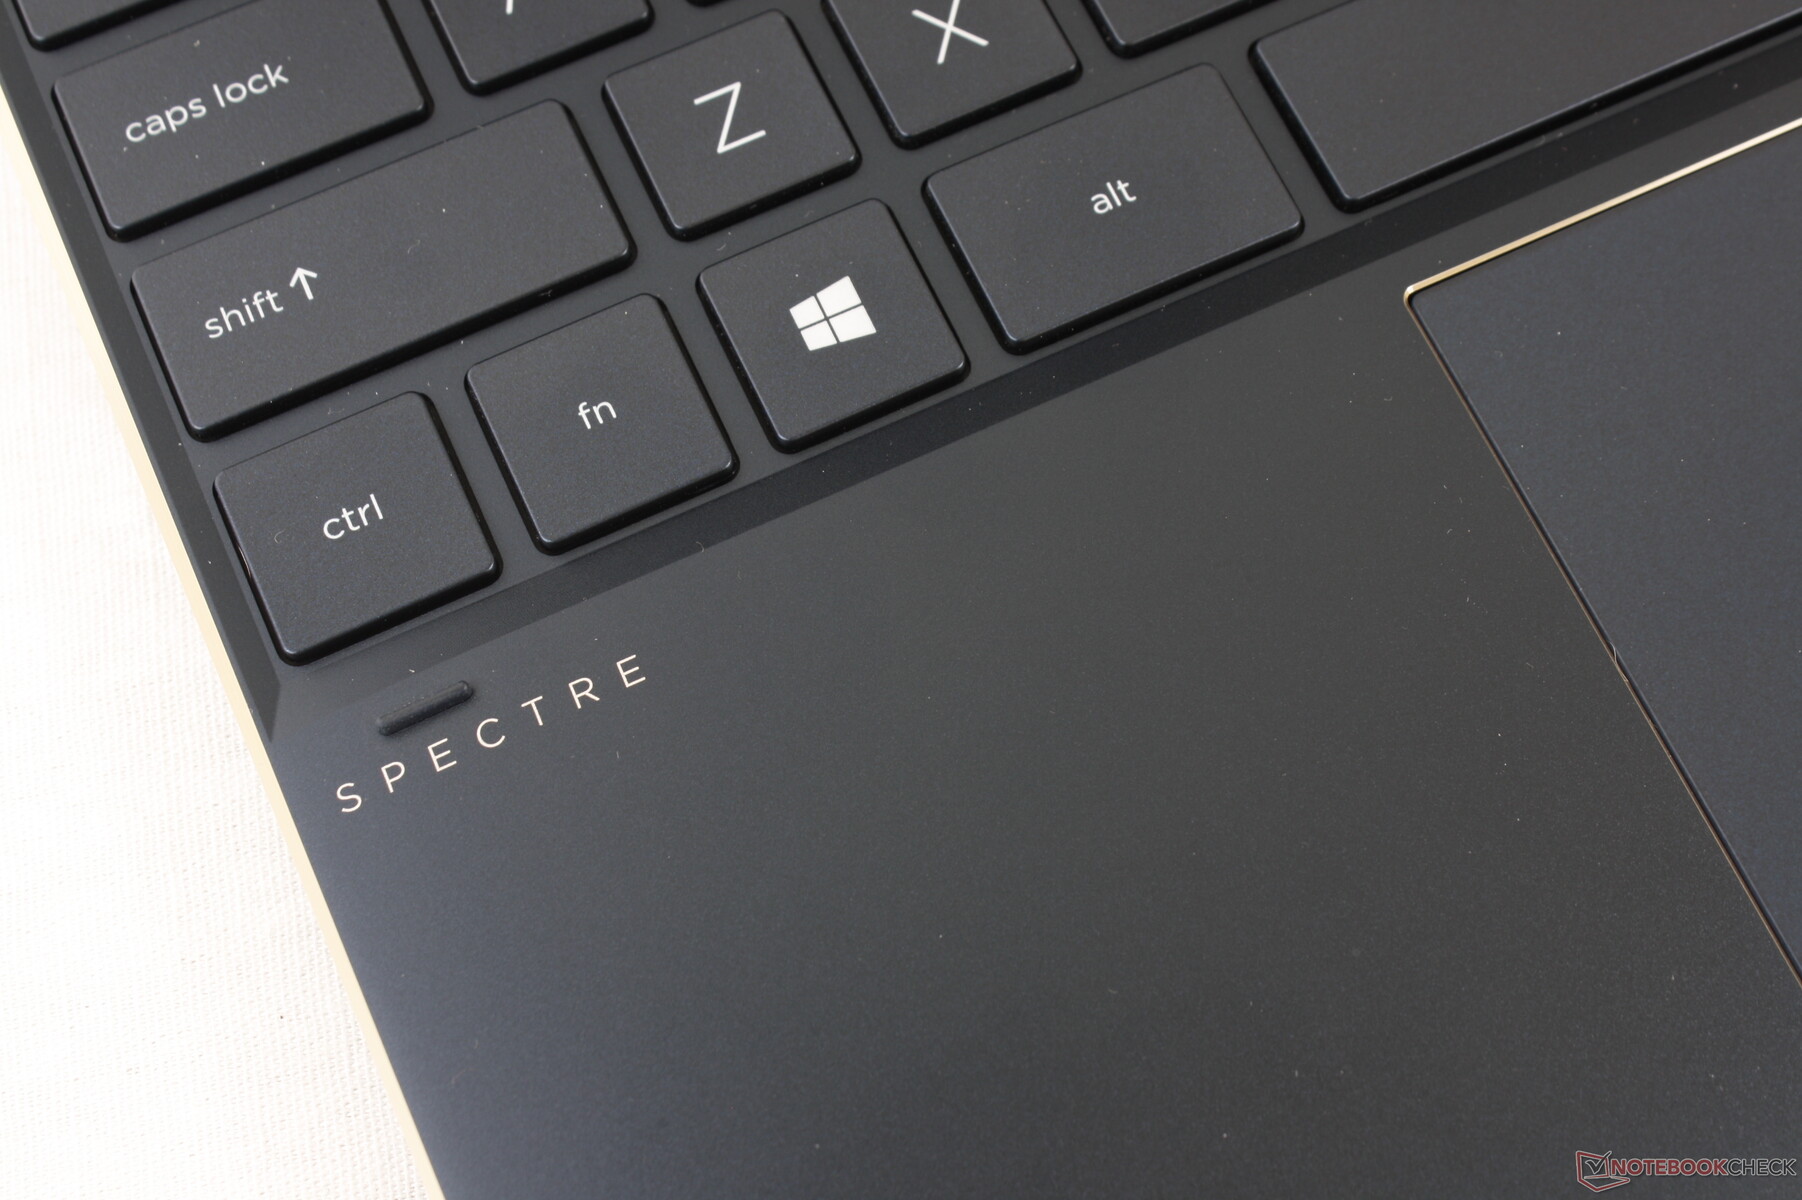
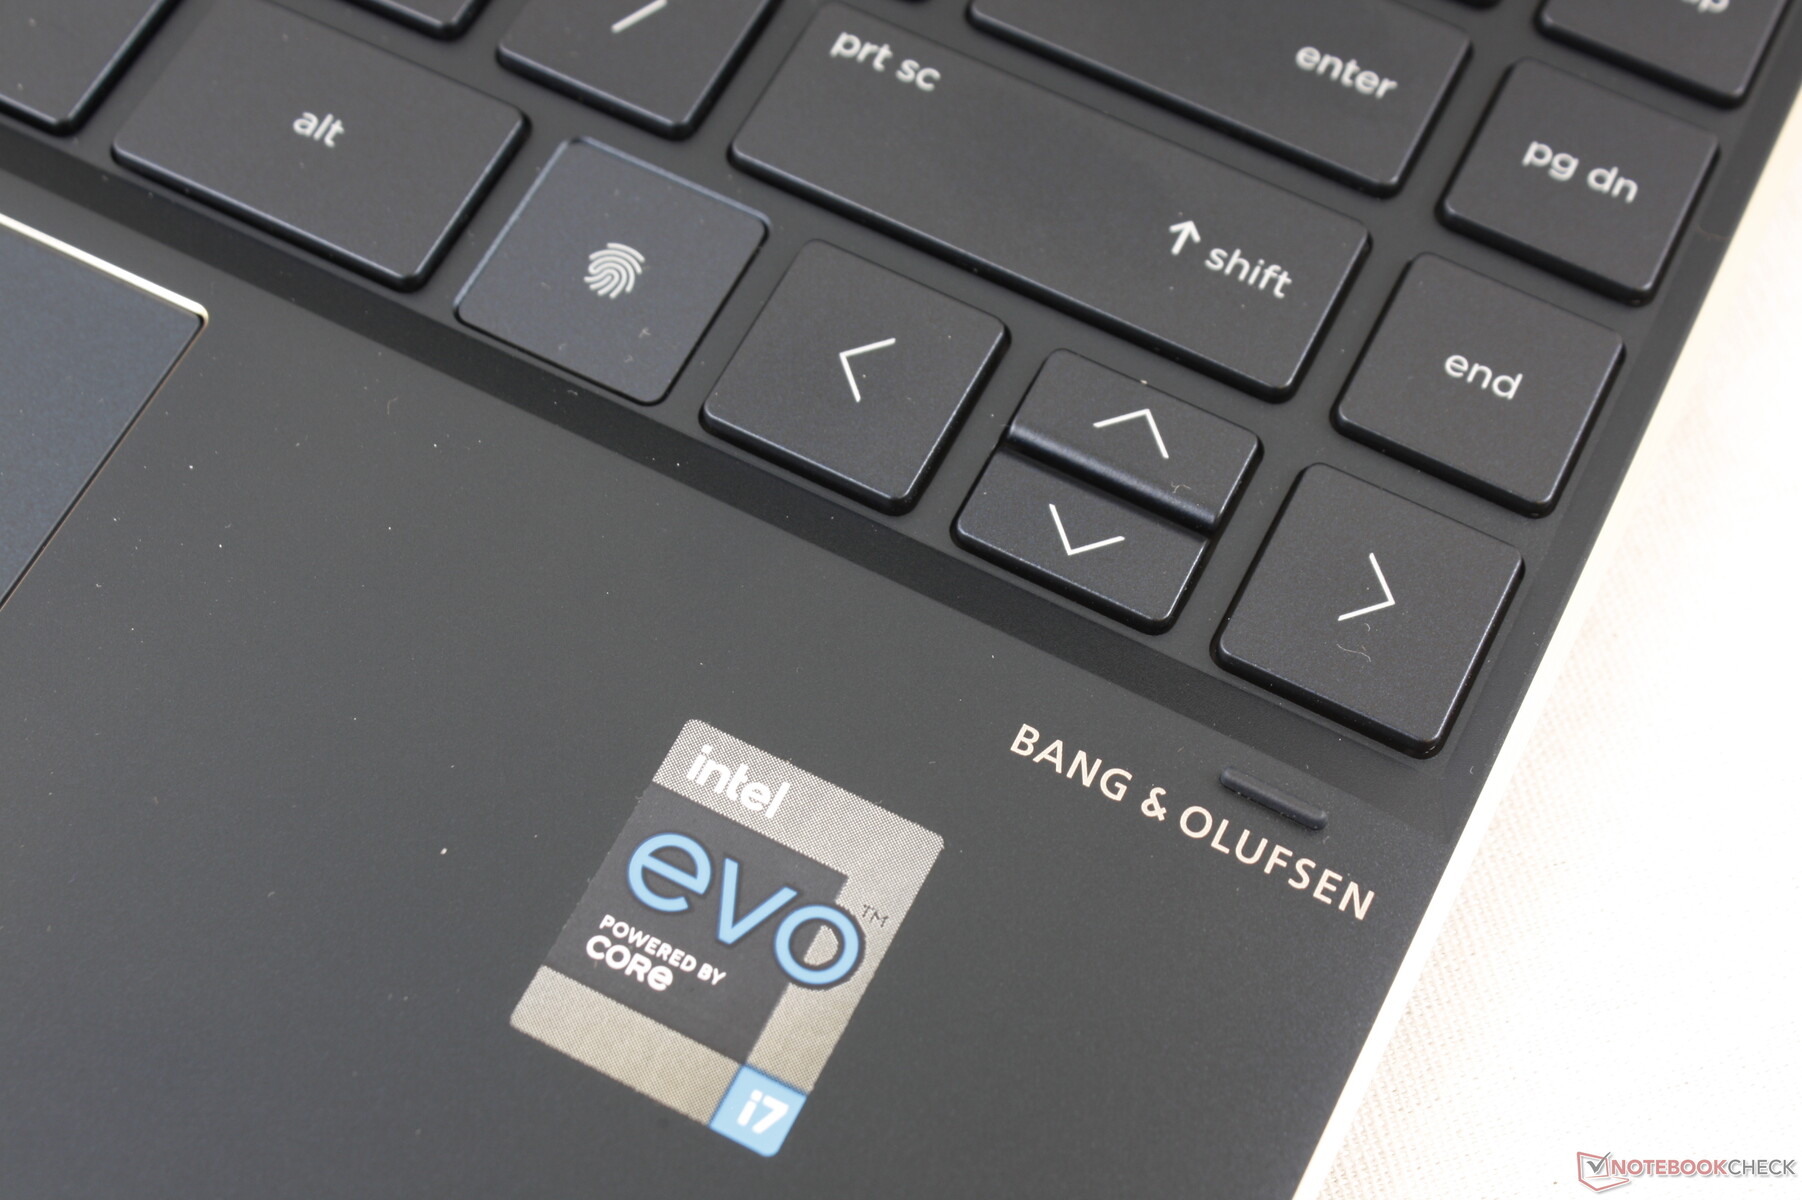
Key layout is a mixed bag. The fingerprint reader in particular replaces the Ctrl key meaning users who have been relying on this key on other laptops will find the change annoying. Meanwhile, the power button takes slightly more force to depress than the surrounding keys to avoid accidental presses, but we would have preferred a fingerprint-enabled power button instead.
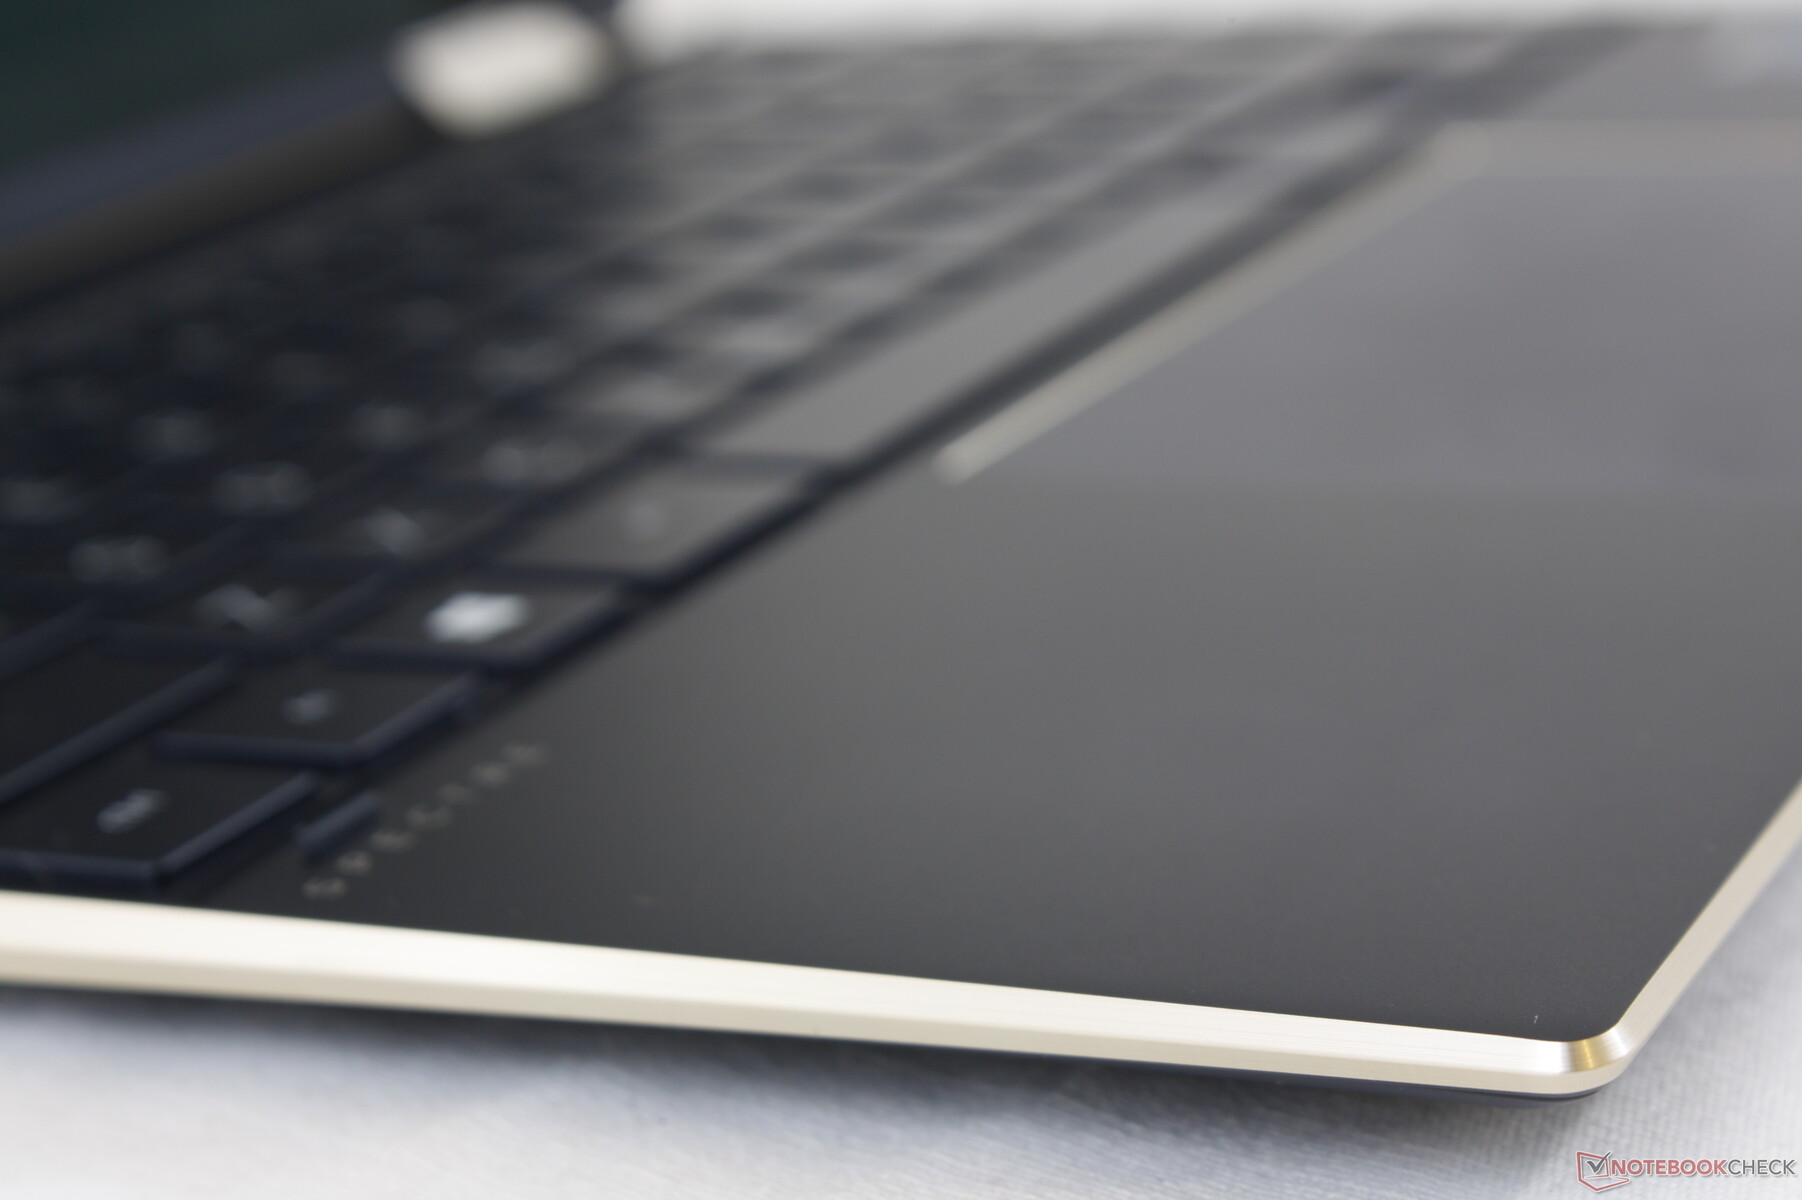
Touchpad
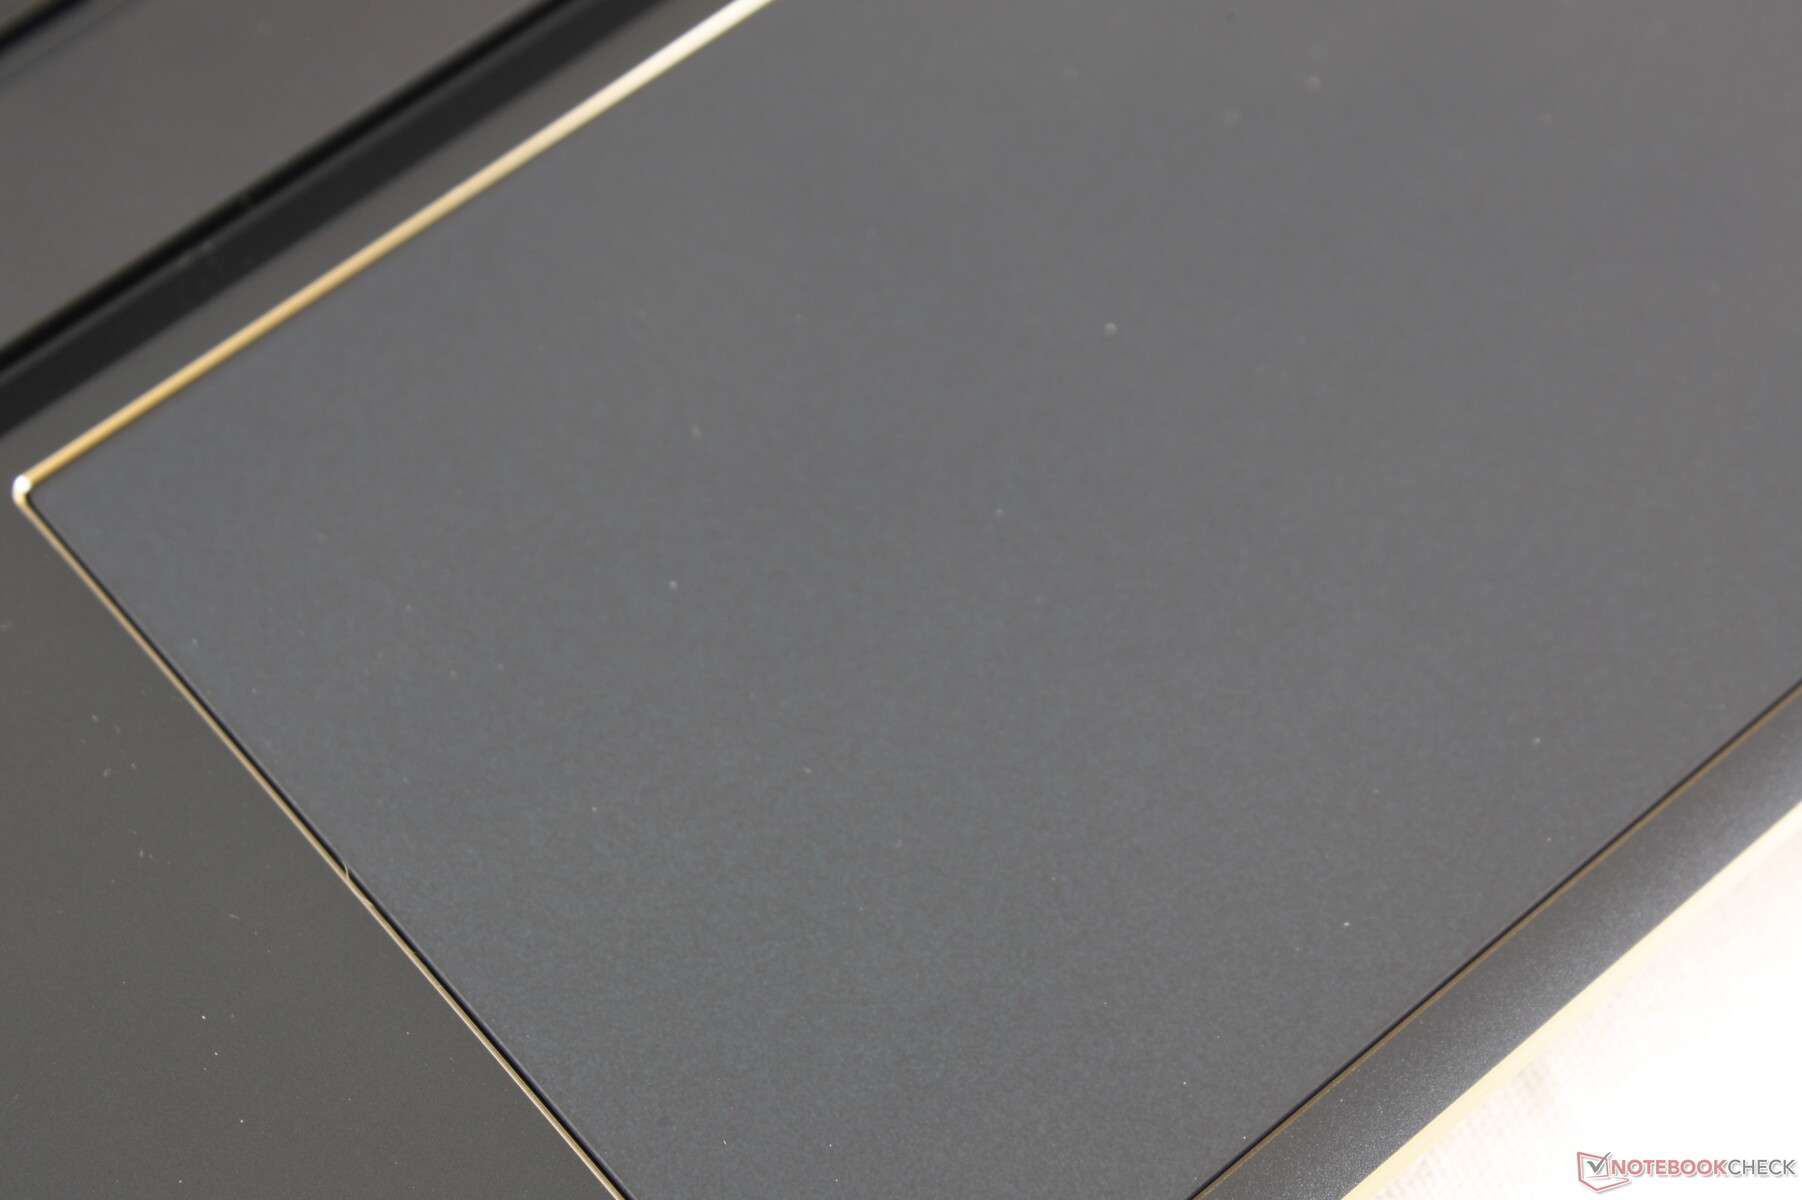
The clickpad is larger than the one on the Spectre x360 13 (11.5 x 7.4 cm vs. 11.1 x 5.6 cm) due to the longer length of the chassis. Texture is similarly smooth and with very little sticking when gliding at slow speeds for accurate cursor control. Clicking on the clickpad has a satisfying audible click even though feedback could have been firmer.

Display
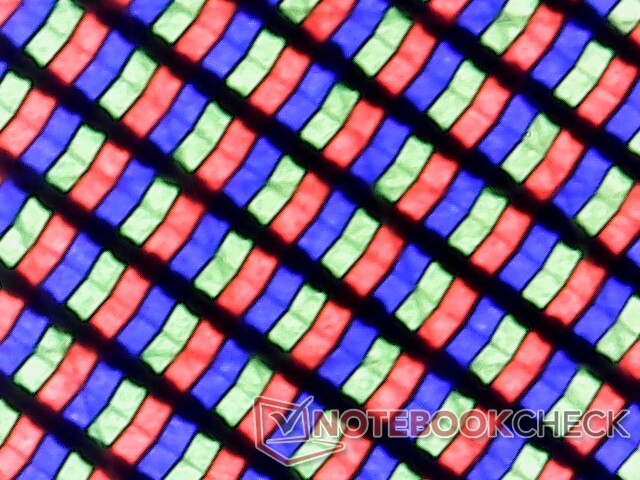
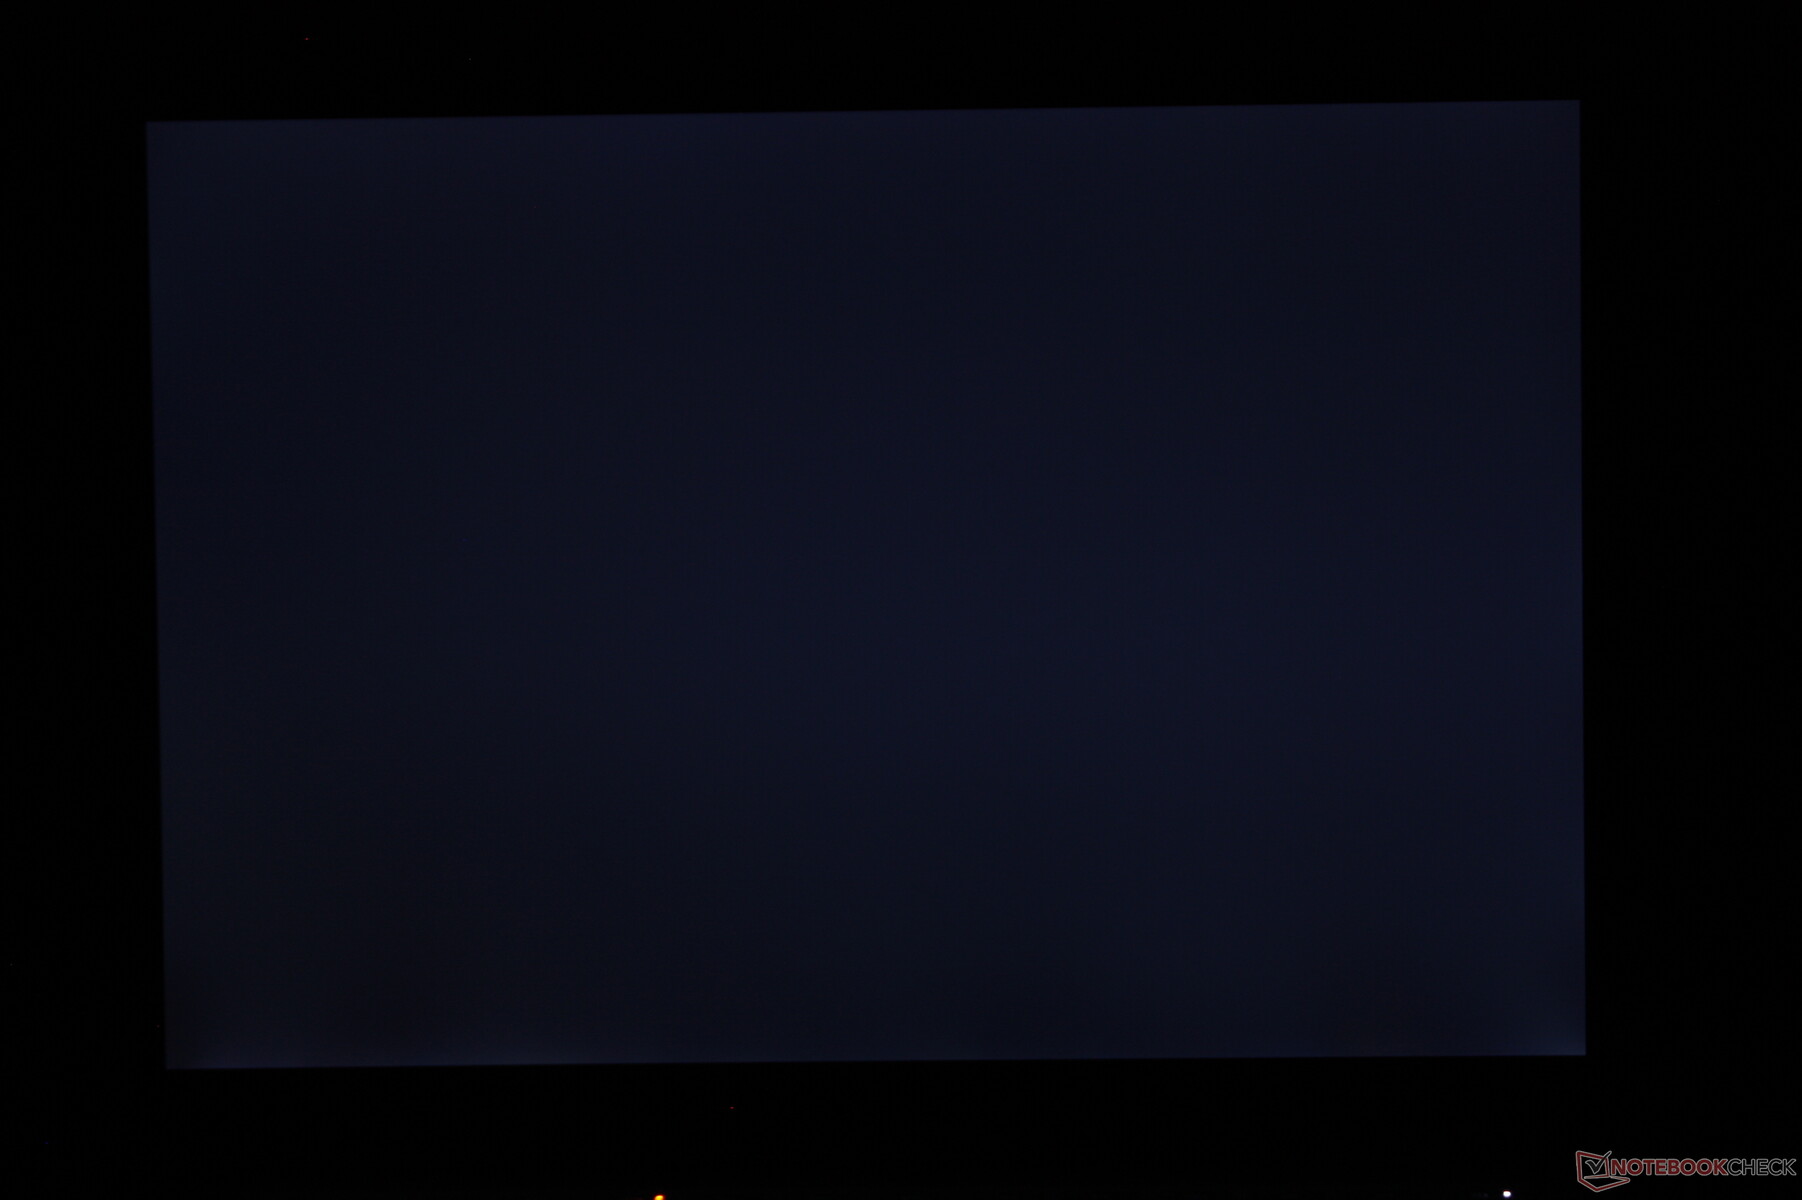
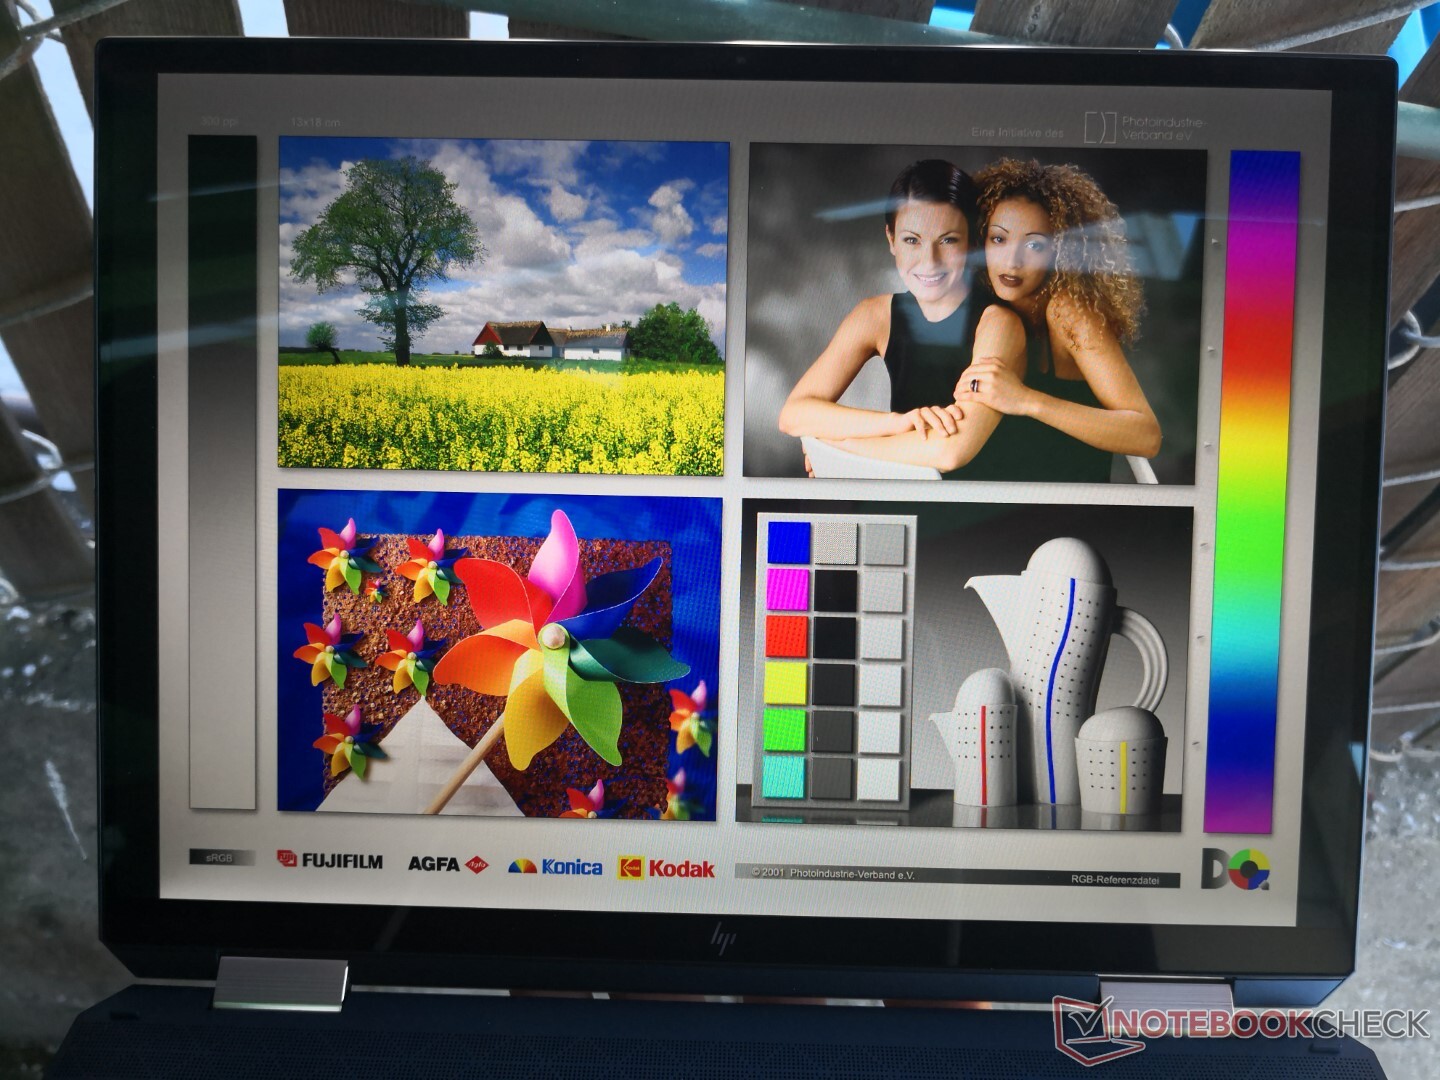
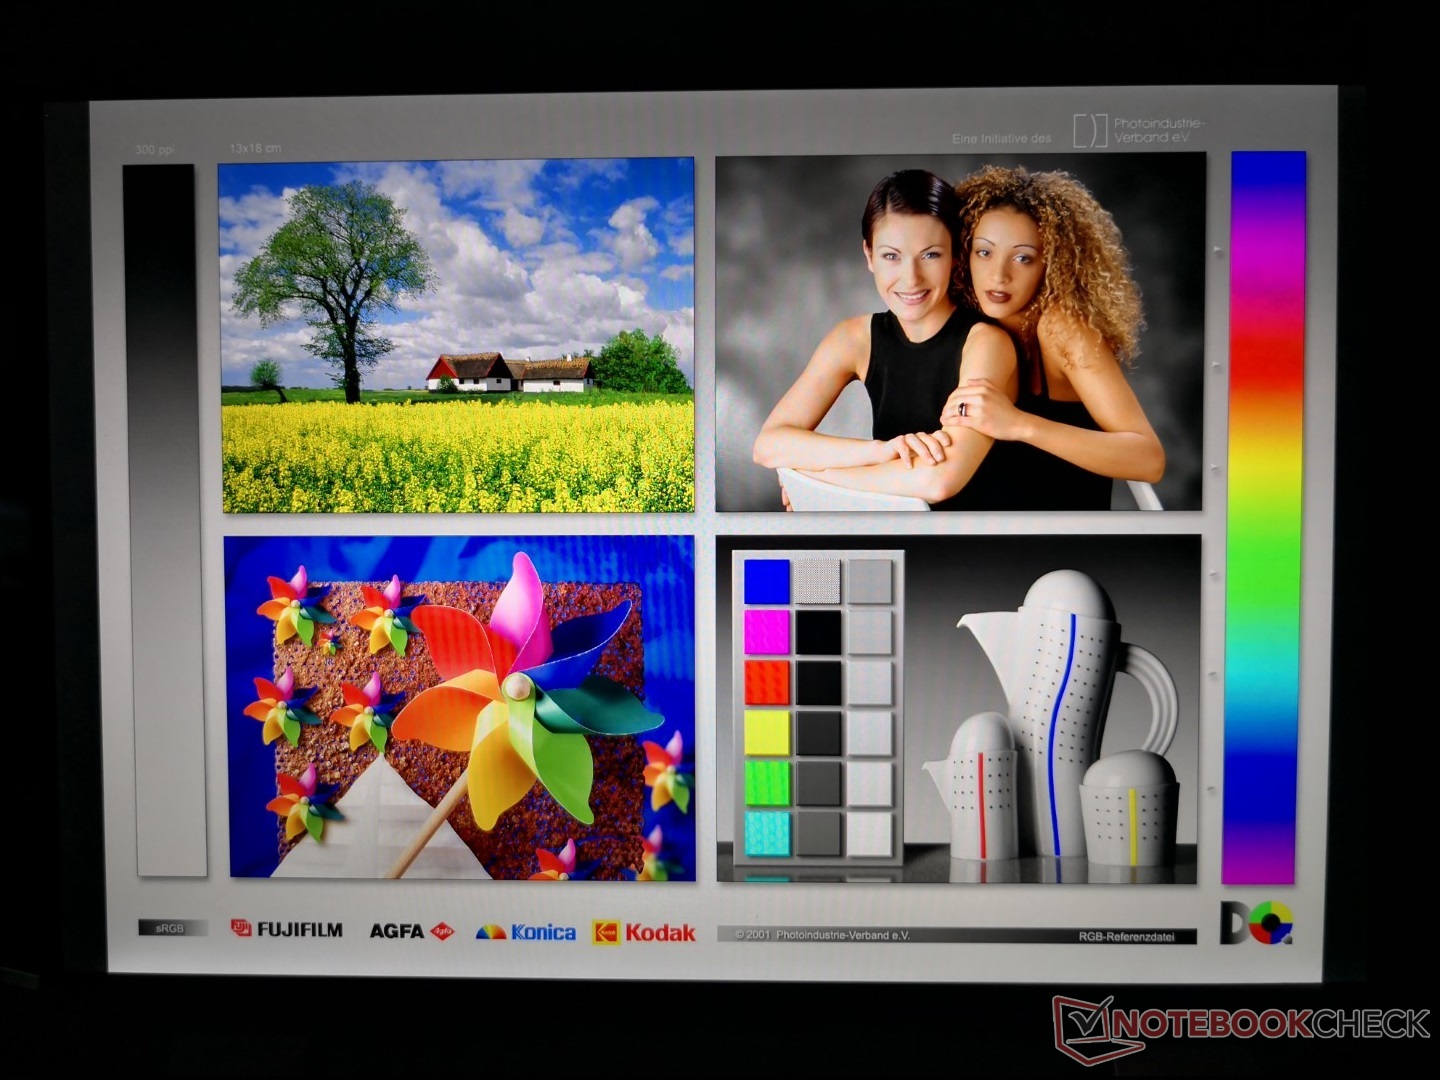
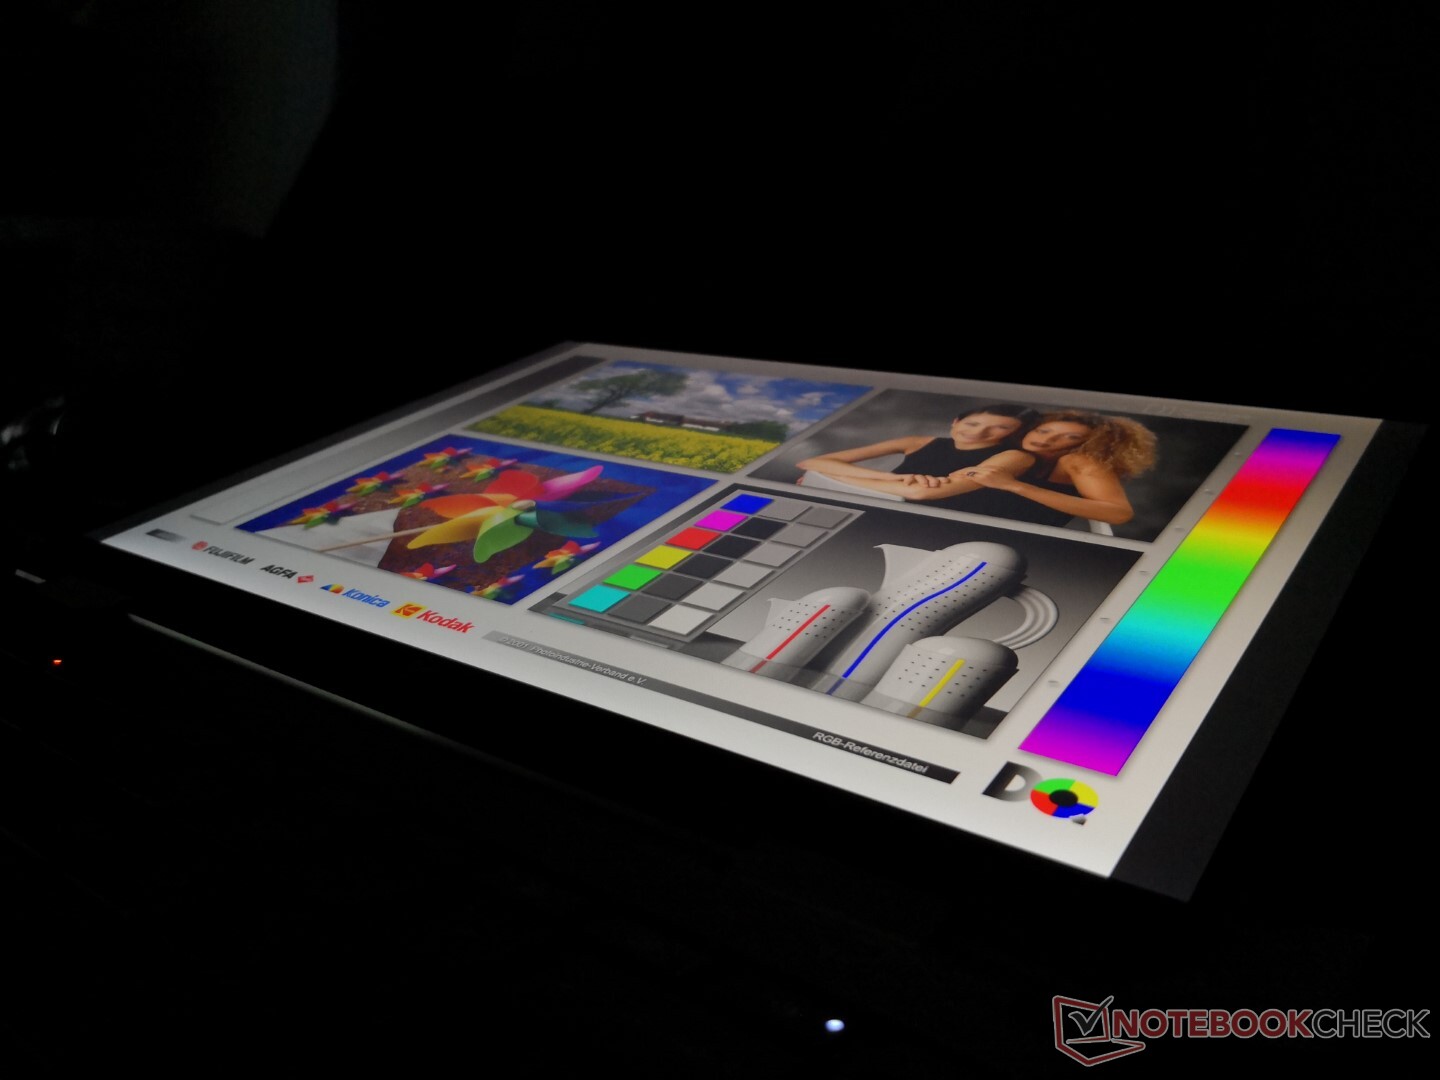
The base LG Philips FHD panel is a high quality IPS panel worthy of the Spectre name. It excels in offering a very high contrast ratio of over 2500:1 compared to half that on most other flagship Ultrabooks. Black-white response times, however, are relatively slow for noticeable ghosting. Upgrading to the pricier OLED option will solve that problem completely.
HP offers 1000-nit brightness options to be at least two times brighter than anything from the Dell XPS, Lenovo Yoga, Microsoft Surface, or Asus ZenBook series. This feature is available only for the FHD IPS SKUs and it can also be found on certain EliteBook laptops. The base 400-nit option is otherwise sufficient if you mostly plan on using the convertible indoors as it's already brighter than the display on the Lenovo Yoga 9i.

| |||||||||||||||||||||||||
Brightness Distribution: 78 %
Center on Battery: 443.5 cd/m²
Contrast: 2609:1 (Black: 0.17 cd/m²)
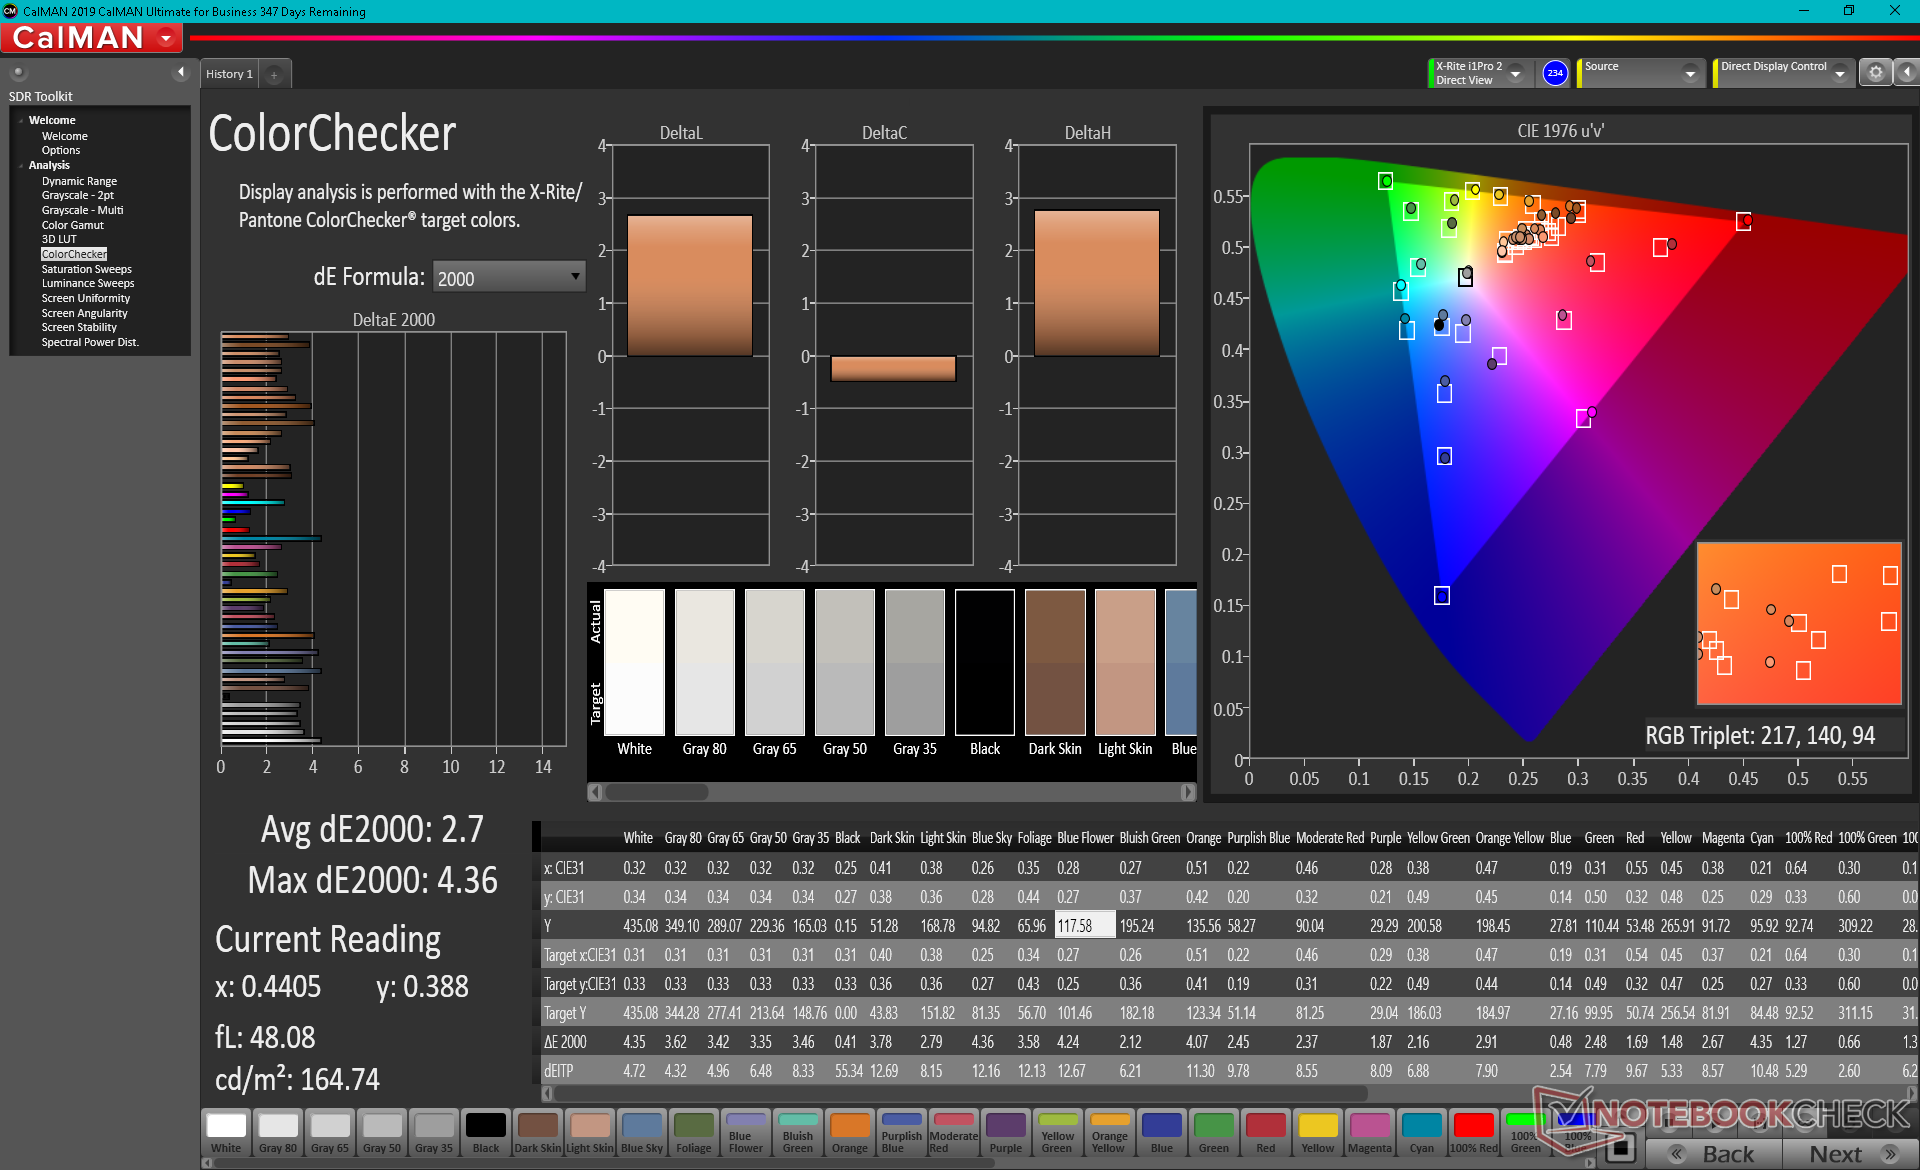
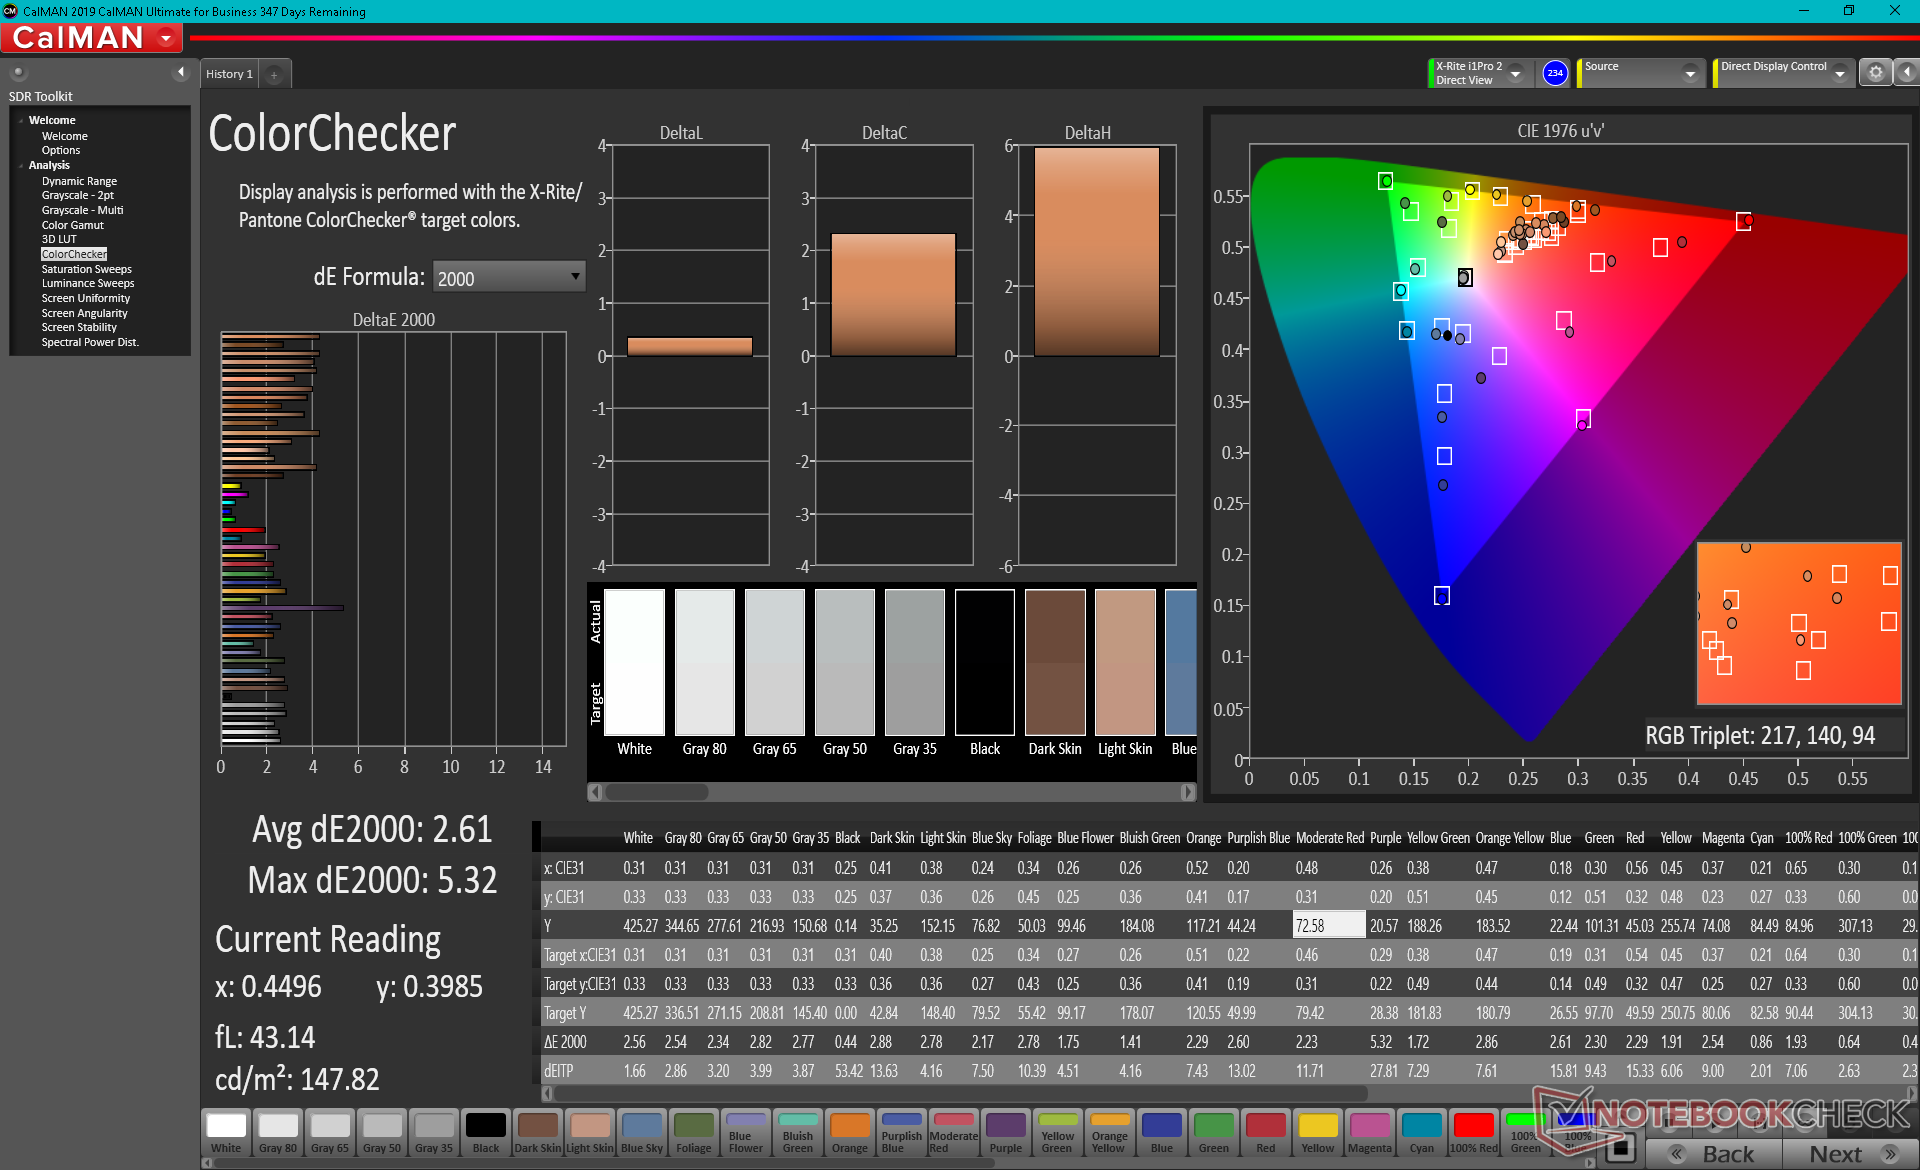
ΔE Color 2.7 | 0.5-29.43 Ø5, calibrated: 2.61
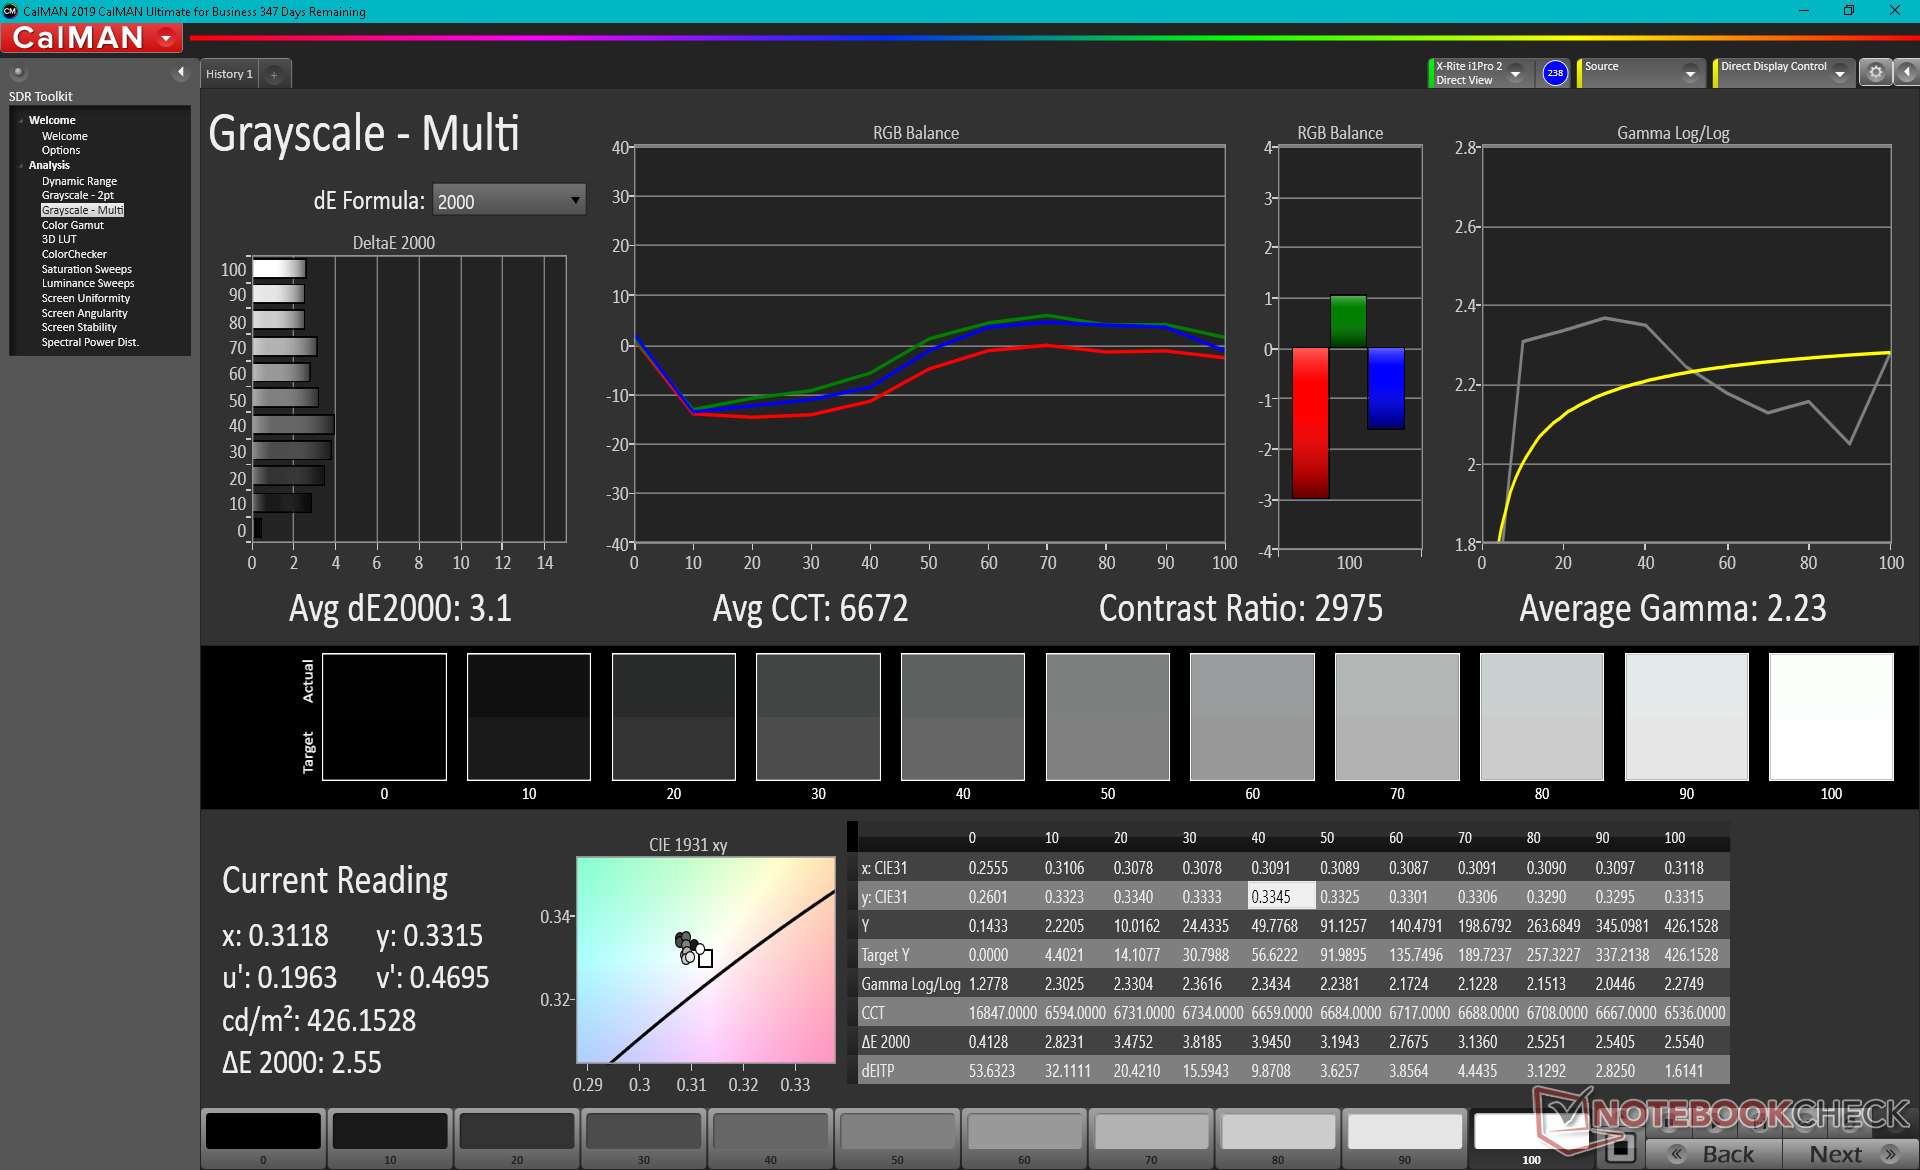
ΔE Greyscale 3.4 | 0.57-98 Ø5.3
98.5% sRGB (Argyll 1.6.3 3D)
62.1% AdobeRGB 1998 (Argyll 1.6.3 3D)
67.9% AdobeRGB 1998 (Argyll 2.2.0 3D)
98.2% sRGB (Argyll 2.2.0 3D)
65.8% Display P3 (Argyll 2.2.0 3D)
Gamma: 2.09
| HP Spectre x360 14t-ea000 LG Philips LGD0663, IPS, 13.50, 1920x1280 | HP Spectre x360 13-aw0013dx AU Optronics AUO5E2D, IPS, 13.30, 1920x1080 | Dell XPS 13 7390 2-in-1 Core i7 Sharp LQ134N1, IPS, 13.40, 1920x1200 | Huawei MateBook 14 2020 Intel TV140WTM-NH0, IPS LED, 14.00, 2160x1440 | Asus Zenbook S UX393JA AU Optronics B139KAN01.0, IPS, 13.90, 3300x2200 | Lenovo Yoga 9i 14ITL5 LG Display LP140WF9-SPE2, IPS, 14.00, 1920x1080 | |
|---|---|---|---|---|---|---|
| Display | 4% | 4% | 2% | 26% | -3% | |
| Display P3 Coverage | 65.8 | 69.6 6% | 69.9 6% | 67.1 2% | 97.7 48% | 64.2 -2% |
| sRGB Coverage | 98.2 | 98.9 1% | 99.2 1% | 99.1 1% | 99.8 2% | 94.2 -4% |
| AdobeRGB 1998 Coverage | 67.9 | 71.5 5% | 71.5 5% | 69 2% | 87.9 29% | 65 -4% |
| Response Times | 5% | 25% | 41% | 6% | 12% | |
| Response Time Grey 50% / Grey 80% * | 62 ? | 60.8 ? 2% | 47.6 ? 23% | 37.6 ? 39% | 56.4 ? 9% | 55.2 ? 11% |
| Response Time Black / White * | 39.6 ? | 36.8 ? 7% | 29.2 ? 26% | 22.4 ? 43% | 38.8 ? 2% | 34.4 ? 13% |
| PWM Frequency | 2500 ? | 59520 ? | ||||
| Screen | -28% | 1% | -12% | -19% | -16% | |
| Brightness middle | 443.5 | 447.4 1% | 549.8 24% | 458 3% | 444.1 0% | 365 -18% |
| Brightness | 394 | 420 7% | 520 32% | 448 14% | 423 7% | 346 -12% |
| Brightness Distribution | 78 | 85 9% | 86 10% | 89 14% | 89 14% | 82 5% |
| Black Level * | 0.17 | 0.31 -82% | 0.39 -129% | 0.25 -47% | 0.37 -118% | 0.23 -35% |
| Contrast | 2609 | 1443 -45% | 1410 -46% | 1832 -30% | 1200 -54% | 1587 -39% |
| Colorchecker dE 2000 * | 2.7 | 4.23 -57% | 2.12 21% | 3.4 -26% | 2.94 -9% | 3.65 -35% |
| Colorchecker dE 2000 max. * | 4.36 | 9.34 -114% | 3.66 16% | 6.7 -54% | 7.37 -69% | 6.69 -53% |
| Colorchecker dE 2000 calibrated * | 2.61 | 1.32 49% | 1.37 48% | 1.7 35% | 3.05 -17% | 1.61 38% |
| Greyscale dE 2000 * | 3.4 | 6.1 -79% | 2.6 24% | 4.9 -44% | 2.9 15% | 4 -18% |
| Gamma | 2.09 105% | 2.11 104% | 2.3 96% | 2.16 102% | 2.1 105% | 2.33 94% |
| CCT | 6144 106% | 6136 106% | 6884 94% | 7704 84% | 6766 96% | 6873 95% |
| Color Space (Percent of AdobeRGB 1998) | 62.1 | 64.8 4% | 65.4 5% | 63.5 2% | 78.2 26% | 60.1 -3% |
| Color Space (Percent of sRGB) | 98.5 | 98.9 0% | 99.7 1% | 99.1 1% | 99.8 1% | 93.9 -5% |
| Total Average (Program / Settings) | -6% /
-18% | 10% /
4% | 10% /
-3% | 4% /
-7% | -2% /
-10% |
* ... smaller is better
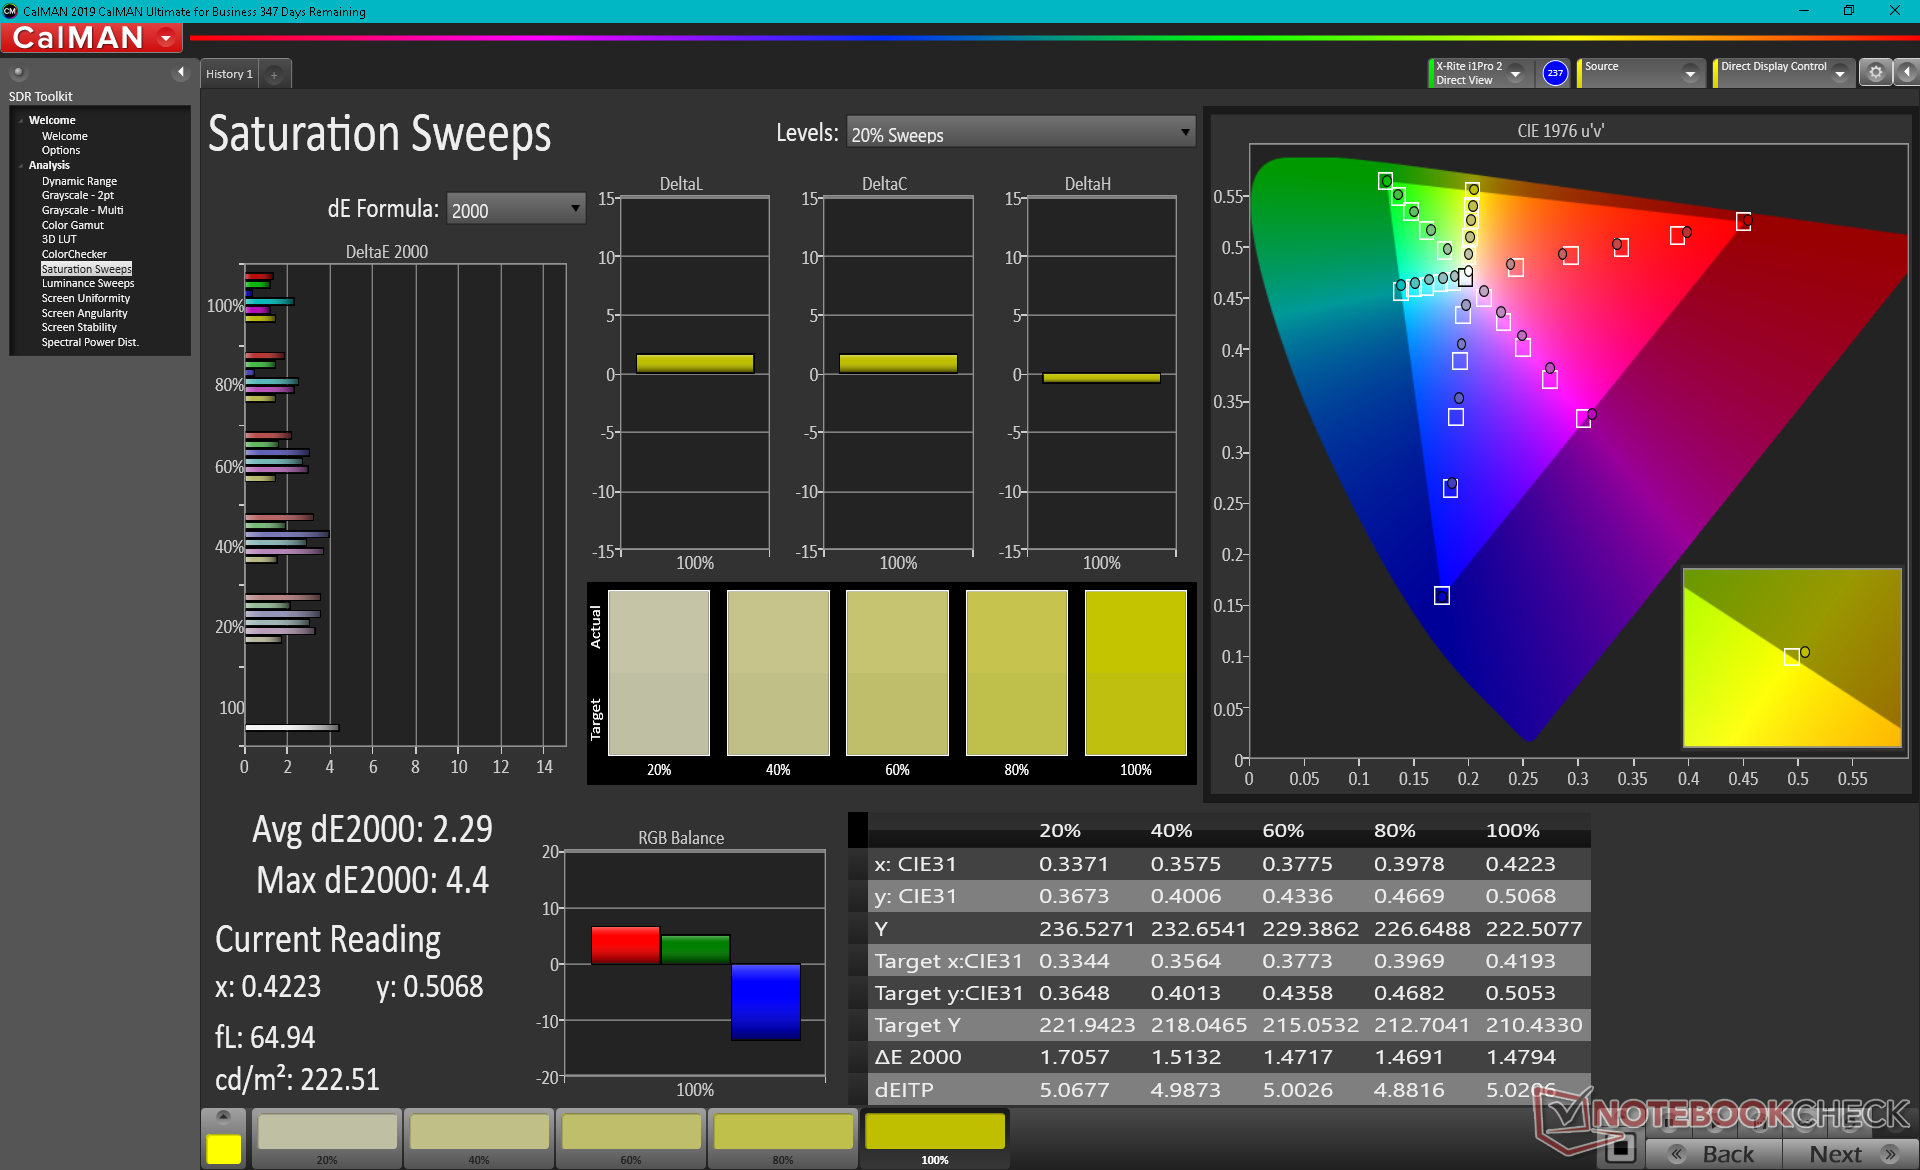
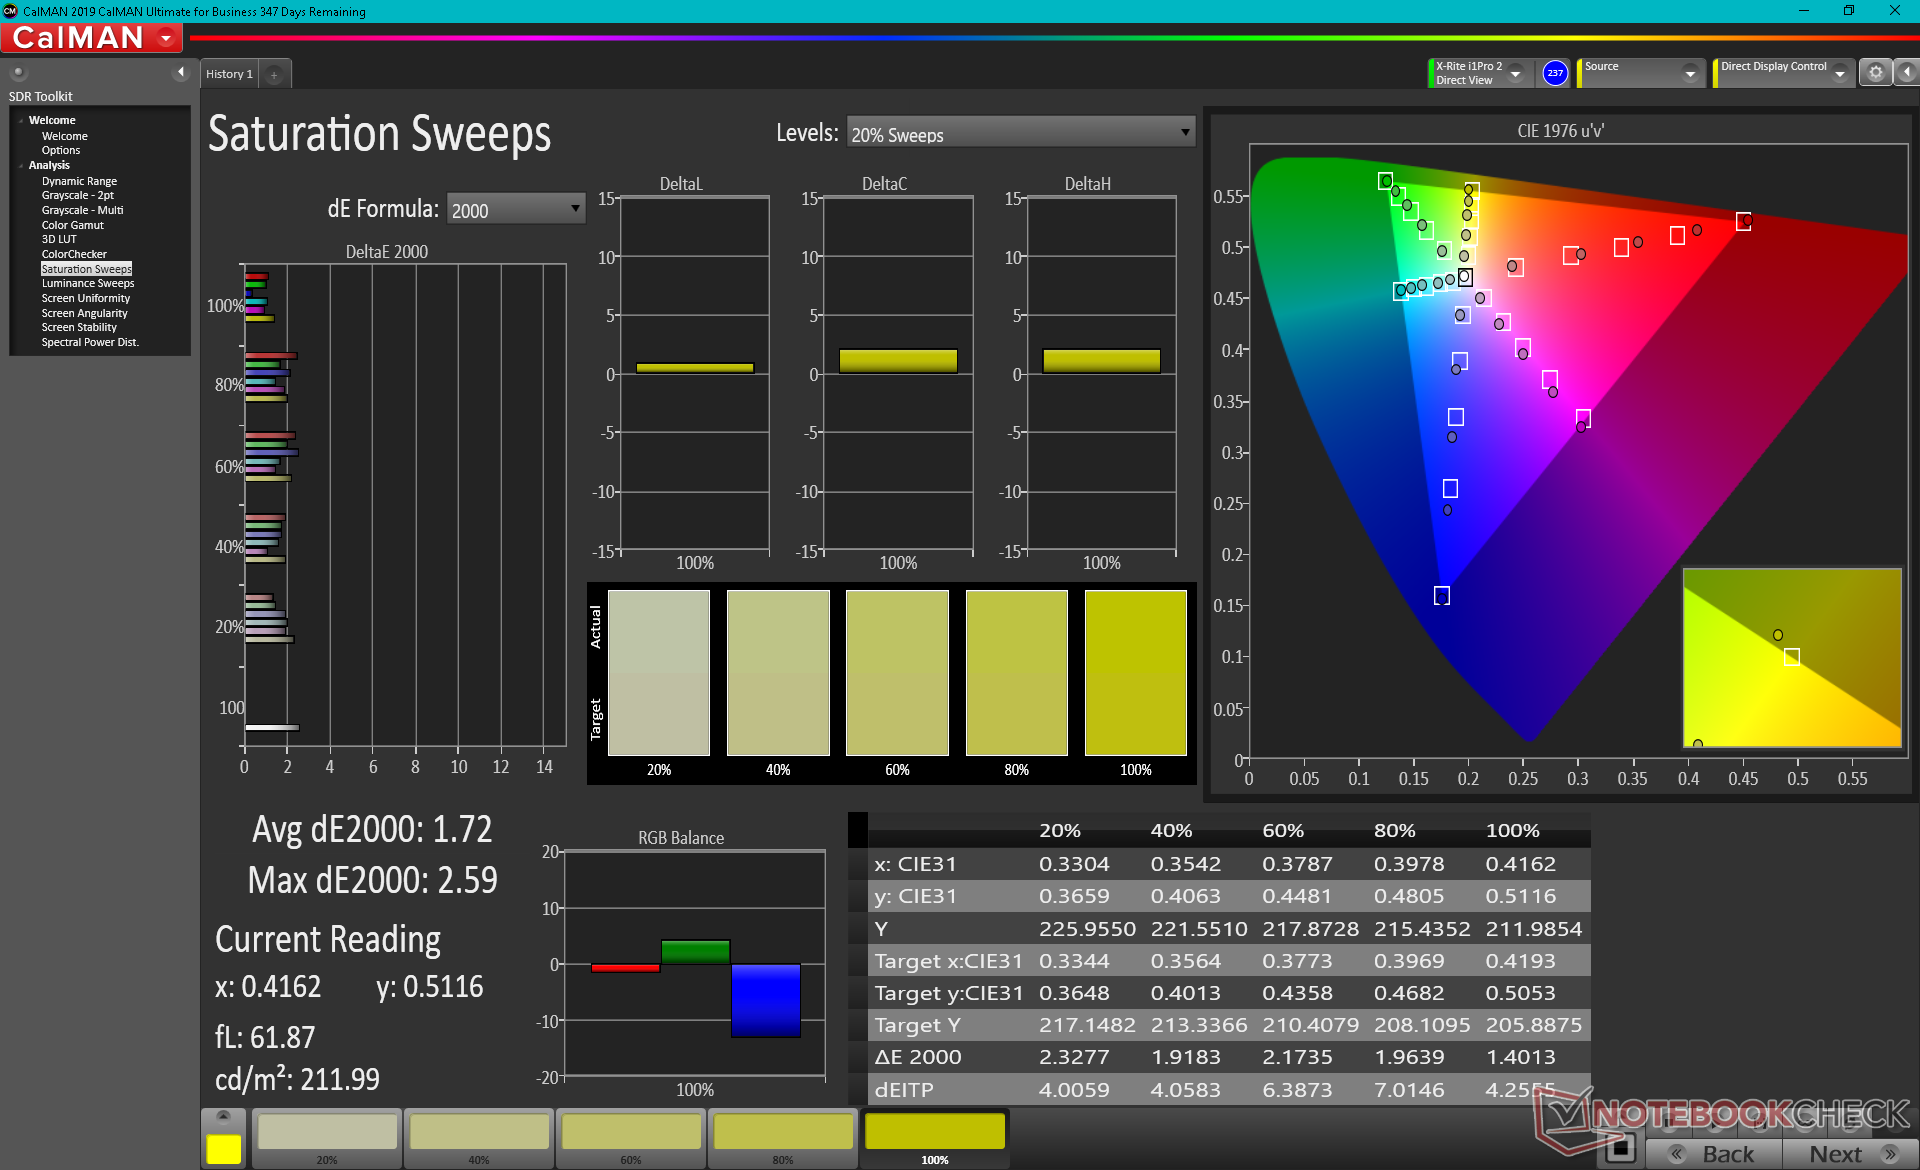
Color space covers almost all of sRGB and approximately 62 percent of AdobeRGB not unlike other high-end Ultrabooks. The costlier OLED option will be able to offer even deeper colors approaching DCI-P3.
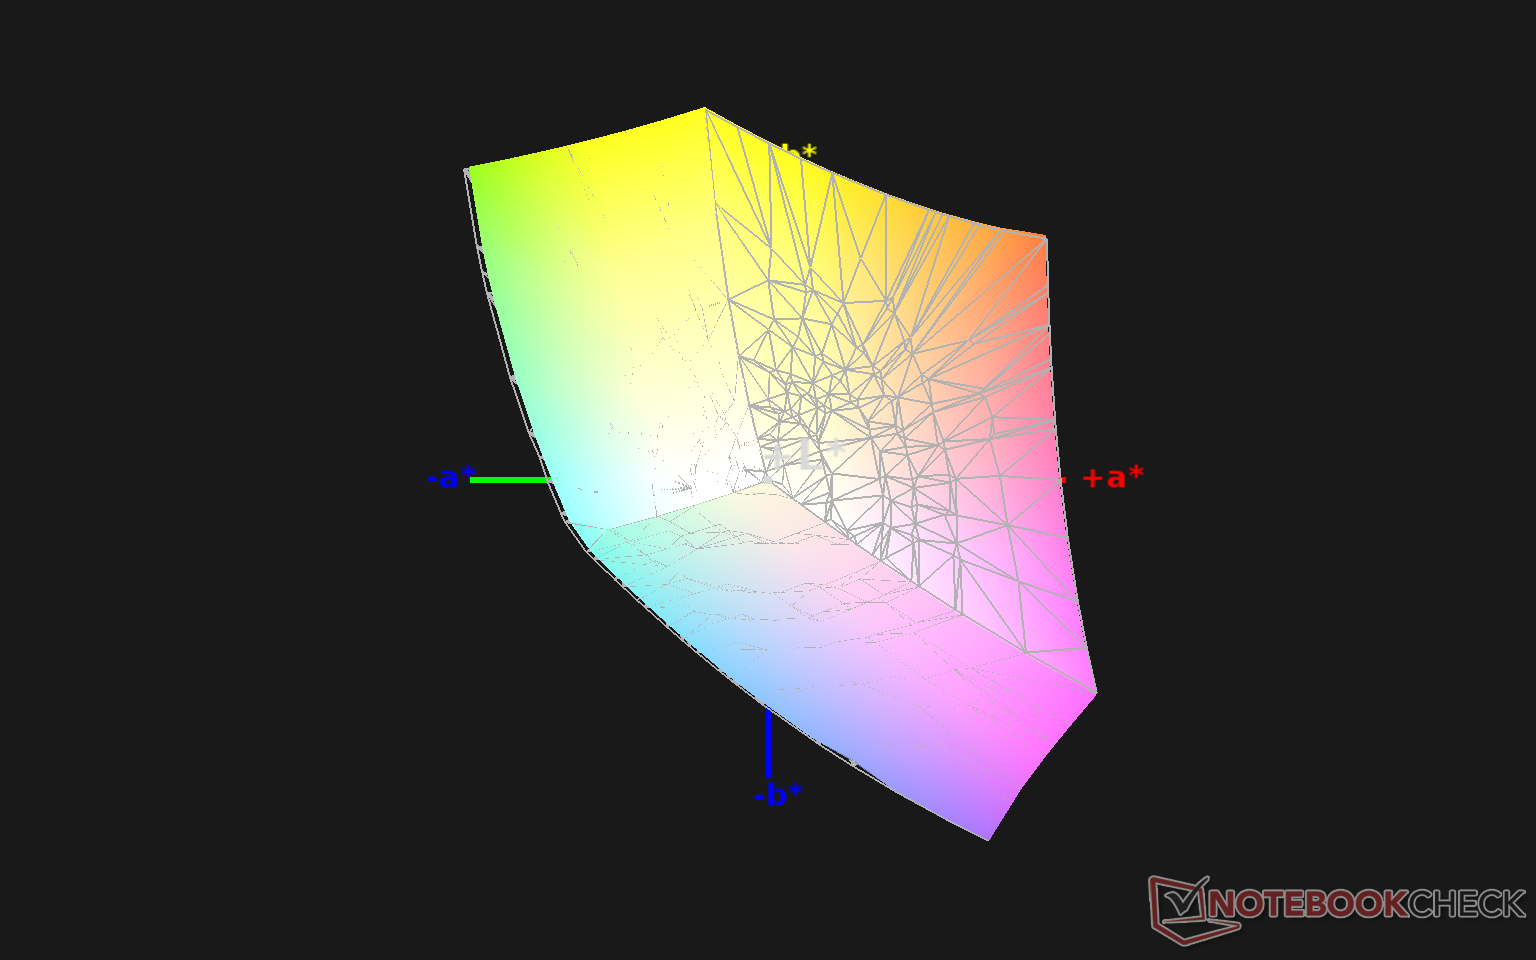
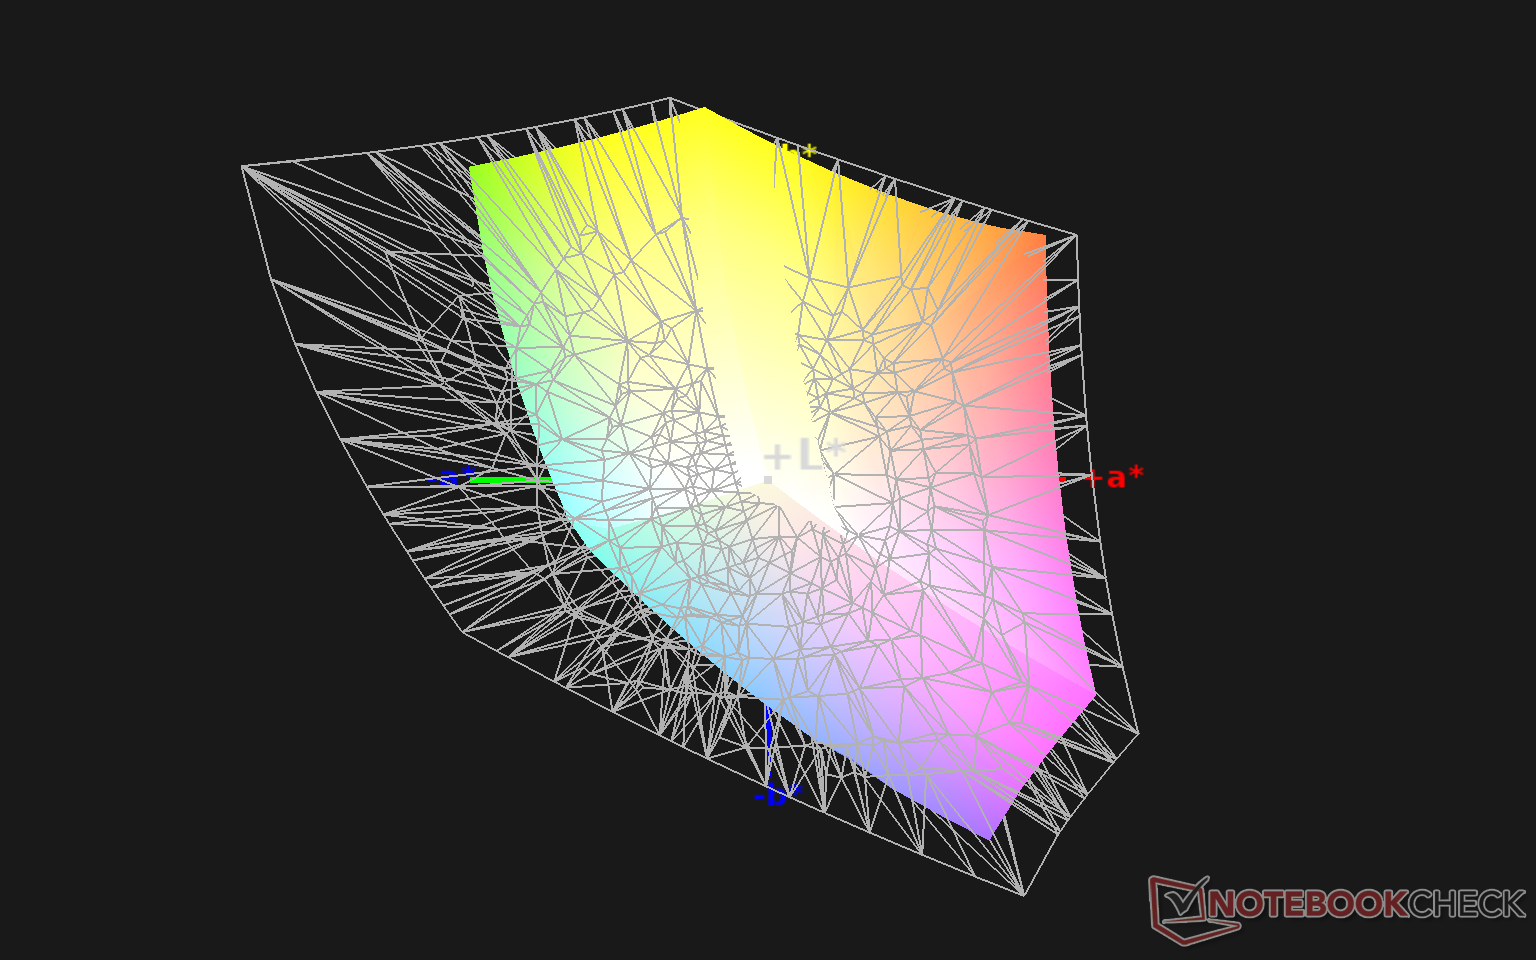
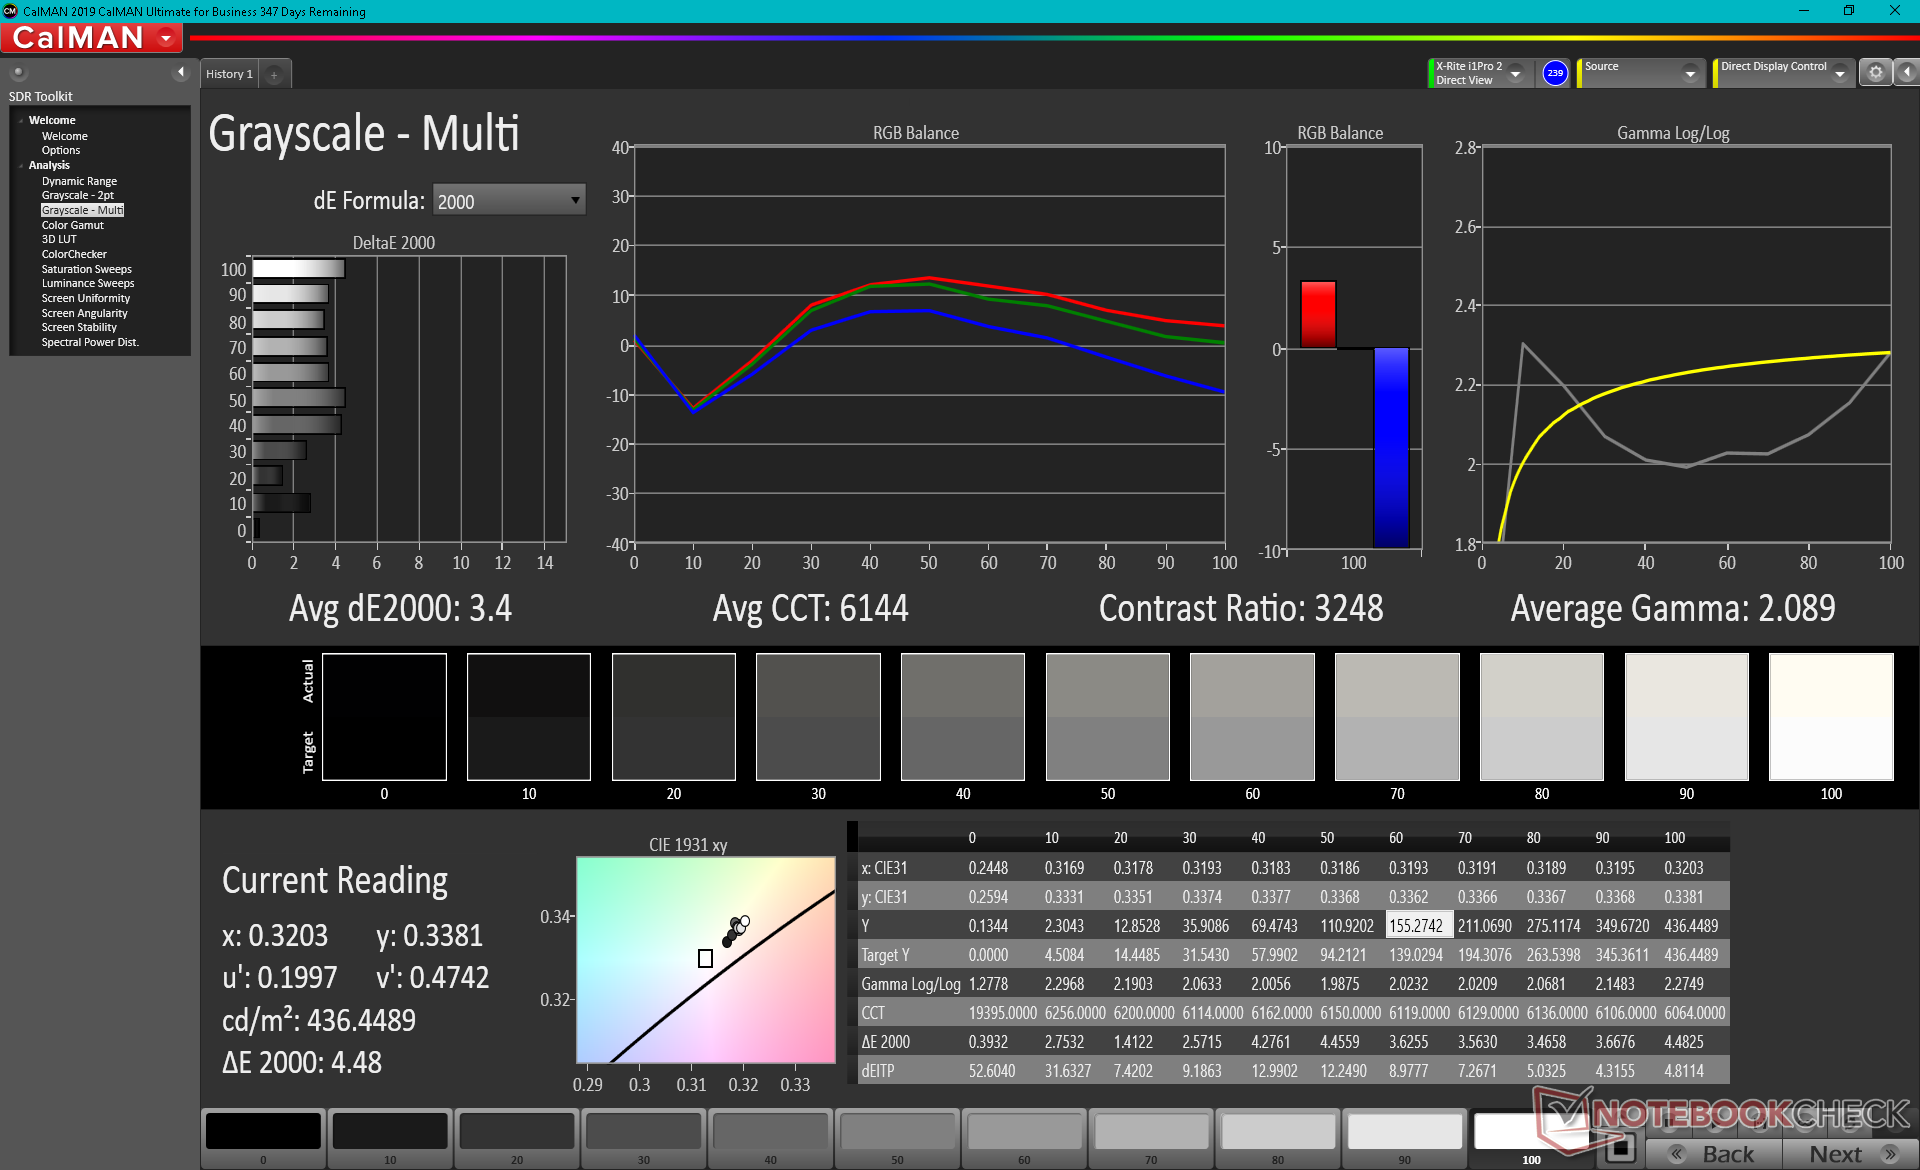
Color temperature is slightly too warm out of the box which our X-Rite colorimeter is able to address. RGB balance is merely average even after calibrating the panel ourselves.
Display Response Times
| ↔ Response Time Black to White | ||
|---|---|---|
| 39.6 ms ... rise ↗ and fall ↘ combined | ↗ 21.6 ms rise | 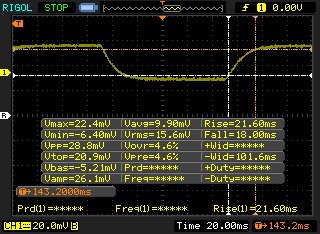 |
| ↘ 18 ms fall | ||
| The screen shows slow response rates in our tests and will be unsatisfactory for gamers. In comparison, all tested devices range from 0.1 (minimum) to 240 (maximum) ms. » 97 % of all devices are better. This means that the measured response time is worse than the average of all tested devices (21.5 ms). | ||
| ↔ Response Time 50% Grey to 80% Grey | ||
| 62 ms ... rise ↗ and fall ↘ combined | ↗ 32 ms rise | 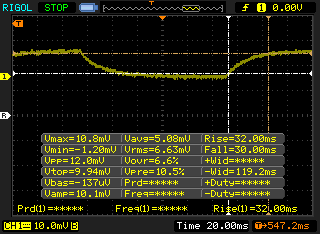 |
| ↘ 30 ms fall | ||
| The screen shows slow response rates in our tests and will be unsatisfactory for gamers. In comparison, all tested devices range from 0.2 (minimum) to 636 (maximum) ms. » 96 % of all devices are better. This means that the measured response time is worse than the average of all tested devices (33.7 ms). | ||
Screen Flickering / PWM (Pulse-Width Modulation)
| Screen flickering / PWM not detected | 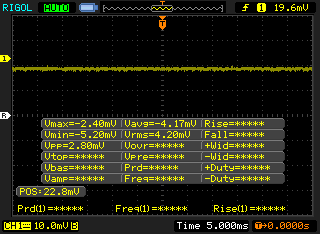 | ||
In comparison: 53 % of all tested devices do not use PWM to dim the display. If PWM was detected, an average of 17924 (minimum: 5 - maximum: 3846000) Hz was measured. | |||
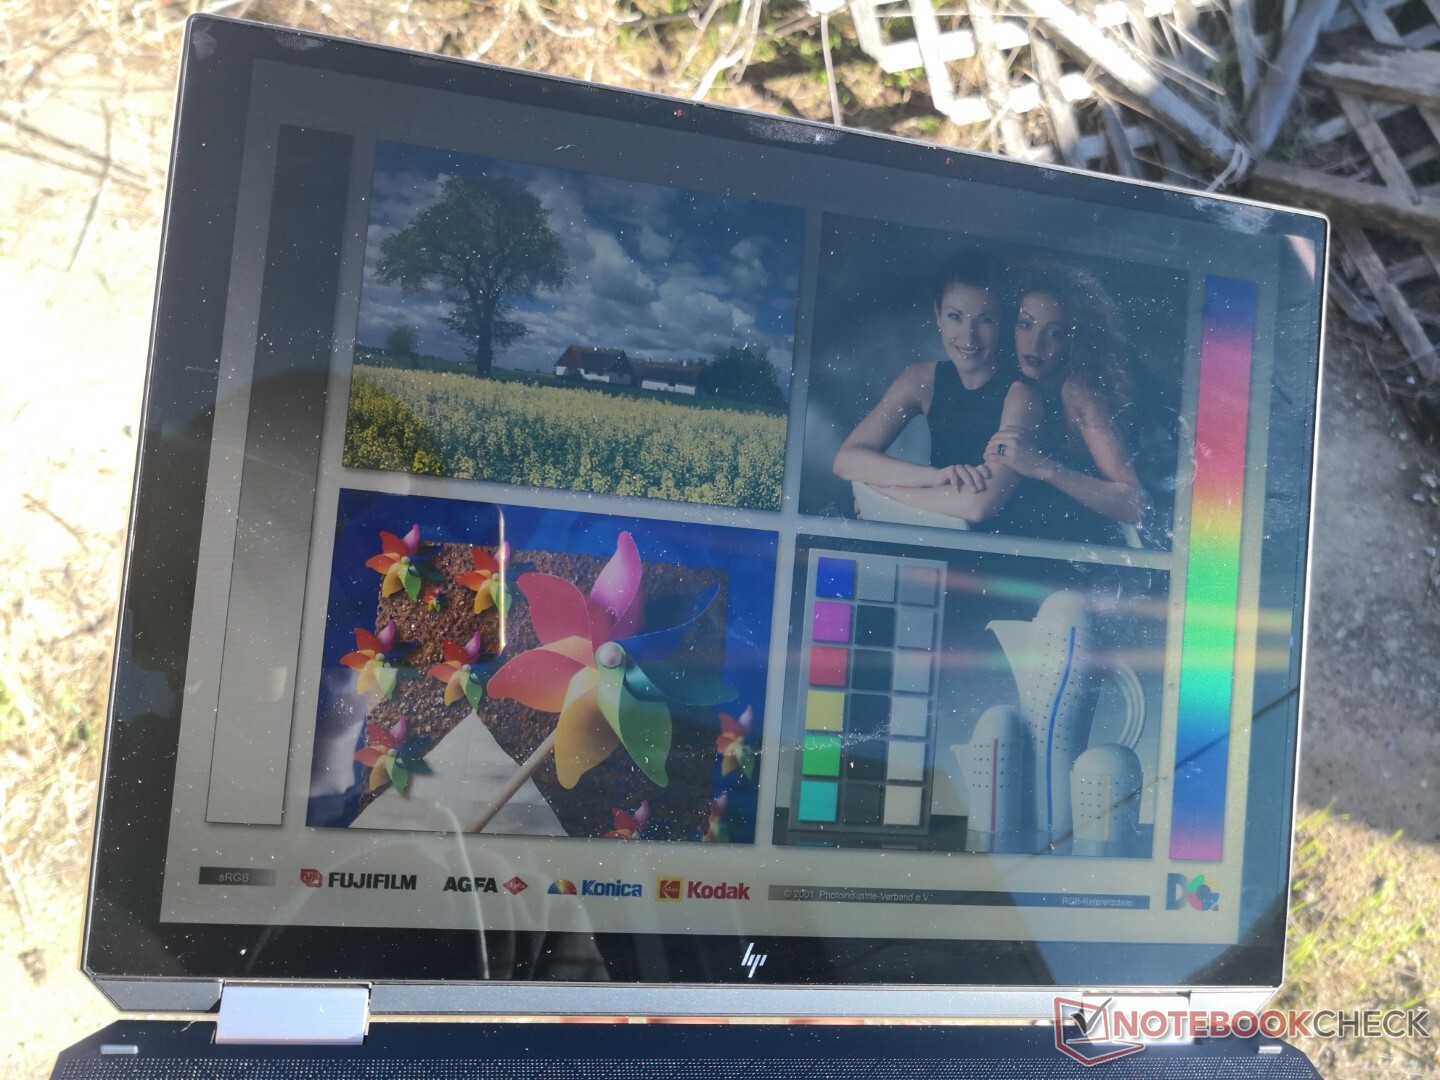
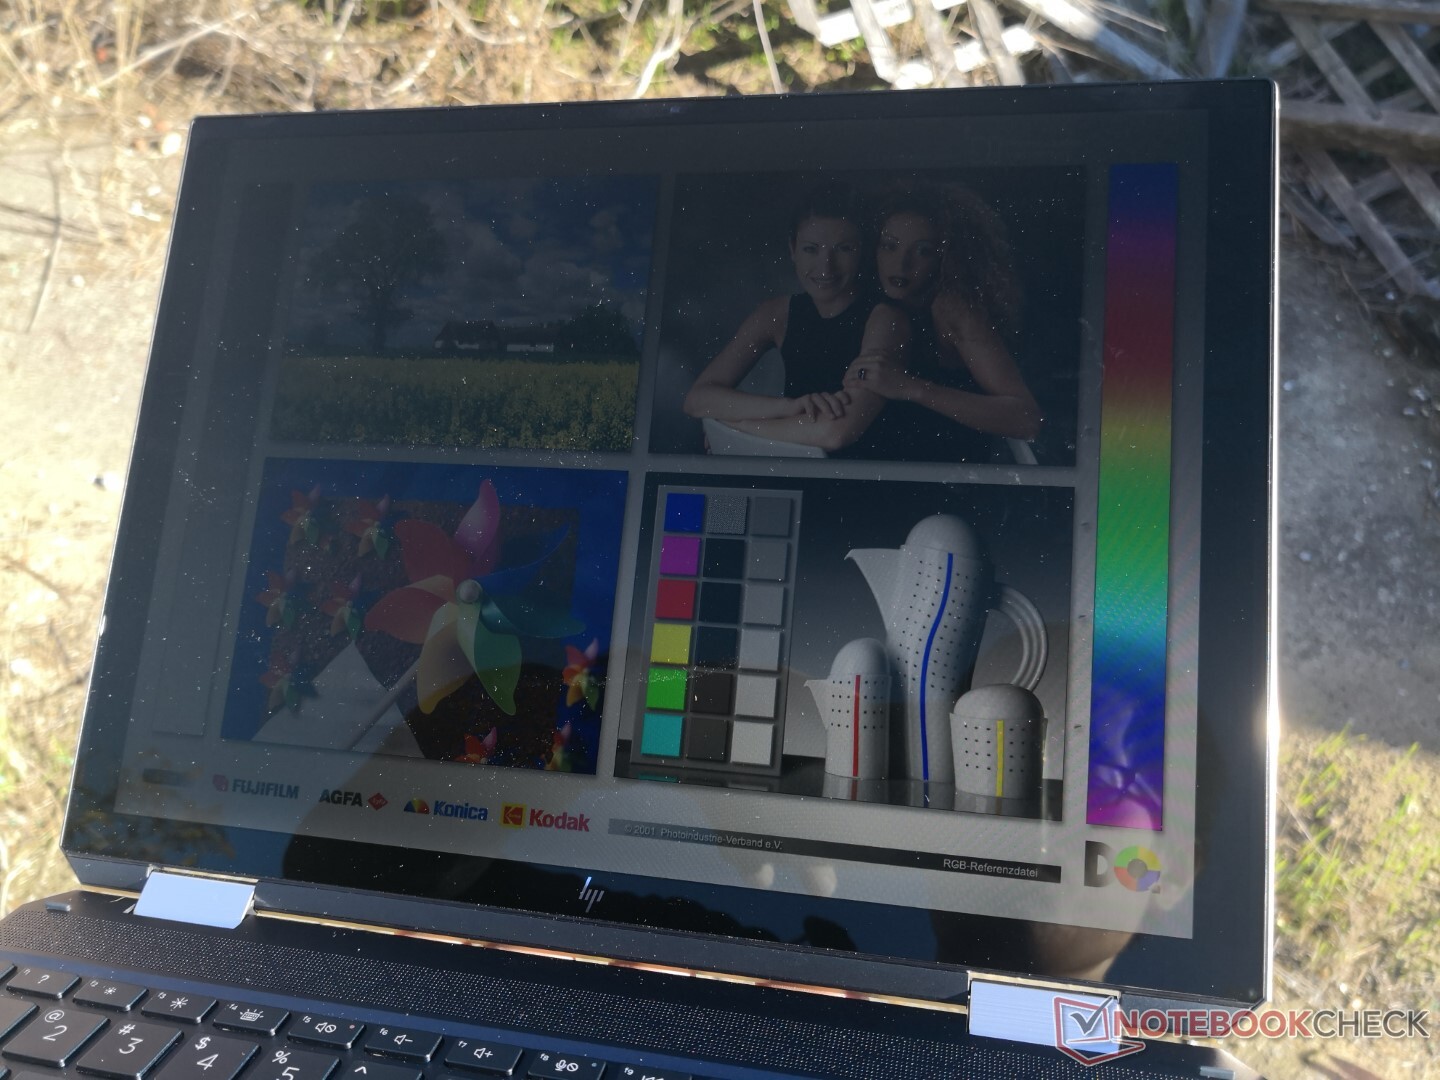
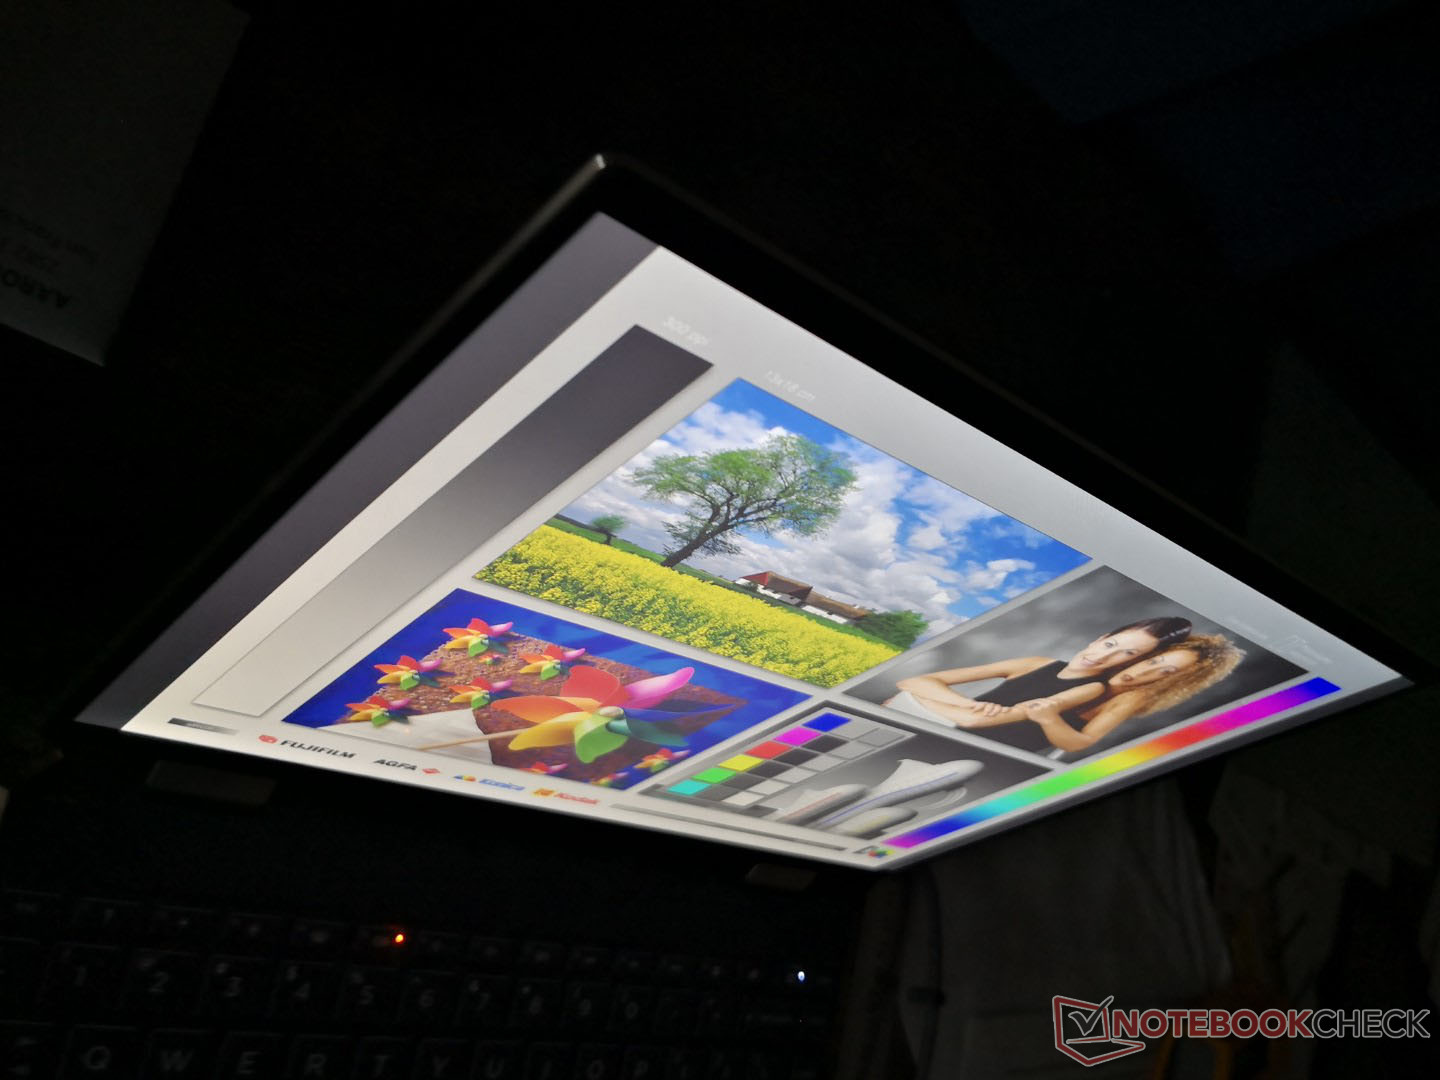
Outdoor visibility is about the same as the Spectre x360 13 or Asus ZenBook S since they all have similar maximum brightness levels. The higher contrast ratio of the Spectre x360 14 display, however, helps to mitigate washed out colors by just a bit when under sunlight. Glare is otherwise almost unavoidable. We recommend the 1000-nit option if outdoor visibility is priority.
Performance
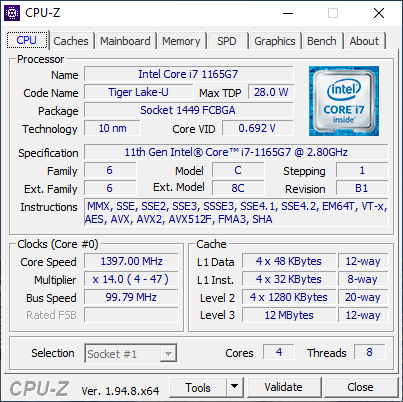
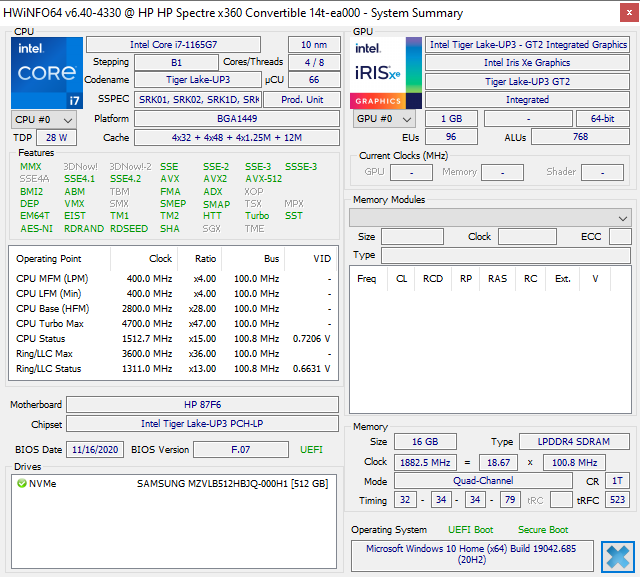
The 11th gen Tiger Lake Core i7-1165G7 directly replaces last year's 10th gen Ice Lake Core i7-1065G7. Unlike the Envy series, there are unfortunately no AMD options available on this Spectre since it is an Intel Evo-certified laptop. The Spectre would lose its Evo certification if it came equipped with AMD options.
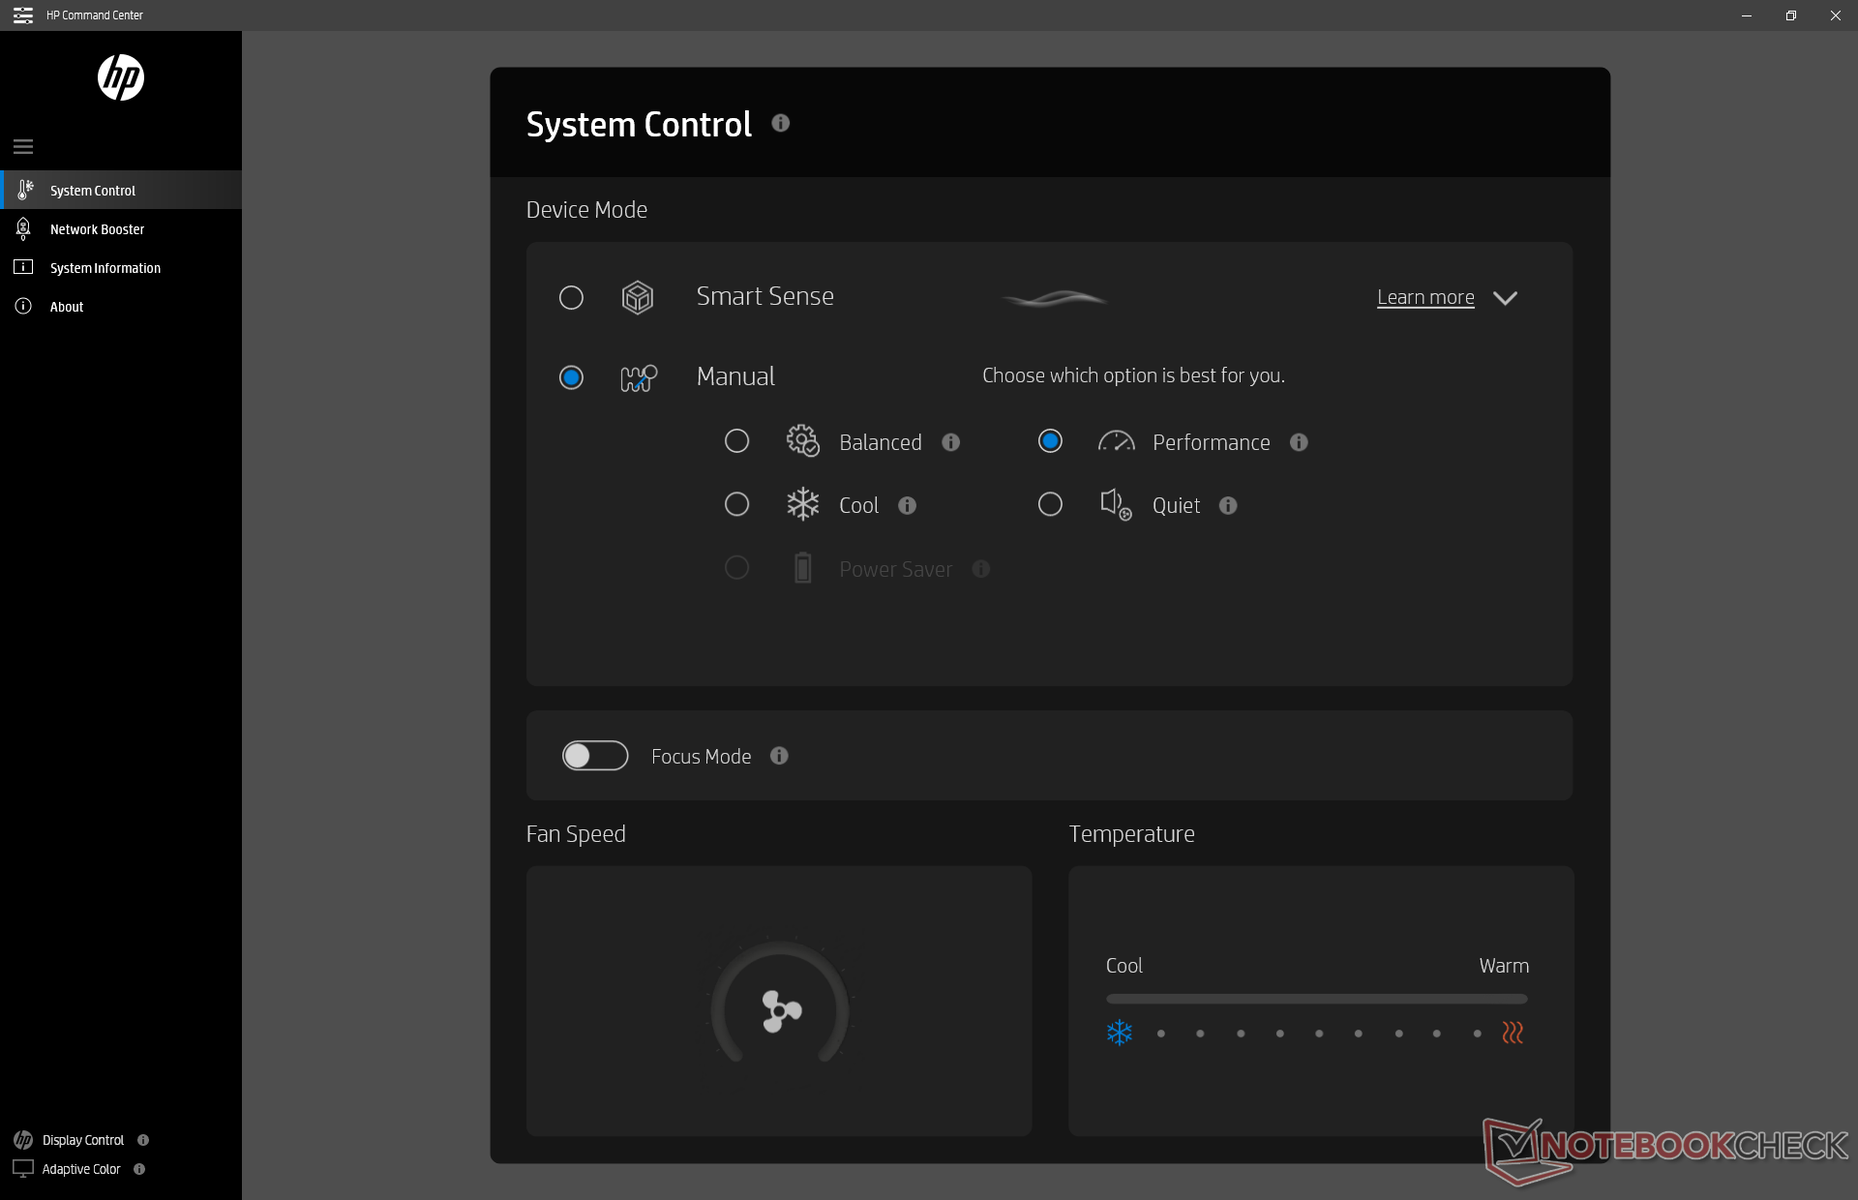
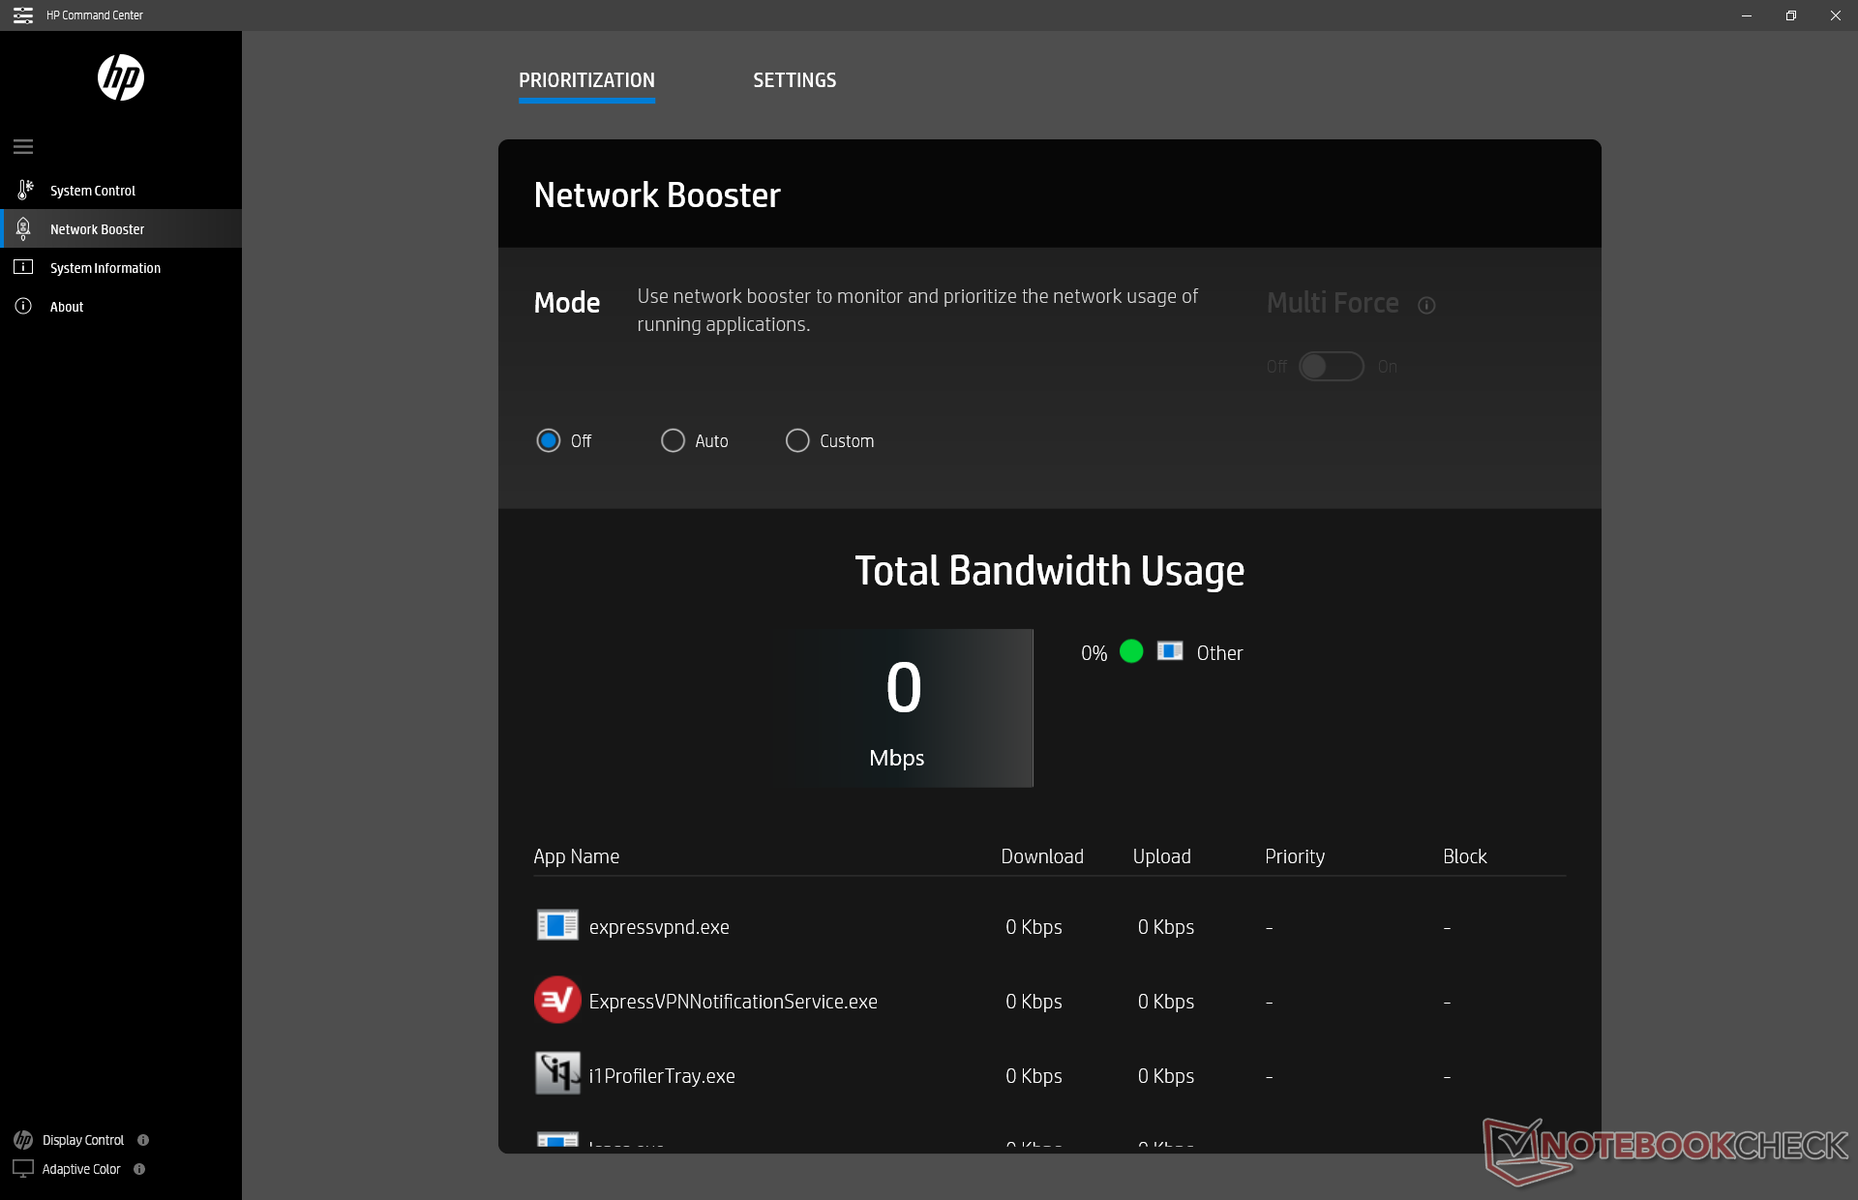
We set our unit to Performance mode via HP Command Center prior to running any performance tests below for the highest possible scores. We recommend owners become familiar with Command Center since it includes manufacturer-specific performance and network controls.
Processor
Much like on the Dell XPS 13 9310 with the same Core i7-1165G7 CPU, processor performance can be unsteady when running high loads for long periods as clock rates will cycle to keep core temperatures in check. However, the amplitude and range at which clock rates cycle on the HP is tighter than on the Dell for a more predictable level of performance. Our CineBench R15 xT loop test below illustrates this as our Spectre 14 would generally score between 770 and 820 points compared to 620 and 750 points on the XPS 13. The HP system is seemingly better at sustaining both tighter and faster clock rates than the Dell as a result.
Raw multi-thread performance is about 20 to 40 percent faster than the Core i7-1065G7 in the Spectre x360 13. Some laptops with the same Core i7-1165G7 CPU are able to run even faster like the Razer Book 13.
Cinebench R15: CPU Multi 64Bit | CPU Single 64Bit
Blender: v2.79 BMW27 CPU
7-Zip 18.03: 7z b 4 -mmt1 | 7z b 4
Geekbench 5.5: Single-Core | Multi-Core
HWBOT x265 Benchmark v2.2: 4k Preset
LibreOffice : 20 Documents To PDF
R Benchmark 2.5: Overall mean
| Blender / v2.79 BMW27 CPU | |
| HP Envy x360 13-ar0601ng | |
| Huawei MateBook 14 2020 Intel | |
| Asus Zenbook S UX393JA | |
| Asus ZenBook 14 UX434FL-DB77 | |
| HP Envy x360 13-ay0359ng | |
| Dell XPS 13 7390 2-in-1 Core i7 | |
| Lenovo Yoga 9i 14ITL5 | |
| Average Intel Core i7-1165G7 (468 - 1138, n=80) | |
| HP Spectre x360 14t-ea000 | |
| Dell XPS 13 7390 Core i7-10710U | |
| Lenovo Yoga Slim 7 14ARE05 82A20008GE | |
| Lenovo Yoga Slim 7-14ARE | |
| 7-Zip 18.03 / 7z b 4 -mmt1 | |
| Average Intel Core i7-1165G7 (4478 - 5507, n=80) | |
| HP Spectre x360 14t-ea000 | |
| Lenovo Yoga 9i 14ITL5 | |
| Huawei MateBook 14 2020 Intel | |
| Lenovo Yoga Slim 7-14ARE | |
| Dell XPS 13 7390 2-in-1 Core i7 | |
| Asus Zenbook S UX393JA | |
| Dell XPS 13 7390 Core i7-10710U | |
| Lenovo Yoga Slim 7 14ARE05 82A20008GE | |
| HP Envy x360 13-ay0359ng | |
| Asus ZenBook 14 UX434FL-DB77 | |
| HP Envy x360 13-ar0601ng | |
| 7-Zip 18.03 / 7z b 4 | |
| Lenovo Yoga Slim 7-14ARE | |
| Lenovo Yoga Slim 7 14ARE05 82A20008GE | |
| Dell XPS 13 7390 Core i7-10710U | |
| Average Intel Core i7-1165G7 (15347 - 27405, n=80) | |
| Dell XPS 13 7390 2-in-1 Core i7 | |
| Lenovo Yoga 9i 14ITL5 | |
| HP Envy x360 13-ay0359ng | |
| HP Spectre x360 14t-ea000 | |
| Asus Zenbook S UX393JA | |
| Huawei MateBook 14 2020 Intel | |
| Asus ZenBook 14 UX434FL-DB77 | |
| HP Envy x360 13-ar0601ng | |
| Geekbench 5.5 / Single-Core | |
| Average Intel Core i7-1165G7 (1302 - 1595, n=77) | |
| HP Spectre x360 14t-ea000 | |
| Lenovo Yoga 9i 14ITL5 | |
| Asus Zenbook S UX393JA | |
| Huawei MateBook 14 2020 Intel | |
| Asus ZenBook 14 UX434FL-DB77 | |
| Lenovo Yoga Slim 7-14ARE | |
| Lenovo Yoga Slim 7-14ARE | |
| Lenovo Yoga Slim 7 14ARE05 82A20008GE | |
| Geekbench 5.5 / Multi-Core | |
| Lenovo Yoga Slim 7-14ARE | |
| Lenovo Yoga Slim 7-14ARE | |
| Lenovo Yoga Slim 7 14ARE05 82A20008GE | |
| HP Spectre x360 14t-ea000 | |
| Lenovo Yoga 9i 14ITL5 | |
| Average Intel Core i7-1165G7 (3078 - 5926, n=77) | |
| Asus Zenbook S UX393JA | |
| Huawei MateBook 14 2020 Intel | |
| Asus ZenBook 14 UX434FL-DB77 | |
| HWBOT x265 Benchmark v2.2 / 4k Preset | |
| Lenovo Yoga Slim 7-14ARE | |
| Lenovo Yoga Slim 7 14ARE05 82A20008GE | |
| Lenovo Yoga 9i 14ITL5 | |
| Dell XPS 13 7390 2-in-1 Core i7 | |
| Average Intel Core i7-1165G7 (1.39 - 8.47, n=80) | |
| HP Spectre x360 14t-ea000 | |
| HP Envy x360 13-ay0359ng | |
| Dell XPS 13 7390 Core i7-10710U | |
| Asus ZenBook 14 UX434FL-DB77 | |
| Huawei MateBook 14 2020 Intel | |
| Asus Zenbook S UX393JA | |
| HP Envy x360 13-ar0601ng | |
| LibreOffice / 20 Documents To PDF | |
| HP Envy x360 13-ay0359ng | |
| Asus ZenBook 14 UX434FL-DB77 | |
| Lenovo Yoga Slim 7 14ARE05 82A20008GE | |
| Lenovo Yoga Slim 7-14ARE | |
| HP Spectre x360 14t-ea000 | |
| Huawei MateBook 14 2020 Intel | |
| Average Intel Core i7-1165G7 (21.5 - 88.1, n=78) | |
| Lenovo Yoga 9i 14ITL5 | |
| Asus Zenbook S UX393JA | |
| R Benchmark 2.5 / Overall mean | |
| Asus ZenBook 14 UX434FL-DB77 | |
| Asus Zenbook S UX393JA | |
| Huawei MateBook 14 2020 Intel | |
| HP Envy x360 13-ay0359ng | |
| Lenovo Yoga 9i 14ITL5 | |
| Lenovo Yoga Slim 7 14ARE05 82A20008GE | |
| Lenovo Yoga Slim 7-14ARE | |
| HP Spectre x360 14t-ea000 | |
| Average Intel Core i7-1165G7 (0.552 - 1.002, n=80) | |
Cinebench R15: CPU Multi 64Bit | CPU Single 64Bit
Blender: v2.79 BMW27 CPU
7-Zip 18.03: 7z b 4 -mmt1 | 7z b 4
Geekbench 5.5: Single-Core | Multi-Core
HWBOT x265 Benchmark v2.2: 4k Preset
LibreOffice : 20 Documents To PDF
R Benchmark 2.5: Overall mean
* ... smaller is better
System Performance
PCMark 10 results are where we expect them to be relative to other laptops with the same Core i7-1165G7 CPU. The HP system edges out ahead of Ultrabooks sporting older generation CPUs like the Asus Zenbook S or Spectre x360 13.
We experienced no software or hardware issues with our test unit save for an interesting Smart Sense observation that we will note in our Power Consumption section below.
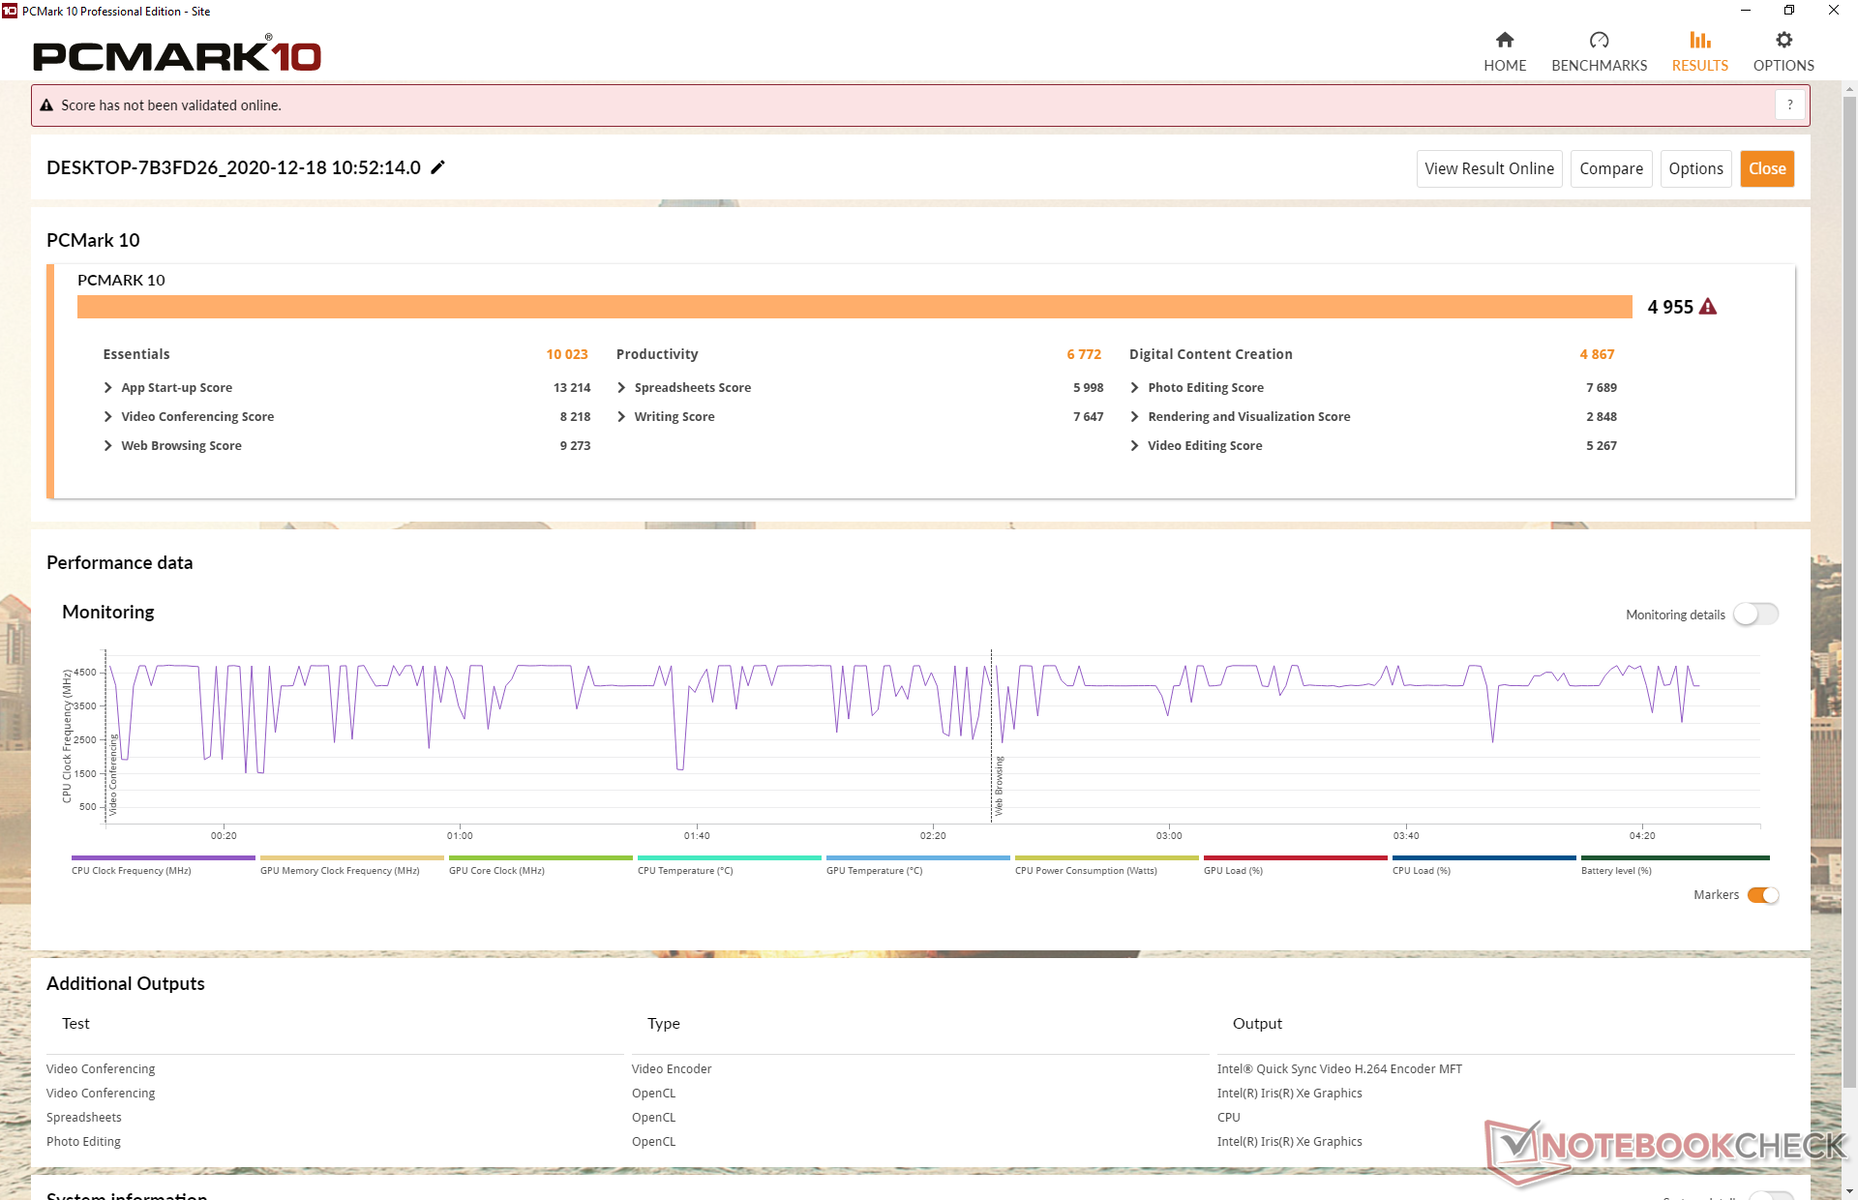
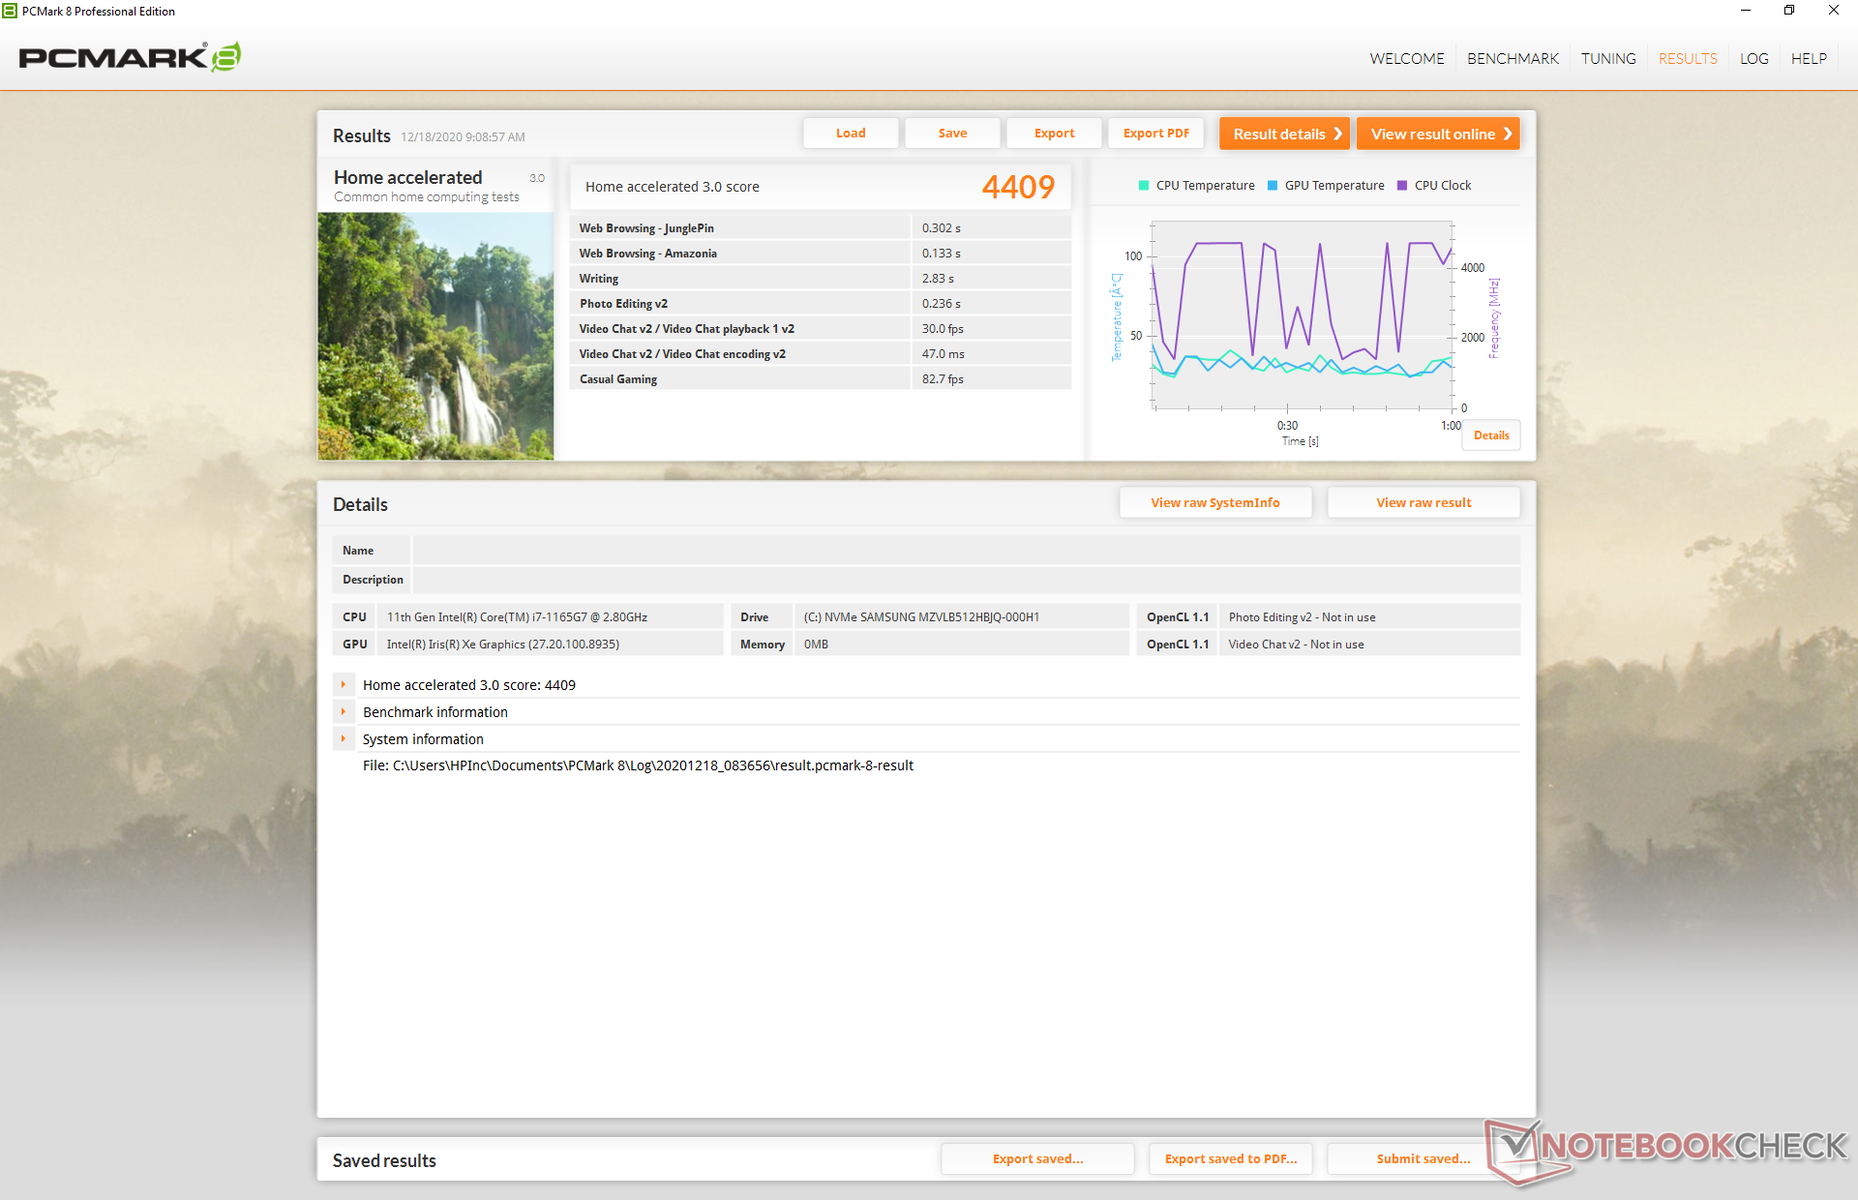
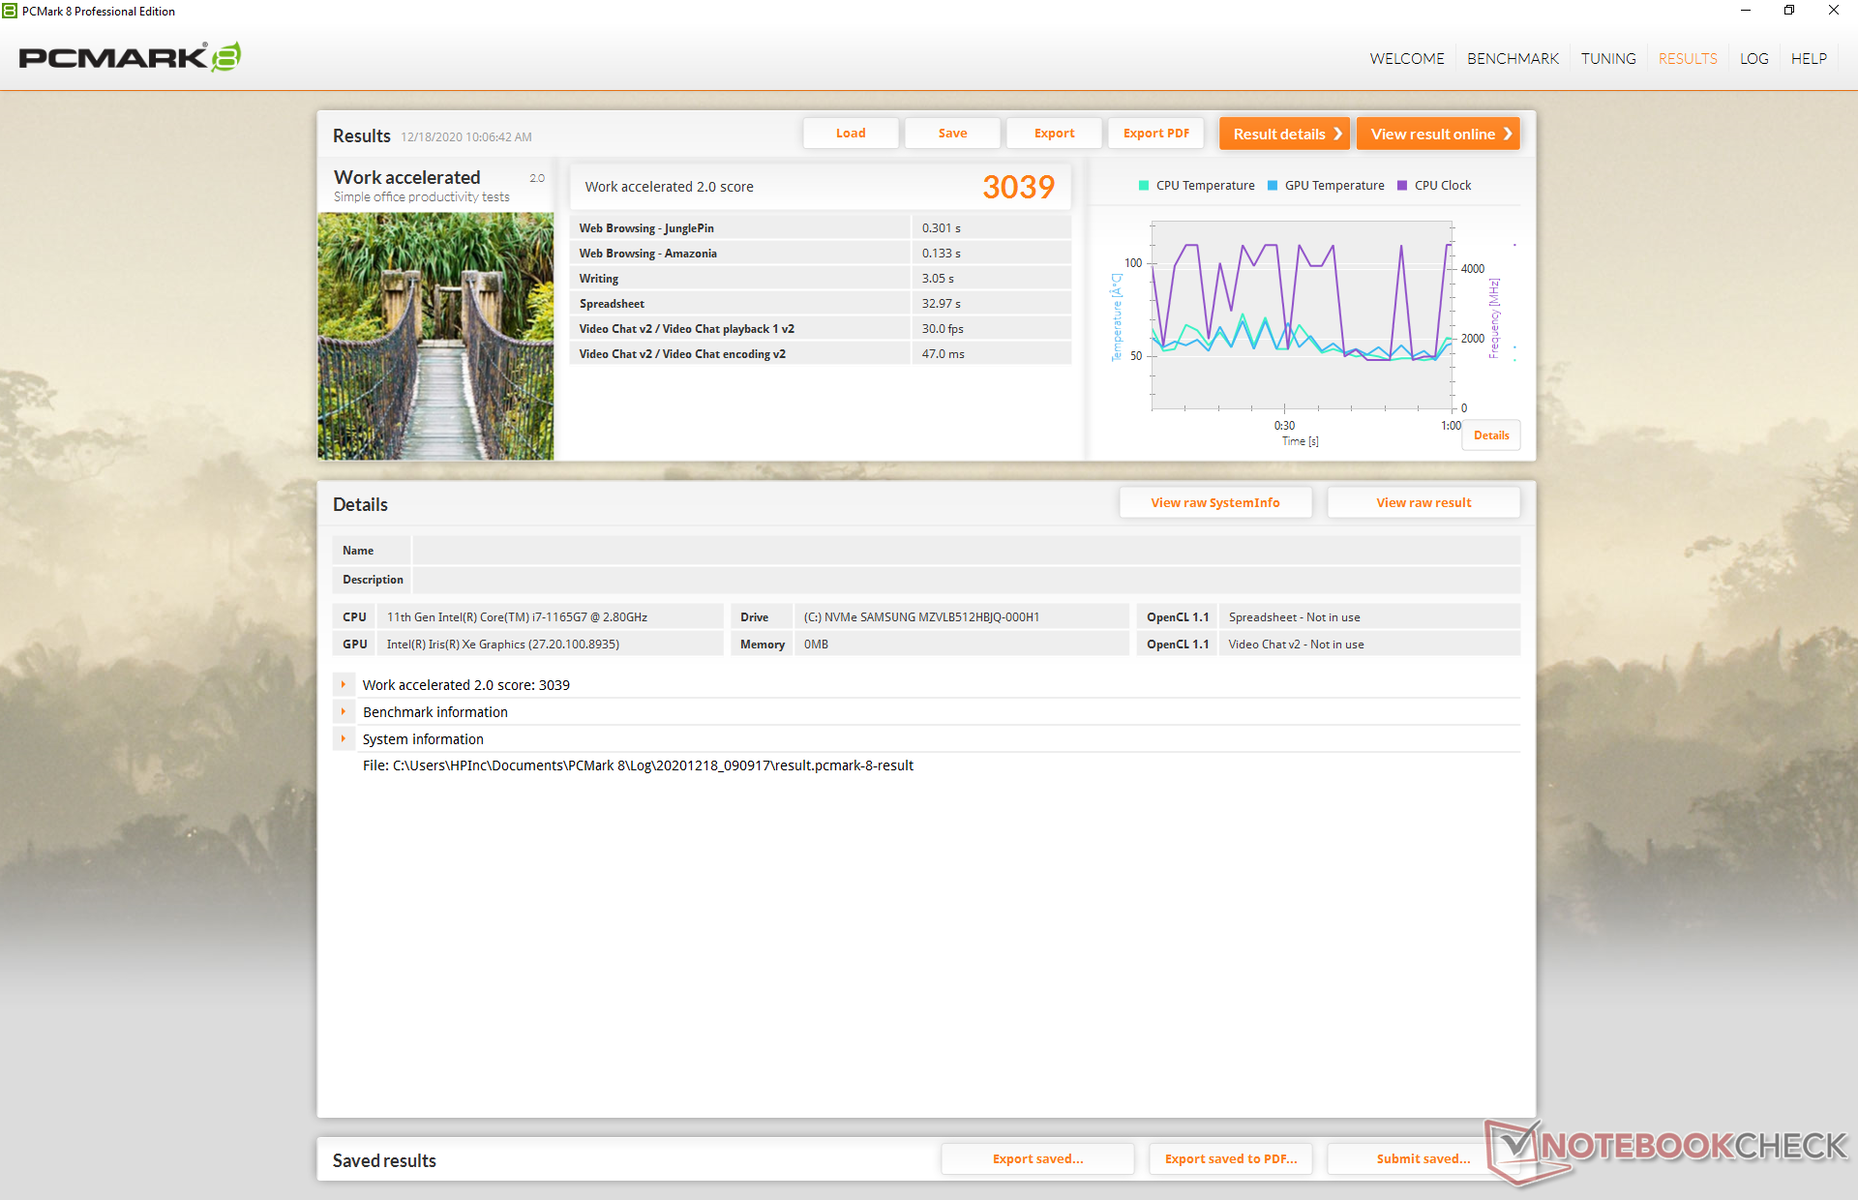
| PCMark 8 Home Score Accelerated v2 | 4409 points | |
| PCMark 8 Work Score Accelerated v2 | 3039 points | |
| PCMark 10 Score | 4955 points | |
Help | ||
DPC Latency
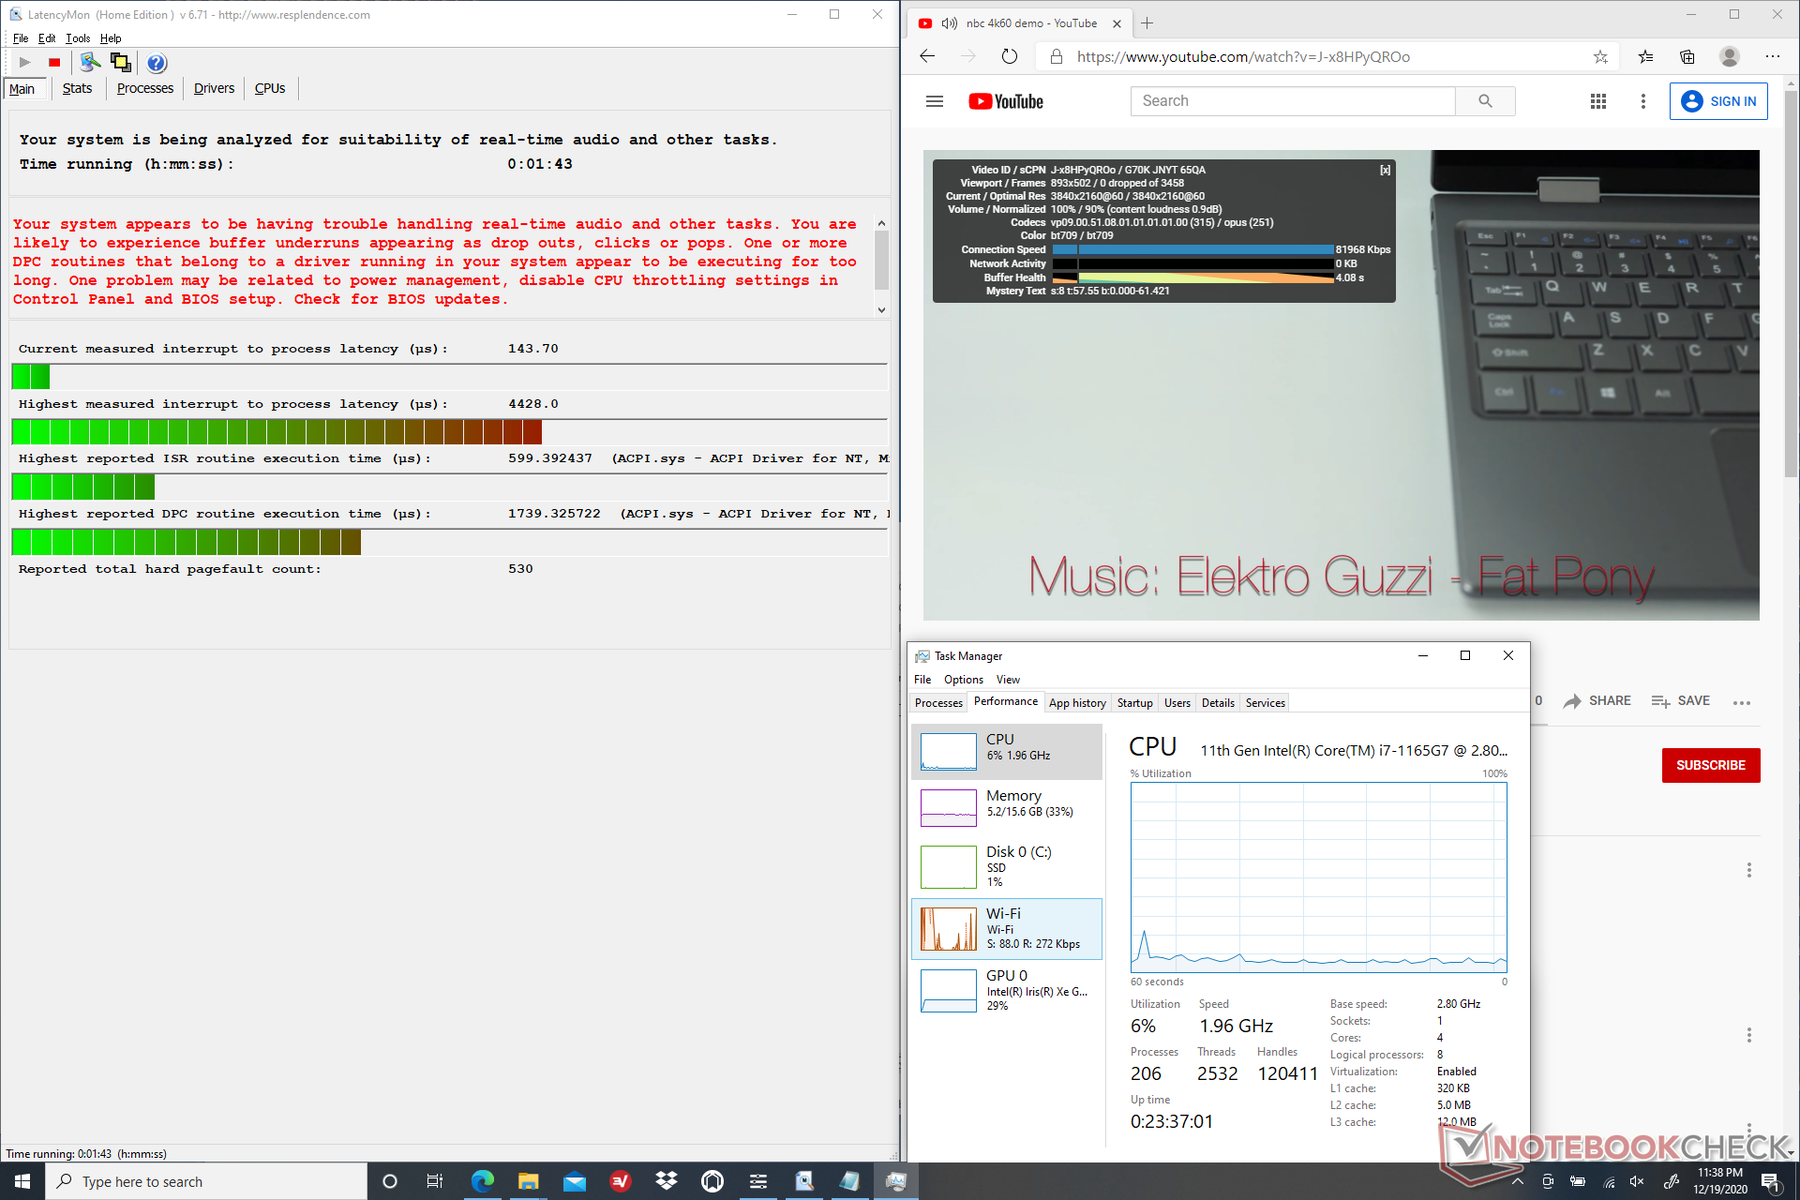
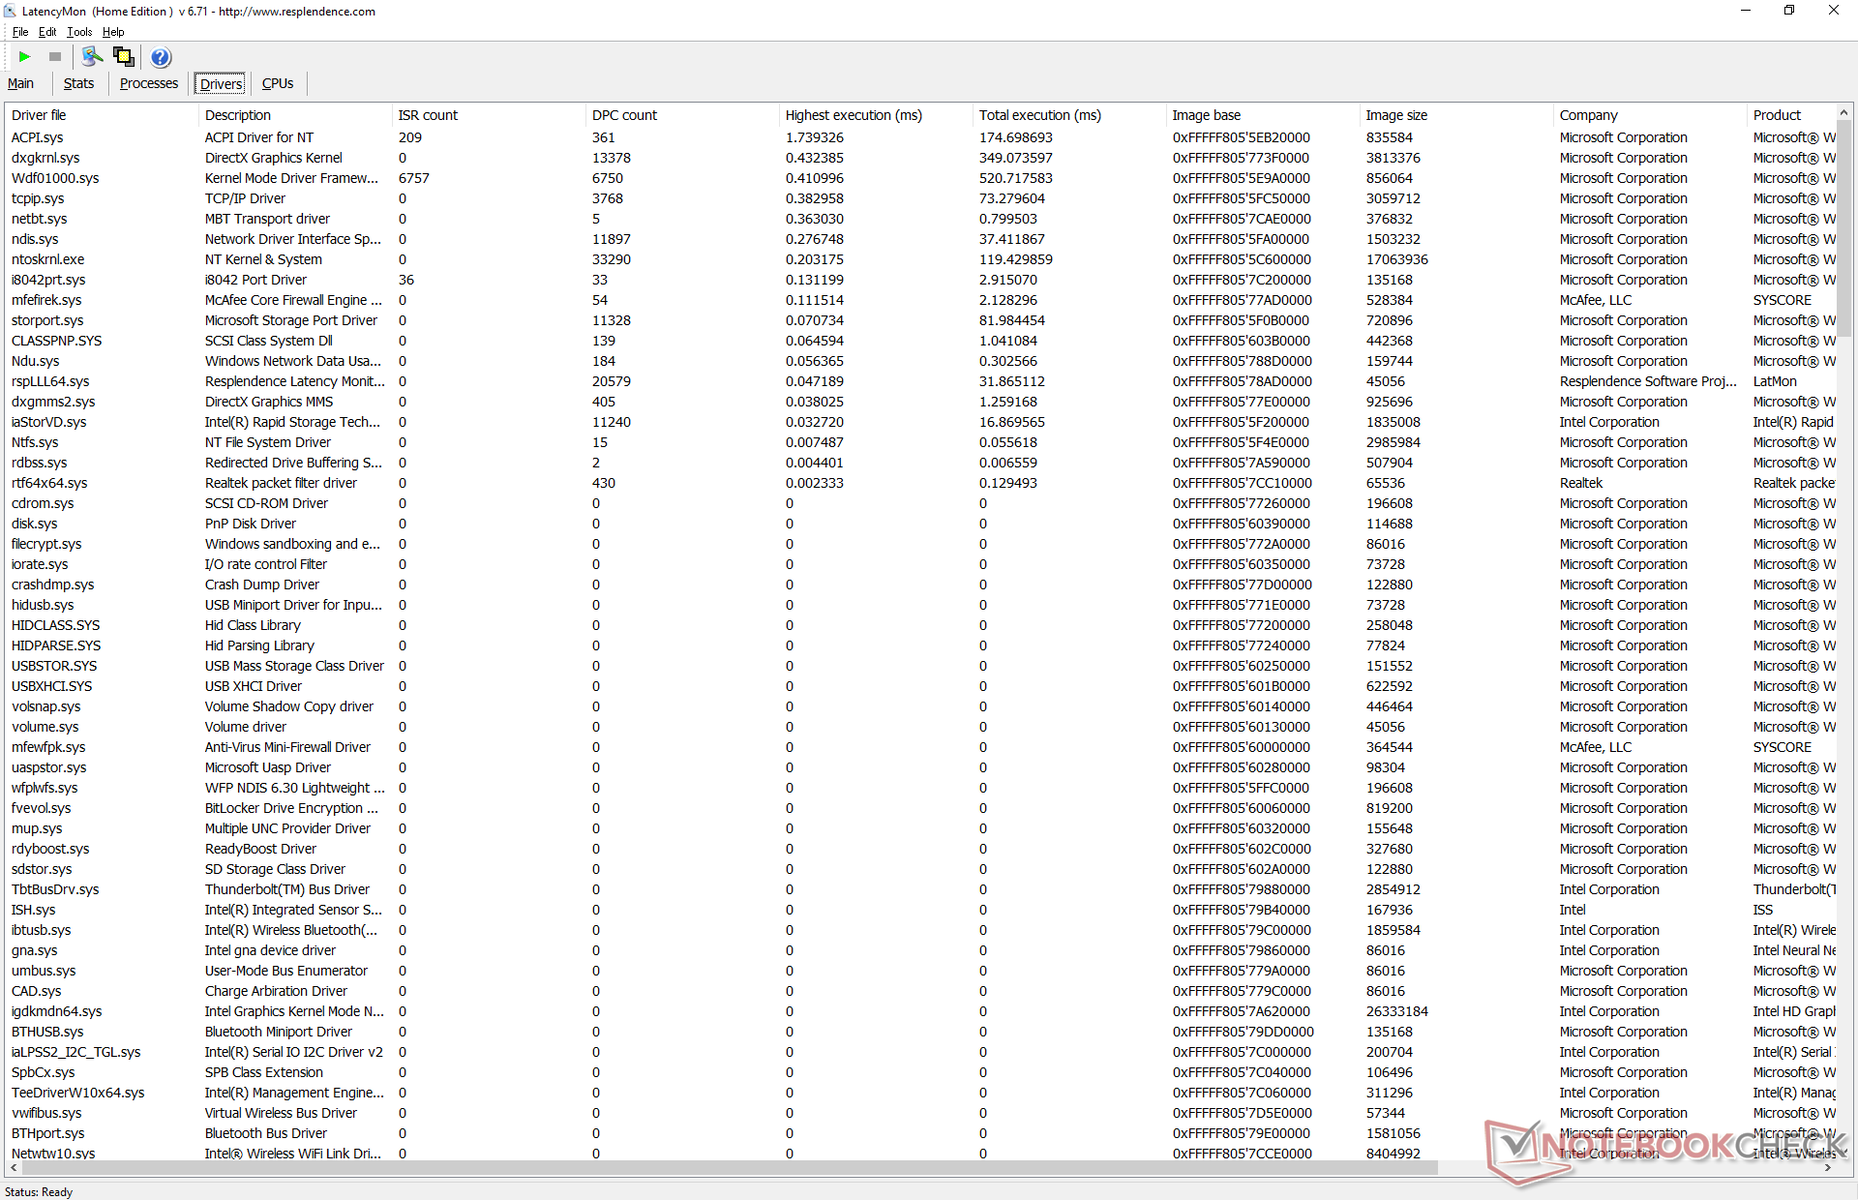
LatencyMon reveals DPC latency issues related to ACPI.sys. 4K UHD video playback at 60 FPS is otherwise smooth and with no dropped frames during our minute-long YouTube test.
| DPC Latencies / LatencyMon - interrupt to process latency (max), Web, Youtube, Prime95 | |
| Asus Zenbook S UX393JA | |
| HP Spectre x360 14t-ea000 | |
| Lenovo Yoga 9i 14ITL5 | |
| Huawei MateBook 14 2020 Intel | |
* ... smaller is better
Storage Devices
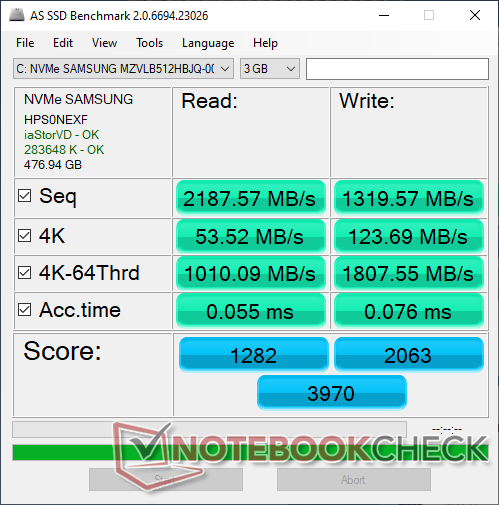
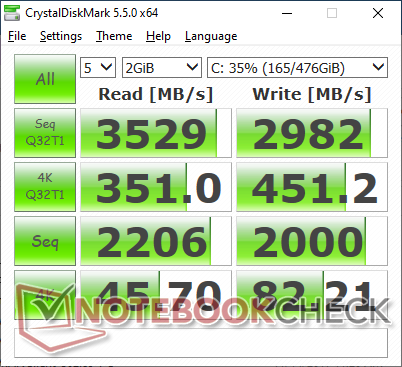
Our unit ships with the Samsung PM981a which is a high-end PCIe 3.0 NVMe SSD. Running DiskSpd Read in a loop shows that the motherboard interface is able to utilize the high x4 transfer rates of the SSD. Optane options are available much like on the Spectre x360 13, but most office users will be just fine without it.
See our table of SSDs and HDDs for more comparisons.

| HP Spectre x360 14t-ea000 Samsung SSD PM981a MZVLB512HBJQ | Dell XPS 13 7390 2-in-1 Core i7 Toshiba BG4 KBG40ZPZ512G | Huawei MateBook 14 2020 Intel Lite-On CA5-8D512 | Asus Zenbook S UX393JA Intel SSD 660p 1TB SSDPEKNW010T8 | Lenovo Yoga 9i 14ITL5 Samsung SSD PM981a MZVLB256HBHQ | |
|---|---|---|---|---|---|
| AS SSD | -80% | -2% | -27% | -21% | |
| Seq Read | 2188 | 1801 -18% | 2933 34% | 1405 -36% | 2177 -1% |
| Seq Write | 1320 | 1125 -15% | 810 -39% | 1062 -20% | 813 -38% |
| 4K Read | 53.5 | 39.7 -26% | 56.6 6% | 50.8 -5% | 53.2 -1% |
| 4K Write | 123.7 | 67 -46% | 147.6 19% | 124.9 1% | 180 46% |
| 4K-64 Read | 1010 | 1253 24% | 856 -15% | 590 -42% | 531 -47% |
| 4K-64 Write | 1808 | 209 -88% | 1099 -39% | 840 -54% | 398.5 -78% |
| Access Time Read * | 0.055 | 0.069 -25% | 0.046 16% | 0.041 25% | 0.052 5% |
| Access Time Write * | 0.076 | 0.625 -722% | 0.028 63% | 0.118 -55% | 0.058 24% |
| Score Read | 1282 | 1472 15% | 1206 -6% | 781 -39% | 802 -37% |
| Score Write | 2063 | 388 -81% | 1328 -36% | 1071 -48% | 660 -68% |
| Score Total | 3970 | 2583 -35% | 3059 -23% | 2251 -43% | 1822 -54% |
| Copy ISO MB/s | 1644 | 1293 -21% | 1459 -11% | 1962 19% | |
| Copy Program MB/s | 920 | 560 -39% | 600 -35% | 522 -43% | |
| Copy Game MB/s | 1725 | 927 -46% | 1411 -18% | 1258 -27% | |
| CrystalDiskMark 5.2 / 6 | -10% | 25% | -12% | 4% | |
| Write 4K | 82.2 | 106.7 30% | 161.8 97% | 129.5 58% | 139.6 70% |
| Read 4K | 45.7 | 49.94 9% | 60.6 33% | 54 18% | 37.3 -18% |
| Write Seq | 2000 | 1223 -39% | 2209 10% | 1265 -37% | 1827 -9% |
| Read Seq | 2206 | 1801 -18% | 2473 12% | 1410 -36% | 2253 2% |
| Write 4K Q32T1 | 451.2 | 325.3 -28% | 514 14% | 420.3 -7% | 467.9 4% |
| Read 4K Q32T1 | 351 | 551 57% | 586 67% | 357.7 2% | 366.7 4% |
| Write Seq Q32T1 | 2982 | 1224 -59% | 2205 -26% | 1799 -40% | 2349 -21% |
| Read Seq Q32T1 | 3529 | 2350 -33% | 3352 -5% | 1616 -54% | 3540 0% |
| Total Average (Program / Settings) | -45% /
-55% | 12% /
10% | -20% /
-22% | -9% /
-12% |
* ... smaller is better

Disk Throttling: DiskSpd Read Loop, Queue Depth 8
GPU Performance
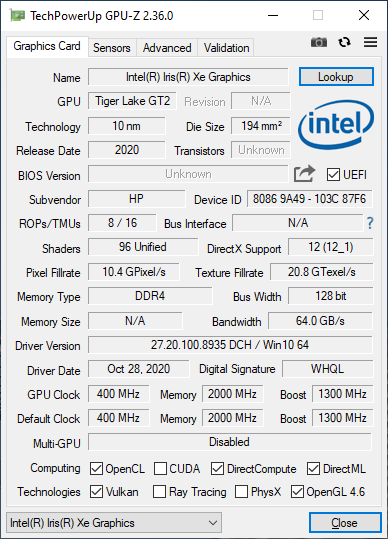
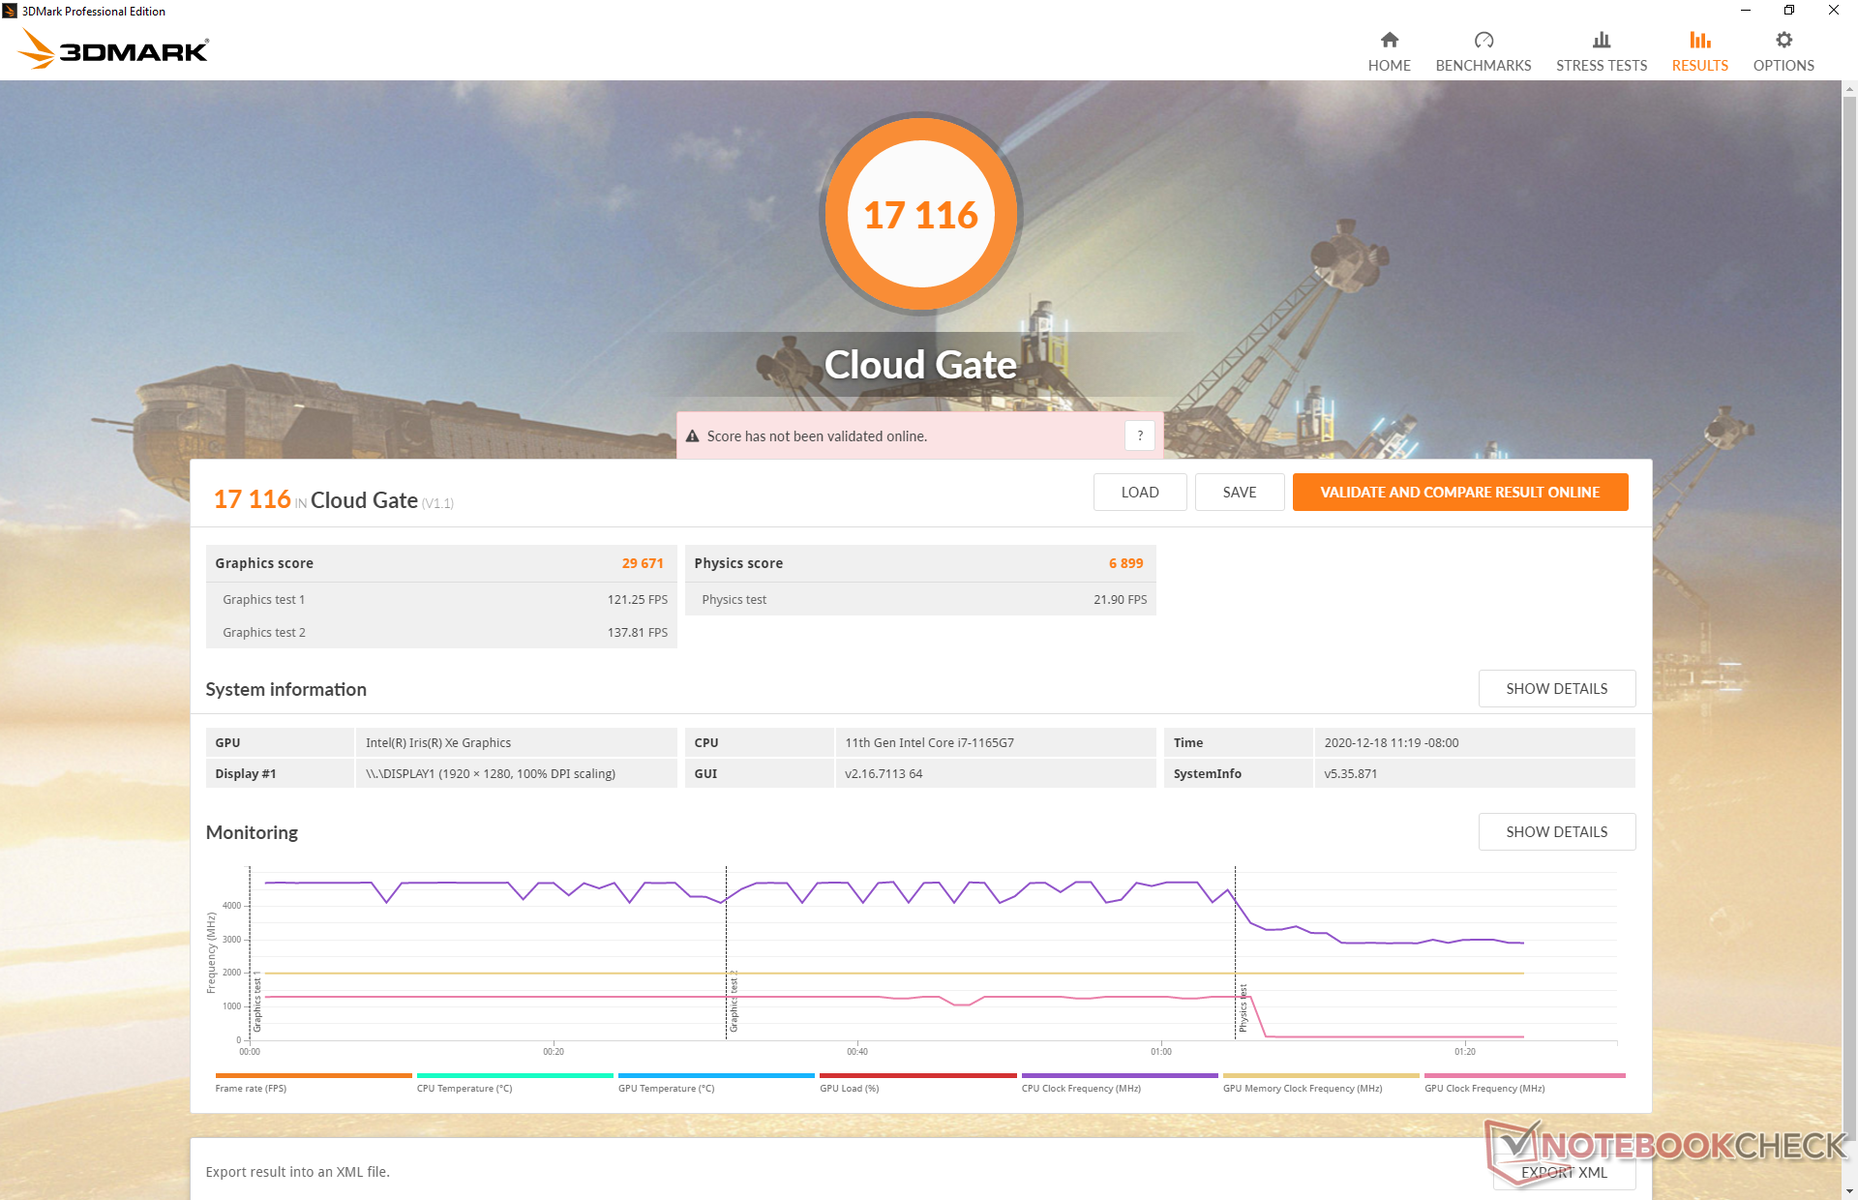
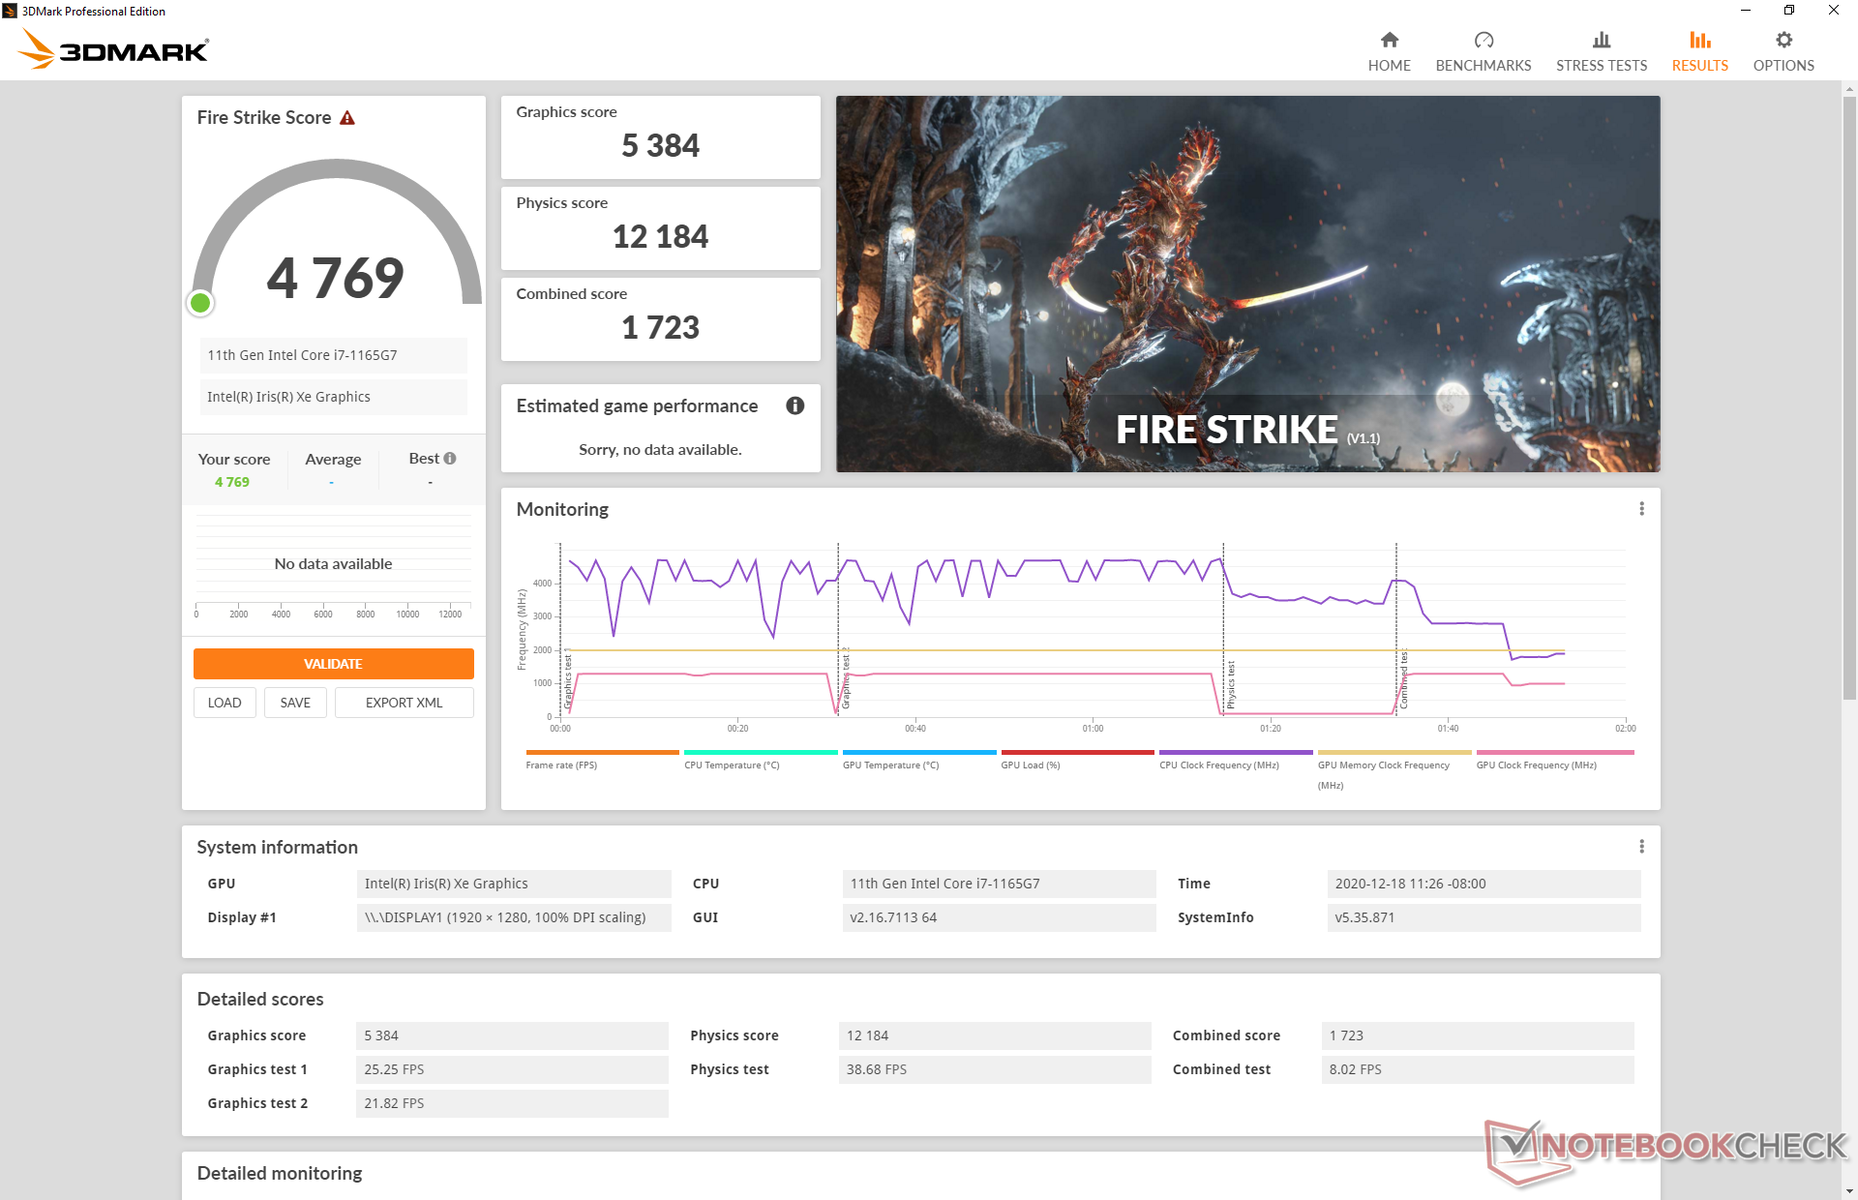
Graphics performance is excellent and towards the higher-end of the spectrum when compared to other laptops with the same GPU. 3DMark scores are notably well above the GeForce MX350 by about 30 percent, but real-world games will still run faster on the Nvidia GPU more often than not due to its more mature game-ready drivers.
Frame rates when gaming on the Spectre 14 tend to fluctuate due to the fluctuating clock rates when under stressful conditions. When idling on Witcher 3 on the lowest settings, for example, frame rates would constantly cycle between 80 and 95 FPS instead of remaining constant as shown by our graph below. This behavior is similar to the XPS 13 albeit it is even more pronounced on Dell's machine. We explore this further in our Stress Test section.
See our dedicated page on the Iris Xe 96 EUs for more technical information and benchmarks.
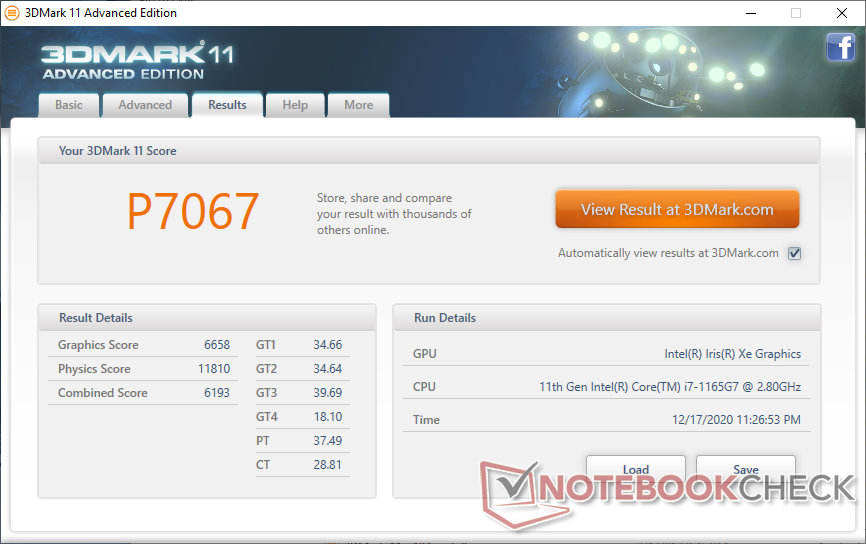
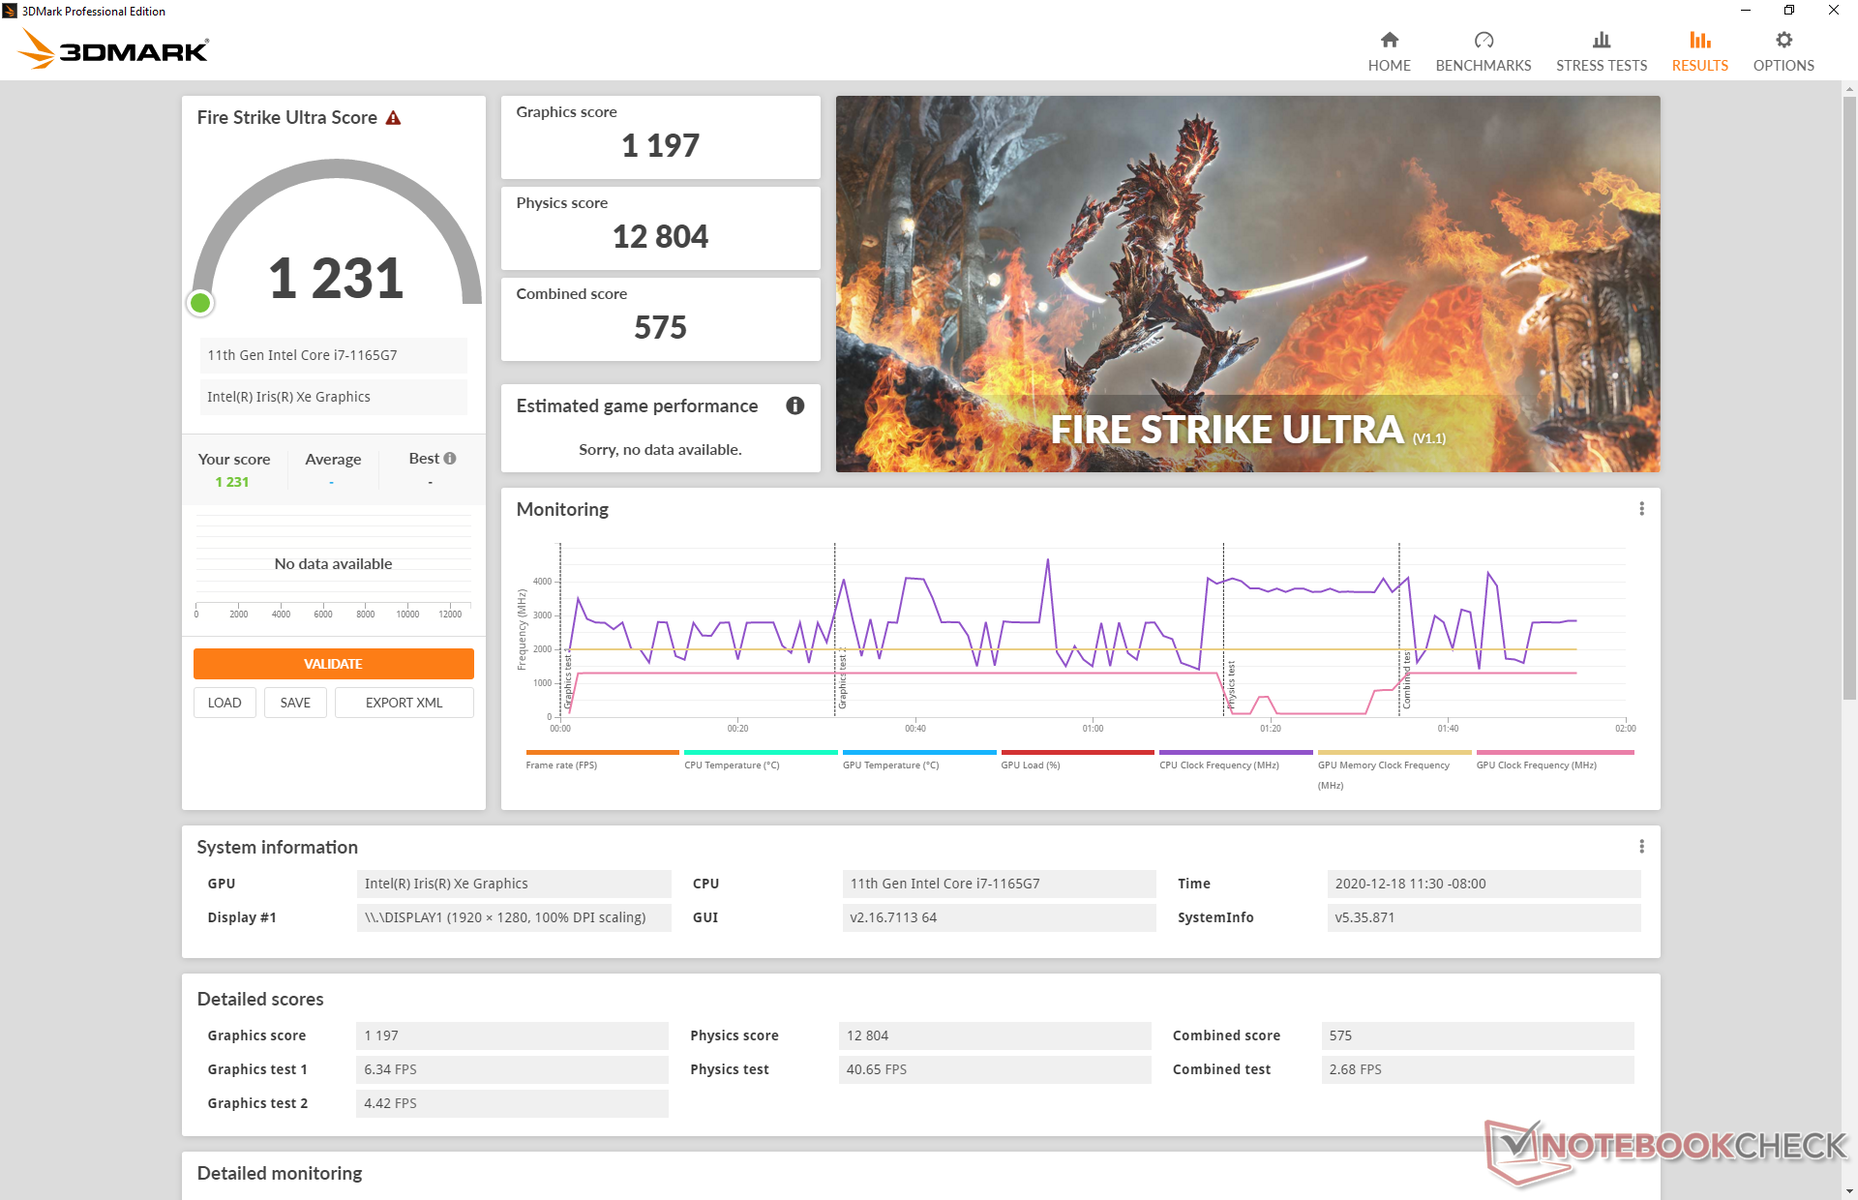
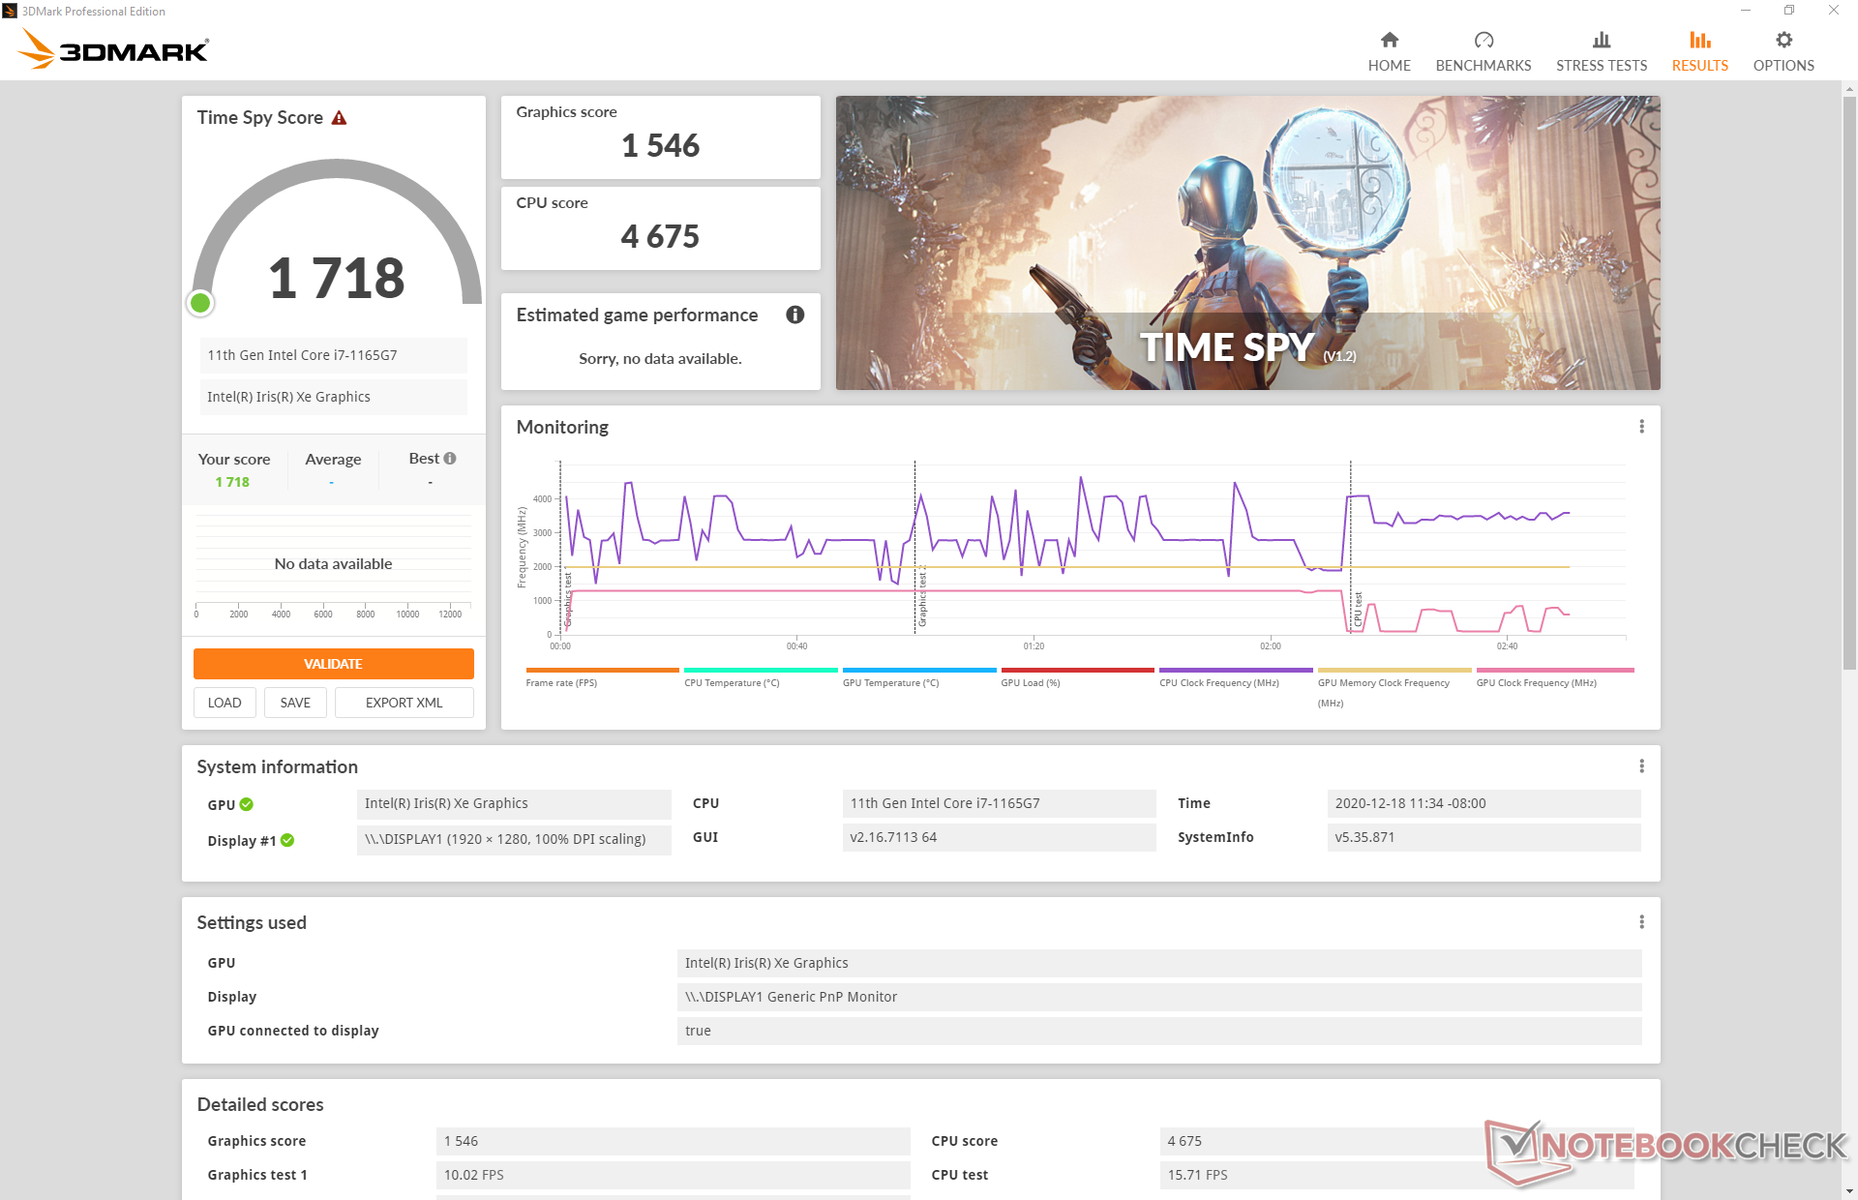
| 3DMark 11 Performance | 7067 points | |
| 3DMark Cloud Gate Standard Score | 17116 points | |
| 3DMark Fire Strike Score | 4769 points | |
| 3DMark Time Spy Score | 1718 points | |
Help | ||
| low | med. | high | ultra | |
| The Witcher 3 (2015) | 77.6 | 50.9 | 30.1 | 13.6 |
| Dota 2 Reborn (2015) | 83.6 | 65.5 | 53 | 46.6 |
| Final Fantasy XV Benchmark (2018) | 41.2 | 22.8 | 17.6 | |
| X-Plane 11.11 (2018) | 46.6 | 34.7 | 31.3 |
Emissions
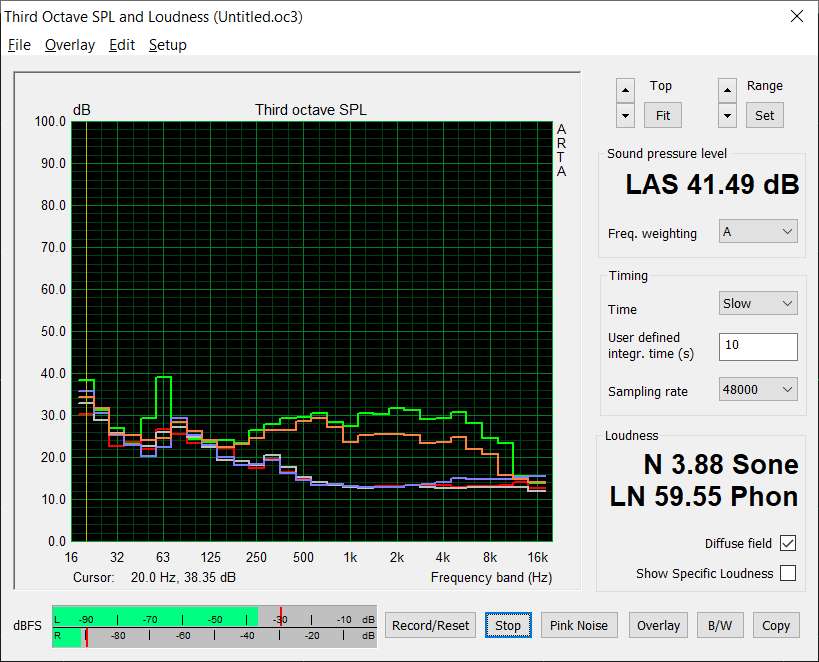
System Noise
Fan noise remains quiet even when browsing the web or video streaming on Performance mode. Running the first benchmark scene of 3DMark 06, for example, would induce a fan noise of just 26.4 dB(A) against a silent background of 25.9 dB(A). It's not until we would run Witcher 3 for longer periods would the fans begin to run at higher and more audible RPMs. At worst, users can expect a noise of 41.5 dB(A) with thankfully no annoying pulsing behavior.
| HP Spectre x360 14t-ea000 Iris Xe G7 96EUs, i7-1165G7, Samsung SSD PM981a MZVLB512HBJQ | HP Spectre x360 13-aw0013dx Iris Plus Graphics G7 (Ice Lake 64 EU), i7-1065G7, Intel Optane Memory H10 with Solid State Storage 32GB + 512GB HBRPEKNX0202A(L/H) | Dell XPS 13 7390 2-in-1 Core i7 Iris Plus Graphics G7 (Ice Lake 64 EU), i7-1065G7, Toshiba BG4 KBG40ZPZ512G | Huawei MateBook 14 2020 Intel GeForce MX350, i7-10510U, Lite-On CA5-8D512 | Lenovo Yoga 9i 14ITL5 Iris Xe G7 80EUs, i5-1135G7, Samsung SSD PM981a MZVLB256HBHQ | |
|---|---|---|---|---|---|
| Noise | -4% | -11% | -12% | -8% | |
| off / environment * | 25.8 | 28.5 -10% | 28.1 -9% | 29.3 -14% | 26.3 -2% |
| Idle Minimum * | 25.9 | 28.5 -10% | 28.1 -8% | 29.3 -13% | 26.3 -2% |
| Idle Average * | 25.9 | 28.5 -10% | 28.1 -8% | 29.3 -13% | 26.3 -2% |
| Idle Maximum * | 25.9 | 28.5 -10% | 28.1 -8% | 30.8 -19% | 26.3 -2% |
| Load Average * | 26.4 | 28.5 -8% | 31.7 -20% | 35.7 -35% | 34.1 -29% |
| Witcher 3 ultra * | 36.9 | 35.3 4% | 43.4 -18% | 35.7 3% | 43.4 -18% |
| Load Maximum * | 41.5 | 35.3 15% | 43.4 -5% | 37.9 9% | 43.3 -4% |
* ... smaller is better
Noise Level
| Idle |
| 25.9 / 25.9 / 25.9 dB(A) |
| Load |
| 26.4 / 41.5 dB(A) |
 | ||
30 dB silent 40 dB(A) audible 50 dB(A) loud |
||
min: | ||
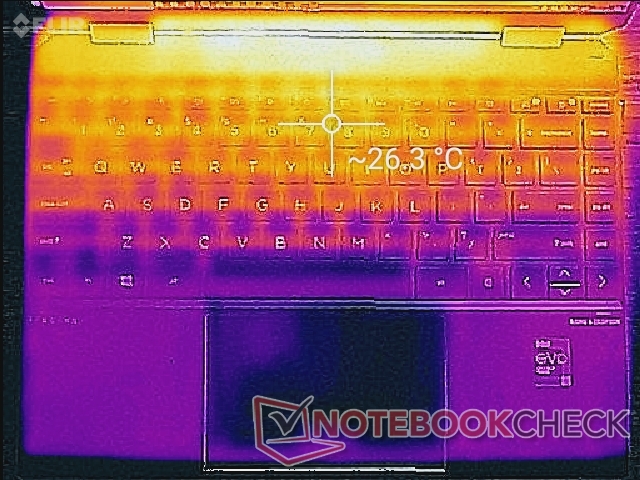
Temperature
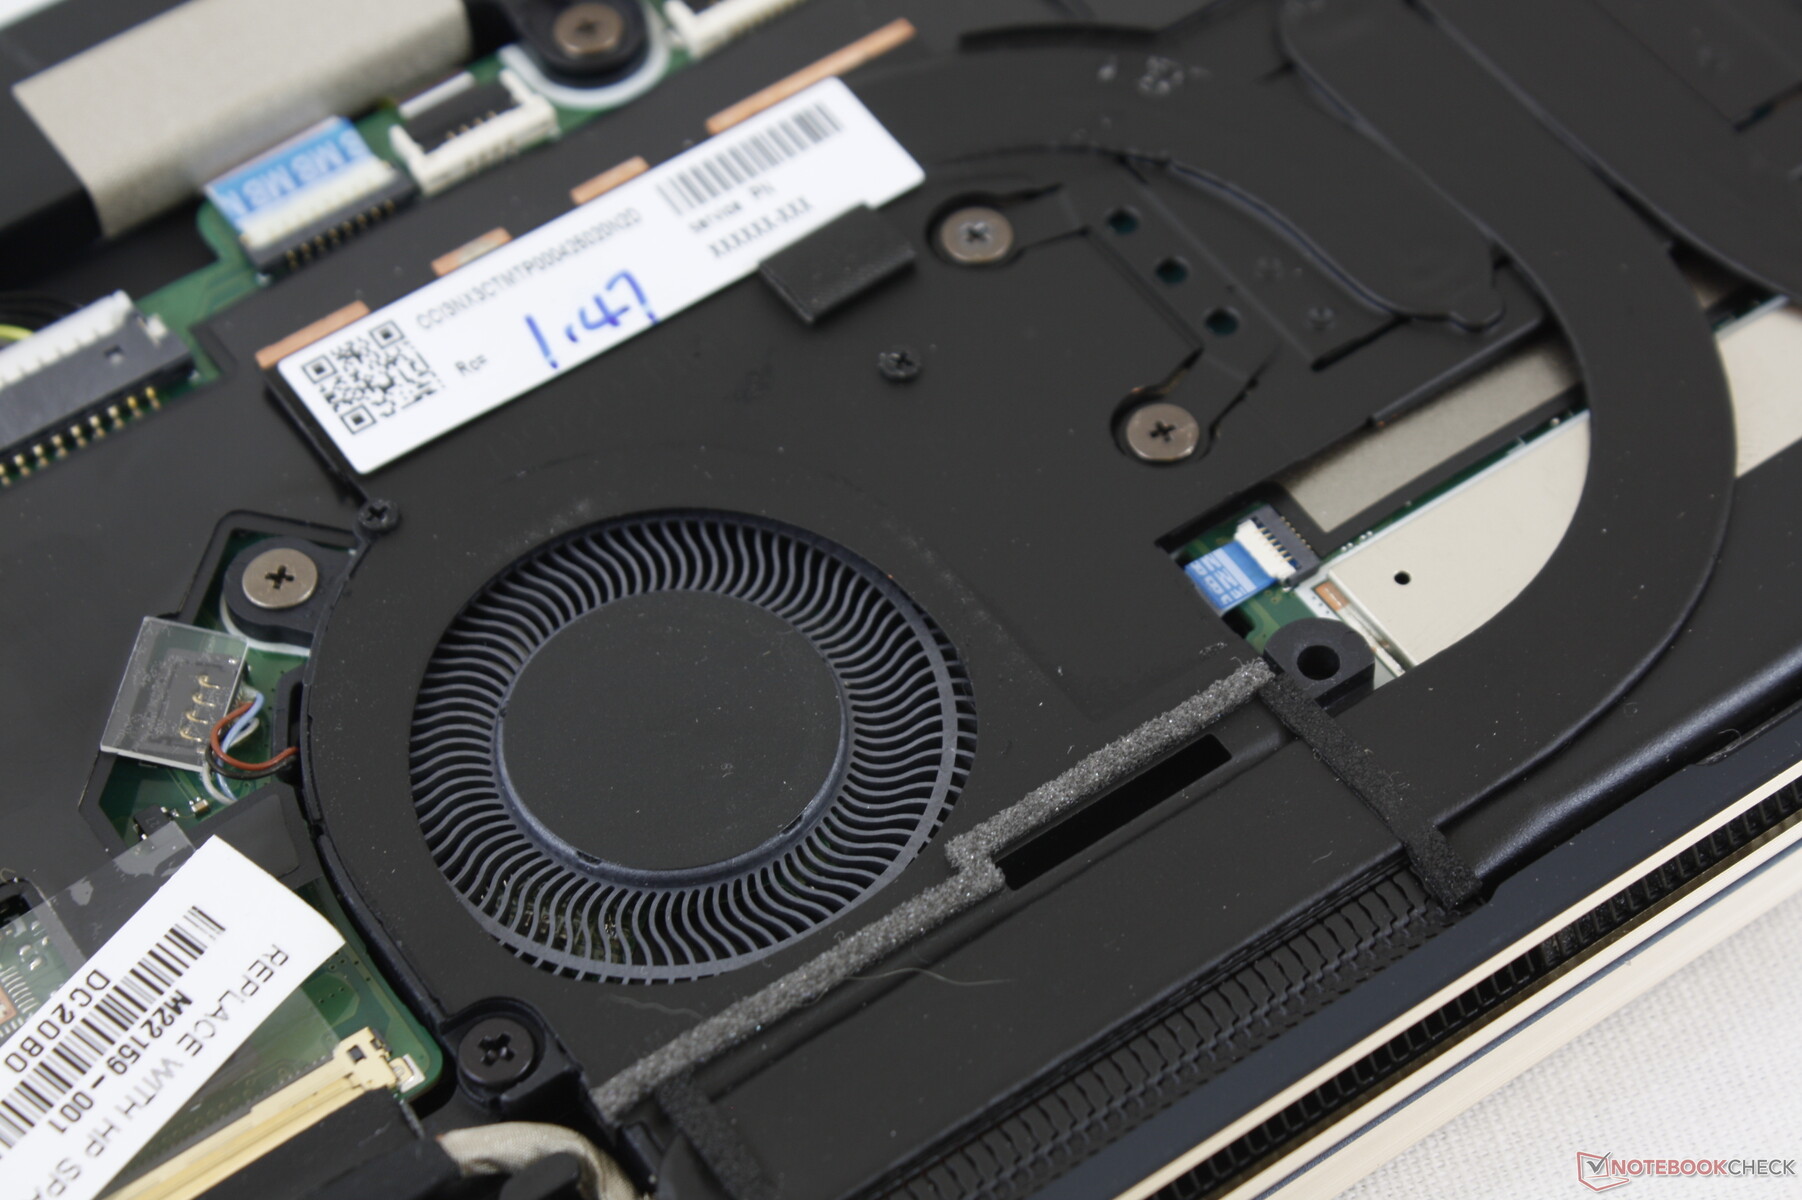
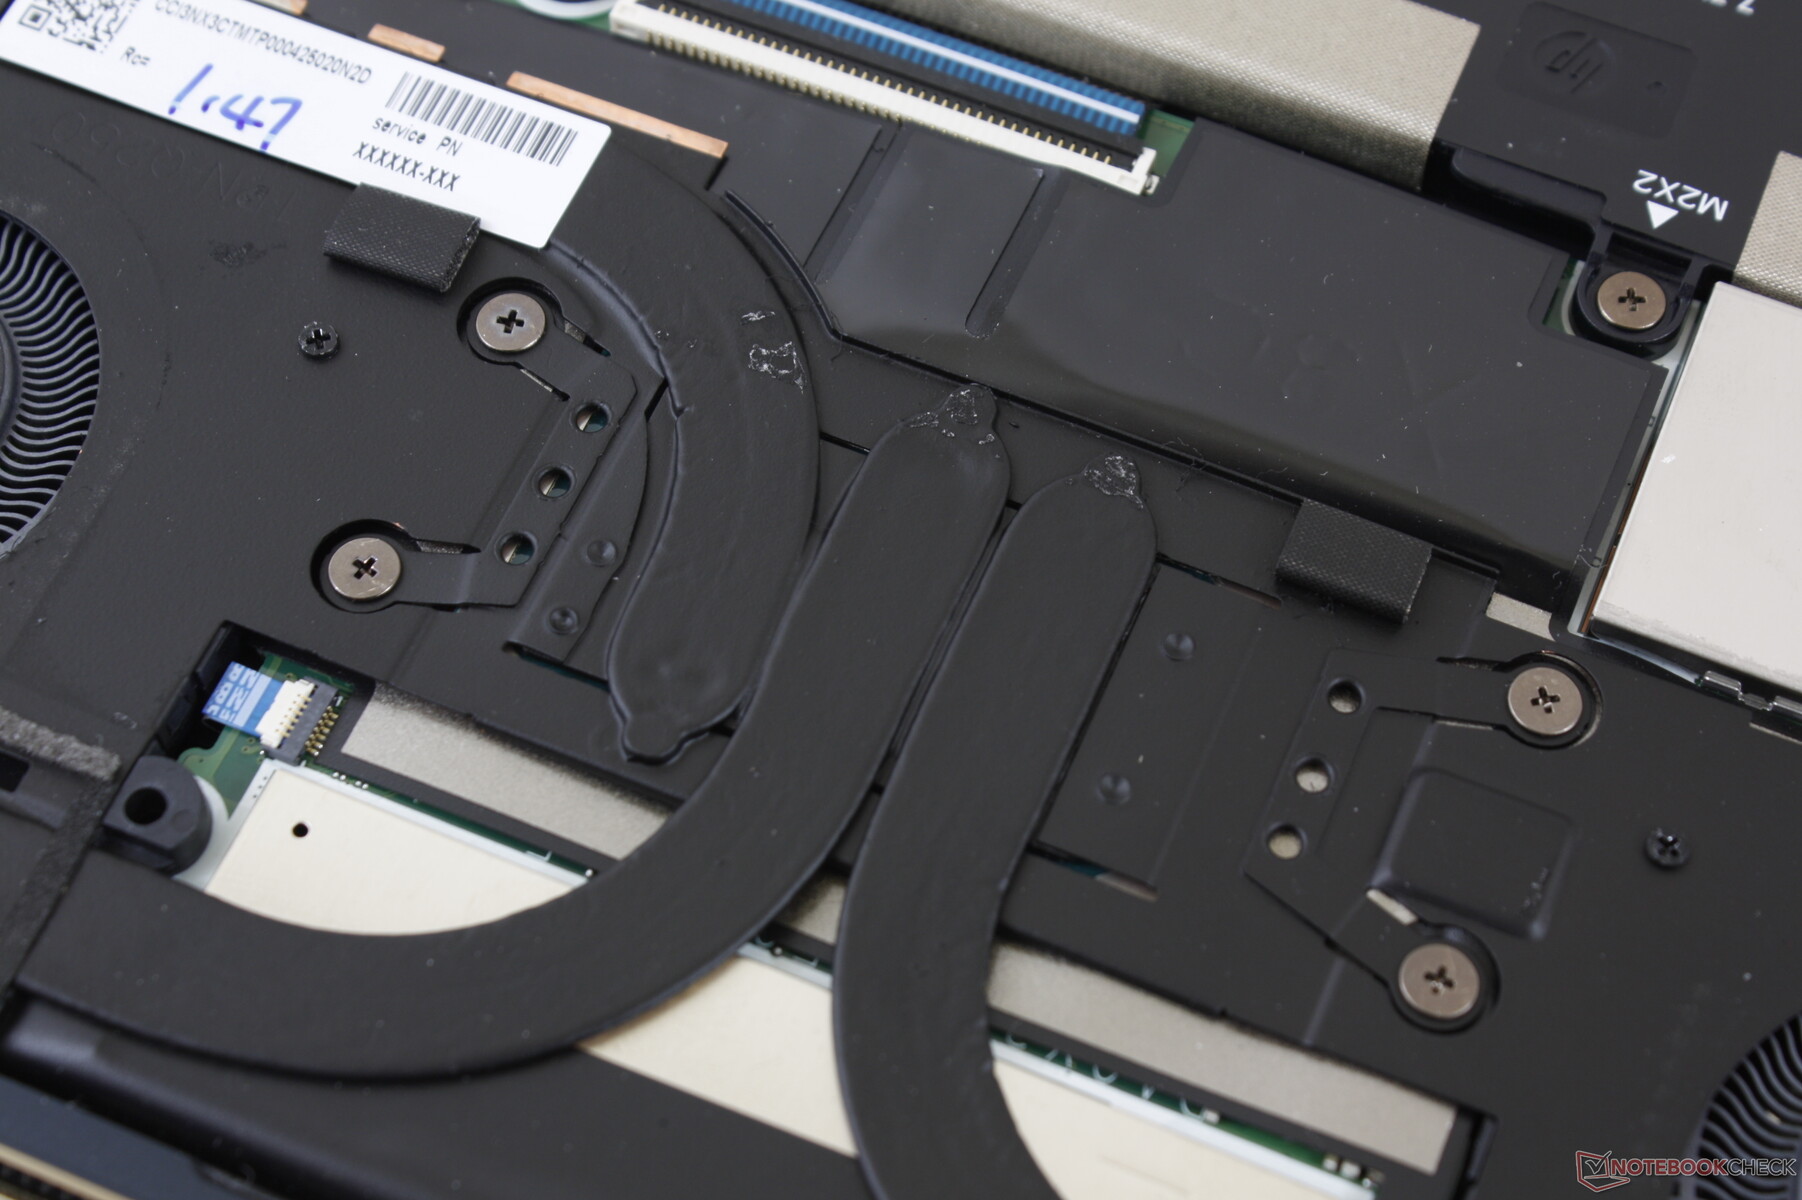
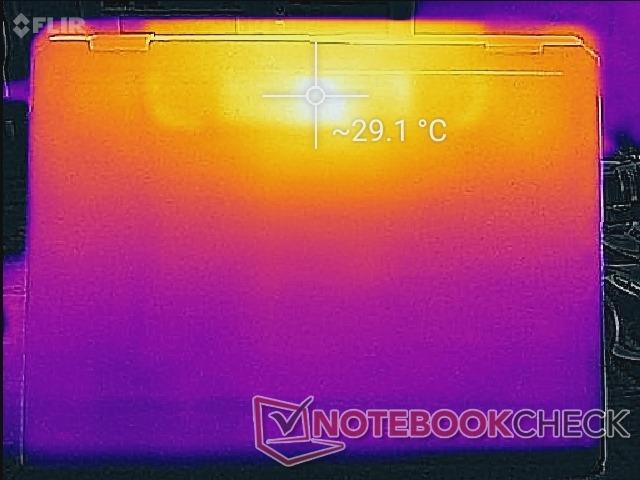
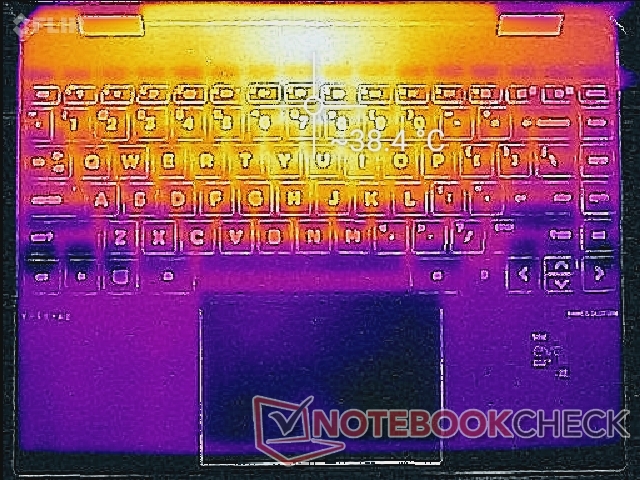
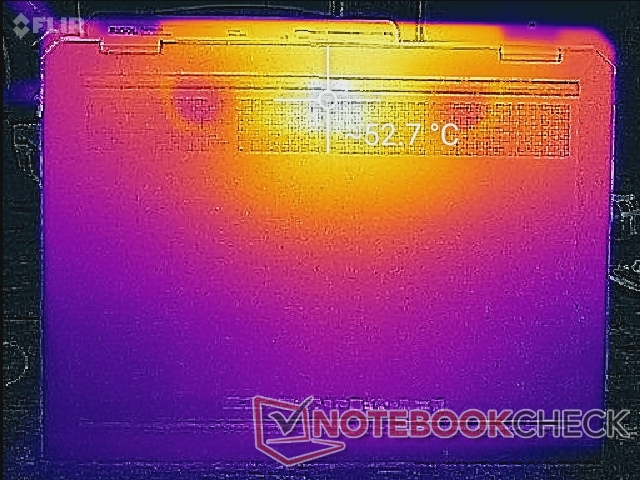
Surface temperature development is symmetrical due to the symmetrical cooling solution inside. The keyboard center can be as warm as 39 C while the bottom hot spot can be as high as 53 C when under high processing stress. These results are even warmer than what we recorded on the 13.3-inch Spectre x360 13 by 5 to 10 degrees C on each side. Though the palm rests are never too warm, a cooler bottom would have been appreciated.
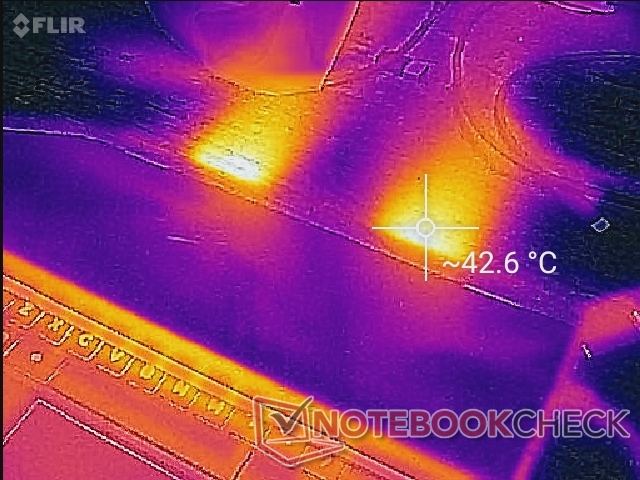
(±) The maximum temperature on the upper side is 40.4 °C / 105 F, compared to the average of 35.3 °C / 96 F, ranging from 19.6 to 55.7 °C for the class Convertible.
(-) The bottom heats up to a maximum of 52.8 °C / 127 F, compared to the average of 36.8 °C / 98 F
(+) In idle usage, the average temperature for the upper side is 25 °C / 77 F, compared to the device average of 30.2 °C / 86 F.
(+) The palmrests and touchpad are cooler than skin temperature with a maximum of 27.6 °C / 81.7 F and are therefore cool to the touch.
(±) The average temperature of the palmrest area of similar devices was 28.1 °C / 82.6 F (+0.5 °C / 0.9 F).
Stress Test
When stressed with Prime95, the CPU would boost to 4 GHz for the first few seconds and at a core temperature of 95 C. Clock rates and core temperature would then steadily fall and eventually cycle between 2.1 and 3.4 GHz and 75 C and 95 C, respectively. Running this same test on the XPS 13 9310 with the same Core i7-1165G7 CPU would result in slower clock rates of 1.9 to 3.1 GHz and a cooler core temperature of 71 to 78 C.
Both CPU and GPU clock rates would fluctuate when gaming as well resulting in unsteady frame rates. Our screenshot below illustrates this when running Witcher 3. You may want to enable v-sync to reduce screen tearing and uneven frame pacing.
Running on battery power limits processor performance even when on the Performance power profile. A 3DMark 11 test on batteries would return Physics and Graphics scores of 3209 and 6714 points, respectively, compared to 11810 and 6658 points when on mains.

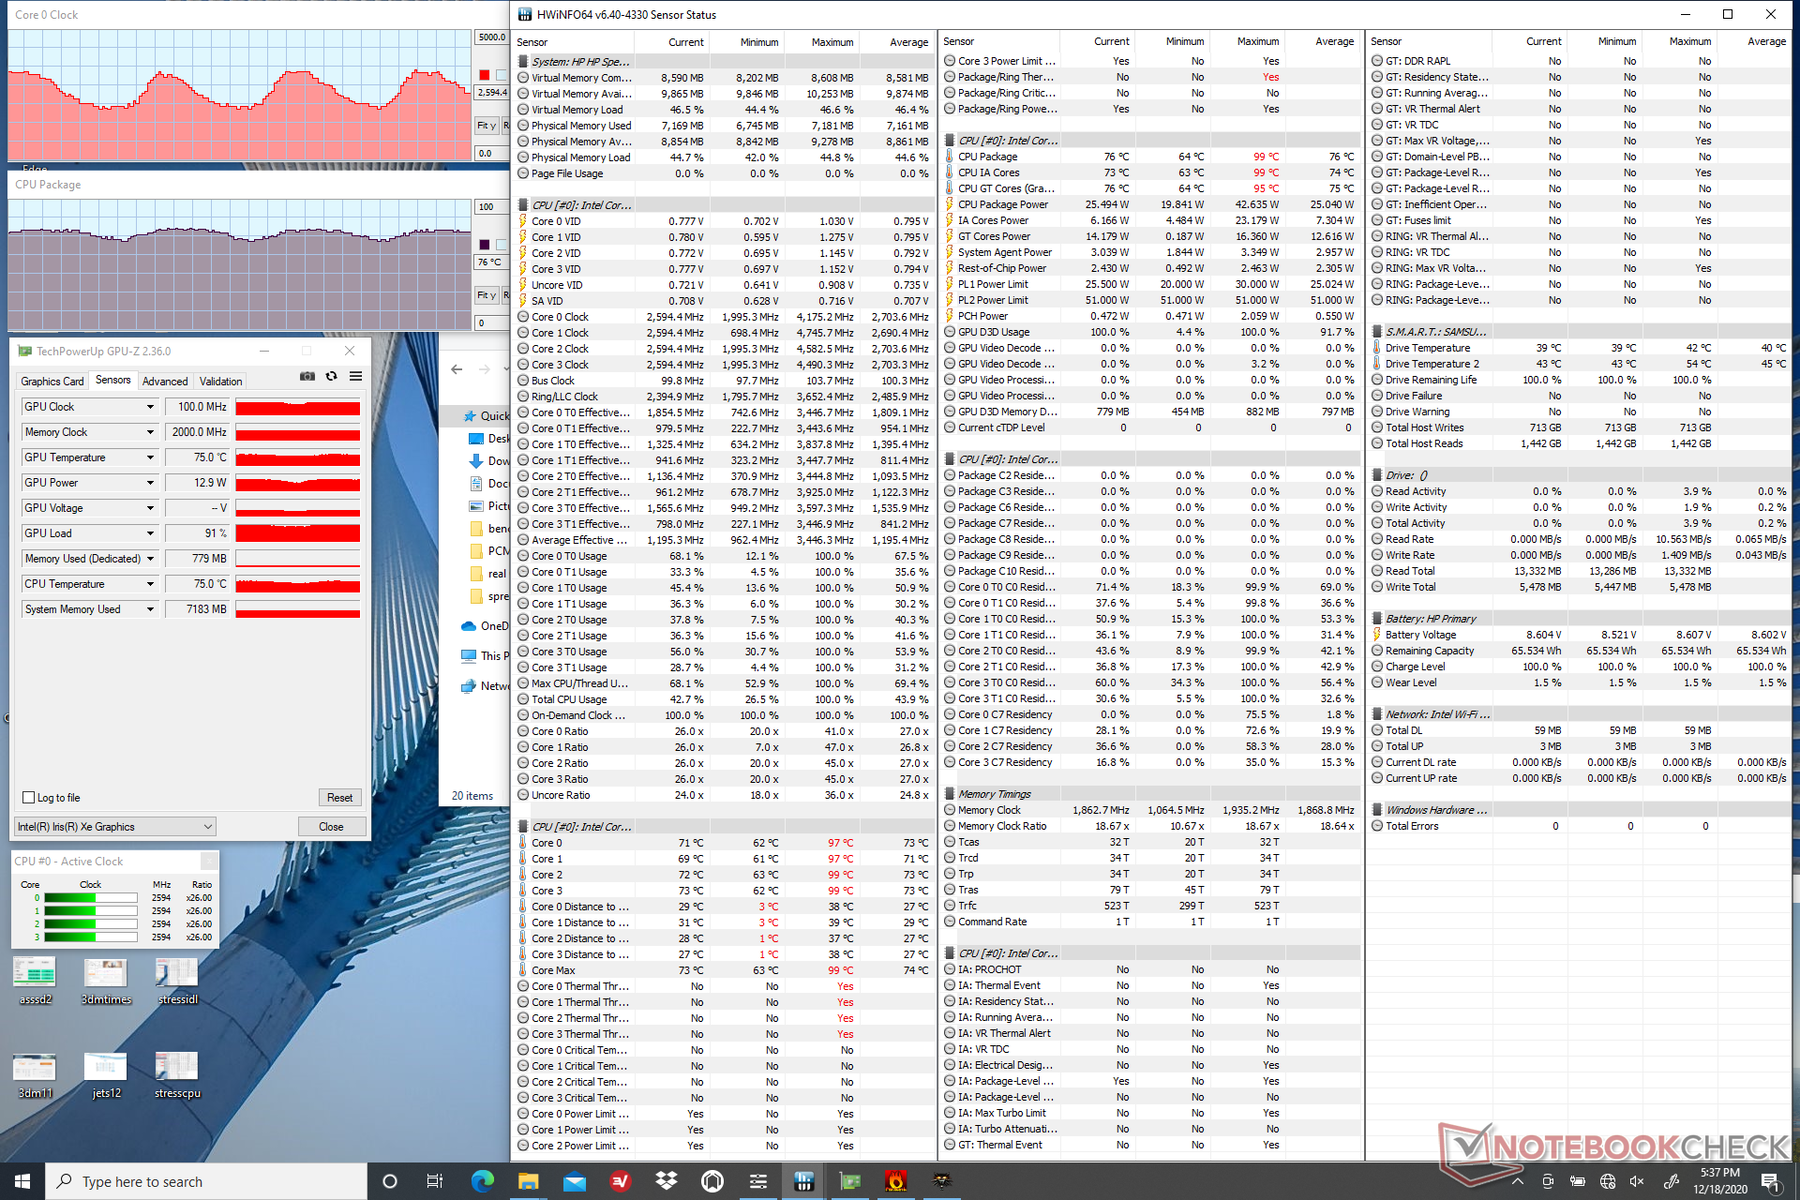
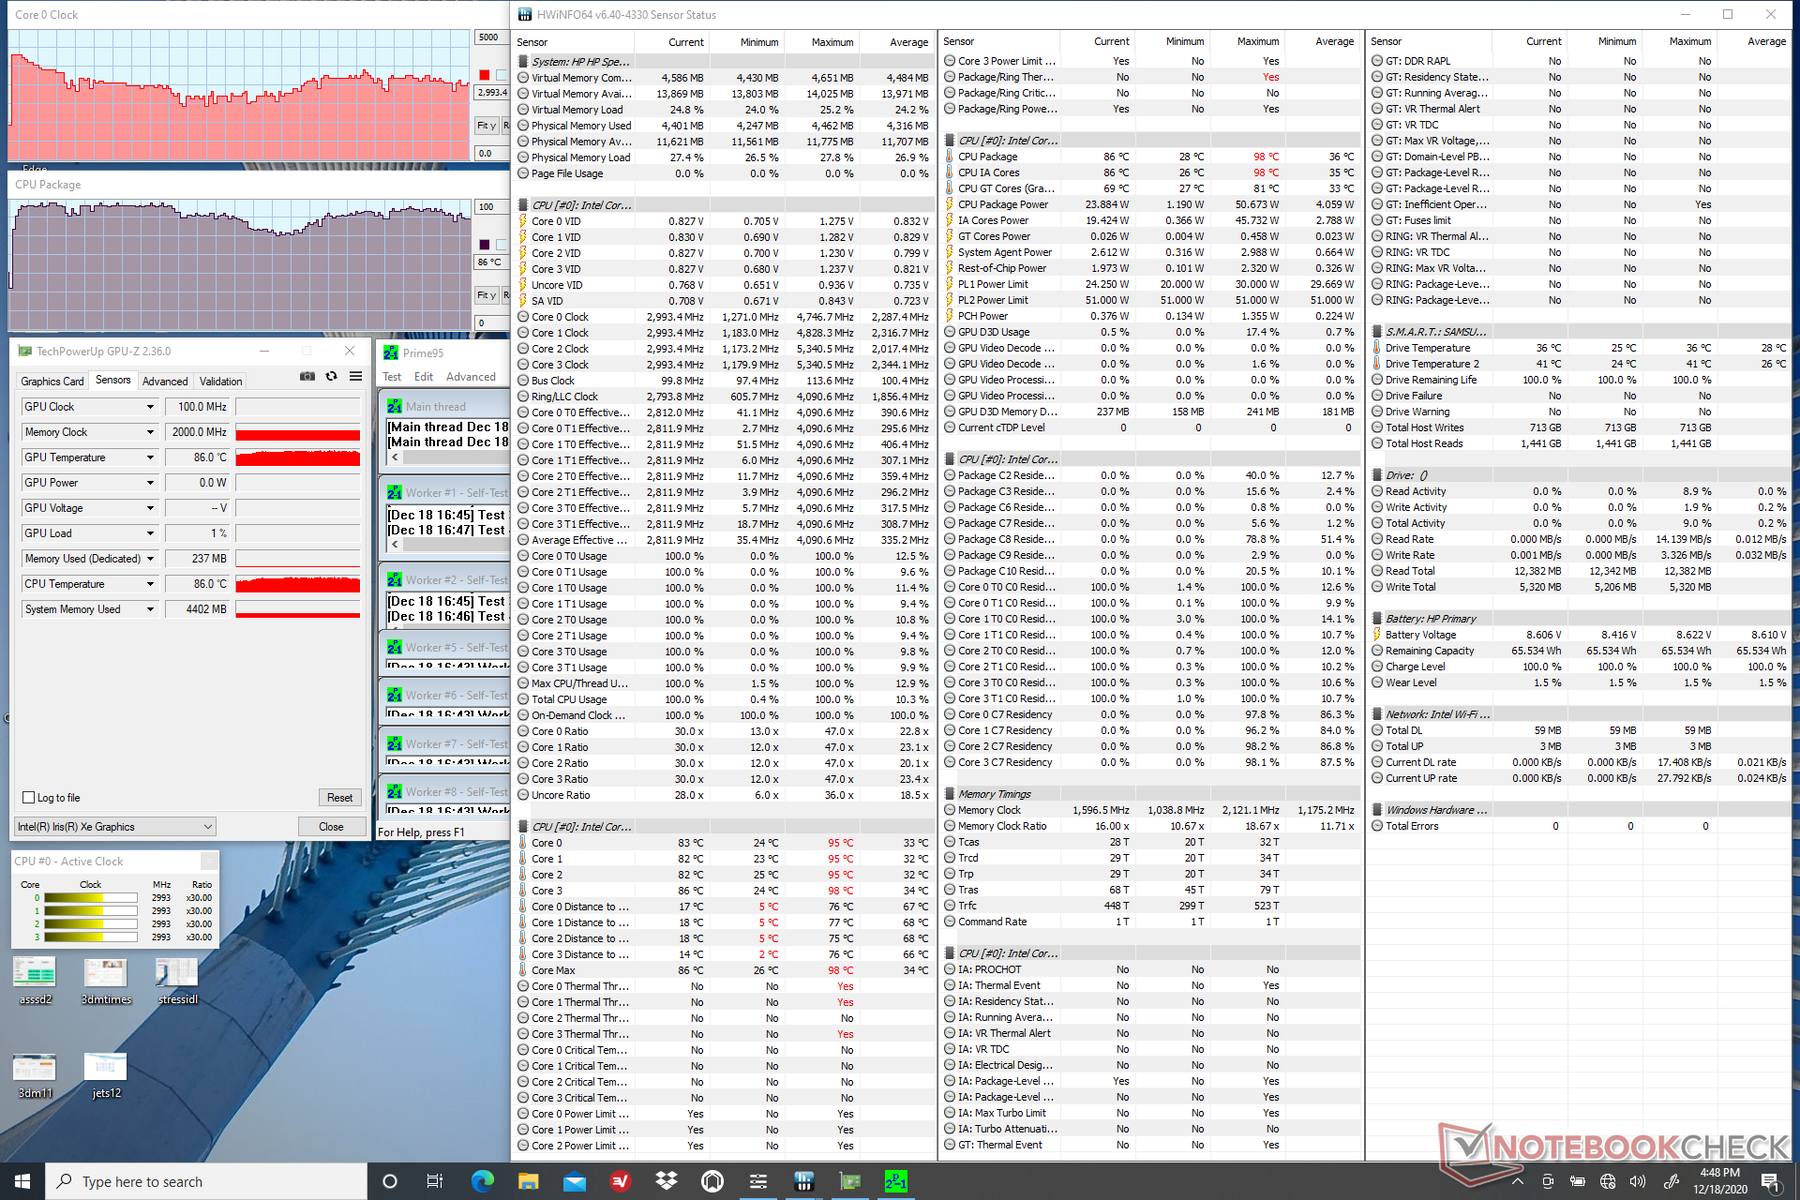
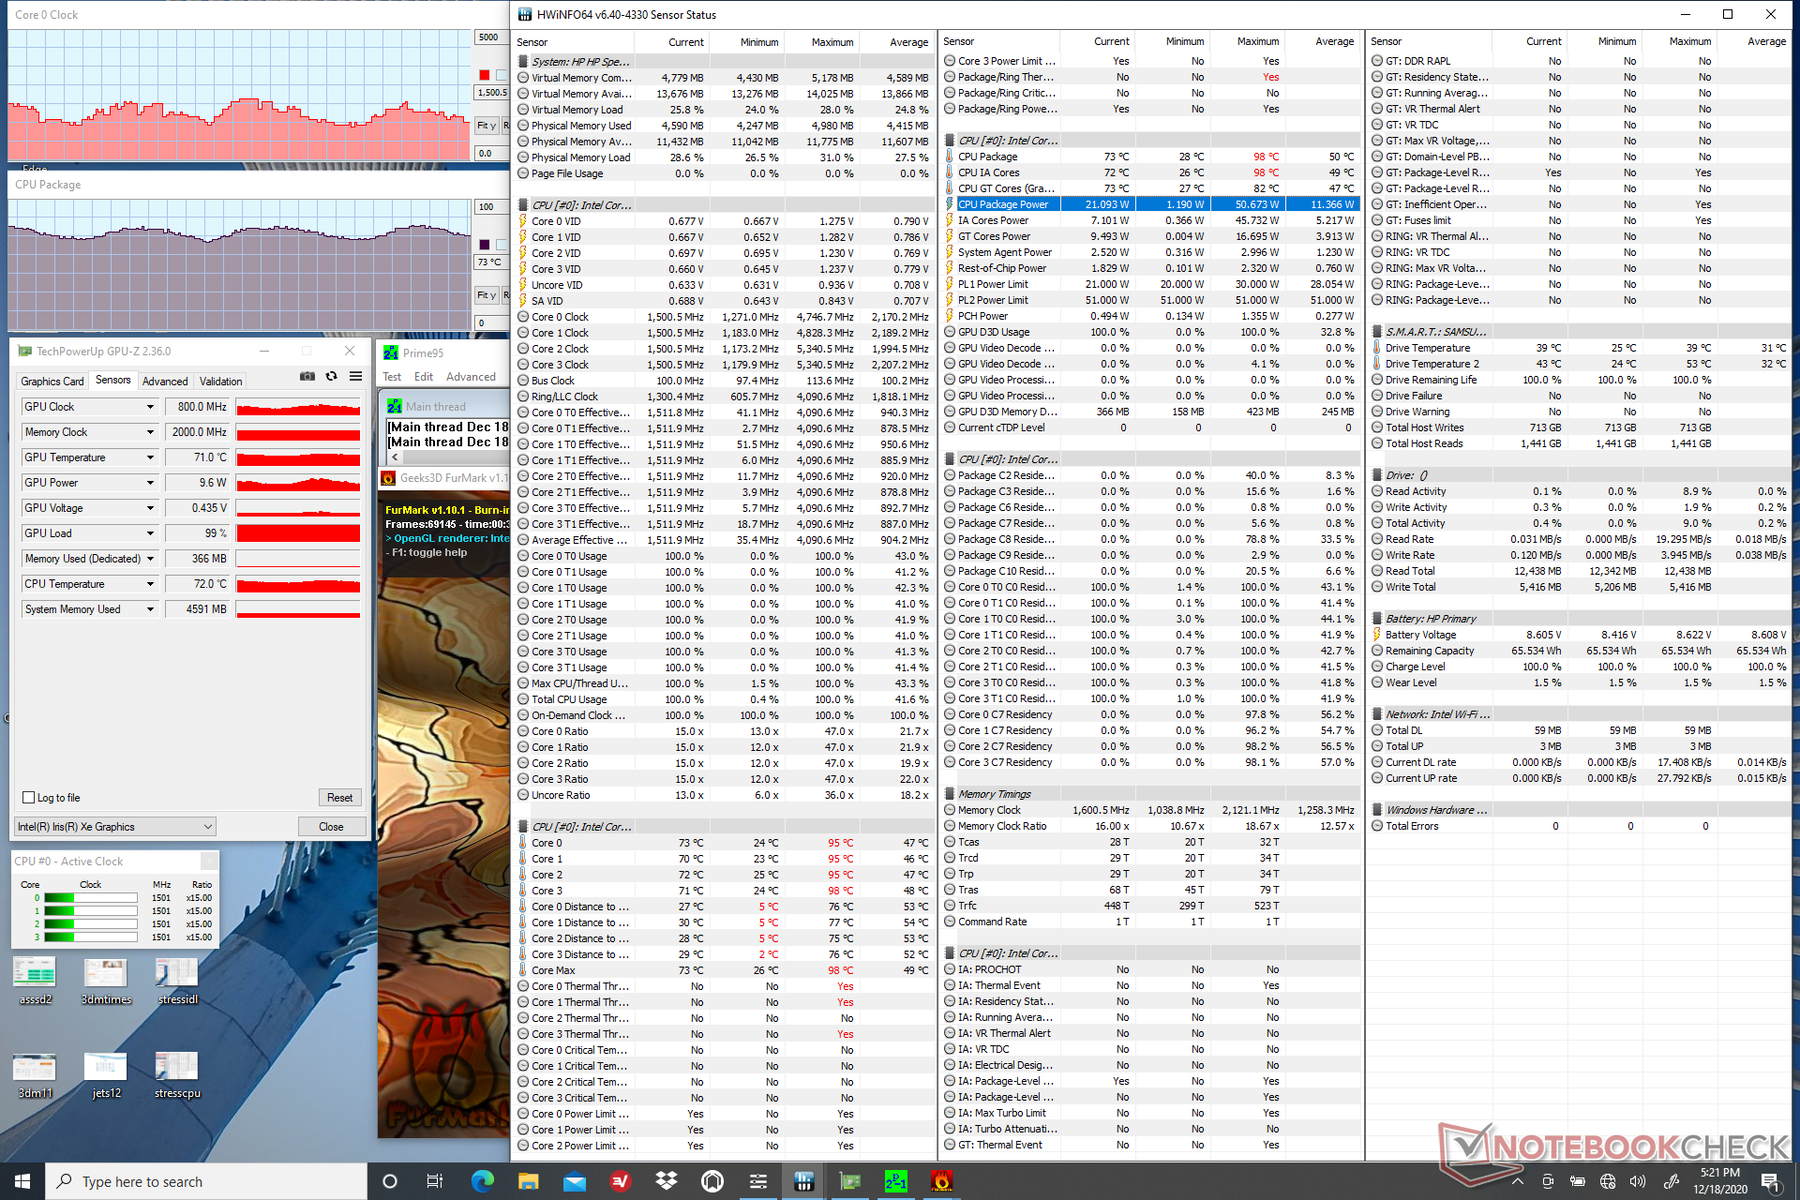
| CPU Clock (GHz) | GPU Clock (MHz) | Average CPU Temperature (°C) | |
| System Idle | -- | -- | 31 |
| Prime95 Stress | 2.1 - 3.4 | -- | 75 - 95 |
| Prime95 + FurMark Stress | 1.4 - 2.3 | 800 - 1150 | 70 - 80 |
| Witcher 3 Stress | 2.0 - 3.4 | 1150 - 1300 | 69 - 76 |
Speakers


HP Spectre x360 14t-ea000 audio analysis
(±) | speaker loudness is average but good (79.6 dB)
Bass 100 - 315 Hz
(±) | reduced bass - on average 11.6% lower than median
(±) | linearity of bass is average (10.5% delta to prev. frequency)
Mids 400 - 2000 Hz
(+) | balanced mids - only 3.2% away from median
(+) | mids are linear (4% delta to prev. frequency)
Highs 2 - 16 kHz
(+) | balanced highs - only 2.8% away from median
(+) | highs are linear (5.3% delta to prev. frequency)
Overall 100 - 16.000 Hz
(+) | overall sound is linear (12.3% difference to median)
Compared to same class
» 10% of all tested devices in this class were better, 3% similar, 87% worse
» The best had a delta of 6%, average was 21%, worst was 57%
Compared to all devices tested
» 8% of all tested devices were better, 2% similar, 90% worse
» The best had a delta of 4%, average was 25%, worst was 134%
Apple MacBook 12 (Early 2016) 1.1 GHz audio analysis
(+) | speakers can play relatively loud (83.6 dB)
Bass 100 - 315 Hz
(±) | reduced bass - on average 11.3% lower than median
(±) | linearity of bass is average (14.2% delta to prev. frequency)
Mids 400 - 2000 Hz
(+) | balanced mids - only 2.4% away from median
(+) | mids are linear (5.5% delta to prev. frequency)
Highs 2 - 16 kHz
(+) | balanced highs - only 2% away from median
(+) | highs are linear (4.5% delta to prev. frequency)
Overall 100 - 16.000 Hz
(+) | overall sound is linear (10.2% difference to median)
Compared to same class
» 5% of all tested devices in this class were better, 2% similar, 93% worse
» The best had a delta of 5%, average was 19%, worst was 53%
Compared to all devices tested
» 3% of all tested devices were better, 1% similar, 96% worse
» The best had a delta of 4%, average was 25%, worst was 134%
Energy Management
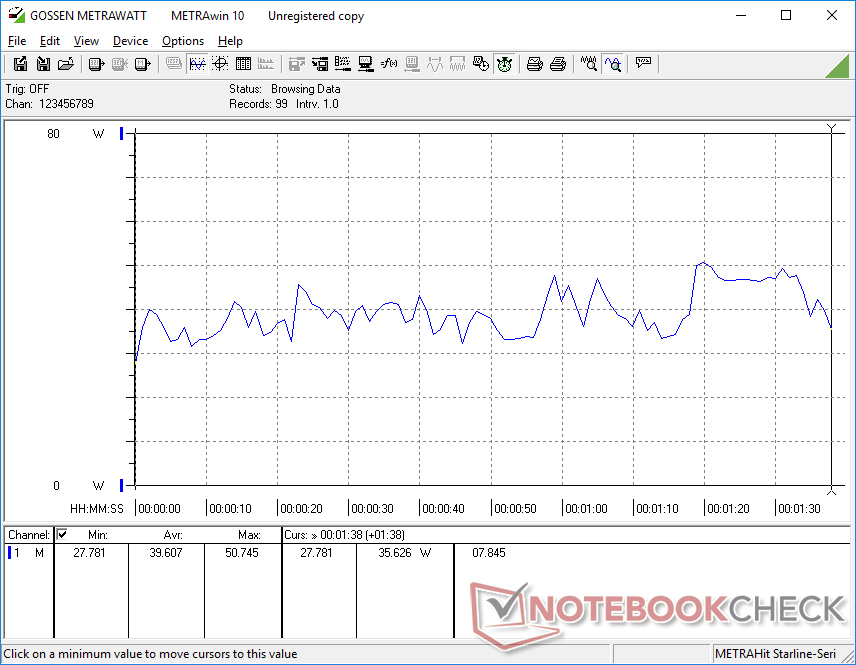
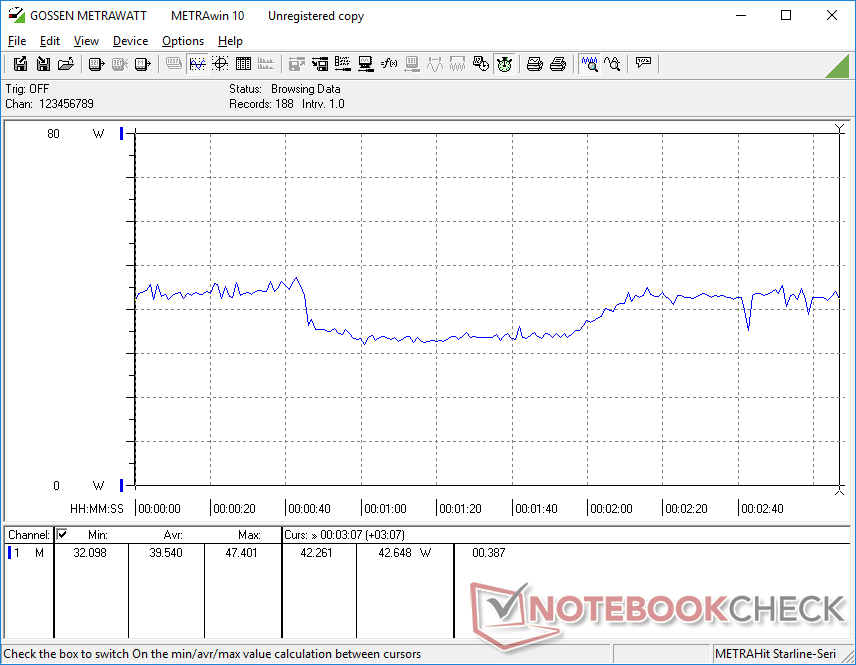
Power Consumption
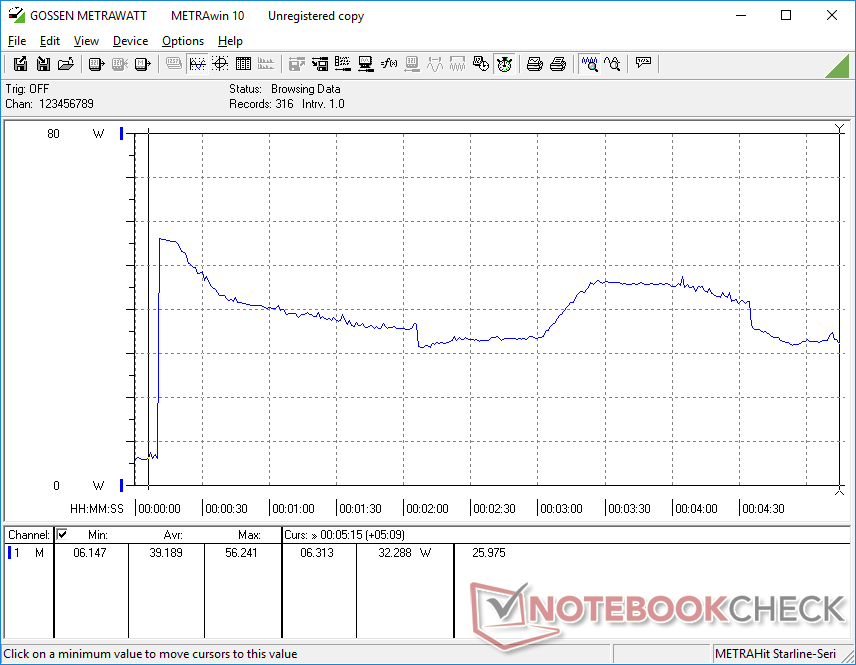
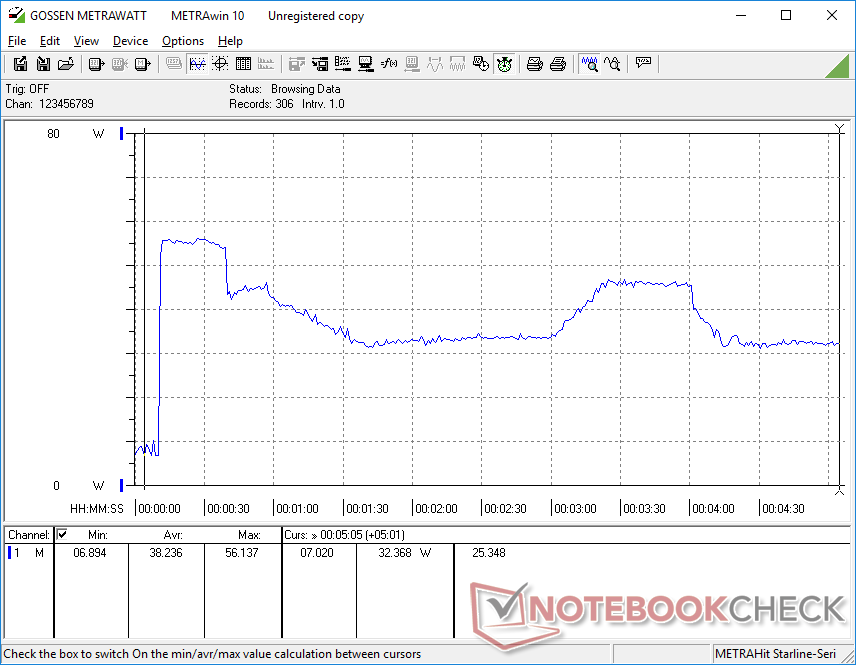
Power consumption fluctuates more readily on the Spectre x360 14 when compared to most other Ultrabooks with the same Core i7-1165G7 like the Asus ZenBook 14. Our screenshots below illustrate the ranges owners can expect when running high processing loads. This behavior is in line with the fluctuating clock rates we observed above.
On average, however, power consumption when running higher loads isn't all that different from the Asus Zenbook S or Lenovo Yoga 9i 14 each equipped with less powerful Ice Lake or Core i5 processors. The HP is especially efficient when compared to Ultrabooks with discrete GeForce MX graphics like the Huawei MateBook 14 which consumes about 15 to 20 W more when gaming.
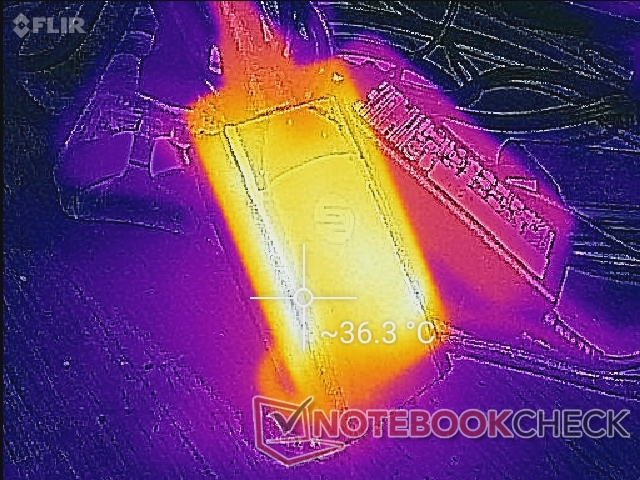
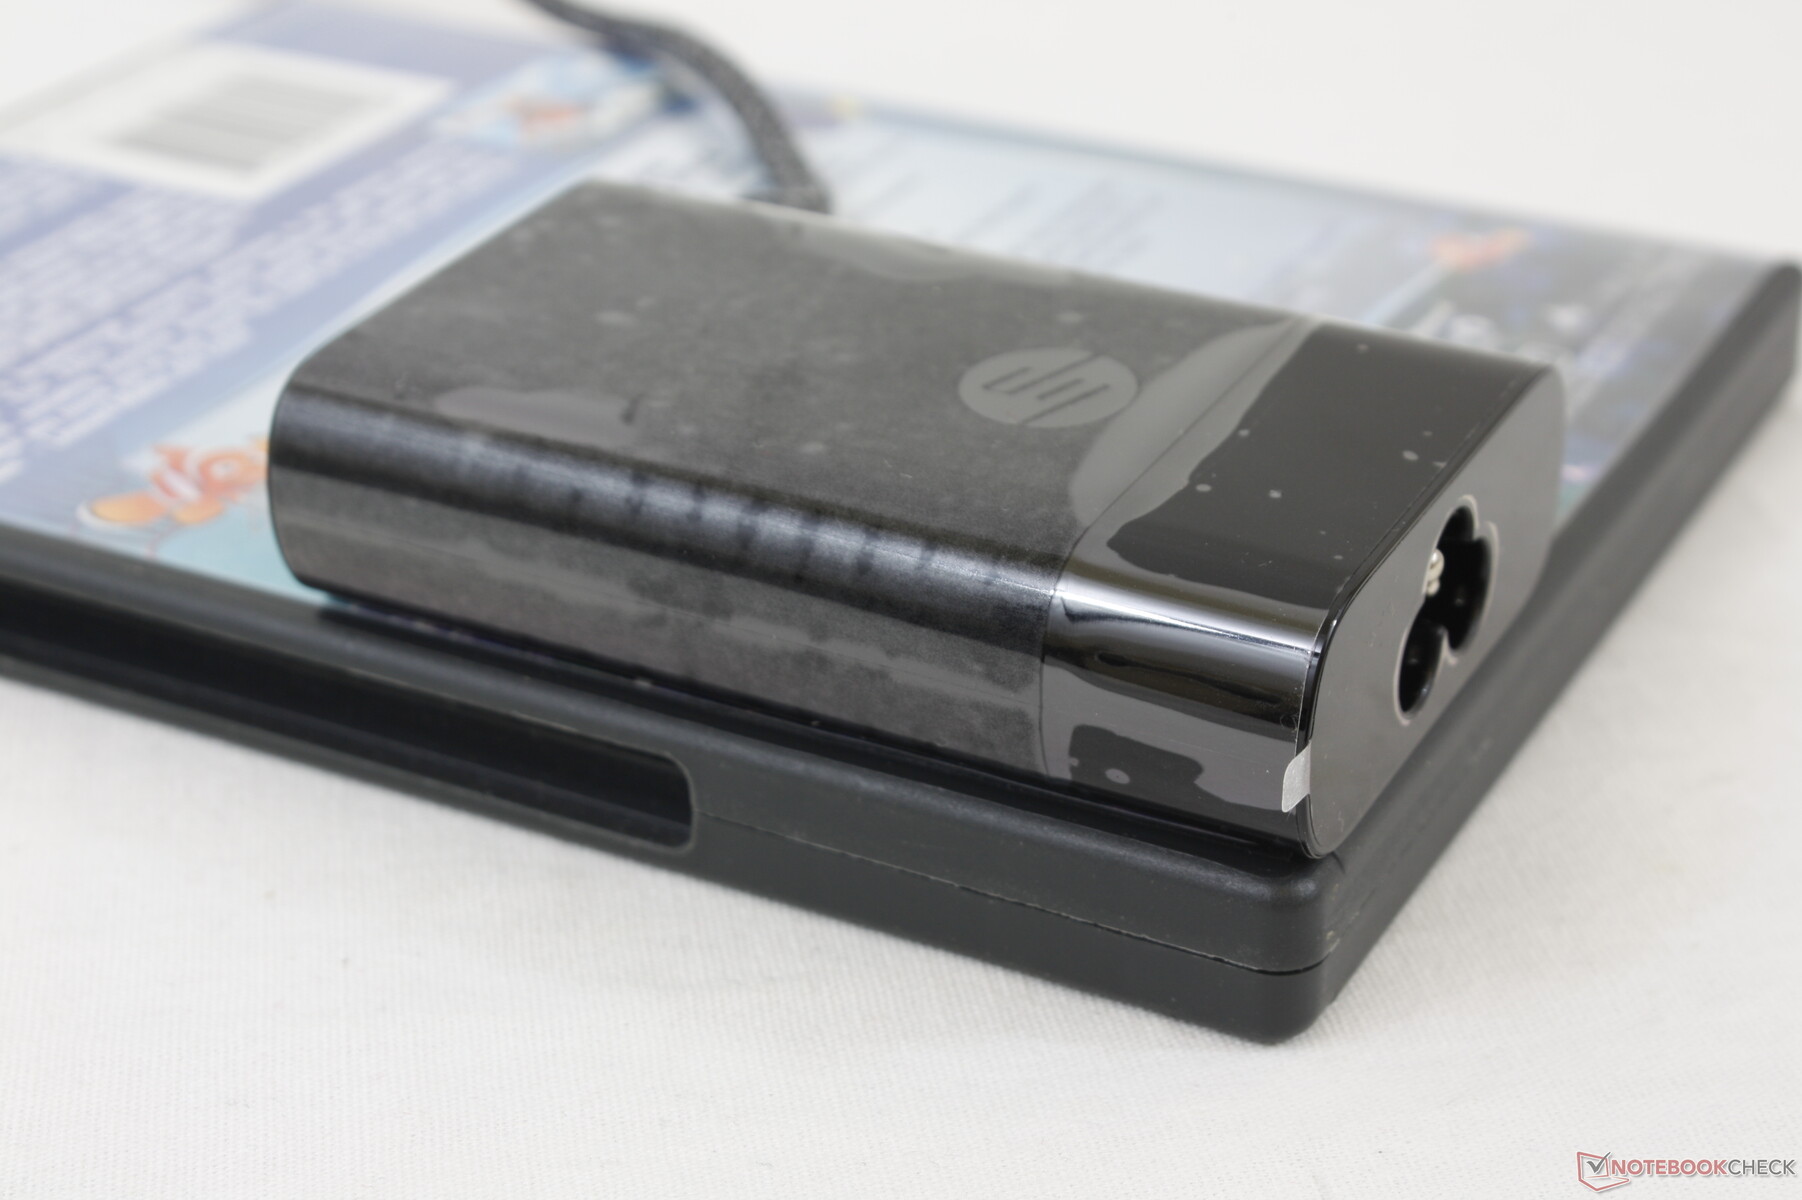
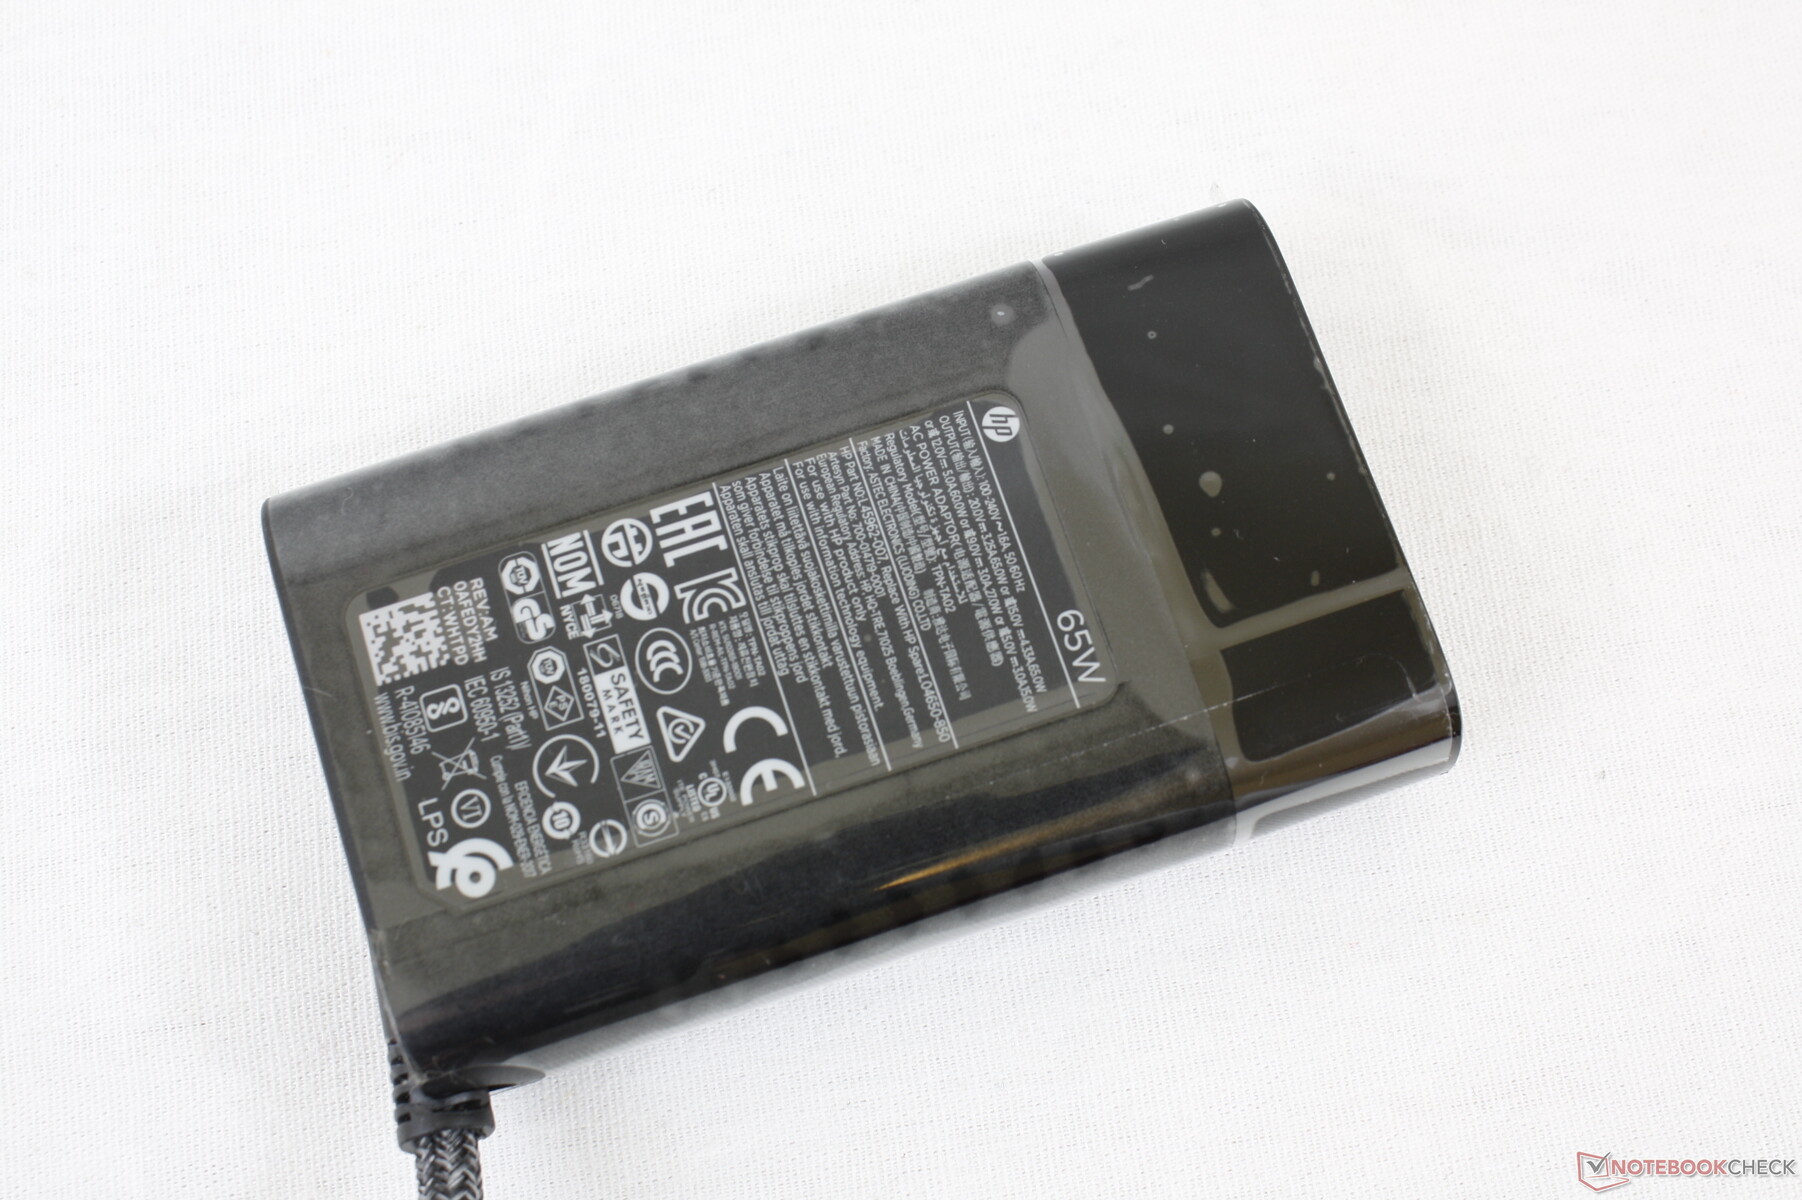
We're able to record a temporary maximum draw of 56.2 W from the small (~8.8 x 5.3 x 2.1 cm) 65 W AC adapter when running extreme loads.
It's worth noting that the default HP Smart Sense power profile is not the most power efficient mode. During our tests, the system would consume at least 6 W on Smart Sense mode compared to just 2 to 3 W when on Quiet mode. You'll want to use Quiet mode if battery life is of utmost importance.
| Off / Standby | |
| Idle | |
| Load |
|
| HP Spectre x360 14t-ea000 i7-1165G7, Iris Xe G7 96EUs, Samsung SSD PM981a MZVLB512HBJQ, IPS, 1920x1280, 13.50 | HP Spectre x360 13-aw0013dx i7-1065G7, Iris Plus Graphics G7 (Ice Lake 64 EU), Intel Optane Memory H10 with Solid State Storage 32GB + 512GB HBRPEKNX0202A(L/H), IPS, 1920x1080, 13.30 | Dell XPS 13 7390 2-in-1 Core i7 i7-1065G7, Iris Plus Graphics G7 (Ice Lake 64 EU), Toshiba BG4 KBG40ZPZ512G, IPS, 1920x1200, 13.40 | Huawei MateBook 14 2020 Intel i7-10510U, GeForce MX350, Lite-On CA5-8D512, IPS LED, 2160x1440, 14.00 | Asus Zenbook S UX393JA i7-1065G7, Iris Plus Graphics G7 (Ice Lake 64 EU), Intel SSD 660p 1TB SSDPEKNW010T8, IPS, 3300x2200, 13.90 | Lenovo Yoga 9i 14ITL5 i5-1135G7, Iris Xe G7 80EUs, Samsung SSD PM981a MZVLB256HBHQ, IPS, 1920x1080, 14.00 | |
|---|---|---|---|---|---|---|
| Power Consumption | -2% | -1% | -43% | -20% | -11% | |
| Idle Minimum * | 3 | 3.9 -30% | 2.6 13% | 3 -0% | 4.1 -37% | 3.3 -10% |
| Idle Average * | 5.1 | 6.3 -24% | 5.3 -4% | 9 -76% | 7.5 -47% | 6.7 -31% |
| Idle Maximum * | 6.4 | 6.8 -6% | 7 -9% | 11 -72% | 8.5 -33% | 6.9 -8% |
| Load Average * | 39.6 | 32.6 18% | 43.1 -9% | 60.8 -54% | 36.8 7% | 41.4 -5% |
| Witcher 3 ultra * | 39.6 | 25.6 35% | 43.1 -9% | 56 -41% | 39.2 1% | 39.3 1% |
| Load Maximum * | 56.2 | 59 -5% | 49 13% | 65.6 -17% | 61.6 -10% | 64.7 -15% |
* ... smaller is better
Battery Life
Battery capacity is 10 percent larger than on the Spectre x360 13 (66 Wh vs 60 Wh) and with a longer WLAN runtime of about 1.5 hours. Users can expect almost 12 hours of real-world WLAN usage on a full charge.
Idling on desktop at the lowest brightness setting on HP Smart Sense mode would last for just 14.5 hours compared to over 36 hours on Quiet mode. The wide discrepancy may be due to the higher power consumption of Smart Sense mode mentioned above.
Charging from empty to full capacity takes about 2 to 2.5 hours.
| HP Spectre x360 14t-ea000 i7-1165G7, Iris Xe G7 96EUs, 66 Wh | HP Spectre x360 13-aw0013dx i7-1065G7, Iris Plus Graphics G7 (Ice Lake 64 EU), 60 Wh | Dell XPS 13 7390 2-in-1 Core i7 i7-1065G7, Iris Plus Graphics G7 (Ice Lake 64 EU), 51 Wh | Huawei MateBook 14 2020 Intel i7-10510U, GeForce MX350, 56 Wh | Asus Zenbook S UX393JA i7-1065G7, Iris Plus Graphics G7 (Ice Lake 64 EU), 67 Wh | Lenovo Yoga 9i 14ITL5 i5-1135G7, Iris Xe G7 80EUs, 60 Wh | |
|---|---|---|---|---|---|---|
| Battery Runtime | -1% | -24% | -5% | -4% | -14% | |
| Reader / Idle | 2185 | 2223 2% | 2305 5% | 2260 3% | ||
| WiFi v1.3 | 707 | 594 -16% | 537 -24% | 768 9% | 495 -30% | 591 -16% |
| Load | 145 | 160 10% | 117 -19% | 164 13% | 103 -29% |
Pros
Cons
Verdict
The best thing about the Spectre x360 14 is that it's a perfect adaptation of the Spectre x360 13. Almost everything we loved about the 13.3-inch model can be found unscathed on the 13.5-inch model including the excellent keyboard feedback, strong and classy metal design, high contrast ratio display with full sRGB coverage, and long battery life. However, this also means that the system inherits many of the same drawbacks as the Spectre x360 13 like the cycling CPU clock rates, non user-upgradeable RAM, average hinge rigidity at certain angles, and slow black-white response times. There's definitely still room for improvement in this regard.
We're not fans of a couple of changes. Whereas the Spectre x360 13 had WAN options, the Spectre x360 14 has silently omitted them. Meanwhile, the larger fingerprint reader is easier to use, but it comes at the expense of a Ctrl key. If you never relied on these features in the first place, however, then these changes won't be much of a problem.
The 13.5-inch Spectre x360 14 puts the 13.3-inch Spectre x360 13 in a tight spot. Though HP insists that the former won't replace the latter, we can see a scenario where the Spectre x360 13 will be slowly phased out anyway in favor of the Spectre x360 14 because both are so similar. If you're in the market for a Spectre, we recommend the 13.5-inch model over the 13.3-inch one simply because it is able to offer a noticeably larger screen size with only marginal increases to size and weight.
HP's latest convertible is faster than the Dell XPS 13 with the same Core i7 CPU while offering a larger and optionally two times brighter display. There are a few faults, but they are generally easy to overlook given that the Spectre x360 14 is so well-crafted and a joy to work on.

Price and availability
HP Spectre x360 14t-ea000
-
12/22/2020 v7
Allen Ngo
More articles related to this device
HP Spectre x360 14t-ea000 (Spectre x360 14 Series)Related Articles


Pricecompare
