2020 HP Pavilion 13 11th gen Core i7 Review: It's Actually Pretty Good
As well-known as the HP Pavilion series may be, we haven't actually reviewed a 13.3-inch model in a long while. We've had our fair share of 15.6-inch Pavilion 15 and 17.3-inch Pavilion 17 laptops over the years, but this is our first Pavilion 13 clamshell. How does HP's entry-level subnotebook compare to the ocean of other subnotebooks out in the market?
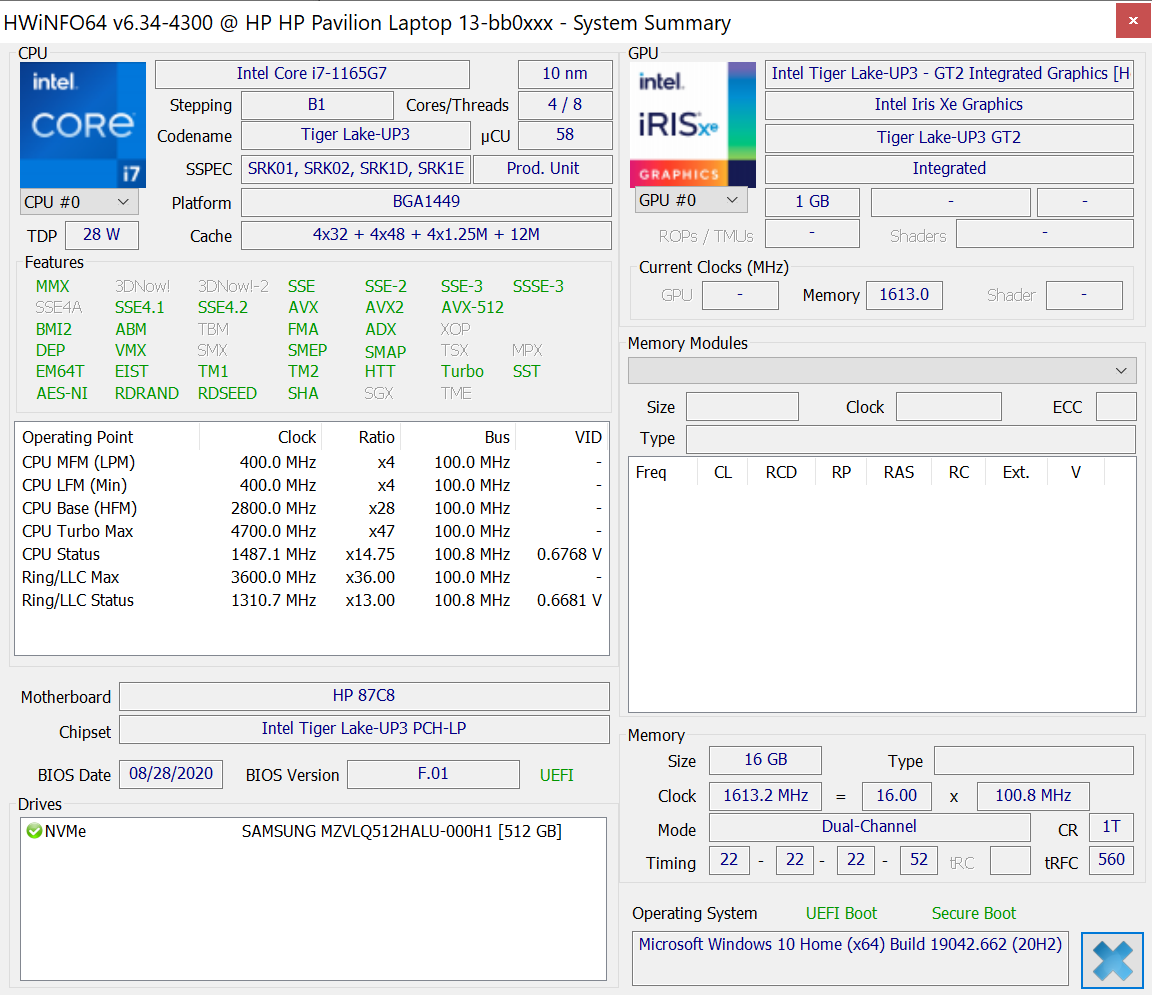
Our test unit is a higher-end configuration of the 2020 HP Pavilion 13 with the 11th gen Core i7-1165G7 CPU, 4K UHD display, 16 GB of RAM, and 512 GB NVMe SSD for approximately $900 USD. Lesser configurations with the Core i5-1135G7, 1080p display, 8 GB of RAM, and 256 GB NVMe SSD are available for $730 USD or even less if on sale. Annoyingly, there are no black color options at the time or writing.
Competitors to the HP Pavilion 13 include other budget-oriented subnotebooks like the Lenovo IdeaPad S540 13, Dell Inspiron 13, Acer Swift 3, or Asus VivoBook S13.
More HP reviews:
potential competitors in comparison
Rating | Date | Model | Weight | Height | Size | Resolution | Price |
|---|---|---|---|---|---|---|---|
| 81.5 % v7 (old) | 12 / 2020 | HP Pavilion 13-bb0015cl i7-1165G7, Iris Xe G7 96EUs | 1.2 kg | 17.7 mm | 13.30" | 3840x2160 | |
| 87.1 % v7 (old) | 12 / 2020 | HP Envy 13-ba0001ng i7-10510U, GeForce MX350 | 1.3 kg | 16 mm | 13.30" | 1920x1080 | |
| 88.8 % v7 (old) | 03 / 2020 | Dell XPS 13 9300 i5 FHD i5-1035G1, UHD Graphics G1 (Ice Lake 32 EU) | 1.2 kg | 14.8 mm | 13.40" | 1920x1200 | |
| 85 % v6 (old) | 12 / 2018 | Asus VivoBook S13 S330UA-EY034T i5-8550U, UHD Graphics 620 | 1.2 kg | 17.9 mm | 13.30" | 1920x1080 | |
| 85 % v7 (old) | 11 / 2020 | Lenovo IdeaPad S540-13ARE-82DL000YGE R5 4600U, Vega 6 | 1.3 kg | 15.95 mm | 13.30" | 2560x1600 | |
| 87 % v7 (old) | 02 / 2020 | Acer Swift 3 SF313-52-71Y7 i7-1065G7, Iris Plus Graphics G7 (Ice Lake 64 EU) | 1.2 kg | 16.6 mm | 13.50" | 2256x1504 |
Case
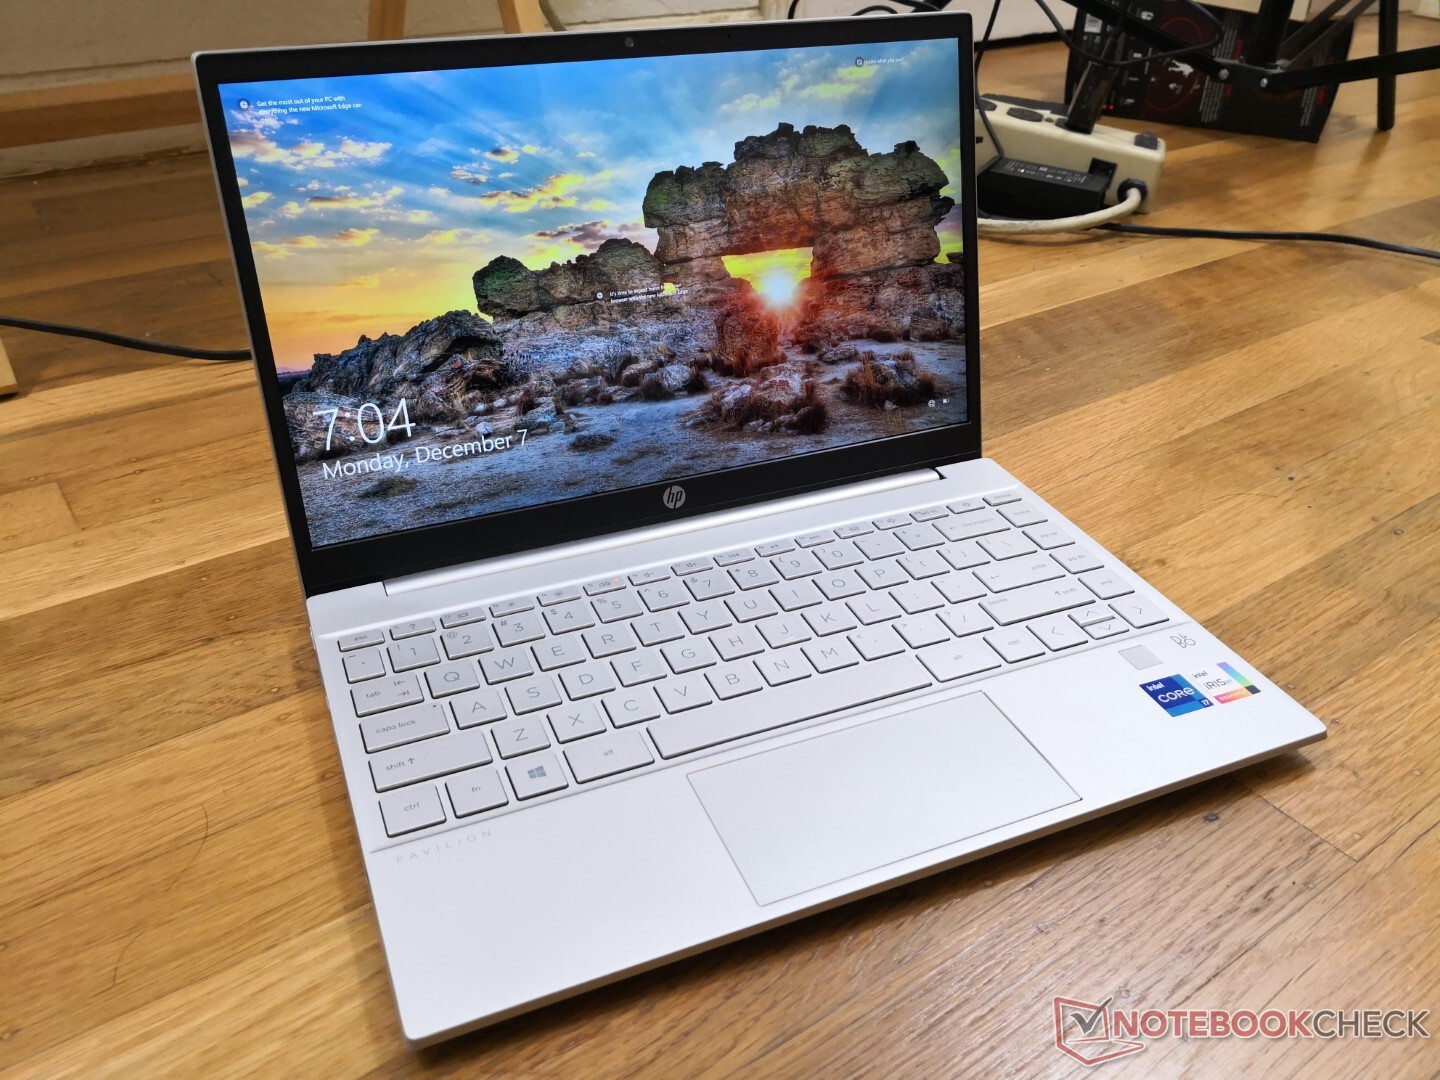
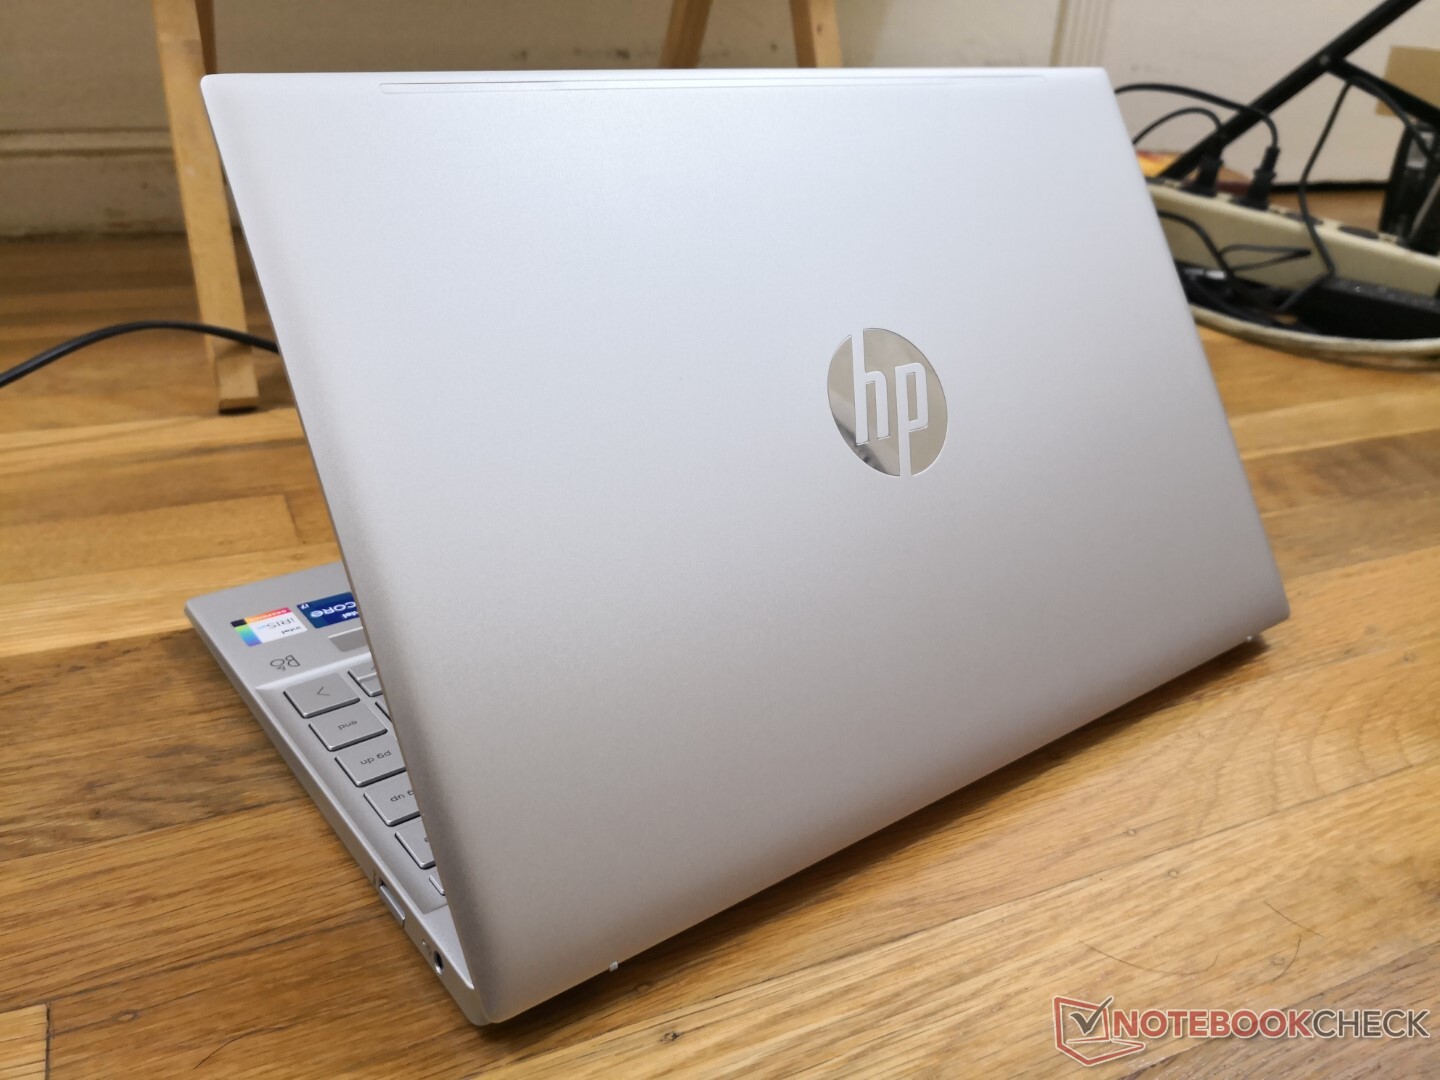
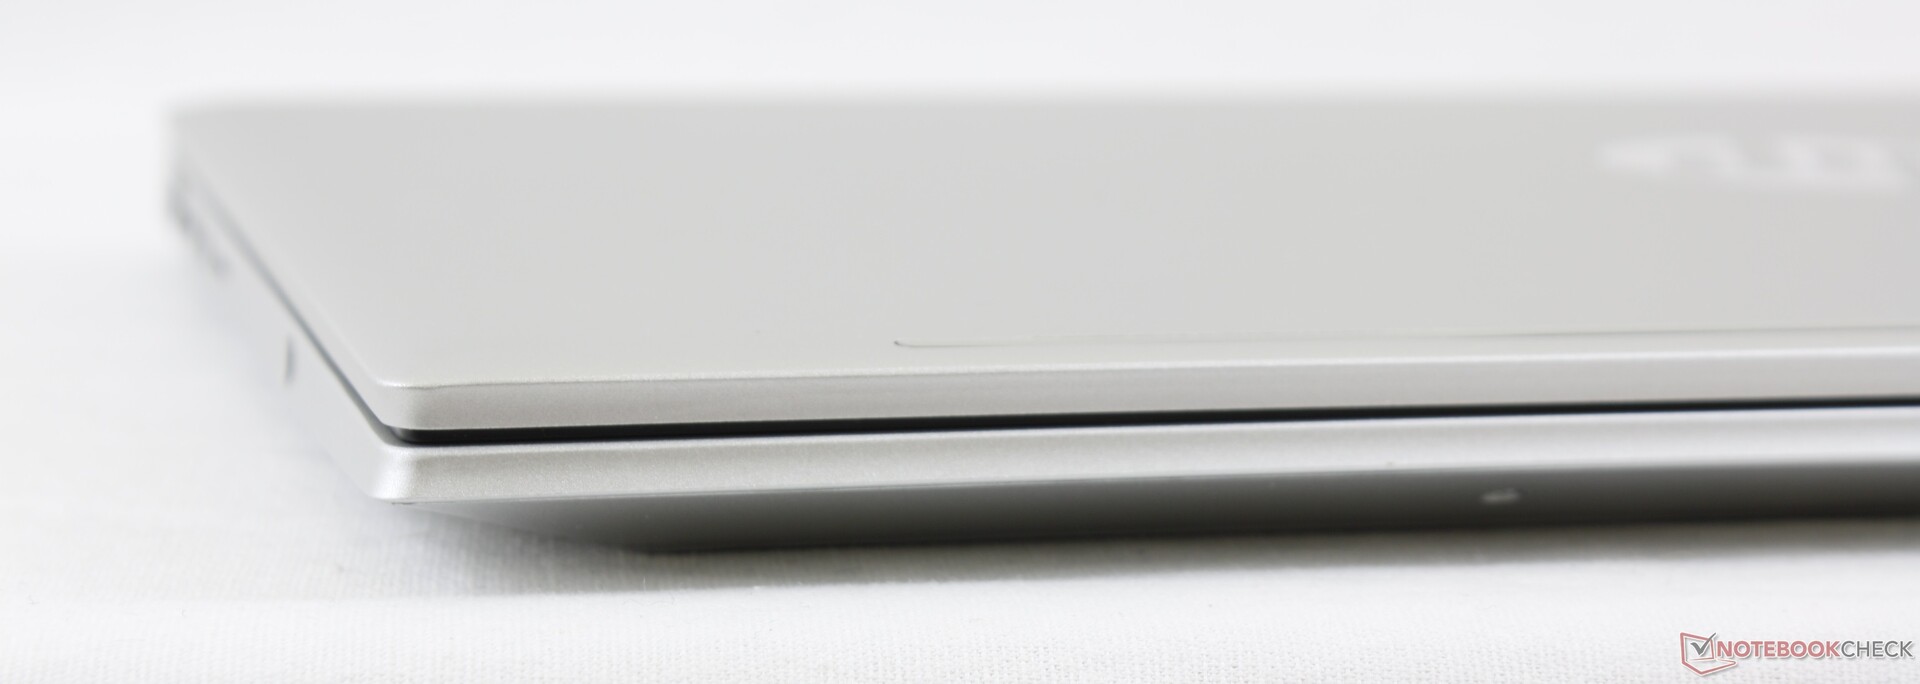
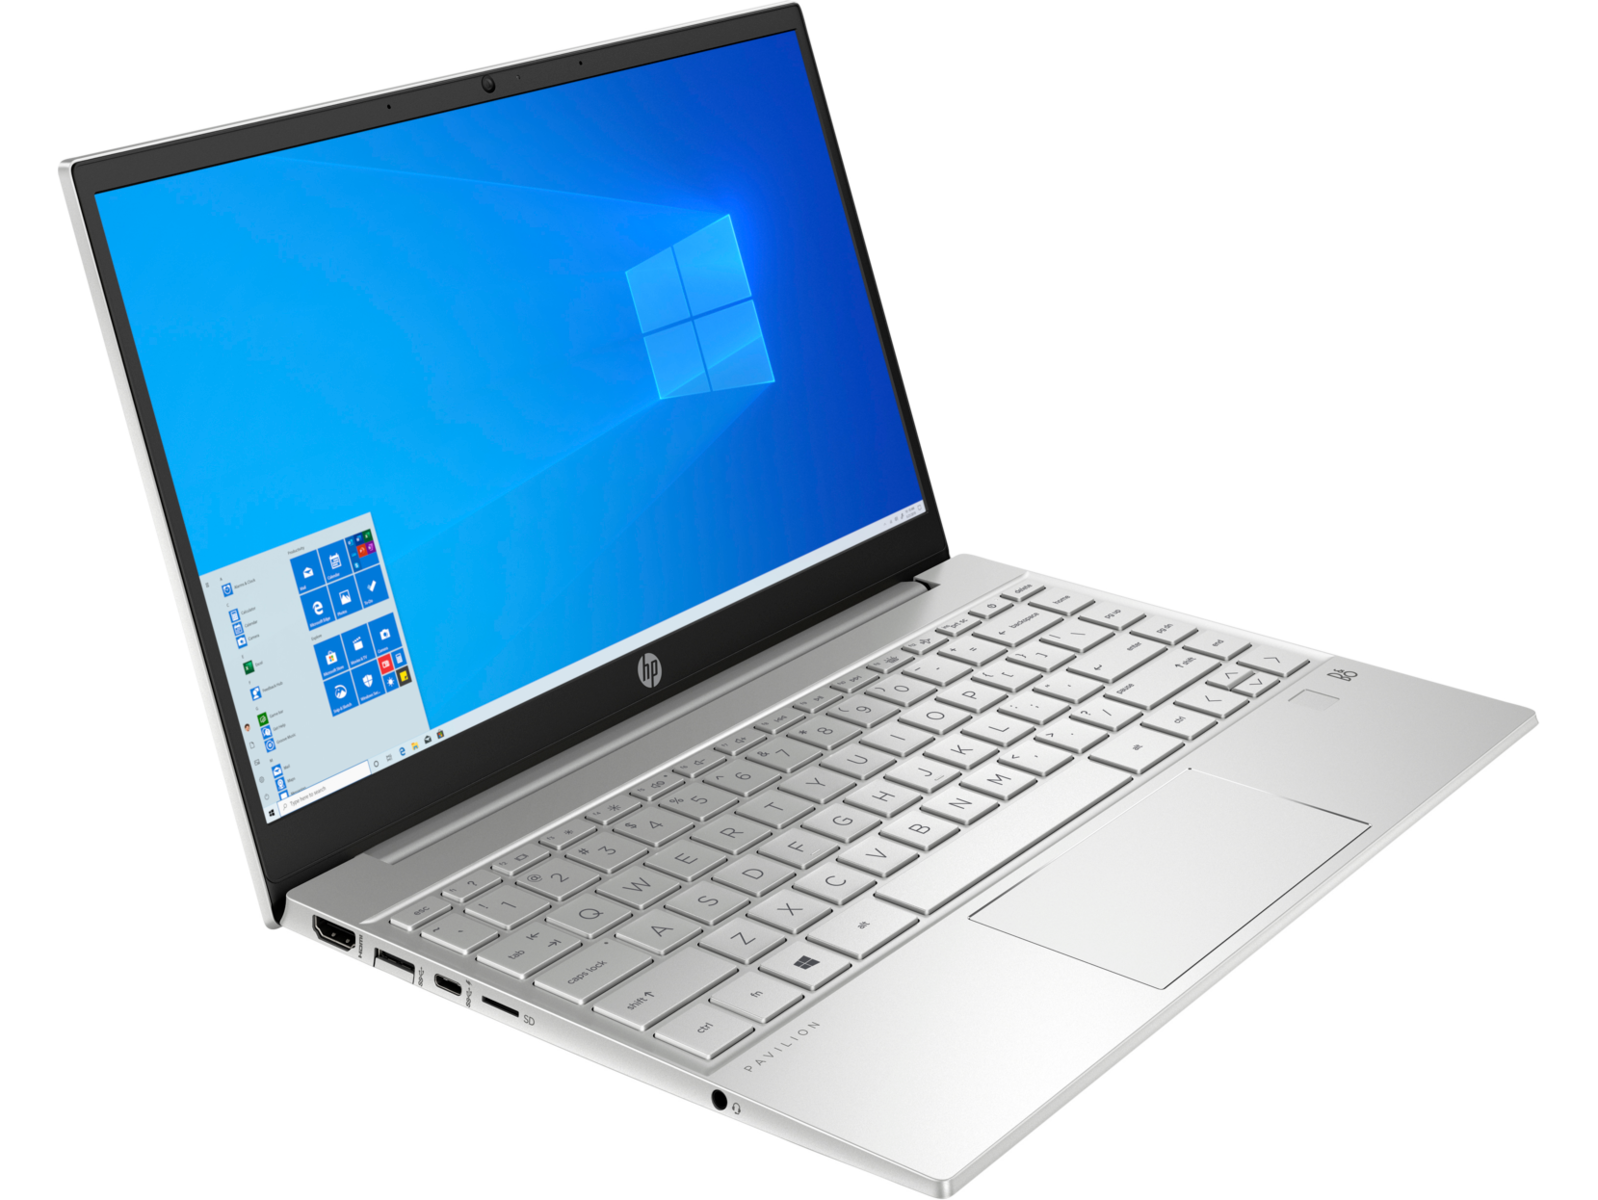
Older Pavilion laptops were thick and looked cheap to reflect their budget price points. On this latest 2020 Pavilion 13, however, HP has trickled down many of the design features from the Envy and Spectre series for a simpler and more elegant look. The end result is a leaner laptop that feels more expensive than what its price might otherwise suggest. Paint the system gold and brown and one would easily mistaken it as an Envy 13 at first glance.
Spend some more time with the Pavilion 13 and the cut corners become more noticeable. Unlike the Envy 13 or Spectre 13 that this Pavilion aspires to be, the chassis is still mostly plastic and more susceptible to flexing and warping. Pushing down on the center of the keyboard, for example, warps the surface more than on HP's higher-end alternatives. The lid also flexes and twists more readily. Overall impressions are still much better than expected for an affordable laptop even if they're still a couple of steps down from the costlier HP Envy, Lenovo Yoga, Asus ZenBook, or Dell XPS.
Overall dimensions are only a bit larger than the Envy 13 since the bottom "chin" bezel of the Pavilion is slightly thicker. Otherwise, the system is as lightweight as the XPS 13 despite the size differences.
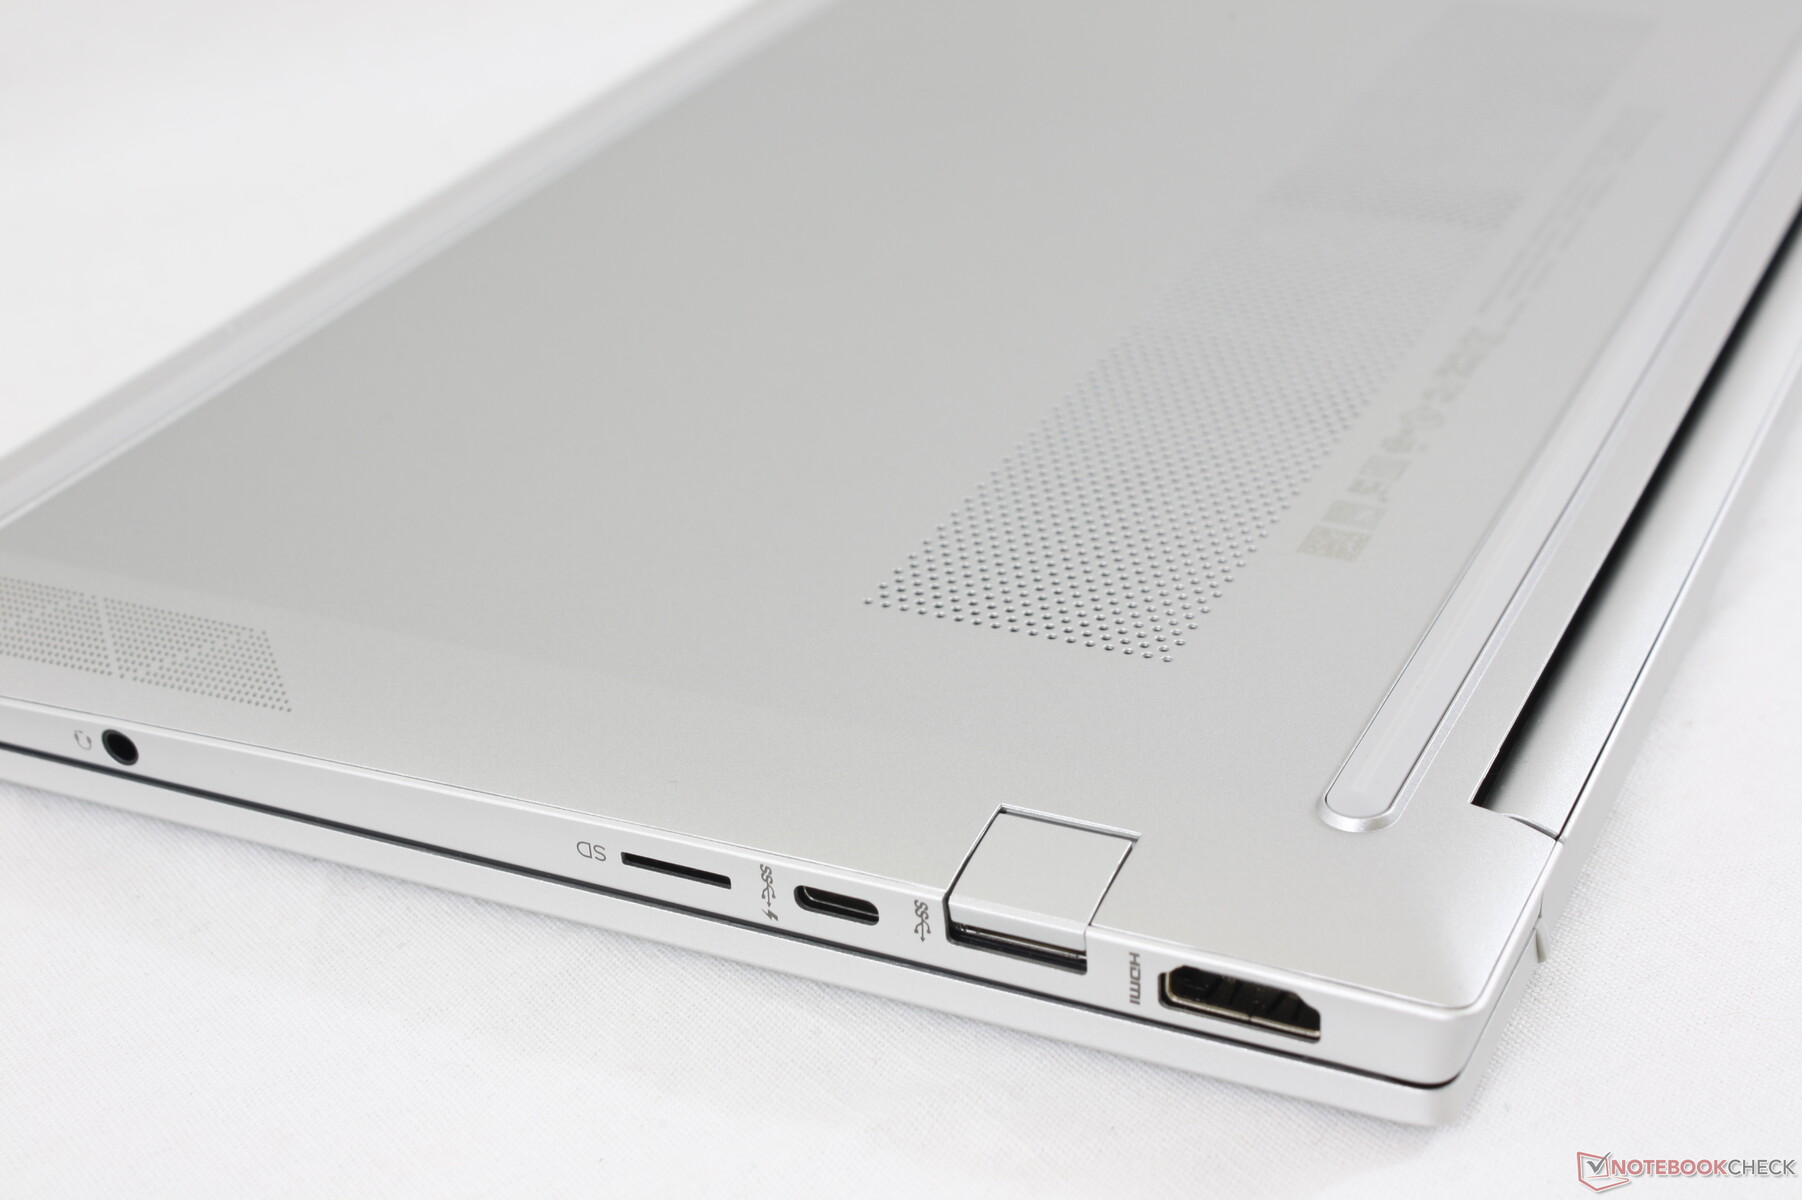
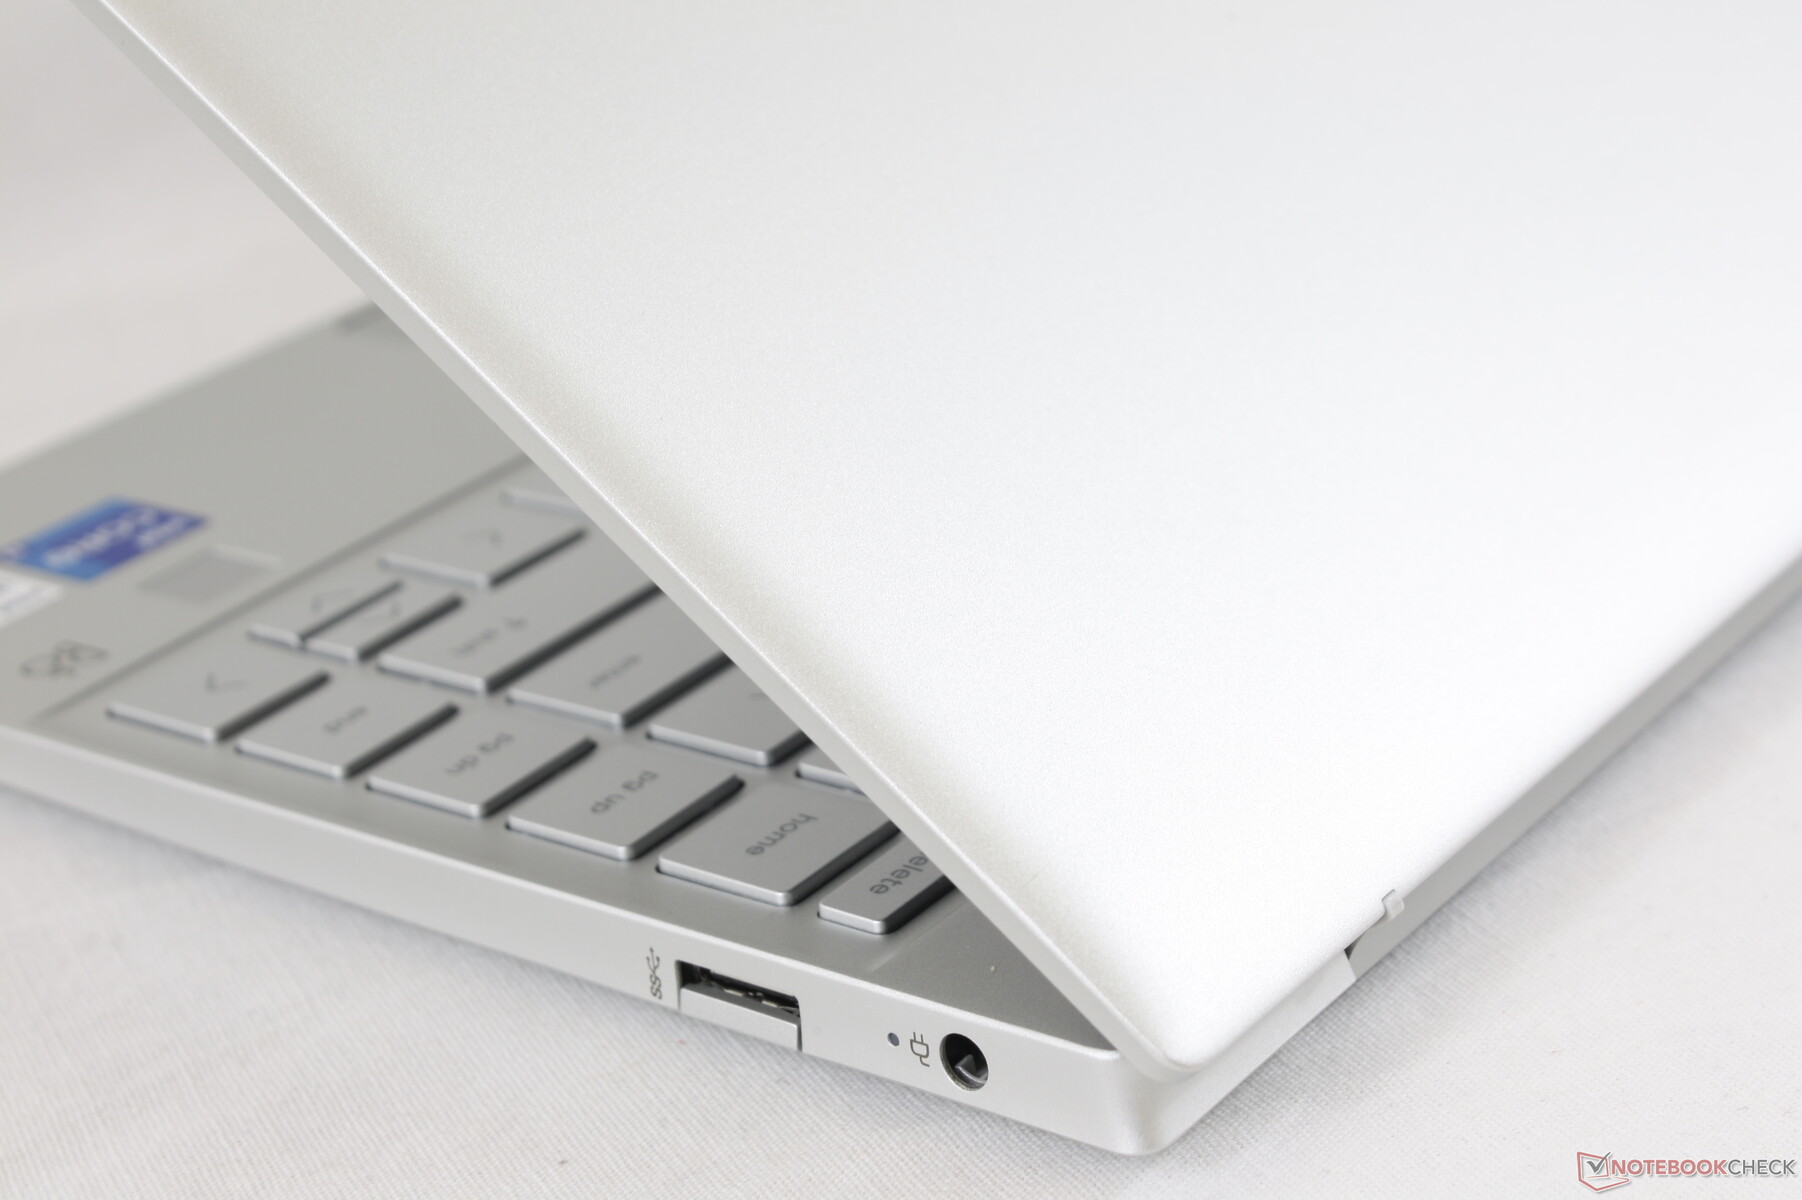
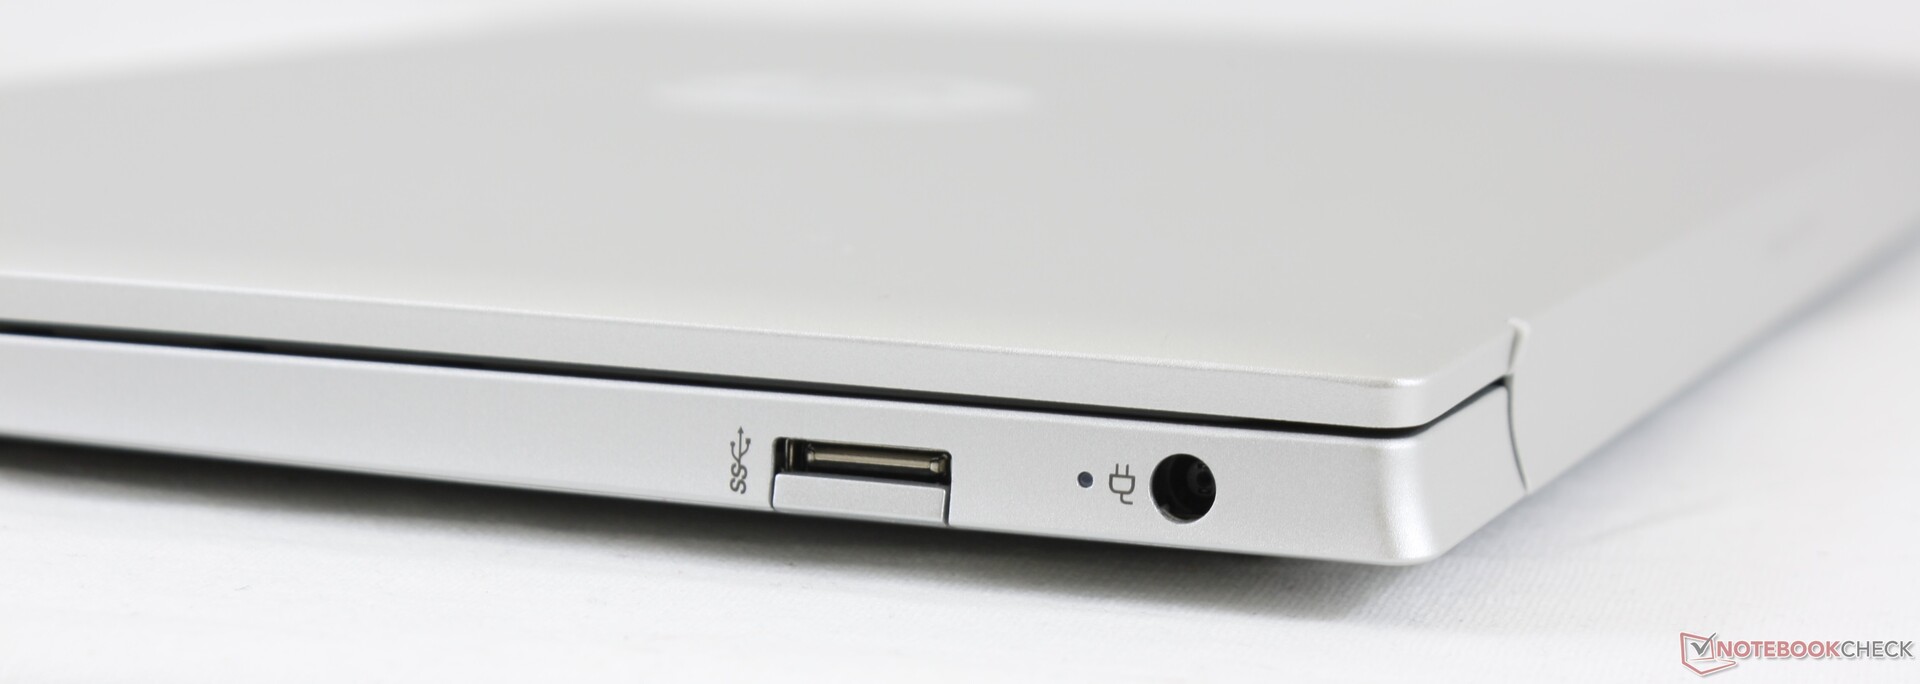
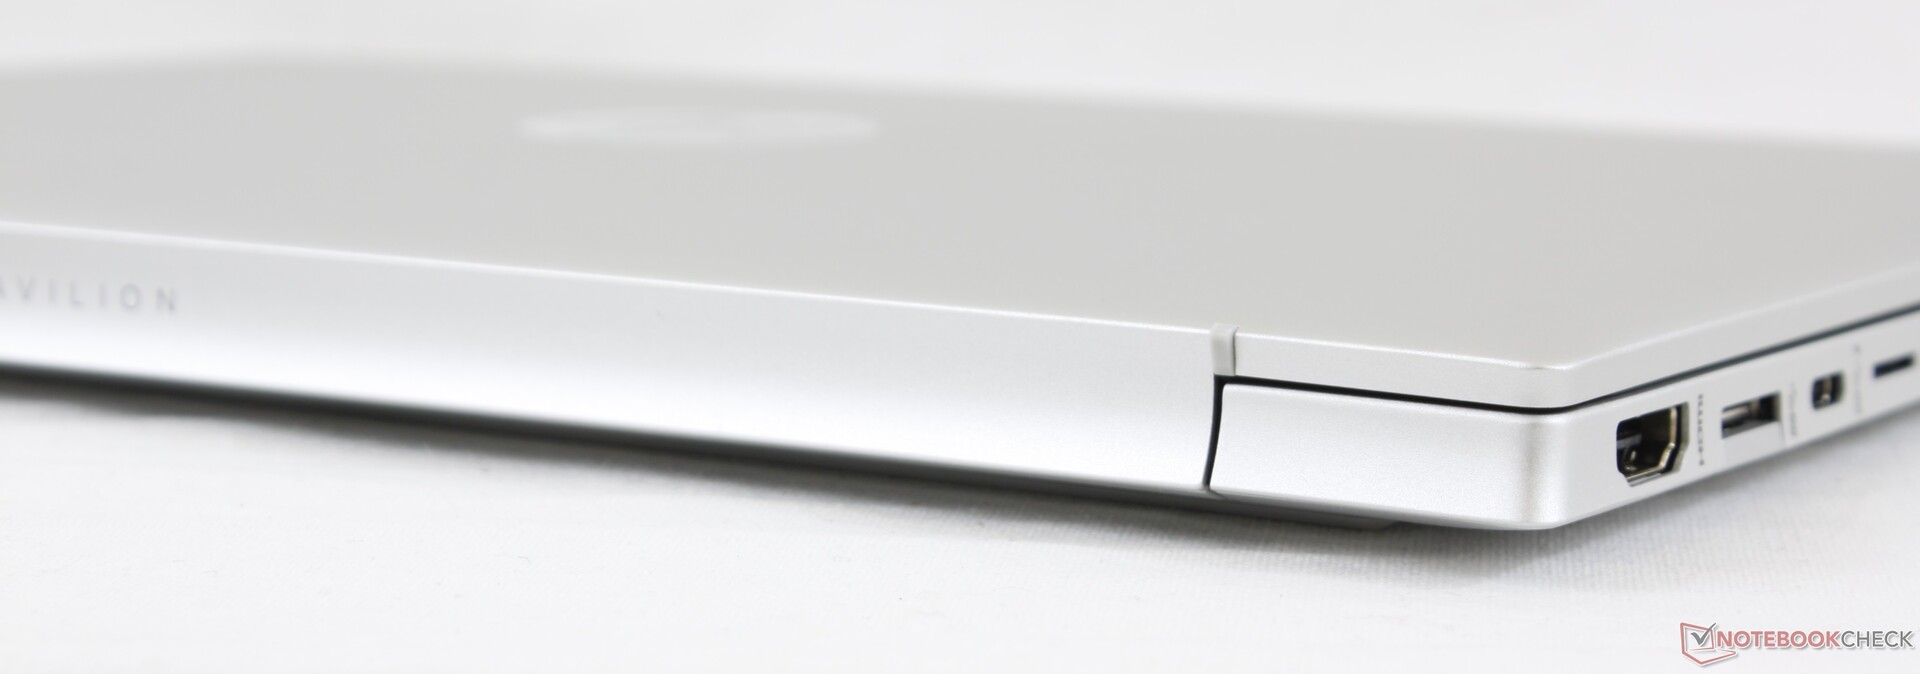
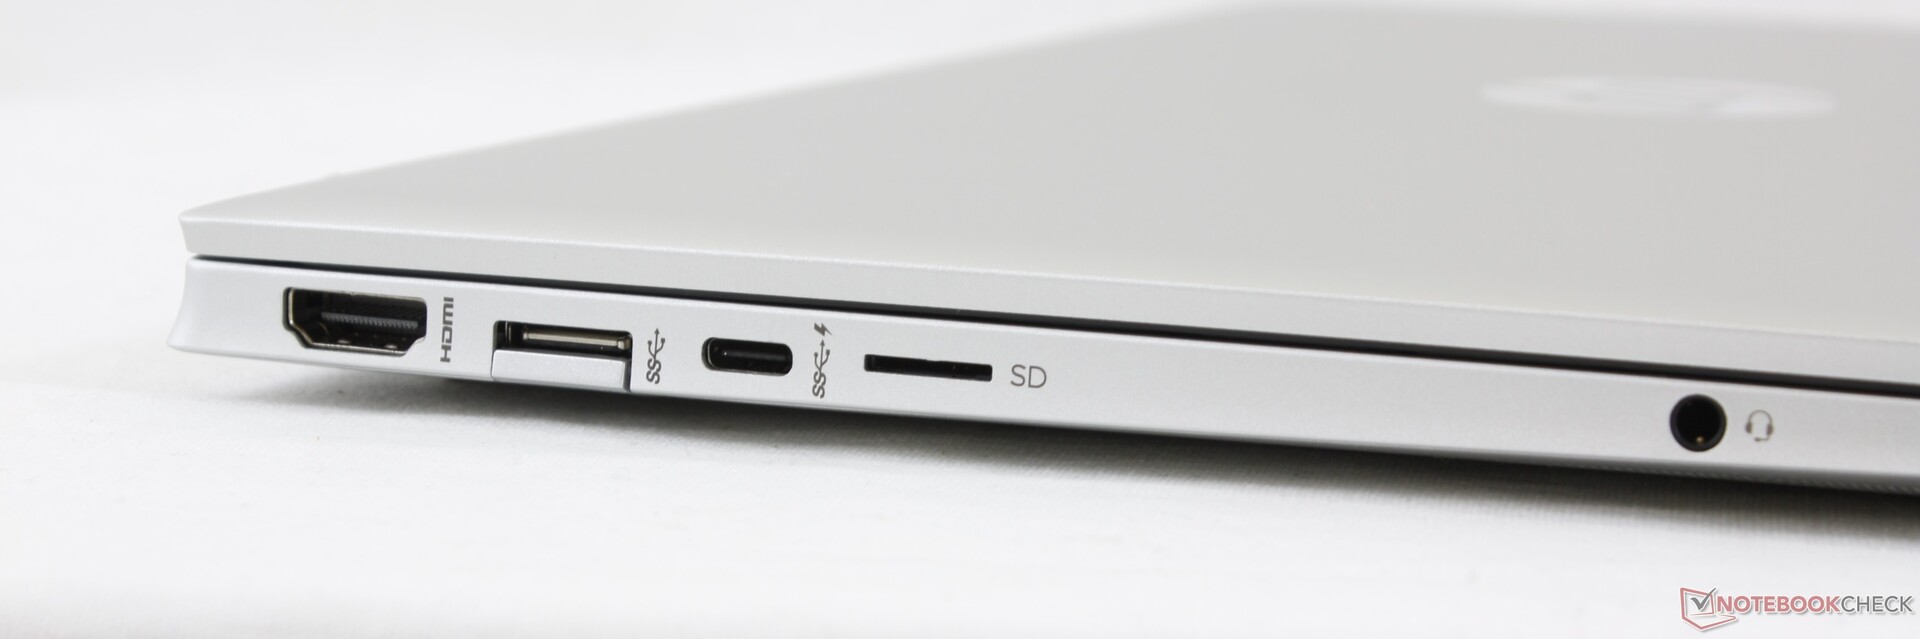
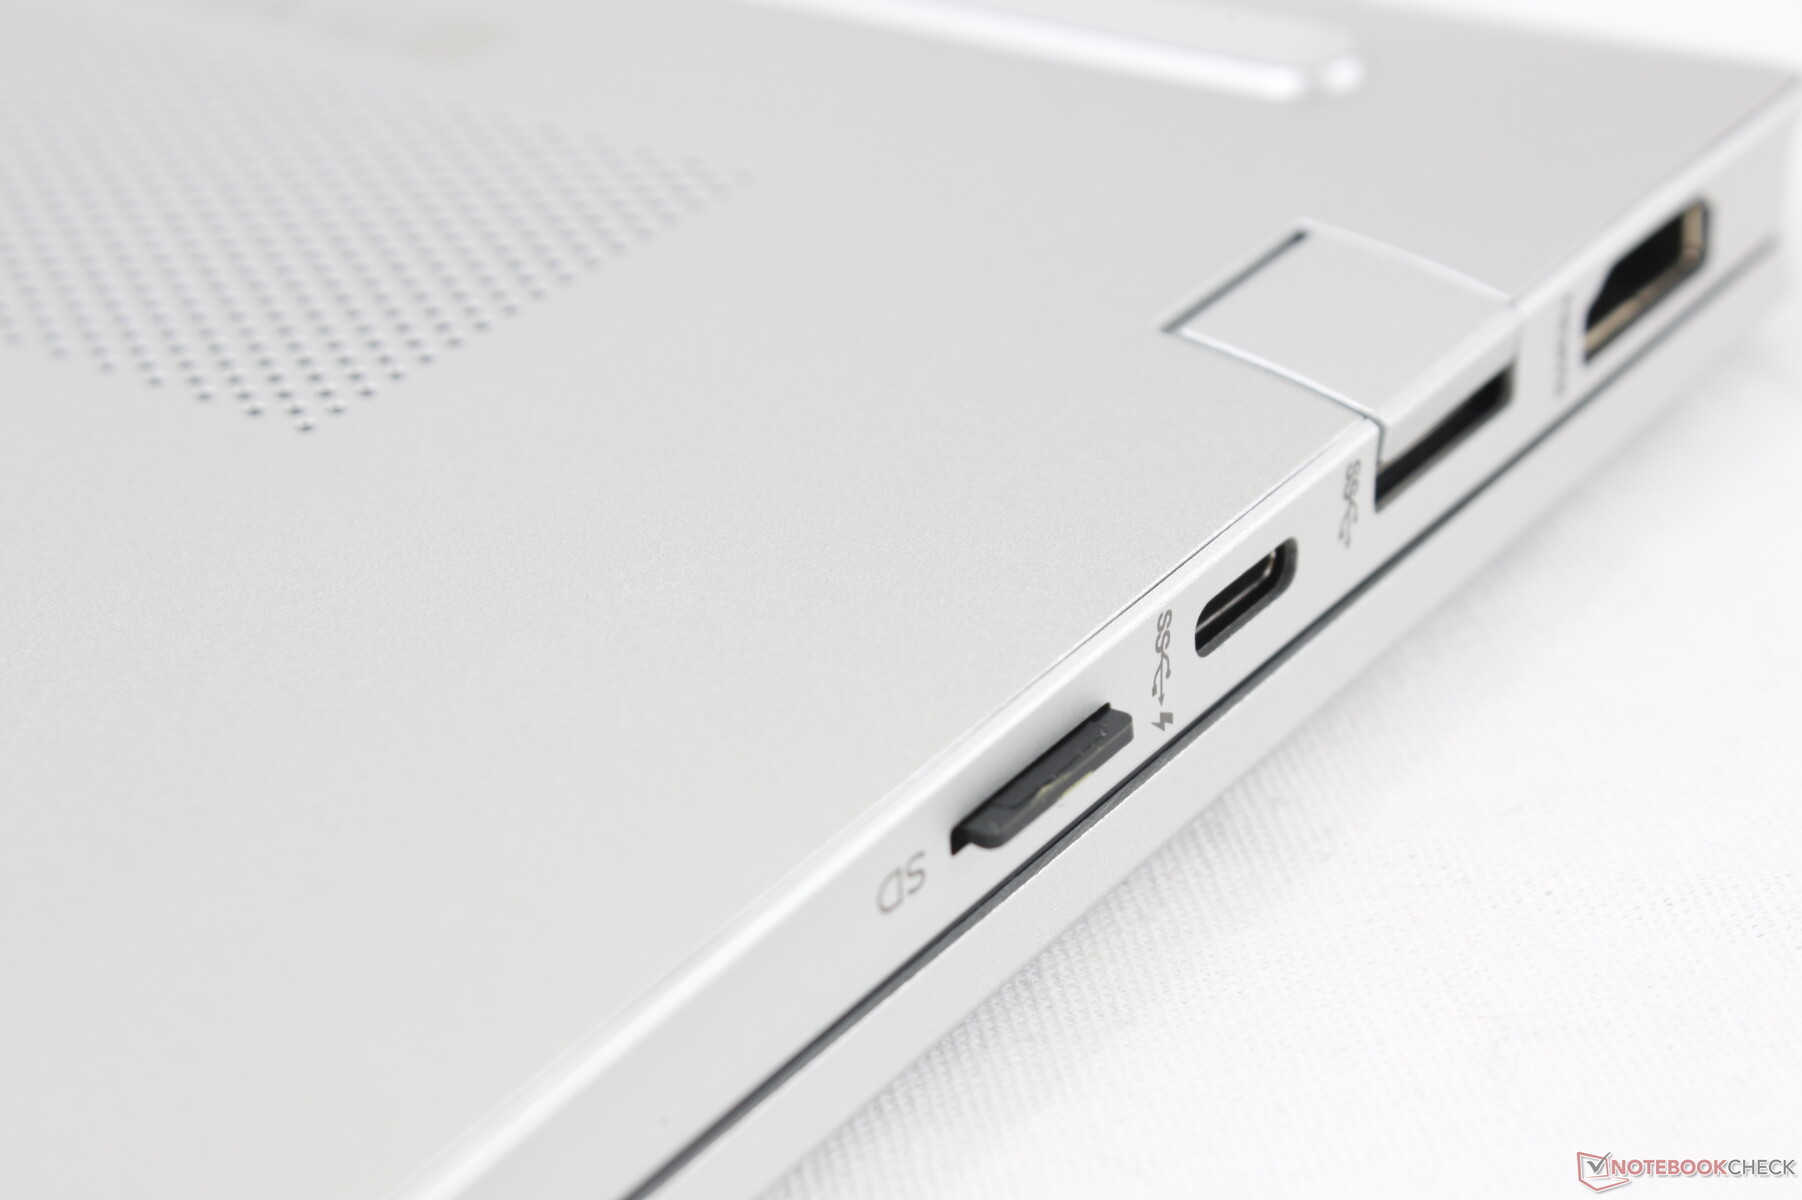
Connectivity
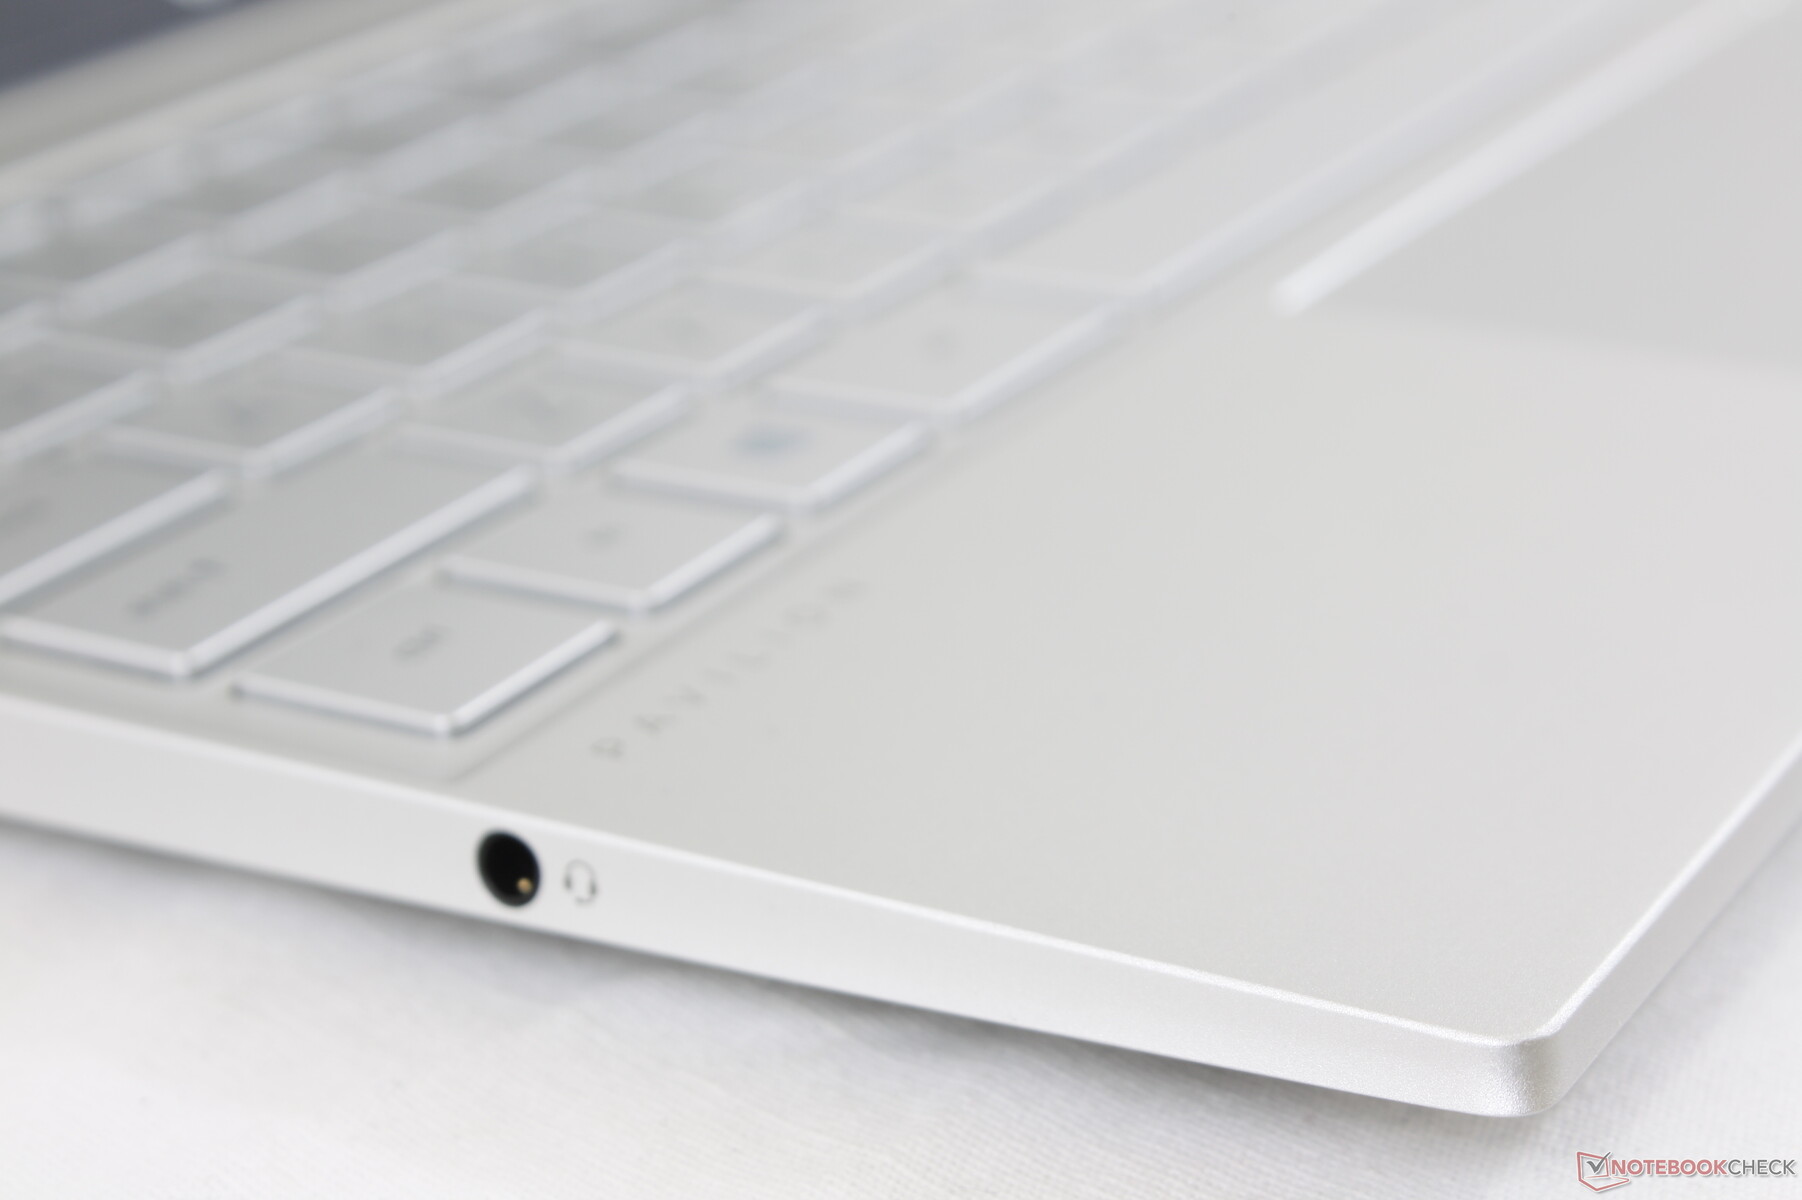
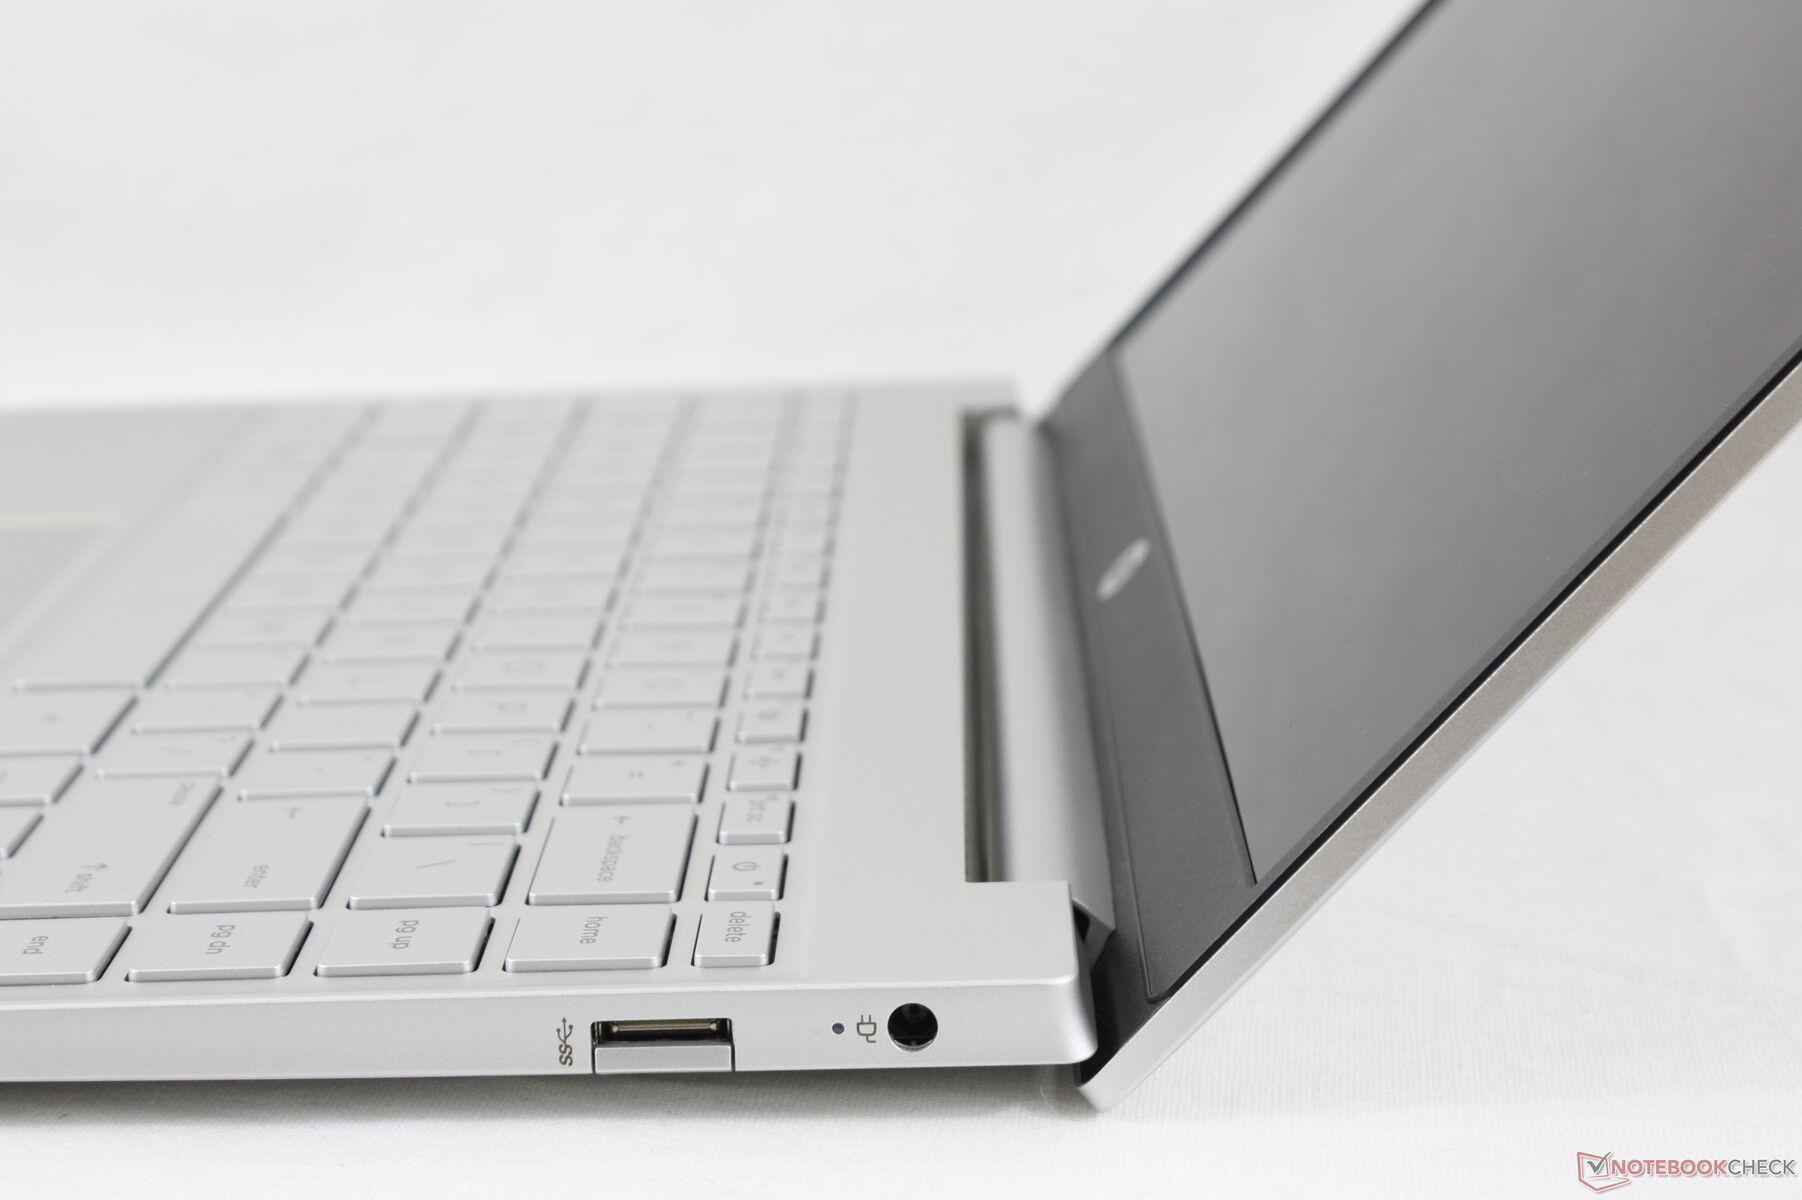
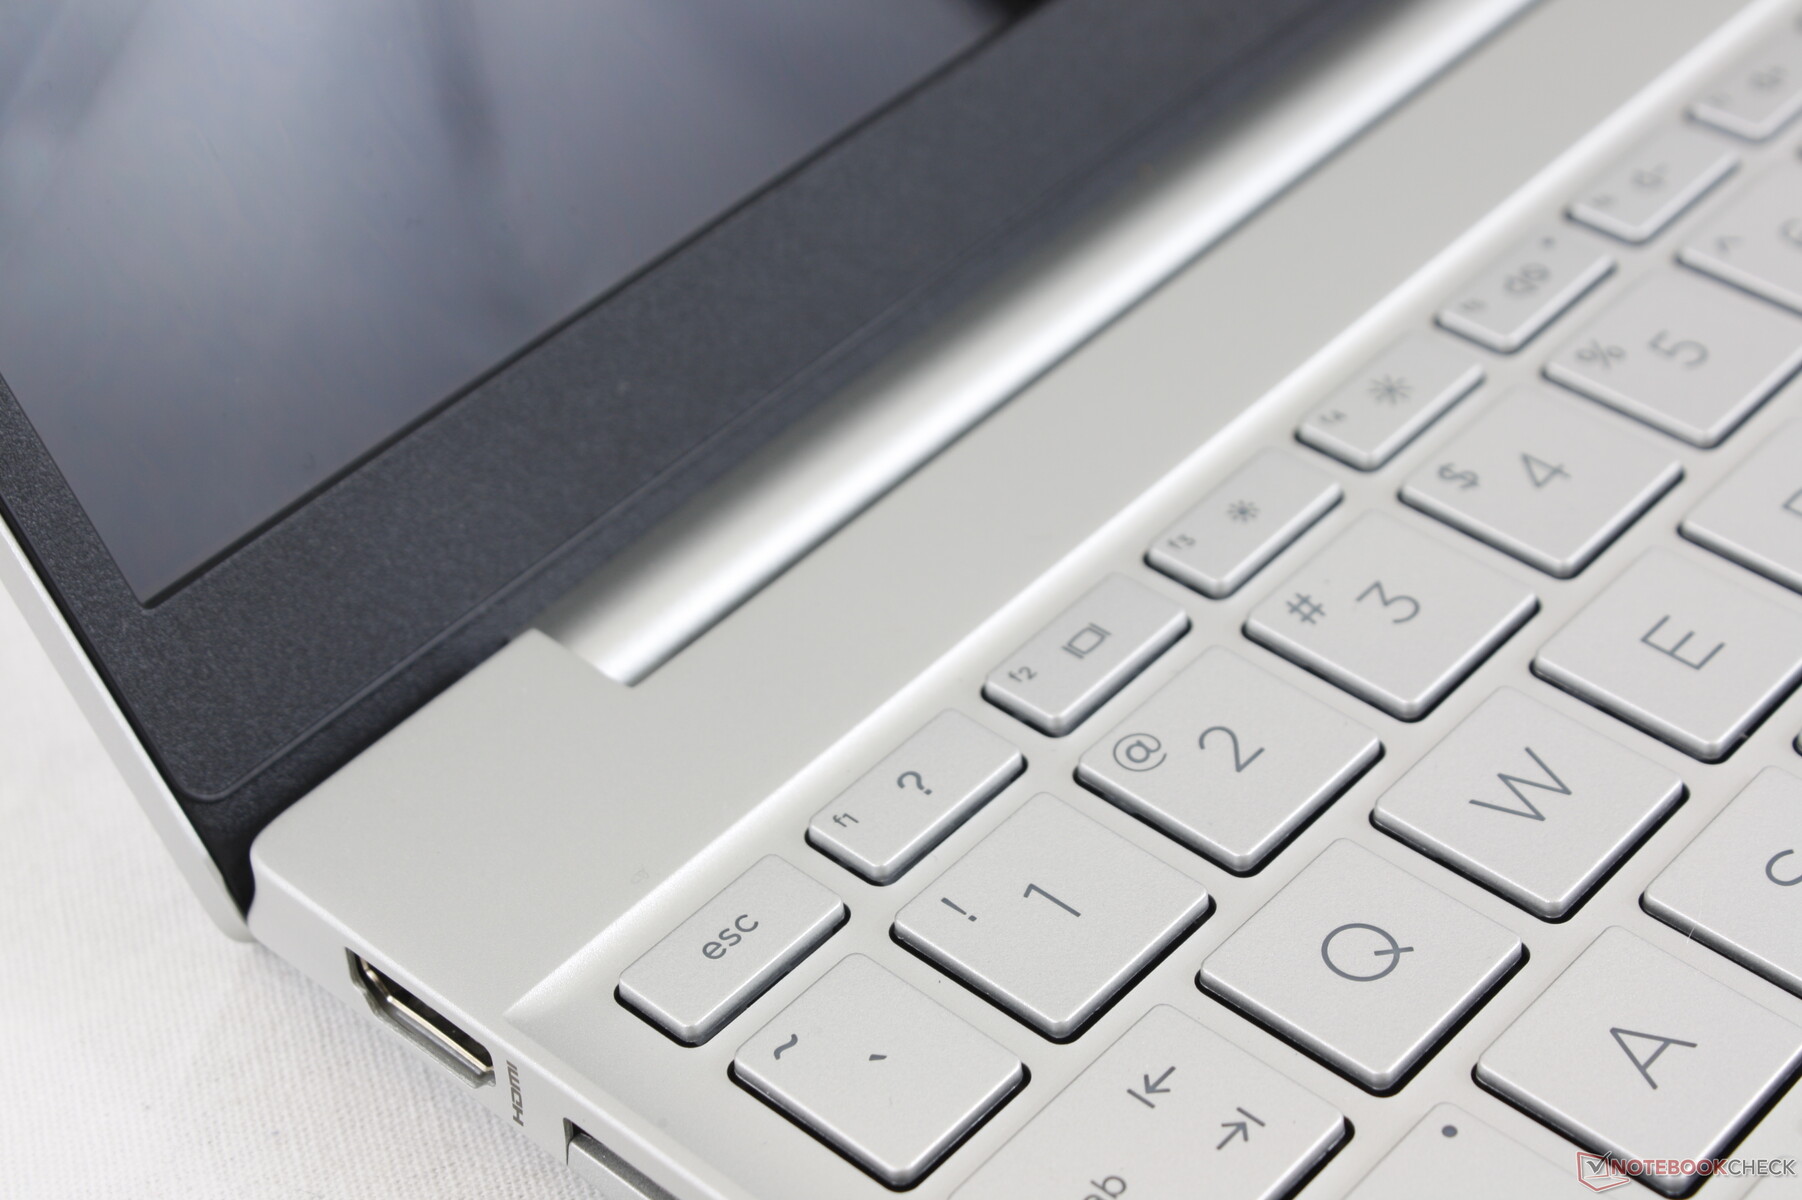
Port options are plentiful for a budget 13-inch Ultrabook including multiple USB-A ports and a USB-C port compatible with both DisplayPort and Power Delivery. Even the more expensive 2020 HP Envy 13 doesn't offer an integrated HDMI port unlike on our Pavilion. The main drawback is that Thunderbolt devices are not supported here.
An annoying design feature of the system is the flap covering the two USB-A ports. Since the flaps are so narrow, it's difficult to open them up and connect the cables without first lifting the entire laptop off the table. Still, we suppose this is better than not having any USB-A ports at all.
SD Card Reader
| SD Card Reader | |
| average JPG Copy Test (av. of 3 runs) | |
| Dell XPS 13 9300 i5 FHD (Toshiba Exceria Pro M501 64 GB UHS-II) | |
| HP Pavilion 13-bb0015cl (Toshiba Exceria Pro M501 32 GB UHS-II) | |
| HP Envy 13-ba0001ng (Toshiba Exceria Pro M501 microSDXC 64GB) | |
| Asus VivoBook S13 S330UA-EY034T (Toshiba Exceria Pro M501 64 GB UHS-II) | |
| maximum AS SSD Seq Read Test (1GB) | |
| Dell XPS 13 9300 i5 FHD (Toshiba Exceria Pro M501 64 GB UHS-II) | |
| HP Pavilion 13-bb0015cl (Toshiba Exceria Pro M501 32 GB UHS-II) | |
| HP Envy 13-ba0001ng (Toshiba Exceria Pro M501 microSDXC 64GB) | |
| Asus VivoBook S13 S330UA-EY034T (Toshiba Exceria Pro M501 64 GB UHS-II) | |
Communication
The Intel AX201 comes standard for Wi-Fi 6 connectivity and Bluetooth 5.1. We experienced no connection issues when paired to our Netgear RAX200 test router.
Webcam


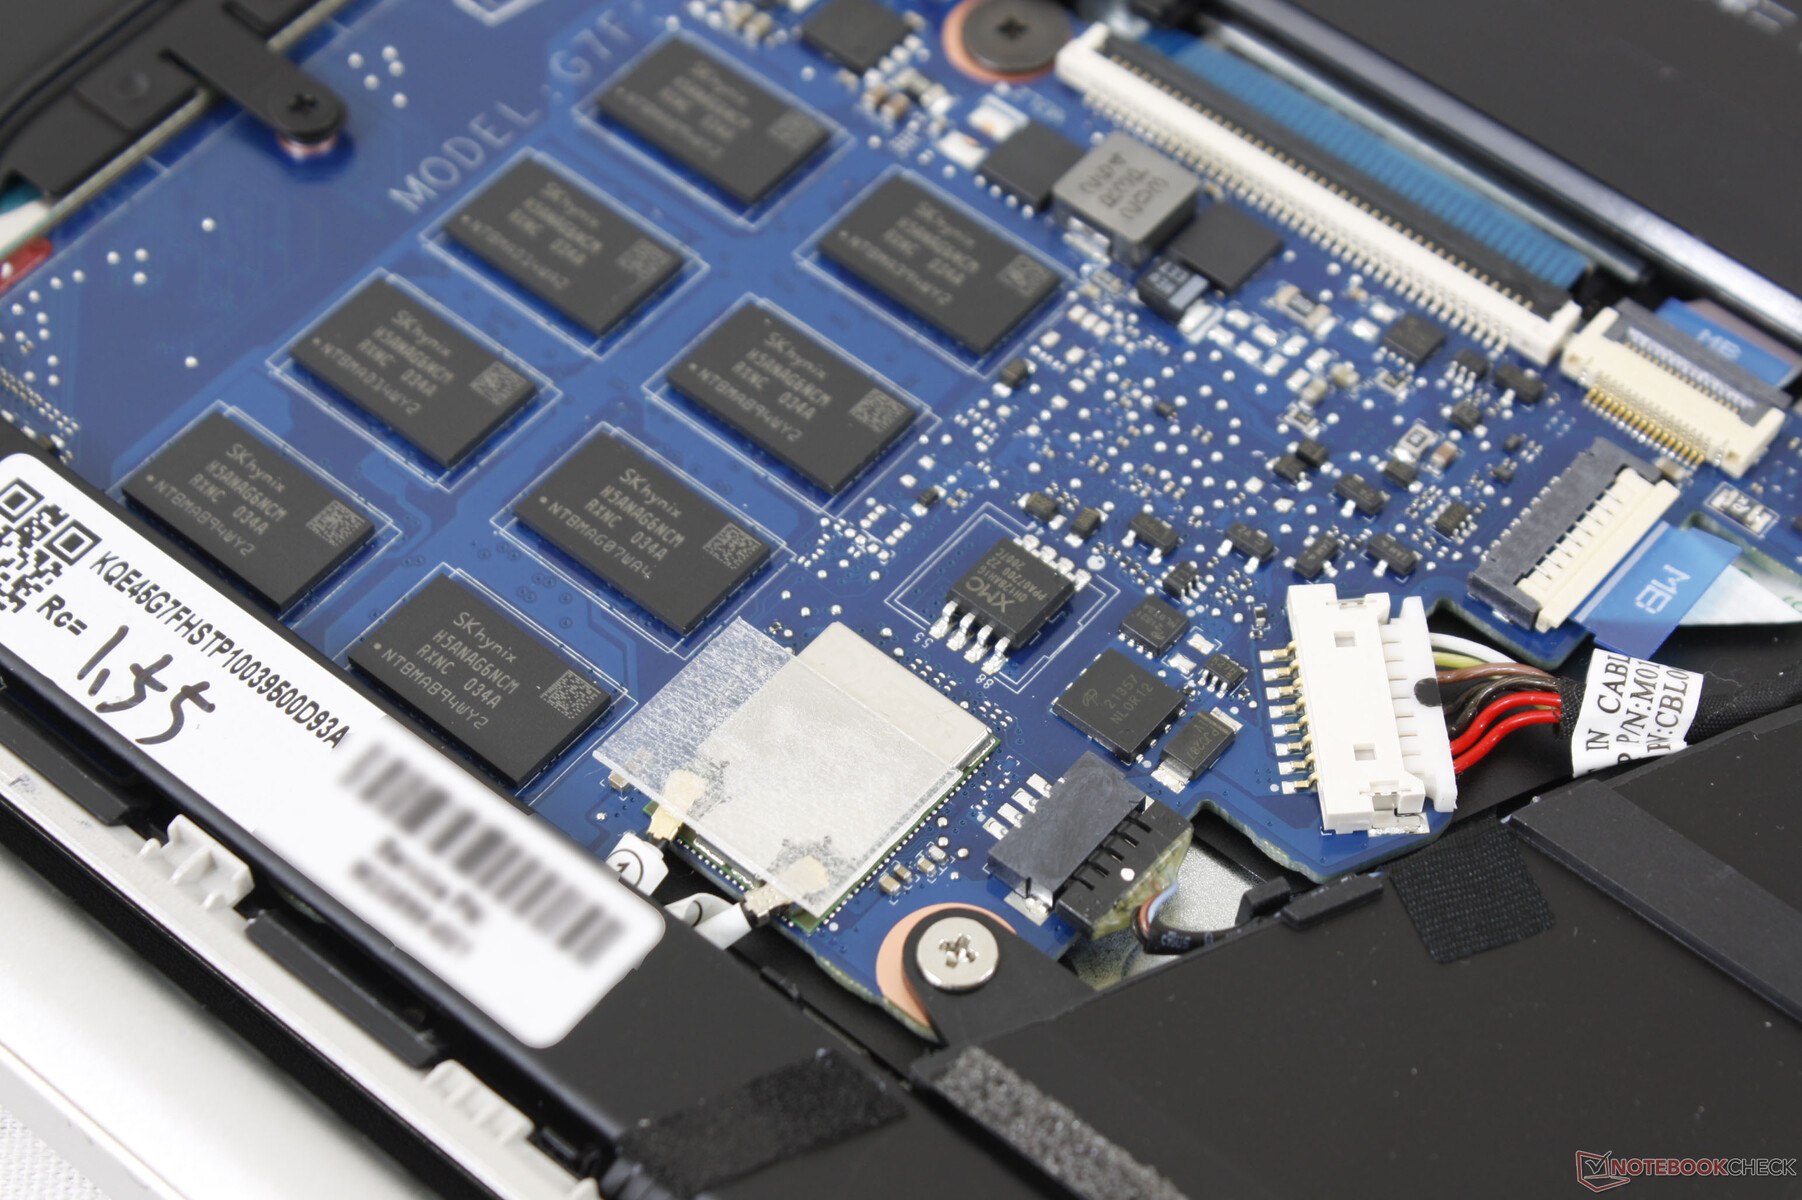
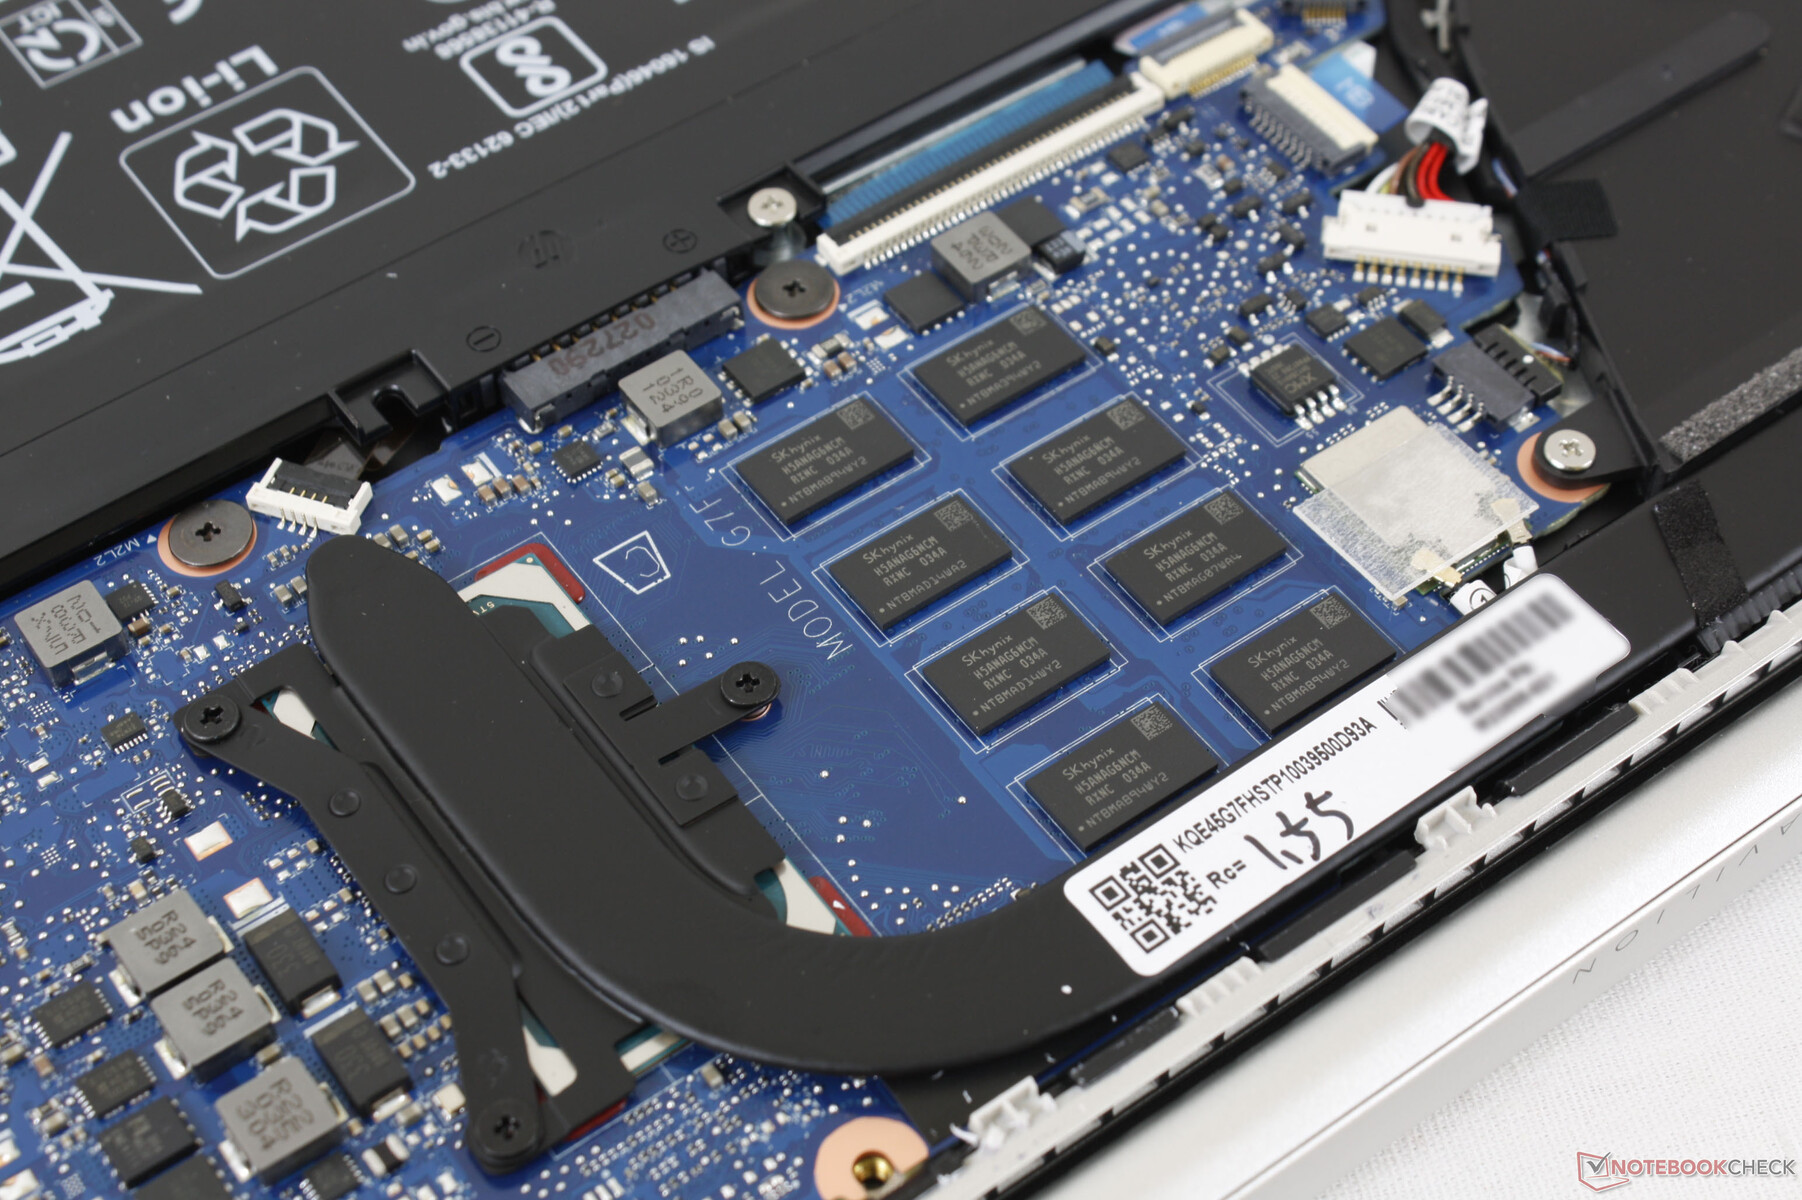
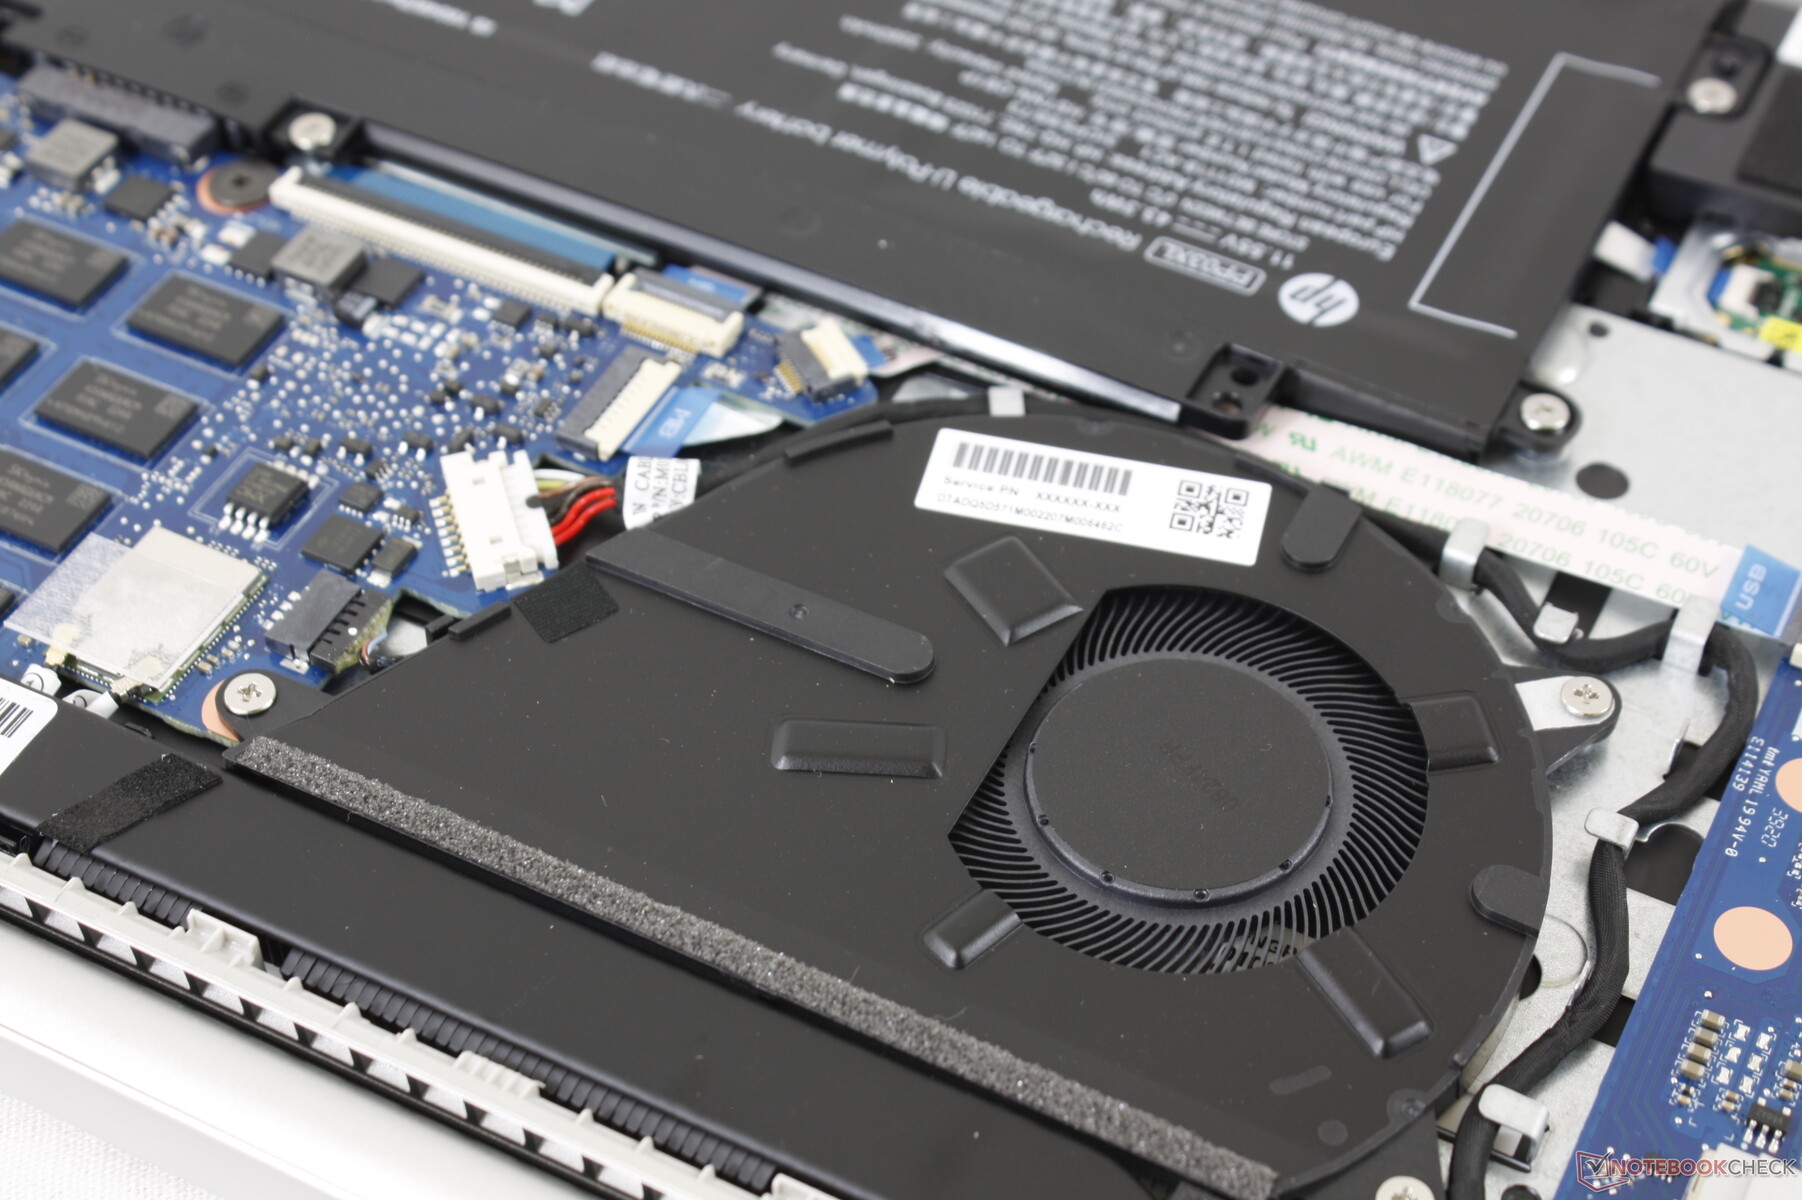
Maintenance
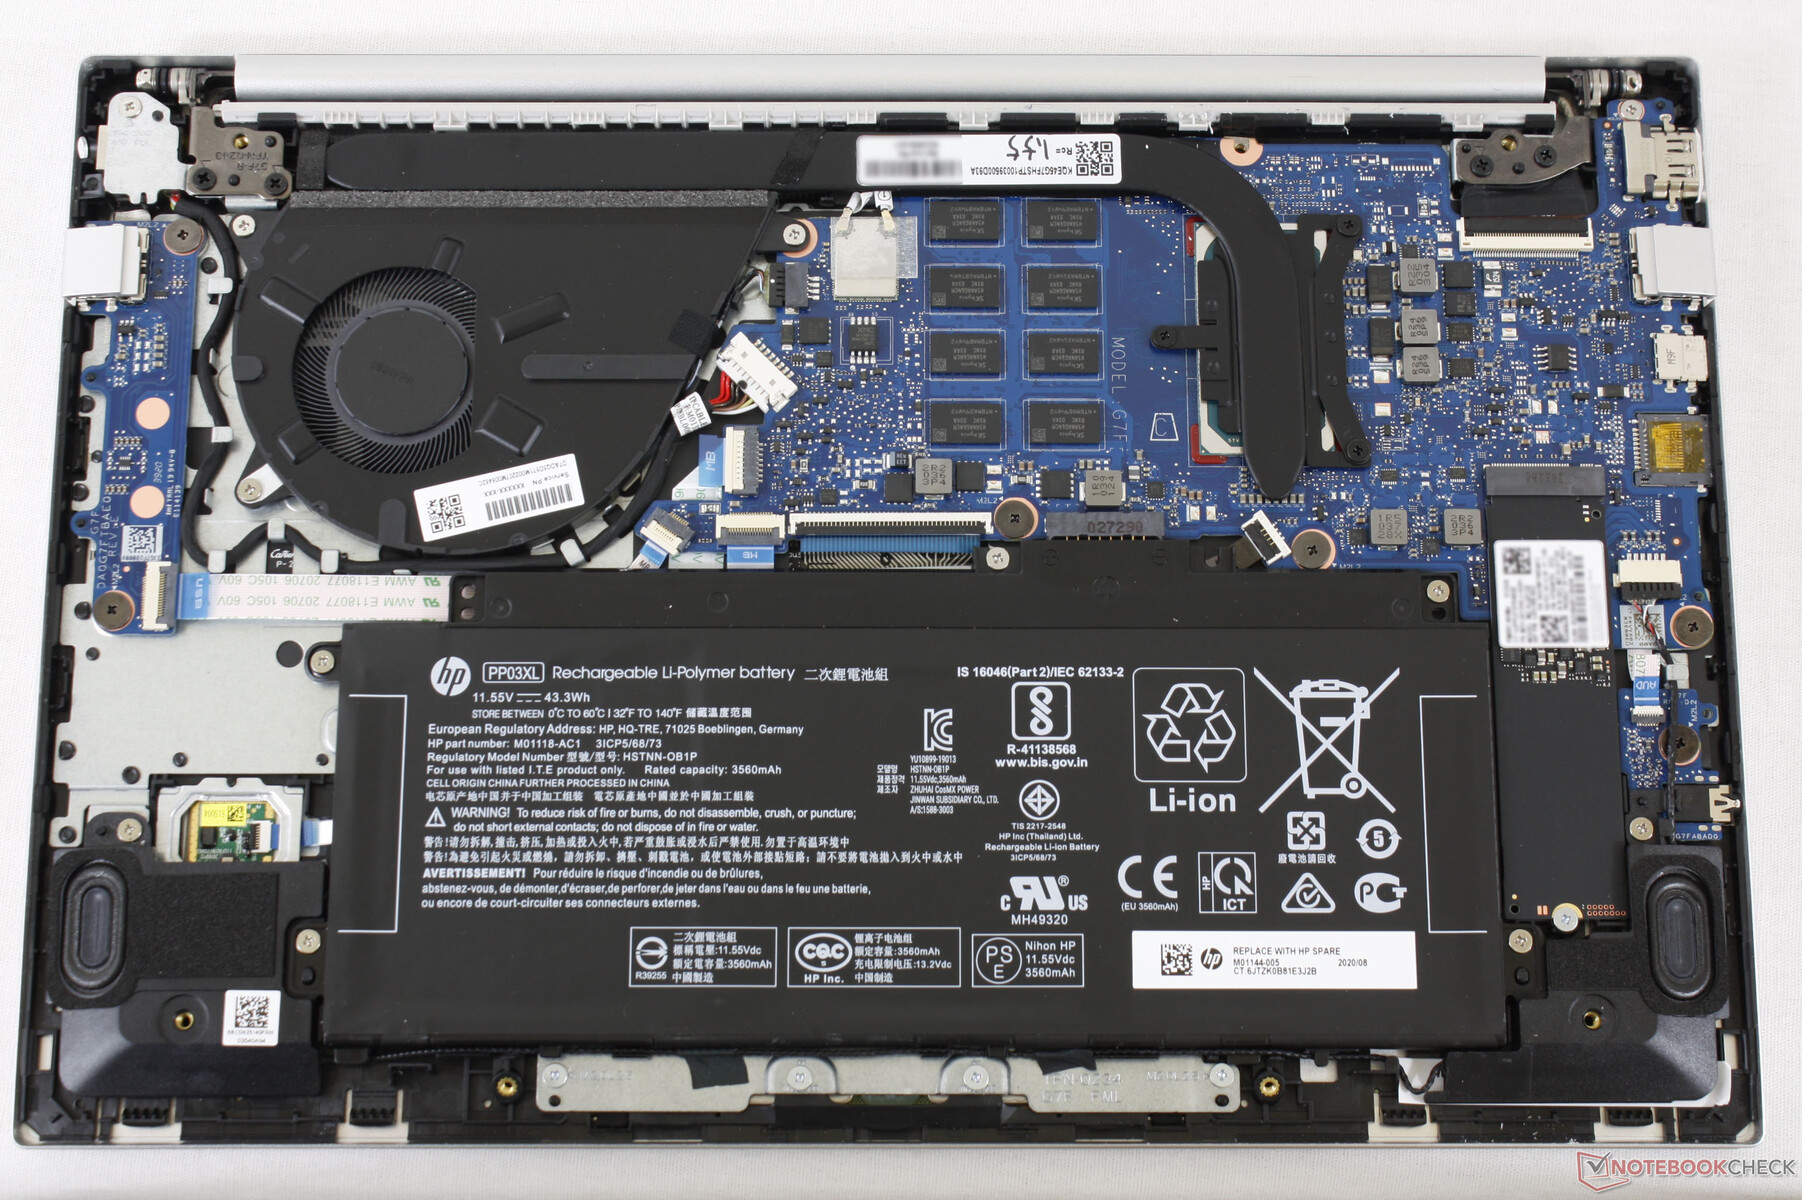
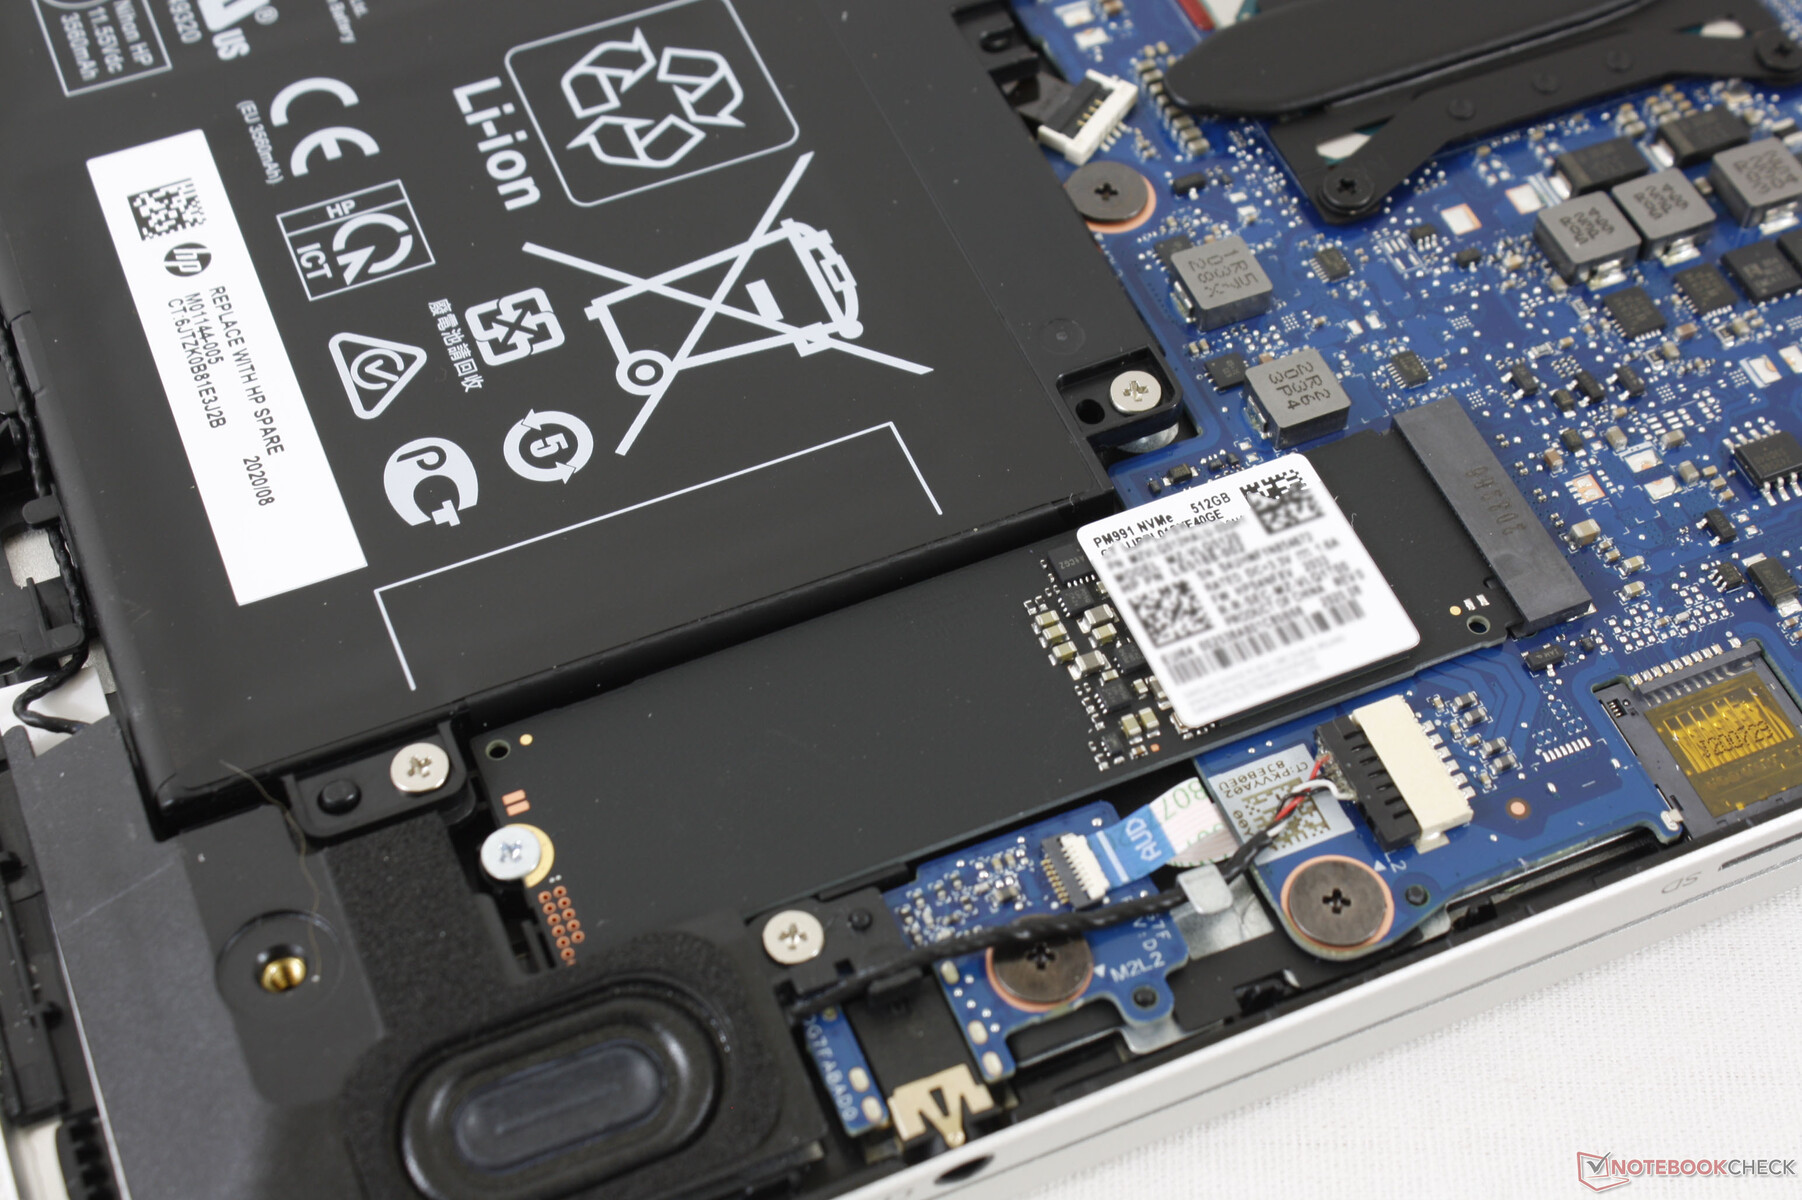
The bottom panel is not easy to remove as there are three hidden screws underneath the rear rubber feet plus two more hidden screws underneath the front feet. The edges and corners are tightly latched as well. There isn't much to upgrade once inside as both RAM and WLAN are soldered.
Accessories and Warranty
There are no extras in the box other than the paperwork and AC adapter. The standard one-year limited warranty applies with extension options if purchased from HP.
Input Devices
Keyboard
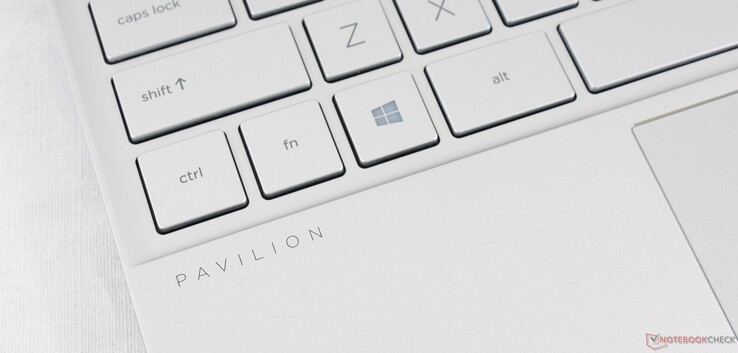
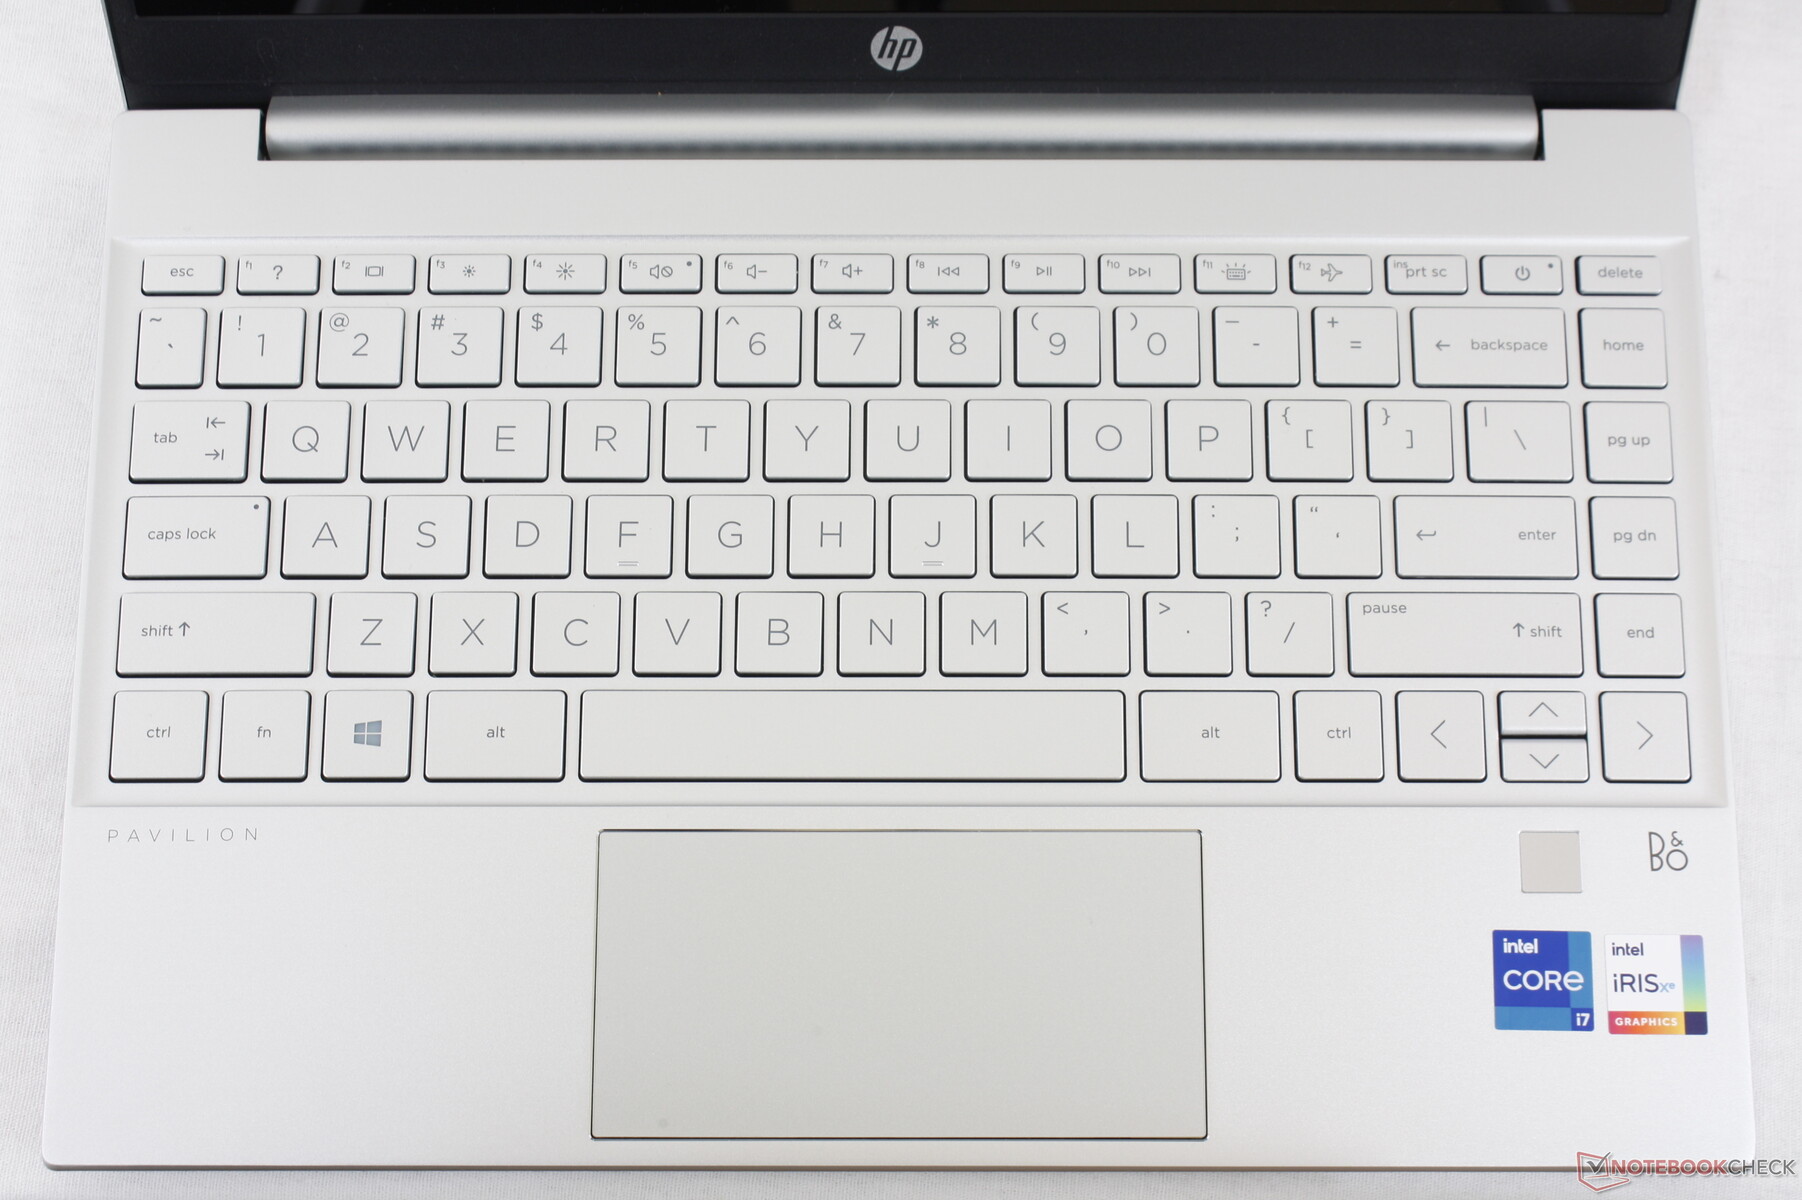
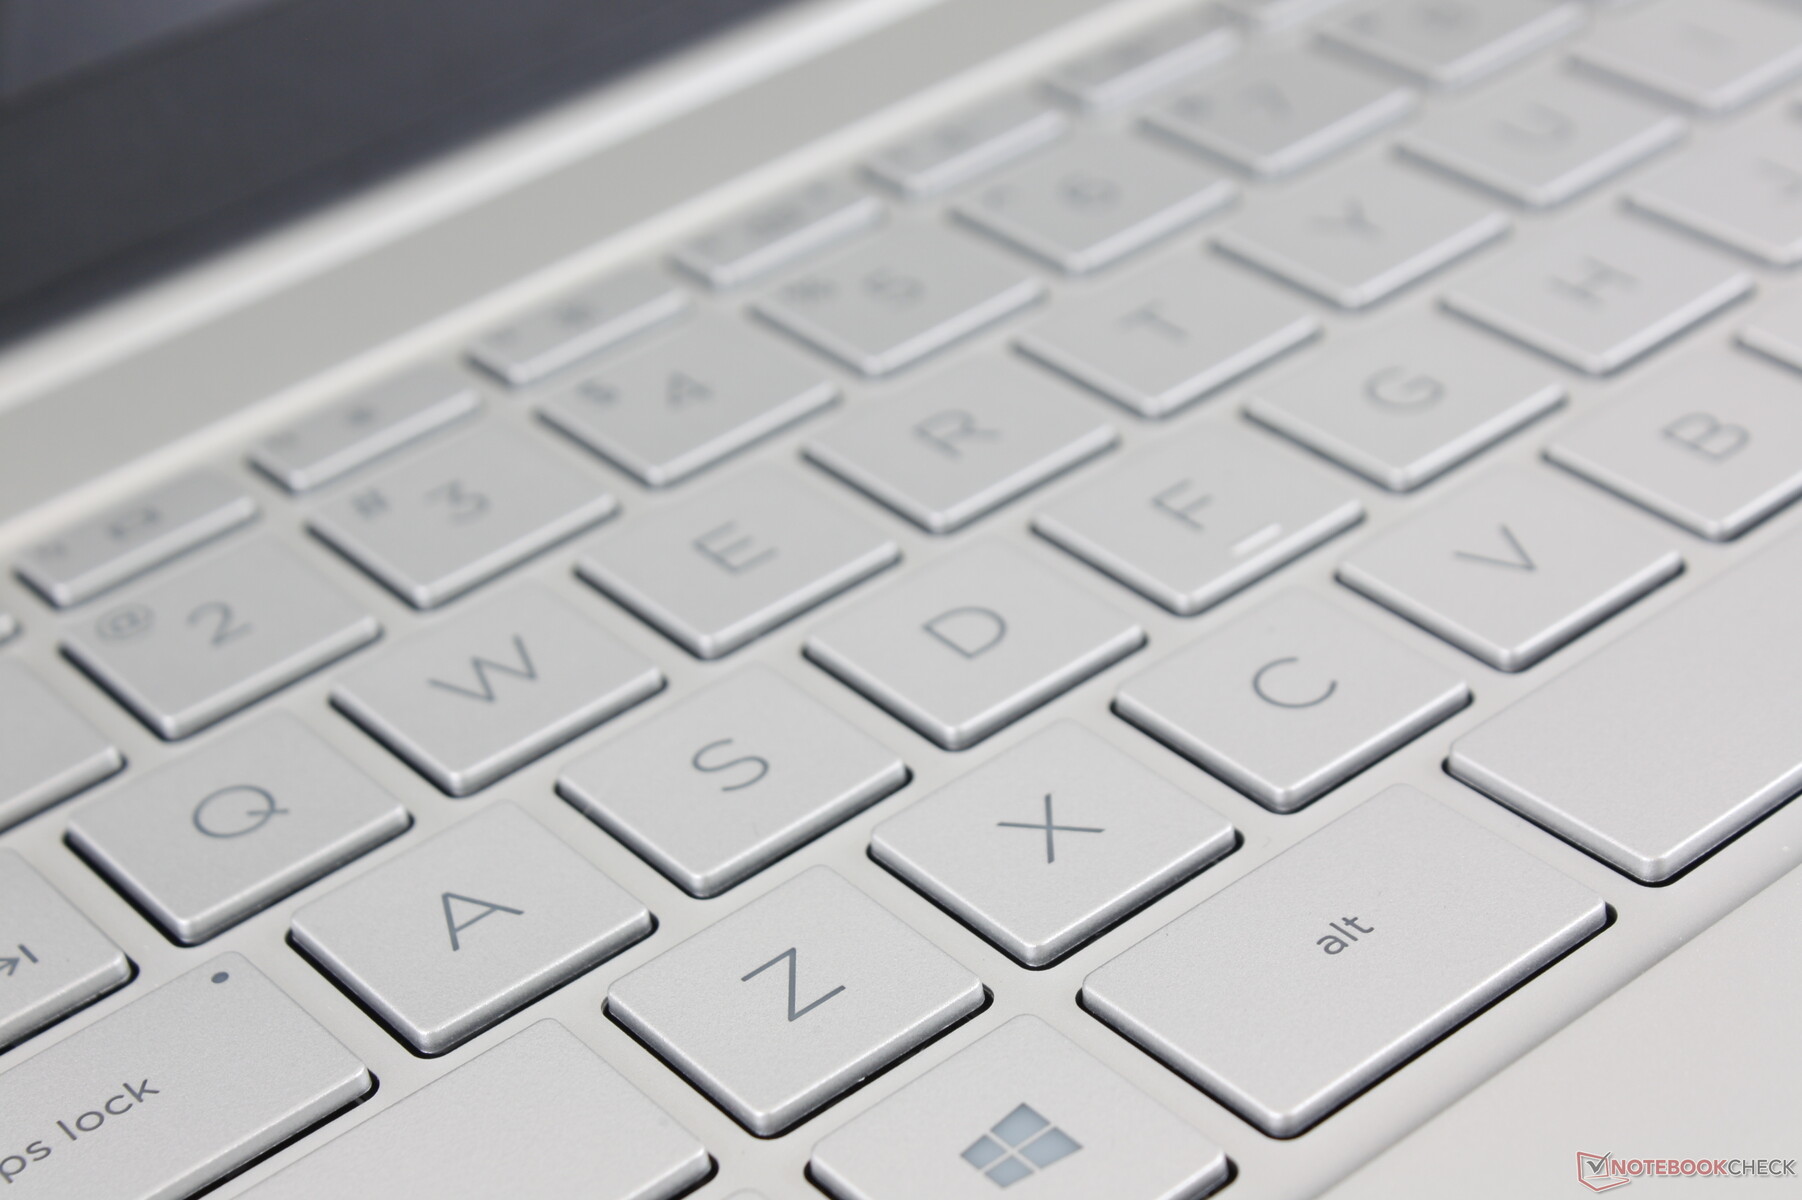
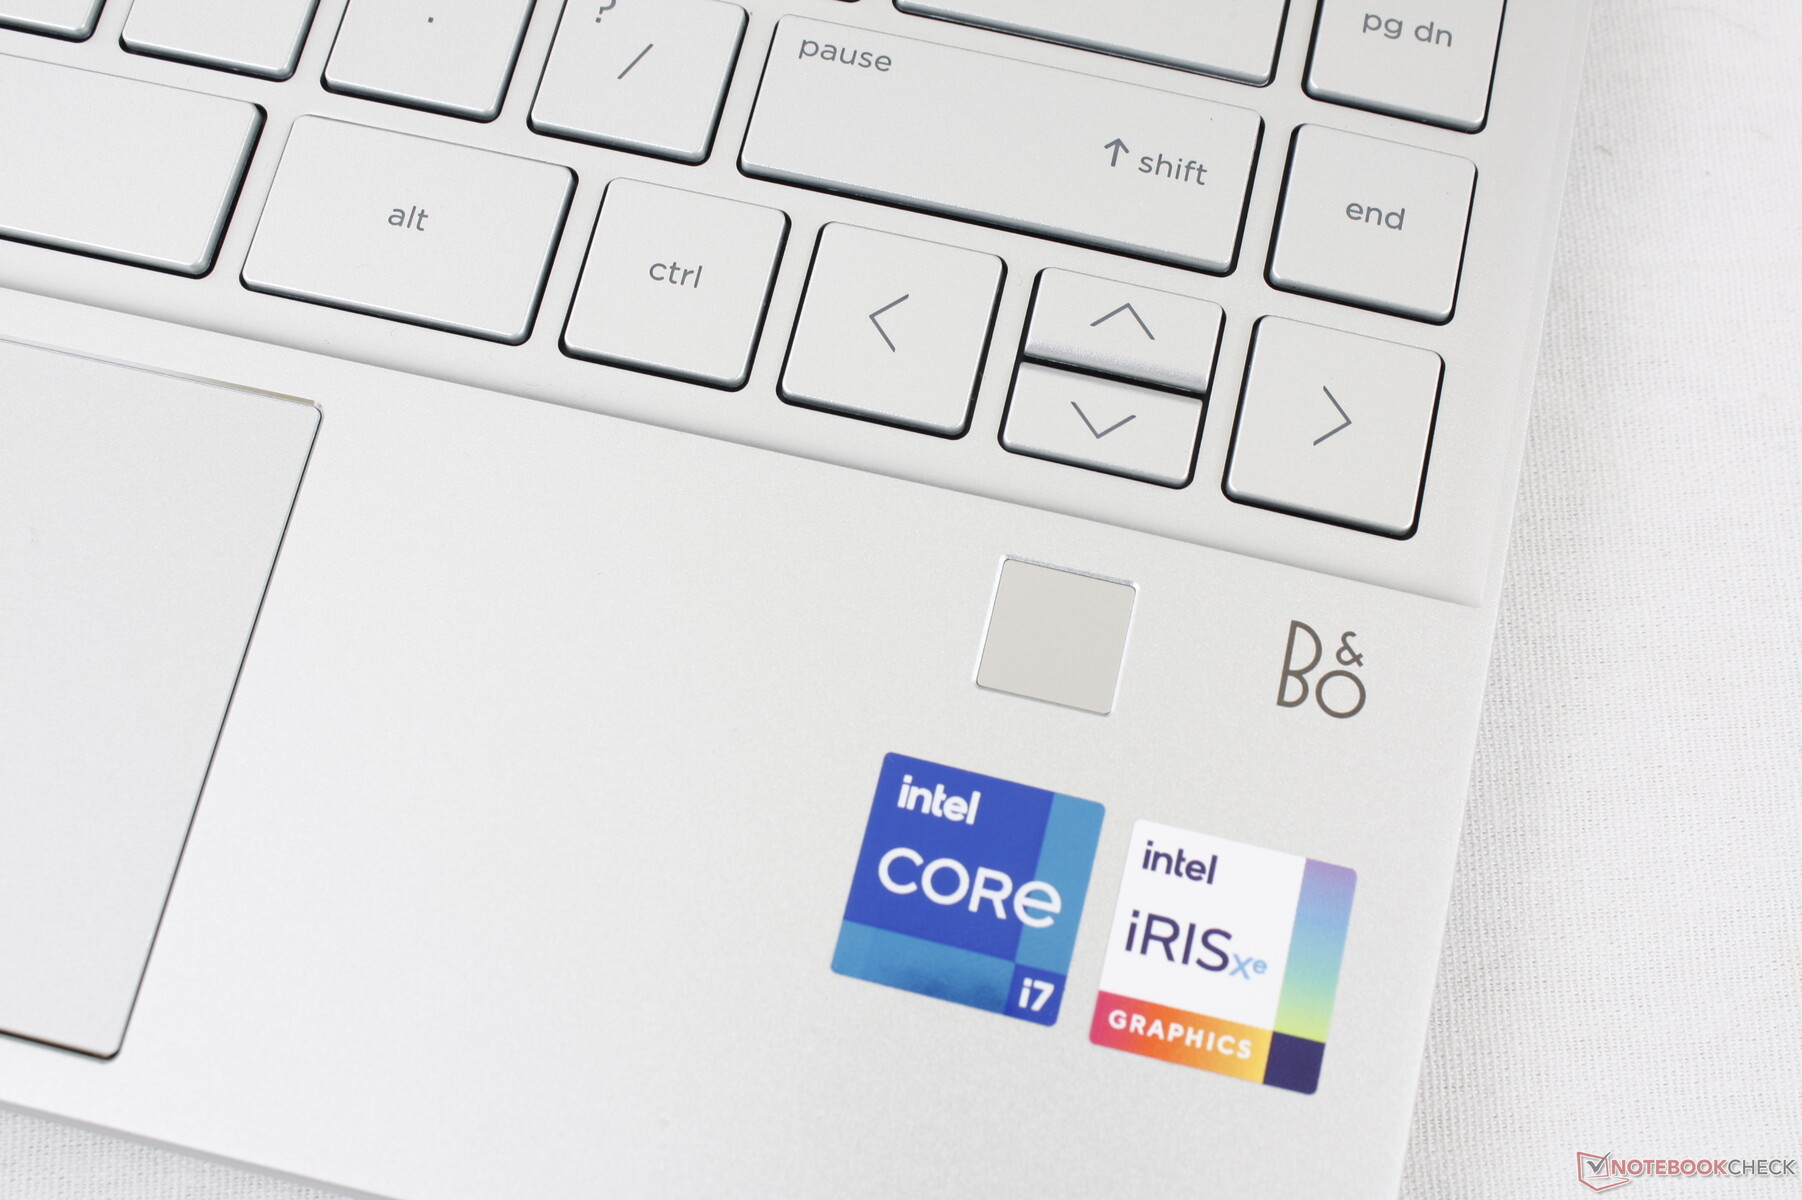
Key feedback and general layout are identical to the new Envy 13. The major difference lies in the positioning of the fingerprint reader as the one on our Pavilion is smaller and with its own dedicated space on the palm rest whereas the fingerprint reader on the Envy 13 replaces the right Ctrl key.
The typing experience is close to the Spectre 13 but not quite. Key feedback and travel is slightly softer and shallower, respectively, which makes key presses less satisfying. We still find it firmer than the keys on a Lenovo IdeaPad or Yoga.
Touchpad
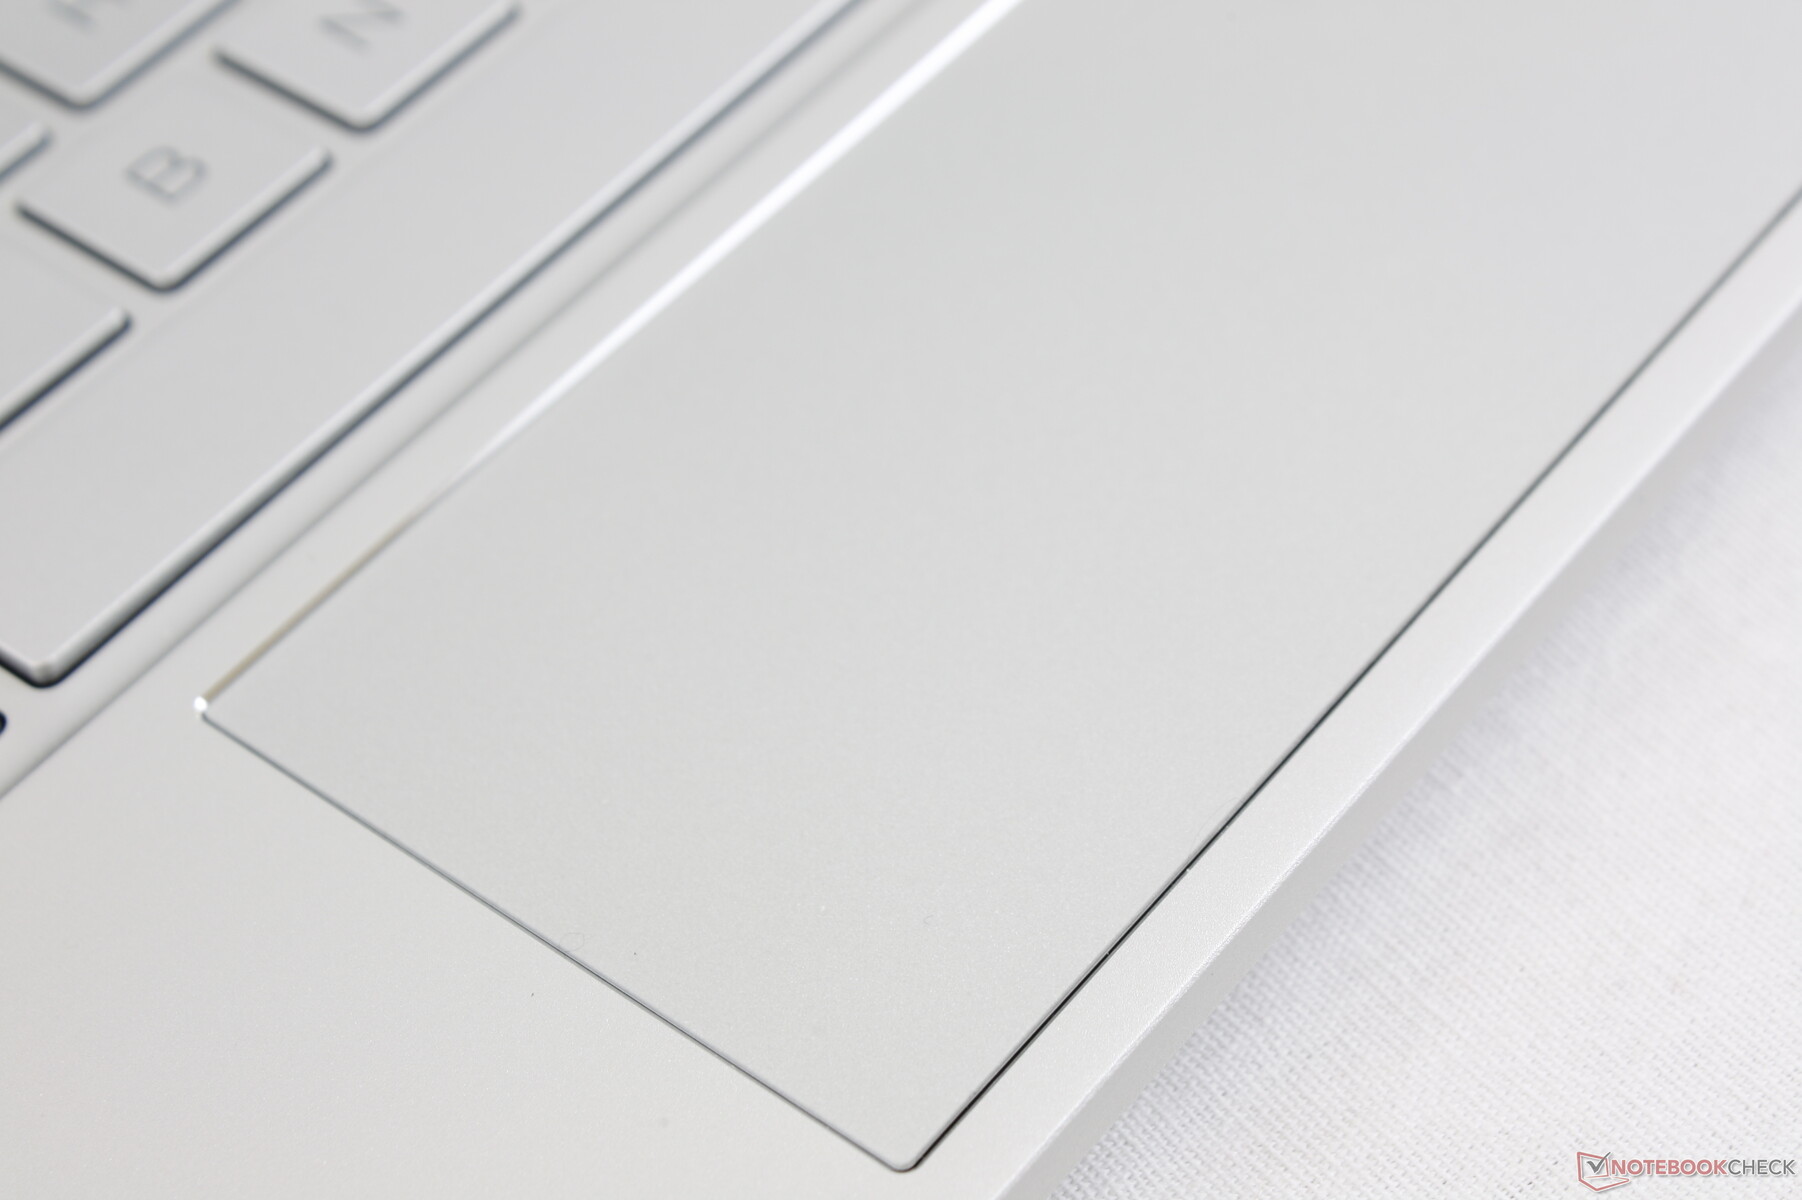
The clickpad is small at 11 x 5.5 cm compared to 11 x 6 cm on the Envy x360 13. Cursor control is smooth and reliable with only a bit of sticking if gliding at slower speeds.
Clicking with the clickpad could have been more comfortable as feedback is spongy and travel is shallow. Additionally, it takes quite a bit of force to push down on the surface while the narrow dimensions make it more difficult to use for long sessions. Perhaps shifting the keyboard upwards to make room for a squarer clickpad could improve its usability.
Display
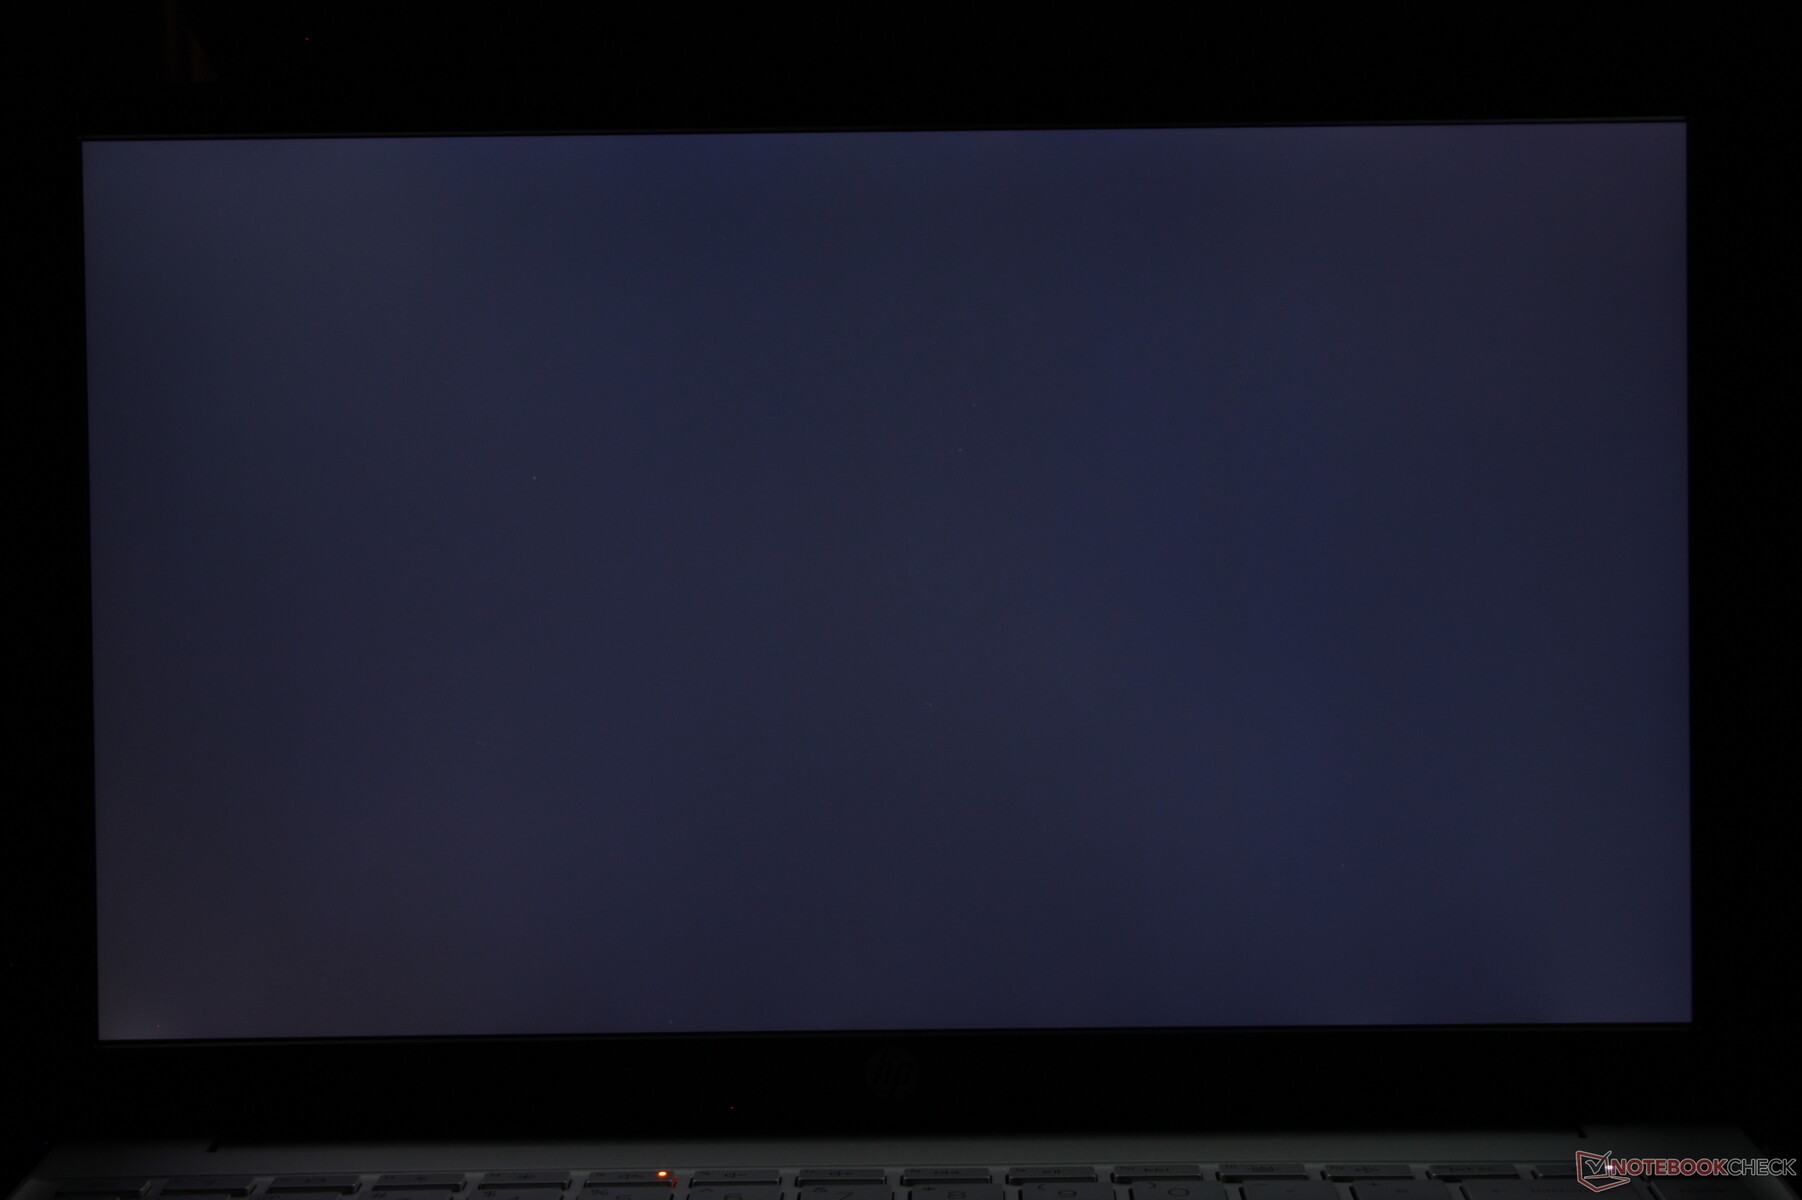
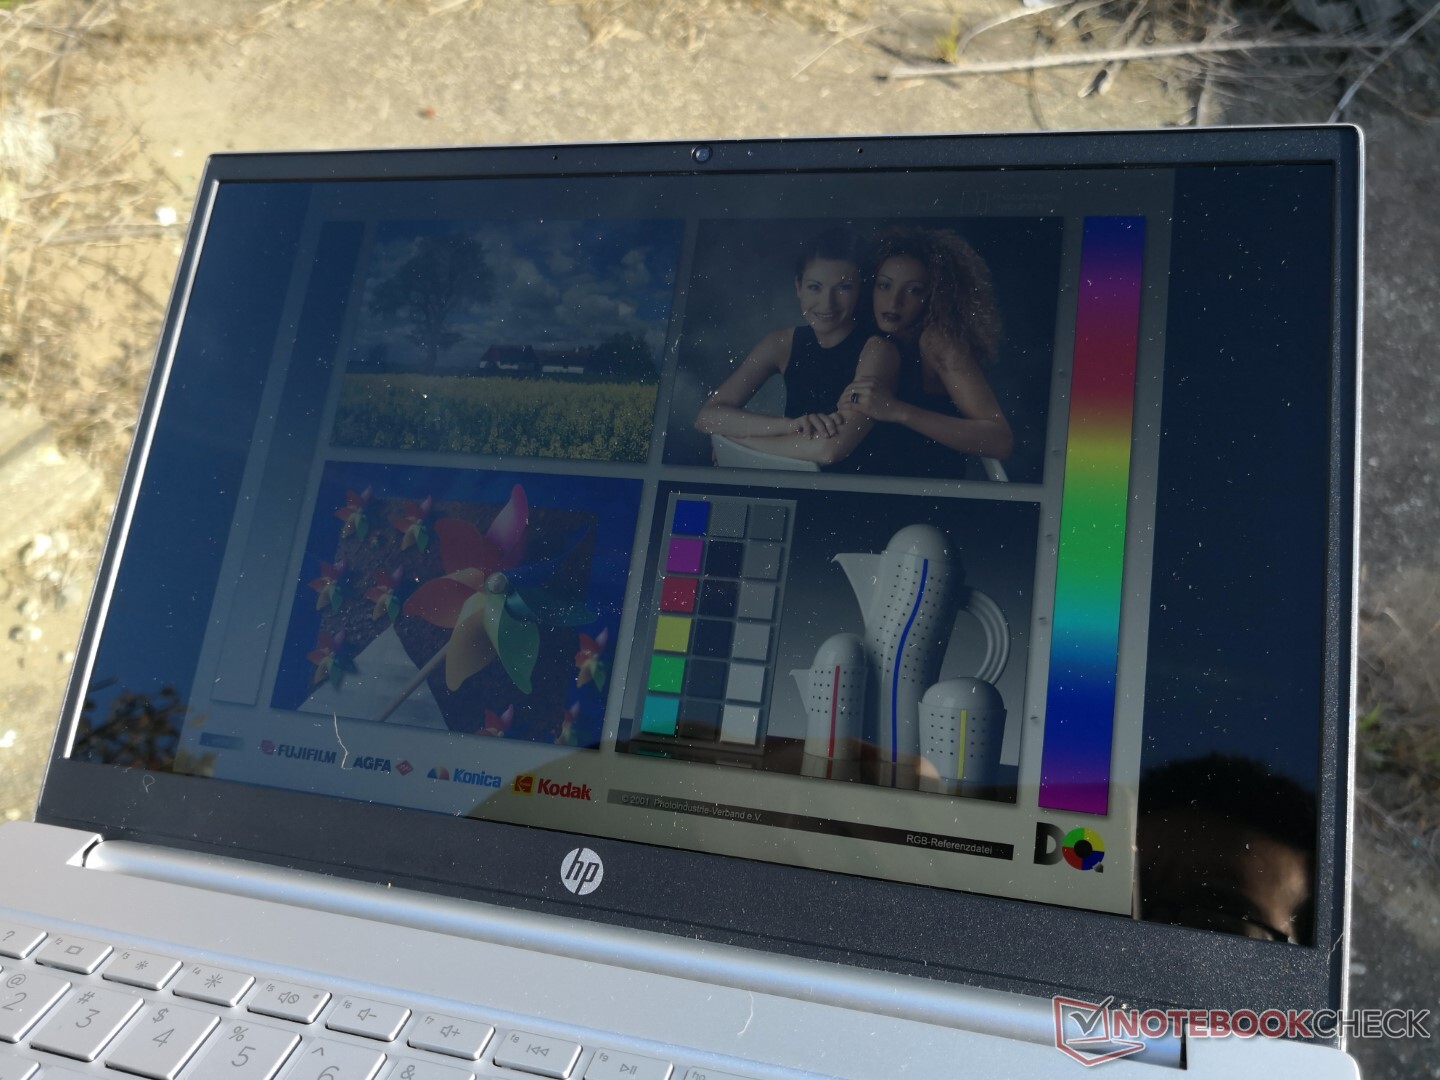
The 4K UHD panel is impressive considering that the Pavilion 13 is a budget-oriented laptop. We're able to measure a maximum brightness of 514 nits against the advertised 550 nits and an excellent contrast ratio to rival pricier flagship Ultrabooks like the XPS 13, Spectre 13, ZenBook S13, or Lenovo Yoga 9i. A key drawback to the display is its slow black-white and gray-gray response times for noticeable ghosting especially if running fast-paced games.
HWiNFO is unable to recognize the exact panel name other than the AU Optronics AUOCA8D controller. No other laptop in our database sports the same display controller.
Keep in mind that our measurements below reflect only the 4K UHD panel and not the inferior 250-nit 1080p panel which will be different in terms of colors, response times, contrast and more.

| |||||||||||||||||||||||||
Brightness Distribution: 91 %
Center on Battery: 514.1 cd/m²
Contrast: 1389:1 (Black: 0.37 cd/m²)
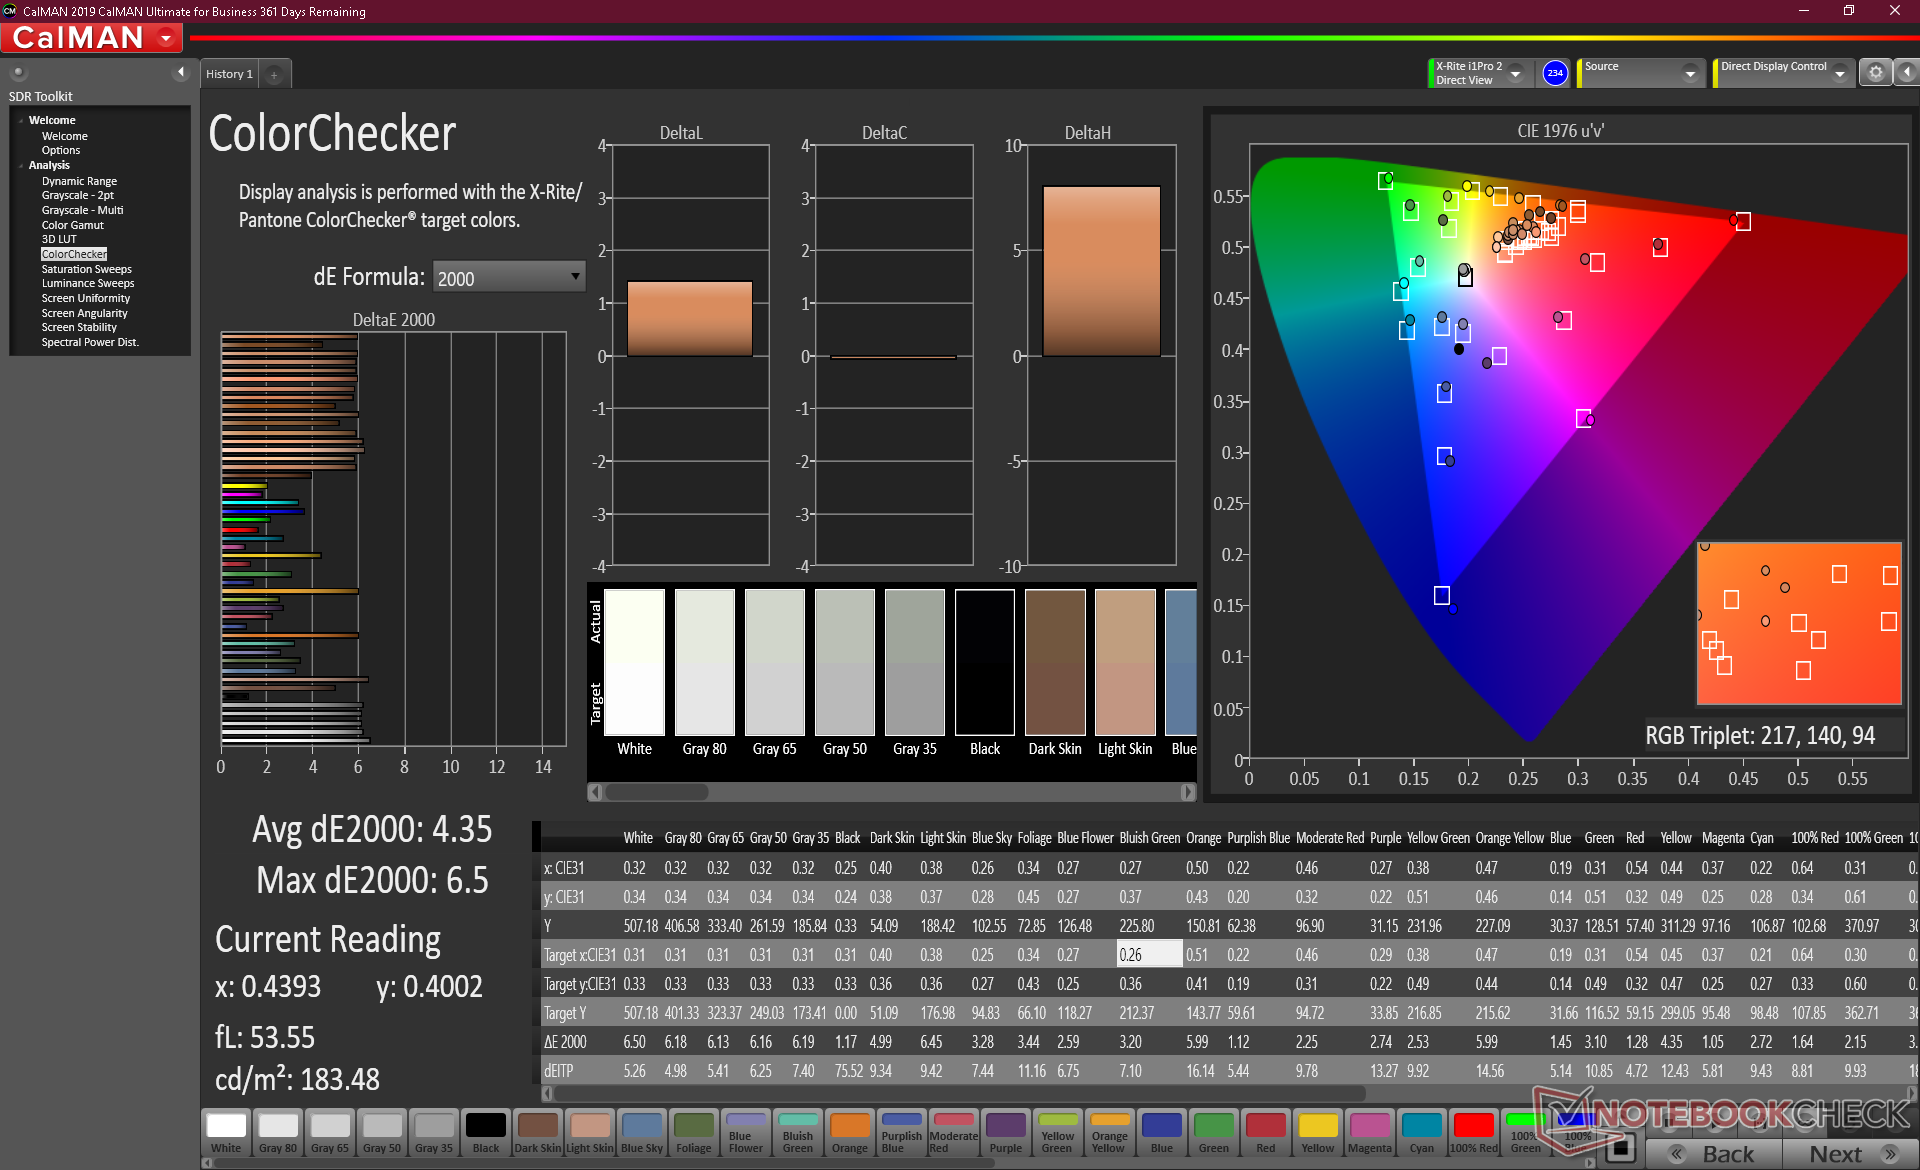
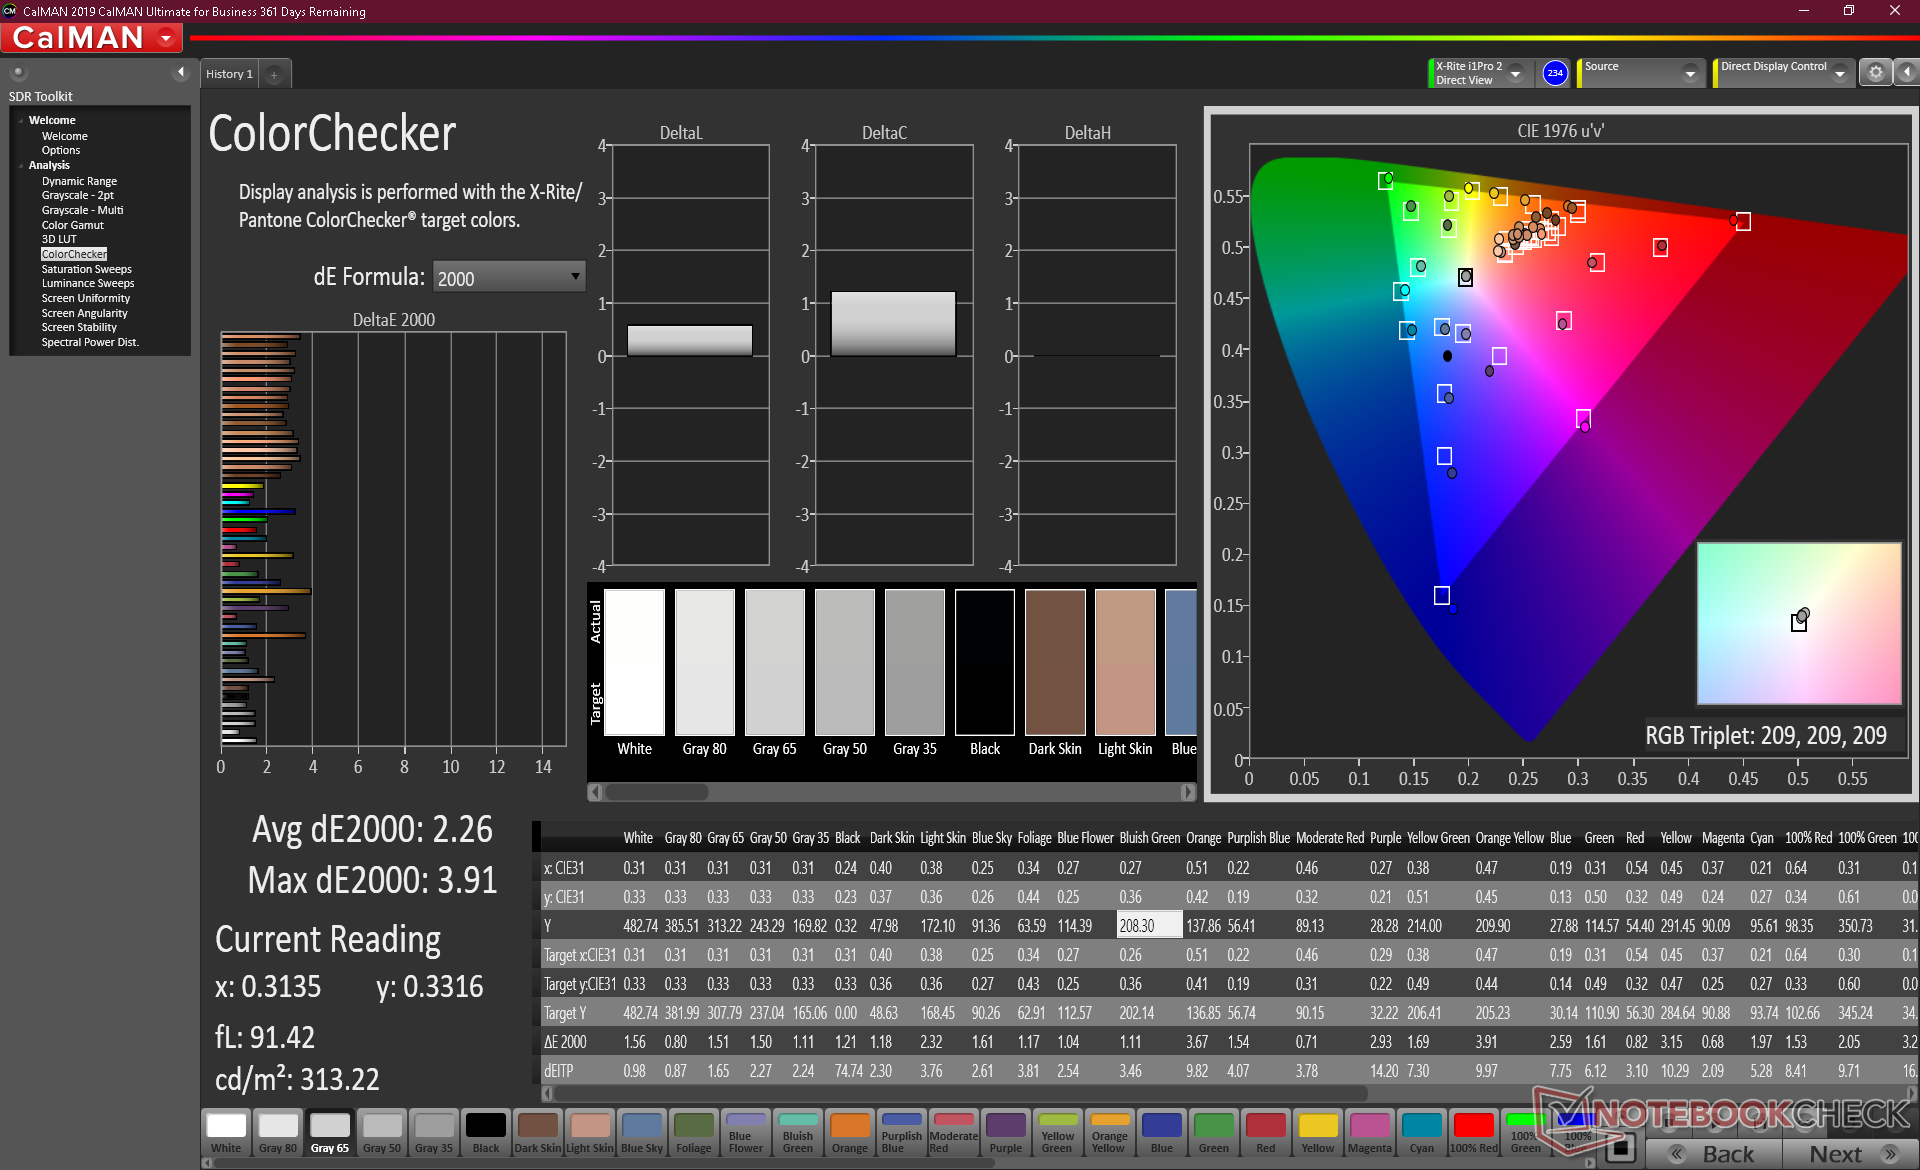
ΔE ColorChecker Calman: 4.35 | ∀{0.5-29.43 Ø4.75}
calibrated: 2.26
ΔE Greyscale Calman: 5.2 | ∀{0.09-98 Ø5}
93.3% sRGB (Argyll 1.6.3 3D)
60.6% AdobeRGB 1998 (Argyll 1.6.3 3D)
66.5% AdobeRGB 1998 (Argyll 3D)
93.4% sRGB (Argyll 3D)
65% Display P3 (Argyll 3D)
Gamma: 2.12
CCT: 6308 K
| HP Pavilion 13-bb0015cl AUOCA8D, IPS, 13.3", 3840x2160 | HP Envy 13-ba0001ng AU Optronics AUO3A8C, IPS, 13.3", 1920x1080 | Dell XPS 13 9300 i5 FHD SHP14CB, IPS, 13.4", 1920x1200 | Asus VivoBook S13 S330UA-EY034T N133HCE-EAA, IPS LED, 13.3", 1920x1080 | Lenovo IdeaPad S540-13ARE-82DL000YGE Chi Mei CMN13B0 (N133GCA-GQ1), IPS, 13.3", 2560x1600 | Acer Swift 3 SF313-52-71Y7 BOE, NE135FBM-N41, IPS, 13.5", 2256x1504 | |
|---|---|---|---|---|---|---|
| Display | 4% | 9% | -34% | 0% | 7% | |
| Display P3 Coverage (%) | 65 | 67.1 3% | 71.5 10% | 42.16 -35% | 64.2 -1% | 70.1 8% |
| sRGB Coverage (%) | 93.4 | 99.1 6% | 99.4 6% | 63.2 -32% | 95.7 2% | 99.8 7% |
| AdobeRGB 1998 Coverage (%) | 66.5 | 69.2 4% | 73.5 11% | 43.59 -34% | 66 -1% | 71.2 7% |
| Response Times | 11% | 3% | 26% | 41% | 10% | |
| Response Time Grey 50% / Grey 80% * (ms) | 52.4 ? | 56 ? -7% | 60 ? -15% | 40.8 ? 22% | 33 ? 37% | 55 ? -5% |
| Response Time Black / White * (ms) | 41.6 ? | 30 ? 28% | 33.2 ? 20% | 29.6 ? 29% | 23 ? 45% | 31 ? 25% |
| PWM Frequency (Hz) | 2500 ? | 26040 ? | 208 ? | |||
| Screen | 32% | 13% | -42% | -0% | 8% | |
| Brightness middle (cd/m²) | 514.1 | 466 -9% | 619 20% | 280 -46% | 321 -38% | 474 -8% |
| Brightness (cd/m²) | 501 | 418 -17% | 591 18% | 265 -47% | 304 -39% | 426 -15% |
| Brightness Distribution (%) | 91 | 85 -7% | 91 0% | 89 -2% | 88 -3% | 82 -10% |
| Black Level * (cd/m²) | 0.37 | 0.215 42% | 0.35 5% | 0.24 35% | 0.32 14% | 0.29 22% |
| Contrast (:1) | 1389 | 2167 56% | 1769 27% | 1167 -16% | 1003 -28% | 1634 18% |
| Colorchecker dE 2000 * | 4.35 | 1.06 76% | 3 31% | 5.6 -29% | 3.41 22% | 2.38 45% |
| Colorchecker dE 2000 max. * | 6.5 | 1.59 76% | 8.2 -26% | 20.7 -218% | 5.88 10% | |
| Colorchecker dE 2000 calibrated * | 2.26 | 1.09 52% | 1 56% | 4.3 -90% | 0.66 71% | 2.69 -19% |
| Greyscale dE 2000 * | 5.2 | 1.3 75% | 5.2 -0% | 4.1 21% | 5.54 -7% | 3.75 28% |
| Gamma | 2.12 104% | 2.39 92% | 2.14 103% | 2.44 90% | 2.33 94% | 2.37 93% |
| CCT | 6308 103% | 6699 97% | 6340 103% | 6614 98% | 6476 100% | 6466 101% |
| Color Space (Percent of AdobeRGB 1998) (%) | 60.6 | 63 4% | 66.9 10% | 40.1 -34% | 61 1% | 65 7% |
| Color Space (Percent of sRGB) (%) | 93.3 | 99 6% | 99.3 6% | 63 -32% | 96 3% | 100 7% |
| Total Average (Program / Settings) | 16% /
24% | 8% /
11% | -17% /
-32% | 14% /
5% | 8% /
8% |
* ... smaller is better
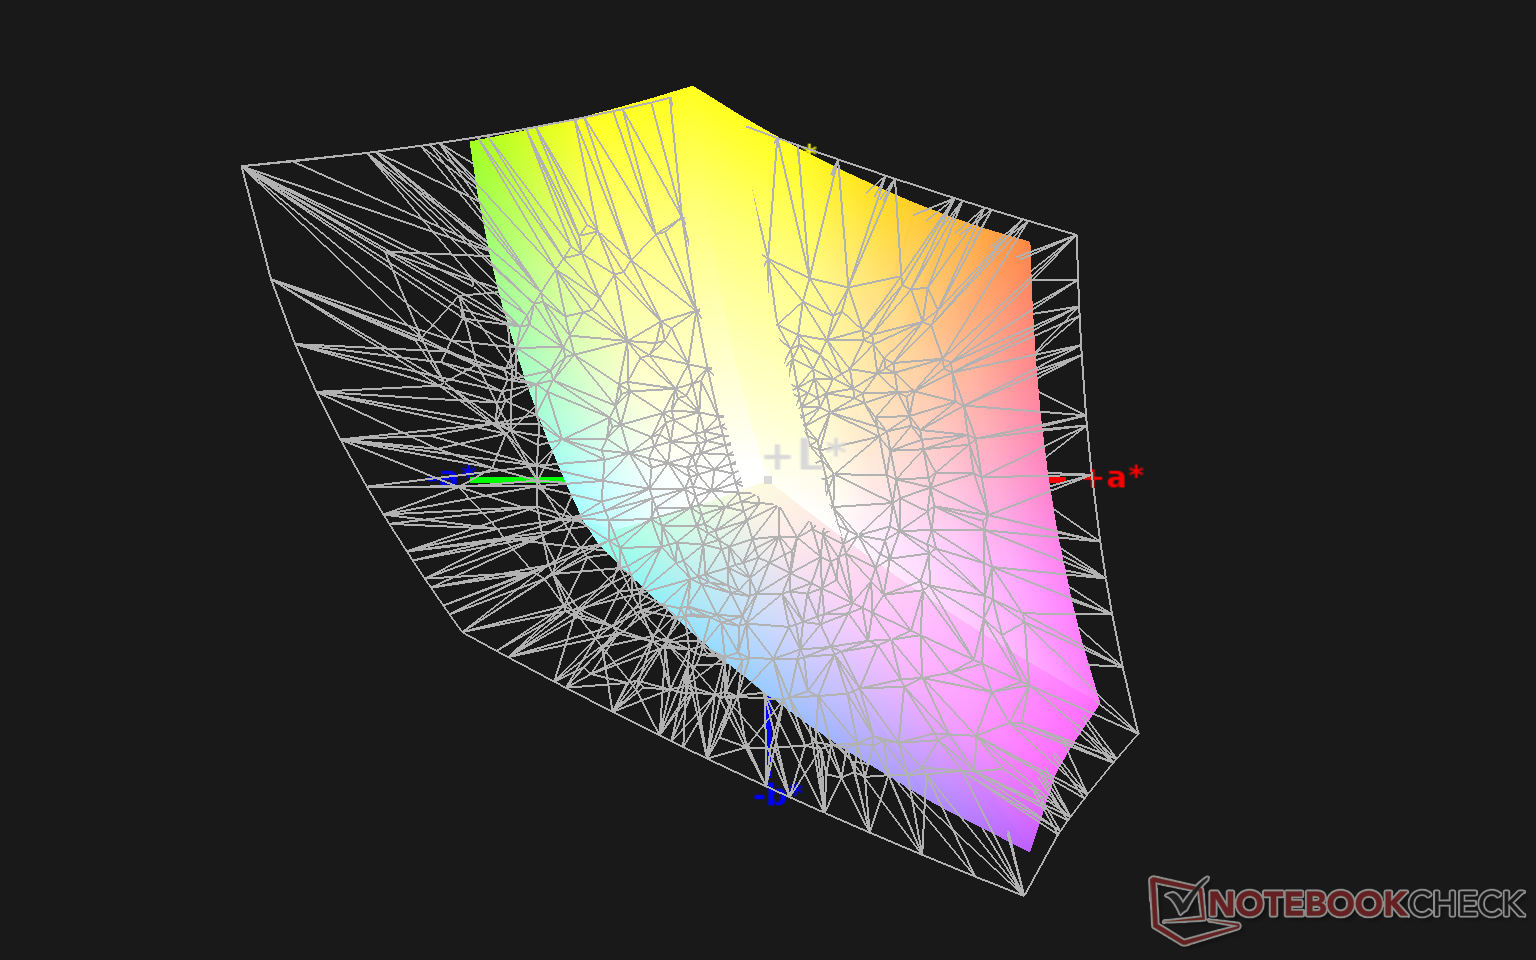
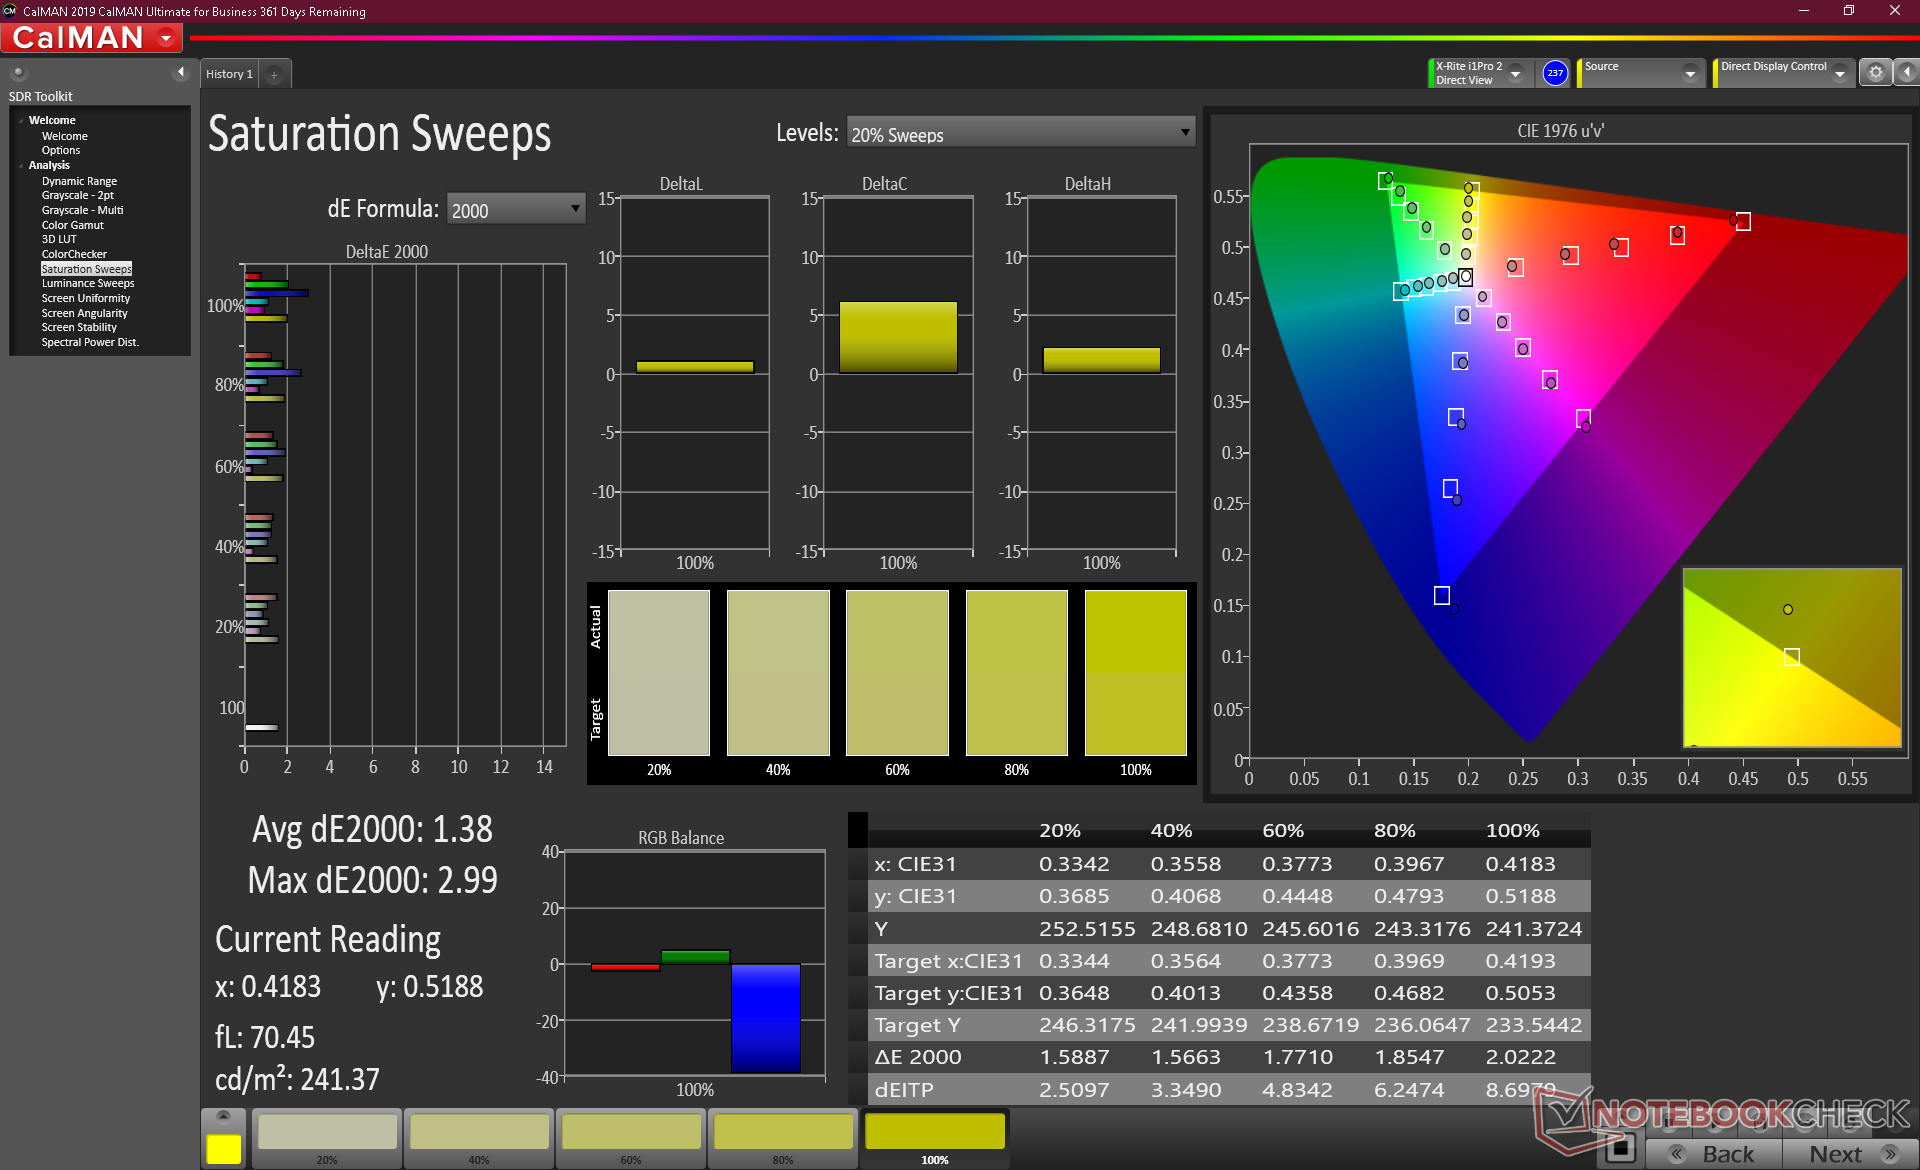
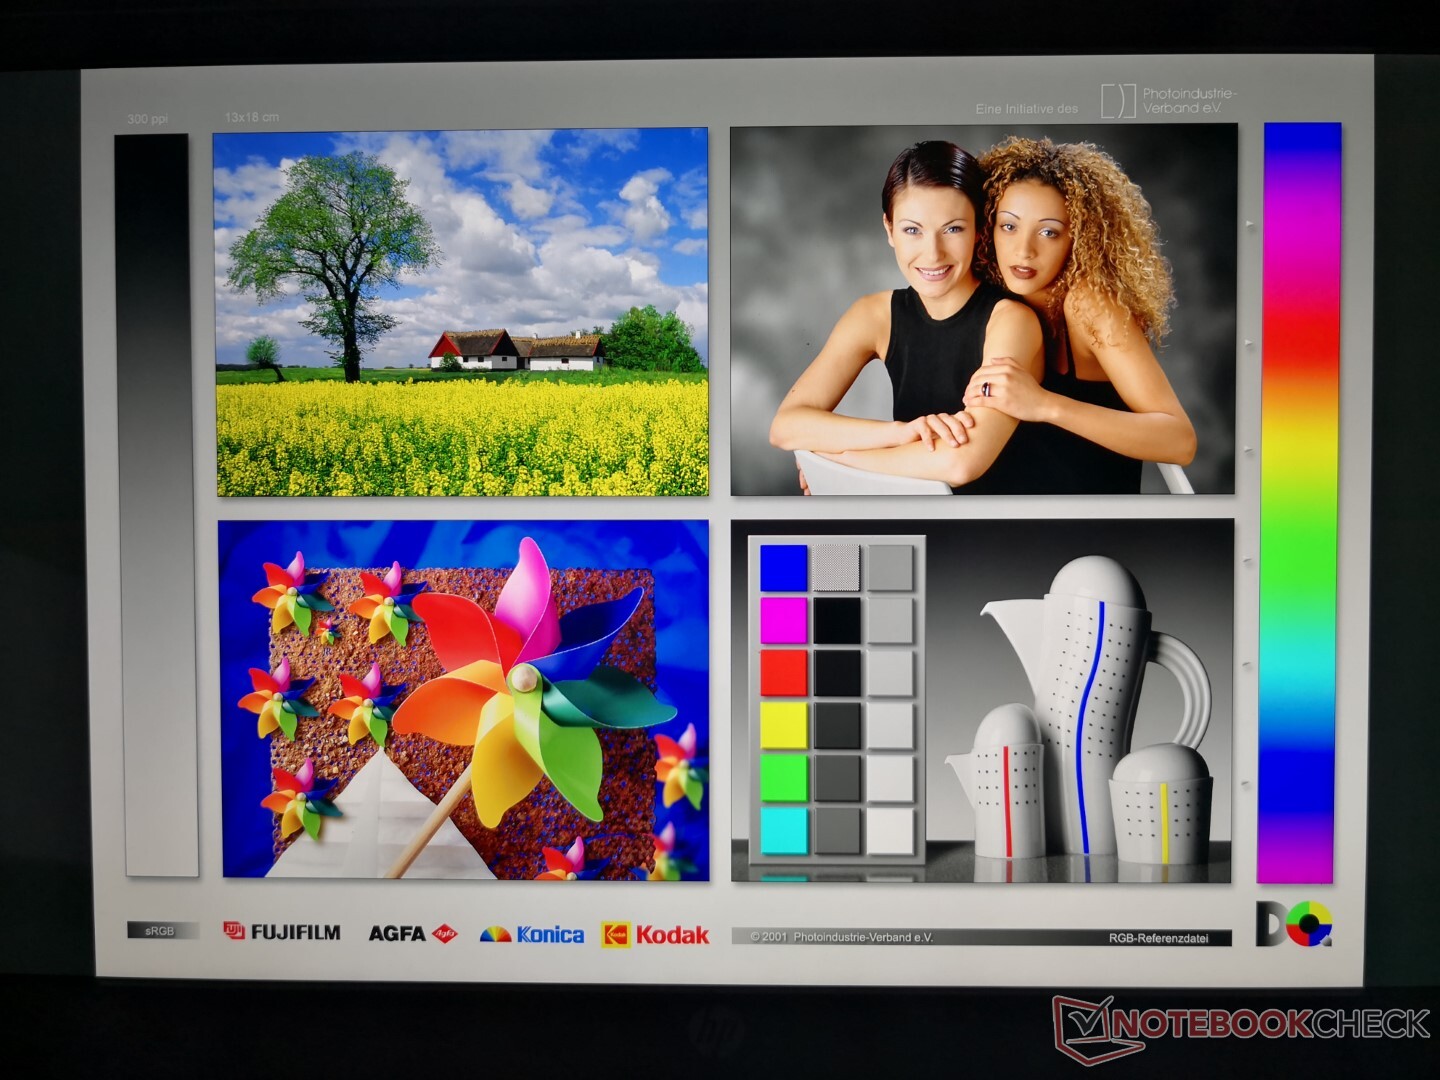
Color space covers about 93 percent and 61 percent of sRGB and AdobeRGB, respectively, to be similar to most FHD panels on high-end Ultrabooks like the XPS 13. The 4K panels on pricier laptops tend to offer full AdobeRGB coverage for deeper and more accurate colors like on the HP Spectre 13.

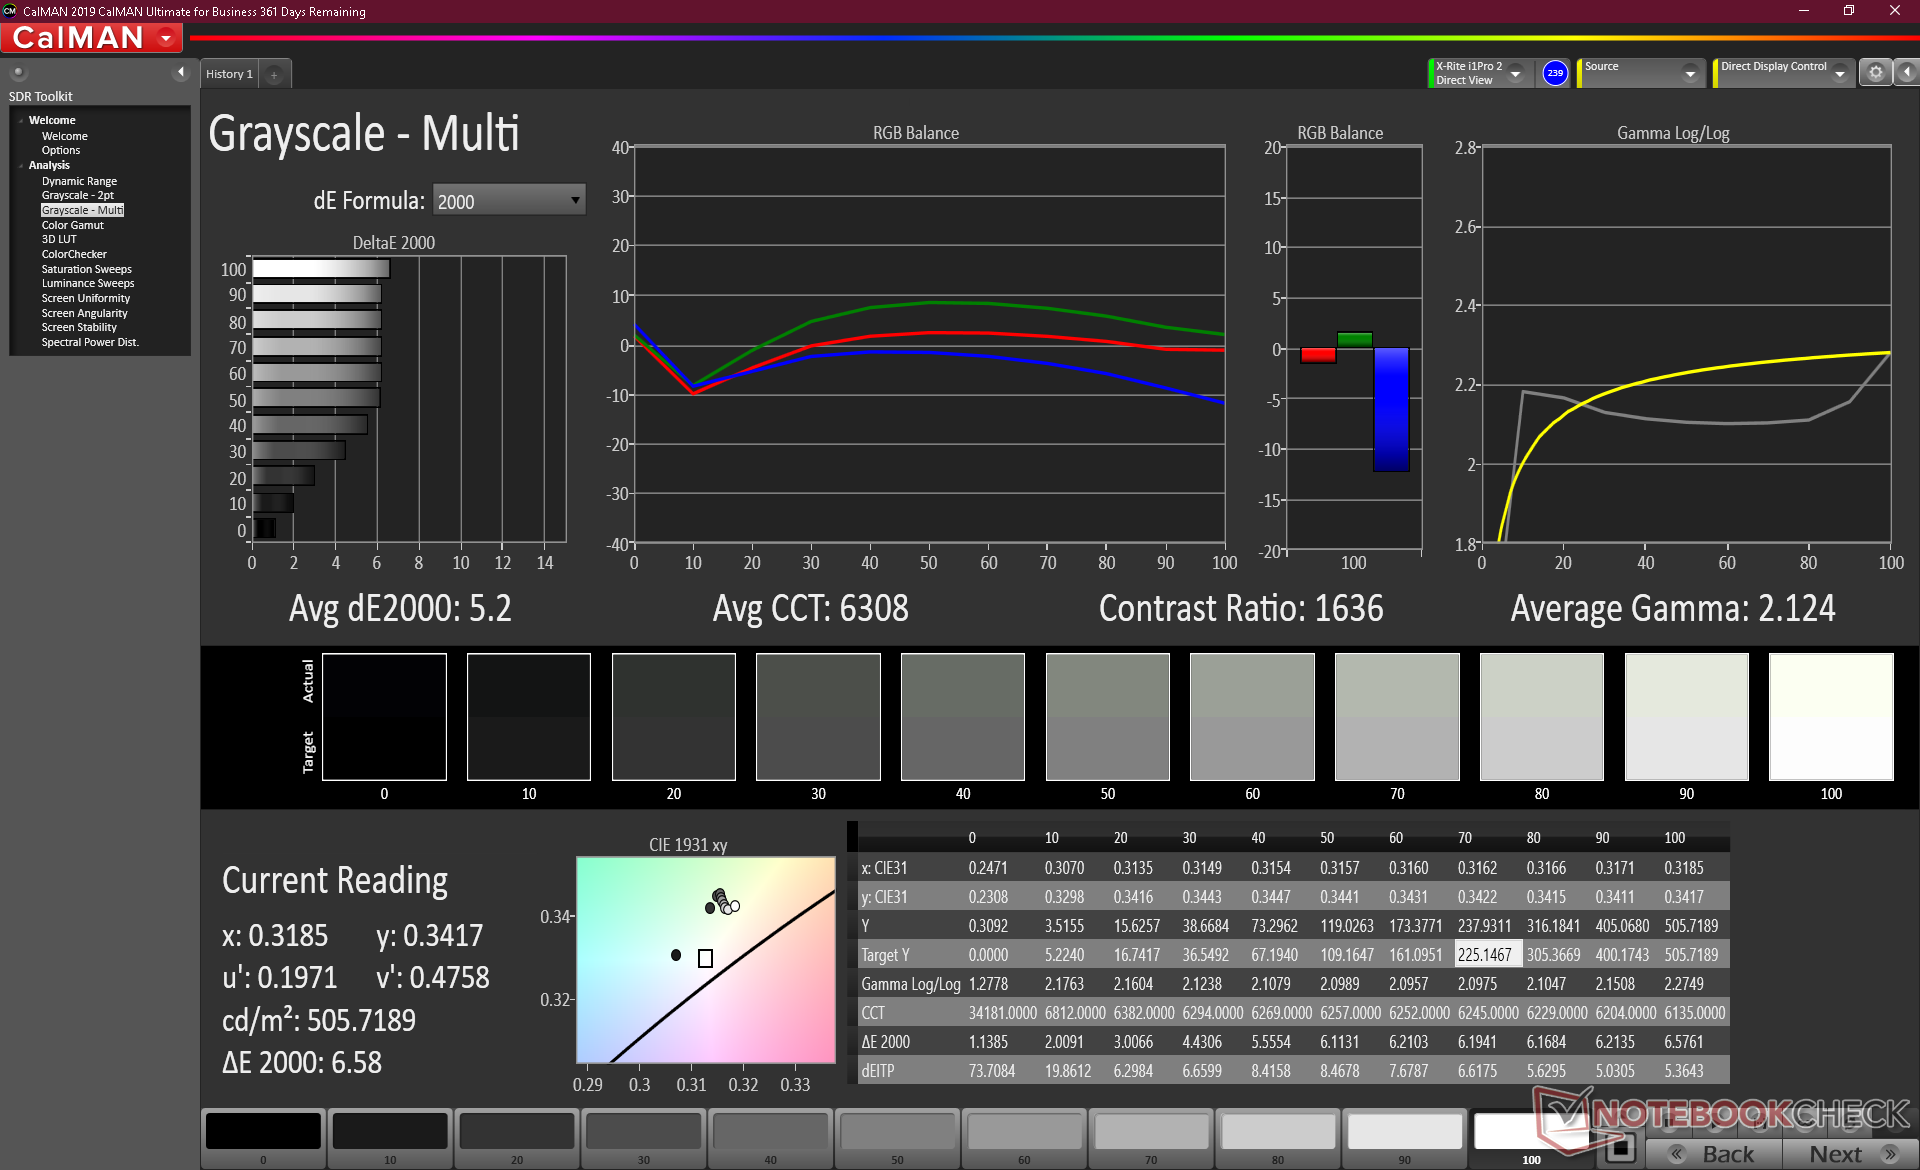
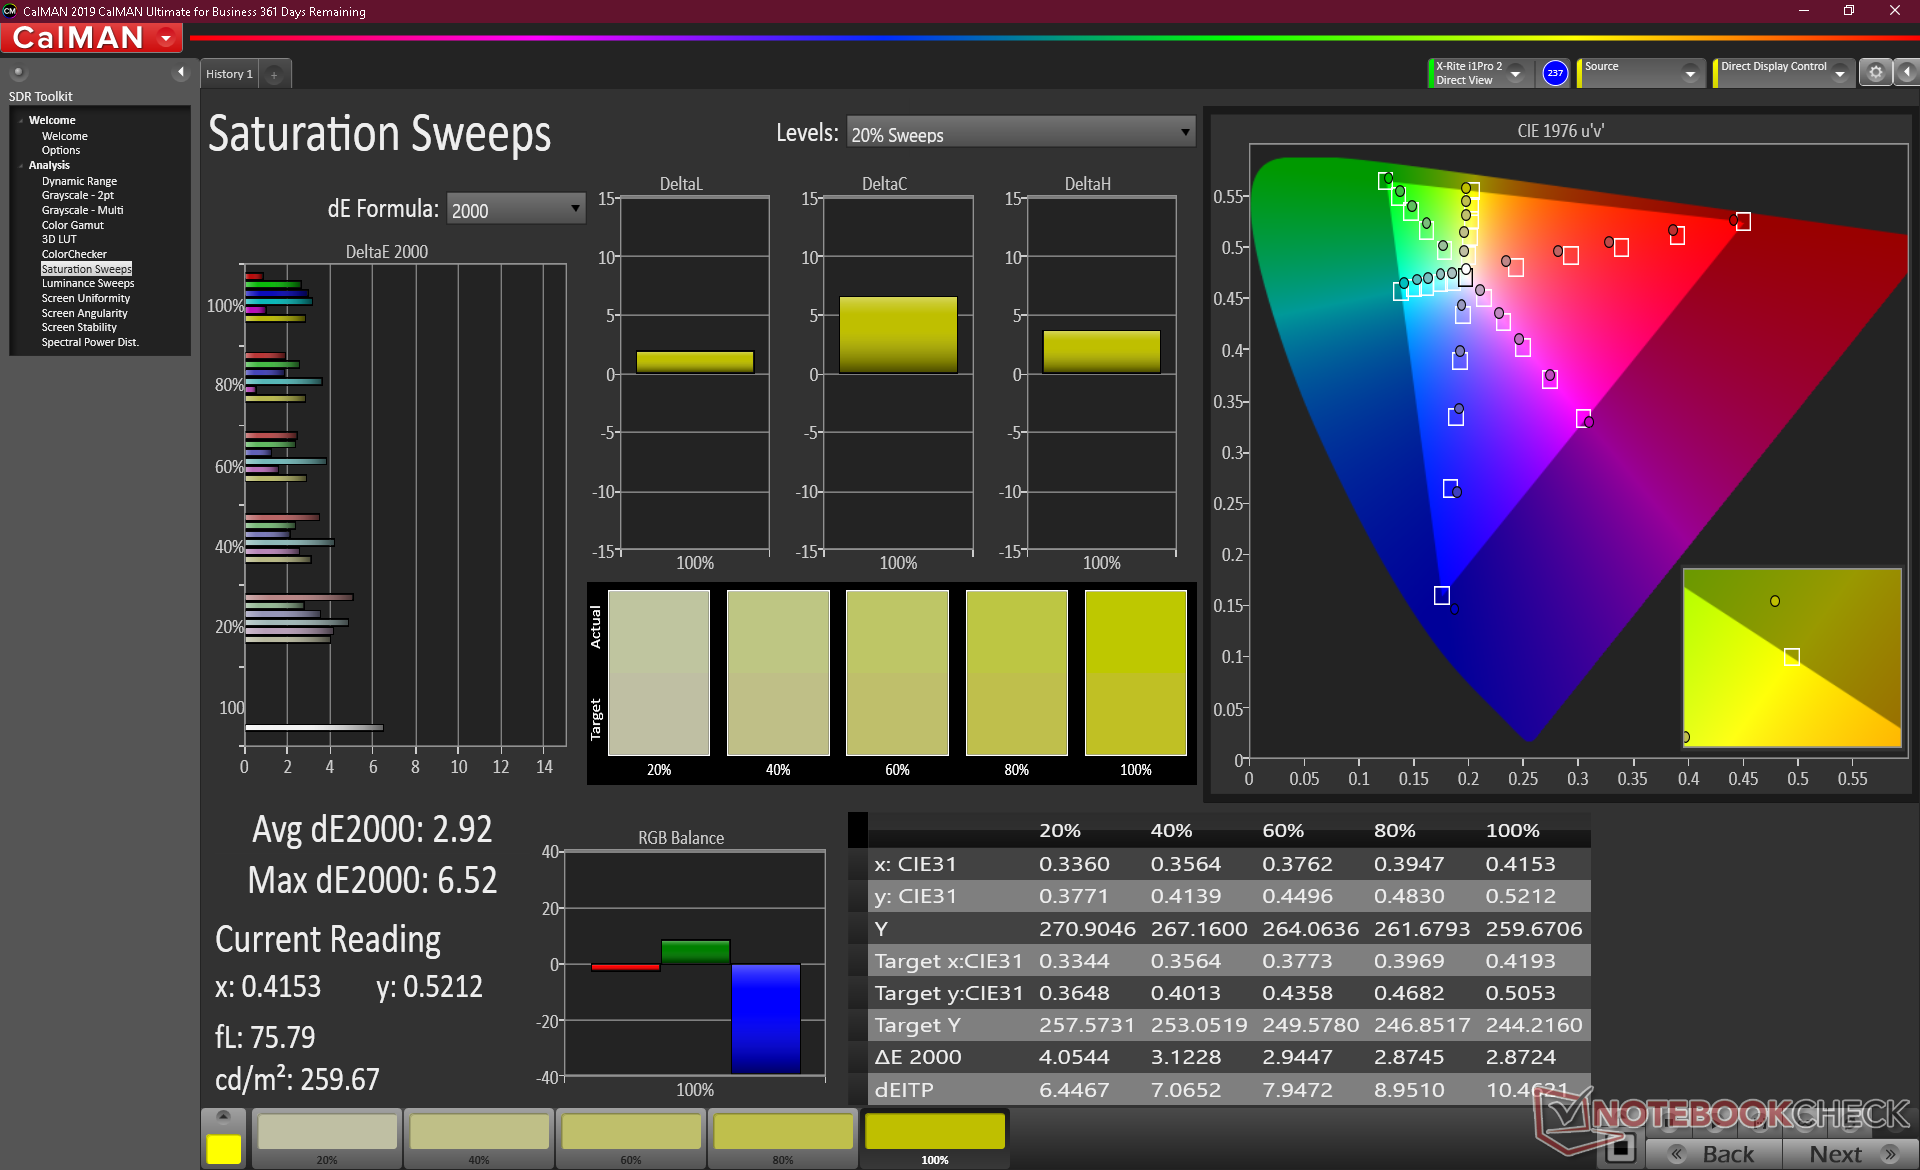
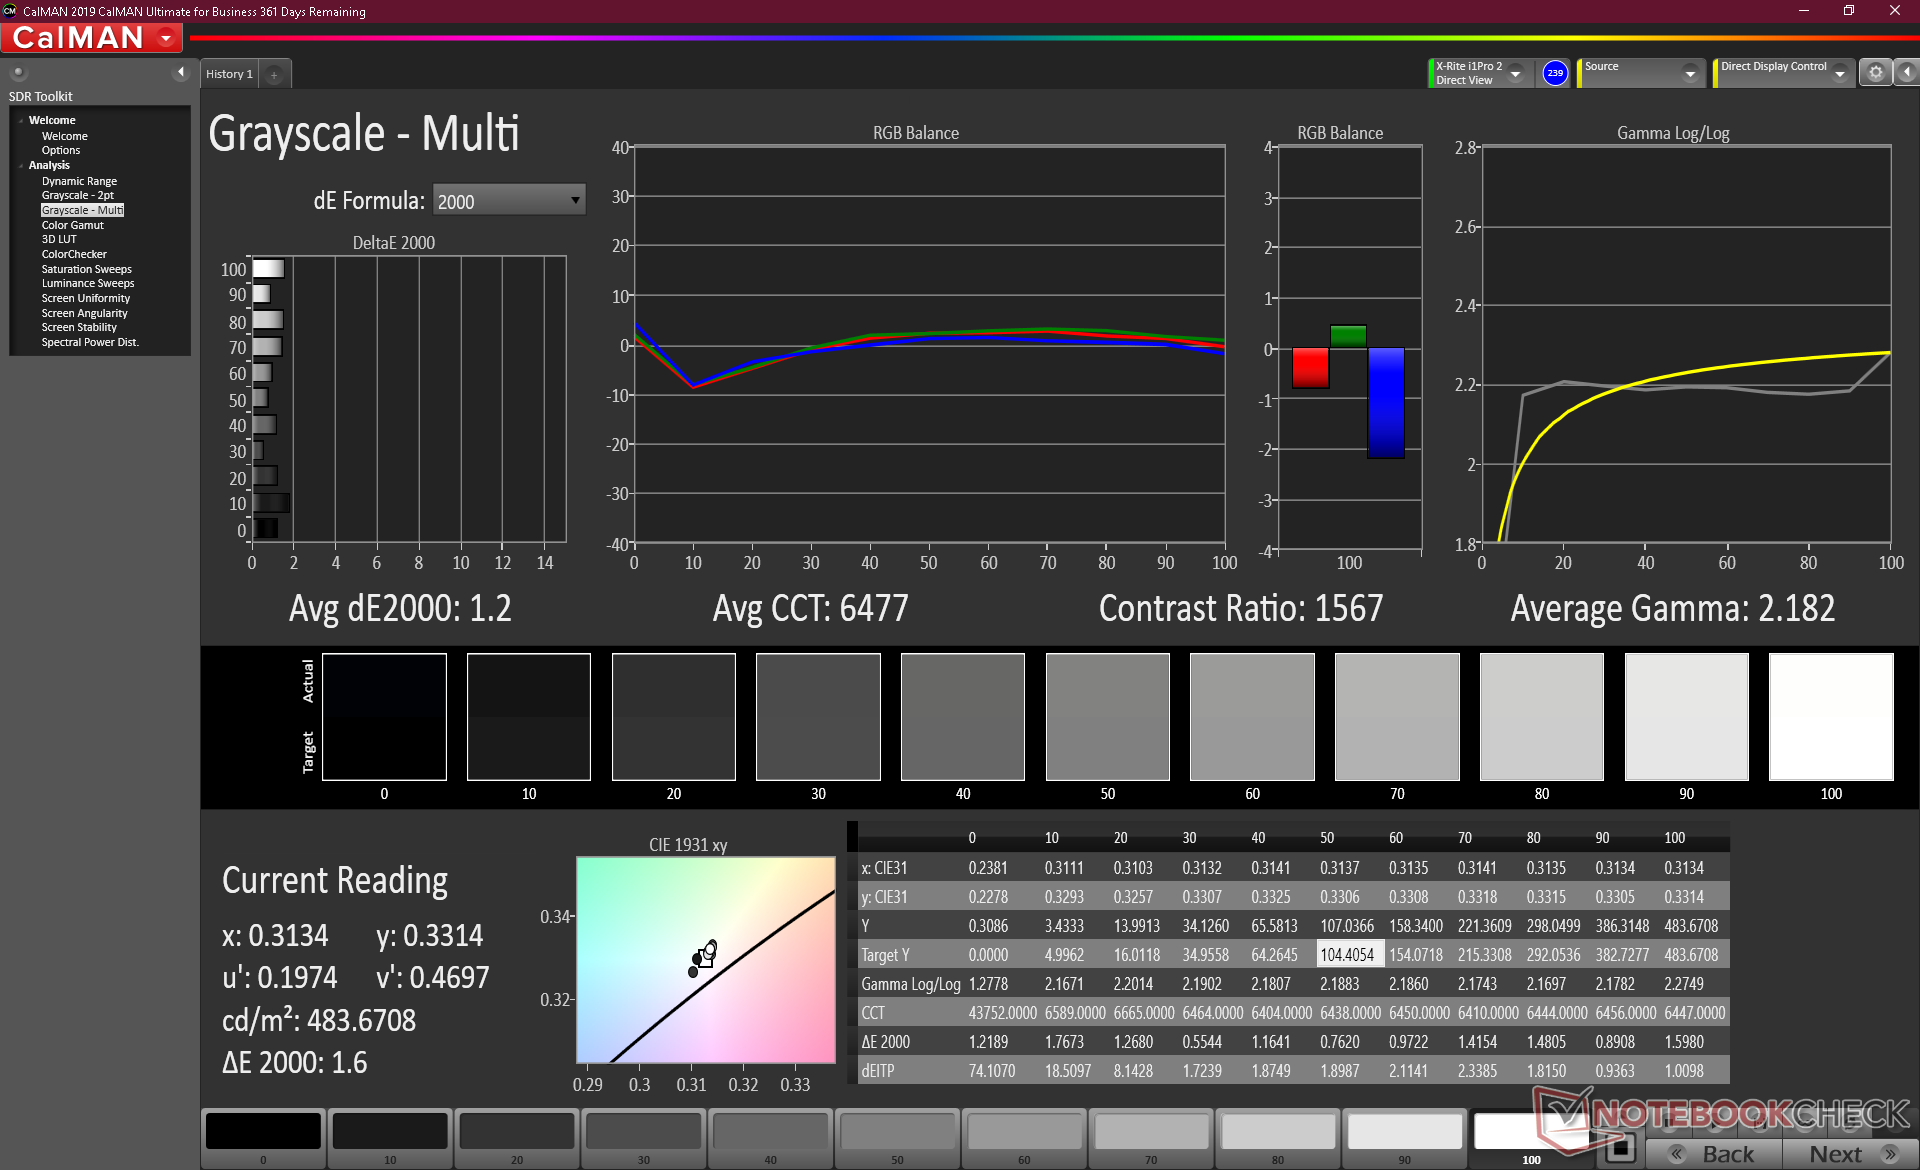
X-Rite colorimeter measurements reveal an uncalibrated display out of the box with an overly warm color temperature. This is a budget laptop after all and so a perfectly calibrated panel is not expected. Calibrating the panel ourselves would improve grayscale, color temperature, and RGB balance noticeably with a new average grayscale DeltaE value of just 1.2. We recommend an end-user calibration if possible to get the most out of the 4K UHD display.
Display Response Times
| ↔ Response Time Black to White | ||
|---|---|---|
| 41.6 ms ... rise ↗ and fall ↘ combined | ↗ 21.2 ms rise | 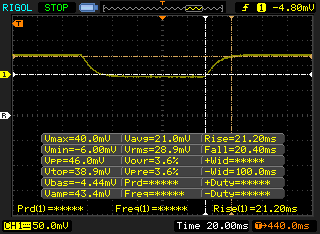 |
| ↘ 20.4 ms fall | ||
| The screen shows slow response rates in our tests and will be unsatisfactory for gamers. In comparison, all tested devices range from 0.1 (minimum) to 240 (maximum) ms. » 98 % of all devices are better. This means that the measured response time is worse than the average of all tested devices (20.1 ms). | ||
| ↔ Response Time 50% Grey to 80% Grey | ||
| 52.4 ms ... rise ↗ and fall ↘ combined | ↗ 25.2 ms rise | 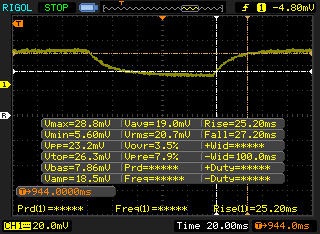 |
| ↘ 27.2 ms fall | ||
| The screen shows slow response rates in our tests and will be unsatisfactory for gamers. In comparison, all tested devices range from 0.165 (minimum) to 636 (maximum) ms. » 89 % of all devices are better. This means that the measured response time is worse than the average of all tested devices (31.4 ms). | ||
Screen Flickering / PWM (Pulse-Width Modulation)
| Screen flickering / PWM not detected | 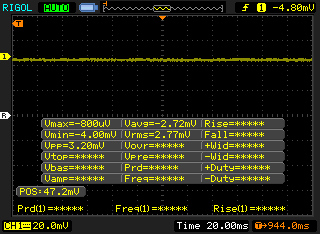 | ||
In comparison: 53 % of all tested devices do not use PWM to dim the display. If PWM was detected, an average of 7986 (minimum: 5 - maximum: 343500) Hz was measured. | |||
Performance
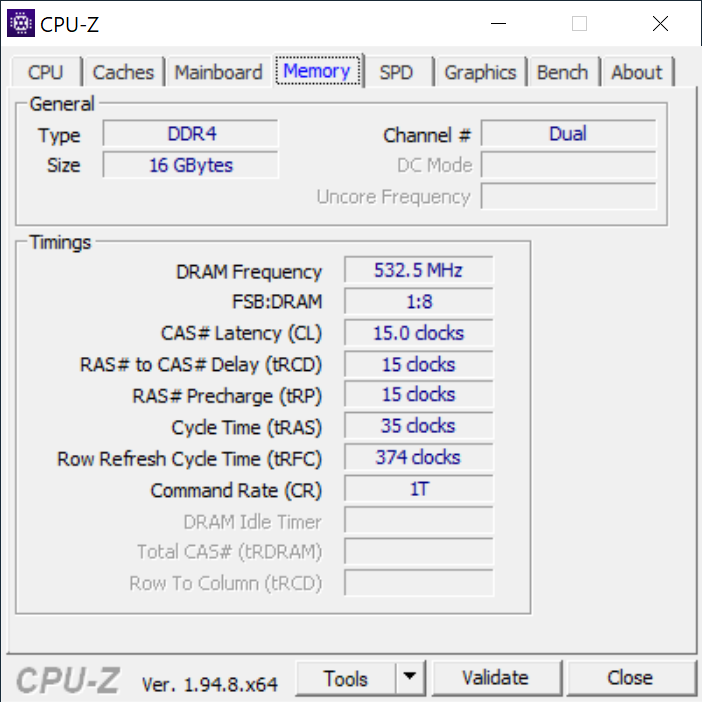
Users can select between the Core i5-1135G7 or Core i7-1165G7 to replace last year's i5-1035G7 and i7-1065G7, respectively. Intel Iris Xe comes standard on all SKUs with no AMD or Nvidia options at the moment. Users should select RAM capacity carefully since the modules are fixed.
We ran all performance benchmarks below on Windows Best performance mode for the highest possible scores. HP Command Center was not pre-installed on our test unit.
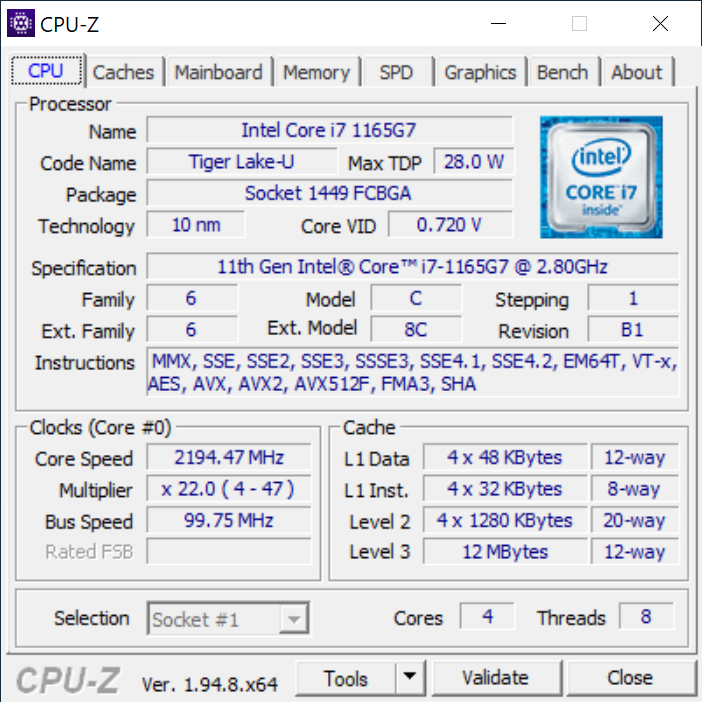
Processor
Multi-thread CPU performance is 4 to 15 percent slower than the average Core i7-1165G7 in our database according to CineBench benchmarks. The short-lived Turbo Boost potential of the processor is to blame for the slightly underwhelming performance. The Razer Blade Stealth with he same CPU, for example, can run almost 20 percent faster. Nonetheless, performance is still roughly 15 to 20 percent faster than the older Core i7-1065G7 in multi-threaded loads or 25 percent faster in single-threaded loads.
Note that the competing Ryzen 7 4700U can outperform our Intel CPU by 65 to 80 percent in multi-threaded workloads while the Intel CPU has the advantage in single-threaded workloads by a smaller 15 to 25 percent.
See our dedicated page on the Core i7-1165G7 for more technical information and benchmark comparisons.
Cinebench R15: CPU Multi 64Bit | CPU Single 64Bit
Blender: v2.79 BMW27 CPU
7-Zip 18.03: 7z b 4 -mmt1 | 7z b 4
Geekbench 5.5: Single-Core | Multi-Core
HWBOT x265 Benchmark v2.2: 4k Preset
LibreOffice : 20 Documents To PDF
R Benchmark 2.5: Overall mean
| Geekbench 5.5 / Single-Core | |
| HP Pavilion 13-bb0015cl | |
| Average Intel Core i7-1165G7 (1302 - 1595, n=77) | |
| Asus Zenbook S UX393JA | |
| HP Envy 13-ba0001ng | |
| Lenovo Yoga Slim 7-14ARE | |
| Lenovo Yoga Slim 7-14ARE | |
| Lenovo Yoga Slim 7 14ARE05 82A20008GE | |
| Huawei MateBook 13 2020 i5 | |
| Geekbench 5.5 / Multi-Core | |
| Lenovo Yoga Slim 7-14ARE | |
| Lenovo Yoga Slim 7-14ARE | |
| Lenovo Yoga Slim 7 14ARE05 82A20008GE | |
| Average Intel Core i7-1165G7 (3078 - 5926, n=77) | |
| HP Pavilion 13-bb0015cl | |
| Asus Zenbook S UX393JA | |
| Huawei MateBook 13 2020 i5 | |
| HP Envy 13-ba0001ng | |
| HWBOT x265 Benchmark v2.2 / 4k Preset | |
| Lenovo Yoga Slim 7-14ARE | |
| Lenovo Yoga Slim 7 14ARE05 82A20008GE | |
| Average Intel Core i7-1165G7 (1.39 - 8.47, n=80) | |
| Dell XPS 13 7390 Core i7-10710U | |
| HP Pavilion 13-bb0015cl | |
| Asus Zenbook S UX393JA | |
| Huawei MateBook 13 2020 i5 | |
| HP Envy 13-ba0001ng | |
| HP Elite Dragonfly-8MK79EA | |
| HP Envy x360 13-ar0601ng | |
| LibreOffice / 20 Documents To PDF | |
| Lenovo Yoga Slim 7 14ARE05 82A20008GE | |
| Huawei MateBook 13 2020 i5 | |
| Lenovo Yoga Slim 7-14ARE | |
| HP Envy 13-ba0001ng | |
| Average Intel Core i7-1165G7 (21.5 - 88.1, n=78) | |
| Asus Zenbook S UX393JA | |
| HP Pavilion 13-bb0015cl | |
| R Benchmark 2.5 / Overall mean | |
| Huawei MateBook 13 2020 i5 | |
| Asus Zenbook S UX393JA | |
| HP Envy 13-ba0001ng | |
| Lenovo Yoga Slim 7 14ARE05 82A20008GE | |
| Lenovo Yoga Slim 7-14ARE | |
| Average Intel Core i7-1165G7 (0.552 - 1.002, n=80) | |
| HP Pavilion 13-bb0015cl | |
* ... smaller is better
System Performance
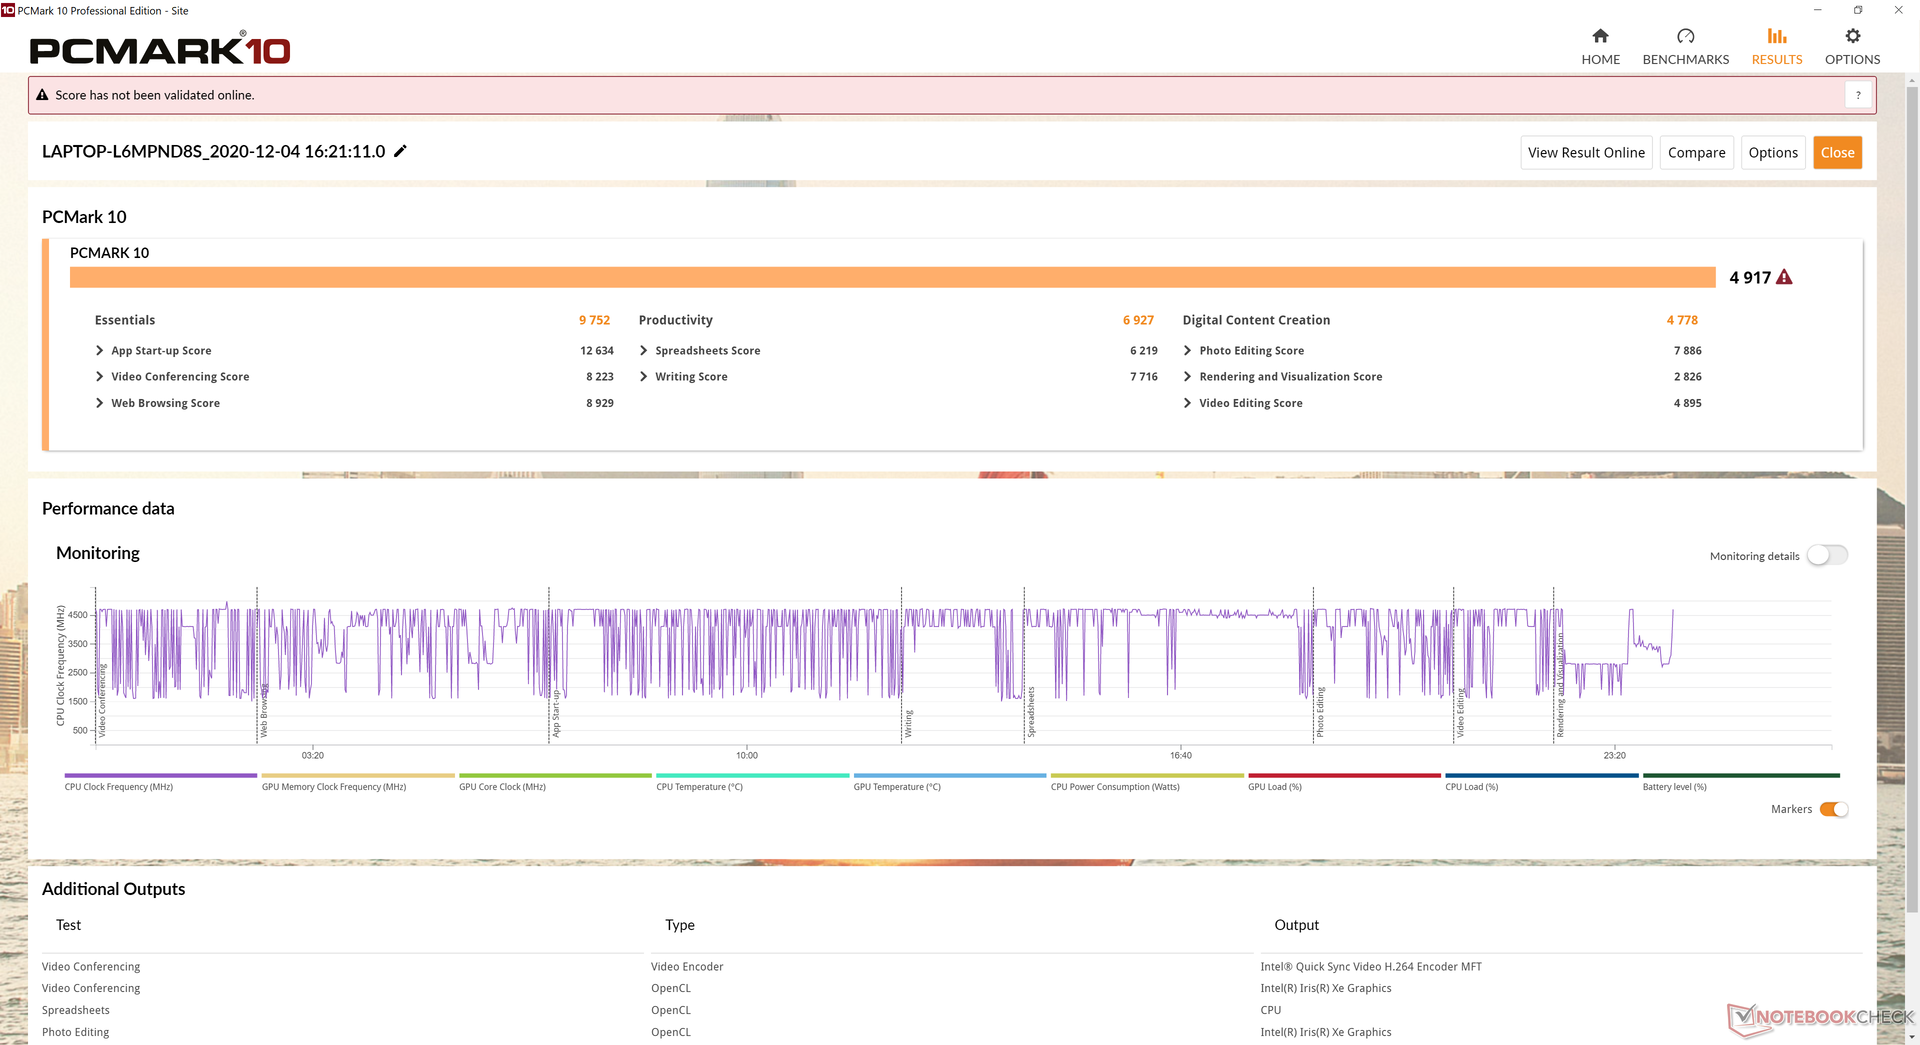
PCMark benchmarks are in line with other laptop we've tested thus far each equipped with the same Core i7-1165G7 CPU. Results are consistently higher than Ice Lake Core i7-1065G7 laptops including the XPS 13 9300 especially in Digital Content Creation where graphics performance can make a big difference.
We experienced no software or hardware issues during our time with the test unit. It did, however, automatically restart once while we were in the middle of running benchmarks. The fact that this can still occur on a Windows 10 machine is frustrating to say the least.
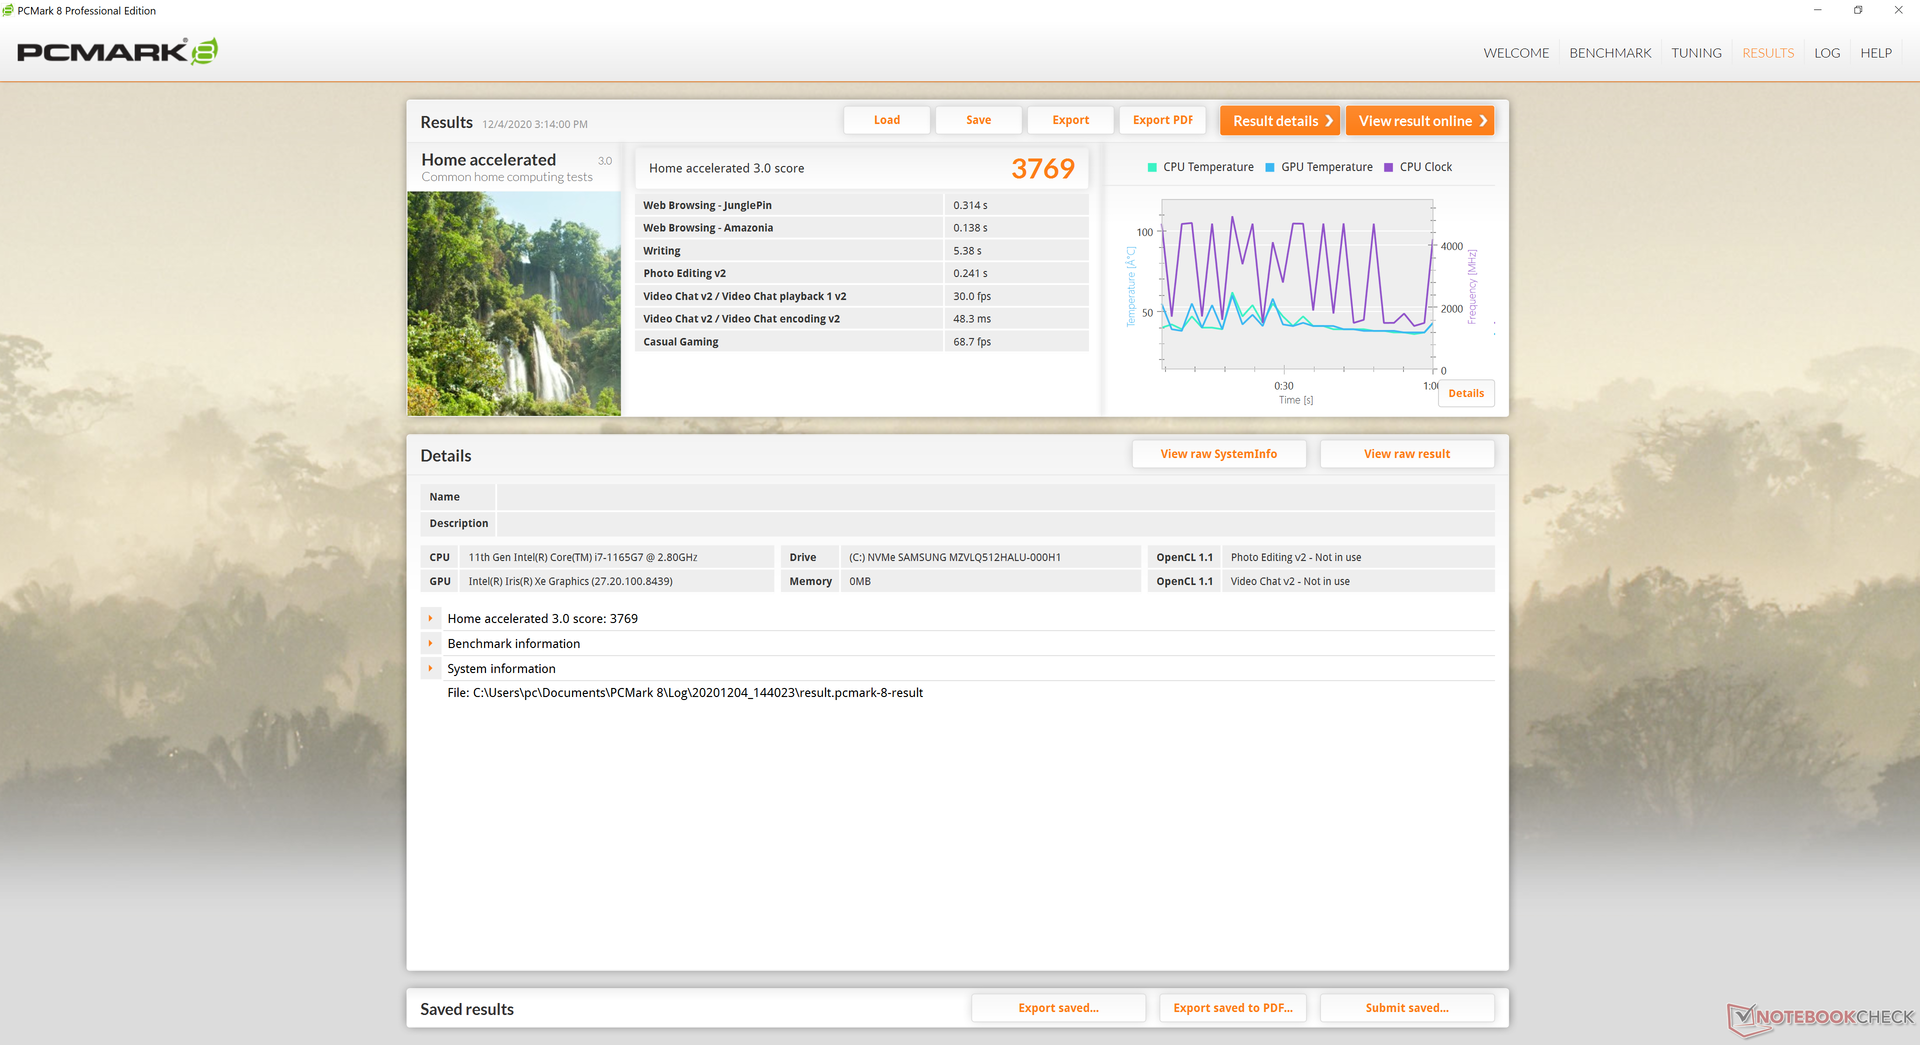
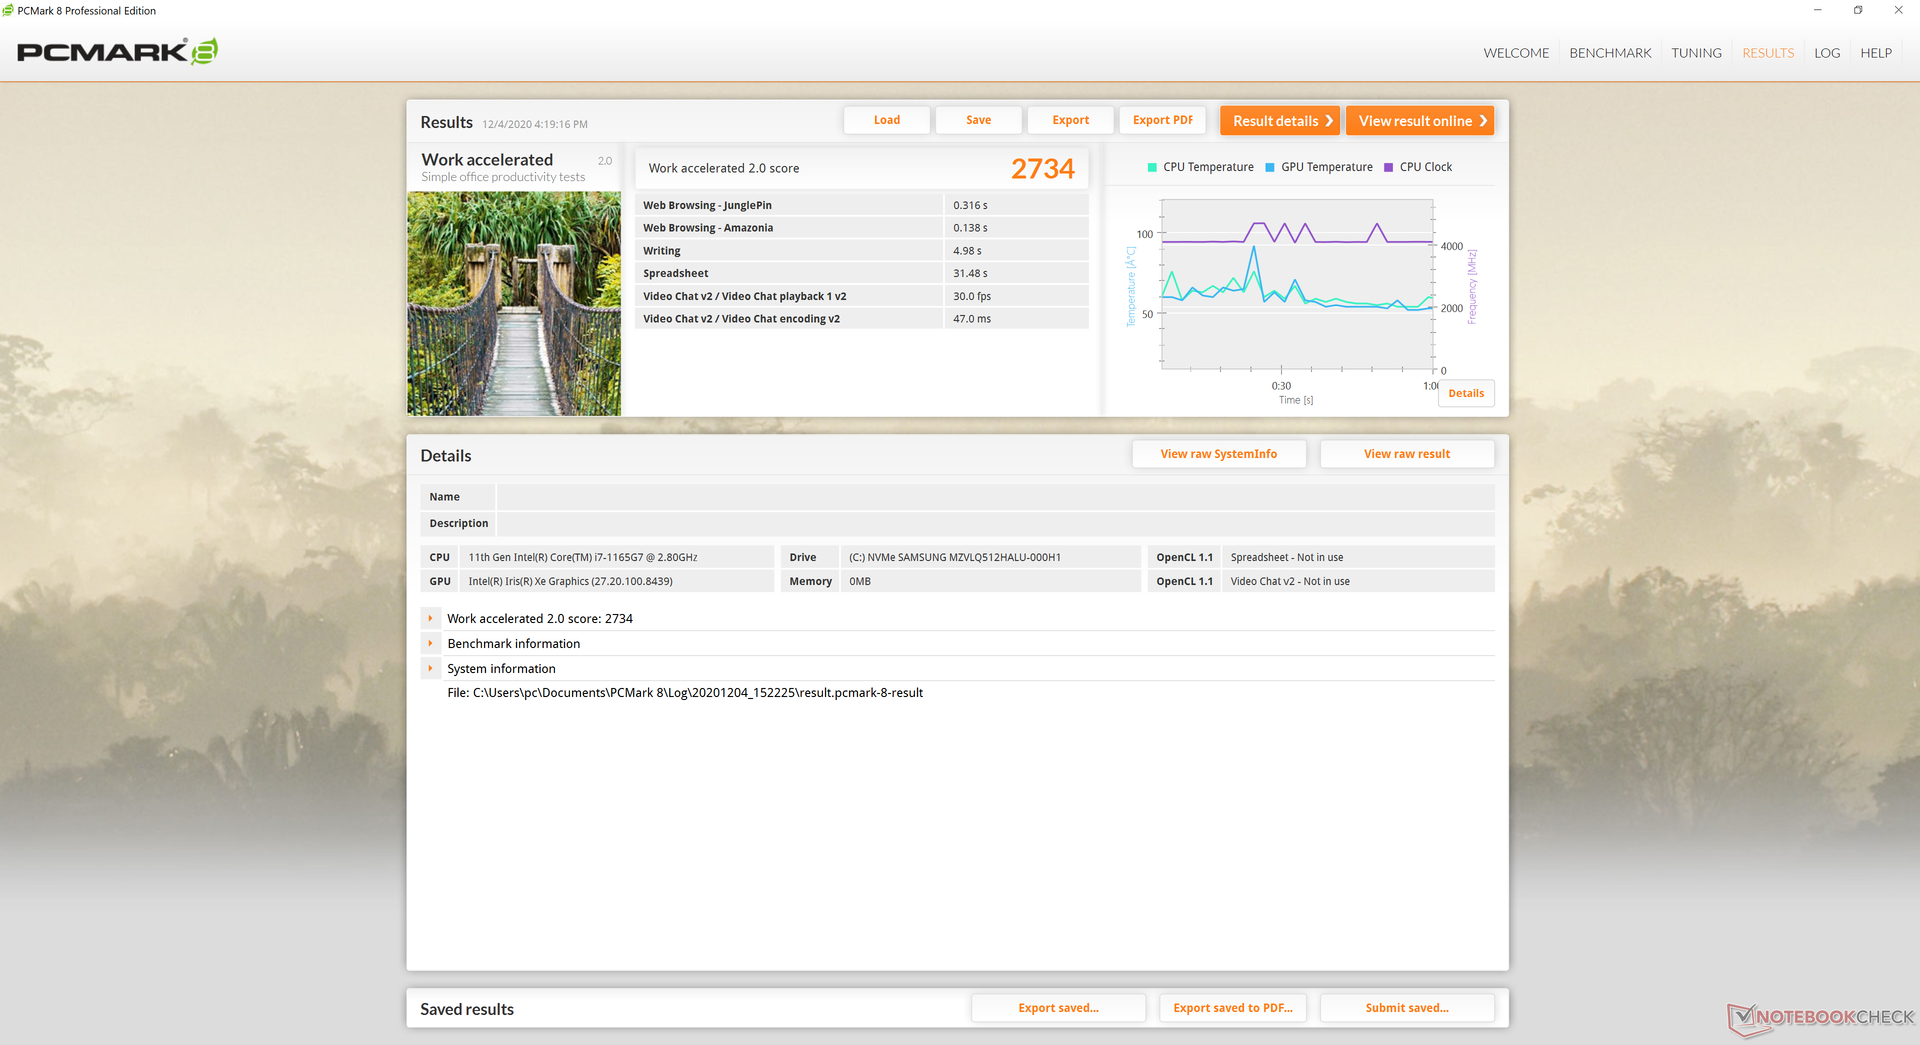
| PCMark 8 Home Score Accelerated v2 | 3769 points | |
| PCMark 8 Work Score Accelerated v2 | 2734 points | |
| PCMark 10 Score | 4917 points | |
Help | ||
DPC Latency
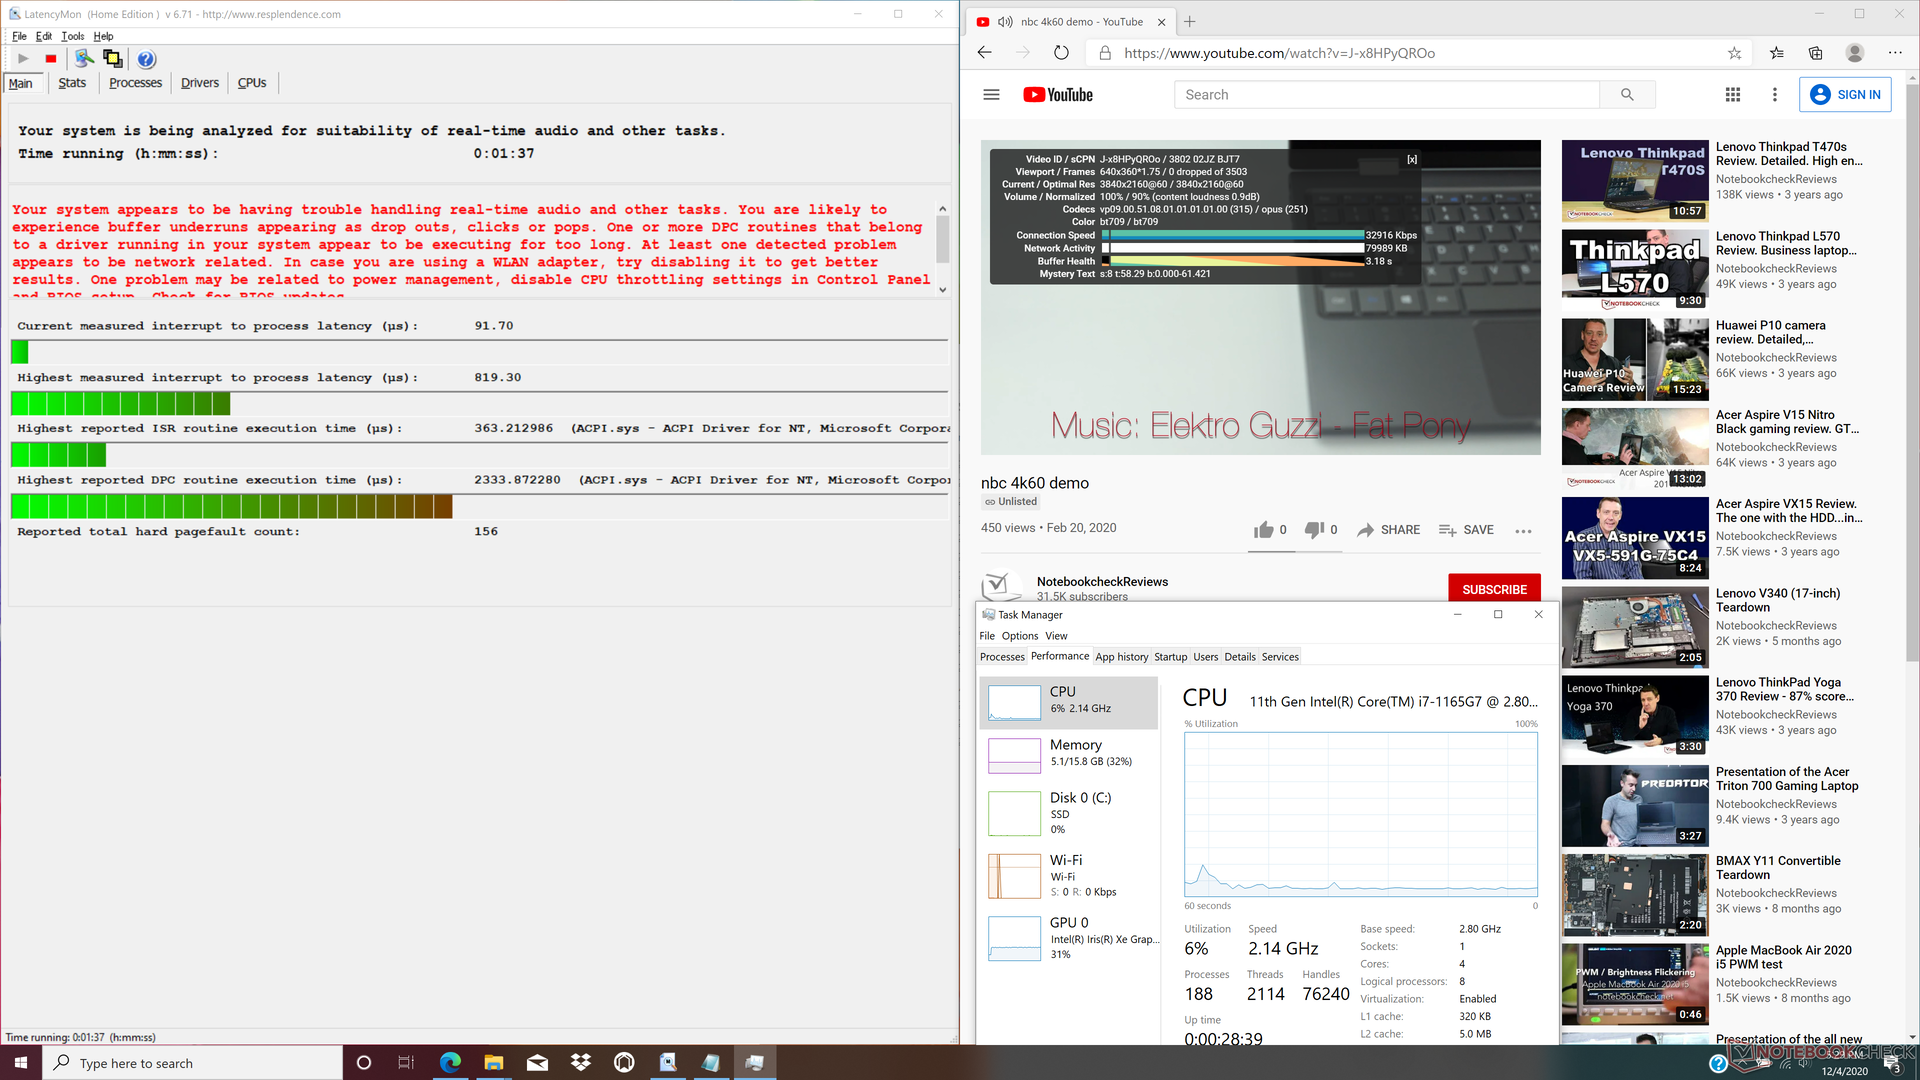
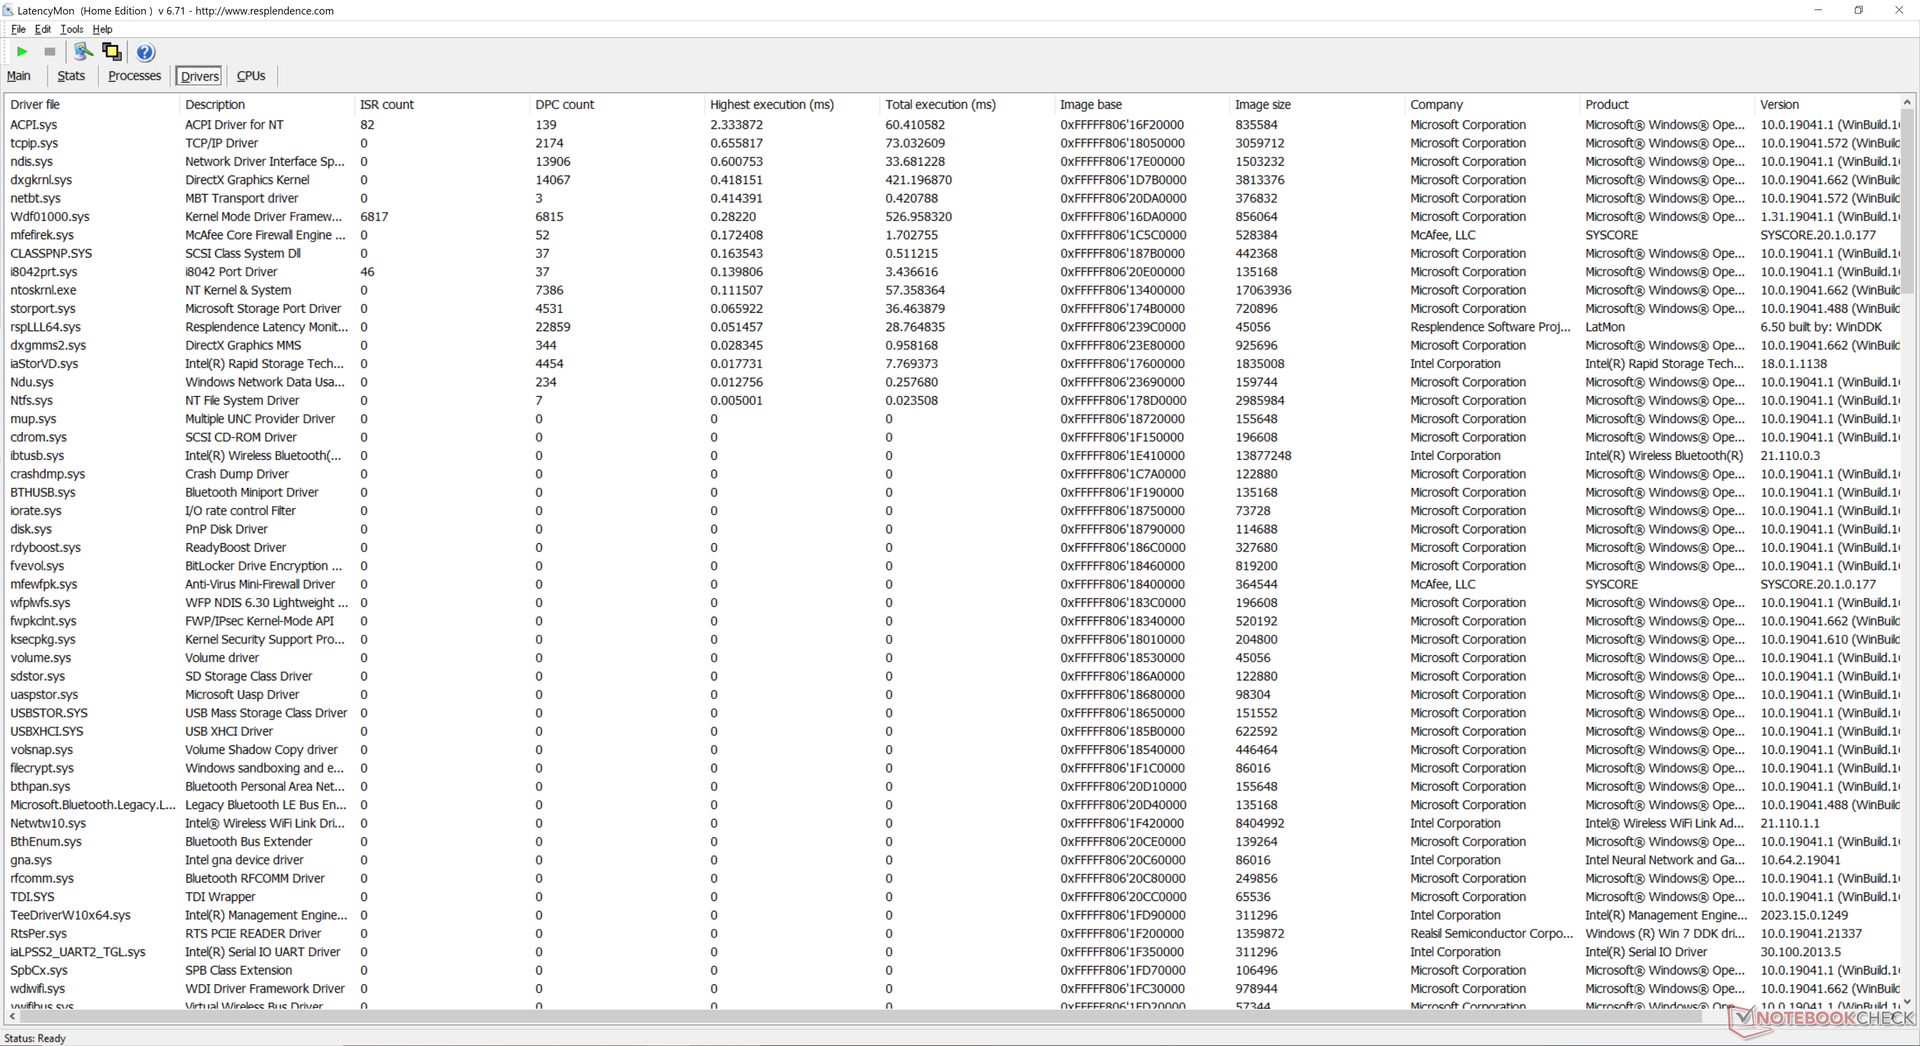
| DPC Latencies / LatencyMon - interrupt to process latency (max), Web, Youtube, Prime95 | |
| HP Envy 13-ba0001ng | |
| HP Pavilion 13-bb0015cl | |
| Dell XPS 13 9300 i5 FHD | |
| Lenovo IdeaPad S540-13ARE-82DL000YGE | |
* ... smaller is better
Storage Devices
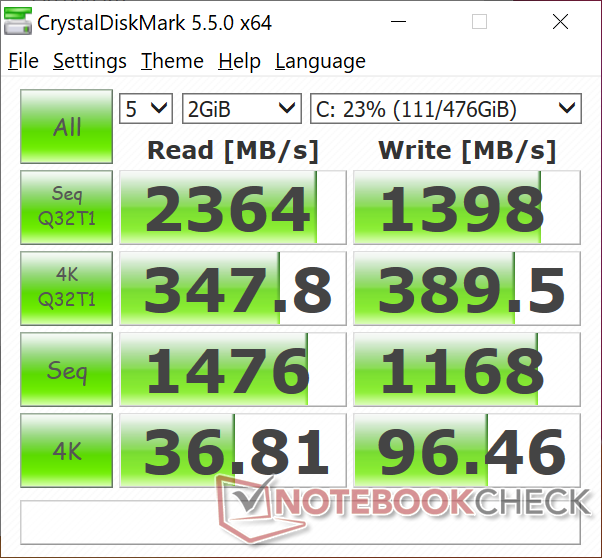
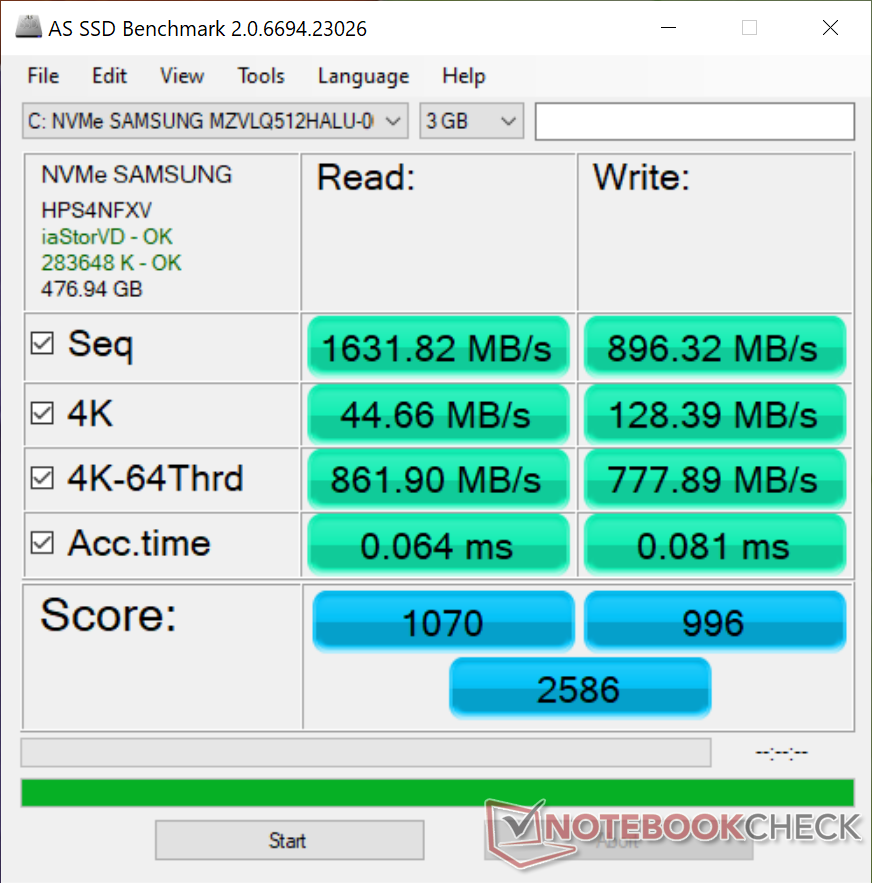
Our unit shipped with the mid-range Samsung PM991 NVMe SSD instead of the costlier and faster PM981a as found on higher-end laptops like the EliteBook 1030 G7 or Razer Blade Stealth. Transfer rates are comparable to the Intel 660p while being much faster than any SATA III solution like the Kingston drive in the Asus VivoBook S13. Interestingly, it can take a while to reach the maximum theoretical transfer rates of the PM991 as shown by our DiskSpd Read Loop test results below.
See our table of HDDs and SSDs for more benchmark comparisons.
| HP Pavilion 13-bb0015cl Samsung PM991 MZVLQ512HALU | HP Envy 13-ba0001ng Intel SSD 660p SSDPEKNW512G8 | Asus VivoBook S13 S330UA-EY034T Kingston RBU-SNS8180DS3512GJ | Lenovo IdeaPad S540-13ARE-82DL000YGE WDC PC SN730 SDBPNTY-256G | HP EliteBook x360 1030 G7 Samsung SSD PM981a MZVLB512HBJQ | |
|---|---|---|---|---|---|
| AS SSD | -11% | -64% | 0% | 13% | |
| Seq Read (MB/s) | 1632 | 1587 -3% | 485.5 -70% | 2193 34% | 2036 25% |
| Seq Write (MB/s) | 896 | 709 -21% | 351 -61% | 1797 101% | 1422 59% |
| 4K Read (MB/s) | 44.66 | 52 16% | 30.94 -31% | 45.79 3% | 53.8 20% |
| 4K Write (MB/s) | 128.4 | 144 12% | 61.6 -52% | 140.3 9% | 122 -5% |
| 4K-64 Read (MB/s) | 862 | 322.8 -63% | 323.8 -62% | 721 -16% | 680 -21% |
| 4K-64 Write (MB/s) | 778 | 835 7% | 439.9 -43% | 651 -16% | 1445 86% |
| Access Time Read * (ms) | 0.064 | 0.103 -61% | 0.108 -69% | 0.086 -34% | 0.041 36% |
| Access Time Write * (ms) | 0.081 | 0.045 44% | 0.174 -115% | 0.027 67% | 0.091 -12% |
| Score Read (Points) | 1070 | 533 -50% | 403 -62% | 986 -8% | 937 -12% |
| Score Write (Points) | 996 | 1050 5% | 537 -46% | 971 -3% | 1709 72% |
| Score Total (Points) | 2586 | 1832 -29% | 1150 -56% | 2453 -5% | 3111 20% |
| Copy ISO MB/s (MB/s) | 1283 | 1483 16% | 546 -57% | 1201 -6% | 2109 64% |
| Copy Program MB/s (MB/s) | 806 | 730 -9% | 106.2 -87% | 303 -62% | 103.5 -87% |
| Copy Game MB/s (MB/s) | 1182 | 943 -20% | 151 -87% | 436.4 -63% | 387.8 -67% |
| CrystalDiskMark 5.2 / 6 | 3% | -52% | 38% | 42% | |
| Write 4K (MB/s) | 96.5 | 146.3 52% | 64.5 -33% | 157.4 63% | 122.2 27% |
| Read 4K (MB/s) | 36.81 | 55.7 51% | 24.91 -32% | 48.59 32% | 44.56 21% |
| Write Seq (MB/s) | 1168 | 949 -19% | 453.4 -61% | 2199 88% | 2105 80% |
| Read Seq (MB/s) | 1476 | 1494 1% | 424.9 -71% | 2011 36% | 2346 59% |
| Write 4K Q32T1 (MB/s) | 389.5 | 408.5 5% | 257.8 -34% | 265.3 -32% | 349.6 -10% |
| Read 4K Q32T1 (MB/s) | 347.8 | 304 -13% | 200.4 -42% | 478.8 38% | 340.6 -2% |
| Write Seq Q32T1 (MB/s) | 1398 | 984 -30% | 504 -64% | 2193 57% | 2958 112% |
| Read Seq Q32T1 (MB/s) | 2364 | 1779 -25% | 459.6 -81% | 2870 21% | 3564 51% |
| Write 4K Q8T8 (MB/s) | 284.4 | ||||
| Read 4K Q8T8 (MB/s) | 301.2 | ||||
| Total Average (Program / Settings) | -4% /
-6% | -58% /
-60% | 19% /
14% | 28% /
23% |
* ... smaller is better

Disk Throttling: DiskSpd Read Loop, Queue Depth 8
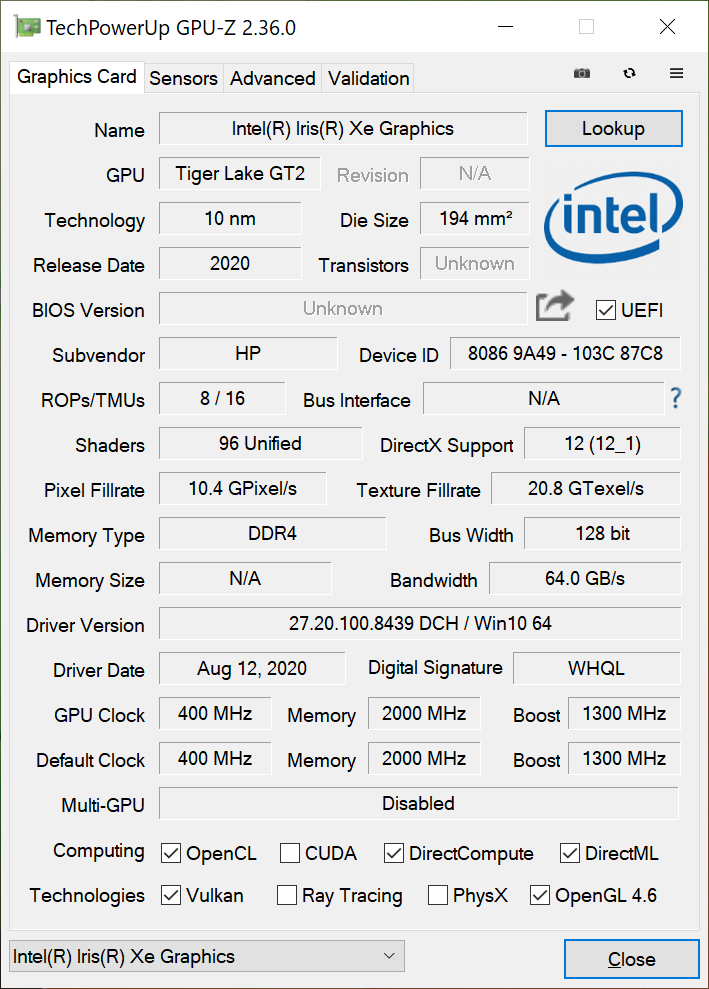
GPU Performance
3DMark results are again excellent with scores that are marginally higher than the discrete GeForce MX350. As we've mentioned before, however, performance in real-world games consistently trails behind the same Nvidia GPU. Even with this in mind, gaming performance is still better than ever for an Intel integrated GPU.
More benchmark and comparisons for Iris Xe can be found on our dedicated page here.
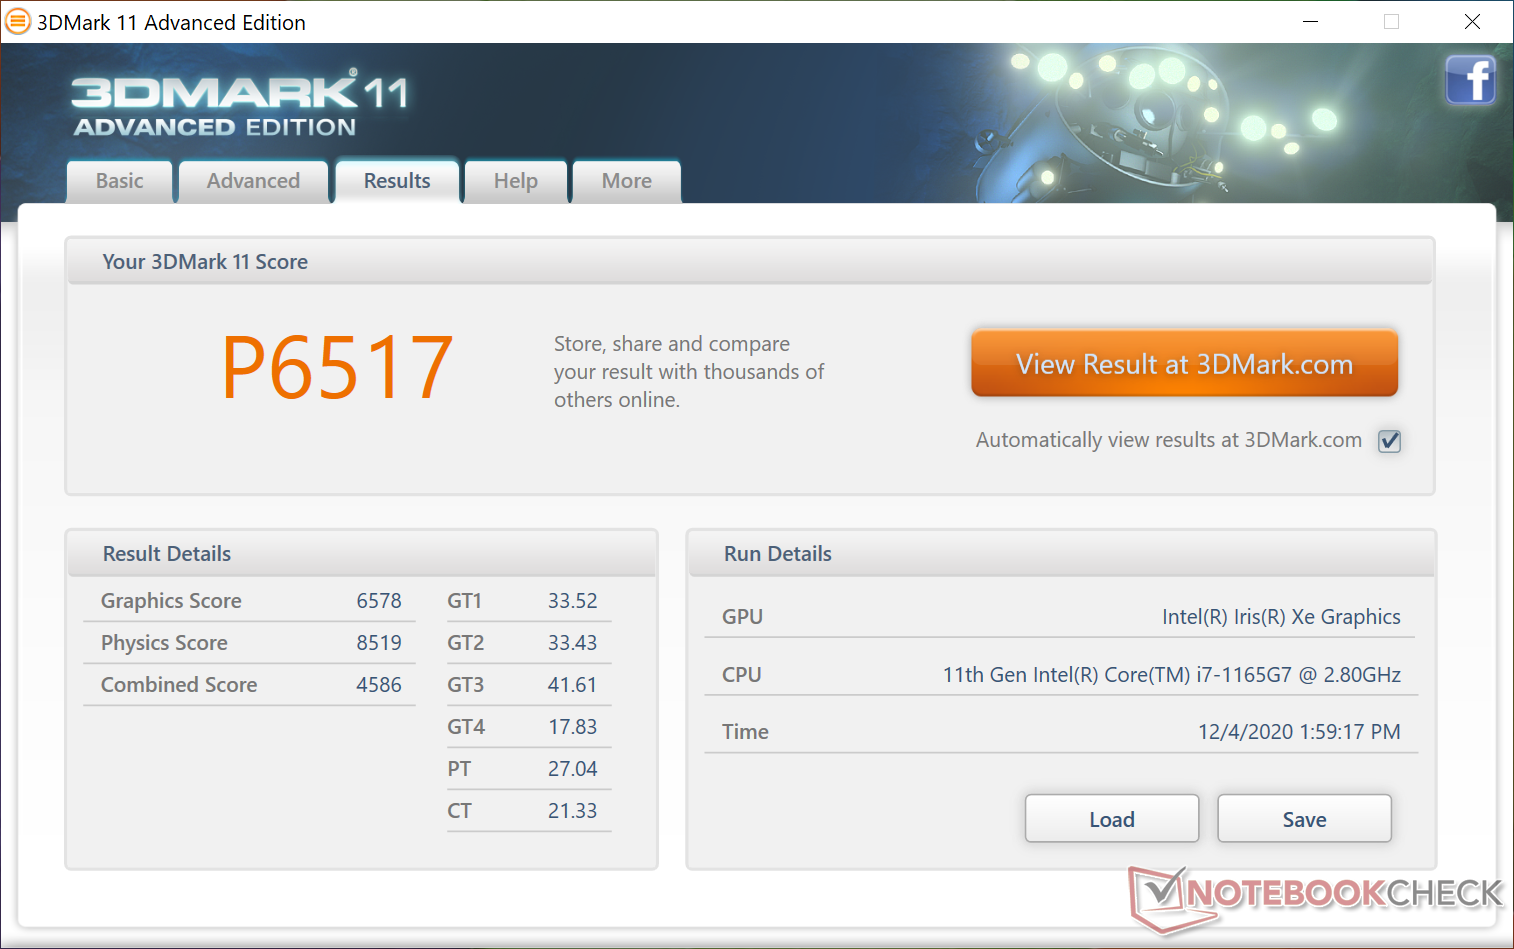
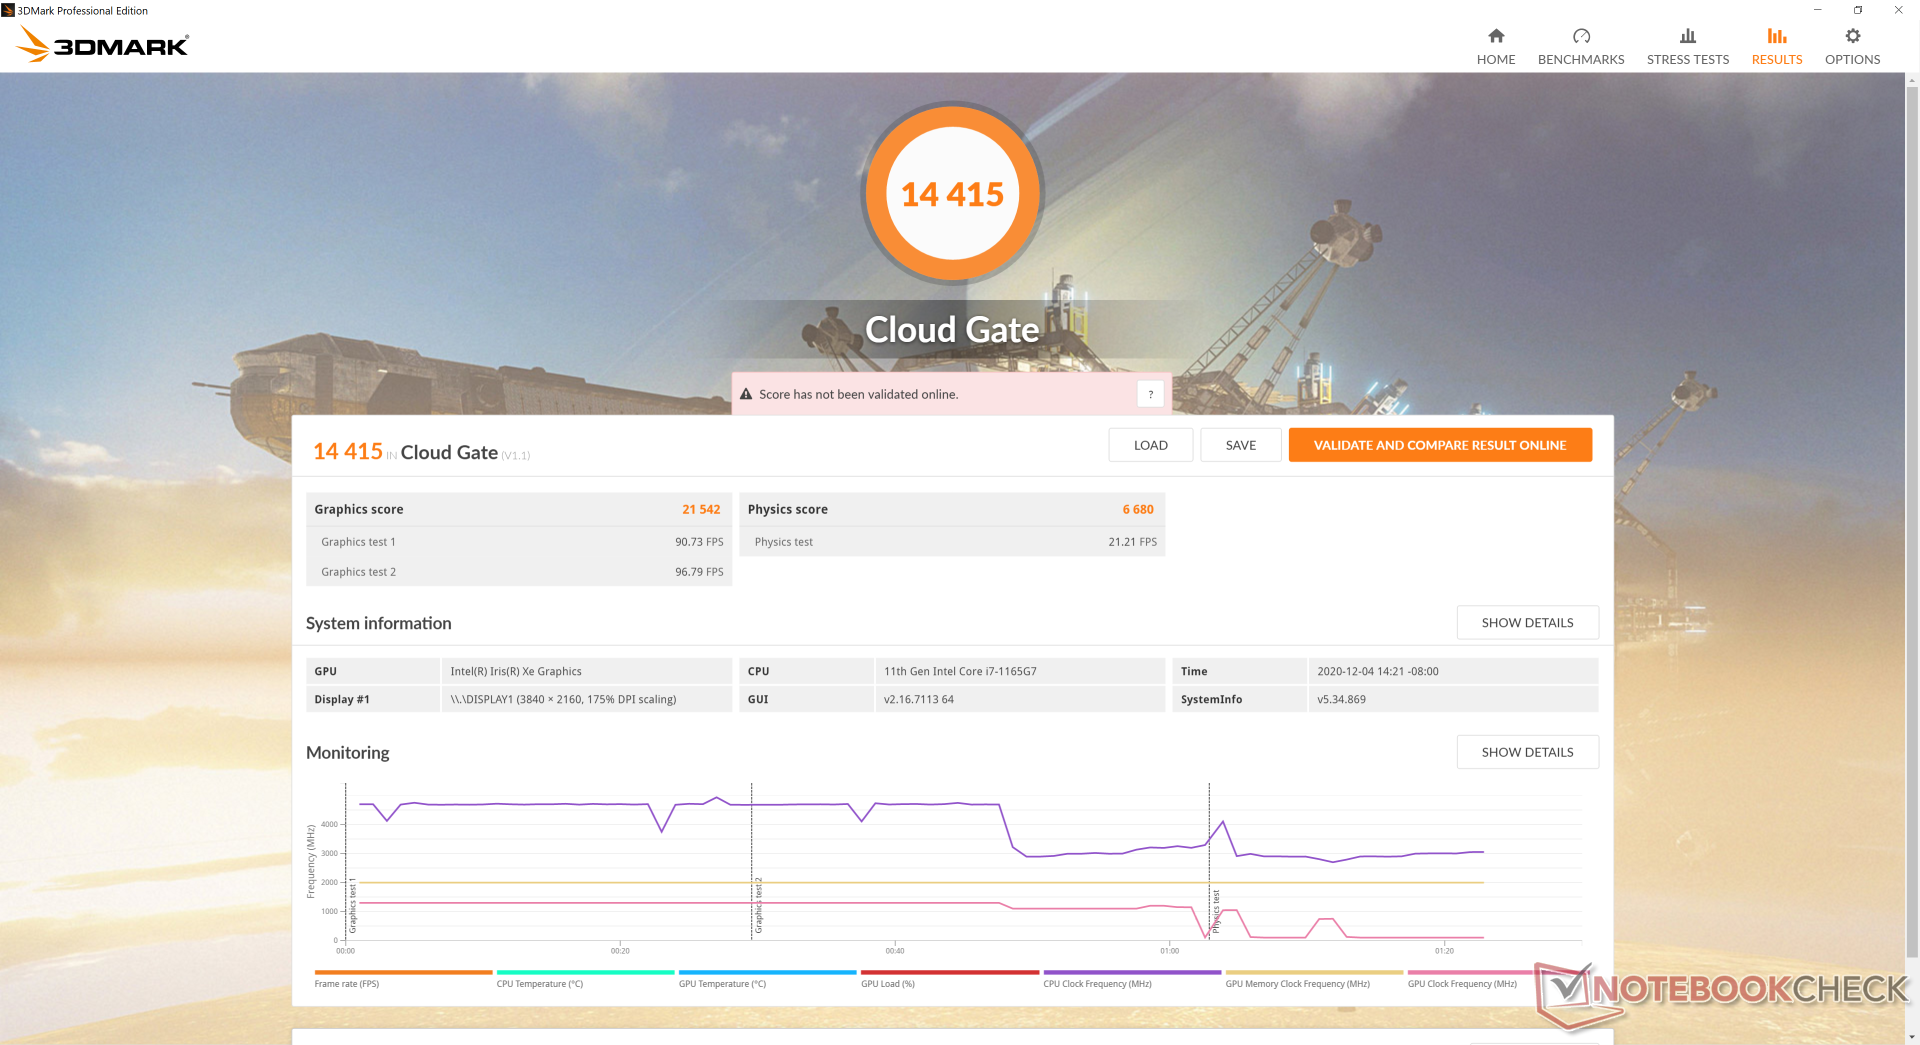
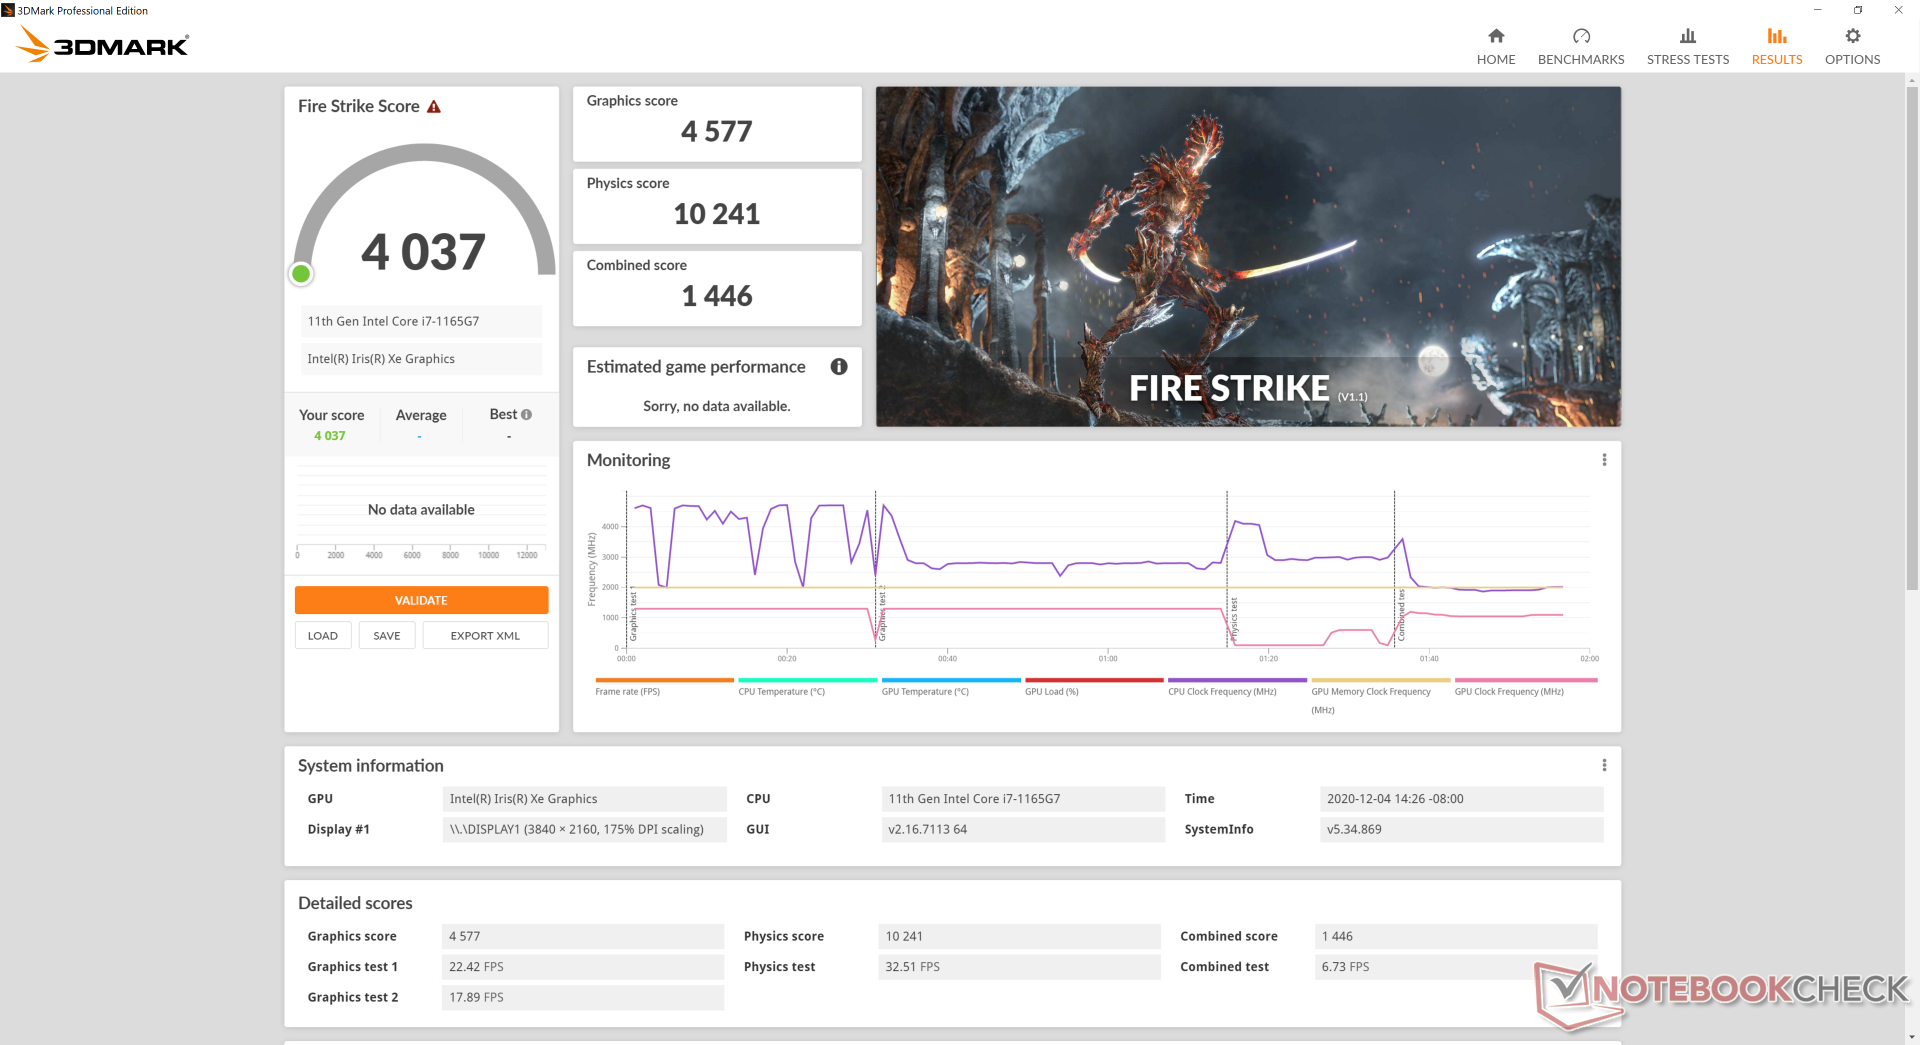
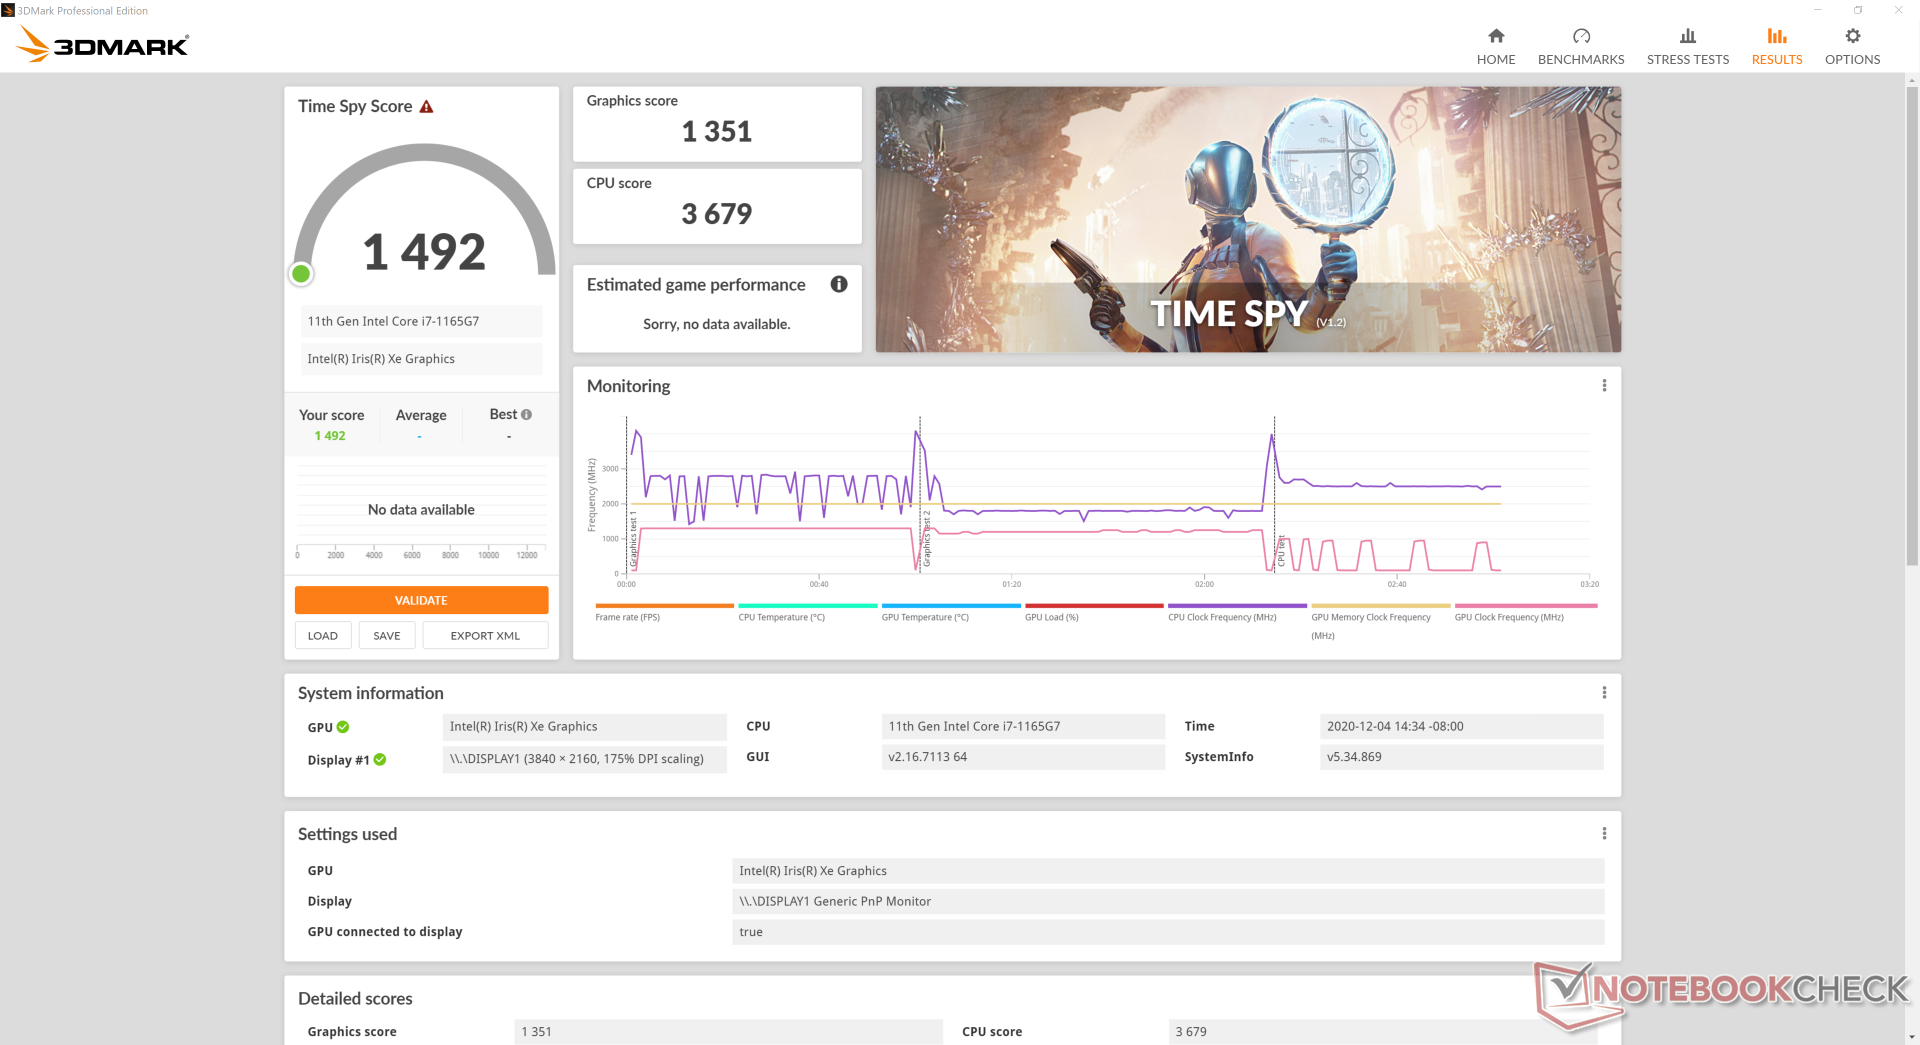
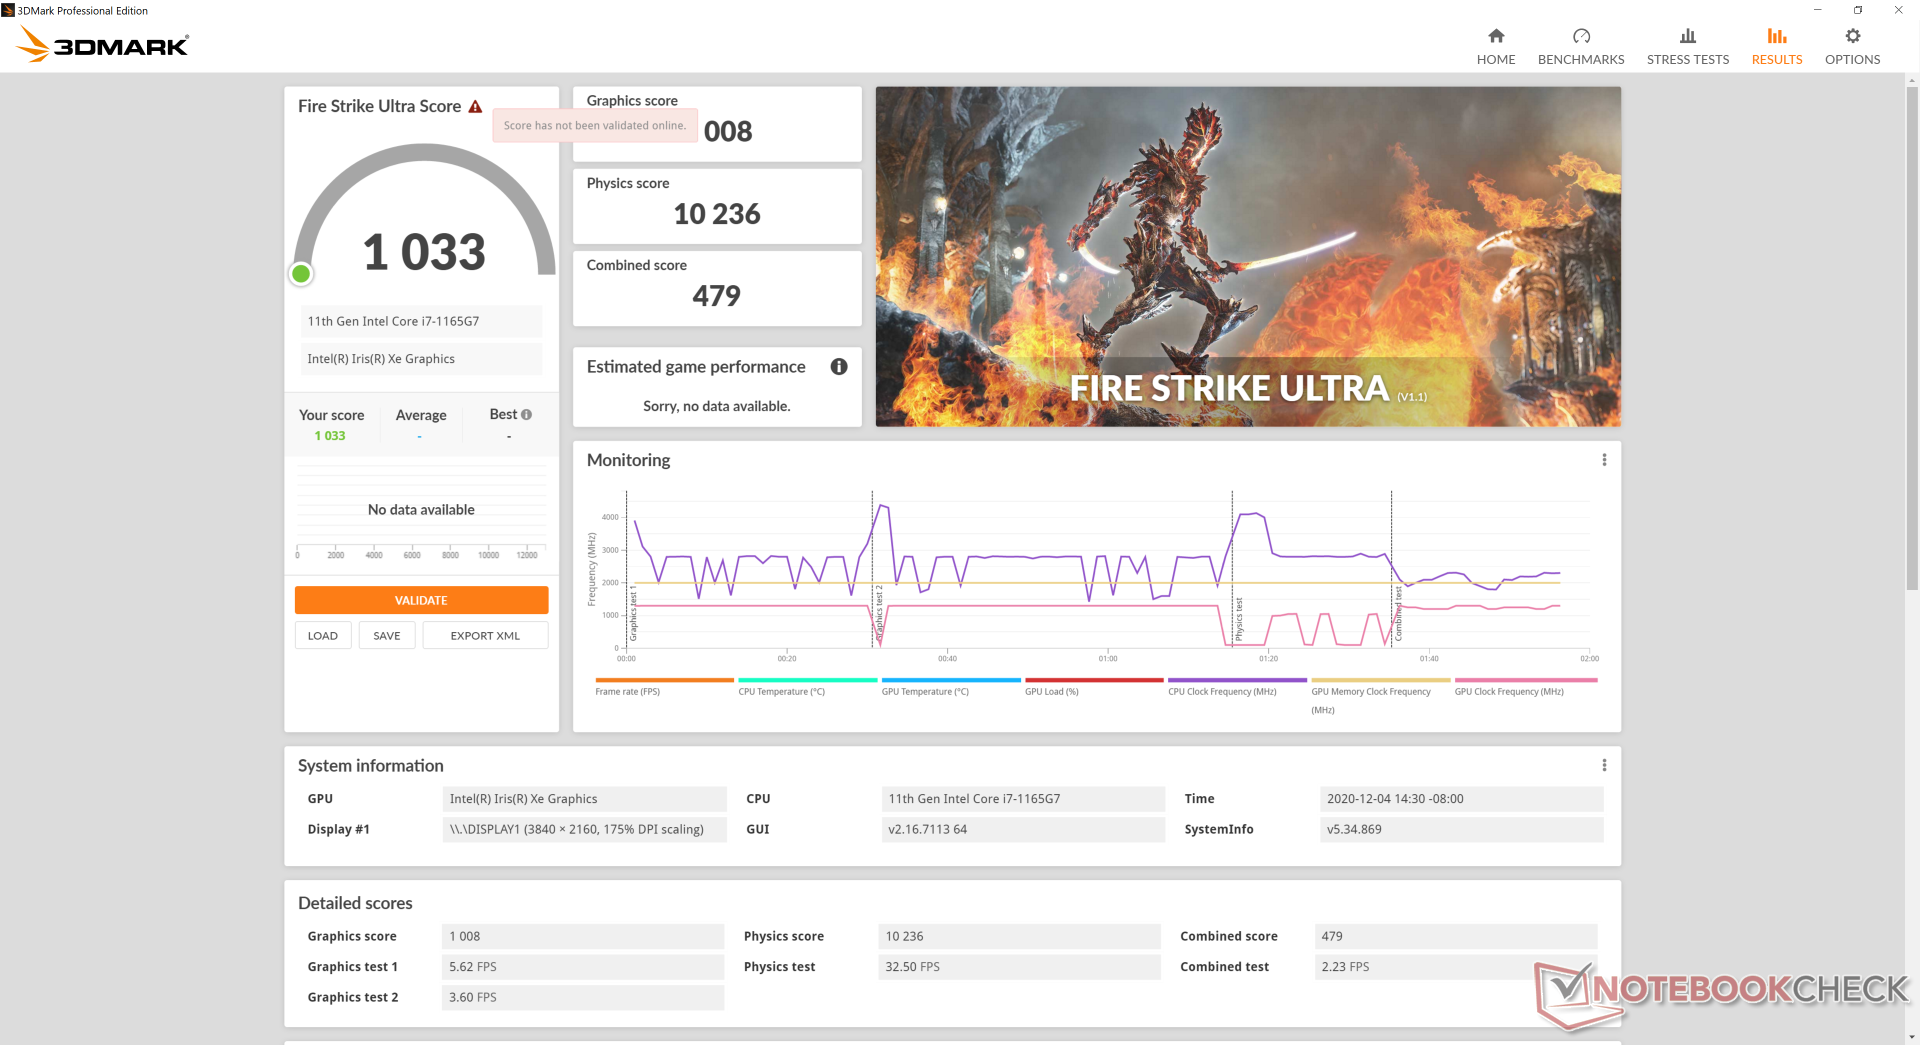
| 3DMark 11 Performance | 6517 points | |
| 3DMark Cloud Gate Standard Score | 14415 points | |
| 3DMark Fire Strike Score | 4037 points | |
| 3DMark Time Spy Score | 1492 points | |
Help | ||
| low | med. | high | ultra | |
|---|---|---|---|---|
| GTA V (2015) | 80.1 | 67 | 19.7 | 7.94 |
| The Witcher 3 (2015) | 72.1 | 48.9 | 29.3 | 12.9 |
| Dota 2 Reborn (2015) | 81.5 | 56.6 | 41.5 | 39.3 |
| Final Fantasy XV Benchmark (2018) | 33.8 | 18.3 | 14.5 | |
| X-Plane 11.11 (2018) | 54.9 | 39.8 | 35.9 |
Emissions
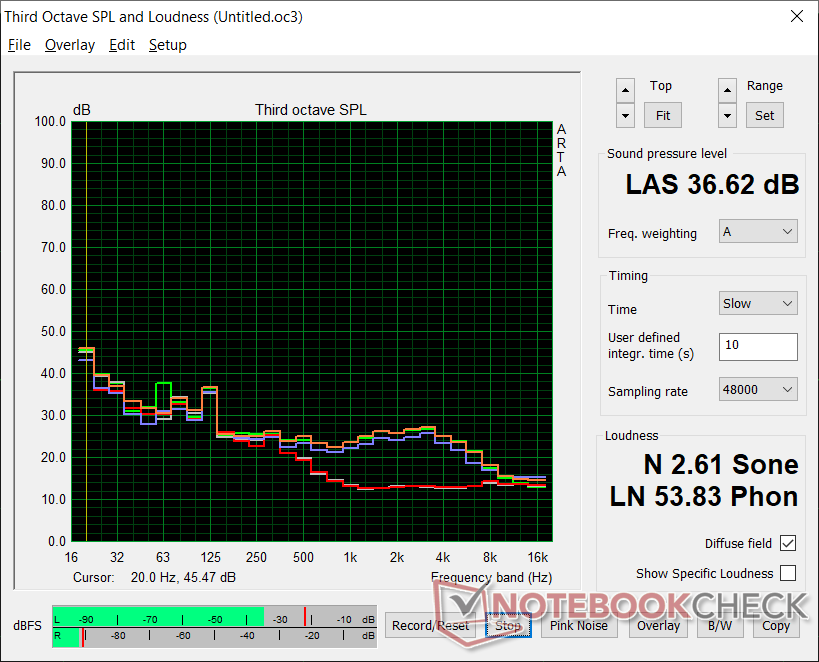
System Noise
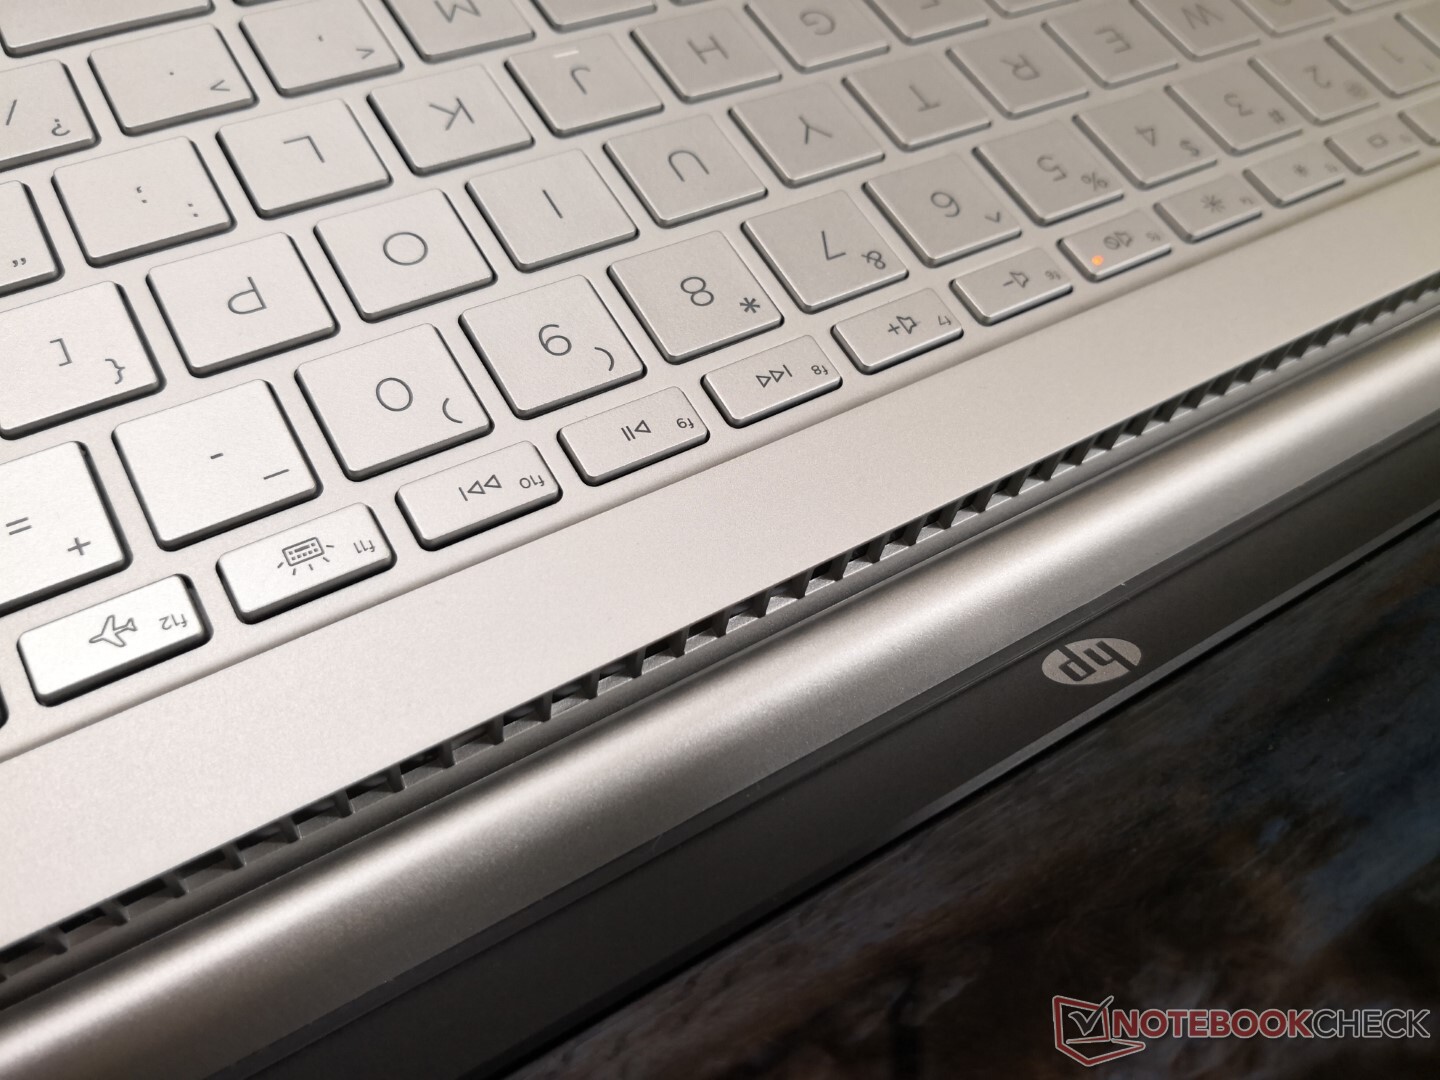
Fan noise isn't an issue as the system remains quiet with no pulsing behavior during low to low-medium loads like web surfing or video streaming. Running higher loads like 3DMark 06 or games would steadily bump fan noise up to a maximum of 36 or 37 dB(A) to be audible but not distracting. Once the demanding load stops, the fan would quickly dial back down.
| HP Pavilion 13-bb0015cl Iris Xe G7 96EUs, i7-1165G7, Samsung PM991 MZVLQ512HALU | HP Envy 13-ba0001ng GeForce MX350, i7-10510U, Intel SSD 660p SSDPEKNW512G8 | Dell XPS 13 9300 i5 FHD UHD Graphics G1 (Ice Lake 32 EU), i5-1035G1, Toshiba XG6 KXG60ZNV512G | Asus VivoBook S13 S330UA-EY034T UHD Graphics 620, i5-8550U, Kingston RBU-SNS8180DS3512GJ | Lenovo IdeaPad S540-13ARE-82DL000YGE Vega 6, R5 4600U, WDC PC SN730 SDBPNTY-256G | Acer Swift 3 SF313-52-71Y7 Iris Plus Graphics G7 (Ice Lake 64 EU), i7-1065G7, Intel SSD 660p 1TB SSDPEKNW010T8 | |
|---|---|---|---|---|---|---|
| Noise | 2% | 1% | 1% | 5% | -2% | |
| off / environment * (dB) | 28 | 25.4 9% | 29.3 -5% | 29 -4% | 25 11% | 30.3 -8% |
| Idle Minimum * (dB) | 28 | 25.4 9% | 29.3 -5% | 29 -4% | 25 11% | 30.3 -8% |
| Idle Average * (dB) | 28 | 25.4 9% | 29.3 -5% | 29 -4% | 25 11% | 30.3 -8% |
| Idle Maximum * (dB) | 28 | 25.4 9% | 29.3 -5% | 29 -4% | 25 11% | 30.3 -8% |
| Load Average * (dB) | 35.2 | 40.6 -15% | 30 15% | 29.9 15% | 32.8 7% | 31.7 10% |
| Witcher 3 ultra * (dB) | 36.8 | |||||
| Load Maximum * (dB) | 36.6 | 39.1 -7% | 32.4 11% | 33.3 9% | 44.5 -22% | 32.7 11% |
* ... smaller is better
Noise level
| Idle |
| 28 / 28 / 28 dB(A) |
| Load |
| 35.2 / 36.6 dB(A) |
 | ||
30 dB silent 40 dB(A) audible 50 dB(A) loud |
||
min: | ||
Temperature
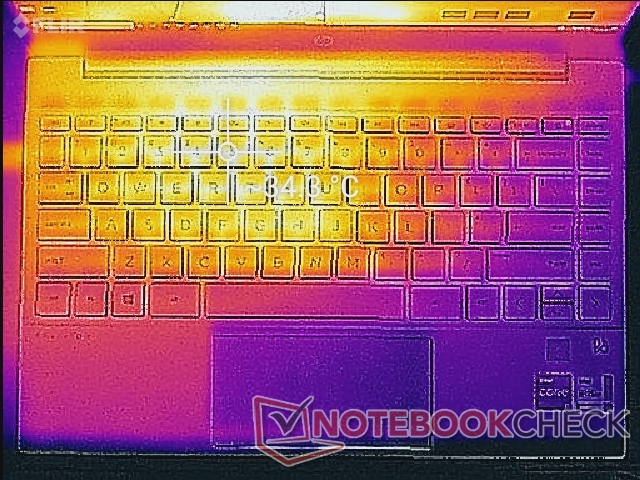
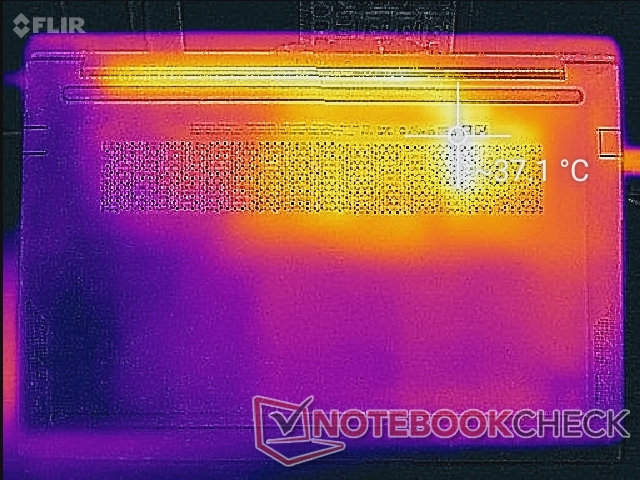
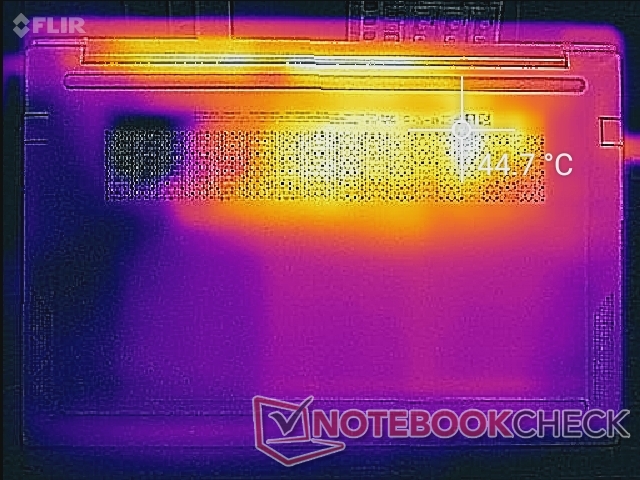
Surface temperatures are warmer on the left half of the chassis than the right half due to the how the processor is positioned inside. This kind of profile is generally undesirable because common keyboard keys like the WASD keys will be much warmer than the rest of the laptop. Hot spots can be as high as 39 C and 45 C on the top and bottom surfaces, respectively, when running high loads like gaming. Though the temperatures are noticeable, they're thankfully not extreme enough to be distracting or uncomfortable.

(+) The maximum temperature on the upper side is 37.6 °C / 100 F, compared to the average of 35.9 °C / 97 F, ranging from 21.4 to 59 °C for the class Subnotebook.
(-) The bottom heats up to a maximum of 45.2 °C / 113 F, compared to the average of 39.2 °C / 103 F
(+) In idle usage, the average temperature for the upper side is 30.1 °C / 86 F, compared to the device average of 30.8 °C / 87 F.
(+) The palmrests and touchpad are cooler than skin temperature with a maximum of 28.2 °C / 82.8 F and are therefore cool to the touch.
(±) The average temperature of the palmrest area of similar devices was 28.2 °C / 82.8 F (0 °C / 0 F).

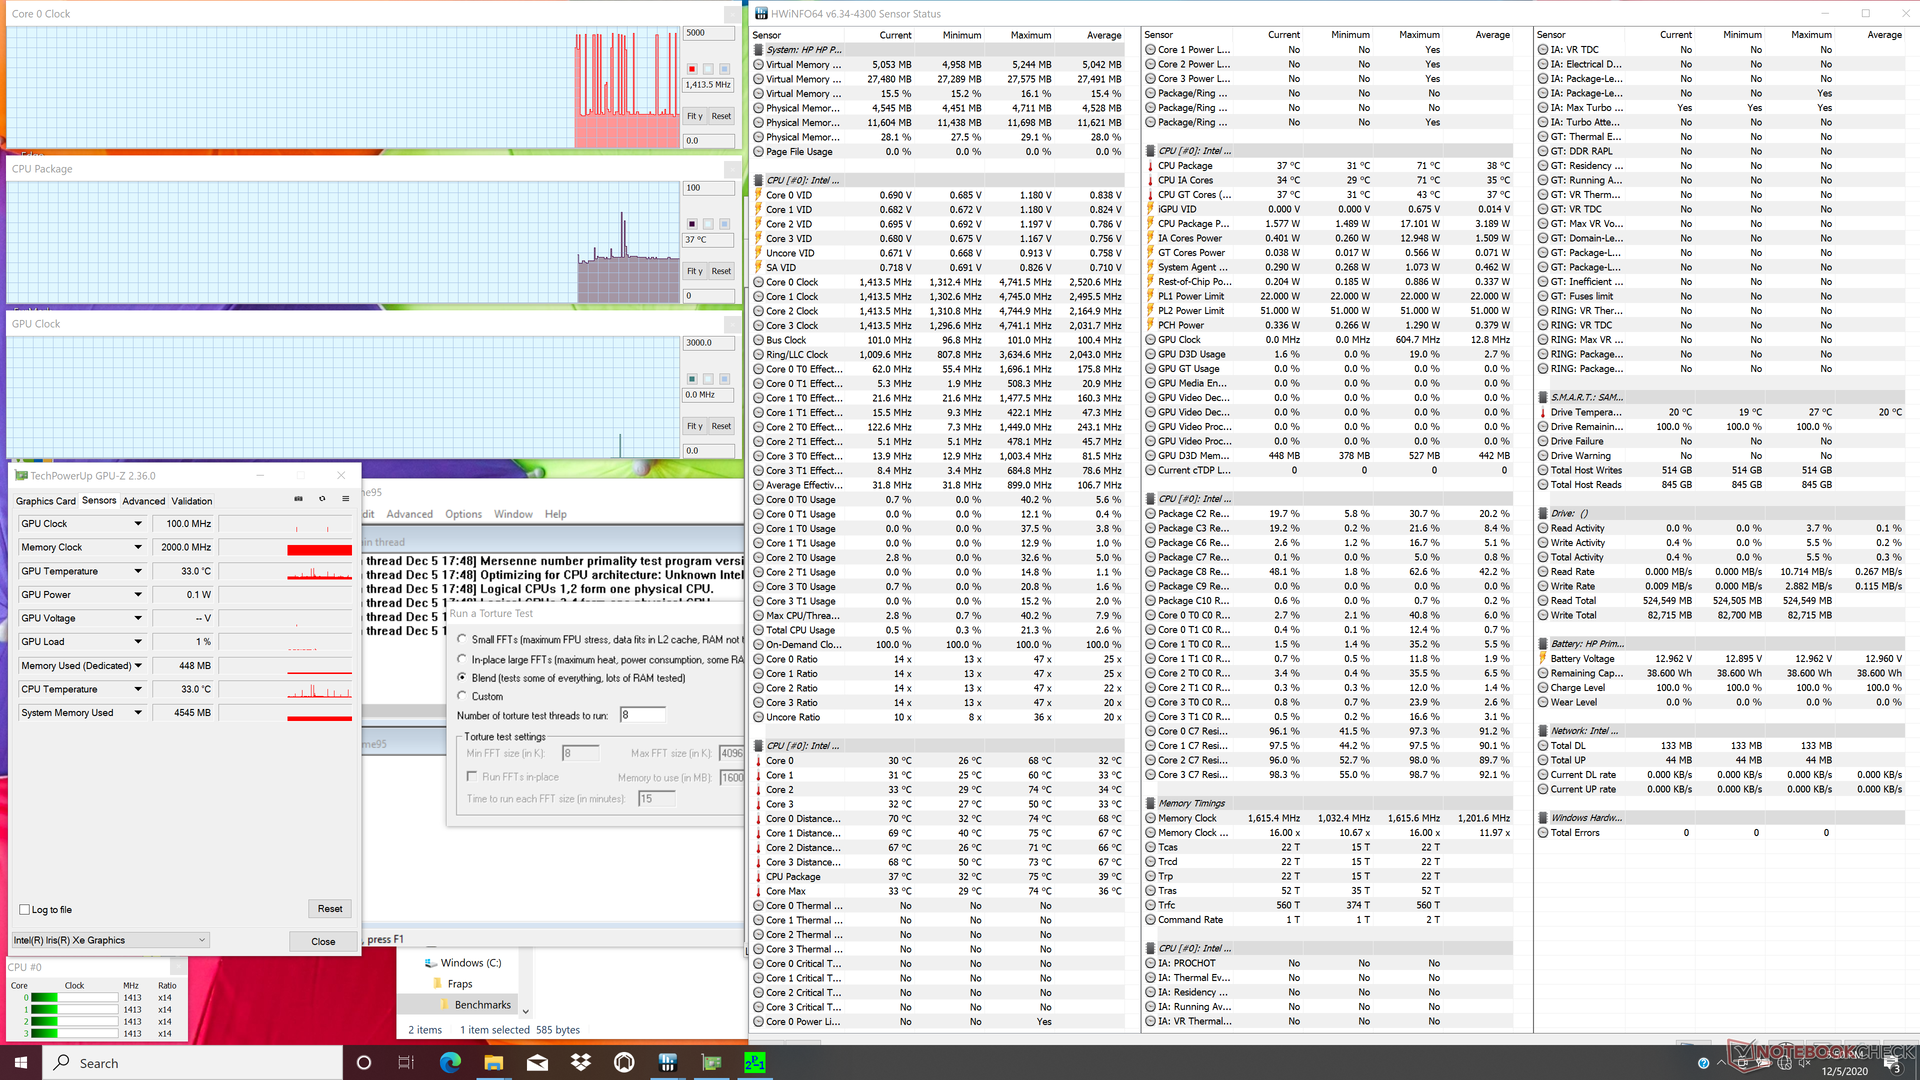
Stress Test
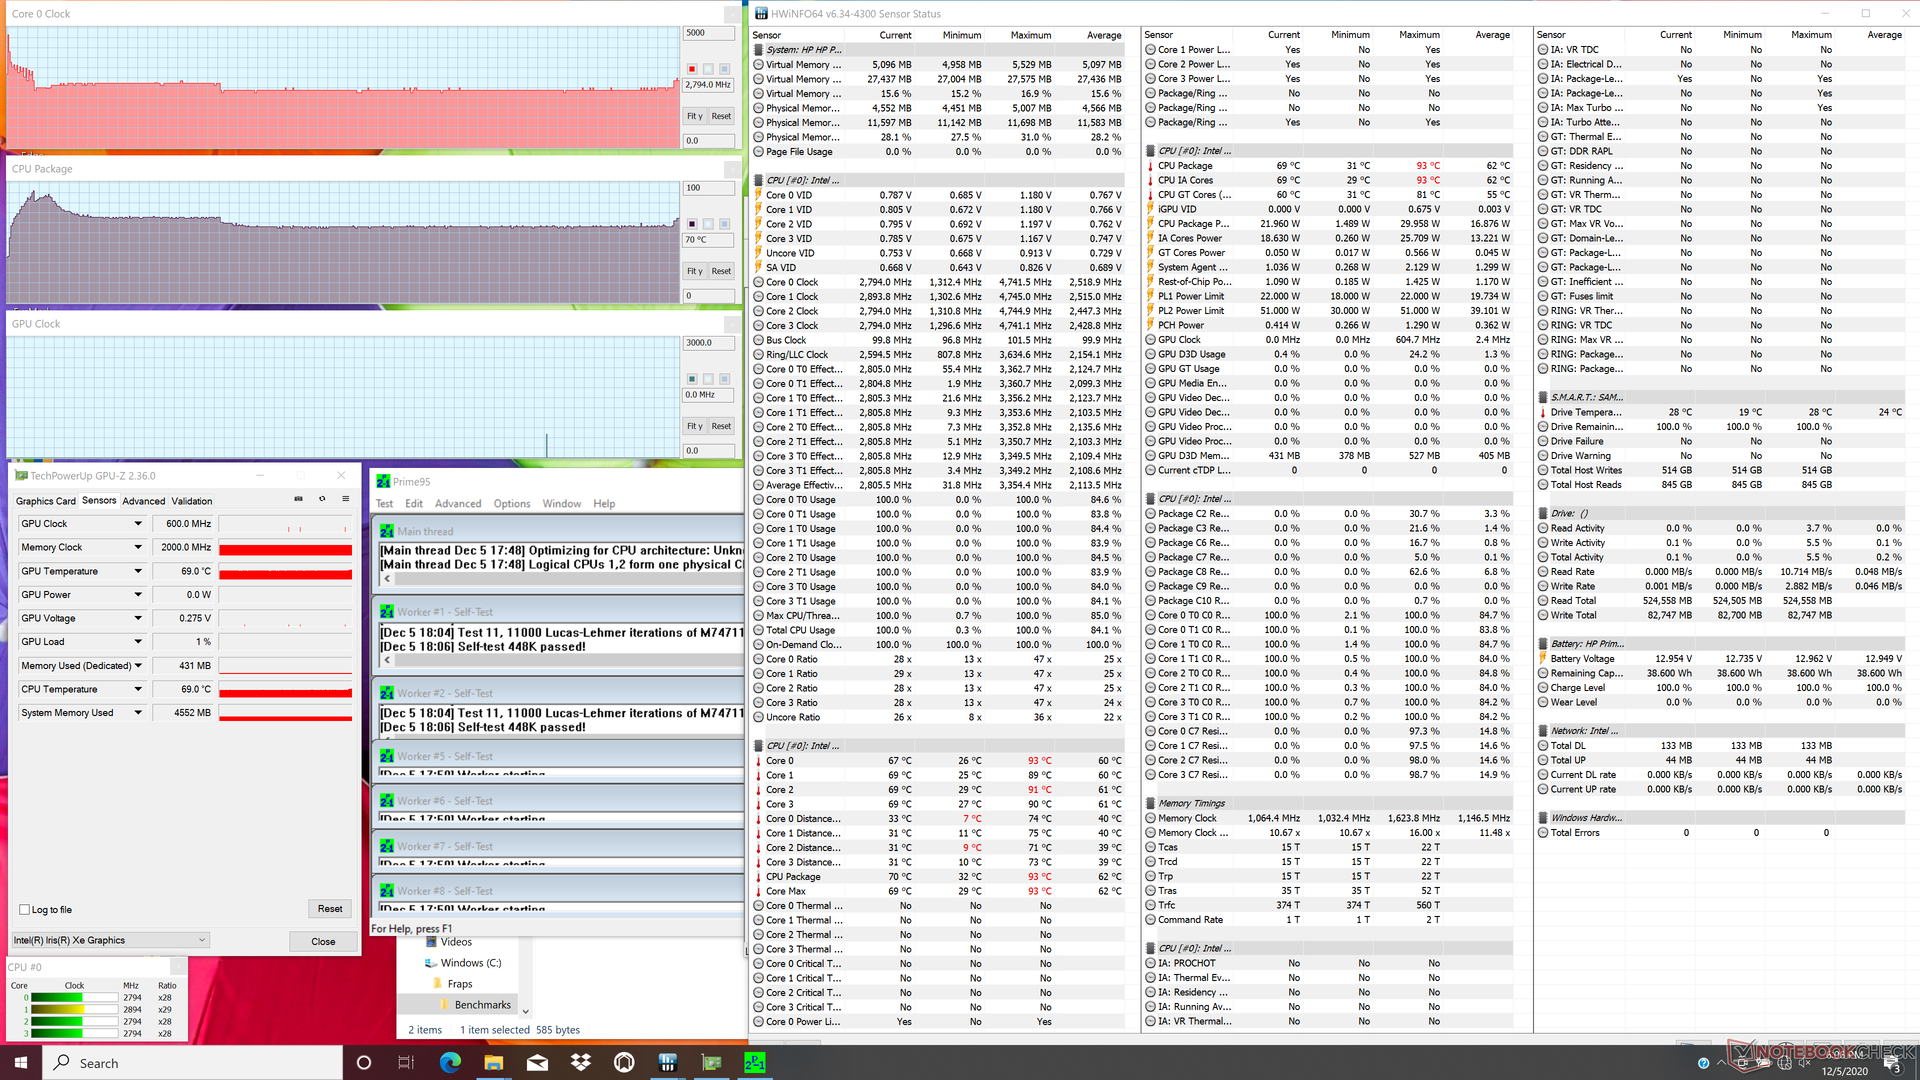
When running Prime95 to the stress the processor, CPU clock rates would boost to 3.5 GHz for the first few seconds until reaching a core temperature of 93 C. Thereafter, clock rates would drop to 2.7 GHz and then finally to 2.4 GHz in order to maintain a core temperature of 63 C. Results are quite similar to what we observed on the Asus ZenBook UX425 equipped with the same Core i7-1165G7 CPU.
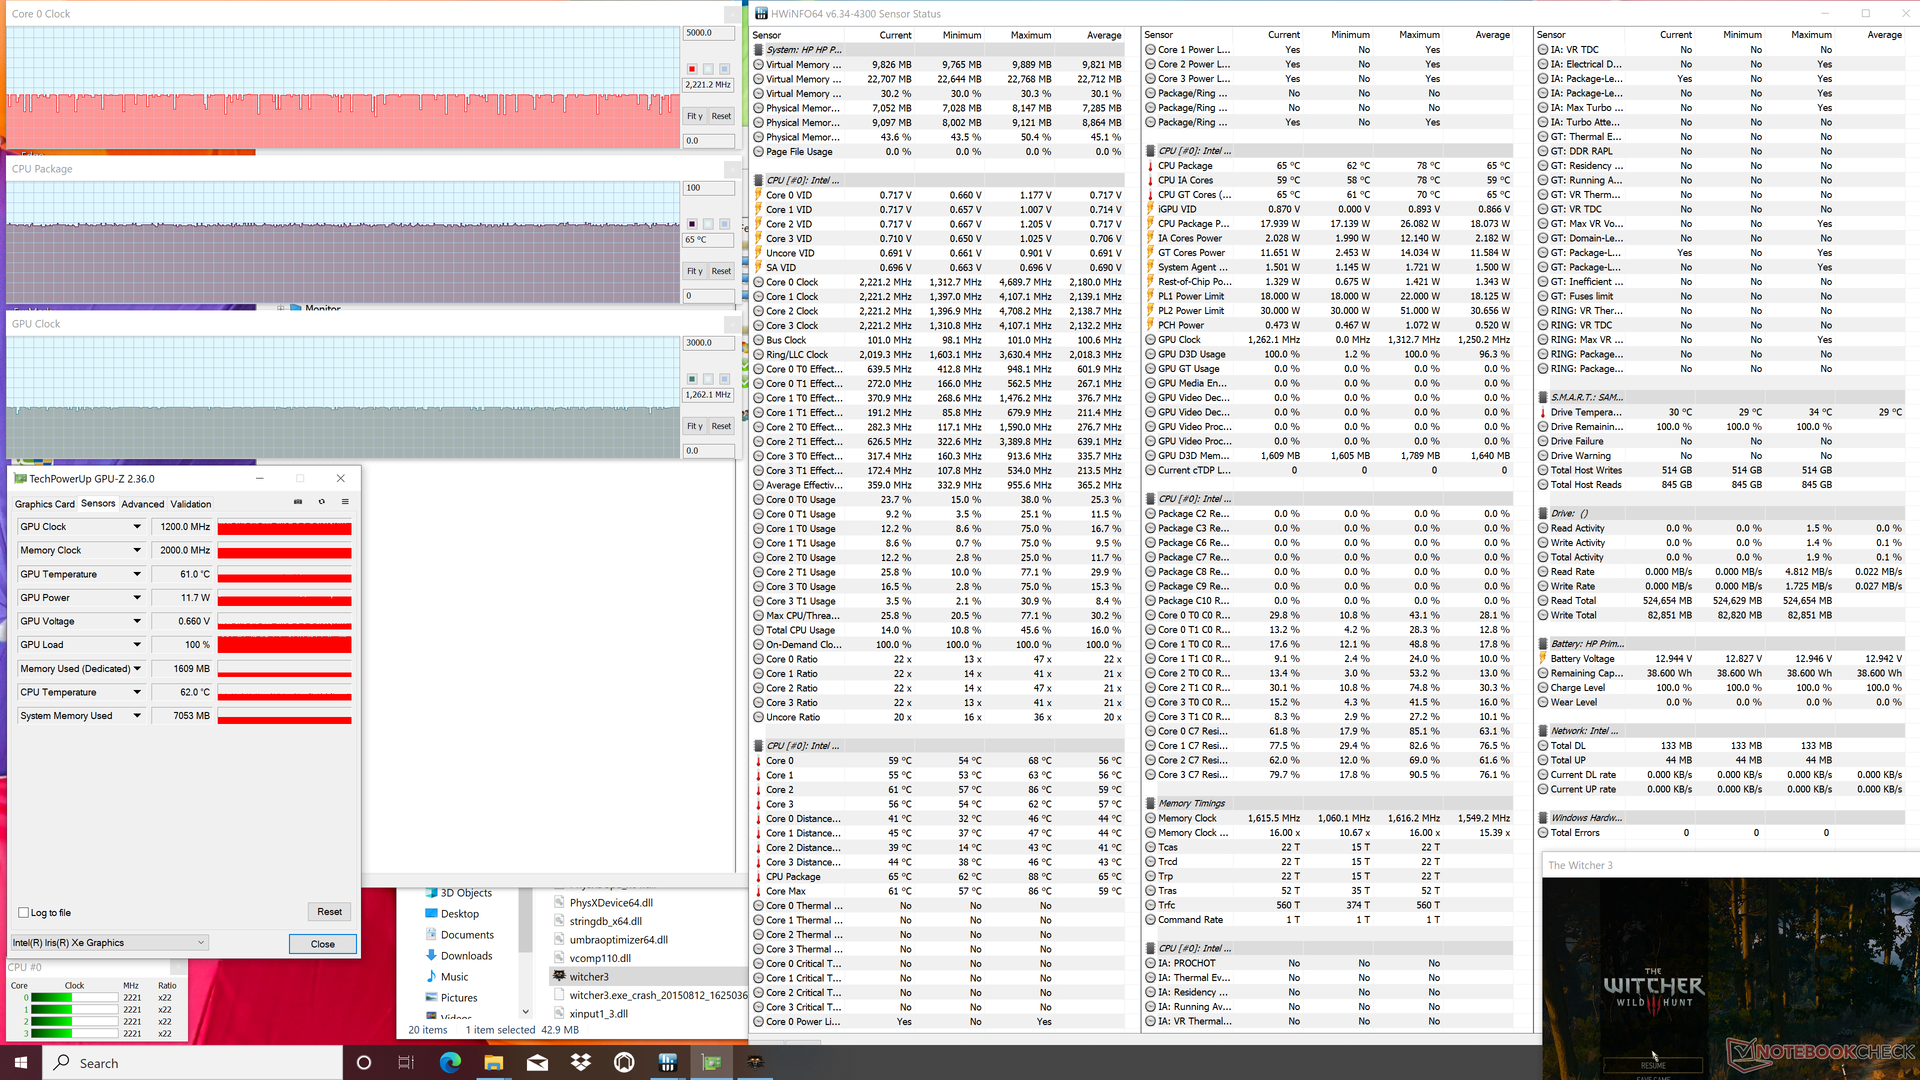
When running Prime95 and FurMark simultaneously, CPU and GPU clock rates would sometimes alternate between 1.2 GHz and 1.5 GHz and 0.8 GHz and 1000 MHz, respectively, instead of remaining constant. This can also occur when gaming which can explain the cycling frame rate behavior when running Witcher 3 as noted above.
Running on battery power will limit GPU performance more heavily than CPU performance. A 3DMark 11 test on batteries would return Physics and Graphics scores of 8026 and 4714 points, respectively, compared to 8519 and 6578 points when on mains.

| CPU Clock (GHz) | GPU Clock (MHz) | Average CPU Temperature (°C) | |
| System Idle | -- | -- | 37 |
| Prime95 Stress | 2.4 | -- | 63 |
| Prime95 + FurMark Stress | 1.2 | 800 | 64 |
| Witcher 3 Stress | 1.6 - 2.2 | 1200 | 65 |
Speakers


HP Pavilion 13-bb0015cl audio analysis
(+) | speakers can play relatively loud (82.6 dB)
Bass 100 - 315 Hz
(-) | nearly no bass - on average 17.1% lower than median
(±) | linearity of bass is average (12% delta to prev. frequency)
Mids 400 - 2000 Hz
(+) | balanced mids - only 1% away from median
(+) | mids are linear (1.5% delta to prev. frequency)
Highs 2 - 16 kHz
(+) | balanced highs - only 2.6% away from median
(+) | highs are linear (6.1% delta to prev. frequency)
Overall 100 - 16.000 Hz
(+) | overall sound is linear (12% difference to median)
Compared to same class
» 14% of all tested devices in this class were better, 4% similar, 82% worse
» The best had a delta of 5%, average was 18%, worst was 53%
Compared to all devices tested
» 9% of all tested devices were better, 2% similar, 89% worse
» The best had a delta of 4%, average was 24%, worst was 134%
Apple MacBook 12 (Early 2016) 1.1 GHz audio analysis
(+) | speakers can play relatively loud (83.6 dB)
Bass 100 - 315 Hz
(±) | reduced bass - on average 11.3% lower than median
(±) | linearity of bass is average (14.2% delta to prev. frequency)
Mids 400 - 2000 Hz
(+) | balanced mids - only 2.4% away from median
(+) | mids are linear (5.5% delta to prev. frequency)
Highs 2 - 16 kHz
(+) | balanced highs - only 2% away from median
(+) | highs are linear (4.5% delta to prev. frequency)
Overall 100 - 16.000 Hz
(+) | overall sound is linear (10.2% difference to median)
Compared to same class
» 7% of all tested devices in this class were better, 2% similar, 91% worse
» The best had a delta of 5%, average was 18%, worst was 53%
Compared to all devices tested
» 5% of all tested devices were better, 1% similar, 94% worse
» The best had a delta of 4%, average was 24%, worst was 134%
Energy Management
Power Consumption
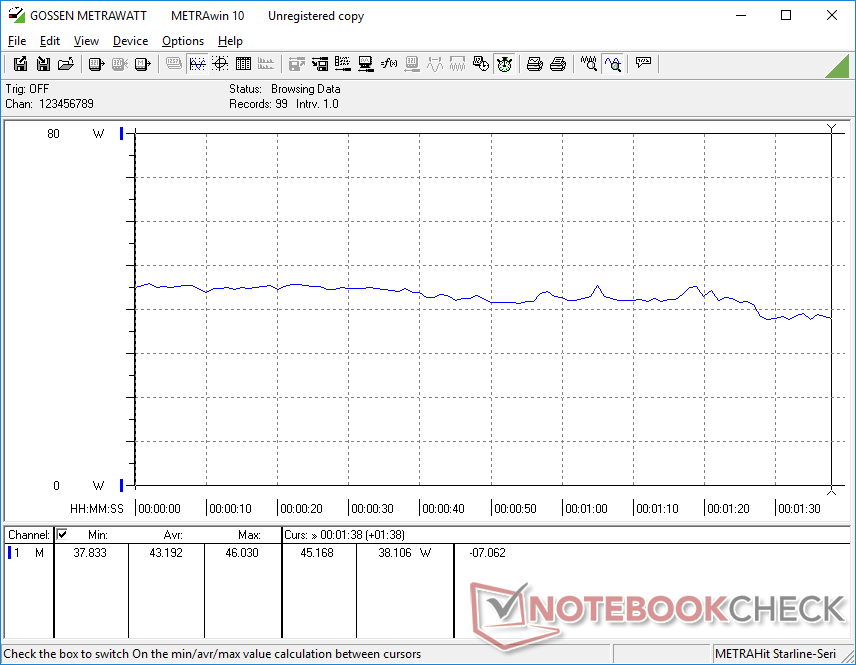
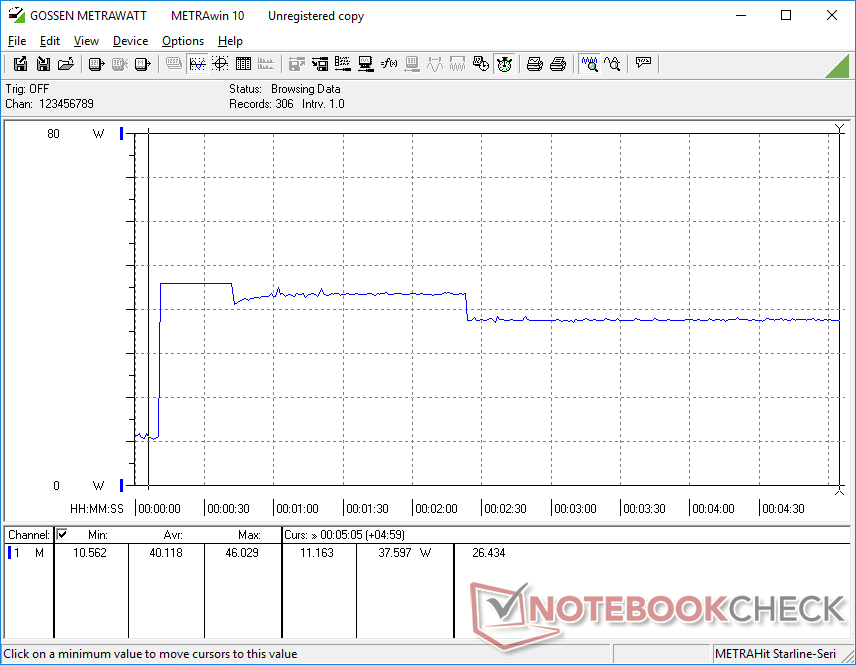
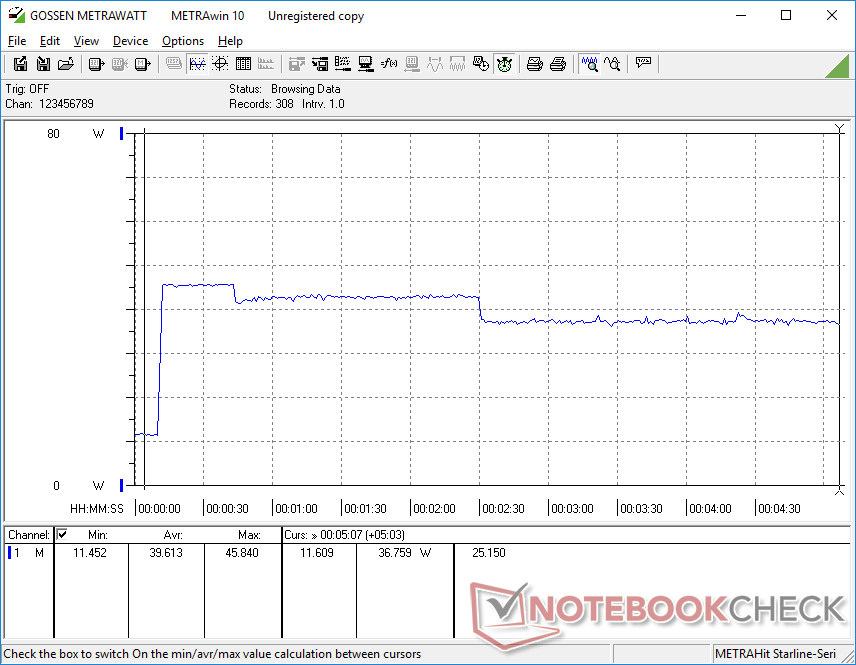
Idling on desktop consumes between 4 W and 12 W depending on the brightness level and power profile. In fact, the difference between minimum and maximum brightness can be as high as 6 W. Running higher loads like games will consume between 40 W and 46 W to be roughly comparable to many other 13-inch laptops with older and slower processors. Thus, the newer Tiger Lake CPU is able to provide tremendous gains in graphics power without needing to draw more from the outlet.
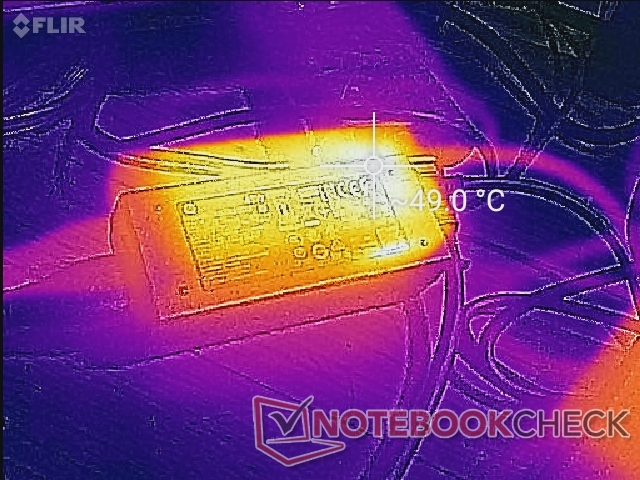
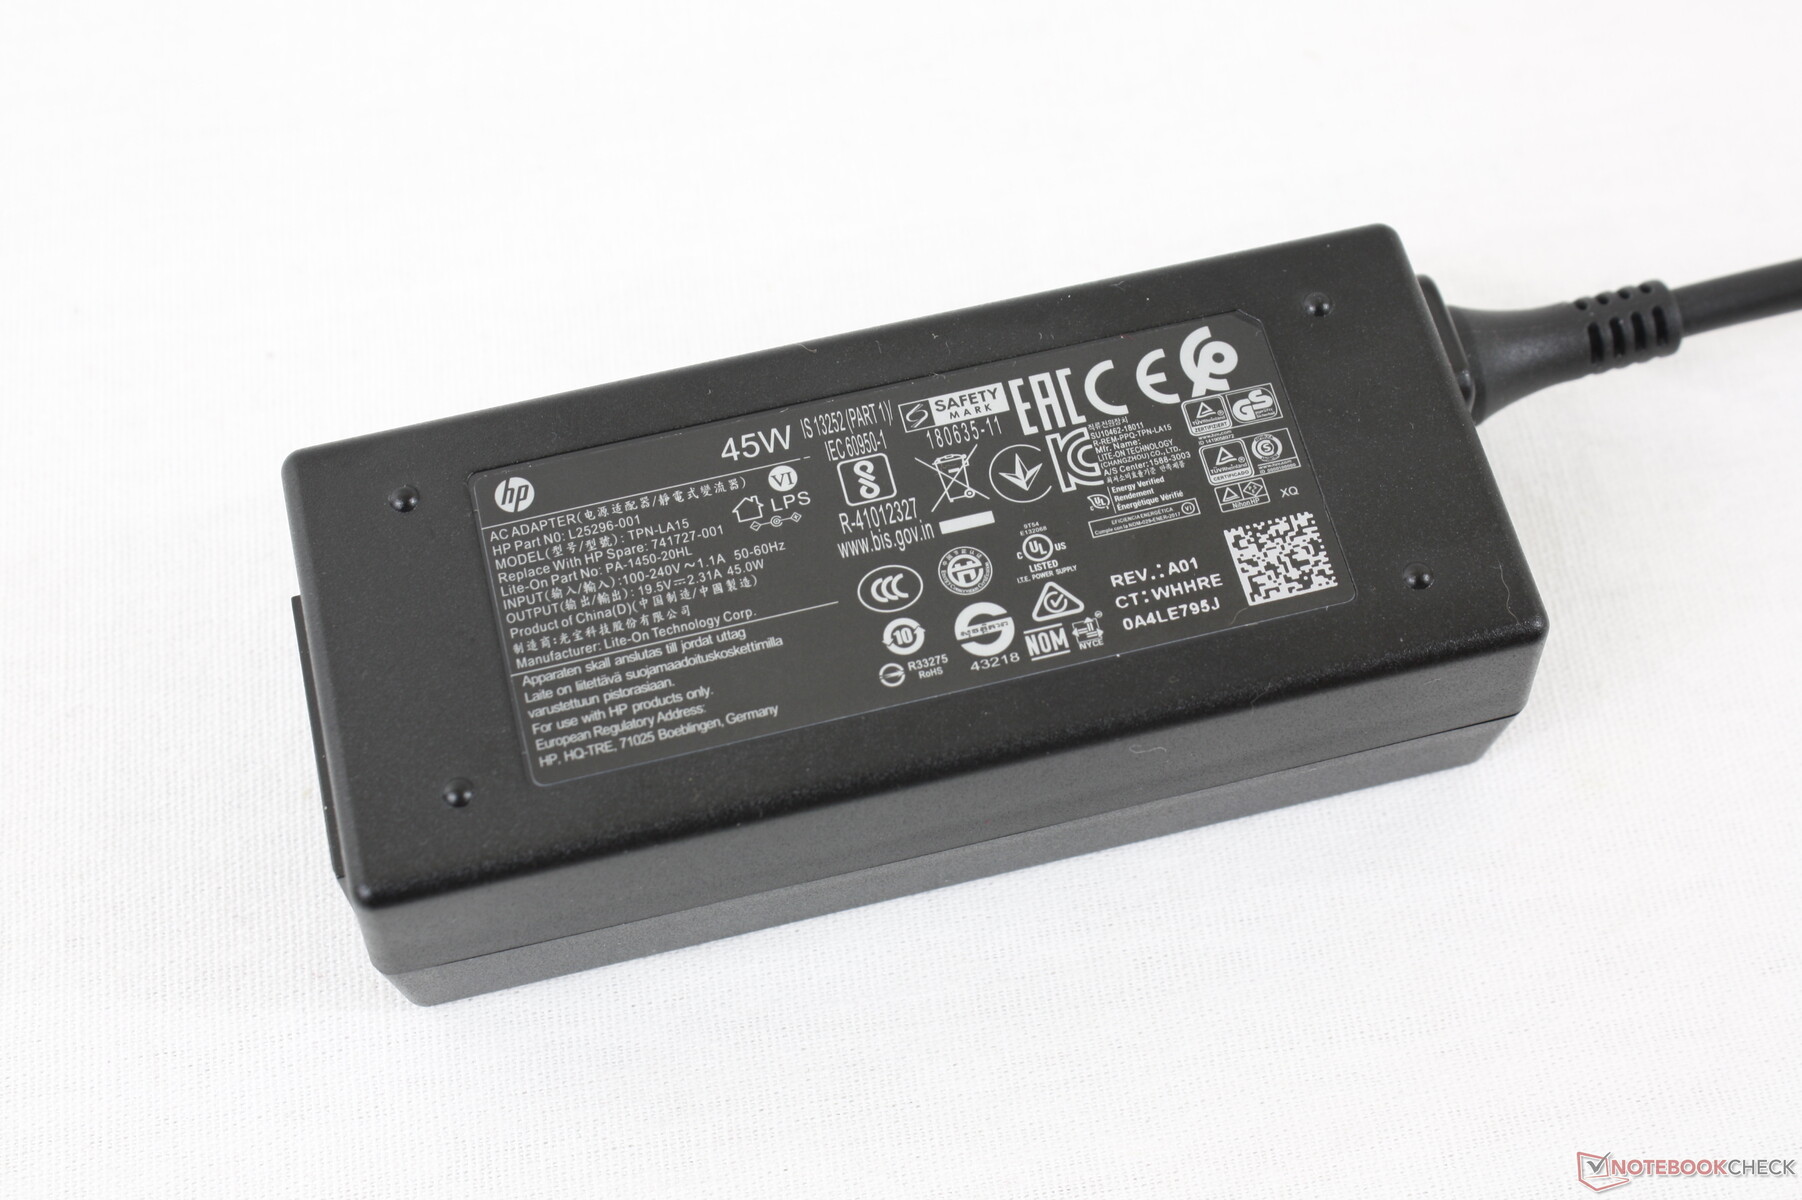
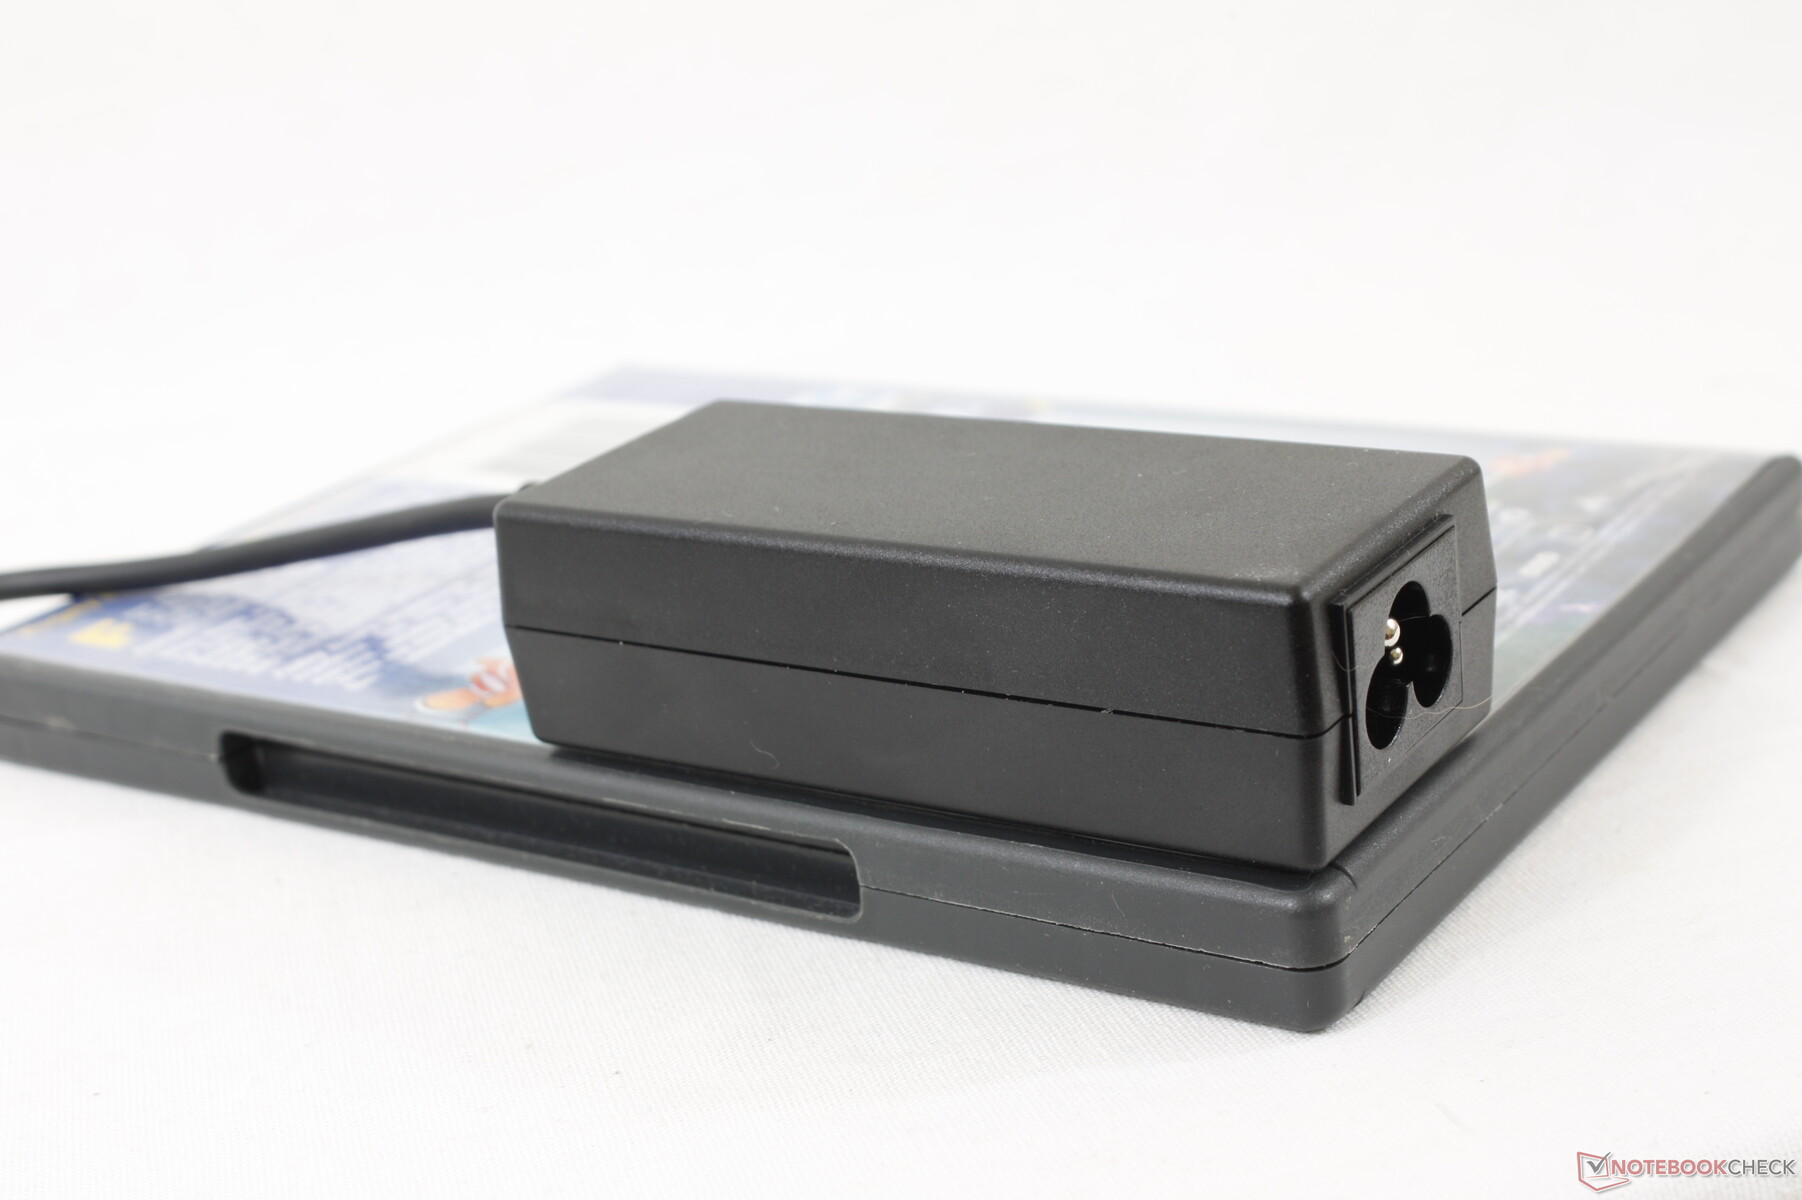
A temporary maximum of 46 W can be recorded from the small (~10 x 4 x 2.7 cm) 45 W AC adapter.

| Off / Standby | |
| Idle | |
| Load |
|
Key:
min: | |
| HP Pavilion 13-bb0015cl i7-1165G7, Iris Xe G7 96EUs, Samsung PM991 MZVLQ512HALU, IPS, 3840x2160, 13.3" | HP Envy 13-ba0001ng i7-10510U, GeForce MX350, Intel SSD 660p SSDPEKNW512G8, IPS, 1920x1080, 13.3" | Dell XPS 13 9300 i5 FHD i5-1035G1, UHD Graphics G1 (Ice Lake 32 EU), Toshiba XG6 KXG60ZNV512G, IPS, 1920x1200, 13.4" | Asus VivoBook S13 S330UA-EY034T i5-8550U, UHD Graphics 620, Kingston RBU-SNS8180DS3512GJ, IPS LED, 1920x1080, 13.3" | Lenovo IdeaPad S540-13ARE-82DL000YGE R5 4600U, Vega 6, WDC PC SN730 SDBPNTY-256G, IPS, 2560x1600, 13.3" | Acer Swift 3 SF313-52-71Y7 i7-1065G7, Iris Plus Graphics G7 (Ice Lake 64 EU), Intel SSD 660p 1TB SSDPEKNW010T8, IPS, 2256x1504, 13.5" | |
|---|---|---|---|---|---|---|
| Power Consumption | 28% | 18% | 15% | -0% | 48% | |
| Idle Minimum * (Watt) | 4.6 | 2 57% | 3.4 26% | 2.8 39% | 1.8 61% | |
| Idle Average * (Watt) | 10.6 | 4 62% | 6 43% | 5 53% | 4.6 57% | |
| Idle Maximum * (Watt) | 11.4 | 6.5 43% | 10.2 11% | 8.3 27% | 9.4 18% | 6.1 46% |
| Load Average * (Watt) | 43.2 | 44 -2% | 36.6 15% | 42.8 1% | 37.6 13% | 27.4 37% |
| Witcher 3 ultra * (Watt) | 39.9 | |||||
| Load Maximum * (Watt) | 46 | 55.6 -21% | 49.3 -7% | 65.8 -43% | 60.7 -32% | 27 41% |
* ... smaller is better
Battery Life
Battery capacity is small and runtimes are subsequently short at just 4.5 hours of real-world WLAN use. In comparison, the costlier Envy or Spectre laptops can last for over two times longer when under similar conditions.
Charging from empty to full capacity takes about 1.5 to 2 hours. The laptop can also recharge via USB-C even though the retail box includes a proprietary barrel charger.
| HP Pavilion 13-bb0015cl i7-1165G7, Iris Xe G7 96EUs, 43 Wh | HP Envy 13-ba0001ng i7-10510U, GeForce MX350, 51 Wh | Dell XPS 13 9300 i5 FHD i5-1035G1, UHD Graphics G1 (Ice Lake 32 EU), 52 Wh | Asus VivoBook S13 S330UA-EY034T i5-8550U, UHD Graphics 620, 42 Wh | Lenovo IdeaPad S540-13ARE-82DL000YGE R5 4600U, Vega 6, 56 Wh | Acer Swift 3 SF313-52-71Y7 i7-1065G7, Iris Plus Graphics G7 (Ice Lake 64 EU), 54.5 Wh | |
|---|---|---|---|---|---|---|
| Battery runtime | 88% | 161% | 87% | 79% | 101% | |
| Reader / Idle (h) | 10.8 | 15.7 45% | 21 94% | 21.4 98% | ||
| WiFi v1.3 (h) | 4.5 | 10.5 133% | 11.7 160% | 8.4 87% | 11 144% | 10.3 129% |
| Load (h) | 1.3 | 2.4 85% | 3.4 162% | 1.3 0% | 2.3 77% |
Pros
Cons
Verdict
For $730 USD, the Pavilion 13 comes with the Intel Core i7-1165G7 CPU, integrated Iris Xe graphics, 1080p display, 16 GB of RAM, and 512 GB NVMe SSD all wrapped in a solid chassis that feels significantly better than previous generation models. The value buyers are getting is the Pavilion's strongest selling point here especially when considering the high performance-per-dollar and decent casual gaming capabilities.
Users will be giving up long battery life, Windows Hello, Thunderbolt support, and easy serviceability. The spongy Enter key and clickpad will also take some getting used to and we hope HP can strengthen the hinges for future models. But for a budget laptop, the 2020 Pavilion 13 excels in almost all the right areas for strong impressions.
The 2020 Pavilion 13 offers high specifications and performance relative to the price and size. The Spectre-inspired chassis design helps the laptop look and feel more like a mid-range laptop without costing nearly as much.
HP Pavilion 13-bb0015cl
- 12/08/2020 v7 (old)
Allen Ngo
Price comparison
