

Lenovo IdeaPad S540 13-inch Laptop Review: Ryzen has turned this small office laptop into a real powerhouse
Lenovo has launched its new 13.3-inch version of the S540. We reviewed its predecessor about a year ago and were very happy with it. The new model is now equipped with a Ryzen 5 4600U instead of the older Ryzen 5 3550H. Unfortunately, this is only accompanied by an RX Vega 6 rather than the Vega 8 that was in last year's model. Our test unit also only has 8 rather than 16 GB of RAM, which is firmly soldered on. Let's find out whether the new S540 has managed to stay on par with its predecessor and whether it would be worth switching to this model.
Please note: This device is not available in the US this configuration at the time of writing.
Comparable 13-inch laptops usually cost more than the S540's 750 Euro (~$900) price tag. Our selection of comparison devices is listed below.
Rating | Date | Model | Weight | Height | Size | Resolution | Price |
|---|---|---|---|---|---|---|---|
| 85 % v7 (old) | 11 / 2020 | Lenovo IdeaPad S540-13ARE-82DL000YGE R5 4600U, Vega 6 | 1.3 kg | 15.95 mm | 13.30" | 2560x1600 | |
| 84.9 % v7 (old) | 12 / 2019 | Lenovo IdeaPad S540-13API R5 3550H, Vega 8 | 1.3 kg | 16 mm | 13.30" | 2560x1600 | |
| 86.8 % v7 (old) | 09 / 2020 | HP ProBook x360 435 G7, Ryzen 5 4500U R5 4500U, Vega 6 | 1.4 kg | 17.9 mm | 13.30" | 1920x1080 | |
| 85.9 % v7 (old) | 06 / 2020 | Acer Swift 3 SF313-52-52AS i5-1035G4, Iris Plus Graphics G4 (Ice Lake 48 EU) | 1.2 kg | 16.6 mm | 13.50" | 2256x1504 | |
| 84 % v7 (old) | 02 / 2020 | Microsoft Surface Laptop 3 13 Core i5-1035G7 i5-1035G7, Iris Plus Graphics G7 (Ice Lake 64 EU) | 1.3 kg | 14.5 mm | 13.50" | 2256x1504 | |
| 88 % v7 (old) | 04 / 2020 | Apple MacBook Air 2020 i5 i5-1030NG7, Iris Plus Graphics G7 (Ice Lake 64 EU) | 1.3 kg | 16.1 mm | 13.30" | 2560x1600 |
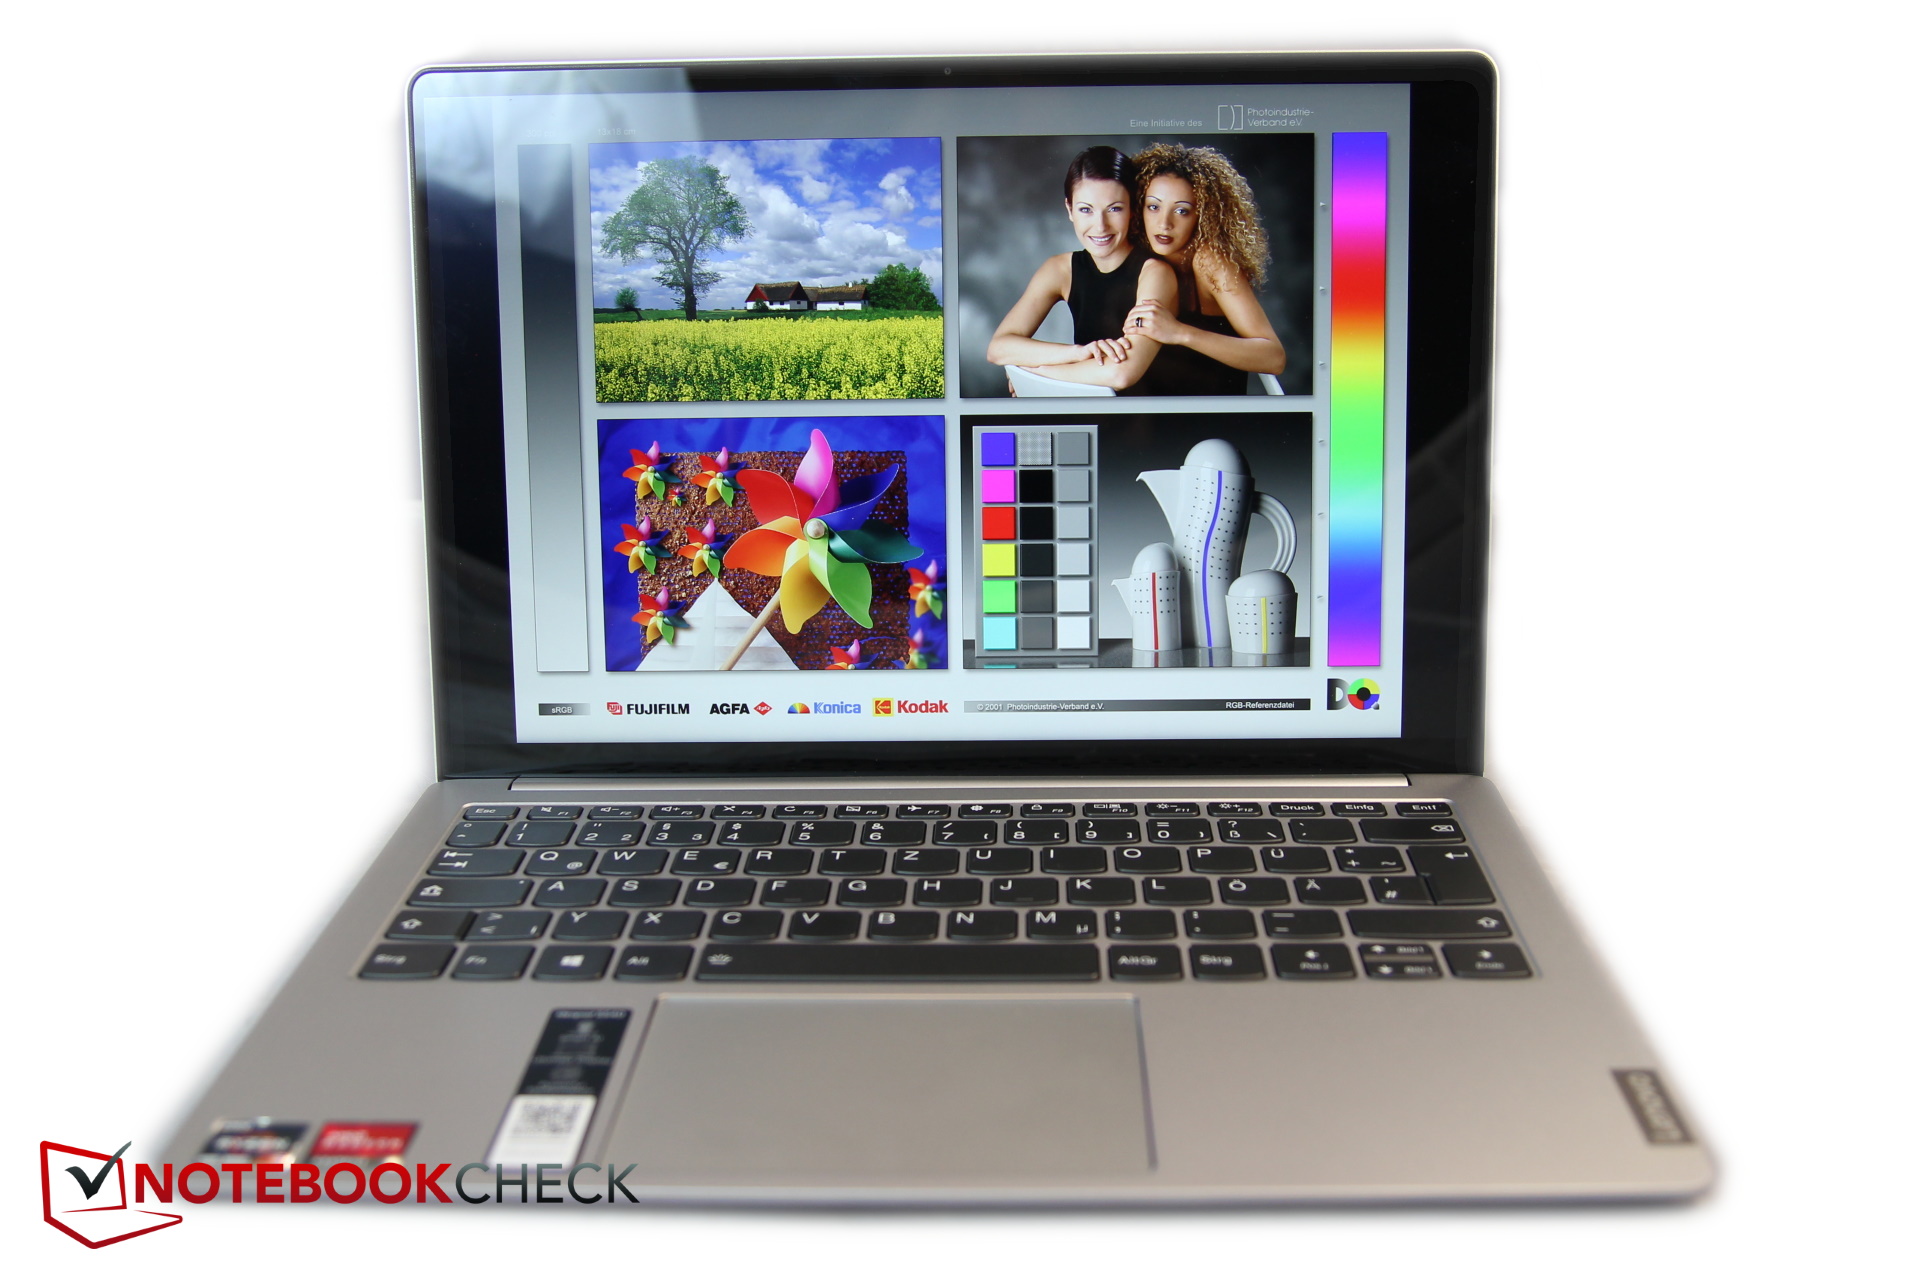
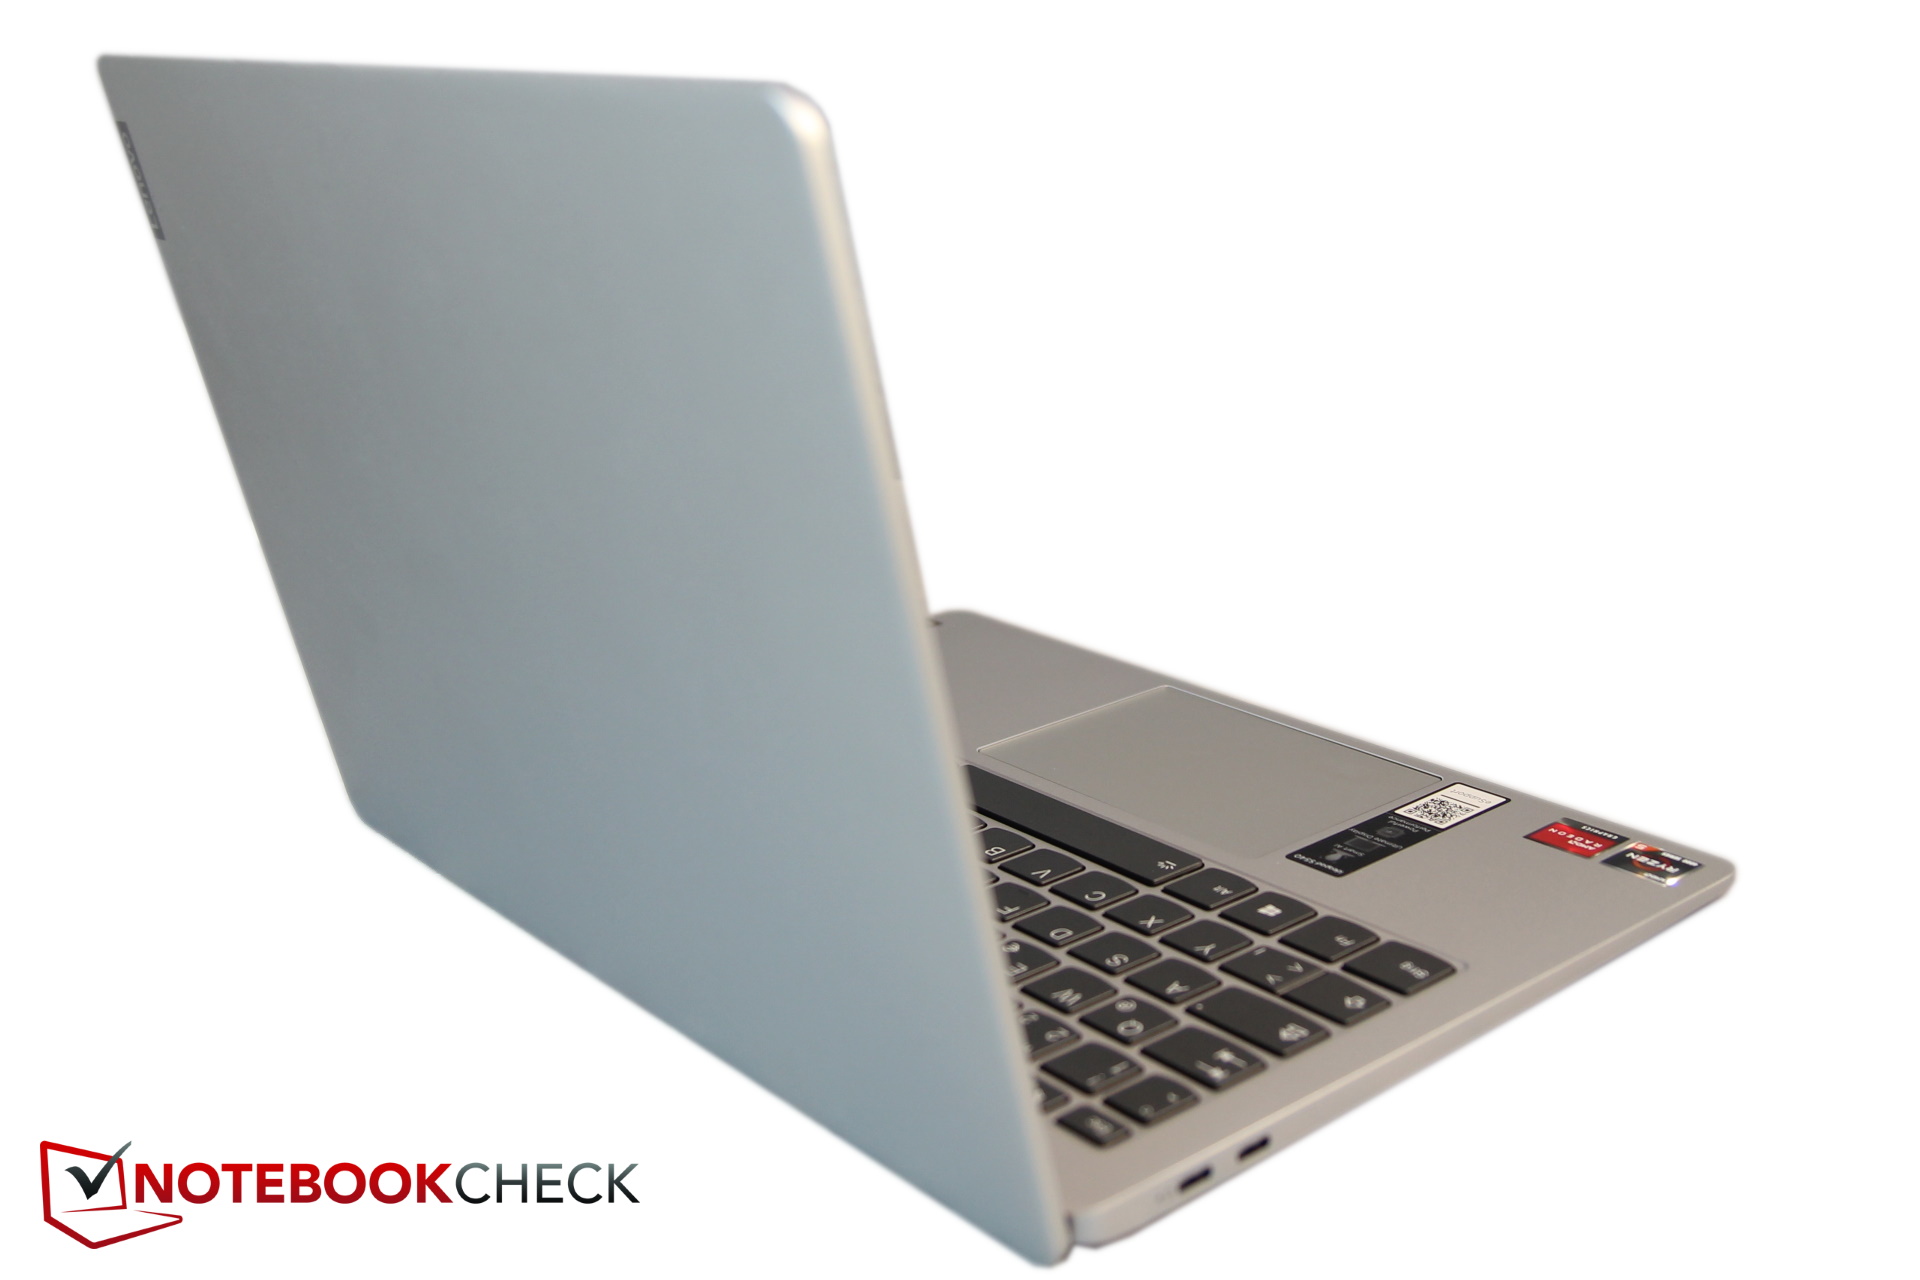
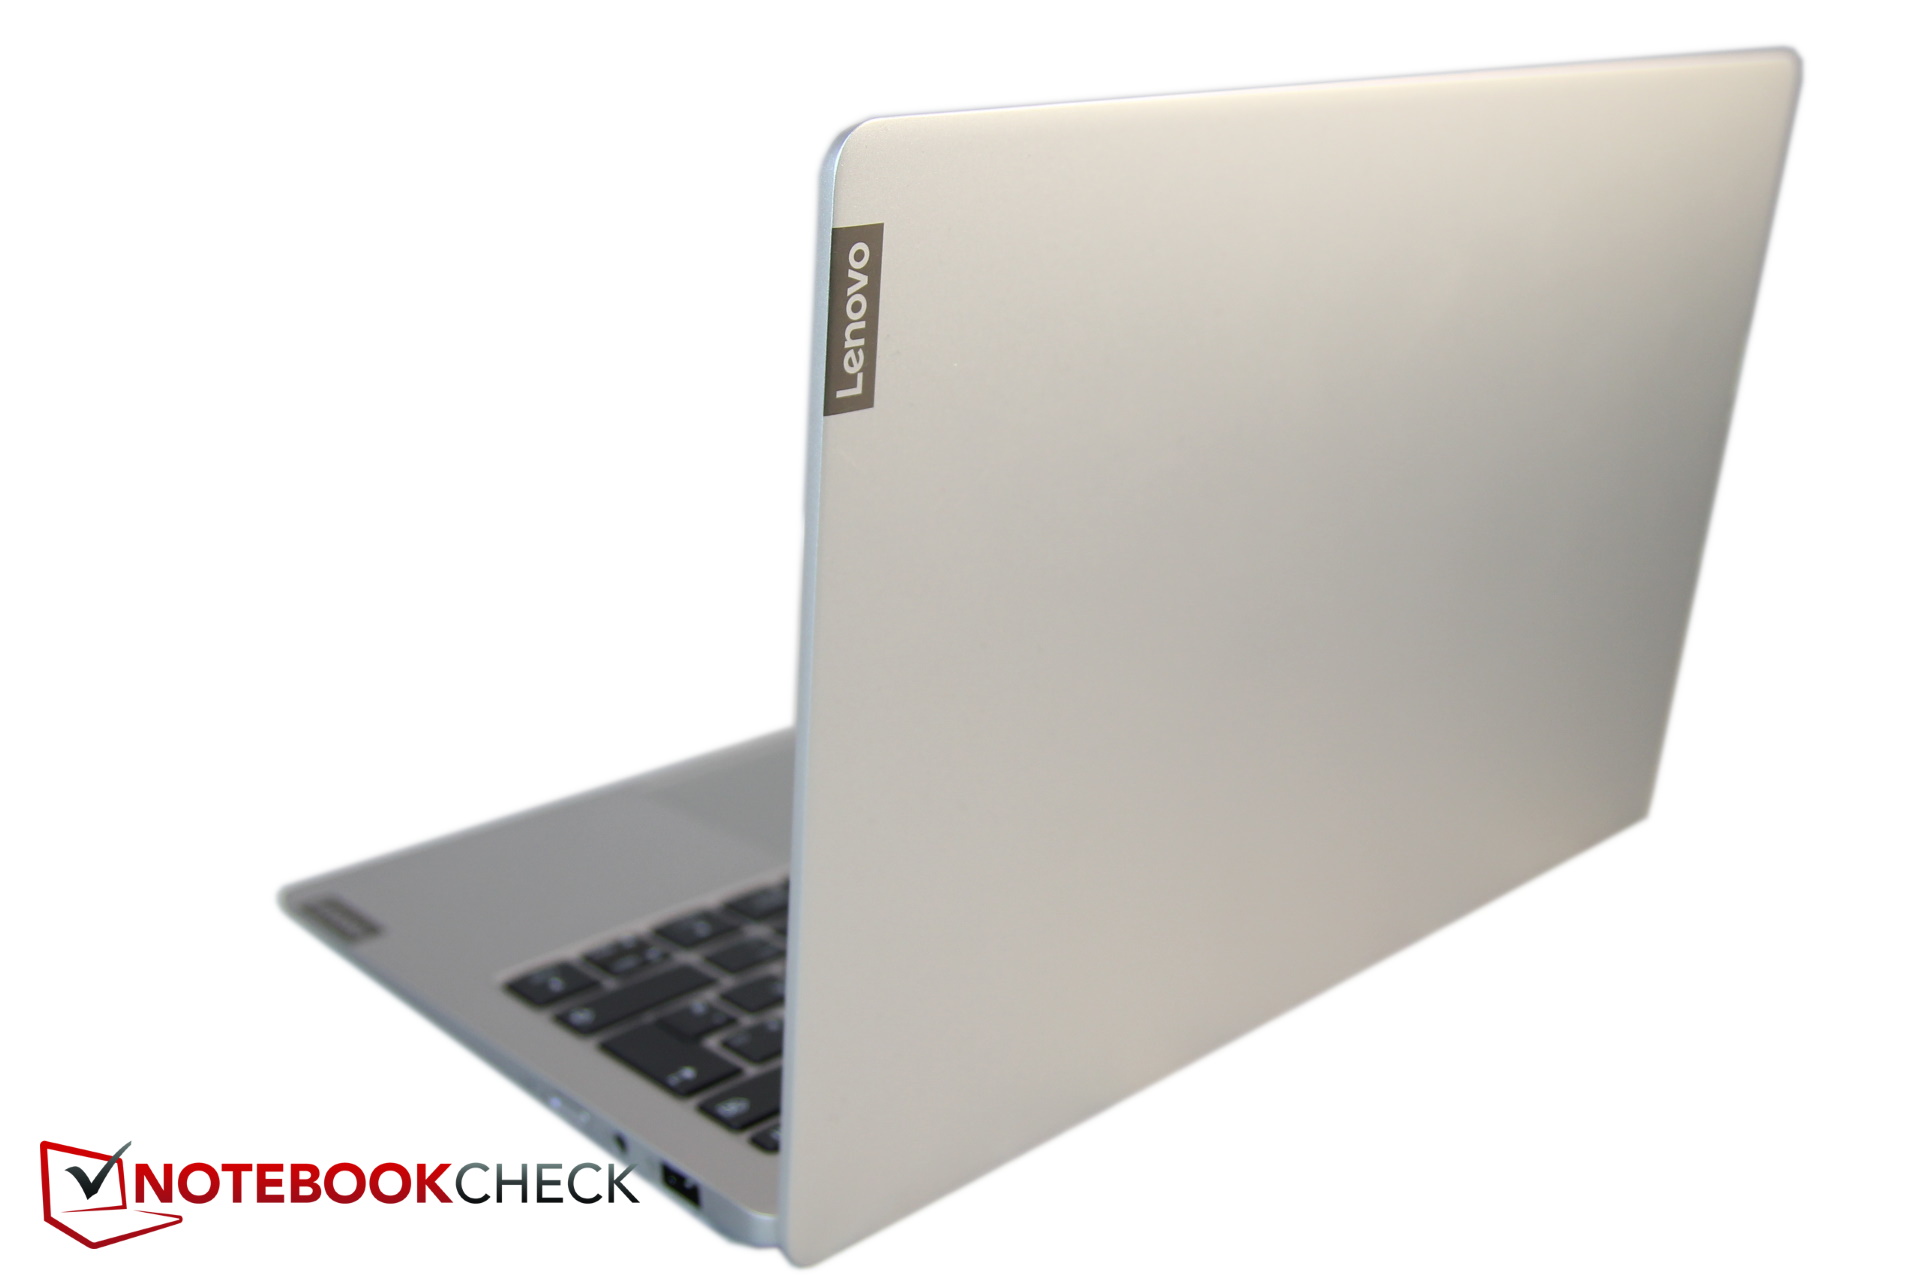
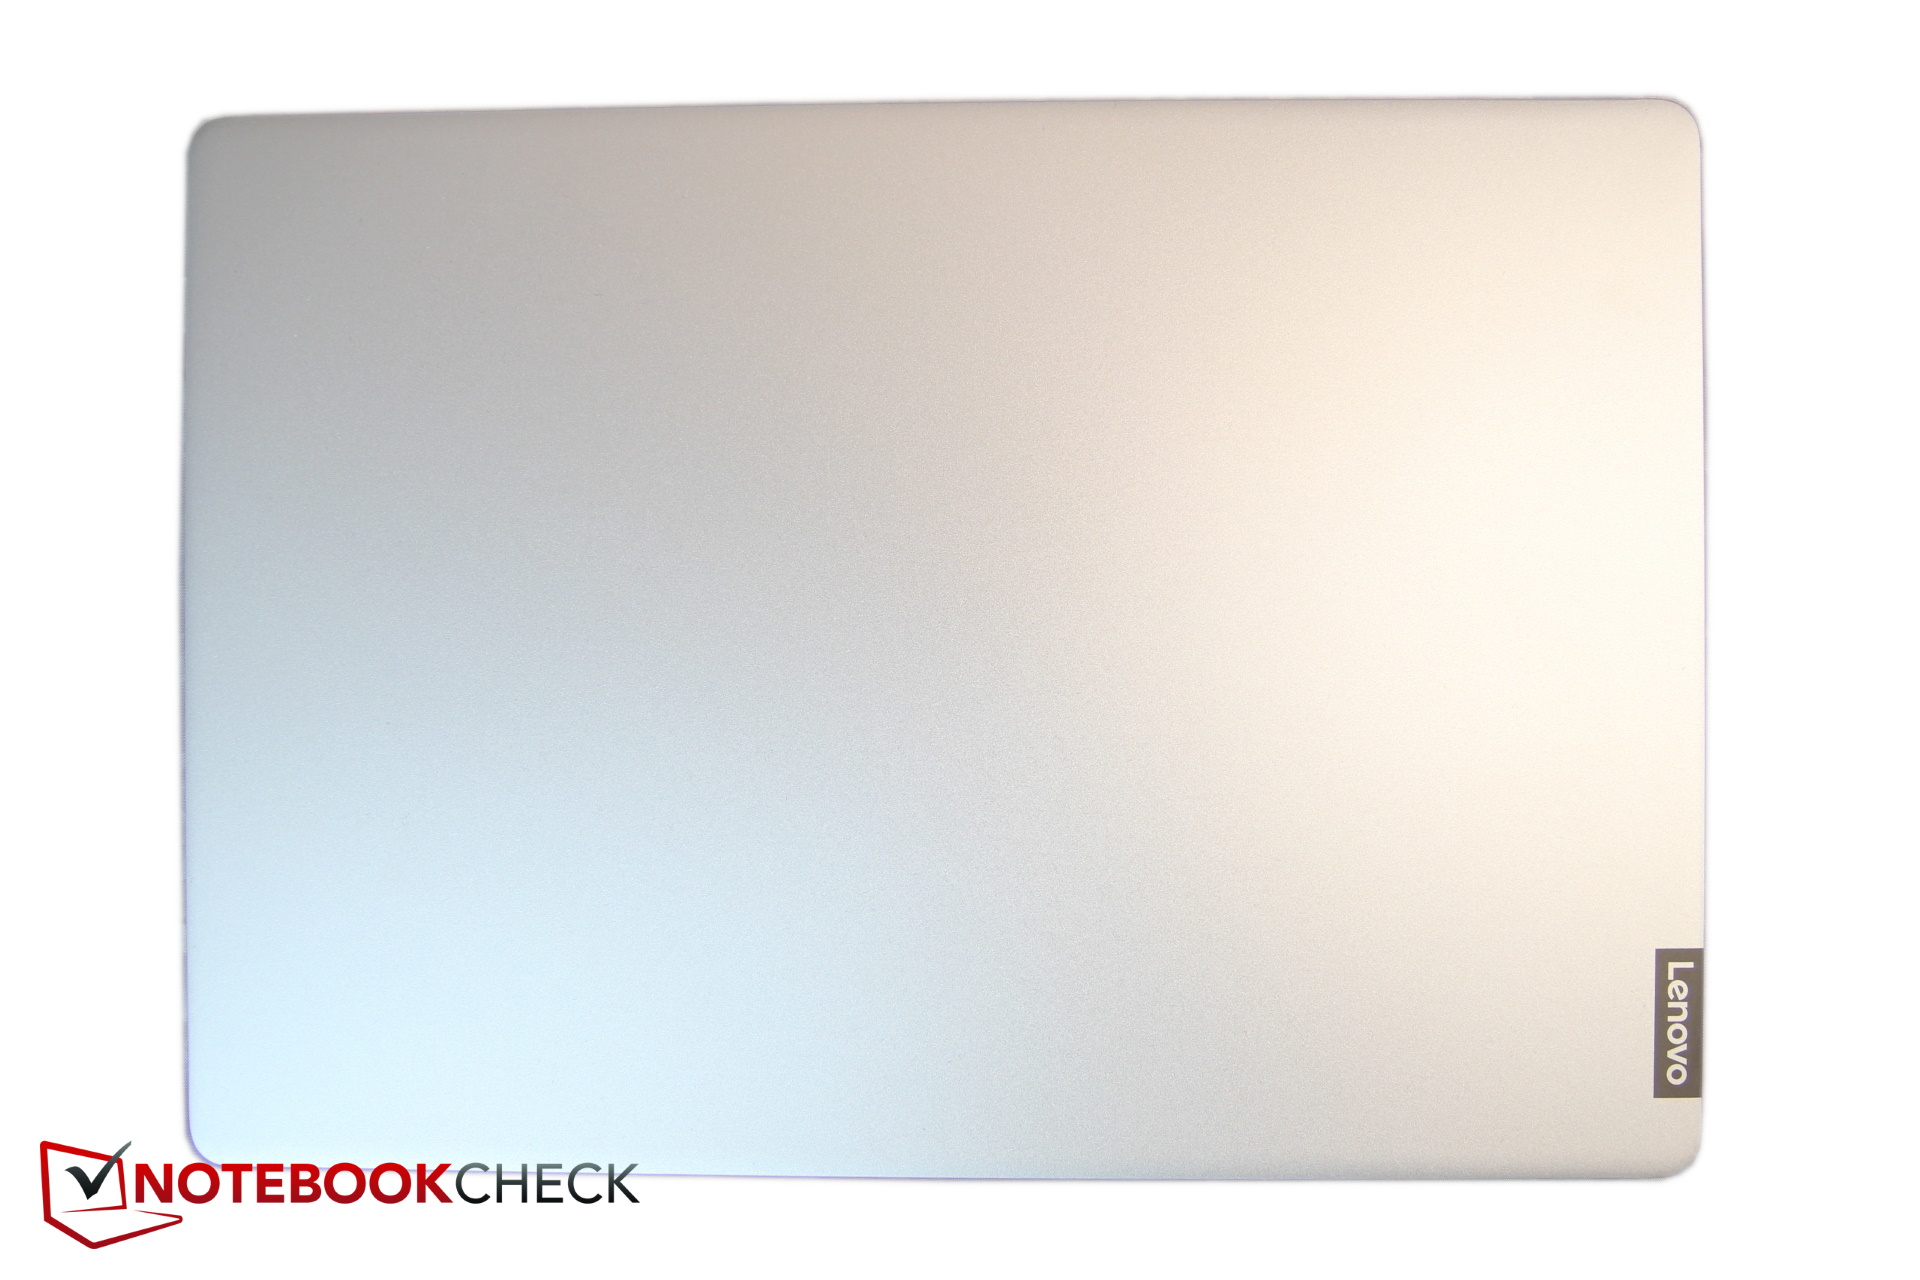
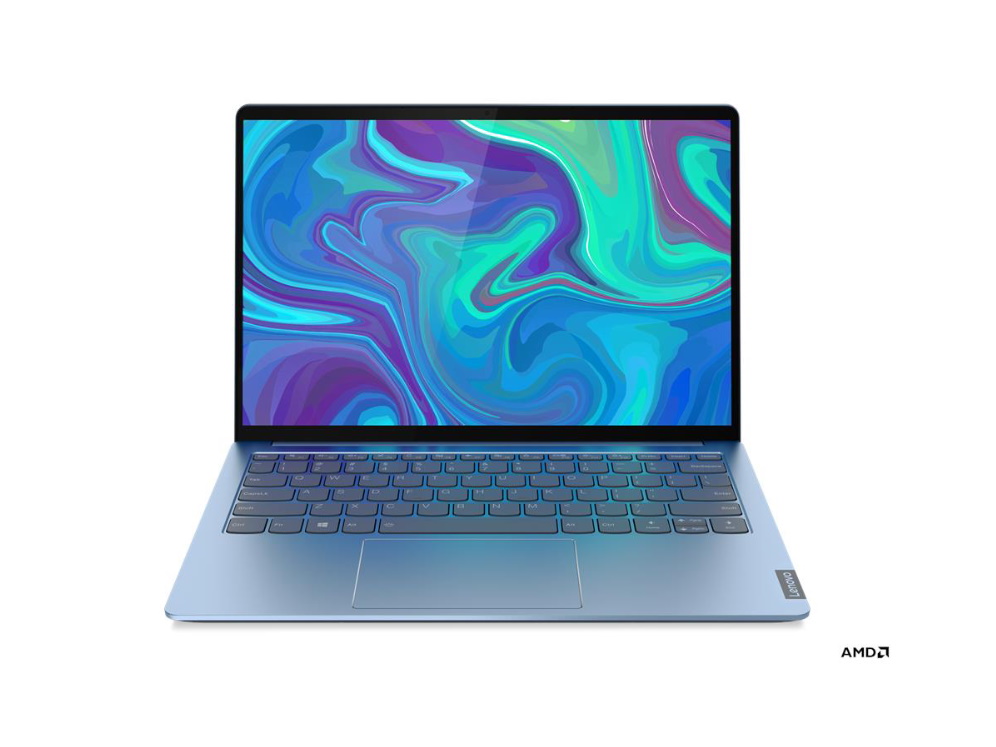
Case - Lenovo S540 with a minimalist aluminum design
The design is very simple, but that's what makes this silvery gray laptop so appealing.
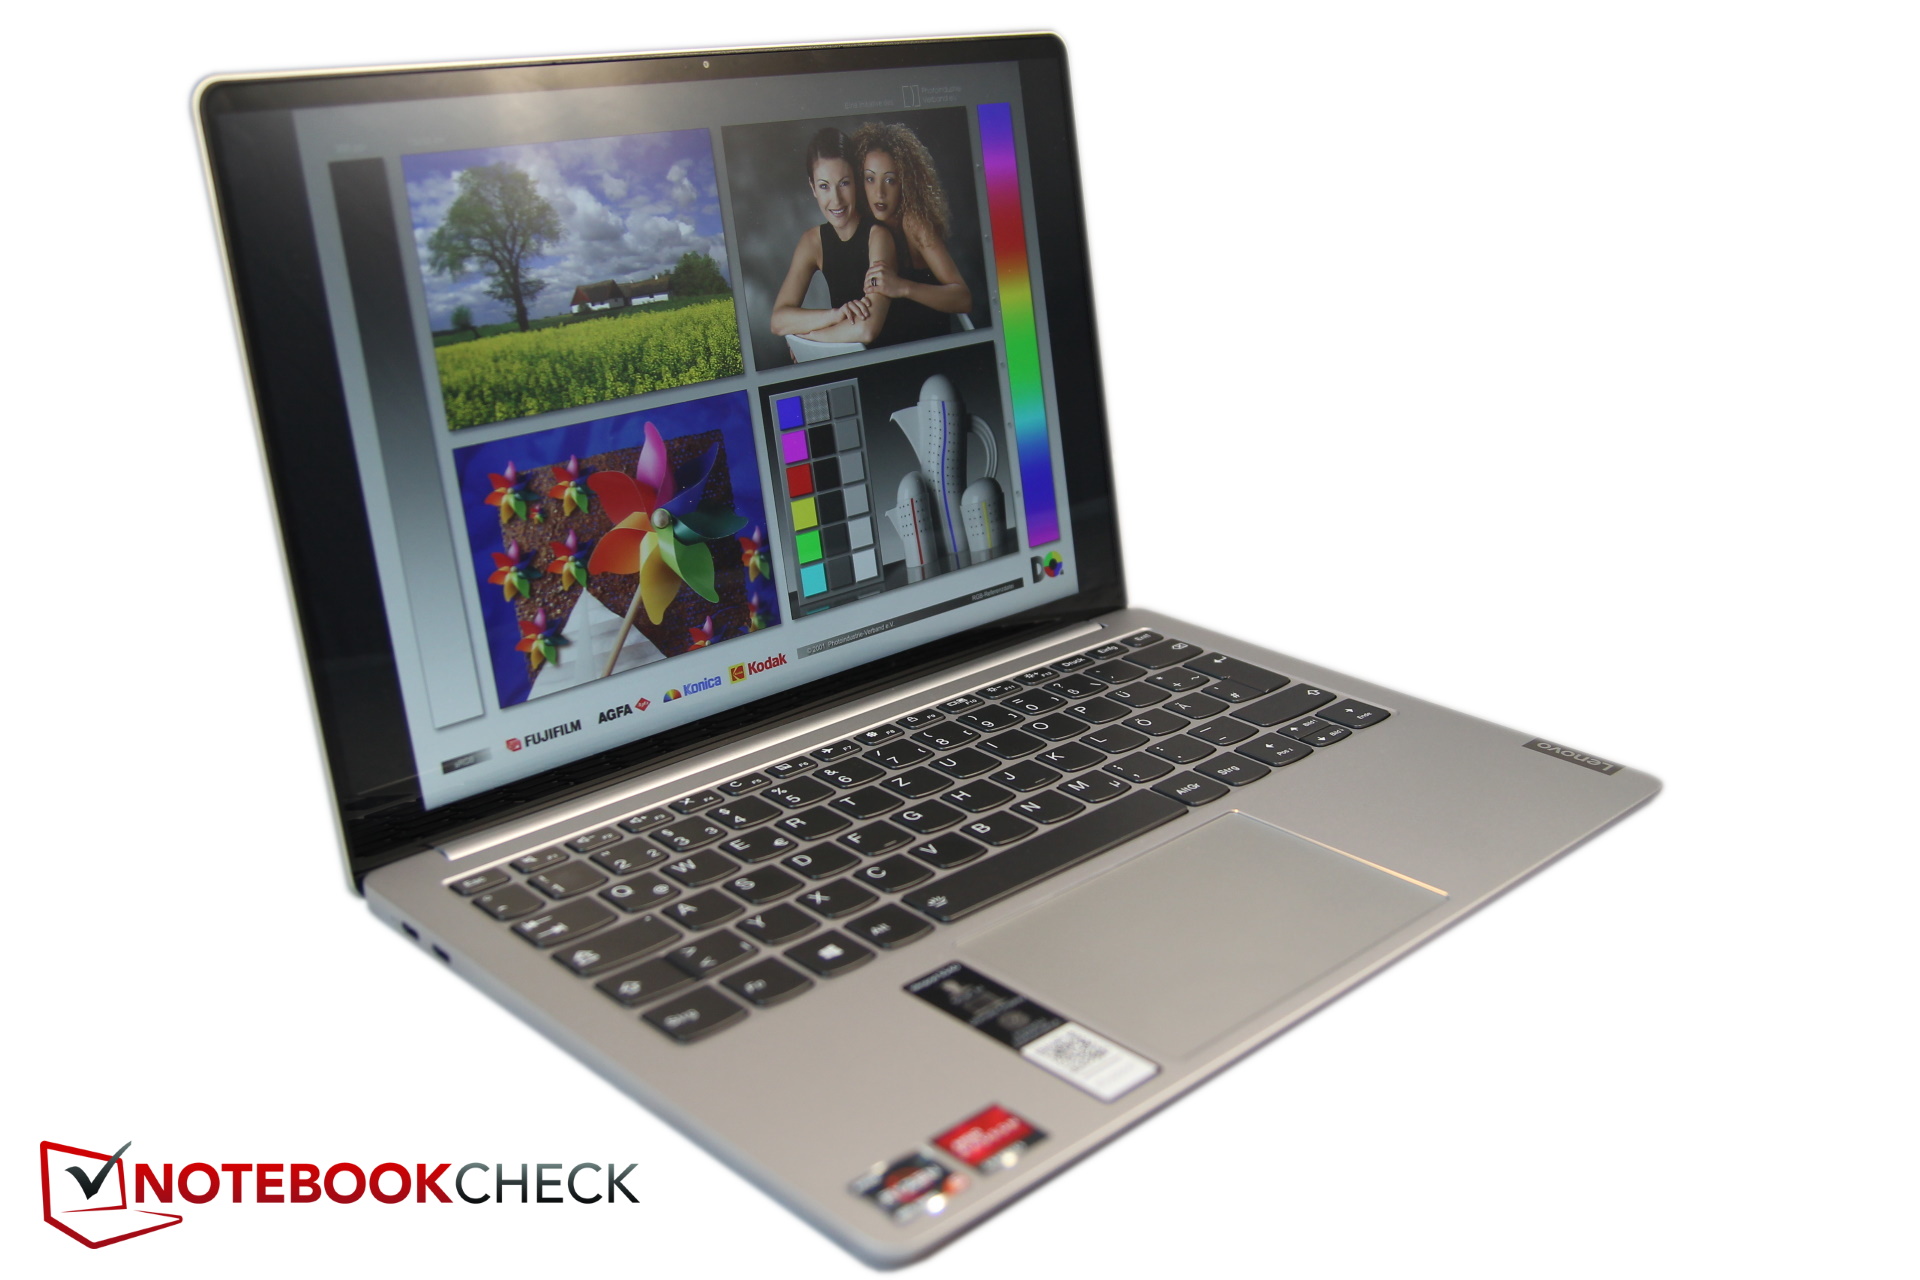
The small and light laptop is mainly made of sandblasted aluminum. Only the bottom and the keyboard keys are made of plastic. This makes the notebook quite rigid, with even the display being comparably resistant to warping. The base makes some minor noises when being warped, there are no gaps and the workmanship is of good quality.
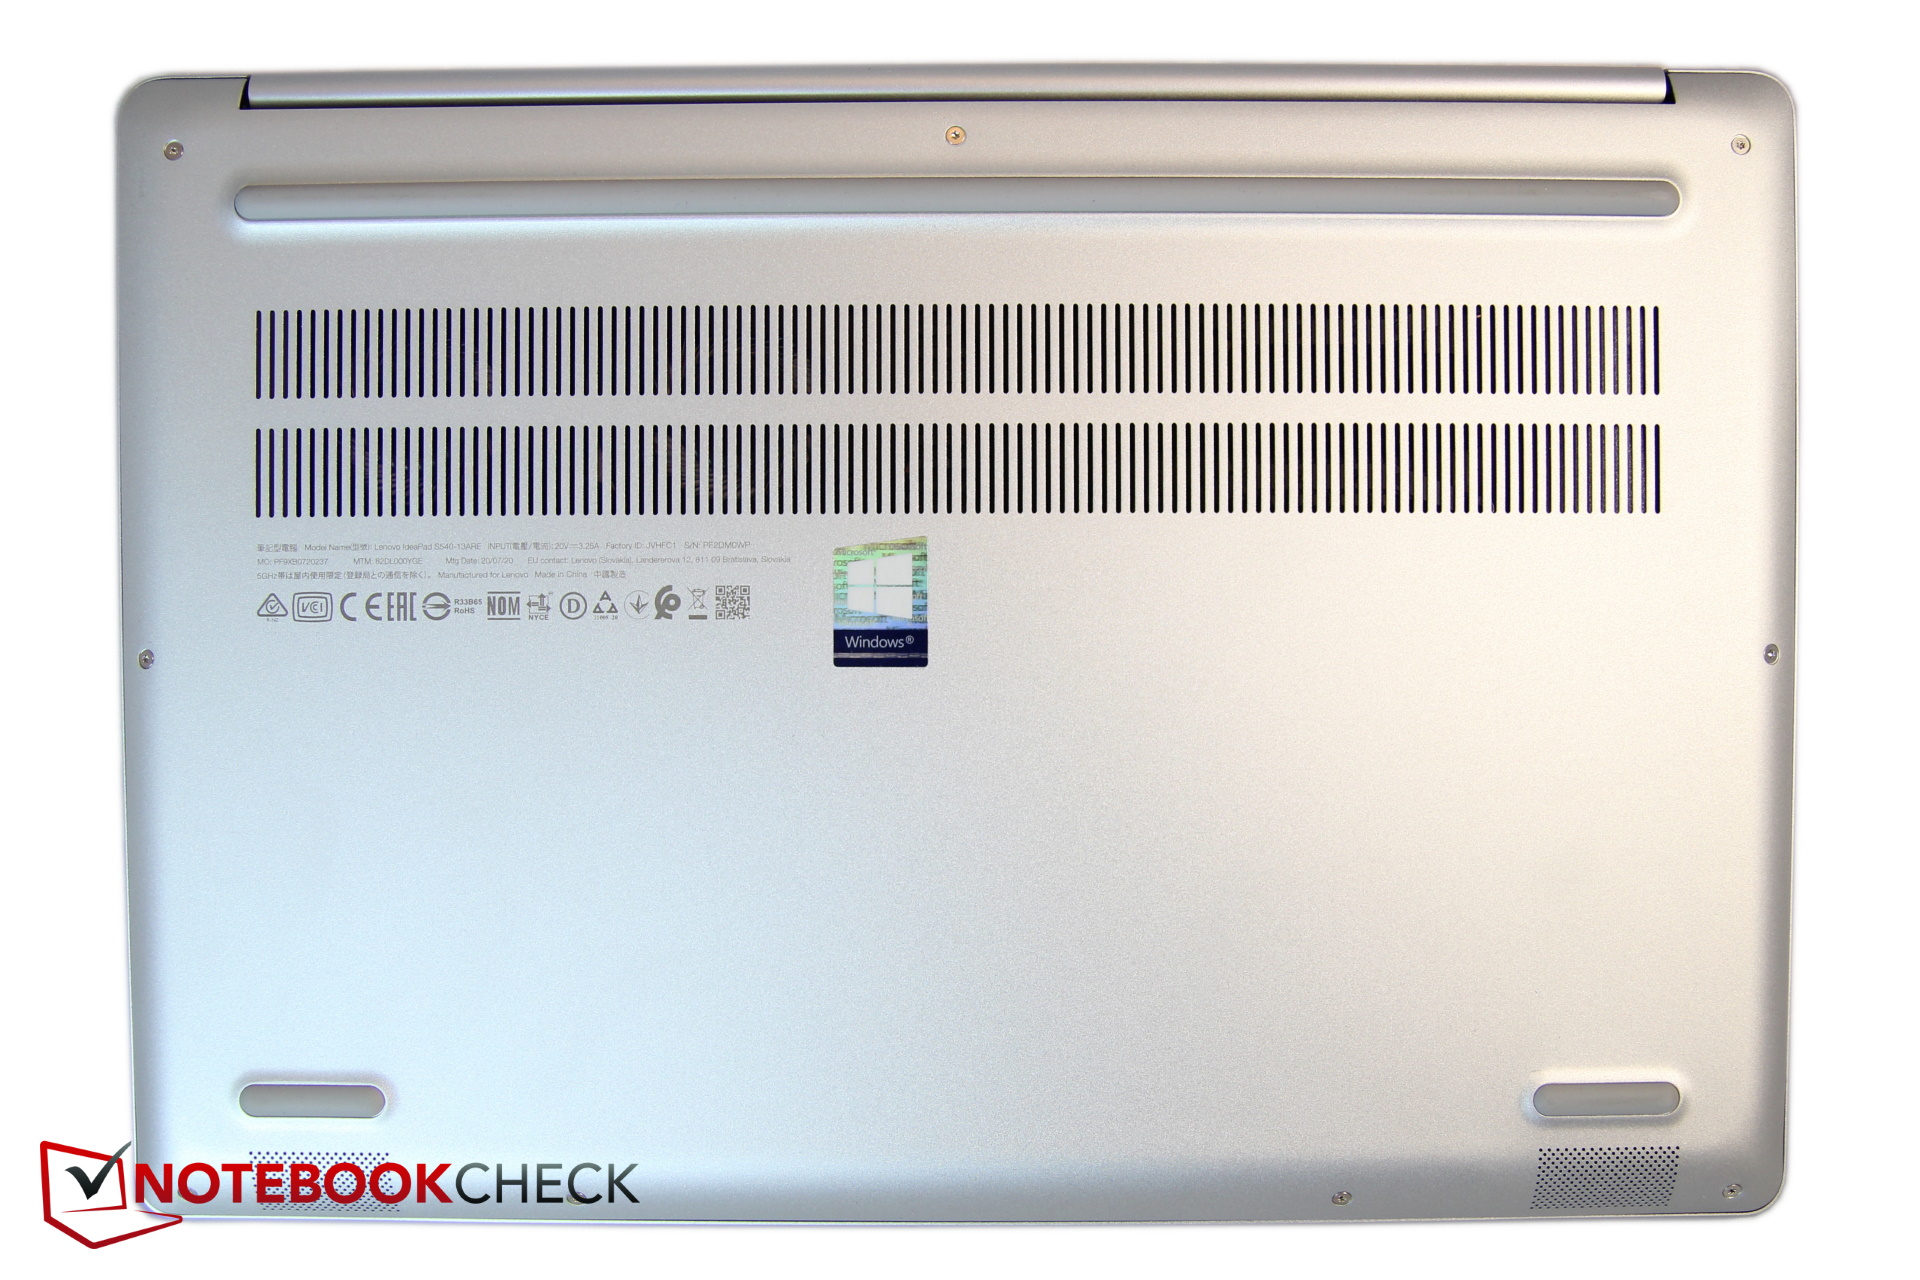
The hinge is not particularly tight but manages to keep the display in position. The maximum opening angle is 135 degrees. The ventilation slots are directed at the hinge with fresh air being sucked in via the bottom of the base unit. The on/off button is positioned along the side, as it would be on a tablet.
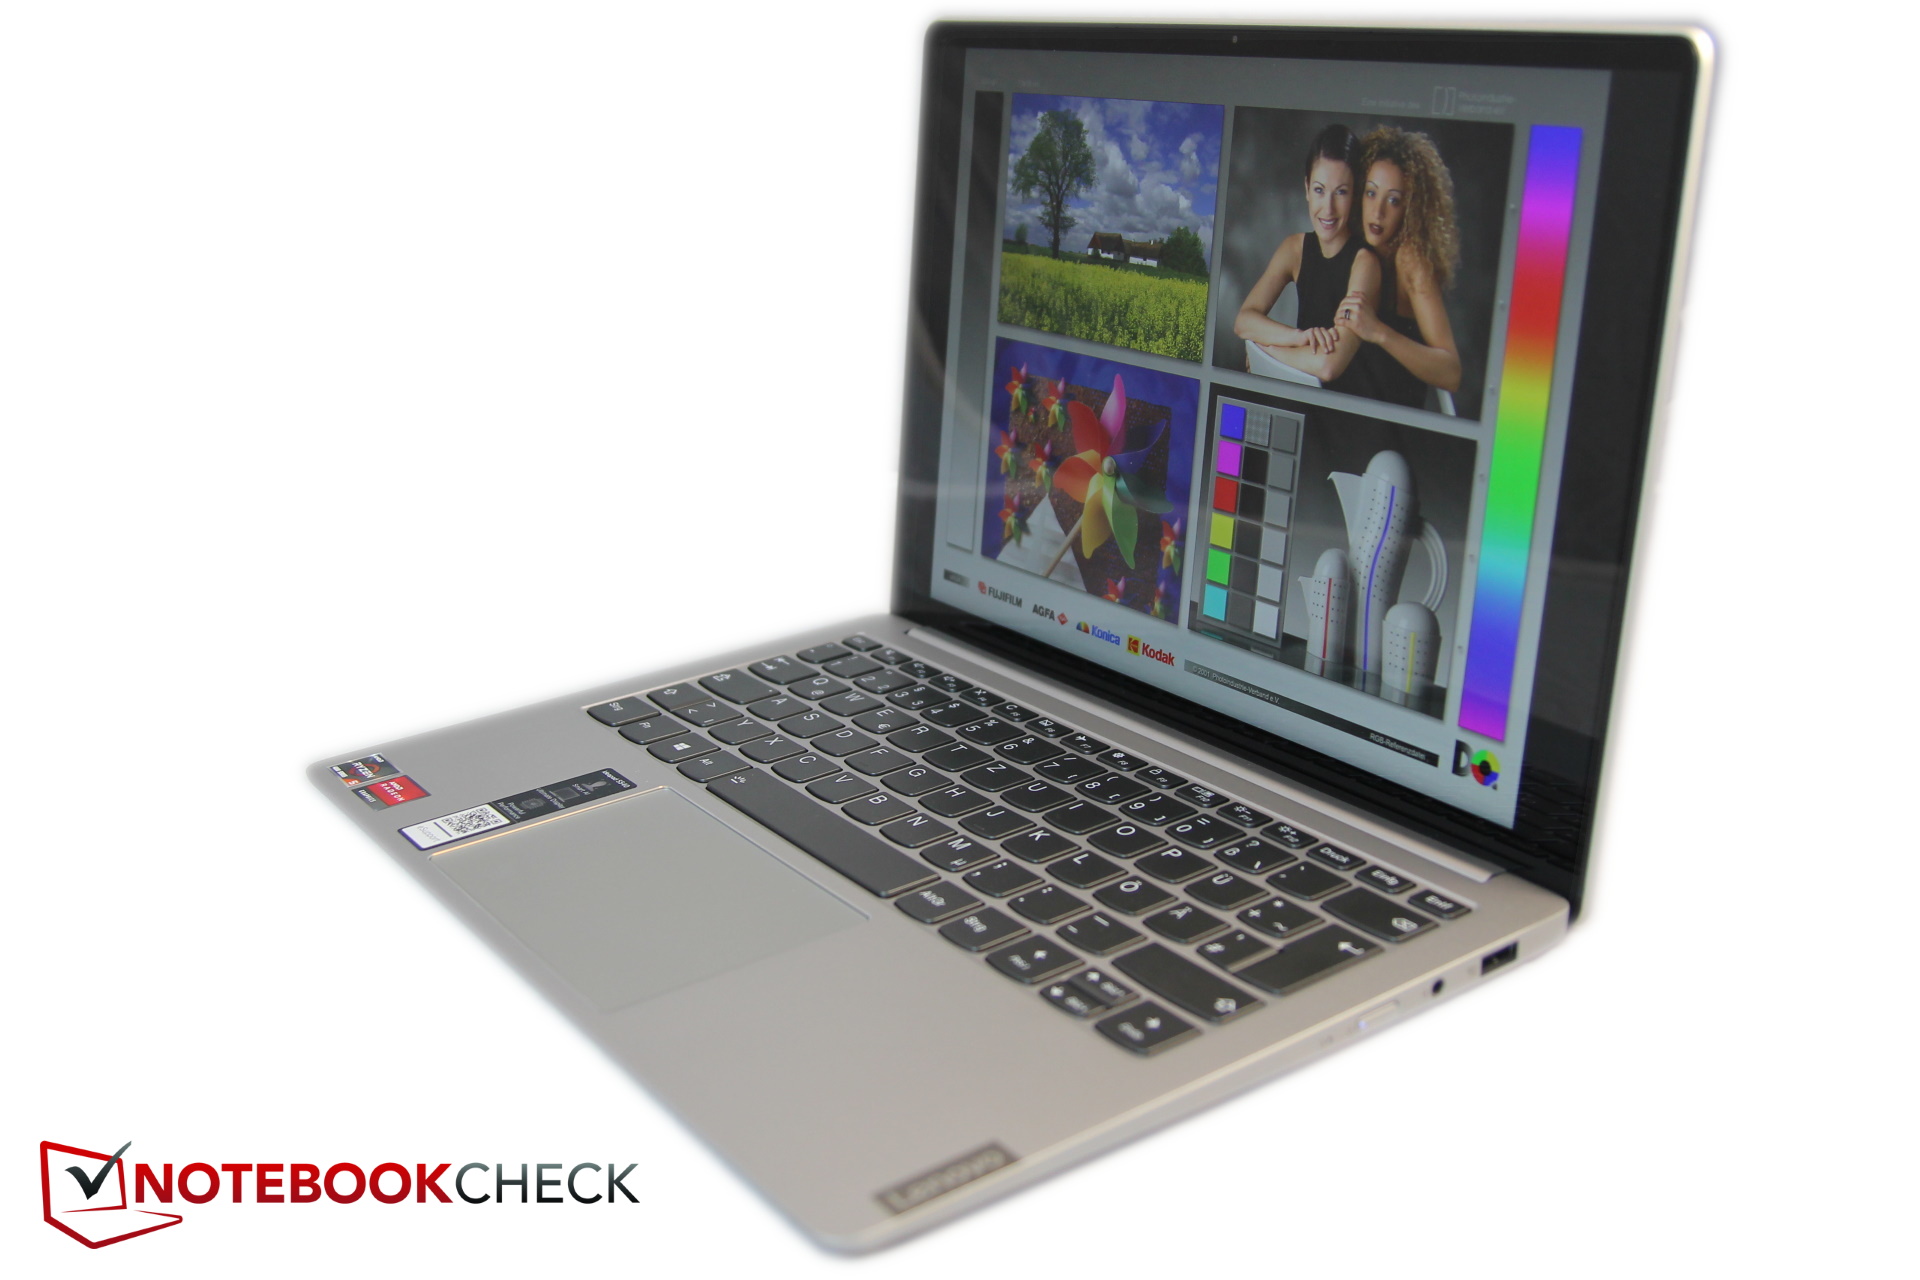
The dimensions of this device are basically identical with those of its predecessor. All other comparable 13-inch laptops are larger. Only the Acer Swift 3 weighs about 100 grams less while the HP ProBook weighs 100 grams more than our test unit.
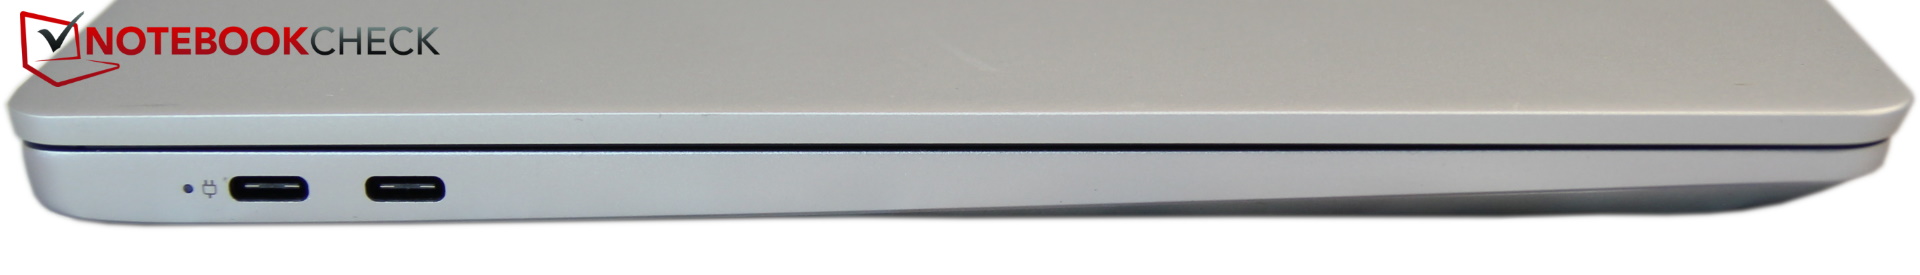
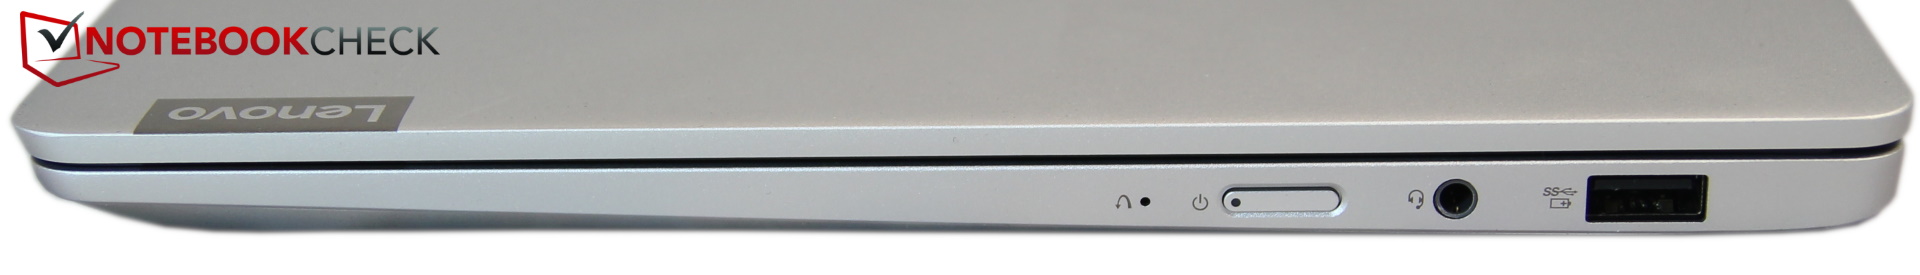
Connectivity - Please don't be so stingy.
The lack of ports is one of the largest disadvantages of the S540. There are four ports available, one of which is a combined audio jack. The other three are USB ports (two Type-C ports). This is meager even for a subnotebook. Particularly if you consider that one of the USB C ports is used for charging. That leaves only 2 free USB slots, one of which might also be occupied by an external screen. We would have appreciated a display port, a LAN port or a card reader.
In practice, users will often only have a single USB-A slot available to connect other devices. That is not enough even for a small 13-inch laptop. Only the Surface Laptop 3 is even more stingy. No need to waste time talking about positioning with only four ports.
Communication
Unfortunately there is no LAN connector, which means users will either have to purchase an adapter or stick to Wi-Fi. The performance of the Intel AX200 module is below our expectations in the S540, particularly when it comes to sending data. The average AX200 is 34% (receiving) to 68% (sending) faster. Looking at the competition, the Surface Laptop 3 stands out as being significantly faster while the MacBook Air offers similarly disappointing results.
Webcam
The webcam is weak as usual for this kind of device with a noticeable red cast. Let's just say it works. The same goes for the competition.


Security
Simple and sparse are two good adjectives to describe the S540. While it features TPM firmware, there is no fingerprint sensor or Kensington lock, let alone a SmartCard slot or other security features. At least the camera has an infrared sensor that enables users to sign in with Windows Hello.
Accessories
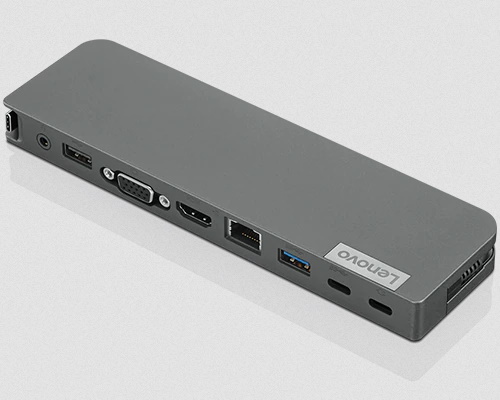
There aren't any accessories included with the IdeaPad S540. Most users will soon feel the need for a dock considering the sparse port selection. Lenovo themselves offer rather expensive solutions (such as the USB-C Mini Dock for $99); there are compatible third-party products available as well.
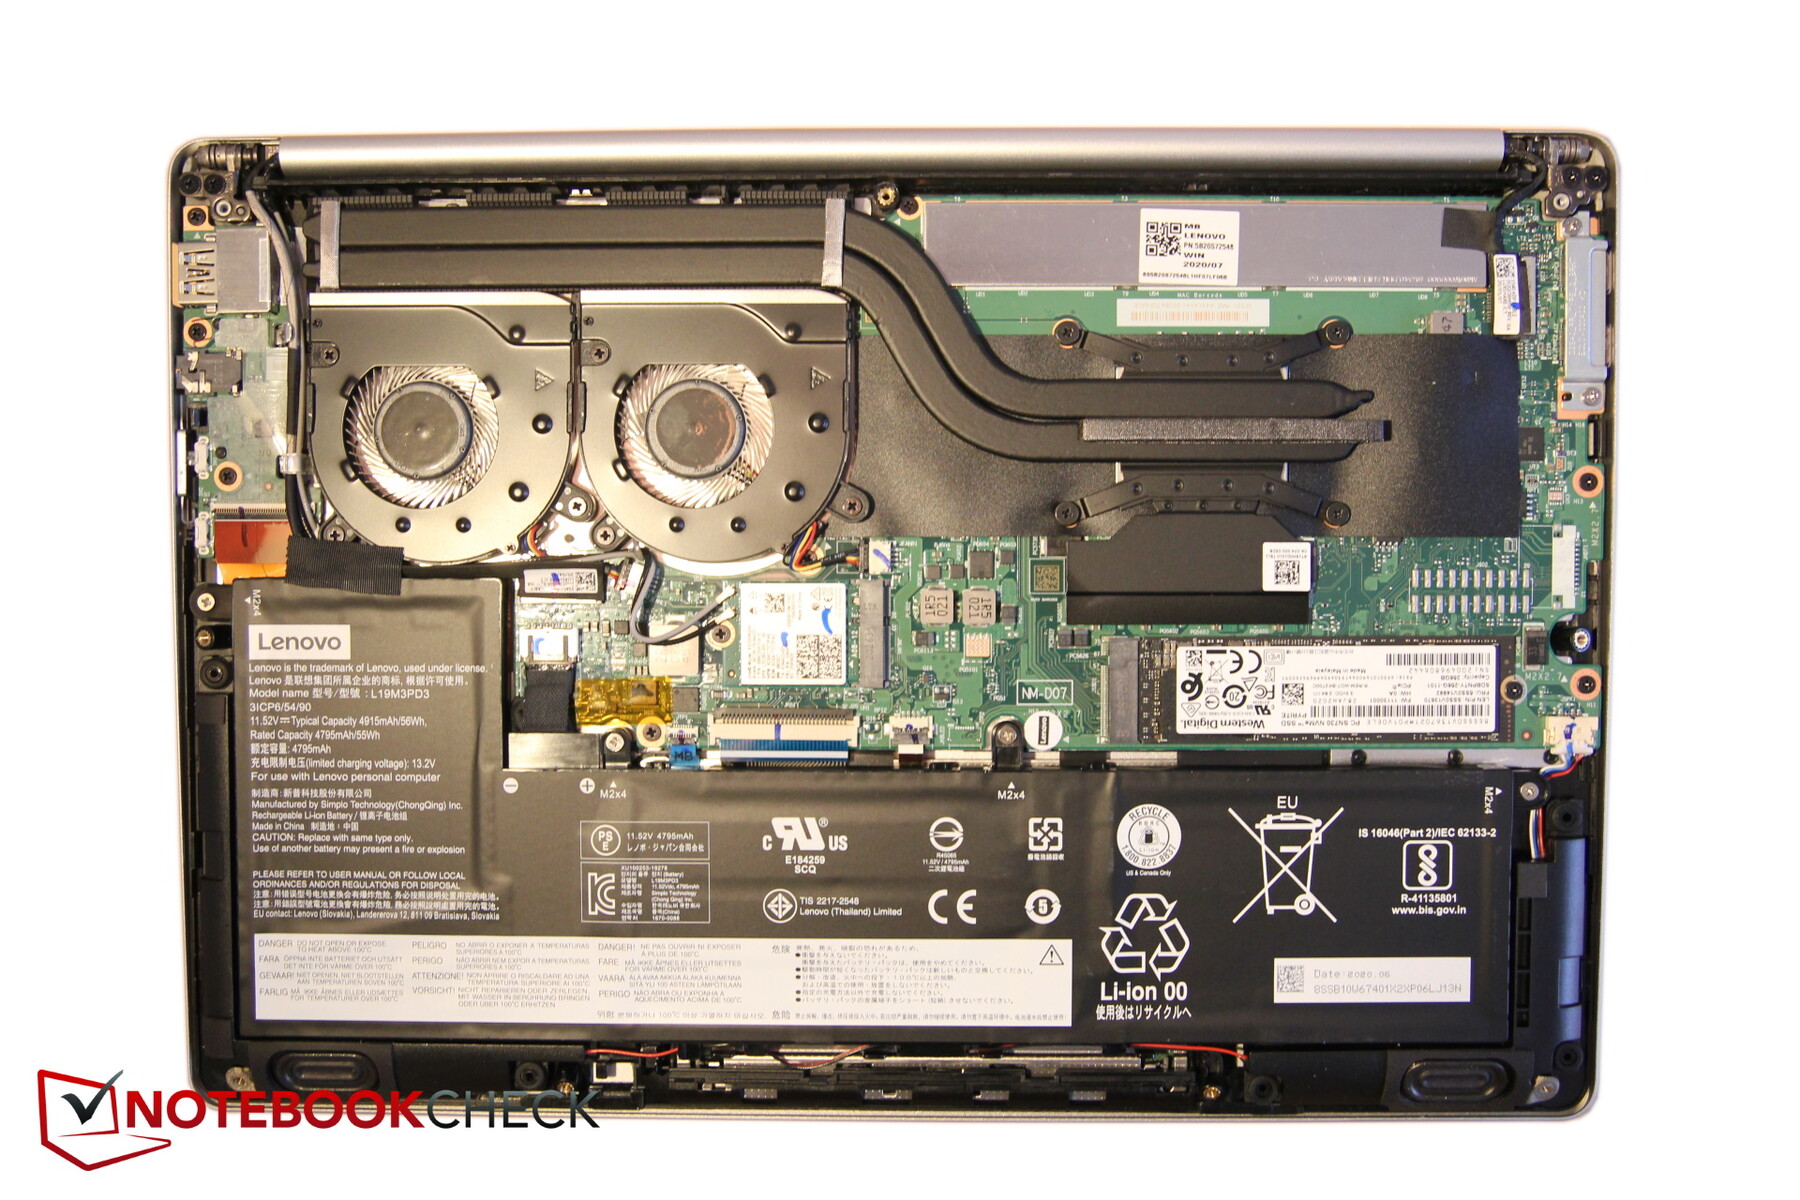
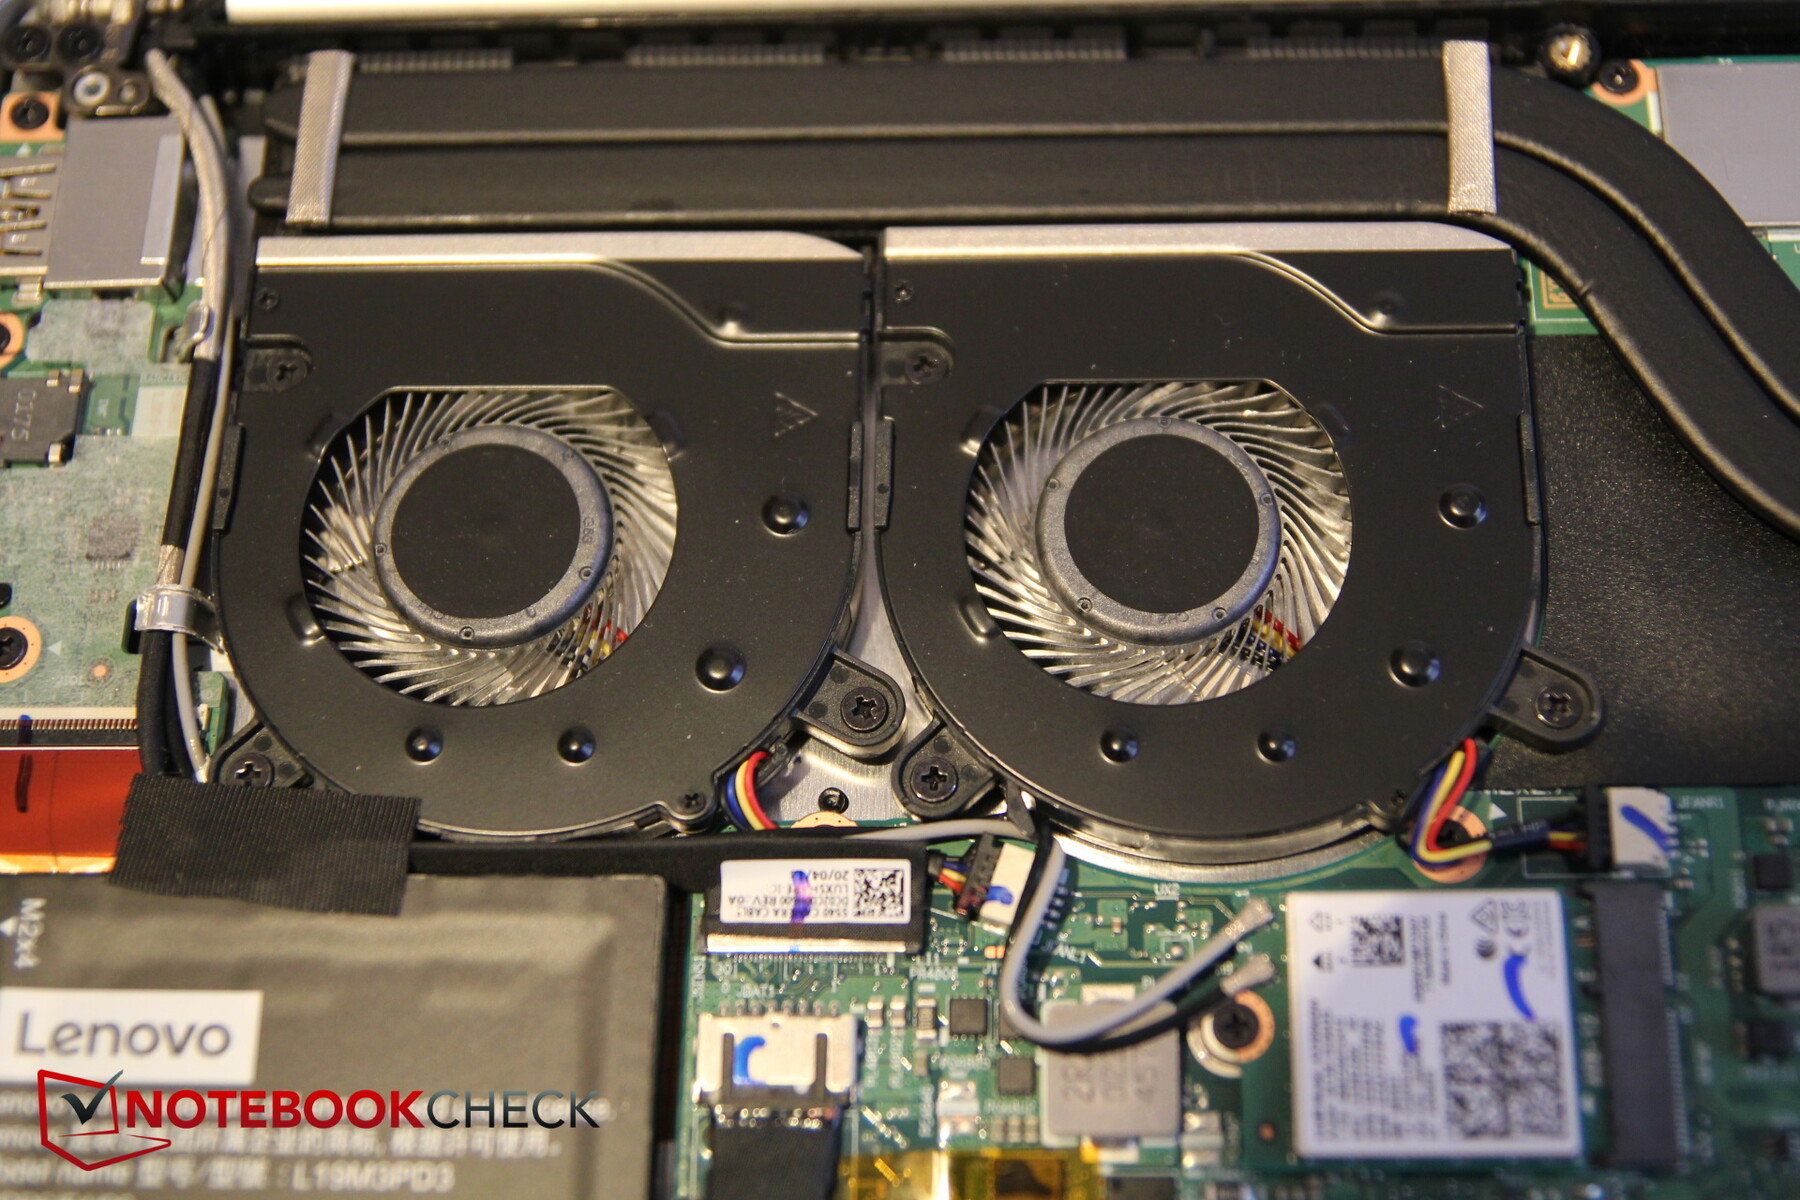
Maintenance
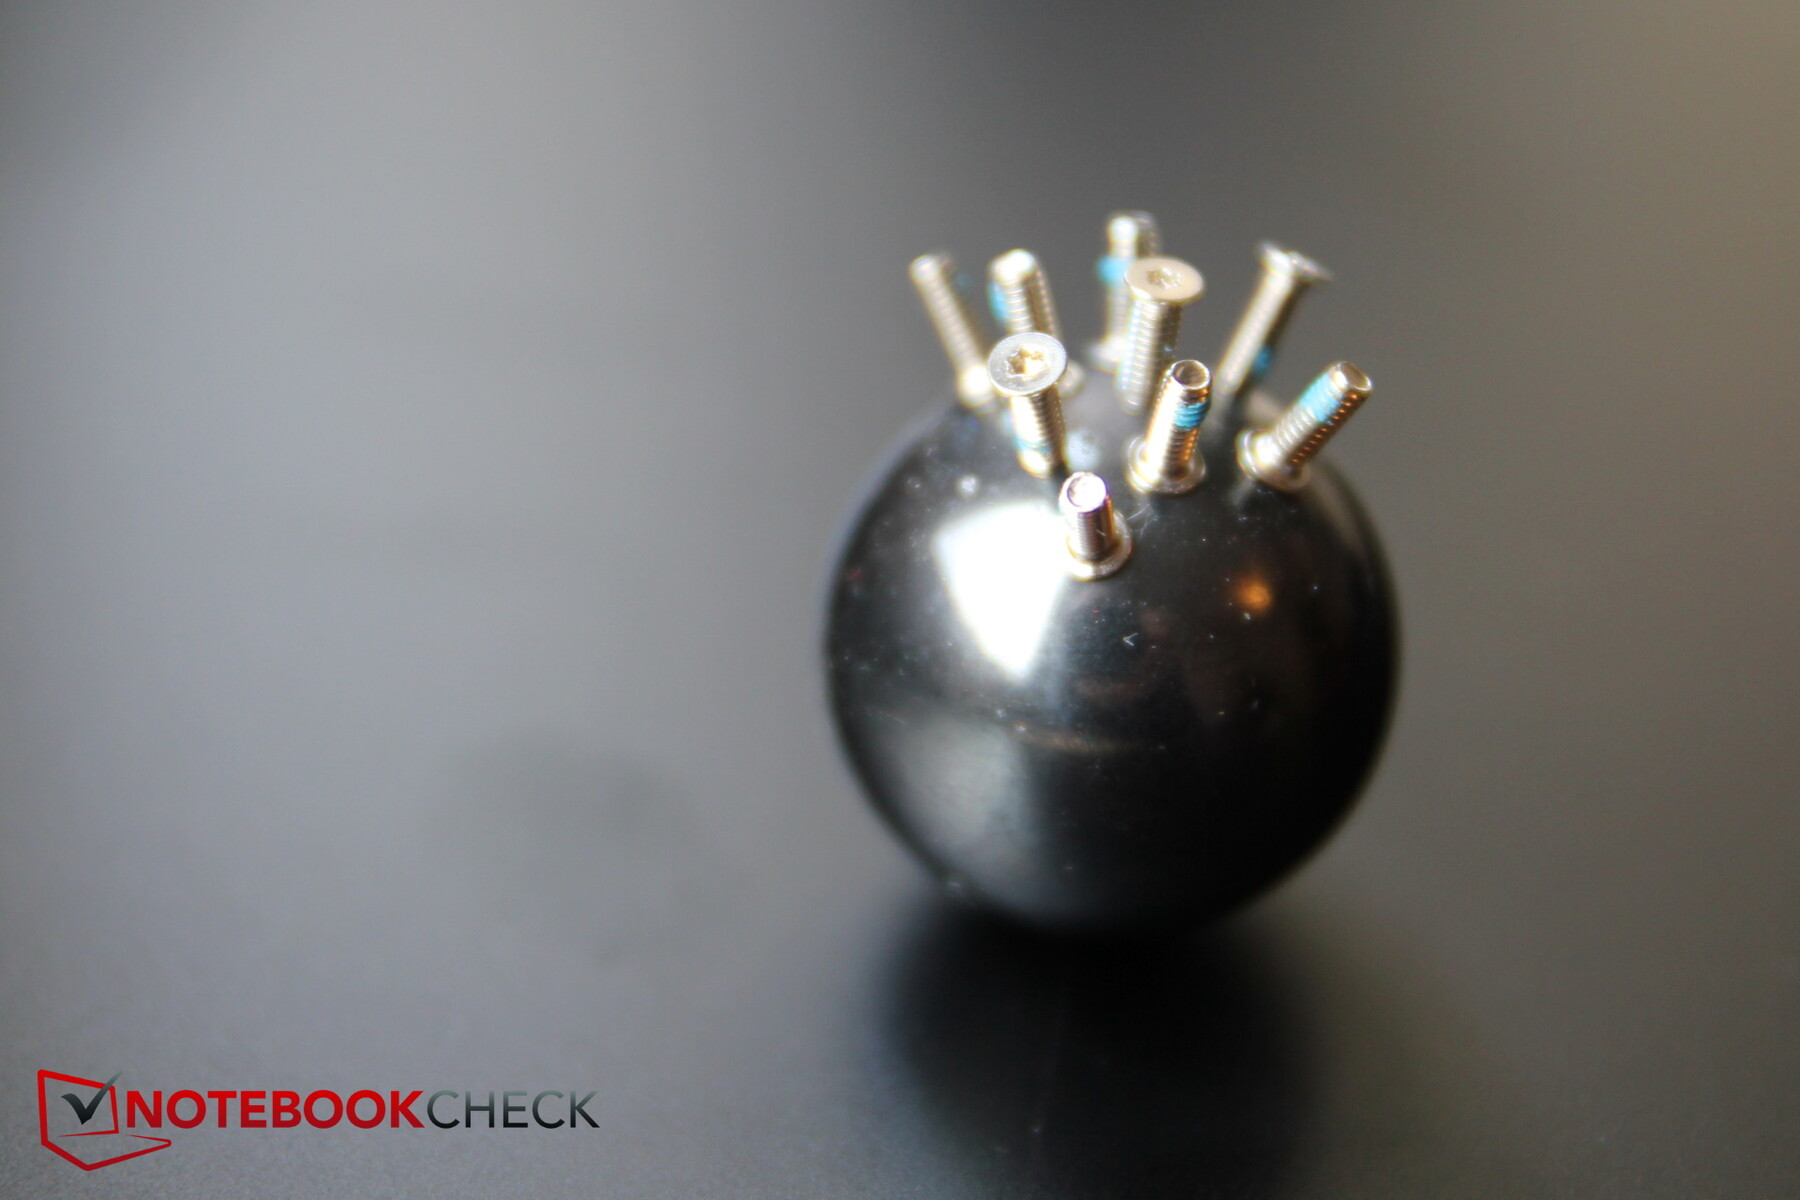
There is no maintenance hatch. The bottom cover is secured with 9 small Torx screws (T5). After removing them, the cover can be pried off quite easily. This gives you access to the two fans, the battery, the Wi-Fi module and the single M.2 SSD slot. The RAM is firmly soldered on, so potential buyers might want to go for the 16-GB version.
Warranty
Lenovo provides a two-year warranty for this device. This can be extended in duration and coverage for an additional fee.
Input Devices - Decent keyboard, touchpad is OK
Keyboard
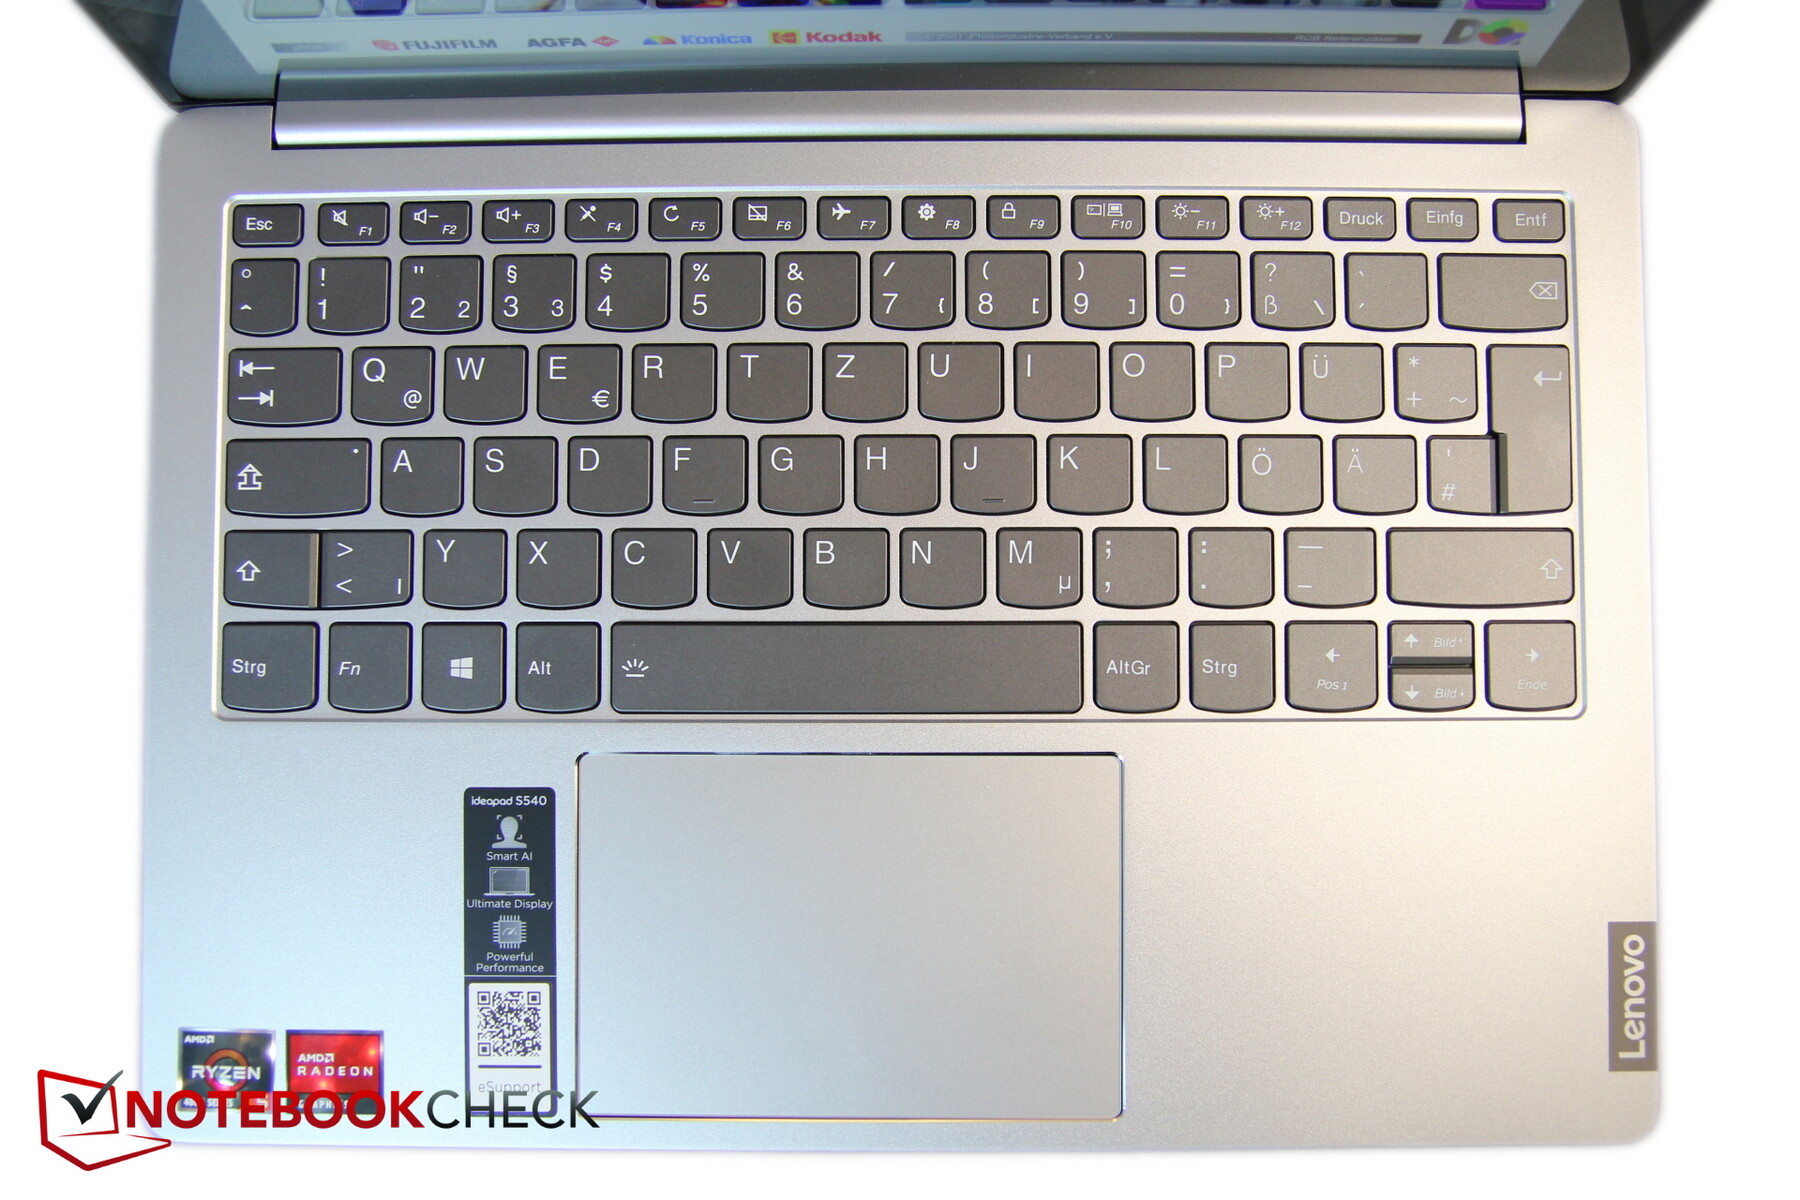
The keyboard layout is very tidy, the lettering is easy to read even in the dark thanks to the two-level backlighting. The up/down arrow keys share a space, unfortunately, which means they are only half the size of the other keys.
All other keys are decently sized; the travel is rather short. Feedback is good when pressing individual keys, but can be a bit spongy when typing due to the short travel. Typing still is very comfortable and quick - particularly once you have gotten used to the short travel and have learnt to use less pressure.
Touchpad
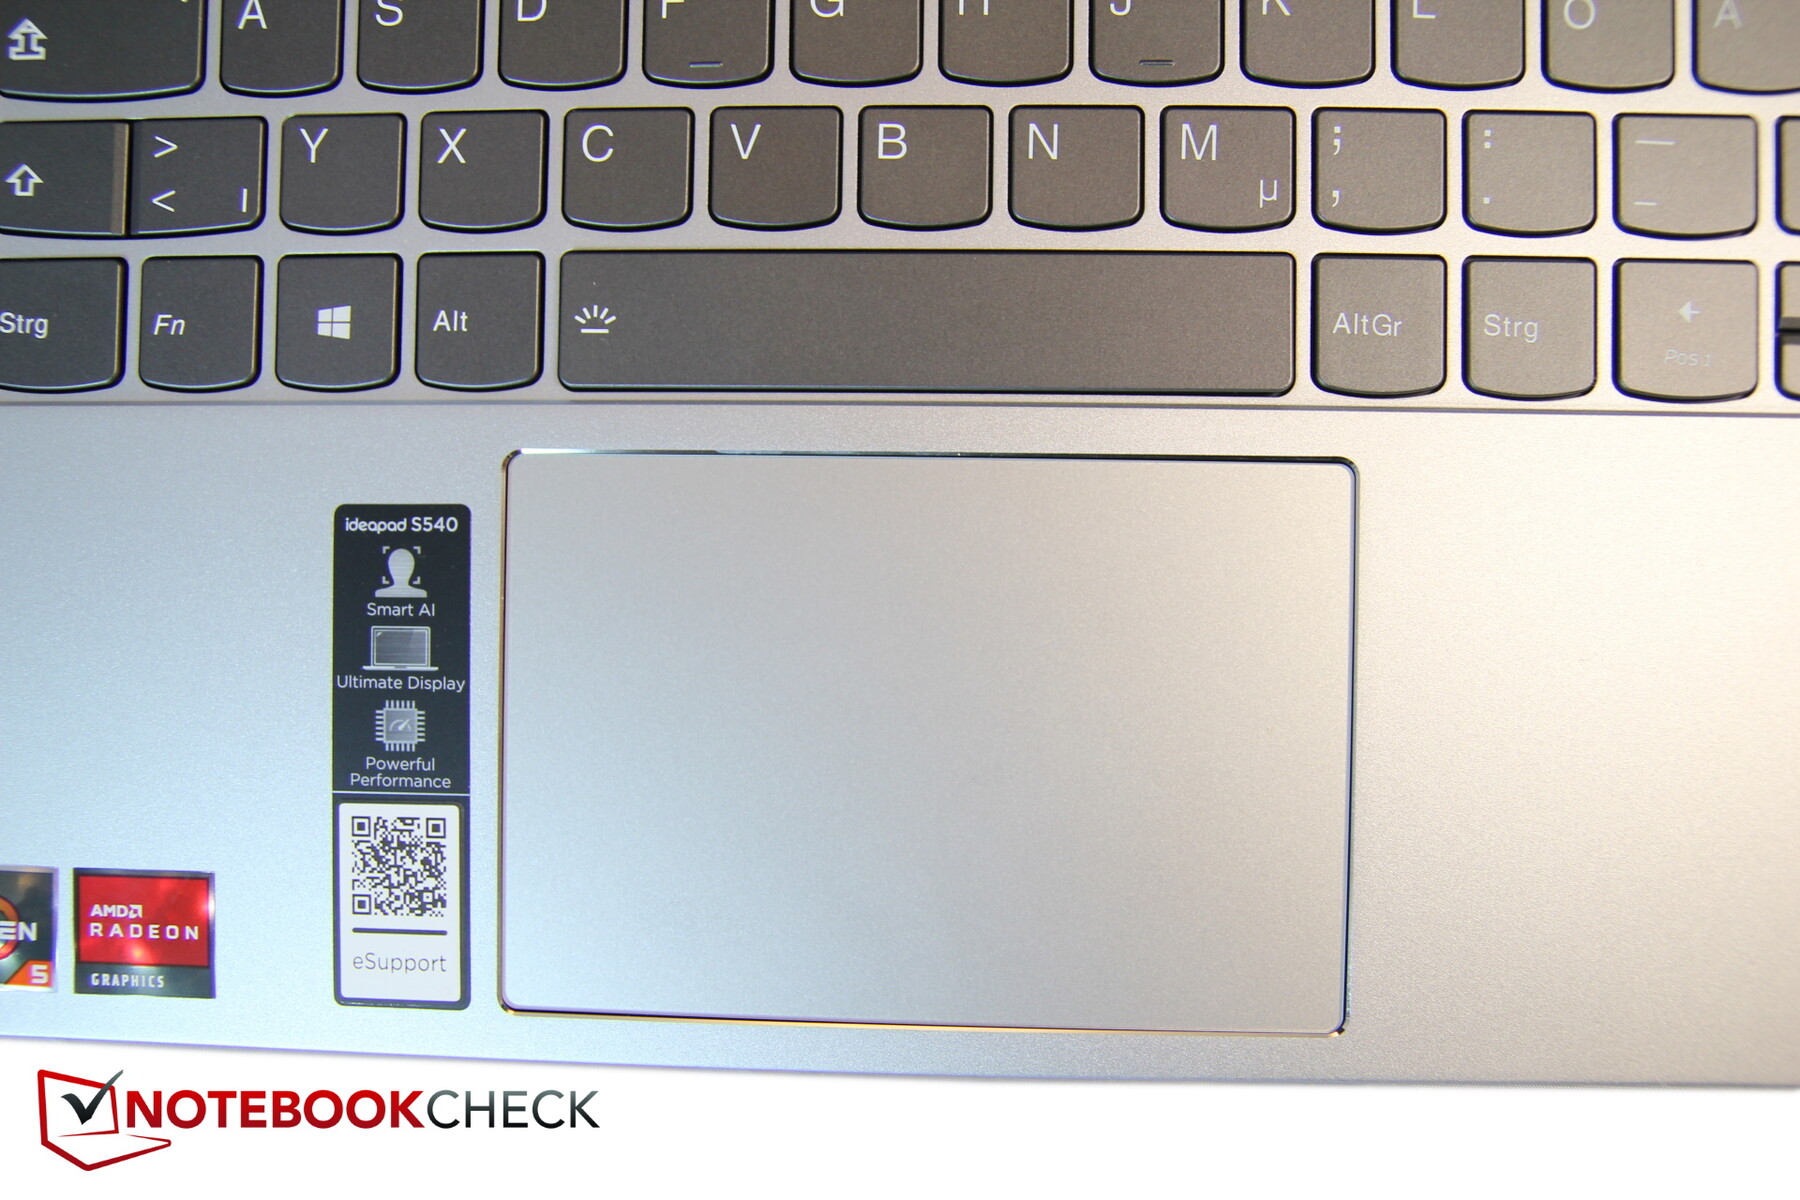
The touchpad has good gliding features, although it can be a bit sticky when moving slowly, which might mean cursor control is a little imprecise in certain situations. The top left corner in particular responds to inputs less well. 4 finger gestures are recognized reliably.
The integrated keys trigger a click reliably, but the noise they make is rather loud. They don't appear to be of particularly high quality.
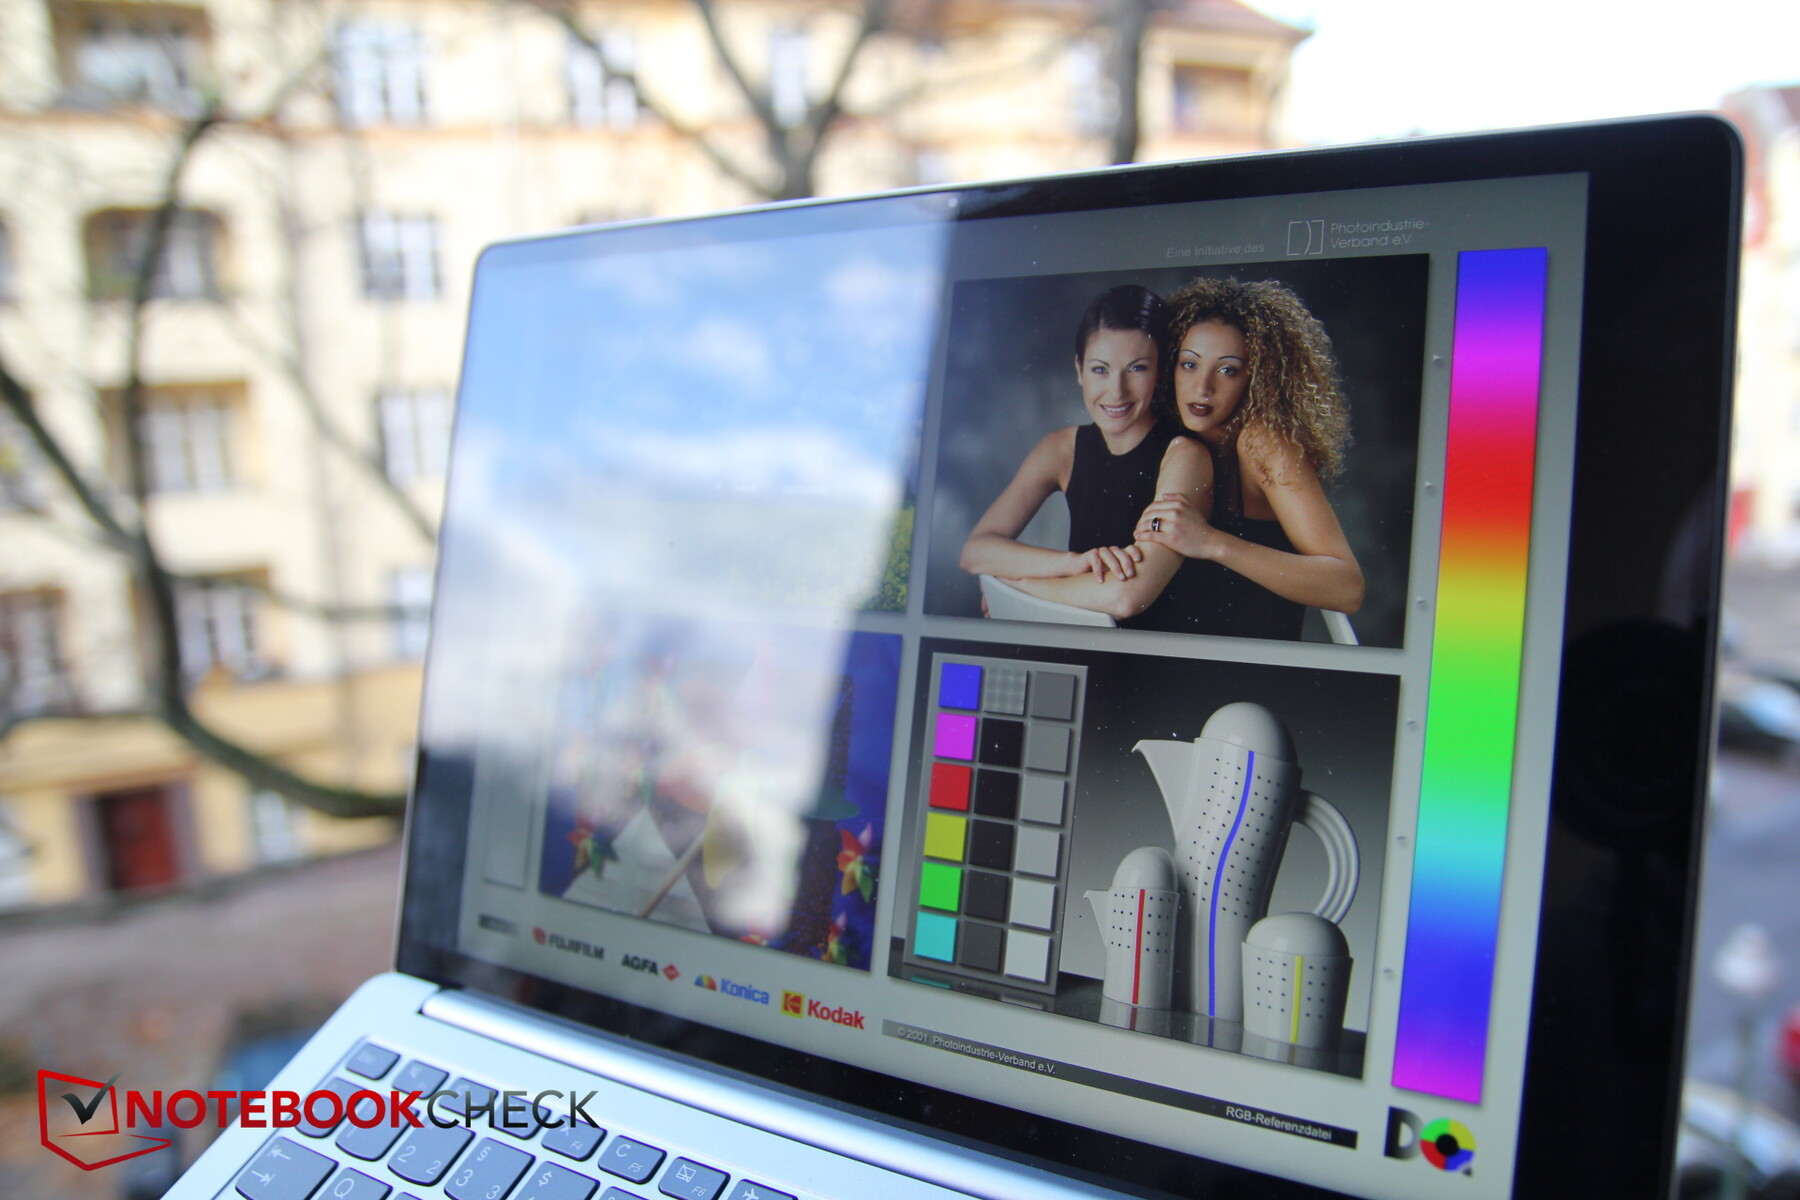
Display - OK, but not as good as last year's
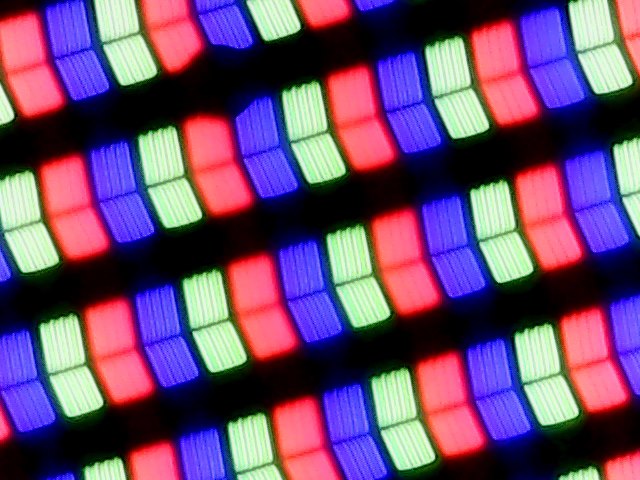
Lenovo has installed a reflective FullHD IPS display from Chi Mei. The predecessor's display was a different model. Unfortunately, that one was better than the current model. At least there are only small differences in brightness (304 vs 314 nits), which , being above 300 nits, is still decent. Still, the competition is even brighter.
Even brightness distribution is lower than on the predecessor with 88 percent instead of 94.
| |||||||||||||||||||||||||
Brightness Distribution: 88 %
Center on Battery: 320 cd/m²
Contrast: 1003:1 (Black: 0.32 cd/m²)
ΔE ColorChecker Calman: 3.41 | ∀{0.5-29.43 Ø4.78}
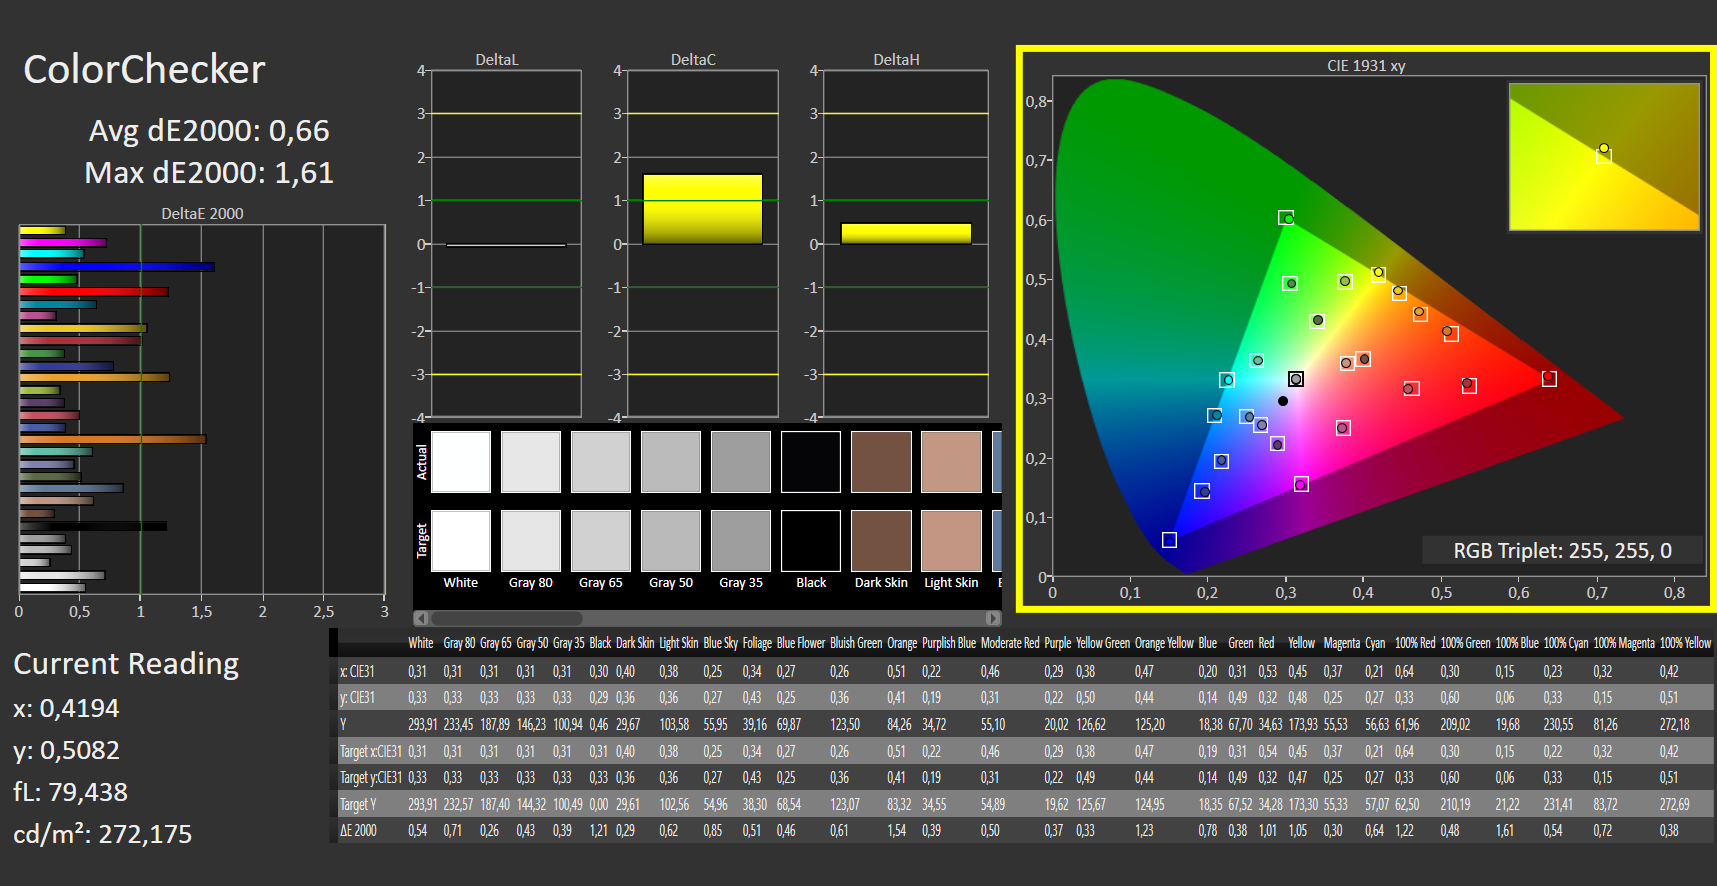
calibrated: 0.66
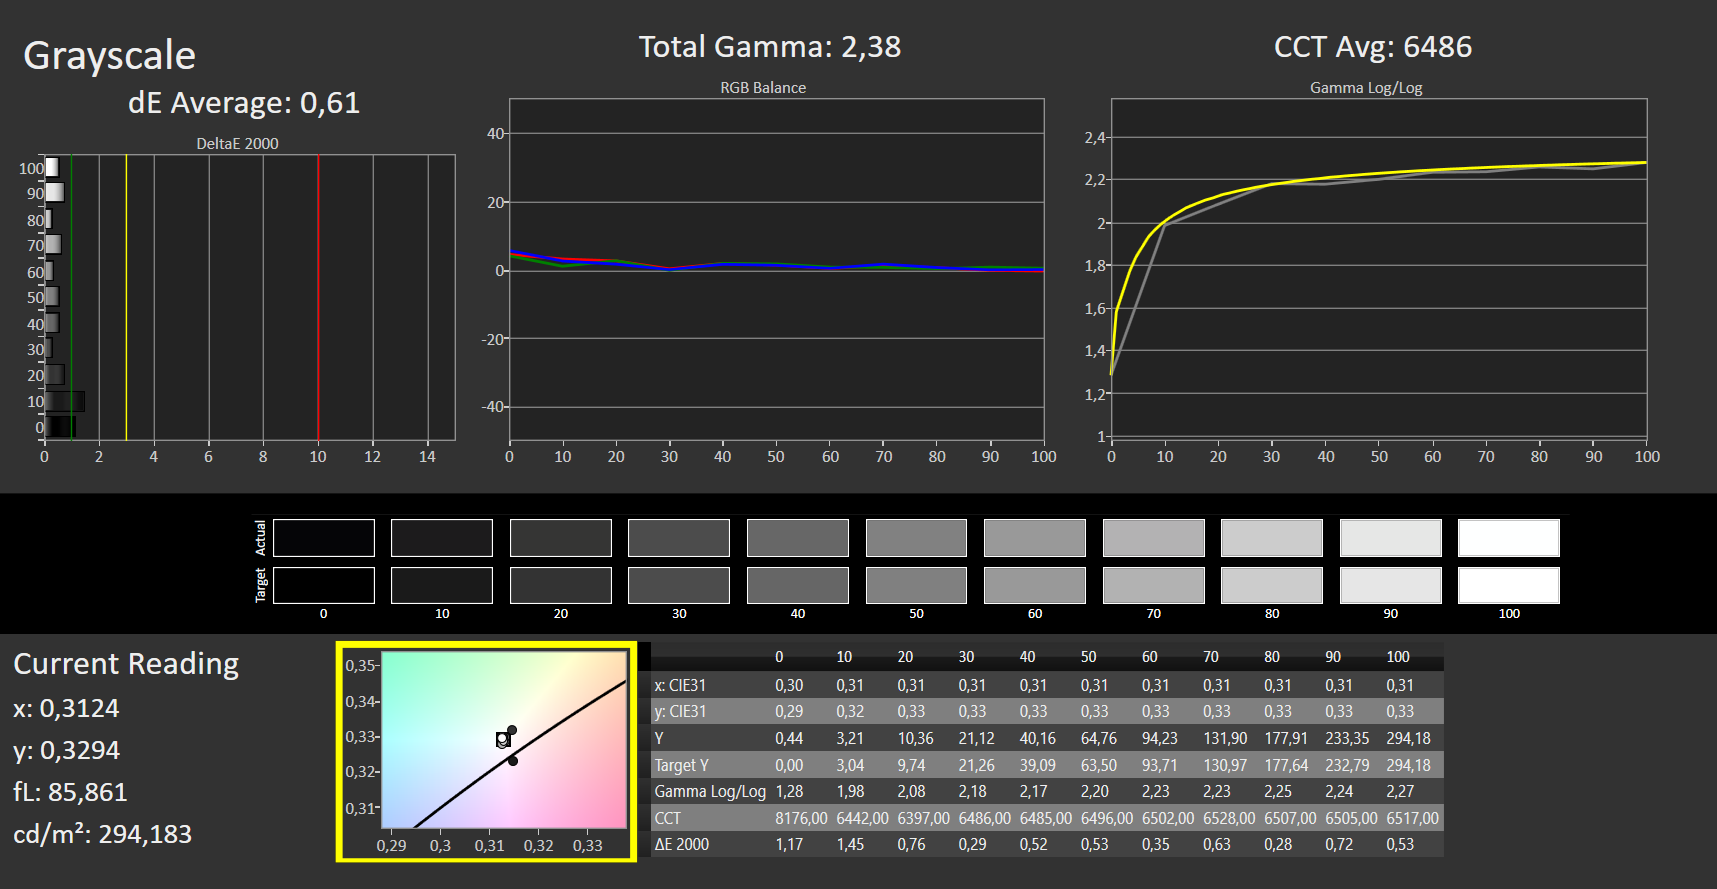
ΔE Greyscale Calman: 5.54 | ∀{0.09-98 Ø5}
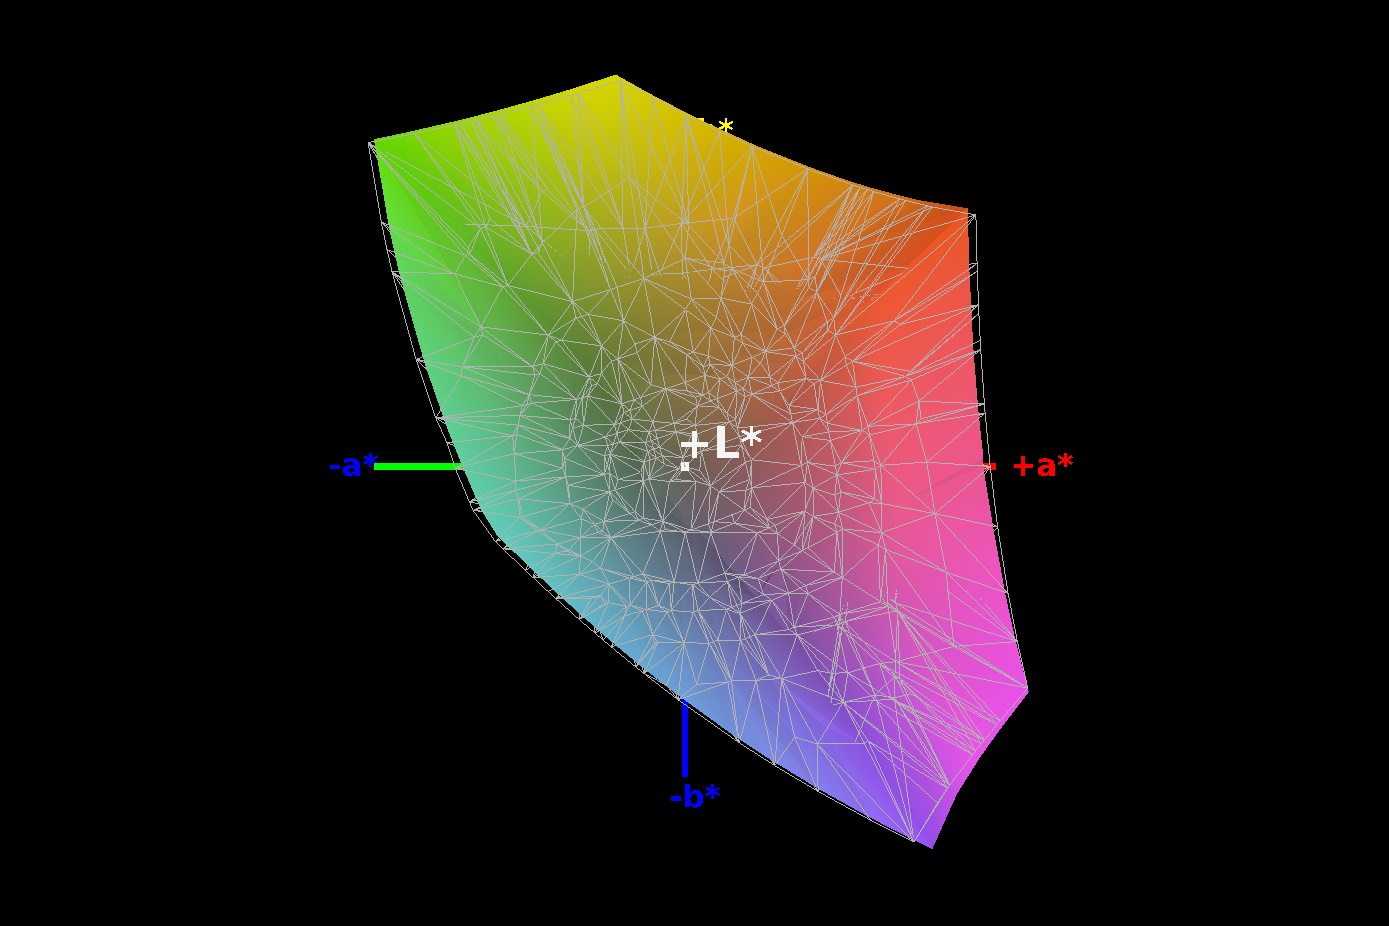
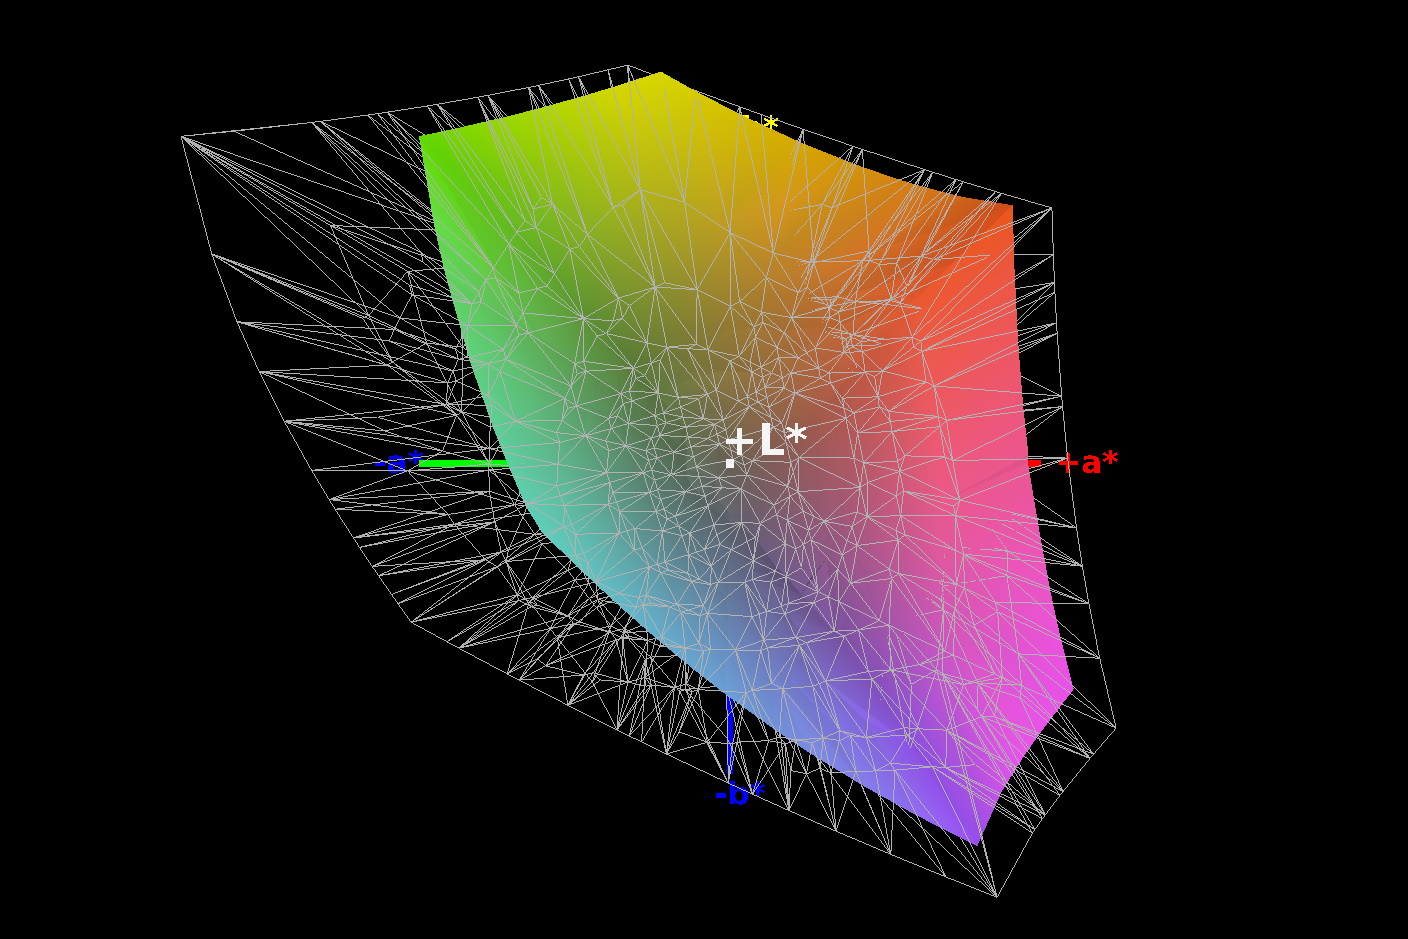
96% sRGB (Argyll 1.6.3 3D)
61% AdobeRGB 1998 (Argyll 1.6.3 3D)
66% AdobeRGB 1998 (Argyll 3D)
95.7% sRGB (Argyll 3D)
64.2% Display P3 (Argyll 3D)
Gamma: 2.33
CCT: 6476 K
| Lenovo IdeaPad S540-13ARE-82DL000YGE Chi Mei CMN13B0 (N133GCA-GQ1), IPS, 2560x1600, 13.3" | Lenovo IdeaPad S540-13API CSOT T3 MND307DA1-2, IPS, 2560x1600, 13.3" | HP ProBook x360 435 G7, Ryzen 5 4500U LGD0675, IPS LED, 1920x1080, 13.3" | Acer Swift 3 SF313-52-52AS BOE08BC, IPS, 2256x1504, 13.5" | Microsoft Surface Laptop 3 13 Core i5-1035G7 Sharp LQ135P1JX51, IPS, 2256x1504, 13.5" | Apple MacBook Air 2020 i5 APPA042, IPS, 2560x1600, 13.3" | |
|---|---|---|---|---|---|---|
| Display | 9% | -3% | 7% | 3% | 7% | |
| Display P3 Coverage (%) | 64.2 | 73.4 14% | 63.1 -2% | 70.3 10% | 65.7 2% | 70.4 10% |
| sRGB Coverage (%) | 95.7 | 98.6 3% | 90.8 -5% | 99.8 4% | 98.6 3% | 97.7 2% |
| AdobeRGB 1998 Coverage (%) | 66 | 72.6 10% | 64.5 -2% | 71.3 8% | 67.8 3% | 71.7 9% |
| Response Times | -36% | -36% | -44% | -80% | -25% | |
| Response Time Grey 50% / Grey 80% * (ms) | 33 ? | 45.6 ? -38% | 45.6 ? -38% | 50 ? -52% | 59.2 ? -79% | 38.7 ? -17% |
| Response Time Black / White * (ms) | 23 ? | 30.8 ? -34% | 30.8 ? -34% | 31 ? -35% | 41.6 ? -81% | 30.44 ? -32% |
| PWM Frequency (Hz) | 192 ? | 21740 ? | 117000 ? | |||
| Screen | 1% | -1% | 13% | 18% | 9% | |
| Brightness middle (cd/m²) | 321 | 321 0% | 354 10% | 456 42% | 403.4 26% | 430 34% |
| Brightness (cd/m²) | 304 | 314 3% | 344 13% | 432 42% | 397 31% | 405 33% |
| Brightness Distribution (%) | 88 | 94 7% | 83 -6% | 88 0% | 89 1% | 89 1% |
| Black Level * (cd/m²) | 0.32 | 0.19 41% | 0.16 50% | 0.32 -0% | 0.34 -6% | 0.32 -0% |
| Contrast (:1) | 1003 | 1689 68% | 2213 121% | 1425 42% | 1186 18% | 1344 34% |
| Colorchecker dE 2000 * | 3.41 | 3.3 3% | 3.4 -0% | 3.49 -2% | 0.94 72% | 1.8 47% |
| Colorchecker dE 2000 calibrated * | 0.66 | 1.7 -158% | 2 -203% | 0.72 -9% | 0.99 -50% | 1.6 -142% |
| Greyscale dE 2000 * | 5.54 | 3.5 37% | 4.5 19% | 5.53 -0% | 0.9 84% | 1.1 80% |
| Gamma | 2.33 94% | 2.08 106% | 2.29 96% | 2.41 91% | 2.13 103% | |
| CCT | 6476 100% | 7245 90% | 6046 108% | 6675 97% | 6620 98% | 6644 98% |
| Color Space (Percent of AdobeRGB 1998) (%) | 61 | 64.5 6% | 59 -3% | 65 7% | 62.3 2% | 64.2 5% |
| Color Space (Percent of sRGB) (%) | 96 | 98.4 3% | 90.6 -6% | 100 4% | 98.7 3% | 97.6 2% |
| Colorchecker dE 2000 max. * | 6 | 5.8 | 8.4 | 2.92 | 4.6 | |
| Total Average (Program / Settings) | -9% /
-2% | -13% /
-6% | -8% /
4% | -20% /
2% | -3% /
4% |
* ... smaller is better
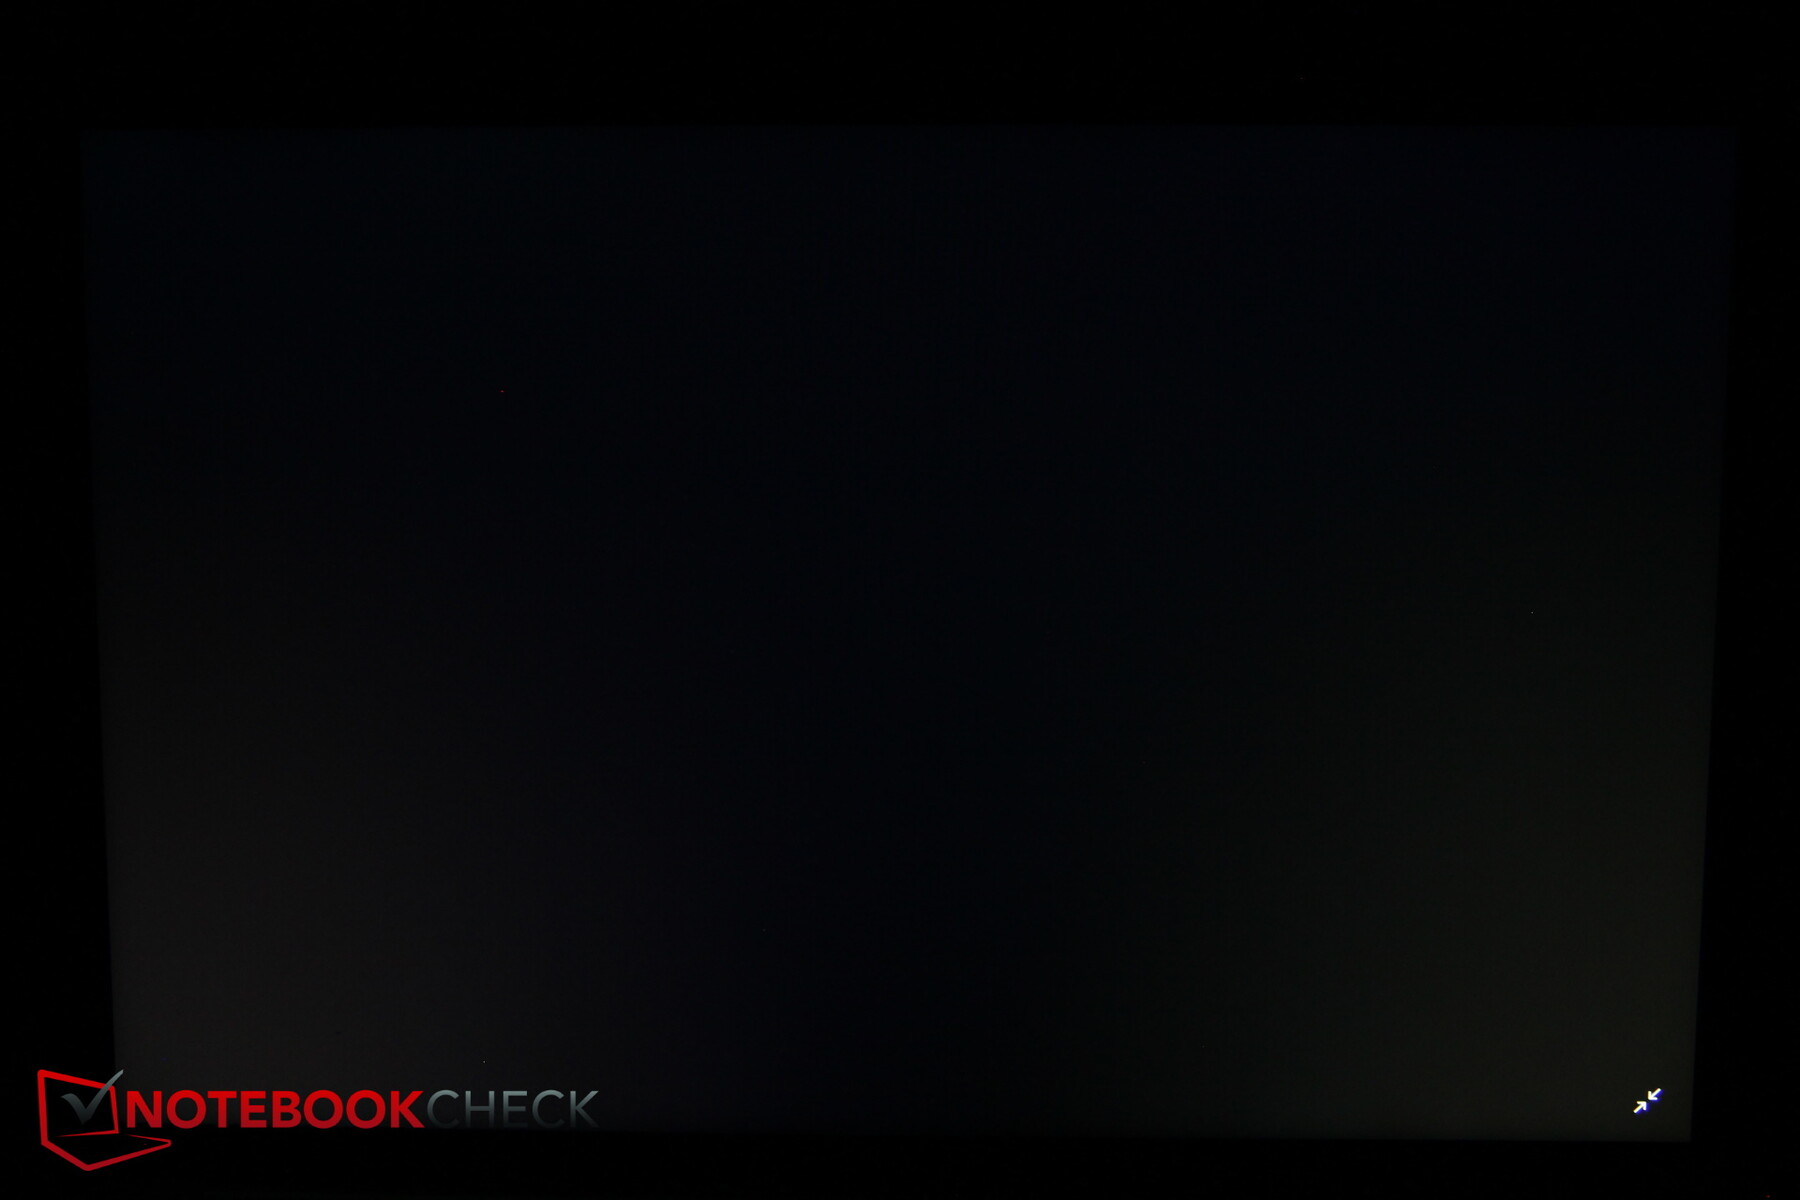
The same goes for the contrast and black value: 1689:1 is what the predecessor had to offer, while today's test unit only manages 1003:1. That's quite a difference in favor of last year's panel. The black value isn't ideal at 0.32 (predecessor: 0.19, lower being better). The color display could be calibrated successfully, although the grayscale deviation still is comparably high.
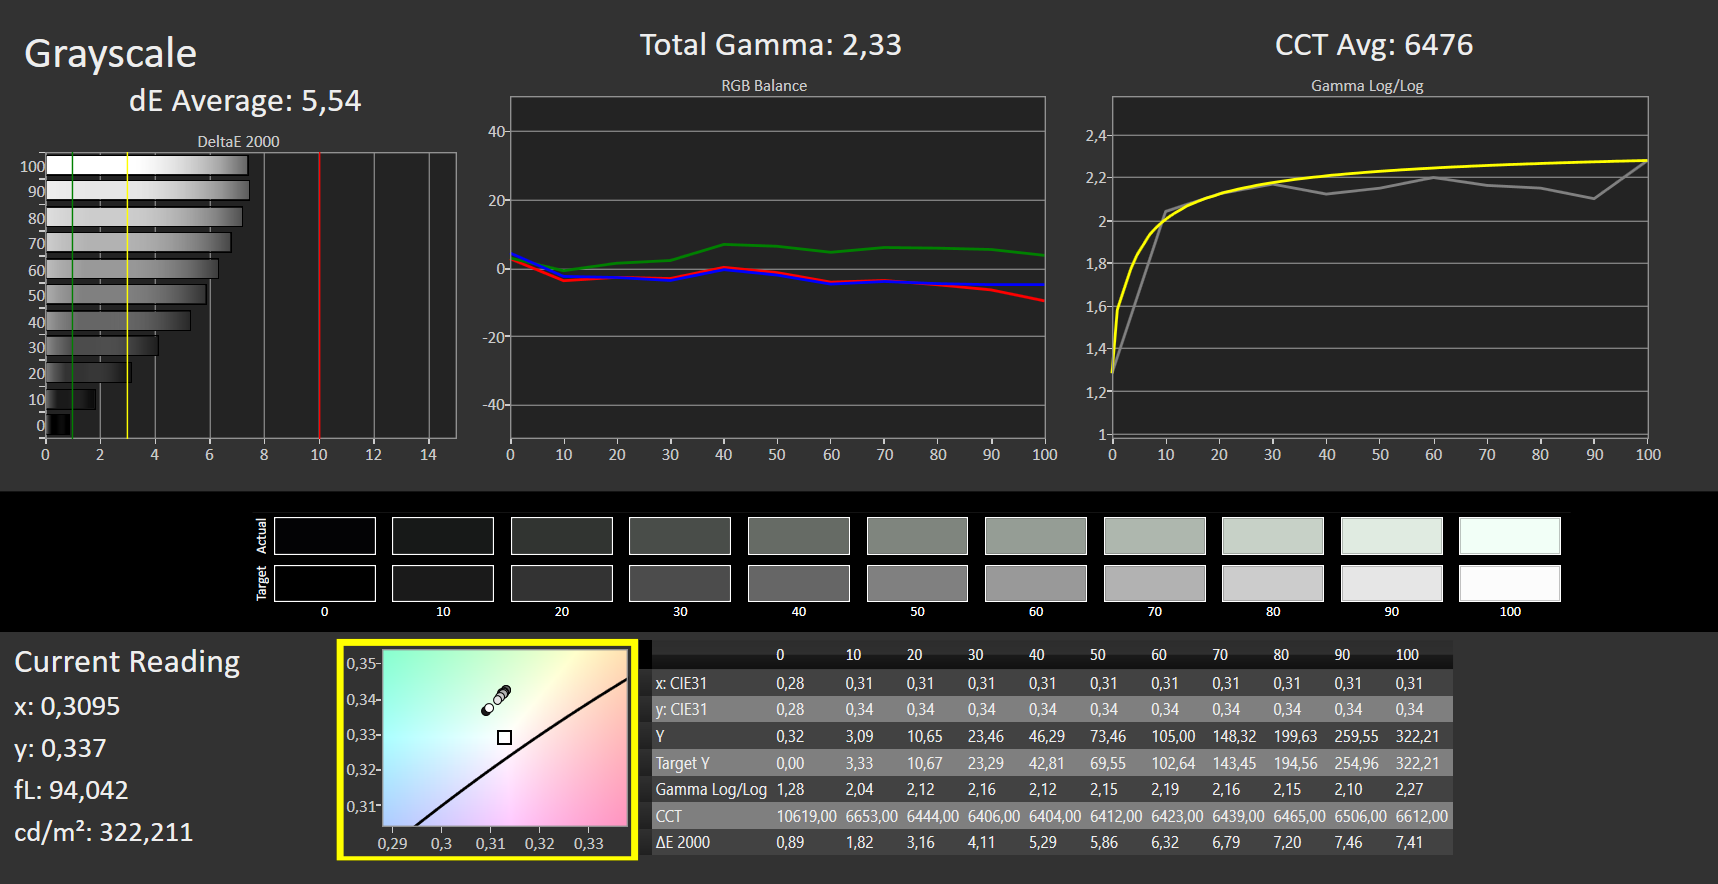
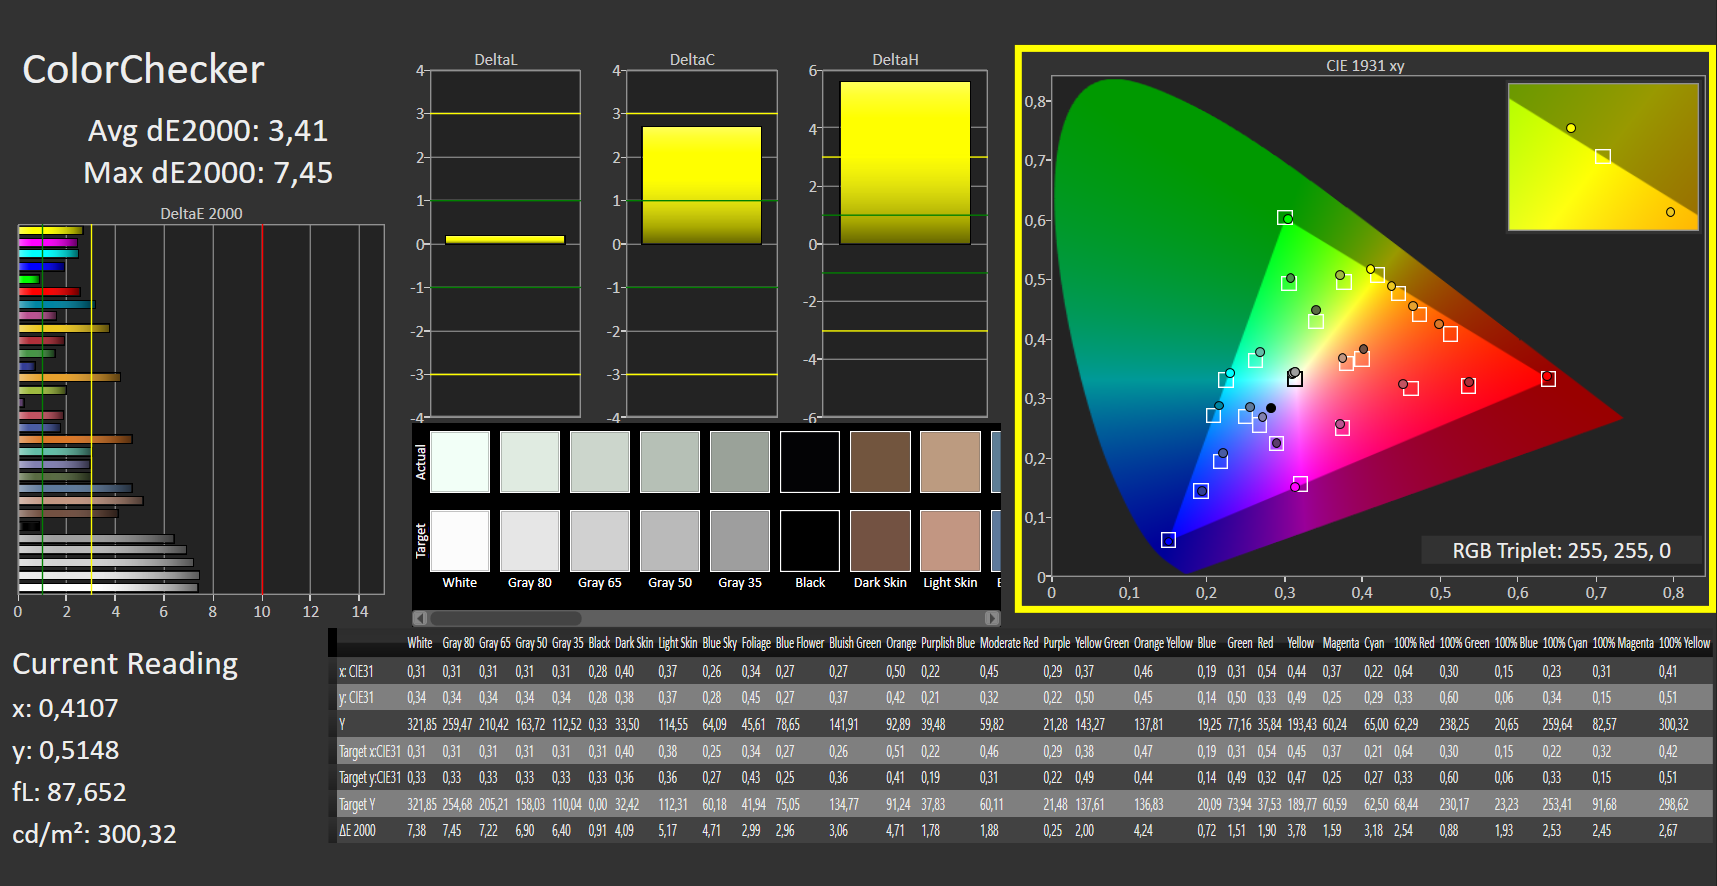
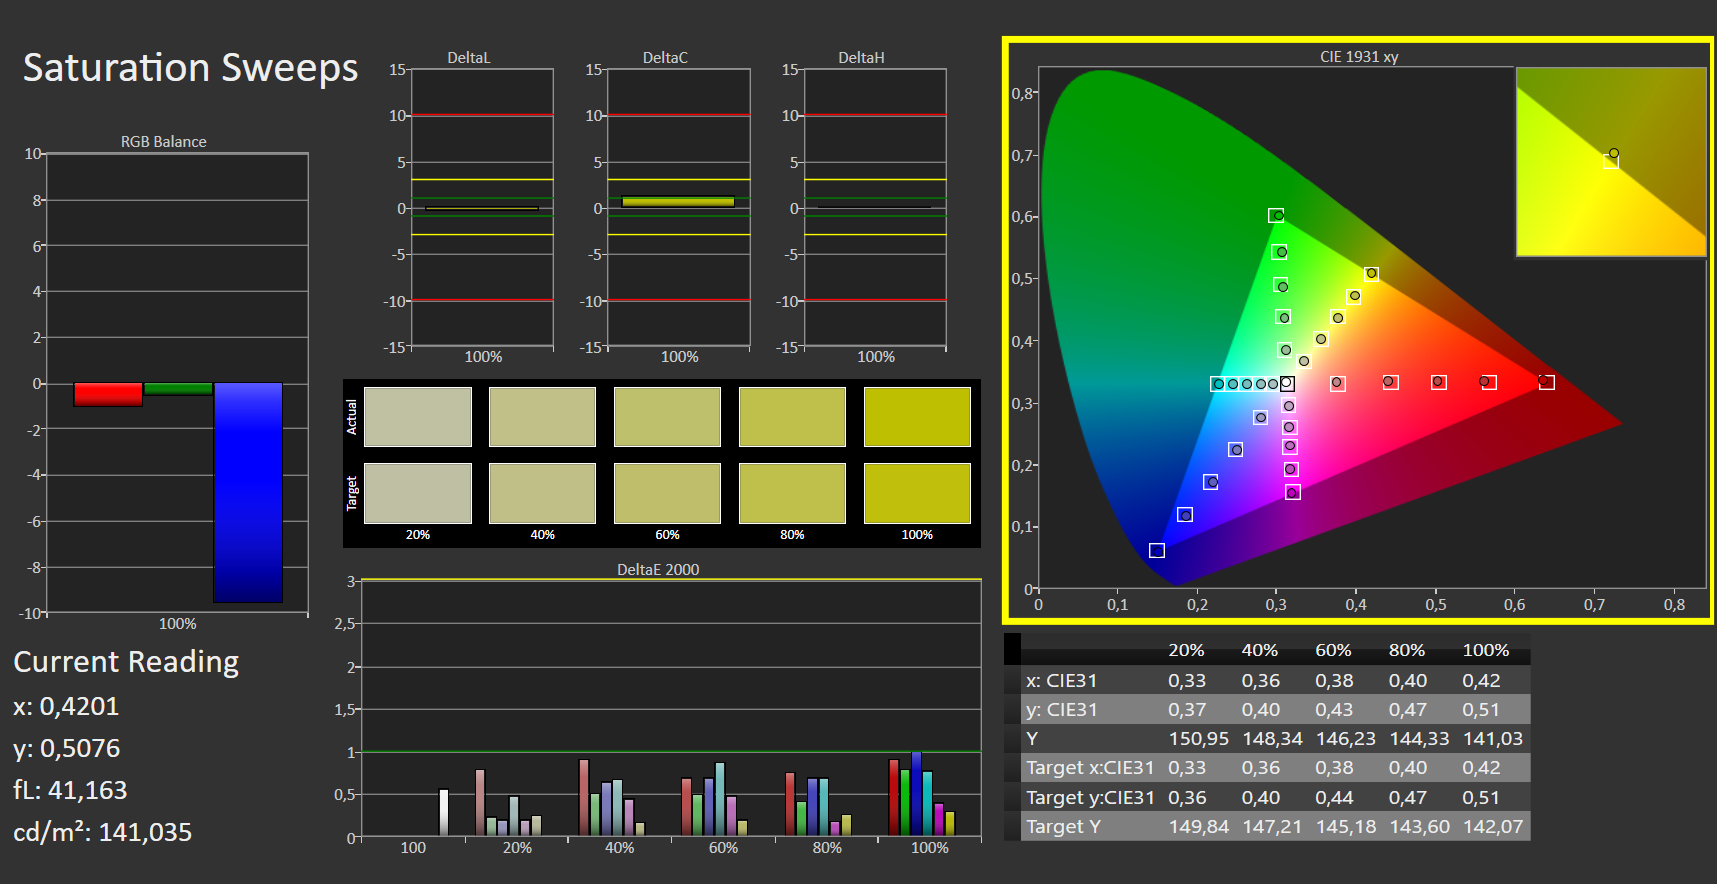
Only the response rates are slightly better this time around - it's just a shame that these aren't particularly relevant for an office laptop. The color space coverage has remained on a similar level at 96 percent of sRGB.
Overall, the new display isn't a bad panel, it just doesn't perform quite as well as its predecessor did. We have no idea why Lenovo chose to use a new, worse model for this edition instead of sticking to what was already a good panel.
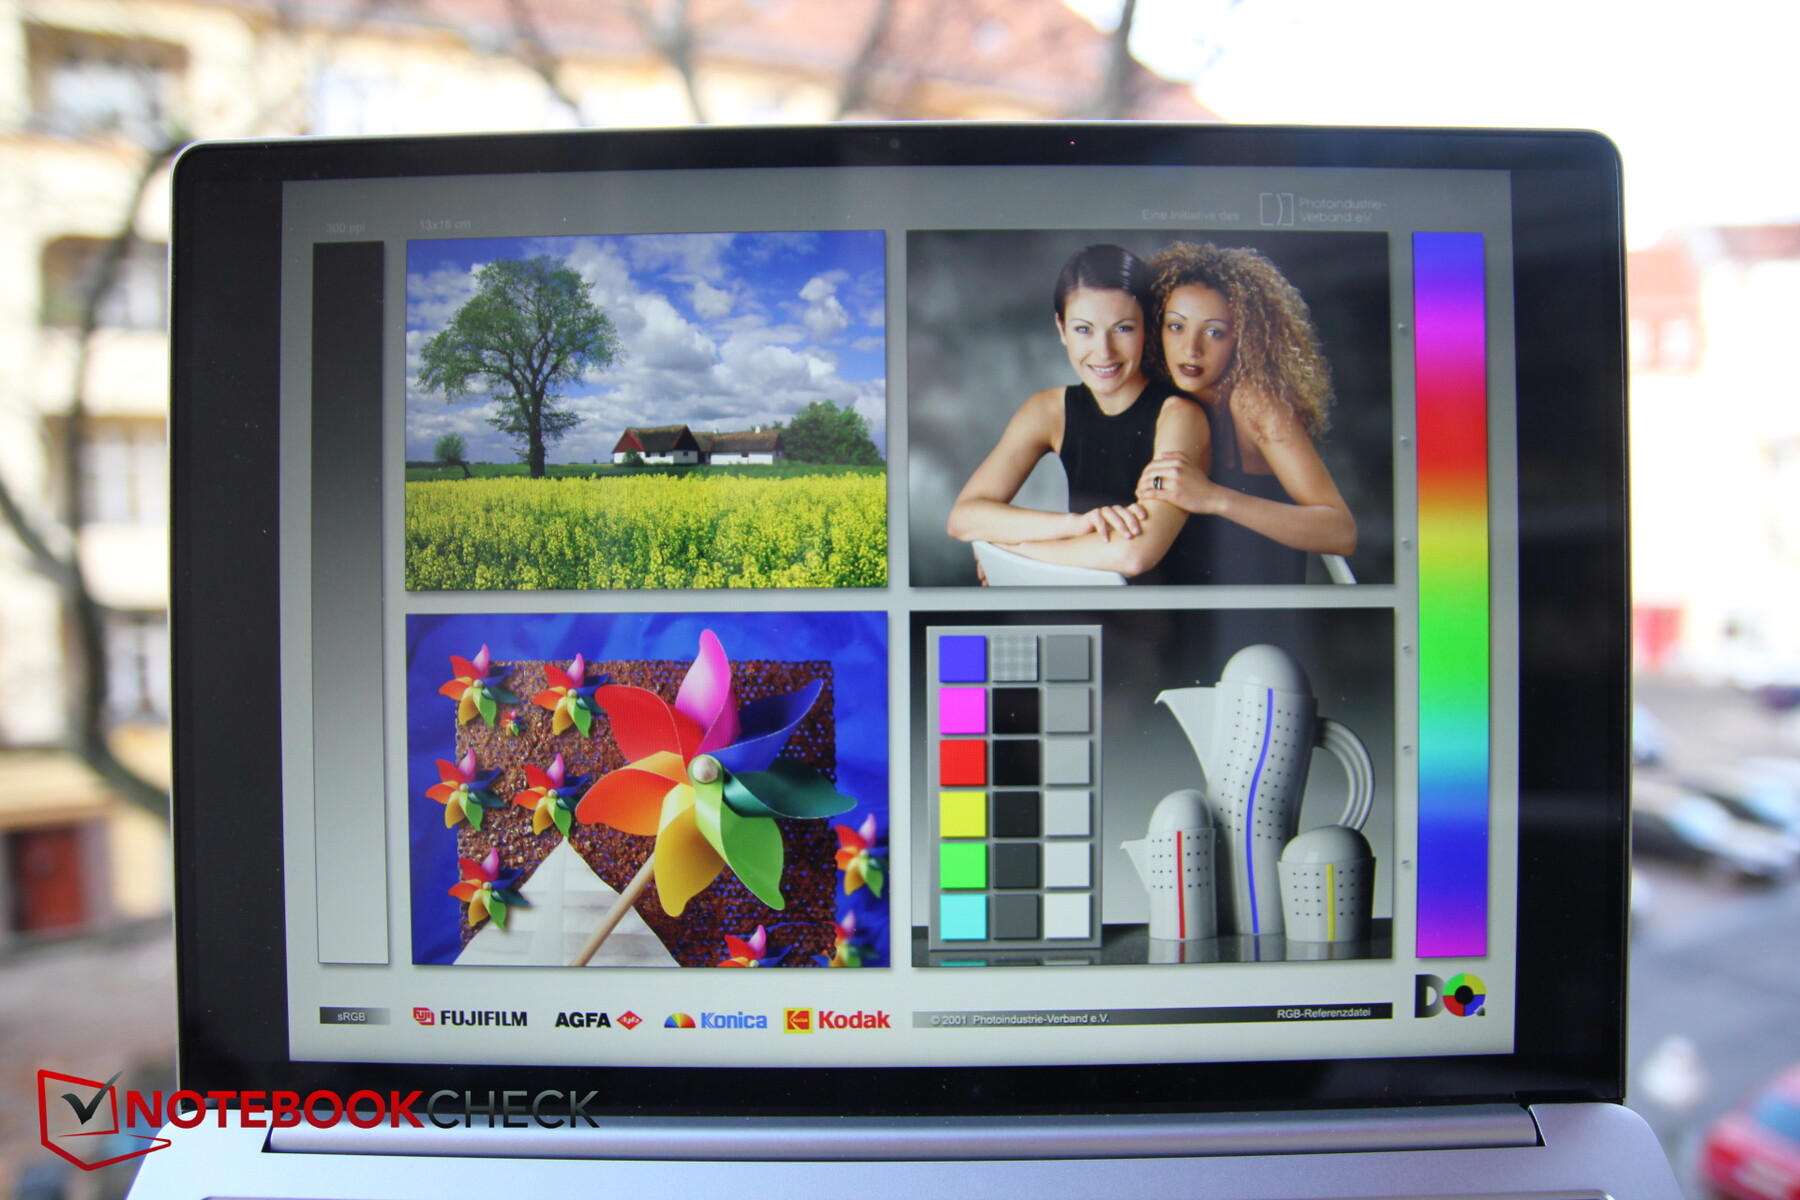
Outdoor use is made more difficult by the reflectiveness of the display. Luckily the good brightness can compensate this to a certain extent.
Display Response Times
| ↔ Response Time Black to White | ||
|---|---|---|
| 23 ms ... rise ↗ and fall ↘ combined | ↗ 14 ms rise | 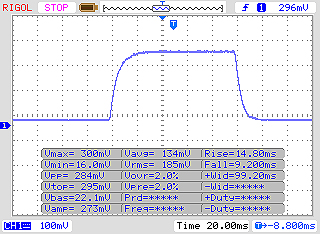 |
| ↘ 9 ms fall | ||
| The screen shows good response rates in our tests, but may be too slow for competitive gamers. In comparison, all tested devices range from 0.1 (minimum) to 240 (maximum) ms. » 50 % of all devices are better. This means that the measured response time is worse than the average of all tested devices (20.2 ms). | ||
| ↔ Response Time 50% Grey to 80% Grey | ||
| 33 ms ... rise ↗ and fall ↘ combined | ↗ 15 ms rise | 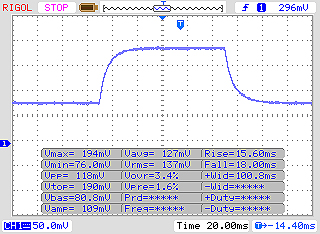 |
| ↘ 18 ms fall | ||
| The screen shows slow response rates in our tests and will be unsatisfactory for gamers. In comparison, all tested devices range from 0.165 (minimum) to 636 (maximum) ms. » 44 % of all devices are better. This means that the measured response time is similar to the average of all tested devices (31.6 ms). | ||
Screen Flickering / PWM (Pulse-Width Modulation)
| Screen flickering / PWM not detected | 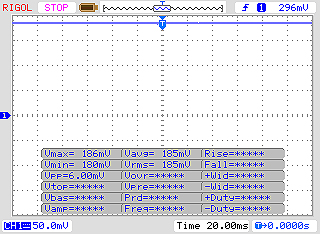 | ||
In comparison: 53 % of all tested devices do not use PWM to dim the display. If PWM was detected, an average of 8111 (minimum: 5 - maximum: 343500) Hz was measured. | |||
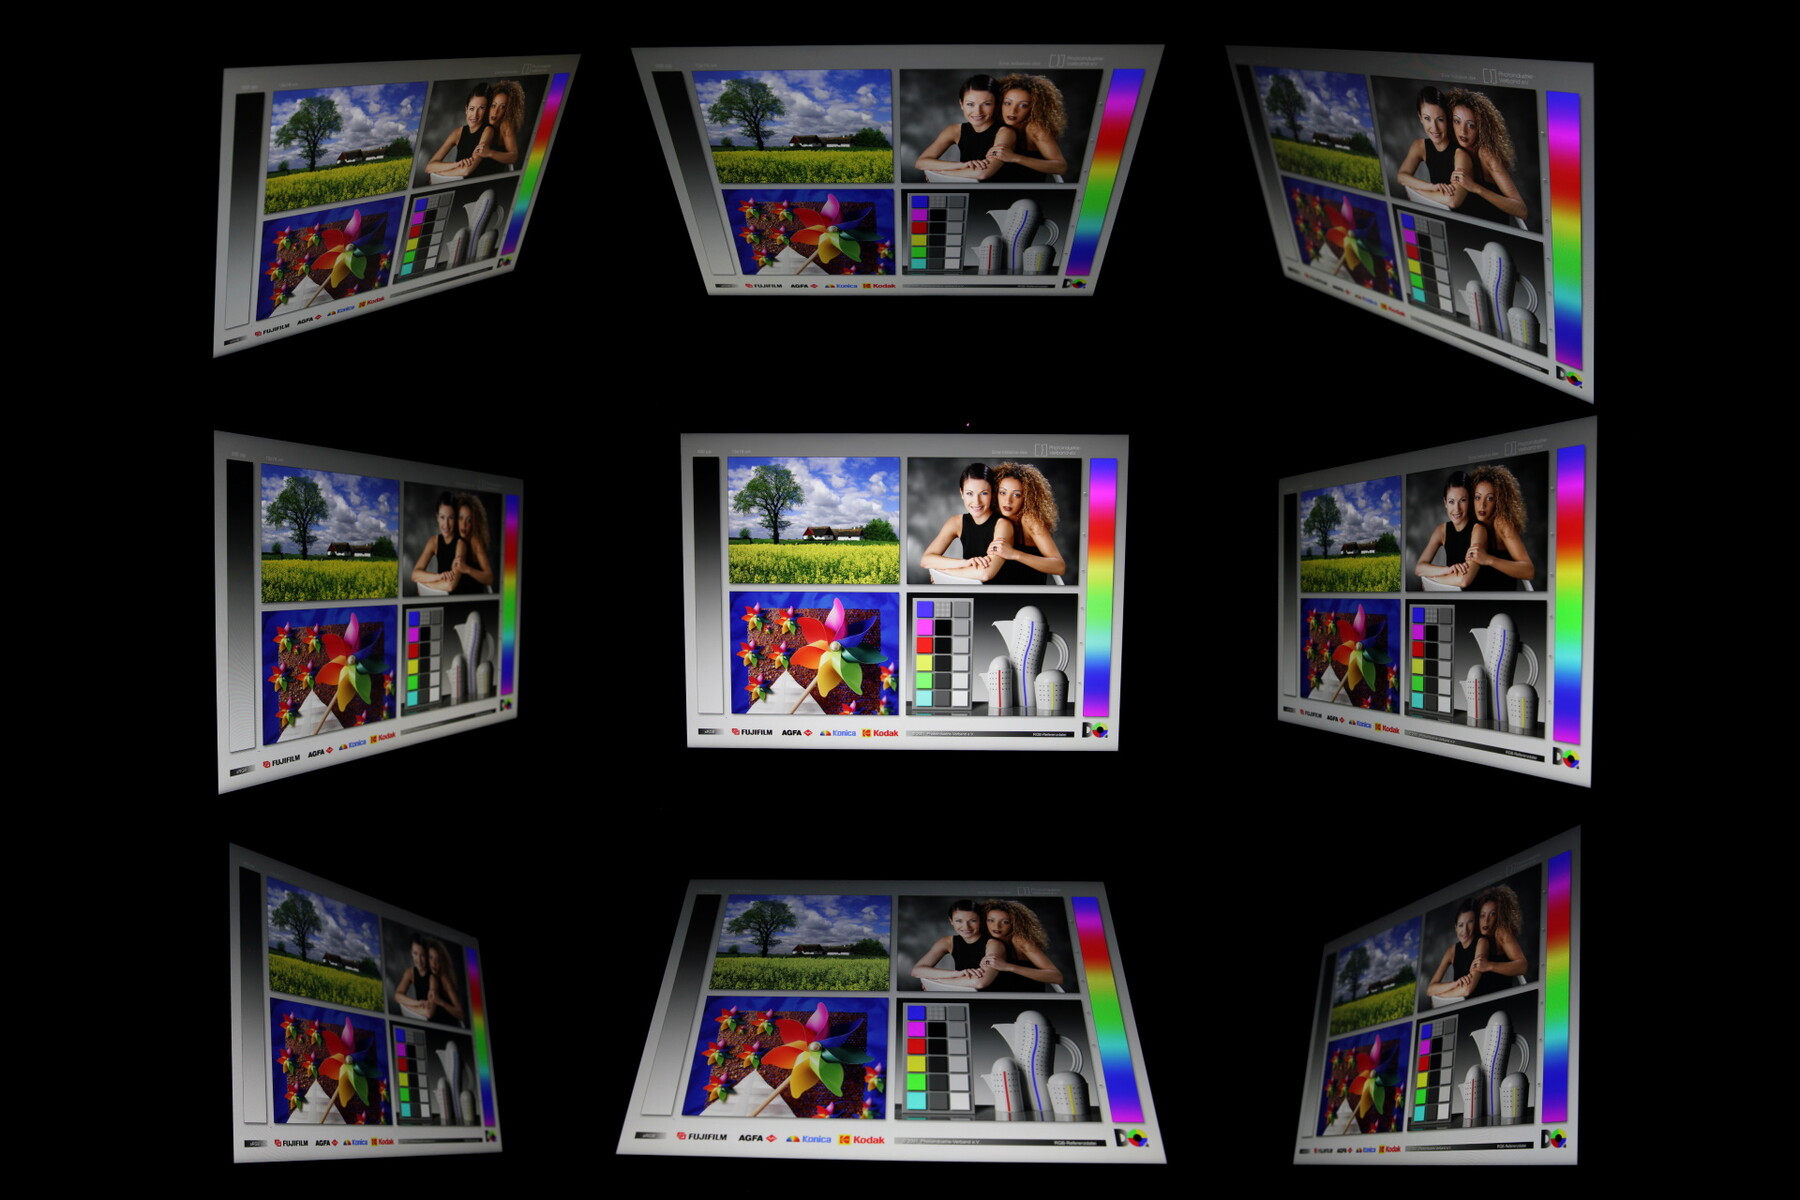
The panel has very stable viewing angles with only a little brightness being lost from wide angles. Content remains easy to see.
Performance - A strong Ryzen - what else?
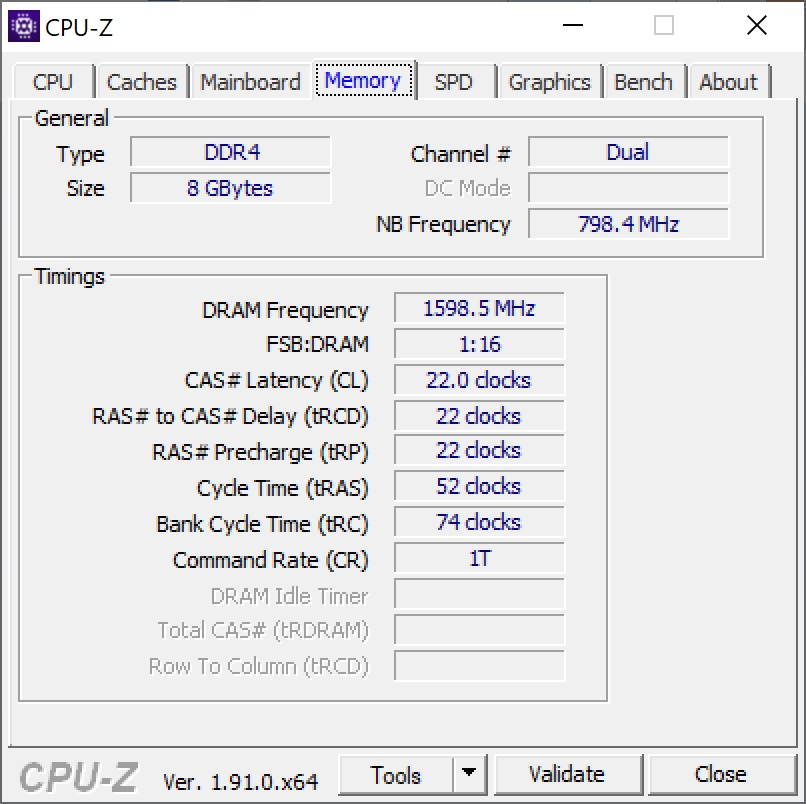
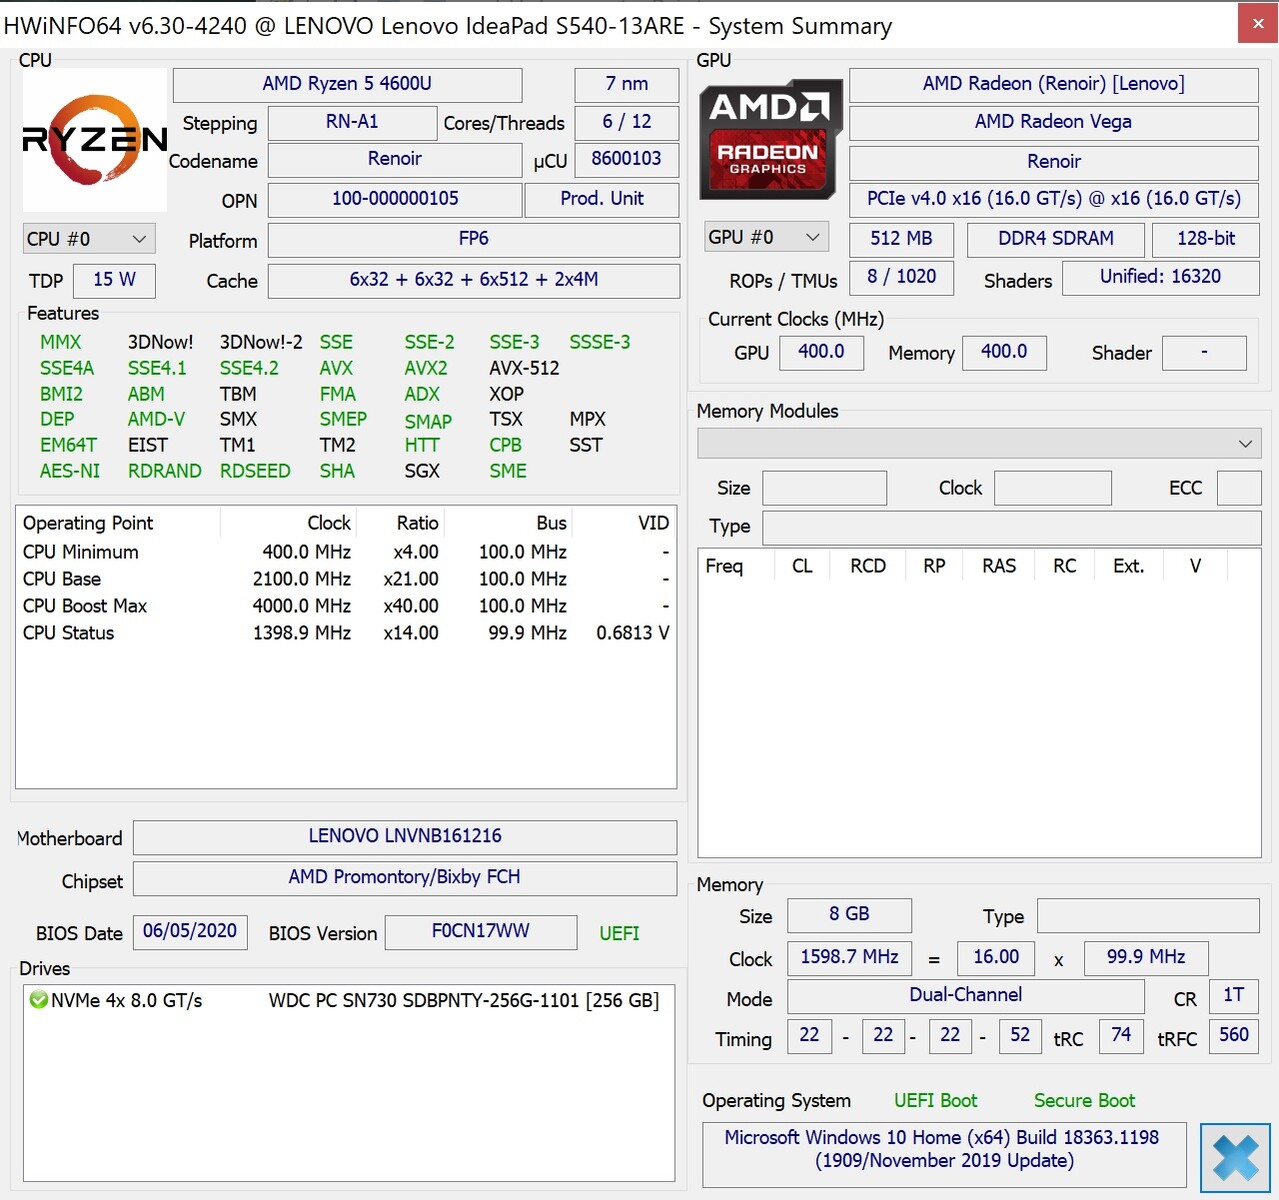
Being equipped with a modern AMD Ryzen 5 4600U, this laptop should benefit from high CPU performance while the missing dedicated GPU disqualifies the notebook from extending these good rates to all-round performance. Nonetheless, the integrated Ryzen 4000 GPUs have become quite effective recently. 8 GB of non-expandable RAM and a 256-GB SSD complete our test unit's hardware.
The 13-inch device is largely directed at office users and for browsing the web. It also supports simple image processing as well as video streaming. Gamers will have to limit themselves to older or less demanding titles.
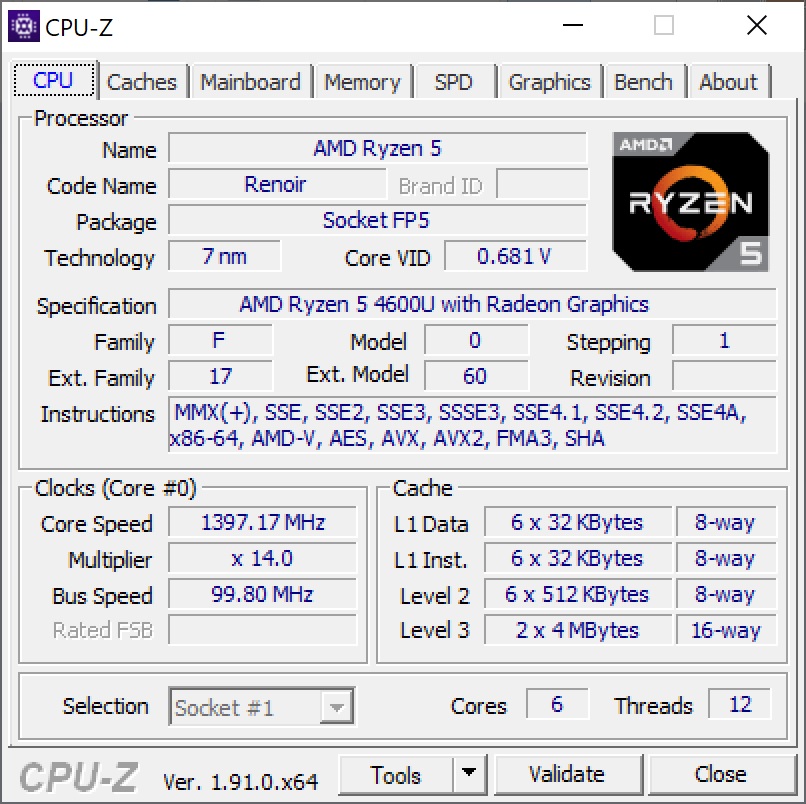
Processor
The Ryzen 5 4600U is based on the Renoir Zen 2 architecture. Its 6 cores clock at a rate of 2.1 to 4 GHz. The CPU can work up to 12 threads simultaneously. It offers very good performance stability, particularly compared to the Intel CPUs. It almost offers too much power for an office laptop, but as it is fairly energy-efficient at the same time, this isn't a disadvantage and enables mobile users to benefit from good performance.
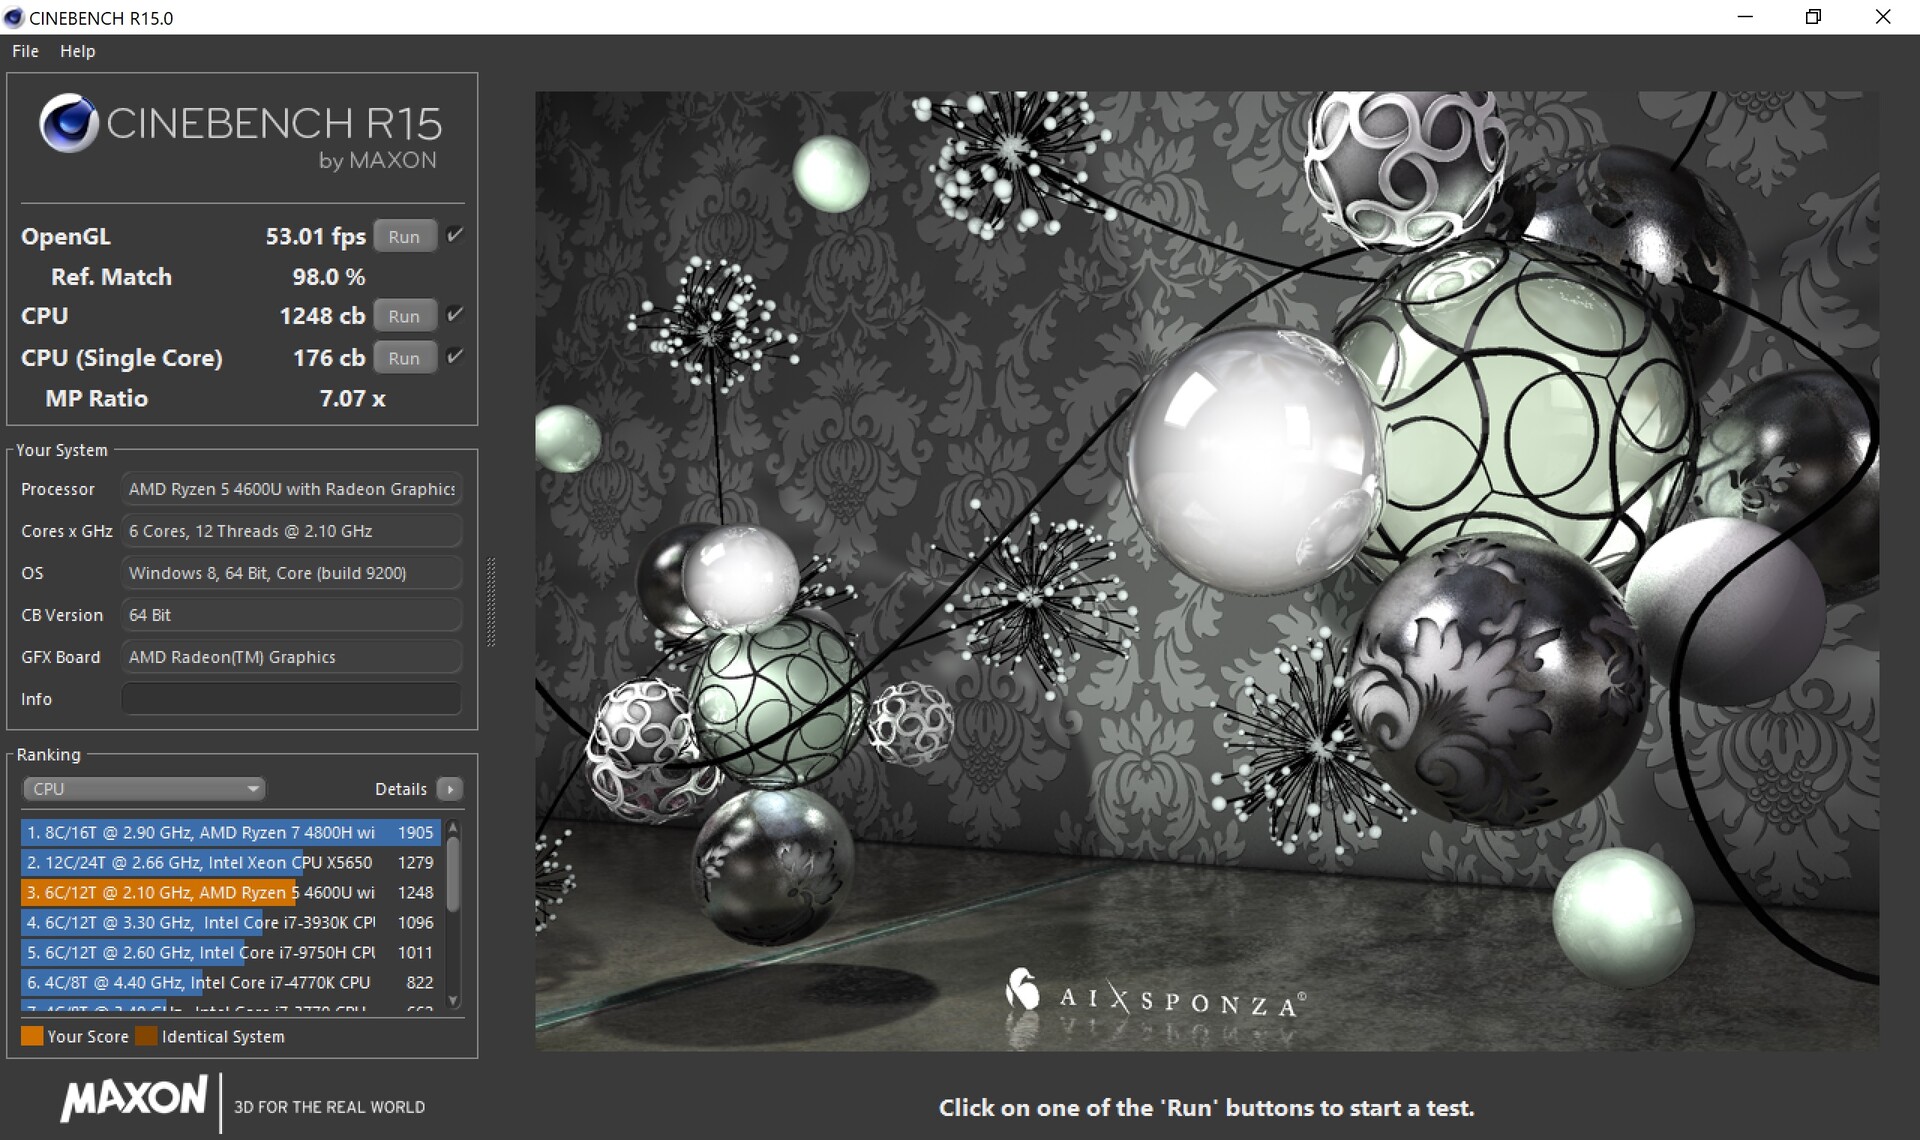
The CPU performance in our CineBench R15 Loop benchmark was very good and consistent. The Core i5 in the Surface Laptop 3 can't keep up, with the Ryzen 5 4600U being almost twice as fast. This is impressive considering the small form factor. The CPU actually performs better than expected. Compared to its predecessor, the CPU performance in multi-thread applications is literally up 100 percent.
The CineBench results are about 7 percent lower on battery, which is almost falls within the range of measurement uncertainty.

Cinebench R15: CPU Single 64Bit | CPU Multi 64Bit
Blender: v2.79 BMW27 CPU
7-Zip 18.03: 7z b 4 -mmt1 | 7z b 4
Geekbench 5.5: Single-Core | Multi-Core
HWBOT x265 Benchmark v2.2: 4k Preset
LibreOffice : 20 Documents To PDF
R Benchmark 2.5: Overall mean
| Cinebench R20 / CPU (Single Core) | |
| Average of class Subnotebook (128 - 826, n=70, last 2 years) | |
| Lenovo IdeaPad S540-13ARE-82DL000YGE | |
| Average AMD Ryzen 5 4600U (447 - 453, n=3) | |
| HP ProBook x360 435 G7, Ryzen 5 4500U | |
| Microsoft Surface Laptop 3 13 Core i5-1035G7 | |
| Apple MacBook Air 2020 i5 | |
| Apple MacBook Air 2020 i5 | |
| Lenovo IdeaPad S540-13API | |
| Acer Swift 3 SF313-52-52AS | |
| Acer Swift 3 SF313-52-52AS | |
| Cinebench R20 / CPU (Multi Core) | |
| Average of class Subnotebook (579 - 8541, n=70, last 2 years) | |
| Lenovo IdeaPad S540-13ARE-82DL000YGE | |
| Average AMD Ryzen 5 4600U (2544 - 2796, n=3) | |
| HP ProBook x360 435 G7, Ryzen 5 4500U | |
| Microsoft Surface Laptop 3 13 Core i5-1035G7 | |
| Lenovo IdeaPad S540-13API | |
| Apple MacBook Air 2020 i5 | |
| Apple MacBook Air 2020 i5 | |
| Acer Swift 3 SF313-52-52AS | |
| Acer Swift 3 SF313-52-52AS | |
| Cinebench R15 / CPU Single 64Bit | |
| Average of class Subnotebook (72.4 - 322, n=70, last 2 years) | |
| Lenovo IdeaPad S540-13ARE-82DL000YGE | |
| Average AMD Ryzen 5 4600U (175 - 176, n=2) | |
| HP ProBook x360 435 G7, Ryzen 5 4500U | |
| Microsoft Surface Laptop 3 13 Core i5-1035G7 | |
| Acer Swift 3 SF313-52-52AS | |
| Lenovo IdeaPad S540-13API | |
| Apple MacBook Air 2020 i5 | |
| Cinebench R15 / CPU Multi 64Bit | |
| Average of class Subnotebook (327 - 3345, n=70, last 2 years) | |
| Lenovo IdeaPad S540-13ARE-82DL000YGE | |
| Average AMD Ryzen 5 4600U (838 - 1340, n=2) | |
| HP ProBook x360 435 G7, Ryzen 5 4500U | |
| Microsoft Surface Laptop 3 13 Core i5-1035G7 | |
| Lenovo IdeaPad S540-13API | |
| Acer Swift 3 SF313-52-52AS | |
| Apple MacBook Air 2020 i5 | |
| Blender / v2.79 BMW27 CPU | |
| Apple MacBook Air 2020 i5 | |
| Acer Swift 3 SF313-52-52AS | |
| Acer Swift 3 SF313-52-52AS | |
| Microsoft Surface Laptop 3 13 Core i5-1035G7 | |
| Lenovo IdeaPad S540-13API | |
| HP ProBook x360 435 G7, Ryzen 5 4500U | |
| Lenovo IdeaPad S540-13ARE-82DL000YGE | |
| Average AMD Ryzen 5 4600U (n=1) | |
| Average of class Subnotebook (159 - 2271, n=73, last 2 years) | |
| 7-Zip 18.03 / 7z b 4 -mmt1 | |
| Average of class Subnotebook (2643 - 6442, n=72, last 2 years) | |
| HP ProBook x360 435 G7, Ryzen 5 4500U | |
| Microsoft Surface Laptop 3 13 Core i5-1035G7 | |
| Lenovo IdeaPad S540-13ARE-82DL000YGE | |
| Average AMD Ryzen 5 4600U (n=1) | |
| Acer Swift 3 SF313-52-52AS | |
| Acer Swift 3 SF313-52-52AS | |
| Lenovo IdeaPad S540-13API | |
| Apple MacBook Air 2020 i5 | |
| 7-Zip 18.03 / 7z b 4 | |
| Average of class Subnotebook (11668 - 77867, n=70, last 2 years) | |
| Lenovo IdeaPad S540-13ARE-82DL000YGE | |
| Average AMD Ryzen 5 4600U (n=1) | |
| HP ProBook x360 435 G7, Ryzen 5 4500U | |
| Microsoft Surface Laptop 3 13 Core i5-1035G7 | |
| Lenovo IdeaPad S540-13API | |
| Acer Swift 3 SF313-52-52AS | |
| Acer Swift 3 SF313-52-52AS | |
| Apple MacBook Air 2020 i5 | |
| Geekbench 5.5 / Single-Core | |
| Average of class Subnotebook (726 - 2350, n=65, last 2 years) | |
| Apple MacBook Air 2020 i5 | |
| Apple MacBook Air 2020 i5 | |
| Lenovo IdeaPad S540-13ARE-82DL000YGE | |
| Average AMD Ryzen 5 4600U (n=1) | |
| HP ProBook x360 435 G7, Ryzen 5 4500U | |
| Acer Swift 3 SF313-52-52AS | |
| Acer Swift 3 SF313-52-52AS | |
| Geekbench 5.5 / Multi-Core | |
| Average of class Subnotebook (2557 - 17218, n=65, last 2 years) | |
| Lenovo IdeaPad S540-13ARE-82DL000YGE | |
| Average AMD Ryzen 5 4600U (n=1) | |
| HP ProBook x360 435 G7, Ryzen 5 4500U | |
| Acer Swift 3 SF313-52-52AS | |
| Acer Swift 3 SF313-52-52AS | |
| Apple MacBook Air 2020 i5 | |
| Apple MacBook Air 2020 i5 | |
| HWBOT x265 Benchmark v2.2 / 4k Preset | |
| Average of class Subnotebook (0.97 - 25.1, n=70, last 2 years) | |
| Lenovo IdeaPad S540-13ARE-82DL000YGE | |
| Average AMD Ryzen 5 4600U (n=1) | |
| HP ProBook x360 435 G7, Ryzen 5 4500U | |
| Microsoft Surface Laptop 3 13 Core i5-1035G7 | |
| Lenovo IdeaPad S540-13API | |
| Acer Swift 3 SF313-52-52AS | |
| Acer Swift 3 SF313-52-52AS | |
| Apple MacBook Air 2020 i5 | |
| LibreOffice / 20 Documents To PDF | |
| Lenovo IdeaPad S540-13ARE-82DL000YGE | |
| Average AMD Ryzen 5 4600U (n=1) | |
| Apple MacBook Air 2020 i5 | |
| Acer Swift 3 SF313-52-52AS | |
| Acer Swift 3 SF313-52-52AS | |
| HP ProBook x360 435 G7, Ryzen 5 4500U | |
| Average of class Subnotebook (38.5 - 220, n=69, last 2 years) | |
| R Benchmark 2.5 / Overall mean | |
| Apple MacBook Air 2020 i5 | |
| Apple MacBook Air 2020 i5 | |
| Acer Swift 3 SF313-52-52AS | |
| Acer Swift 3 SF313-52-52AS | |
| HP ProBook x360 435 G7, Ryzen 5 4500U | |
| Lenovo IdeaPad S540-13ARE-82DL000YGE | |
| Average AMD Ryzen 5 4600U (n=1) | |
| Average of class Subnotebook (0.403 - 1.456, n=71, last 2 years) | |
* ... smaller is better
System Performance
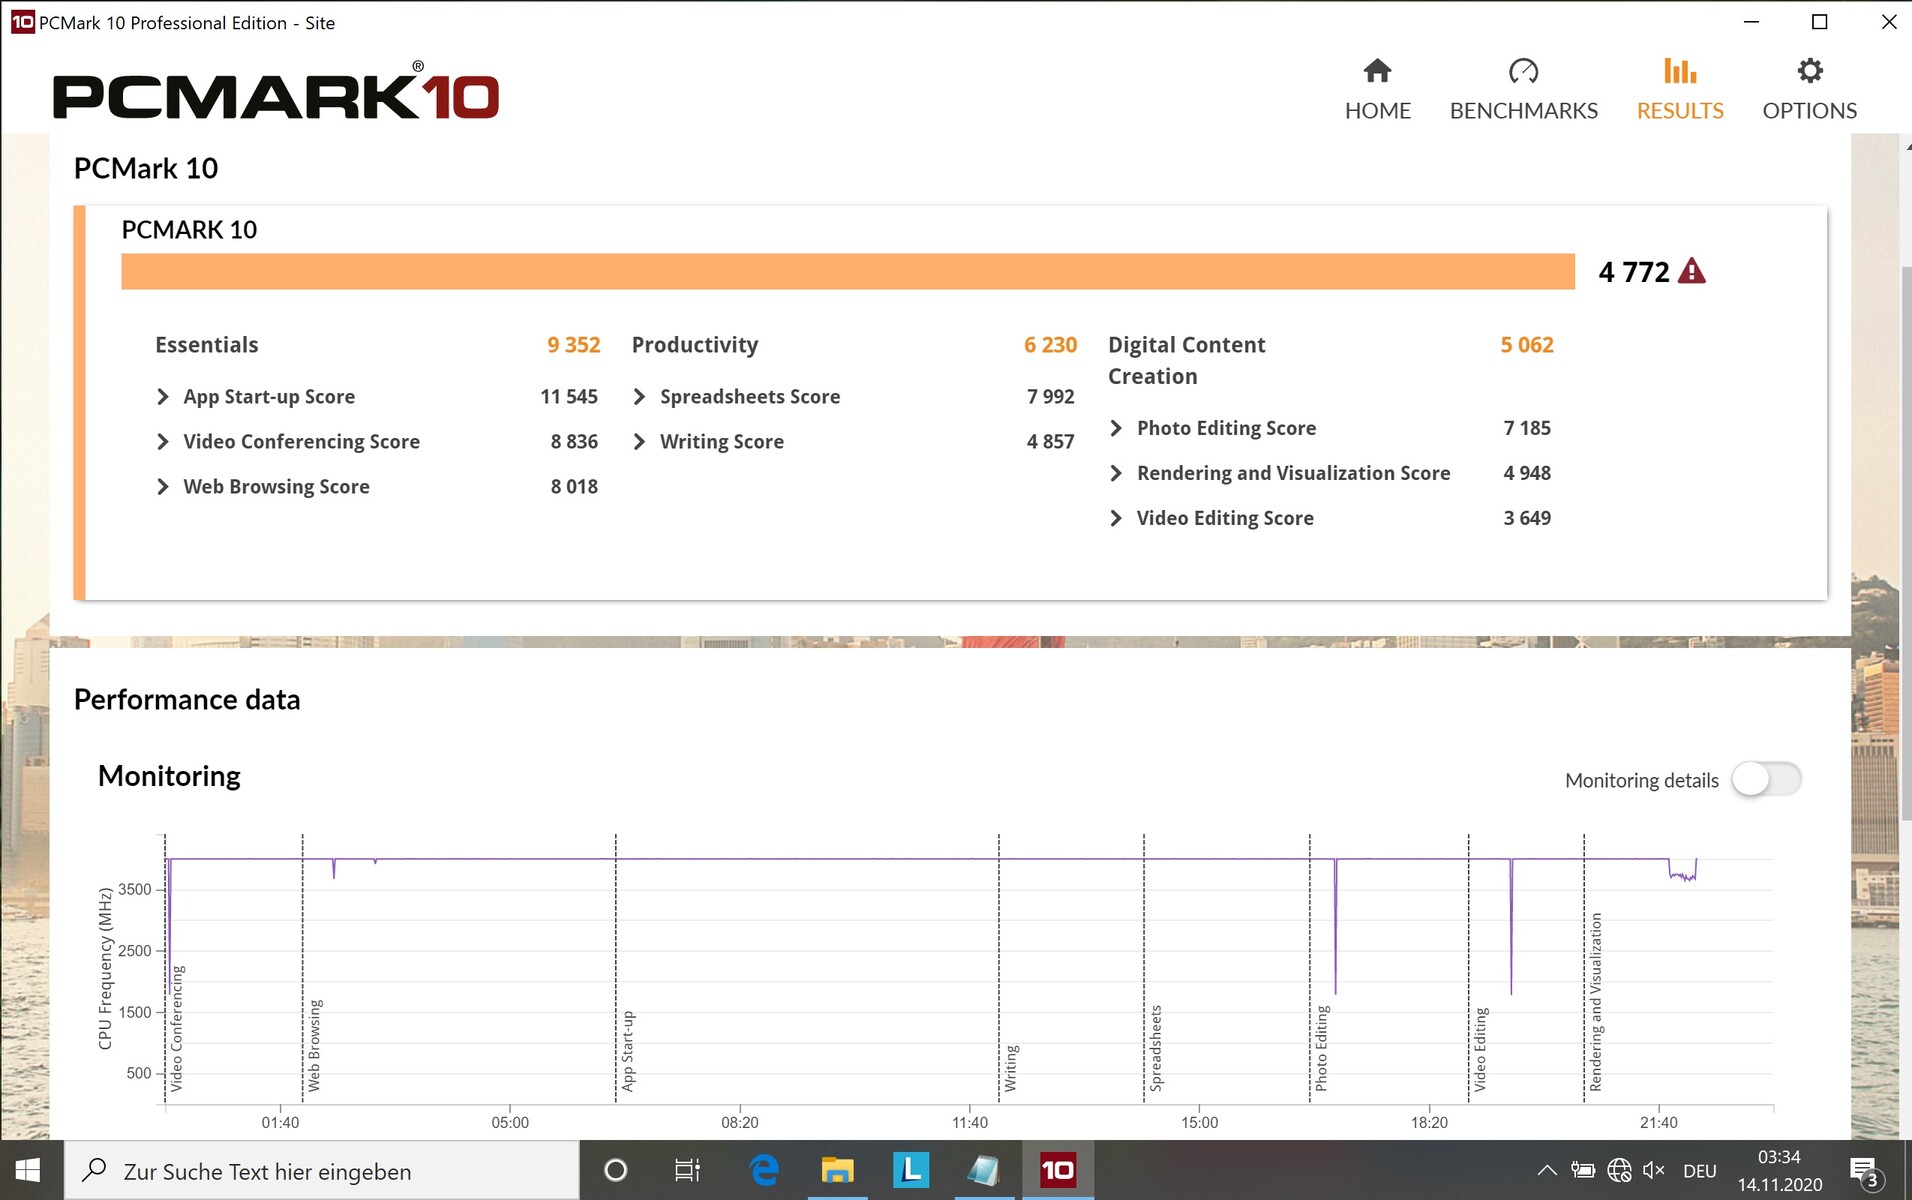
The system performance is very good in our synthetic benchmarks and higher than most of our comparison devices. Using the device was also very smooth during our testing period.
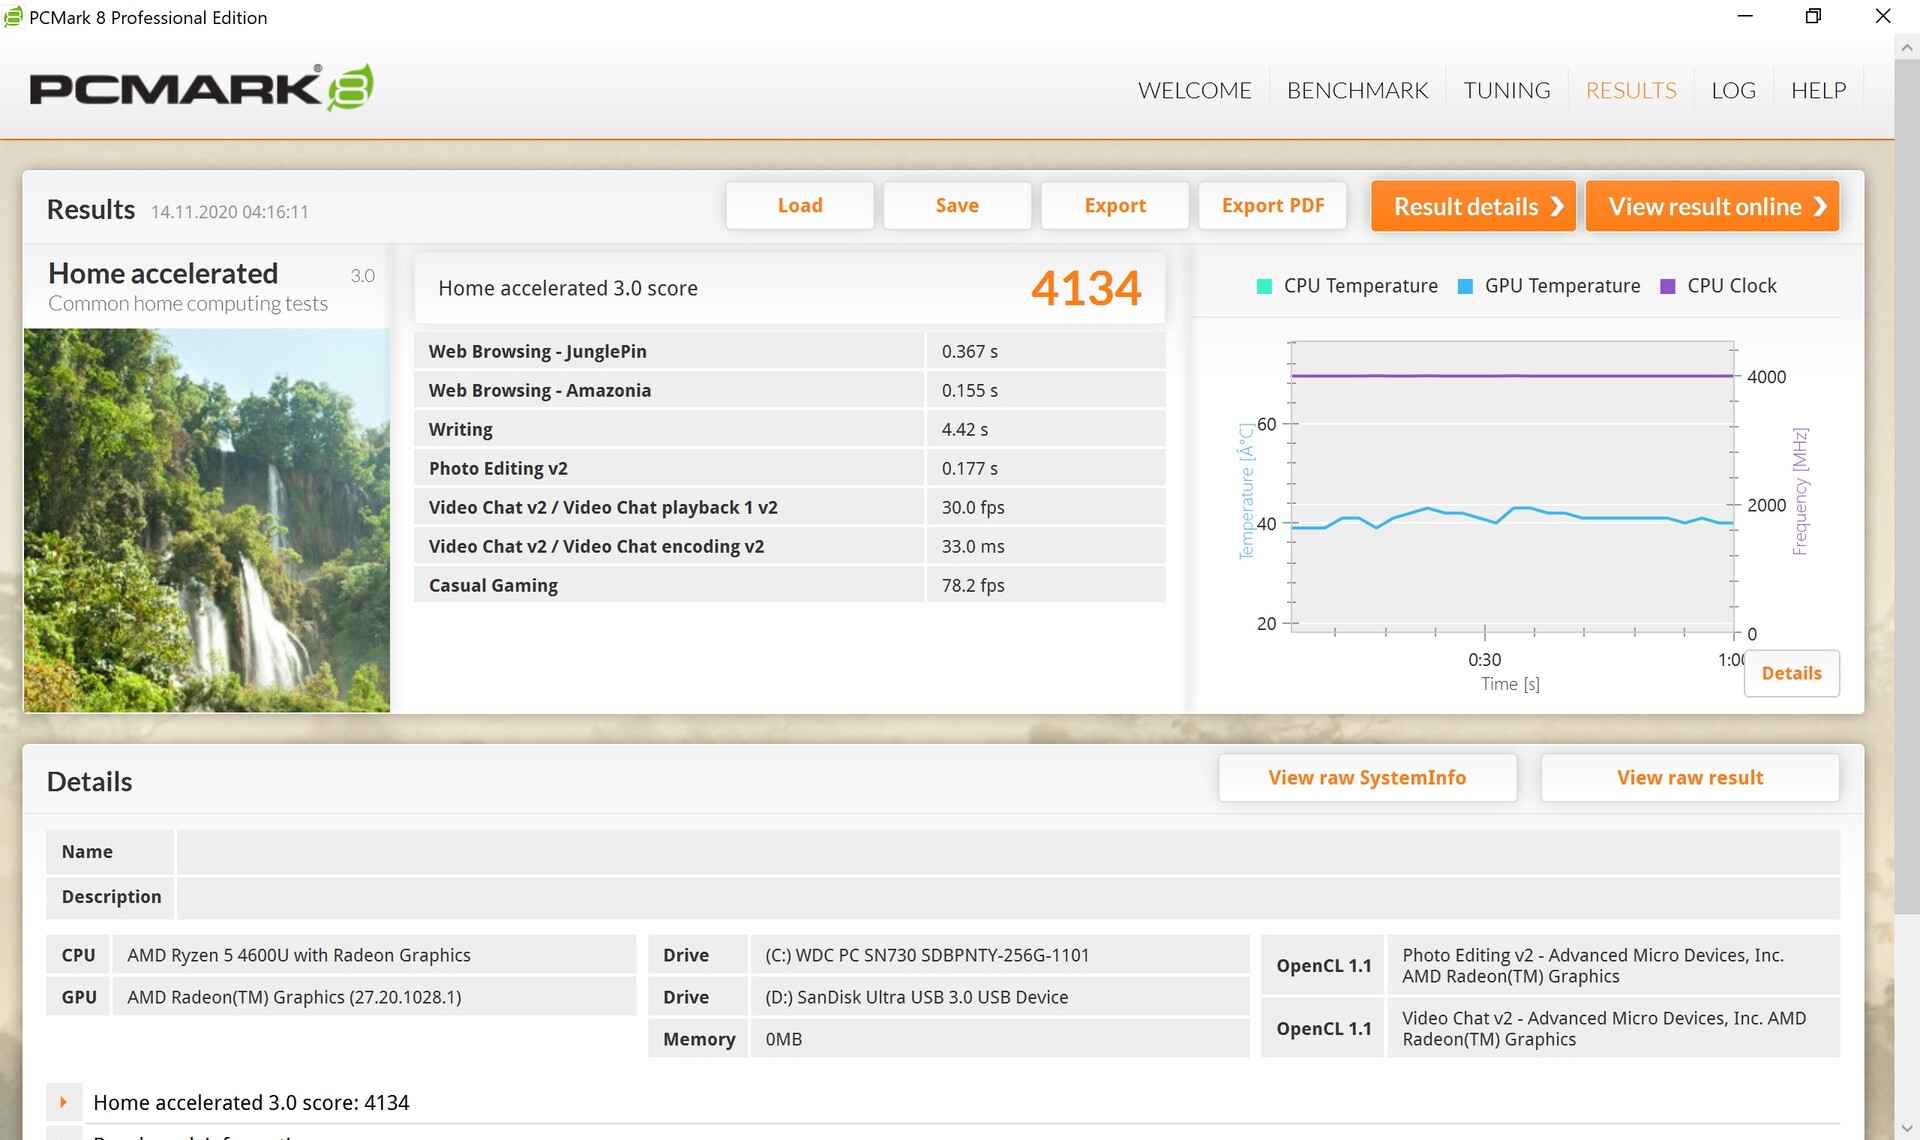
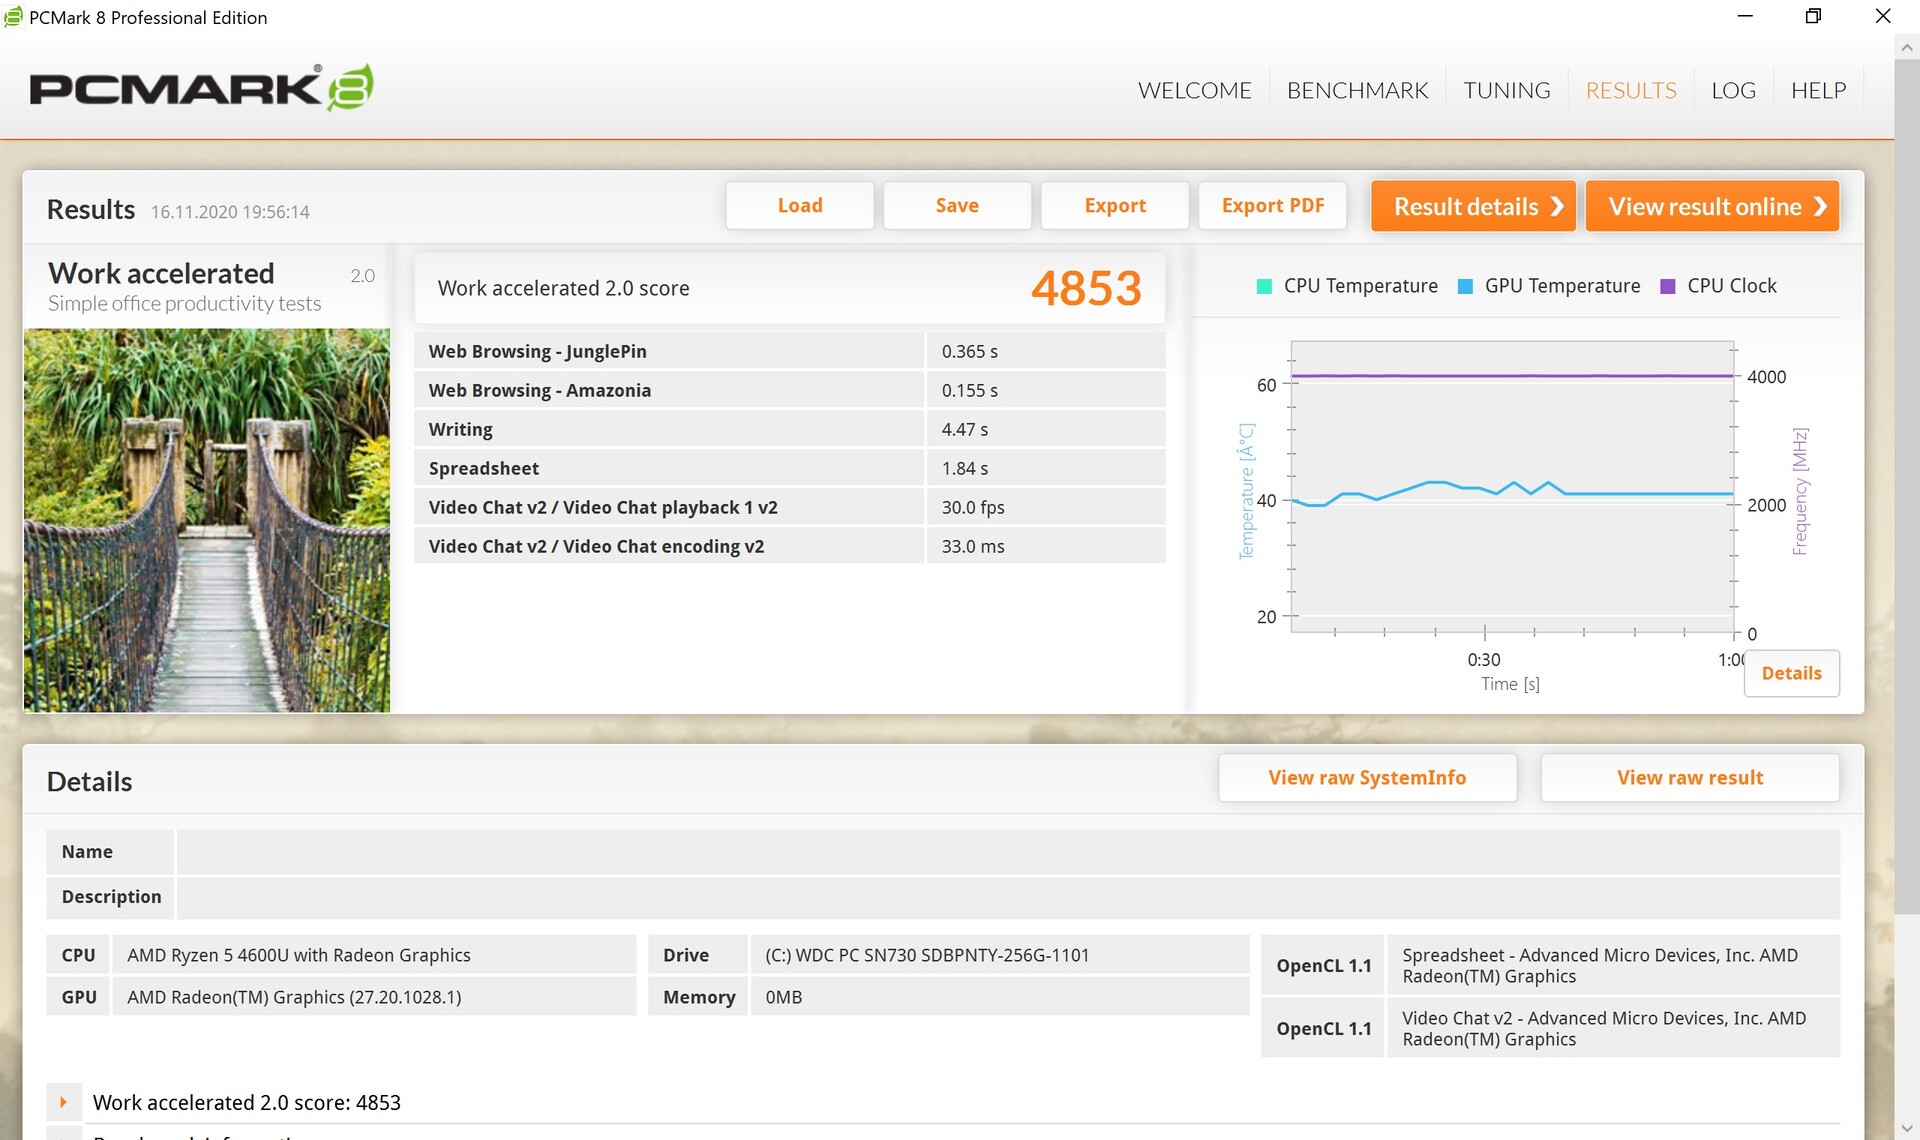
| PCMark 8 Home Score Accelerated v2 | 4134 points | |
| PCMark 8 Work Score Accelerated v2 | 4853 points | |
| PCMark 10 Score | 4772 points | |
Help | ||
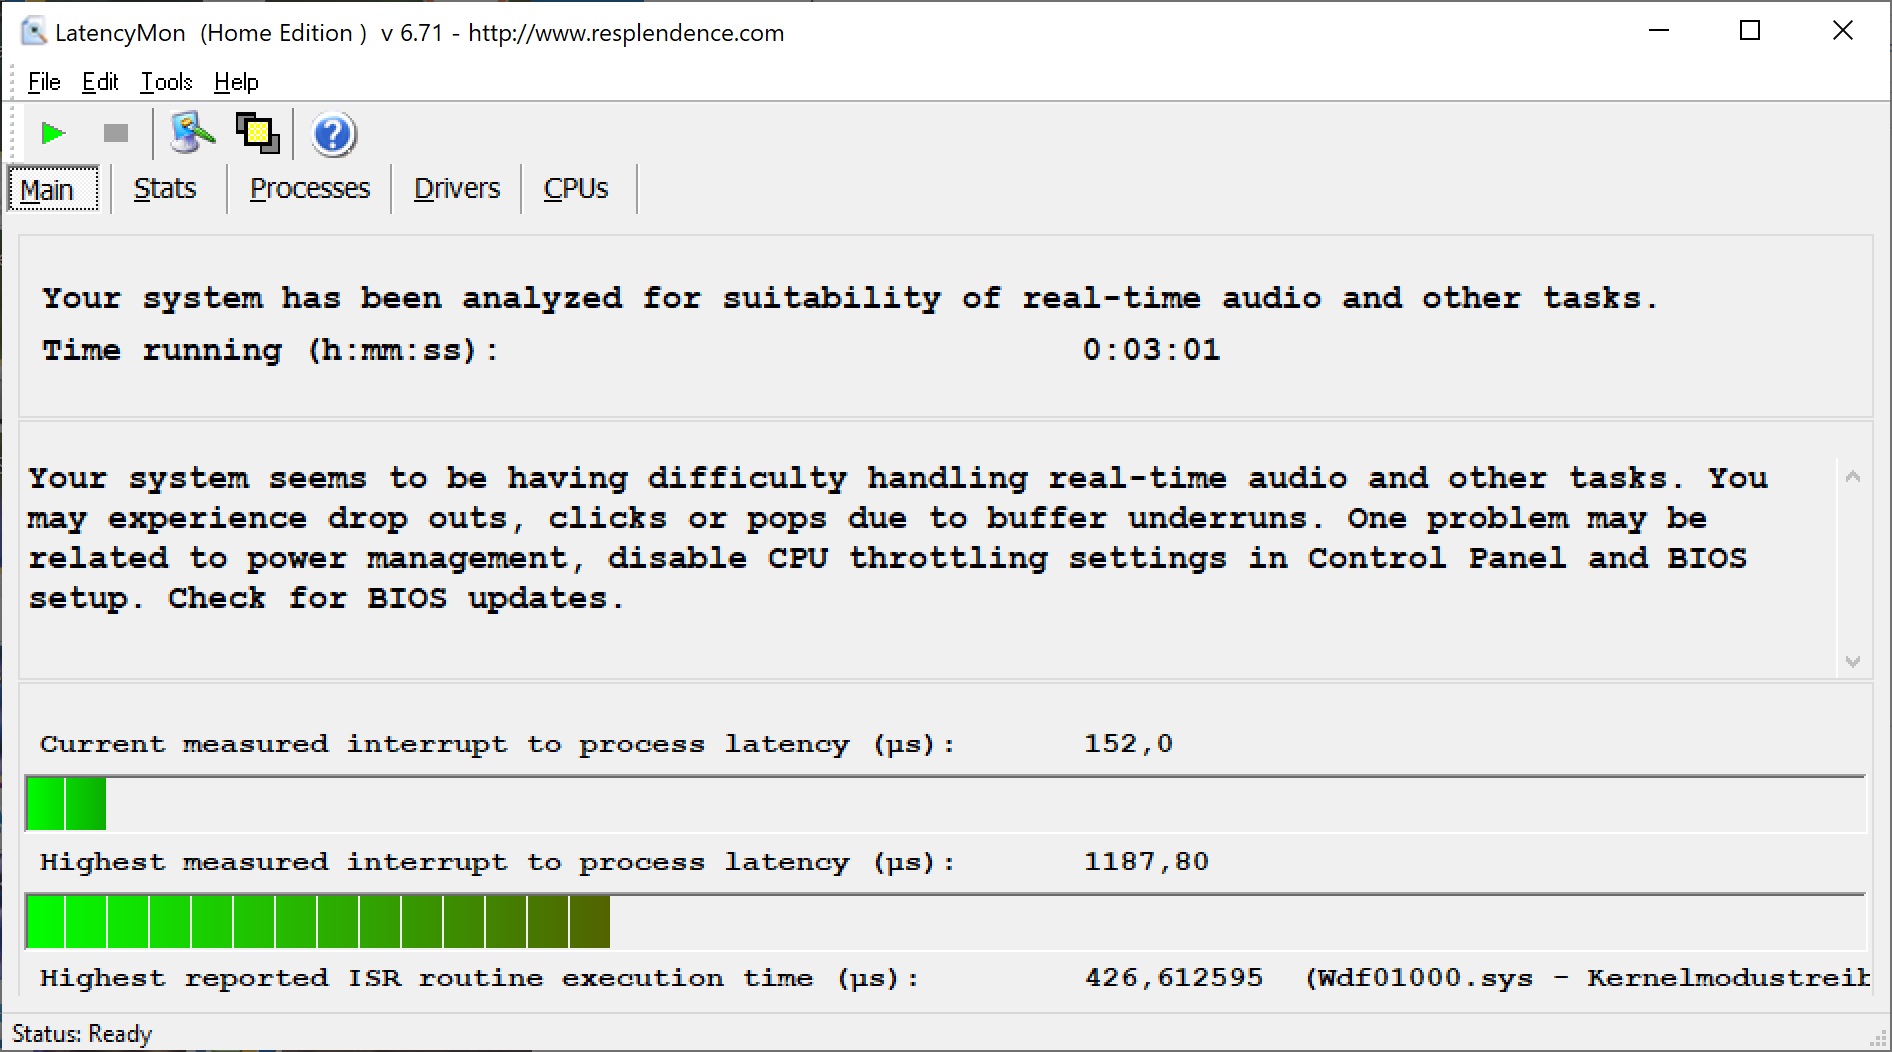
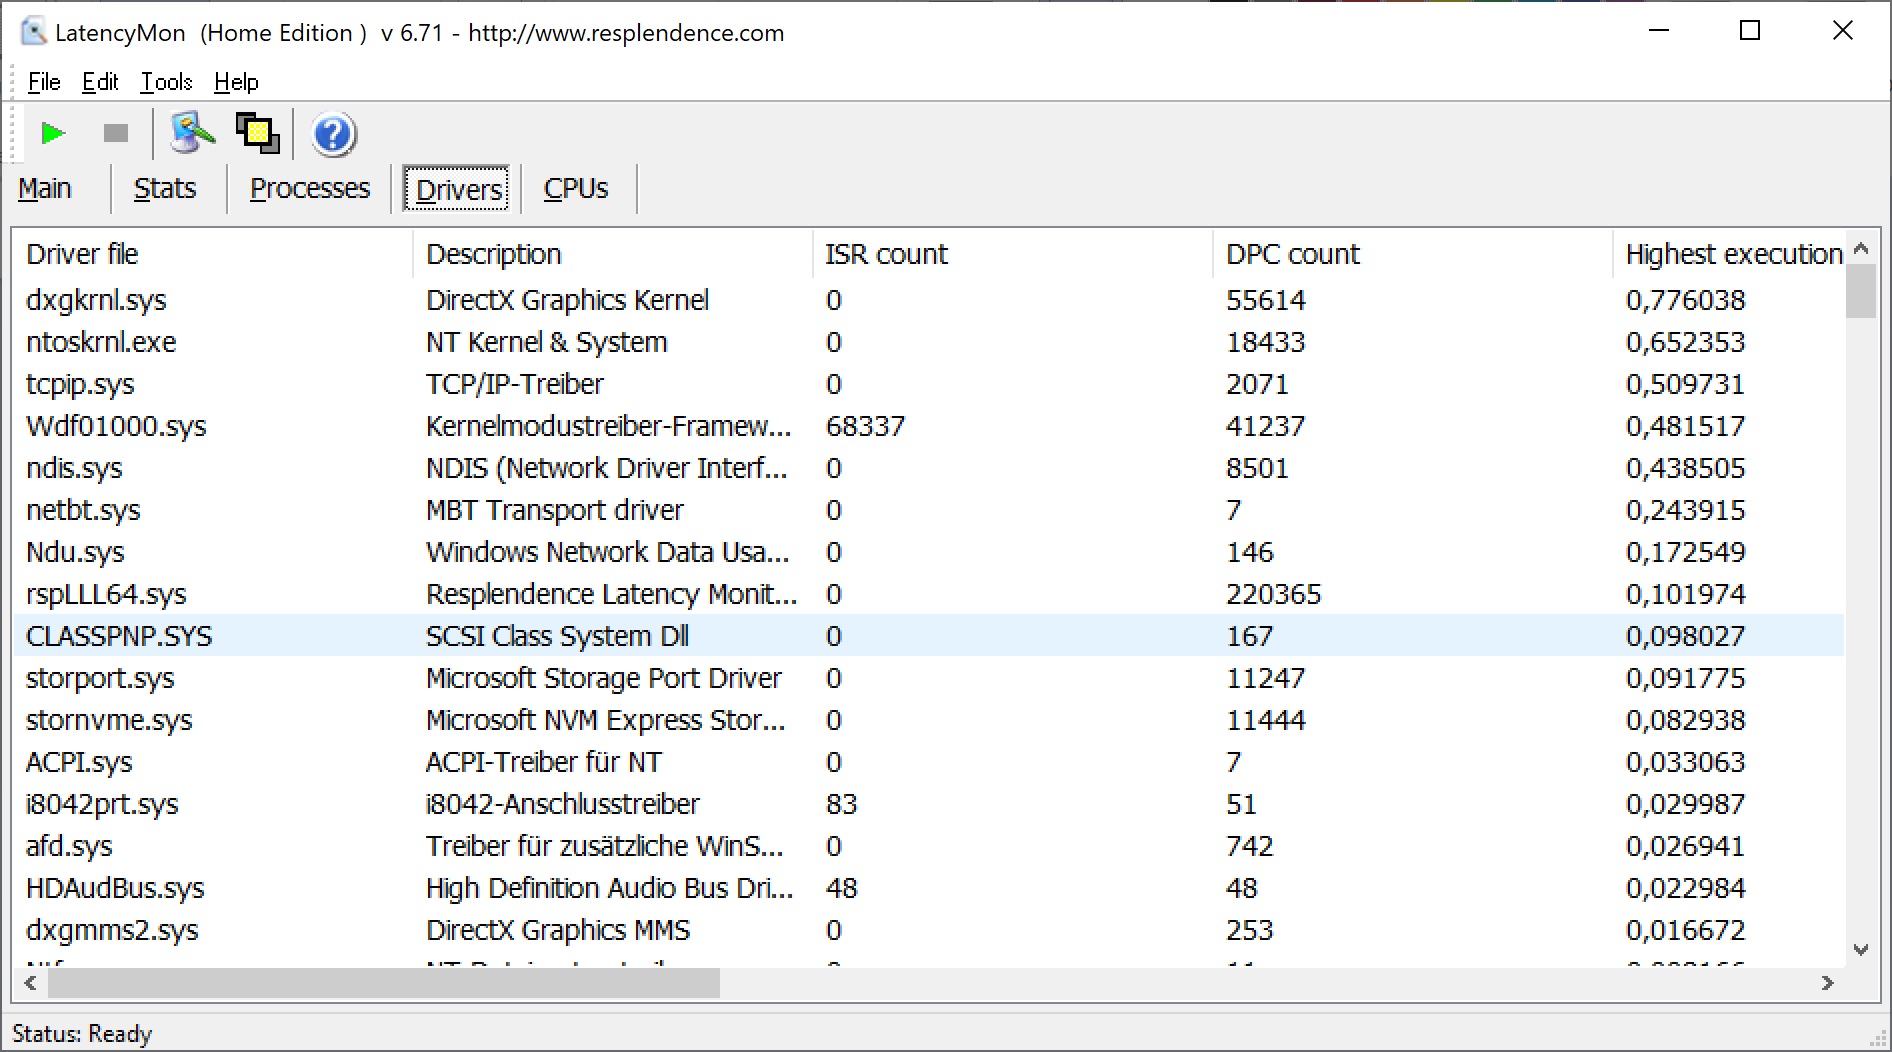
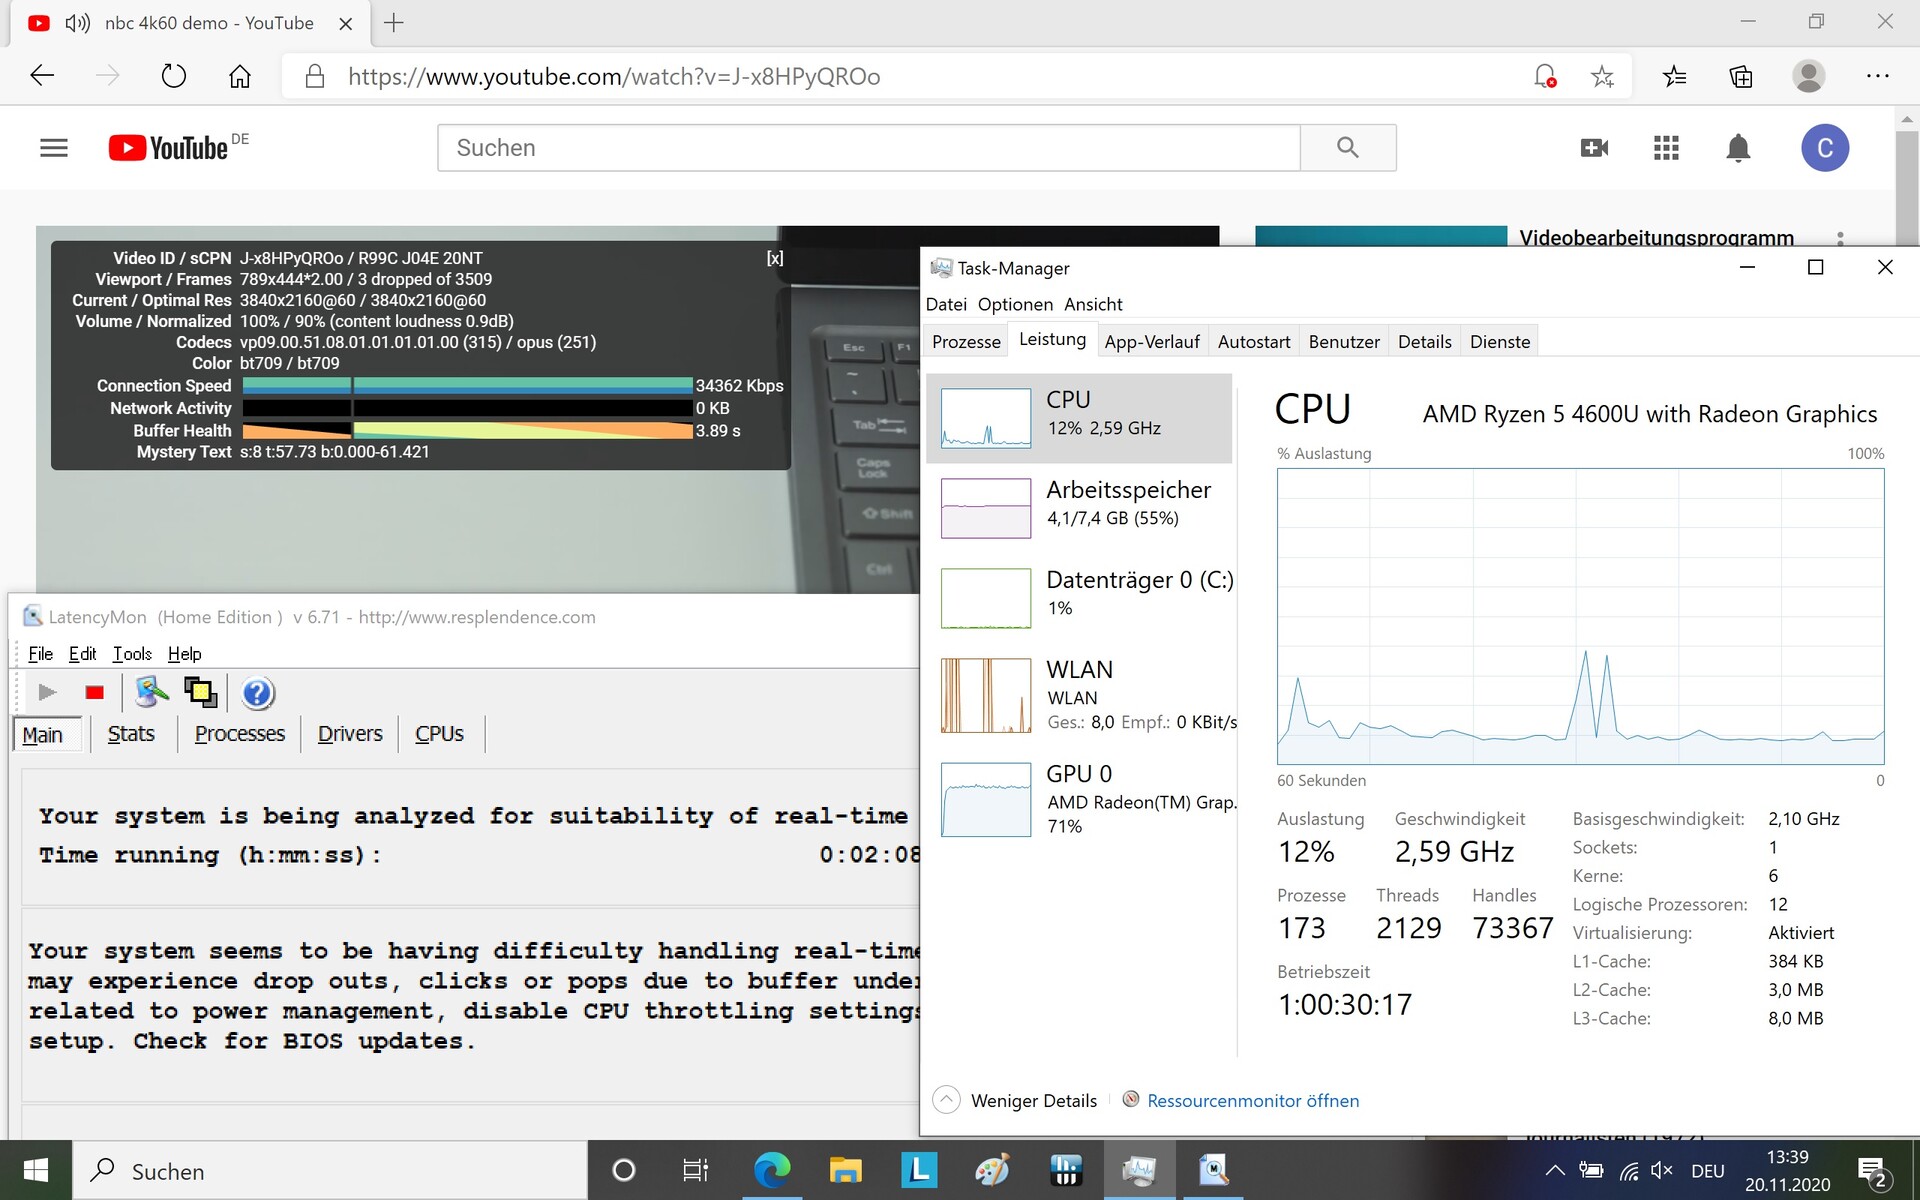
DPC Latencies
There weren't any problems when opening several browser tabs, but we did notice some issues when playing our 4K 60 Hz YouTube video. These come from a set of drivers including the kernel, network and DirectX drivers. We measured 3 dropped frames in our YouTube test. The competitions has some issues here as well.
| DPC Latencies / LatencyMon - interrupt to process latency (max), Web, Youtube, Prime95 | |
| HP ProBook x360 435 G7, Ryzen 5 4500U | |
| Apple MacBook Air 2020 i5 | |
| Acer Swift 3 SF313-52-52AS | |
| Lenovo IdeaPad S540-13ARE-82DL000YGE | |
* ... smaller is better
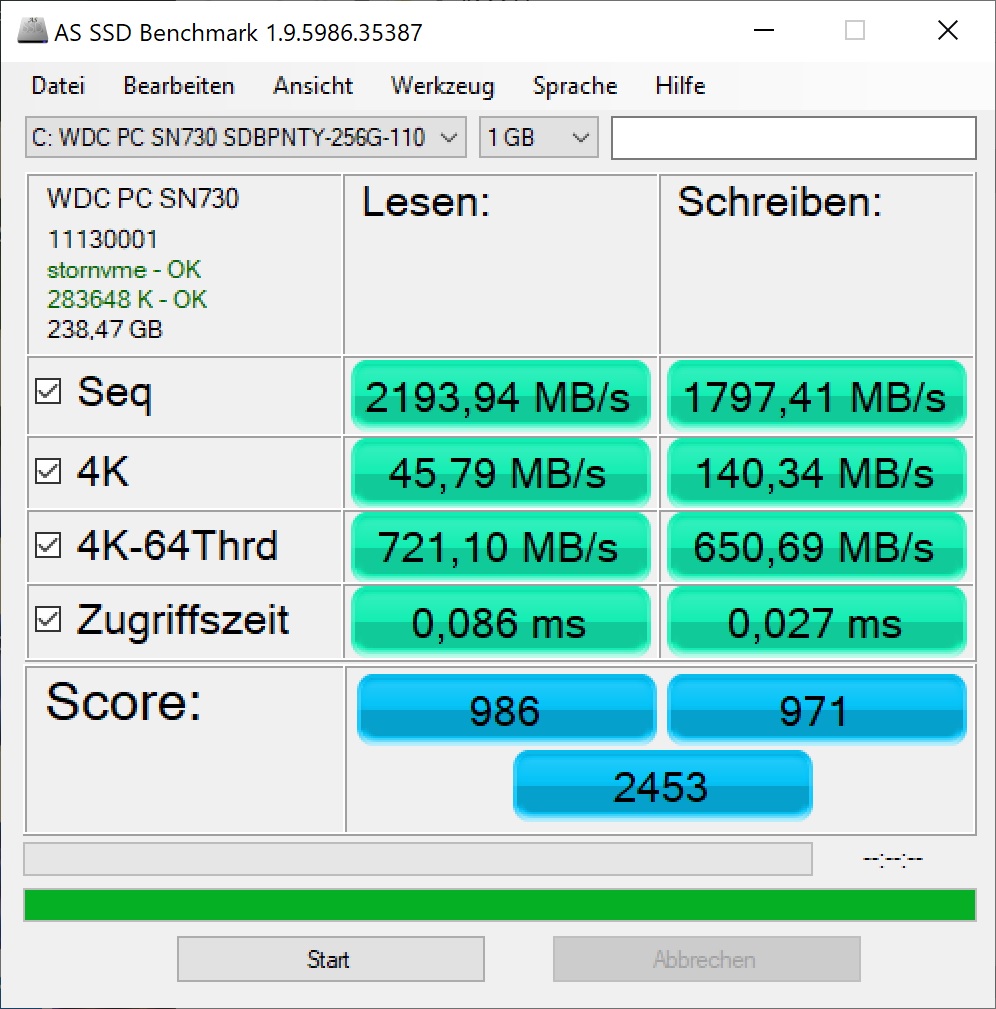
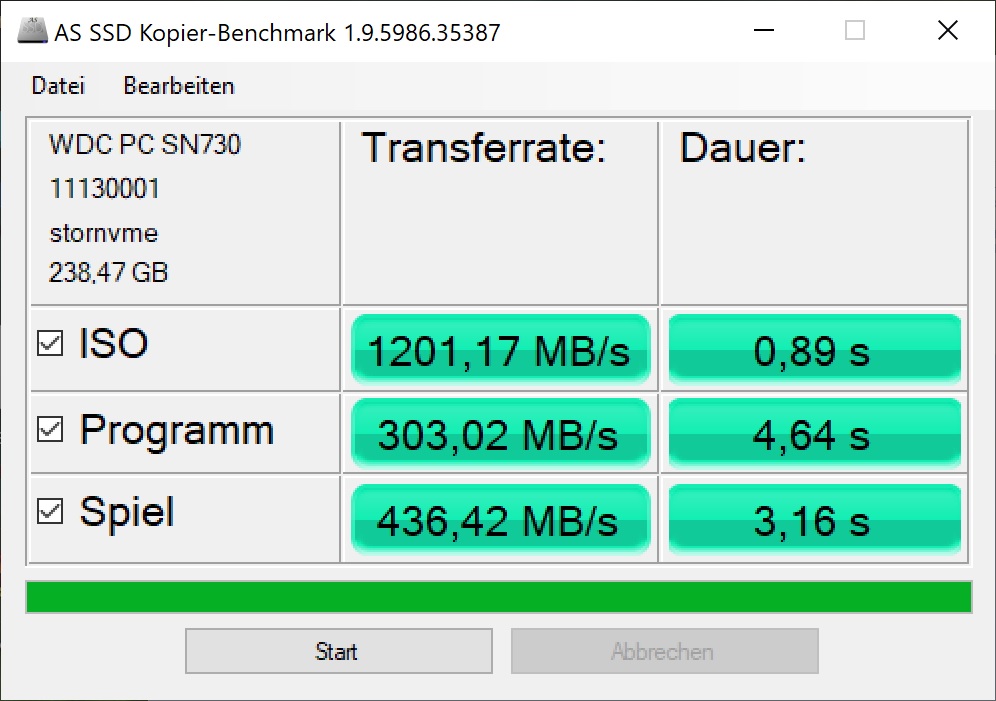
Storage Devices
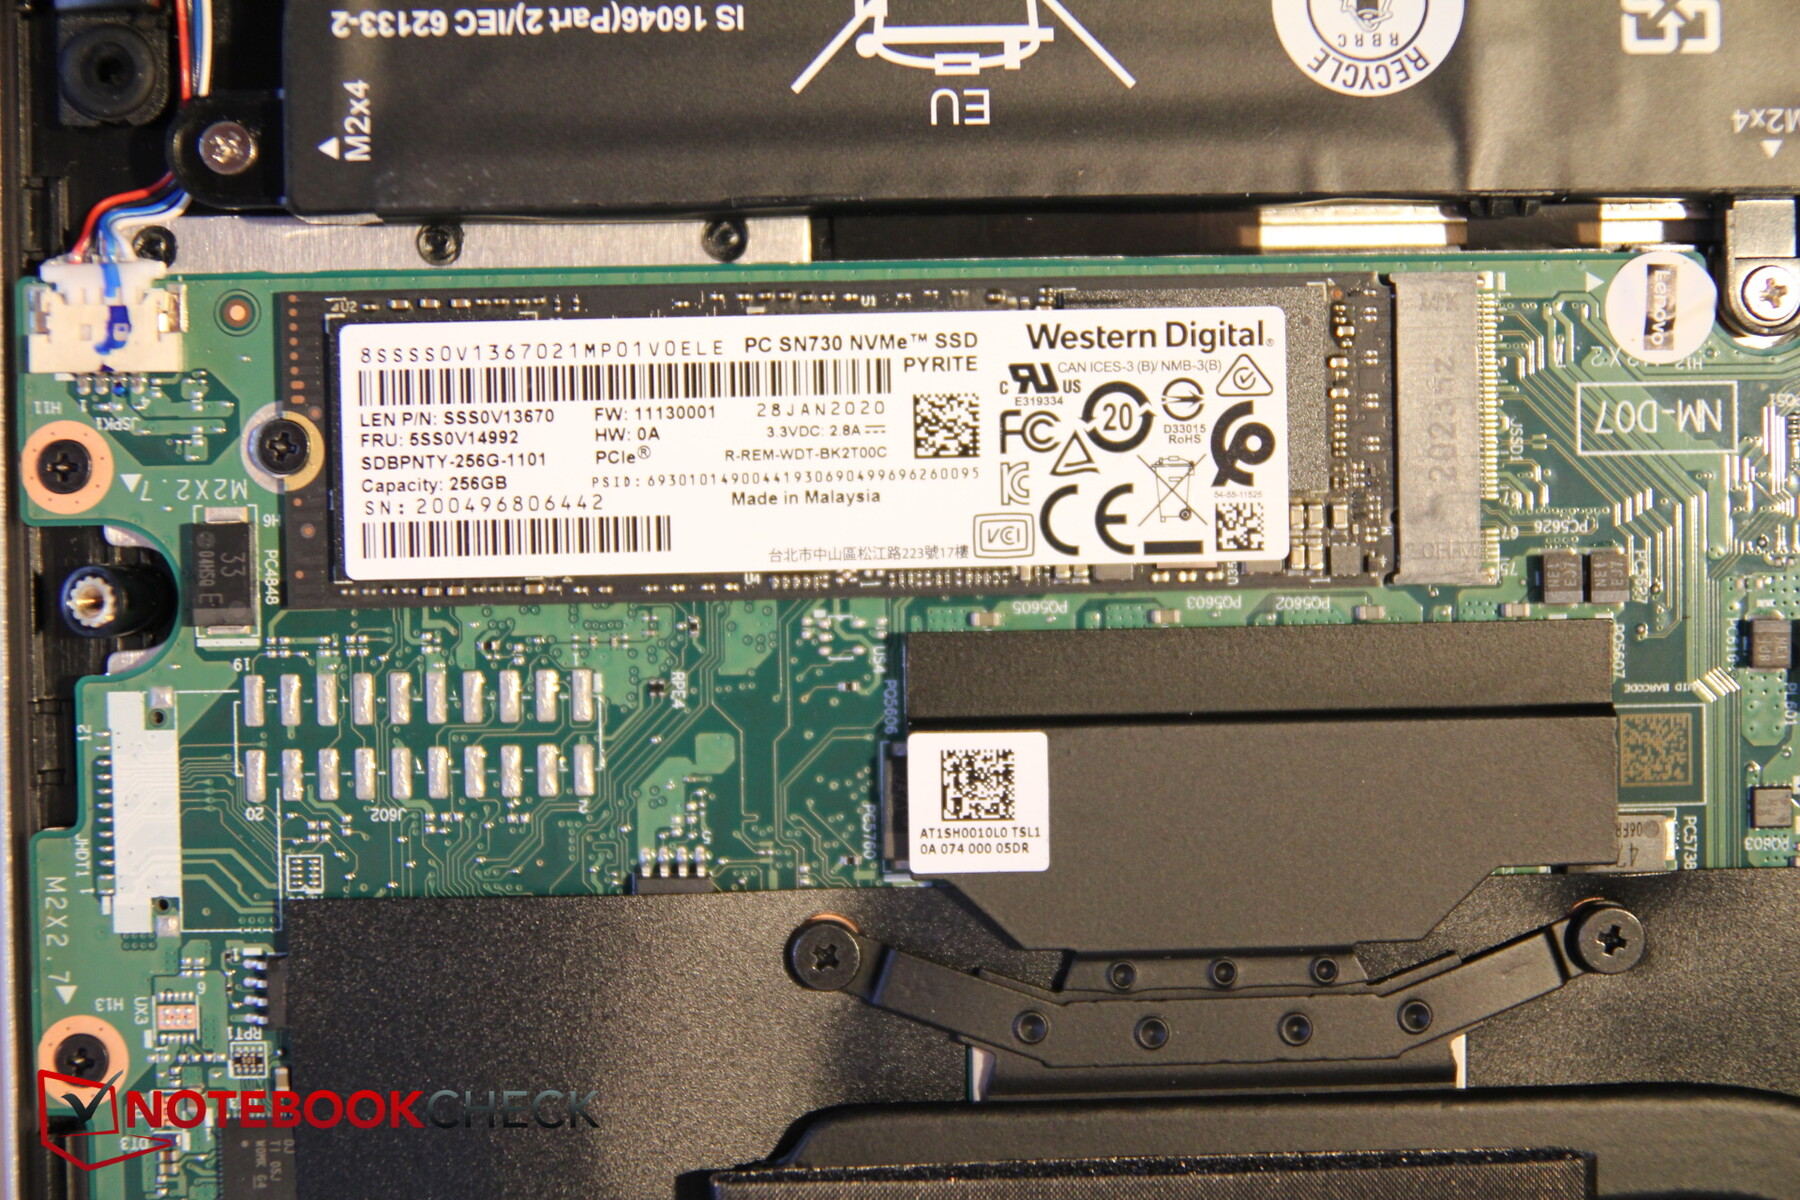
Lenovo has equipped its S540 with an SSD from Western Digital with a capacity of 256 GB. Alternatively, buyers can also choose a 512-GB version. The storage device reaches good transfer rates and beats most competition, although the predecessor was again equipped with a faster Samsung SSD. The 512-GB version is positioned on rank 81 in our HDD/SSD benchmark table.
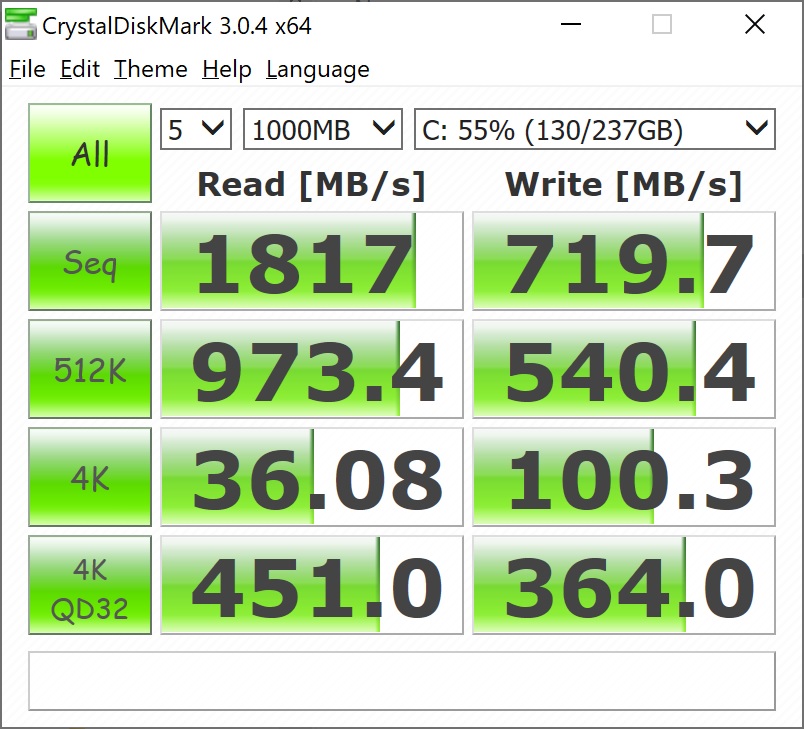
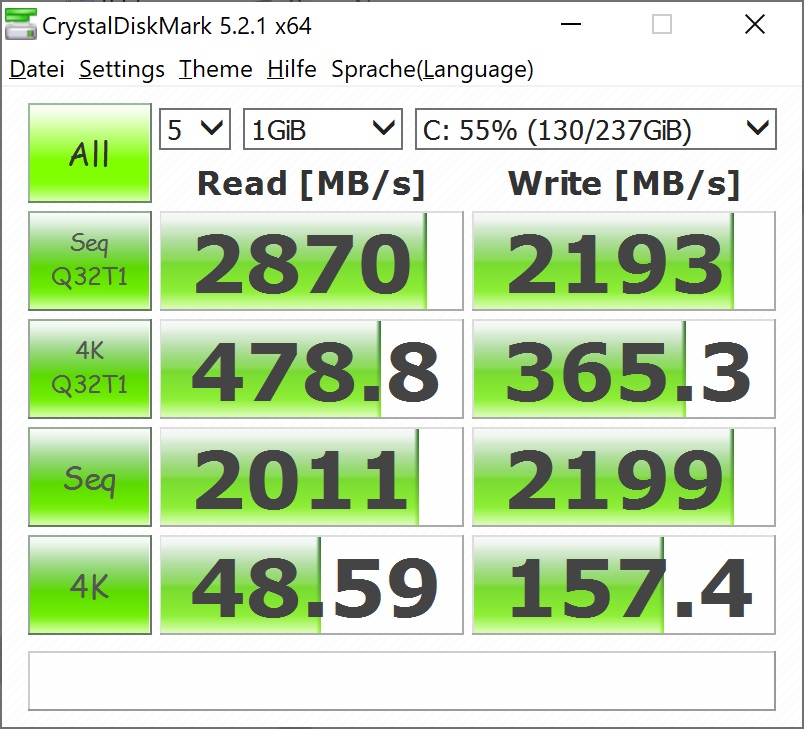
| Lenovo IdeaPad S540-13ARE-82DL000YGE WDC PC SN730 SDBPNTY-256G | Lenovo IdeaPad S540-13API Samsung SSD PM981 MZVLB512HAJQ | HP ProBook x360 435 G7, Ryzen 5 4500U WDC PC SN520 SDAPNUW-512G | Acer Swift 3 SF313-52-52AS SK Hynix BC501 HFM512GDJTNG | Microsoft Surface Laptop 3 13 Core i5-1035G7 SK hynix BC501 HFM256GDGTNG | Apple MacBook Air 2020 i5 Apple SSD AP0512 | Average WDC PC SN730 SDBPNTY-256G | |
|---|---|---|---|---|---|---|---|
| CrystalDiskMark 5.2 / 6 | 6% | -22% | -23% | -31% | -1% | ||
| Write 4K (MB/s) | 157.4 | 133.9 -15% | 94.1 -40% | 120.6 -23% | 112.3 -29% | 138.6 ? -12% | |
| Read 4K (MB/s) | 48.59 | 44.98 -7% | 41.01 -16% | 46.88 -4% | 42.13 -13% | 43.6 ? -10% | |
| Write Seq (MB/s) | 2199 | 2730 24% | 1465 -33% | 1044 -53% | 630 -71% | 1977 ? -10% | |
| Read Seq (MB/s) | 2011 | 2403 19% | 1453 -28% | 1147 -43% | 1023 -49% | 1860 ? -8% | |
| Write 4K Q32T1 (MB/s) | 265.3 | 252.2 -5% | 322.6 22% | 332.4 25% | 336.6 27% | 364 ? 37% | |
| Read 4K Q32T1 (MB/s) | 478.8 | 335.6 -30% | 421.8 -12% | 443.3 -7% | 399.6 -17% | 435 ? -9% | |
| Write Seq Q32T1 (MB/s) | 2193 | 2983 36% | 1463 -33% | 1052 -52% | 821 -63% | 2189 ? 0% | |
| Read Seq Q32T1 (MB/s) | 2870 | 3535 23% | 1751 -39% | 2171 -24% | 2030 -29% | 2994 ? 4% | |
| AS SSD | 35% | 5% | -11% | -43% | -77% | 14% | |
| Seq Read (MB/s) | 2193 | 2792 27% | 1491 -32% | 1370 -38% | 1387 -37% | 1153 -47% | 2290 ? 4% |
| Seq Write (MB/s) | 1797 | 2564 43% | 1306 -27% | 1019 -43% | 504 -72% | 1367 -24% | 1899 ? 6% |
| 4K Read (MB/s) | 45.79 | 47.14 3% | 41.2 -10% | 50.8 11% | 42.35 -8% | 12.95 -72% | 43.5 ? -5% |
| 4K Write (MB/s) | 140.3 | 89.5 -36% | 118.1 -16% | 111.2 -21% | 120 -14% | 24.52 -83% | 155 ? 10% |
| 4K-64 Read (MB/s) | 721 | 1159 61% | 1033 43% | 770 7% | 497.4 -31% | 665 -8% | 701 ? -3% |
| 4K-64 Write (MB/s) | 651 | 1468 125% | 1007 55% | 713 10% | 354.9 -45% | 159.5 -75% | 611 ? -6% |
| Access Time Read * (ms) | 0.086 | 0.069 20% | 0.103 -20% | 0.055 36% | 0.295 -243% | 0.0685 ? 20% | |
| Access Time Write * (ms) | 0.027 | 0.043 -59% | 0.031 -15% | 0.034 -26% | 0.093 -244% | 0.163 -504% | 0.026 ? 4% |
| Score Read (Points) | 986 | 1486 51% | 1223 24% | 958 -3% | 678 -31% | 793 -20% | 974 ? -1% |
| Score Write (Points) | 971 | 1814 87% | 1256 29% | 926 -5% | 525 -46% | 321 -67% | 956 ? -2% |
| Score Total (Points) | 2453 | 4054 65% | 3102 26% | 2370 -3% | 1520 -38% | 1528 -38% | 2419 ? -1% |
| Copy ISO MB/s (MB/s) | 1201 | 764 -36% | 1433 19% | 1528 ? 27% | |||
| Copy Program MB/s (MB/s) | 303 | 256.1 -15% | 363 20% | 434 ? 43% | |||
| Copy Game MB/s (MB/s) | 436.4 | 368.4 -16% | 725 66% | 898 ? 106% | |||
| Total Average (Program / Settings) | 21% /
23% | -9% /
-6% | -17% /
-16% | -37% /
-38% | -77% /
-77% | 7% /
9% |
* ... smaller is better

Disk Throttling: DiskSpd Read Loop, Queue Depth 8
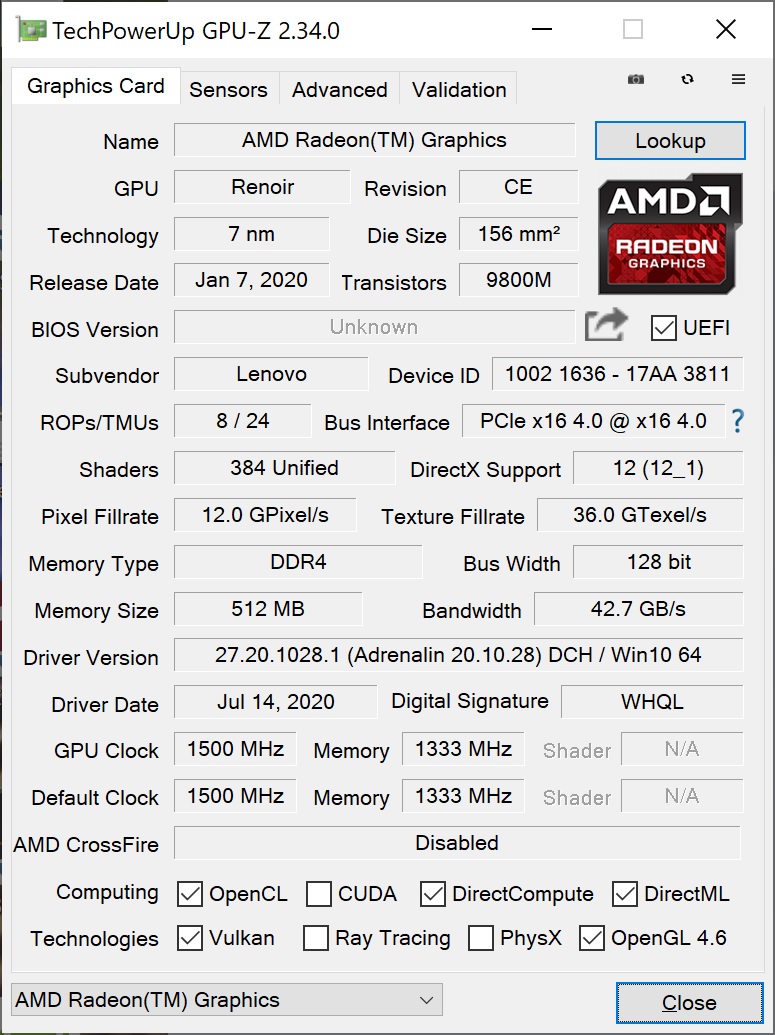
Graphics
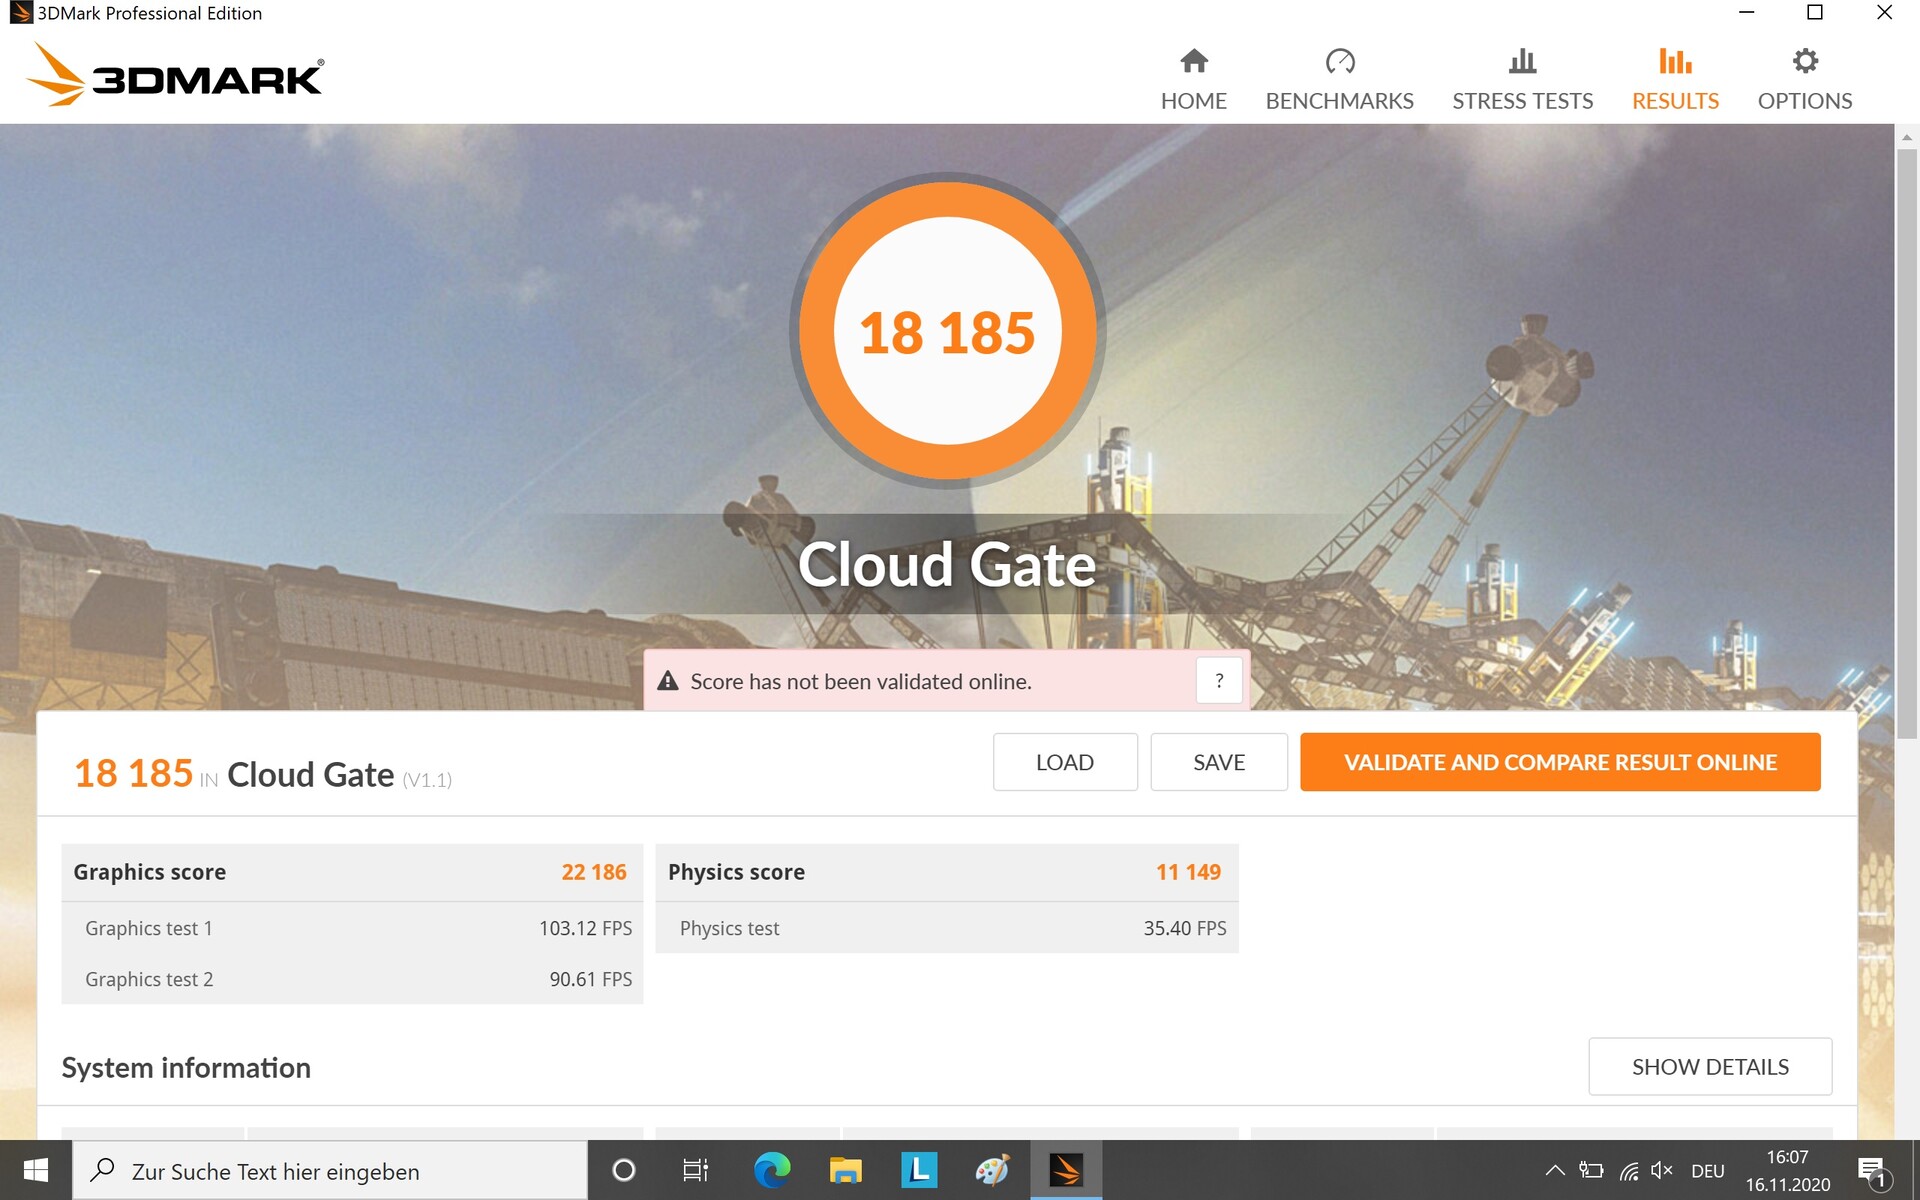
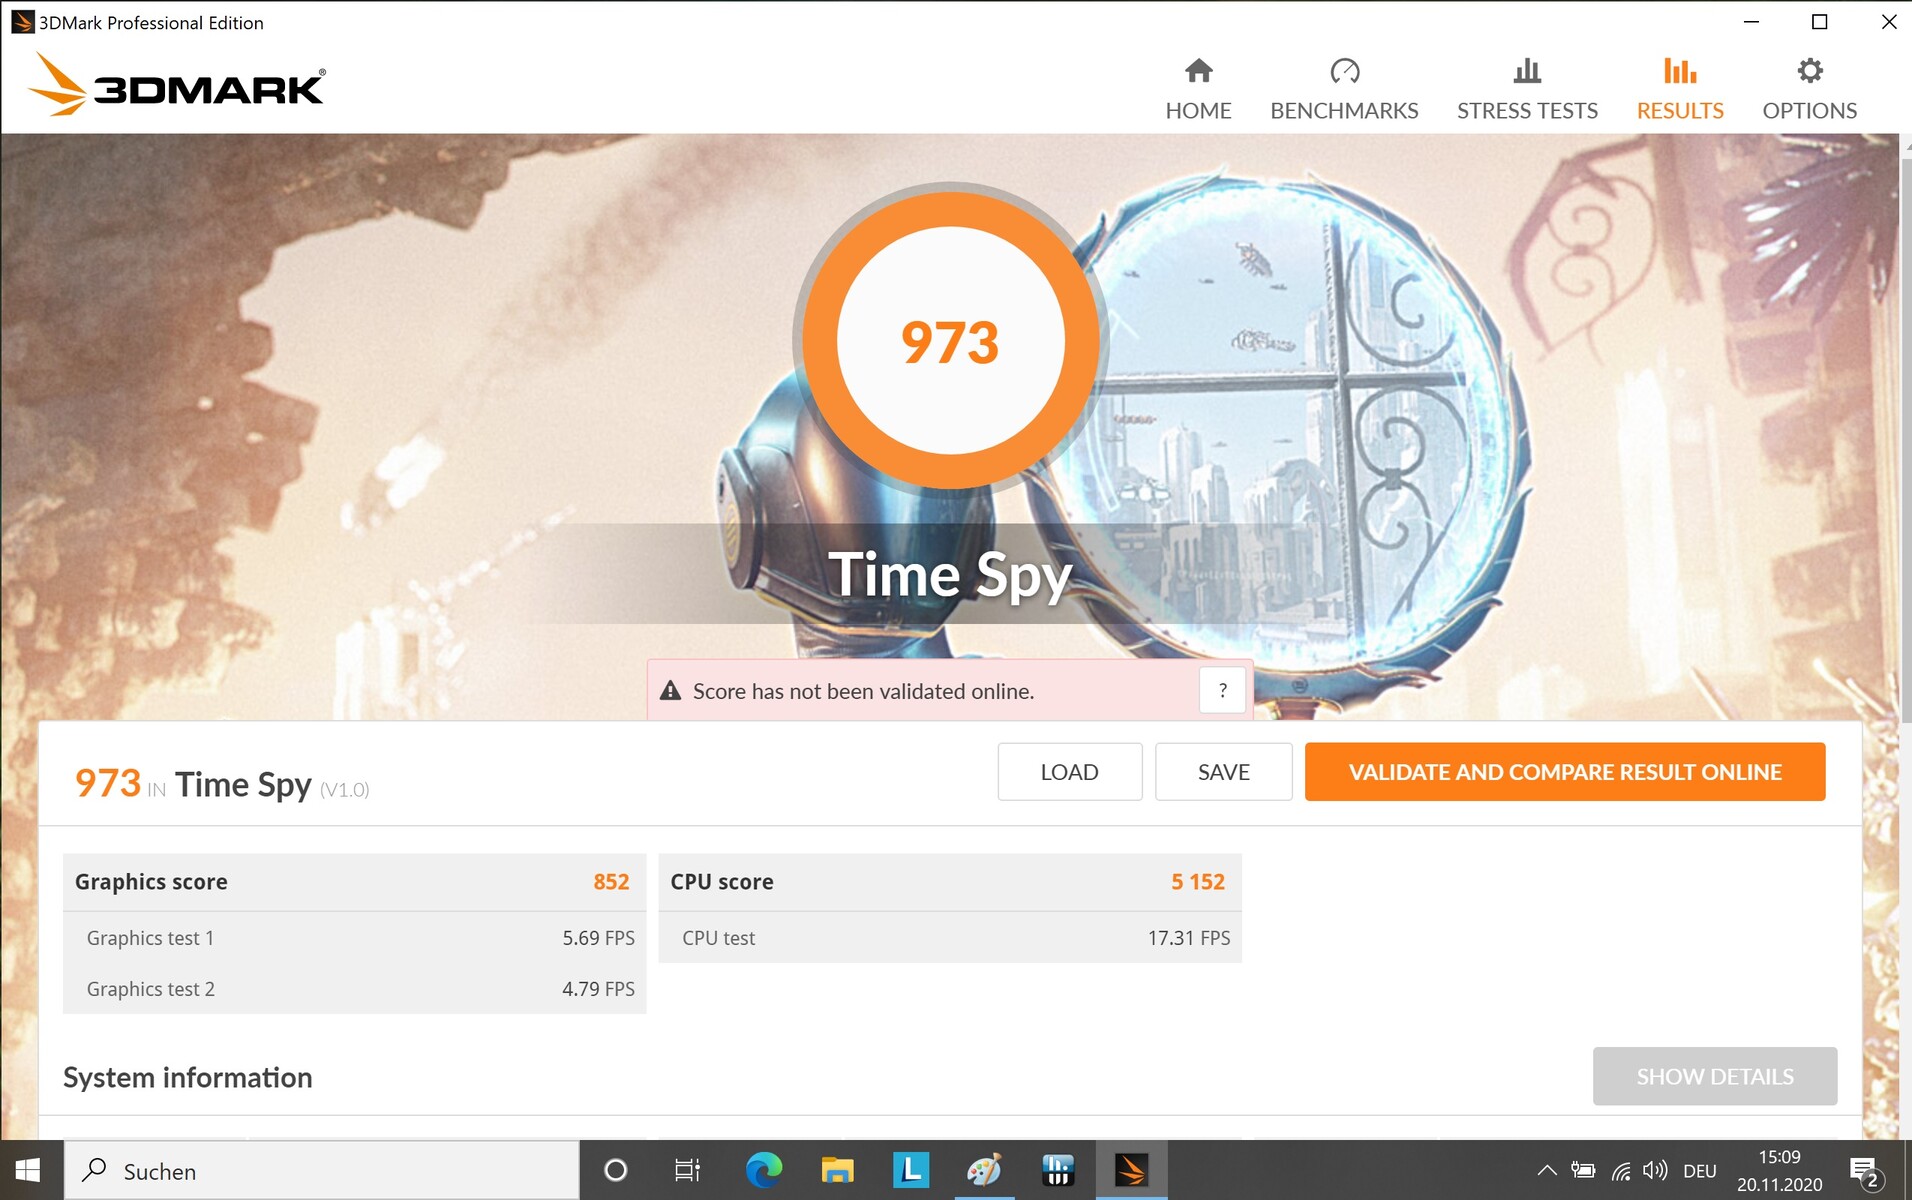
The AMD Radeon RX Vega 6 that is integrated into the processor can clock up to 400 MHz higher than the Vega 6 in the Ryzen 3000 series. It should manage to join the ranks of the dedicated Geforce MX150 in synthetic benchmarks. However, games still aren't really this device's forte and users had better limit themselves to less demanding titles.
The S540 manages to place itself at the top in the 3DMarks and offers around 5 to 8 percent more than the average Vega 6 in our database. The Intel Iris Graphics G7 in the Surface 3 can't keep up either, although the differences are very small.
The performance difference on battery is not significant at -4 percent.


| 3DMark 11 Performance | 4695 points | |
| 3DMark Cloud Gate Standard Score | 18185 points | |
| 3DMark Fire Strike Score | 2560 points | |
| 3DMark Time Spy Score | 973 points | |
Help | ||
Gaming Performance
The graphics performance is only enough for fairly recent games (Witcher 3, Shadow of the Tomb Raider) to be played at very low resolutions and settings. Even at average resolution and details, the RX Vega 6 (Ryzen 4000) usually is overtaxed - at least when it comes to demanding games. Older or less demanding titles (DOTA 2 Reborn) can be played in FullHD.
The Vega 6 seems to perform a little better than the Intel Iris Plus Graphics G7 at low resolution and details, but this turns around in FullHD, at least when playing Witcher 3. The performance of the Vega 6 of the 4000 series is around 20 percent higher than that of the Vega 8 of the 3000 series.
| low | med. | high | ultra | |
|---|---|---|---|---|
| The Witcher 3 (2015) | 49.3 | 34.6 | 15.3 | |
| Dota 2 Reborn (2015) | 100 | 76.9 | 45.4 | 42.3 |
| Rise of the Tomb Raider (2016) | 56 | 38.1 | 17.4 | |
| Final Fantasy XV Benchmark (2018) | 29.4 | 15.1 | 8.65 | |
| X-Plane 11.11 (2018) | 40.4 | 30.5 | 27.5 | |
| Shadow of the Tomb Raider (2018) | 42 | 15 |
Emissions - Cool business Lenovo
System Noise
The Lenovo S540 is surprisingly silent most of the time with the cooling fans often being turned off completely.
They turn up under real load with system noise being average under average load. Under full load, the S540 turns out to be even louder than its competition. The predecessor remained calmer under maximum load.
Noise level
| Idle |
| 25 / 25 / 25 dB(A) |
| Load |
| 32.8 / 44.5 dB(A) |
 | ||
30 dB silent 40 dB(A) audible 50 dB(A) loud |
||
min: | ||
| Lenovo IdeaPad S540-13ARE-82DL000YGE Vega 6, R5 4600U, WDC PC SN730 SDBPNTY-256G | Lenovo IdeaPad S540-13API Vega 8, R5 3550H, Samsung SSD PM981 MZVLB512HAJQ | HP ProBook x360 435 G7, Ryzen 5 4500U Vega 6, R5 4500U, WDC PC SN520 SDAPNUW-512G | Acer Swift 3 SF313-52-52AS Iris Plus Graphics G4 (Ice Lake 48 EU), i5-1035G4, SK Hynix BC501 HFM512GDJTNG | Microsoft Surface Laptop 3 13 Core i5-1035G7 Iris Plus Graphics G7 (Ice Lake 64 EU), i5-1035G7, SK hynix BC501 HFM256GDGTNG | Apple MacBook Air 2020 i5 Iris Plus Graphics G7 (Ice Lake 64 EU), i5-1030NG7, Apple SSD AP0512 | |
|---|---|---|---|---|---|---|
| Noise | -5% | -8% | -13% | -6% | -20% | |
| off / environment * (dB) | 25 | 28.6 -14% | 29.3 -17% | 31.2 -25% | 28.5 -14% | 30 -20% |
| Idle Minimum * (dB) | 25 | 28.6 -14% | 29.3 -17% | 31.2 -25% | 28.5 -14% | 30 -20% |
| Idle Average * (dB) | 25 | 28.6 -14% | 29.3 -17% | 31.2 -25% | 28.5 -14% | 30 -20% |
| Idle Maximum * (dB) | 25 | 29.2 -17% | 30.4 -22% | 31.2 -25% | 28.5 -14% | 30 -20% |
| Load Average * (dB) | 32.8 | 31.4 4% | 31.3 5% | 33.2 -1% | 28.5 13% | 45.5 -39% |
| Load Maximum * (dB) | 44.5 | 34.4 23% | 34.6 22% | 34.9 22% | 40.4 9% | 45.8 -3% |
| Witcher 3 ultra * (dB) | 40.4 |
* ... smaller is better
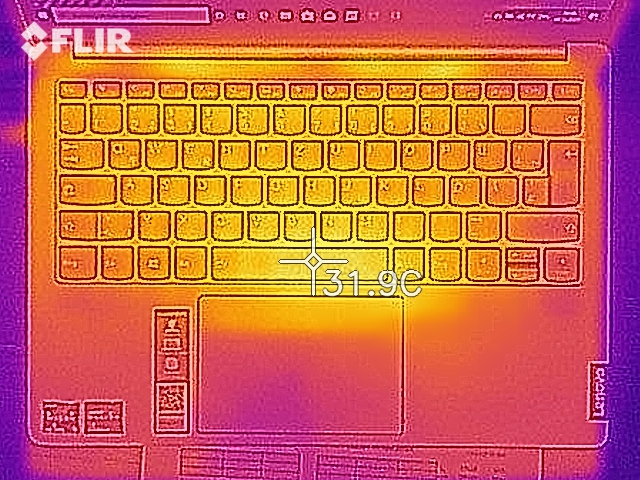
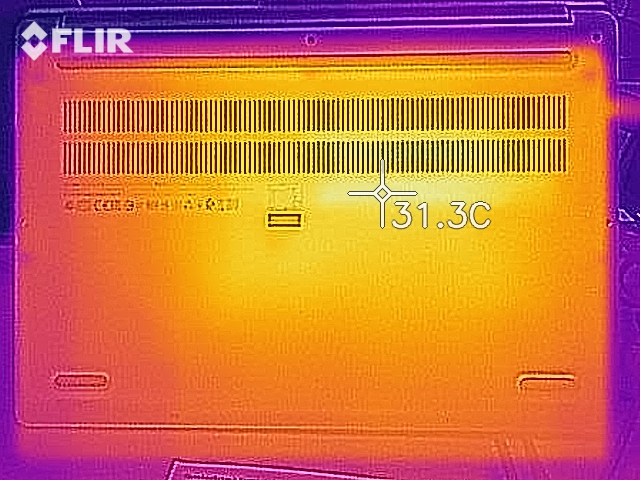
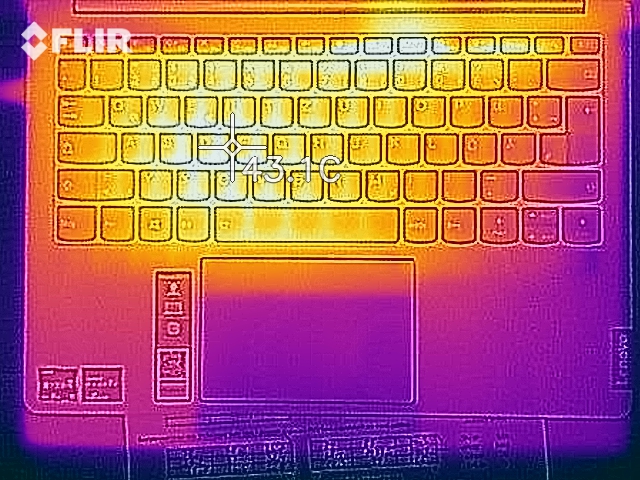
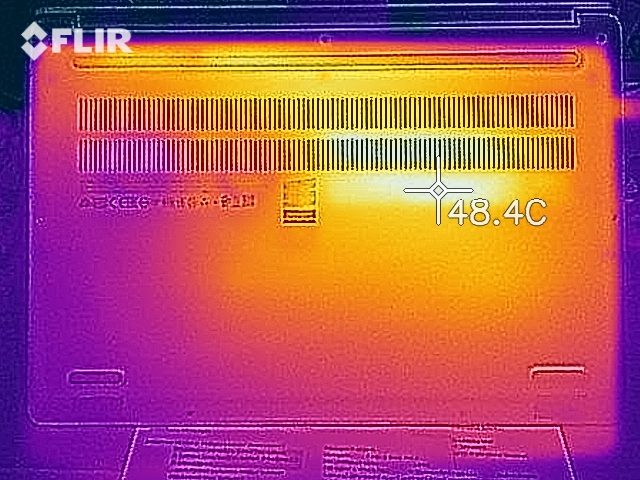
Temperature
We measured a hotspot of around 39 °C under maximum load, which is very good. Only the Acer Swift 3 can keep up with this - all other comparison devices become a lot hotter. The heat develops in the center and on the left side towards the display. The wrist rests remain cool throughout.
(+) The maximum temperature on the upper side is 38.8 °C / 102 F, compared to the average of 35.9 °C / 97 F, ranging from 21.4 to 59 °C for the class Subnotebook.
(+) The bottom heats up to a maximum of 38 °C / 100 F, compared to the average of 39.3 °C / 103 F
(+) In idle usage, the average temperature for the upper side is 25 °C / 77 F, compared to the device average of 30.8 °C / 87 F.
(+) The palmrests and touchpad are cooler than skin temperature with a maximum of 28.8 °C / 83.8 F and are therefore cool to the touch.
(±) The average temperature of the palmrest area of similar devices was 28.2 °C / 82.8 F (-0.6 °C / -1 F).
| Lenovo IdeaPad S540-13ARE-82DL000YGE Vega 6, R5 4600U, WDC PC SN730 SDBPNTY-256G | Lenovo IdeaPad S540-13API Vega 8, R5 3550H, Samsung SSD PM981 MZVLB512HAJQ | HP ProBook x360 435 G7, Ryzen 5 4500U Vega 6, R5 4500U, WDC PC SN520 SDAPNUW-512G | Acer Swift 3 SF313-52-52AS Iris Plus Graphics G4 (Ice Lake 48 EU), i5-1035G4, SK Hynix BC501 HFM512GDJTNG | Microsoft Surface Laptop 3 13 Core i5-1035G7 Iris Plus Graphics G7 (Ice Lake 64 EU), i5-1035G7, SK hynix BC501 HFM256GDGTNG | Apple MacBook Air 2020 i5 Iris Plus Graphics G7 (Ice Lake 64 EU), i5-1030NG7, Apple SSD AP0512 | |
|---|---|---|---|---|---|---|
| Heat | -7% | -7% | 2% | -11% | -18% | |
| Maximum Upper Side * (°C) | 38.8 | 41.1 -6% | 39.6 -2% | 34.7 11% | 42.6 -10% | 48 -24% |
| Maximum Bottom * (°C) | 38 | 42.9 -13% | 45.3 -19% | 36.4 4% | 45.4 -19% | 40 -5% |
| Idle Upper Side * (°C) | 26.1 | 26.5 -2% | 25.8 1% | 27.8 -7% | 27.2 -4% | 33 -26% |
| Idle Bottom * (°C) | 26 | 28 -8% | 28.4 -9% | 26.6 -2% | 28.8 -11% | 30 -15% |
* ... smaller is better
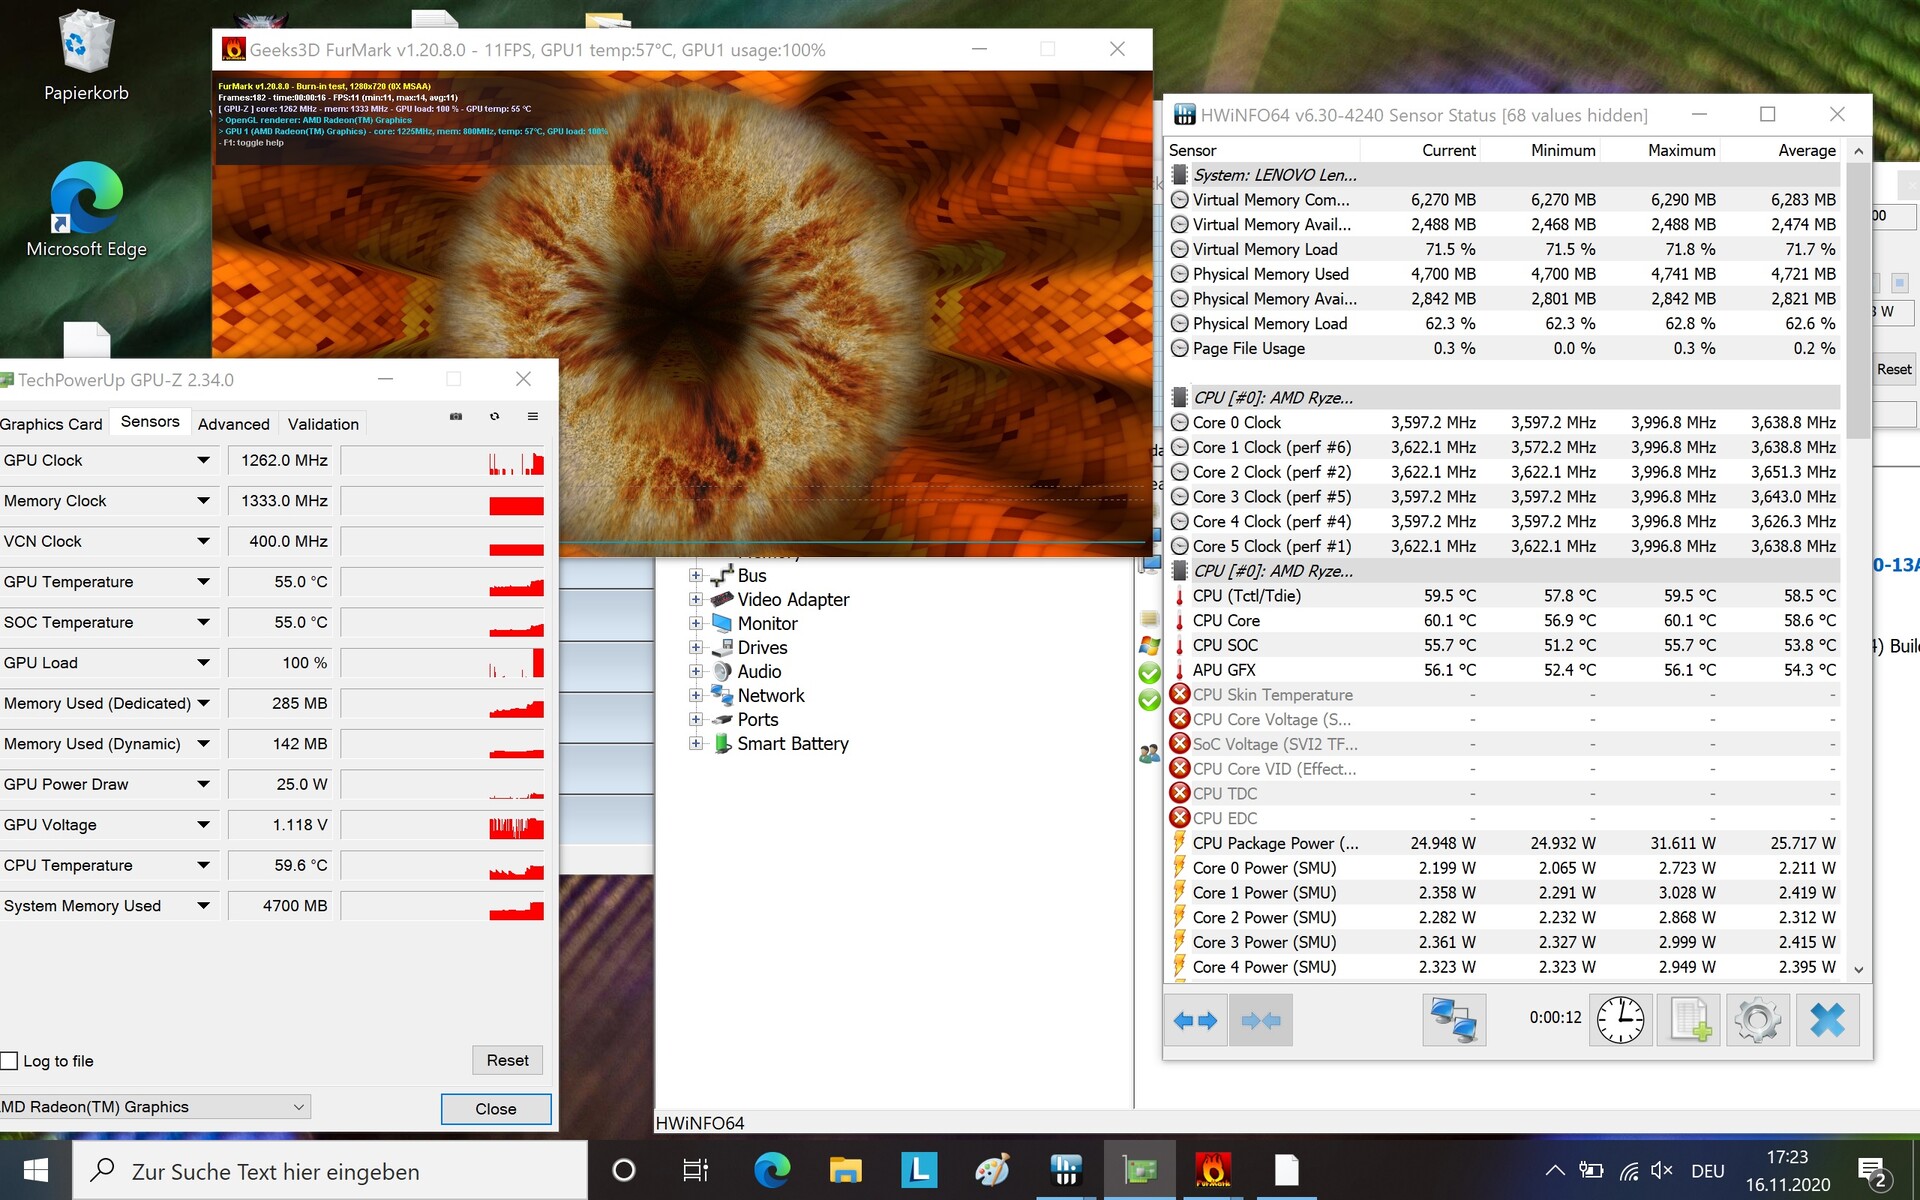
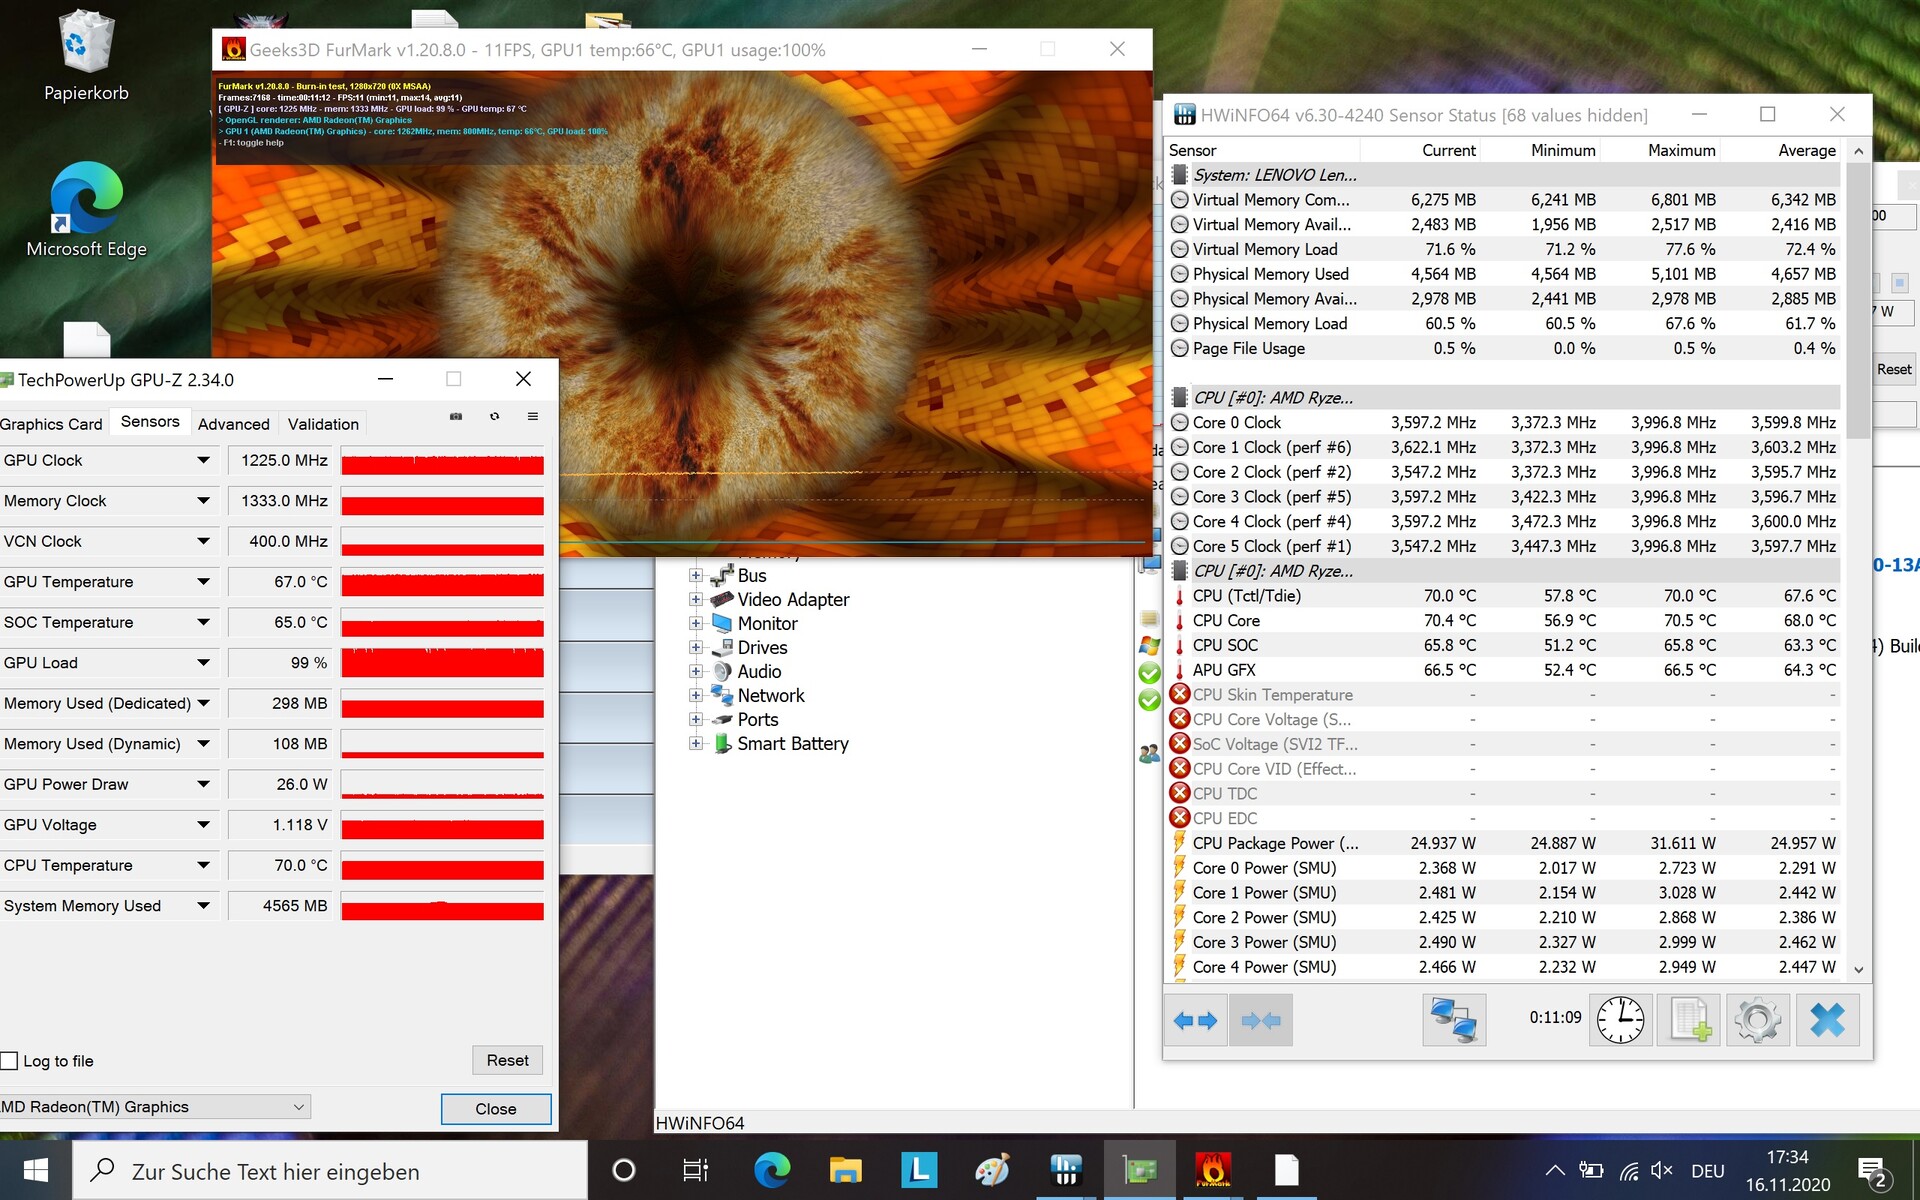
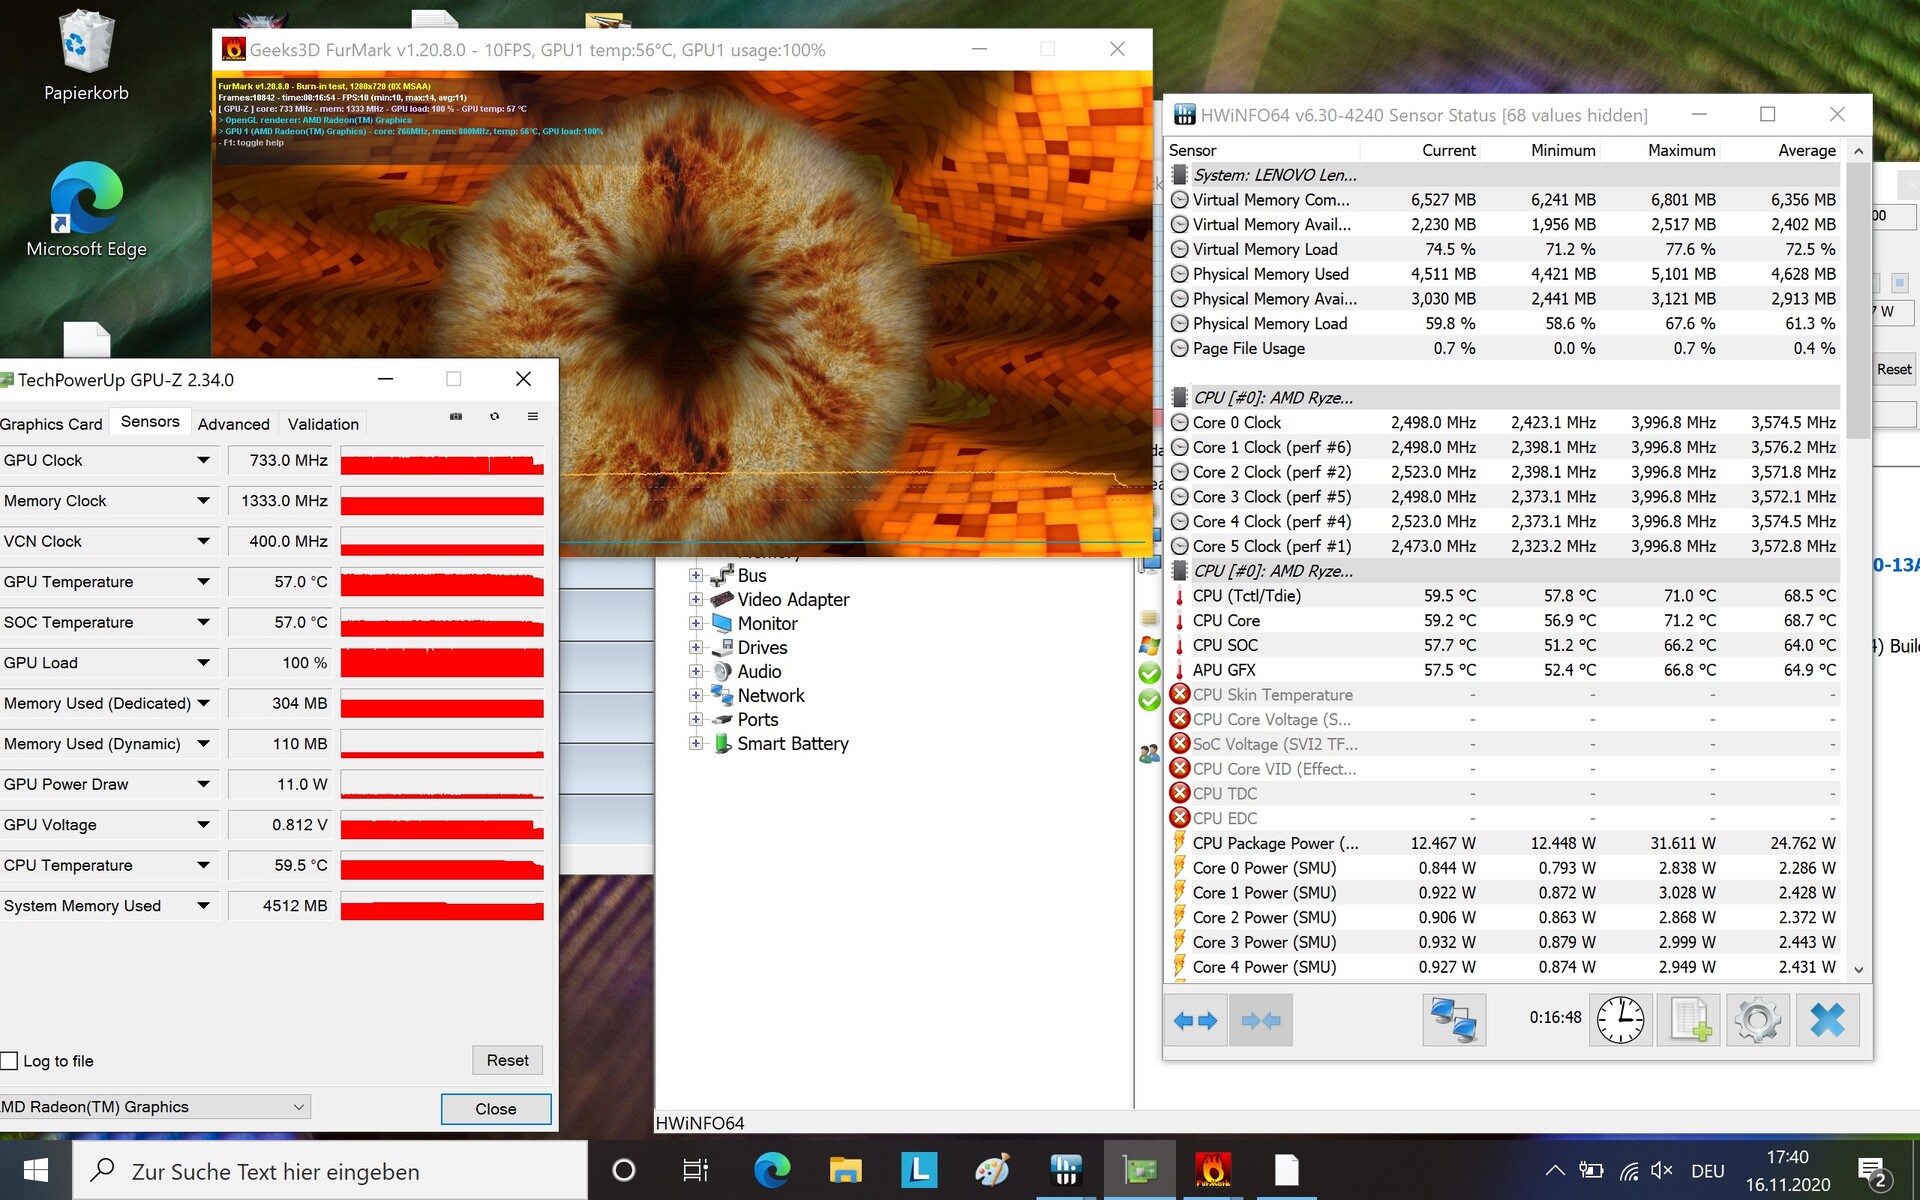
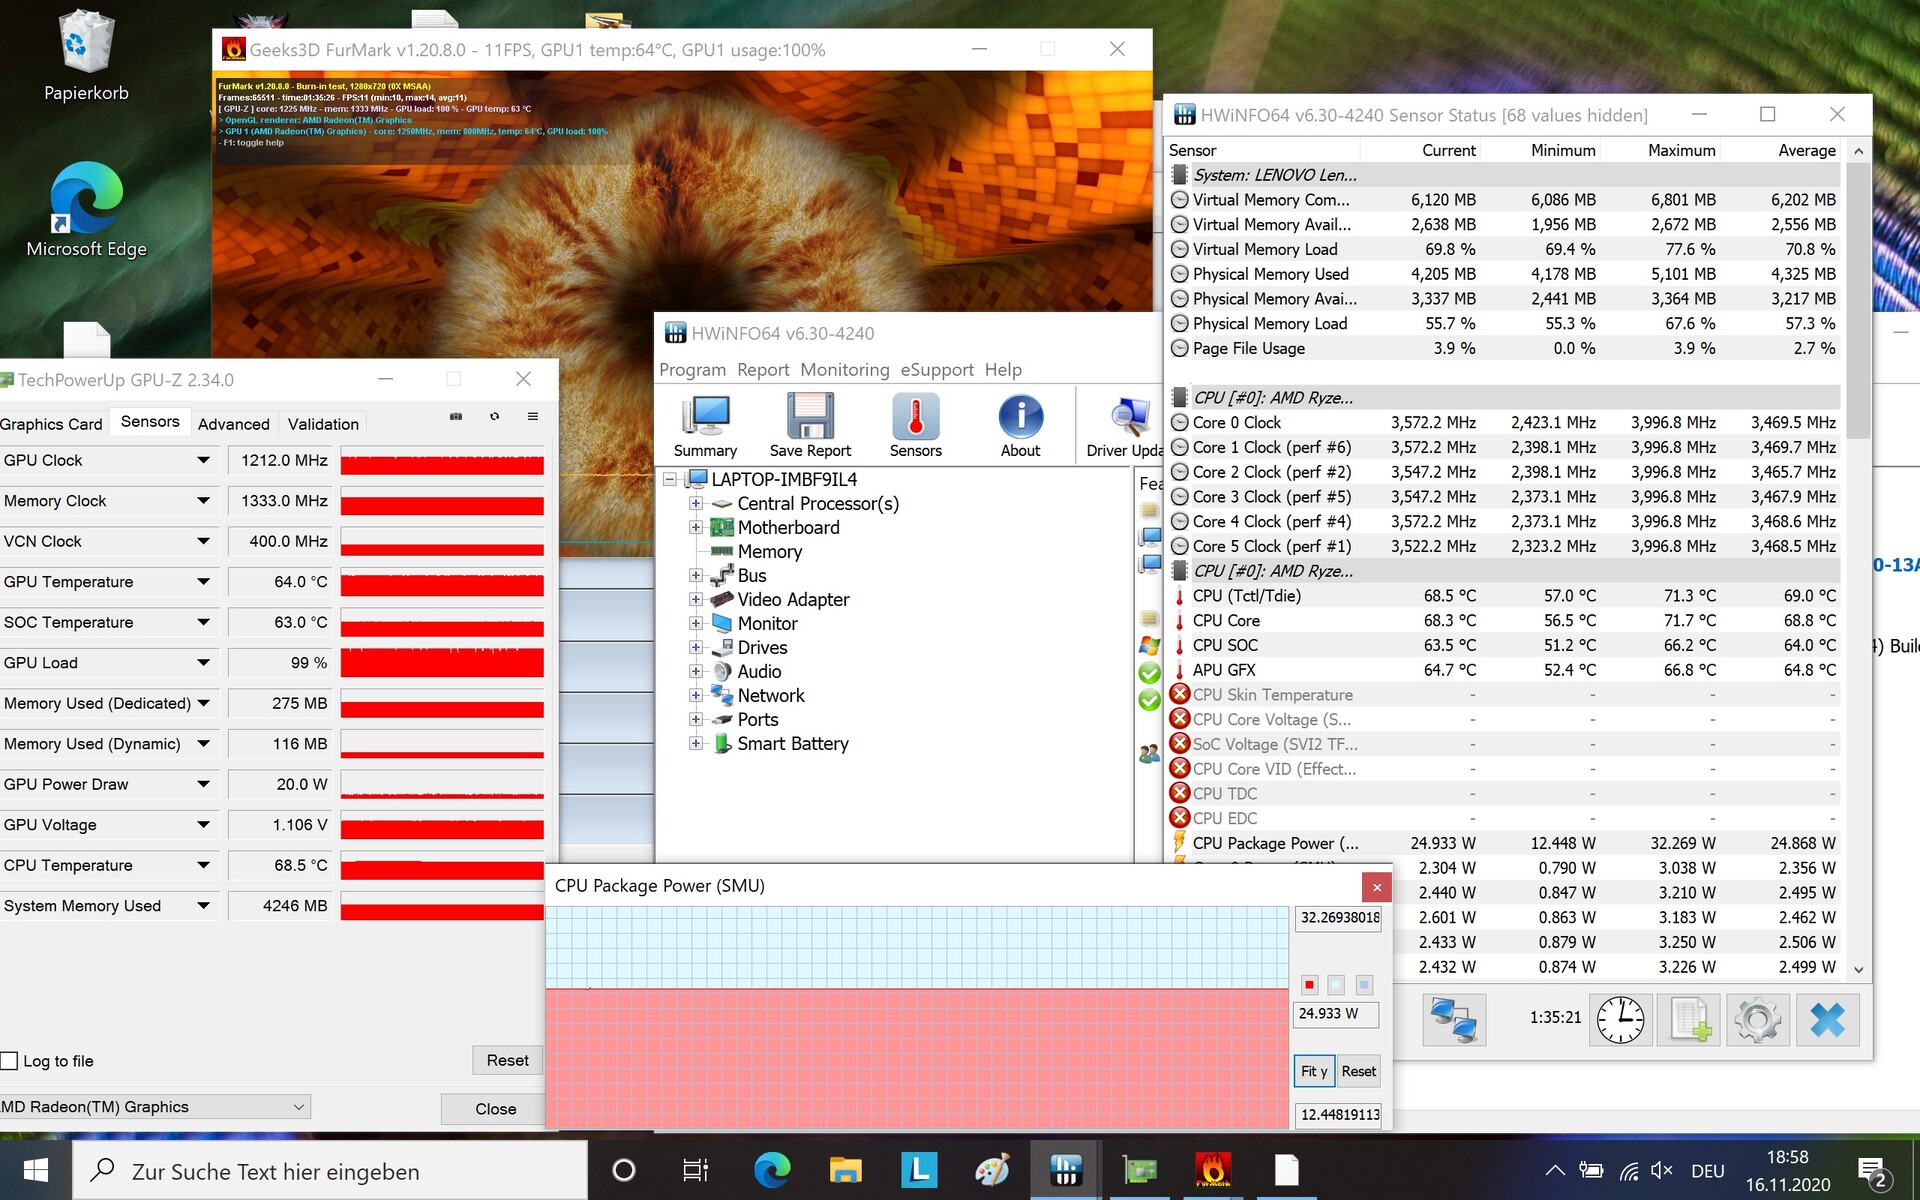
The CPU started our stress test by clocking at 3.6 GHz on all cores. This remains the same even after 10 minutes while the CPU temperature increases by 10 degrees to 70 °C. The GPU clock rate drops by 40 MHz. Both clock rates drop after around 15 minutes with the CPU then clocking at 2.5 GHz and the GPU at only 733 MHz (instead of the initial 1265 MHz).
The device clearly starts throttling at 75 °C. Interestingly enough, the clock rates are back up to 3.5 GHz (CPU) and 1.2 GHz (GPU) again after an hour, with the CPU temperature at 68 °C. We assume that the device would start throttling again once the 75 °C limit was reached and that the clock rates and temperatures fluctuate around these values.
The system recovers quickly and a second round of the 3DMark 11 did not result in any performance losses.
Speaker
The speakers aren't that bad considering the small form factor. Of course there is hardly any bass and they could offer more volume, but the mids and even highs are balanced and linear. We would still recommend connecting headphones or external speakers via the combined audio jack.
Lenovo IdeaPad S540-13ARE-82DL000YGE audio analysis
(±) | speaker loudness is average but good (76.1 dB)
Bass 100 - 315 Hz
(-) | nearly no bass - on average 31.3% lower than median
(±) | linearity of bass is average (11.4% delta to prev. frequency)
Mids 400 - 2000 Hz
(+) | balanced mids - only 2.3% away from median
(+) | mids are linear (5% delta to prev. frequency)
Highs 2 - 16 kHz
(+) | balanced highs - only 4.9% away from median
(+) | highs are linear (6.1% delta to prev. frequency)
Overall 100 - 16.000 Hz
(±) | linearity of overall sound is average (20.1% difference to median)
Compared to same class
» 63% of all tested devices in this class were better, 9% similar, 28% worse
» The best had a delta of 5%, average was 18%, worst was 53%
Compared to all devices tested
» 51% of all tested devices were better, 8% similar, 41% worse
» The best had a delta of 4%, average was 24%, worst was 134%
Microsoft Surface Laptop 3 13 Core i5-1035G7 audio analysis
(±) | speaker loudness is average but good (79 dB)
Bass 100 - 315 Hz
(+) | good bass - only 4.2% away from median
(±) | linearity of bass is average (10.5% delta to prev. frequency)
Mids 400 - 2000 Hz
(+) | balanced mids - only 3.6% away from median
(±) | linearity of mids is average (7.1% delta to prev. frequency)
Highs 2 - 16 kHz
(+) | balanced highs - only 1.8% away from median
(+) | highs are linear (6.5% delta to prev. frequency)
Overall 100 - 16.000 Hz
(+) | overall sound is linear (11.4% difference to median)
Compared to same class
» 2% of all tested devices in this class were better, 2% similar, 96% worse
» The best had a delta of 7%, average was 21%, worst was 53%
Compared to all devices tested
» 7% of all tested devices were better, 2% similar, 91% worse
» The best had a delta of 4%, average was 24%, worst was 134%
Energy Management - Consumption that is appropriate for its performance
Power Consumption
Despite the Ryzen CPU, the laptop isn't very energy-efficient compared to its competitors - particularly under load. Only the Surface Laptop 3 has an even higher consumption (minimal difference). The predecessor and the other comparison devices consume less. The HP ProBook, equipped with a Ryzen 5 4500U, has consumption values that are 20 percent below that of our test unit. But then again, its performance is 25 to 30 percent lower, so these values are actually OK. The Surface actually often offers less performance but consumes more. Power consumption is at around 37 Watt under average load, but even temporary peaks of 61 Watt can be covered by the 65-Watt power supply.
| Off / Standby | |
| Idle | |
| Load |
|
Key:
min: | |
| Lenovo IdeaPad S540-13ARE-82DL000YGE R5 4600U, Vega 6, WDC PC SN730 SDBPNTY-256G, IPS, 2560x1600, 13.3" | Lenovo IdeaPad S540-13API R5 3550H, Vega 8, Samsung SSD PM981 MZVLB512HAJQ, IPS, 2560x1600, 13.3" | HP ProBook x360 435 G7, Ryzen 5 4500U R5 4500U, Vega 6, WDC PC SN520 SDAPNUW-512G, IPS LED, 1920x1080, 13.3" | Acer Swift 3 SF313-52-52AS i5-1035G4, Iris Plus Graphics G4 (Ice Lake 48 EU), SK Hynix BC501 HFM512GDJTNG, IPS, 2256x1504, 13.5" | Microsoft Surface Laptop 3 13 Core i5-1035G7 i5-1035G7, Iris Plus Graphics G7 (Ice Lake 64 EU), SK hynix BC501 HFM256GDGTNG, IPS, 2256x1504, 13.5" | Apple MacBook Air 2020 i5 i5-1030NG7, Iris Plus Graphics G7 (Ice Lake 64 EU), Apple SSD AP0512, IPS, 2560x1600, 13.3" | Average AMD Radeon RX Vega 6 (Ryzen 4000/5000) | Average of class Subnotebook | |
|---|---|---|---|---|---|---|---|---|
| Power Consumption | 8% | 19% | 33% | 0% | 23% | 10% | -6% | |
| Idle Minimum * (Watt) | 5.6 | 3.8 | 3 | 4.4 | 2.4 | 3.98 ? | 4 ? | |
| Idle Average * (Watt) | 8.2 | 5.7 | 6.1 | 7.5 | 6.8 | 6.53 ? | 6.85 ? | |
| Idle Maximum * (Watt) | 9.4 | 9.1 3% | 7.9 16% | 8.4 11% | 7.8 17% | 10.5 -12% | 8.65 ? 8% | 8.47 ? 10% |
| Load Average * (Watt) | 37.6 | 37.6 -0% | 29.3 22% | 25.7 32% | 41.9 -11% | 25.7 32% | 35 ? 7% | 44.4 ? -18% |
| Load Maximum * (Watt) | 60.7 | 48.3 20% | 48.6 20% | 27.6 55% | 63.9 -5% | 30.4 50% | 51.5 ? 15% | 67.4 ? -11% |
| Witcher 3 ultra * (Watt) | 40.8 | 24.5 |
* ... smaller is better
Battery Life
Our practical Wi-Fi test lasts 11 hours on this device. That is slightly better than the competition and significantly better than the Surface. The device turns off after 1 hour and 17 minutes under full load due to the fairly high performance. The Surface lasts a little longer in this scenario (1 hour 42 minutes). Overall, the battery life is quite good.
| Lenovo IdeaPad S540-13ARE-82DL000YGE R5 4600U, Vega 6, 56 Wh | Lenovo IdeaPad S540-13API R5 3550H, Vega 8, 56 Wh | HP ProBook x360 435 G7, Ryzen 5 4500U R5 4500U, Vega 6, 45 Wh | Acer Swift 3 SF313-52-52AS i5-1035G4, Iris Plus Graphics G4 (Ice Lake 48 EU), 54.5 Wh | Microsoft Surface Laptop 3 13 Core i5-1035G7 i5-1035G7, Iris Plus Graphics G7 (Ice Lake 64 EU), 45 Wh | Apple MacBook Air 2020 i5 i5-1030NG7, Iris Plus Graphics G7 (Ice Lake 64 EU), 49.9 Wh | Average of class Subnotebook | |
|---|---|---|---|---|---|---|---|
| Battery runtime | -5% | -15% | -2% | 28% | 32% | 36% | |
| Reader / Idle (h) | 21 | 34.4 64% | 30.7 ? 46% | ||||
| H.264 (h) | 13.4 | 11 -18% | 10.7 -20% | 16.7 ? 25% | |||
| WiFi v1.3 (h) | 11 | 10.5 -5% | 9.7 -12% | 10.8 -2% | 8.3 -25% | 10.3 -6% | 13.3 ? 21% |
| Load (h) | 1.3 | 1.1 -15% | 1.9 46% | 2.9 123% | 1.945 ? 50% |
Pros
Cons
Verdict - Powerful and cool IdeaPad S540
Once again, a business or office laptop has benefited from its Ryzen CPU. The CPU performance of this little notebook is very good and surprisingly steady considering its small form factor. All performance values are very good for this 13-inch laptop for that matter, including GPU performance (although of course we're not looking at a real gamer). At the same time, the S540 remains nice and cool and usually quiet as well (except under full load). It's definitely a safe choice at a price of around €750 (~$900).
There's only one annoying aspect and one minor disappointment: The former is the extremely meagre port selection with only 3 USB ports (one of which is used for power supply) and one audio jack. That's clearly not enough for a mobile laptop. Users will almost always have to carry along an extra hub. The minor disappointment concerns the display. Although it is by no means bad, we were a little disappointed when comparing it to the predecessor's display, which offered a better contrast ratio and black value. The SSD has also been limited slightly, although this should not be noticeable in everyday use.
The Lenovo S540 13-inch laptop does very well in terms of CPU performance, remains cool and usually quiet in every situation. The good overall impression is only slightly clouded by the very sparse port selection.
Lenovo IdeaPad S540-13ARE-82DL000YGE
- 11/24/2020 v7 (old)
Christian Hintze
Price comparison

