Notebookcheck Logo

4x NVIDIA RTX A6000 vs NVIDIA Quadro M1200

4x NVIDIA RTX A6000

► remove from comparison NVIDIA 4x RTX A6000 (Quad NV-Link)

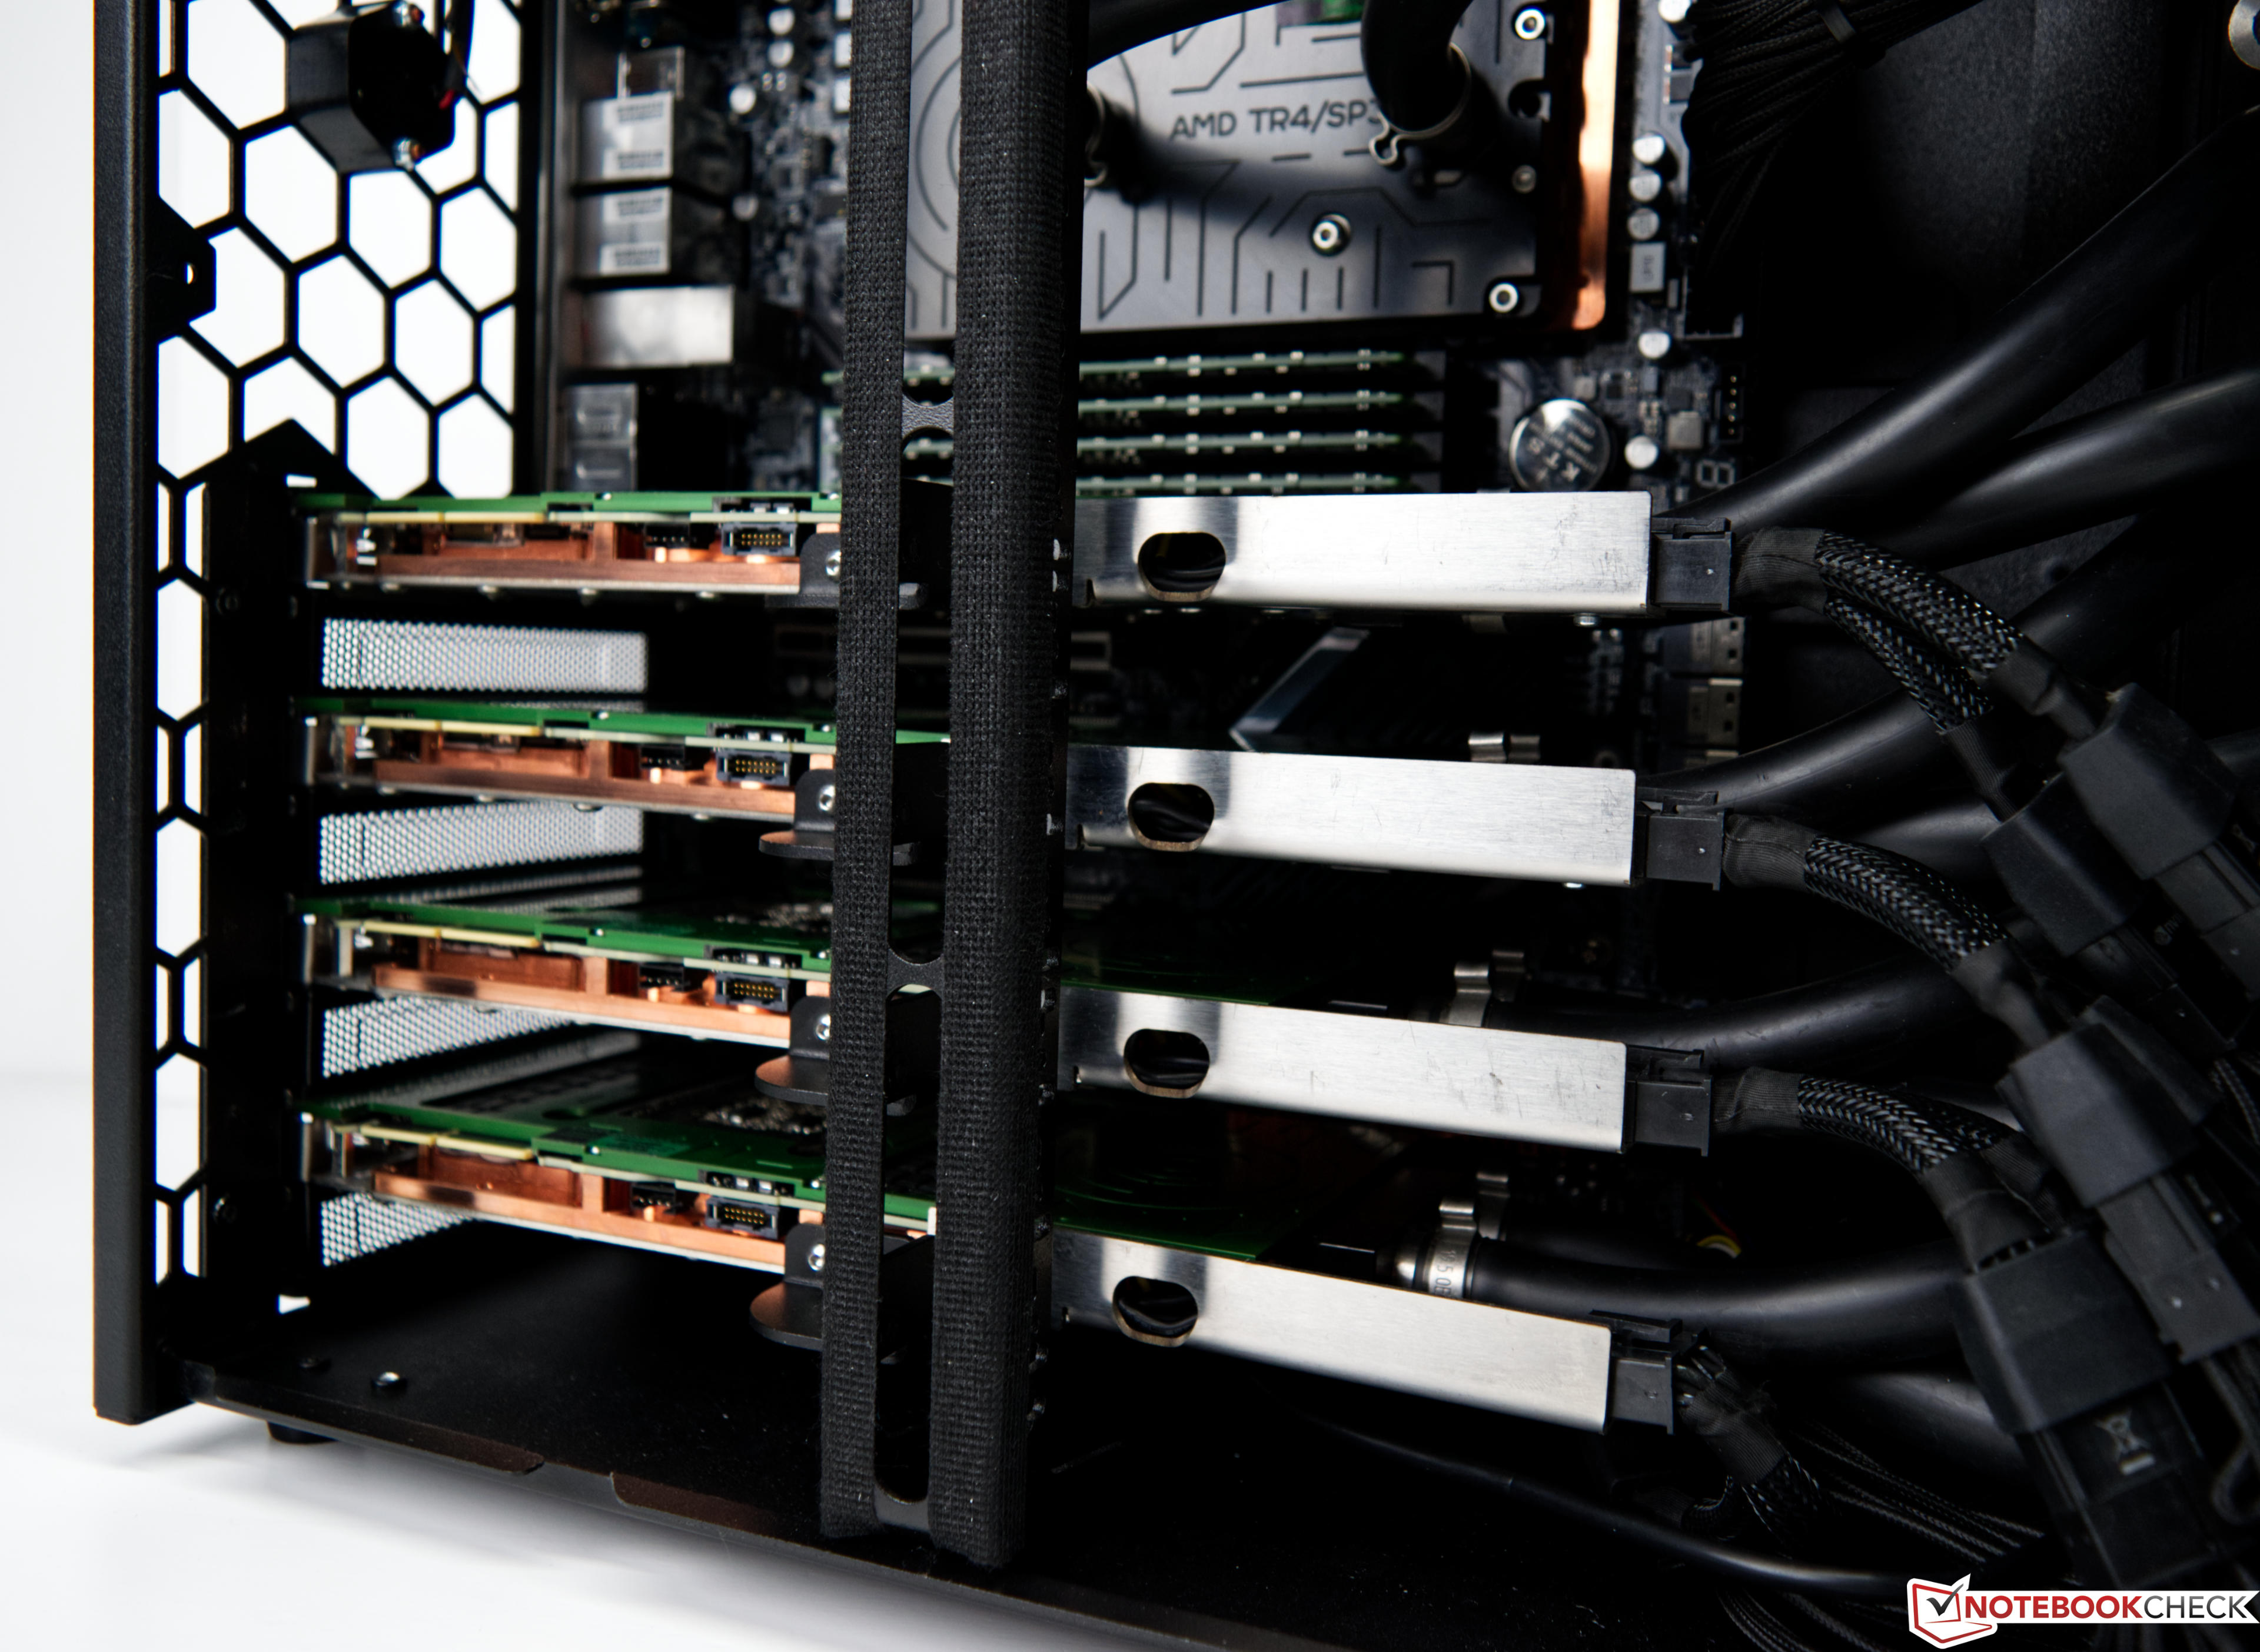
The 4x Nvidia RTX A6000 (Quad NV-Link) is a graphics solution consisting out of four professional RTX A6000 graphics cards connected via NV-Link. Each card uses the GA102 chip and offers 10.752 CUDA cores and 48 GB GDDR6 memory. Only a selected number of professional apps can make use of all four graphics cards, otherwise only one card is used (e.g. in games).

NVIDIA Quadro M1200

► remove from comparison NVIDIA Quadro M1200

The 28 nm Nvidia Quadro M1200 is a mid-range DirectX 12 (FL 11_0) and OpenGL 4.5-compatible graphics card for mobile workstations. It is a (first generation) Maxwell-based GPU built on the GM107 chip with 640 shader cores. Therefore, the GPU is similar to the consumer Nvidia GeForce GTX 960M. The Quadro M1200M is built for the Intel Skylake generation and is the successor to the Quadro M1000M (950M based).

The Quadro series offers certified drivers that are optimized for stability and performance in professional applications like CAD or DCC. OpenGL performance, for example, should be significantly better compared to GeForce graphics cards of similar specifications.

Performance

The performance of the Quadro M1200 is on a level to the previous generation M2000M which is also based on the 960M. In games it is comparable to the GTX 960M although the driver support is not optimized for gaming.

Using CUDA (Compute Capability 5.0) or OpenCL 1.2, the cores of the Quadro M2000M can be used for general calculations.

Power Consumption

The power consumption of the Quadro M1200 is rated for the same TGP of 45 Watt (32.5 Watt TDP) and therefore a bit lower than the M2000M with 55 Watt TGP.

4x NVIDIA RTX A6000NVIDIA Quadro M1200
Quadro M Series
RTX A6000 compare 10752 @ 1.41 - 1.8 GHz384 Bit @ 16000 MHz
4x RTX A6000 (Quad NV-Link) 10752 @ 1.41 - 1.8 GHz384 Bit @ 16000 MHz
Quadro M5500 compare 2048 @ 1.14 - 1.14 GHz256 Bit @ 6606 MHz
Quadro M5000M compare 1536 @ 0.96 - 1.05 GHz256 Bit @ 5000 MHz
Quadro M4000M compare 1280 @ 0.98 - 1.01 GHz256 Bit @ 5012 MHz
Quadro M3000M compare 1024 @ 1.05 GHz256 Bit @ 5000 MHz
Quadro M2200 compare 1024 @ 0.69 - 1.04 GHz128 Bit @ 5508 MHz
Quadro M1200 640 @ 0.99 - 1.15 GHz128 Bit @ 5000 MHz
Quadro M2000M compare 640 @ 1.04 - 1.2 GHz128 Bit @ 5000 MHz
Quadro M1000M compare 512 @ 0.99 - 1.07 GHz128 Bit @ 5000 MHz
Quadro M620 compare 512 @ 1.02 GHz128 Bit @ 5012 MHz
Quadro 5010M compare 384 @ 0.45 GHz256 Bit @ 1300 MHz
Quadro 4000M compare 336 @ 0.48 GHz256 Bit @ 1200 MHz
Quadro M520 compare 384 @ 0.76 - 1.02 GHz64 Bit
Quadro M600M compare 384 @ 0.84 - 0.88 GHz128 Bit @ 5012 MHz
Quadro M500M compare 384 @ 1.03 - 1.12 GHz64 Bit @ 4004 MHz
Quadro 5000M compare 320 @ 0.41 GHz256 Bit @ 1200 MHz
Quadro 3000M compare 240 @ 0.45 GHz256 Bit @ 625 MHz
Quadro 2000M compare 192 @ 0.55 GHz128 Bit @ 900 MHz
Quadro 1000M compare 96 @ 0.7 GHz128 Bit @ 900 MHz
CodenameAmpereN17P-Q1
ArchitectureAmpereMaxwell
Pipelines10752 - unified640 - unified
Core Speed1410 - 1800 (Boost) MHz991 - 1150 (Boost) MHz
Memory Speed16000 MHz5000 MHz
Memory Bus Width384 Bit128 Bit
Memory TypeGDDR6GDDR5
Max. Amount of Memory48 GB4 GB
Shared Memorynono
APIDirectX 12_2, Shader 6.6, OpenGL 4.6DirectX 12 (FL 11_0), Shader 5.0, OpenGL 4.5
Power Consumption300 Watt45 Watt
Transistors28.3 Billion1.9 Billion
technology8 nm28 nm
Date of Announcement05.10.2020 13.01.2017
FeaturesOptimus, PhysX, 3D Vision Pro, nView, Optimus
Notebook Sizelarge
Link to Manufacturer Pagewww.nvidia.de

Benchmarks

Performance Rating - 3DMark 11 + Fire Strike + Time Spy - 4x RTX A6000 (Quad NV-Link)
10.5 pt (32%)
Restrict / Search: Model: Max. age: years
Performance Rating - 3DMark 11 + Fire Strike + Time Spy - Quadro M1200
1.6 pt (5%)
Restrict / Search: Model: Max. age: years
3DMark - 3DMark Fire Strike Standard Score
24576 Points (37%)
min: 3759     avg: 3846     median: 3878 (6%)     max: 3900 Points
3DMark - 3DMark Fire Strike Standard Graphics
27937 Points (26%)
min: 4118     avg: 4142     median: 4141.5 (4%)     max: 4165 Points
3DMark - 3DMark Ice Storm Graphics
407114 Points (45%)
63463 Points (7%)
3DMark - 3DMark Time Spy Score
min: 10303     avg: 11122     median: 11122 (30%)     max: 11941 Points
1290 Points (3%)
3DMark - 3DMark Time Spy Graphics
10167 Points (21%)
3DMark - 3DMark Ice Storm Unlimited Graphics
440592 Points (44%)
240298 Points (24%)
3DMark - 3DMark Ice Storm Extreme Graphics
404406 Points (47%)
42129 Points (5%)
3DMark - 3DMark Cloud Gate Score
41996 Points (40%)
min: 12632     avg: 14705     median: 13600 (13%)     max: 17884 Points
3DMark - 3DMark Cloud Gate Graphics
92363 Points (23%)
min: 26860     avg: 27557     median: 27557 (7%)     max: 28254 Points
3DMark - 3DMark Night Raid
min: 43353     avg: 49697     median: 49696.5 (47%)     max: 56040 Points
3DMark - 3DMark Night Raid Graphics Score
min: 72784     avg: 102103     median: 102102 (39%)     max: 131421 Points
3DMark 11 - 3DM11 Performance Score
29277 Points (35%)
min: 5513     avg: 5515     median: 5514.5 (7%)     max: 5516 Points
3DMark 11 - 3DM11 Performance GPU
38132 Points (29%)
min: 5105     avg: 5310     median: 5310 (4%)     max: 5515 Points
3DMark Vantage
3DM Vant. Perf. total + 4x NVIDIA RTX A6000
3DMark Vantage - 3DM Vant. Perf. total
78808 Points (23%)
3DM Vant. Perf. GPU no PhysX + 4x NVIDIA RTX A6000
3DMark Vantage - 3DM Vant. Perf. GPU no PhysX
83834 Points (46%)
3DMark 05 - 3DMark 05 - Standard
35288 Points (39%)
3DMark 06 3DMark 06 - Standard 1280x1024 + 4x NVIDIA RTX A6000
3DMark 06
38668 Points (51%)
3DMark 06 - Standard 1280x1024 + NVIDIA Quadro M1200
26109 Points (34%)
Unigine Valley 1.0 - Unigine Valley 1.0 DX
134.7 fps (41%)
27.7 fps (8%)
Unigine Heaven 3.0 - Unigine Heaven 3.0 DX 11
30.1 fps (10%)
Unigine Heaven 3.0 - Unigine Heaven 3.0 OpenGL
28.9 fps (13%)
Unigine Heaven 2.1 - Heaven 2.1 high
28.1 fps (5%)
SPECviewperf 11
specvp11 snx-01 + NVIDIA Quadro M1200
SPECviewperf 11 - specvp11 snx-01
43.9 fps (26%)
specvp11 tcvis-02 + NVIDIA Quadro M1200
SPECviewperf 11 - specvp11 tcvis-02
44.2 fps (25%)
specvp11 sw-02 + NVIDIA Quadro M1200
SPECviewperf 11 - specvp11 sw-02
56.4 fps (43%)
specvp11 proe-05 + NVIDIA Quadro M1200
SPECviewperf 11 - specvp11 proe-05
22 fps (26%)
specvp11 maya-03 + NVIDIA Quadro M1200
SPECviewperf 11 - specvp11 maya-03
57.2 fps (43%)
specvp11 lightwave-01 + NVIDIA Quadro M1200
SPECviewperf 11 - specvp11 lightwave-01
57.8 fps (62%)
specvp11 ensight-04 + NVIDIA Quadro M1200
SPECviewperf 11 - specvp11 ensight-04
46.7 fps (22%)
specvp11 catia-03 + NVIDIA Quadro M1200
SPECviewperf 11 - specvp11 catia-03
53.3 fps (28%)
SPECviewperf 12
specvp12 sw-03 + 4x NVIDIA RTX A6000
SPECviewperf 12 - specvp12 sw-03
208 fps (52%)
specvp12 sw-03 + NVIDIA Quadro M1200
min: 69     avg: 72.5     median: 70 (17%)     max: 78.4 fps
specvp12 snx-02 + 4x NVIDIA RTX A6000
SPECviewperf 12 - specvp12 snx-02
333 fps (49%)
specvp12 snx-02 + NVIDIA Quadro M1200
min: 34.18     avg: 35     median: 34.7 (5%)     max: 36 fps
specvp12 showcase-01 + 4x NVIDIA RTX A6000
SPECviewperf 12 - specvp12 showcase-01
237 fps (41%)
specvp12 showcase-01 + NVIDIA Quadro M1200
min: 22.17     avg: 24.8     median: 26 (5%)     max: 26.2 fps
specvp12 mediacal-01 + 4x NVIDIA RTX A6000
SPECviewperf 12 - specvp12 mediacal-01
156 fps (40%)
specvp12 mediacal-01 + NVIDIA Quadro M1200
min: 17.49     avg: 17.8     median: 17.8 (5%)     max: 18 fps
specvp12 maya-04 + 4x NVIDIA RTX A6000
SPECviewperf 12 - specvp12 maya-04
147 fps (40%)
specvp12 maya-04 + NVIDIA Quadro M1200
min: 32.07     avg: 34.4     median: 33.7 (9%)     max: 37.29 fps
specvp12 energy-01 + 4x NVIDIA RTX A6000
SPECviewperf 12 - specvp12 energy-01
39.3 fps (35%)
specvp12 energy-01 + NVIDIA Quadro M1200
min: 3.78     avg: 3.8     median: 3.9 (3%)     max: 3.9 fps
specvp12 creo-01 + 4x NVIDIA RTX A6000
SPECviewperf 12 - specvp12 creo-01
127 fps (51%)
specvp12 creo-01 + NVIDIA Quadro M1200
min: 45     avg: 46     median: 46.1 (18%)     max: 46.97 fps
specvp12 catia-04 + 4x NVIDIA RTX A6000
SPECviewperf 12 - specvp12 catia-04
208 fps (34%)
specvp12 catia-04 + NVIDIA Quadro M1200
min: 45.75     avg: 46.2     median: 45.9 (8%)     max: 47 fps
specvp12 3dsmax-05 + 4x NVIDIA RTX A6000
SPECviewperf 12 - specvp12 3dsmax-05
245 fps (37%)
specvp12 3dsmax-05 + NVIDIA Quadro M1200
46 fps (7%)
SPECviewperf 13 specvp13 sw-04 + 4x NVIDIA RTX A6000
SPECviewperf 13 - specvp13 sw-04
191 fps (51%)
specvp13 snx-03 + 4x NVIDIA RTX A6000
SPECviewperf 13 - specvp13 snx-03
604 fps (67%)
specvp13 showcase-02 + 4x NVIDIA RTX A6000
SPECviewperf 13 - specvp13 showcase-02
239 fps (41%)
specvp13 medical-02 + 4x NVIDIA RTX A6000
SPECviewperf 13 - specvp13 medical-02
180 fps (31%)
specvp13 maya-05 + 4x NVIDIA RTX A6000
SPECviewperf 13 - specvp13 maya-05
405 fps (46%)
specvp13 energy-02 + 4x NVIDIA RTX A6000
SPECviewperf 13 - specvp13 energy-02
128 fps (41%)
specvp13 creo-02 + 4x NVIDIA RTX A6000
SPECviewperf 13 - specvp13 creo-02
292 fps (43%)
specvp13 catia-05 + 4x NVIDIA RTX A6000
SPECviewperf 13 - specvp13 catia-05
359 fps (40%)
specvp13 3dsmax-06 + 4x NVIDIA RTX A6000
SPECviewperf 13 - specvp13 3dsmax-06
247 fps (39%)
SPECviewperf 2020 specvp2020 solidworks-05 4k + 4x NVIDIA RTX A6000
SPECviewperf 2020 - specvp2020 solidworks-05 4k
141 fps (34%)
specvp2020 snx-04 4k + 4x NVIDIA RTX A6000
SPECviewperf 2020 - specvp2020 snx-04 4k
367 fps (38%)
specvp2020 medical-03 4k + 4x NVIDIA RTX A6000
SPECviewperf 2020 - specvp2020 medical-03 4k
32.1 fps (21%)
specvp2020 maya-06 4k + 4x NVIDIA RTX A6000
SPECviewperf 2020 - specvp2020 maya-06 4k
262 fps (38%)
specvp2020 energy-03 4k + 4x NVIDIA RTX A6000
SPECviewperf 2020 - specvp2020 energy-03 4k
46.1 fps (10%)
specvp2020 creo-03 4k + 4x NVIDIA RTX A6000
SPECviewperf 2020 - specvp2020 creo-03 4k
75.6 fps (34%)
specvp2020 catia-06 4k + 4x NVIDIA RTX A6000
SPECviewperf 2020 - specvp2020 catia-06 4k
67.5 fps (44%)
specvp2020 3dsmax-07 4k + 4x NVIDIA RTX A6000
SPECviewperf 2020 - specvp2020 3dsmax-07 4k
95.7 fps (32%)
Cinebench R10 Cinebench R10 Shading (32bit) + 4x NVIDIA RTX A6000
Cinebench R10 - Cinebench R10 Shading (32bit)
6831 Points (5%)
Cinebench R11.5 Cinebench R11.5 OpenGL 64 Bit + 4x NVIDIA RTX A6000
Cinebench R11.5 - Cinebench R11.5 OpenGL 64 Bit
76.2 fps (25%)
Cinebench R11.5 OpenGL 64 Bit + NVIDIA Quadro M1200
102.2 fps (34%)
Cinebench R15
Cinebench R15 OpenGL 64 Bit + 4x NVIDIA RTX A6000
Cinebench R15 - Cinebench R15 OpenGL 64 Bit
204.8 fps (12%)
Cinebench R15 OpenGL 64 Bit + NVIDIA Quadro M1200
min: 102.8     avg: 108.2     median: 108.2 (6%)     max: 113.5 fps
Cinebench R15 OpenGL Ref. Match 64 Bit + 4x NVIDIA RTX A6000
Cinebench R15 - Cinebench R15 OpenGL Ref. Match 64 Bit
99.6 % (100%)
Cinebench R15 OpenGL Ref. Match 64 Bit + NVIDIA Quadro M1200
99.6 % (100%)
LuxMark v2.0 64Bit - LuxMark v2.0 Room GPU
22134 Samples/s (80%)
min: 656     avg: 818     median: 817.5 (3%)     max: 979 Samples/s
LuxMark v2.0 64Bit - LuxMark v2.0 Sala GPU
57054 Samples/s (100%)
min: 852     avg: 1207     median: 1207 (2%)     max: 1562 Samples/s
ComputeMark v2.1 - ComputeMark v2.1 Result
43210 Points (36%)
388 Points (0%)
Power Consumption - Furmark Stress Test Power Consumption - external Monitor *
650 Watt (87%)
Power Consumption - The Witcher 3 Power Consumption - external Monitor *
716 Watt (100%)
Power Consumption - Witcher 3 Power Consumption *
min: 74.8     avg: 87.5     median: 87.5 (19%)     max: 100.2 Watt
Power Consumption - Power Efficiency - Witcher 3 ultra
0.2 fps per Watt (16%)
Power Consumption - Power Efficiency - Witcher 3 ultra external Monitor
0.2 fps per Watt (20%)
Emissions Witcher 3 Fan Noise + NVIDIA Quadro M1200
Emissions - Witcher 3 Fan Noise
min: 42.3     avg: 43.9     median: 43.9 (63%)     max: 45.5 dB(A)

Average Benchmarks 4x NVIDIA RTX A6000 → 100% n=27

Average Benchmarks NVIDIA Quadro M1200 → 29% n=27

- Range of benchmark values for this graphics card
red legend - Average benchmark values for this graphics card
* Smaller numbers mean a higher performance
1 This benchmark is not used for the average calculation

Game Benchmarks

The following benchmarks stem from our benchmarks of review laptops. The performance depends on the used graphics memory, clock rate, processor, system settings, drivers, and operating systems. So the results don't have to be representative for all laptops with this GPU. For detailed information on the benchmark results, click on the fps number.

F1 2021

F1 2021

2021
low 1280x720
100%
4x RTX A6000 (Quad NV-Link):
328  fps
med. 1920x1080
100%
4x RTX A6000 (Quad NV-Link):
303  fps
high 1920x1080
100%
4x RTX A6000 (Quad NV-Link):
278  fps
ultra 1920x1080
100%
4x RTX A6000 (Quad NV-Link):
159  fps
QHD 2560x1440
100%
4x RTX A6000 (Quad NV-Link):
149  fps
4K 3840x2160
100%
4x RTX A6000 (Quad NV-Link):
96.8  fps
F1 2020

F1 2020

2020
low 1280x720
100%
4x RTX A6000 (Quad NV-Link):
277  fps
med. 1920x1080
100%
4x RTX A6000 (Quad NV-Link):
241  fps
high 1920x1080
100%
4x RTX A6000 (Quad NV-Link):
241  fps
ultra 1920x1080
100%
4x RTX A6000 (Quad NV-Link):
221  fps
QHD 2560x1440
100%
4x RTX A6000 (Quad NV-Link):
210  fps
4K 3840x2160
100%
4x RTX A6000 (Quad NV-Link):
136  fps
low 1280x720
100%
4x RTX A6000 (Quad NV-Link):
40  fps
med. 1920x1080
100%
4x RTX A6000 (Quad NV-Link):
40  fps
high 1920x1080
100%
4x RTX A6000 (Quad NV-Link):
38  fps
ultra 1920x1080
100%
4x RTX A6000 (Quad NV-Link):
37  fps
QHD 2560x1440
100%
4x RTX A6000 (Quad NV-Link):
37  fps
4K 3840x2160
100%
4x RTX A6000 (Quad NV-Link):
36  fps
low 1280x720
100%
4x RTX A6000 (Quad NV-Link):
119  fps
med. 1920x1080
100%
4x RTX A6000 (Quad NV-Link):
106  fps
high 1920x1080
100%
4x RTX A6000 (Quad NV-Link):
95.7  fps
ultra 1920x1080
100%
4x RTX A6000 (Quad NV-Link):
87.9  fps
QHD 2560x1440
100%
4x RTX A6000 (Quad NV-Link):
83.5  fps
4K 3840x2160
100%
4x RTX A6000 (Quad NV-Link):
67  fps
Strange Brigade

Strange Brigade

2018
low 1280x720
100%
4x RTX A6000 (Quad NV-Link):
317  fps
med. 1920x1080
100%
4x RTX A6000 (Quad NV-Link):
260  fps
high 1920x1080
100%
4x RTX A6000 (Quad NV-Link):
257  fps
ultra 1920x1080
100%
4x RTX A6000 (Quad NV-Link):
258  fps
QHD 2560x1440
100%
4x RTX A6000 (Quad NV-Link):
252  fps
4K 3840x2160
100%
4x RTX A6000 (Quad NV-Link):
246  fps
Far Cry 5

Far Cry 5

2018
low 1280x720
100%
4x RTX A6000 (Quad NV-Link):
18  fps
med. 1920x1080
100%
4x RTX A6000 (Quad NV-Link):
18  fps
high 1920x1080
100%
4x RTX A6000 (Quad NV-Link):
17  fps
ultra 1920x1080
100%
4x RTX A6000 (Quad NV-Link):
18  fps
QHD 2560x1440
100%
4x RTX A6000 (Quad NV-Link):
17  fps
4K 3840x2160
100%
4x RTX A6000 (Quad NV-Link):
18  fps
low 1280x720
100%
4x RTX A6000 (Quad NV-Link):
109  fps
med. 1920x1080
100%
4x RTX A6000 (Quad NV-Link):
96.8  fps
high 1920x1080
100%
4x RTX A6000 (Quad NV-Link):
78.3  fps
4K 3840x2160
100%
4x RTX A6000 (Quad NV-Link):
67.8  fps
low 1280x720
100%
4x RTX A6000 (Quad NV-Link):
175  fps
med. 1920x1080
100%
4x RTX A6000 (Quad NV-Link):
167  fps
high 1920x1080
100%
4x RTX A6000 (Quad NV-Link):
131  fps
QHD 2560x1440
100%
4x RTX A6000 (Quad NV-Link):
113  fps
4K 3840x2160
100%
4x RTX A6000 (Quad NV-Link):
56.3  fps
Doom

Doom

2016
low 1280x720
Quadro M1200:
79  fps
med. 1366x768
Quadro M1200:
66  fps
high 1920x1080
Quadro M1200:
37  fps
ultra 1920x1080
Quadro M1200:
34  fps
4K 3840x2160
Quadro M1200:
12  fps
low 1024x768
Quadro M1200:
88.1  fps
med. 1366x768
Quadro M1200:
49.2  fps
high 1920x1080
Quadro M1200:
28.4  fps
ultra 1920x1080
Quadro M1200:
23.9  fps
4K 3840x2160
Quadro M1200:
9.9  fps
low 1280x720
100%
4x RTX A6000 (Quad NV-Link):
154  fps
med. 1366x768
100%
4x RTX A6000 (Quad NV-Link):
135.3  fps
high 1920x1080
100%
4x RTX A6000 (Quad NV-Link):
126.8  fps
ultra 1920x1080
100%
4x RTX A6000 (Quad NV-Link):
115.3  fps
4K 3840x2160
100%
4x RTX A6000 (Quad NV-Link):
109.3  fps
low 1280x720
Quadro M1200:
74  fps
med. 1366x768
Quadro M1200:
63  fps
high 1920x1080
Quadro M1200:
35  fps
ultra 1920x1080
Quadro M1200:
29  fps
4K 3840x2160
Quadro M1200:
11  fps
low 1024x768
100%
4x RTX A6000 (Quad NV-Link):
351  fps
21%
Quadro M1200:
73.6  fps
med. 1366x768
100%
4x RTX A6000 (Quad NV-Link):
331  fps
14%
Quadro M1200:
45.9  fps
high 1920x1080
100%
4x RTX A6000 (Quad NV-Link):
305  fps
9%
Quadro M1200:
26.3 29 ~ 28 fps
ultra 1920x1080
100%
4x RTX A6000 (Quad NV-Link):
173  fps
8%
Quadro M1200:
13  fps
4K 3840x2160
100%
4x RTX A6000 (Quad NV-Link):
142  fps
GTA V

GTA V

2015
low 1024x768
100%
4x RTX A6000 (Quad NV-Link):
169  fps
med. 1366x768
100%
4x RTX A6000 (Quad NV-Link):
162  fps
high 1920x1080
100%
4x RTX A6000 (Quad NV-Link):
142  fps
ultra 1920x1080
100%
4x RTX A6000 (Quad NV-Link):
88.5  fps
QHD 2560x1440
100%
4x RTX A6000 (Quad NV-Link):
88.4  fps
4K 3840x2160
100%
4x RTX A6000 (Quad NV-Link):
139  fps
Thief

Thief

2014
low 1024x768
Quadro M1200:
93.3  fps
med. 1366x768
Quadro M1200:
58.9  fps
high 1366x768
Quadro M1200:
50.1  fps
ultra 1920x1080
Quadro M1200:
26.2  fps
low 1280x720
Quadro M1200:
189 224.7 ~ 207 fps
med. 1366x768
Quadro M1200:
130.8 137 ~ 134 fps
high 1366x768
Quadro M1200:
113.1 125 ~ 119 fps
ultra 1920x1080
Quadro M1200:
42.6 47 ~ 45 fps

Average Gaming 4x NVIDIA RTX A6000 → 100%

Average Gaming 30-70 fps → 100%

Average Gaming NVIDIA Quadro M1200 → 13%

Average Gaming 30-70 fps → 14%

4x NVIDIA RTX A6000NVIDIA Quadro M1200
lowmed.highultraQHD4Klowmed.highultraQHD4K
F1 202132830327815914996.8
F1 2020277241241221210136
Far Cry New Dawn404038373736
Metro Exodus11910695.787.983.567
Strange Brigade317260257258252246
Far Cry 5181817181718
X-Plane 11.1110996.878.367.8
Final Fantasy XV Benchmark17516713111356.3
Dota 2 Reborn154135.3126.8115.3109.3
The Witcher 335133130517314273.645.92813
GTA V16916214288.588.4139
4x NVIDIA RTX A6000NVIDIA Quadro M1200
lowmed.highultraQHD4Klowmed.highultraQHD4K
< 30 fps
< 60 fps
< 120 fps
≥ 120 fps
1
1
2
7
1
1
2
7
1
1
2
7
1
1
3
4
1
1
3
3
1
2
4
4
< 30 fps
< 60 fps
< 120 fps
≥ 120 fps


1

1

1


1


For more games that might be playable and a list of all games and graphics cards visit our Gaming List

Add one or more devices and compare

In the following list you can select (and also search for) devices that should be added to the comparison. You can select more than one device.

restrict list:
v1.35
log 13. 16:10:30

#0 ran 0s before starting gpusingle class +0s ... 0s

#1 checking url part for id 11095 +0s ... 0s

#2 checking url part for id 7704 +0s ... 0s

#3 redirected to Ajax server, took 1765638629s time from redirect:1 +0s ... 0s

#4 did not recreate cache, as it is less than 5 days old! Created at Sat, 13 Dec 2025 05:19:17 +0100 +0s ... 0s

#5 composed specs +0.018s ... 0.018s

#6 did output specs +0s ... 0.018s

#7 start showIntegratedCPUs +0s ... 0.018s

#8 getting avg benchmarks for device 11095 +0.02s ... 0.038s

#9 got single benchmarks 11095 +0.005s ... 0.043s

#10 getting avg benchmarks for device 7704 +0.004s ... 0.046s

#11 got single benchmarks 7704 +0.006s ... 0.052s

#12 got avg benchmarks for devices +0s ... 0.052s

#13 min, max, avg, median took s +0.036s ... 0.088s

#14 before gaming benchmark output +0s ... 0.088s

#15 Got 93 rows for game benchmarks. +0.006s ... 0.094s

#16 composed SQL query for gamebenchmarks +0s ... 0.094s

#17 got data and put it in $dataArray +0.001s ... 0.095s

#18 benchmarks composed for output. +0.005s ... 0.1s

#19 calculated avg scores. +0s ... 0.1s

#20 return log +0.002s ... 0.102s

Please share our article, every link counts!
Mail Logo
> Expert Reviews and News on Laptops, Smartphones and Tech Innovations > Benchmarks / Tech > Graphics Card Comparison - Head 2 Head
Redaktion, 2017-09- 8 (Update: 2023-07- 1)