Notebookcheck Logo

Intel Iris Plus Graphics 655 vs Intel HD Graphics P630

Intel Iris Plus Graphics 655

► remove from comparison Intel Iris Plus Graphics 655

The Intel Iris Plus Graphics 655 (GT3e) is a processor graphics card announced in September 2017. As the successor to the Intel Iris Graphics 650 (Kaby Lake), the Iris Plus Graphics 655 is used for 28-Watt Coffee Lake-U models. The biggest difference is the doubled eDRAM-cache at 128 MB. There should not be any big changes compared to the Iris Graphics 650.

The so called GT3e version of the Kaby Lake GPU still has 48 Execution Units (EUs), which can reach up to 1200 MHz (previously 1100 MHz) depending on the model. Besides eDRAM cache, the Iris 655 can also access the system memory (2x 64 Bit DDR3L-2133/DDR4-2400) via processor interface.

Compared to the Iris Plus 640 from the 15-Watt models, the Iris 655 only has a slightly higher maximum clock as well as almost twice the TDP, which allows a better utilization of the Turbo Boost potential.

Performance

The exact performance of the Iris Plus Graphics 655 depends on the CPU model, because maximum clock as well as the size of the L3 cache can differ a bit. The system memory (DDR3/DDR4) will influence the performance as well.

The fastest chips are high-clocked Core i7 models like the Core i7-8559U. Depending on the game, the Iris Plus 655 will probably be on par with a dedicated GeForce 930M or GeForce 940MX and can handle smooth gameplay in modern titles in low up to medium settings.

Features

The reworked video engine now fully supports hardware decoding of H.265/HEVC videos. Contrary to Skylake, however, Kaby Lake can now also decode H.265/HEVC Main 10 with a 10-bit color depth as well as Google's VP9 codec. The video output is possible via DP 1.2/eDP 1.3 (up to 3840 x 2160 @60 Hz), whereas HDMI is also supported in the older 1.4a standard. An HDMI 2.0 output can be added via converter from DisplayPort. The GPU can drive up to three displays simultaneously.

Power Consumption

The Iris Plus Graphics 655 is used for 28-Watt processor and therefore small/medium-sized notebooks.

Intel HD Graphics P630

► remove from comparison Intel HD Graphics P630

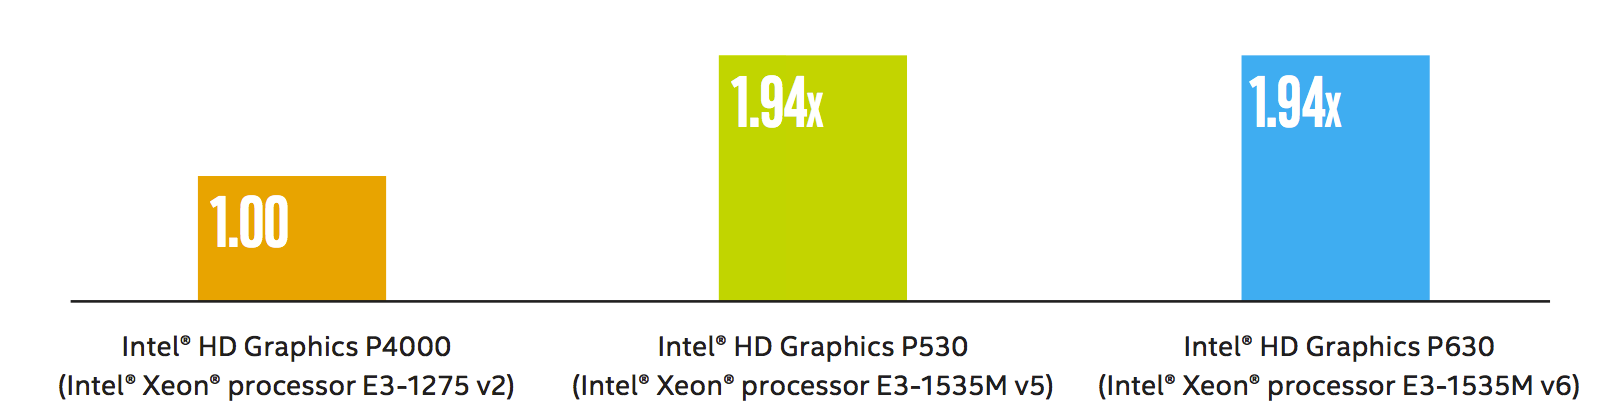
The Intel HD Graphics P630 (GT2) is an integrated graphics unit, which can be found in various Xeon workstation processors of the Kaby Lake generation. The "GT2" version of the Skylake GPU offers 24 Execution Units (EUs) clocked at up to 1050 MHz (depending on the CPU model). Due to its lack of dedicated graphics memory or eDRAM cache, the P630 has to access the main memory (2x 64bit DDR3L-1600 / DDR4-2133). It uses the same silicon as the consumer HD Graphics 630 in Kaby-Lake-H processors but features optimized drivers for workstaion and CAD software. According to Intel it is certified for 15 applications (see list).

Performance

According to Intel, the performance of the P630 is identical to the Intel HD Graphis P530 (Skylake predecessor) processor graphics card and 1.94x faster than the old Intel HD Graphics P4000. Compared to consumer cards, the gaming performance should be on a similar level to the dedicated GeForce 920M and will handle old games (as of 2015) in low or medium settings.

Features

The revised video engine in the Kaby Lake chips now supports H.265/HEVC Main10 profile at 10-bit color depth and also the VP9 codec in hardware. Furthermore, HDCP 2.2 is also supported in all chips, which allows Netflix 4K videos, for instance.

Power Consumption

The HD Graphics P630 can be found in mobile quad-core Xeon processors with 45 W TDP and also desktop processors of the Xeon range with higher TDPs.

Sourcehttp://www.intel.com/content/dam/www/public/us/en/documents/guides/hd-graphics-performance-guide.pdf

Intel Iris Plus Graphics 655Intel HD Graphics P630
Gen. 9.5 Series
Iris Plus Graphics 655 48 @ 0.3 - 1.2 GHz
Iris Plus Graphics 650 compare 48 @ 0.3 - 1.1 GHz64/128 Bit
Iris Plus Graphics 645 compare 48 @ 0.3 - 1.15 GHz
Iris Plus Graphics 640 compare 48 @ 0.3 - 1.05 GHz64/128 Bit
UHD Graphics 630 compare 24 @ 0.3 - 1.15 GHz64/128 Bit
UHD Graphics P630 compare 24 @ 0.3 - 1.2 GHz64/128 Bit
HD Graphics 630 compare 24 @ 0.3 - 1.15 GHz64/128 Bit
HD Graphics P630 24 64/128 Bit
UHD Graphics 620 compare 24 @ 0.3 - 1.15 GHz
HD Graphics 620 compare 24 @ 0.3 - 1.05 GHz64/128 Bit
UHD Graphics 617 compare 24 @ 0.3 - 1.15 GHz64/128 Bit
UHD Graphics 615 compare 24 @ 0.3 - 1 GHz64/128 Bit
HD Graphics 615 compare 24 @ 0.3 - 1.05 GHz64/128 Bit
CodenameKaby Lake GT3eKaby-Lake-H-GT2
ArchitectureGen. 9.5 Kaby LakeGen. 9.5 Kaby Lake
Pipelines48 - unified24 - unified
Core Speed300 - 1200 (Boost) MHz
Memory TypeDDR3/DDR4
Shared Memoryyesyes
APIDirectX 12_1, OpenGL 4.5DirectX 12_1, OpenGL 4.4
technology14 nm14 nm
FeaturesQuickSyncQuickSync
Date of Announcement01.09.2017 05.08.2015
Memory Bus Width64/128 Bit
CPU in Iris Plus Graphics 655GPU Base SpeedGPU Boost / Turbo
Intel Core i7-8559U4 x 2700 MHz, 28 W300 MHz1200 MHz
Intel Core i5-8269U4 x 2600 MHz, 28 W300 MHz1100 MHz
Intel Core i5-8279U4 x 2400 MHz, 28 W300 MHz1150 MHz
min. - max.300 MHz1050 - 1200 MHz
CPU in HD Graphics P630GPU Base SpeedGPU Boost / Turbo
Intel Xeon E3-1535M v64 x 3100 MHz, 45 W300 MHz1150 MHz
Intel Xeon E3-1505M v64 x 3000 MHz, 45 W300 MHz1150 MHz
min. - max.300 MHz1050 - 1200 MHz

Benchmarks

Performance Rating - 3DMark 11 + Fire Strike + Time Spy - Iris Plus Graphics 655
0.9 pt (3%)
3DMark - 3DMark Time Spy Score
min: 348     avg: 647     median: 684 (2%)     max: 722 Points
400 Points (1%)
3DMark - 3DMark Time Spy Graphics
min: 301     avg: 570     median: 604.5 (2%)     max: 633 Points
3DMark - 3DMark Ice Storm Unlimited Graphics
min: 131607     avg: 139716     median: 137266 (16%)     max: 152727 Points
3DMark - 3DMark Ice Storm Extreme Graphics
min: 57033     avg: 72655     median: 71073 (9%)     max: 89859 Points
3DMark - 3DMark Cloud Gate Score
min: 6769     avg: 10798     median: 11622 (12%)     max: 13037 Points
8280 Points (9%)
3DMark - 3DMark Cloud Gate Graphics
min: 6498     avg: 13736     median: 14343 (4%)     max: 16698 Points
3DMark - 3DMark Fire Strike Standard Score
min: 852     avg: 1703     median: 1850 (3%)     max: 2040 Points
1040 Points (2%)
3DMark - 3DMark Fire Strike Standard Graphics
min: 920     avg: 1836     median: 1983 (2%)     max: 2260 Points
3DMark - 3DMark Ice Storm Graphics
min: 85405     avg: 107151     median: 110302 (13%)     max: 122594 Points
3DMark 11 - 3DM11 Performance Score
min: 1548     avg: 2942     median: 3180.5 (4%)     max: 3349 Points
3DMark 11 - 3DM11 Performance GPU
min: 1365     avg: 2707     median: 2894 (2%)     max: 3081 Points
3DMark Vantage
3DM Vant. Perf. total + Intel Iris Plus Graphics 655
3DMark Vantage - 3DM Vant. Perf. total
min: 12093     avg: 12287     median: 12287 (4%)     max: 12481 Points
3DM Vant. Perf. GPU no PhysX + Intel Iris Plus Graphics 655
3DMark Vantage - 3DM Vant. Perf. GPU no PhysX
min: 10337     avg: 10514     median: 10513.5 (6%)     max: 10690 Points
3DMark 05 - 3DMark 05 - Standard
22740 Points (25%)
3DMark 06 3DMark 06 - Standard 1280x1024 + Intel Iris Plus Graphics 655
3DMark 06
min: 17176     avg: 17885     median: 17885 (24%)     max: 18594 Points
Unigine Valley 1.0 - Unigine Valley 1.0 DX
8.2 fps (3%)
SPECviewperf 12
specvp12 sw-03 + Intel Iris Plus Graphics 655
SPECviewperf 12 - specvp12 sw-03
28.2 fps (7%)
specvp12 snx-02 + Intel Iris Plus Graphics 655
SPECviewperf 12 - specvp12 snx-02
2.1 fps (0%)
specvp12 showcase-01 + Intel Iris Plus Graphics 655
SPECviewperf 12 - specvp12 showcase-01
10.3 fps (2%)
specvp12 mediacal-01 + Intel Iris Plus Graphics 655
SPECviewperf 12 - specvp12 mediacal-01
4.6 fps (1%)
specvp12 maya-04 + Intel Iris Plus Graphics 655
SPECviewperf 12 - specvp12 maya-04
20.4 fps (6%)
specvp12 energy-01 + Intel Iris Plus Graphics 655
SPECviewperf 12 - specvp12 energy-01
0.3 fps (0%)
specvp12 creo-01 + Intel Iris Plus Graphics 655
SPECviewperf 12 - specvp12 creo-01
14.9 fps (6%)
specvp12 catia-04 + Intel Iris Plus Graphics 655
SPECviewperf 12 - specvp12 catia-04
18.8 fps (3%)
specvp12 3dsmax-05 + Intel Iris Plus Graphics 655
SPECviewperf 12 - specvp12 3dsmax-05
18.1 fps (3%)
SPECviewperf 13 specvp13 sw-04 + Intel Iris Plus Graphics 655
SPECviewperf 13 - specvp13 sw-04
34.6 fps (9%)
specvp13 snx-03 + Intel Iris Plus Graphics 655
SPECviewperf 13 - specvp13 snx-03
3.8 fps (0%)
specvp13 showcase-02 + Intel Iris Plus Graphics 655
SPECviewperf 13 - specvp13 showcase-02
10.3 fps (2%)
specvp13 medical-02 + Intel Iris Plus Graphics 655
SPECviewperf 13 - specvp13 medical-02
3.8 fps (1%)
specvp13 maya-05 + Intel Iris Plus Graphics 655
SPECviewperf 13 - specvp13 maya-05
25.9 fps (3%)
specvp13 energy-02 + Intel Iris Plus Graphics 655
SPECviewperf 13 - specvp13 energy-02
1.1 fps (0%)
specvp13 creo-02 + Intel Iris Plus Graphics 655
SPECviewperf 13 - specvp13 creo-02
19.6 fps (3%)
specvp13 catia-05 + Intel Iris Plus Graphics 655
SPECviewperf 13 - specvp13 catia-05
26.4 fps (3%)
specvp13 3dsmax-06 + Intel Iris Plus Graphics 655
SPECviewperf 13 - specvp13 3dsmax-06
18.2 fps (3%)
SPECviewperf 2020 specvp2020 solidworks-05 4k + Intel Iris Plus Graphics 655
SPECviewperf 2020 - specvp2020 solidworks-05 4k
21.2 fps (6%)
specvp2020 snx-04 4k + Intel Iris Plus Graphics 655
SPECviewperf 2020 - specvp2020 snx-04 4k
3.8 fps (0%)
specvp2020 medical-03 4k + Intel Iris Plus Graphics 655
SPECviewperf 2020 - specvp2020 medical-03 4k
1.8 fps (2%)
specvp2020 maya-06 4k + Intel Iris Plus Graphics 655
SPECviewperf 2020 - specvp2020 maya-06 4k
32.7 fps (5%)
specvp2020 energy-03 4k + Intel Iris Plus Graphics 655
SPECviewperf 2020 - specvp2020 energy-03 4k
1.1 fps (0%)
specvp2020 creo-03 4k + Intel Iris Plus Graphics 655
SPECviewperf 2020 - specvp2020 creo-03 4k
12.1 fps (6%)
specvp2020 catia-06 4k + Intel Iris Plus Graphics 655
SPECviewperf 2020 - specvp2020 catia-06 4k
6.3 fps (4%)
specvp2020 3dsmax-07 4k + Intel Iris Plus Graphics 655
SPECviewperf 2020 - specvp2020 3dsmax-07 4k
8.4 fps (3%)
Cinebench R10 Cinebench R10 Shading (32bit) + Intel Iris Plus Graphics 655
Cinebench R10 - Cinebench R10 Shading (32bit)
min: 7836     avg: 9544     median: 10263 (7%)     max: 10533 Points
Cinebench R11.5 Cinebench R11.5 OpenGL 64 Bit + Intel Iris Plus Graphics 655
Cinebench R11.5 - Cinebench R11.5 OpenGL 64 Bit
min: 50.25     avg: 51.4     median: 51.6 (18%)     max: 52.2 fps
Cinebench R15
Cinebench R15 OpenGL 64 Bit + Intel Iris Plus Graphics 655
Cinebench R15 - Cinebench R15 OpenGL 64 Bit
min: 33.91     avg: 67     median: 74 (4%)     max: 88 fps
Cinebench R15 OpenGL Ref. Match 64 Bit + Intel Iris Plus Graphics 655
Cinebench R15 - Cinebench R15 OpenGL Ref. Match 64 Bit
min: 97.8     avg: 98.1     median: 97.8 (98%)     max: 99.3 %
GFXBench 3.1 - GFXBench Manhattan ES 3.1 Offscreen
min: 43.1     avg: 2387     median: 2387.1 (50%)     max: 4731 fps
GFXBench 3.0 - GFXBench 3.0 Manhattan Offscreen
199.6 fps (12%)
GFXBench (DX / GLBenchmark) 2.7
GFXBench T-Rex HD Offscreen C24Z16 + Intel Iris Plus Graphics 655
GFXBench (DX / GLBenchmark) 2.7 - GFXBench T-Rex HD Offscreen C24Z16
min: 199.6     avg: 6375     median: 6375.3 (51%)     max: 12551 fps
LuxMark v2.0 64Bit - LuxMark v2.0 Room GPU
min: 359     avg: 419.5     median: 419.5 (2%)     max: 480 Samples/s
LuxMark v2.0 64Bit - LuxMark v2.0 Sala GPU
min: 882     avg: 1038     median: 1038 (2%)     max: 1194 Samples/s
ComputeMark v2.1 - ComputeMark v2.1 Result
min: 1584     avg: 1713     median: 1712.5 (2%)     max: 1841 Points
Power Consumption - Furmark Stress Test Power Consumption - external Monitor *
min: 28.9     avg: 37.4     median: 39.2 (6%)     max: 42.4 Watt
Power Consumption - The Witcher 3 Power Consumption - external Monitor *
min: 35.3     avg: 40.6     median: 39.4 (6%)     max: 47.2 Watt
Power Consumption - Witcher 3 Power Consumption *
min: 39.4     avg: 43.3     median: 43.3 (10%)     max: 47.2 Watt
Power Consumption - Witcher 3 ultra Power Efficiency
0.1 fps per Watt (14%)
Power Consumption - Witcher 3 ultra Power Efficiency - external Monitor
0.2 fps per Watt (13%)
Emissions Witcher 3 Fan Noise + Intel Iris Plus Graphics 655
Emissions - Witcher 3 Fan Noise
min: 32.5     avg: 36.2     median: 37.2 (60%)     max: 39 dB(A)
Clock Speed - GPU Clock Witcher 3 ultra
998 MHz (39%)

Average Benchmarks Intel Iris Plus Graphics 655 → 100% n=3

Average Benchmarks Intel HD Graphics P630 → 62% n=3

- Range of benchmark values for this graphics card
- Average benchmark values for this graphics card
* Smaller numbers mean a higher performance
1 This benchmark is not used for the average calculation

Game Benchmarks

The following benchmarks stem from our benchmarks of review laptops. The performance depends on the used graphics memory, clock rate, processor, system settings, drivers, and operating systems. So the results don't have to be representative for all laptops with this GPU. For detailed information on the benchmark results, click on the fps number.

F1 2021

F1 2021

2021
low 1280x720
100%
Iris Plus Graphics 655:
44.6  fps
med. 1920x1080
100%
Iris Plus Graphics 655:
21.6  fps
high 1920x1080
100%
Iris Plus Graphics 655:
16.4  fps
ultra 1920x1080
100%
Iris Plus Graphics 655:
10.2  fps
F1 2020

F1 2020

2020
low 1280x720
100%
Iris Plus Graphics 655:
40.7  fps
med. 1920x1080
100%
Iris Plus Graphics 655:
19.1  fps
high 1920x1080
100%
Iris Plus Graphics 655:
14.5  fps
ultra 1920x1080
100%
Iris Plus Graphics 655:
9.6  fps
low 1280x720
100%
Iris Plus Graphics 655:
54.8  fps
med. 1920x1080
100%
Iris Plus Graphics 655:
17.3  fps
high 1920x1080
100%
Iris Plus Graphics 655:
11.6  fps
low 1280x720
Iris Plus Graphics 655:
0 (!)  fps
low 1280x720
100%
Iris Plus Graphics 655:
29.1  fps
med. 1920x1080
100%
Iris Plus Graphics 655:
16.2  fps
high 1920x1080
100%
Iris Plus Graphics 655:
14.1  fps
ultra 1920x1080
100%
Iris Plus Graphics 655:
6.6  fps
high 1920x1080
100%
Iris Plus Graphics 655:
59.8  fps
4K 3840x2160
100%
Iris Plus Graphics 655:
27.2  fps
low 1280x720
100%
Iris Plus Graphics 655:
15.8  fps
low 1280x720
Iris Plus Graphics 655:
0 (!)  fps
GRID 2019

GRID 2019

2019
low 1280x720
100%
Iris Plus Graphics 655:
36.3 (!)  fps
med. 1920x1080
100%
Iris Plus Graphics 655:
20.9 (!)  fps
low 1280x720
Iris Plus Graphics 655:
0 (!)  fps
FIFA 20

FIFA 20

2019
low 1280x720
100%
Iris Plus Graphics 655:
92  fps
med. 1920x1080
100%
Iris Plus Graphics 655:
55.9  fps
high 1920x1080
100%
Iris Plus Graphics 655:
46.3  fps
ultra 1920x1080
100%
Iris Plus Graphics 655:
34.9  fps
QHD 2560x1440
100%
Iris Plus Graphics 655:
26.5  fps
4K 3840x2160
100%
Iris Plus Graphics 655:
13.6  fps
low 1280x720
100%
Iris Plus Graphics 655:
22.5 23.5 ~ 23 fps
med. 1920x1080
100%
Iris Plus Graphics 655:
10.2 10.4 ~ 10 fps
high 1920x1080
100%
Iris Plus Graphics 655:
6.4 6.7 ~ 7 fps
Control

Control

2019
low 1280x720
100%
Iris Plus Graphics 655:
25.4 (!)  fps
F1 2019

F1 2019

2019
low 1280x720
100%
Iris Plus Graphics 655:
51.2  fps
med. 1920x1080
100%
Iris Plus Graphics 655:
21.9  fps
high 1920x1080
100%
Iris Plus Graphics 655:
19.3  fps
low 1280x720
100%
Iris Plus Graphics 655:
56.7  fps
med. 1920x1080
100%
Iris Plus Graphics 655:
18.5  fps
high 1920x1080
100%
Iris Plus Graphics 655:
10.5  fps
Rage 2

Rage 2

2019
low 1280x720
100%
Iris Plus Graphics 655:
24.5  fps
Anno 1800

Anno 1800

2019
low 1280x720
100%
Iris Plus Graphics 655:
30.2  fps
low 1280x720
100%
Iris Plus Graphics 655:
35  fps
low 1280x720
100%
Iris Plus Graphics 655:
64  fps
med. 1920x1080
100%
Iris Plus Graphics 655:
22.8  fps
Anthem

Anthem

2019
low 1280x720
100%
Iris Plus Graphics 655:
16.6  fps
low 1280x720
100%
Iris Plus Graphics 655:
21 22 ~ 22 fps
med. 1920x1080
100%
Iris Plus Graphics 655:
11 11 ~ 11 fps
high 1920x1080
100%
Iris Plus Graphics 655:
10  fps
ultra 1920x1080
100%
Iris Plus Graphics 655:
9  fps
low 1280x720
100%
Iris Plus Graphics 655:
18.3 20.1 ~ 19 fps
med. 1920x1080
100%
Iris Plus Graphics 655:
10.1  fps
high 1920x1080
100%
Iris Plus Graphics 655:
7.4  fps
low 1280x720
100%
Iris Plus Graphics 655:
19.9  fps
low 1280x720
Iris Plus Graphics 655:
0 (!)  fps
low 1280x720
100%
Iris Plus Graphics 655:
13 18 ~ 16 fps
low 1280x720
100%
Iris Plus Graphics 655:
25  fps
med. 1920x1080
Iris Plus Graphics 655:
0 (!)  fps
FIFA 19

FIFA 19

2018
low 1280x720
100%
Iris Plus Graphics 655:
82  fps
med. 1920x1080
100%
Iris Plus Graphics 655:
45.8  fps
high 1920x1080
100%
Iris Plus Graphics 655:
40.3  fps
ultra 1920x1080
100%
Iris Plus Graphics 655:
36.7  fps
low 1280x720
100%
Iris Plus Graphics 655:
19 20.5 22 23.5 ~ 21 fps
med. 1920x1080
100%
Iris Plus Graphics 655:
11 13 ~ 12 fps
high 1920x1080
100%
Iris Plus Graphics 655:
8 10.1 ~ 9 fps
Strange Brigade

Strange Brigade

2018
low 1280x720
100%
Iris Plus Graphics 655:
41.4  fps
med. 1920x1080
100%
Iris Plus Graphics 655:
17.6  fps
high 1920x1080
100%
Iris Plus Graphics 655:
16.9  fps
ultra 1920x1080
100%
Iris Plus Graphics 655:
14.5  fps
F1 2018

F1 2018

2018
low 1280x720
100%
Iris Plus Graphics 655:
45  fps
med. 1920x1080
100%
Iris Plus Graphics 655:
23  fps
high 1920x1080
100%
Iris Plus Graphics 655:
17  fps
ultra 1920x1080
100%
Iris Plus Graphics 655:
12 12 ~ 12 fps
low 1280x720
100%
Iris Plus Graphics 655:
30.9  fps
Far Cry 5

Far Cry 5

2018
low 1280x720
100%
Iris Plus Graphics 655:
20 22 23 ~ 22 fps
med. 1920x1080
100%
Iris Plus Graphics 655:
10 11 11 ~ 11 fps
high 1920x1080
100%
Iris Plus Graphics 655:
10  fps
ultra 1920x1080
100%
Iris Plus Graphics 655:
9  fps
World of Tanks enCore

World of Tanks enCore

2018
low 1366x768
100%
Iris Plus Graphics 655:
15.7 250 ~ 133 fps
med. 1920x1080
100%
Iris Plus Graphics 655:
40.3  fps
low 1280x720
100%
Iris Plus Graphics 655:
13.8 21.2 22.4 25.3 26.8 32.6 42.8 ~ 26 fps
med. 1920x1080
100%
Iris Plus Graphics 655:
9.8 15 15.3 18 18.4 23.3 29.5 ~ 18 fps
high 1920x1080
100%
Iris Plus Graphics 655:
8.6 12.3 13.4 15.9 16 19.8 25.1 ~ 16 fps
low 1280x720
100%
Iris Plus Graphics 655:
9.1 14.7 15.6 16.6 16.9 17 17.3 18.1 ~ 16 fps
med. 1920x1080
100%
Iris Plus Graphics 655:
7.9 8.8 9.1 9.7 ~ 9 fps
high 1920x1080
100%
Iris Plus Graphics 655:
5.3 6 6.1 6.6 ~ 6 fps
Fortnite

Fortnite

2018
low 1280x720
100%
Iris Plus Graphics 655:
51.5  fps
med. 1920x1080
100%
Iris Plus Graphics 655:
21.6  fps
low 1280x720
100%
Iris Plus Graphics 655:
13  fps
low 1280x720
100%
Iris Plus Graphics 655:
30  fps
med. 1920x1080
100%
Iris Plus Graphics 655:
18  fps
high 1920x1080
100%
Iris Plus Graphics 655:
14  fps
ultra 1920x1080
100%
Iris Plus Graphics 655:
9  fps
low 1280x720
100%
Iris Plus Graphics 655:
128  fps
med. 1366x768
100%
Iris Plus Graphics 655:
125  fps
high 1920x1080
100%
Iris Plus Graphics 655:
113  fps
ultra 1920x1080
100%
Iris Plus Graphics 655:
57.8  fps
4K 3820x2160
100%
Iris Plus Graphics 655:
34.4  fps
low 1280x720
100%
Iris Plus Graphics 655:
78 97 133.3 ~ 103 fps
med. 1920x1080
100%
Iris Plus Graphics 655:
40.6 46 59.1 ~ 49 fps
high 1920x1080
100%
Iris Plus Graphics 655:
32.7 36 38.8 ~ 36 fps
low 1280x720
100%
Iris Plus Graphics 655:
20.4 22.7 ~ 22 fps
med. 1920x1080
100%
Iris Plus Graphics 655:
10.2  fps
For Honor

For Honor

2017
low 1280x720
100%
Iris Plus Graphics 655:
0 (!) 41.3 ~ 21 fps
med. 1920x1080
100%
Iris Plus Graphics 655:
16.1  fps
low 1280x720
100%
Iris Plus Graphics 655:
28.7  fps
med. 1366x768
100%
Iris Plus Graphics 655:
21.1  fps
Overwatch

Overwatch

2016
low 1280x720
100%
Iris Plus Graphics 655:
91  fps
med. 1366x768
100%
Iris Plus Graphics 655:
68  fps
high 1920x1080
100%
Iris Plus Graphics 655:
29.9  fps
ultra 1920x1080
100%
Iris Plus Graphics 655:
18.2  fps
low 1280x768
100%
Iris Plus Graphics 655:
19.4  fps
med. 1920x1080
100%
Iris Plus Graphics 655:
11.3  fps
high 1920x1080
100%
Iris Plus Graphics 655:
10.5  fps
low 1280x720
100%
Iris Plus Graphics 655:
34.2  fps
med. 1366x768
100%
Iris Plus Graphics 655:
21.2  fps
low 1024x768
100%
Iris Plus Graphics 655:
25.9 39.2 ~ 33 fps
med. 1366x768
100%
Iris Plus Graphics 655:
17.6 22.3 ~ 20 fps
high 1920x1080
100%
Iris Plus Graphics 655:
10.8  fps
ultra 1920x1080
100%
Iris Plus Graphics 655:
8.9  fps
low 1024x768
100%
Iris Plus Graphics 655:
75.8  fps
med. 1366x768
Iris Plus Graphics 655:
0 (!)  fps
low 1280x720
100%
Iris Plus Graphics 655:
51.4 84 86.8 87.9 92.6 94.4 95 98 ~ 86 fps
med. 1366x768
100%
Iris Plus Graphics 655:
34.6 37.1 57 63 64 66 68 77.9 ~ 58 fps
high 1920x1080
100%
Iris Plus Graphics 655:
15.8 25.3 27.8 31.9 32.4 33.3 34.5 34.7 ~ 29 fps
ultra 1920x1080
100%
Iris Plus Graphics 655:
13.4 22.7 24.5 27.7 28.1 28.1 29.9 30.4 ~ 26 fps
4K 3840x2160
100%
Iris Plus Graphics 655:
11.6 12.2 ~ 12 fps
low 1024x768
100%
Iris Plus Graphics 655:
23.2 24.7 27.4 27.9 ~ 26 fps
med. 1366x768
100%
Iris Plus Graphics 655:
14.6 17.8 ~ 16 fps
high 1920x1080
100%
Iris Plus Graphics 655:
10.1 10.9 ~ 11 fps
ultra 1920x1080
100%
Iris Plus Graphics 655:
5.6 5.6 ~ 6 fps
GTA V

GTA V

2015
low 1024x768
100%
Iris Plus Graphics 655:
57 61 68 ~ 62 fps
med. 1366x768
100%
Iris Plus Graphics 655:
51.2 51.8 62.1 ~ 55 fps
high 1920x1080
100%
Iris Plus Graphics 655:
13.7 14.3 15.8 ~ 15 fps
ultra 1920x1080
100%
Iris Plus Graphics 655:
5.2 5.5 6.2 ~ 6 fps
QHD 2560x1440
100%
Iris Plus Graphics 655:
4.2  fps
low 1280x720
100%
Iris Plus Graphics 655:
78.4 116.6 ~ 98 fps
med. 1366x768
100%
Iris Plus Graphics 655:
54.3 64.8 ~ 60 fps
high 1366x768
100%
Iris Plus Graphics 655:
49.4 55 ~ 52 fps
ultra 1920x1080
100%
Iris Plus Graphics 655:
15.5 17 ~ 16 fps
high 1366x768
100%
Iris Plus Graphics 655:
93.7  fps
ultra 1920x1080
100%
Iris Plus Graphics 655:
49.6  fps
4K 3820x2160
100%
Iris Plus Graphics 655:
12.4  fps

Average Gaming Intel Iris Plus Graphics 655 → 100%

Average Gaming 30-70 fps → 100%

Intel Iris Plus Graphics 655lowmed.highultraQHD4K
F1 202144.621.616.410.2
F1 202040.719.114.59.64
Gears Tactics54.817.311.6
Doom Eternal
Escape from Tarkov29.116.214.16.59
Hearthstone59.827.2
Red Dead Redemption 215.8
Call of Duty Modern Warfare 2019
GRID 201936.320.9
Ghost Recon Breakpoint
FIFA 209255.946.334.926.513.6
Borderlands 323107
Control25.4
F1 201951.221.919.3
Total War: Three Kingdoms56.718.510.5
Rage 224.5
Anno 180030.2
The Division 235
Dirt Rally 2.06422.8
Anthem16.6
Far Cry New Dawn2211109
Metro Exodus1910.17.41
Battlefield V19.9
Call of Duty Black Ops 4
Assassin´s Creed Odyssey16
Forza Horizon 425
FIFA 198245.840.336.7
Shadow of the Tomb Raider21129
Strange Brigade41.417.616.914.5
F1 201845231712
The Crew 230.9
Far Cry 52211109
World of Tanks enCore13340.3
X-Plane 11.11261816
Final Fantasy XV Benchmark1696
Fortnite51.521.6
Assassin´s Creed Origins13
Middle-earth: Shadow of War3018149
Team Fortress 212812511357.834.4
Rocket League1034936
Ghost Recon Wildlands2210.2
For Honor2116.1
Deus Ex Mankind Divided28.721.1
Overwatch916829.918.2
Ashes of the Singularity19.411.310.5
The Division34.221.2
Rise of the Tomb Raider332010.88.9
Rainbow Six Siege75.8
Dota 2 Reborn8658292612
The Witcher 32616116
GTA V62551564.17
BioShock Infinite98605216
Counter-Strike: GO93.749.612.4
< 30 fps
< 60 fps
< 120 fps
≥ 120 fps
21
15
9
2
26
6
2
1
22
5
2
14
4

2


4
1

For more games that might be playable and a list of all games and graphics cards visit our Gaming List

Add one or more devices and compare

In the following list you can select (and also search for) devices that should be added to the comparison. You can select more than one device.

restrict list:

show all (including archived), 2024, 2023
v1.26
log 28. 20:56:53

#0 checking url part for id 8828 +0s ... 0s

#1 checking url part for id 7657 +0s ... 0s

#2 not redirecting to Ajax server +0s ... 0s

#3 did not recreate cache, as it is less than 5 days old! Created at Thu, 28 Mar 2024 05:37:00 +0100 +0.001s ... 0.001s

#4 composed specs +0.087s ... 0.088s

#5 did output specs +0s ... 0.088s

#6 start showIntegratedCPUs +0s ... 0.088s

#7 getting avg benchmarks for device 8828 +0.048s ... 0.136s

#8 got single benchmarks 8828 +0.026s ... 0.162s

#9 getting avg benchmarks for device 7657 +0.002s ... 0.163s

#10 got single benchmarks 7657 +0.005s ... 0.169s

#11 got avg benchmarks for devices +0s ... 0.169s

#12 min, max, avg, median took s +0.219s ... 0.388s

#13 before gaming benchmark output +0s ... 0.388s

#14 Got 248 rows for game benchmarks. +0.041s ... 0.429s

#15 composed SQL query for gamebenchmarks +0s ... 0.429s

#16 got data and put it in $dataArray +0.042s ... 0.472s

#17 benchmarks composed for output. +0.126s ... 0.598s

#18 calculated avg scores. +0s ... 0.598s

#19 return log +0.066s ... 0.664s

Please share our article, every link counts!
> Expert Reviews and News on Laptops, Smartphones and Tech Innovations > Benchmarks / Tech > Graphics Card Comparison - Head 2 Head
Redaktion, 2017-09- 8 (Update: 2023-07- 1)