


Verdict - Great display, great multimedia laptop
The new MacBook Pro 14 with OLED is a great multimedia laptop and the obvious highlight is the new tandem OLED display. The image quality is simply stunning and it is the best laptop display you can currently get. The touchscreen does not affect the image quality, either, so there is no drawback even if you do not use it. The screen is also more efficient than the old Mini-LED panel, which results in longer battery runtimes, especially at higher brightness levels. The PWM flickering at 240 Hz could still be an issue for sensitive users despite the DC dimming and there is no support for the Apple pen, either.
The other major change is the chassis itself, and it is more compact as well as lighter than the Mini-LED version. So far, so good, but the fans are also louder than before and chassis temperatures are pretty high. The new sound system offers more bass, but Apple did not improve the keyboard.
The other problem is also familiar, because the power supply is once again insufficient. Apple still limits the maximum power draw to 96 Watts and you can drain the battery by around 15 % per hour with full CPU load and high brightness levels in High Performance mode. While this is once again not a huge issue for the M5 Pro units, it will be more noticeable on the M5 Max units and it is a bit embarrassing that Apple did not fix this issue.
Pros
Cons
Price and Availability
The new MacBook Pro 14 with the OLED panel starts at $2899 with the base M5 Pro, 24 GB RAM and 1 TB SSD storage. Our review unit with the maximum storage options for the M5 Pro (64 GB RAM, 4 TB SSD) retails for $5599.
Table of Contents
- Verdict - Great display, great multimedia laptop
- Specifications
- Case - The glowing Apple logo is back
- Connectivity - Thunderbolt 5
- Input Devices - Touchscreen and Dynamic Island
- Display - Tandem OLED touchscreen with 120 Hz
- Performance - M5 Pro & 64 GB RAM
- Emissions
- Energy Management - Insufficient power supply
- Notebookcheck Rating
- Potential Competitors in Comparison
Apple offers a new premium version of the MacBook Pro 14, which features are slightly redesigned chassis as well as new OLED screen. it is the first MacBook with a tandem OLED panel, but also the first one with a touchscreen. The new models are still based on the M5 Pro/Max SoCs and right now, Apple offers the new OLED models in addition to the existing Mini-LED versions. We review the new 14-inch version, which has a base price of $2,899 with the small M5 Pro, 24 GB RAM and 1 TB SSD storage. Our review unit uses the standard glass, upgraded M5 Pro SoC as well as the highest memory configuration for the M5 Pro with 64 GB RAM and 4 TB SSD storage, which increases the price to $5,599. If you get the nano-texture screen, the M5 Max SoC, 128 GB RAM and 16 TB SSD storage, the price reaches an eye-watering $14,249.
Specifications
Case - The glowing Apple logo is back
Apple kept the basic design for the updated MacBook Pro 14, but the new OLED version is a bit more compact and more than 200 grams lighter than before. We have included some comparison pictures with the current MacBook Pro 14 M6 below and the smaller footprint is immediately noticeably. Apple mainly reduced the depth and the lower screen bezel is also much narrower than before. It is also slightly slimmer than before, but the shape of the base unit (does not taper off) subjectively feels thicker than it really is.


Apple also brought back the glowing Apple logo and the brightness changes depending on the panel brightness. Apple also adjusted the hinge resistance and the new setting is amazing, because there is absolutely no wobbling when you adjust the screen angle (up to 135 degrees). It wobbles slightly when you touch the screen, but it is much better compared to the Asus ProArt P14, for example. You can still open the lid with one hand.
Apple also managed to reduce the weight of the chassis by more than 200 grams, which is immediately noticeable when you lift the new model. The chassis quality and stability, however, did not change and you still get a premium device. Only the bottom panel is thinner than before, but you only notice that when you remove this panel. Our black unit still attracts fingerprints, but you can also get the silver version.


Connectivity - Thunderbolt 5
The connectivity did not change and you still get three Thunderbolt 5 ports, HDMI as well as a full-size SD-card reader. However, the transfer rates are actually a bit worse compared to the previous model and there is no SD-Express support, either. Apple's N1 chip provides Bluetooth 6 as well as Wi-Fi 7, but it is limited to 160 MHz, so transfer rates are capped at ~2 Gbps. The 12 MP webcam with center stage takes good videos, but the quality of pictures (1440 x 900 pixels) is not great and there is still no Face-ID support.


| SD Card Reader | |
| average JPG Copy Test (av. of 3 runs) | |
| Asus ProArt P14 H7407 (Angelbird AV Pro V60) | |
| Average of class Multimedia (22.3 - 567, n=40, last 2 years) | |
| Apple MacBook Pro 14 2026 M5 Max (Angelbird AV Pro V60) | |
| Apple MacBook Pro 14 M5 Pro OLED (Angelbird AV Pro V60) | |
| maximum AS SSD Seq Read Test (1GB) | |
| Asus ProArt P14 H7407 (Angelbird AV Pro V60) | |
| Apple MacBook Pro 14 2026 M5 Max (Angelbird AV Pro V60) | |
| Average of class Multimedia (37.3 - 1455, n=39, last 2 years) | |
| Apple MacBook Pro 14 M5 Pro OLED (Angelbird AV Pro V60) | |
| Networking | |
| Apple MacBook Pro 14 M5 Pro OLED | |
| iperf3 transmit Wi-Fi6/7 RT-BE96U | |
| iperf3 receive Wi-Fi6/7 RT-BE96U | |
| Asus ProArt P14 H7407 | |
| iperf3 transmit Wi-Fi6/7 RT-BE96U | |
| iperf3 receive Wi-Fi6/7 RT-BE96U | |
| Apple MacBook Pro 14 2026 M5 Max | |
| iperf3 receive AXE11000 | |
| iperf3 transmit AXE11000 | |
| HP ZBook Ultra G1a 14 | |
| iperf3 receive AXE11000 6GHz | |
| iperf3 transmit AXE11000 6GHz | |
| iperf3 receive AXE11000 | |
| iperf3 transmit AXE11000 | |
| HP OmniBook Ultra 14 Core Ultra X9 | |
| iperf3 receive AXE11000 6GHz | |
| iperf3 transmit AXE11000 6GHz | |
| iperf3 receive AXE11000 | |
| iperf3 transmit AXE11000 | |
| Dell XPS 14 Core Ultra X7 358H | |
| iperf3 receive AXE11000 6GHz | |
| iperf3 transmit AXE11000 6GHz | |
| iperf3 receive AXE11000 | |
| iperf3 transmit AXE11000 | |



Maintenance
The bottom panel is secured by four Pentalobe screws (P5) and multiple clamps. Maintenance options are limited to the cleaning of the fans, because all the other components are soldered.


Input Devices - Touchscreen and Dynamic Island
As far as we can teel in a direct comparison, bit the keyboard and the trackpad are identical to the Mini-LED model. You therefore get a comfortable keyboard and a great haptic trackpad, even though we had hoped for a better keyboard. Rivals like the Asus ProArt P14 offer noticeably better keyboards, so there is definitely still room for improvement.


The new MacBook Pro OLED also supports touch inputs and it works just like any other modern capacitive touchscreen. MacOS also handles touch inputs very well, but we still think this is more of a gimmick. If you sit comfortable, your hands are usually positioned for the keyboard and the trackpad, so you have to lift your arm and maybe even bend slightly forward to reach the screen. The Apple Pencil is not supported, which is a strange decision.


The display notch is gone as well, and now we get the Dynamic Island that is already familiar from the iPhone models. The basic principle here is the same, the area next to the island is used for the menu and is sitting on top of the regular 16:10 panel. This area is blacked-out in full-screen mode, where you then get the regular 16:10 image. The new dynamic island is smaller compared the notch, but still quite pretty disturbing in our opinion and it does not really help that the size is always changing, because the island also shows setting change like the brightness/volume or you can expand the view for more information, for example during music playback.
Display - Tandem OLED touchscreen with 120 Hz


Tandem OLED panels in laptops are available since 2025 and have finally caught up with Apple's Mini-LED panel in terms of brightness, so it is no surprise that Apple now uses this technology for the MacBook Pro as well. The panel has a resolution of 3,024 x 1,986 pixels and supports Apple's ProMotion technology with 120 Hz. The subjective image quality is just amazing with crystal clear images, deep blacks, fast response times and rich colors. The touchscreen does not affect the image quality and even bright images look perfect.
In terms of brightness, the behavior is identical to the existing Mini-LED panels. The maximum SDR brightness is 600 nits when the brightness sensor is turned off. If the sensor is active, the SDR brightness can reach up to 1,025 nits in bright environments. Peak HDR brightness is 2,085 nits, so it is the brightest laptop panel we have tested so far and also beat Microsoft's new Mini-LED panel in the Surface Laptop Ultra.
| |||||||||||||||||||||||||
Brightness Distribution: 98 %
Center on Battery: 606 cd/m²
Contrast: ∞:1 (Black: 0 cd/m²)
ΔE ColorChecker Calman: 1.7 | ∀{0.5-29.43 Ø4.68}
ΔE Greyscale Calman: 3.2 | ∀{0.09-98 Ø4.93}
97.8% AdobeRGB 1998 (Argyll 3D)
98.6% sRGB (Argyll 3D)
98% Display P3 (Argyll 3D)
Gamma: 2.23
CCT: 6973 K
| Apple MacBook Pro 14 M5 Pro OLED OLED, 3092x1986, 14.2", 120 Hz | Asus ProArt P14 H7407 ATNA40LE04-0, OLED, 2880x1800, 14", 120 Hz | Apple MacBook Pro 14 2024 M4 Pro MiniLED, 3024x1964, 14.2", 120 Hz | HP ZBook Ultra G1a 14 Samsung SDC41B3, OLED, 2880x1800, 14", 120 Hz | HP OmniBook Ultra 14 Core Ultra X9 Samsung SDC4215, OLED, 2880x1800, 14", 120 Hz | Dell XPS 14 Core Ultra X7 358H LG Philips 140WT2, OLED, 2880x1800, 14", 120 Hz | |
|---|---|---|---|---|---|---|
| Display | -6% | -6% | 0% | -1% | 1% | |
| HDR Peak Brightness (cd/m²) | 2084 | 1682 -19% | 1706 -18% | |||
| Display P3 Coverage (%) | 98 | 99.9 2% | 99.6 2% | 99.7 2% | 99.9 2% | 99.7 2% |
| sRGB Coverage (%) | 98.6 | 99.9 1% | 100 1% | 100 1% | 100 1% | 100 1% |
| AdobeRGB 1998 Coverage (%) | 97.8 | 89 -9% | 89 -9% | 95.6 -2% | 92.3 -6% | 98.2 0% |
| Response Times | -146% | -15713% | -132% | -68% | -105% | |
| Response Time Grey 50% / Grey 80% * (ms) | 0.31 ? | 1.67 ? -439% | 77.2 ? -24803% | 0.94 ? -203% | 0.58 ? -87% | 0.75 ? -142% |
| Response Time Black / White * (ms) | 0.32 ? | 0.46 ? -44% | 71.6 ? -22275% | 1.01 ? -216% | 0.87 ? -172% | 1.03 ? -222% |
| PWM Frequency (Hz) | 240 ? | 960 ? | 14880 ? | 492.6 | 927.13 ? | 240.62 ? |
| PWM Amplitude * (%) | 56 | 30 46% | 90 -61% | 43 23% | 25 55% | 29 48% |
| Screen | 12% | 33% | -35% | -6% | -3% | |
| Brightness middle (cd/m²) | 606 | 697 15% | 638 5% | 384.7 -37% | 446 -26% | 393.8 -35% |
| Brightness (cd/m²) | 606 | 706 17% | 621 2% | 387 -36% | 447 -26% | 389 -36% |
| Brightness Distribution (%) | 98 | 98 0% | 95 -3% | 99 1% | 99 1% | 96 -2% |
| Black Level * (cd/m²) | 0.01 | |||||
| Colorchecker dE 2000 * | 1.7 | 1.1 35% | 0.6 65% | 3.36 -98% | 1.76 -4% | 1.27 25% |
| Colorchecker dE 2000 max. * | 3.1 | 3.8 -23% | 1.4 55% | 6.45 -108% | 3.29 -6% | 3.35 -8% |
| Greyscale dE 2000 * | 3.2 | 2.4 25% | 0.8 75% | 1 69% | 2.3 28% | 2 37% |
| Gamma | 2.23 99% | 2.18 101% | 2.22 99% | 2.26 97% | 2.25 98% | 2.19 100% |
| CCT | 6973 93% | 6503 100% | 6430 101% | 6380 102% | 6470 100% | 6379 102% |
| Contrast (:1) | 69700 | |||||
| Colorchecker dE 2000 calibrated * | 0.65 | 1.18 | 0.71 | |||
| Total Average (Program / Settings) | -47% /
-30% | -5229% /
-3613% | -56% /
-50% | -25% /
-20% | -36% /
-28% |
* ... smaller is better
We analyzed the panel with the professional CalMAN software. Apple offers multiple color profiles and the default panel is called Apple XDR Display (P3-2000 nits) or the corresponding AdobeRGB version, because the new OLED panel now also covers full AdobeRGB gamut in addition to P3. The grayscale performance is not that great and there is a slight blue cast in combination with a cool color temperature, but most users likely won't notice as long as TrueTone is active. The color accuracy is already very good though.


Apple also offers additional color profiles for Photography, and they offer excellent grayscale and color accuracy. There is one big issue, however, because Apple also used fixed brightness settings for these profiles that meet the corresponding standards and you cannot adjust the brightness manually. This is particularly problematic for the sRGB profile, where the brightness is set to just 84 nits, which is very dark. For P3 and AdobeRGB, the brightness is fixed at 167 nits.


Display Response Times
| ↔ Response Time Black to White | ||
|---|---|---|
| 0.32 ms ... rise ↗ and fall ↘ combined | ↗ 0.17 ms rise |  |
| ↘ 0.15 ms fall | ||
| The screen shows very fast response rates in our tests and should be very well suited for fast-paced gaming. In comparison, all tested devices range from 0.1 (minimum) to 240 (maximum) ms. » 0 % of all devices are better. This means that the measured response time is better than the average of all tested devices (19.6 ms). | ||
| ↔ Response Time 50% Grey to 80% Grey | ||
| 0.31 ms ... rise ↗ and fall ↘ combined | ↗ 0.12 ms rise |  |
| ↘ 0.19 ms fall | ||
| The screen shows very fast response rates in our tests and should be very well suited for fast-paced gaming. In comparison, all tested devices range from 0.13 (minimum) to 636 (maximum) ms. » 1 % of all devices are better. This means that the measured response time is better than the average of all tested devices (30.6 ms). | ||
Screen Flickering / PWM (Pulse-Width Modulation)
| Screen flickering / PWM detected | 240 Hz Amplitude: 56 % | ≤ 99 % brightness setting |  |
The display backlight flickers at 240 Hz (worst case, e.g., utilizing PWM) Flickering detected at a brightness setting of 99 % and below. There should be no flickering or PWM above this brightness setting. The frequency of 240 Hz is relatively low, so sensitive users will likely notice flickering and experience eyestrain at the stated brightness setting and below. In comparison: 52 % of all tested devices do not use PWM to dim the display. If PWM was detected, an average of 7556 (minimum: 5 - maximum: 343500) Hz was measured. | |||
The PWM behavior is interesting, because we can see DC-dimming for all brightness levels. Usually, OLED panels use DC-Dimming only at higher brightness levels. The frequency is very low at 240 Hz, however, and this might be an issue for sensitive users, despite the DC-dimming.


Our panel is the standard OLED option, but as you can see in the pictures below (which were taken in direct sunlight), reflections are actually not a huge problem and this is one of the best glossy OLED panels in this regard. We also included a comparison picture with the current nano-texture Mini-LED version on the right, where both devices are facing Windows. As the nano-texture option will probbly slightly affect the subjective image impression (we did not yet have the chance to test the new OLED model with nano-texture), we would personally get the standard version.


Performance - M5 Pro & 64 GB RAM


Testing Conditions
The MacBook Pro 14 offers three power profiles: Low Power, Auto, High Power. We performed our benchmarks in Auto mode, because High Power only has an advantage in combined CPU/GPU workloads, but the fan noise is significantly louder, so it does not make much sense most of the time.
| Power Profile | CPU TDP | CB24 Multi | GPU TGP | 3DMark Steel Nomad | Stress test package power | max. fan noise |
|---|---|---|---|---|---|---|
| Low Power | 12 Watts | 914 points | 7.5 Watts | 1134 points | 10 Watts | 24.9 dB(A) (~2400 rpm) |
| Auto | 70/50/42 Watts | 2243 points | 36 Watts | 2340 points | 85/48/39 Watts | 44.6 dB(A) (~5600 rpm) |
| High Power | 70/50 Watts | 2225 points | 36 Watts | 2325 points | 90/48-54 Watts | 55.5 dB(A) (~8700 rpm) |
Processor Performance
The M5 Pro is a well-known processor so the results are on the expected level. The larger MacBook Pro 16 with the M5 Pro is slightly faster, but the difference is not that big. However, there is some throttling and the cooling performance seemingly did not improve, but at least it is not worse, either. CPU performance is identical on battery power.
Cinebench 2024: CPU Multi Core | CPU Single Core
Cinebench 2026: CPU Multi | CPU Single Thread
Geekbench 6.7: Multi-Core | Single-Core
Geekbench 7.0: Multi-Core | Single-Core
| CPU Performance rating | |
| Apple MacBook Pro 16 2026 M5 Pro -2! | |
| Average Apple M5 Pro 18-Core | |
| Apple MacBook Pro 14 M5 Pro OLED | |
| Apple MacBook Pro 14 2026 M5 Max -2! | |
| Asus ProArt P14 H7407 -2! | |
| Average of class Multimedia | |
| HP ZBook Ultra G1a 14 -2! | |
| HP OmniBook Ultra 14 Core Ultra X9 -2! | |
| Dell XPS 14 Core Ultra X7 358H -2! | |
| Cinebench 2024 / CPU Multi Core | |
| Apple MacBook Pro 16 2026 M5 Pro | |
| Average Apple M5 Pro 18-Core (2243 - 2347, n=2) | |
| Apple MacBook Pro 14 M5 Pro OLED | |
| Apple MacBook Pro 14 2026 M5 Max | |
| Asus ProArt P14 H7407 | |
| HP ZBook Ultra G1a 14 | |
| Average of class Multimedia (327 - 2490, n=66, last 2 years) | |
| HP OmniBook Ultra 14 Core Ultra X9 | |
| Dell XPS 14 Core Ultra X7 358H | |
| Cinebench 2024 / CPU Single Core | |
| Apple MacBook Pro 16 2026 M5 Pro | |
| Apple MacBook Pro 14 2026 M5 Max | |
| Average Apple M5 Pro 18-Core (196 - 201, n=2) | |
| Apple MacBook Pro 14 M5 Pro OLED | |
| Average of class Multimedia (72.5 - 201, n=60, last 2 years) | |
| HP OmniBook Ultra 14 Core Ultra X9 | |
| Asus ProArt P14 H7407 | |
| Dell XPS 14 Core Ultra X7 358H | |
| HP ZBook Ultra G1a 14 | |
| Cinebench 2026 / CPU Multi | |
| Apple MacBook Pro 16 2026 M5 Pro | |
| Average Apple M5 Pro 18-Core (8577 - 9481, n=2) | |
| Apple MacBook Pro 14 M5 Pro OLED | |
| Apple MacBook Pro 14 2026 M5 Max | |
| HP ZBook Ultra G1a 14 | |
| Average of class Multimedia (1829 - 9481, n=26, last 2 years) | |
| HP OmniBook Ultra 14 Core Ultra X9 | |
| Dell XPS 14 Core Ultra X7 358H | |
| Cinebench 2026 / CPU Single Thread | |
| Apple MacBook Pro 14 2026 M5 Max | |
| Apple MacBook Pro 16 2026 M5 Pro | |
| Average Apple M5 Pro 18-Core (728 - 738, n=2) | |
| Apple MacBook Pro 14 M5 Pro OLED | |
| Average of class Multimedia (436 - 739, n=26, last 2 years) | |
| HP OmniBook Ultra 14 Core Ultra X9 | |
| Dell XPS 14 Core Ultra X7 358H | |
| HP ZBook Ultra G1a 14 | |
| Geekbench 6.7 / Multi-Core | |
| Apple MacBook Pro 14 2026 M5 Max | |
| Apple MacBook Pro 14 M5 Pro OLED | |
| Average Apple M5 Pro 18-Core (28436 - 29359, n=2) | |
| Apple MacBook Pro 16 2026 M5 Pro | |
| Asus ProArt P14 H7407 | |
| Dell XPS 14 Core Ultra X7 358H | |
| HP ZBook Ultra G1a 14 | |
| HP OmniBook Ultra 14 Core Ultra X9 | |
| Average of class Multimedia (4983 - 30057, n=65, last 2 years) | |
| Geekbench 6.7 / Single-Core | |
| Apple MacBook Pro 14 2026 M5 Max | |
| Apple MacBook Pro 14 M5 Pro OLED | |
| Average Apple M5 Pro 18-Core (4295 - 4300, n=2) | |
| Apple MacBook Pro 16 2026 M5 Pro | |
| Asus ProArt P14 H7407 | |
| HP OmniBook Ultra 14 Core Ultra X9 | |
| Average of class Multimedia (1591 - 4336, n=65, last 2 years) | |
| Dell XPS 14 Core Ultra X7 358H | |
| HP ZBook Ultra G1a 14 | |
| Geekbench 7.0 / Multi-Core | |
| Apple MacBook Pro 14 M5 Pro OLED | |
| Average Apple M5 Pro 18-Core (34285 - 34622, n=2) | |
| Asus ProArt P14 H7407 | |
| Average of class Multimedia (13578 - 35738, n=8, last 2 years) | |
| Geekbench 7.0 / Single-Core | |
| Apple MacBook Pro 14 M5 Pro OLED | |
| Average Apple M5 Pro 18-Core (3693 - 3745, n=2) | |
| Average of class Multimedia (2463 - 3766, n=8, last 2 years) | |
| Asus ProArt P14 H7407 | |
Cinebench R15 Multi Loop
System & SSD Performance
The subjective performance impression is excellent and the MacBook Pro is a very responsive system. Our review unit is equipped with the optional 4 TB SSD (3.95 TB free), which is the highest capacity in combination with the M5 Pro SoC. It adds $1500 to the price of the 1 TB model, but it is at least a very fast PCIe 5.0 SSD with transfer rates


CrossMark: Overall | Productivity | Creativity | Responsiveness
WebXPRT 4: Overall
WebXPRT 5: Overall
Mozilla Kraken 1.1: Total
| Performance rating | |
| Apple MacBook Pro 14 M5 Pro OLED | |
| Average Apple M5 Pro 18-Core, Apple M5 Pro 20-Core GPU | |
| Apple MacBook Pro 16 2026 M5 Pro | |
| Apple MacBook Pro 14 2026 M5 Max | |
| Average of class Multimedia | |
| HP OmniBook Ultra 14 Core Ultra X9 -1! | |
| Dell XPS 14 Core Ultra X7 358H -1! | |
| Asus ProArt P14 H7407 | |
| HP ZBook Ultra G1a 14 -1! | |
| CrossMark / Overall | |
| Apple MacBook Pro 14 M5 Pro OLED | |
| Average Apple M5 Pro 18-Core, Apple M5 Pro 20-Core GPU (2725 - 3129, n=2) | |
| Apple MacBook Pro 14 2026 M5 Max | |
| Apple MacBook Pro 16 2026 M5 Pro | |
| HP OmniBook Ultra 14 Core Ultra X9 | |
| Dell XPS 14 Core Ultra X7 358H | |
| Average of class Multimedia (866 - 3231, n=62, last 2 years) | |
| HP ZBook Ultra G1a 14 | |
| Asus ProArt P14 H7407 | |
| CrossMark / Productivity | |
| Apple MacBook Pro 14 M5 Pro OLED | |
| Average Apple M5 Pro 18-Core, Apple M5 Pro 20-Core GPU (2489 - 2618, n=2) | |
| Apple MacBook Pro 16 2026 M5 Pro | |
| Apple MacBook Pro 14 2026 M5 Max | |
| HP OmniBook Ultra 14 Core Ultra X9 | |
| Average of class Multimedia (931 - 2677, n=62, last 2 years) | |
| Dell XPS 14 Core Ultra X7 358H | |
| HP ZBook Ultra G1a 14 | |
| Asus ProArt P14 H7407 | |
| CrossMark / Creativity | |
| Apple MacBook Pro 14 M5 Pro OLED | |
| Average Apple M5 Pro 18-Core, Apple M5 Pro 20-Core GPU (3438 - 4343, n=2) | |
| Apple MacBook Pro 14 2026 M5 Max | |
| Apple MacBook Pro 16 2026 M5 Pro | |
| HP ZBook Ultra G1a 14 | |
| Dell XPS 14 Core Ultra X7 358H | |
| HP OmniBook Ultra 14 Core Ultra X9 | |
| Average of class Multimedia (907 - 4522, n=62, last 2 years) | |
| Asus ProArt P14 H7407 | |
| CrossMark / Responsiveness | |
| Apple MacBook Pro 14 M5 Pro OLED | |
| Average Apple M5 Pro 18-Core, Apple M5 Pro 20-Core GPU (1780 - 1996, n=2) | |
| HP OmniBook Ultra 14 Core Ultra X9 | |
| Apple MacBook Pro 16 2026 M5 Pro | |
| Apple MacBook Pro 14 2026 M5 Max | |
| Average of class Multimedia (605 - 2073, n=62, last 2 years) | |
| Dell XPS 14 Core Ultra X7 358H | |
| HP ZBook Ultra G1a 14 | |
| Asus ProArt P14 H7407 | |
| WebXPRT 4 / Overall | |
| Apple MacBook Pro 14 M5 Pro OLED | |
| Average Apple M5 Pro 18-Core, Apple M5 Pro 20-Core GPU (402 - 420, n=2) | |
| Apple MacBook Pro 16 2026 M5 Pro | |
| Apple MacBook Pro 14 2026 M5 Max | |
| HP OmniBook Ultra 14 Core Ultra X9 | |
| Dell XPS 14 Core Ultra X7 358H | |
| Average of class Multimedia (111 - 420, n=63, last 2 years) | |
| HP ZBook Ultra G1a 14 | |
| Asus ProArt P14 H7407 | |
| WebXPRT 5 / Overall | |
| Apple MacBook Pro 14 M5 Pro OLED | |
| Average Apple M5 Pro 18-Core, Apple M5 Pro 20-Core GPU (119 - 129, n=2) | |
| Apple MacBook Pro 16 2026 M5 Pro | |
| Apple MacBook Pro 14 2026 M5 Max | |
| Average of class Multimedia (56 - 129, n=22, last 2 years) | |
| Asus ProArt P14 H7407 | |
| Mozilla Kraken 1.1 / Total | |
| Dell XPS 14 Core Ultra X7 358H | |
| HP ZBook Ultra G1a 14 | |
| HP OmniBook Ultra 14 Core Ultra X9 | |
| Average of class Multimedia (226 - 835, n=64, last 2 years) | |
| Asus ProArt P14 H7407 | |
| Apple MacBook Pro 14 2026 M5 Max | |
| Apple MacBook Pro 16 2026 M5 Pro | |
| Average Apple M5 Pro 18-Core, Apple M5 Pro 20-Core GPU (226 - 230, n=2) | |
| Apple MacBook Pro 14 M5 Pro OLED | |
* ... smaller is better
GPU Performance
The M5 Pro GPU is a capable graphics chip and also benefits from unified memory, especially for larger video or modelling projects. The raw performance is slower than the new RTX Spark n1X and also slower compared to the GeForce RTX 5070 as well as the Radeon 8060s. You can also play games, but the selection is still very limited compared to Windows. The graphics performance is pretty stable, both under sustained workloads (Steel Nomad stress test: 95 %) and on battery power.
| 3DMark Steel Nomad Score | 2340 points | |
| 3DMark Steel Nomad Light Score | 10037 points | |
Help | ||
| Blender / v3.3 Classroom METAL | |
| Apple MacBook Pro 16 2026 M5 Pro | |
| Average of class Multimedia (17.8 - 68, n=7, last 2 years) | |
| Average Apple M5 Pro 20-Core GPU (23.8 - 36.6, n=2) | |
| Apple MacBook Pro 14 2026 M5 Max | |
| Apple MacBook Pro 14 M5 Pro OLED | |
| Blender / v3.3 Classroom CUDA | |
| Average of class Multimedia (20 - 186, n=21, last 2 years) | |
| Asus ProArt P14 H7407 | |
| Blender / v3.3 Classroom CPU | |
| Average of class Multimedia (133 - 1042, n=63, last 2 years) | |
| Asus ProArt P14 H7407 | |
| Dell XPS 14 Core Ultra X7 358H | |
| HP OmniBook Ultra 14 Core Ultra X9 | |
| HP ZBook Ultra G1a 14 | |
| Apple MacBook Pro 14 2026 M5 Max | |
| Apple MacBook Pro 14 M5 Pro OLED | |
| Average Apple M5 Pro 20-Core GPU (134.5 - 147, n=2) | |
| Apple MacBook Pro 16 2026 M5 Pro | |
| Blender / v3.3 Classroom oneAPI/Intel | |
| Average of class Multimedia (105 - 492, n=16, last 2 years) | |
| Dell XPS 14 Core Ultra X7 358H | |
| HP OmniBook Ultra 14 Core Ultra X9 | |
* ... smaller is better
| low | med. | high | ultra | QHD | |
|---|---|---|---|---|---|
| Shadow of the Tomb Raider (2018) | 117 | 103 | 75 | ||
| Baldur's Gate 3 (2023) | 119 | 94.2 | 75.3 | 74.8 | 55.1 |
| Cyberpunk 2077 (2023) | 103 | 81.7 | 67.8 | 59.1 | 34.2 |
| Total War Pharaoh (2023) | 54 | 53.7 | |||
| Assassin's Creed Shadows (2025) | 52 | 47 | 42 | 28 | 23 |
Emissions
System Noise
The lighter chassis design does affect the fan noise and the new OLED model is louder than before. Don't get us wrong, the MBP 14 is still a very quiet device in everyday situations and the first fan level at 2400 rpm is barely audible at all. If you stress the system in Auto mode, the fans now spin at ~5600 rpm and 44 dB(A), while the speed was lower on the Mini-LED model at ~5100 rpm and 41 dB(A). In High Performance mode, the new model is also louder at ~8700 rpm and 55 dB(A) vs. ~7500 rpm and 51 dB(A) on the Mini-LED model.
Noise level
| Idle |
| 24.2 / 24.2 / 24.2 dB(A) |
| Load |
| 27.5 / 44.6 dB(A) |
 | ||
30 dB silent 40 dB(A) audible 50 dB(A) loud |
||
min:  , med:  , max:  Earthworks M23R, Arta (15 cm distance) environment noise: 24.2 dB(A) | ||
| Apple MacBook Pro 14 M5 Pro OLED M5 Pro 18-Core, M5 Pro 20-Core GPU | Asus ProArt P14 H7407 Spark RTX N1X 20-Core, RTX Spark N1X 6144-Core Blackwell GPU | Apple MacBook Pro 14 2026 M5 Max M5 Max, M5 Max 40-Core GPU | HP ZBook Ultra G1a 14 Ryzen AI Max+ PRO 395, Radeon 8060S | HP OmniBook Ultra 14 Core Ultra X9 Ultra X9 388H, Arc B390 Panther Lake iGPU | Dell XPS 14 Core Ultra X7 358H Ultra X7 358H, Arc B390 Panther Lake iGPU | |
|---|---|---|---|---|---|---|
| Noise | -12% | -6% | -12% | -6% | -1% | |
| off / environment * (dB) | 24.2 | 24.5 -1% | 23.1 5% | 23.9 1% | 23.3 4% | 22.9 5% |
| Idle Minimum * (dB) | 24.2 | 24.5 -1% | 23.1 5% | 23.9 1% | 23.3 4% | 23.3 4% |
| Idle Average * (dB) | 24.2 | 24.5 -1% | 23.1 5% | 23.9 1% | 23.3 4% | 23.3 4% |
| Idle Maximum * (dB) | 24.2 | 24.5 -1% | 23.1 5% | 26.8 -11% | 23.3 4% | 23.3 4% |
| Load Average * (dB) | 27.5 | 36 -31% | 36.8 -34% | 42.2 -53% | 42.9 -56% | 34 -24% |
| Cyberpunk 2077 ultra * (dB) | 44.6 | 54.9 -23% | 47.8 -7% | 49.1 -10% | 44.4 -0% | 43.5 2% |
| Load Maximum * (dB) | 44.6 | 54.9 -23% | 53.2 -19% | 49.2 -10% | 44.1 1% | 45.7 -2% |
* ... smaller is better
Temperature
While the surfaces stay comfortably cool during light workloads, the metal chassis gets pretty warm under load. The whole device warms up noticeably and skin contact can be uncomfortable. The keyboard section also warms up to 45 °C, but typing is still possible. During the stress test, the SoC consumes around 39 Watts in Auto mode and fluctuates between 48-54 Watts in High Performance mode.
(-) The maximum temperature on the upper side is 49.4 °C / 121 F, compared to the average of 36.8 °C / 98 F, ranging from 21 to 71 °C for the class Multimedia.
(-) The bottom heats up to a maximum of 47.8 °C / 118 F, compared to the average of 39.1 °C / 102 F
(+) In idle usage, the average temperature for the upper side is 25.4 °C / 78 F, compared to the device average of 31.3 °C / 88 F.
(-) 3: The average temperature for the upper side is 39.7 °C / 103 F, compared to the average of 31.3 °C / 88 F for the class Multimedia.
(+) The palmrests and touchpad are reaching skin temperature as a maximum (34.7 °C / 94.5 F) and are therefore not hot.
(-) The average temperature of the palmrest area of similar devices was 28.7 °C / 83.7 F (-6 °C / -10.8 F).


| Apple MacBook Pro 14 M5 Pro OLED M5 Pro 18-Core, M5 Pro 20-Core GPU | Asus ProArt P14 H7407 Spark RTX N1X 20-Core, RTX Spark N1X 6144-Core Blackwell GPU | Apple MacBook Pro 14 2026 M5 Max M5 Max, M5 Max 40-Core GPU | HP ZBook Ultra G1a 14 Ryzen AI Max+ PRO 395, Radeon 8060S | HP OmniBook Ultra 14 Core Ultra X9 Ultra X9 388H, Arc B390 Panther Lake iGPU | Dell XPS 14 Core Ultra X7 358H Ultra X7 358H, Arc B390 Panther Lake iGPU | |
|---|---|---|---|---|---|---|
| Heat | 3% | 10% | -6% | 12% | 14% | |
| Maximum Upper Side * (°C) | 49.4 | 39.3 20% | 47 5% | 41.4 16% | 40.2 19% | 34 31% |
| Maximum Bottom * (°C) | 47.8 | 42.7 11% | 40.5 15% | 36.6 23% | 44.2 8% | 35.8 25% |
| Idle Upper Side * (°C) | 25.7 | 28.3 -10% | 23.3 9% | 34 -32% | 22.8 11% | 25.6 -0% |
| Idle Bottom * (°C) | 26.1 | 28.8 -10% | 23.4 10% | 33.6 -29% | 23.4 10% | 26.4 -1% |
* ... smaller is better
Speakers
Apple uses a new sound system and our analysis shows improved bass performance, which is also noticeable while watching movies or listening to music. Overall, this is once again one of the best sound systems on the market.
Apple MacBook Pro 14 M5 Pro OLED audio analysis
(+) | speakers can play relatively loud (85.6 dB)
Bass 100 - 315 Hz
(+) | good bass - only 3.4% away from median
(+) | bass is linear (5.9% delta to prev. frequency)
Mids 400 - 2000 Hz
(+) | balanced mids - only 1.6% away from median
(+) | mids are linear (2.4% delta to prev. frequency)
Highs 2 - 16 kHz
(+) | balanced highs - only 3.6% away from median
(+) | highs are linear (3.1% delta to prev. frequency)
Overall 100 - 16.000 Hz
(+) | overall sound is linear (6.2% difference to median)
Compared to same class
» 3% of all tested devices in this class were better, 1% similar, 96% worse
» The best had a delta of 5%, average was 17%, worst was 45%
Compared to all devices tested
» 0% of all tested devices were better, 0% similar, 99% worse
» The best had a delta of 4%, average was 23%, worst was 136%
Asus ProArt P14 H7407 audio analysis
(+) | speakers can play relatively loud (87.5 dB)
Bass 100 - 315 Hz
(+) | good bass - only 4.9% away from median
(±) | linearity of bass is average (7.2% delta to prev. frequency)
Mids 400 - 2000 Hz
(+) | balanced mids - only 2.5% away from median
(+) | mids are linear (3.5% delta to prev. frequency)
Highs 2 - 16 kHz
(+) | balanced highs - only 2.3% away from median
(+) | highs are linear (3% delta to prev. frequency)
Overall 100 - 16.000 Hz
(+) | overall sound is linear (6.2% difference to median)
Compared to same class
» 3% of all tested devices in this class were better, 1% similar, 96% worse
» The best had a delta of 5%, average was 17%, worst was 45%
Compared to all devices tested
» 0% of all tested devices were better, 0% similar, 99% worse
» The best had a delta of 4%, average was 23%, worst was 136%
Apple MacBook Pro 14 2026 M5 Max audio analysis
(+) | speakers can play relatively loud (83.1 dB)
Bass 100 - 315 Hz
(+) | good bass - only 4.5% away from median
(±) | linearity of bass is average (7.1% delta to prev. frequency)
Mids 400 - 2000 Hz
(+) | balanced mids - only 1.3% away from median
(+) | mids are linear (2.5% delta to prev. frequency)
Highs 2 - 16 kHz
(+) | balanced highs - only 3.3% away from median
(+) | highs are linear (3.7% delta to prev. frequency)
Overall 100 - 16.000 Hz
(+) | overall sound is linear (6.5% difference to median)
Compared to same class
» 4% of all tested devices in this class were better, 1% similar, 94% worse
» The best had a delta of 5%, average was 17%, worst was 45%
Compared to all devices tested
» 1% of all tested devices were better, 0% similar, 99% worse
» The best had a delta of 4%, average was 23%, worst was 136%
HP ZBook Ultra G1a 14 audio analysis
(+) | speakers can play relatively loud (88.7 dB)
Bass 100 - 315 Hz
(±) | reduced bass - on average 11.8% lower than median
(±) | linearity of bass is average (11% delta to prev. frequency)
Mids 400 - 2000 Hz
(+) | balanced mids - only 4.5% away from median
(+) | mids are linear (3.4% delta to prev. frequency)
Highs 2 - 16 kHz
(+) | balanced highs - only 3.4% away from median
(+) | highs are linear (4.3% delta to prev. frequency)
Overall 100 - 16.000 Hz
(+) | overall sound is linear (10.4% difference to median)
Compared to same class
» 7% of all tested devices in this class were better, 6% similar, 88% worse
» The best had a delta of 7%, average was 17%, worst was 35%
Compared to all devices tested
» 6% of all tested devices were better, 1% similar, 93% worse
» The best had a delta of 4%, average was 23%, worst was 136%
HP OmniBook Ultra 14 Core Ultra X9 audio analysis
(+) | speakers can play relatively loud (85.3 dB)
Bass 100 - 315 Hz
(±) | reduced bass - on average 10% lower than median
(±) | linearity of bass is average (11.6% delta to prev. frequency)
Mids 400 - 2000 Hz
(+) | balanced mids - only 2.6% away from median
(+) | mids are linear (4% delta to prev. frequency)
Highs 2 - 16 kHz
(+) | balanced highs - only 1.3% away from median
(+) | highs are linear (2.6% delta to prev. frequency)
Overall 100 - 16.000 Hz
(+) | overall sound is linear (7.3% difference to median)
Compared to same class
» 1% of all tested devices in this class were better, 1% similar, 98% worse
» The best had a delta of 5%, average was 18%, worst was 53%
Compared to all devices tested
» 1% of all tested devices were better, 0% similar, 98% worse
» The best had a delta of 4%, average was 23%, worst was 136%
Dell XPS 14 Core Ultra X7 358H audio analysis
(+) | speakers can play relatively loud (87 dB)
Bass 100 - 315 Hz
(±) | reduced bass - on average 7.6% lower than median
(+) | bass is linear (5.9% delta to prev. frequency)
Mids 400 - 2000 Hz
(+) | balanced mids - only 3.2% away from median
(+) | mids are linear (3.6% delta to prev. frequency)
Highs 2 - 16 kHz
(+) | balanced highs - only 3.3% away from median
(+) | highs are linear (5.8% delta to prev. frequency)
Overall 100 - 16.000 Hz
(+) | overall sound is linear (7.3% difference to median)
Compared to same class
» 7% of all tested devices in this class were better, 1% similar, 93% worse
» The best had a delta of 5%, average was 17%, worst was 45%
Compared to all devices tested
» 1% of all tested devices were better, 0% similar, 98% worse
» The best had a delta of 4%, average was 23%, worst was 136%
Energy Management - Insufficient power supply
Power Consumption

The new OLED screen is surprisingly efficient even at higher brightness levels. However, the big issue is once again the power supply. You can select a 96 Watt PSU when you configure the new MacBook Pro 14 OLED and our review unit was actually shipped with a 140W PSU, so we initially thought the new model can finally accept more than 96 Watts. We already reported about this problem on the previous models, but unfortunately, Apple did not fix this issue. While many users will probably not have problems, this is still embarrassing for a "Pro" laptop and you can drain the battery by around 15 % in one hour at full load and high brightness levels in High Performance mode.
| Off / Standby | 0.15 / 0.41 Watt |
| Idle | 3.4 / 4.8 / 4.9 Watt |
| Load |
75.5 / 96.4 Watt |
   
| |
Key:
min: ,
med: ,
max: Metrahit Energy | |
| Apple MacBook Pro 14 M5 Pro OLED M5 Pro 18-Core, M5 Pro 20-Core GPU, Apple SSD AP4096Z, OLED, 3092x1986, 14.2" | Asus ProArt P14 H7407 Spark RTX N1X 20-Core, RTX Spark N1X 6144-Core Blackwell GPU, Samsung PM9C1b MZVL81T0HFLB-00BH1, OLED, 2880x1800, 14" | Apple MacBook Pro 14 2026 M5 Max M5 Max, M5 Max 40-Core GPU, Apple SSD AP8192Z, Mini-LED, 3024x1964, 14.2" | HP ZBook Ultra G1a 14 Ryzen AI Max+ PRO 395, Radeon 8060S, WDC PC SN810 2TB, OLED, 2880x1800, 14" | HP OmniBook Ultra 14 Core Ultra X9 Ultra X9 388H, Arc B390 Panther Lake iGPU, , OLED, 2880x1800, 14" | Dell XPS 14 Core Ultra X7 358H Ultra X7 358H, Arc B390 Panther Lake iGPU, Samsung PM9C1b MZVL81T0HFLB-00BH1, OLED, 2880x1800, 14" | Average Apple M5 Pro 20-Core GPU | Average of class Multimedia | |
|---|---|---|---|---|---|---|---|---|
| Power Consumption | -73% | -44% | -69% | 18% | 6% | -65% | -67% | |
| Idle Minimum * (Watt) | 3.4 | 5.8 -71% | 2.5 26% | 6.9 -103% | 2.5 26% | 3.1 9% | 3.9 ? -15% | 5.43 ? -60% |
| Idle Average * (Watt) | 4.8 | 10.8 -125% | 11.6 -142% | 7.7 -60% | 5.1 -6% | 3.6 25% | 11.6 ? -142% | 10.3 ? -115% |
| Idle Maximum * (Watt) | 4.9 | 11.3 -131% | 11.8 -141% | 14.7 -200% | 5.8 -18% | 10 -104% | 11.6 ? -137% | 12.5 ? -155% |
| Load Average * (Watt) | 75.5 | 98.4 -30% | 95.6 -27% | 83.3 -10% | 49.8 34% | 39.2 48% | 79.9 ? -6% | 66.3 ? 12% |
| Cyberpunk 2077 ultra external monitor * (Watt) | 78.3 | 86.4 -10% | 110.5 -41% | 55.1 30% | 51.2 35% | |||
| Cyberpunk 2077 ultra * (Watt) | 80 | 111.4 -39% | 89.4 -12% | 110.9 -39% | 55 31% | 51.4 36% | ||
| Load Maximum * (Watt) | 96.4 | 136 -41% | 98.8 -2% | 126.3 -31% | 68 29% | 101.4 -5% | 120.7 ? -25% | 113.6 ? -18% |
* ... smaller is better
Power Consumption Cyberpunk / Stress Test
Power Consumption external Monitor
Battery Life

The battery capacity is pretty much identical to the Mini-LED model at 72.6 Wh, but the efficient OLED screen still results in improved battery runtimes. Our Wi-Fi runtime test at 150 nits runs for ~16.5 hours and therefore over an hour longer than on the Mini-LED model. Considering our Wi-Fi test mainly uses bright websites, this is a very good result. At full SDR brightness, we recorded ~9.5 hours, which is a massive improvement compared to 6 hours on the Mini-LED model (with a comparable maximum SDR brightness). We will add more battery runtime tests soon. A full recharge takes around 1.5 hours with 50 % recharged after 27 minutes and 80 % after 52 minutes.
Notebookcheck Rating
Apple MacBook Pro 14 M5 Pro OLED
- 11/05/2026 v8
Andreas Osthoff
 Total Sustainability Score:
Potential Competitors in Comparison
Image | Model / Review | Price | Weight | Height | Display |
|---|---|---|---|---|---|
1. 91.7% 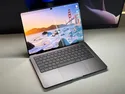 | Apple MacBook Pro 14 M5 Pro OLED Apple M5 Pro 18-Core ⎘ Apple M5 Pro 20-Core GPU ⎘ 64 GB Memory, 4096 GB SSD | List Price: 6289€ | 1.4 kg | 15 mm | 14.20" 3092x1986 259 PPI OLED |
2. 90%  | Asus ProArt P14 H7407 Nvidia RTX Spark N1X 20-Core ⎘ NVIDIA RTX Spark N1X 6144-Core Blackwell GPU ⎘ 32 GB Memory, 1000 GB SSD | List Price: 3299€ | 1.5 kg | 15.9 mm | 14.00" 2880x1800 243 PPI OLED |
3. 90.2%  | Apple MacBook Pro 14 2026 M5 Max Apple M5 Max ⎘ Apple M5 Max 40-Core GPU ⎘ 128 GB Memory, 8192 GB SSD | List Price: 8589€ | 1.6 kg | 15.5 mm | 14.20" 3024x1964 254 PPI Mini-LED |
4. 87.4%  | HP ZBook Ultra G1a 14 AMD Ryzen AI Max+ PRO 395 ⎘ AMD Radeon 8060S ⎘ 128 GB Memory, 2048 GB SSD | List Price: 4000 USD | 1.6 kg | 18.5 mm | 14.00" 2880x1800 243 PPI OLED |
5. 87.9%  | HP OmniBook Ultra 14 Core Ultra X9 Intel Core Ultra X9 388H ⎘ Intel Arc B390 12 Xe3 Panther Lake iGPU ⎘ 32 GB Memory | List Price: 2800 USD | 1.3 kg | 10.7 mm | 14.00" 2880x1800 243 PPI OLED |
6. 87.4%  | Dell XPS 14 Core Ultra X7 358H Intel Core Ultra X7 358H ⎘ Intel Arc B390 12 Xe3 Panther Lake iGPU ⎘ 32 GB Memory, 1000 GB SSD | List Price: 2200 USD | 1.4 kg | 14.62 mm | 14.00" 2880x1800 243 PPI OLED |
Transparency
The selection of devices to be reviewed is made by our editorial team. The test sample was provided to the author as a loan by the manufacturer or retailer for the purpose of this review. The lender had no influence on this review, nor did the manufacturer receive a copy of this review before publication. There was no obligation to publish this review. As an independent media company, Notebookcheck is not subjected to the authority of manufacturers, retailers or publishers.
This is how Notebookcheck is testing
Every year, Notebookcheck independently reviews hundreds of laptops and smartphones using standardized procedures to ensure that all results are comparable. We have continuously developed our test methods for around 20 years and set industry standards in the process. In our test labs, high-quality measuring equipment is utilized by experienced technicians and editors. These tests involve a multi-stage validation process. Our complex rating system is based on hundreds of well-founded measurements and benchmarks, which maintains objectivity. Further information on our test methods can be found here.
 Add as a preferred source on Google


