Notebookcheck Logo
Teaser

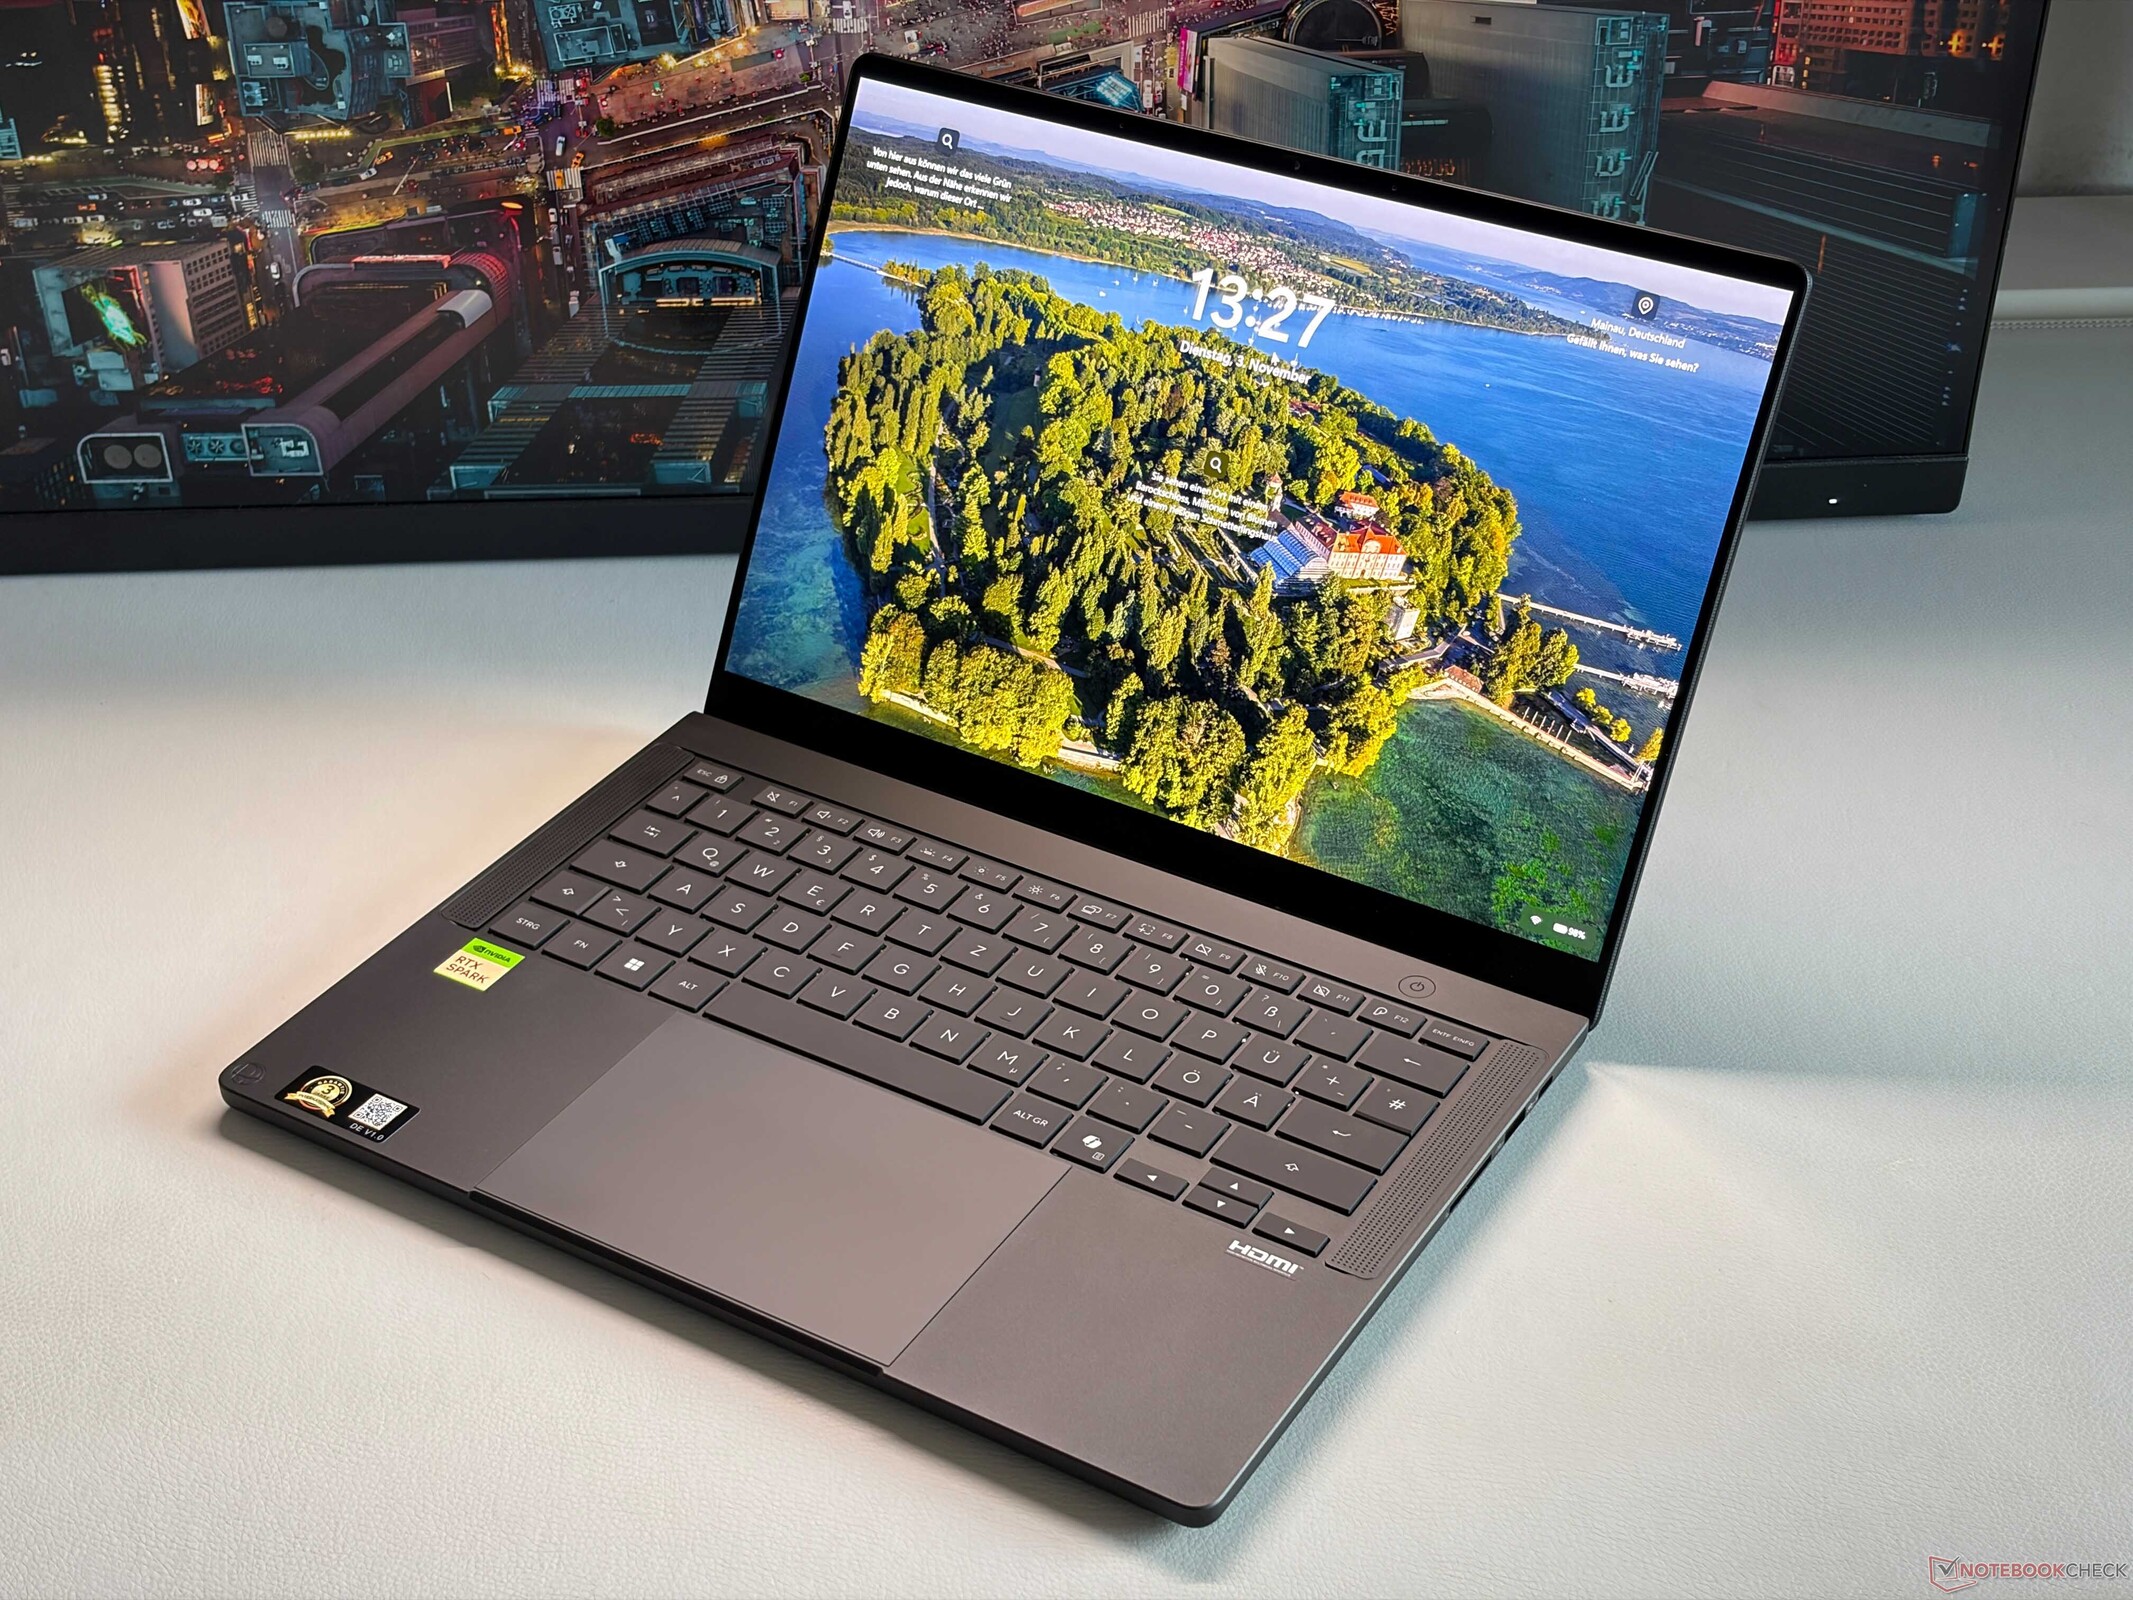
The only 14-inch laptop with Nvidia RTX Spark - Asus ProArt P14 Review

It's all about the RAM.

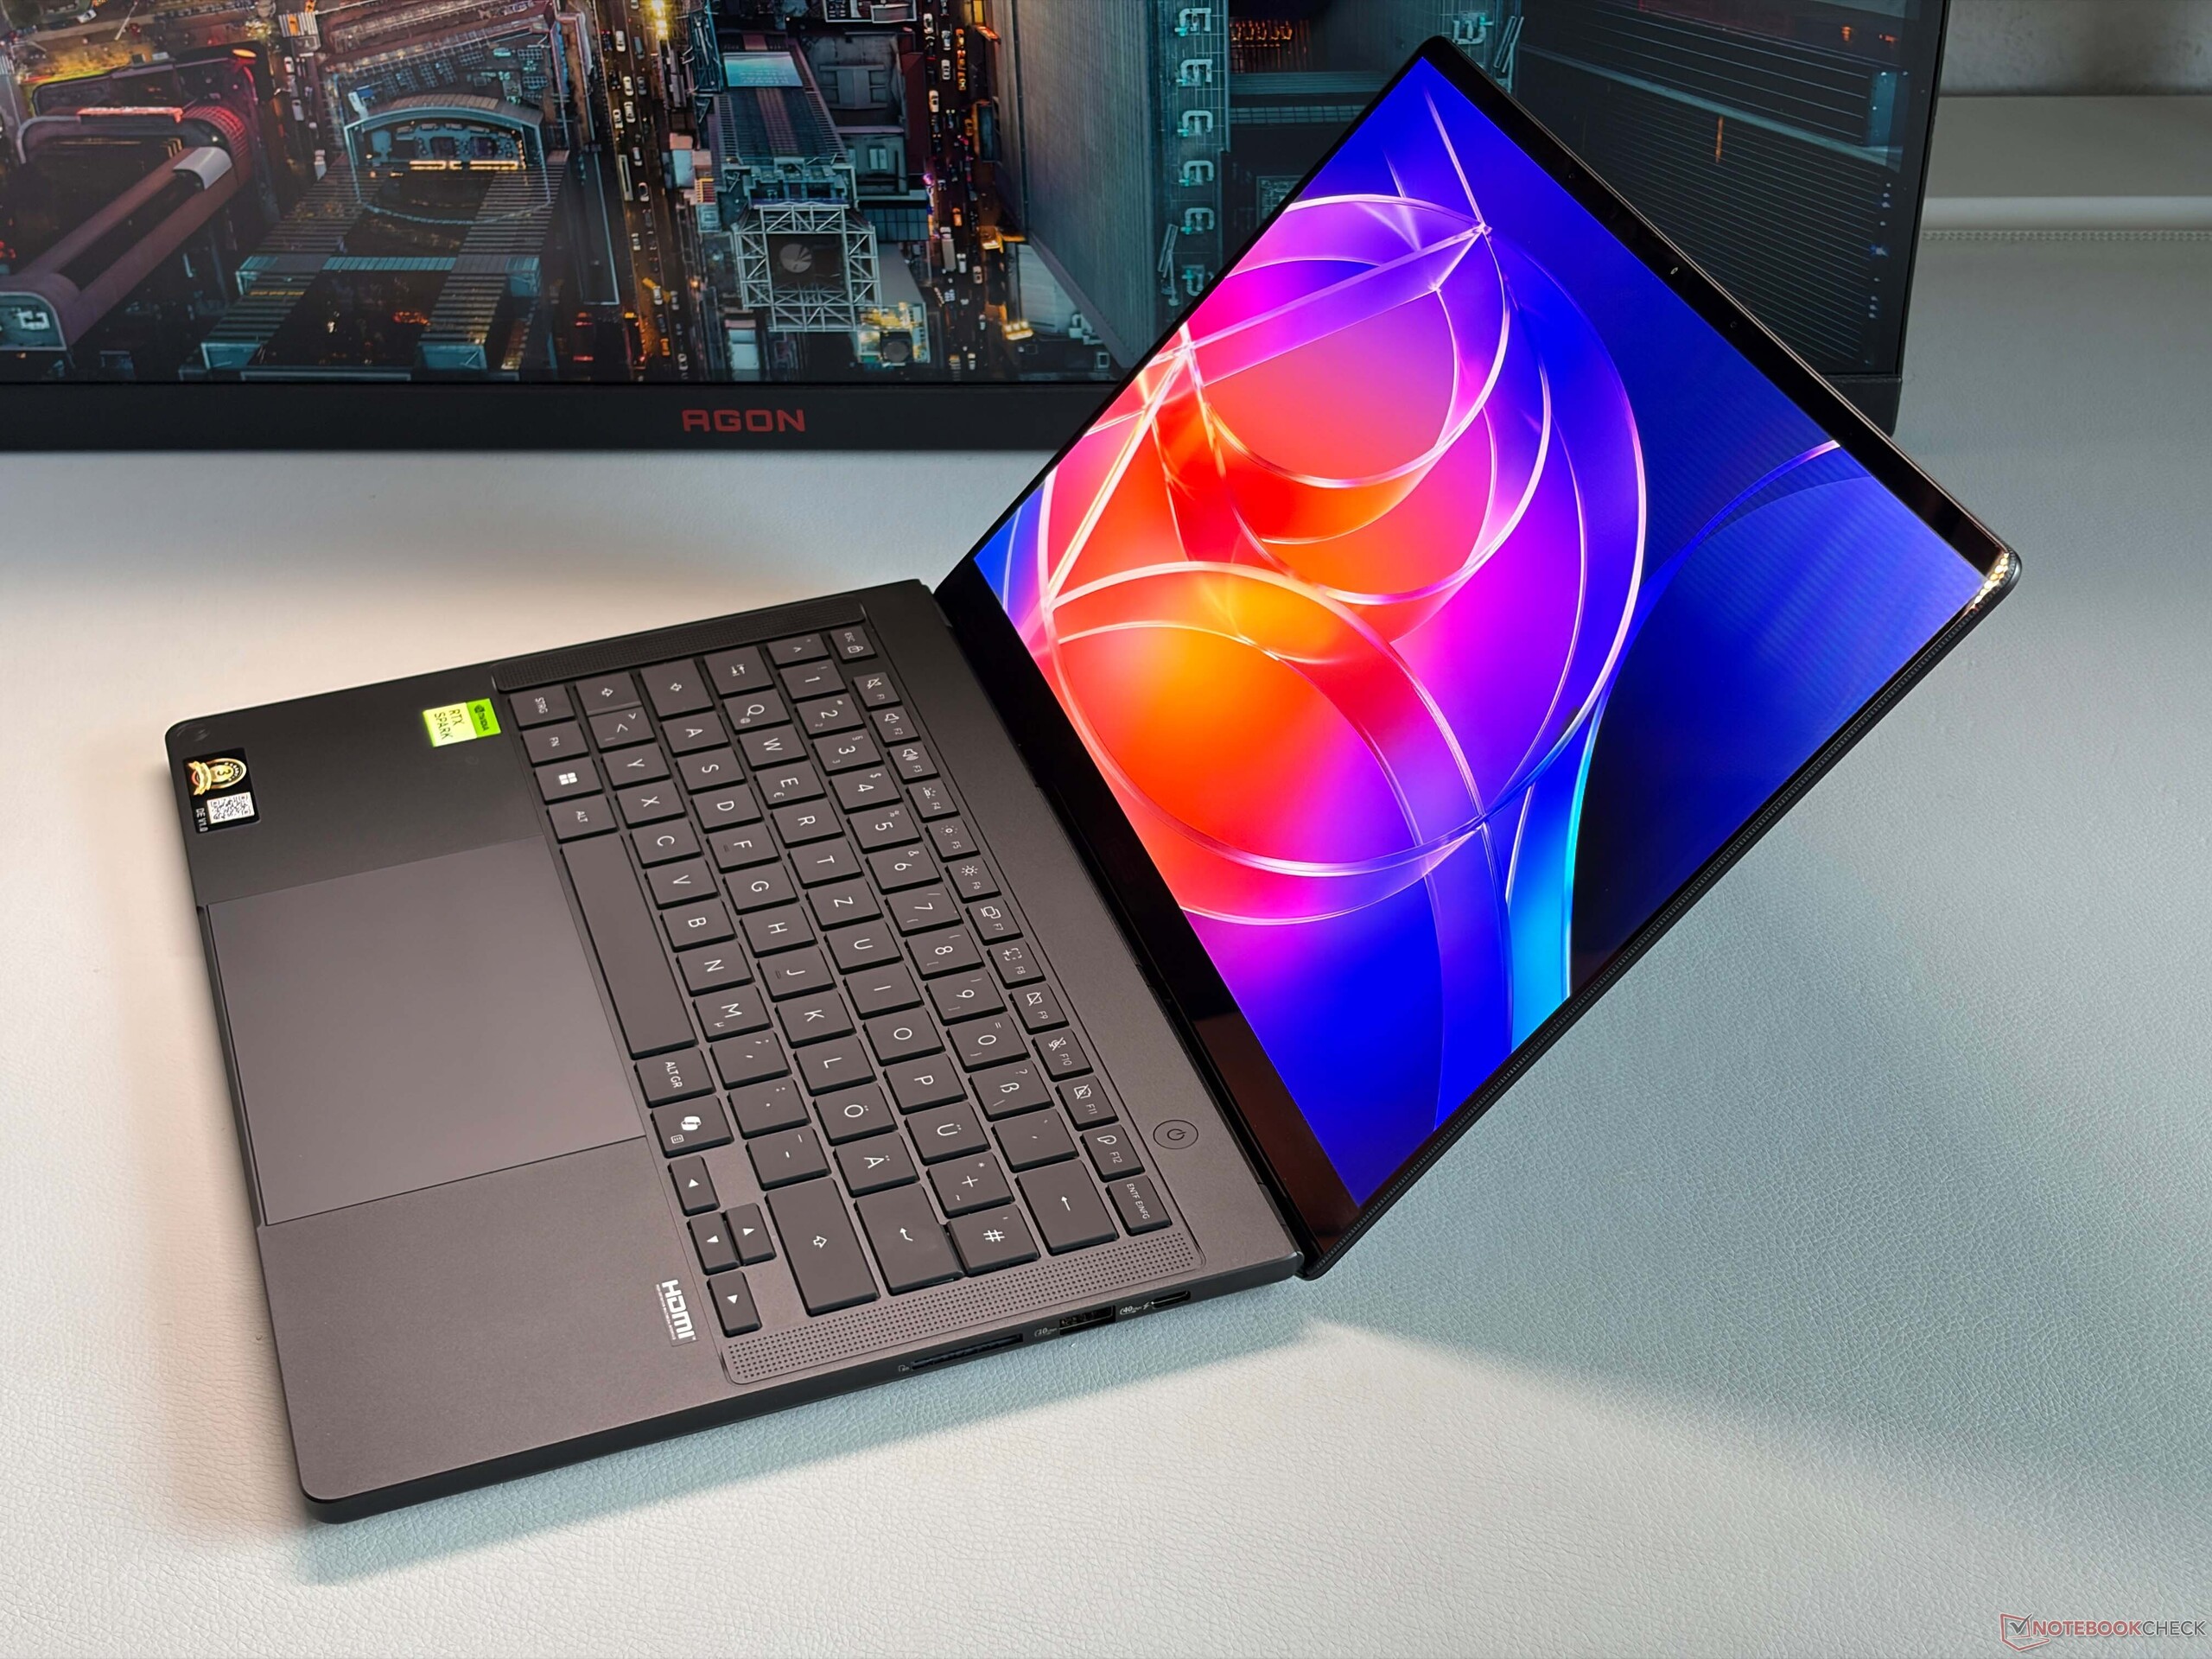
The Asus ProArt P14 is the only 14-inch laptop right now powered by Nvidia's new RTX Spark N1X SoC. You also get a sleek chassis, an excellent tandem OLED panel as well as great speakers, but be prepared for loud fans.
Andreas Osthoff 👁 Published
AI ARM Blackwell RTX 5000 Laptop RTX Spark Touchscreen Wi-Fi 7 Windows

Verdict - ProArt P14 is a sleek laptop, but does not make much sense with 32 GB RAM

The Asus ProArt P14 is currently the only 14-inch laptop with the new Nvidia RTX Spark SoC. Asus also decided to use the faster version with 20 CPU cores and 6144 GPU cores, so the performance is decent, even though it is a bit slower than the 16-inch models we have tested so far and the fans can also get quite noisy, but you get the same performance whether you are plugged-in or running on battery power.

Download your licensed rating image as SVG / PNG

Asus also uses a sleek metal chassis with excellent build quality and stability. You also get a very comfortable keyboard, a great haptic touchpad, decent connectivity (even though only the larger ProArt P16 gets SD-Express support) and you also get an excellent sound system. The tandem OLED screen also offers great color accuracy and impressive brightness values (700 nits SDR, up to ~1700 nits HDR), but the touchscreen layer slightly affects the image quality with a visible grid, especially on brighter contents.

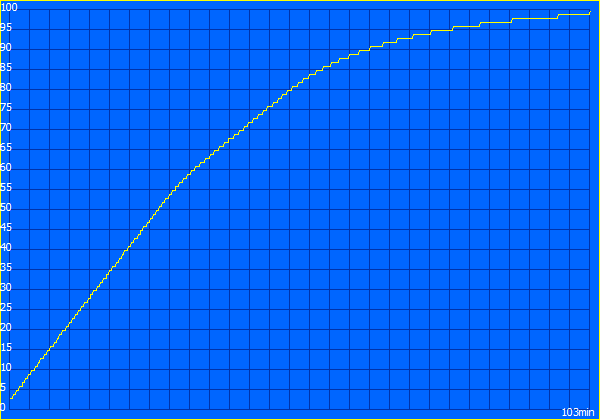
There are three major issues we have with this device. Firstly, the battery runtime is not great, even though Asus already implements a massive 90 Wh battery. Secondly, it is expensive with at $3700 for the SKU with 32 GB RAM. And right now, you can only get the ProArt P14 with up to 32 GB RAM, which is not great when you consider the purpose of these machines is to run large AI models locally. The ProArt P14 also competes with the brand-new MacBook Pro 14 OLED, which we will review soon and we are already eager to compare the two models.

Pros

+ slim and lightweight chassis with excellent stability
+ very good overall performance
+ stable performance on battery power
+ excellent 2.8K tandem OLED with 120 Hz
+ very comfortable input devices
+ excellent sound system
+ sufficient ports
+ three-year international warranty

Cons

- PWM flickering
- compatibility issues with some apps/games
- mediocre 1080p webcam
- soldered RAM/currently limited to 32 GB RAM
- no SD-Express support

Price and Availability

You can get our review configuration of the ProArt P14 for $3719 from Amazon.

Amazon Logo
$3,719.00
HIDevolution [2026] ASUS ProArt P14 H7407BA 14" 3K 120Hz 500 Nits OLED Touch, Black, NVIDIA RTX Spark N1X 6144-Core GPU 20-Core CPU, 32 GB Unified Memory, 1 TB PCIe SSD, Windows 11 Home

Specifications

Asus ProArt P14 H7407
Processor
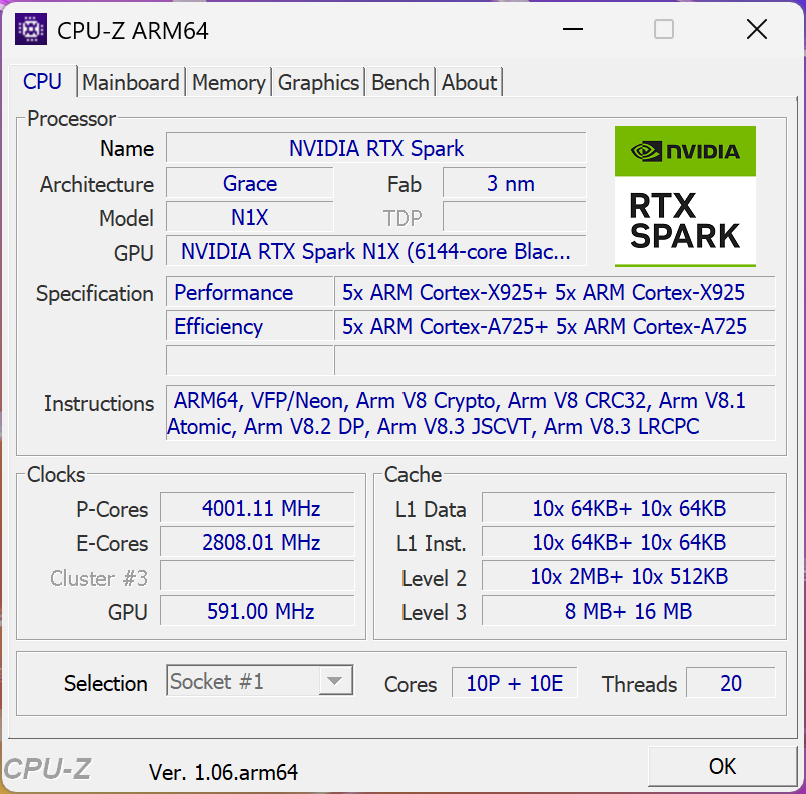
Nvidia RTX Spark N1X 20-Core 20c/20t, 10 x 4.0 GHz ARM Cortex-X925, 10 x 2.8 GHz ARM Cortex-A725, 75 W PL2 / Short Burst, 58 W PL1 / Sustained, Spark
Graphics adapter
NVIDIA RTX Spark N1X 6144-Core Blackwell GPU, Core: 2561 MHz, 70 W TDP, 621.01
Memory
32 GB 
, LPDDR5x-9400, Dual-Channel, onboard
Display
14.00 inch 16:10, 2880 x 1800 pixel 243 PPI, capacitive, ATNA40LE04-0, OLED, glossy: yes, HDR, 120 Hz
Storage
Samsung PM9C1b MZVL81T0HFLB-00BH1, 1000 GB 
, 888 GB free
Connections
1 USB 3.1 Gen2, 3 USB4 40 Gbps, USB-C Power Delivery (PD), 1 HDMI, 3 DisplayPort, 1 Docking Station Port, Audio Connections: 3.5 mm stereo, Card Reader: SDXC, Brightness Sensor
Networking
Mediatek Wi-Fi 7 MT7925 Wireless LAN Card (a/b/g/ac = Wi-Fi 5/ax = Wi-Fi 6/ Wi-Fi 6E 6 GHz be = Wi-Fi 7), Bluetooth 5.4
Size
height x width x depth (in mm): 15.9 x 310.7 x 218.9 ( = 0.63 x 12.23 x 8.62 in)
Battery
90 Wh, 5770 mAh Lithium-Polymer
Operating System
Microsoft Windows 11 Home
Camera
Webcam: 108p + IR
Primary Camera: 2 MPix
Additional features
Speakers: Stereo, Keyboard: Chiclet, 1.5 mm travel, Keyboard Light: yes, 140W PSU, 2-month Xbox PC Game Pass, 24 Months Warranty
Weight
1.482 kg ( = 52.28 oz / 3.27 pounds), Power Supply: 212 g ( = 7.48 oz / 0.47 pounds)
Price
3299 Euro
Amazon
Note: The manufacturer may use components from different suppliers including display panels, drives or memory sticks with similar specifications.


Case, Connectivity and Input Devices

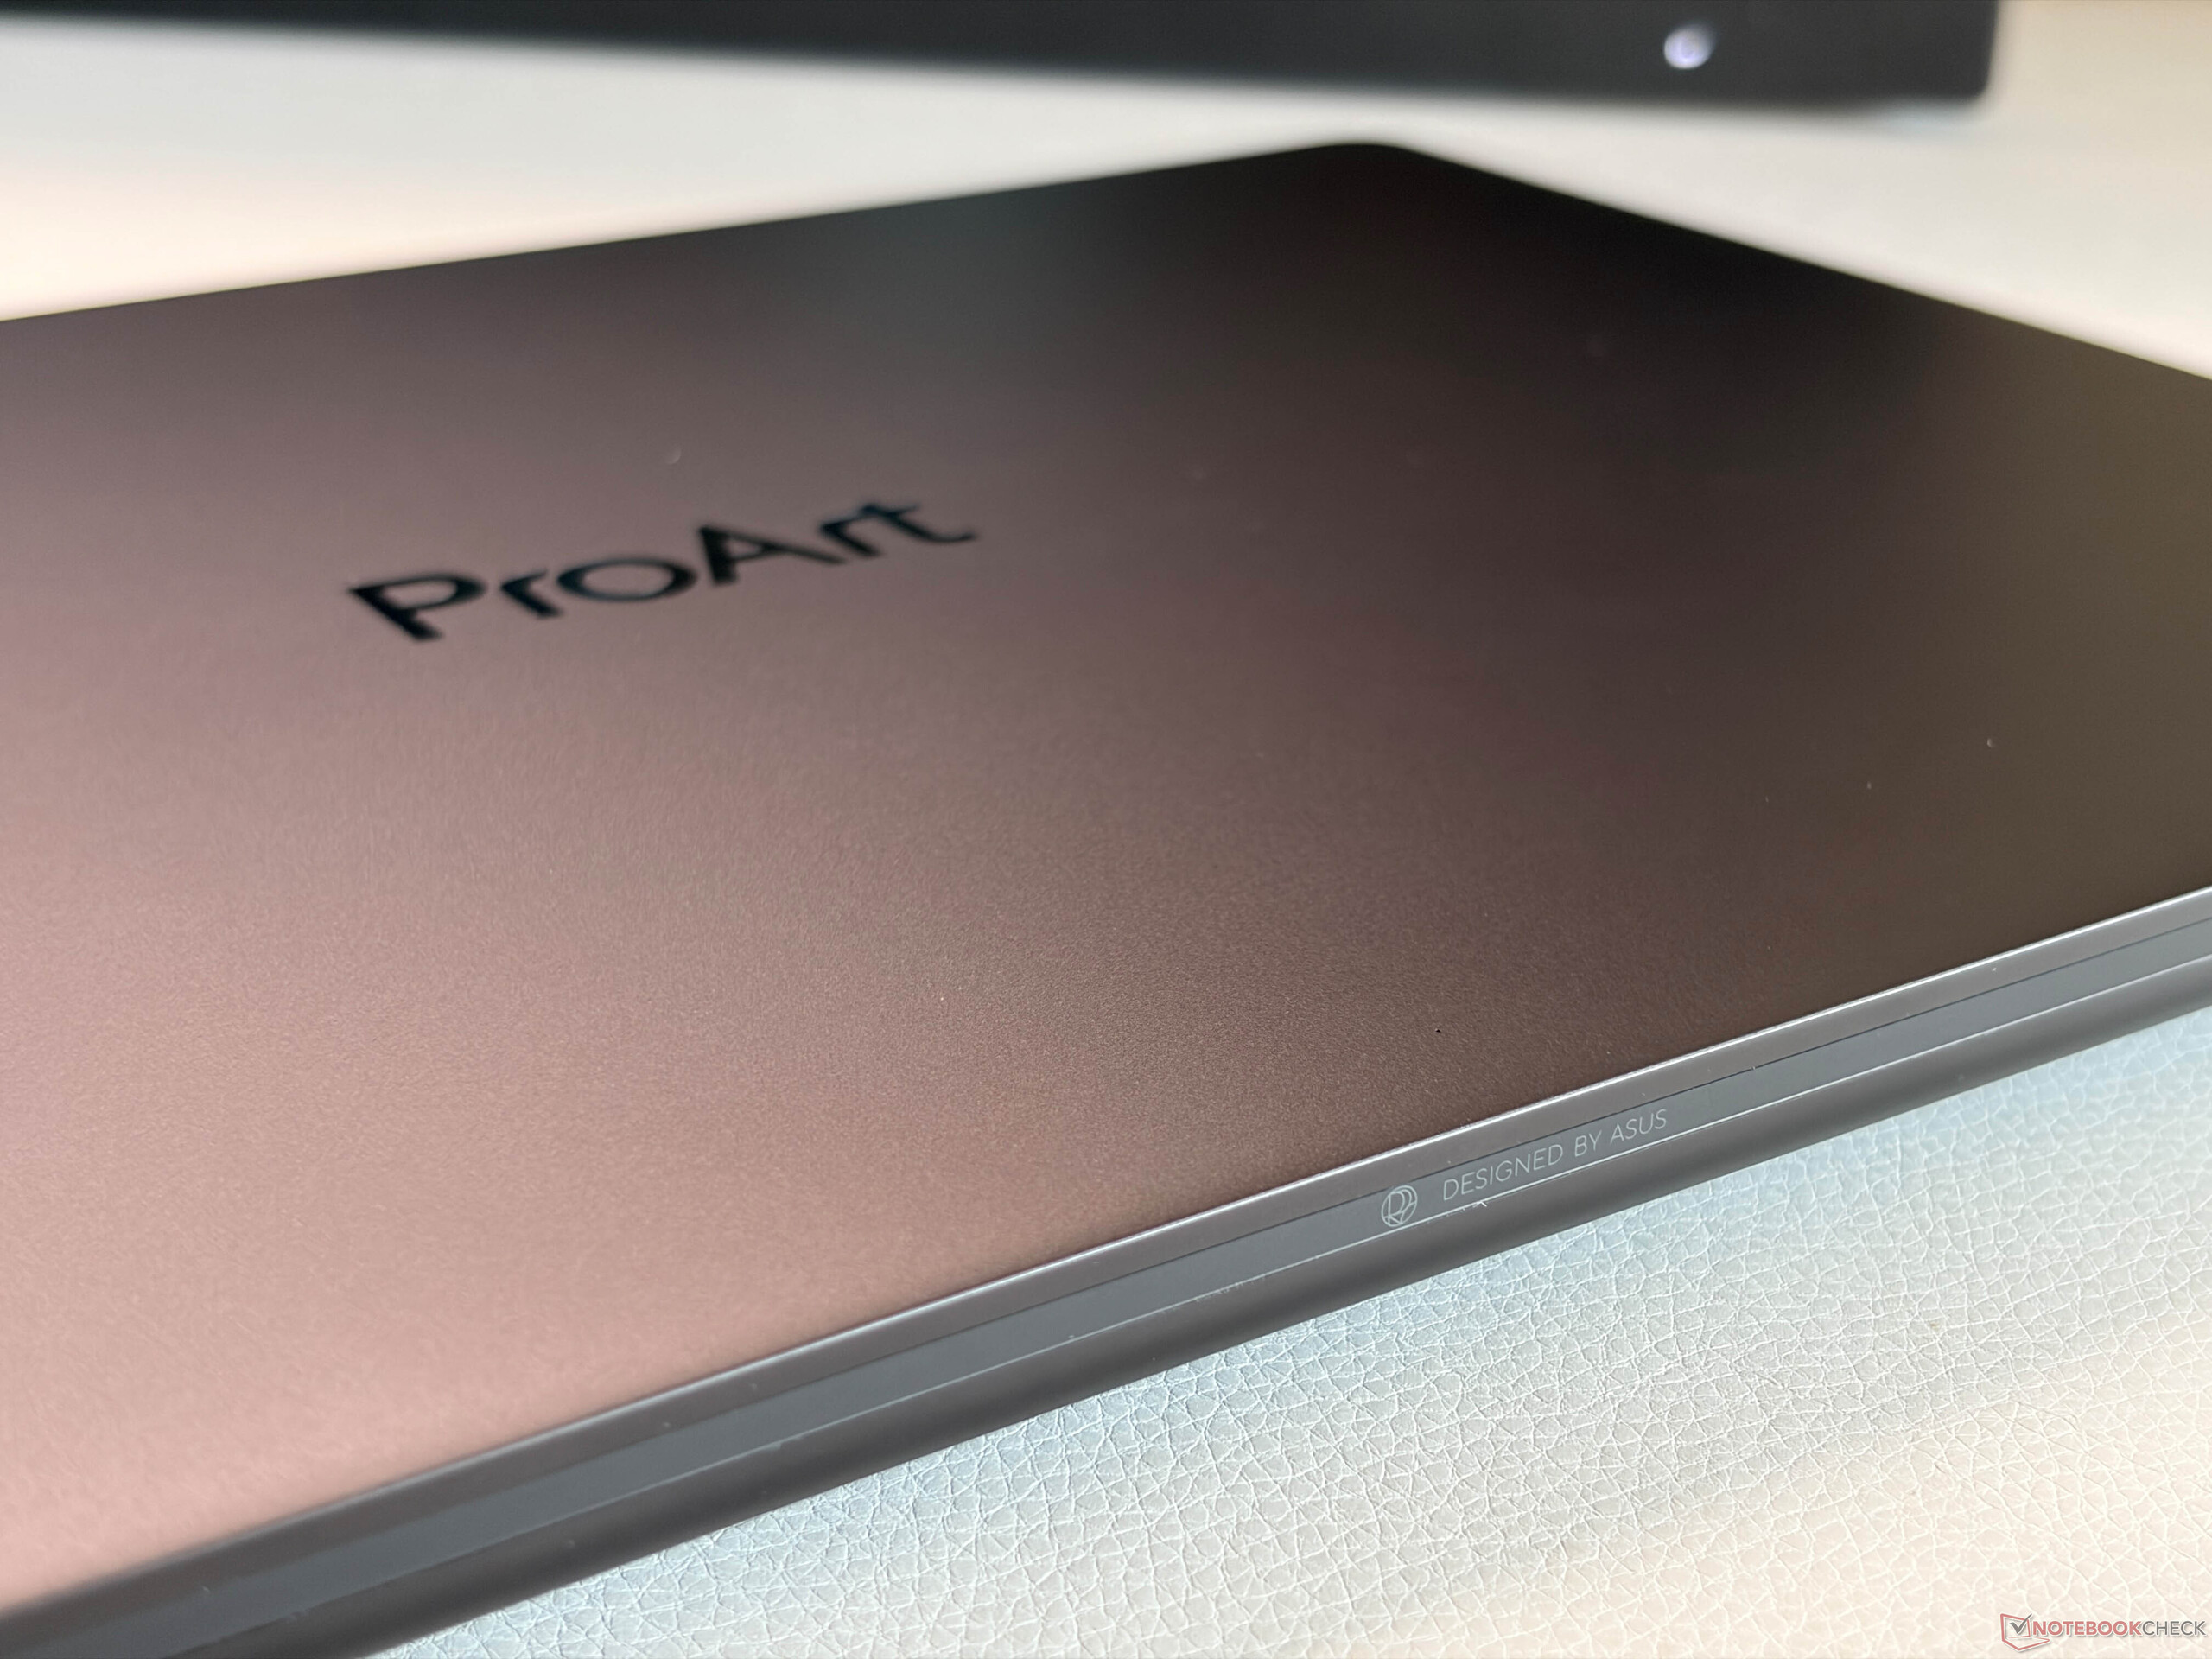
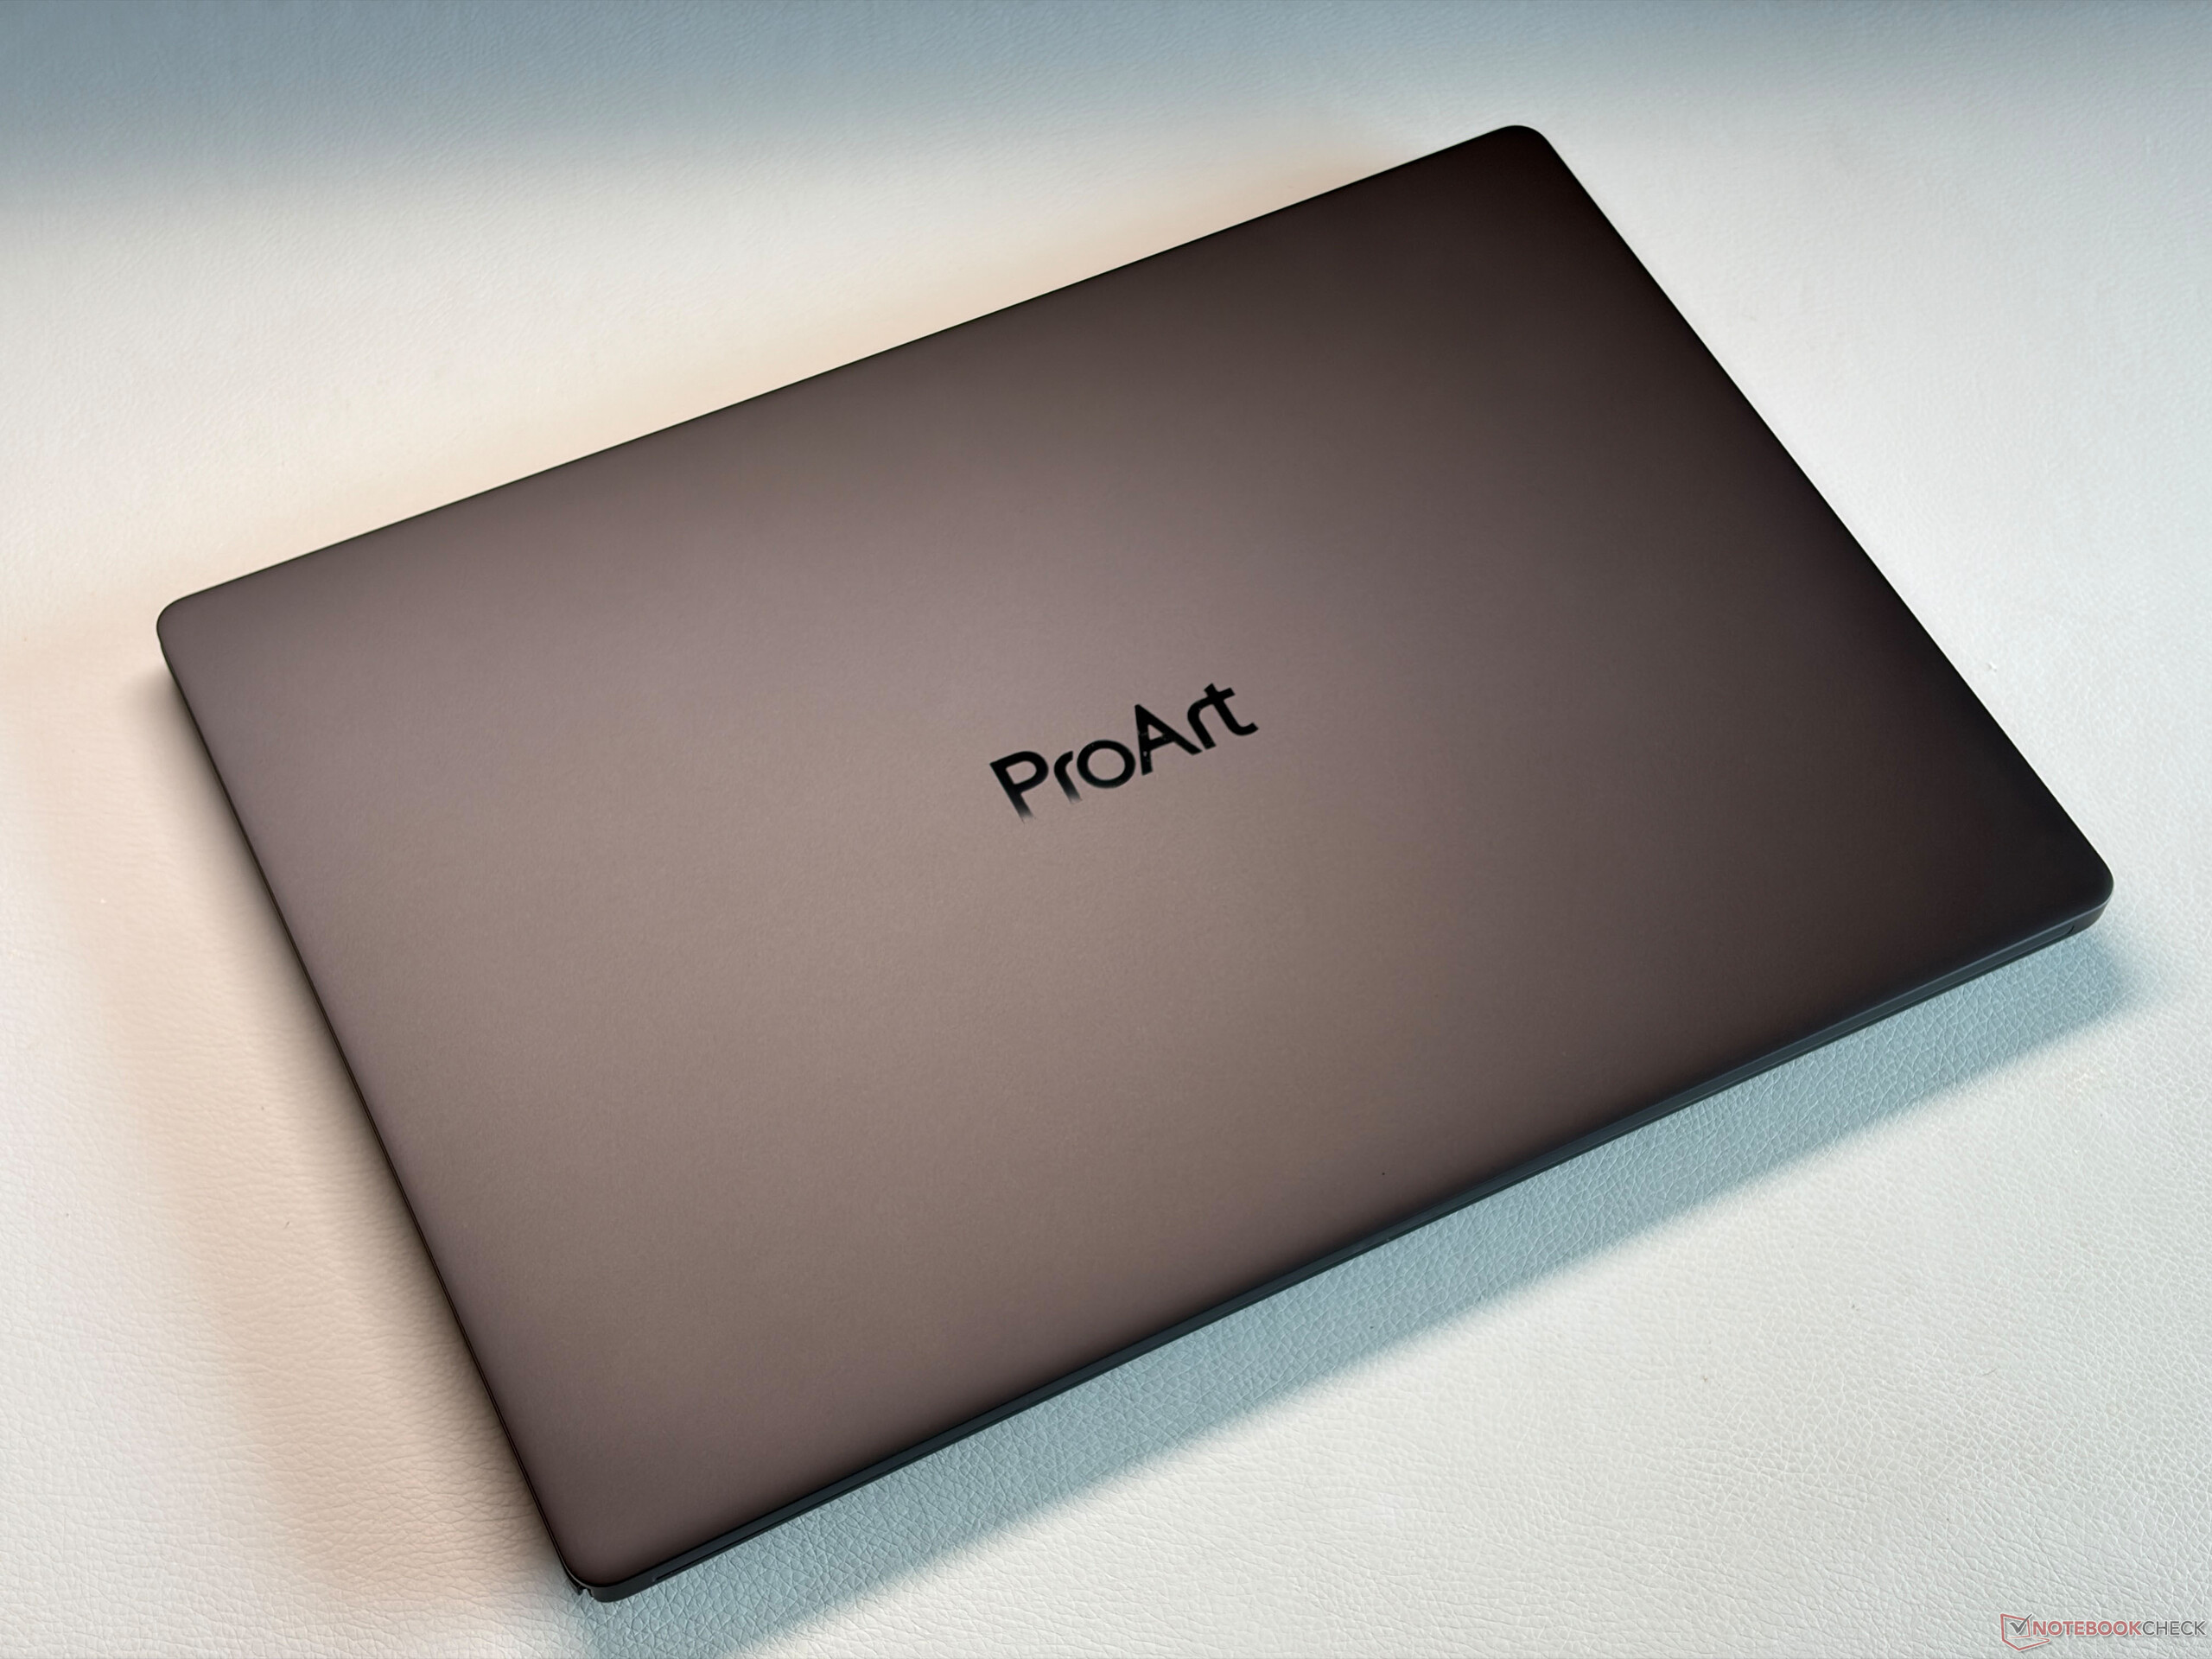
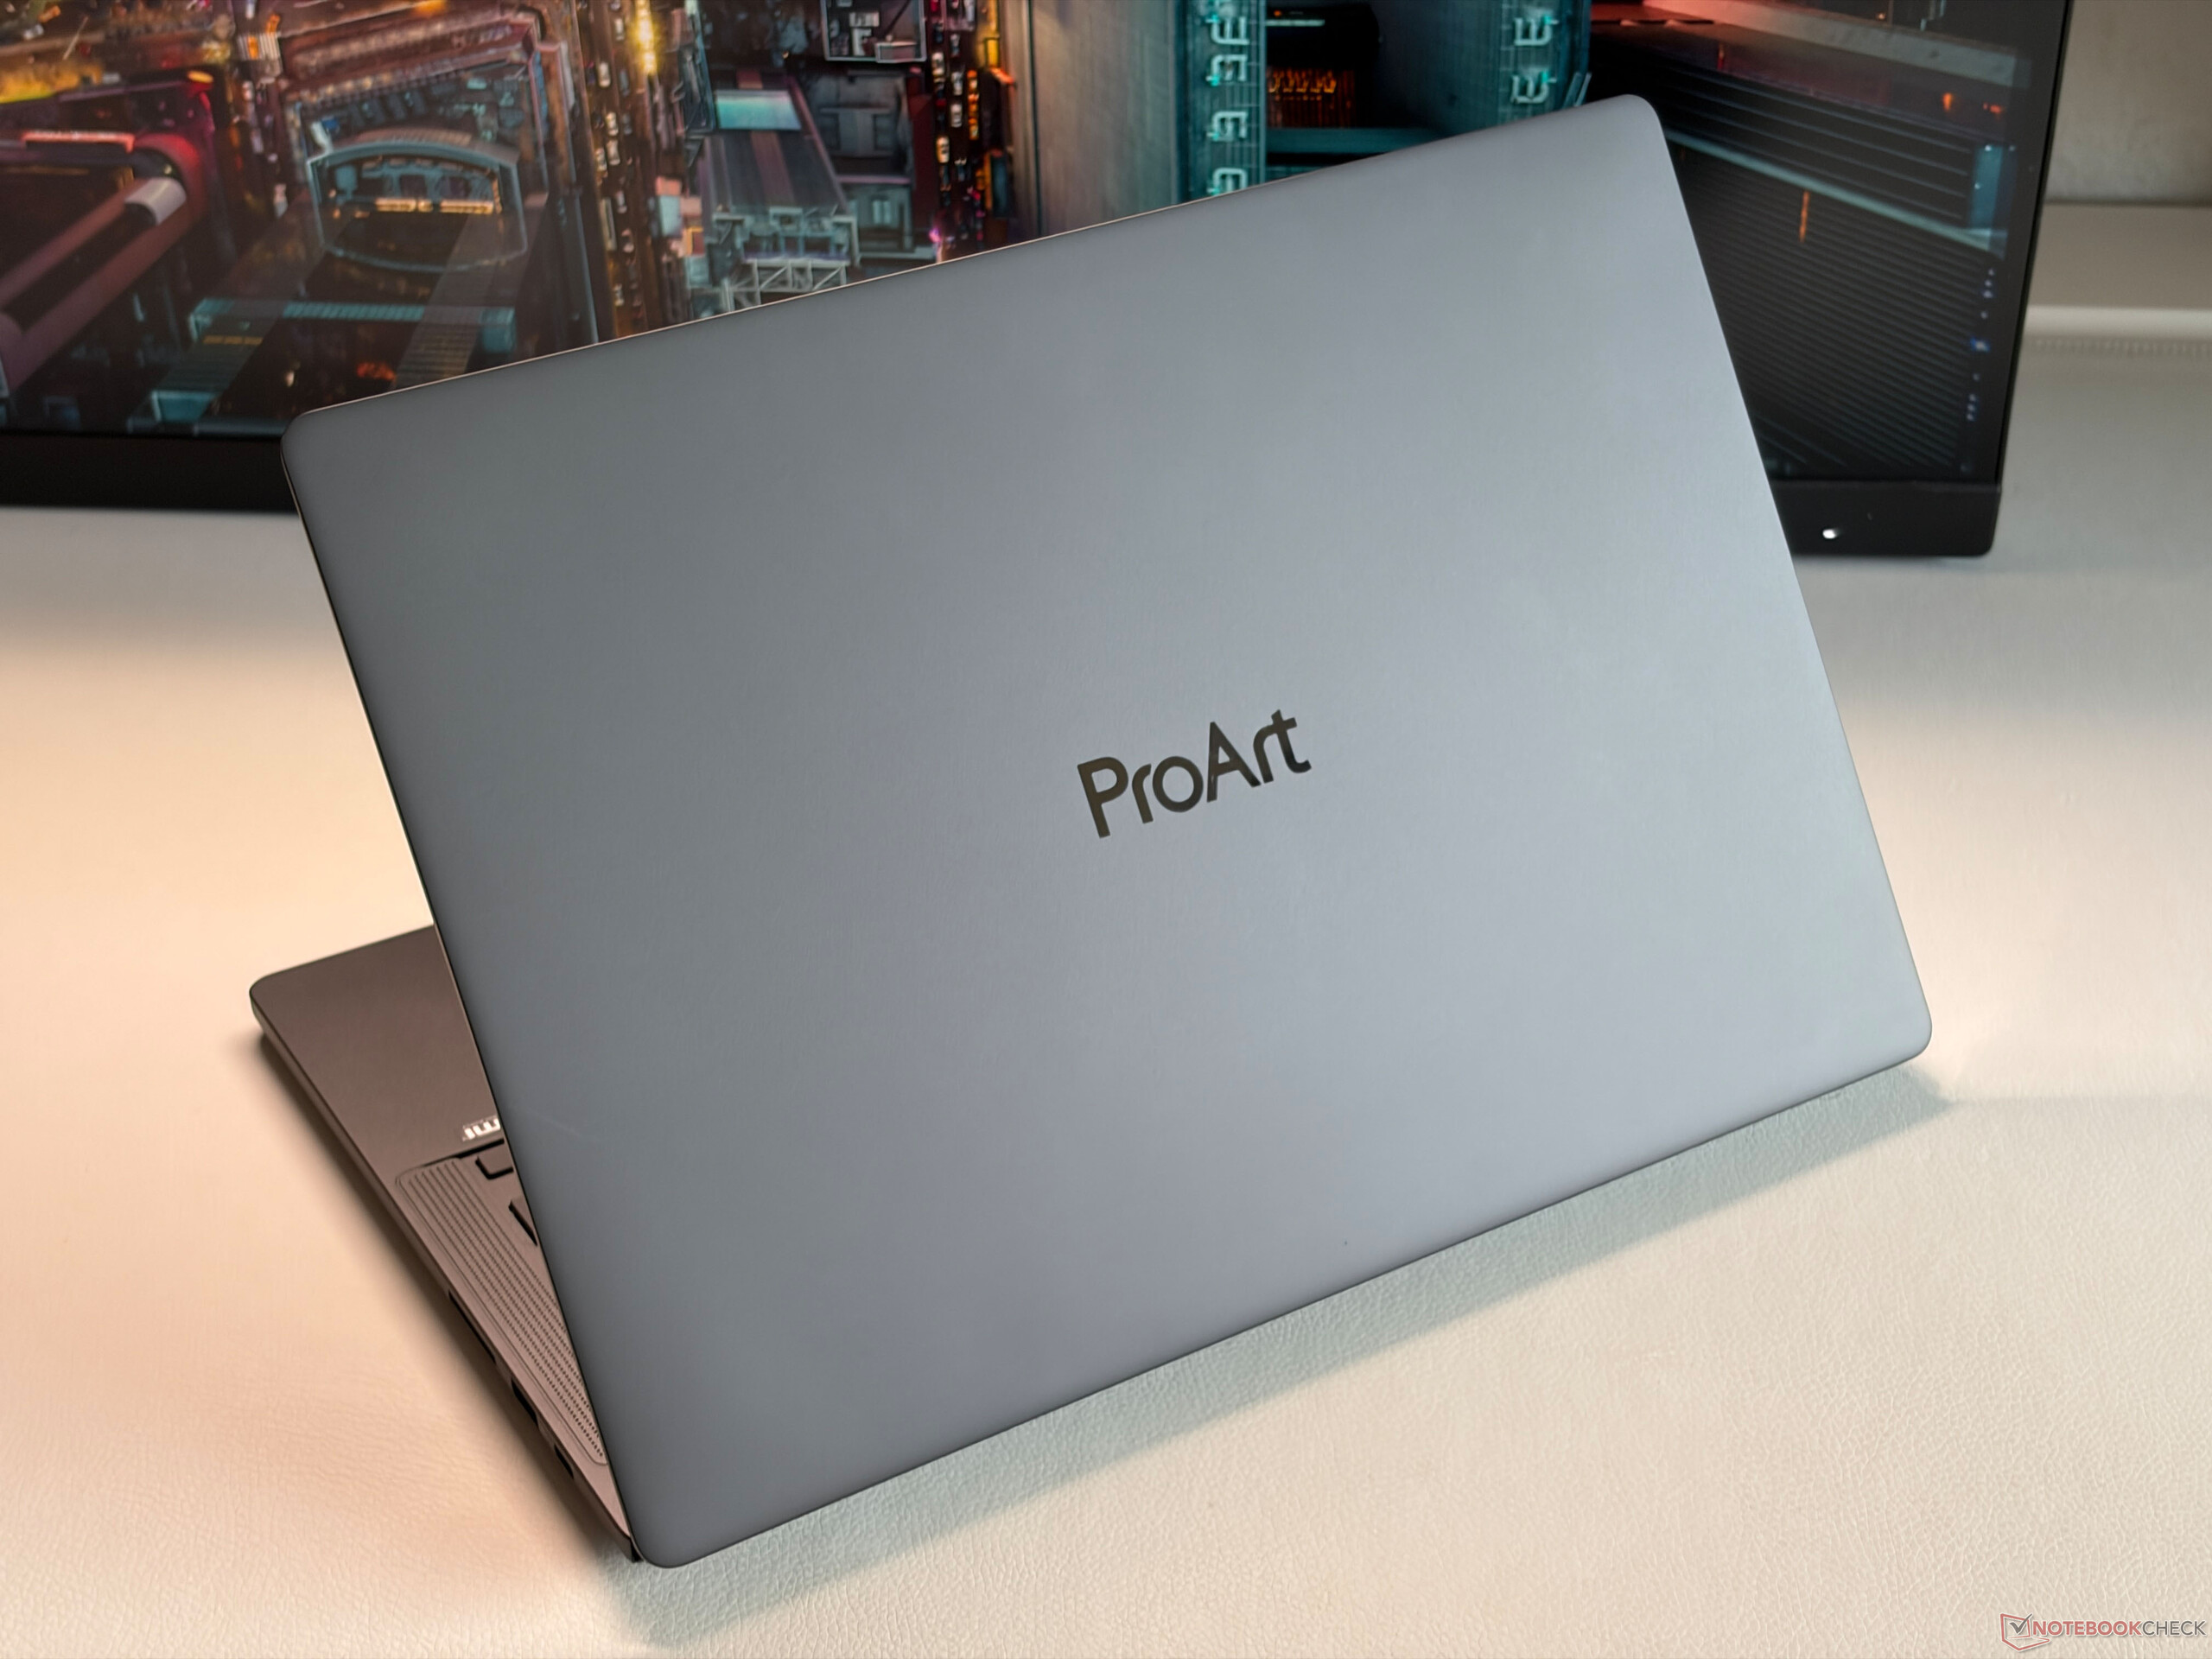
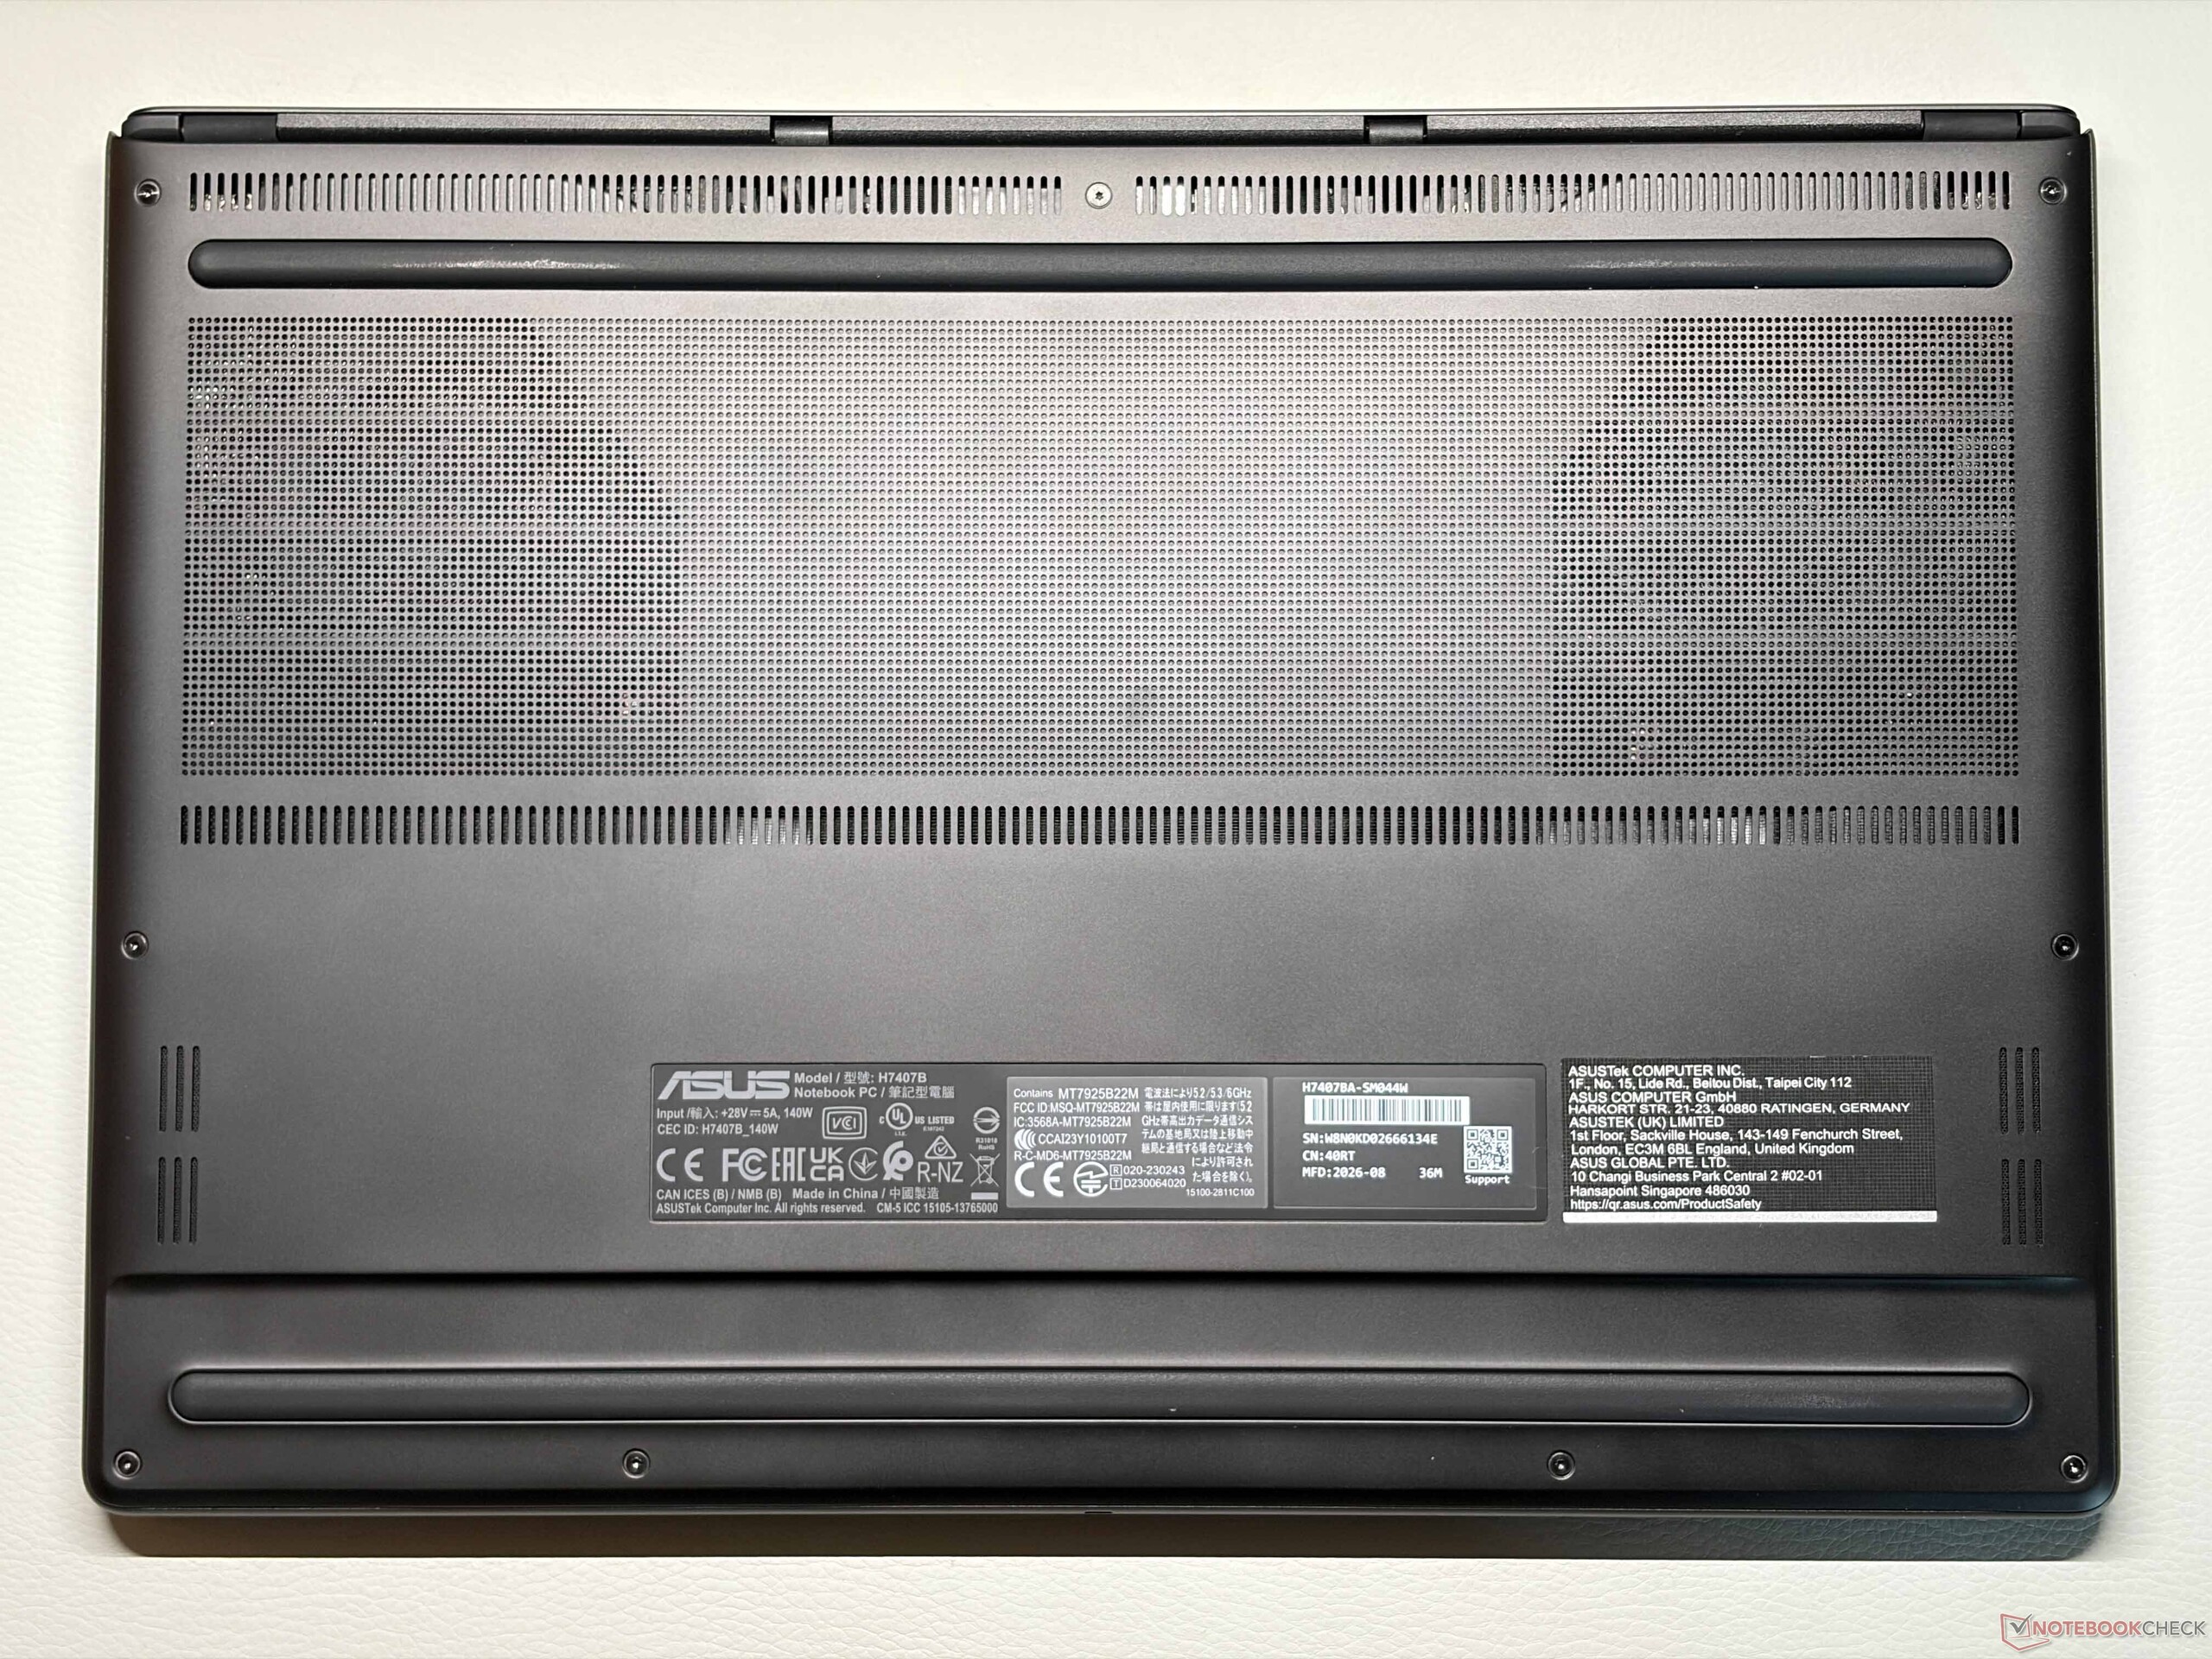
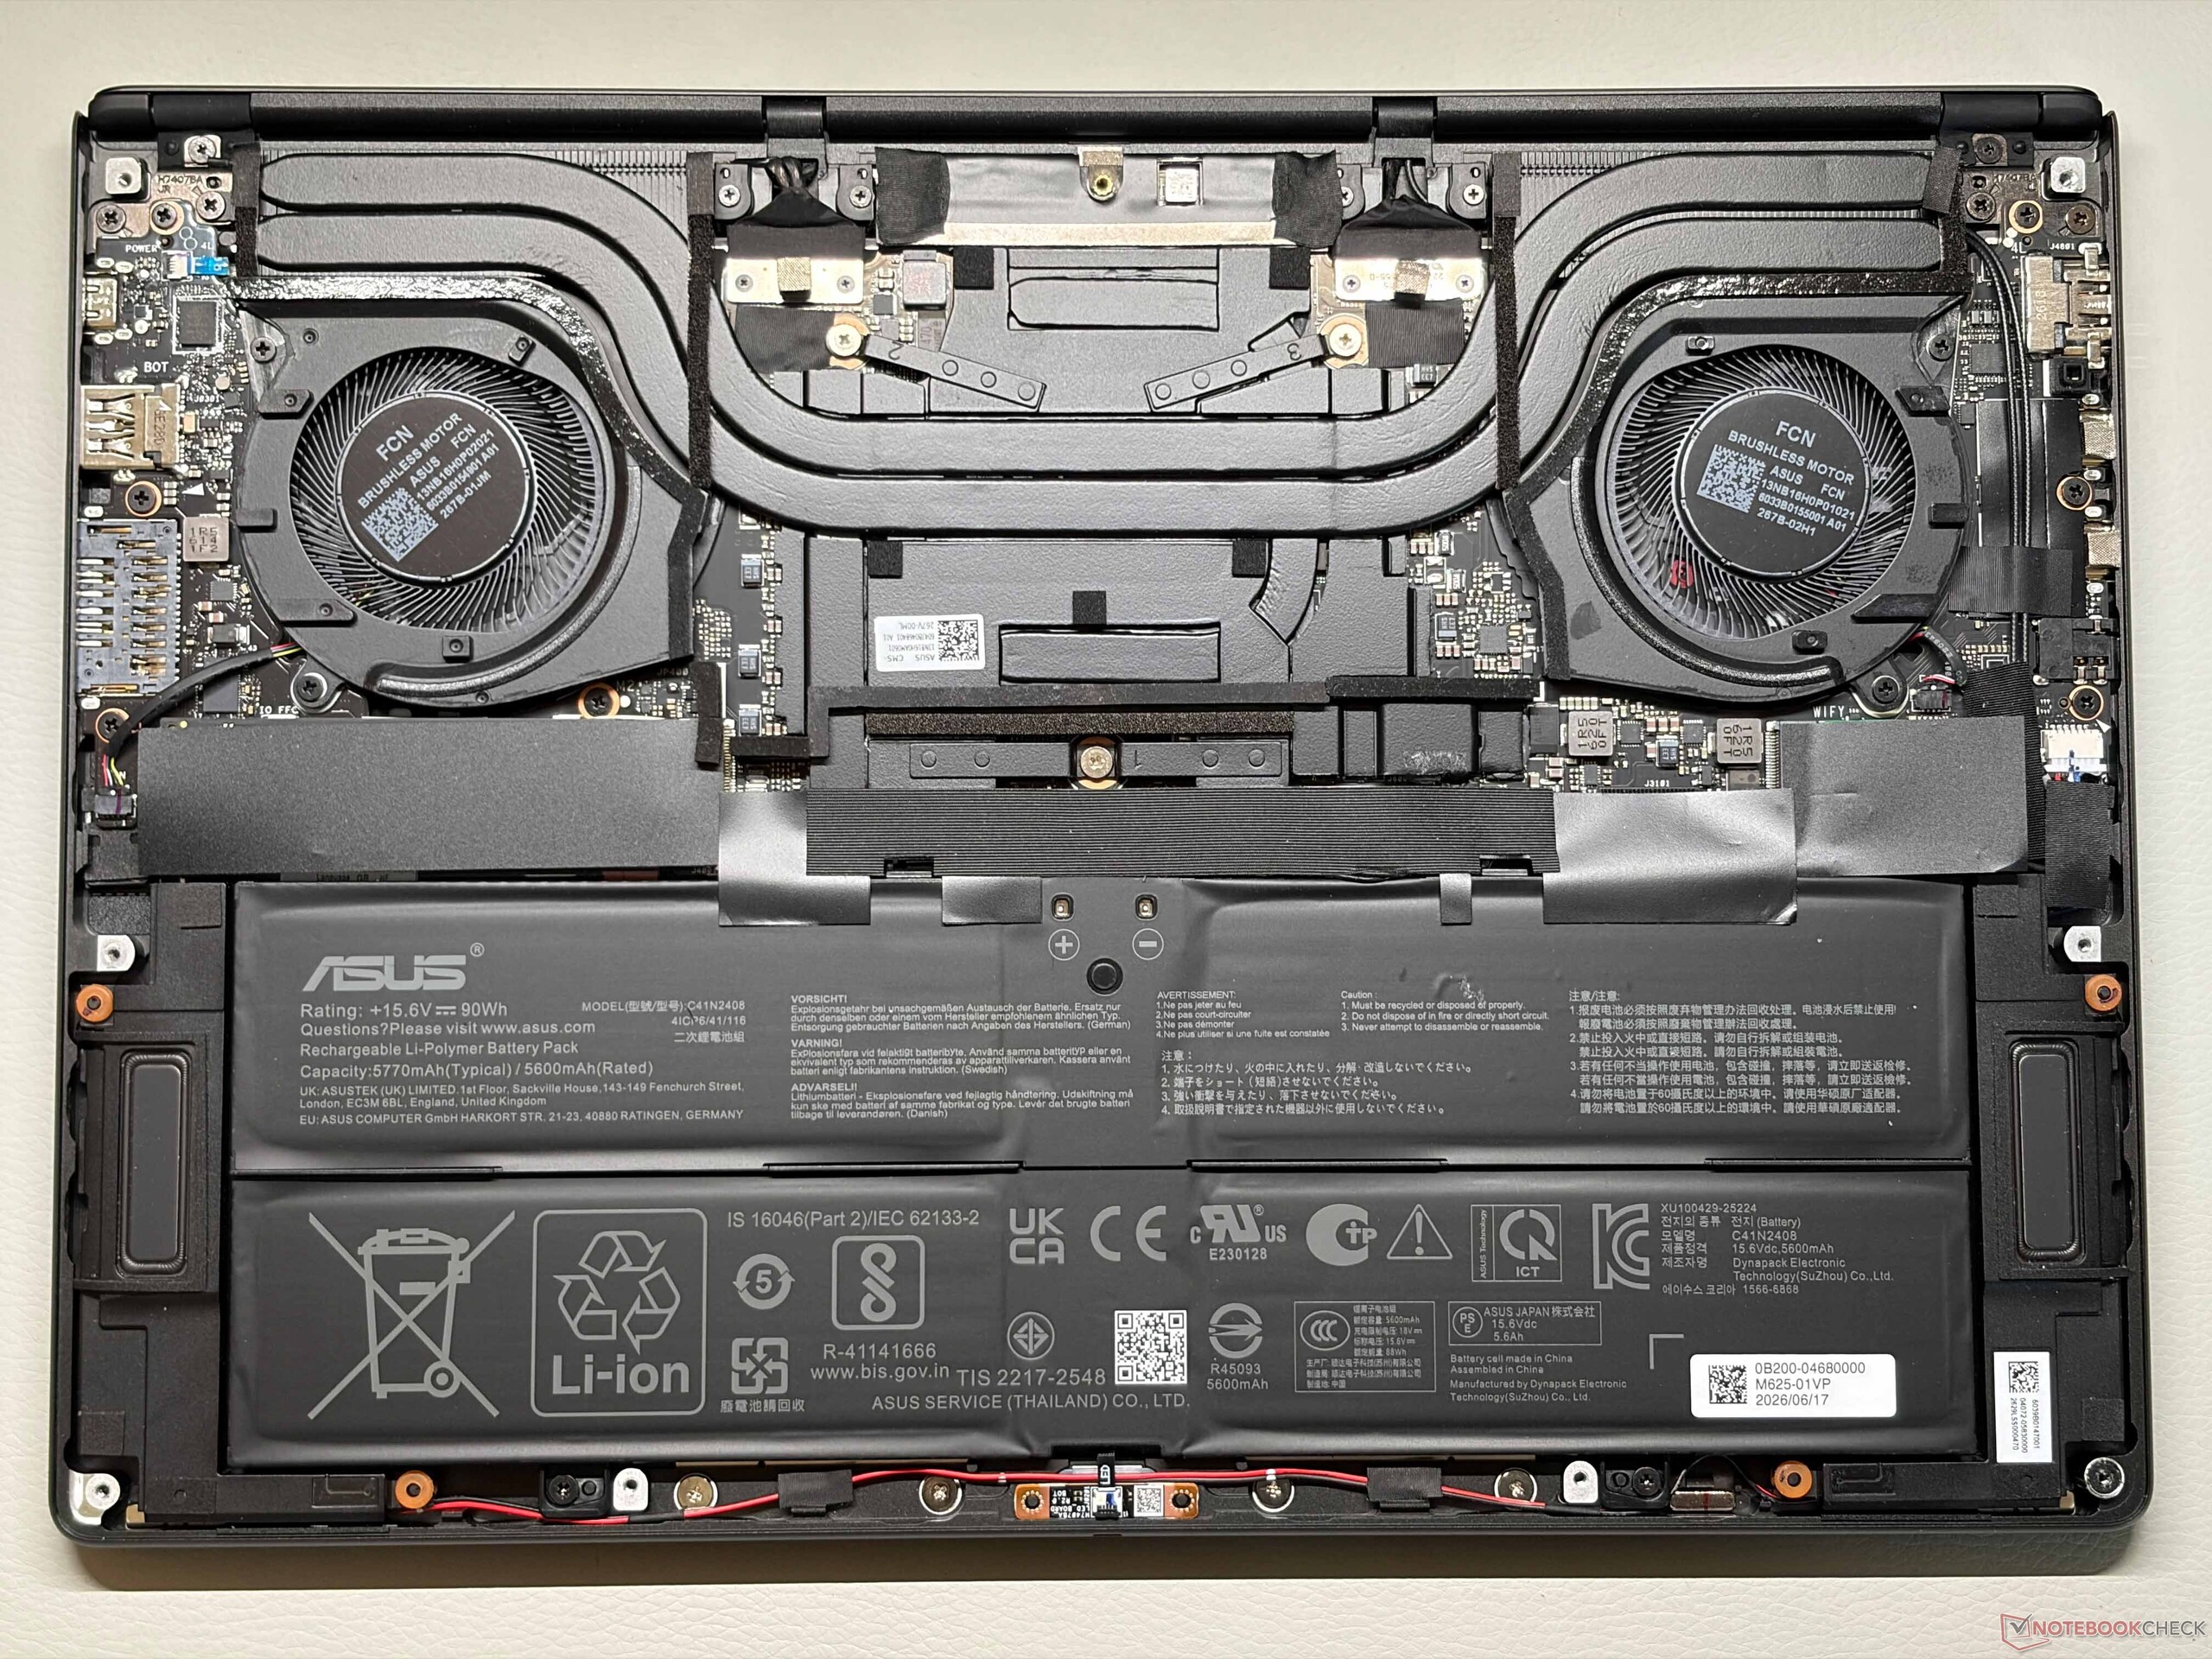
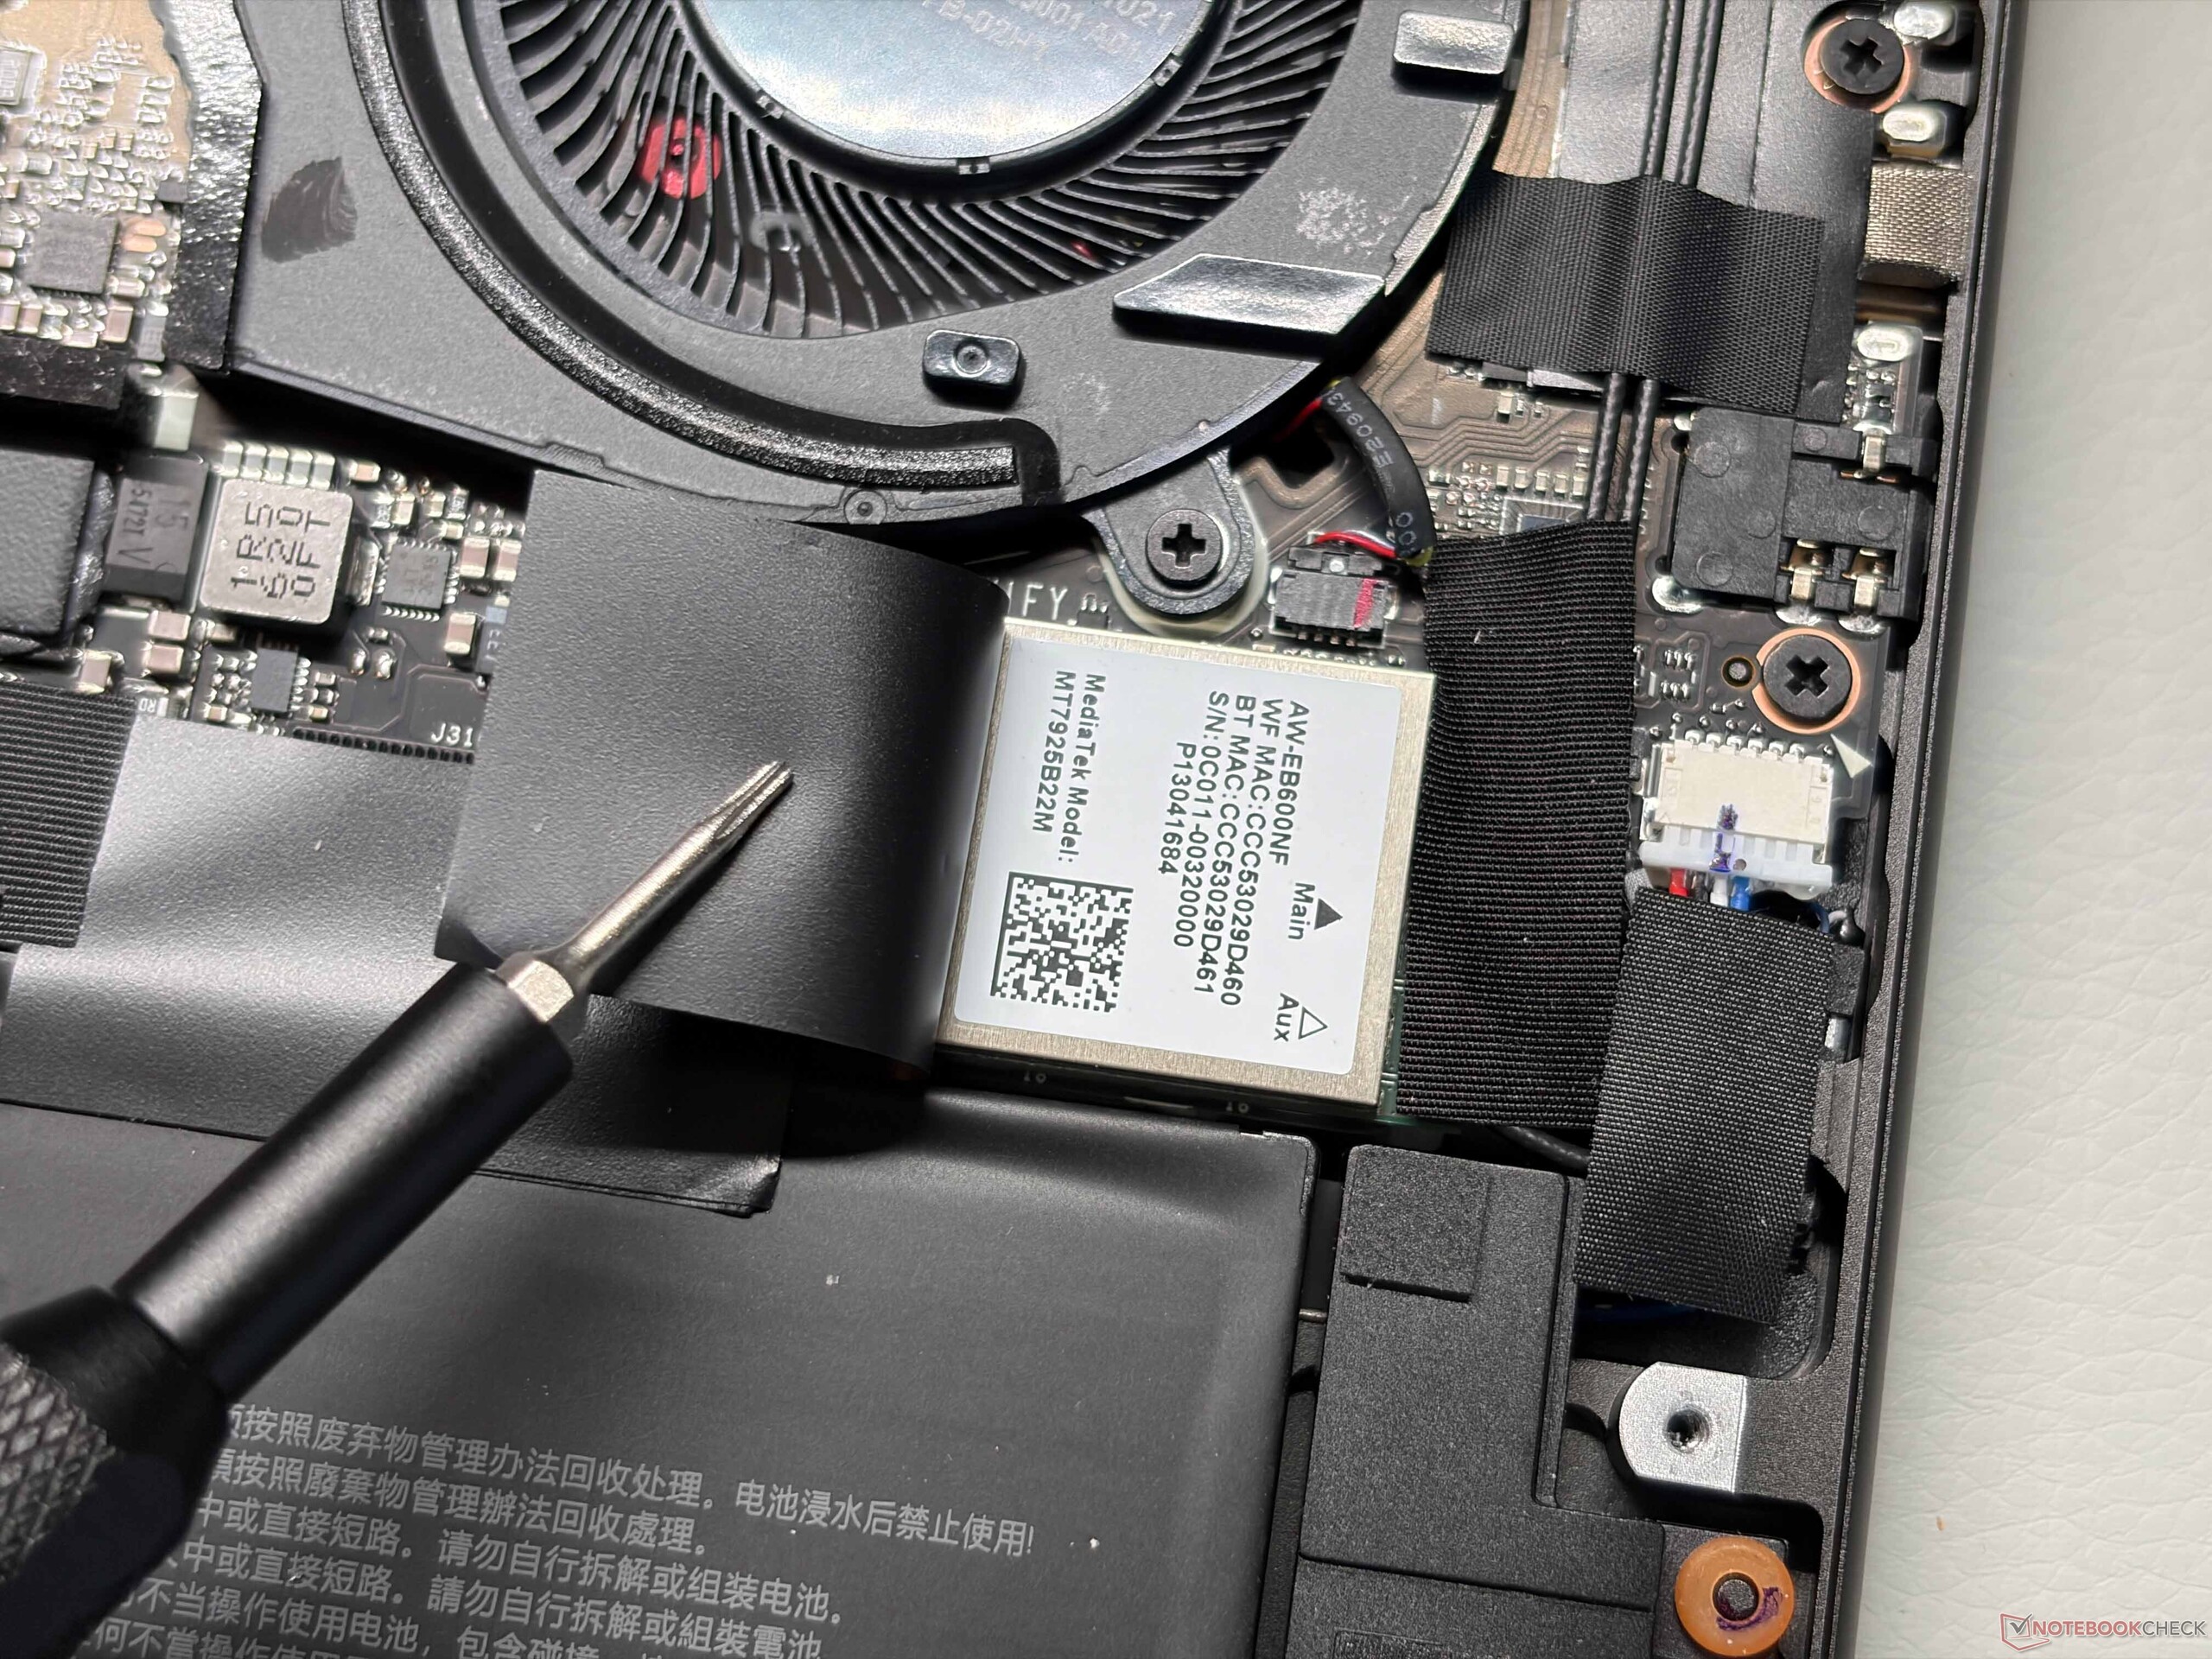
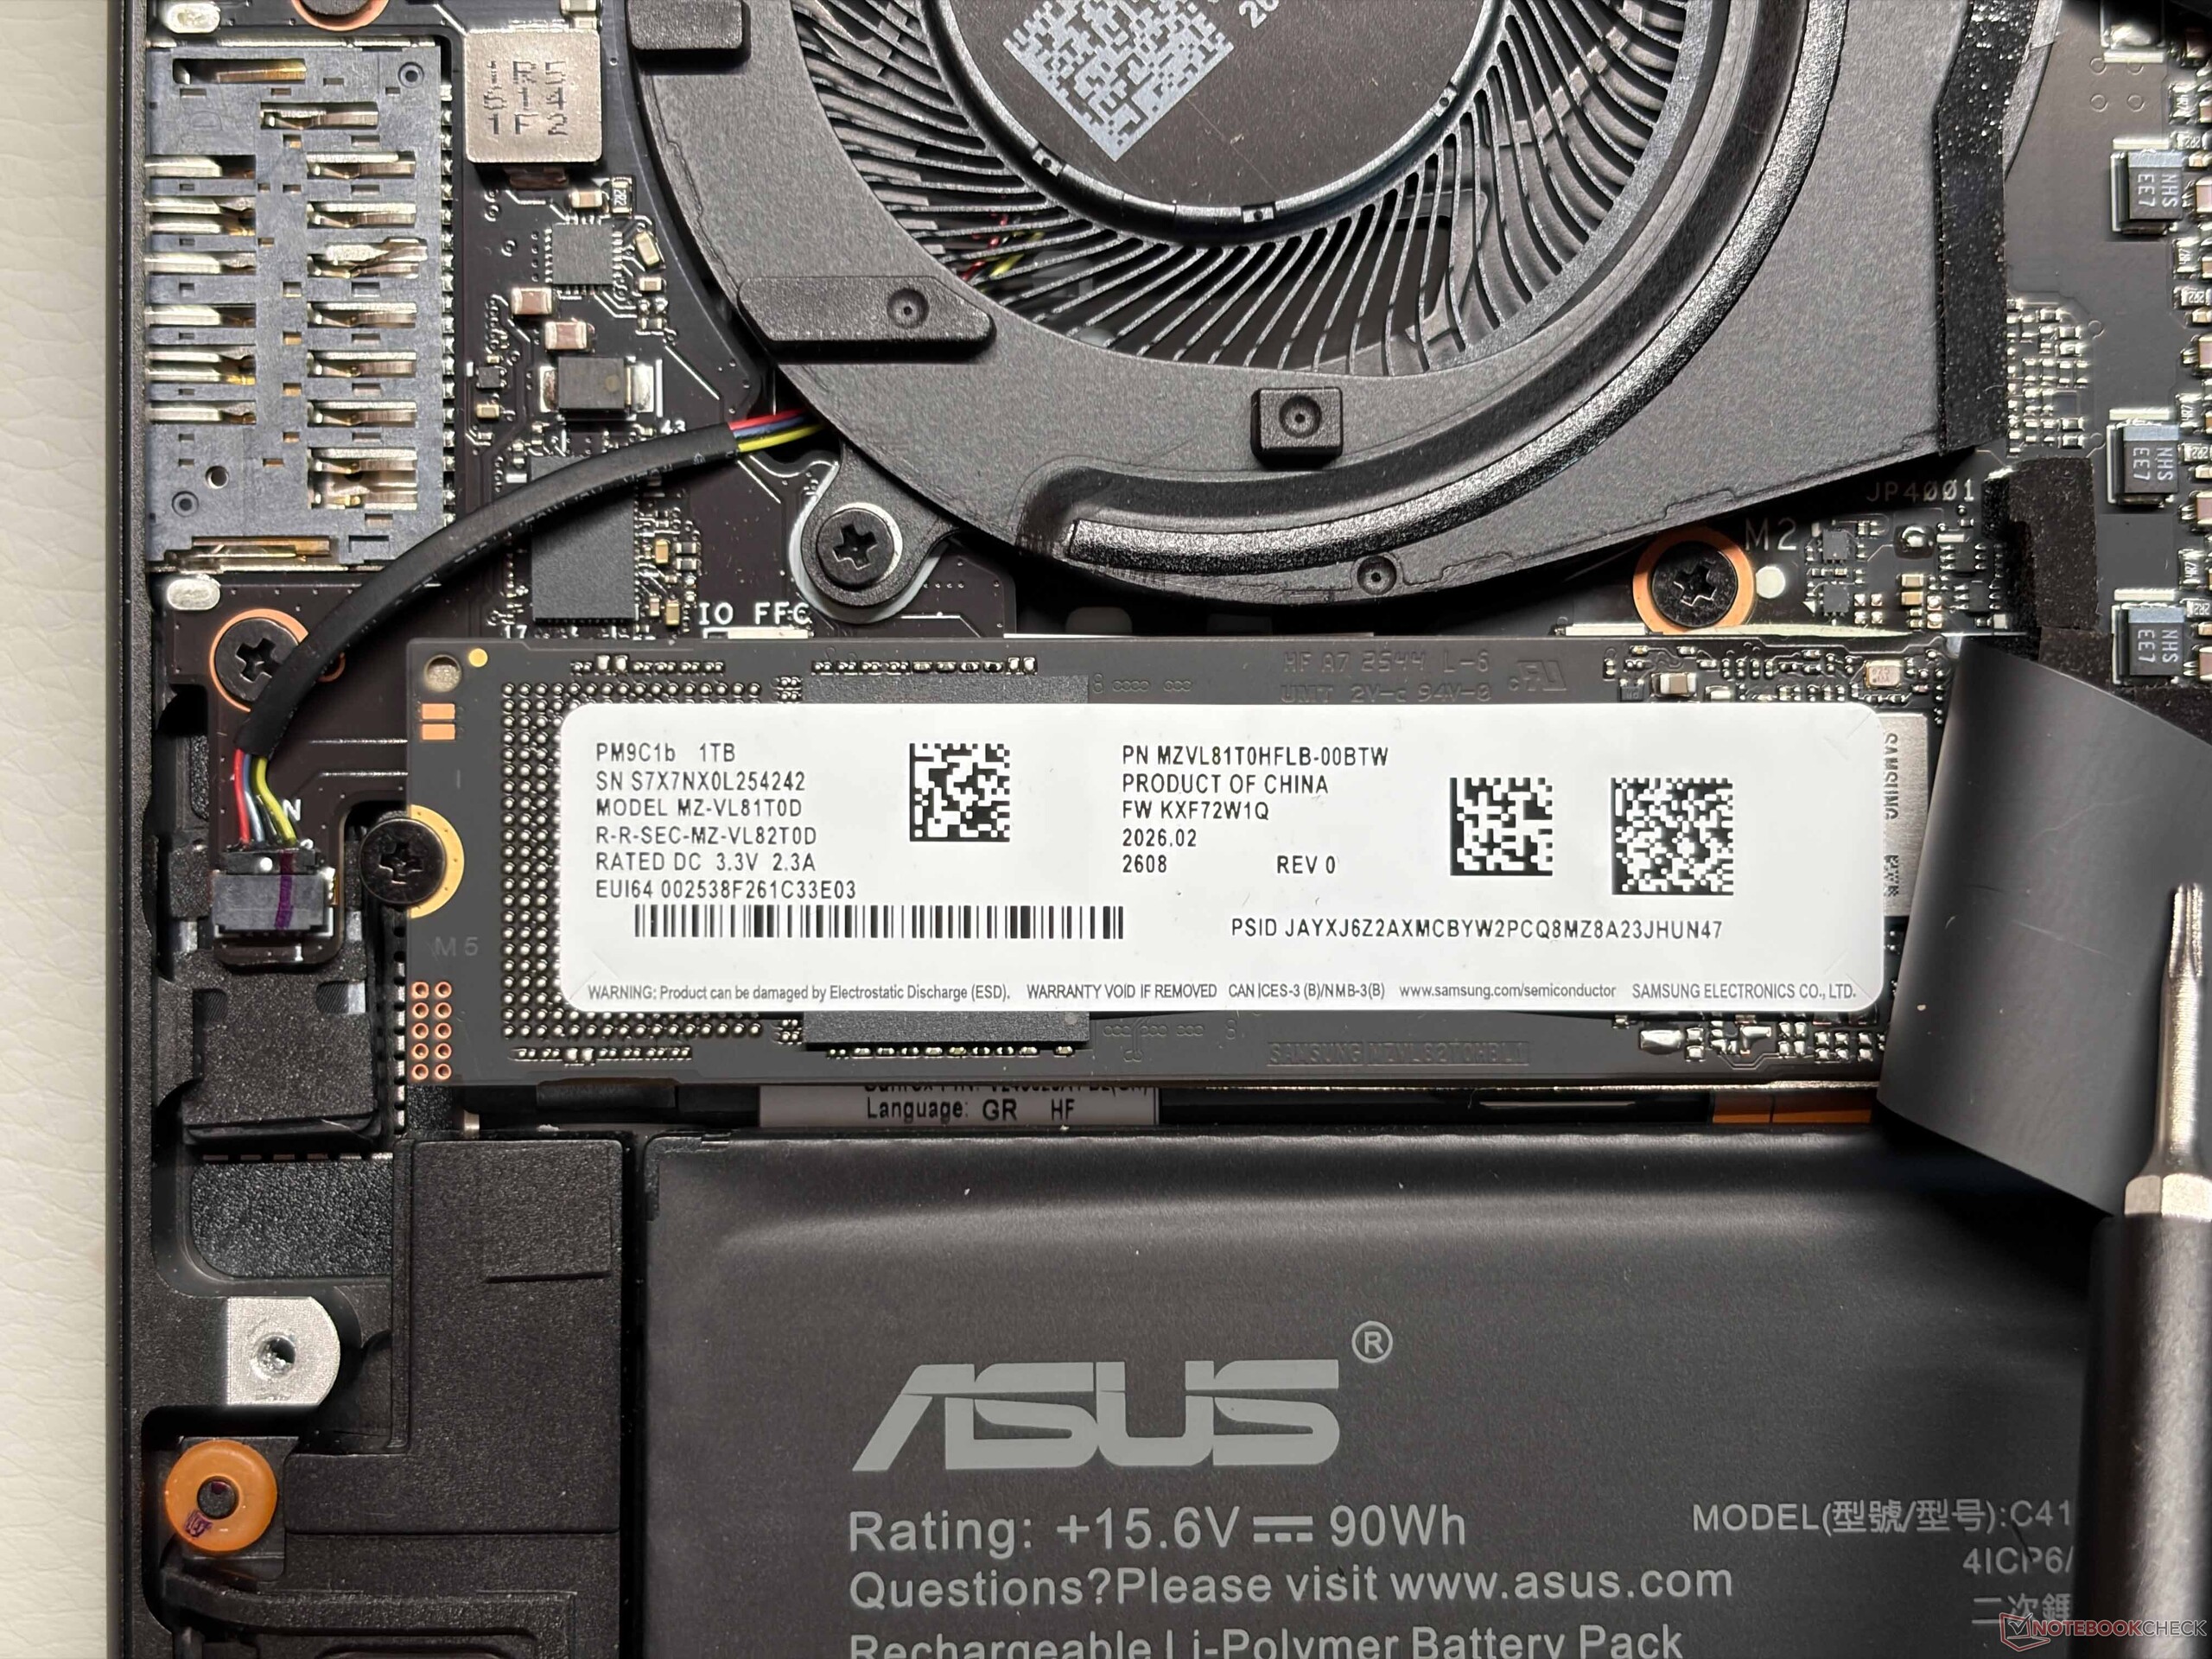
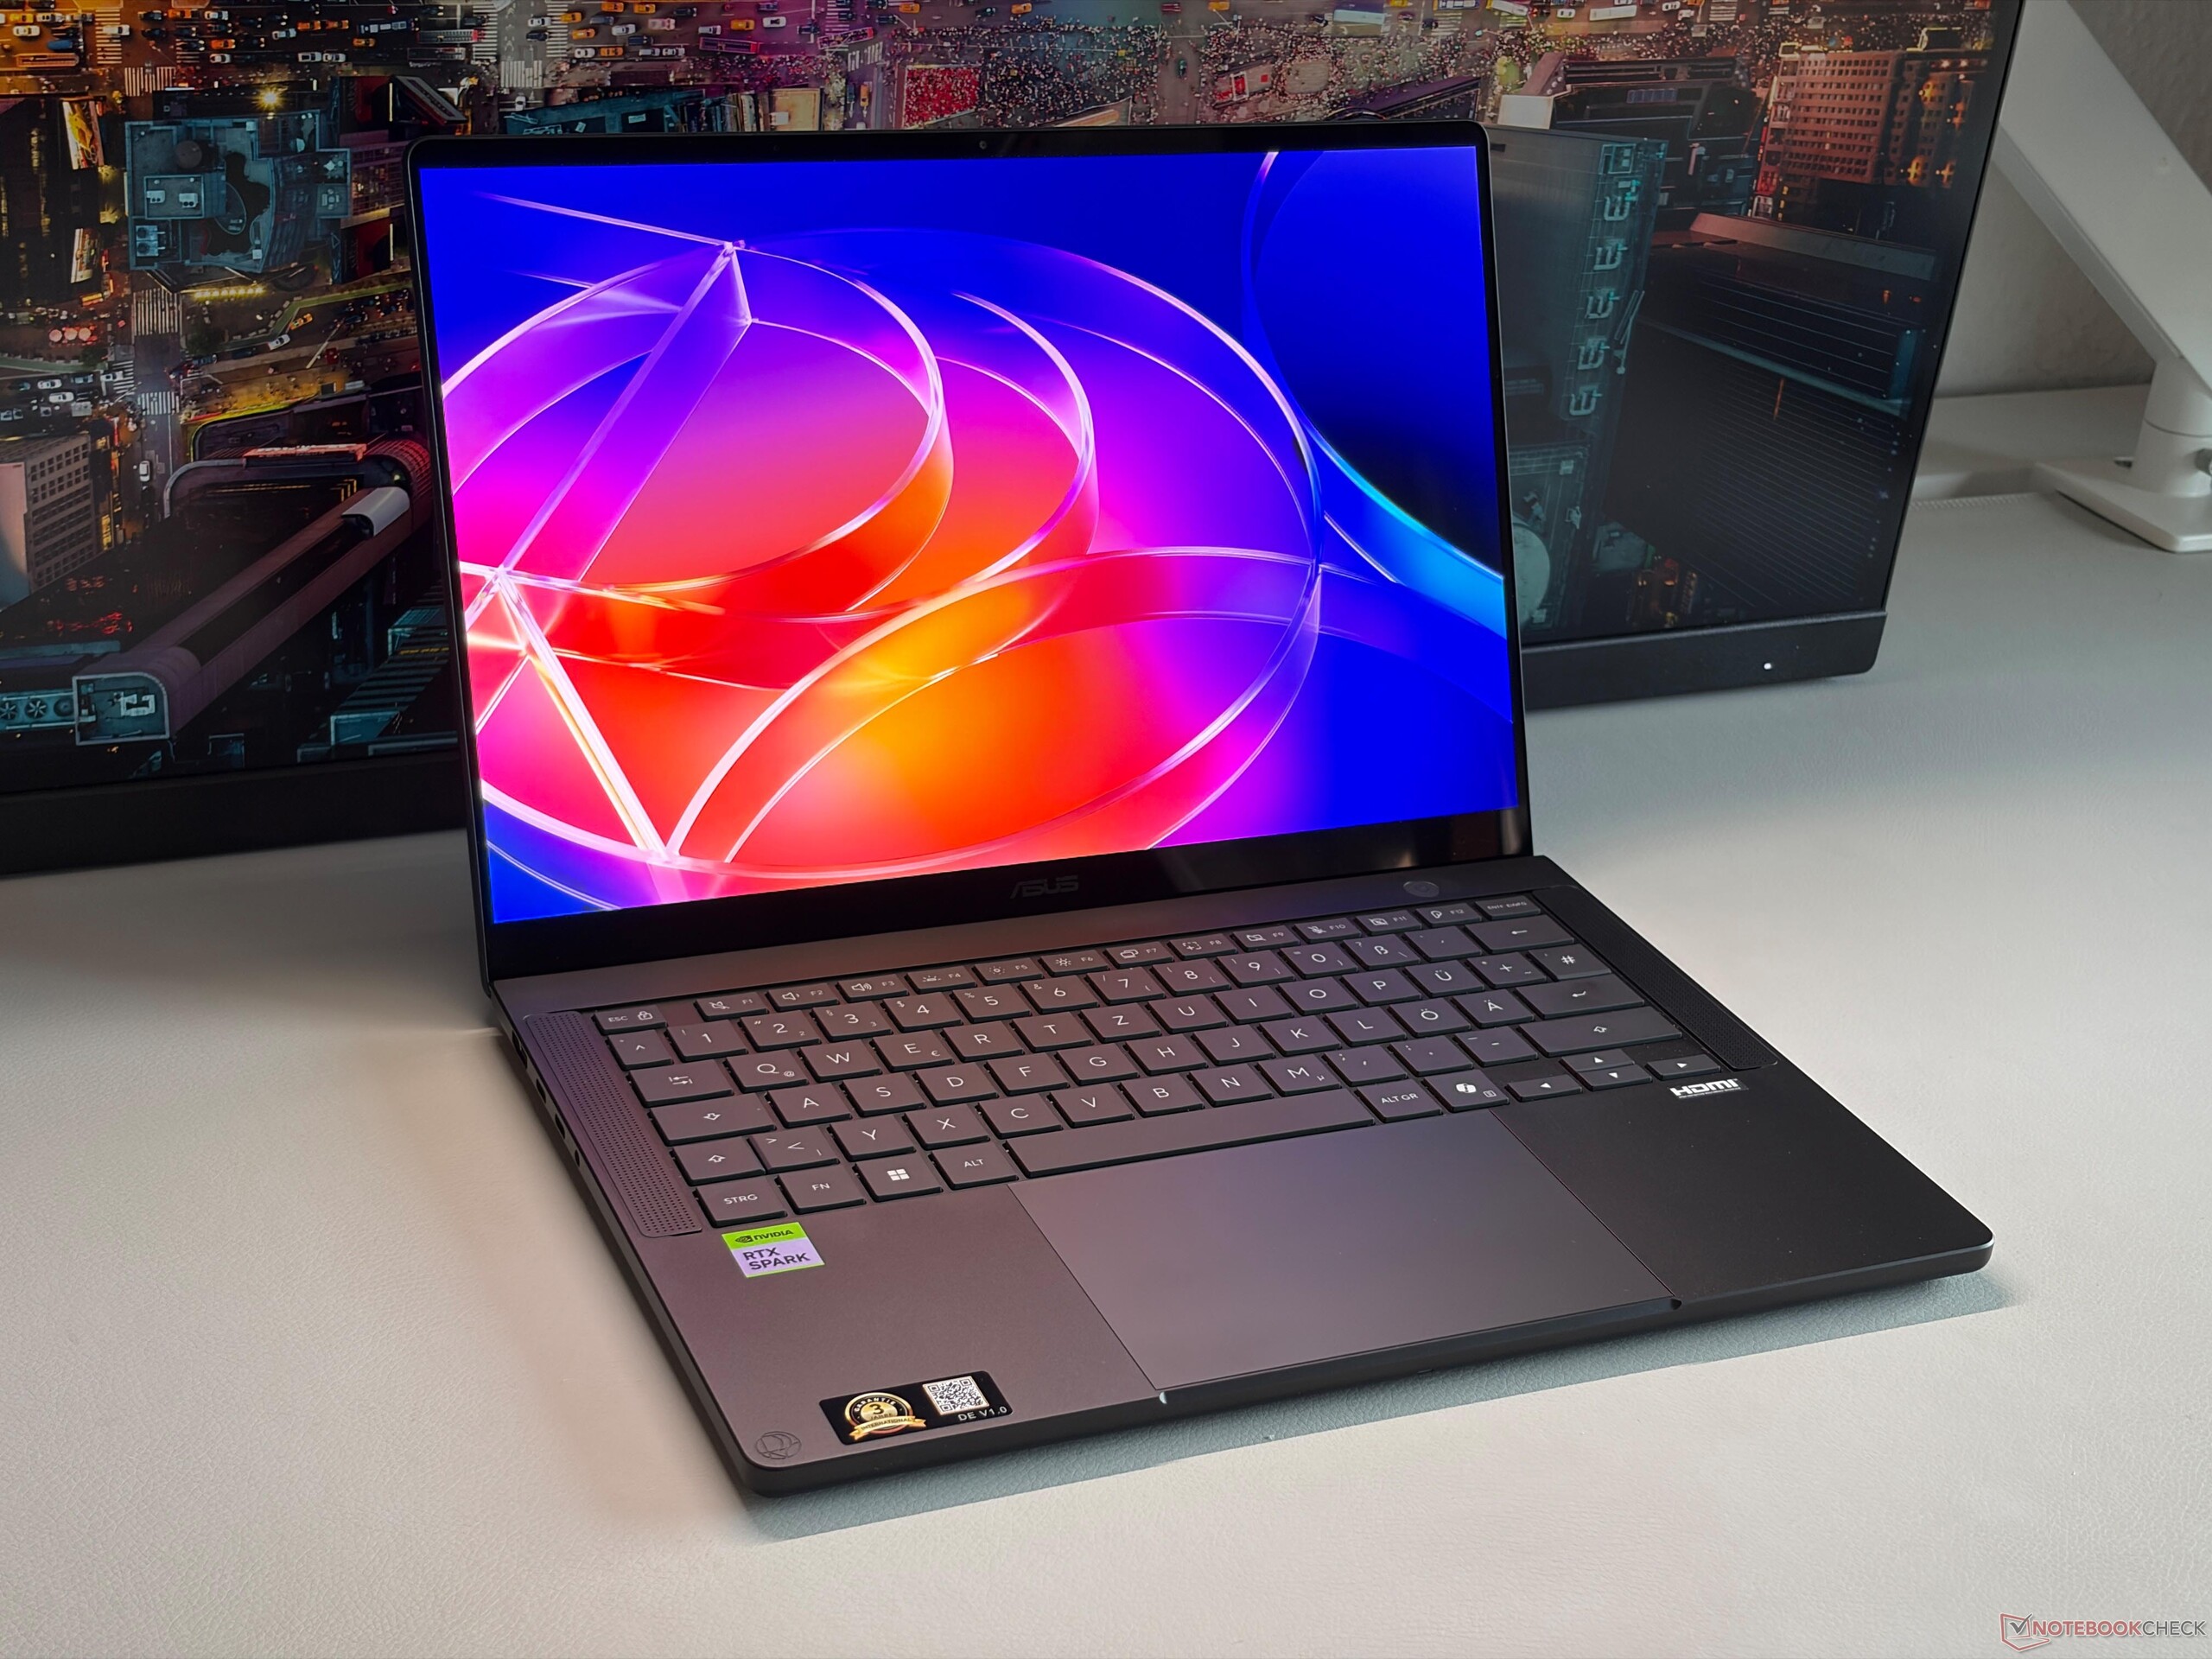
The ProArt P14 uses a black (or white) metal chassis and it is sleeker than the ROG Zephyrus G14, for example, and also a bit more compact compared to the Apple MacBook Pro 14 Mini-LED. Both the build quality and the stability are excellent, but our black review unit quickly attracts fingerprints and is also not that easy to clean. The hinges are a bit too lose considering this is a touchscreen, but there is not too much display wobble in regular use. Maintenance options include the fans, the battery, the M.2-2280 SSD as well as the Wi-Fi module.

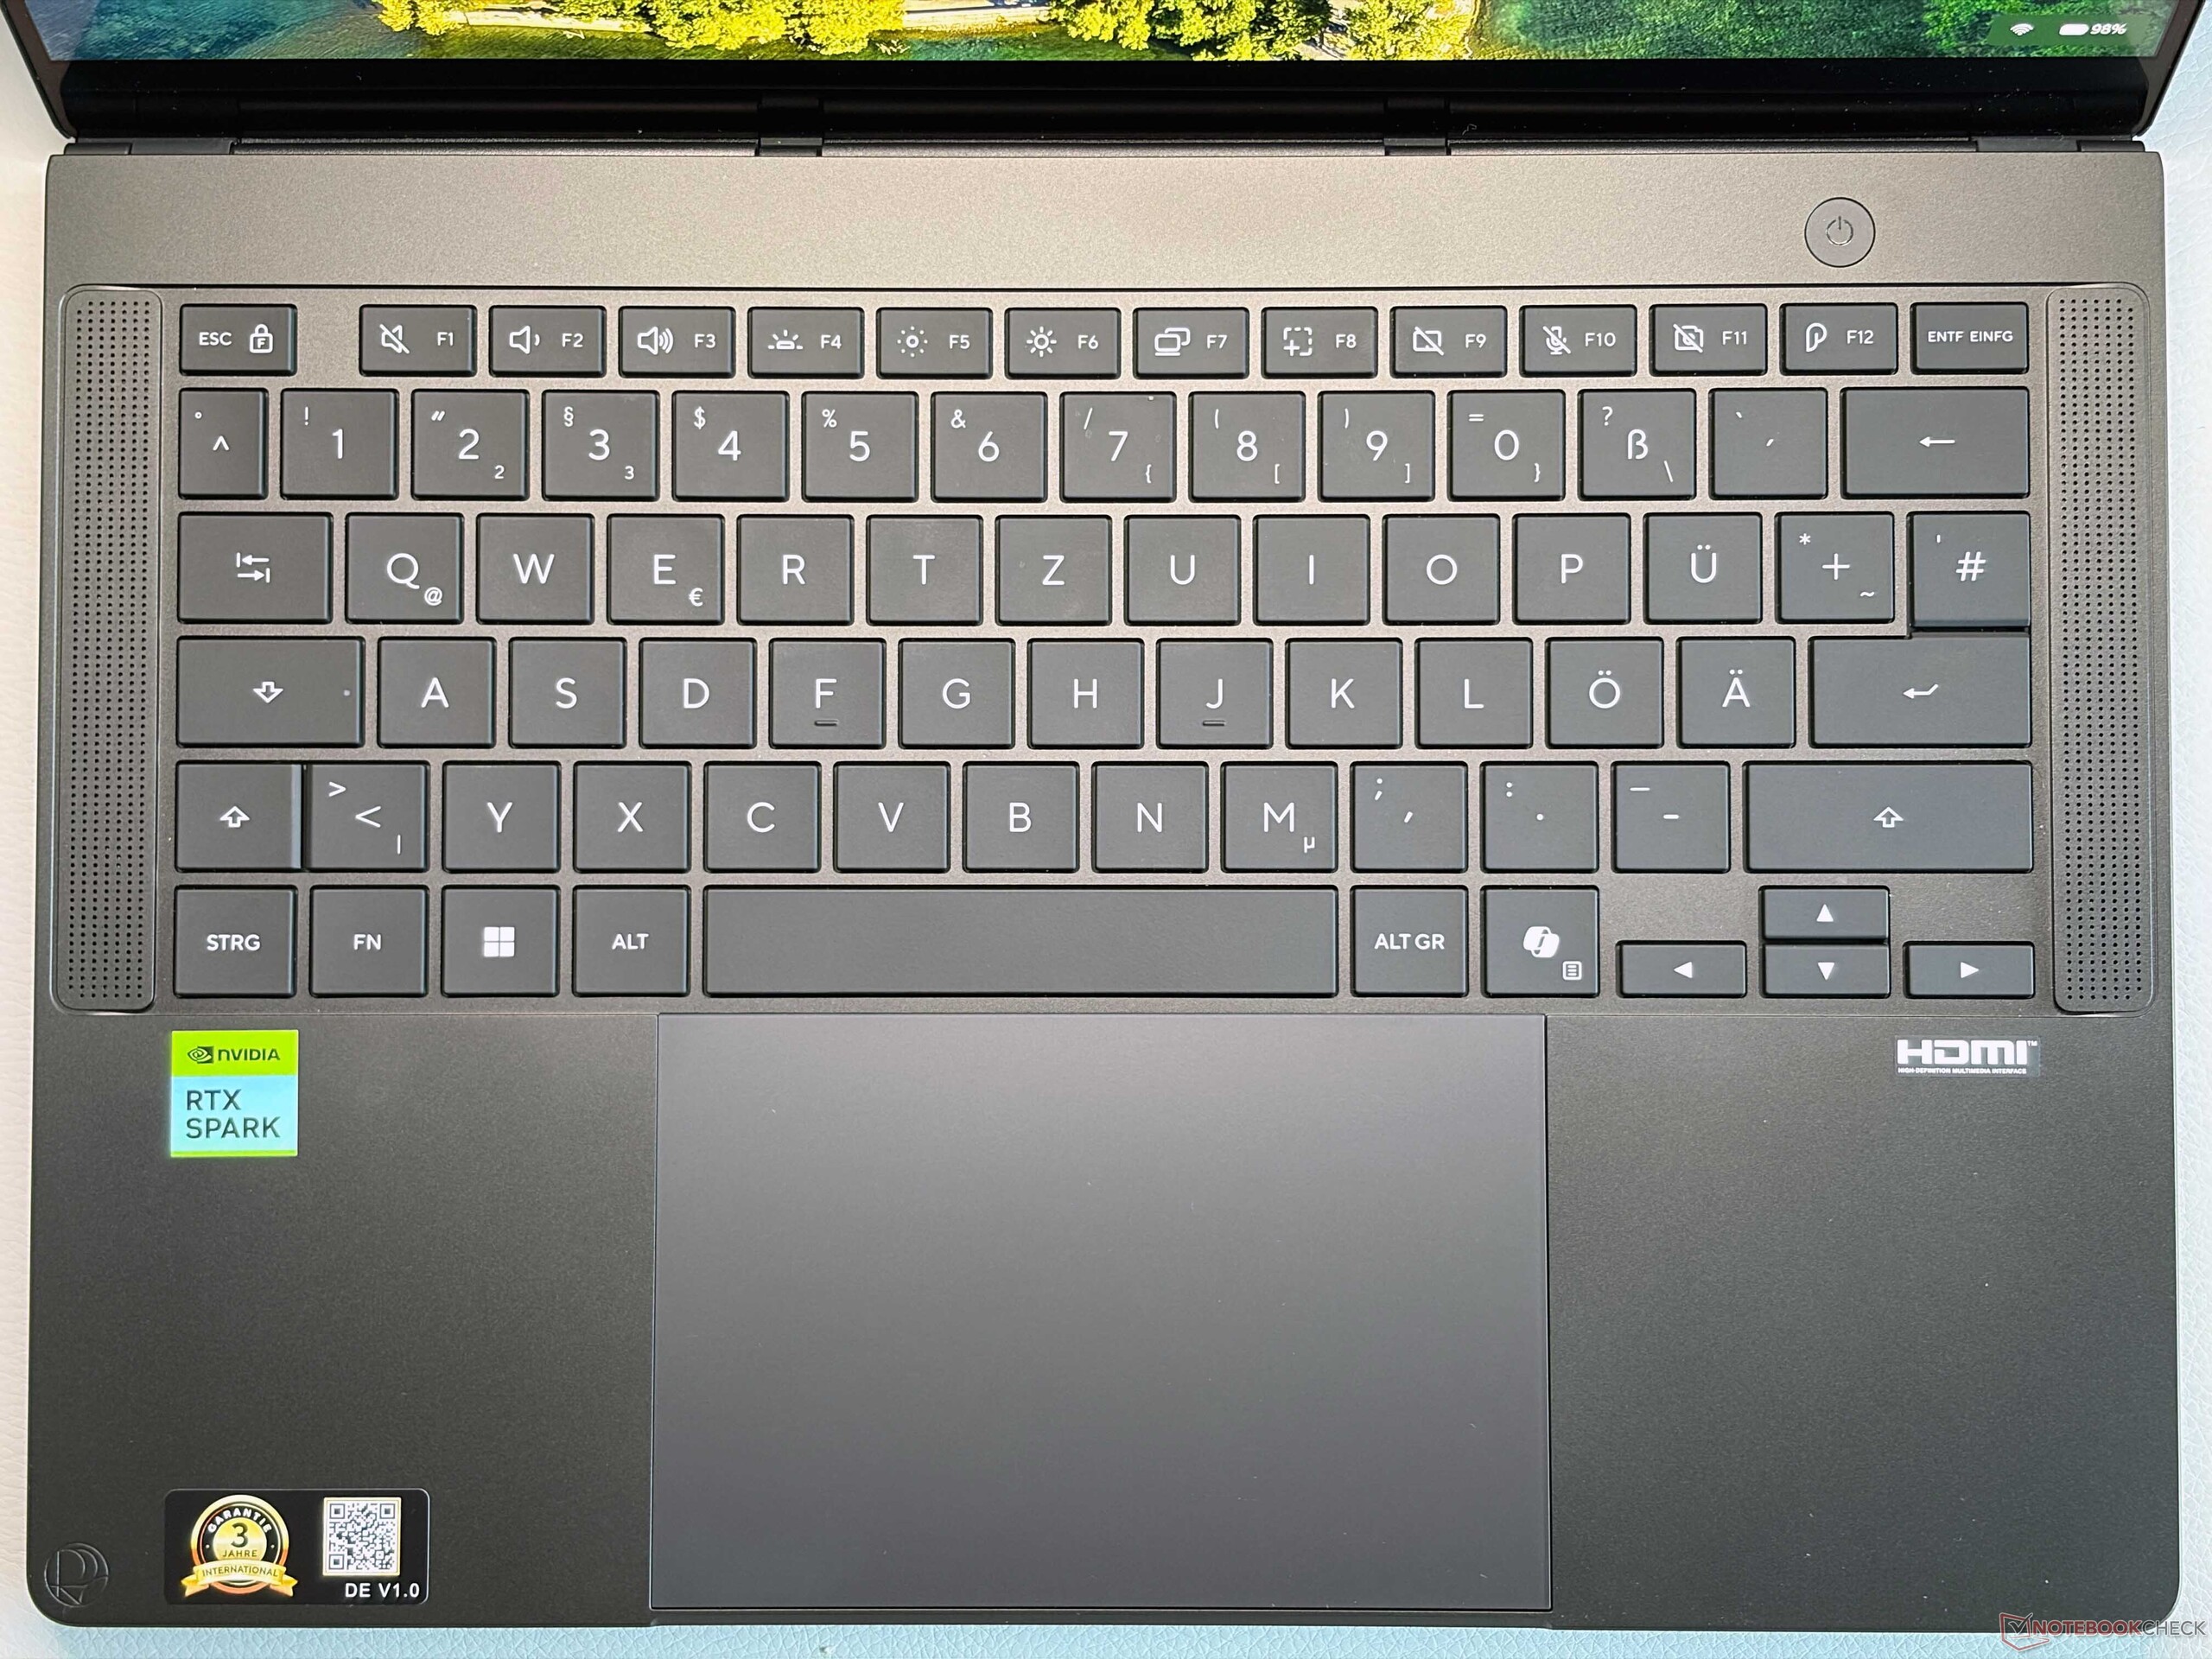
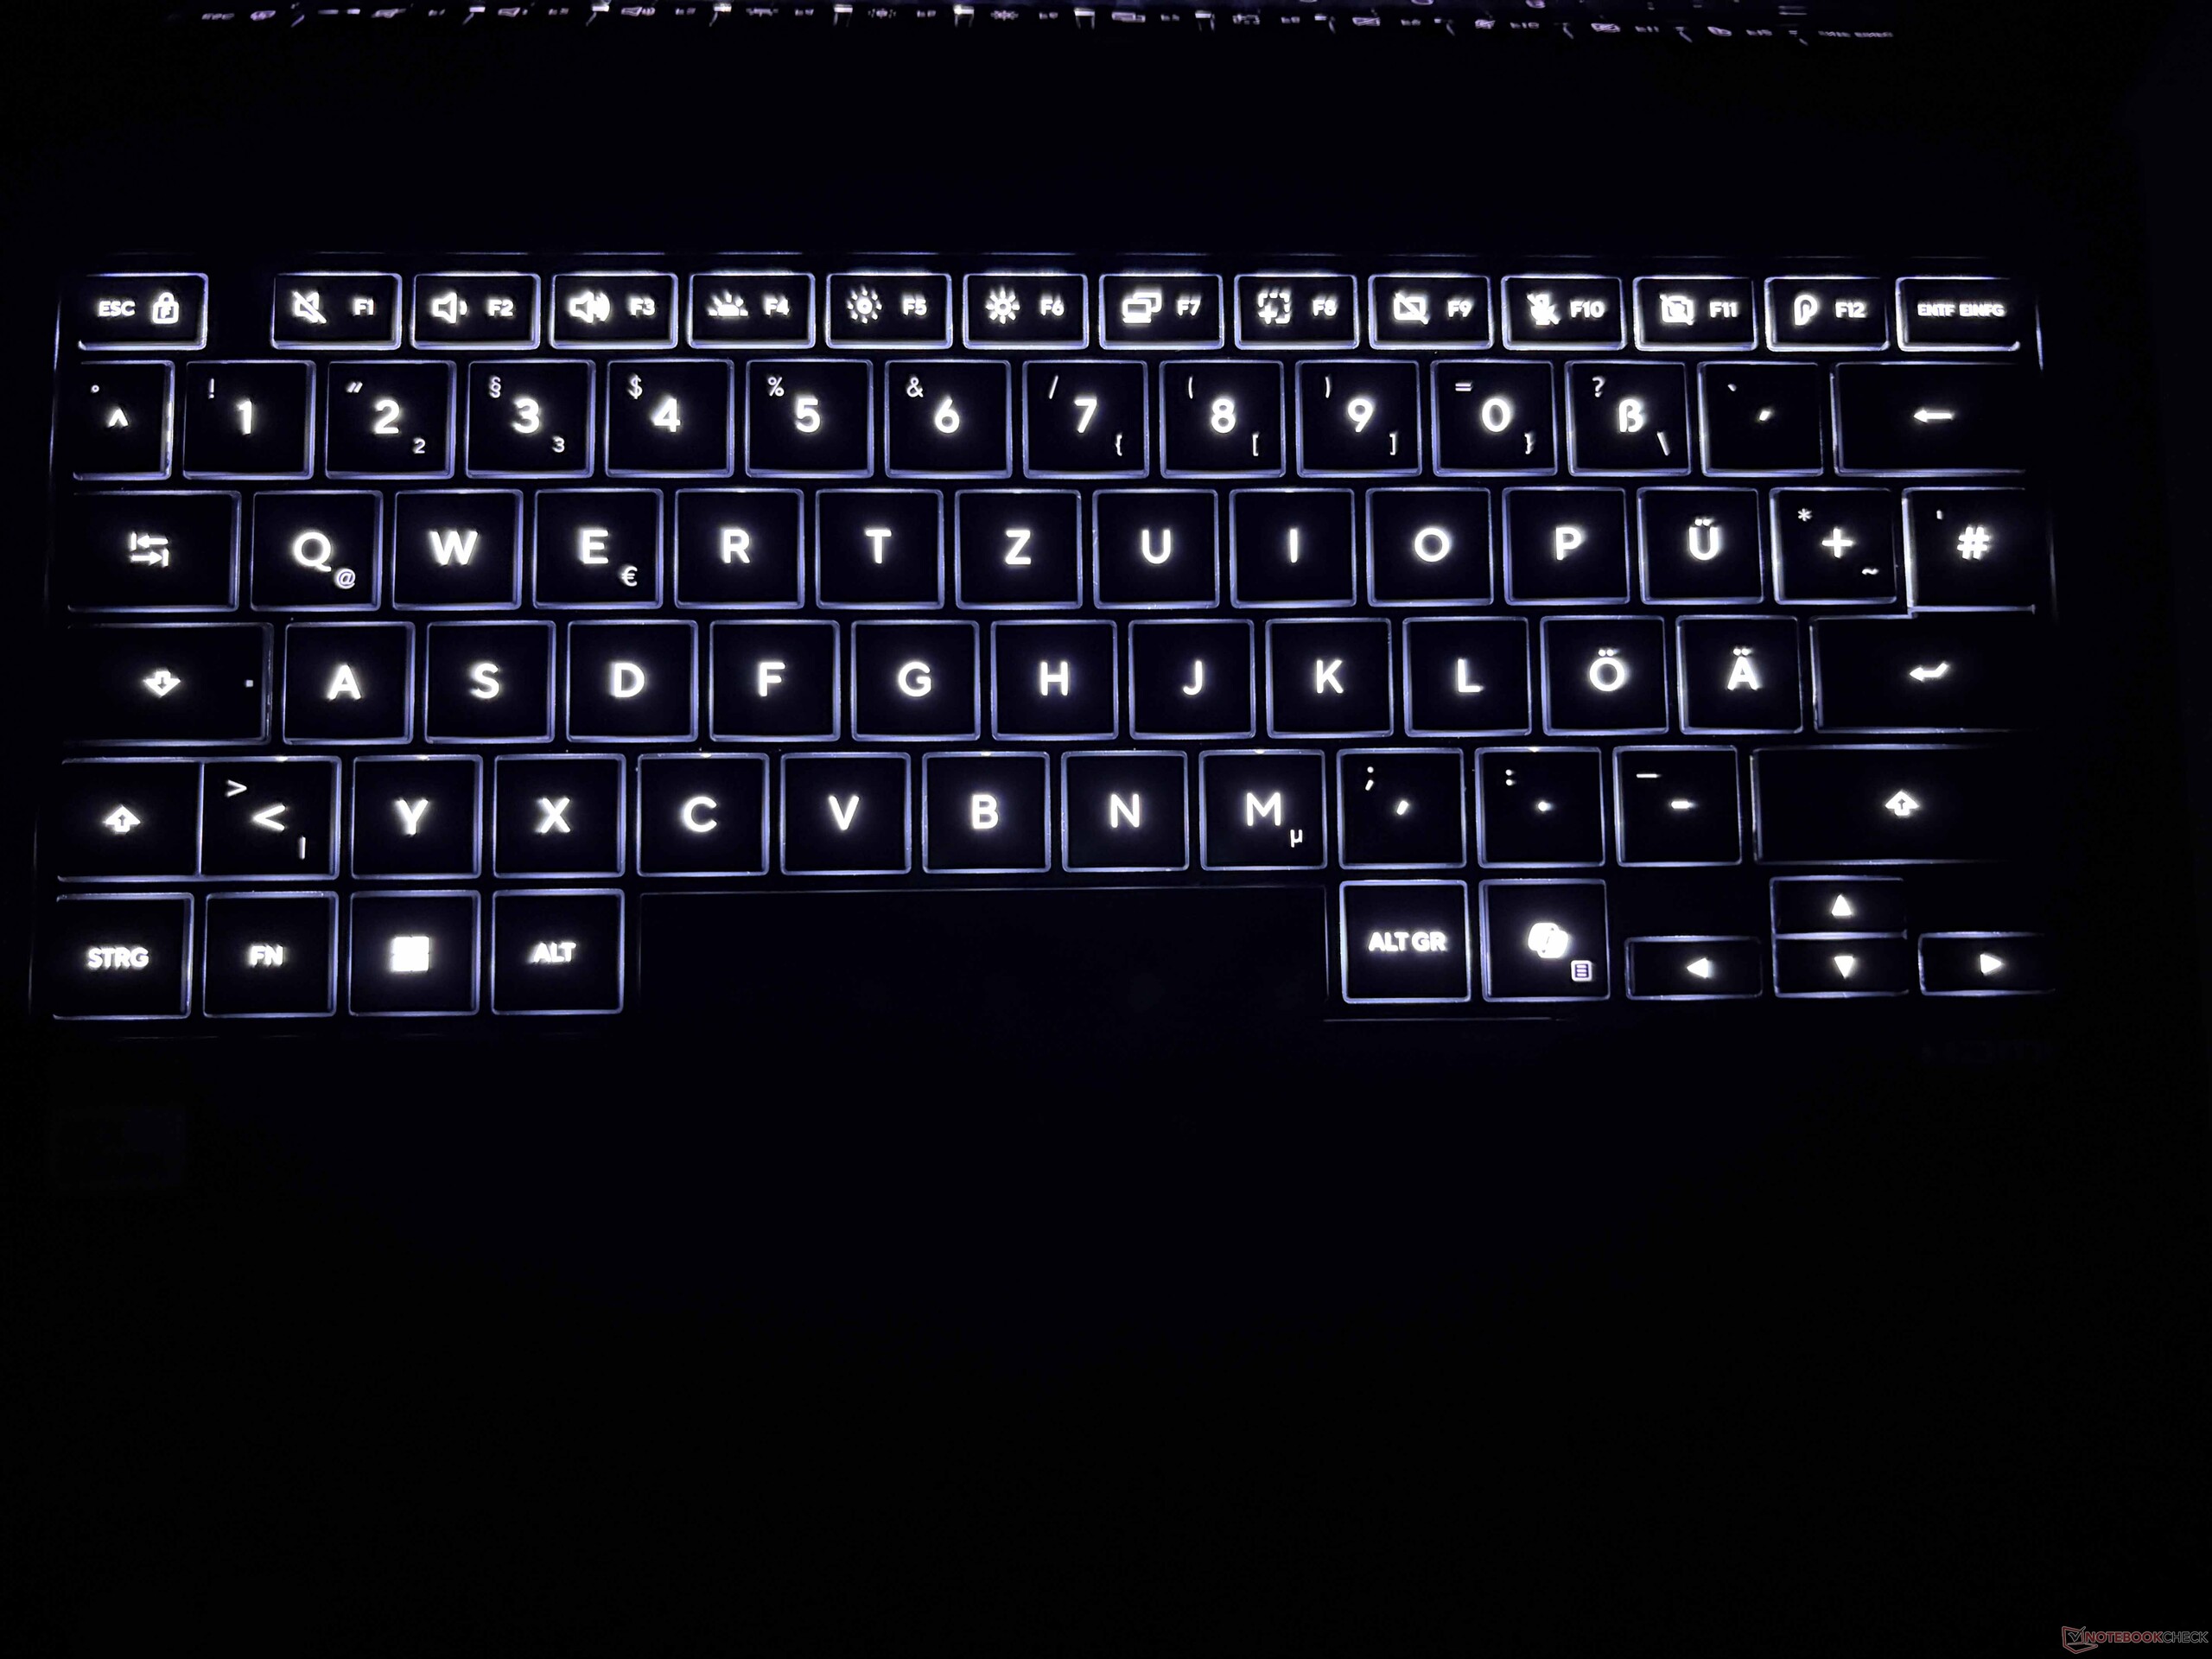
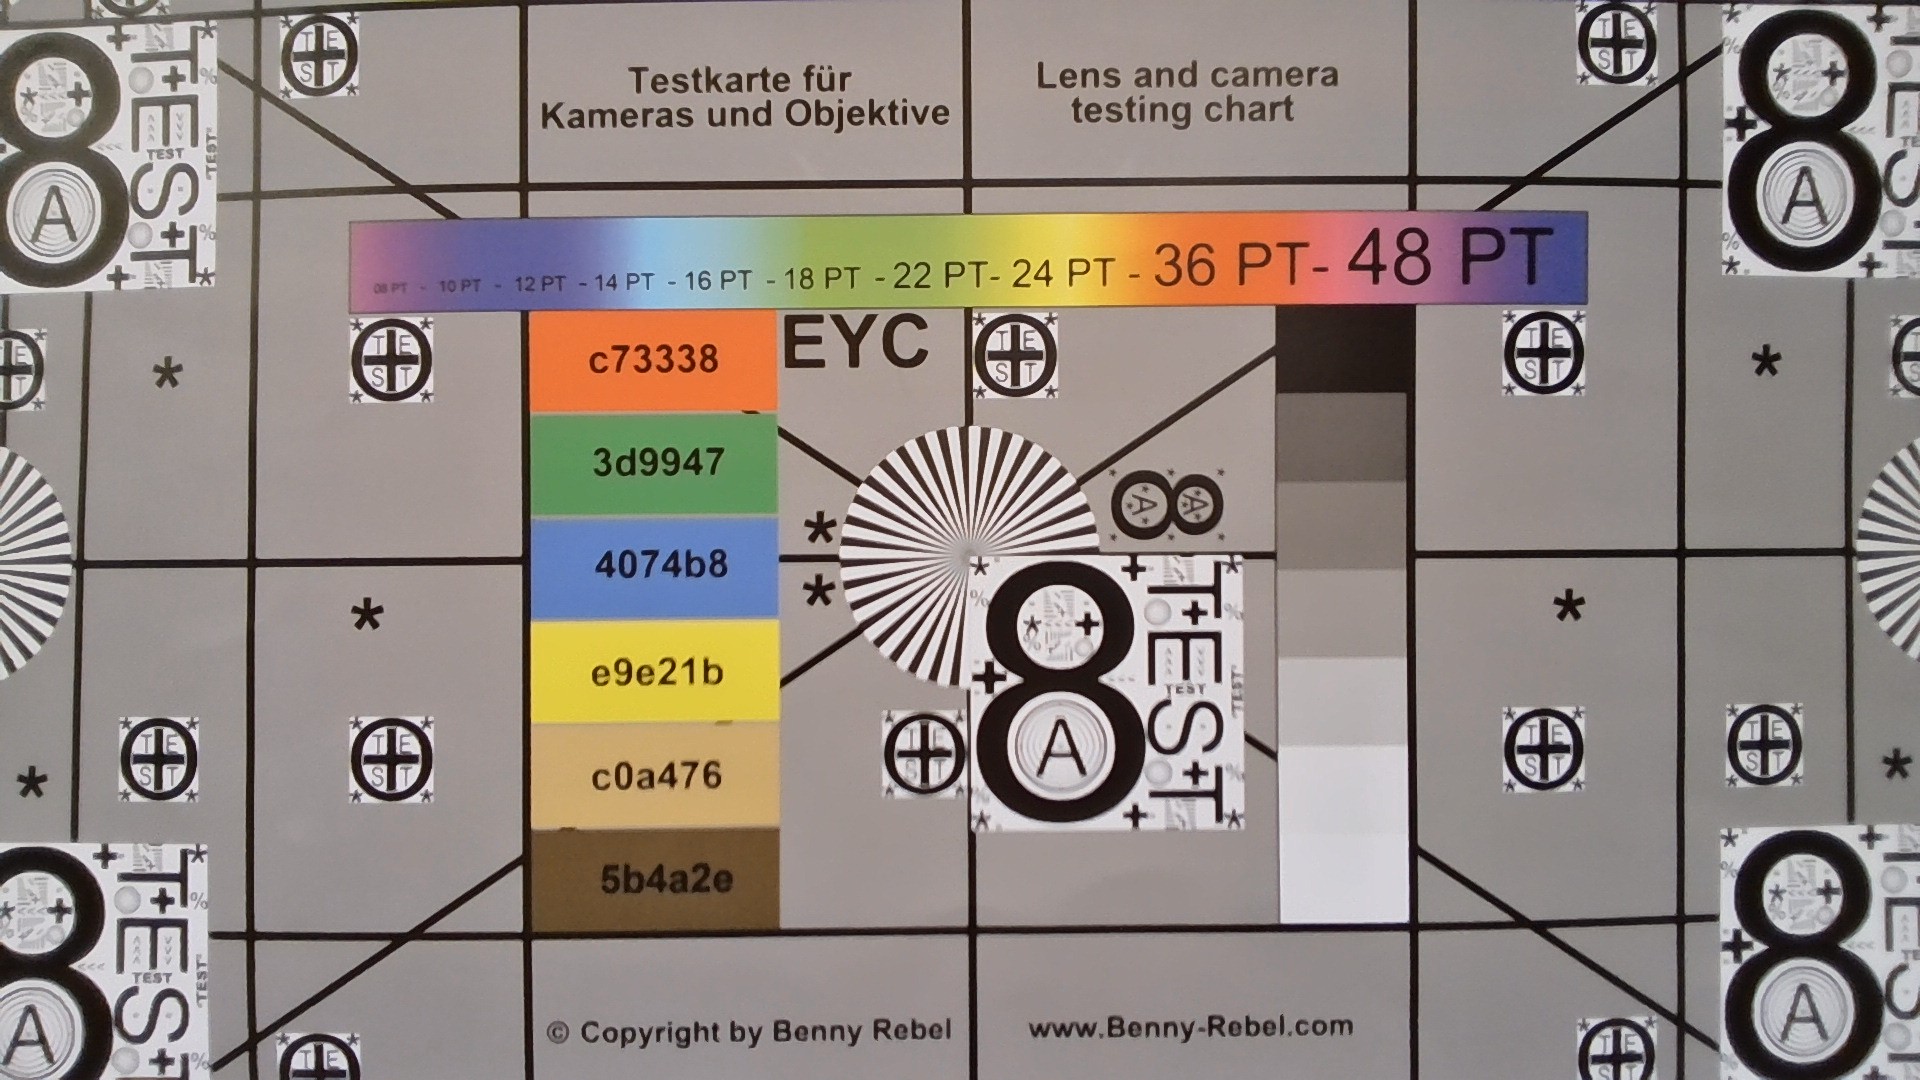
We were slightly worried about the keyboard quality due to the slimmer chassis, but it is fortunately still an excellent model and typing is extremely comfortable. The haptic trackpad also works great, even though you do not get a dial pad as on previous ProArt laptops anymore. Connectivity is very good with sufficient USB ports, fast Wi-Fi 7 and a speedy full-size SD-card reader, but it does not support the SD Express standard. The 1080p webcam does not take good pictures. 
Size Comparison

❌
312.2 mm / 12.3 in 215.5 mm / 8.48 in 18.5 mm / 0.728 in 1.6 kg3.5 lbs312.6 mm / 12.3 in 221.2 mm / 8.71 in 15.5 mm / 0.61 in 1.6 kg3.56 lbs311 mm / 12.2 in 220 mm / 8.66 in 16.3 mm / 0.642 in 1.6 kg3.46 lbs310.7 mm / 12.2 in 224.3 mm / 8.83 in 16.2 mm / 0.638 in 1.6 kg3.56 lbs310.7 mm / 12.2 in 218.9 mm / 8.62 in 15.9 mm / 0.626 in 1.5 kg3.27 lbs312 mm / 12.3 in 221 mm / 8.7 in 13.9 mm / 0.547 in 1.3 kg2.79 lbs309.52 mm / 12.2 in 209.71 mm / 8.26 in 14.62 mm / 0.576 in 1.4 kg3.18 lbs297 mm / 11.7 in 210 mm / 8.27 in 1 mm / 0.03937 in 5.7 g0.01257 lbs
Left: HDMI 2.1 FRL, 2x USB-C 4.0 (40 Gbps, DisplayPort, Power Delivery), 3.5 mm stereo jack
Right: SD-card reader (UHS-II), USB-A 3.2 Gen. 2 (10 Gbps), USB-C 4.0 (40 Gbps, DisplayPort, Power Delivery)
SD Card Reader
maximum AS SSD Seq Read Test (1GB)
Asus ProArt P14 H7407
RTX Spark N1X 6144-Core Blackwell GPU, Spark RTX N1X 20-Core, Samsung PM9C1b MZVL81T0HFLB-00BH1
236.6 MB/s
Apple MacBook Pro 14 2026 M5 Max
M5 Max 40-Core GPU, M5 Max, Apple SSD AP8192Z
227 MB/s -4%
Asus ROG Zephyrus G14 GU405AR
GeForce RTX 5070 Ti Laptop, Ultra 9 386H, Kioxia BG6 KBG60ZNV1T02
225.4 MB/s -5%
Razer Blade 14 2025
GeForce RTX 5070 Laptop, Ryzen AI 9 365, Samsung PM9A1 MZVL21T0HCLR
211.3 MB/s -11%
average JPG Copy Test (av. of 3 runs)
Razer Blade 14 2025
GeForce RTX 5070 Laptop, Ryzen AI 9 365, Samsung PM9A1 MZVL21T0HCLR
202 MB/s +30%
Asus ROG Zephyrus G14 GU405AR
GeForce RTX 5070 Ti Laptop, Ultra 9 386H, Kioxia BG6 KBG60ZNV1T02
182 MB/s +17%
Asus ProArt P14 H7407
RTX Spark N1X 6144-Core Blackwell GPU, Spark RTX N1X 20-Core, Samsung PM9C1b MZVL81T0HFLB-00BH1
155 MB/s
Apple MacBook Pro 14 2026 M5 Max
M5 Max 40-Core GPU, M5 Max, Apple SSD AP8192Z
137.2 MB/s -11%
Networking
Asus ProArt P14 H7407
Mediatek Wi-Fi 7 MT7925 Wireless LAN Card
iperf3 transmit Wi-Fi6/7 RT-BE96U
2222 (min: 2180) MBit/s ∼50%
iperf3 receive Wi-Fi6/7 RT-BE96U
2226 (min: 2155) MBit/s ∼69%
Apple MacBook Pro 14 2026 M5 Max
Apple N1 160MHz Wi-Fi 7
iperf3 transmit AXE11000
1814 (min: 1780) MBit/s ∼98%
iperf3 receive AXE11000
1818 (min: 1776) MBit/s ∼100%
Asus ROG Zephyrus G14 GU405AR
Intel Wi-Fi 7 BE211 320MHz
iperf3 transmit Wi-Fi6/7 RT-BE96U
4473 (min: 3979) MBit/s ∼100%
iperf3 receive Wi-Fi6/7 RT-BE96U
3208 (min: 1650) MBit/s ∼100%
Lenovo Yoga Slim 7 14Q8Y11
Qualcomm FastConnect 7800
iperf3 receive AXE11000 6GHz
1759 (min: 1731) MBit/s ∼100%
iperf3 transmit AXE11000 6GHz
1592 (min: 1563) MBit/s ∼100%
iperf3 transmit AXE11000
1427 (min: 1205) MBit/s ∼77%
iperf3 receive AXE11000
1468 (min: 1159) MBit/s ∼81%
Dell XPS 14 Core Ultra X7 358H
Intel Wi-Fi 7 BE211 320MHz
iperf3 receive AXE11000 6GHz
1740 (min: 1711) MBit/s ∼99%
iperf3 transmit AXE11000 6GHz
1440 (min: 1053) MBit/s ∼90%
iperf3 transmit AXE11000
844 (min: 426) MBit/s ∼46%
iperf3 receive AXE11000
765 (min: 660) MBit/s ∼42%
Razer Blade 14 2025
Mediatek Wi-Fi 7 MT7925 Wireless LAN Card
iperf3 transmit AXE11000
1842 (min: 1618) MBit/s ∼100%
iperf3 receive AXE11000
1719 (min: 1648) MBit/s ∼95%
HP ZBook Ultra G1a 14
Mediatek Wi-Fi 7 MT7925 Wireless LAN Card
iperf3 receive AXE11000 6GHz
1762 (min: 1731) MBit/s ∼100%
iperf3 transmit AXE11000 6GHz
1409 (min: 1348) MBit/s ∼89%
iperf3 transmit AXE11000
1382 (min: 1195) MBit/s ∼75%
iperf3 receive AXE11000
1561 (min: 1331) MBit/s ∼86%
010020030040050060070080090010001100120013001400150016001700180019002000210022002300Tooltip
Asus ProArt P14 H7407; iperf3 transmit Wi-Fi6/7 RT-BE96U; iperf 3.1.3: Ø2222 (2180-2321) MBit/s
Asus ProArt P14 H7407; iperf3 receive Wi-Fi6/7 RT-BE96U; iperf 3.1.3: Ø2226 (2155-2249) MBit/s
ColorChecker
21 ∆E
14.9 ∆E
18.9 ∆E
21 ∆E
17.5 ∆E
11.7 ∆E
20.1 ∆E
19.5 ∆E
28.5 ∆E
18.8 ∆E
11.4 ∆E
14.2 ∆E
12 ∆E
15.9 ∆E
31 ∆E
5.9 ∆E
21.2 ∆E
18.9 ∆E
3.5 ∆E
4.9 ∆E
13.3 ∆E
14.3 ∆E
12 ∆E
5.6 ∆E
ColorChecker Asus ProArt P14 H7407: 15.67 ∆E min: 3.49 - max: 31.02 ∆E

Display

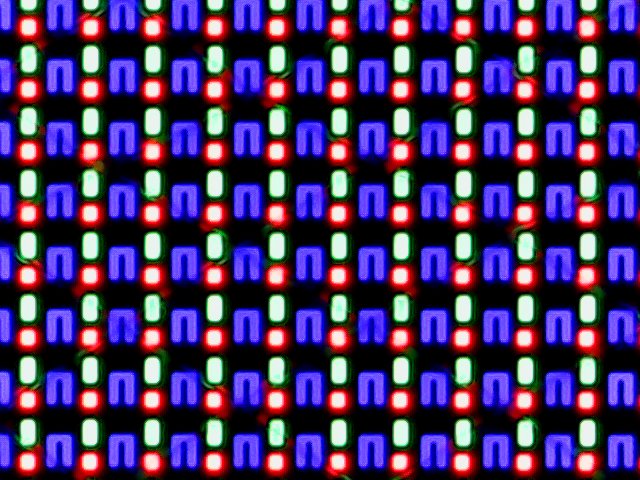
Subpixel array
Subpixel array
Max. HDR brightness: 1682 nits

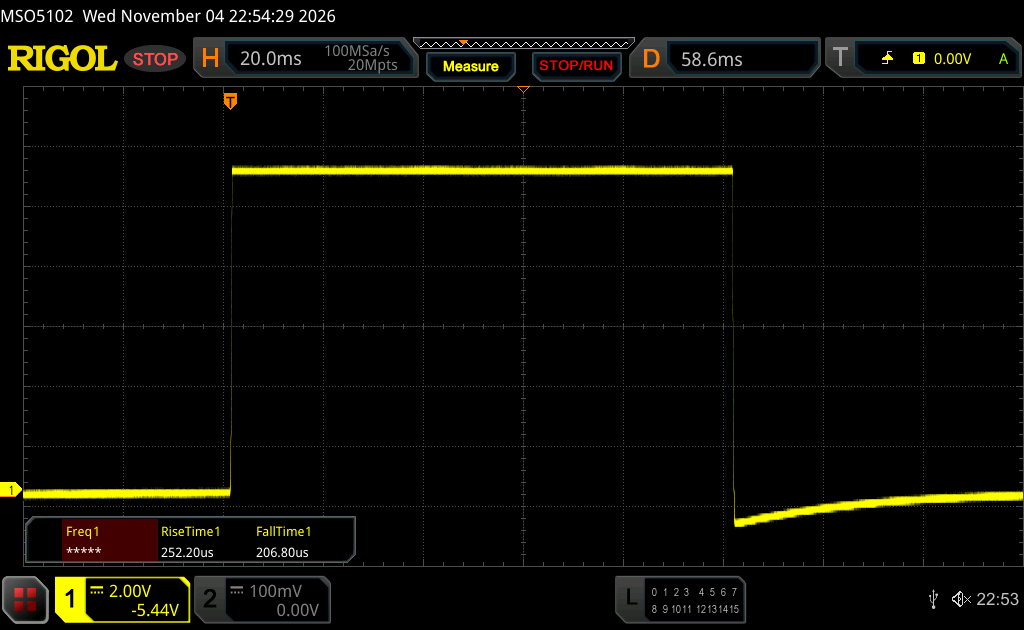
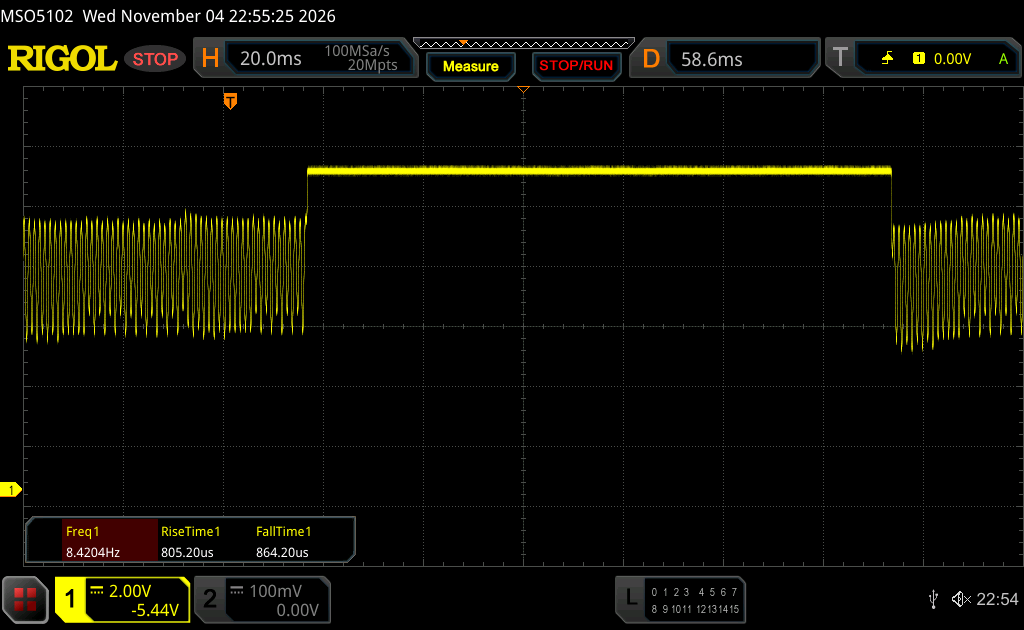
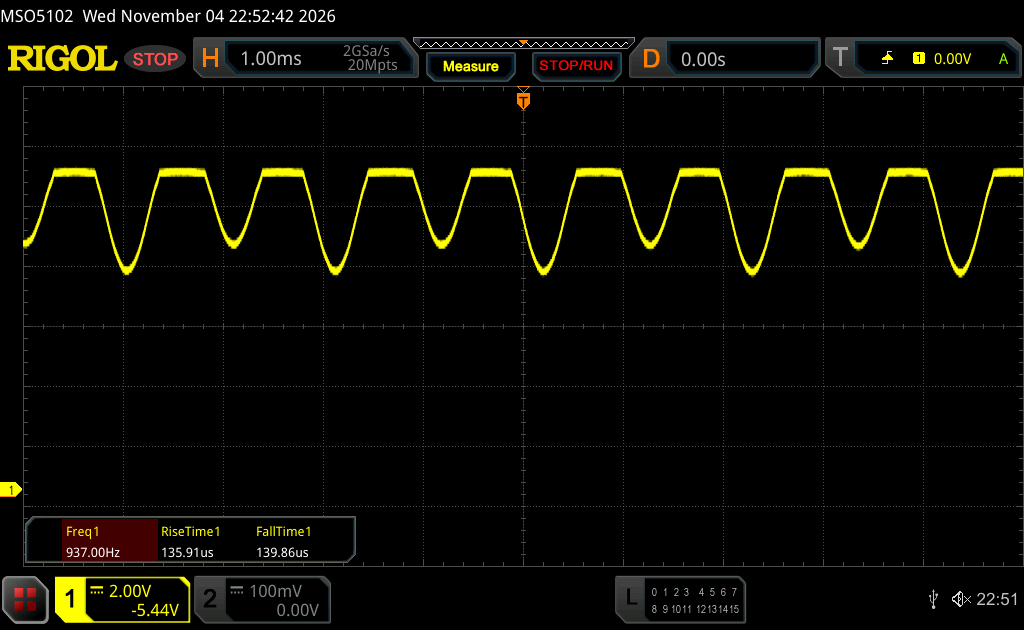
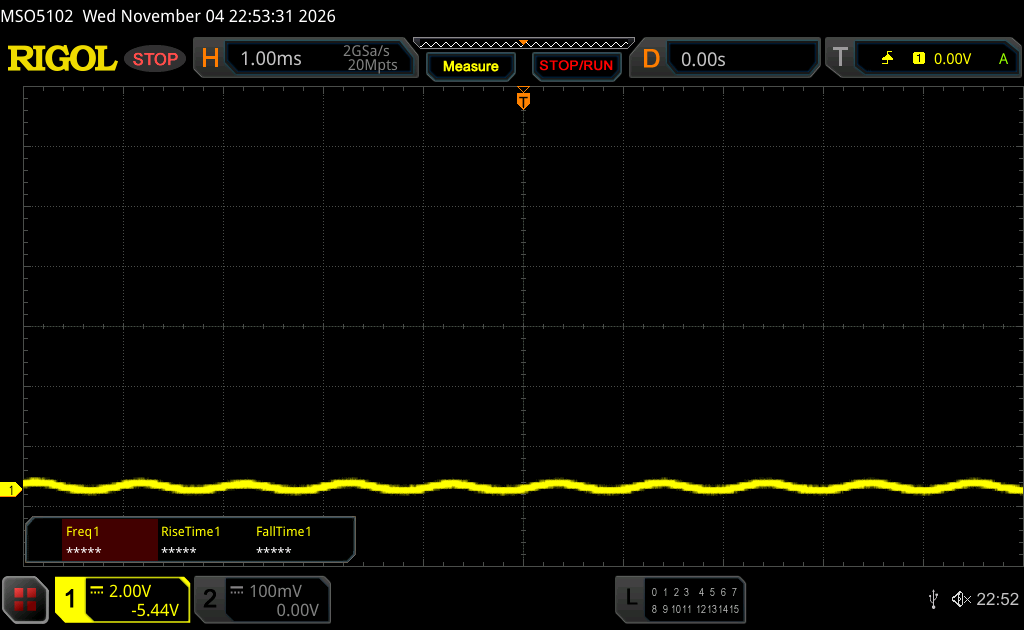
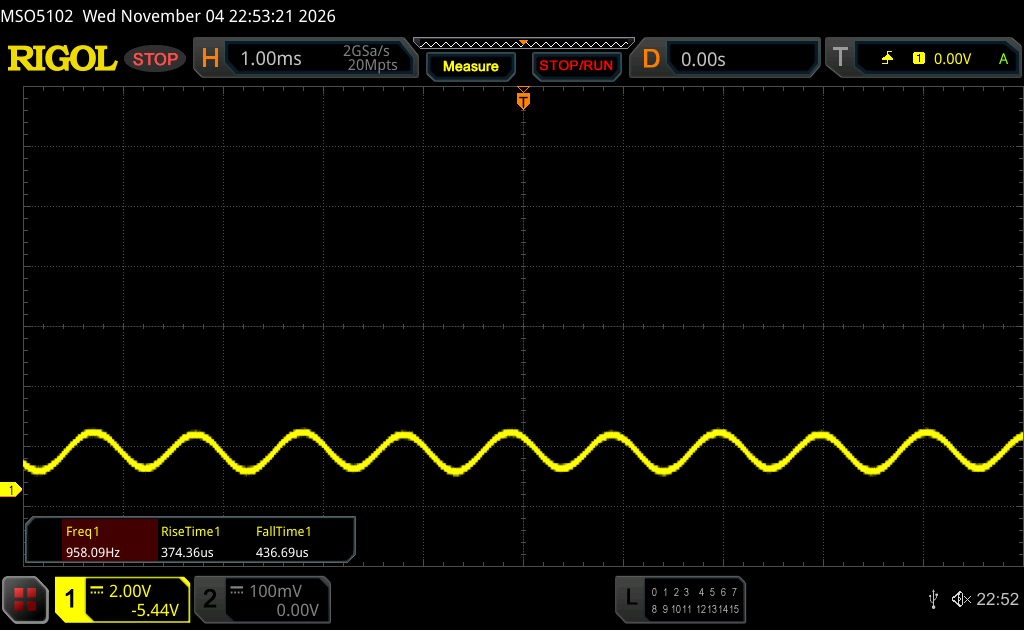
Asus uses a tandem OLED touchscreen from Samsung with a resolution of 2880 x 1800 pixels and 120 Hz refresh rate. The subjective image quality is very good, even though the touch layer slightly affects the image quality, especially on brighter content. Response times are very fast and the PWM frequency is pretty high (960 Hz) with a small amplitude, so this should not be an issue for most users.

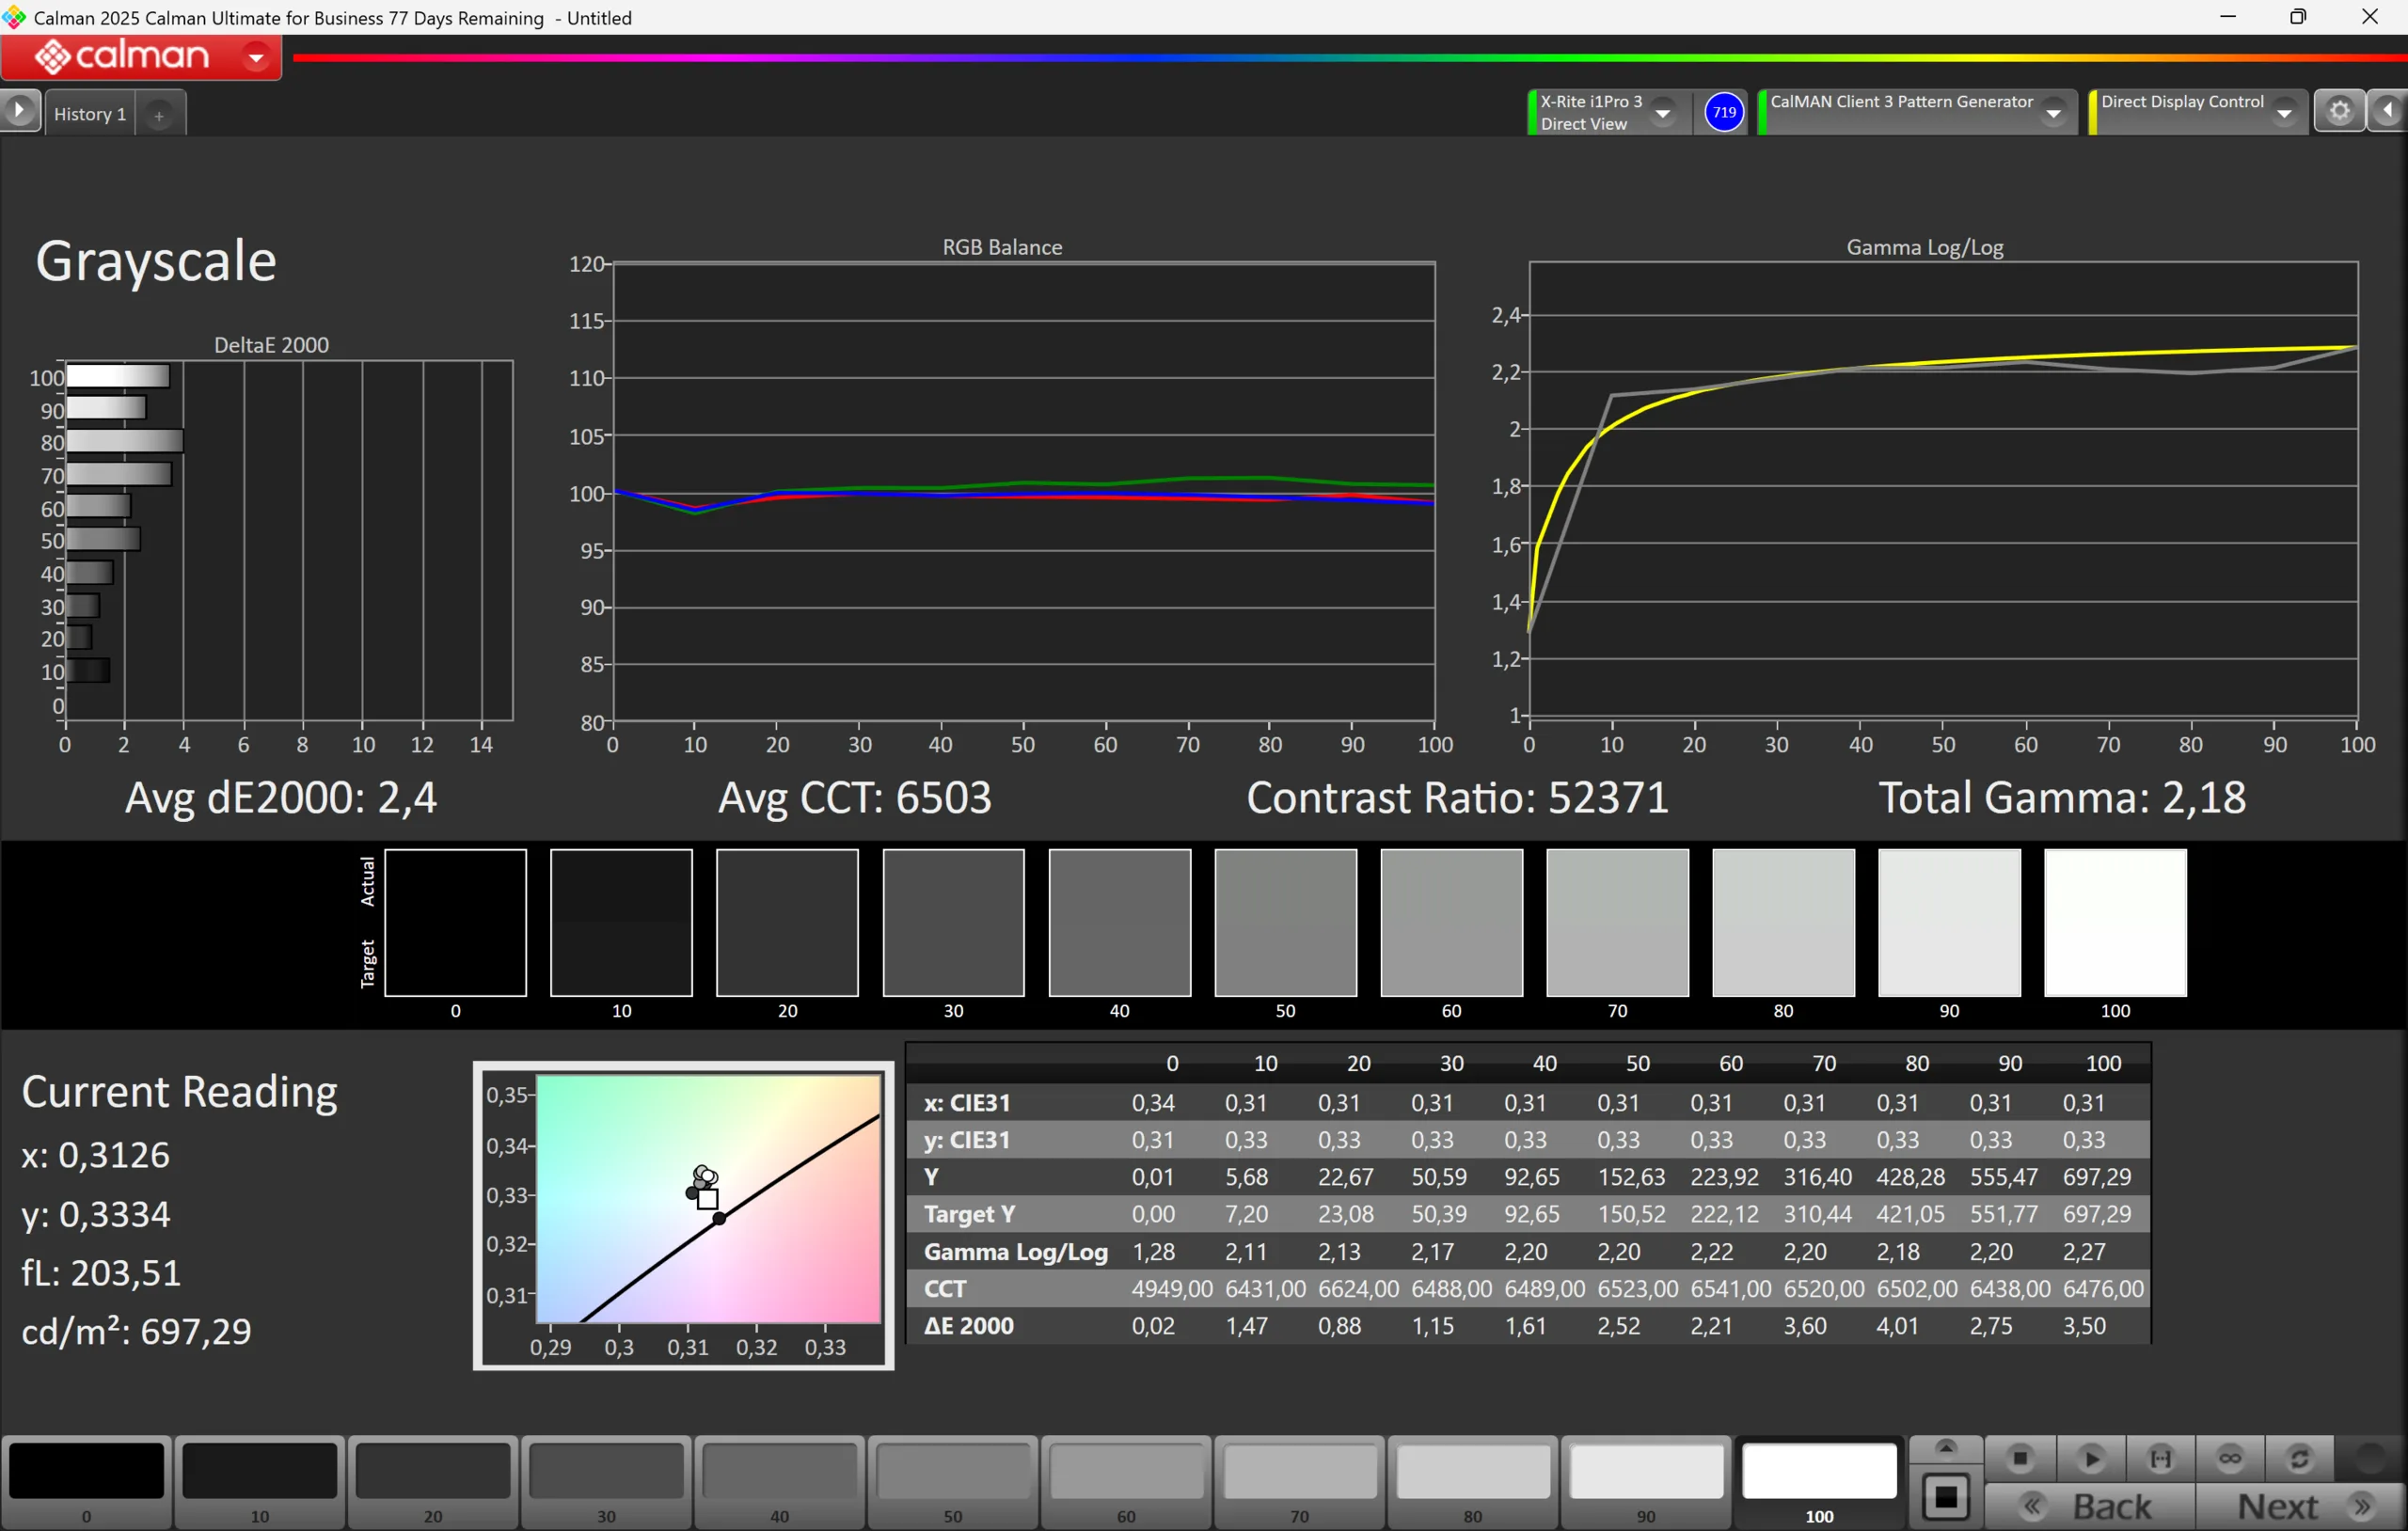
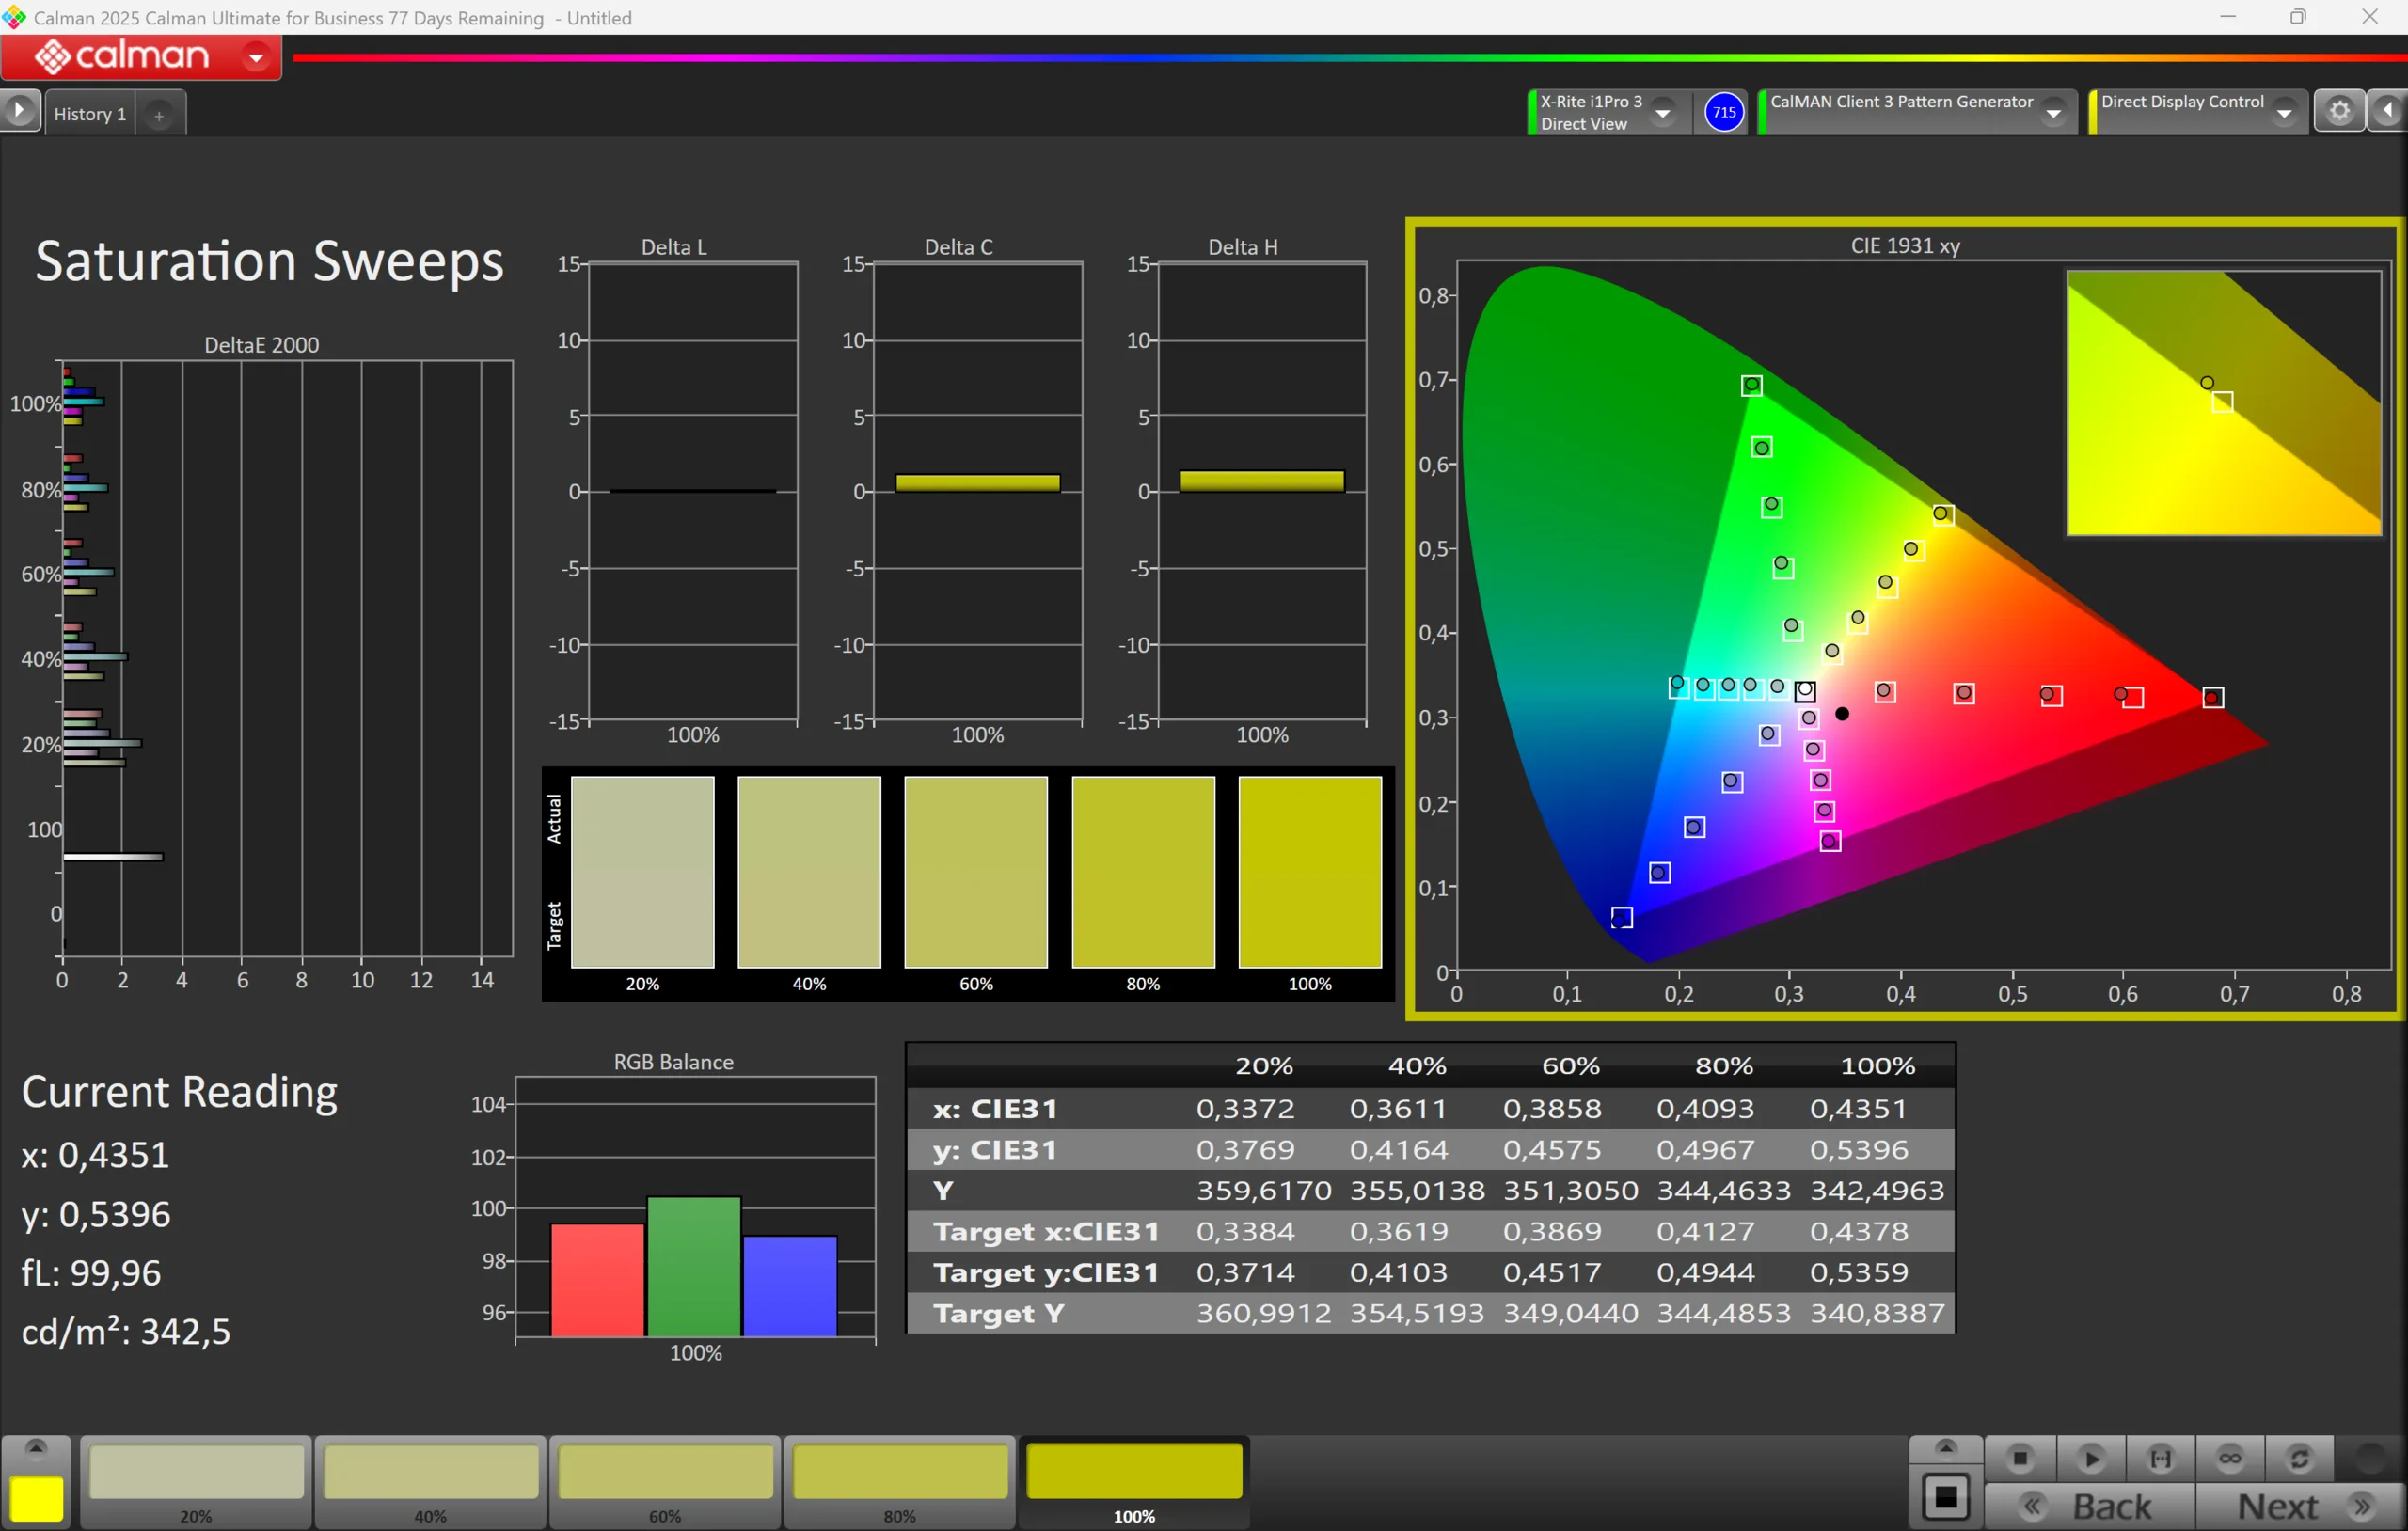
Our analysis with the professional CalMAN software confirms that Asus once again ships very accurate color profiles for P3 as well as sRGB and picture editing is no problem. We measured a brightness of ~700 nits for SDR content and almost 1700 nits peak brightness for HDR content (~900 nits on a completely white image), which are excellent results.

708
cd/m²
703
cd/m²
711
cd/m²
707
cd/m²
697
cd/m²
710
cd/m²
705
cd/m²
704
cd/m²
711
cd/m²
Distribution of brightness
ATNA40LE04-0 tested with X-Rite i1Pro 3
Maximum: 711 cd/m² (Nits) Average: 706.2 cd/m² Minimum: 3.7 cd/m²
Brightness Distribution: 98 %
Center on Battery: 697 cd/m²
Contrast: 69700:1 (Black: 0.01 cd/m²)
ΔE ColorChecker Calman: 1.1 | ∀{0.5-29.43 Ø4.68}
ΔE Greyscale Calman: 2.4 | ∀{0.09-98 Ø4.93}
89% AdobeRGB 1998 (Argyll 3D)
99.9% sRGB (Argyll 3D)
99.9% Display P3 (Argyll 3D)
Gamma: 2.18
CCT: 6503 K
Asus ProArt P14 H7407
ATNA40LE04-0, OLED, 2880x1800, 14", 120 Hz
Apple MacBook Pro 14 2024 M4 Pro
MiniLED, 3024x1964, 14.2", 120 Hz
Asus ROG Zephyrus G14 GU405AR
ATNA40HQ06-0, OLED, 2880x1800, 14", 120 Hz
Lenovo Yoga Slim 7 14Q8Y11
LEN140WUXGA, OLED, 1920x1200, 14", 60 Hz
Dell XPS 14 Core Ultra X7 358H
LG Philips 140WT2, OLED, 2880x1800, 14", 120 Hz
Razer Blade 14 2025
ATNA40CU05-0, OLED, 2880x1800, 14", 120 Hz
HP ZBook Ultra G1a 14
Samsung SDC41B3, OLED, 2880x1800, 14", 120 Hz
Display
0%
-7%
4%
3%
-19%
2%
HDR Peak Brightness (cd/m²)
1682
1706
1%
1140
-32%
440
-74%
Display P3 Coverage (%)
99.9
99.6
0%
99.8
0%
100
0%
99.7
0%
99.5
0%
99.7
0%
sRGB Coverage (%)
99.9
100
0%
100
0%
100
0%
100
0%
100
0%
100
0%
AdobeRGB 1998 Coverage (%)
89
89
0%
94.1
6%
99
11%
98.2
10%
89.2
0%
95.6
7%
Response Times
-6729%
-33%
-77%
-22%
14%
-40%
Response Time Grey 50% / Grey 80% * (ms)
1.67 ?(0.81, 0.86)
77.2 ?(36.8, 40.4)
-4523%
2 ?(1, 1)
-20%
1.6 ?(82, 0.78)
4%
0.75 ?(0.43, 0.32)
55%
0.59 ?(0.32, 0.27)
65%
0.94 ?(0.53, 0.41)
44%
Response Time Black / White * (ms)
0.46 ?(0.25, 0.21)
71.6 ?(44.2, 27.4)
-15465%
0.49 ?(0.27, 0.22)
-7%
1.85 ?(0.85, 1)
-302%
1.03 ?(0.53, 0.5)
-124%
0.63 ?(0.35, 0.28)
-37%
1.01 ?(0.46, 0.55)
-120%
PWM Frequency (Hz)
960 ?(70)
14880 ?(100)
960 ?(90)
482.1 ?(100)
240.62 ?(100)
960 ?(90)
492.6
PWM Amplitude * (%)
30
90
-200%
52
-73%
10.3
66%
29
3%
26
13%
43
-43%
Screen
25%
-26%
-70%
-13%
-26%
-51%
Brightness middle (cd/m²)
697
638
-8%
508
-27%
367.1
-47%
393.8
-44%
361
-48%
384.7
-45%
Brightness (cd/m²)
706
621
-12%
514
-27%
338
-52%
389
-45%
363
-49%
387
-45%
Brightness Distribution (%)
98
95
-3%
98
0%
86
-12%
96
-2%
98
0%
99
1%
Black Level * (cd/m²)
0.01
0.02
-100%
Contrast (:1)
69700
25400
-64%
Colorchecker dE 2000 *
1.1
0.6
45%
1.3
-18%
3.91
-255%
1.27
-15%
1.7
-55%
3.36
-205%
Colorchecker dE 2000 max. *
3.8
1.4
63%
3.5
8%
7.49
-97%
3.35
12%
3.9
-3%
6.45
-70%
Greyscale dE 2000 *
2.4
0.8
67%
2
17%
1.3
46%
2
17%
2.4
-0%
1
58%
Gamma
2.18 101%
2.22 99%
2.13 103%
2.23 99%
2.19 100%
2.14 103%
2.26 97%
CCT
6503 100%
6430 101%
6588 99%
6269 104%
6379 102%
6571 99%
6380 102%
Colorchecker dE 2000 calibrated *
0.71
0.65
Total Average (Program / Settings)
-2235% / -1541%
-22% / -22%
-48% / -53%
-11% / -11%
-10% / -14%
-30% / -35%

* ... smaller is better

CalMAN Grayscale
CalMAN Grayscale
CalMAN Saturation
CalMAN Saturation
CalMAN ColorChecker
CalMAN ColorChecker

Display Response Times

ℹ
Display response times show how fast the screen is able to change from one color to the next. Slow response times can lead to afterimages and can cause moving objects to appear blurry (ghosting). Gamers of fast-paced 3D titles should pay special attention to fast response times.
   ↔    Response Time Black to White
0.46 ms ... rise ↗ and fall ↘ combined↗ 0.25 ms rise
↘ 0.21 ms fall
The screen shows very fast response rates in our tests and should be very well suited for fast-paced gaming.
In comparison, all tested devices range from 0.1 (minimum) to 240 (maximum) ms. » 1 % of all devices are better.
This means that the measured response time is better than the average of all tested devices (19.6 ms).
   ↔    Response Time 50% Grey to 80% Grey
1.67 ms ... rise ↗ and fall ↘ combined↗ 0.81 ms rise
↘ 0.86 ms fall
The screen shows very fast response rates in our tests and should be very well suited for fast-paced gaming.
In comparison, all tested devices range from 0.13 (minimum) to 636 (maximum) ms. » 9 % of all devices are better.
This means that the measured response time is better than the average of all tested devices (30.6 ms).

Screen Flickering / PWM (Pulse-Width Modulation)

ℹ
To dim the screen, some notebooks will simply cycle the backlight on and off in rapid succession - a method called Pulse Width Modulation (PWM) . This cycling frequency should ideally be undetectable to the human eye. If said frequency is too low, users with sensitive eyes may experience strain or headaches or even notice the flickering altogether.
Screen flickering / PWM detected 960 Hz
Amplitude: 30 %
≤ 70 % brightness setting

The display backlight flickers at 960 Hz (worst case, e.g., utilizing PWM) Flickering detected at a brightness setting of 70 % and below. There should be no flickering or PWM above this brightness setting.

The frequency of 960 Hz is quite high, so most users sensitive to PWM should not notice any flickering.

In comparison: 52 % of all tested devices do not use PWM to dim the display. If PWM was detected, an average of 7559 (minimum: 5 - maximum: 343500) Hz was measured.

PWM (0 % brightness)
PWM (20 % brightness)
PWM (40 % brightness)
PWM (60 % brightness)
PWM (80 % brightness)
PWM (100 % brightness)
In the sun
In the sun
Outdoors (overcast day)
Viewing angles
Viewing angles

Performance - RTX Spark N1X with 32 GB RAM

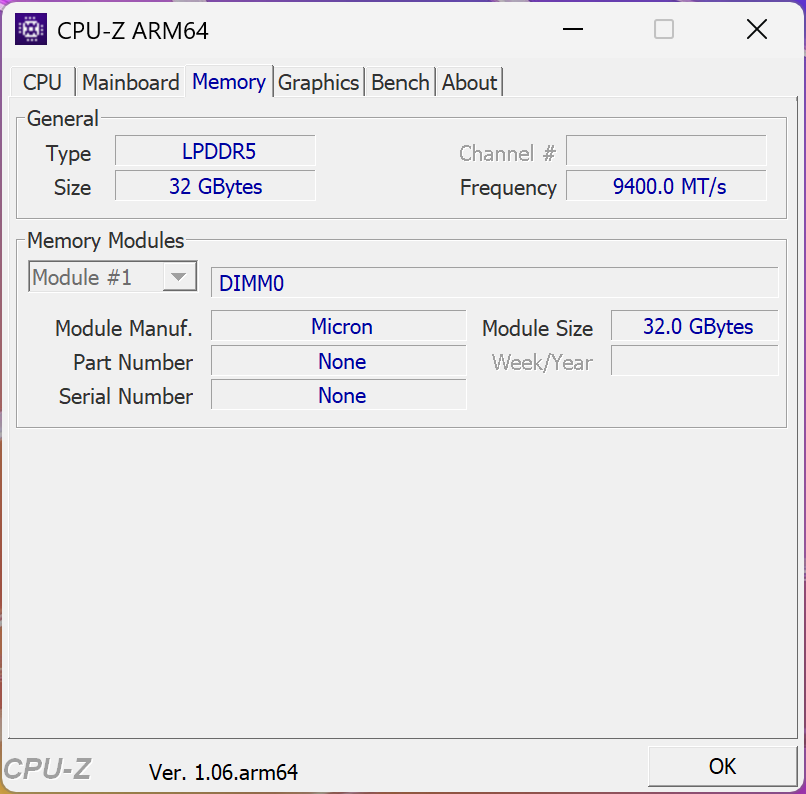
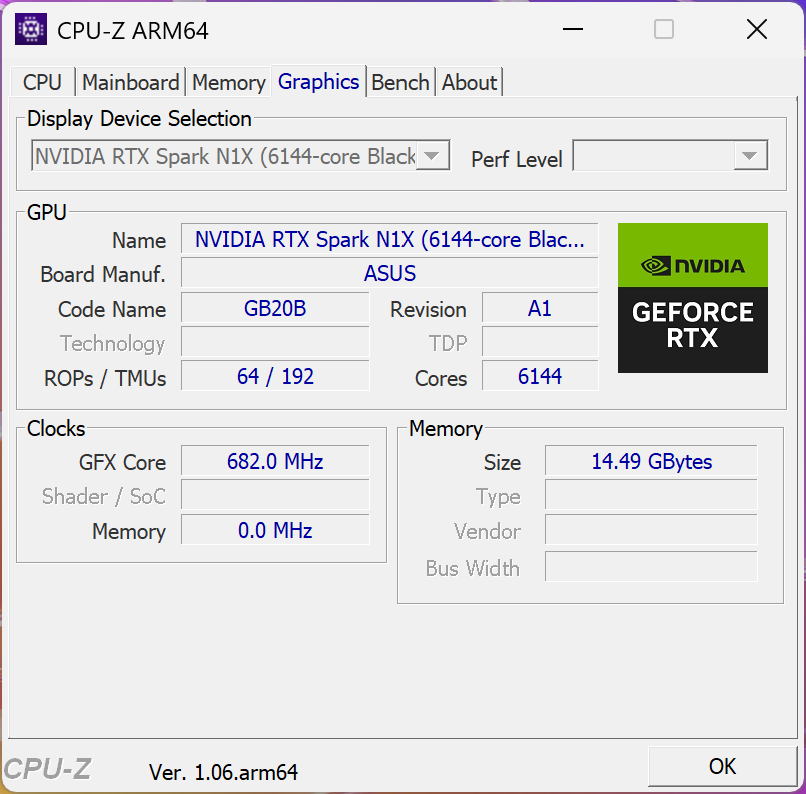
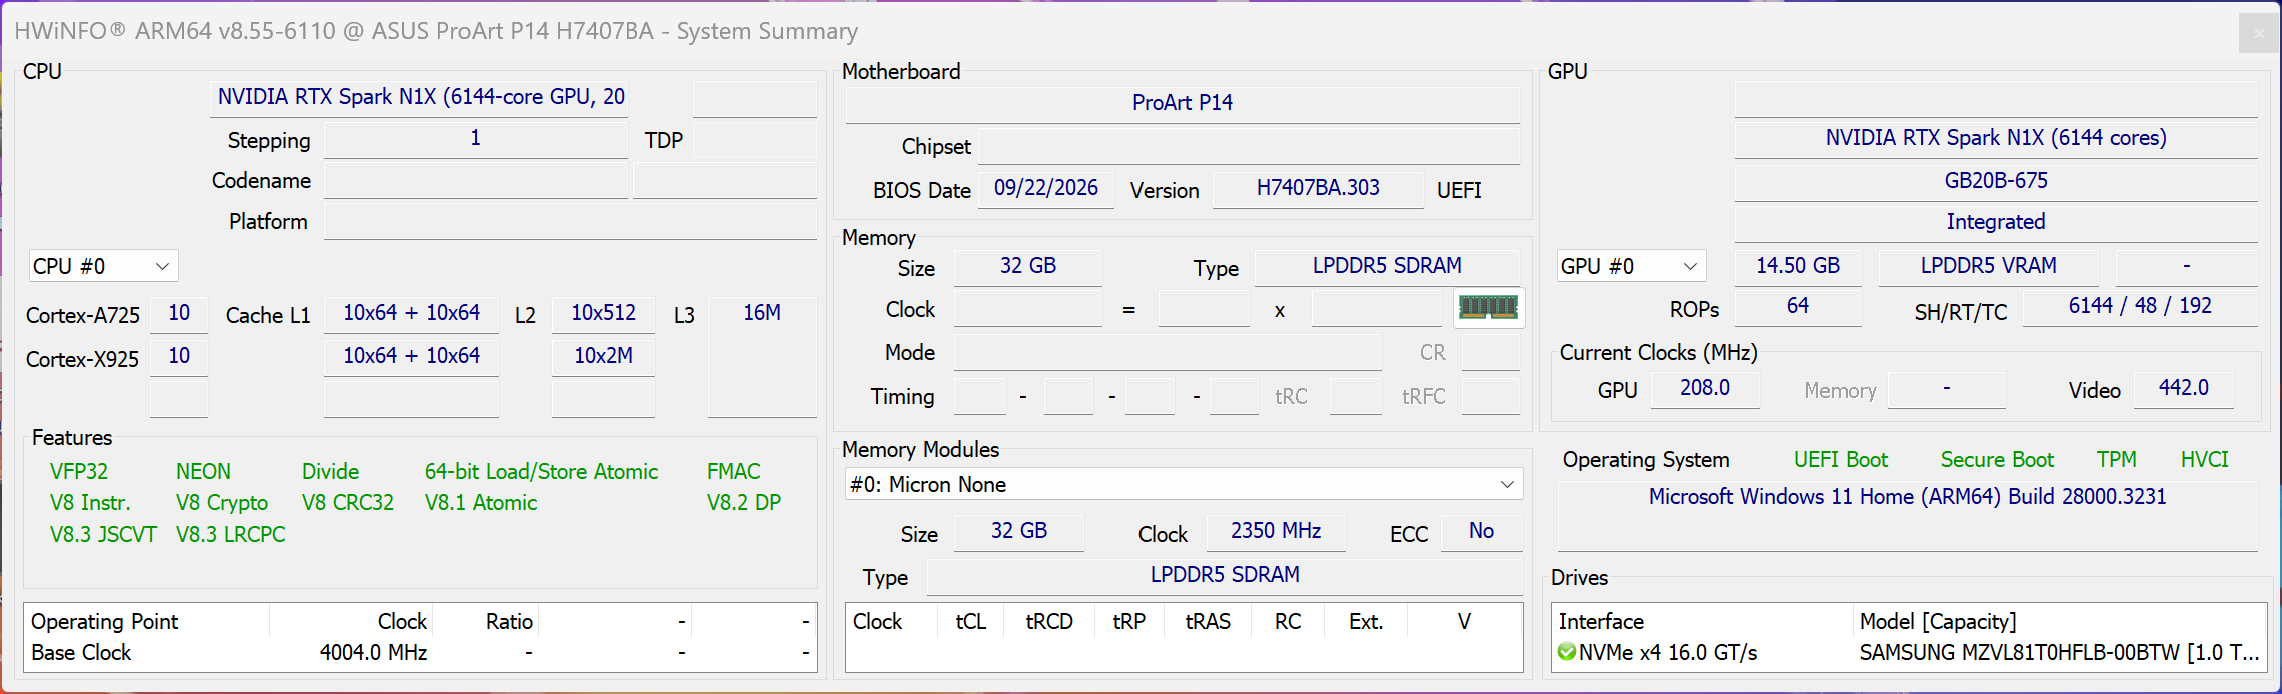
The ProArt P14 is equipped with the faster RTX Spark N1X chip, but right now you can only get models with 24 or 32 GB unified memory. Our 32 GB unit has allocated 16 GB RAM to the GPU by default, so you only have 16 GB left for the system. 
Testing Conditions

We used Performance mode for our benchmarks and measurements, but we recommend Silent mode for everyday tasks to ensure quieter fans.

Profile TDP CB24 Multi Steel Nomad Cyberpunk 2077 QHD Ultra max. fan noise
Whisper 40/25 W 1409 points 2094 points 34 fps 38.4 dB(A)
Standard 50/35 W 1522 points 2503 points 43.1 fps 44.9 dB(A)
Performance 75/58 W 1647 points 2872 points 53 fps 54.9 dB(A)
Battery (Performance) 75/58 W 1597 points 2863 points 53 fps 54.9 dB(A)

Processor Performance

The RTX Spark N1X features 20 CPU cores and can consume 75/58 Watts in the ProArt P14. The performance is pretty good in general and it beats all the rivals except Apple's M5 Pro and M5 Max chips. The N1X is also faster than AMD's fastest Strix Halo SoC. For more technical information and efficiency results, please see our comprehensive analysis article of Nvidia's RTX Spark SoC.

CPU Native Performance rating: Percent
Cinebench 2024: CPU Multi Core | CPU Single Core
Geekbench 6.7: Multi-Core | Single-Core
CPU Native Performance rating
Apple MacBook Pro 14 2026 M5 Max
Apple M5 Max
100 pt
Average Nvidia RTX Spark N1X 20-Core
 
71.6 pt
Asus ProArt P14 H7407
Nvidia RTX Spark N1X 20-Core
71.2 pt
Lenovo Yoga Slim 7 14Q8Y11
Qualcomm Snapdragon X2 Elite X2E-88-100
67 pt
HP ZBook Ultra G1a 14
AMD Ryzen AI Max+ PRO 395
64.1 pt
Average of class Multimedia
 
61.4 pt
Asus ROG Zephyrus G14 GU405AR
Intel Core Ultra 9 386H
61.3 pt
Dell XPS 14 Core Ultra X7 358H
Intel Core Ultra X7 358H
58.9 pt
Razer Blade 14 2025
AMD Ryzen AI 9 365
57 pt
Cinebench 2024 / CPU Multi Core
Apple MacBook Pro 14 2026 M5 Max
Apple M5 Max
2073 Points +26%
Average Nvidia RTX Spark N1X 20-Core
  (1635 - 1726, n=4)
1673 Points +2%
Asus ProArt P14 H7407
Nvidia RTX Spark N1X 20-Core
1647 Points
HP ZBook Ultra G1a 14
AMD Ryzen AI Max+ PRO 395
1643 Points 0%
Lenovo Yoga Slim 7 14Q8Y11
Qualcomm Snapdragon X2 Elite X2E-88-100
1462 Points -11%
Asus ROG Zephyrus G14 GU405AR
Intel Core Ultra 9 386H
1262 Points -23%
Average of class Multimedia
  (327 - 2490, n=65, last 2 years)
1167 Points -29%
Razer Blade 14 2025
AMD Ryzen AI 9 365
1072 Points -35%
Dell XPS 14 Core Ultra X7 358H
Intel Core Ultra X7 358H
974 Points -41%
Cinebench 2024 / CPU Single Core
Apple MacBook Pro 14 2026 M5 Max
Apple M5 Max
200 Points +56%
Lenovo Yoga Slim 7 14Q8Y11
Qualcomm Snapdragon X2 Elite X2E-88-100
150 Points +17%
Average of class Multimedia
  (72.5 - 201, n=59, last 2 years)
130.7 Points +2%
Average Nvidia RTX Spark N1X 20-Core
  (128 - 133, n=4)
130.5 Points +2%
Asus ProArt P14 H7407
Nvidia RTX Spark N1X 20-Core
128 Points
Dell XPS 14 Core Ultra X7 358H
Intel Core Ultra X7 358H
125.5 Points -2%
Asus ROG Zephyrus G14 GU405AR
Intel Core Ultra 9 386H
121.3 Points -5%
Razer Blade 14 2025
AMD Ryzen AI 9 365
116.3 Points -9%
HP ZBook Ultra G1a 14
AMD Ryzen AI Max+ PRO 395
112.2 Points -12%
Geekbench 6.7 / Multi-Core
Apple MacBook Pro 14 2026 M5 Max
Apple M5 Max
29415 Points +45%
Asus ProArt P14 H7407
Nvidia RTX Spark N1X 20-Core
20226 Points
Average Nvidia RTX Spark N1X 20-Core
  (20031 - 20296, n=3)
20184 Points 0%
Asus ROG Zephyrus G14 GU405AR
Intel Core Ultra 9 386H
17224 Points -15%
Dell XPS 14 Core Ultra X7 358H
Intel Core Ultra X7 358H
17121 Points -15%
HP ZBook Ultra G1a 14
AMD Ryzen AI Max+ PRO 395
16855 Points -17%
Lenovo Yoga Slim 7 14Q8Y11
Qualcomm Snapdragon X2 Elite X2E-88-100
16674 Points -18%
Average of class Multimedia
  (4983 - 30057, n=64, last 2 years)
16041 Points -21%
Razer Blade 14 2025
AMD Ryzen AI 9 365
15137 Points -25%
Geekbench 6.7 / Single-Core
Apple MacBook Pro 14 2026 M5 Max
Apple M5 Max
4322 Points +38%
Asus ProArt P14 H7407
Nvidia RTX Spark N1X 20-Core
3139 Points
Average Nvidia RTX Spark N1X 20-Core
  (3092 - 3139, n=3)
3109 Points -1%
Average of class Multimedia
  (1591 - 4336, n=64, last 2 years)
2998 Points -4%
Dell XPS 14 Core Ultra X7 358H
Intel Core Ultra X7 358H
2927 Points -7%
Razer Blade 14 2025
AMD Ryzen AI 9 365
2888 Points -8%
Lenovo Yoga Slim 7 14Q8Y11
Qualcomm Snapdragon X2 Elite X2E-88-100
2836 Points -10%
Asus ROG Zephyrus G14 GU405AR
Intel Core Ultra 9 386H
2810 Points -10%
HP ZBook Ultra G1a 14
AMD Ryzen AI Max+ PRO 395
2756 Points -12%

Cinebench R15 Multi Loop

010020030040050060070080090010001100120013001400150016001700180019002000210022002300240025002600270028002900300031003200330034003500360037003800390040004100420043004400450046004700Tooltip
Asus ProArt P14 H7407 Nvidia RTX Spark N1X 20-Core: Ø3602 (3574.94-3629.76) Points
Asus ROG Zephyrus G14 GU405AR Intel Core Ultra 9 386H: Ø3316 (3259.72-3347) Points
Lenovo Yoga Slim 7 14Q8Y11 Qualcomm Snapdragon X2 Elite X2E-88-100: Ø2727 (2567.23-3182.18) Points
Dell XPS 14 Core Ultra X7 358H Intel Core Ultra X7 358H: Ø2340 (2099.85-3134.55) Points
Razer Blade 14 2025 AMD Ryzen AI 9 365: Ø2928 (2910.57-2975.97) Points
HP ZBook Ultra G1a 14 AMD Ryzen AI Max+ PRO 395: Ø4735 (4586.1-4783.54) Points
CPU Emulated Performance rating: Percent
Cinebench R23: Multi Core | Single Core
Cinebench R20: CPU (Multi Core) | CPU (Single Core)
Cinebench R15: CPU Multi 64Bit | CPU Single 64Bit
Blender: v2.79 BMW27 CPU
7-Zip 18.03: 7z b 4 | 7z b 4 -mmt1
HWBOT x265 Benchmark v2.2: 4k Preset
LibreOffice : 20 Documents To PDF
R Benchmark 2.5: Overall mean
CPU Emulated Performance rating
HP ZBook Ultra G1a 14
AMD Ryzen AI Max+ PRO 395
82.3 pt
Asus ROG Zephyrus G14 GU405AR
Intel Core Ultra 9 386H
69.1 pt
Dell XPS 14 Core Ultra X7 358H
Intel Core Ultra X7 358H
65.8 pt
Razer Blade 14 2025
AMD Ryzen AI 9 365
63 pt
Average of class Multimedia
 
58 pt
Lenovo Yoga Slim 7 14Q8Y11 -1!
Qualcomm Snapdragon X2 Elite X2E-88-100
53.8 pt
Average Nvidia RTX Spark N1X 20-Core
 
52 pt
Asus ProArt P14 H7407
Nvidia RTX Spark N1X 20-Core
51.1 pt
Cinebench R23 / Multi Core
HP ZBook Ultra G1a 14
AMD Ryzen AI Max+ PRO 395
30706 (29203.2min - 30705.8max) Points +78%
Asus ROG Zephyrus G14 GU405AR
Intel Core Ultra 9 386H
21186 Points +23%
Razer Blade 14 2025
AMD Ryzen AI 9 365
19449 Points +13%
Dell XPS 14 Core Ultra X7 358H
Intel Core Ultra X7 358H
18932 (14811.1min - 18932.2max) Points +10%
Average Nvidia RTX Spark N1X 20-Core
  (16591 - 17944, n=4)
17313 Points 0%
Asus ProArt P14 H7407
Nvidia RTX Spark N1X 20-Core
17279 Points
Average of class Multimedia
  (4861 - 33362, n=65, last 2 years)
17156 Points -1%
Lenovo Yoga Slim 7 14Q8Y11
Qualcomm Snapdragon X2 Elite X2E-88-100
15957 (14658.8min - 15956.6max) Points -8%
Cinebench R23 / Single Core
Dell XPS 14 Core Ultra X7 358H
Intel Core Ultra X7 358H
2086 Points +58%
Asus ROG Zephyrus G14 GU405AR
Intel Core Ultra 9 386H
2012 Points +52%
HP ZBook Ultra G1a 14
AMD Ryzen AI Max+ PRO 395
2003 Points +52%
Razer Blade 14 2025
AMD Ryzen AI 9 365
1987 Points +50%
Average of class Multimedia
  (1237 - 2459, n=64, last 2 years)
1930 Points +46%
Lenovo Yoga Slim 7 14Q8Y11
Qualcomm Snapdragon X2 Elite X2E-88-100
1604 Points +21%
Asus ProArt P14 H7407
Nvidia RTX Spark N1X 20-Core
1321 Points
Average Nvidia RTX Spark N1X 20-Core
  (1308 - 1321, n=4)
1315 Points 0%
Cinebench R20 / CPU (Multi Core)
HP ZBook Ultra G1a 14
AMD Ryzen AI Max+ PRO 395
11816 Points +84%
Asus ROG Zephyrus G14 GU405AR
Intel Core Ultra 9 386H
8405 Points +31%
Razer Blade 14 2025
AMD Ryzen AI 9 365
7576 Points +18%
Dell XPS 14 Core Ultra X7 358H
Intel Core Ultra X7 358H
7437 Points +16%
Average of class Multimedia
  (1887 - 12912, n=56, last 2 years)
6614 Points +3%
Average Nvidia RTX Spark N1X 20-Core
  (6184 - 6679, n=4)
6458 Points +1%
Asus ProArt P14 H7407
Nvidia RTX Spark N1X 20-Core
6424 Points
Lenovo Yoga Slim 7 14Q8Y11
Qualcomm Snapdragon X2 Elite X2E-88-100
6172 Points -4%
Cinebench R20 / CPU (Single Core)
Dell XPS 14 Core Ultra X7 358H
Intel Core Ultra X7 358H
792 Points +61%
HP ZBook Ultra G1a 14
AMD Ryzen AI Max+ PRO 395
783 Points +59%
Razer Blade 14 2025
AMD Ryzen AI 9 365
779 Points +59%
Asus ROG Zephyrus G14 GU405AR
Intel Core Ultra 9 386H
762 Points +55%
Average of class Multimedia
  (456 - 833, n=56, last 2 years)
721 Points +47%
Lenovo Yoga Slim 7 14Q8Y11
Qualcomm Snapdragon X2 Elite X2E-88-100
617 Points +26%
Asus ProArt P14 H7407
Nvidia RTX Spark N1X 20-Core
491 Points
Average Nvidia RTX Spark N1X 20-Core
  (485 - 491, n=4)
487 Points -1%
Cinebench R15 / CPU Multi 64Bit
HP ZBook Ultra G1a 14
AMD Ryzen AI Max+ PRO 395
4784 (4586.1min - 4783.54max) Points +32%
Asus ProArt P14 H7407
Nvidia RTX Spark N1X 20-Core
3630 (3574.94min - 3629.76max) Points
Average Nvidia RTX Spark N1X 20-Core
  (3479 - 3677, n=4)
3590 Points -1%
Asus ROG Zephyrus G14 GU405AR
Intel Core Ultra 9 386H
3347 (3259.72min - 3347max) Points -8%
Lenovo Yoga Slim 7 14Q8Y11
Qualcomm Snapdragon X2 Elite X2E-88-100
3182 (2567.23min - 3182.18max) Points -12%
Dell XPS 14 Core Ultra X7 358H
Intel Core Ultra X7 358H
3135 (2099.85min - 3134.55max) Points -14%
Razer Blade 14 2025
AMD Ryzen AI 9 365
2976 (2910.57min - 2975.97max) Points -18%
Average of class Multimedia
  (856 - 5224, n=62, last 2 years)
2784 Points -23%
Cinebench R15 / CPU Single 64Bit
Dell XPS 14 Core Ultra X7 358H
Intel Core Ultra X7 358H
312 Points +19%
HP ZBook Ultra G1a 14
AMD Ryzen AI Max+ PRO 395
307 Points +17%
Asus ROG Zephyrus G14 GU405AR
Intel Core Ultra 9 386H
304 Points +16%
Lenovo Yoga Slim 7 14Q8Y11
Qualcomm Snapdragon X2 Elite X2E-88-100
302 Points +15%
Average of class Multimedia
  (184.8 - 326, n=59, last 2 years)
282 Points +7%
Asus ProArt P14 H7407
Nvidia RTX Spark N1X 20-Core
263 Points
Average Nvidia RTX Spark N1X 20-Core
  (255 - 263, n=4)
258 Points -2%
Razer Blade 14 2025
AMD Ryzen AI 9 365
195.7 Points -26%
Blender / v2.79 BMW27 CPU
Average of class Multimedia
  (100 - 557, n=57, last 2 years)
233 Seconds * -21%
Lenovo Yoga Slim 7 14Q8Y11
Qualcomm Snapdragon X2 Elite X2E-88-100
206 Seconds * -7%
Dell XPS 14 Core Ultra X7 358H
Intel Core Ultra X7 358H
196 Seconds * -2%
Average Nvidia RTX Spark N1X 20-Core
  (192 - 197, n=4)
194.3 Seconds * -1%
Asus ProArt P14 H7407
Nvidia RTX Spark N1X 20-Core
193 Seconds *
Razer Blade 14 2025
AMD Ryzen AI 9 365
169 Seconds * +12%
Asus ROG Zephyrus G14 GU405AR
Intel Core Ultra 9 386H
157 Seconds * +19%
HP ZBook Ultra G1a 14
AMD Ryzen AI Max+ PRO 395
102 Seconds * +47%
7-Zip 18.03 / 7z b 4
HP ZBook Ultra G1a 14
AMD Ryzen AI Max+ PRO 395
109760 MIPS +33%
Asus ProArt P14 H7407
Nvidia RTX Spark N1X 20-Core
82825 MIPS
Average Nvidia RTX Spark N1X 20-Core
  (80534 - 82825, n=4)
81834 MIPS -1%
Asus ROG Zephyrus G14 GU405AR
Intel Core Ultra 9 386H
72609 MIPS -12%
Razer Blade 14 2025
AMD Ryzen AI 9 365
71550 MIPS -14%
Dell XPS 14 Core Ultra X7 358H
Intel Core Ultra X7 358H
64255 MIPS -22%
Average of class Multimedia
  (26062 - 130368, n=53, last 2 years)
60736 MIPS -27%
7-Zip 18.03 / 7z b 4 -mmt1
Dell XPS 14 Core Ultra X7 358H
Intel Core Ultra X7 358H
6526 MIPS +14%
Asus ROG Zephyrus G14 GU405AR
Intel Core Ultra 9 386H
6280 MIPS +10%
Razer Blade 14 2025
AMD Ryzen AI 9 365
6017 MIPS +5%
Average of class Multimedia
  (4526 - 7337, n=55, last 2 years)
5928 MIPS +4%
Asus ProArt P14 H7407
Nvidia RTX Spark N1X 20-Core
5708 MIPS
Average Nvidia RTX Spark N1X 20-Core
  (5658 - 5708, n=4)
5678 MIPS -1%
HP ZBook Ultra G1a 14
AMD Ryzen AI Max+ PRO 395
5613 MIPS -2%
Lenovo Yoga Slim 7 14Q8Y11
Qualcomm Snapdragon X2 Elite X2E-88-100
5200 MIPS -9%
HWBOT x265 Benchmark v2.2 / 4k Preset
HP ZBook Ultra G1a 14
AMD Ryzen AI Max+ PRO 395
33 fps +170%
Asus ROG Zephyrus G14 GU405AR
Intel Core Ultra 9 386H
25.1 fps +106%
Razer Blade 14 2025
AMD Ryzen AI 9 365
24.2 fps +98%
Dell XPS 14 Core Ultra X7 358H
Intel Core Ultra X7 358H
20.7 fps +70%
Average of class Multimedia
  (6.08 - 36.1, n=55, last 2 years)
18.8 fps +54%
Average Nvidia RTX Spark N1X 20-Core
  (12.2 - 12.6, n=4)
12.5 fps +2%
Asus ProArt P14 H7407
Nvidia RTX Spark N1X 20-Core
12.2 fps
Lenovo Yoga Slim 7 14Q8Y11
Qualcomm Snapdragon X2 Elite X2E-88-100
11.5 fps -6%
LibreOffice / 20 Documents To PDF
Asus ProArt P14 H7407
Nvidia RTX Spark N1X 20-Core
75.3 s *
Average Nvidia RTX Spark N1X 20-Core
  (59.5 - 75.3, n=4)
64.9 s * +14%
Razer Blade 14 2025
AMD Ryzen AI 9 365
54.3 s * +28%
HP ZBook Ultra G1a 14
AMD Ryzen AI Max+ PRO 395
53.4 s * +29%
Average of class Multimedia
  (23.9 - 75.3, n=56, last 2 years)
49.5 s * +34%
Asus ROG Zephyrus G14 GU405AR
Intel Core Ultra 9 386H
46.5 s * +38%
Dell XPS 14 Core Ultra X7 358H
Intel Core Ultra X7 358H
45.9 s * +39%
Lenovo Yoga Slim 7 14Q8Y11
Qualcomm Snapdragon X2 Elite X2E-88-100
45.6 s * +39%
R Benchmark 2.5 / Overall mean
Asus ProArt P14 H7407
Nvidia RTX Spark N1X 20-Core
0.535 sec *
Average Nvidia RTX Spark N1X 20-Core
  (0.52 - 0.538, n=4)
0.532 sec * +1%
Lenovo Yoga Slim 7 14Q8Y11
Qualcomm Snapdragon X2 Elite X2E-88-100
0.512 sec * +4%
Average of class Multimedia
  (0.3903 - 0.609, n=55, last 2 years)
0.4541 sec * +15%
Asus ROG Zephyrus G14 GU405AR
Intel Core Ultra 9 386H
0.4317 sec * +19%
HP ZBook Ultra G1a 14
AMD Ryzen AI Max+ PRO 395
0.4127 sec * +23%
Dell XPS 14 Core Ultra X7 358H
Intel Core Ultra X7 358H
0.4127 sec * +23%
Razer Blade 14 2025
AMD Ryzen AI 9 365
0.4091 sec * +24%

* ... smaller is better

Cinebench R15 CPU Multi 64Bit
3630 Points
Cinebench R15 OpenGL 64Bit
201 fps
Cinebench R15 Ref. Match 64Bit
97.6 %
Cinebench R15 CPU Single 64Bit
263 Points
Cinebench R20 CPU (Single Core)
491 Points
Cinebench R20 CPU (Multi Core)
6424 Points
Cinebench R23 Multi Core
17279 Points
Cinebench R23 Single Core
1321 Points
Cinebench 2024 CPU Single Core
128 Points
Cinebench 2024 CPU Multi Core
1647 Points
Help
Performance rating
HP ZBook Ultra G1a 14
AMD Ryzen AI Max+ PRO 395, Radeon 8060S
100 pt
Razer Blade 14 2025
AMD Ryzen AI 9 365, GeForce RTX 5070 Laptop
59.9 pt
Asus ROG Zephyrus G14 GU405AR -1!
Intel Core Ultra 9 386H, GeForce RTX 5070 Ti Laptop
52.2 pt
Dell XPS 14 Core Ultra X7 358H
Intel Core Ultra X7 358H, Arc B390 Panther Lake iGPU
43.9 pt
Average of class Multimedia
 
43.1 pt
Asus ProArt P14 H7407 -1!
Nvidia RTX Spark N1X 20-Core, RTX Spark N1X 6144-Core Blackwell GPU
40.4 pt
Average Nvidia RTX Spark N1X 20-Core -1!
 
40.3 pt
Lenovo Yoga Slim 7 14Q8Y11 -1!
Qualcomm Snapdragon X2 Elite X2E-88-100, X2-90
35.3 pt
AIDA64 / FP32 Ray-Trace
HP ZBook Ultra G1a 14
AMD Ryzen AI Max+ PRO 395, Radeon 8060S (v6.92.6600)
61611 KRay/s +416%
Razer Blade 14 2025
AMD Ryzen AI 9 365, GeForce RTX 5070 Laptop (v6.92.6600)
30940 KRay/s +159%
Asus ROG Zephyrus G14 GU405AR
Intel Core Ultra 9 386H, GeForce RTX 5070 Ti Laptop (v8.20.8100)
20987 KRay/s +76%
Average of class Multimedia
  (2214 - 50388, n=53, last 2 years)
17612 KRay/s +48%
Dell XPS 14 Core Ultra X7 358H
Intel Core Ultra X7 358H, Arc B390 Panther Lake iGPU (v8.20.8100)
14318 KRay/s +20%
Asus ProArt P14 H7407
Nvidia RTX Spark N1X 20-Core, RTX Spark N1X 6144-Core Blackwell GPU (v8.20.8100)
11935 KRay/s
Average Nvidia RTX Spark N1X 20-Core
  (11198 - 11989, n=4)
11674 KRay/s -2%
Lenovo Yoga Slim 7 14Q8Y11
Qualcomm Snapdragon X2 Elite X2E-88-100, X2-90 (v8.20.8100)
9981 KRay/s -16%
AIDA64 / FPU Julia
HP ZBook Ultra G1a 14
AMD Ryzen AI Max+ PRO 395, Radeon 8060S (v6.92.6600)
183843 Points +317%
Razer Blade 14 2025
AMD Ryzen AI 9 365, GeForce RTX 5070 Laptop (v6.92.6600)
119210 Points +170%
Asus ROG Zephyrus G14 GU405AR
Intel Core Ultra 9 386H, GeForce RTX 5070 Ti Laptop (v8.20.8100)
111022 Points +152%
Average of class Multimedia
  (12867 - 201874, n=53, last 2 years)
82245 Points +86%
Dell XPS 14 Core Ultra X7 358H
Intel Core Ultra X7 358H, Arc B390 Panther Lake iGPU (v8.20.8100)
77086 Points +75%
Lenovo Yoga Slim 7 14Q8Y11
Qualcomm Snapdragon X2 Elite X2E-88-100, X2-90 (v8.20.8100)
44941 Points +2%
Asus ProArt P14 H7407
Nvidia RTX Spark N1X 20-Core, RTX Spark N1X 6144-Core Blackwell GPU (v8.20.8100)
44115 Points
Average Nvidia RTX Spark N1X 20-Core
  (43306 - 45056, n=4)
43999 Points 0%
AIDA64 / CPU SHA3
HP ZBook Ultra G1a 14
AMD Ryzen AI Max+ PRO 395, Radeon 8060S (v6.92.6600)
8341 MB/s +90%
Asus ROG Zephyrus G14 GU405AR
Intel Core Ultra 9 386H, GeForce RTX 5070 Ti Laptop (v8.20.8100)
5502 MB/s +25%
Lenovo Yoga Slim 7 14Q8Y11
Qualcomm Snapdragon X2 Elite X2E-88-100, X2-90 (v8.20.8100)
4973 MB/s +13%
Razer Blade 14 2025
AMD Ryzen AI 9 365, GeForce RTX 5070 Laptop (v6.92.6600)
4971 MB/s +13%
Asus ProArt P14 H7407
Nvidia RTX Spark N1X 20-Core, RTX Spark N1X 6144-Core Blackwell GPU (v8.20.8100)
4388 MB/s
Average Nvidia RTX Spark N1X 20-Core
  (4247 - 4431, n=4)
4346 MB/s -1%
Average of class Multimedia
  (626 - 8623, n=53, last 2 years)
4039 MB/s -8%
Dell XPS 14 Core Ultra X7 358H
Intel Core Ultra X7 358H, Arc B390 Panther Lake iGPU (v8.20.8100)
4033 MB/s -8%
AIDA64 / CPU Queen
HP ZBook Ultra G1a 14
AMD Ryzen AI Max+ PRO 395, Radeon 8060S (v6.92.6600)
114210 Points
Razer Blade 14 2025
AMD Ryzen AI 9 365, GeForce RTX 5070 Laptop (v6.92.6600)
92790 Points
Average of class Multimedia
  (13483 - 181505, n=30, last 2 years)
71678 Points
Dell XPS 14 Core Ultra X7 358H
Intel Core Ultra X7 358H, Arc B390 Panther Lake iGPU (v6.92.6600)
63827 Points
AIDA64 / FPU SinJulia
HP ZBook Ultra G1a 14
AMD Ryzen AI Max+ PRO 395, Radeon 8060S (v6.92.6600)
29343 Points +607%
Razer Blade 14 2025
AMD Ryzen AI 9 365, GeForce RTX 5070 Laptop (v6.92.6600)
16240 Points +291%
Average of class Multimedia
  (886 - 28794, n=53, last 2 years)
8117 Points +95%
Asus ROG Zephyrus G14 GU405AR
Intel Core Ultra 9 386H, GeForce RTX 5070 Ti Laptop (v8.20.8100)
7299 Points +76%
Dell XPS 14 Core Ultra X7 358H
Intel Core Ultra X7 358H, Arc B390 Panther Lake iGPU (v8.20.8100)
6919 Points +67%
Asus ProArt P14 H7407
Nvidia RTX Spark N1X 20-Core, RTX Spark N1X 6144-Core Blackwell GPU (v8.20.8100)
4153 Points
Average Nvidia RTX Spark N1X 20-Core
  (3995 - 4153, n=4)
4068 Points -2%
Lenovo Yoga Slim 7 14Q8Y11
Qualcomm Snapdragon X2 Elite X2E-88-100, X2-90 (v8.20.8100)
3665 Points -12%
AIDA64 / FPU Mandel
HP ZBook Ultra G1a 14
AMD Ryzen AI Max+ PRO 395, Radeon 8060S (v6.92.6600)
97385 Points +286%
Razer Blade 14 2025
AMD Ryzen AI 9 365, GeForce RTX 5070 Laptop (v6.92.6600)
63459 Points +152%
Asus ROG Zephyrus G14 GU405AR
Intel Core Ultra 9 386H, GeForce RTX 5070 Ti Laptop (v8.20.8100)
59685 Points +137%
Average of class Multimedia
  (6395 - 105740, n=53, last 2 years)
43536 Points +73%
Dell XPS 14 Core Ultra X7 358H
Intel Core Ultra X7 358H, Arc B390 Panther Lake iGPU (v8.20.8100)
40542 Points +61%
Average Nvidia RTX Spark N1X 20-Core
  (24870 - 26051, n=4)
25271 Points 0%
Asus ProArt P14 H7407
Nvidia RTX Spark N1X 20-Core, RTX Spark N1X 6144-Core Blackwell GPU (v8.20.8100)
25209 Points
Lenovo Yoga Slim 7 14Q8Y11
Qualcomm Snapdragon X2 Elite X2E-88-100, X2-90 (v8.20.8100)
22255 Points -12%
AIDA64 / CPU AES
HP ZBook Ultra G1a 14
AMD Ryzen AI Max+ PRO 395, Radeon 8060S (v6.92.6600)
187841 MB/s +69%
Average Nvidia RTX Spark N1X 20-Core
  (107456 - 116546, n=4)
111126 MB/s 0%
Asus ProArt P14 H7407
Nvidia RTX Spark N1X 20-Core, RTX Spark N1X 6144-Core Blackwell GPU (v8.20.8100)
110939 MB/s
Razer Blade 14 2025
AMD Ryzen AI 9 365, GeForce RTX 5070 Laptop (v6.92.6600)
99502 MB/s -10%
Lenovo Yoga Slim 7 14Q8Y11
Qualcomm Snapdragon X2 Elite X2E-88-100, X2-90 (v8.20.8100)
96917 MB/s -13%
Asus ROG Zephyrus G14 GU405AR
Intel Core Ultra 9 386H, GeForce RTX 5070 Ti Laptop (v8.20.8100)
70468 MB/s -36%
Average of class Multimedia
  (8171 - 126790, n=53, last 2 years)
68880 MB/s -38%
Dell XPS 14 Core Ultra X7 358H
Intel Core Ultra X7 358H, Arc B390 Panther Lake iGPU (v8.20.8100)
63775 MB/s -43%
AIDA64 / CPU ZLib
HP ZBook Ultra G1a 14
AMD Ryzen AI Max+ PRO 395, Radeon 8060S (v6.92.6600)
2057 MB/s +45%
Asus ProArt P14 H7407
Nvidia RTX Spark N1X 20-Core, RTX Spark N1X 6144-Core Blackwell GPU (v8.20.8100)
1414 MB/s
Average Nvidia RTX Spark N1X 20-Core
  (1365 - 1445, n=4)
1398 MB/s -1%
Razer Blade 14 2025
AMD Ryzen AI 9 365, GeForce RTX 5070 Laptop (v6.92.6600)
1271 MB/s -10%
Asus ROG Zephyrus G14 GU405AR
Intel Core Ultra 9 386H, GeForce RTX 5070 Ti Laptop (v8.20.8100)
1262 MB/s -11%
Lenovo Yoga Slim 7 14Q8Y11
Qualcomm Snapdragon X2 Elite X2E-88-100, X2-90 (v8.20.8100)
1185 MB/s -16%
Dell XPS 14 Core Ultra X7 358H
Intel Core Ultra X7 358H, Arc B390 Panther Lake iGPU (v8.20.8100)
1103 MB/s -22%
Average of class Multimedia
  (143.8 - 2022, n=53, last 2 years)
1025 MB/s -28%
AIDA64 / FP64 Ray-Trace
HP ZBook Ultra G1a 14
AMD Ryzen AI Max+ PRO 395, Radeon 8060S (v6.92.6600)
32891 KRay/s +421%
Razer Blade 14 2025
AMD Ryzen AI 9 365, GeForce RTX 5070 Laptop (v6.92.6600)
16696 KRay/s +165%
Asus ROG Zephyrus G14 GU405AR
Intel Core Ultra 9 386H, GeForce RTX 5070 Ti Laptop (v8.20.8100)
11219 KRay/s +78%
Average of class Multimedia
  (1014 - 26875, n=53, last 2 years)
9387 KRay/s +49%
Dell XPS 14 Core Ultra X7 358H
Intel Core Ultra X7 358H, Arc B390 Panther Lake iGPU (v8.20.8100)
7603 KRay/s +21%
Average Nvidia RTX Spark N1X 20-Core
  (6235 - 6472, n=4)
6318 KRay/s 0%
Asus ProArt P14 H7407
Nvidia RTX Spark N1X 20-Core, RTX Spark N1X 6144-Core Blackwell GPU (v8.20.8100)
6307 KRay/s
Lenovo Yoga Slim 7 14Q8Y11
Qualcomm Snapdragon X2 Elite X2E-88-100, X2-90 (v8.20.8100)
5436 KRay/s -14%
AIDA64 / CPU PhotoWorxx
HP ZBook Ultra G1a 14
AMD Ryzen AI Max+ PRO 395, Radeon 8060S (v6.92.6600)
93684 MPixel/s +24%
Dell XPS 14 Core Ultra X7 358H
Intel Core Ultra X7 358H, Arc B390 Panther Lake iGPU (v8.20.8100)
88086 MPixel/s +17%
Asus ROG Zephyrus G14 GU405AR
Intel Core Ultra 9 386H, GeForce RTX 5070 Ti Laptop (v8.20.8100)
84786 MPixel/s +13%
Average Nvidia RTX Spark N1X 20-Core
  (75337 - 77724, n=4)
76743 MPixel/s +2%
Asus ProArt P14 H7407
Nvidia RTX Spark N1X 20-Core, RTX Spark N1X 6144-Core Blackwell GPU (v8.20.8100)
75337 MPixel/s
Average of class Multimedia
  (8187 - 88533, n=53, last 2 years)
55708 MPixel/s -26%
Razer Blade 14 2025
AMD Ryzen AI 9 365, GeForce RTX 5070 Laptop (v6.92.6600)
53550 MPixel/s -29%
Lenovo Yoga Slim 7 14Q8Y11
Qualcomm Snapdragon X2 Elite X2E-88-100, X2-90 (v8.20.8100)
52930 MPixel/s -30%

System and Storage Devices

System performance is very good and we did not encounter any stability issues. Please keep in mind that some apps still have compatibility issues with the ARM version of Windows. Some of our SSD benchmarks also seem to have an issue, as they report low transfer rates. DiskSpeed, however, shows good and stable results for a PCIe 4.0 drive, so there should not be any issues. The slot actually supports PCIe 5.0, so it is unfortunate that Asus does not implement a corresponding drive considering the high base price.

Performance rating: Percent
CrossMark: Overall | Productivity | Creativity | Responsiveness
WebXPRT 4: Overall
WebXPRT 5: Overall
Mozilla Kraken 1.1: Total
Performance rating
Apple MacBook Pro 14 2026 M5 Max
M5 Max 40-Core GPU, M5 Max, Apple SSD AP8192Z
92.4 pt
Lenovo Yoga Slim 7 14Q8Y11 -2!
X2-90, X2E-88-100
74.1 pt
Asus ROG Zephyrus G14 GU405AR
GeForce RTX 5070 Ti Laptop, Ultra 9 386H, Kioxia BG6 KBG60ZNV1T02
69.3 pt
Average of class Multimedia
 
67 pt
Average Nvidia RTX Spark N1X 20-Core, NVIDIA RTX Spark N1X 6144-Core Blackwell GPU
 
66.5 pt
Dell XPS 14 Core Ultra X7 358H -1!
Arc B390 Panther Lake iGPU, Ultra X7 358H, Samsung PM9C1b MZVL81T0HFLB-00BH1
62.7 pt
Razer Blade 14 2025 -1!
GeForce RTX 5070 Laptop, Ryzen AI 9 365, Samsung PM9A1 MZVL21T0HCLR
62.5 pt
HP ZBook Ultra G1a 14 -1!
Radeon 8060S, Ryzen AI Max+ PRO 395, WDC PC SN810 2TB
57.8 pt
Asus ProArt P14 H7407
RTX Spark N1X 6144-Core Blackwell GPU, Spark RTX N1X 20-Core, Samsung PM9C1b MZVL81T0HFLB-00BH1
57.6 pt
CrossMark / Overall
Apple MacBook Pro 14 2026 M5 Max
M5 Max 40-Core GPU, M5 Max, Apple SSD AP8192Z
2728 Points +65%
Asus ROG Zephyrus G14 GU405AR
GeForce RTX 5070 Ti Laptop, Ultra 9 386H, Kioxia BG6 KBG60ZNV1T02
2029 Points +23%
Razer Blade 14 2025
GeForce RTX 5070 Laptop, Ryzen AI 9 365, Samsung PM9A1 MZVL21T0HCLR
1964 Points +19%
Dell XPS 14 Core Ultra X7 358H
Arc B390 Panther Lake iGPU, Ultra X7 358H, Samsung PM9C1b MZVL81T0HFLB-00BH1
1955 Points +19%
Average of class Multimedia
  (866 - 3231, n=61, last 2 years)
1927 Points +17%
Lenovo Yoga Slim 7 14Q8Y11
X2-90, X2E-88-100
1919 Points +16%
HP ZBook Ultra G1a 14
Radeon 8060S, Ryzen AI Max+ PRO 395, WDC PC SN810 2TB
1892 Points +15%
Average Nvidia RTX Spark N1X 20-Core, NVIDIA RTX Spark N1X 6144-Core Blackwell GPU
  (1579 - 1750, n=4)
1682 Points +2%
Asus ProArt P14 H7407
RTX Spark N1X 6144-Core Blackwell GPU, Spark RTX N1X 20-Core, Samsung PM9C1b MZVL81T0HFLB-00BH1
1649 Points
CrossMark / Productivity
Apple MacBook Pro 14 2026 M5 Max
M5 Max 40-Core GPU, M5 Max, Apple SSD AP8192Z
2477 Points +84%
Razer Blade 14 2025
GeForce RTX 5070 Laptop, Ryzen AI 9 365, Samsung PM9A1 MZVL21T0HCLR
1808 Points +35%
Asus ROG Zephyrus G14 GU405AR
GeForce RTX 5070 Ti Laptop, Ultra 9 386H, Kioxia BG6 KBG60ZNV1T02
1802 Points +34%
Average of class Multimedia
  (931 - 2677, n=61, last 2 years)
1785 Points +33%
Lenovo Yoga Slim 7 14Q8Y11
X2-90, X2E-88-100
1722 Points +28%
Dell XPS 14 Core Ultra X7 358H
Arc B390 Panther Lake iGPU, Ultra X7 358H, Samsung PM9C1b MZVL81T0HFLB-00BH1
1719 Points +28%
HP ZBook Ultra G1a 14
Radeon 8060S, Ryzen AI Max+ PRO 395, WDC PC SN810 2TB
1620 Points +21%
Average Nvidia RTX Spark N1X 20-Core, NVIDIA RTX Spark N1X 6144-Core Blackwell GPU
  (1343 - 1510, n=4)
1432 Points +7%
Asus ProArt P14 H7407
RTX Spark N1X 6144-Core Blackwell GPU, Spark RTX N1X 20-Core, Samsung PM9C1b MZVL81T0HFLB-00BH1
1343 Points
CrossMark / Creativity
Apple MacBook Pro 14 2026 M5 Max
M5 Max 40-Core GPU, M5 Max, Apple SSD AP8192Z
3465 Points +54%
HP ZBook Ultra G1a 14
Radeon 8060S, Ryzen AI Max+ PRO 395, WDC PC SN810 2TB
2412 Points +7%
Asus ROG Zephyrus G14 GU405AR
GeForce RTX 5070 Ti Laptop, Ultra 9 386H, Kioxia BG6 KBG60ZNV1T02
2404 Points +7%
Dell XPS 14 Core Ultra X7 358H
Arc B390 Panther Lake iGPU, Ultra X7 358H, Samsung PM9C1b MZVL81T0HFLB-00BH1
2398 Points +7%
Razer Blade 14 2025
GeForce RTX 5070 Laptop, Ryzen AI 9 365, Samsung PM9A1 MZVL21T0HCLR
2253 Points 0%
Average of class Multimedia
  (907 - 4522, n=61, last 2 years)
2247 Points 0%
Asus ProArt P14 H7407
RTX Spark N1X 6144-Core Blackwell GPU, Spark RTX N1X 20-Core, Samsung PM9C1b MZVL81T0HFLB-00BH1
2246 Points
Lenovo Yoga Slim 7 14Q8Y11
X2-90, X2E-88-100
2175 Points -3%
Average Nvidia RTX Spark N1X 20-Core, NVIDIA RTX Spark N1X 6144-Core Blackwell GPU
  (1838 - 2246, n=4)
2061 Points -8%
CrossMark / Responsiveness
Lenovo Yoga Slim 7 14Q8Y11
X2-90, X2E-88-100
1822 Points +51%
Apple MacBook Pro 14 2026 M5 Max
M5 Max 40-Core GPU, M5 Max, Apple SSD AP8192Z
1777 Points +47%
Asus ROG Zephyrus G14 GU405AR
GeForce RTX 5070 Ti Laptop, Ultra 9 386H, Kioxia BG6 KBG60ZNV1T02
1745 Points +44%
Razer Blade 14 2025
GeForce RTX 5070 Laptop, Ryzen AI 9 365, Samsung PM9A1 MZVL21T0HCLR
1666 Points +38%
Dell XPS 14 Core Ultra X7 358H
Arc B390 Panther Lake iGPU, Ultra X7 358H, Samsung PM9C1b MZVL81T0HFLB-00BH1
1560 Points +29%
Average of class Multimedia
  (605 - 2073, n=61, last 2 years)
1560 Points +29%
Average Nvidia RTX Spark N1X 20-Core, NVIDIA RTX Spark N1X 6144-Core Blackwell GPU
  (1208 - 1667, n=4)
1499 Points +24%
HP ZBook Ultra G1a 14
Radeon 8060S, Ryzen AI Max+ PRO 395, WDC PC SN810 2TB
1455 Points +20%
Asus ProArt P14 H7407
RTX Spark N1X 6144-Core Blackwell GPU, Spark RTX N1X 20-Core, Samsung PM9C1b MZVL81T0HFLB-00BH1
1208 Points
WebXPRT 4 / Overall
Apple MacBook Pro 14 2026 M5 Max
M5 Max 40-Core GPU, M5 Max, Apple SSD AP8192Z
397 Points +258%
Dell XPS 14 Core Ultra X7 358H
Arc B390 Panther Lake iGPU, Ultra X7 358H, Samsung PM9C1b MZVL81T0HFLB-00BH1
305 Points +175%
Average Nvidia RTX Spark N1X 20-Core, NVIDIA RTX Spark N1X 6144-Core Blackwell GPU
  (111 - 408, n=3)
304 Points +174%
Average of class Multimedia
  (111 - 415, n=62, last 2 years)
295 Points +166%
Asus ROG Zephyrus G14 GU405AR
GeForce RTX 5070 Ti Laptop, Ultra 9 386H, Kioxia BG6 KBG60ZNV1T02
292 Points +163%
Razer Blade 14 2025
GeForce RTX 5070 Laptop, Ryzen AI 9 365, Samsung PM9A1 MZVL21T0HCLR
271 Points +144%
HP ZBook Ultra G1a 14
Radeon 8060S, Ryzen AI Max+ PRO 395, WDC PC SN810 2TB
225 Points +103%
Asus ProArt P14 H7407
RTX Spark N1X 6144-Core Blackwell GPU, Spark RTX N1X 20-Core, Samsung PM9C1b MZVL81T0HFLB-00BH1
111 Points
WebXPRT 5 / Overall
Apple MacBook Pro 14 2026 M5 Max
M5 Max 40-Core GPU, M5 Max, Apple SSD AP8192Z
119 Points +10%
Asus ROG Zephyrus G14 GU405AR
GeForce RTX 5070 Ti Laptop, Ultra 9 386H, Kioxia BG6 KBG60ZNV1T02
118 Points +9%
Average of class Multimedia
  (56 - 124, n=21, last 2 years)
113.5 Points +5%
Asus ProArt P14 H7407
RTX Spark N1X 6144-Core Blackwell GPU, Spark RTX N1X 20-Core, Samsung PM9C1b MZVL81T0HFLB-00BH1
108 Points
Average Nvidia RTX Spark N1X 20-Core, NVIDIA RTX Spark N1X 6144-Core Blackwell GPU
  (107 - 108, n=3)
107.3 Points -1%
Lenovo Yoga Slim 7 14Q8Y11
X2-90, X2E-88-100
81 Points -25%
Mozilla Kraken 1.1 / Total
Asus ROG Zephyrus G14 GU405AR
GeForce RTX 5070 Ti Laptop, Ultra 9 386H, Kioxia BG6 KBG60ZNV1T02
461 ms * -63%
Dell XPS 14 Core Ultra X7 358H
Arc B390 Panther Lake iGPU, Ultra X7 358H, Samsung PM9C1b MZVL81T0HFLB-00BH1
445 ms * -57%
Razer Blade 14 2025
GeForce RTX 5070 Laptop, Ryzen AI 9 365, Samsung PM9A1 MZVL21T0HCLR
437 ms * -54%
HP ZBook Ultra G1a 14
Radeon 8060S, Ryzen AI Max+ PRO 395, WDC PC SN810 2TB
433 ms * -53%
Average of class Multimedia
  (228 - 835, n=63, last 2 years)
432 ms * -52%
Average Nvidia RTX Spark N1X 20-Core, NVIDIA RTX Spark N1X 6144-Core Blackwell GPU
  (283 - 293, n=3)
289 ms * -2%
Asus ProArt P14 H7407
RTX Spark N1X 6144-Core Blackwell GPU, Spark RTX N1X 20-Core, Samsung PM9C1b MZVL81T0HFLB-00BH1
283.3 ms *
Apple MacBook Pro 14 2026 M5 Max
M5 Max 40-Core GPU, M5 Max, Apple SSD AP8192Z
233.2 ms * +18%

* ... smaller is better

AIDA64 / Memory Copy
HP ZBook Ultra G1a 14
AMD Ryzen AI Max+ PRO 395, Radeon 8060S
158632 MB/s 0%
Asus ProArt P14 H7407
Nvidia RTX Spark N1X 20-Core, RTX Spark N1X 6144-Core Blackwell GPU
158370 MB/s
Average Nvidia RTX Spark N1X 20-Core
  (153516 - 158370, n=4)
155754 MB/s -2%
Dell XPS 14 Core Ultra X7 358H
Intel Core Ultra X7 358H, Arc B390 Panther Lake iGPU
131796 MB/s -17%
Asus ROG Zephyrus G14 GU405AR
Intel Core Ultra 9 386H, GeForce RTX 5070 Ti Laptop
117140 MB/s -26%
Razer Blade 14 2025
AMD Ryzen AI 9 365, GeForce RTX 5070 Laptop
94015 MB/s -41%
Average of class Multimedia
  (11299 - 158370, n=53, last 2 years)
91954 MB/s -42%
Lenovo Yoga Slim 7 14Q8Y11
Qualcomm Snapdragon X2 Elite X2E-88-100, X2-90
74077 MB/s -53%
AIDA64 / Memory Read
Average Nvidia RTX Spark N1X 20-Core
  (132805 - 134029, n=4)
133578 MB/s +1%
Asus ProArt P14 H7407
Nvidia RTX Spark N1X 20-Core, RTX Spark N1X 6144-Core Blackwell GPU
132805 MB/s
Lenovo Yoga Slim 7 14Q8Y11
Qualcomm Snapdragon X2 Elite X2E-88-100, X2-90
124121 MB/s -7%
HP ZBook Ultra G1a 14
AMD Ryzen AI Max+ PRO 395, Radeon 8060S
121177 MB/s -9%
Dell XPS 14 Core Ultra X7 358H
Intel Core Ultra X7 358H, Arc B390 Panther Lake iGPU
114349 MB/s -14%
Asus ROG Zephyrus G14 GU405AR
Intel Core Ultra 9 386H, GeForce RTX 5070 Ti Laptop
110936 MB/s -16%
Razer Blade 14 2025
AMD Ryzen AI 9 365, GeForce RTX 5070 Laptop
104349 MB/s -21%
Average of class Multimedia
  (11624 - 174586, n=53, last 2 years)
86726 MB/s -35%
AIDA64 / Memory Write
Average Nvidia RTX Spark N1X 20-Core
  (222938 - 225987, n=4)
224933 MB/s +1%
Asus ProArt P14 H7407
Nvidia RTX Spark N1X 20-Core, RTX Spark N1X 6144-Core Blackwell GPU
222938 MB/s
HP ZBook Ultra G1a 14
AMD Ryzen AI Max+ PRO 395, Radeon 8060S
212172 MB/s -5%
Dell XPS 14 Core Ultra X7 358H
Intel Core Ultra X7 358H, Arc B390 Panther Lake iGPU
134916 MB/s -39%
Asus ROG Zephyrus G14 GU405AR
Intel Core Ultra 9 386H, GeForce RTX 5070 Ti Laptop
120870 MB/s -46%
Razer Blade 14 2025
AMD Ryzen AI 9 365, GeForce RTX 5070 Laptop
105106 MB/s -53%
Average of class Multimedia
  (11755 - 225987, n=53, last 2 years)
99485 MB/s -55%
Lenovo Yoga Slim 7 14Q8Y11
Qualcomm Snapdragon X2 Elite X2E-88-100, X2-90
54559 MB/s -76%
Samsung PM9C1b MZVL81T0HFLB-00BH1
CDM 5/6 Read Seq Q32T1: 5017 MB/s
CDM 5/6 Write Seq Q32T1: 5637 MB/s
CDM 5/6 Read 4K Q32T1: 199.6 MB/s
CDM 5/6 Write 4K Q32T1: 310 MB/s
CDM 5/6 Read 4K: 29.5 MB/s
CDM 5/6 Write 4K: 50 MB/s
CDM 6 Write 4K Q8T8: 668 MB/s
CDM 6 Read 4K Q8T8: 1582 MB/s
Drive Performance rating - Percent
Razer Blade 14 2025
Samsung PM9A1 MZVL21T0HCLR
88.6 pt
Lenovo Yoga Slim 7 14Q8Y11
 
74.7 pt
HP ZBook Ultra G1a 14
WDC PC SN810 2TB
67.4 pt
Average of class Multimedia
 
64.7 pt
Dell XPS 14 Core Ultra X7 358H
Samsung PM9C1b MZVL81T0HFLB-00BH1
58.9 pt
Asus ROG Zephyrus G14 GU405AR
Kioxia BG6 KBG60ZNV1T02
58.2 pt
Average Samsung PM9C1b MZVL81T0HFLB-00BH1
 
55.1 pt
Asus ProArt P14 H7407
Samsung PM9C1b MZVL81T0HFLB-00BH1
41.9 pt
DiskSpd
seq read
Lenovo Yoga Slim 7 14Q8Y11
 
4081 (4033.45min - 4081.28max) MB/s +57%
Razer Blade 14 2025
Samsung PM9A1 MZVL21T0HCLR
3813 (3801.51min - 3813.46max) MB/s +47%
HP ZBook Ultra G1a 14
WDC PC SN810 2TB
3352 (3235.49min - 3352.09max) MB/s +29%
Average of class Multimedia
  (453 - 7811, n=56, last 2 years)
3121 MB/s +20%
Dell XPS 14 Core Ultra X7 358H
Samsung PM9C1b MZVL81T0HFLB-00BH1
2967 (2659.4min - 2966.9max) MB/s +14%
Average Samsung PM9C1b MZVL81T0HFLB-00BH1
  (2490 - 3031, n=5)
2726 MB/s +5%
Asus ROG Zephyrus G14 GU405AR
Kioxia BG6 KBG60ZNV1T02
2641 (2602.78min - 2640.94max) MB/s +1%
Asus ProArt P14 H7407
Samsung PM9C1b MZVL81T0HFLB-00BH1
2602 (2285.52min - 2602.18max) MB/s
seq write
Lenovo Yoga Slim 7 14Q8Y11
 
4086 (3977.26min - 4085.68max) MB/s +128%
HP ZBook Ultra G1a 14
WDC PC SN810 2TB
3998 (3691.2min - 3997.57max) MB/s +123%
Razer Blade 14 2025
Samsung PM9A1 MZVL21T0HCLR
3469 (2223.57min - 3469.11max) MB/s +93%
Average of class Multimedia
  (384 - 9952, n=56, last 2 years)
3244 MB/s +81%
Asus ROG Zephyrus G14 GU405AR
Kioxia BG6 KBG60ZNV1T02
2823 (1907.74min - 2822.99max) MB/s +57%
Average Samsung PM9C1b MZVL81T0HFLB-00BH1
  (1796 - 3704, n=5)
2463 MB/s +37%
Dell XPS 14 Core Ultra X7 358H
Samsung PM9C1b MZVL81T0HFLB-00BH1
2327 (2217.14min - 2327max) MB/s +30%
Asus ProArt P14 H7407
Samsung PM9C1b MZVL81T0HFLB-00BH1
1796 (1158.04min - 1796.39max) MB/s
seq q8 t1 read
Asus ProArt P14 H7407
Samsung PM9C1b MZVL81T0HFLB-00BH1
7204 (5366.82min - 7203.99max) MB/s
Dell XPS 14 Core Ultra X7 358H
Samsung PM9C1b MZVL81T0HFLB-00BH1
7037 (5759.83min - 7037.41max) MB/s -2%
Lenovo Yoga Slim 7 14Q8Y11
 
7021 (6167.3min - 7020.85max) MB/s -3%
HP ZBook Ultra G1a 14
WDC PC SN810 2TB
6974 (6195.18min - 6973.56max) MB/s -3%
Razer Blade 14 2025
Samsung PM9A1 MZVL21T0HCLR
6691 (5876.63min - 6691.17max) MB/s -7%
Average Samsung PM9C1b MZVL81T0HFLB-00BH1
  (4747 - 7258, n=5)
6649 MB/s -8%
Average of class Multimedia
  (467 - 14225, n=56, last 2 years)
6401 MB/s -11%
Asus ROG Zephyrus G14 GU405AR
Kioxia BG6 KBG60ZNV1T02
5901 (4817.58min - 5901.12max) MB/s -18%
seq q8 t1 write
Lenovo Yoga Slim 7 14Q8Y11
 
6006 (5866.15min - 6006.03max) MB/s +2%
Asus ProArt P14 H7407
Samsung PM9C1b MZVL81T0HFLB-00BH1
5909 (5752.1min - 5909.43max) MB/s
Dell XPS 14 Core Ultra X7 358H
Samsung PM9C1b MZVL81T0HFLB-00BH1
5595 (5550.94min - 5595.34max) MB/s -5%
Average Samsung PM9C1b MZVL81T0HFLB-00BH1
  (4105 - 5909, n=5)
5439 MB/s -8%
Average of class Multimedia
  (247 - 13512, n=56, last 2 years)
5360 MB/s -9%
Asus ROG Zephyrus G14 GU405AR
Kioxia BG6 KBG60ZNV1T02
5046 (1306.53min - 5046.12max) MB/s -15%
HP ZBook Ultra G1a 14
WDC PC SN810 2TB
5025 (4956.2min - 5024.78max) MB/s -15%
Razer Blade 14 2025
Samsung PM9A1 MZVL21T0HCLR
4123 (2408.79min - 4122.72max) MB/s -30%
4k q1 t1 read
Lenovo Yoga Slim 7 14Q8Y11
 
80.6 (79.7min - 80.57max) MB/s +152%
Average of class Multimedia
  (18.8 - 94.1, n=56, last 2 years)
63.1 MB/s +97%
Dell XPS 14 Core Ultra X7 358H
Samsung PM9C1b MZVL81T0HFLB-00BH1
61.8 (59.95min - 61.82max) MB/s +93%
HP ZBook Ultra G1a 14
WDC PC SN810 2TB
58.7 (56.42min - 58.7max) MB/s +83%
Razer Blade 14 2025
Samsung PM9A1 MZVL21T0HCLR
55.9 (55.71min - 55.9max) MB/s +75%
Average Samsung PM9C1b MZVL81T0HFLB-00BH1
  (32 - 61.8, n=5)
48.6 MB/s +52%
Asus ROG Zephyrus G14 GU405AR
Kioxia BG6 KBG60ZNV1T02
43.2 (43.01min - 43.19max) MB/s +35%
Asus ProArt P14 H7407
Samsung PM9C1b MZVL81T0HFLB-00BH1
32 (30.51min - 31.96max) MB/s
4k q1 t1 write
Lenovo Yoga Slim 7 14Q8Y11
 
277 (266.35min - 276.64max) MB/s +201%
Razer Blade 14 2025
Samsung PM9A1 MZVL21T0HCLR
203 (200.63min - 203.18max) MB/s +121%
Asus ROG Zephyrus G14 GU405AR
Kioxia BG6 KBG60ZNV1T02
191.5 (158.68min - 191.52max) MB/s +108%
HP ZBook Ultra G1a 14
WDC PC SN810 2TB
165.1 (140.72min - 165.08max) MB/s +80%
Average of class Multimedia
  (40.3 - 278, n=56, last 2 years)
163.9 MB/s +78%
Dell XPS 14 Core Ultra X7 358H
Samsung PM9C1b MZVL81T0HFLB-00BH1
139.7 (138.86min - 139.67max) MB/s +52%
Average Samsung PM9C1b MZVL81T0HFLB-00BH1
  (91.9 - 139.7, n=5)
113.8 MB/s +24%
Asus ProArt P14 H7407
Samsung PM9C1b MZVL81T0HFLB-00BH1
91.9 (85.46min - 91.91max) MB/s
4k q32 t16 read
Razer Blade 14 2025
Samsung PM9A1 MZVL21T0HCLR
3222 (3205.72min - 3221.76max) MB/s +178%
Average of class Multimedia
  (190.3 - 6121, n=56, last 2 years)
1652 MB/s +42%
HP ZBook Ultra G1a 14
WDC PC SN810 2TB
1247 (1208.78min - 1246.91max) MB/s +8%
Lenovo Yoga Slim 7 14Q8Y11
 
1193 (1171.66min - 1193.44max) MB/s +3%
Asus ProArt P14 H7407
Samsung PM9C1b MZVL81T0HFLB-00BH1
1160 (1154.71min - 1160.24max) MB/s
Average Samsung PM9C1b MZVL81T0HFLB-00BH1
  (665 - 1160, n=5)
822 MB/s -29%
Dell XPS 14 Core Ultra X7 358H
Samsung PM9C1b MZVL81T0HFLB-00BH1
711 (562.02min - 711.38max) MB/s -39%
Asus ROG Zephyrus G14 GU405AR
Kioxia BG6 KBG60ZNV1T02
703 (695.91min - 702.67max) MB/s -39%
4k q32 t16 write
Razer Blade 14 2025
Samsung PM9A1 MZVL21T0HCLR
2479 (2210.04min - 2479.14max) MB/s +194%
Average of class Multimedia
  (154.9 - 4447, n=56, last 2 years)
1164 MB/s +38%
Asus ProArt P14 H7407
Samsung PM9C1b MZVL81T0HFLB-00BH1
844 (797.25min - 844.26max) MB/s
Lenovo Yoga Slim 7 14Q8Y11
 
671 (653.86min - 671.02max) MB/s -20%
HP ZBook Ultra G1a 14
WDC PC SN810 2TB
561 (514.69min - 560.6max) MB/s -34%
Asus ROG Zephyrus G14 GU405AR
Kioxia BG6 KBG60ZNV1T02
511 (481.83min - 510.6max) MB/s -39%
Average Samsung PM9C1b MZVL81T0HFLB-00BH1
  (356 - 844, n=5)
480 MB/s -43%
Dell XPS 14 Core Ultra X7 358H
Samsung PM9C1b MZVL81T0HFLB-00BH1
432 (319.99min - 432.49max) MB/s -49%
AS SSD
Score Total
Razer Blade 14 2025
Samsung PM9A1 MZVL21T0HCLR
8561 Points +554%
HP ZBook Ultra G1a 14
WDC PC SN810 2TB
5730 Points +338%
Dell XPS 14 Core Ultra X7 358H
Samsung PM9C1b MZVL81T0HFLB-00BH1
5466 Points +318%
Asus ROG Zephyrus G14 GU405AR
Kioxia BG6 KBG60ZNV1T02
5233 Points +300%
Average of class Multimedia
  (482 - 11377, n=54, last 2 years)
5198 Points +297%
Lenovo Yoga Slim 7 14Q8Y11
 
4837 Points +270%
Average Samsung PM9C1b MZVL81T0HFLB-00BH1
  (1309 - 5466, n=5)
4033 Points +208%
Asus ProArt P14 H7407
Samsung PM9C1b MZVL81T0HFLB-00BH1
1309 Points
Score Read
Razer Blade 14 2025
Samsung PM9A1 MZVL21T0HCLR
3165 Points +393%
HP ZBook Ultra G1a 14
WDC PC SN810 2TB
1798 Points +180%
Average of class Multimedia
  (192 - 4351, n=54, last 2 years)
1705 Points +166%
Asus ROG Zephyrus G14 GU405AR
Kioxia BG6 KBG60ZNV1T02
1446 Points +125%
Dell XPS 14 Core Ultra X7 358H
Samsung PM9C1b MZVL81T0HFLB-00BH1
1402 Points +118%
Lenovo Yoga Slim 7 14Q8Y11
 
1185 Points +85%
Average Samsung PM9C1b MZVL81T0HFLB-00BH1
  (642 - 1402, n=5)
1172 Points +83%
Asus ProArt P14 H7407
Samsung PM9C1b MZVL81T0HFLB-00BH1
642 Points
Score Write
Razer Blade 14 2025
Samsung PM9A1 MZVL21T0HCLR
3851 Points +726%
Dell XPS 14 Core Ultra X7 358H
Samsung PM9C1b MZVL81T0HFLB-00BH1
3375 Points +624%
Asus ROG Zephyrus G14 GU405AR
Kioxia BG6 KBG60ZNV1T02
3116 Points +569%
Lenovo Yoga Slim 7 14Q8Y11
 
3114 Points +568%
HP ZBook Ultra G1a 14
WDC PC SN810 2TB
3112 Points +568%
Average of class Multimedia
  (191 - 4851, n=54, last 2 years)
2687 Points +477%
Average Samsung PM9C1b MZVL81T0HFLB-00BH1
  (466 - 3375, n=5)
2340 Points +402%
Asus ProArt P14 H7407
Samsung PM9C1b MZVL81T0HFLB-00BH1
466 Points
Seq Read
Lenovo Yoga Slim 7 14Q8Y11
 
6456.92 MB/s +33%
HP ZBook Ultra G1a 14
WDC PC SN810 2TB
5390.95 MB/s +11%
Razer Blade 14 2025
Samsung PM9A1 MZVL21T0HCLR
5295 MB/s +9%
Asus ProArt P14 H7407
Samsung PM9C1b MZVL81T0HFLB-00BH1
4850 MB/s
Average of class Multimedia
  (484 - 10494, n=54, last 2 years)
4839 MB/s 0%
Asus ROG Zephyrus G14 GU405AR
Kioxia BG6 KBG60ZNV1T02
4815 MB/s -1%
Average Samsung PM9C1b MZVL81T0HFLB-00BH1
  (4161 - 5086, n=5)
4708 MB/s -3%
Dell XPS 14 Core Ultra X7 358H
Samsung PM9C1b MZVL81T0HFLB-00BH1
4161.24 MB/s -14%
Seq Write
Razer Blade 14 2025
Samsung PM9A1 MZVL21T0HCLR
3815 MB/s +79%
Lenovo Yoga Slim 7 14Q8Y11
 
3652.96 MB/s +71%
Dell XPS 14 Core Ultra X7 358H
Samsung PM9C1b MZVL81T0HFLB-00BH1
3356.2 MB/s +57%
Average of class Multimedia
  (344 - 9596, n=54, last 2 years)
3297 MB/s +55%
HP ZBook Ultra G1a 14
WDC PC SN810 2TB
3289.15 MB/s +54%
Asus ROG Zephyrus G14 GU405AR
Kioxia BG6 KBG60ZNV1T02
3271 MB/s +53%
Average Samsung PM9C1b MZVL81T0HFLB-00BH1
  (2132 - 3356, n=5)
2896 MB/s +36%
Asus ProArt P14 H7407
Samsung PM9C1b MZVL81T0HFLB-00BH1
2132 MB/s
4K Read
Razer Blade 14 2025
Samsung PM9A1 MZVL21T0HCLR
71.8 MB/s +114%
Lenovo Yoga Slim 7 14Q8Y11
 
71.28 MB/s +113%
Average of class Multimedia
  (17.5 - 89.9, n=54, last 2 years)
61.4 MB/s +83%
Dell XPS 14 Core Ultra X7 358H
Samsung PM9C1b MZVL81T0HFLB-00BH1
57.94 MB/s +73%
Average Samsung PM9C1b MZVL81T0HFLB-00BH1
  (33.5 - 59.5, n=5)
53.5 MB/s +60%
HP ZBook Ultra G1a 14
WDC PC SN810 2TB
51.75 MB/s +54%
Asus ROG Zephyrus G14 GU405AR
Kioxia BG6 KBG60ZNV1T02
49.1 MB/s +47%
Asus ProArt P14 H7407
Samsung PM9C1b MZVL81T0HFLB-00BH1
33.5 MB/s
4K Write
Lenovo Yoga Slim 7 14Q8Y11
 
265.39 MB/s +178%
HP ZBook Ultra G1a 14
WDC PC SN810 2TB
197.08 MB/s +107%
Razer Blade 14 2025
Samsung PM9A1 MZVL21T0HCLR
183.2 MB/s +92%
Dell XPS 14 Core Ultra X7 358H
Samsung PM9C1b MZVL81T0HFLB-00BH1
183.04 MB/s +92%
Average of class Multimedia
  (43.1 - 265, n=54, last 2 years)
177.5 MB/s +86%
Asus ROG Zephyrus G14 GU405AR
Kioxia BG6 KBG60ZNV1T02
155.4 MB/s +63%
Average Samsung PM9C1b MZVL81T0HFLB-00BH1
  (95.3 - 189.4, n=5)
148.4 MB/s +56%
Asus ProArt P14 H7407
Samsung PM9C1b MZVL81T0HFLB-00BH1
95.3 MB/s
4K-64 Read
Razer Blade 14 2025
Samsung PM9A1 MZVL21T0HCLR
2564 MB/s +1981%
HP ZBook Ultra G1a 14
WDC PC SN810 2TB
1207.28 MB/s +880%
Average of class Multimedia
  (123.2 - 3394, n=54, last 2 years)
1160 MB/s +842%
Dell XPS 14 Core Ultra X7 358H
Samsung PM9C1b MZVL81T0HFLB-00BH1
927.71 MB/s +653%
Asus ROG Zephyrus G14 GU405AR
Kioxia BG6 KBG60ZNV1T02
916 MB/s +644%
Average Samsung PM9C1b MZVL81T0HFLB-00BH1
  (123.2 - 928, n=5)
648 MB/s +426%
Lenovo Yoga Slim 7 14Q8Y11
 
567.95 MB/s +361%
Asus ProArt P14 H7407
Samsung PM9C1b MZVL81T0HFLB-00BH1
123.2 MB/s
4K-64 Write
Razer Blade 14 2025
Samsung PM9A1 MZVL21T0HCLR
3286 MB/s +1990%
Dell XPS 14 Core Ultra X7 358H
Samsung PM9C1b MZVL81T0HFLB-00BH1
2856.06 MB/s +1717%
Asus ROG Zephyrus G14 GU405AR
Kioxia BG6 KBG60ZNV1T02
2634 MB/s +1576%
HP ZBook Ultra G1a 14
WDC PC SN810 2TB
2585.64 MB/s +1545%
Lenovo Yoga Slim 7 14Q8Y11
 
2483.75 MB/s +1480%
Average of class Multimedia
  (75.2 - 4042, n=54, last 2 years)
2180 MB/s +1287%
Average Samsung PM9C1b MZVL81T0HFLB-00BH1
  (157.2 - 2856, n=5)
1902 MB/s +1110%
Asus ProArt P14 H7407
Samsung PM9C1b MZVL81T0HFLB-00BH1
157.2 MB/s
Access Time Read
Dell XPS 14 Core Ultra X7 358H
Samsung PM9C1b MZVL81T0HFLB-00BH1
0.103 ms * -51%
Average Samsung PM9C1b MZVL81T0HFLB-00BH1
  (0.038 - 0.103, n=5)
0.0704 ms * -4%
Asus ProArt P14 H7407
Samsung PM9C1b MZVL81T0HFLB-00BH1
0.068 ms *
Average of class Multimedia
  (0.018 - 0.168, n=54, last 2 years)
0.06522 ms * +4%
Lenovo Yoga Slim 7 14Q8Y11
 
0.062 ms * +9%
HP ZBook Ultra G1a 14
WDC PC SN810 2TB
0.057 ms * +16%
Asus ROG Zephyrus G14 GU405AR
Kioxia BG6 KBG60ZNV1T02
0.052 ms * +24%
Razer Blade 14 2025
Samsung PM9A1 MZVL21T0HCLR
0.025 ms * +63%
Access Time Write
Asus ROG Zephyrus G14 GU405AR
Kioxia BG6 KBG60ZNV1T02
0.087 ms * -71%
Dell XPS 14 Core Ultra X7 358H
Samsung PM9C1b MZVL81T0HFLB-00BH1
0.077 ms * -51%
Average of class Multimedia
  (0.015 - 0.754, n=54, last 2 years)
0.07593 ms * -49%
HP ZBook Ultra G1a 14
WDC PC SN810 2TB
0.057 ms * -12%
Asus ProArt P14 H7407
Samsung PM9C1b MZVL81T0HFLB-00BH1
0.051 ms *
Lenovo Yoga Slim 7 14Q8Y11
 
0.044 ms * +14%
Average Samsung PM9C1b MZVL81T0HFLB-00BH1
  (0.022 - 0.077, n=5)
0.0416 ms * +18%
Razer Blade 14 2025
Samsung PM9A1 MZVL21T0HCLR
0.023 ms * +55%

* ... smaller is better

Disk Throttling: DiskSpd Read Loop, Queue Depth 8

014028042056070084098011201260140015401680182019602100224023802520266028002940308032203360350036403780392040604200434044804620476049005040518053205460560057405880602061606300644065806720Tooltip
Asus ProArt P14 H7407; diskspd 2.0.17 f: Ø6801 (5975.83-6837.81) MB/s

GPU and Gaming Performance

The RTX Spark N1X Blackwell GPU offers 6144 CUDA cores and sits between a mobile GeForce RTX 5060 and RTX 5070 in terms of raw performance. As we have seen in our analysis article, it is also faster than the current M5 Pro GPU from Apple, but cannot keep up with the M5 Max GPU. While RTX Spark laptops are primarily designed for content creators with large projects and/or agentic AI workloads, gaming is obviously possible as well including all the features we know from the current Blackwell generation including DLSS 5 and multi frame generation. The gaming performance is decent, but keep in mind that there are currently still compatibility issues with some games like Battlefield, Call of Duty or F1 2025, for example.

3DMark 11 - 1280x720 Performance GPU
Asus ROG Zephyrus G14 GU405AR
NVIDIA GeForce RTX 5070 Ti Laptop, Intel Core Ultra 9 386H
55109 Points +35%
Razer Blade 14 2025
NVIDIA GeForce RTX 5070 Laptop, AMD Ryzen AI 9 365
45246 Points +11%
Average NVIDIA RTX Spark N1X 6144-Core Blackwell GPU
  (39804 - 43182, n=4)
41425 Points +1%
Asus ProArt P14 H7407
NVIDIA RTX Spark N1X 6144-Core Blackwell GPU, Nvidia RTX Spark N1X 20-Core
40849 Points
HP ZBook Ultra G1a 14
AMD Radeon 8060S, AMD Ryzen AI Max+ PRO 395
39596 Points -3%
Average of class Multimedia
  (3749 - 60002, n=54, last 2 years)
21728 Points -47%
Dell XPS 14 Core Ultra X7 358H
Intel Arc B390 12 Xe3 Panther Lake iGPU, Intel Core Ultra X7 358H
18743 Points -54%
Lenovo Yoga Slim 7 14Q8Y11
Qualcomm Adreno X2-90, Qualcomm Snapdragon X2 Elite X2E-88-100
11584 Points -72%
3DMark
Steel Nomad Score
Apple MacBook Pro 14 2026 M5 Max
Apple M5 Max 40-Core GPU, Apple M5 Max
3924 Points +37%
Asus ROG Zephyrus G14 GU405AR
NVIDIA GeForce RTX 5070 Ti Laptop, Intel Core Ultra 9 386H
3694 Points +29%
Average NVIDIA RTX Spark N1X 6144-Core Blackwell GPU
  (2872 - 3134, n=4)
3032 Points +6%
Razer Blade 14 2025
NVIDIA GeForce RTX 5070 Laptop, AMD Ryzen AI 9 365
3030 Points +6%
Asus ProArt P14 H7407
NVIDIA RTX Spark N1X 6144-Core Blackwell GPU, Nvidia RTX Spark N1X 20-Core
2872 Points
Average of class Multimedia
  (342 - 4959, n=44, last 2 years)
2117 Points -26%
Steel Nomad Light Score
Asus ROG Zephyrus G14 GU405AR
NVIDIA GeForce RTX 5070 Ti Laptop, Intel Core Ultra 9 386H
16907 Points +31%
Apple MacBook Pro 14 2026 M5 Max
Apple M5 Max 40-Core GPU, Apple M5 Max
16191 Points +25%
Razer Blade 14 2025
NVIDIA GeForce RTX 5070 Laptop, AMD Ryzen AI 9 365
14367 Points +11%
Average NVIDIA RTX Spark N1X 6144-Core Blackwell GPU
  (12900 - 13266, n=3)
13040 Points +1%
Asus ProArt P14 H7407
NVIDIA RTX Spark N1X 6144-Core Blackwell GPU, Nvidia RTX Spark N1X 20-Core
12955 Points
Average of class Multimedia
  (2001 - 21012, n=42, last 2 years)
8512 Points -34%
Wild Life Extreme
Apple MacBook Pro 14 2026 M5 Max
Apple M5 Max 40-Core GPU, Apple M5 Max
39389 Points +79%
Asus ROG Zephyrus G14 GU405AR
NVIDIA GeForce RTX 5070 Ti Laptop, Intel Core Ultra 9 386H
30791 Points +40%
Razer Blade 14 2025
NVIDIA GeForce RTX 5070 Laptop, AMD Ryzen AI 9 365
24716 Points +13%
Asus ProArt P14 H7407
NVIDIA RTX Spark N1X 6144-Core Blackwell GPU, Nvidia RTX Spark N1X 20-Core
21962 Points
Average NVIDIA RTX Spark N1X 6144-Core Blackwell GPU
  (21779 - 21962, n=3)
21846 Points -1%
Average of class Multimedia
  (3769 - 43426, n=28, last 2 years)
19676 Points -10%
1920x1080 Fire Strike Graphics
Asus ROG Zephyrus G14 GU405AR
NVIDIA GeForce RTX 5070 Ti Laptop, Intel Core Ultra 9 386H
42629 Points +56%
Razer Blade 14 2025
NVIDIA GeForce RTX 5070 Laptop, AMD Ryzen AI 9 365
33878 Points +24%
Average NVIDIA RTX Spark N1X 6144-Core Blackwell GPU
  (27409 - 29045, n=4)
28370 Points +4%
HP ZBook Ultra G1a 14
AMD Radeon 8060S, AMD Ryzen AI Max+ PRO 395
27659 Points +1%
Asus ProArt P14 H7407
NVIDIA RTX Spark N1X 6144-Core Blackwell GPU, Nvidia RTX Spark N1X 20-Core
27409 Points
Dell XPS 14 Core Ultra X7 358H
Intel Arc B390 12 Xe3 Panther Lake iGPU, Intel Core Ultra X7 358H
17324 Points -37%
Average of class Multimedia
  (2328 - 48907, n=58, last 2 years)
16733 Points -39%
Lenovo Yoga Slim 7 14Q8Y11
Qualcomm Adreno X2-90, Qualcomm Snapdragon X2 Elite X2E-88-100
10112 Points -63%
2560x1440 Time Spy Graphics
Asus ROG Zephyrus G14 GU405AR
NVIDIA GeForce RTX 5070 Ti Laptop, Intel Core Ultra 9 386H
16295 Points +34%
Razer Blade 14 2025
NVIDIA GeForce RTX 5070 Laptop, AMD Ryzen AI 9 365
13734 Points +13%
Average NVIDIA RTX Spark N1X 6144-Core Blackwell GPU
  (12168 - 12912, n=4)
12543 Points +3%
Asus ProArt P14 H7407
NVIDIA RTX Spark N1X 6144-Core Blackwell GPU, Nvidia RTX Spark N1X 20-Core
12168 Points
HP ZBook Ultra G1a 14
AMD Radeon 8060S, AMD Ryzen AI Max+ PRO 395
10346 Points -15%
Dell XPS 14 Core Ultra X7 358H
Intel Arc B390 12 Xe3 Panther Lake iGPU, Intel Core Ultra X7 358H
7043 Points -42%
Average of class Multimedia
  (696 - 19403, n=58, last 2 years)
6612 Points -46%
Lenovo Yoga Slim 7 14Q8Y11
Qualcomm Adreno X2-90, Qualcomm Snapdragon X2 Elite X2E-88-100
3666 Points -70%
3DMark 11 Performance
26797 points
3DMark Fire Strike Score
22619 points
3DMark Time Spy Score
12598 points
3DMark Steel Nomad Score
2872 points
3DMark Steel Nomad Light Score
12955 points
Help
Blender / v3.3 Classroom OPTIX/RTX
Average of class Multimedia
  (12 - 105, n=20, last 2 years)
27.4 Seconds *
Average NVIDIA RTX Spark N1X 6144-Core Blackwell GPU
  (20 - 21, n=2)
20.5 Seconds *
Razer Blade 14 2025
NVIDIA GeForce RTX 5070 Laptop, AMD Ryzen AI 9 365
19 Seconds *
Asus ROG Zephyrus G14 GU405AR
NVIDIA GeForce RTX 5070 Ti Laptop, Intel Core Ultra 9 386H
17 Seconds *
Blender / v3.3 Classroom CUDA
Average of class Multimedia
  (20 - 186, n=21, last 2 years)
52.5 Seconds * -59%
Asus ProArt P14 H7407
NVIDIA RTX Spark N1X 6144-Core Blackwell GPU, Nvidia RTX Spark N1X 20-Core
33 Seconds *
Average NVIDIA RTX Spark N1X 6144-Core Blackwell GPU
  (32 - 33, n=3)
32.7 Seconds * +1%
Razer Blade 14 2025
NVIDIA GeForce RTX 5070 Laptop, AMD Ryzen AI 9 365
31 Seconds * +6%
Asus ROG Zephyrus G14 GU405AR
NVIDIA GeForce RTX 5070 Ti Laptop, Intel Core Ultra 9 386H
26 Seconds * +21%
Blender / v3.3 Classroom METAL
Average of class Multimedia
  (17.8 - 68, n=6, last 2 years)
37.2 Seconds *
Apple MacBook Pro 14 2026 M5 Max
Apple M5 Max 40-Core GPU, Apple M5 Max
25.6 Seconds *
Blender / v3.3 Classroom CPU
Lenovo Yoga Slim 7 14Q8Y11
Qualcomm Adreno X2-90, Qualcomm Snapdragon X2 Elite X2E-88-100
406 Seconds * -17%
Average of class Multimedia
  (133 - 1042, n=62, last 2 years)
368 Seconds * -6%
Average NVIDIA RTX Spark N1X 6144-Core Blackwell GPU
  (337 - 360, n=4)
348 Seconds * -1%
Asus ProArt P14 H7407
NVIDIA RTX Spark N1X 6144-Core Blackwell GPU, Nvidia RTX Spark N1X 20-Core
346 Seconds *
Dell XPS 14 Core Ultra X7 358H
Intel Arc B390 12 Xe3 Panther Lake iGPU, Intel Core Ultra X7 358H
335 Seconds * +3%
Razer Blade 14 2025
NVIDIA GeForce RTX 5070 Laptop, AMD Ryzen AI 9 365
261 Seconds * +25%
Asus ROG Zephyrus G14 GU405AR
NVIDIA GeForce RTX 5070 Ti Laptop, Intel Core Ultra 9 386H
250 Seconds * +28%
HP ZBook Ultra G1a 14
AMD Radeon 8060S, AMD Ryzen AI Max+ PRO 395
159 Seconds * +54%
Apple MacBook Pro 14 2026 M5 Max
Apple M5 Max 40-Core GPU, Apple M5 Max
149 Seconds * +57%
Blender / v3.3 Classroom oneAPI/Intel
Average of class Multimedia
  (105 - 492, n=16, last 2 years)
252 Seconds *
Dell XPS 14 Core Ultra X7 358H
Intel Arc B390 12 Xe3 Panther Lake iGPU, Intel Core Ultra X7 358H
106 Seconds *

* ... smaller is better

Performance rating - Percent
Asus ROG Zephyrus G14 GU405AR
Intel Core Ultra 9 386H, NVIDIA GeForce RTX 5070 Ti Laptop
100 pt
Razer Blade 14 2025
AMD Ryzen AI 9 365, NVIDIA GeForce RTX 5070 Laptop
87.8 pt
Apple MacBook Pro 14 2026 M5 Max -5!
Apple M5 Max, Apple M5 Max 40-Core GPU
83.8 pt
HP ZBook Ultra G1a 14
AMD Ryzen AI Max+ PRO 395, AMD Radeon 8060S
65.4 pt
Asus ProArt P14 H7407
Nvidia RTX Spark N1X 20-Core, NVIDIA RTX Spark N1X 6144-Core Blackwell GPU
60.1 pt
Average of class Multimedia
 
44 pt
Dell XPS 14 Core Ultra X7 358H
Intel Core Ultra X7 358H, Intel Arc B390 12 Xe3 Panther Lake iGPU
39.4 pt
Lenovo Yoga Slim 7 14Q8Y11
Qualcomm Snapdragon X2 Elite X2E-88-100, Qualcomm Adreno X2-90
29.7 pt
Cyberpunk 2077 - 1920x1080 Ultra Preset (FSR off)
Asus ROG Zephyrus G14 GU405AR
Intel Core Ultra 9 386H, NVIDIA GeForce RTX 5070 Ti Laptop
111.9 (88.8min) fps +46%
Razer Blade 14 2025
AMD Ryzen AI 9 365, NVIDIA GeForce RTX 5070 Laptop
98.9 (73.1min) fps +29%
Apple MacBook Pro 14 2026 M5 Max
Apple M5 Max, Apple M5 Max 40-Core GPU
91.3 fps +19%
HP ZBook Ultra G1a 14
AMD Ryzen AI Max+ PRO 395, AMD Radeon 8060S
80.7 (65.3min, 60.6P1) fps +5%
Asus ProArt P14 H7407
Nvidia RTX Spark N1X 20-Core, NVIDIA RTX Spark N1X 6144-Core Blackwell GPU
76.8 (59.1min) fps
Average of class Multimedia
  (6.41 - 112.3, n=68, last 2 years)
47.3 fps -38%
Dell XPS 14 Core Ultra X7 358H
Intel Core Ultra X7 358H, Intel Arc B390 12 Xe3 Panther Lake iGPU
40.9 (33.3min, 30.6P1) fps -47%
Lenovo Yoga Slim 7 14Q8Y11
Qualcomm Snapdragon X2 Elite X2E-88-100, Qualcomm Adreno X2-90
30.9 (24.6min, 22.3P1) fps -60%
Baldur's Gate 3 - 1920x1080 Ultra Preset AA:T
Asus ROG Zephyrus G14 GU405AR
Intel Core Ultra 9 386H, NVIDIA GeForce RTX 5070 Ti Laptop
141.9 (90.2min, 102.1P0.1, 119.1P1) fps +43%
Razer Blade 14 2025
AMD Ryzen AI 9 365, NVIDIA GeForce RTX 5070 Laptop
128.4 fps +30%
Apple MacBook Pro 14 2026 M5 Max
Apple M5 Max, Apple M5 Max 40-Core GPU
122.1 fps +23%
HP ZBook Ultra G1a 14
AMD Ryzen AI Max+ PRO 395, AMD Radeon 8060S
99.4 fps +1%
Asus ProArt P14 H7407
Nvidia RTX Spark N1X 20-Core, NVIDIA RTX Spark N1X 6144-Core Blackwell GPU
98.9 (33.4min, 63.8P0.1, 75.5P1) fps
Average of class Multimedia
  (7.8 - 158.7, n=66, last 2 years)
59.3 fps -40%
Dell XPS 14 Core Ultra X7 358H
Intel Core Ultra X7 358H, Intel Arc B390 12 Xe3 Panther Lake iGPU
48.7 (43.1min, 44.3P0.1, 45.5P1) fps -51%
Lenovo Yoga Slim 7 14Q8Y11
Qualcomm Snapdragon X2 Elite X2E-88-100, Qualcomm Adreno X2-90
37.7 (27.6min, 30.2P0.1, 32.8P1) fps -62%
GTA V - 1920x1080 Highest AA:4xMSAA + FX AF:16x
Asus ROG Zephyrus G14 GU405AR
Intel Core Ultra 9 386H, NVIDIA GeForce RTX 5070 Ti Laptop
148.2 (2.69min, 100P1) fps +201%
Razer Blade 14 2025
AMD Ryzen AI 9 365, NVIDIA GeForce RTX 5070 Laptop
127.2 (4.9min, 90.9P1) fps +159%
HP ZBook Ultra G1a 14
AMD Ryzen AI Max+ PRO 395, AMD Radeon 8060S
86.6 (9.6min, 62.5P1) fps +76%
Average of class Multimedia
  (7.92 - 141.6, n=51, last 2 years)
54.9 fps +12%
Asus ProArt P14 H7407
Nvidia RTX Spark N1X 20-Core, NVIDIA RTX Spark N1X 6144-Core Blackwell GPU
49.2 (1.883min, 14.5P1) fps
Dell XPS 14 Core Ultra X7 358H
Intel Core Ultra X7 358H, Intel Arc B390 12 Xe3 Panther Lake iGPU
43.3 (6.46min, 33.3P1) fps -12%
Lenovo Yoga Slim 7 14Q8Y11
Qualcomm Snapdragon X2 Elite X2E-88-100, Qualcomm Adreno X2-90
34.4 (2.28min, 21.3P1) fps -30%
Final Fantasy XV Benchmark - 1920x1080 High Quality
Asus ROG Zephyrus G14 GU405AR
Intel Core Ultra 9 386H, NVIDIA GeForce RTX 5070 Ti Laptop
151 fps +51%
Razer Blade 14 2025
AMD Ryzen AI 9 365, NVIDIA GeForce RTX 5070 Laptop
138.3 fps +38%
Asus ProArt P14 H7407
Nvidia RTX Spark N1X 20-Core, NVIDIA RTX Spark N1X 6144-Core Blackwell GPU
100.2 fps
HP ZBook Ultra G1a 14
AMD Ryzen AI Max+ PRO 395, AMD Radeon 8060S
84.8 fps -15%
Average of class Multimedia
  (7.61 - 144.4, n=56, last 2 years)
59.4 fps -41%
Dell XPS 14 Core Ultra X7 358H
Intel Core Ultra X7 358H, Intel Arc B390 12 Xe3 Panther Lake iGPU
52.8 fps -47%
Lenovo Yoga Slim 7 14Q8Y11
Qualcomm Snapdragon X2 Elite X2E-88-100, Qualcomm Adreno X2-90
28.1 fps -72%
Strange Brigade - 1920x1080 ultra AA:ultra AF:16
Asus ROG Zephyrus G14 GU405AR
Intel Core Ultra 9 386H, NVIDIA GeForce RTX 5070 Ti Laptop
295 (159.4min, 213P1) fps +54%
Razer Blade 14 2025
AMD Ryzen AI 9 365, NVIDIA GeForce RTX 5070 Laptop
258 (53.6min, 127.9P1) fps +34%
Asus ProArt P14 H7407
Nvidia RTX Spark N1X 20-Core, NVIDIA RTX Spark N1X 6144-Core Blackwell GPU
192 fps
HP ZBook Ultra G1a 14
AMD Ryzen AI Max+ PRO 395, AMD Radeon 8060S
171 (69.6min, 110.3P1) fps -11%
Average of class Multimedia
  (13.3 - 303, n=55, last 2 years)
108.5 fps -43%
Dell XPS 14 Core Ultra X7 358H
Intel Core Ultra X7 358H, Intel Arc B390 12 Xe3 Panther Lake iGPU
95.1 (51.4min, 79.8P1) fps -50%
Lenovo Yoga Slim 7 14Q8Y11
Qualcomm Snapdragon X2 Elite X2E-88-100, Qualcomm Adreno X2-90
67.4 (10.9min, 18.3P1) fps -65%
Dota 2 Reborn - 1920x1080 ultra (3/3) best looking
Asus ROG Zephyrus G14 GU405AR
Intel Core Ultra 9 386H, NVIDIA GeForce RTX 5070 Ti Laptop
150.1 (130.3min) fps +53%
Razer Blade 14 2025
AMD Ryzen AI 9 365, NVIDIA GeForce RTX 5070 Laptop
137.6 (116.8min) fps +41%
HP ZBook Ultra G1a 14
AMD Ryzen AI Max+ PRO 395, AMD Radeon 8060S
133.1 (112.2min) fps +36%
Dell XPS 14 Core Ultra X7 358H
Intel Core Ultra X7 358H, Intel Arc B390 12 Xe3 Panther Lake iGPU
105.4 (70.1min) fps +8%
Asus ProArt P14 H7407
Nvidia RTX Spark N1X 20-Core, NVIDIA RTX Spark N1X 6144-Core Blackwell GPU
97.8 (85.2min) fps
Average of class Multimedia
  (30.3 - 170.9, n=57, last 2 years)
93 fps -5%
Lenovo Yoga Slim 7 14Q8Y11
Qualcomm Snapdragon X2 Elite X2E-88-100, Qualcomm Adreno X2-90
70.5 (55.2min) fps -28%
X-Plane 11.11 - 1920x1080 high (fps_test=3)
Asus ROG Zephyrus G14 GU405AR
Intel Core Ultra 9 386H, NVIDIA GeForce RTX 5070 Ti Laptop
104.5 fps +91%
Razer Blade 14 2025
AMD Ryzen AI 9 365, NVIDIA GeForce RTX 5070 Laptop
83.1 fps +52%
HP ZBook Ultra G1a 14
AMD Ryzen AI Max+ PRO 395, AMD Radeon 8060S
57.2 fps +5%
Asus ProArt P14 H7407
Nvidia RTX Spark N1X 20-Core, NVIDIA RTX Spark N1X 6144-Core Blackwell GPU
54.6 fps
Average of class Multimedia
  (16.9 - 103, n=55, last 2 years)
50.8 fps -7%
Lenovo Yoga Slim 7 14Q8Y11
Qualcomm Snapdragon X2 Elite X2E-88-100, Qualcomm Adreno X2-90
44 fps -19%
Dell XPS 14 Core Ultra X7 358H
Intel Core Ultra X7 358H, Intel Arc B390 12 Xe3 Panther Lake iGPU
40.3 fps -26%

Cyberpunk 2077 ultra FPS Chart

05101520253035404550556065707580859095100105Tooltip
Asus ProArt P14 H7407 Spark RTX N1X 20-Core, RTX Spark N1X 6144-Core Blackwell GPU: Ø75.5 (63.2-77.4) fps
Asus ROG Zephyrus G14 GU405AR Ultra 9 386H, GeForce RTX 5070 Ti Laptop: Ø105.9 (102.1-107.8) fps
Lenovo Yoga Slim 7 14Q8Y11 X2E-88-100, X2-90: Ø26.5 (23.7-29.6) fps
Dell XPS 14 Core Ultra X7 358H Ultra X7 358H, Arc B390 Panther Lake iGPU: Ø40.6 (36.6-42.9) fps
Razer Blade 14 2025 Ryzen AI 9 365, GeForce RTX 5070 Laptop: Ø96 (90.9-97.5) fps
HP ZBook Ultra G1a 14 Ryzen AI Max+ PRO 395, Radeon 8060S: Ø72.6 (68.7-74) fps
lowmed.highultraQHD DLSSQHD
GTA V (2015) 49.2 39.8
Dota 2 Reborn (2015) 111.3 105.4 101.7 97.8
Final Fantasy XV Benchmark (2018) 144 121.7 100.2 81.7
X-Plane 11.11 (2018) 67.6 63 54.6
Strange Brigade (2018) 344 233 212 192 135
Baldur's Gate 3 (2023) 125 108.6 99.9 98.9 75.4
Cyberpunk 2077 (2023) 100.8 96.7 84 76.8 60 53

Emissions & Power Consumption

System Noise

Cooling unit
Cooling unit

The ProArt P14 uses two fans and the laptop is silent while idling and also pretty quiet under lighter workloads, even in Performance mode. The fan noise under full load depends on the power profile and the fan curve of the Performance profile is actually not ideal, because the fan noise fluctuates between 51.1 and 54.9 dB(A) while gaming and during our stress test. We did not hear any other electronic noises like coil whine.

Noise level

Idle
24.5 / 24.5 / 24.5 dB(A)
Load
36 / 54.9 dB(A)
  red to green bar
 
 
30 dB
silent
40 dB(A)
audible
50 dB(A)
loud
 
min: dark, med: mid, max: light   Earthworks M23R, Arta (15 cm distance)   environment noise: 24.5 dB(A)
dB(A) 0102030405060708090Deep BassMiddle BassHigh BassLower RangeMidsHigher MidsLower HighsMid HighsUpper HighsSuper Highs2045.633.235.734.133.131.535.82532.928.323.524.725.929.429.33140.43128.72829.830.637.74033.131.629.633.728.828.632.75030.132.230.230.927.126.131.76325.224.323.124.92226.430.98024.525.424.820.819.220.626.910024.428.129.321.319.318.3271252627.53021.918.221.926.916025.32829.522.119.417.526.520026.829.131.221.718.920.925.425029.332.534.424.220.821.22431531.434.337.524.719.315.523.240032.637.639.726.719.613.225.950033.638.941.727.219.211.42563032.837.540.32516.311.224.280030.536.338.321.814.210.622.1100032.938.141.123.415.311.223125033.139.143.824.415.110.723160033.439.742.724.21610.822.7200034.841.545.526.517.210.823.8250035.542.745.62716.811.824.731503541.945.225.61512.224.1400034.240.8442413.21221.1500030.437.540.917.413.212.616.2630027.737.541.5161312.514.9800023.233.838.914.113.112.413.91000019.229.234.313.213.112.613.7125001625.230.513.112.912.513.41600013.719.72512.312.211.812.8SPL44.951.554.93627.724.534.5N4.87.89.82.310.62median 30.5median 37.5median 39.7median 23.4median 16median 12.4median 23.2Delta4.95.15.842.92.84.4hearing rangehide median Fan NoiseAsus ProArt P14 H7407
Asus ProArt P14 H7407
Spark RTX N1X 20-Core, RTX Spark N1X 6144-Core Blackwell GPU
Apple MacBook Pro 14 2026 M5 Max
M5 Max, M5 Max 40-Core GPU
Asus ROG Zephyrus G14 GU405AR
Ultra 9 386H, GeForce RTX 5070 Ti Laptop
Lenovo Yoga Slim 7 14Q8Y11
X2E-88-100, X2-90
Dell XPS 14 Core Ultra X7 358H
Ultra X7 358H, Arc B390 Panther Lake iGPU
Razer Blade 14 2025
Ryzen AI 9 365, GeForce RTX 5070 Laptop
HP ZBook Ultra G1a 14
Ryzen AI Max+ PRO 395, Radeon 8060S
Noise
5%
-14%
6%
9%
-3%
0%
off / environment * (dB)
24.5
23.1
6%
26
-6%
23.8
3%
22.9
7%
23.7
3%
23.9
2%
Idle Minimum * (dB)
24.5
23.1
6%
26
-6%
23.8
3%
23.3
5%
23.7
3%
23.9
2%
Idle Average * (dB)
24.5
23.1
6%
35.1
-43%
23.8
3%
23.3
5%
23.7
3%
23.9
2%
Idle Maximum * (dB)
24.5
23.1
6%
35.1
-43%
23.8
3%
23.3
5%
27
-10%
26.8
-9%
Load Average * (dB)
36
36.8
-2%
35.1
2%
41.4
-15%
34
6%
44.9
-25%
42.2
-17%
Cyberpunk 2077 ultra * (dB)
54.9
47.8
13%
55.5
-1%
42.4
23%
43.5
21%
54.6
1%
49.1
11%
Load Maximum * (dB)
54.9
53.2
3%
55.5
-1%
42.4
23%
45.7
17%
54.6
1%
49.2
10%

* ... smaller is better

Temperature

The surface temperatures surprised us, because the ProArt P14 stays comparatively cool even under maximum load. We only measured little more than 40 °C at a few spots on the bottom, so using it on your lap is absolutely no problem. We are pretty sure the high fan noise is not necessary and maybe a software update will improve the situation. The 140W PSU on the other hand gets quite toasty at up to 55 °C.

Max. Load
38.9 °C
102 F
39.3 °C
103 F
38.5 °C
101 F
35.8 °C
96 F
36 °C
97 F
33 °C
91 F
27.4 °C
81 F
26.7 °C
80 F
26.7 °C
80 F
Maximum: 39.3 °C = 103 F
Average: 33.6 °C = 92 F
40.4 °C
105 F
42.7 °C
109 F
40.3 °C
105 F
32.9 °C
91 F
34.4 °C
94 F
33.8 °C
93 F
29.5 °C
85 F
30.2 °C
86 F
28.5 °C
83 F
Maximum: 42.7 °C = 109 F
Average: 34.7 °C = 94 F
Power Supply (max.)  55.2 °C = 131 F | Room Temperature 21 °C = 70 F | Fluke t3000FC (calibrated), Voltcraft IR-900
(±) The average temperature for the upper side under maximal load is 33.6 °C / 92 F, compared to the average of 31.3 °C / 88 F for the devices in the class Multimedia.
(+) The maximum temperature on the upper side is 39.3 °C / 103 F, compared to the average of 36.8 °C / 98 F, ranging from 21 to 71 °C for the class Multimedia.
(±) The bottom heats up to a maximum of 42.7 °C / 109 F, compared to the average of 39.1 °C / 102 F
(+) In idle usage, the average temperature for the upper side is 27.3 °C / 81 F, compared to the device average of 31.3 °C / 88 F.
(+) The palmrests and touchpad are cooler than skin temperature with a maximum of 27.4 °C / 81.3 F and are therefore cool to the touch.
(±) The average temperature of the palmrest area of similar devices was 28.7 °C / 83.7 F (+1.3 °C / 2.4 F).
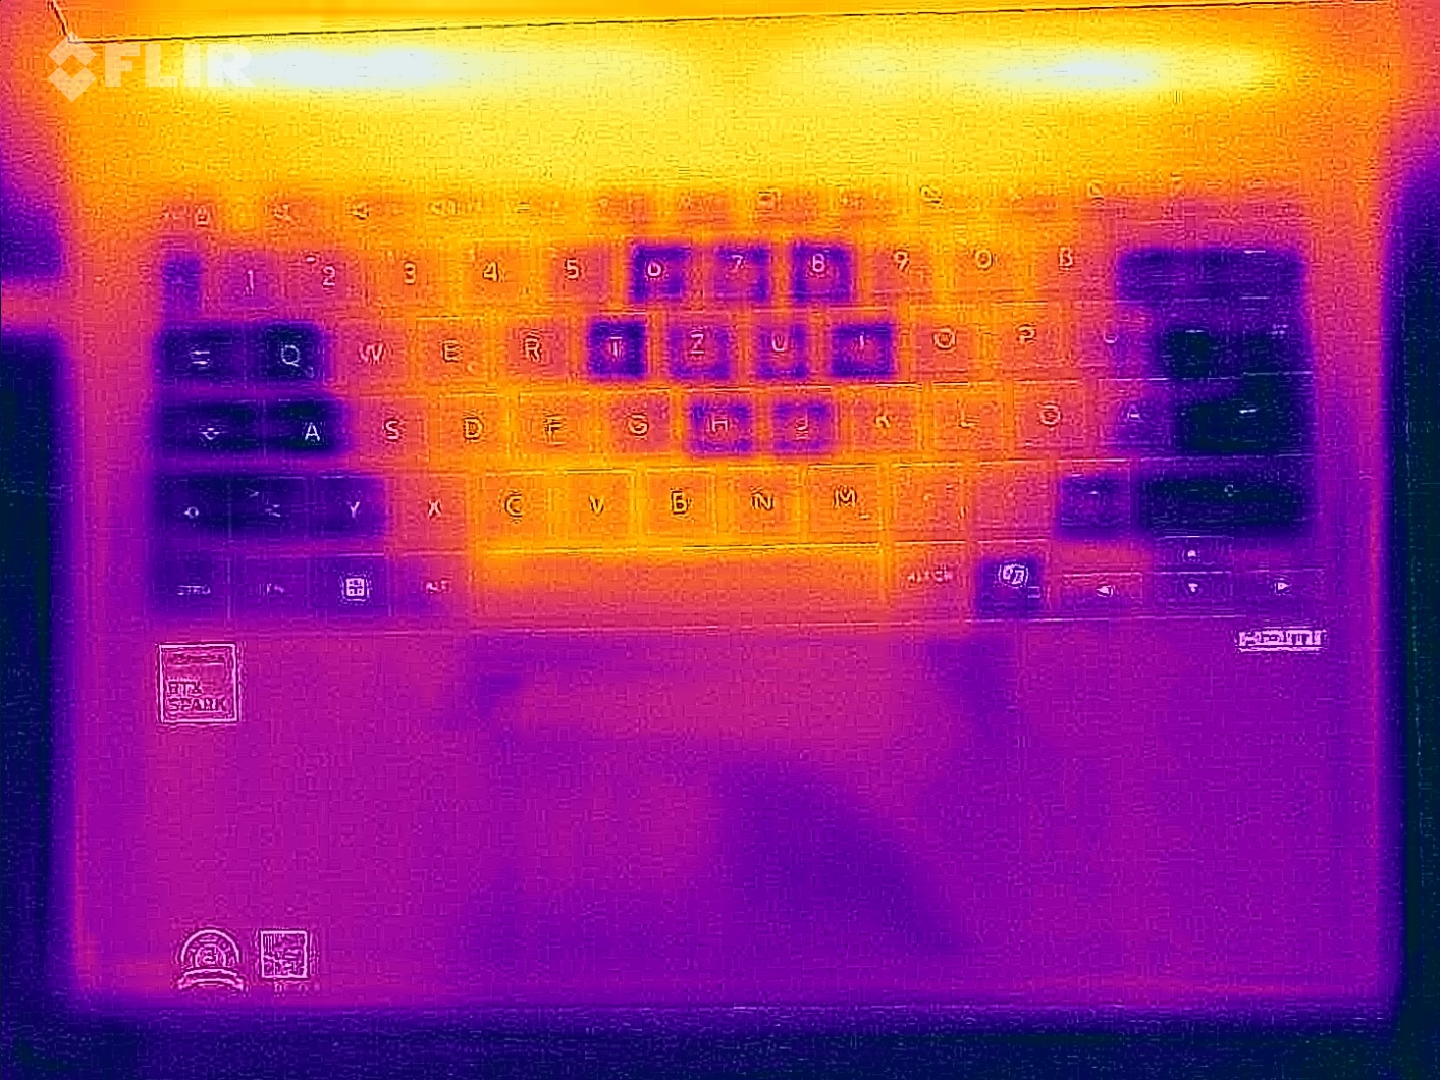
Heatmap stress test (top)
Heatmap stress test (bottom)
Asus ProArt P14 H7407
Spark RTX N1X 20-Core, RTX Spark N1X 6144-Core Blackwell GPU
Apple MacBook Pro 14 2026 M5 Max
M5 Max, M5 Max 40-Core GPU
Asus ROG Zephyrus G14 GU405AR
Ultra 9 386H, GeForce RTX 5070 Ti Laptop
Lenovo Yoga Slim 7 14Q8Y11
X2E-88-100, X2-90
Dell XPS 14 Core Ultra X7 358H
Ultra X7 358H, Arc B390 Panther Lake iGPU
Razer Blade 14 2025
Ryzen AI 9 365, GeForce RTX 5070 Laptop
HP ZBook Ultra G1a 14
Ryzen AI Max+ PRO 395, Radeon 8060S
Heat
6%
6%
6%
12%
-12%
-7%
Maximum Upper Side * (°C)
39.3
47
-20%
41.7
-6%
40.6
-3%
34
13%
47
-20%
41.4
-5%
Maximum Bottom * (°C)
42.7
40.5
5%
41.5
3%
39.2
8%
35.8
16%
49.6
-16%
36.6
14%
Idle Upper Side * (°C)
28.3
23.3
18%
25
12%
25.4
10%
25.6
10%
29.8
-5%
34
-20%
Idle Bottom * (°C)
28.8
23.4
19%
24.8
14%
26.4
8%
26.4
8%
30.7
-7%
33.6
-17%

* ... smaller is better

Speakers

The sound system with speaker grilles next to the keyboard offers excellent sound quality on par with the best multimedia laptops like the ROG Zephyrus G14 or the current MacBook Pro 14 Mini-LED.

dB(A) 0102030405060708090Deep BassMiddle BassHigh BassLower RangeMidsHigher MidsLower HighsMid HighsUpper HighsSuper Highs2031.541.32529.429.83130.635.24028.637.85026.138.76326.443.28020.651.910018.365.612521.967.916017.566.120020.970.325021.271.231515.575.140013.274.450011.474.563011.276.780010.680.9100011.279.4125010.775.1160010.873.8200010.876.3250011.875.1315012.273.340001276.4500012.673.9630012.570.5800012.469.71000012.669.61250012.568.81600011.868.6SPL24.587.5N0.679.5median 12.4median 73.9Delta2.83.538.437.126.626.729.232.640.339.532.833.52637.620.85318.961.91764.416.161.617.266.820.267.415.872.312.369.210.768.310.669.39.571.79.569.69.470.89.471.79.671.410.272.210.575.210.671.211.371.31168.510.965.210.86410.762.410.463.223.283.10.560.8median 10.7median 69.22.42.734.843.635.532.730.733.331.234.531.237.226.944.425.951.723.66420.966.221.865.520.971.221.272.716.275.415.37414.174.413.775.613.47813.174.413.573.612.675.412.97713.572.513.772.213.473.913.67113.567.513.465.913.366.113.866.312.863.62685.90.872.1median 13.6median 72.51.63.439.737.328.825.526.123.92323.323.62924.92825.724.821.72718.23817.249.316.25616.861.319.765.914.770.211.970.210.869.310.1749.576.19.271.69.570.61071.110.369.510.667.510.962.911.456.311.557.811.760.111.66112.162.412.159.223.681.80.551median 11.6median 62.92.97.539.936.129.629.228.628.525.923.922.724.42630.924.652.120.957.716.858.215.26415.771.814.471.714.969.913.373.510.476.89.576.19.574.99.476.29.477.79.879.810.875.610.77511.270.611.674.511.466.111.469.511.871.311.868.512.870.911.873.223.3870.575.6median 11.6median 73.22.23.537.236.432.130.529.429.928.53225.231.6263421.338.618.843.118.848.317.347.718.554.42056.116.159.21463.312.169.410.472.210.470.81069.110.3689.770.910.571.910.964.611.164.411.263.611.457.511.757.51256.811.758.911.560.51158.323.779.60.544.8median 11.5median 60.52.66.638.637.128.929.127.928.122.926.72930.826.530.524.634.32744.231.752.618.262.314.465.212.468.41374.211.775.311.772.39.270.39.674.79.5789.678.59.880.29.980.810.379.110.877.211.370.411.770.71272.812.267.912.268.512.471.312.167.823.888.70.678.3median 11.7median 72.32.24.2hearing rangehide median Pink NoiseAsus ProArt P14 H7407Apple MacBook Pro 14 2026 M5 MaxAsus ROG Zephyrus G14 GU405ARLenovo Yoga Slim 7 14Q8Y11Dell XPS 14 Core Ultra X7 358HRazer Blade 14 2025HP ZBook Ultra G1a 14
Frequency diagram (checkboxes can be checked and unchecked to compare devices)
Asus ProArt P14 H7407 audio analysis

(+) | speakers can play relatively loud (87.5 dB)
Bass 100 - 315 Hz
(+) | good bass - only 4.9% away from median
(±) | linearity of bass is average (7.2% delta to prev. frequency)
Mids 400 - 2000 Hz
(+) | balanced mids - only 2.5% away from median
(+) | mids are linear (3.5% delta to prev. frequency)
Highs 2 - 16 kHz
(+) | balanced highs - only 2.3% away from median
(+) | highs are linear (3% delta to prev. frequency)
Overall 100 - 16.000 Hz
(+) | overall sound is linear (6.2% difference to median)
Compared to same class
» 3% of all tested devices in this class were better, 1% similar, 96% worse
» The best had a delta of 5%, average was 17%, worst was 45%
Compared to all devices tested
» 0% of all tested devices were better, 0% similar, 99% worse
» The best had a delta of 4%, average was 23%, worst was 136%

Apple MacBook Pro 14 2026 M5 Max audio analysis

(+) | speakers can play relatively loud (83.1 dB)
Bass 100 - 315 Hz
(+) | good bass - only 4.5% away from median
(±) | linearity of bass is average (7.1% delta to prev. frequency)
Mids 400 - 2000 Hz
(+) | balanced mids - only 1.3% away from median
(+) | mids are linear (2.5% delta to prev. frequency)
Highs 2 - 16 kHz
(+) | balanced highs - only 3.3% away from median
(+) | highs are linear (3.7% delta to prev. frequency)
Overall 100 - 16.000 Hz
(+) | overall sound is linear (6.5% difference to median)
Compared to same class
» 4% of all tested devices in this class were better, 1% similar, 95% worse
» The best had a delta of 5%, average was 17%, worst was 45%
Compared to all devices tested
» 1% of all tested devices were better, 0% similar, 99% worse
» The best had a delta of 4%, average was 23%, worst was 136%

Asus ROG Zephyrus G14 GU405AR audio analysis

(+) | speakers can play relatively loud (85.9 dB)
Bass 100 - 315 Hz
(+) | good bass - only 4.3% away from median
(±) | linearity of bass is average (7.1% delta to prev. frequency)
Mids 400 - 2000 Hz
(+) | balanced mids - only 2.8% away from median
(+) | mids are linear (2.8% delta to prev. frequency)
Highs 2 - 16 kHz
(+) | balanced highs - only 3% away from median
(+) | highs are linear (3.6% delta to prev. frequency)
Overall 100 - 16.000 Hz
(+) | overall sound is linear (6.7% difference to median)
Compared to same class
» 0% of all tested devices in this class were better, 1% similar, 99% worse
» The best had a delta of 6%, average was 18%, worst was 132%
Compared to all devices tested
» 1% of all tested devices were better, 0% similar, 99% worse
» The best had a delta of 4%, average was 23%, worst was 136%

Lenovo Yoga Slim 7 14Q8Y11 audio analysis

(±) | speaker loudness is average but good (81.8 dB)
Bass 100 - 315 Hz
(±) | reduced bass - on average 14.3% lower than median
(±) | linearity of bass is average (13.4% delta to prev. frequency)
Mids 400 - 2000 Hz
(±) | higher mids - on average 8.7% higher than median
(+) | mids are linear (4.4% delta to prev. frequency)
Highs 2 - 16 kHz
(+) | balanced highs - only 3.9% away from median
(+) | highs are linear (5.4% delta to prev. frequency)
Overall 100 - 16.000 Hz
(±) | linearity of overall sound is average (17% difference to median)
Compared to same class
» 44% of all tested devices in this class were better, 8% similar, 48% worse
» The best had a delta of 5%, average was 18%, worst was 53%
Compared to all devices tested
» 31% of all tested devices were better, 8% similar, 61% worse
» The best had a delta of 4%, average was 23%, worst was 136%

Dell XPS 14 Core Ultra X7 358H audio analysis

(+) | speakers can play relatively loud (87 dB)
Bass 100 - 315 Hz
(±) | reduced bass - on average 7.6% lower than median
(+) | bass is linear (5.9% delta to prev. frequency)
Mids 400 - 2000 Hz
(+) | balanced mids - only 3.2% away from median
(+) | mids are linear (3.6% delta to prev. frequency)
Highs 2 - 16 kHz
(+) | balanced highs - only 3.3% away from median
(+) | highs are linear (5.8% delta to prev. frequency)
Overall 100 - 16.000 Hz
(+) | overall sound is linear (7.3% difference to median)
Compared to same class
» 6% of all tested devices in this class were better, 1% similar, 93% worse
» The best had a delta of 5%, average was 17%, worst was 45%
Compared to all devices tested
» 1% of all tested devices were better, 0% similar, 98% worse
» The best had a delta of 4%, average was 23%, worst was 136%

Razer Blade 14 2025 audio analysis

(±) | speaker loudness is average but good (79.6 dB)
Bass 100 - 315 Hz
(±) | reduced bass - on average 9% lower than median
(±) | linearity of bass is average (7.4% delta to prev. frequency)
Mids 400 - 2000 Hz
(±) | higher mids - on average 9% higher than median
(+) | mids are linear (5.4% delta to prev. frequency)
Highs 2 - 16 kHz
(+) | balanced highs - only 3.2% away from median
(+) | highs are linear (5% delta to prev. frequency)
Overall 100 - 16.000 Hz
(±) | linearity of overall sound is average (15.1% difference to median)
Compared to same class
» 33% of all tested devices in this class were better, 6% similar, 61% worse
» The best had a delta of 6%, average was 18%, worst was 132%
Compared to all devices tested
» 22% of all tested devices were better, 4% similar, 74% worse
» The best had a delta of 4%, average was 23%, worst was 136%

HP ZBook Ultra G1a 14 audio analysis

(+) | speakers can play relatively loud (88.7 dB)
Bass 100 - 315 Hz
(±) | reduced bass - on average 11.8% lower than median
(±) | linearity of bass is average (11% delta to prev. frequency)
Mids 400 - 2000 Hz
(+) | balanced mids - only 4.5% away from median
(+) | mids are linear (3.4% delta to prev. frequency)
Highs 2 - 16 kHz
(+) | balanced highs - only 3.4% away from median
(+) | highs are linear (4.3% delta to prev. frequency)
Overall 100 - 16.000 Hz
(+) | overall sound is linear (10.4% difference to median)
Compared to same class
» 7% of all tested devices in this class were better, 6% similar, 88% worse
» The best had a delta of 7%, average was 17%, worst was 35%
Compared to all devices tested
» 6% of all tested devices were better, 1% similar, 93% worse
» The best had a delta of 4%, average was 23%, worst was 136%

Power Consumption and Battery Life

The power consumption is actually not too bad while idling considering the bright screen and the 140W PSU is sufficient under load, but the battery runtime is a bit sobering. Asus implements a large 90 Wh battery, which has much more capacity compared to the rivals, but the battery runtime is still worse in many cases. In our Wi-Fi test at 150 nits, the ProArt P14 only lasts 12 hours, while both the Zephyrus G14 and the MacBook Pro 14 manage ~3 additional hours. 

140W PSU
140W PSU
Battery information
Battery information
Charging
Charging
Power Consumption
Off / Standbydarklight 0.14 / 0.69 Watt
Idledarkmidlight 5.8 / 10.8 / 11.3 Watt
Load midlight 98.4 / 136 Watt
 color bar
Key: min: dark, med: mid, max: light        Metrahit Energy
Asus ProArt P14 H7407
Spark RTX N1X 20-Core, RTX Spark N1X 6144-Core Blackwell GPU, Samsung PM9C1b MZVL81T0HFLB-00BH1, OLED, 2880x1800, 14"
Apple MacBook Pro 14 2026 M5 Max
M5 Max, M5 Max 40-Core GPU, Apple SSD AP8192Z, Mini-LED, 3024x1964, 14.2"
Asus ROG Zephyrus G14 GU405AR
Ultra 9 386H, GeForce RTX 5070 Ti Laptop, Kioxia BG6 KBG60ZNV1T02, OLED, 2880x1800, 14"
Lenovo Yoga Slim 7 14Q8Y11
X2E-88-100, X2-90, , OLED, 1920x1200, 14"
Dell XPS 14 Core Ultra X7 358H
Ultra X7 358H, Arc B390 Panther Lake iGPU, Samsung PM9C1b MZVL81T0HFLB-00BH1, OLED, 2880x1800, 14"
Razer Blade 14 2025
Ryzen AI 9 365, GeForce RTX 5070 Laptop, Samsung PM9A1 MZVL21T0HCLR, OLED, 2880x1800, 14"
HP ZBook Ultra G1a 14
Ryzen AI Max+ PRO 395, Radeon 8060S, WDC PC SN810 2TB, OLED, 2880x1800, 14"
Average NVIDIA RTX Spark N1X 6144-Core Blackwell GPU
 
Average of class Multimedia
 
Power Consumption
16%
-2%
50%
44%
-25%
0%
-20%
9%
Idle Minimum * (Watt)
5.8
2.5
57%
3.9
33%
3.1
47%
3.1
47%
9.3
-60%
6.9
-19%
6.65 ?(5.8 - 7.7, n=4)
-15%
Idle Average * (Watt)
10.8
11.6
-7%
7.8
28%
4.2
61%
3.6
67%
11.1
-3%
7.7
29%
13.9 ?(8.8 - 22.7, n=4)
-29%
Idle Maximum * (Watt)
11.3
11.8
-4%
8.1
28%
9.1
19%
10
12%
11.2
1%
14.7
-30%
16.9 ?(11.3 - 24, n=4)
-50%
Load Average * (Watt)
98.4
95.6
3%
82.2
16%
40.2
59%
39.2
60%
91.9
7%
83.3
15%
98.4 ?(n=1)
-0%
Cyberpunk 2077 ultra * (Watt)
111.4
89.4
20%
162.9
-46%
43
61%
51.4
54%
171.5
-54%
110.9
-0%
Load Maximum * (Watt)
136
98.8
27%
230.7
-70%
67.7
50%
101.4
25%
195
-43%
126.3
7%
142.2 ?(136 - 146.8, n=4)
-5%
Cyberpunk 2077 ultra external monitor * (Watt)
86.4
161.6
47.7
51.2
168.6
110.5

* ... smaller is better

Battery Runtime
WiFi Websurfing
11h 57min
WiFi Websurfing max. Brightness
6h 53min
Battery Runtime
WiFi Websurfing
Lenovo Yoga Slim 7 14Q8Y11
X2E-88-100, X2-90, 70 Wh
18.9 h +58%
Dell XPS 14 Core Ultra X7 358H
Ultra X7 358H, Arc B390 Panther Lake iGPU, 70 Wh
16.8 h +40%
Apple MacBook Pro 14 2026 M5 Max
M5 Max, M5 Max 40-Core GPU, 72.4 Wh
15.2 h +27%
Asus ROG Zephyrus G14 GU405AR
Ultra 9 386H, GeForce RTX 5070 Ti Laptop, 73 Wh
14.4 h +20%
Average of class Multimedia
  (4.37 - 26.6, n=64, last 2 years)
12.8 h +7%
Asus ProArt P14 H7407
Spark RTX N1X 20-Core, RTX Spark N1X 6144-Core Blackwell GPU, 90 Wh
12 h
Razer Blade 14 2025
Ryzen AI 9 365, GeForce RTX 5070 Laptop, 72 Wh
8.9 h -26%
HP ZBook Ultra G1a 14
Ryzen AI Max+ PRO 395, Radeon 8060S, 74.5 Wh
7 h -42%
WiFi Websurfing max. Brightness
Asus ROG Zephyrus G14 GU405AR
Ultra 9 386H, GeForce RTX 5070 Ti Laptop, 73 Wh
8.3 h +20%
Average of class Multimedia
  (3.53 - 11.6, n=33, last 2 years)
7.11 h +3%
Asus ProArt P14 H7407
Spark RTX N1X 20-Core, RTX Spark N1X 6144-Core Blackwell GPU, 90 Wh
6.9 h
Apple MacBook Pro 14 2026 M5 Max
M5 Max, M5 Max 40-Core GPU, 72.4 Wh
6 h -13%
Razer Blade 14 2025
Ryzen AI 9 365, GeForce RTX 5070 Laptop, 72 Wh
6 h -13%

Notebookcheck Rating

Asus ProArt P14 H7407 - 11/04/2026 v8
Andreas Osthoff

Chassis
91 / 98 → 93%
Keyboard
91%
Pointing Device
100%
Connectivity
80 / 80 → 99%
Weight
69 / 20-74 → 91%
Battery
89 / 95 → 94%
Display
90%
Games Performance
79 / 88 → 90%
Application Performance
83 / 92 → 91%
AI Performance
79%
Temperature
92%
Noise
70 / 95 → 73%
Audio
97%
Camera
33 / 75 → 44%
Average
71%
90%
Multimedia - Weighted Average
CO2 Emissions
No Data
Materials
50%
Packaging
100%
Power Use
85.4%
Repairability
40%
Software Updates
22.3%
Recycle Logo Total Sustainability Score: 49.6%

Potential Competitors in Comparison

Image
Model / Review
Price
Weight
Height
Display
1.
90%
Asus ProArt P14 H7407
Nvidia RTX Spark N1X 20-Core ⎘
NVIDIA RTX Spark N1X 6144-Core Blackwell GPU ⎘
32 GB Memory, 1000 GB SSD
Amazon:
1. $53.99
Laptop Case for ASUS ProArt ...
2. $71.20
ASUS ProArt Wireless Mouse M...
3. $1,249.99
ASUS ProArt PZ13 2in1 13.3" ...
List Price: 3299€
1.5 kg15.9 mm14.00"
2880x1800
243 PPI
OLED
2.
90.2%
Apple MacBook Pro 14 2026 M5 Max
Apple M5 Max ⎘
Apple M5 Max 40-Core GPU ⎘
128 GB Memory, 8192 GB SSD
List Price: 8589€1.6 kg15.5 mm14.20"
3024x1964
254 PPI
Mini-LED
3.
89.9%
Asus ROG Zephyrus G14 GU405AR
Intel Core Ultra 9 386H ⎘
NVIDIA GeForce RTX 5070 Ti Laptop ⎘
32 GB Memory, 1024 GB SSD
Amazon:
1. $3,999.00
HIDevolution [2026] ASUS ROG...
2. $3,299.00
HIDevolution [2026] ASUS ROG...
3. $2,049.00
ASUS ROG Zephyrus G14 AI Gam...
List Price: 3299€
1.6 kg16.3 mm14.00"
2880x1800
243 PPI
OLED
4.
85.9%
Lenovo Yoga Slim 7 14Q8Y11
Qualcomm Snapdragon X2 Elite X2E-88-100 ⎘
Qualcomm Adreno X2-90 ⎘
32 GB Memory
List Price: 1150 USD1.3 kg13.9 mm14.00"
1920x1200
162 PPI
OLED
5.
87.4%
Dell XPS 14 Core Ultra X7 358H
Intel Core Ultra X7 358H ⎘
Intel Arc B390 12 Xe3 Panther Lake iGPU ⎘
32 GB Memory, 1000 GB SSD
Amazon:
1. $1,591.62
Dell XPS 14 Premium Laptop D...
2. $1,449.99
Dell Latitude 5450 Laptop, I...
3. $2,399.00
Dell XPS 14 9440 14.5" Noteb...
List Price: 2200 USD
1.4 kg14.62 mm14.00"
2880x1800
243 PPI
OLED
6.
87.2%
Razer Blade 14 2025
Razer Blade 14 2025
AMD Ryzen AI 9 365 ⎘
NVIDIA GeForce RTX 5070 Laptop ⎘
32 GB Memory, 1024 GB SSD
List Price: 2399€1.6 kg16.2 mm14.00"
2880x1800
243 PPI
OLED
7.
87.4%
HP ZBook Ultra G1a 14
AMD Ryzen AI Max+ PRO 395 ⎘
AMD Radeon 8060S ⎘
128 GB Memory, 2048 GB SSD
List Price: 4000 USD1.6 kg18.5 mm14.00"
2880x1800
243 PPI
OLED

Transparency

The selection of devices to be reviewed is made by our editorial team. The test sample was provided to the author as a loan by the manufacturer or retailer for the purpose of this review. The lender had no influence on this review, nor did the manufacturer receive a copy of this review before publication. There was no obligation to publish this review. As an independent media company, Notebookcheck is not subjected to the authority of manufacturers, retailers or publishers.

This is how Notebookcheck is testing

Every year, Notebookcheck independently reviews hundreds of laptops and smartphones using standardized procedures to ensure that all results are comparable. We have continuously developed our test methods for around 20 years and set industry standards in the process. In our test labs, high-quality measuring equipment is utilized by experienced technicians and editors. These tests involve a multi-stage validation process. Our complex rating system is based on hundreds of well-founded measurements and benchmarks, which maintains objectivity. Further information on our test methods can be found here.

Google LogoAdd as a preferred source on Google
Mail Logo
Could not open connection to Notebookchat
static version load dynamic
Loading Comments
> Expert reviews and news on laptops, smartphones and tech innovations > Reviews > The only 14-inch laptop with Nvidia RTX Spark - Asus ProArt P14 Review
Andreas Osthoff, 2026-11- 4 (Update: 2026-11- 4)