

Nvidia GeForce RTX 4090 Founders Edition Review: Unrivaled 4K 100 fps behemoth for US$400 less than the RTX 3090 Ti
")
When the first rumors of a new Nvidia GPU based on the Ada Lovelace architecture came about back in end 2020, the purported specs were nothing short of astounding. Today, the RTX 4090 is available in flesh for US$1,599 MSRP and is as impressive as a consumer GPU can possibly get.
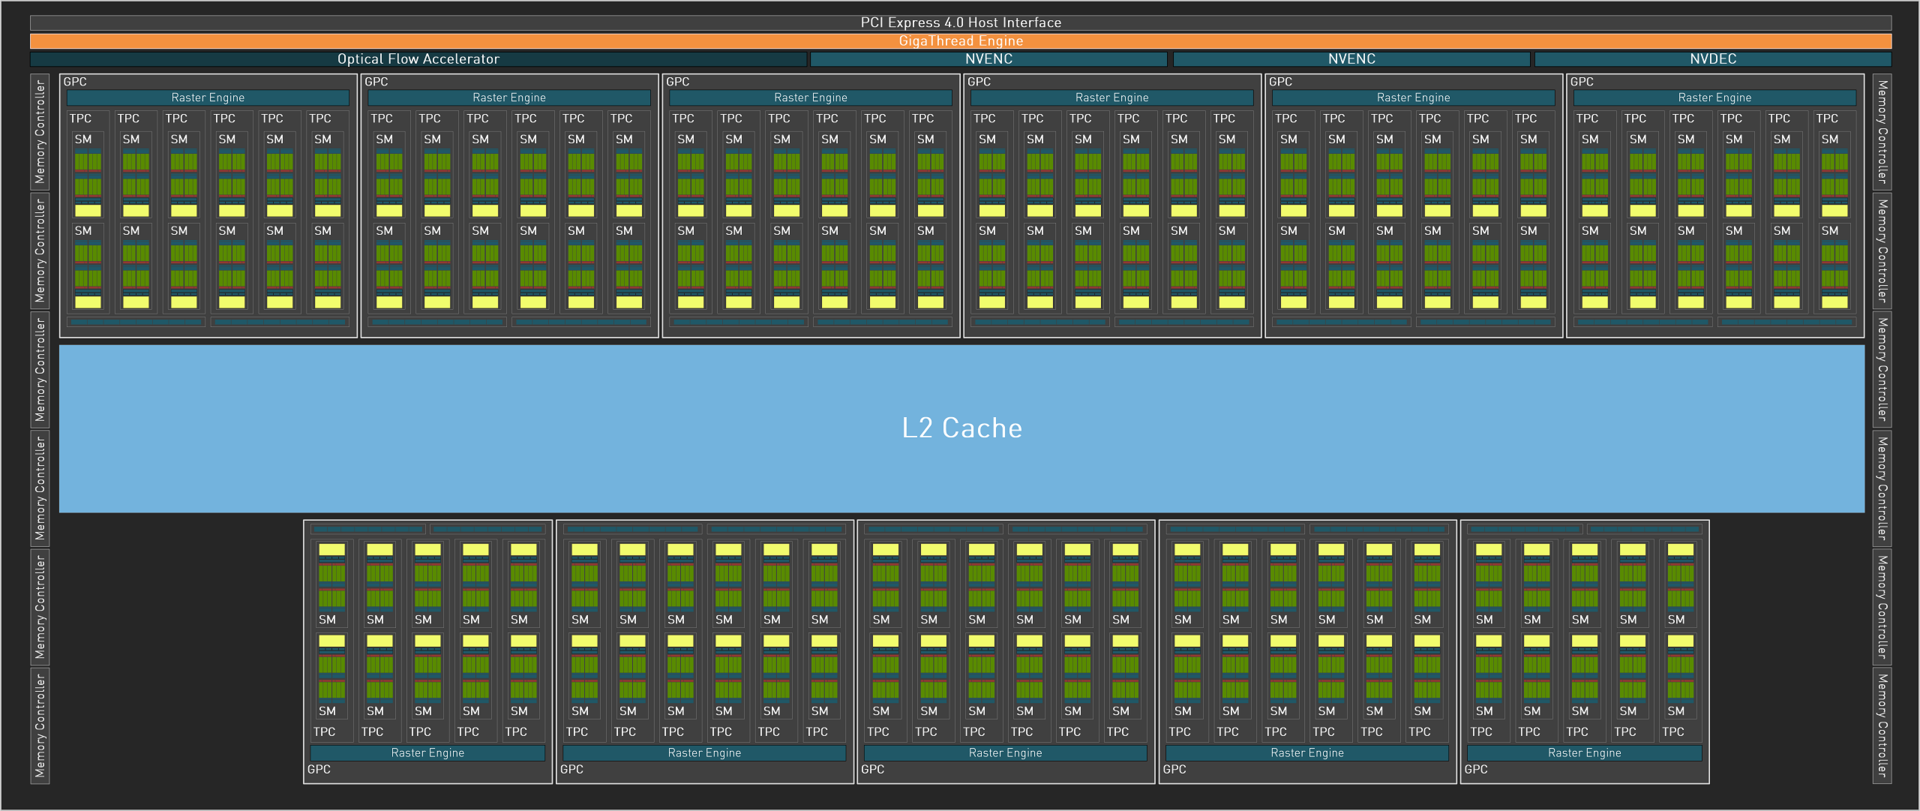
The RTX 4090's AD102 GPU houses 16,384 CUDA cores, 512 4th gen Tensor cores and 128 3rd gen RT cores. This is a cut from the complete AD102 silicon, which has 18,432 CUDA cores, 568 Tensor cores, and 142 RT cores. Thus, it goes without saying that we can soon expect an "RTX 4090 Ti" of sorts in the months ahead.
An Ada graphics processing cluster (GPC) includes a raster engine, six texture processor clusters (TPCs), 12 streaming multiprocessors (SMs) and 16 raster operations pipelines (ROPs).
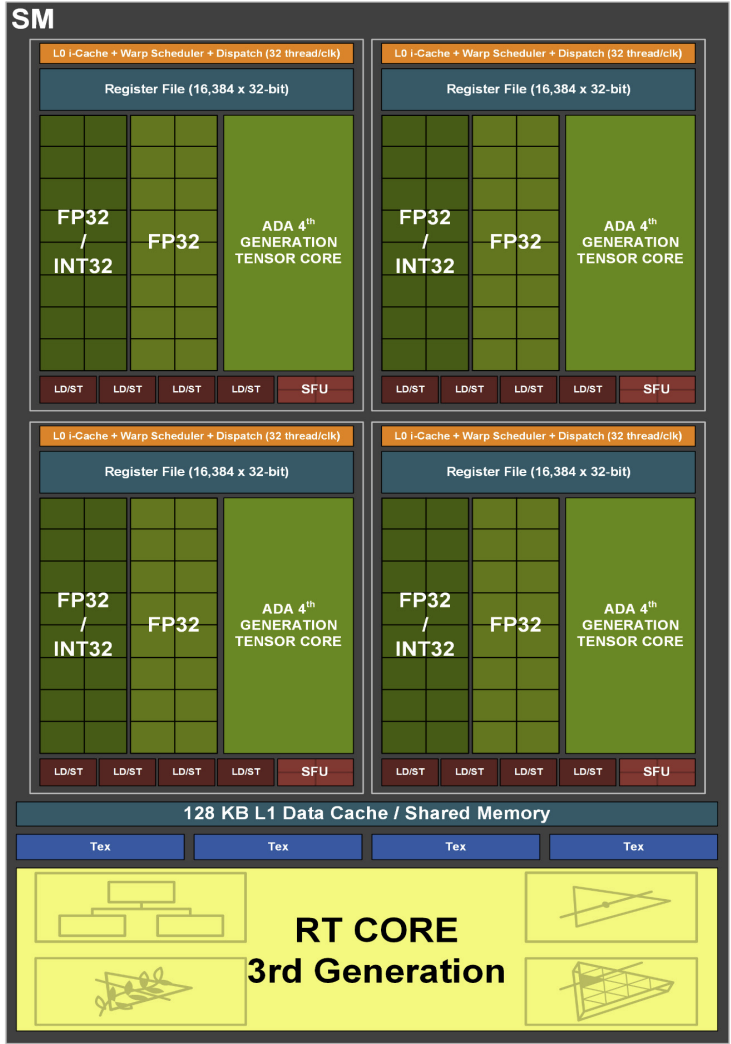
Each SM in turn features 128 CUDA cores, one RT core, four Tensor cores, four texture units, a 256 KB register, and 128 KB of configurable L1 cache.
In this review, we take a good look at the Ada flagship, the Nvidia GeForce RTX 4090 Founders Edition, and see how much of a gen-to-gen performance uplift the new architecture offers over Ampere and AMD RDNA 2 flagships.
Comparison of the RTX 4090 with other Nvidia GPUs
| Specification | RTX 4090 FE | RTX 3090 Ti FE | RTX 3090 FE | RTX 3080 Ti FE | RTX 3080 FE | RTX 3070 FE | RTX 3060 Ti FE | Titan RTX | Titan X Pascal |
| Chip | AD102 | GA102 | GA102 | GA102 | GA102 | GA104 | GA104 | TU102 | GP102 |
| FinFET Process | Custom 4N | 8 nm | 8 nm | 8 nm | 8 nm | 8 nm | 8 nm | 12 nm | 16 nm |
| CUDA Cores | 16,384 | 10,752 | 10,496 | 10,240 | 8,704 | 5,888 | 4,864 | 4,608 | 3,584 |
| Texture Units | 512 | 336 | 328 | 320 | 272 | 184 | 152 | 288 | 224 |
| Tensor Cores | 512 4th Gen. | 336 3rd Gen. | 328 3rd Gen. | 320 3rd Gen. | 272 3rd Gen. | 184 3rd Gen. | 152 3rd Gen. | 576 2nd Gen. | — |
| RT Cores | 128 3rd Gen. | 84 2nd Gen. | 82 2nd Gen. | 80 2nd Gen. | 68 2nd Gen. | 46 2nd Gen. | 38 2nd Gen. | 72 | — |
| GPU Base Clock | 2,235 MHz | 1,560 MHz | 1,395 MHz | 1,365 MHz | 1,440 MHz | 1,500 MHz | 1,410 MHz | 1,350 MHz | 1,417 MHz |
| GPU Boost Clock | 2,520 MHz | 1,860 MHz | 1,695 MHz | 1,665 MHz | 1,710 MHz | 1,750 MHz | 1,665 MHz | 1,770 MHz | 1,531 MHz |
| Memory Bus | 384-bit | 384-bit | 384-bit | 384-bit | 320-bit | 256-bit | 256-bit | 384-bit | 384-bit |
| Memory Bandwidth | 1,008 GB/s | 1,008 GB/s | 936 GB/s | 912 GB/s | 760 GB/s | 448 GB/s | 448 GB/s | 672 GB/s | 480.4 GB/s |
| Video Memory | 24 GB GDDR6X | 24 GB GDDR6X | 24 GB GDDR6X | 12 GB GDDR6X | 10 GB GDDR6X | 8 GB GDDR6 | 8 GB GDDR6 | 24 GB GDDR6 | 12 GB GDDR5X |
| Power Consumption | 450 W | 450 W | 350 W | 350 W | 320 W | 220 W | 200 W | 280 W | 250 W |
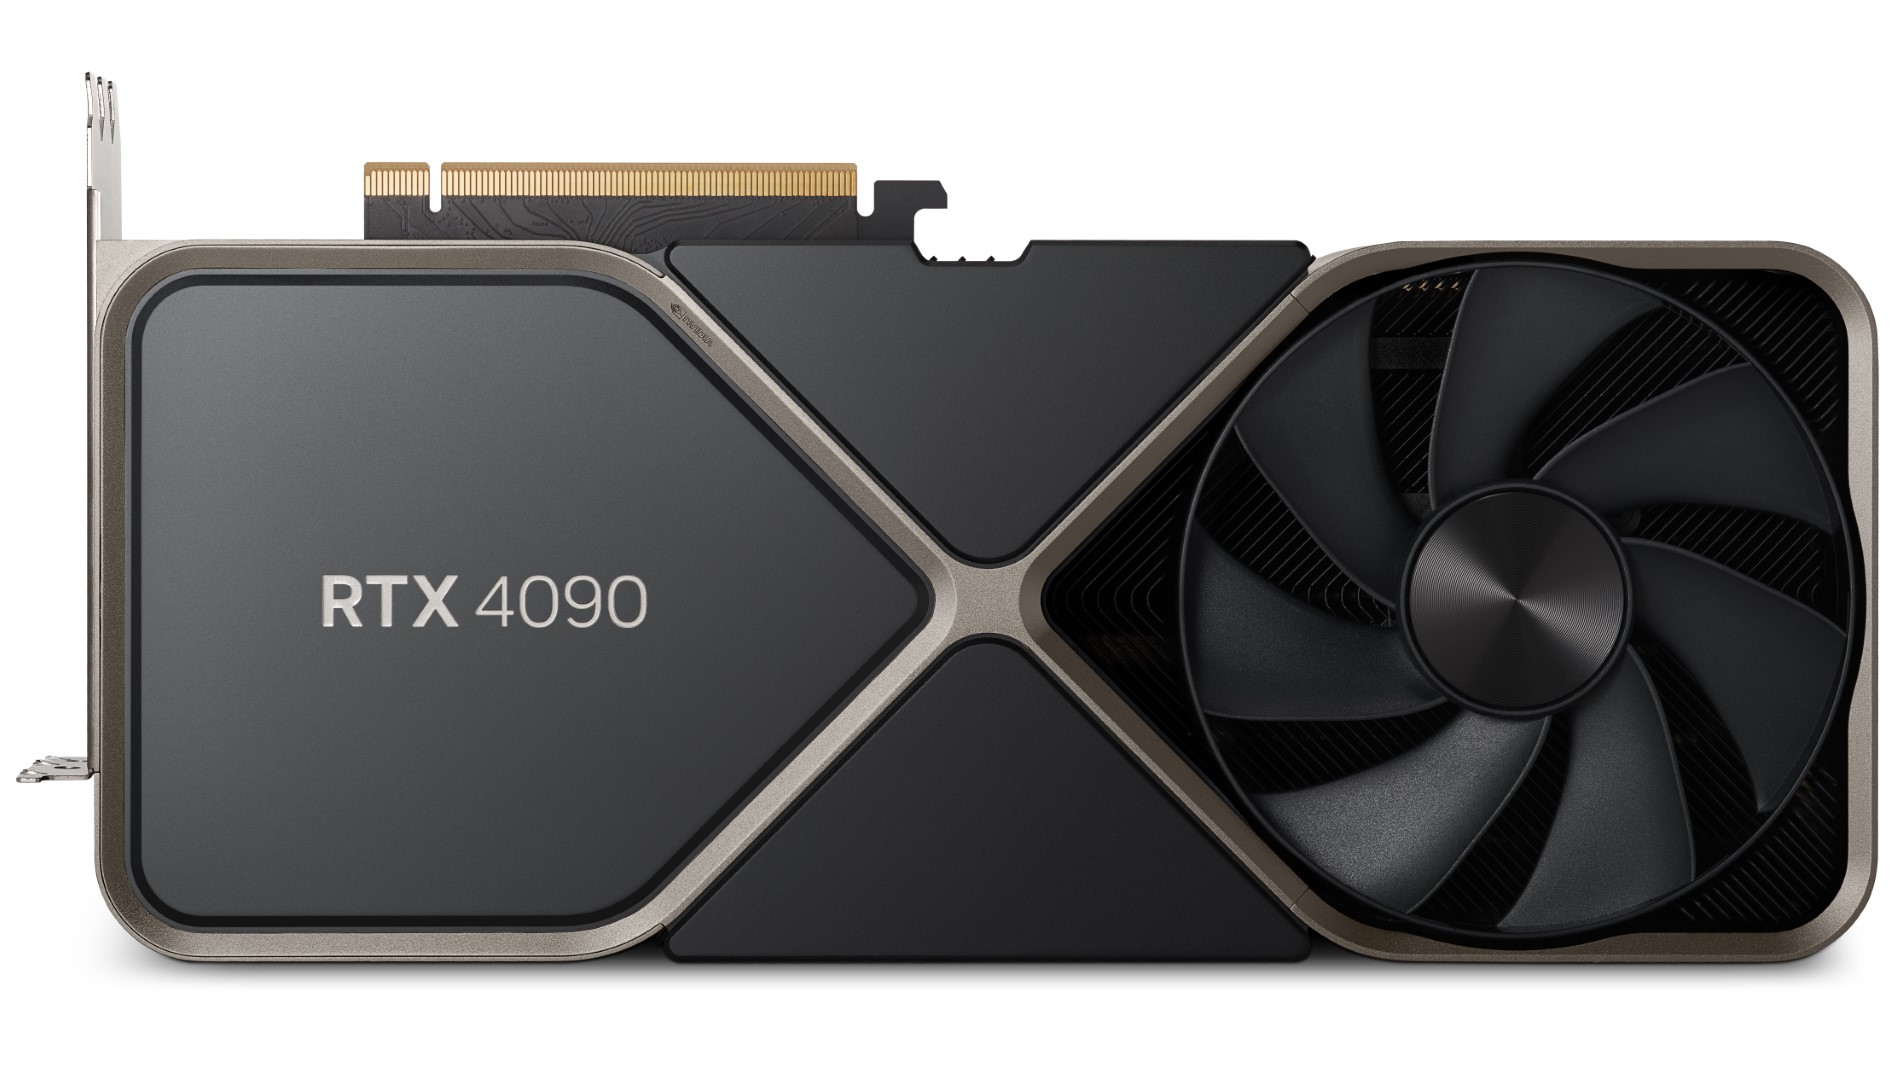
A closer look at the Nvidia GeForce RTX 4090 Founders Edition
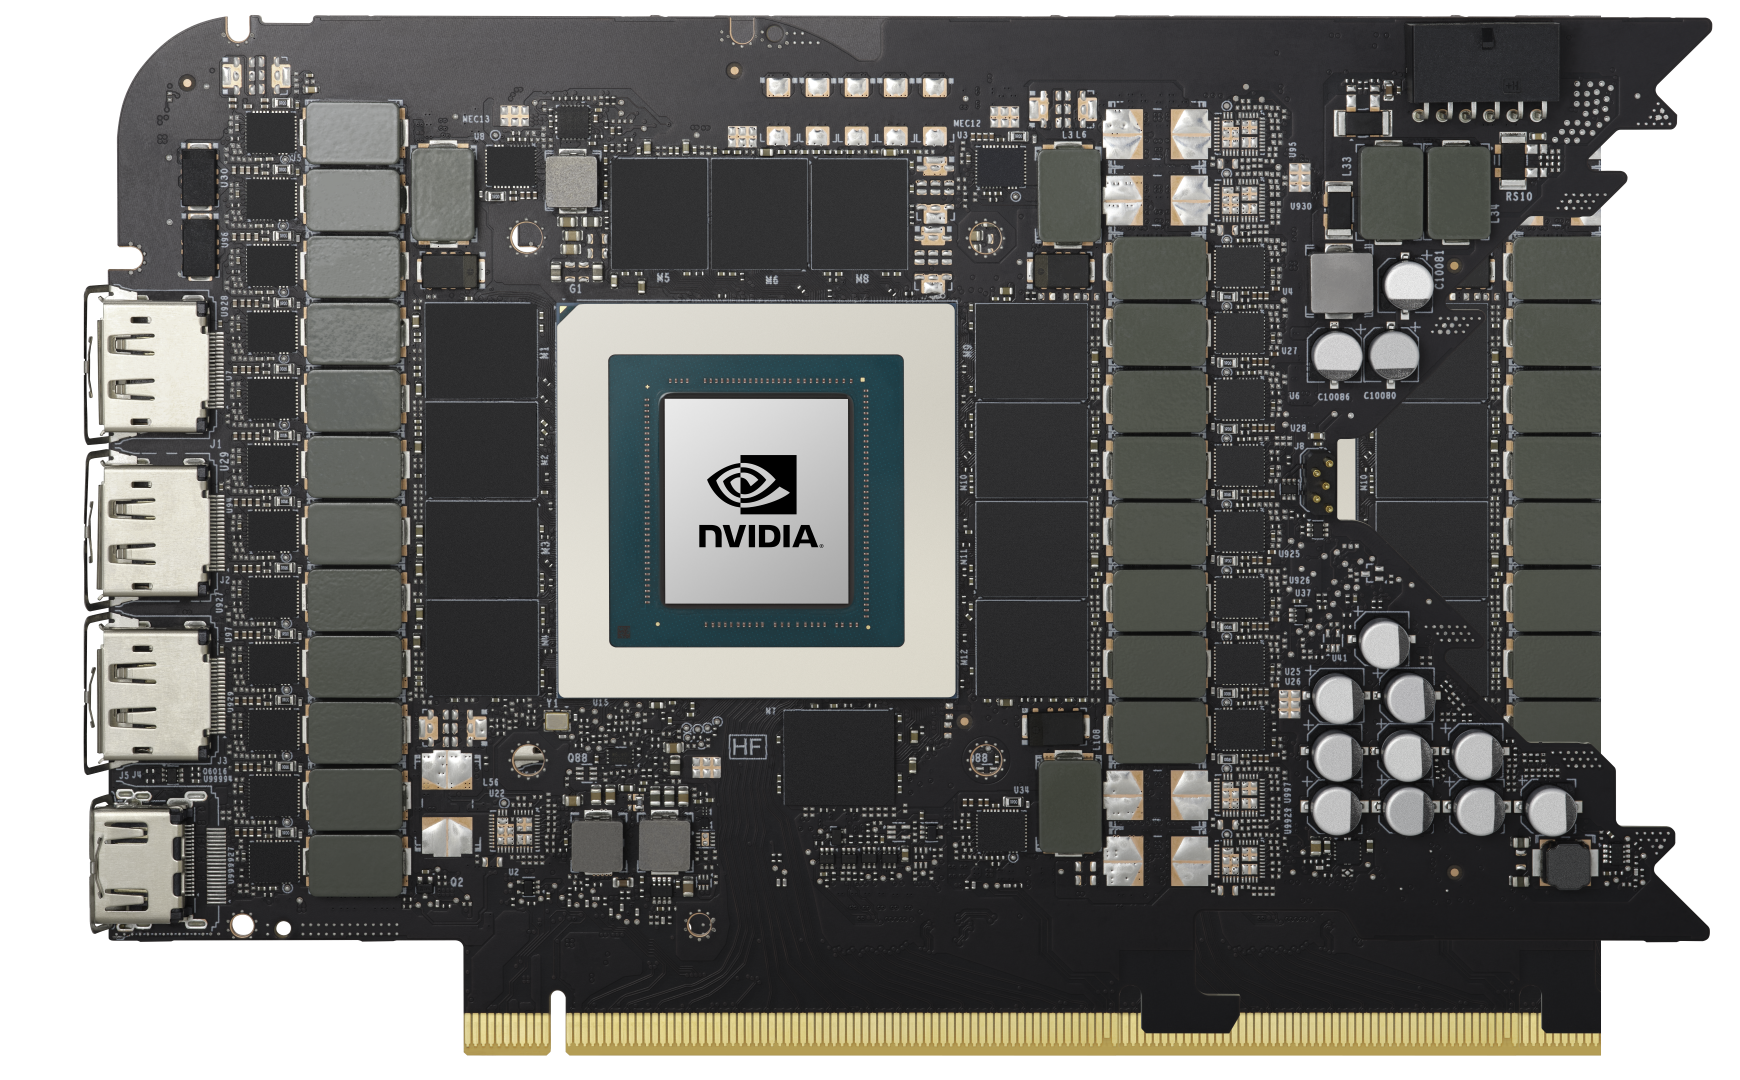
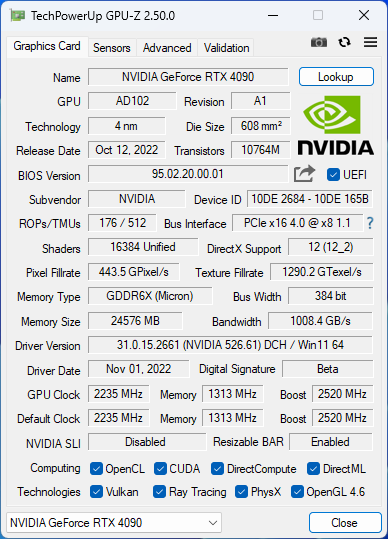
Even though it's not a complete chip, the current AD102 die in the RTX 4090 crams in 76.3 billion transistors — close to a whopping 170% increase in transistor count compared to the RTX 3090 Ti — while managing to make the die 3% smaller at 608.5 mm2. AD102 is actually based on TSMC's N5 process, but Nvidia denotes it as "4N" indicating own customizations.
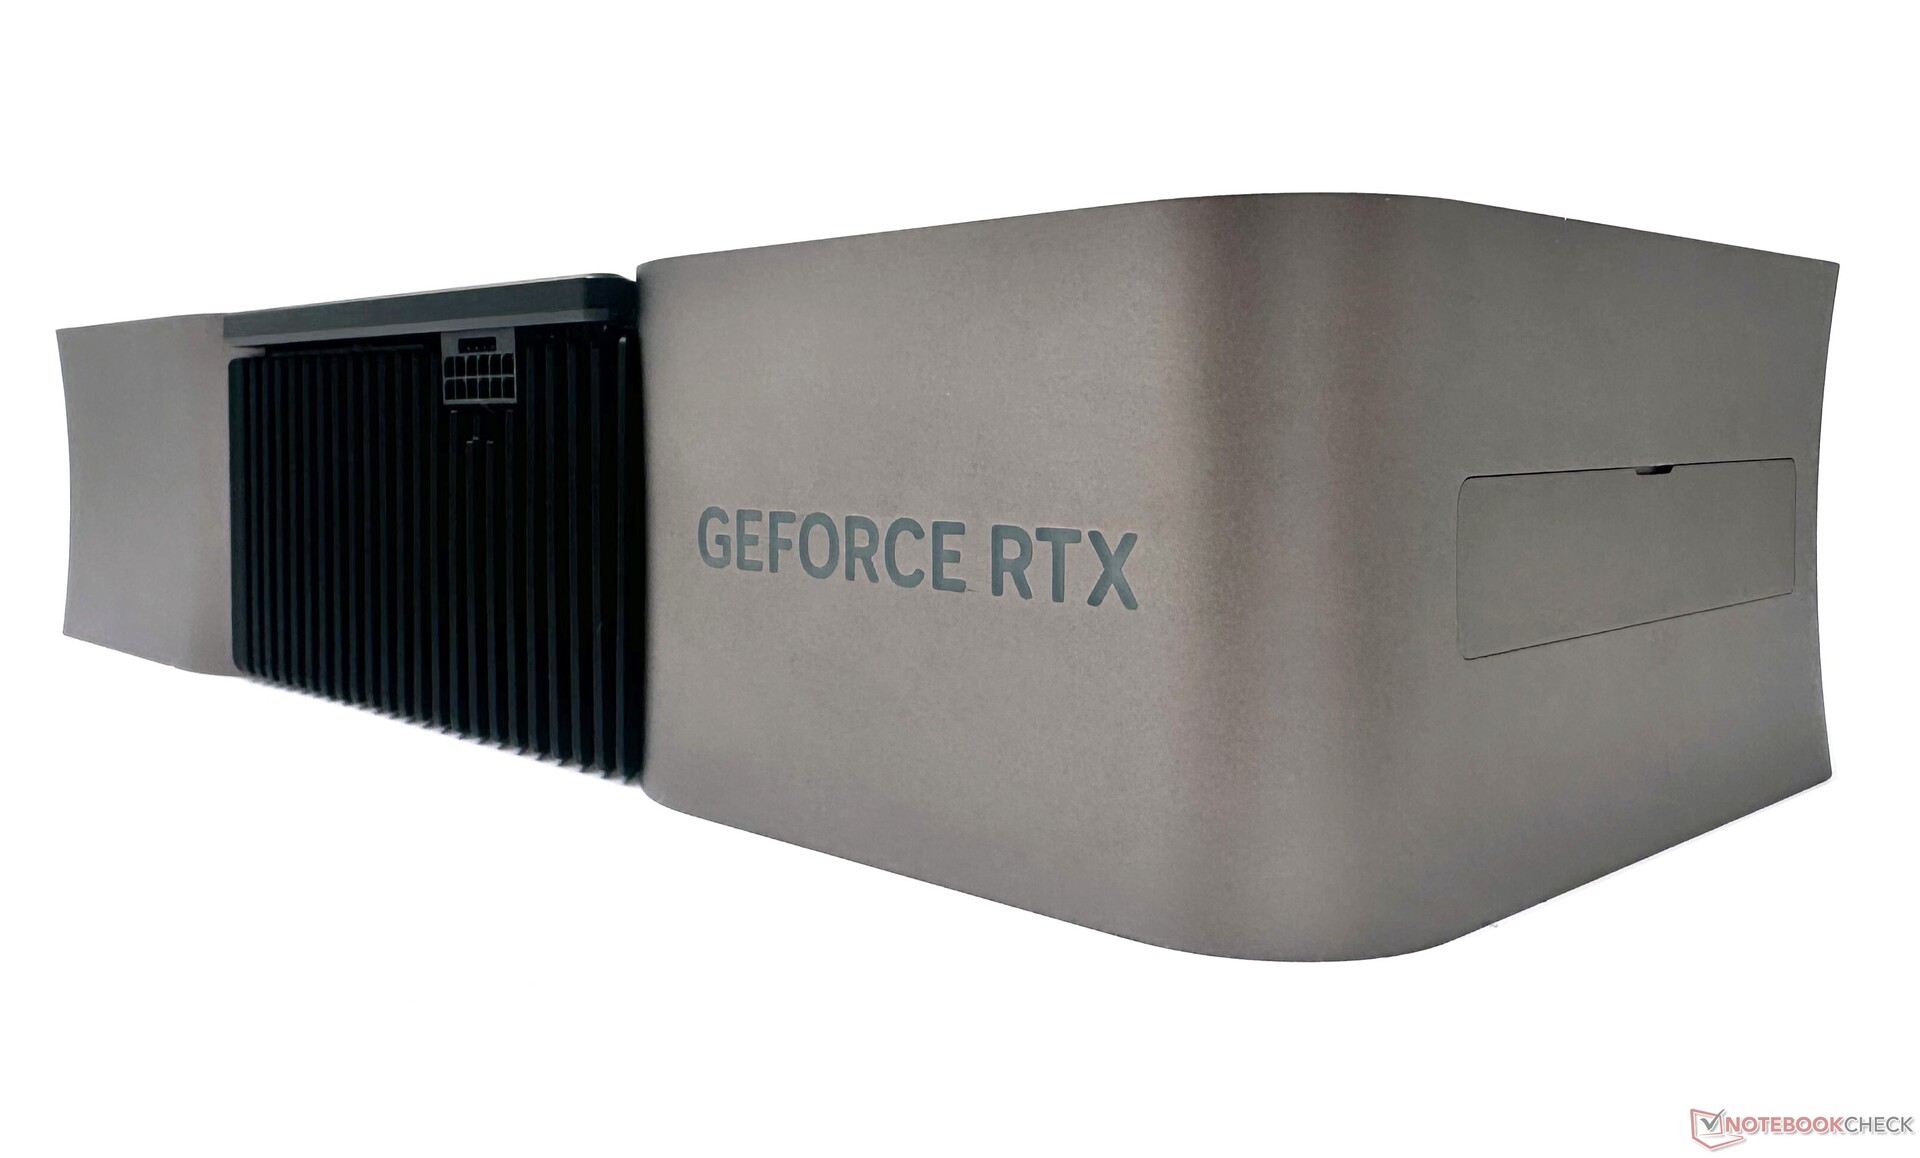
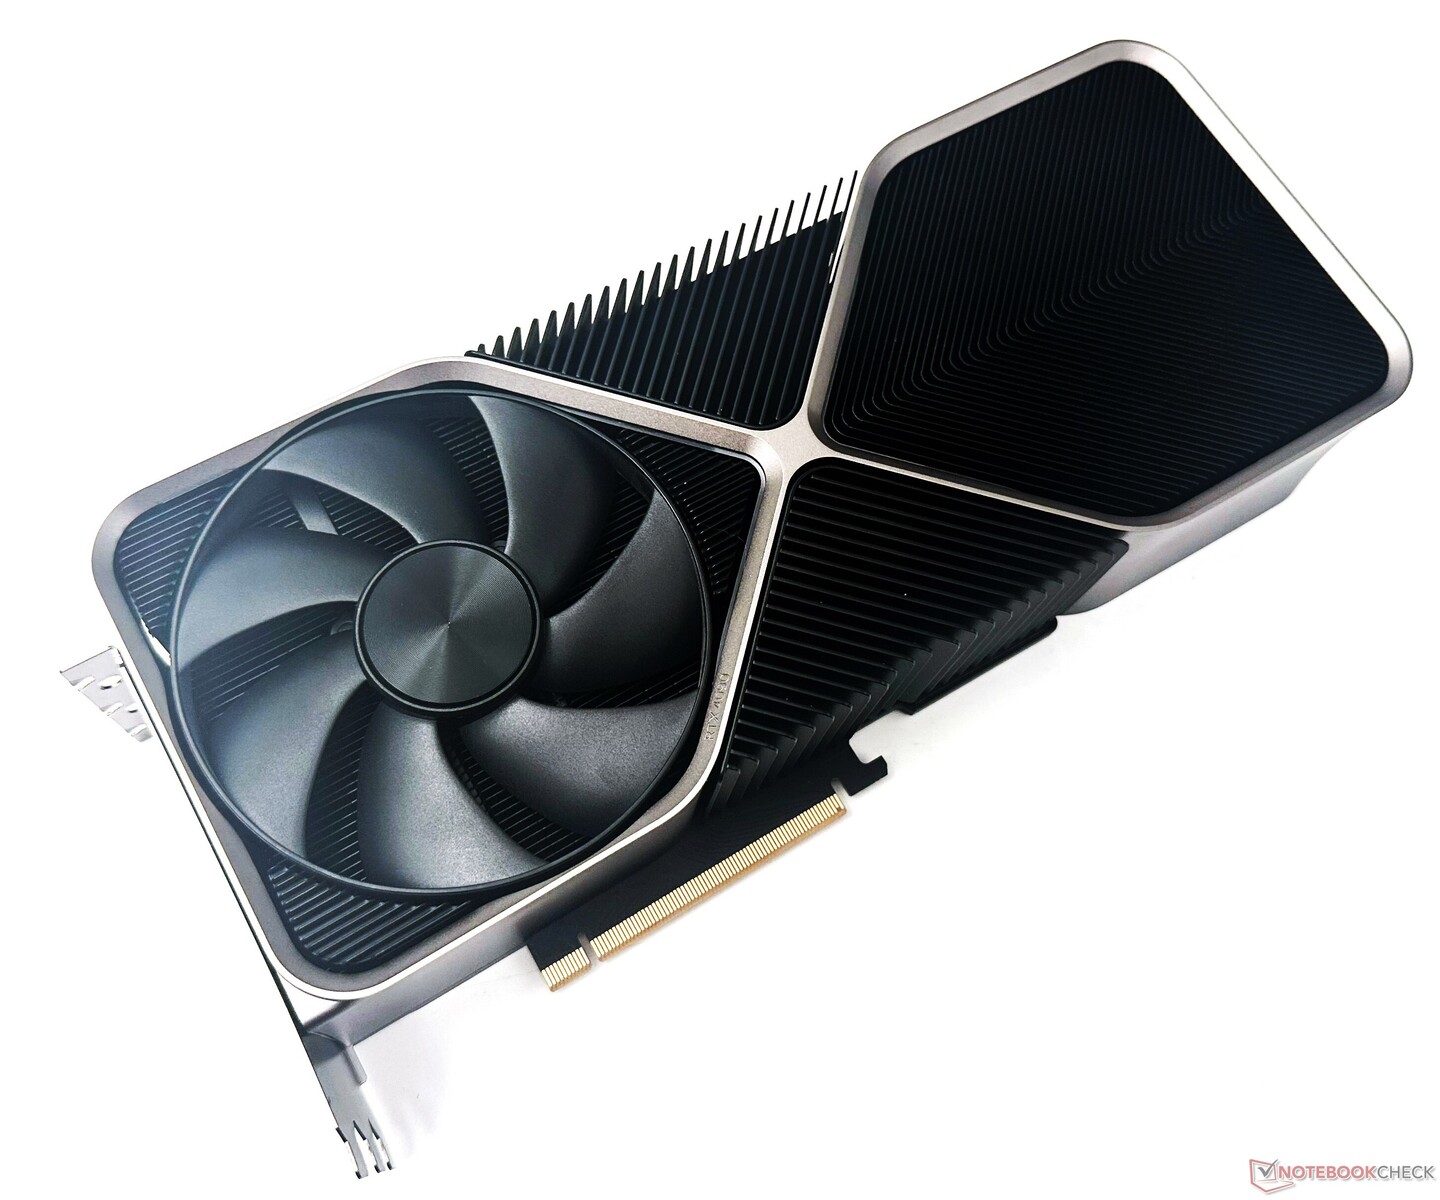
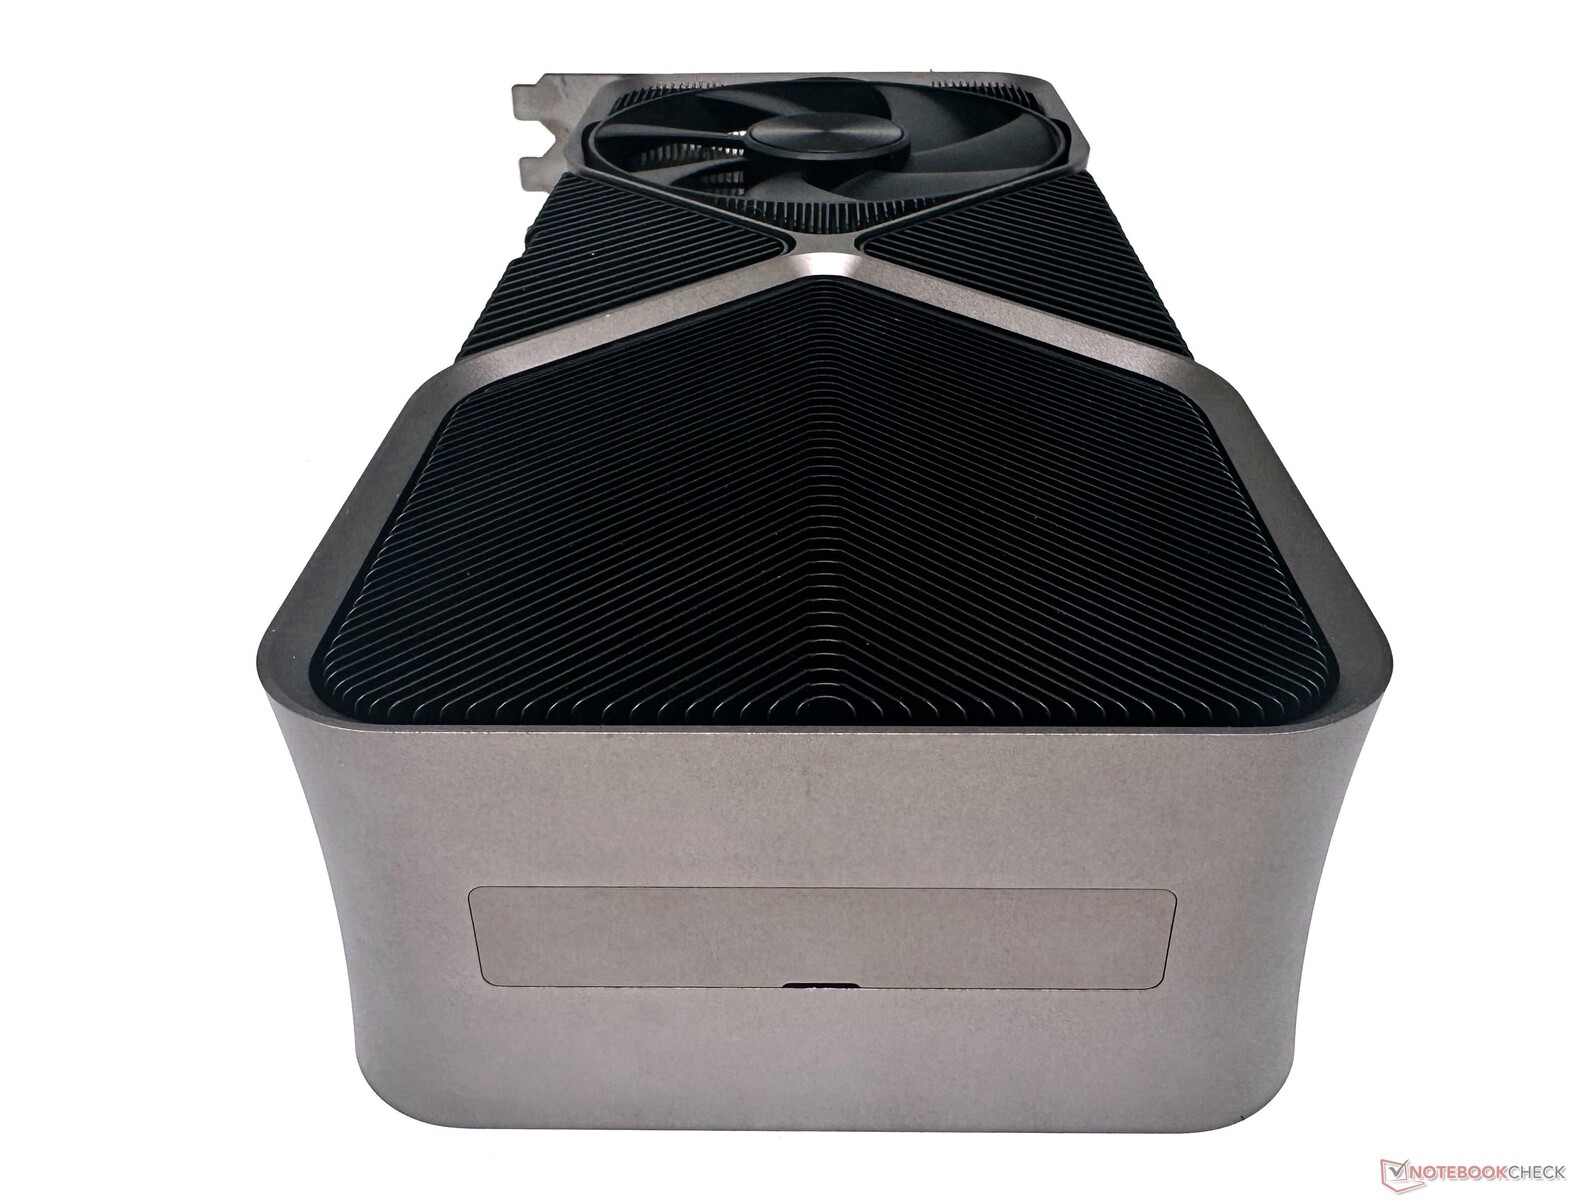
Externally, the RTX 4090 FE looks massive at first glance but measurements put it more or less on par with the RTX 3090 FE. The 4090 FE has added thickness (61 mm vs 57 mm for the RTX 3090 FE) while the RTX 3090 FE is actually longer at 313 mm compared to the 304 mm length of the 4090 FE.
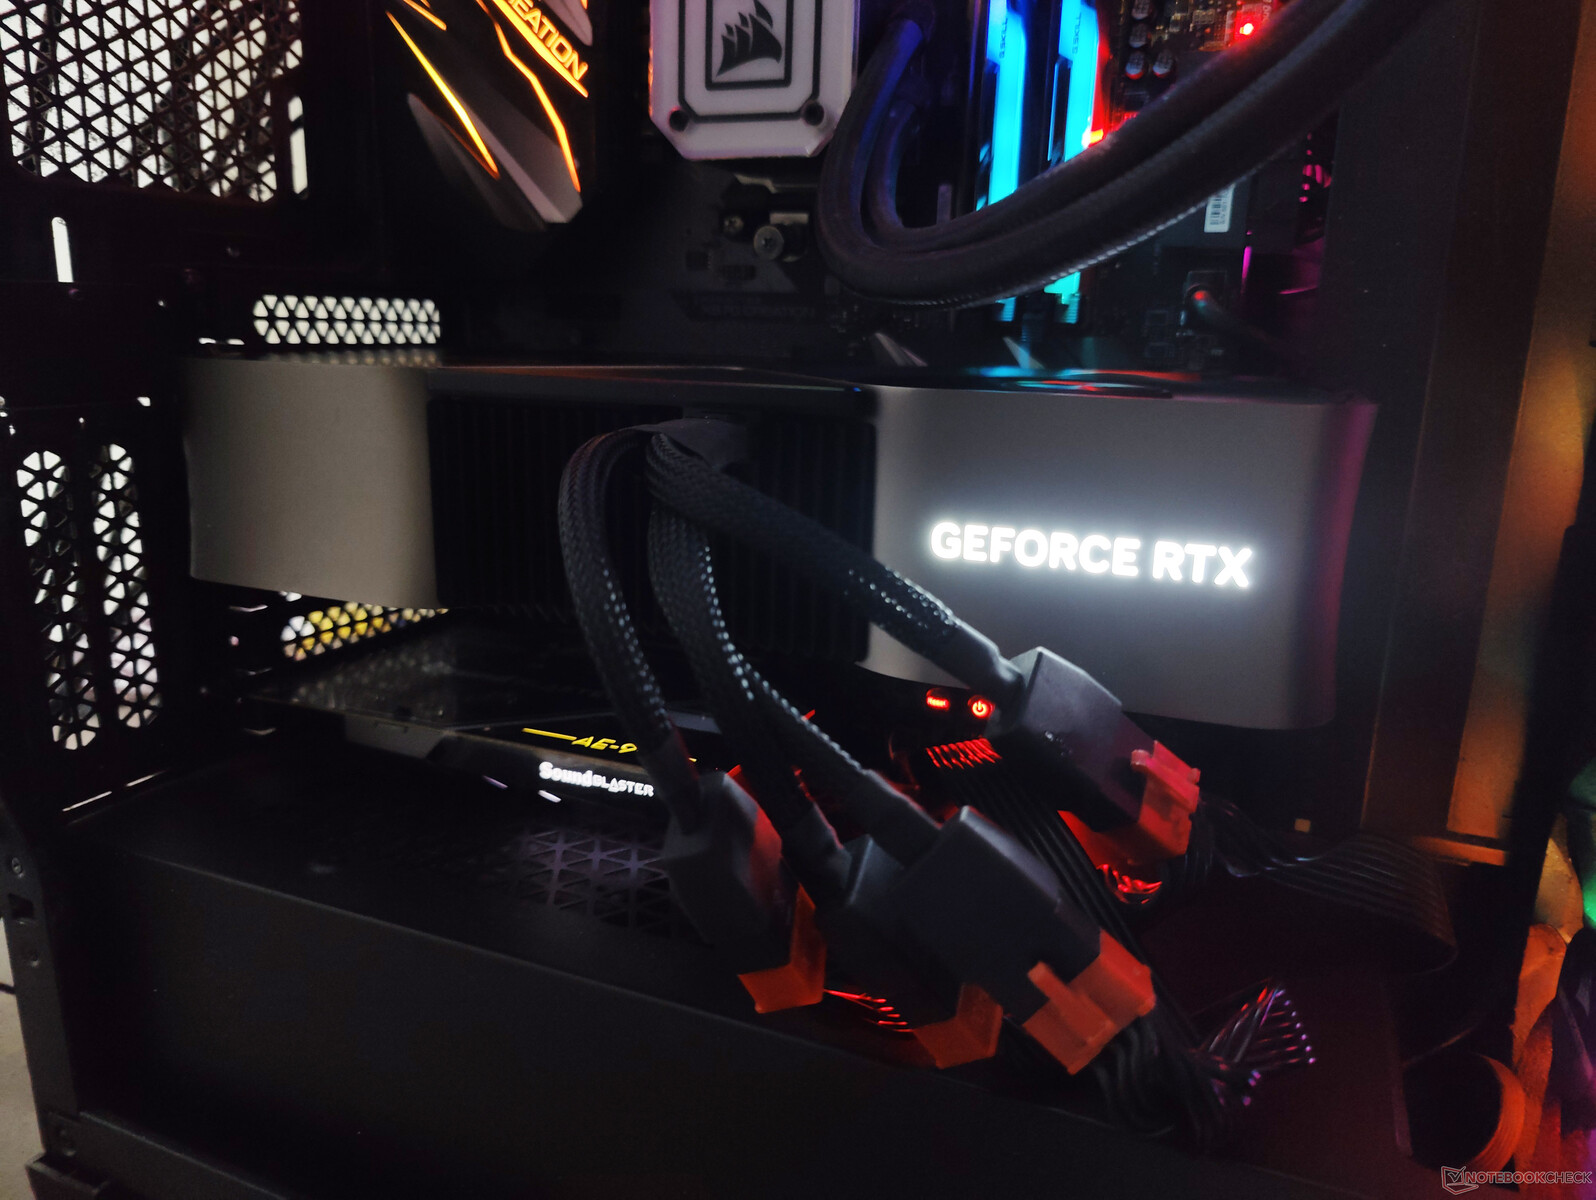
The RTX 4090 FE is slightly longer than an E-ATX motherboard and will occupy the space of three PCIe slots, so you will have to factor this in during purchase. We recommend having adequate clearance between the card and the front case fans for optimal case airflow.
Measurements apart, there are not many aesthetic differences from what we've already seen with the RTX 3090 FE. The design is simple, unobtrusive yet extremely functional.
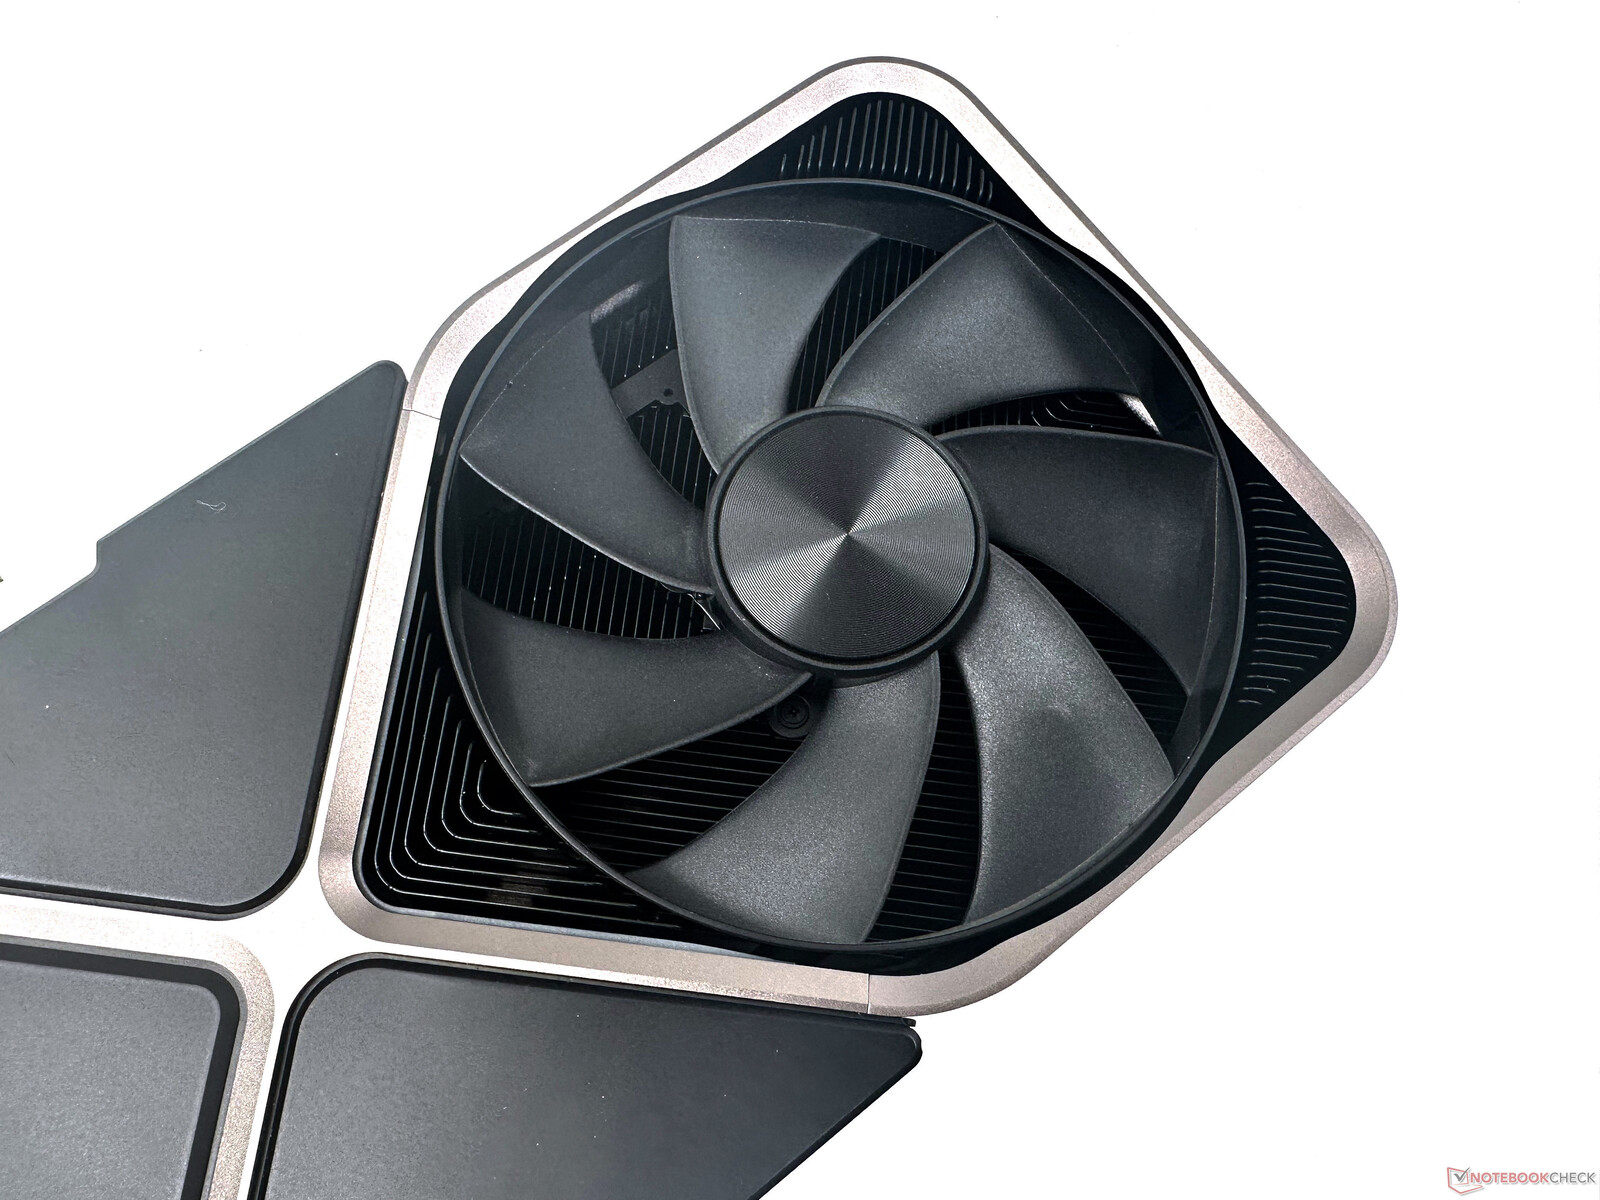
The thermal subsystem also sports a familiar look and functionality as the previous generation — one fan sucks air from the bottom while the other sucks this air from the card and pushes it on the opposite end, usually towards the top of the case. This means that if you place the card conventionally, the radiator fans or "pull" exhaust fans should be ideally located on the top of your case to prevent potential heat buildup.
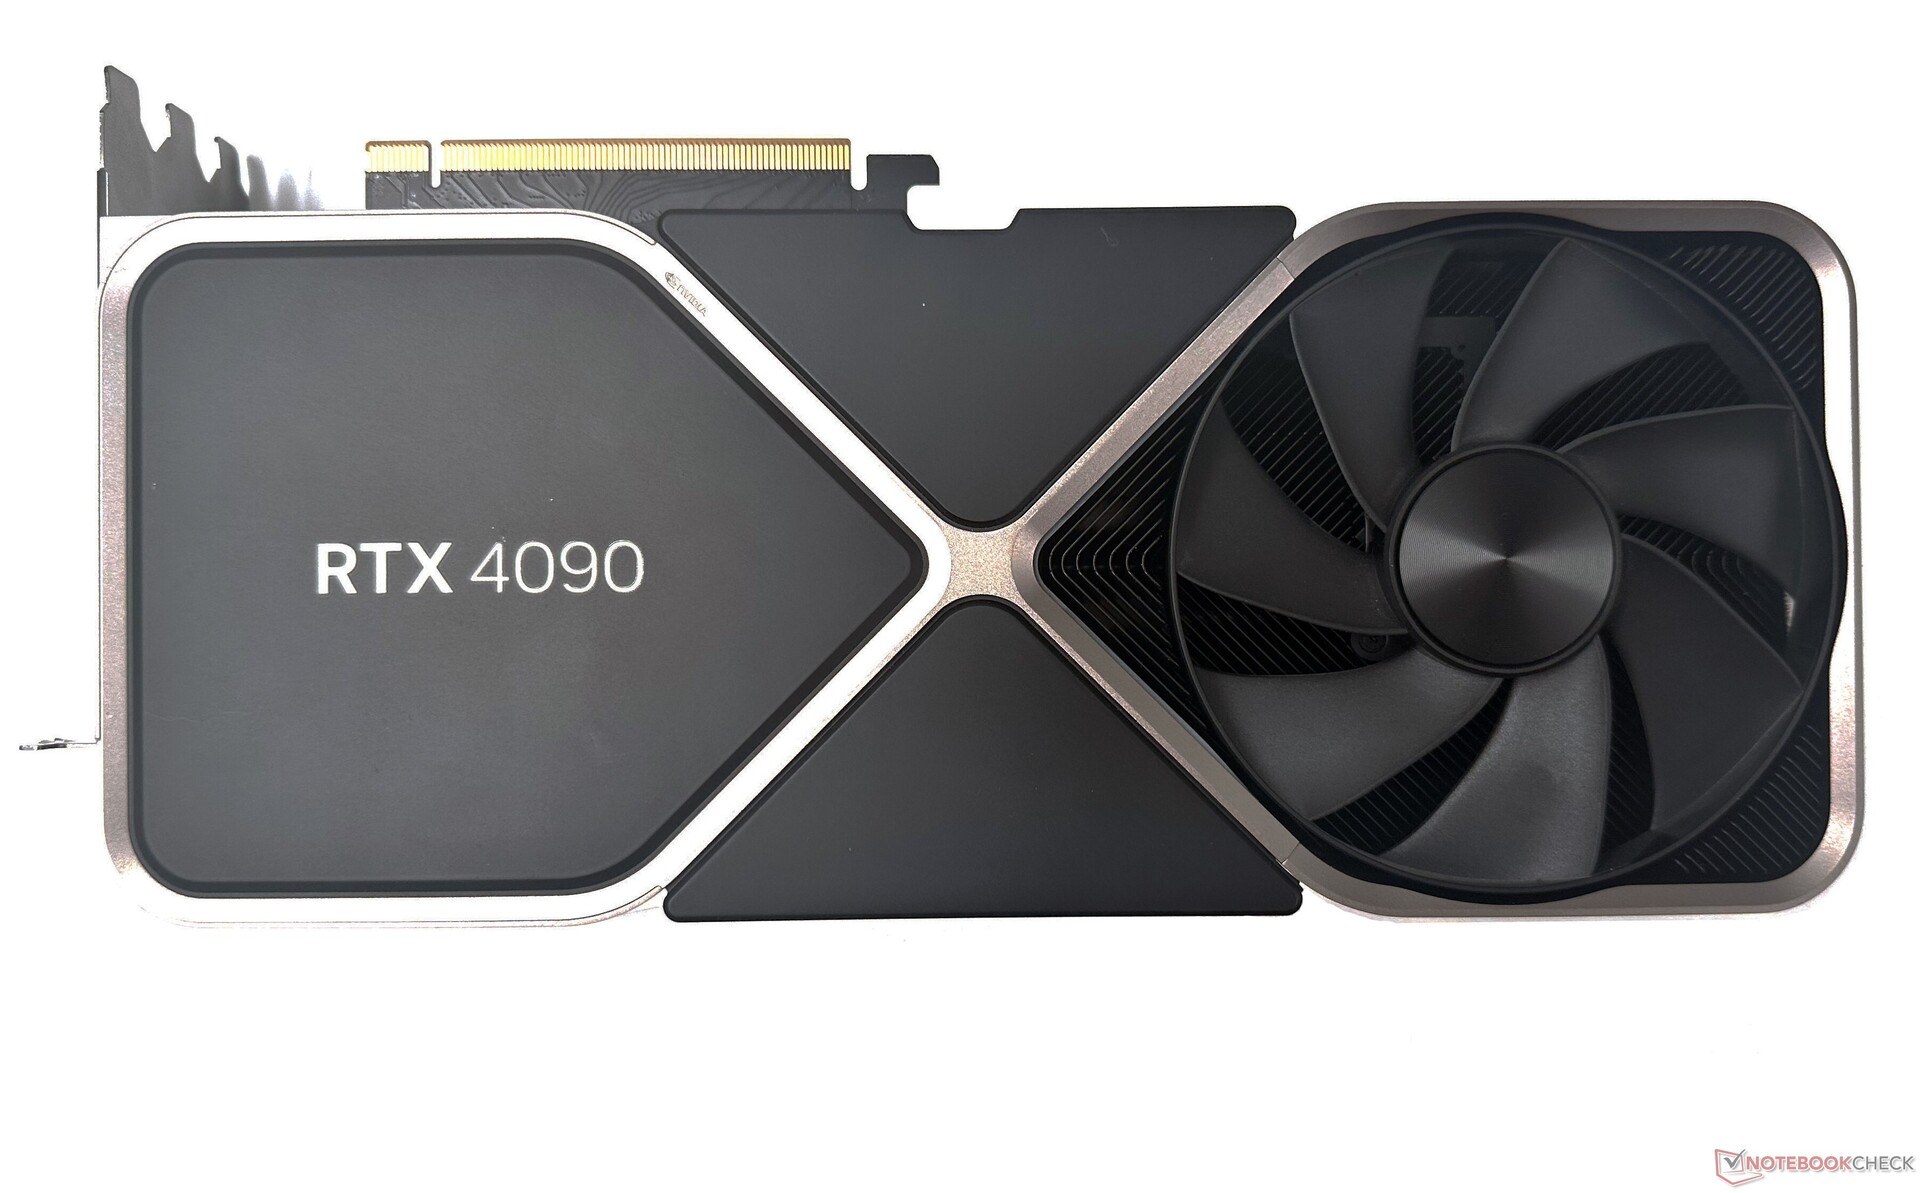
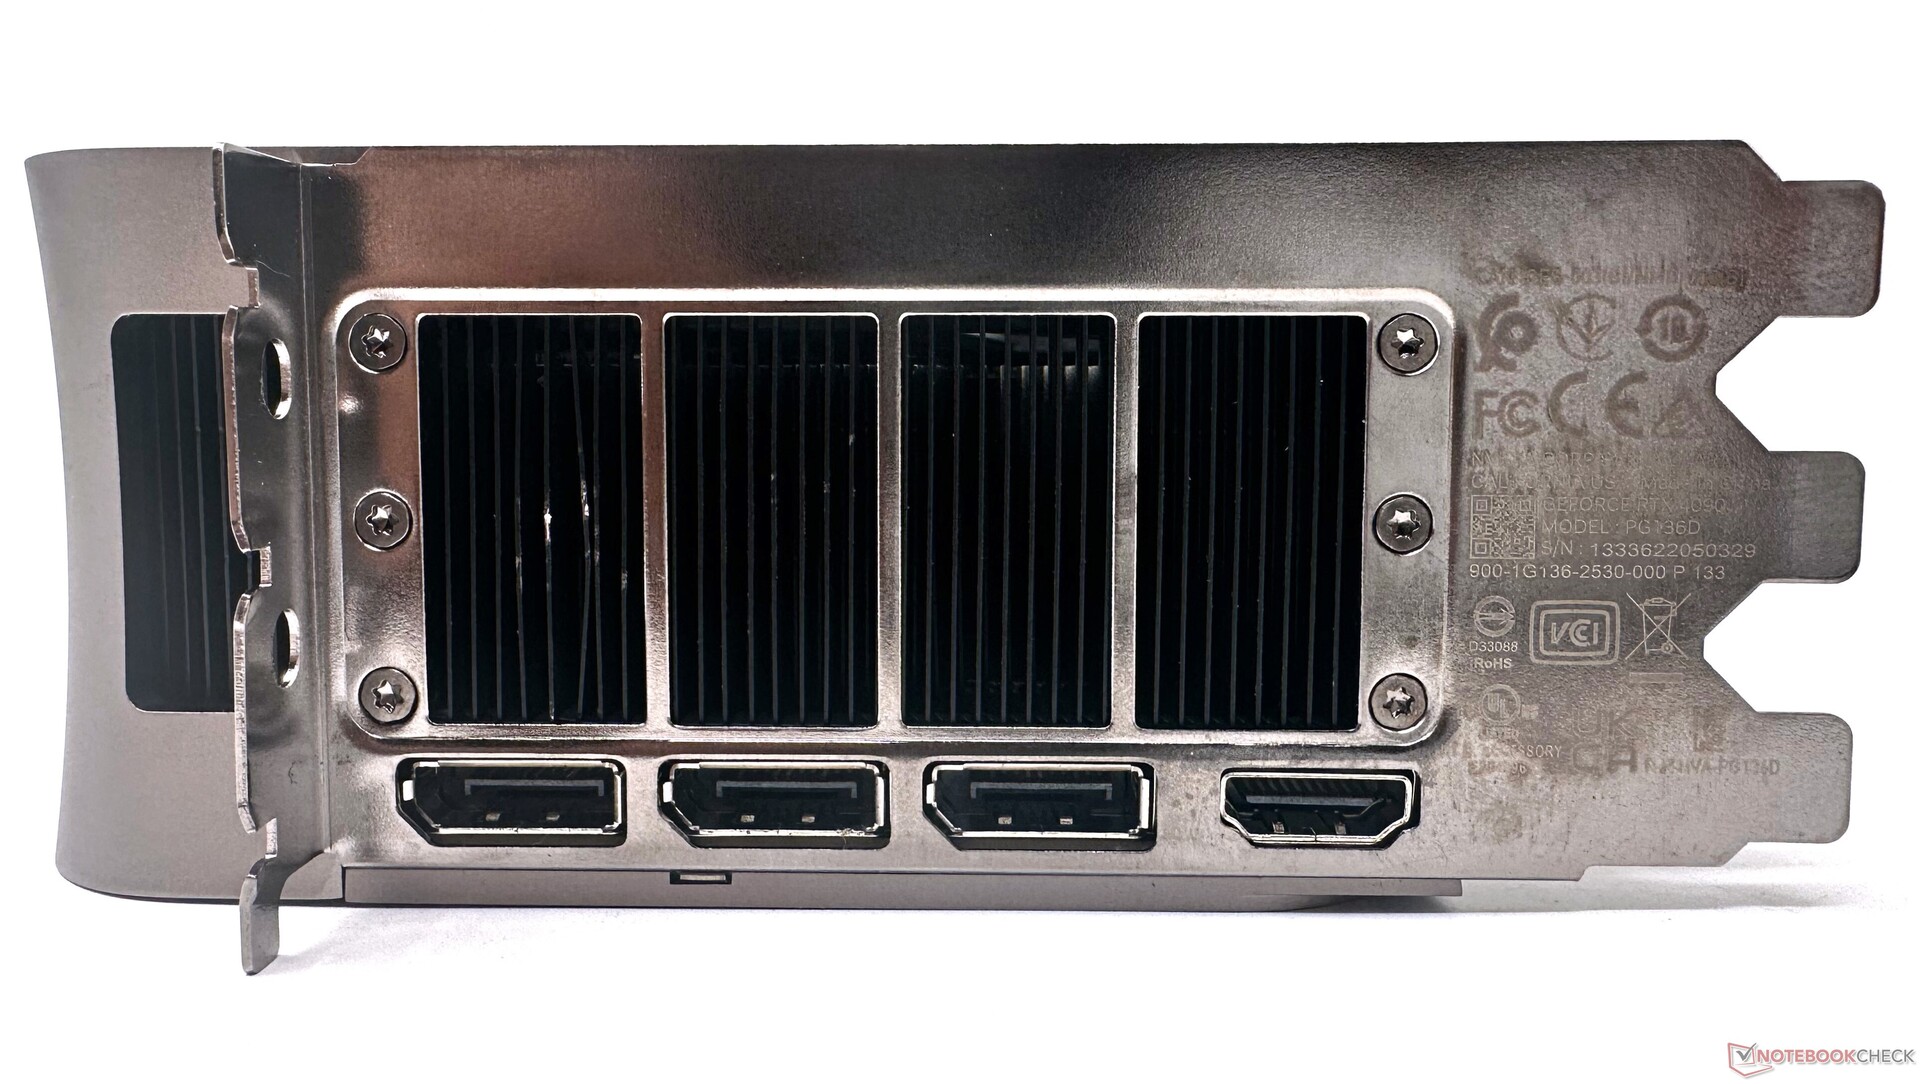
Connectivity options are the same as what we've seen before with Ampere cards, but the NVLink connector that was previously offered with the RTX 3090 and RTX 3090 Ti boards has now been axed. There are three DisplayPort 1.4a outs and one HDMI 2.1a port.
Nvidia feels that the market isn't ripe yet for DisplayPort 2.1 whereas the upcoming AMD Radeon RX 7900 XT and RX 7900 XTX RDNA 3 cards already brag about having DisplayPort 2.1 with UHBR 13.5 support.
Turing cards offered USB Type-C support back in the day, but Nvidia removed this port with Ampere. Though not really a deal-breaker, AMD's upcoming RDNA 3 cards, on the other hand, will offer USB Type-C for directly hooking up VR headsets and USB-C monitors.
Nvidia first introduced the PCIe Gen 5 power connector with the RTX 3090 Ti and mandated its inclusion even on add-in board (AiB) partner models. This year, the PCIe Gen 5 connector, dubbed the 12VHPWR adapter, has drawn a lot of flak for increasing number of melting reports.
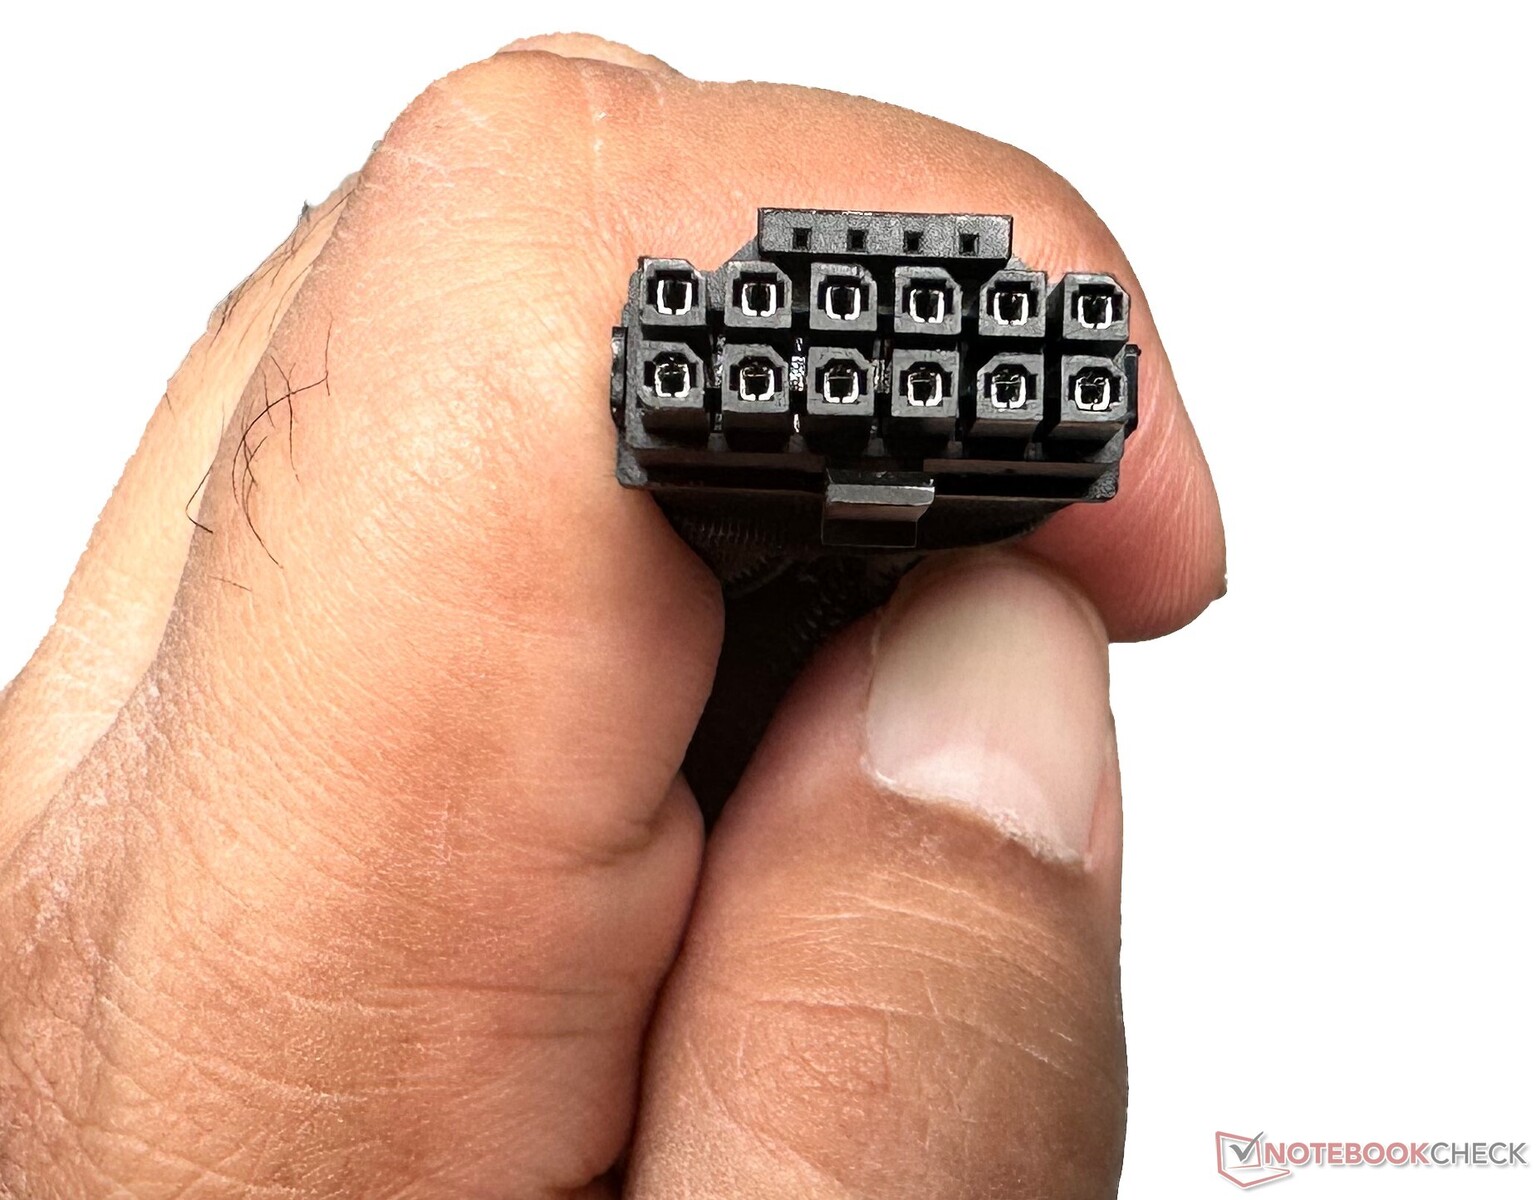
Early adopters and prospective buyers alike are apprehensive of the hazards of a melting power connector that can pull 600 W under load.
Nvidia has now confirmed that it is actively investigating this problem and said that the issue can arise if the connector is not securely plugged in. Nevertheless, the company said that it will be supporting all affected customers and expedite the RMA process.
We didn't have an ATX 3 PSU or modded cables on hand, so we had to make do with the supplied 12VHPWR 16-pin to 4x 8-pin adapter.
Luckily, the connector in our review sample still seems intact even after many hours of continuous gameplay, stress testing, and overclocking.
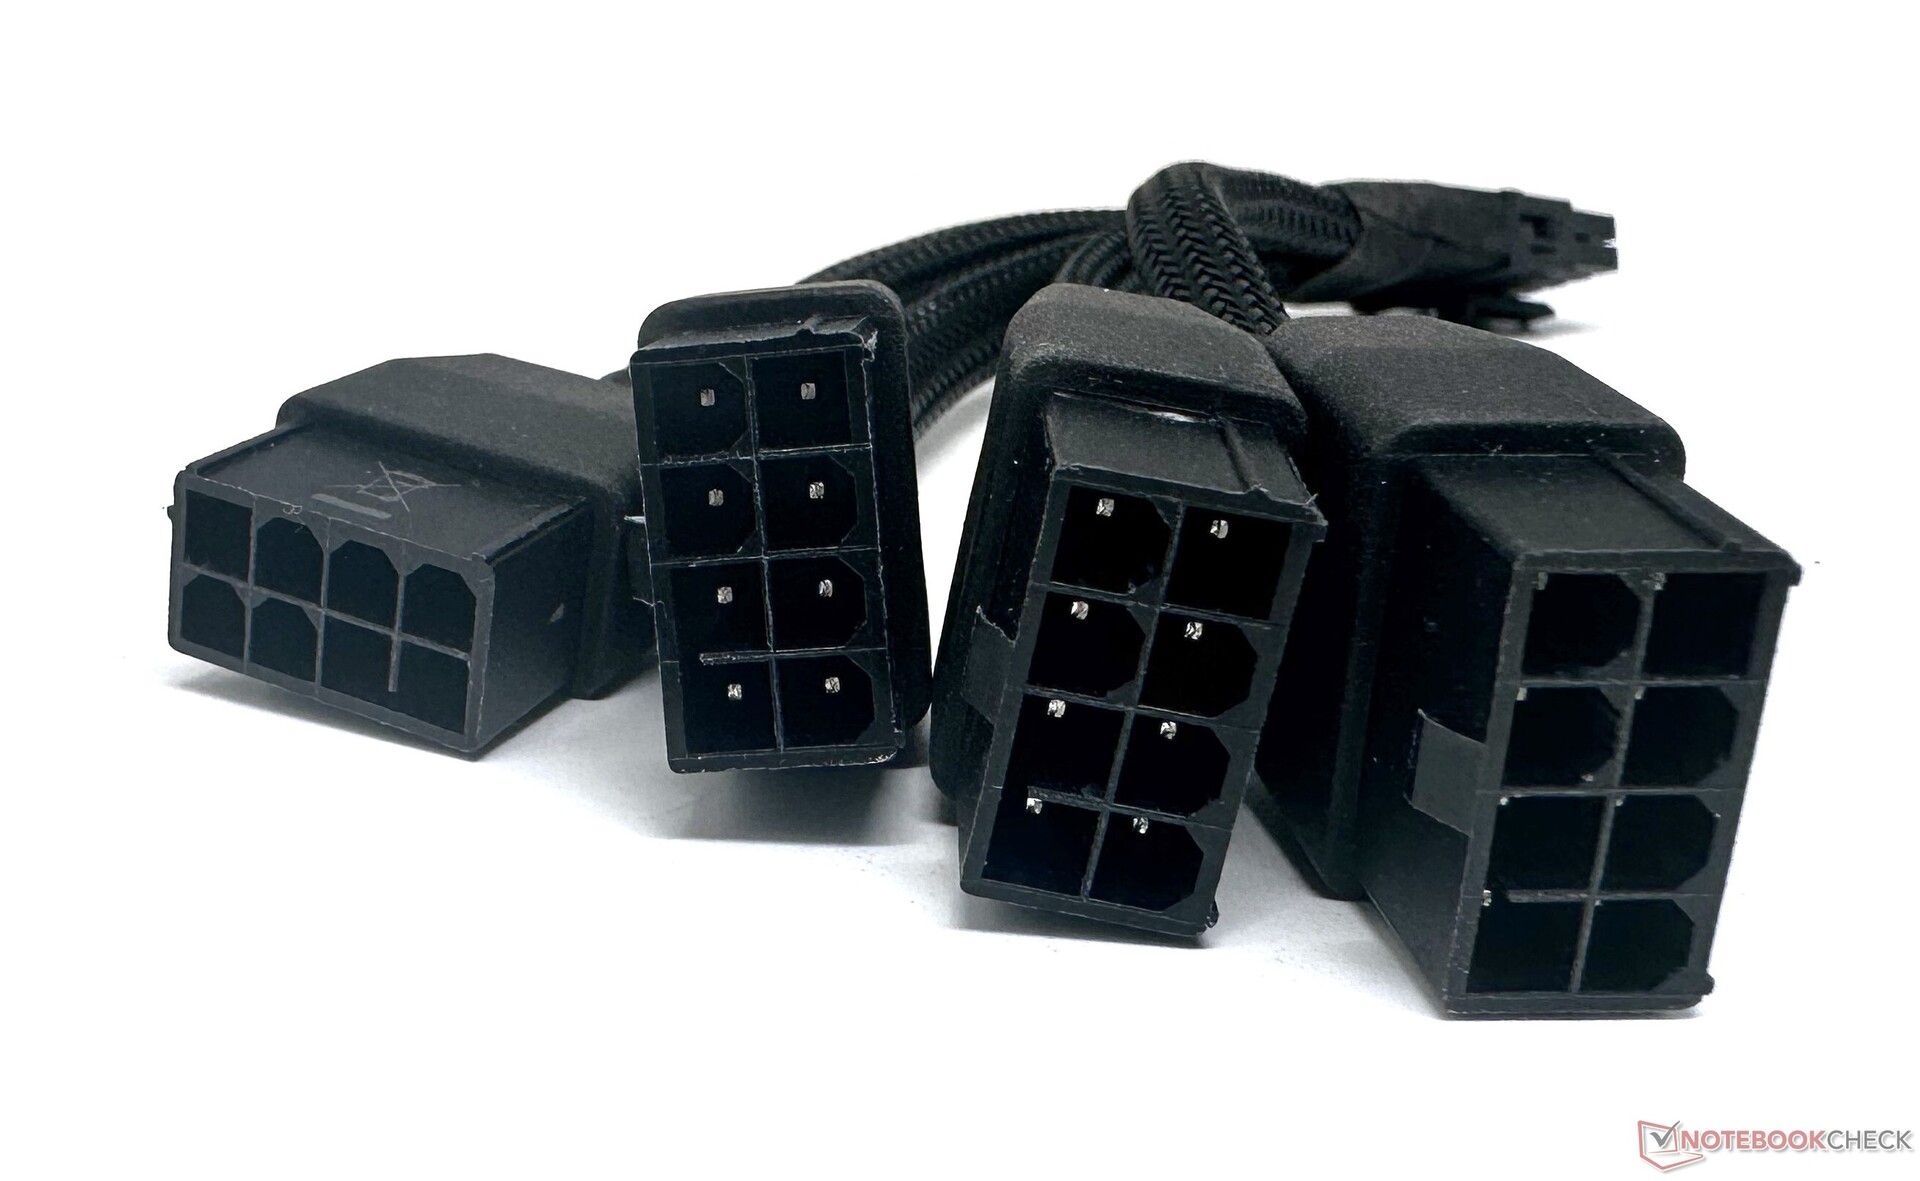
If you are content with running the RTX 4090 at 450 W, you can technically make do with just 3x 8-pin connections to your PSU. You will only need the fourth 8-pin if you plan to overclock or increase the power target of the card.
The sense pins in the 12VHPWR help tell the GPU how many 8-pins are connected to adjust power correspondingly. Anything less than three 8-pin connections and the card won't boot.
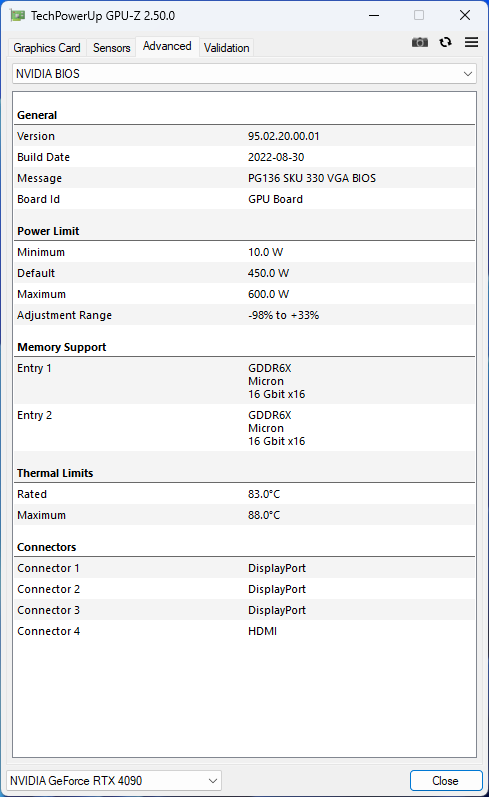
The RTX 4090 FE runs at a base clock of 2,235 MHz and can boost up to 2,520 MHz in the default power and voltage profile. It is possible to increase the power target by an additional 33% to 600 W.
The test bench: Core i9-13900K meets the RTX 4090 FE
In order to enable the RTX 4090 to fully flex its muscles, you will need a modern CPU of the likes of AMD Zen 4 or Intel Alder Lake/Raptor Lake processors — the AMD Ryzen 9 7900X/7950X or the Intel Core i9-13900K are worthy companions to the RTX 4090.
The Ryzen 7 5800X3D can be a good option as well if you wish to stick with the AM4 platform for now. However, other AM4 CPUs, including the Ryzen 9 5950X, can severely bottleneck the RTX 4090, especially at resolutions below QHD.
In our initial testing with the Ryzen 9 5950X, we found that the RTX 4090's performance at 1080p was so bottlenecked that some of the scores at various settings this resolution were often not that different from an RTX 3090 Ti. Therefore, the current review relies on a Core i9-13900K platform.
The following components were used in our build:
- Cooler Master MasterFrame 700 test bench
- Intel Core i9-13900K
- Gigabyte Z790 Aorus Master motherboard
- Gigabyte Aorus Gen 4 2 TB NVMe SSD for benchmarks and games
- 2x 16 GB Kingston Fury Beast DDR5-6000 RAM with timings 36-38-38-80 at 1.35 V
- Gigabyte M28U 4K 144 Hz monitor
- Cooler Master MasterLiquid ML360L V2 ARGB AIO cooler
- Cooler Master MVE Gold 1250 V2 fully modular PSU
A fresh installation of Windows 11 22H2 with the latest patches was used together with Game Ready driver version 526.47.
We would like to thank Cooler Master for supplying the test bench, AIO, and PSU, Gigabyte for the Core i9-13900K, Z790 motherboard, M28U monitor, and NVMe SSD, and AMD for the Kingston DDR5 memory.
Synthetic benchmarks: A slam dunk for the RTX 4090
Combining all synthetic benchmarks together, we find that the RTX 4090 FE puts up a significant 51% lead over the RTX 3090 Ti and a 58% lead over the RTX 3090 FE and also with the Radeon RX 6950 XT.
The Radeon RX 6950 XT does have a perceivable advantage over the RTX 3090 Ti in synthetic 3DMark graphics tests. It remains to be seen how the new RDNA 3 cards would fare once they become available next month, but the RTX 4090 FE is able to get itself a big enough lead for now. Interestingly, the RX 6950 XT is only 9% behind the 4090 FE in Fire Strike Graphics while it trails by up to 40% in other tests such as Time Spy Graphics.
Unigine tests show Nvidia cards leading the way in general and the RTX 4090 FE in particular. We get to see 50%+ improvements in both the Heaven 4.0 tests and also in the Valley 1.0 OpenGL test compared to the RTX 3090 Ti.
Superposition, particularly at higher resolutions, shows the RTX 4090 FE completely decimating the RX 6950 XT by as much as 93% while also showing leads up to 79% over the RTX 3090 Ti.
| 3DMark 11 Performance | 64966 points | |
| 3DMark Ice Storm Standard Score | 300753 points | |
| 3DMark Cloud Gate Standard Score | 85501 points | |
| 3DMark Fire Strike Score | 47404 points | |
| 3DMark Fire Strike Extreme Score | 37848 points | |
| 3DMark Time Spy Score | 32177 points | |
Help | ||
Compute benchmarks: Chart-topping performance
The RTX 4090 FE's hegemony continues in compute benchmarks as well. In ComputeMark overall, we find Nvidia's Ada flagship attaining a 93% lead over the RX 6950XT and a highly significant 66% gain over the RTX 3090 Ti.
LuxMark presents an interesting paradigm, however. While the RTX 4090 FE leads the RX 6950XT in the Room test by a whopping 150%, AMD cards generally show better performance in Sala.
* ... smaller is better
Professional applications: Powerful hardware handicapped by drivers
The RTX 4090 is able to offer significantly better performance in pro apps than other last gen consumer GPUs solely due to its brute hardware power. It is still a GeForce card at the end of the day, so performance in these applications is artificially limited by the driver.
The GA102-based RTX A6000 has a 109% gain in SPECviewperf tests solely due to driver optimizations. It is for the same reason that even the Turing-based mobile Quadro RTX 5000 is able to offer much better performance in Solidworks and Siemens NX, though they trail behind in workloads such as 3Ds Max and Maya.
Nvidia allows changing the VRAM ECC state even with regular Game Ready drivers. This option is of no use to gamers since it can reduce memory speeds. However, it can come in handy for professionals running long simulations that can make use of the RTX 4090's massive VRAM but do not want to shell out heaps of cash for the Quadros.
| Nvidia GeForce RTX 4090 FE i9-13900K | NVIDIA GeForce RTX 3090 Ti R7 5800X3D | AMD Radeon RX 6950 XT R9 5900X | AMD Radeon RX 6900 XT R9 5950X | AMD Radeon RX 6800 XT R9 5950X | NVIDIA GeForce RTX 3090 i9-13900K | 4x NVIDIA RTX A6000 TR Pro 3975WX | NVIDIA RTX A6000 TR Pro 3975WX | Average NVIDIA GeForce RTX 3090 | Average NVIDIA GeForce RTX 3080 | Average NVIDIA GeForce RTX 3080 Ti | Average NVIDIA Titan RTX | Average NVIDIA RTX A5000 Laptop GPU | Average NVIDIA Quadro RTX 5000 (Laptop) | Average of class Desktop | |
|---|---|---|---|---|---|---|---|---|---|---|---|---|---|---|---|
| SPECviewperf 12 | -43% | -20% | -16% | -27% | -34% | 96% | 109% | -38% | -56% | -34% | 67% | 27% | 24% | 28% | |
| 1900x1060 Solidworks (sw-03) | 119 | 85.7 -28% | 157 32% | 167 40% | 150 26% | 106 -11% | 208 75% | 225 89% | 96.7 ? -19% | 68.6 ? -42% | 103.7 ? -13% | 164.8 ? 38% | 168.2 ? 41% | 156.7 ? 32% | 150.3 ? 26% |
| 1900x1060 Siemens NX (snx-02) | 28.8 | 15.6 -46% | 49.4 72% | 47.7 66% | 45.07 56% | 17.1 -41% | 333 1056% | 351 1119% | 16.1 ? -44% | 13.1 ? -55% | 16.7 ? -42% | 264 ? 817% | 167.3 ? 481% | 184 ? 539% | 124.3 ? 332% |
| 1900x1060 Showcase (showcase-01) | 410 | 265 -35% | 308 -25% | 241 -41% | 223 -46% | 263 -36% | 237 -42% | 255 -38% | 257 ? -37% | 190 ? -54% | 256 ? -38% | 193.8 ? -53% | 110.3 ? -73% | 104.3 ? -75% | 293 ? -29% |
| 1900x1060 Medical (medical-01) | 288 | 87.1 -70% | 58.3 -80% | 88.4 -69% | 77.3 -73% | 90 -69% | 156 -46% | 159 -45% | 93 ? -68% | 43.9 ? -85% | 124.8 ? -57% | 94.6 ? -67% | 69.8 ? -76% | 109.3 ? -62% | 184.7 ? -36% |
| 1900x1060 Maya (maya-04) | 324 | 197 -39% | 90.7 -72% | 151 -53% | 118 -64% | 306 -6% | 147 -55% | 144 -56% | 268 ? -17% | 165.3 ? -49% | 294 ? -9% | 184 ? -43% | 113.8 ? -65% | 121.4 ? -63% | 269 ? -17% |
| 1900x1060 Energy (energy-01) | 82.6 | 27.6 -67% | 23 -72% | 30.8 -63% | 28.39 -66% | 26 -69% | 39.3 -52% | 39.8 -52% | 25.2 ? -69% | 17.4 ? -79% | 26.7 ? -68% | 28.7 ? -65% | 16.9 ? -80% | 26 ? -69% | 60.1 ? -27% |
| 1900x1060 Creo (creo-01) | 122 | 76.4 -37% | 115 -6% | 127 4% | 119 -2% | 101 -17% | 127 4% | 136 11% | 89.9 ? -26% | 69.9 ? -43% | 96.3 ? -21% | 153.8 ? 26% | 151.3 ? 24% | 144.4 ? 18% | 120.8 ? -1% |
| 1900x1060 Catia (catia-04) | 274 | 150 -45% | 199 -27% | 292 7% | 238 -13% | 177 -35% | 208 -24% | 229 -16% | 161.4 ? -41% | 121.1 ? -56% | 172 ? -37% | 239 ? -13% | 177.3 ? -35% | 159 ? -42% | 294 ? 7% |
| 1900x1060 3ds Max (3dsmax-05) | 473 | 371 -22% | 484 2% | 318 -33% | 167 -65% | 369 -22% | 245 -48% | 336 -29% | 364 ? -23% | 276 ? -42% | 373 ? -21% | 284 ? -40% | 193.9 ? -59% | 449 ? -5% | |
| SPECviewperf 13 | -40% | -10% | -17% | -24% | -36% | 98% | 110% | -41% | -52% | -37% | 58% | 9% | 8% | 33% | |
| Solidworks (sw-04) | 190 | 118 -38% | 210 11% | 214 13% | 193 2% | 154 -19% | 191 1% | 192 1% | 136.3 ? -28% | 94.5 ? -50% | 150.7 ? -21% | 169.6 ? -11% | 151.3 ? -20% | 144.1 ? -24% | 188.6 ? -1% |
| Siemens NX (snx-03) | 51.4 | 28 -46% | 89.7 75% | 85.8 67% | 81.4 58% | 30.7 -40% | 604 1075% | 638 1141% | 28.1 ? -45% | 23.7 ? -54% | 30.1 ? -41% | 477 ? 828% | 298 ? 480% | 307 ? 497% | 225 ? 338% |
| Showcase (showcase-02) | 412 | 265 -36% | 312 -24% | 241 -42% | 232 -44% | 262 -36% | 239 -42% | 255 -38% | 246 ? -40% | 204 ? -50% | 257 ? -38% | 192.8 ? -53% | 117.9 ? -71% | 104.7 ? -75% | 294 ? -29% |
| Medical (medical-02) | 182 | 113 -38% | 157 -14% | 148 -19% | 130 -29% | 107 -41% | 180 -1% | 184 1% | 100.6 ? -45% | 95.4 ? -48% | 106.3 ? -42% | 90.1 ? -50% | 114.3 ? -37% | 116.1 ? -36% | 252 ? 38% |
| Maya (maya-05) | 838 | 493 -41% | 372 -56% | 395 -53% | 348 -58% | 580 -31% | 405 -52% | 415 -50% | 522 ? -38% | 400 ? -52% | 574 ? -32% | 425 ? -49% | 235 ? -72% | 235 ? -72% | 602 ? -28% |
| Energy (energy-02) | 119 | 48.4 -59% | 60.3 -49% | 60.6 -49% | 58.4 -51% | 45.1 -62% | 128 8% | 132 11% | 42.8 ? -64% | 37 ? -69% | 41.4 ? -65% | 52.7 ? -56% | 63.8 ? -46% | 51.7 ? -57% | 103.5 ? -13% |
| Creo (creo-02) | 580 | 353 -39% | 323 -44% | 292 -50% | 276 -52% | 397 -32% | 292 -50% | 366 -37% | 366 ? -37% | 288 ? -50% | 398 ? -31% | 344 ? -41% | 233 ? -60% | 231 ? -60% | 511 ? -12% |
| Catia (catia-05) | 406 | 230 -43% | 450 11% | 468 15% | 412 1% | 252 -38% | 359 -12% | 371 -9% | 232 ? -43% | 190.2 ? -53% | 251 ? -38% | 374 ? -8% | 262 ? -35% | 239 ? -41% | 435 ? 7% |
| 3ds Max (3dsmax-06) | 474 | 373 -21% | 483 2% | 317 -33% | 284 -40% | 369 -22% | 247 -48% | 338 -29% | 348 ? -27% | 266 ? -44% | 372 ? -22% | 283 ? -40% | 196 ? -59% | 187.5 ? -60% | 441 ? -7% |
| SPECviewperf 2020 | -40% | -21% | -30% | -28% | -24% | 57% | 104% | -34% | -46% | -32% | 64% | -6% | 22% | ||
| 3840x2160 Solidworks (solidworks-05) | 305 | 197 -35% | 125 -59% | 112 -63% | 108 -65% | 192 -37% | 141 -54% | 169 -45% | 178 ? -42% | 158 ? -48% | 184 ? -40% | 171.2 ? -44% | 82.6 ? -73% | 350 ? 15% | |
| 3840x2160 Siemens NX (snx-04) | 44 | 23.7 -46% | 88.6 101% | 85 93% | 81.7 86% | 25.6 -42% | 367 734% | 481 993% | 24 ? -45% | 19.8 ? -55% | 25.2 ? -43% | 372 ? 745% | 152.3 ? 246% | 111.3 ? 153% | |
| 3840x2160 Medical (medical-03) | 39.3 | 22.2 -44% | 34.4 -12% | 30.4 -23% | 27.84 -29% | 20.3 -48% | 32.1 -18% | 37.9 -4% | 19.9 ? -49% | 18.5 ? -53% | 21.8 ? -45% | 18.6 ? -53% | 22.8 ? -42% | 49.4 ? 26% | |
| 3840x2160 Maya (maya-06) | 508 | 353 -31% | 296 -42% | 266 -48% | 224 -56% | 356 -30% | 262 -48% | 329 -35% | 341 ? -33% | 293 ? -42% | 356 ? -30% | 278 ? -45% | 127.7 ? -75% | 446 ? -12% | |
| 3840x2160 Energy (energy-03) | 65.3 | 31.6 -52% | 47.6 -27% | 32.6 -50% | 60.8 -7% | 101 55% | 46.1 -29% | 63 -4% | 62.4 ? -4% | 51.7 ? -21% | 64.3 ? -2% | 50.1 ? -23% | 87.1 ? 33% | 95 ? 45% | |
| 3840x2160 Creo (creo-03) | 142 | 84.5 -40% | 73.1 -49% | 65.4 -54% | 65 -54% | 118 -17% | 75.6 -47% | 111 -22% | 107.7 ? -24% | 77.6 ? -45% | 113 ? -20% | 127.5 ? -10% | 93.3 ? -34% | 124.2 ? -13% | |
| 3840x2160 CATIA (catia-06) | 95.6 | 58.6 -39% | 53 -45% | 44.6 -53% | 42.4 -56% | 60.4 -37% | 67.5 -29% | 82.4 -14% | 57 ? -40% | 50 ? -48% | 59.6 ? -38% | 83.8 ? -12% | 58.4 ? -39% | 79.6 ? -17% | |
| 3840x2160 3ds Max (3dsmax-07) | 213 | 145 -32% | 144 -32% | 121 -43% | 114 -46% | 143 -33% | 95.7 -55% | 137 -36% | 134.7 ? -37% | 100 ? -53% | 139.3 ? -35% | 119.4 ? -44% | 83.9 ? -61% | 172.2 ? -19% | |
| Total Average (Program / Settings) | -41% /
-41% | -17% /
-17% | -21% /
-21% | -26% /
-26% | -31% /
-31% | 84% /
85% | 108% /
108% | -38% /
-38% | -51% /
-52% | -34% /
-34% | 63% /
63% | 10% /
10% | 16% /
16% | 28% /
28% |
Game benchmarks: Superlative raster and RT performance
Gamers looking to buy the RTX 4090 will be generally pleased with the kind of raster performance uplift that is on offer compared to the RTX 3090 Ti or the RX 6950 XT. Exact gains will depend on the game itself, and it is possible that not all games scale linearly with the increased shader count. You may also run into maximum fps caps depending on the game engine.
Overall, the RTX 4090 can be up to 39%, 59%, and 63% faster than the RTX 3090 Ti, RX 6950 XT, and RTX 3090 average, respectively.
| The Witcher 3 | |
| 3840x2160 High Graphics & Postprocessing (Nvidia HairWorks Off) | |
| Nvidia GeForce RTX 4090 FE | |
| NVIDIA GeForce RTX 4080 | |
| Average of class Desktop (41.7 - 388, n=35, last 2 years) | |
| NVIDIA GeForce RTX 3090 Ti | |
| Average NVIDIA GeForce RTX 3080 Ti (149 - 156.8, n=4) | |
| Average NVIDIA GeForce RTX 3090 (128 - 160.2, n=14) | |
| AMD Radeon RX 6950 XT | |
| AMD Radeon RX 6900 XT | |
| Average NVIDIA GeForce RTX 3080 (114 - 115, n=2) | |
| AMD Radeon RX 6800 XT | |
| Average NVIDIA Titan RTX (94 - 107.1, n=28) | |
| 1920x1080 Ultra Graphics & Postprocessing (HBAO+) | |
| Nvidia GeForce RTX 4090 FE | |
| NVIDIA GeForce RTX 4080 | |
| Average of class Desktop (7.8 - 369, n=40, last 2 years) | |
| AMD Radeon RX 6950 XT | |
| NVIDIA GeForce RTX 3090 Ti (110% PT) | |
| NVIDIA GeForce RTX 3090 Ti (100% PT) | |
| Average NVIDIA GeForce RTX 3090 (160 - 192.6, n=18) | |
| Average NVIDIA GeForce RTX 3080 Ti (174 - 184.6, n=4) | |
| AMD Radeon RX 6900 XT | |
| AMD Radeon RX 6800 XT | |
| Average NVIDIA GeForce RTX 3080 (145 - 152, n=2) | |
| Average NVIDIA Titan RTX (124 - 150, n=28) | |
Ray tracing performance
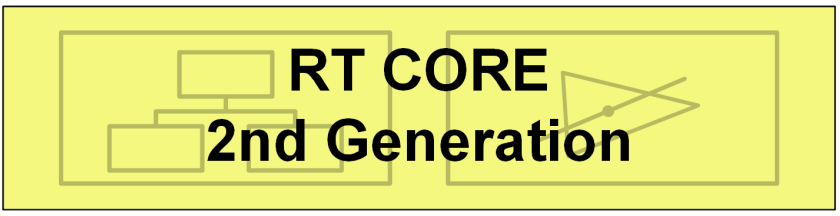
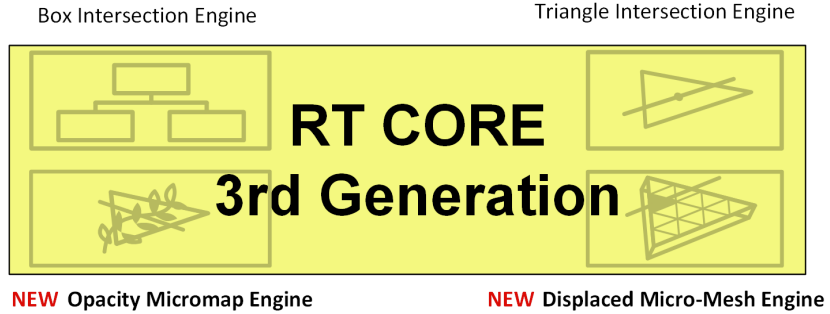
The new Ada architecture brings with it 128 3rd gen RT cores, which is a 52% increase in the number of RT cores in Ampere. The fundamental change in Ada's RT cores is the addition of two new functions — the Opacity Micromap Engine and Displaced Micro-mesh Engine — in addition to the Box Intersection Engine and the Triangle Intersection Engine that were originally part of Ampere.
Ada's RT cores also feature a new Shader Execution Reordering (SER) scheduling system that effectively reorders threads for secondary rays efficiently for effects such as path tracing, reflections, indirect lighting, and translucency. However, developers will have to specifically take advantage of SER via an API to see the benefits.
The Box Intersection Engine (presented by the boxes on the left of the diagram) performs Bounding Volume Hierarchy (BVH) traversal while the Triangle Intersection Engine calculates ray-triangle intersection testing.
Nvidia said that Ada's RT core can ray trace complex geometry thanks to the Displaced Micro-mesh Engine that generates meshes of micro-triangles and accelerated alpha traversals brought about by the Opacity Micromap Engine.
While it's good to see Nvidia investing in advancing RT rendering tech, real world results may not always represent a generation leap in performance. For instance, Metro Exodus (not the Enhanced Edition) shows only 5% gains with the RTX 4090 compared to the RTX 3090 Ti in the game's Taiga benchmark.
The RT benefits start becoming apparent with Control and Dying Light 2 that stand to gain by 42% compared to the RTX 3090 Ti at 1080p without DLSS. Far Cry 6 and Watch Dogs: Legion are other games that can show perceivable benefits with the RTX 4090's ray tracing capabilities.
Perhaps the highest gains are seen with Cyberpunk 2077 and Ghostwire: Tokyo that profusely make use of RT reflections and shadows. Cyberpunk 2077 sees a mammoth 75% increase in RT performance compared to the RTX 3090 Ti at 4K Ultra without DLSS and RT quality set to Ultra. However, the numbers are still below the 60 fps sweet spot.
1080p RT performance in Cyberpunk 2077 and Ghostwire: Tokyo sees a significant uplift compared to the previous Ampere flagship.
| Control - 1920x1080 High Quality Preset & High Ray Tracing Preset (DX12) | |
| Nvidia GeForce RTX 4090 FE | |
| NVIDIA GeForce RTX 4080 | |
| Average of class Desktop (113.8 - 170.5, n=6, last 2 years) | |
| NVIDIA GeForce RTX 3090 Ti | |
| Average NVIDIA GeForce RTX 3080 Ti (111 - 120.6, n=3) | |
| Average NVIDIA GeForce RTX 3090 (91.4 - 122.6, n=5) | |
| Average NVIDIA GeForce RTX 3080 (98.1 - 103, n=2) | |
| AMD Radeon RX 6950 XT | |
| Average NVIDIA Titan RTX (63 - 120, n=3) | |
| AMD Radeon RX 6900 XT (SAM ENABLED) | |
| AMD Radeon RX 6900 XT | |
| AMD Radeon RX 6800 XT | |
| Watch Dogs Legion - 1920x1080 Ultra Preset + Ultra Ray Tracing (DX12) | |
| Nvidia GeForce RTX 4090 FE | |
| NVIDIA GeForce RTX 4080 | |
| Average of class Desktop (87.8 - 99.9, n=4, last 2 years) | |
| NVIDIA GeForce RTX 3090 Ti | |
| Average NVIDIA GeForce RTX 3090 (75.7 - 110, n=3) | |
| Average NVIDIA GeForce RTX 3080 Ti (n=1) | |
| AMD Radeon RX 6800 XT | |
| Average NVIDIA GeForce RTX 3080 (70.9 - 71.3, n=2) | |
| AMD Radeon RX 6950 XT | |
| AMD Radeon RX 6900 XT | |
| AMD Radeon RX 6900 XT (SAM ENABLED) | |
| Average NVIDIA Titan RTX (n=1) | |
| Far Cry 6 - 1920x1080 Ultra Graphics Quality + HD Textures + DXR AA:T | |
| Average of class Desktop (62.2 - 207, n=17, last 2 years) | |
| NVIDIA GeForce RTX 4080 | |
| Nvidia GeForce RTX 4090 FE | |
| NVIDIA GeForce RTX 3090 Ti | |
| Average NVIDIA GeForce RTX 3080 Ti (112 - 128.6, n=2) | |
| Average NVIDIA GeForce RTX 3090 (76 - 138.2, n=8) | |
| Average NVIDIA Titan RTX (97 - 109.3, n=2) | |
| AMD Radeon RX 6950 XT | |
| Average NVIDIA GeForce RTX 3080 (n=1) | |
| Cyberpunk 2077 1.6 | |
| 3840x2160 Ray Tracing Ultra Preset (DLSS off) | |
| Nvidia GeForce RTX 4090 FE (1.6) | |
| NVIDIA GeForce RTX 4080 (1.6) | |
| NVIDIA GeForce RTX 3090 Ti (1.52) | |
| Average of class Desktop (20 - 29.9, n=4, last 2 years) | |
| Average NVIDIA GeForce RTX 3090 (19.8 - 22.1, n=6) | |
| Average NVIDIA GeForce RTX 3080 Ti (n=1) | |
| Average NVIDIA Titan RTX (n=1) | |
| Average NVIDIA GeForce RTX 3080 (n=1) | |
| 1920x1080 Ray Tracing Ultra Preset (DLSS off) | |
| Nvidia GeForce RTX 4090 FE (1.6) | |
| NVIDIA GeForce RTX 4080 (1.6) | |
| Average of class Desktop (68.9 - 97.3, n=4, last 2 years) | |
| NVIDIA GeForce RTX 3090 Ti (1.52) | |
| Average NVIDIA GeForce RTX 3080 Ti (n=1) | |
| Average NVIDIA GeForce RTX 3090 (61.3 - 70.4, n=6) | |
| Average NVIDIA GeForce RTX 3080 (n=1) | |
| Average NVIDIA Titan RTX (n=1) | |
| Ghostwire Tokyo - 1920x1080 Highest Settings + Maximum Ray Tracing | |
| Nvidia GeForce RTX 4090 FE | |
| NVIDIA GeForce RTX 4080 | |
| Average of class Desktop (128.3 - 195.1, n=5, last 2 years) | |
| NVIDIA GeForce RTX 3090 Ti | |
| Average NVIDIA GeForce RTX 3080 Ti (n=1) | |
| Average NVIDIA GeForce RTX 3090 (106 - 122, n=4) | |
| Average NVIDIA GeForce RTX 3080 (n=1) | |
| Average NVIDIA Titan RTX (74.5 - 79, n=2) | |
| low | med. | high | ultra | QHD | 4K | |
|---|---|---|---|---|---|---|
| GTA V (2015) | 188 | 187.9 | 187.4 | 168.6 | 167.9 | 187.6 |
| The Witcher 3 (2015) | 747 | 666 | 606 | 297 | 274 | |
| Dota 2 Reborn (2015) | 292.4 | 268.3 | 252.6 | 239.8 | 228.9 | |
| Final Fantasy XV Benchmark (2018) | 236 | 233 | 230 | 220 | 151.5 | |
| X-Plane 11.11 (2018) | 251 | 216 | 164.8 | 138.6 | ||
| Far Cry 5 (2018) | 239 | 222 | 215 | 203 | 207 | 176 |
| Shadow of the Tomb Raider (2018) | 324 | 316 | 315 | 306 | 282 | 182 |
| Metro Exodus (2019) | 273 | 250 | 215 | 191.2 | 176 | 135 |
| Total War: Three Kingdoms (2019) | 642 | 422 | 332 | 268 | 188 | 100 |
| Control (2019) | 233 | 238 | 238 | 201 | 107.7 | |
| Borderlands 3 (2019) | 242 | 217 | 203 | 201 | 190 | 133.4 |
| Doom Eternal (2020) | 855 | 826 | 679 | 680 | 572 | 364 |
| Mafia Definitive Edition (2020) | 291 | 267 | 255 | 238 | 160.2 | |
| Watch Dogs Legion (2020) | 189.5 | 187.7 | 172.5 | 160.3 | 151.9 | 111.6 |
| Assassin´s Creed Valhalla (2020) | 303 | 274 | 235 | 206 | 173 | 120 |
| F1 2021 (2021) | 663 | 616 | 573 | 289 | 273 | 192 |
| Far Cry 6 (2021) | 234 | 214 | 193 | 182 | 175 | 132 |
| Call of Duty Vanguard (2021) | 286 | 329 | 301 | 239 | 161.4 | |
| Forza Horizon 5 (2021) | 388 | 275 | 266 | 198 | 186 | 151 |
| Rainbow Six Extraction (2022) | 530 | 489 | 468 | 446 | 343 | 198 |
| Dying Light 2 (2022) | 363 | 315 | 276 | 204 | 105.2 | |
| Cyberpunk 2077 1.6 (2022) | 241 | 233 | 222 | 210 | 147 | 77.8 |
| Ghostwire Tokyo (2022) | 301 | 300 | 302 | 301 | 299 | 167.2 |
| F1 22 (2022) | 387 | 411 | 381 | 199.2 | 149.6 | 80.5 |
| Call of Duty Modern Warfare 2 2022 (2022) | 364 | 335 | 291 | 285 | 216 | 139 |
A note on DLSS 3 frame generation
Nvidia wants gamers to use their new DLSS 3 frame generation tech with ray tracing to get triple-digit frames. DLSS 3 frame generation basically creates intermediary frames between frame 1 and frame 2, theoretically doubling the frame rate. However, not all games support it as of now, and the feature comes with the overhead of added latency thereby requiring Nvidia Reflex to also be inevitably enabled.
DLSS 3 is backwards compatible with DLSS 2 and can even be enabled independently or used in combination with other upscalers such as Intel XeSS or AMD FSR. The super resolution aspect hasn't changed, but this is where curtains are drawn for RTX 30 owners. Ampere does feature a standalone optical flow accelerator (OFA), but the one in Ada is 2x as powerful and can deliver 300 TOPS performance as per Nvidia. As a consequence, DLSS 3 frame generation will not be supported on Ampere GPUs and is Ada-exclusive for now.
Frame generation can be a boon for CPU-limited games. However, it must be noted here that the frame generation does not happen at the source, so you can still eventually get CPU-limited. Whether you would be able to perceive the intermittent frames or not depends on how fast the action in the game is and the overall implementation.
Most PresentMon-based utilities such as CapFrameX, which we regularly use for our game metrics, may not always see the intermediate frames. Therefore, capturing accurate fps with frame generation enabled requires using Nvidia's FrameView 1.4 utility.
AMD will also offer its own frame generation technique called Fluid Motion Frame in the upcoming FSR 3 update next year, hopefully with some machine learning smarts. Comparisons between DLSS 3 and FSR 3 will be interesting to watch out for.
Emissions: Superior thermals and fan noise with reference design
Nvidia has been nailing the thermal design with the Founders Edition cards for a while now, and the RTX 4090 FE is no different. This Ada flagship reference card is a cool customer for the most part with tolerable fan noise even under load.
We would like to mention here that overclocking works differently with Ada compared to Ampere. Ampere's boost algorithms relied on power limits to increase clocks. Nvidia says that since Ada is much more power-efficient, the GPU first looks at maximum clocks and voltage limits to boost clocks opportunistically before coming to power limits. Therefore, theoretically, you should be able to get a better voltage-frequency curve at the same power.
In our testing, we could manage about +205 MHz on the core, +1650 MHz on the memory, and a 133% power target with the core voltage maxed out in MSI Afterburner. This was the maximum we could go before we noticed artefacting in the Heaven 4.0 benchmark. Note that not all workloads tolerate these settings. For instance, FurMark at 1080p would crash the driver at these settings while we had no issues in running 3DMark Port Royal.
Stress tests
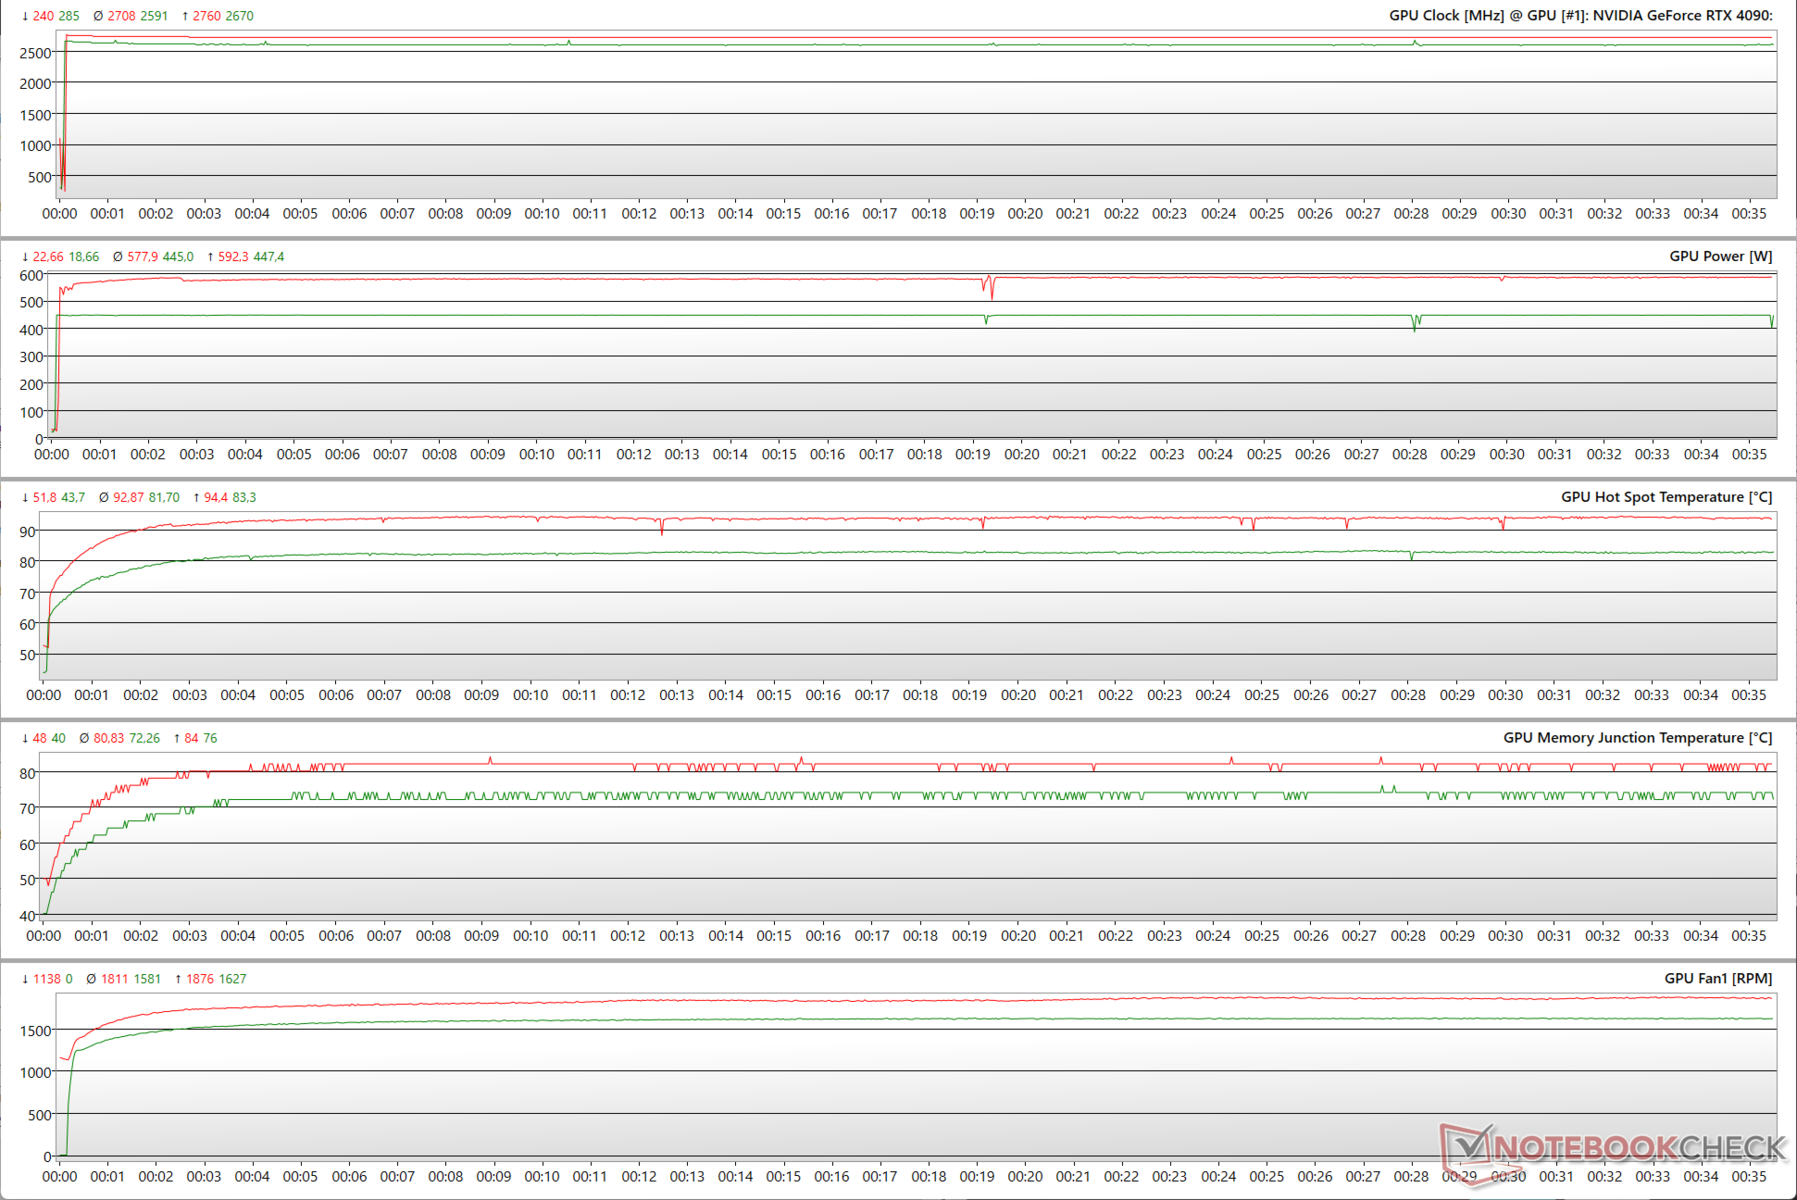
Stress testing with FurMark 1.19 at 1280x720 with AA off shows that the GPU clocks fairly stabilize at 2,591 MHz at a 100% power target (power target) and this can rise up to a peak of 2,760 MHz at 133% PT with the TGP going up to 592 W.
We observe fan speeds hitting a maximum of 65% of the rated RPM at 1,876 RPM at the higher PT, which otherwise remains fairly steady at 1,581 RPM at the default setting. The default setting also sees the GPU hot spot temperature coasting close to 82 °C while this can rise close to 93 °C when overclocked.
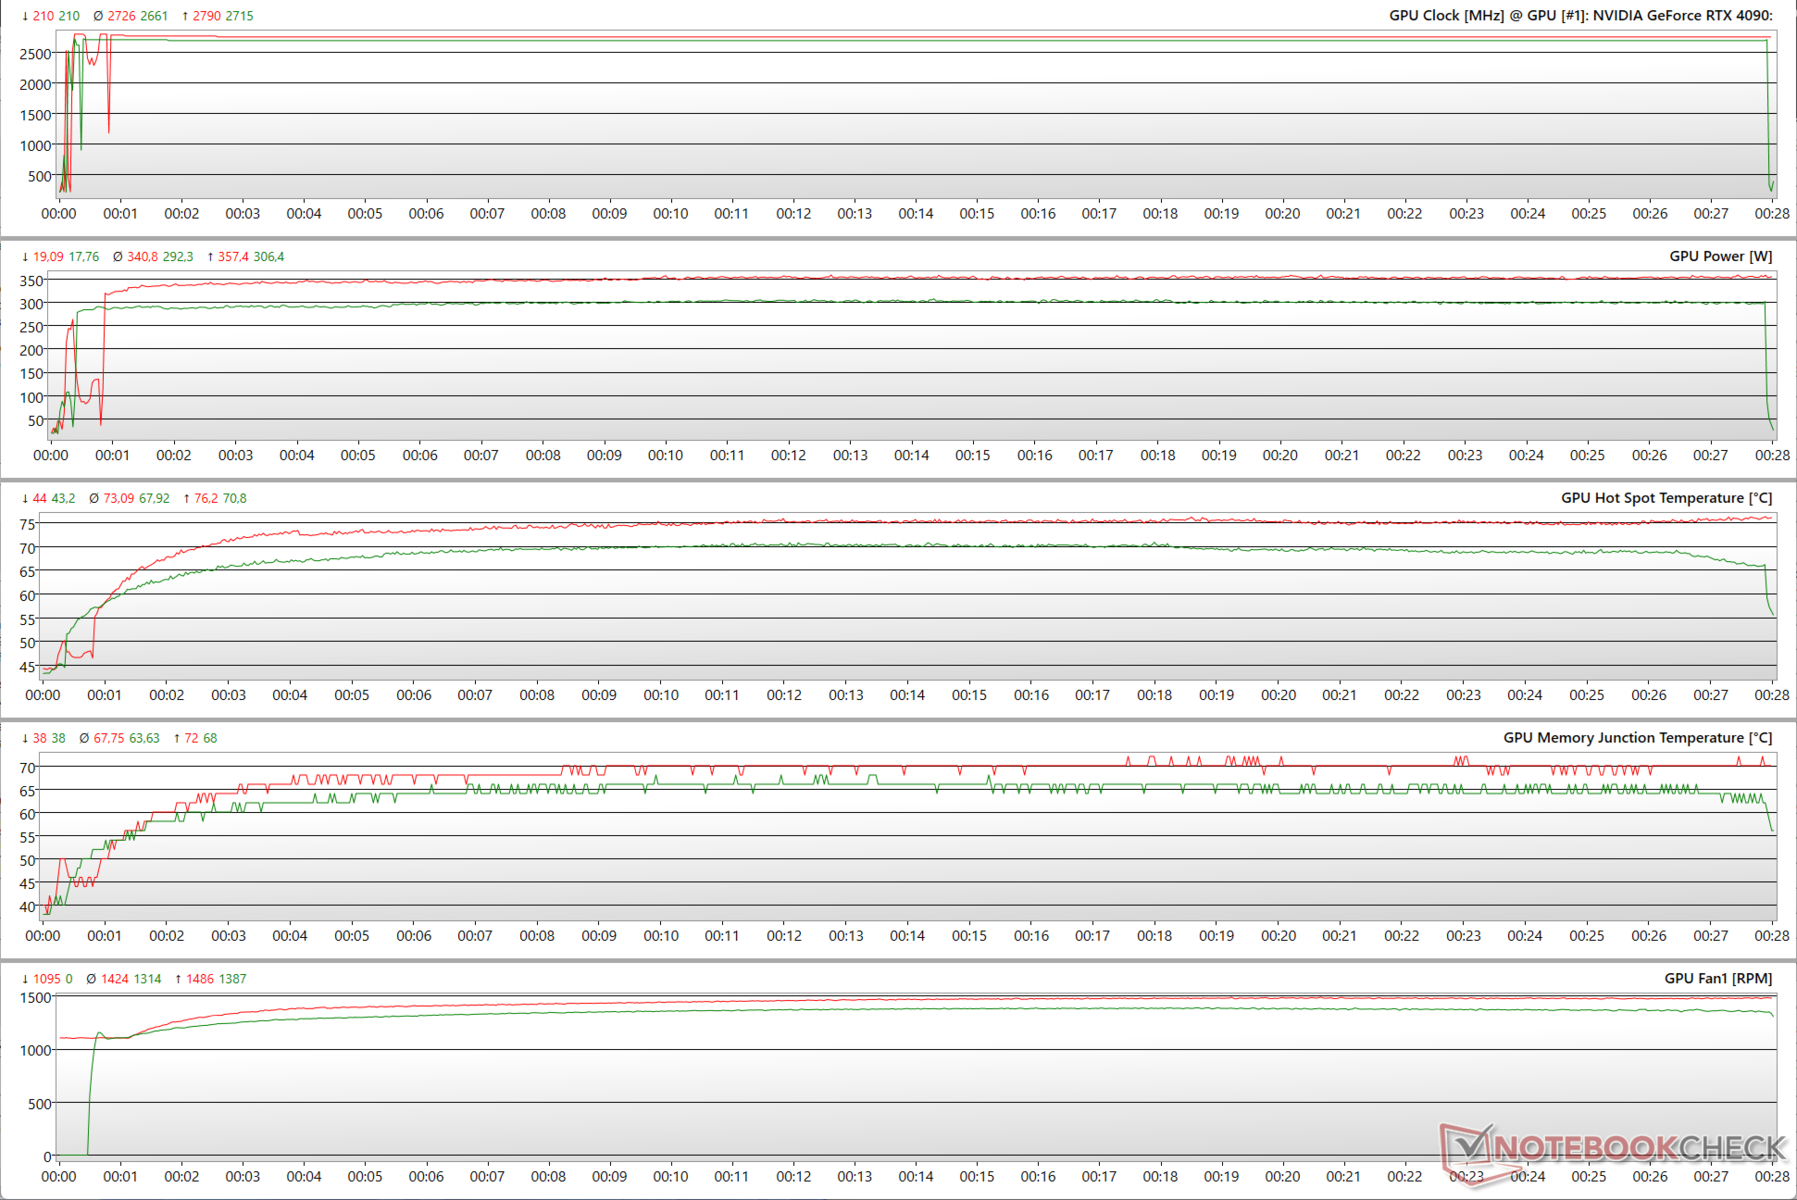
A similar pattern is seen during The Witcher 3 stress as well at 1080p Ultra, but here we observe a cooler operation with the hot spot temperature even under overclock being just about 73 °C. The fan speeds are comparatively lower as well.
This is the result of a much lower max. power consumption of just 306 W in the default setting and about 357 W in OC, which is actually a lot more efficient than what we had observed with the Zotac RTX 3090 Ti AMP Extreme Holo that consumed 416 W in this stress test even without OC.
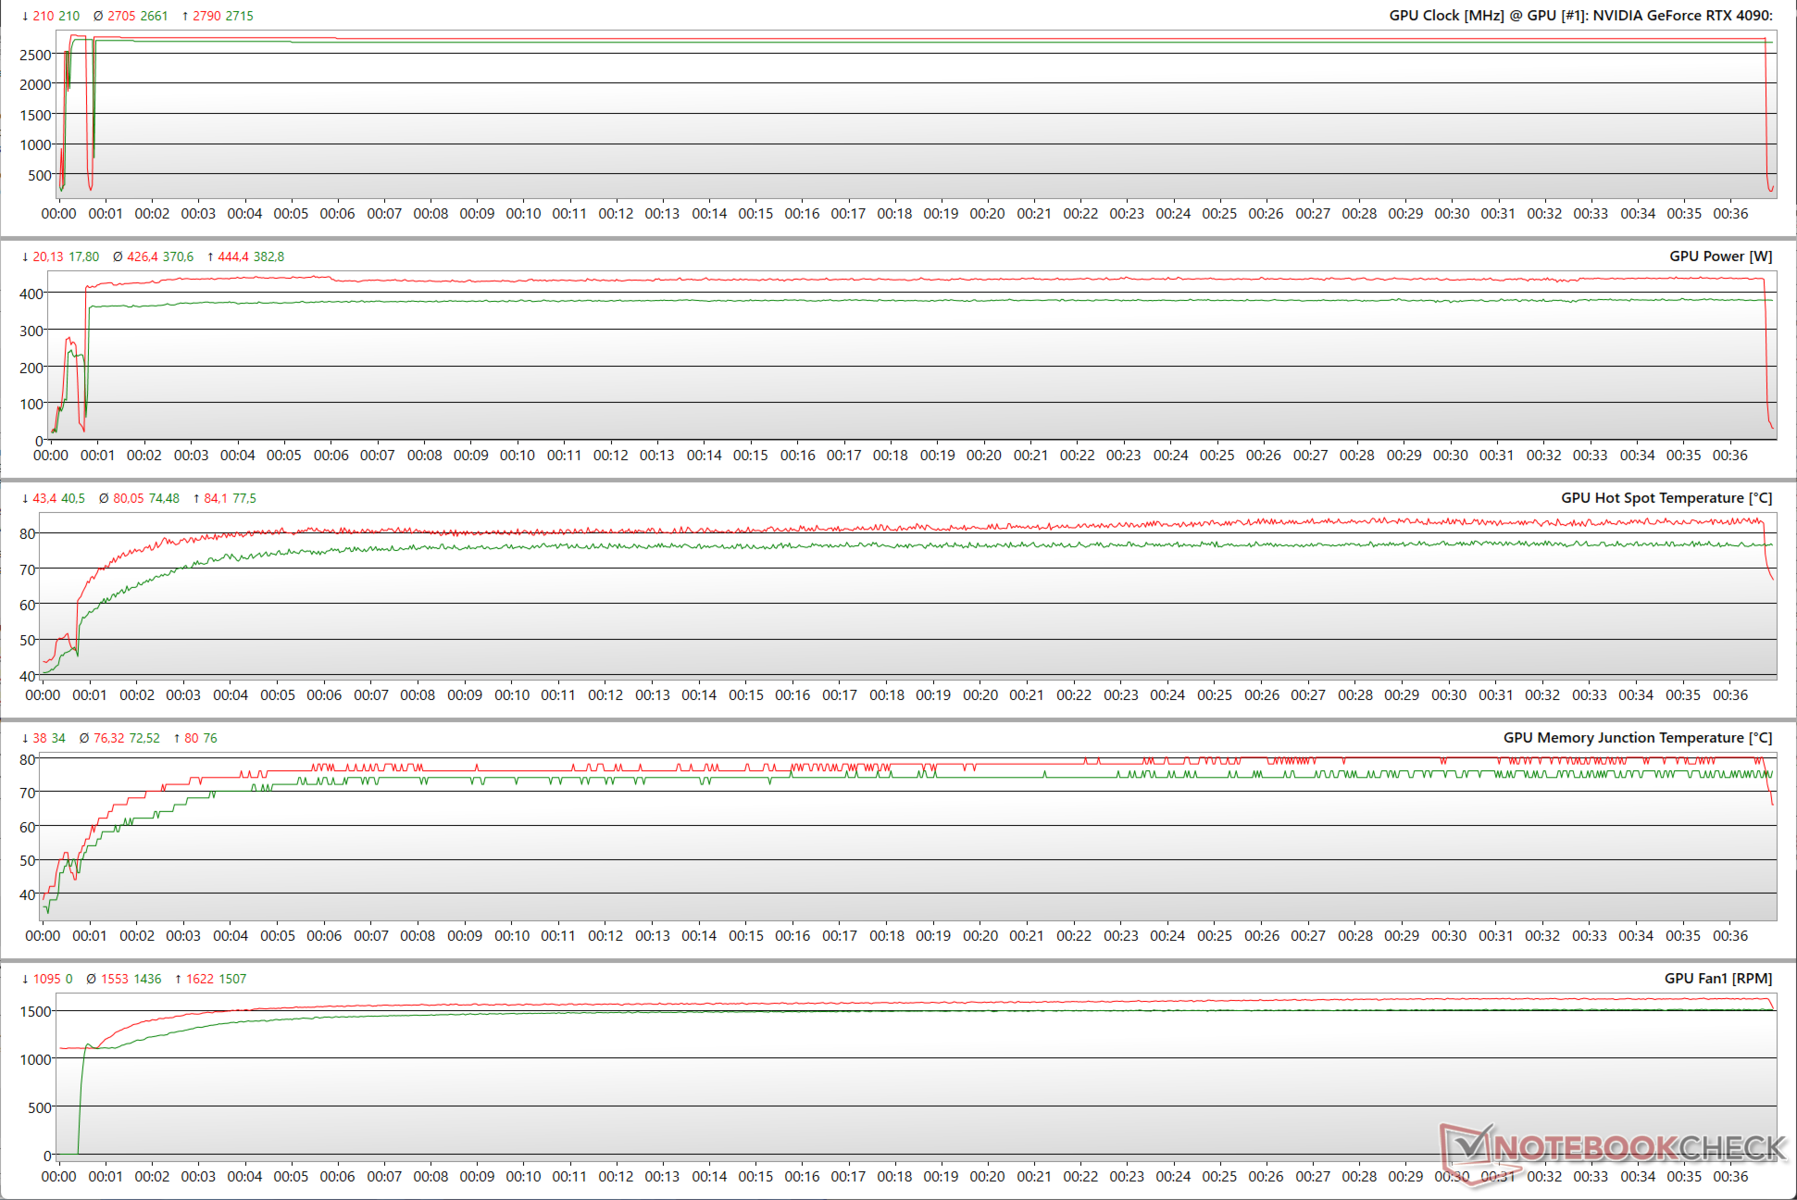
Stressing with The Witcher 3 at 4K Ultra results in the TGP increasing to 382 W max in default mode and close to 445 W in OC. We did not observe much difference in clocks in either setting. However, the hot spot temperature in this stress hit a maximum of 77.5 °C without OC.
The Witcher 3 FPS Chart
The Witcher 3 shows generally stable frame rates at both 1080p Ultra and 4K Ultra, which indicates that the card's cooling system is enabling it to perform at its full potential without throttling.
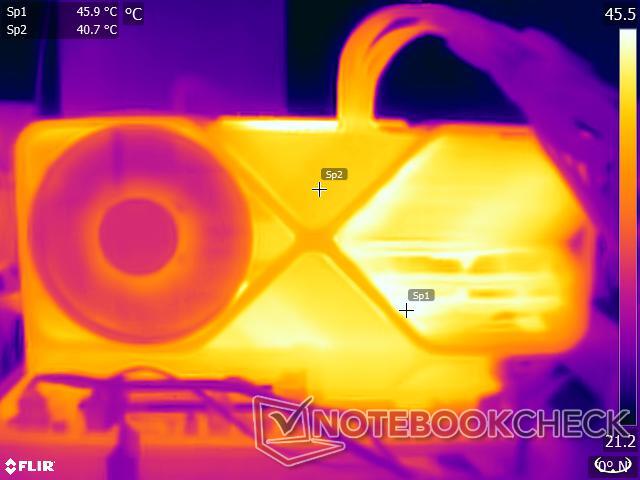
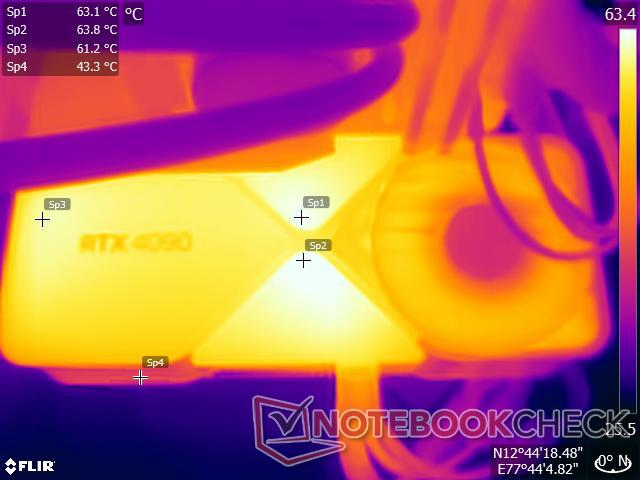
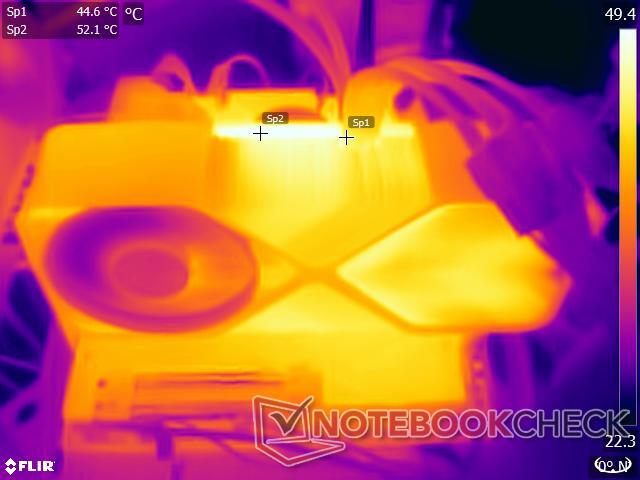
Surface temperatures
Thanks to the efficient cooling and heat dissipation, surface temperatures on the RTX 4090 FE are very much tolerable. We recorded close to just 64 °C as the maximum surface temperature under stress at an ambient temperature of about 23 °C. The temperature near the power adaptor was relatively cool, close to 45 °C, indicating no untoward signs of melting.
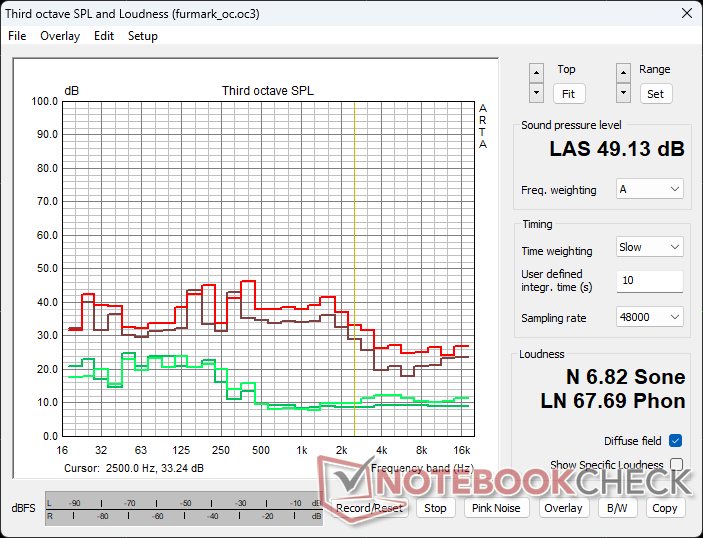
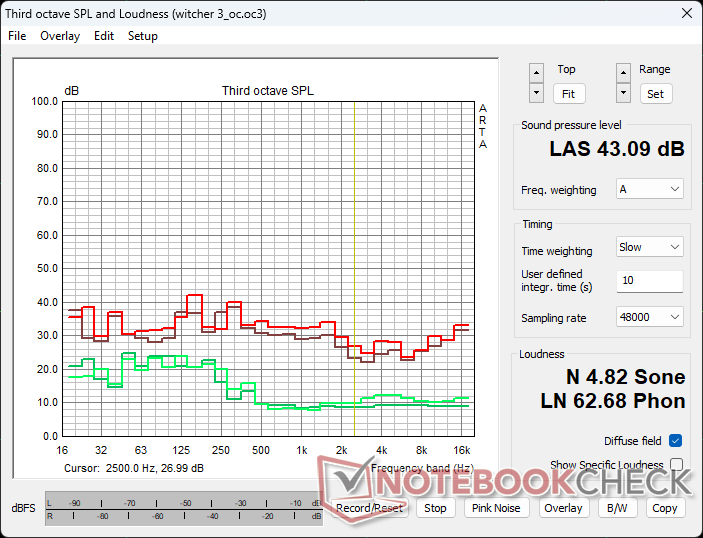
Noise levels
We measured fan noise at a fixed 20 cm from the test bench with all case fans turned off except the Cooler Master AIO pump. We recorded 22.1 dB(A) and 23.47 dB(A) as the ambient and system idle noises, respectively.
At 100% power, FurMark stress causes the fans to spin at a maximum of 53% of their rated speeds. This results in a noise emission of 44.42 dB(A). When overclocked at 133% power, the fans now spin at 65% resulting in a higher 49.13 dB(A) sound pressure level (SPL).
Similarly, at 100% power, The Witcher 3 at 1080p Ultra results in only 43% fan RPM and an SPL of 40.79 dB(A). When overclocked at 133% power, we observe a 47% max. fan RPM and a noise emission of 43.09 dB(A).
Nvidia implements a complete fan stop when the card is not taxed. All in all, the RTX 4090 FE has a subdued noise profile in default settings and this is one area where Nvidia Founders Edition cards can have a significant advantage over their AiB counterparts.
Power consumption: High energy bills in the offing
At stock settings, the total power consumption from the wall in FurMark is more or less on the lines of what we had previously seen with the RTX 3090 Ti and RX 6950 XT. When overclocked, the RTX 4090 FE can consume as much as 25% more power than the RX 6950 XT stock. Compared to an OC'd Zotac RTX 3090 Ti AMP Extreme Holo, the total power consumption with the RTX 4090 FE OC is about 9% higher.
In The Witcher 3 at 1080p Ultra, the RTX 4090 FE actually comes across as a more economical card compared to the RX 6950 XT with the latter having an 18% higher power consumption at stock settings, which is also about 7% higher compared to even an overclocked RTX 4090 FE.
Although Ada promises more performance at the same TGP as that of Ampere's, you should still be prepared to shell out for bloated energy bills with the RTX 4090 FE.
Power Consumption: External Monitor
* ... smaller is better
Pros
Cons
Verdict: One GPU to rule them all

By releasing the RTX 4090 earlier than mainstream cards such as the RTX 4080 and below, Nvidia wants to show the world how powerful its new Ada Lovelace architecture can get. Apart from massive increases in CUDA core, Tensor core, and RT core counts coupled with all the efficiency benefits of TSMC's custom 4N process, Ada also brings with it new graphics pipelines such as shader execution reordering, improved optical flow acceleration, and new RT core functions not present in Ampere.
The RTX 4090 Founders Edition features the same design language that has augured well for Nvidia previously with the RTX 3090 Founders Edition. This allows Nvidia to offer excellent thermal and noise performance that sets a benchmark for AiB partner cards.
The RTX 4090 FE lets the numbers speak for themselves. It is indubitably the coveted hero GPU of this generation that will remain uncontested for a long time to come."
Though issues pertaining to the new 12VHPWR connector are concerning, it is good to see Nvidia finally offer some respite for affected users. Performance numbers need no further explanation, but it is recommended to see how much of a benefit your specific workflow would gain before splurging on this card.
To get the most out of the RTX 4090, you should ensure there are absolutely no bottlenecks anywhere in the system. Even the latest Intel 13th gen and AMD Ryzen 7000 chips may find themselves unable to keep the RTX 4090 well-fed depending on the game and resolution settings.
All these performance gains do not come cheaply, however. You may find yourself investing in a complete spec overhaul if your PC is a few years old. The power consumption is similar to the RTX 3090 Ti and RX 6950 XT at stock settings, but they are still on the higher side nevertheless.
The RTX 4090 is a Titan-class card and is better suited for professionals who also game. Mainstream gamers would do better with RTX 4080 and below series GPUs. AMD's confidence to outdo the RTX 4080 at a much lower price is also a positive sign, but we will reserve our judgement when we test the RX 7900 XT and the RX 7900 XTX.
We haven't touched upon aspects such as DLSS 3 image quality comparisons and performance of the dual NVENC encoders in this review. But for now, it is not hyperbole to say that the RTX 4090 will be looked up to by other GPUs both in-house and from the competition.
For a US$1,599 MSRP that is actually US$400 less than what the RTX 3090 Ti FE cost back in the day, this is quite a significant achievement.
Price and Availability
The Nvidia GeForce RTX 4090 can be purchased from all major PC e-tailers and brick and mortar stores across the world in both Founders Edition and AiB formats but stocks are still an issue. Currently, Best Buy is offering the RTX 4090 Founders Edition at US$1,599 MSRP but stocks appear sold out at the time of writing.
In India, the RTX 4090 FE retails at a ₹1,55,000 MSRP. However, RP Tech is offering the card for ₹1,58,000 and is the sole distributor of Founders Edition cards in the country. The cards are out of stock at the moment, but prospective buyers can file an online request and await their turn patiently for an email invite with a purchase link.
More articles related to this device
NVIDIA GeForce RTX 4090 Founders Edition (GeForce RTX Series)Related Articles


Price comparison
