 Deutsch
 English
 Español
 Français
 Italiano
 Nederlands
 Polski
 Português
 Русский
 Türkçe
 Svenska
 Chinese
 Magyar
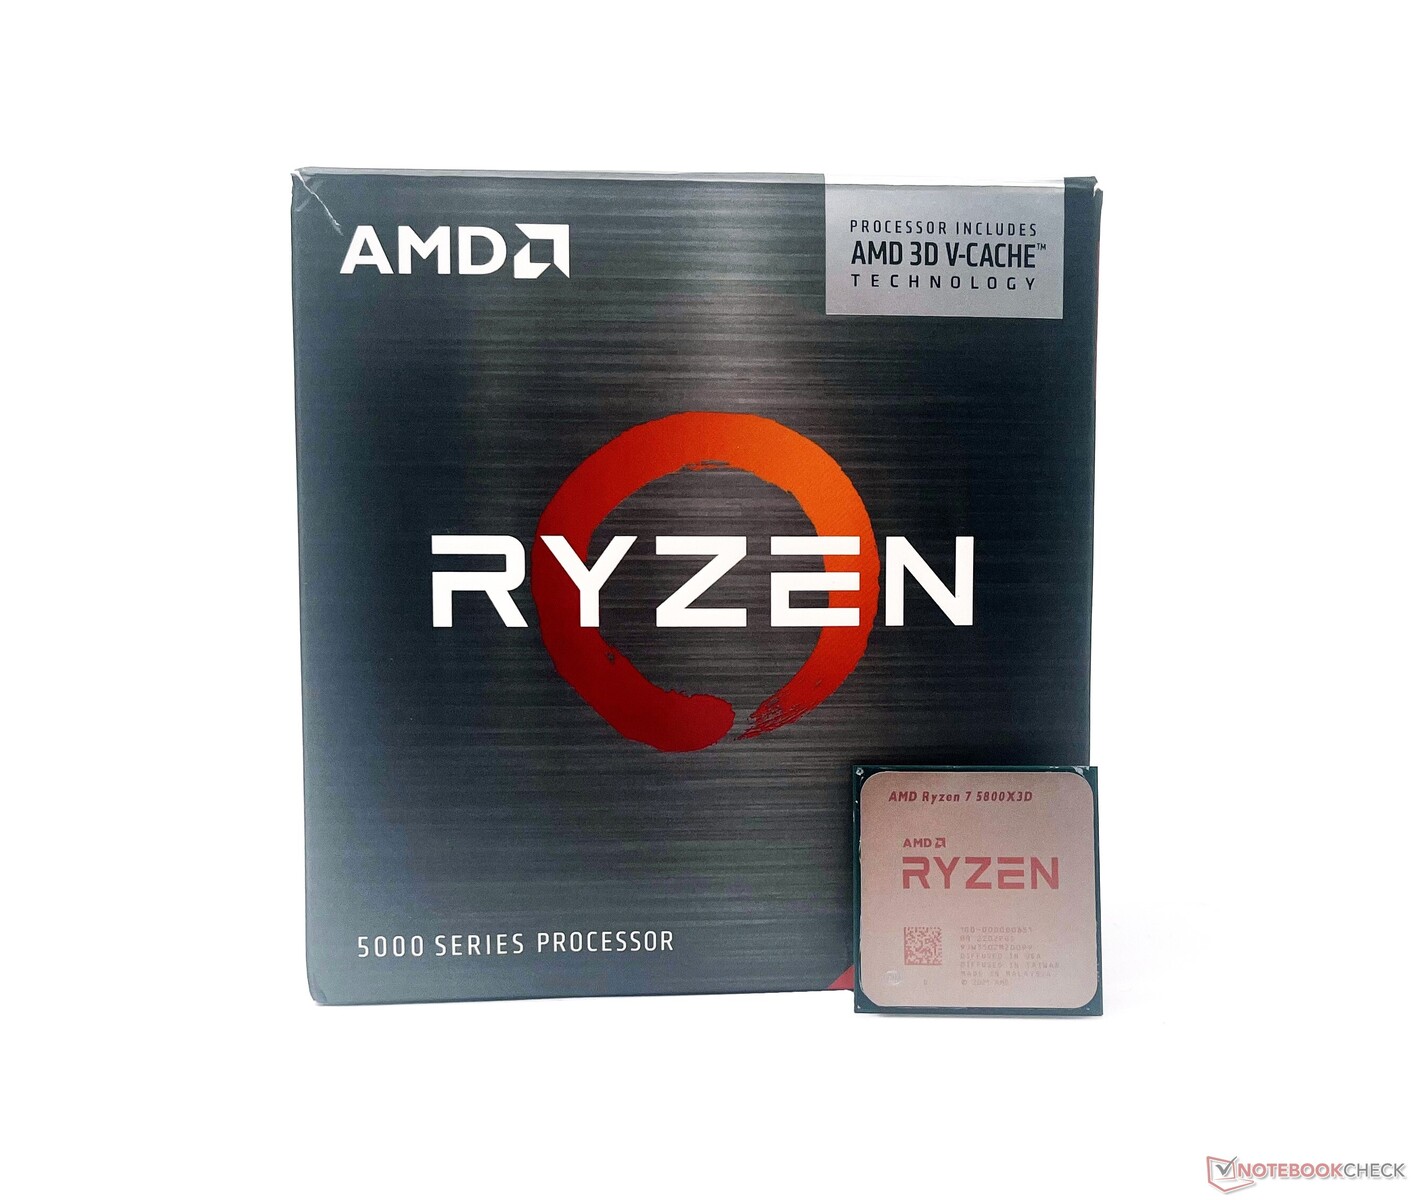
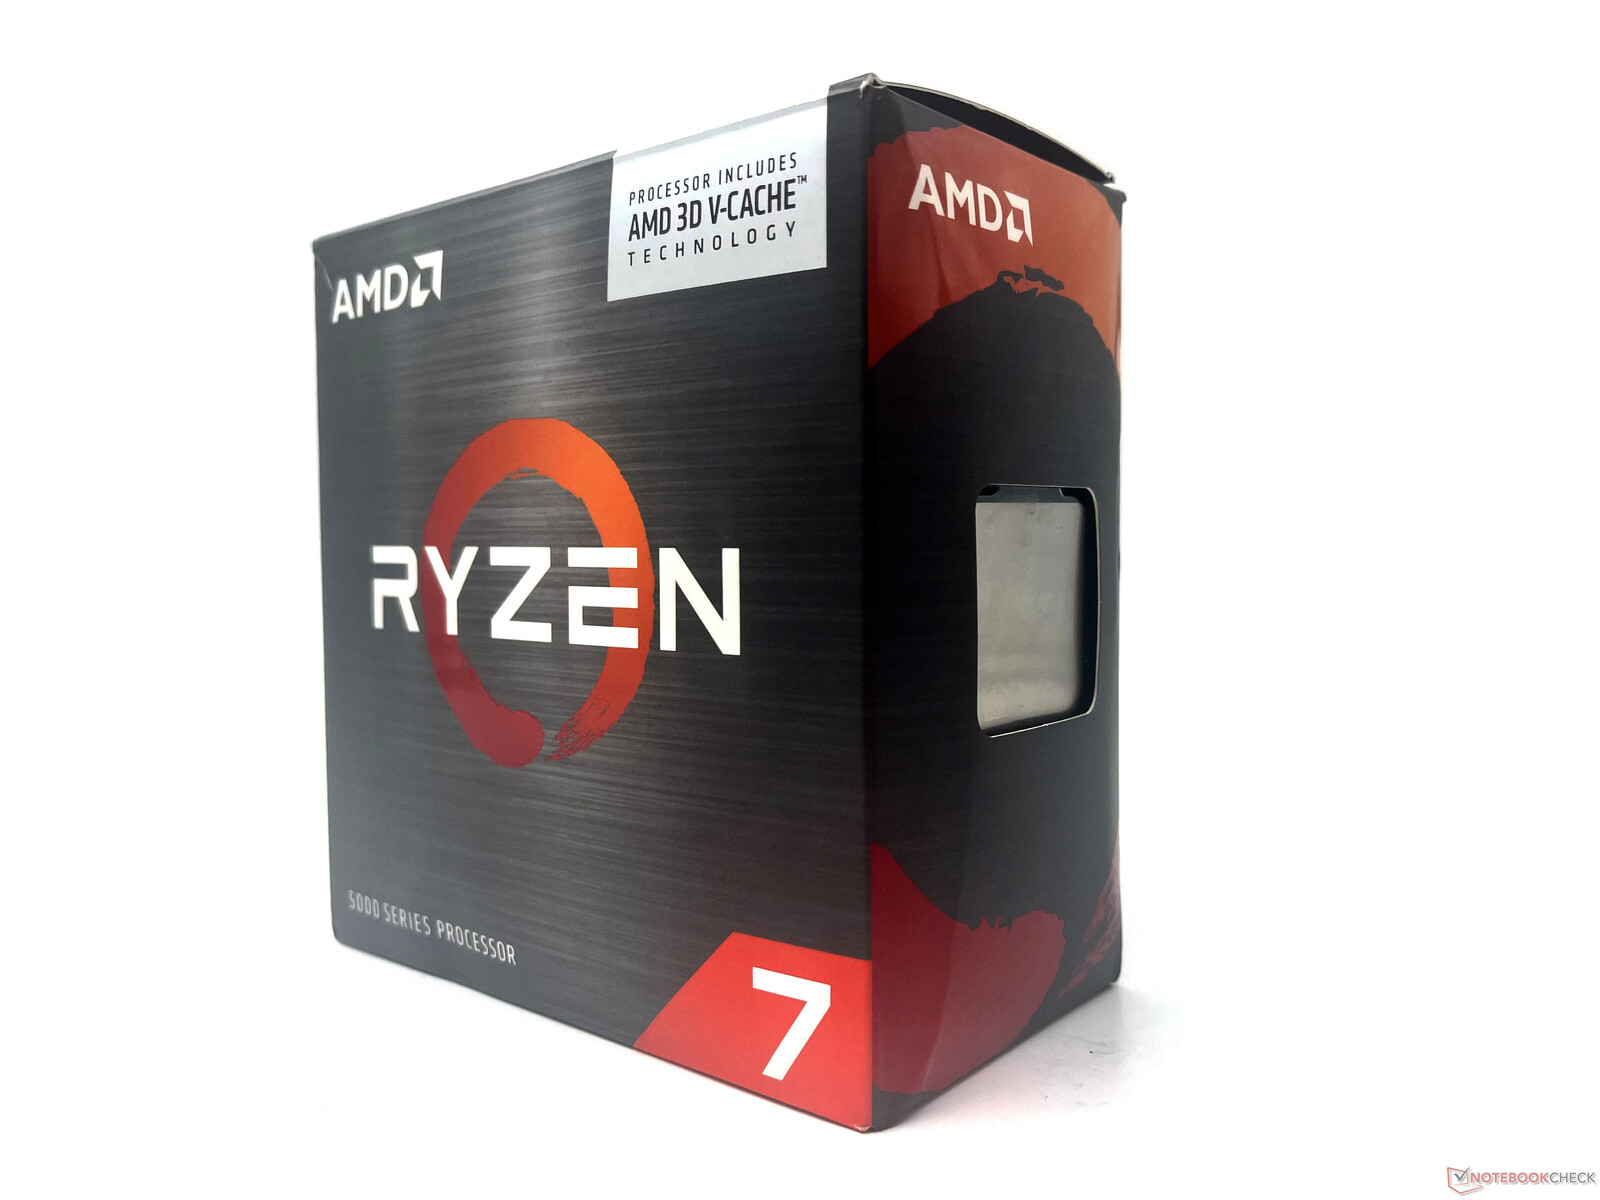
AMD Ryzen 7 5800X3D Review: Better gaming CPU than Core i9-12900K for US$120 less
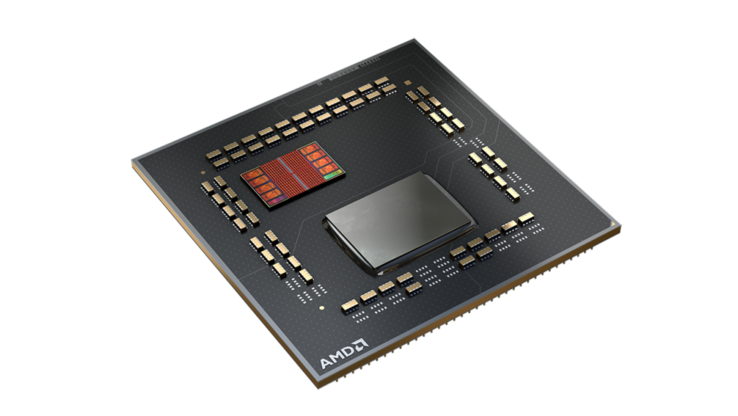
AMD has finally transitioned to a new socket and chipset platform with the Ryzen 7000 series, but the company is still looking to milk the maximum out of socket AM4. AMD first announced its 3D V-cache design based on TSMC's 3DFabric packaging technology at Computex 2021, showing massive improvements in gaming performance at 1080p.
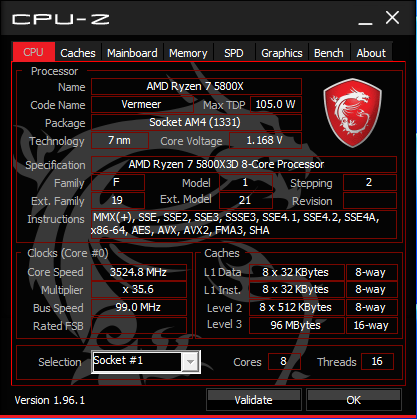
Fast forward to CES 2022, and AMD unveiled the Ryzen 7 5800X3D — an 8-core 16-thread 105 W processor with an added 64 MB of 3D V-Cache in addition to the 32 MB of existing 2D cache.
While AMD has had a home run with the Zen 3 Vermeer lineup for the most part, Intel quickly took a hop with the Alder Lake hybrid Core architecture led by the Core i9-12900K and later, the Core i9-12900KS.
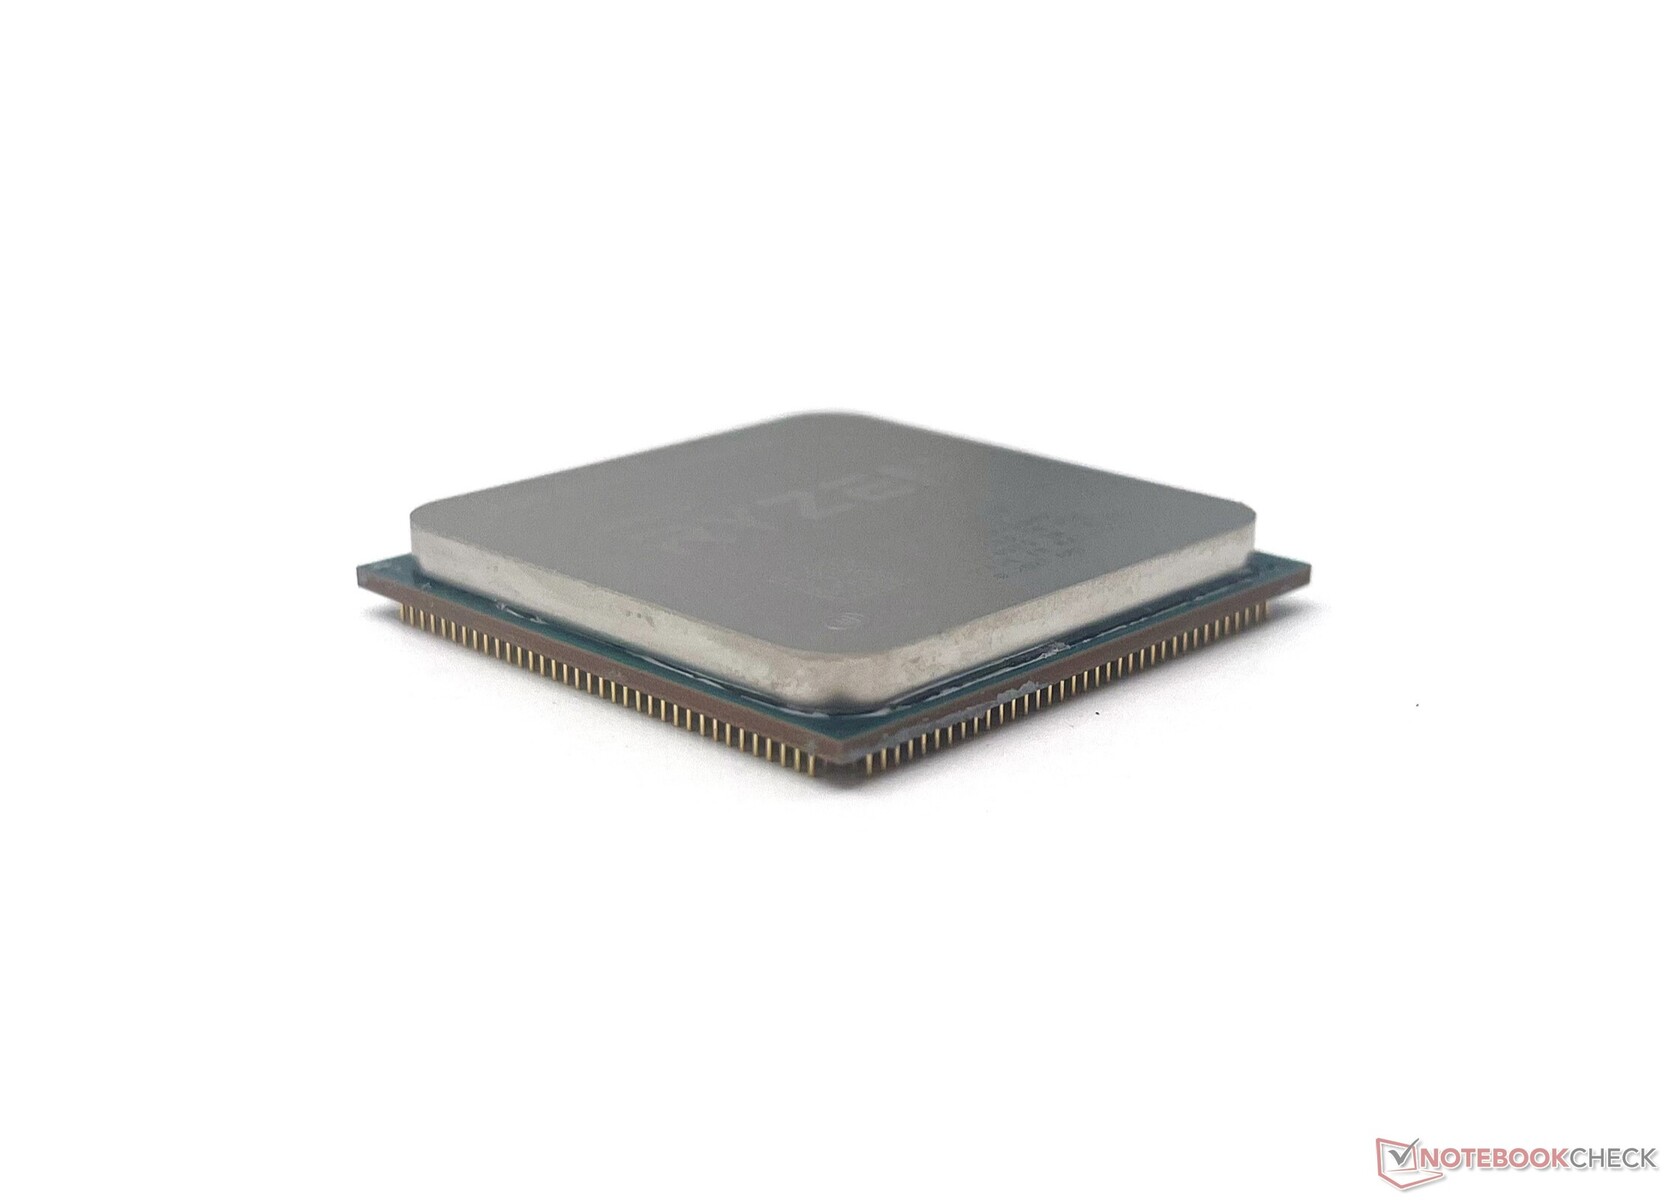
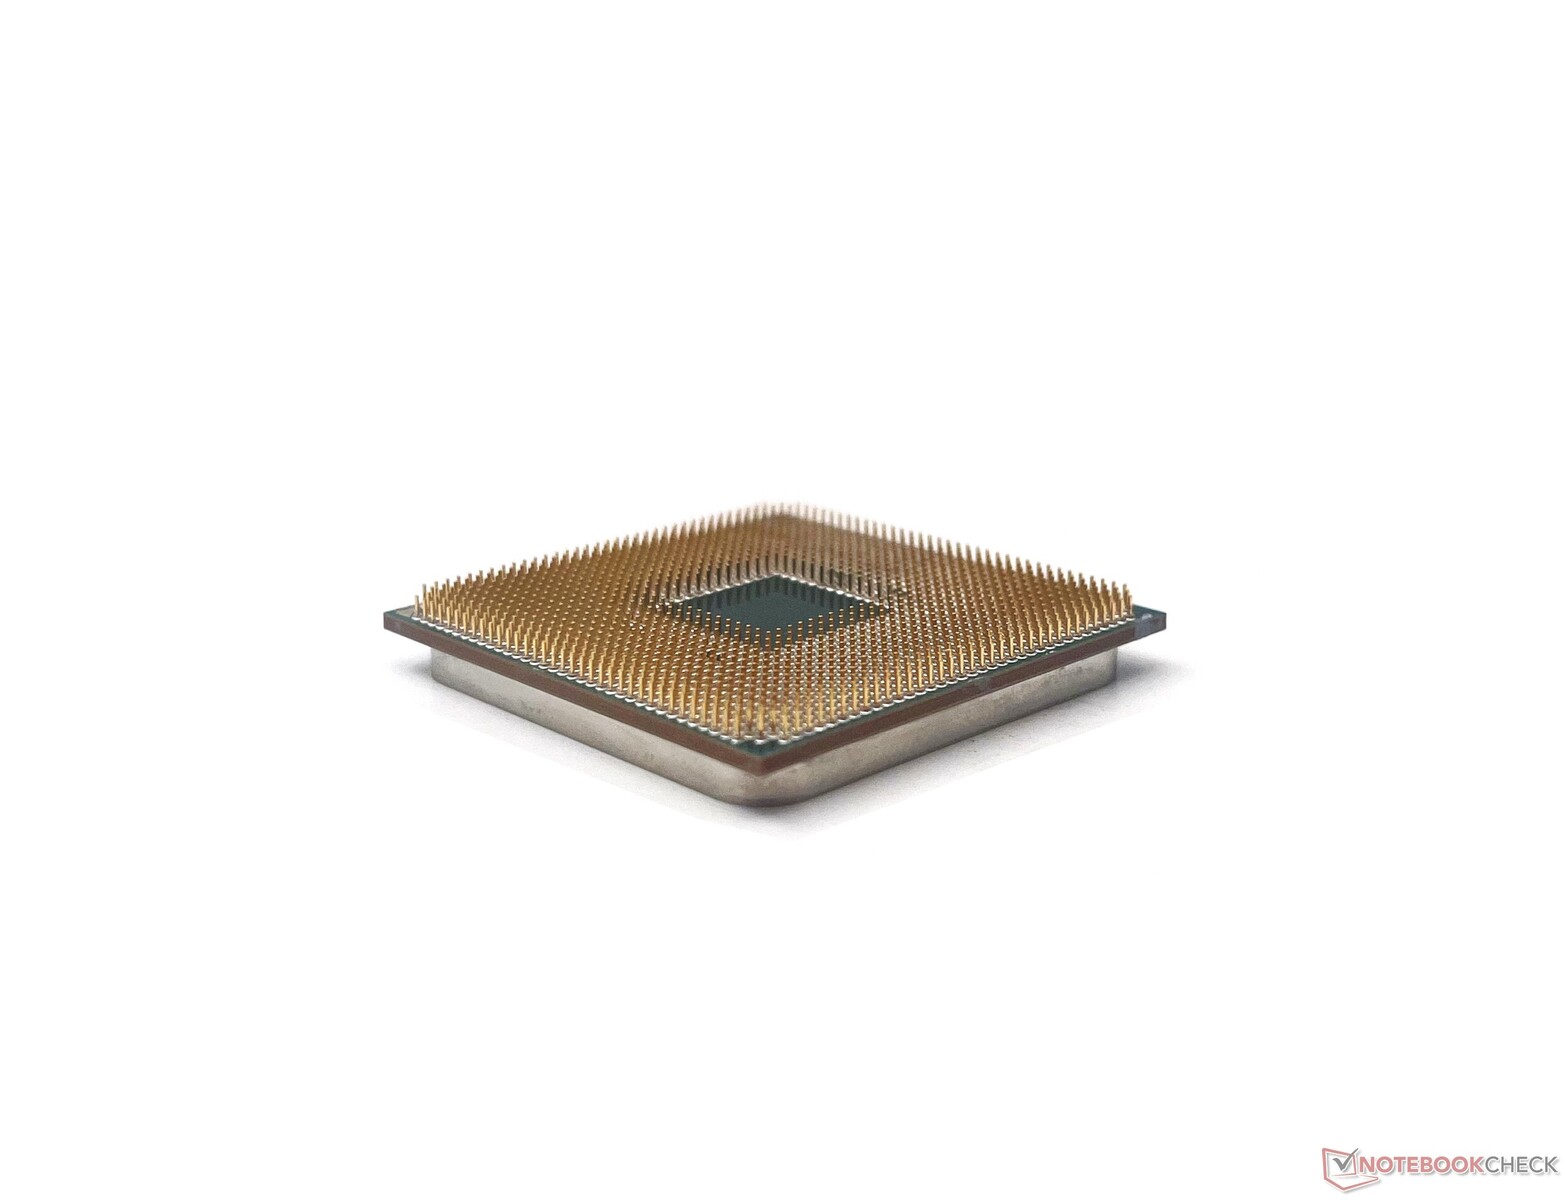
Despite sporting new cache technology, the Ryzen 7 5800X3D looks exactly identical to other Zen 3 processors, including sporting the same Z-height. Therefore, existing socket AM4 coolers work just fine with this CPU.
In this review, we take a look at the AMD Ryzen 7 5800X3D, see how well it stacks up to the current Alder Lake competition from Intel, and whether this is an investment you should be contemplating upon in 2022.
The AMD Ryzen Zen 3 Vermeer desktop CPU lineup
| SKU | Cores/Threads | Base Clock (GHz) | Turbo Clock (GHz) | L3-Cache (MB) | TDP (W) | MSRP at Launch (US$) |
|---|---|---|---|---|---|---|
| Ryzen 9 5950X | 16/32 | 3.4 | 4.9 | 64 | 105 | 799 |
| Ryzen 9 5900X | 12/24 | 3.7 | 4.8 | 64 | 105 | 549 |
| Ryzen 7 5800X3D | 8/16 | 3.4 | 4.5 | 32+64 | 105 | 449 |
| Ryzen 7 5800X | 8/16 | 3.8 | 4.7 | 32 | 105 | 449 |
| Ryzen 7 5700X | 8/16 | 3.4 | 4.6 | 32 | 65 | 299 |
| Ryzen 5 5600X | 6/12 | 3.7 | 4.6 | 32 | 65 | 299 |
| Ryzen 5 5600 | 6/12 | 3.5 | 4.4 | 32 | 65 | 199 |
The test bench: Ryzen 7 5800X3D meets the RTX 3090 Ti
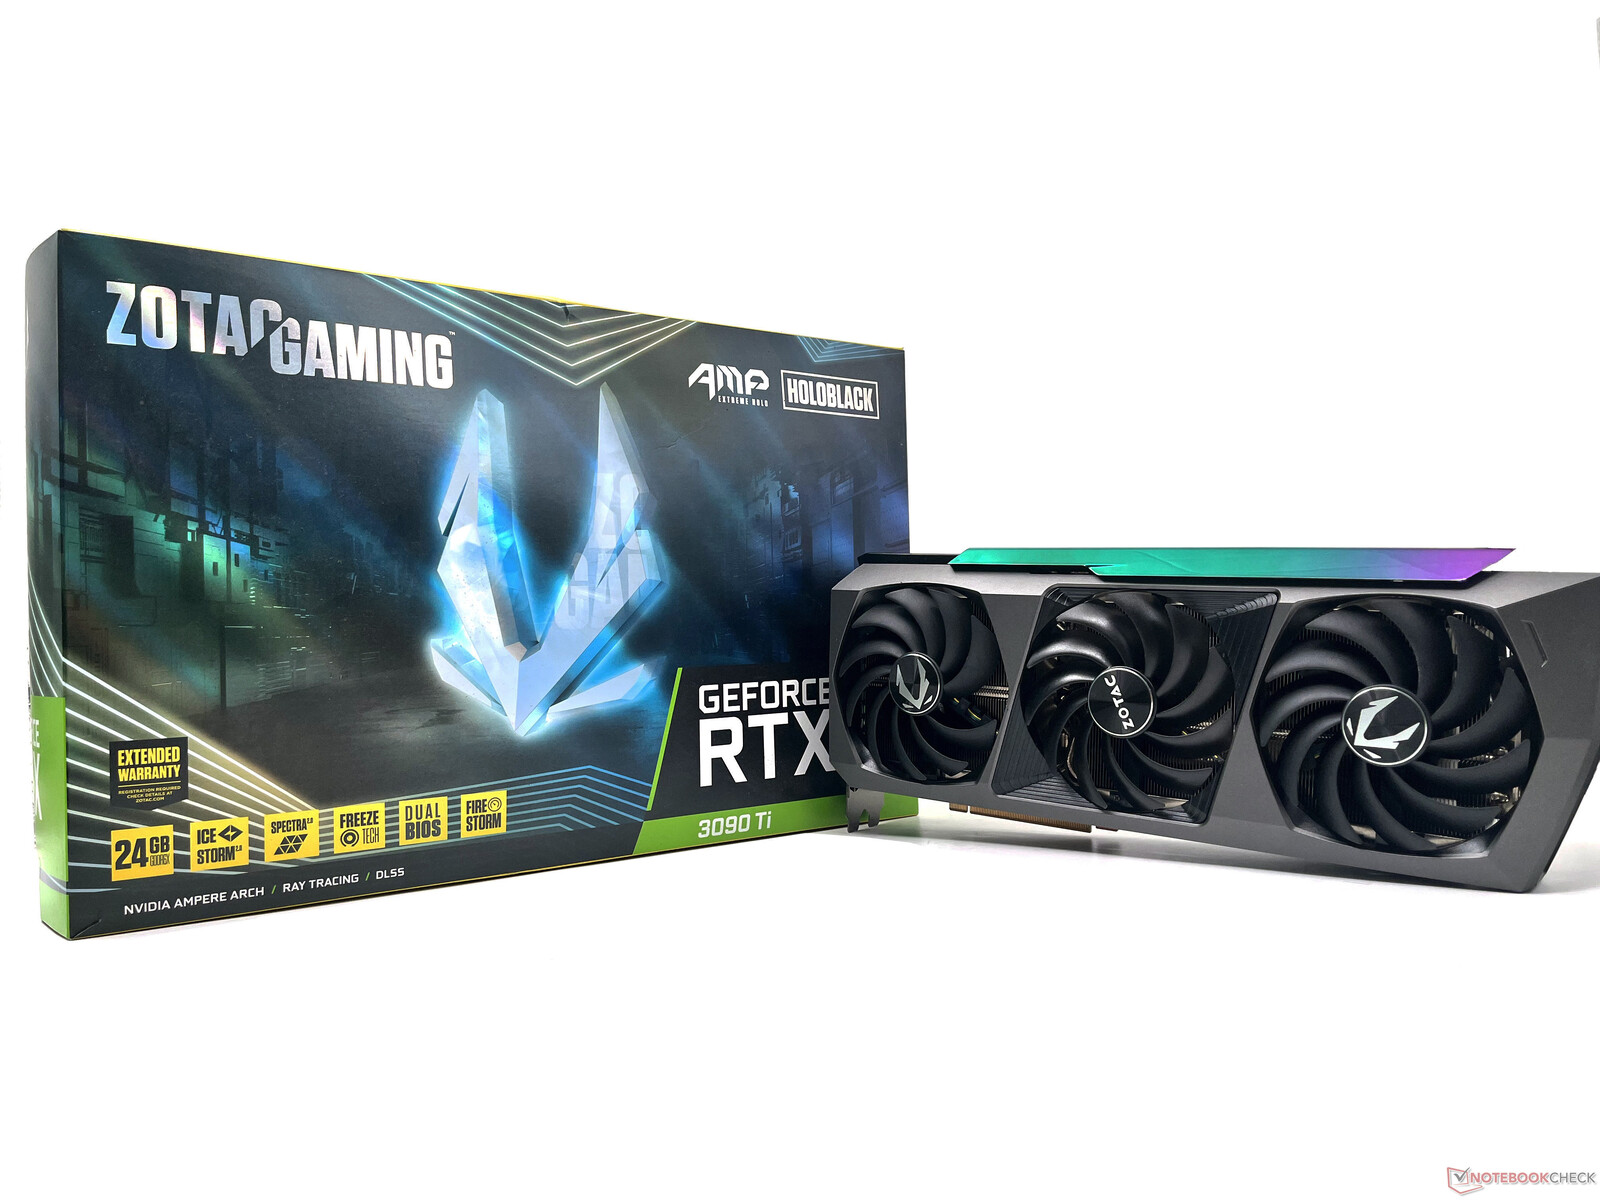
Our test bench is based on what we had used earlier for the Zotac Gaming GeForce RTX 3090 Ti AMP Extreme Holo GPU review. This includes the following:
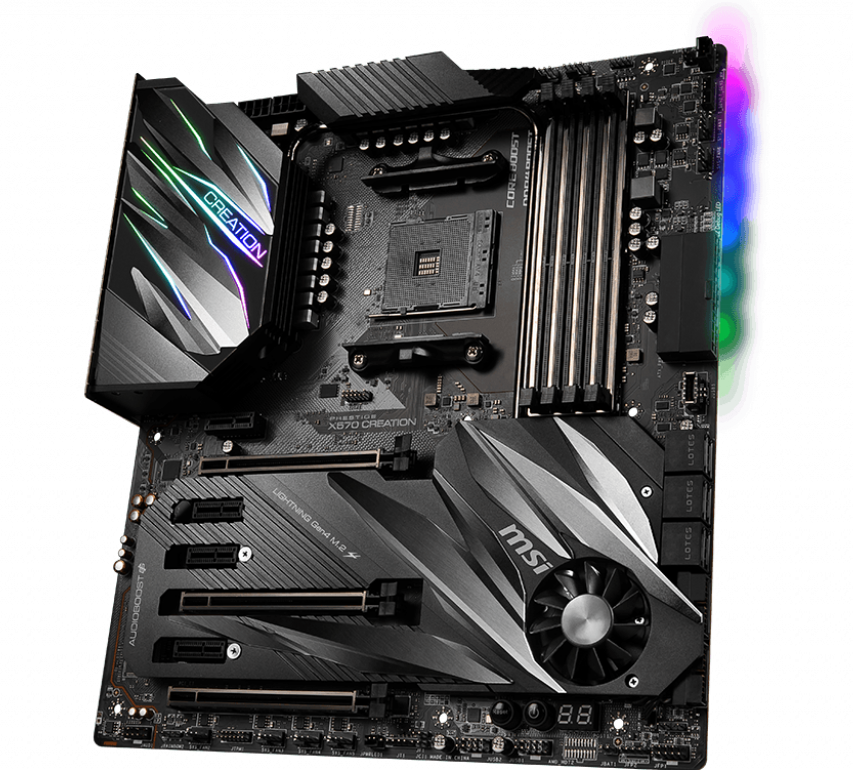
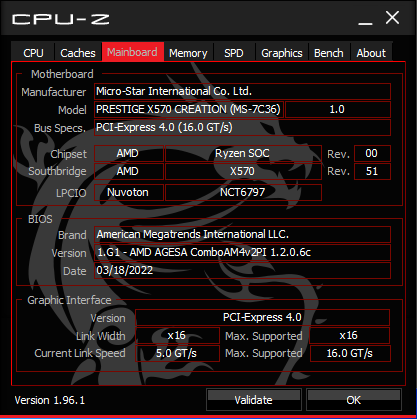
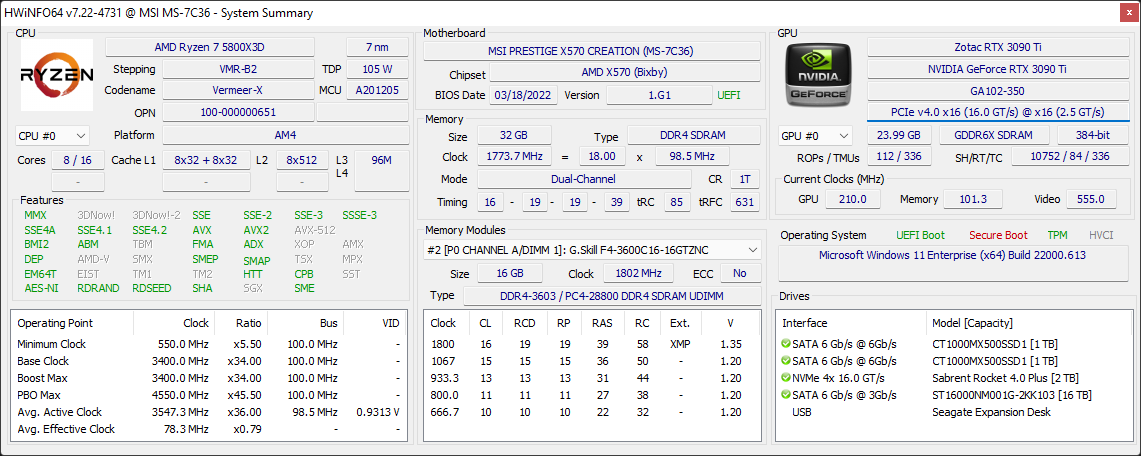
- MSI Prestige X570 Creation motherboard with AGESA 1.2.0.6c
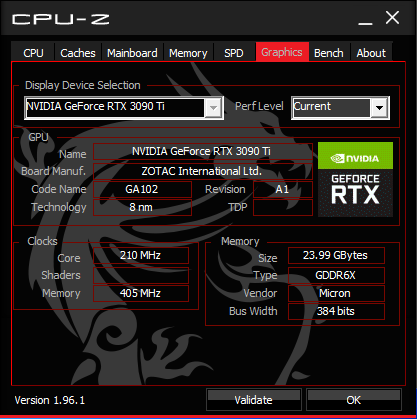
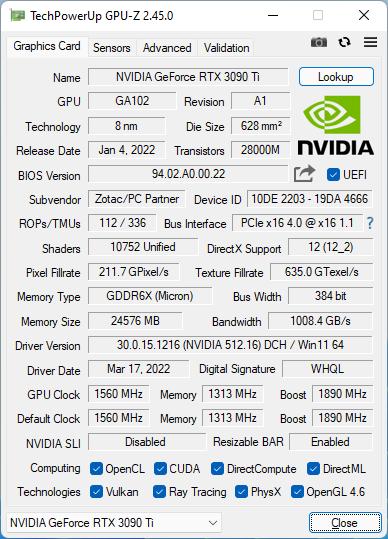
- Zotac Gaming GeForce RTX 3090 Ti AMP Extreme Holo GPU
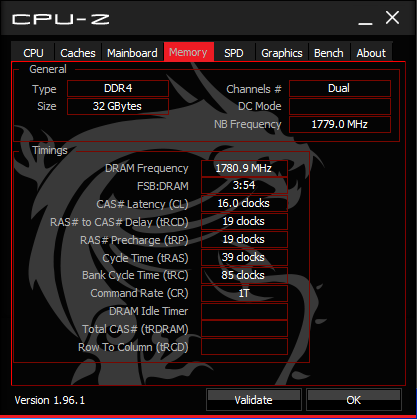
- 2x 16 GB G.SKILL Trident Z Neo DDR4-3600 RAM with timings 16-19-19-39
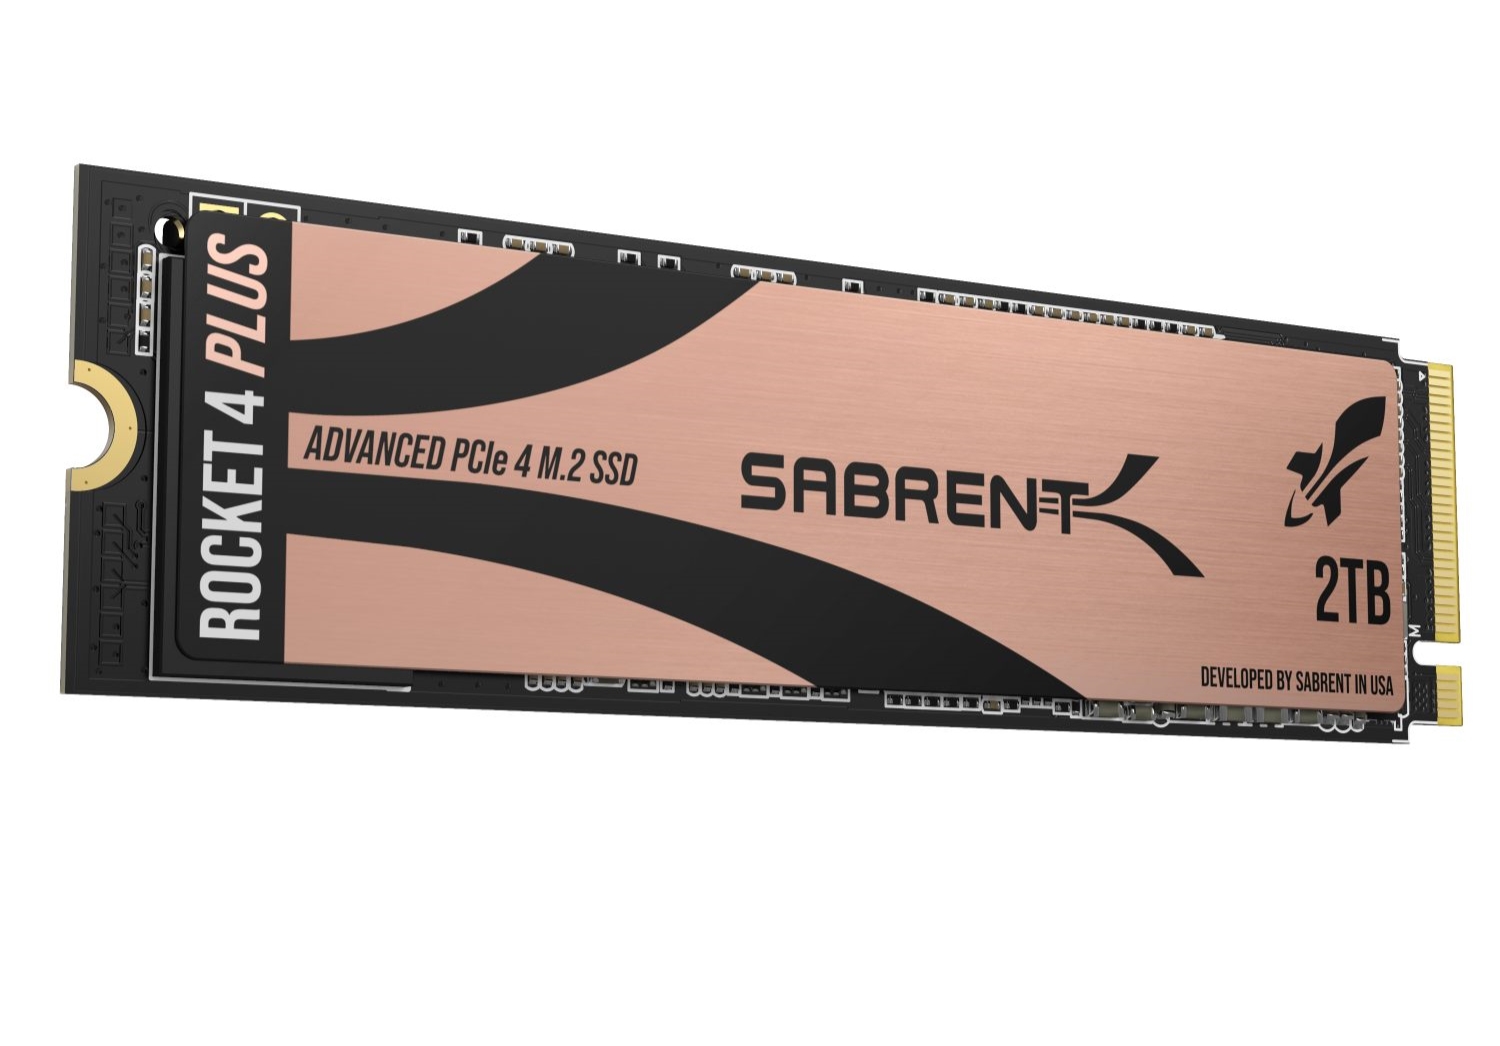
- 2 TB Sabrent Rocket 4 Plus Gen4 NVMe SSD
- 2x 1 TB Crucial MX500 SATA SSDs
- Thermaltake Toughpower 850 W Plus Gold PSU
- Corsair iCUE H115i Elite Capellix AIO cooler
- Corsair iCUE 4000X RGB case
- Gigabyte M28U 4K 144 Hz AMD FreeSync Premium Pro monitor
We would like to thank AMD for providing the Ryzen 7 5800X3D review sample, Nvidia for the Zotac RTX 3090 Ti GPU, Sabrent for the Rocket 4 Plus Gen4 SSD, Corsair for the iCUE H115i Elite Capellix Cooler and 4000X case, and Gigabyte for the M28U gaming monitor.
Synthetic benchmarks: Ryzen 7 5800X3D takes a back seat
Raw CPU performance is definitely not the Ryzen 7 5800X3D's forte. This is primarily due to a couple of reasons:
- The Ryzen 7 5800X3D is clocked lower — 400 MHz lower base and 200 MHz lower boost — than the Ryzen 7 5800X
- Though the 5800X3D supports memory and Infinity Fabric overclock, the added 3D V-Cache prevents any form of core overclocking, including Precision Boost Overdrive
Therefore, multi-core performance in Cinebench R15, R20, and R23 is about 6-10% slower compared to a Ryzen 7 5800X. In single-core, even the Ryzen 5 5600X is faster by about 6% compared to the 5800X3D.
A similar trend is reflected in other synthetic CPU benchmarks as well wherein the Ryzen 7 5800X gets a comfortable lead over the Ryzen 7 5800X3D save for the wPrime, 3DMark 11 Physics, and 3DMark Time Spy CPU tests.
The Intel Core i9-12900K, owing to its 16-core 24-thread configuration and a 5.1 GHz boost clock, maintains a comfortable lead in our tests without breaking a sweat.
| Blender - v2.79 BMW27 CPU | |
| AMD Ryzen 5 5600X | |
| AMD Ryzen 7 5800X3D | |
| AMD Ryzen 7 5800X | |
| Intel Core i5-12600K | |
| AMD Ryzen 9 5900X | |
| Intel Core i9-12900K | |
| AMD Ryzen 9 5950X | |
| WinRAR - Result | |
| AMD Ryzen 7 5800X | |
| AMD Ryzen 7 5800X3D | |
| AMD Ryzen 9 5900X | |
| AMD Ryzen 5 5600X | |
| AMD Ryzen 9 5950X | |
| Intel Core i9-12900K | |
| Intel Core i5-12600K | |
| HWBOT x265 Benchmark v2.2 - 4k Preset | |
| AMD Ryzen 9 5950X | |
| Intel Core i5-12600K | |
| Intel Core i9-12900K | |
| AMD Ryzen 9 5900X | |
| AMD Ryzen 7 5800X | |
| AMD Ryzen 7 5800X3D | |
| AMD Ryzen 5 5600X | |
| R Benchmark 2.5 - Overall mean | |
| AMD Ryzen 7 5800X3D | |
| AMD Ryzen 5 5600X | |
| AMD Ryzen 9 5950X | |
| AMD Ryzen 9 5900X | |
| AMD Ryzen 7 5800X | |
| Intel Core i5-12600K | |
| Intel Core i9-12900K | |
| LibreOffice - 20 Documents To PDF | |
| Intel Core i5-12600K | |
| AMD Ryzen 7 5800X3D | |
| AMD Ryzen 9 5900X | |
| AMD Ryzen 9 5950X | |
| AMD Ryzen 5 5600X | |
| AMD Ryzen 7 5800X | |
| Intel Core i9-12900K | |
| 3DMark 11 - 1280x720 Performance Physics | |
| Intel Core i9-12900K | |
| AMD Ryzen 7 5800X3D | |
| AMD Ryzen 9 5950X | |
| Intel Core i5-12600K | |
| AMD Ryzen 9 5900X | |
| AMD Ryzen 7 5800X | |
| AMD Ryzen 5 5600X | |
* ... smaller is better
The Corsair H115i Elite Capellix AIO cooler combined with the 280 mm radiator is able to do a fine job of keeping the Ryzen 7 5800X3D cool. We did not notice any throttling in our sustained Cinebench R15 multi-core loop test.
Application performance: No major qualms in daily productivity and certain creative workflows
The Ryzen 7 5800X3D is able to deftly handle daily productivity tasks as evidenced by PCMark 10 results. Its ranking at the bottom of the chart can be attributed to lower clocks, but we see only about an 8% performance deficit compared to the Ryzen 7 5800X.
Since we did not have a Titan RTX for this comparison, we had to make do with the RTX 3090 Ti as the GPU of choice. Though a Titan-class card on paper, the RTX 3090 Ti uses conventional GeForce drivers that leads to artificial performance penalties in some professional applications.
Nevertheless, the Ryzen 7 5800X3D and RTX 3090 Ti combination does lend itself to some good scores in certain subsets of the SPECviewperf tests such as 3ds Max, Maya, Showcase, and Medical.
| PCMark 10 Score | 7607 points | |
Help | ||
3D and gaming performance: Ryzen 7 5800X3D races past the Core i9-12900K at 1080p
AMD markets the Ryzen 7 5800X3D as primarily a gaming processor. While the 5800X3D clearly struggles in raw CPU performance, the tables turn when it comes to gaming applications. We see this particularly at lower resolutions such as 1080p.
The Ryzen 7 5800X3D+RTX 3090 Ti combo clearly leads the pack and even manages to convincingly beat the Core i9-12900K+Titan RTX configuration in a good majority of 3DMark and Unigine tests by a significant margin. Do note that the Ryzen 7 5800X3D still loses out to Intel Alder Lake offerings and most of its Zen 3 cousins in CPU-only aspects of these benchmarks as shown earlier. The RTX 3090 Ti seems to have contributed its muscle in these tests as it is clearly a far more powerful card than the Titan RTX we had used in previous reviews.
For a more detailed analysis of synthetic 3D benchmark results, we refer to our review of the Zotac GeForce RTX 3090 Ti AMP Extreme Holo GPU.
| 3DMark 11 Performance | 49471 points | |
| 3DMark Ice Storm Standard Score | 233264 points | |
| 3DMark Cloud Gate Standard Score | 75753 points | |
| 3DMark Fire Strike Score | 36563 points | |
| 3DMark Fire Strike Extreme Score | 24198 points | |
| 3DMark Time Spy Score | 19241 points | |
Help | ||
The Ryzen 7 5800X3D is the clear winner if you are looking for one of the fastest gaming CPUs available currently. Unfortunately, we could not source a Core i9-12900KS sample yet, so the below comparison is limited to the Core i9-12900K and the Core i5-12600K from Team Blue's stable.
Resolutions at 1080p stand to benefit the most with the increased cache as these settings are more CPU-limited compared to 2K and above. Accordingly, the Ryzen 7 5800X3D seems to be an ideal match for the RTX 3090 Ti for pushing as many frames as possible at this resolution. The uplift from the Core i9-12900K can be as high as 40% (Borderlands 3, 1080p Badass Quality) depending on the game and chosen quality settings.
| F1 2021 | |
| 1920x1080 Medium Preset AA:T AF:16x | |
| AMD Ryzen 7 5800X3D, NVIDIA GeForce RTX 3090 Ti | |
| AMD Ryzen 9 5900X, NVIDIA Titan RTX | |
| Intel Core i9-12900K, NVIDIA Titan RTX | |
| Intel Core i5-12600K, NVIDIA Titan RTX | |
| 1920x1080 High Preset AA:T AF:16x | |
| AMD Ryzen 7 5800X3D, NVIDIA GeForce RTX 3090 Ti | |
| AMD Ryzen 9 5900X, NVIDIA Titan RTX | |
| Intel Core i9-12900K, NVIDIA Titan RTX | |
| Intel Core i5-12600K, NVIDIA Titan RTX | |
| 1920x1080 Ultra High Preset + Raytracing AA:T AF:16x | |
| AMD Ryzen 7 5800X3D, NVIDIA GeForce RTX 3090 Ti | |
| AMD Ryzen 9 5900X, NVIDIA Titan RTX | |
| Intel Core i9-12900K, NVIDIA Titan RTX | |
| Intel Core i5-12600K, NVIDIA Titan RTX | |
| low | med. | high | ultra | QHD | 4K | |
| GTA V (2015) | 185.59 | 160.67 | 155.26 | 182.63 | ||
| The Witcher 3 (2015) | 394 | 193.4 | 172.9 | |||
| Dota 2 Reborn (2015) | 257.7 | 231.2 | 217.1 | 195.8 | 184.2 | |
| Final Fantasy XV Benchmark (2018) | 222 | 226 | 186.1 | 151.6 | 96.3 | |
| X-Plane 11.11 (2018) | 169.1 | 158.1 | 135.9 | 115.7 | ||
| Shadow of the Tomb Raider (2018) | 265 | 257 | 244 | 184 | 106 | |
| Metro Exodus (2019) | 213 | 175.2 | 145.9 | 125.3 | 84.3 | |
| Total War: Three Kingdoms (2019) | 342.6 | 248.9 | 176.6 | 117.9 | 59.9 | |
| Control (2019) | 240 | 209 | 142.5 | 73.9 | ||
| Borderlands 3 (2019) | 204 | 187.6 | 173.3 | 143.1 | 83.8 | |
| Mafia Definitive Edition (2020) | 240 | 231 | 173.9 | 99.2 | ||
| Watch Dogs Legion (2020) | 171.4 | 154.2 | 130.2 | 107.8 | 70.1 | |
| Assassin´s Creed Valhalla (2020) | 160 | 138 | 123 | 108 | 73 | |
| F1 2021 (2021) | 537 | 470 | 242 | 189.3 | 114.9 | |
| Far Cry 6 (2021) | 179 | 161.6 | 142 | 132.9 | 89.9 | |
| Call of Duty Vanguard (2021) | 195.5 | 207 | 191.2 | 149.9 | 93.7 | |
| Forza Horizon 5 (2021) | 231 | 200 | 188 | 127 | 114 | 89 |
| Rainbow Six Extraction (2022) | 411 | 347 | 315 | 290 | 208 | 116 |
| Dying Light 2 (2022) | 202 | 171.4 | 153 | 113.2 | 64.3 | |
| GRID Legends (2022) | 228 | 202 | 173.4 | 156.6 | 153.2 | 120.5 |
| Elden Ring (2022) | 60 | 60 | 60 | 60 | 60 | 60 |
| Cyberpunk 2077 1.6 (2022) | 219 | 201 | 172.8 | 151.8 | 103.9 | 53.3 |
| Ghostwire Tokyo (2022) | 263 | 260 | 261 | 261 | 210 | 113.2 |
| Tiny Tina's Wonderlands (2022) | 324 | 277 | 231 | 190.2 | 142.6 | 81.1 |
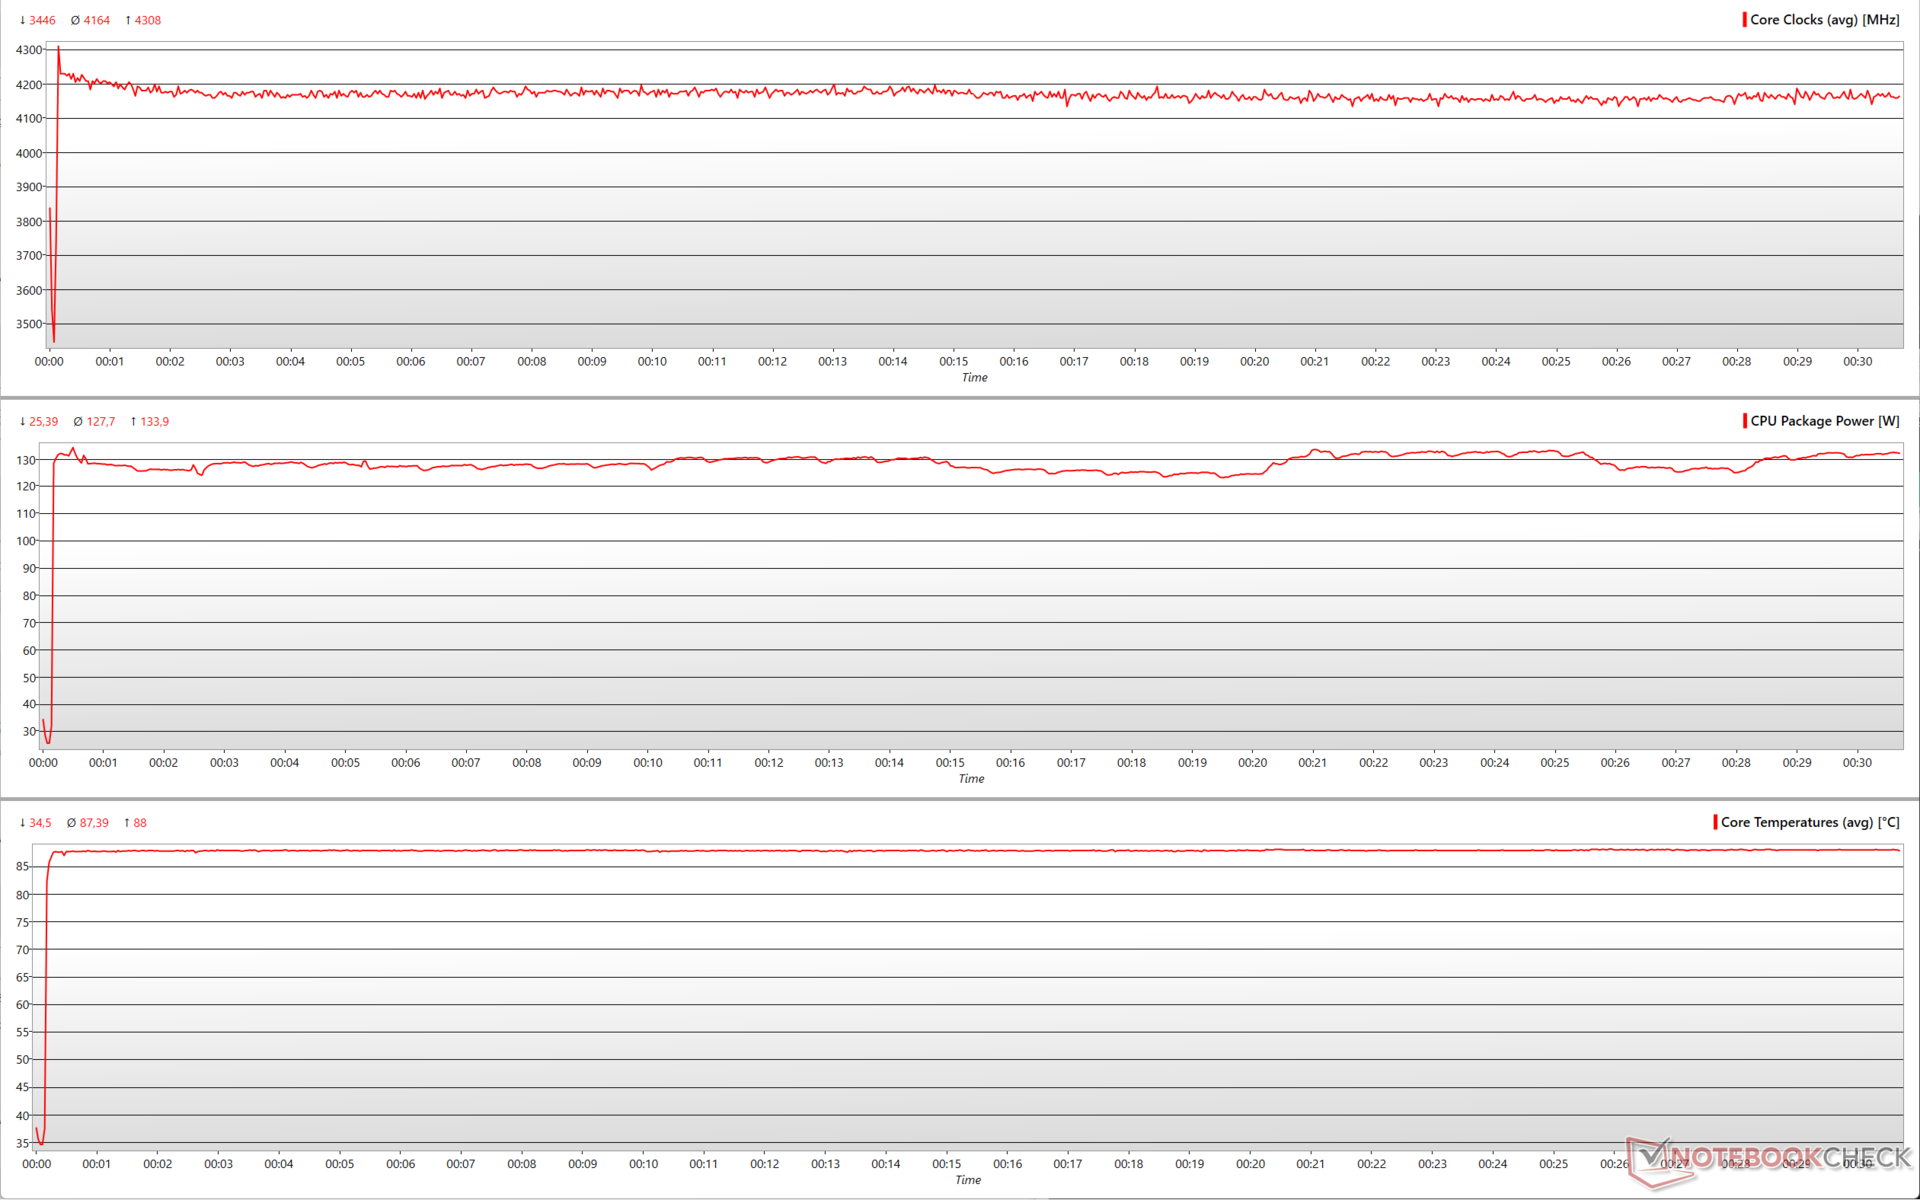
Stress test and temperatures: No throttling issues
Stressing the Ryzen 7 5800X3D with Prime95 sees the CPU package power coasting just above the 130 W mark and the clock speeds being fairly consistent close to 4.2 GHz. CPU temperatures hover near the 90 °C mark without throttling.
This consistency in performance was also previously seen in the Cinebench R15 multi-core loop test above. This can be attributed in part to the Ryzen 7 5800X3D and also in part to the excellent cooling performance of the Corsair H115i Elite Capellix AIO cooler.
Power consumption: Less economical than Core i5-12600K despite lower performance
Our test system consumes about 102 W in idle with a total of five case fans (three Corsair SP 120 mm case fans and two Corsair ML 120 mm radiator fans) and the Elite Capellix cooler running in the Balanced profile. All RGB lighting was turned off.
Power consumption is more or less similar to the Ryzen 9 5900X and about 29% higher than the Ryzen 5 5600X in Prime95 in-place FFT stress. Cinebench R15 multi-core sees the Ryzen 7 5800X3D being slightly less economical than the Core i5-12600K even though AMD's chip shows a 6% performance deficit. A similar profile is seen with Cinebench R20 multi as well, this time with an even greater performance gap of 18% compared to the Core i5-12600K.
The Ryzen 7 5800X3D lags behind the Core i9-12900K by 26% in Cinebench R20 single-core but seems to consume slightly more power. In general, however, the total system power consumption with the Ryzen 7 5800X3D is still limited to around the 230 W mark whereas the Core i9-12900K-powered PC can guzzle nearly 57% more power in multi-core CPU tests.
Power Consumption: External Monitor
* ... smaller is better
Pros
Cons
Verdict: Strictly for gamers and OG Zen users only

AMD has held on socket AM4 for long. Even with the launch of the Ryzen 7000 series on socket AM5, the company expects the older socket to perform well for the most part. The Ryzen 7 5800X3D is more of a test bed for AMD, learnings from which will be incorporated in future iterations. That being said, the Ryzen 7 5800X3D clearly appears to be a great choice if your primary use case is gaming, particularly at lower resolutions.
The use of a 3D stacked-cache does give games significant headroom. However, it brings with it several pitfalls including not being able to overclock the cores themselves and lower base/boost clocks to ensure that the TDP does not go beyond 105 W.
3D V-cache is an ingenious way to improve gaming performance without increasing the TDP. Gamers will find 3D V-cache useful in pushing higher frames than the Core i9-12900K for about US$120 less. For all other tasks, the lower clocks and lack of overclocking prove to be major limitations.
The Ryzen 7 5800X3D suffers when it comes to raw CPU performance when compared with its siblings from the Zen 3 family, and definitely loses to the Alder Lake Core i5-12600K and Core i9-12900K processors. The flip side is that this performance deficit is not accompanied by lower power consumption.
Though we see the Ryzen 7 5800X3D lagging when it comes to the Physics component of synthetic 3D benchmarks, the processor begins to show its worth in the graphics components of these tests. Gaming at 1080p or QHD is the best use case for this processor. Coupled with the right GPU, the Ryzen 7 5800X3D can push frames much more than is possible with the Core i9-12900K.
This begets the question. Is this CPU worth upgrading to?
Socket AM4 is now a highly stable platform. It is still early days for socket AM5 and users would want to wait and see how the new Ryzen 7000 CPUs would perform in real-world tests and also find out the best possible DDR5 memory combinations before taking the plunge.
Gamers still on older generation Zen processors, like a Ryzen 7 2700X for example, will find the Ryzen 7 5800X3D a worthy upgrade and will gladly pocket the US$120 savings in comparison to the Core i9-12900K in addition to saving on motherboard upgrades (assuming your current board still offers decent power delivery). However, content creators and those who need a better all-round performer might want to seek other options such as the Ryzen 7 5800X for the same MSRP of US$449.
The Core i5-12600K is an even better bargain at just US$289 MSRP provided investing additionally in Intel's ecosystem is not a constraint.
Price and availability
More articles related to this device
AMD Ryzen 7 5800X3D (Ryzen 7 Series)Related Articles


Pricecompare
