

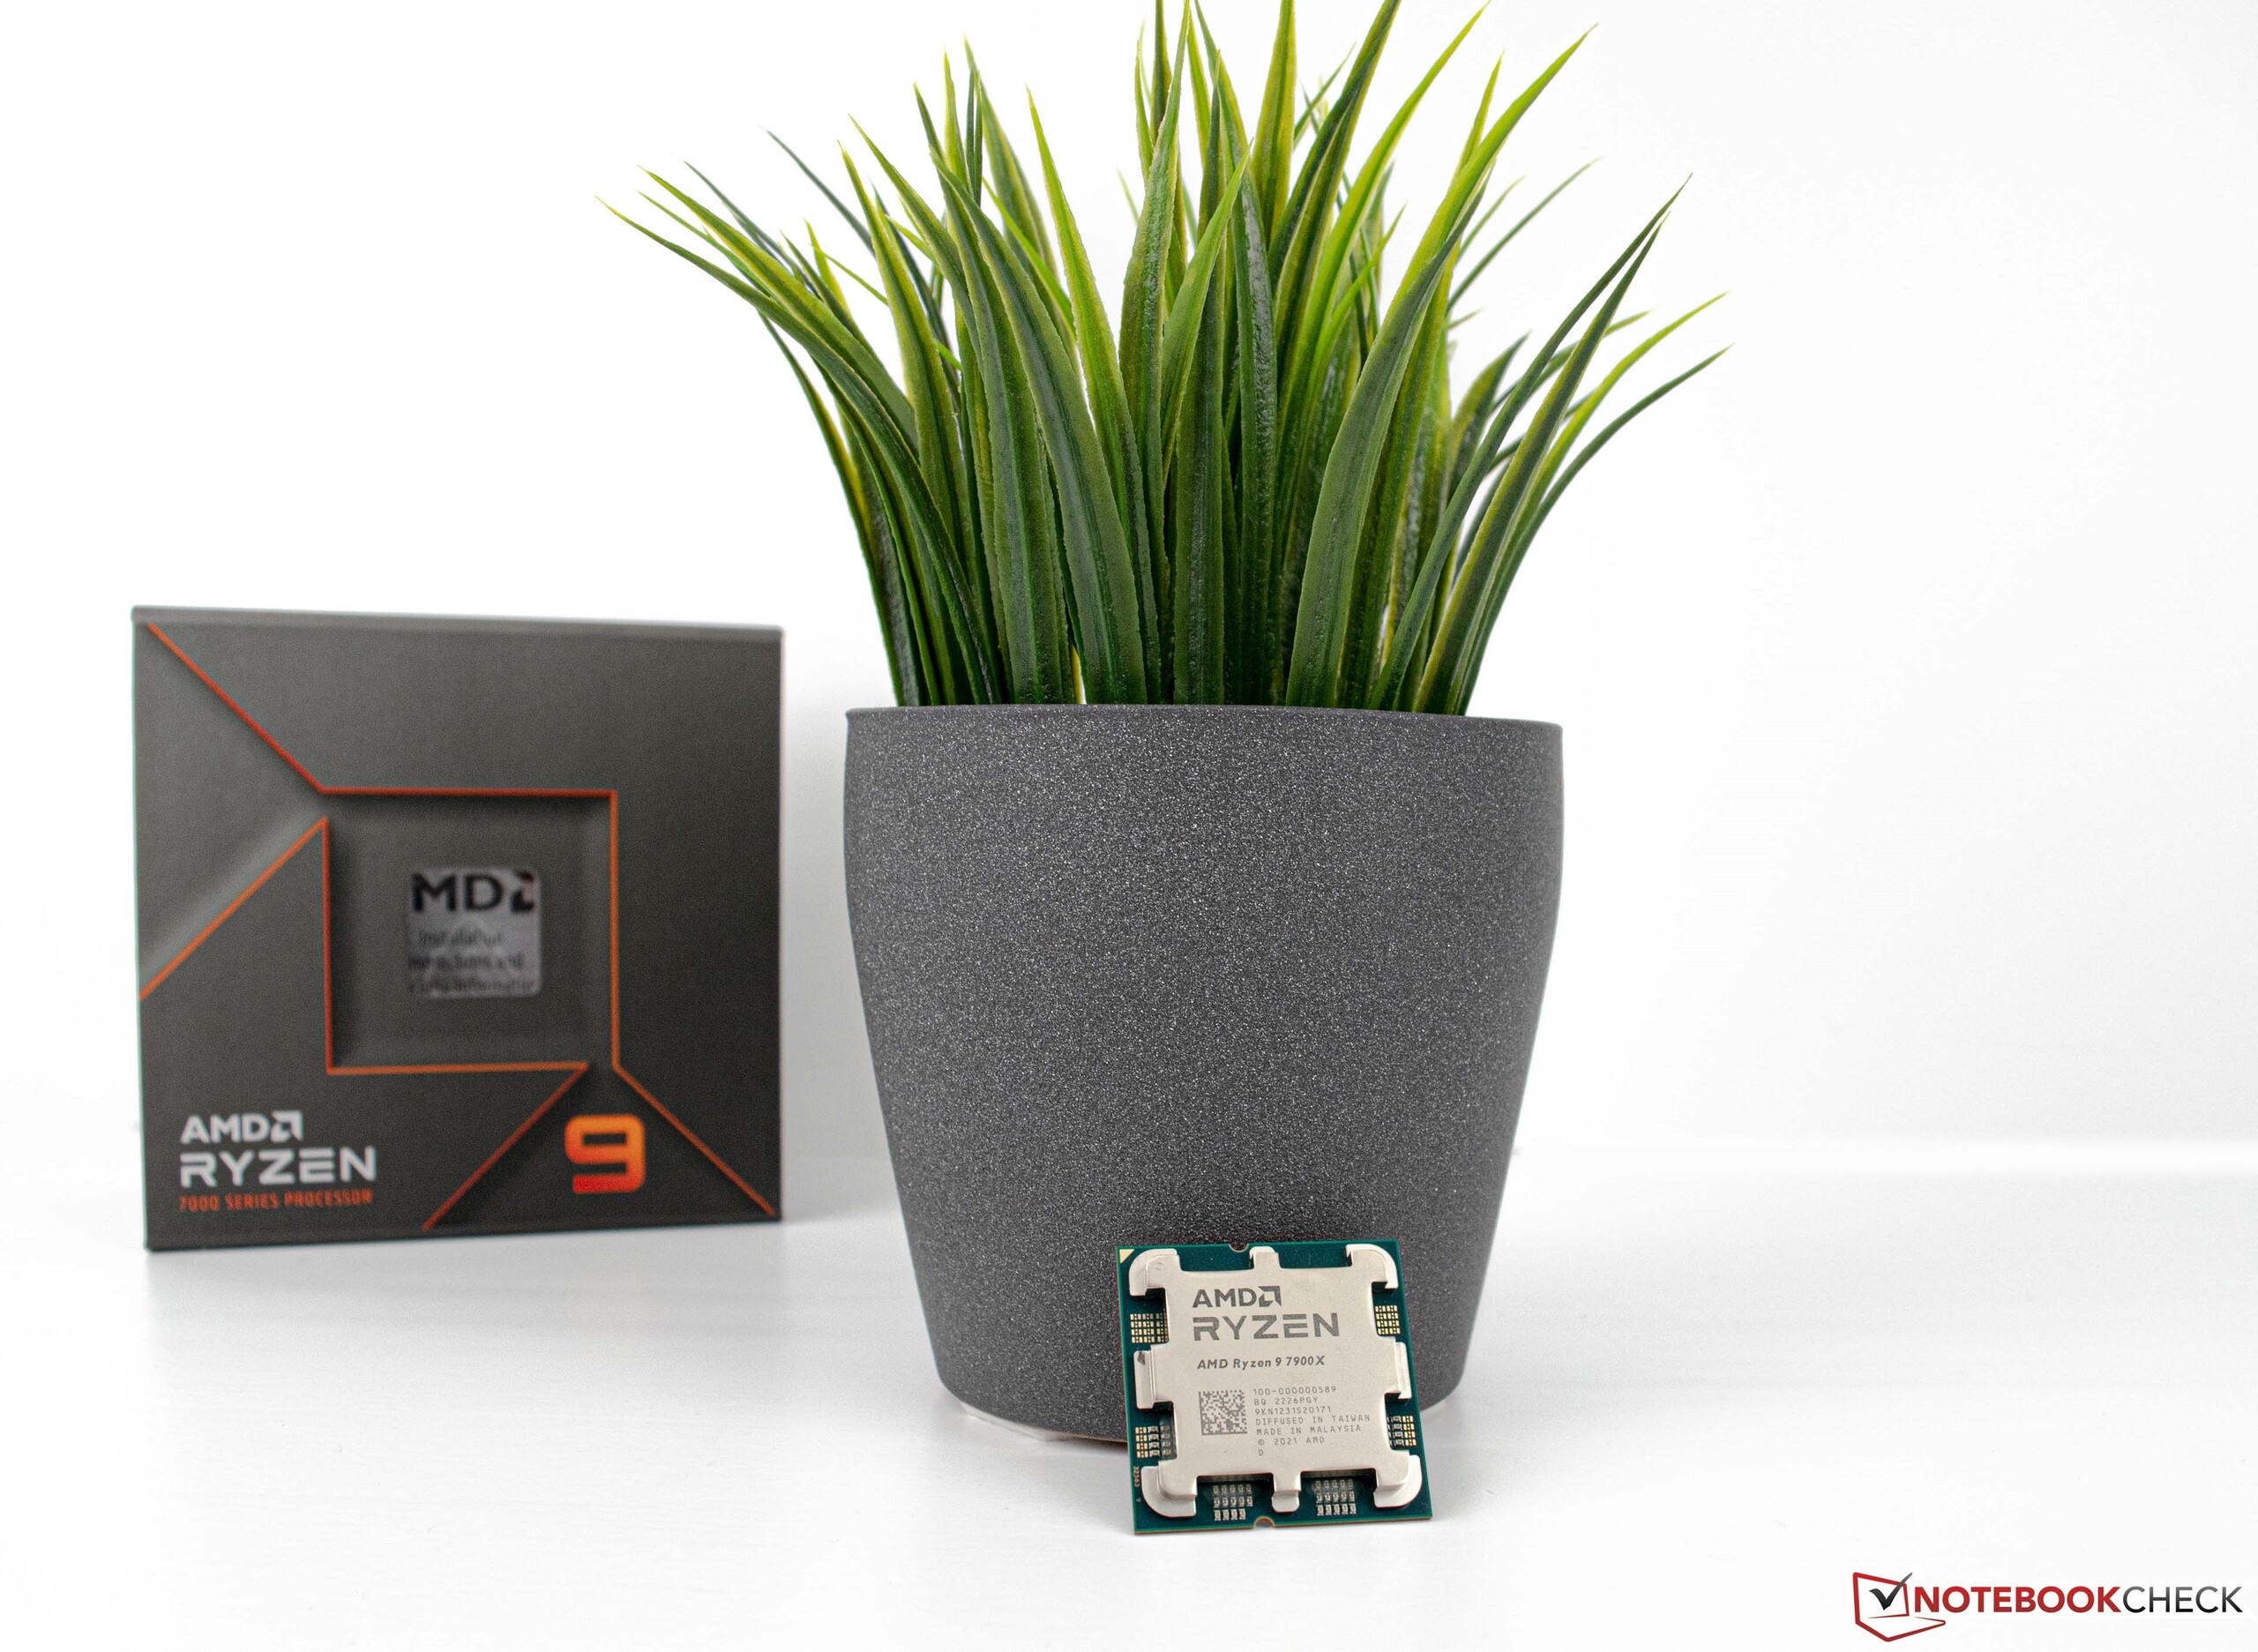
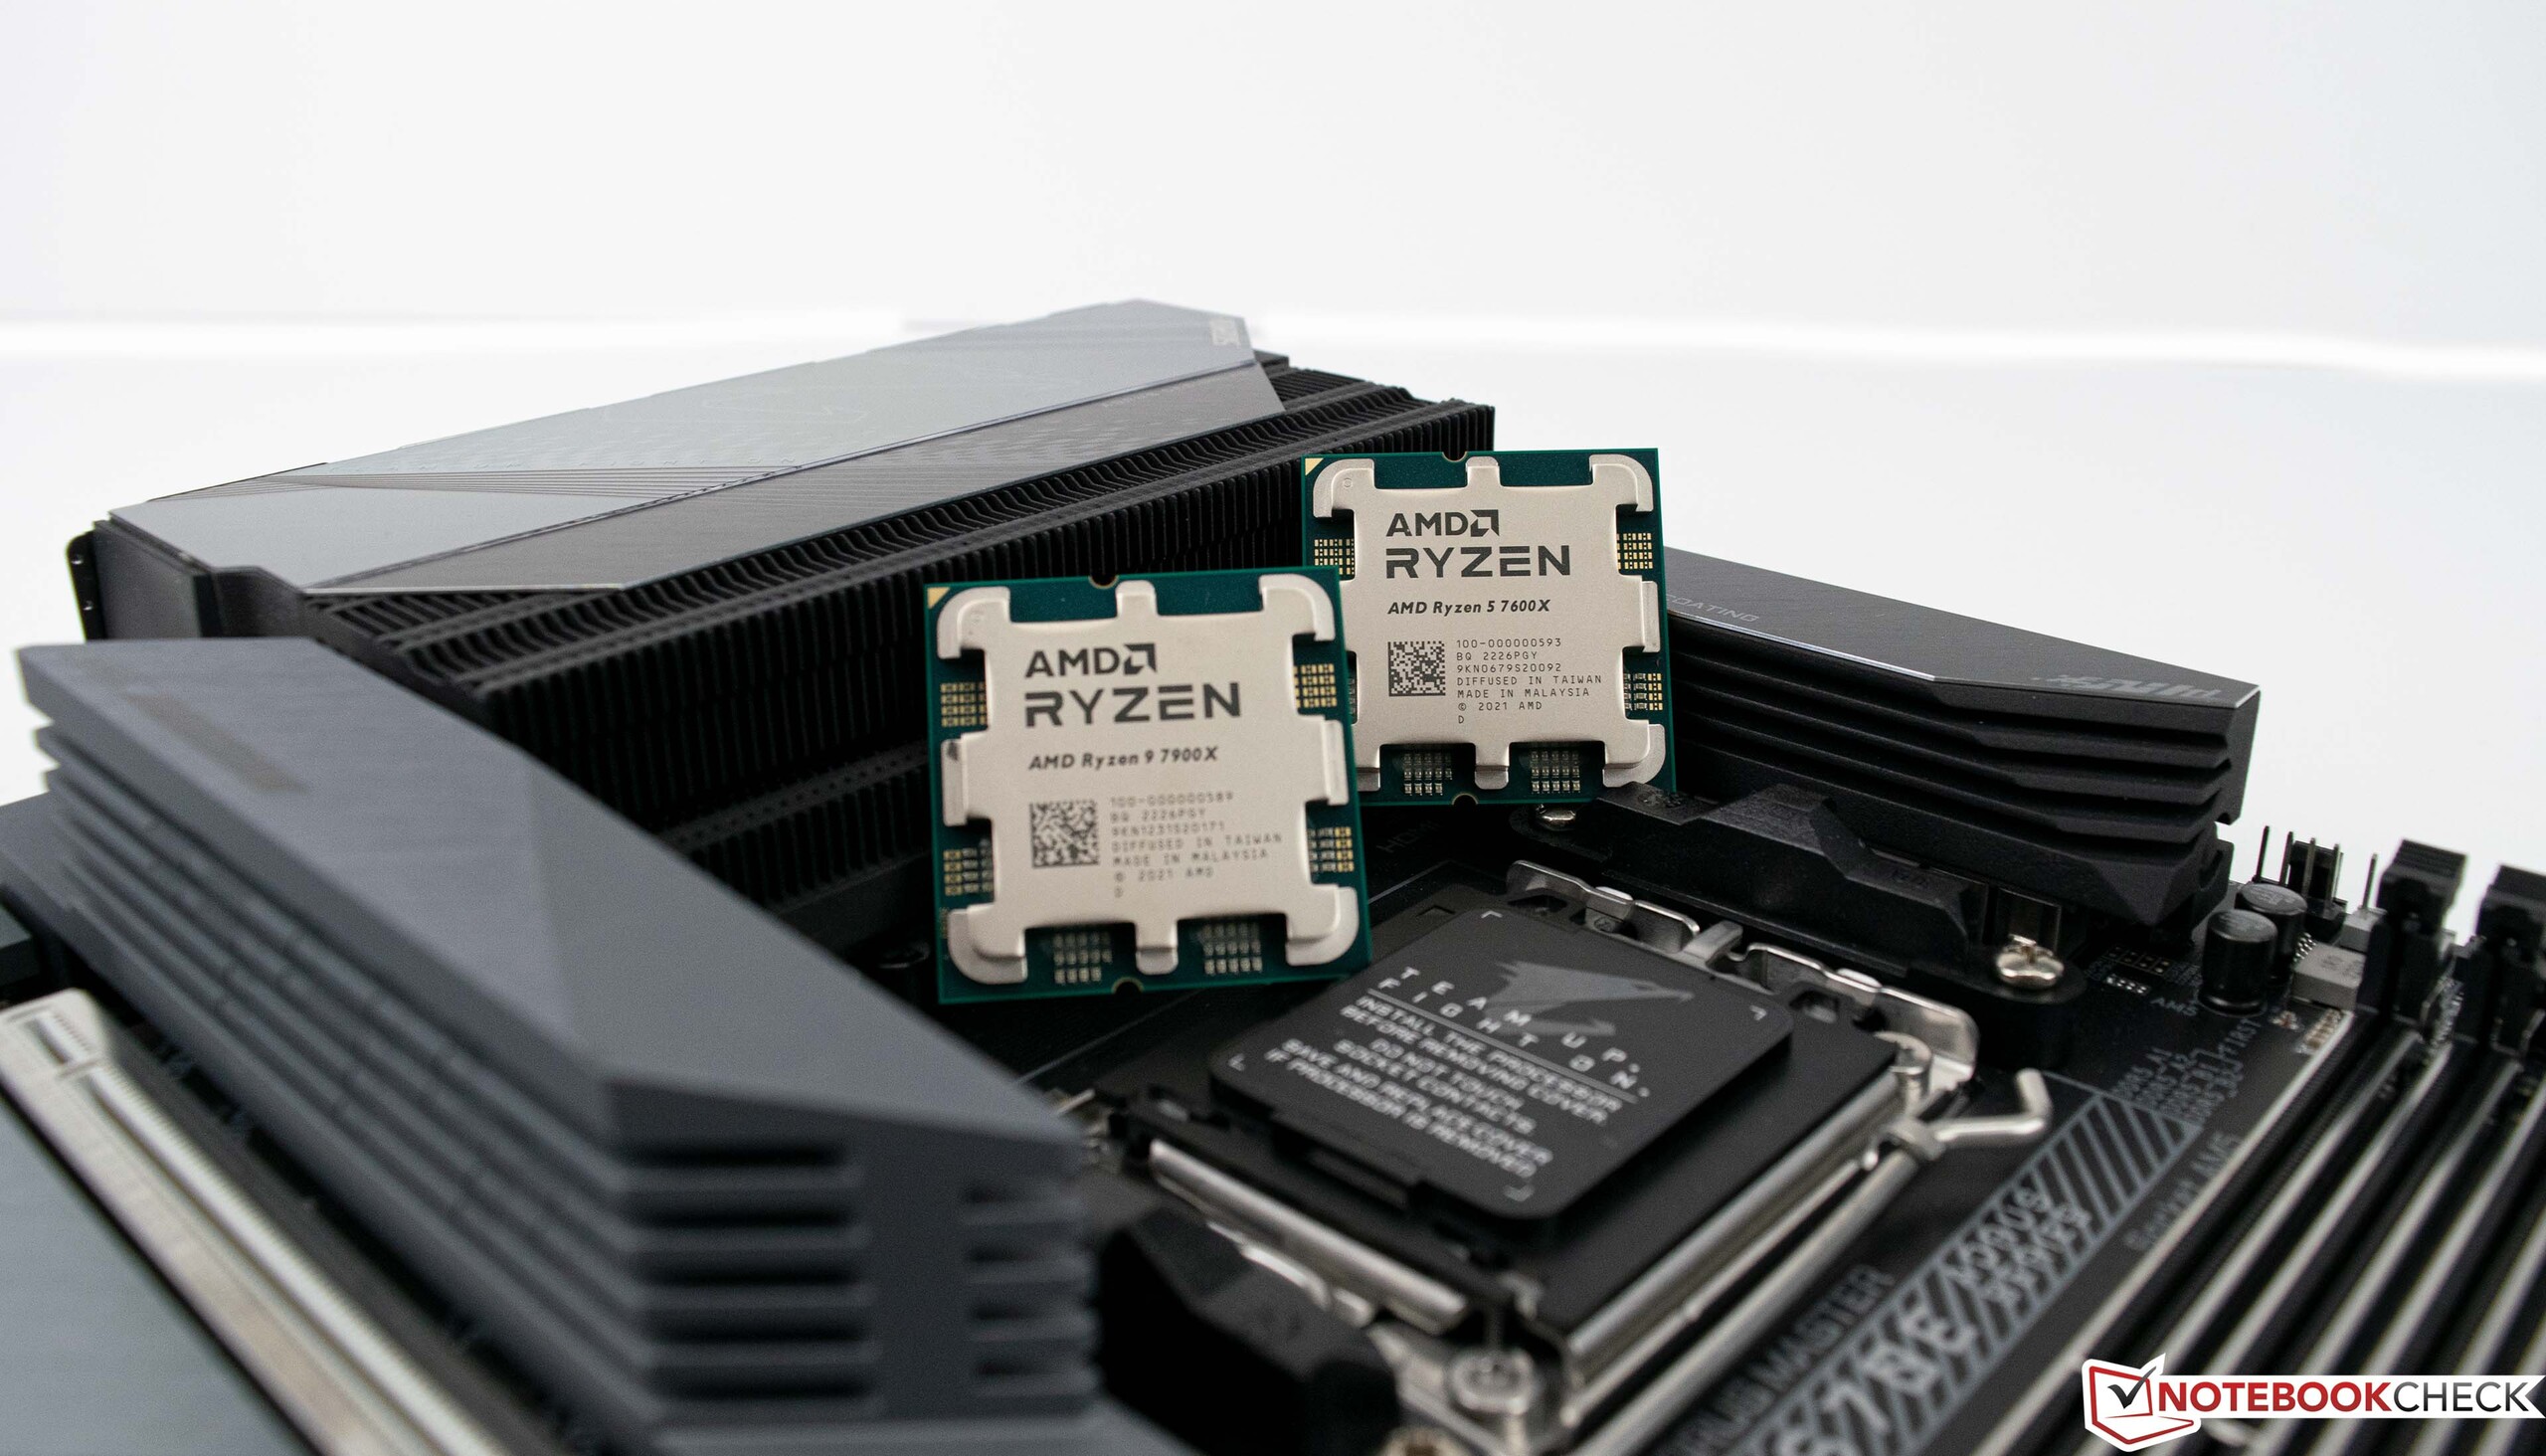
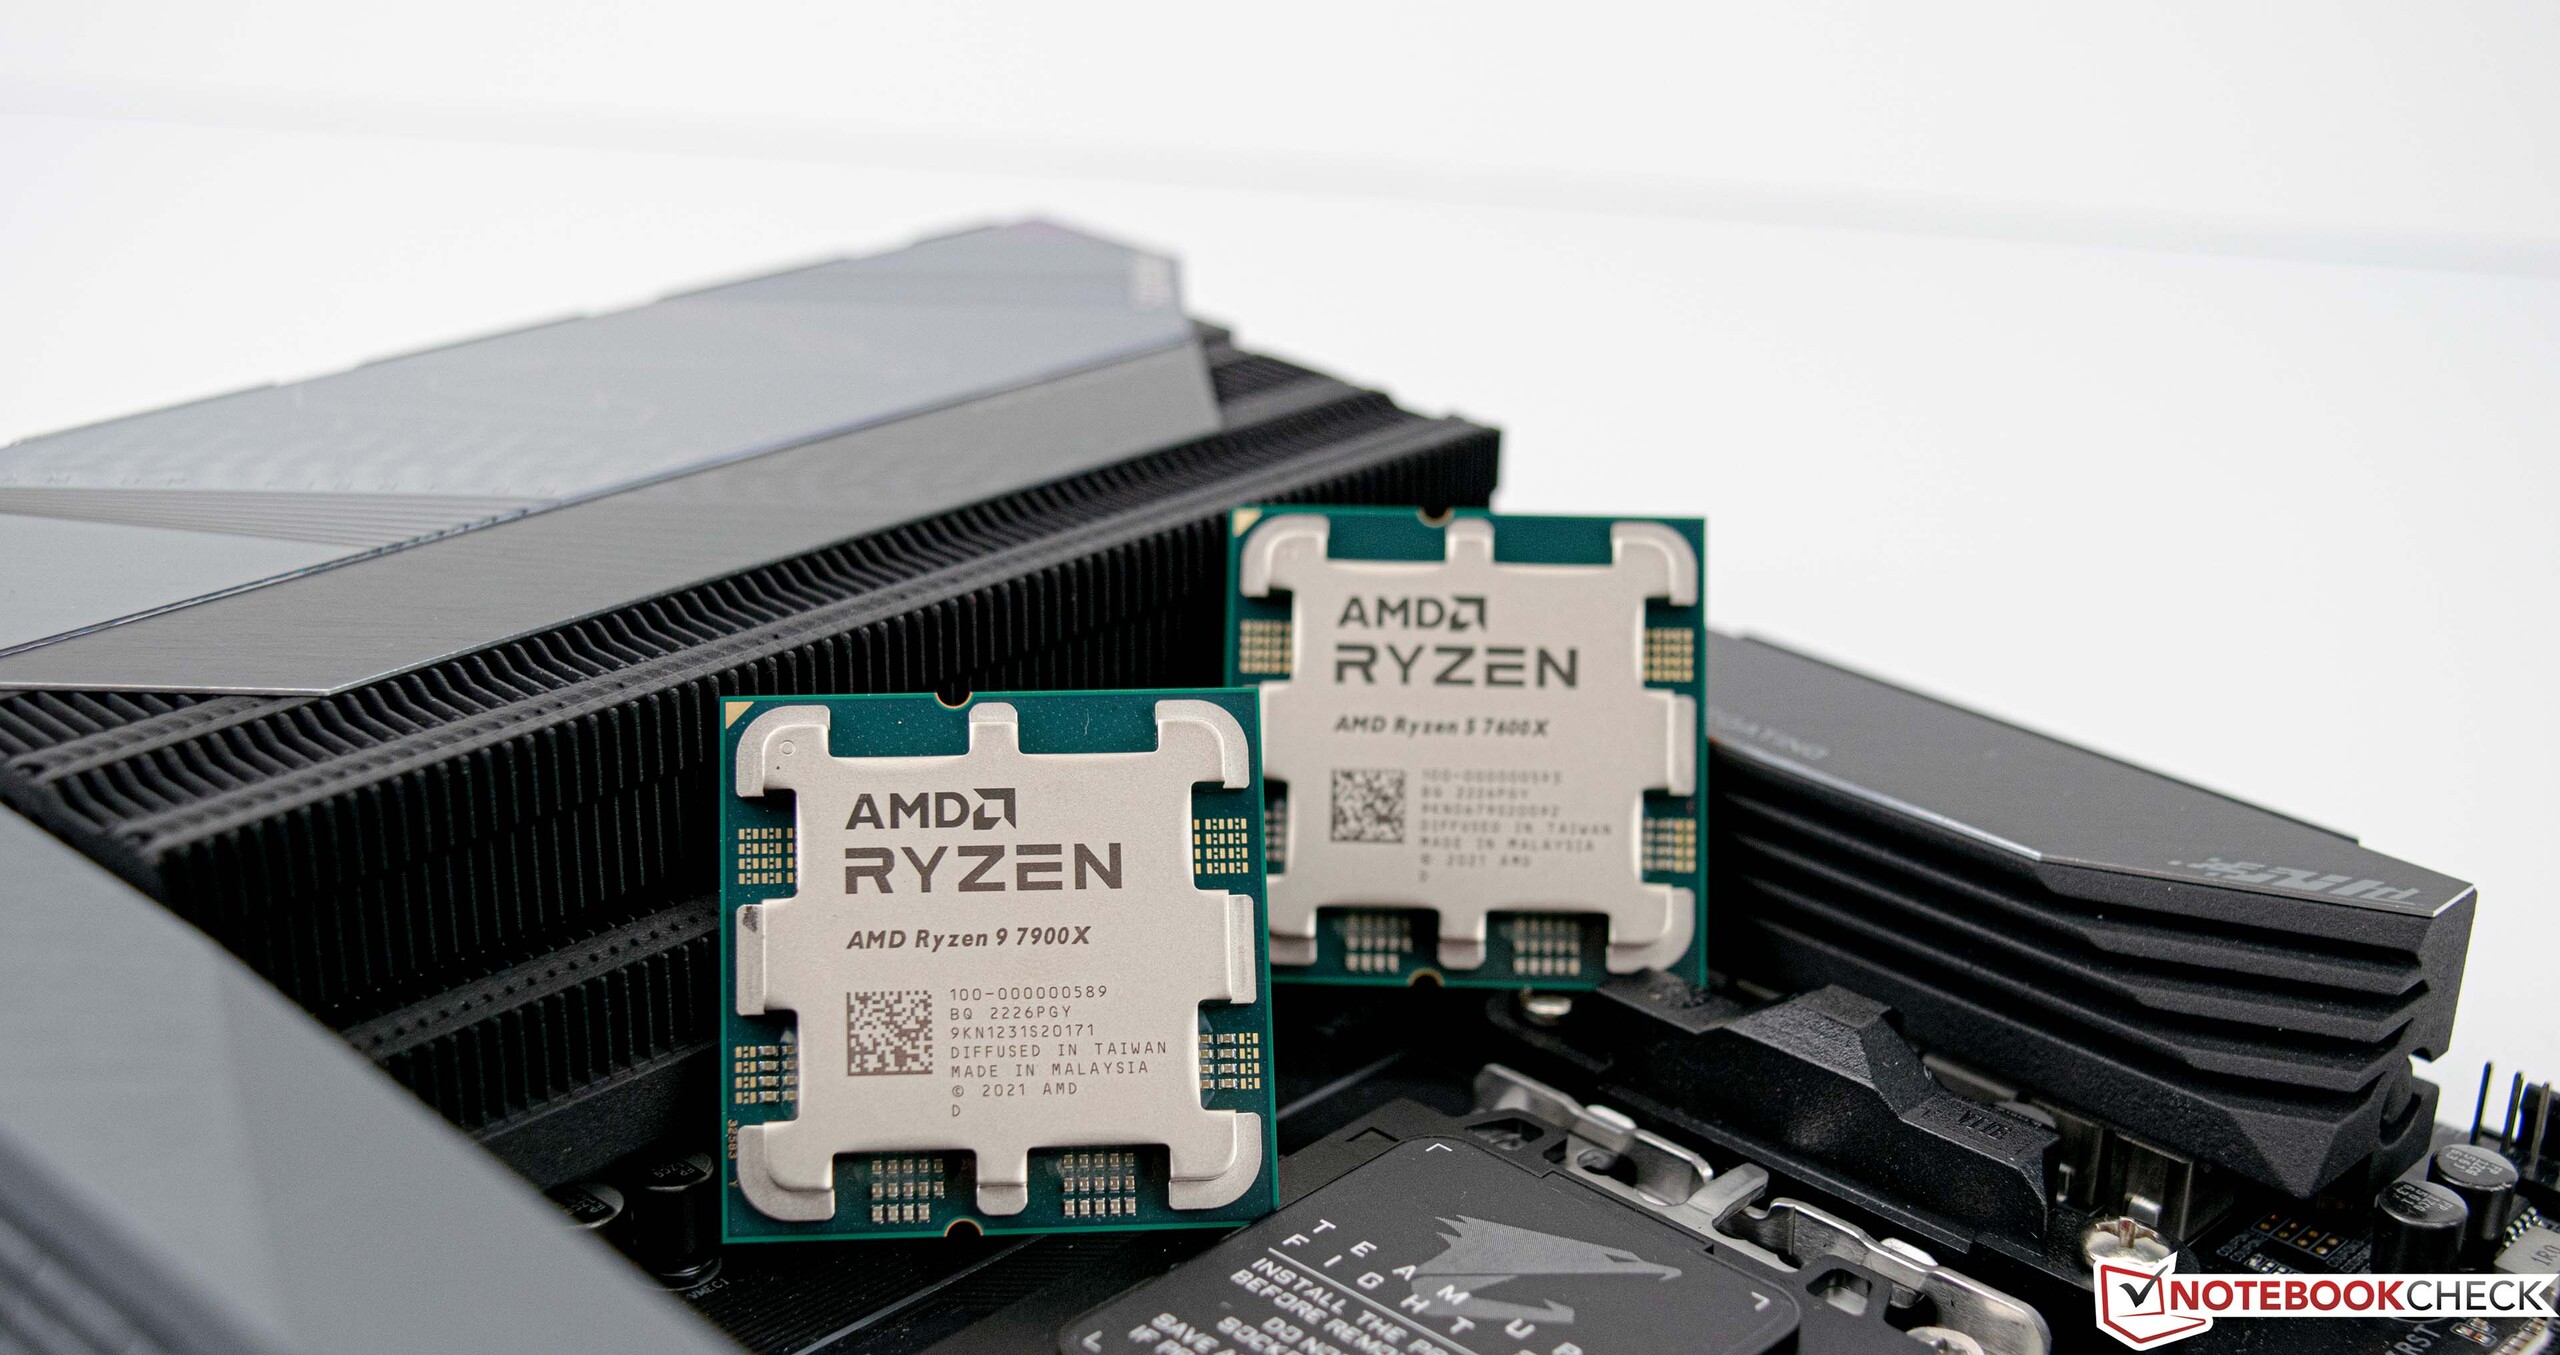
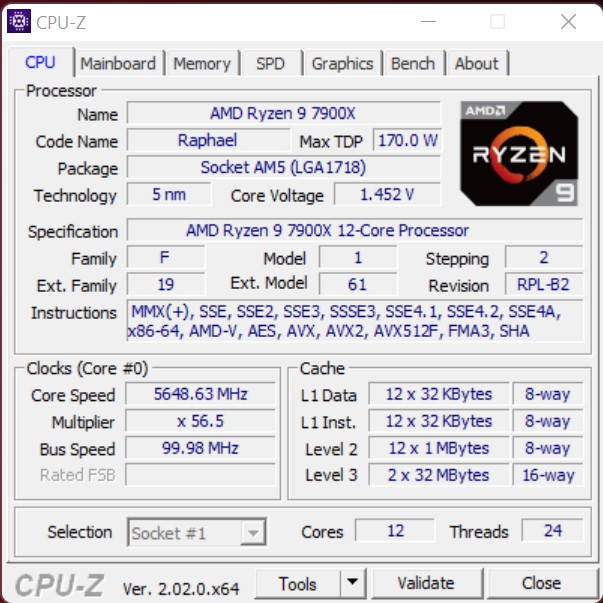
AMD Ryzen 9 7900X and AMD Ryzen 5 7600X in review: Back to the fastest gaming CPU crown with Raphael!
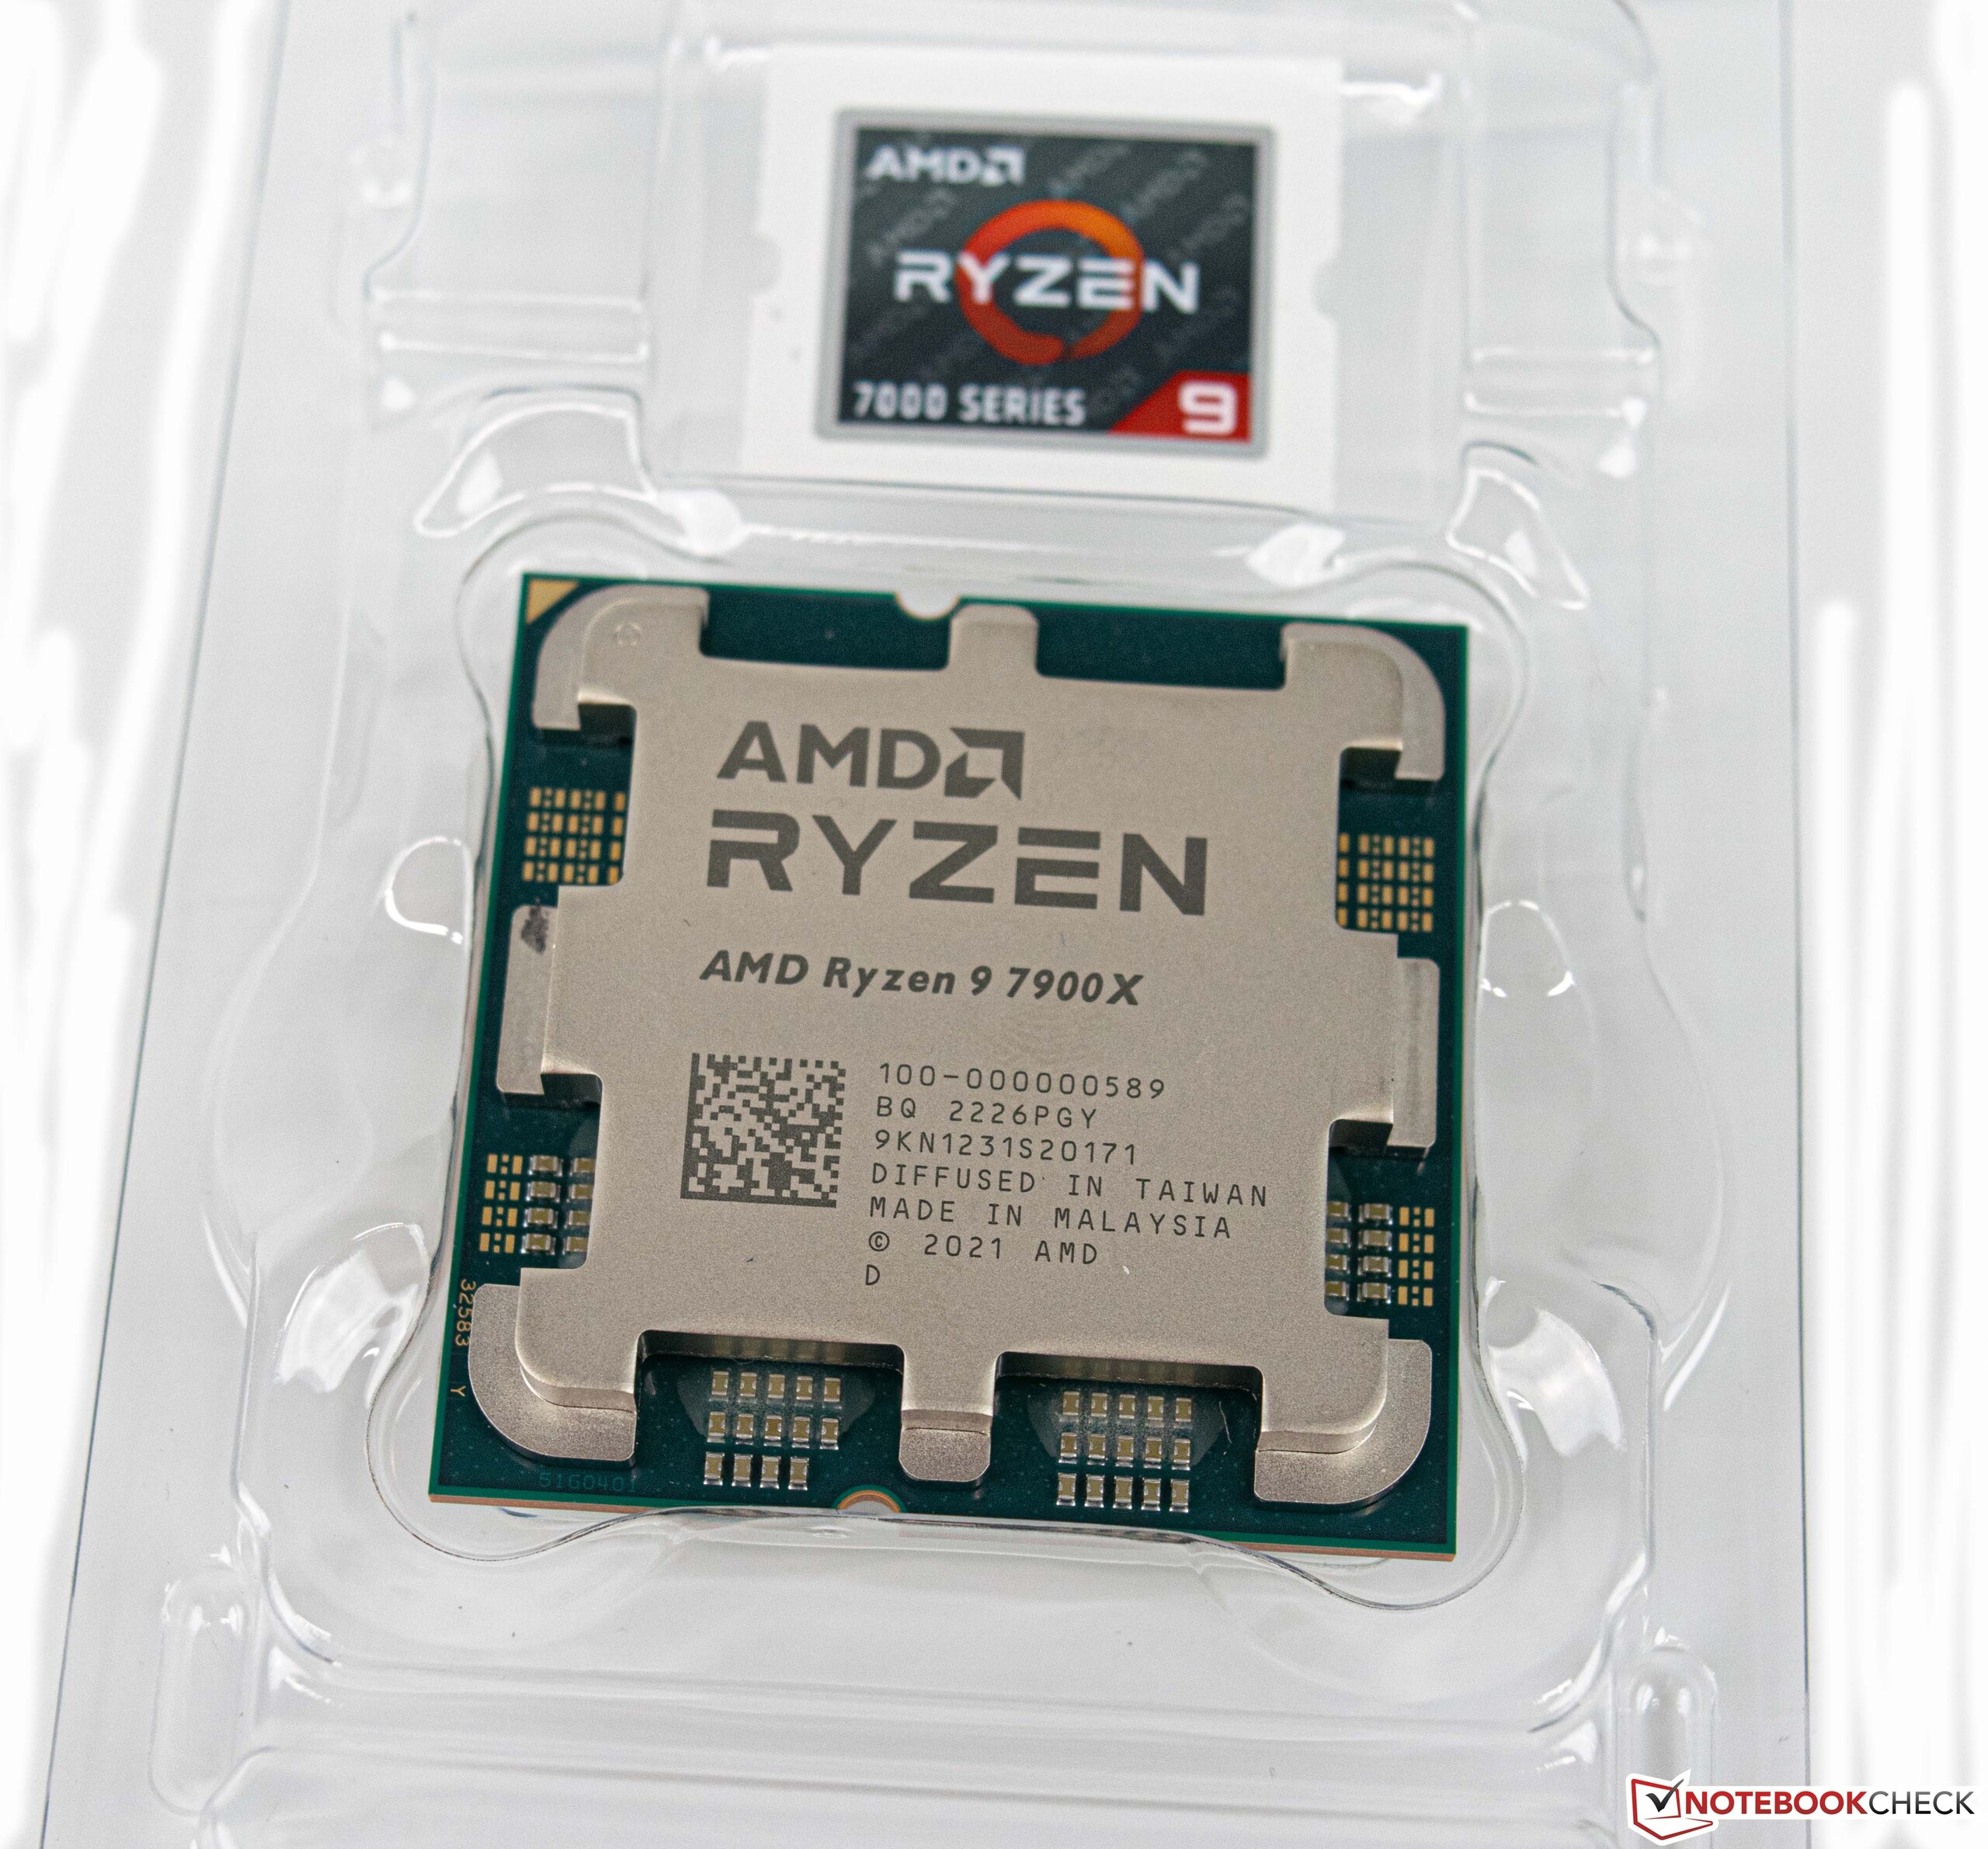
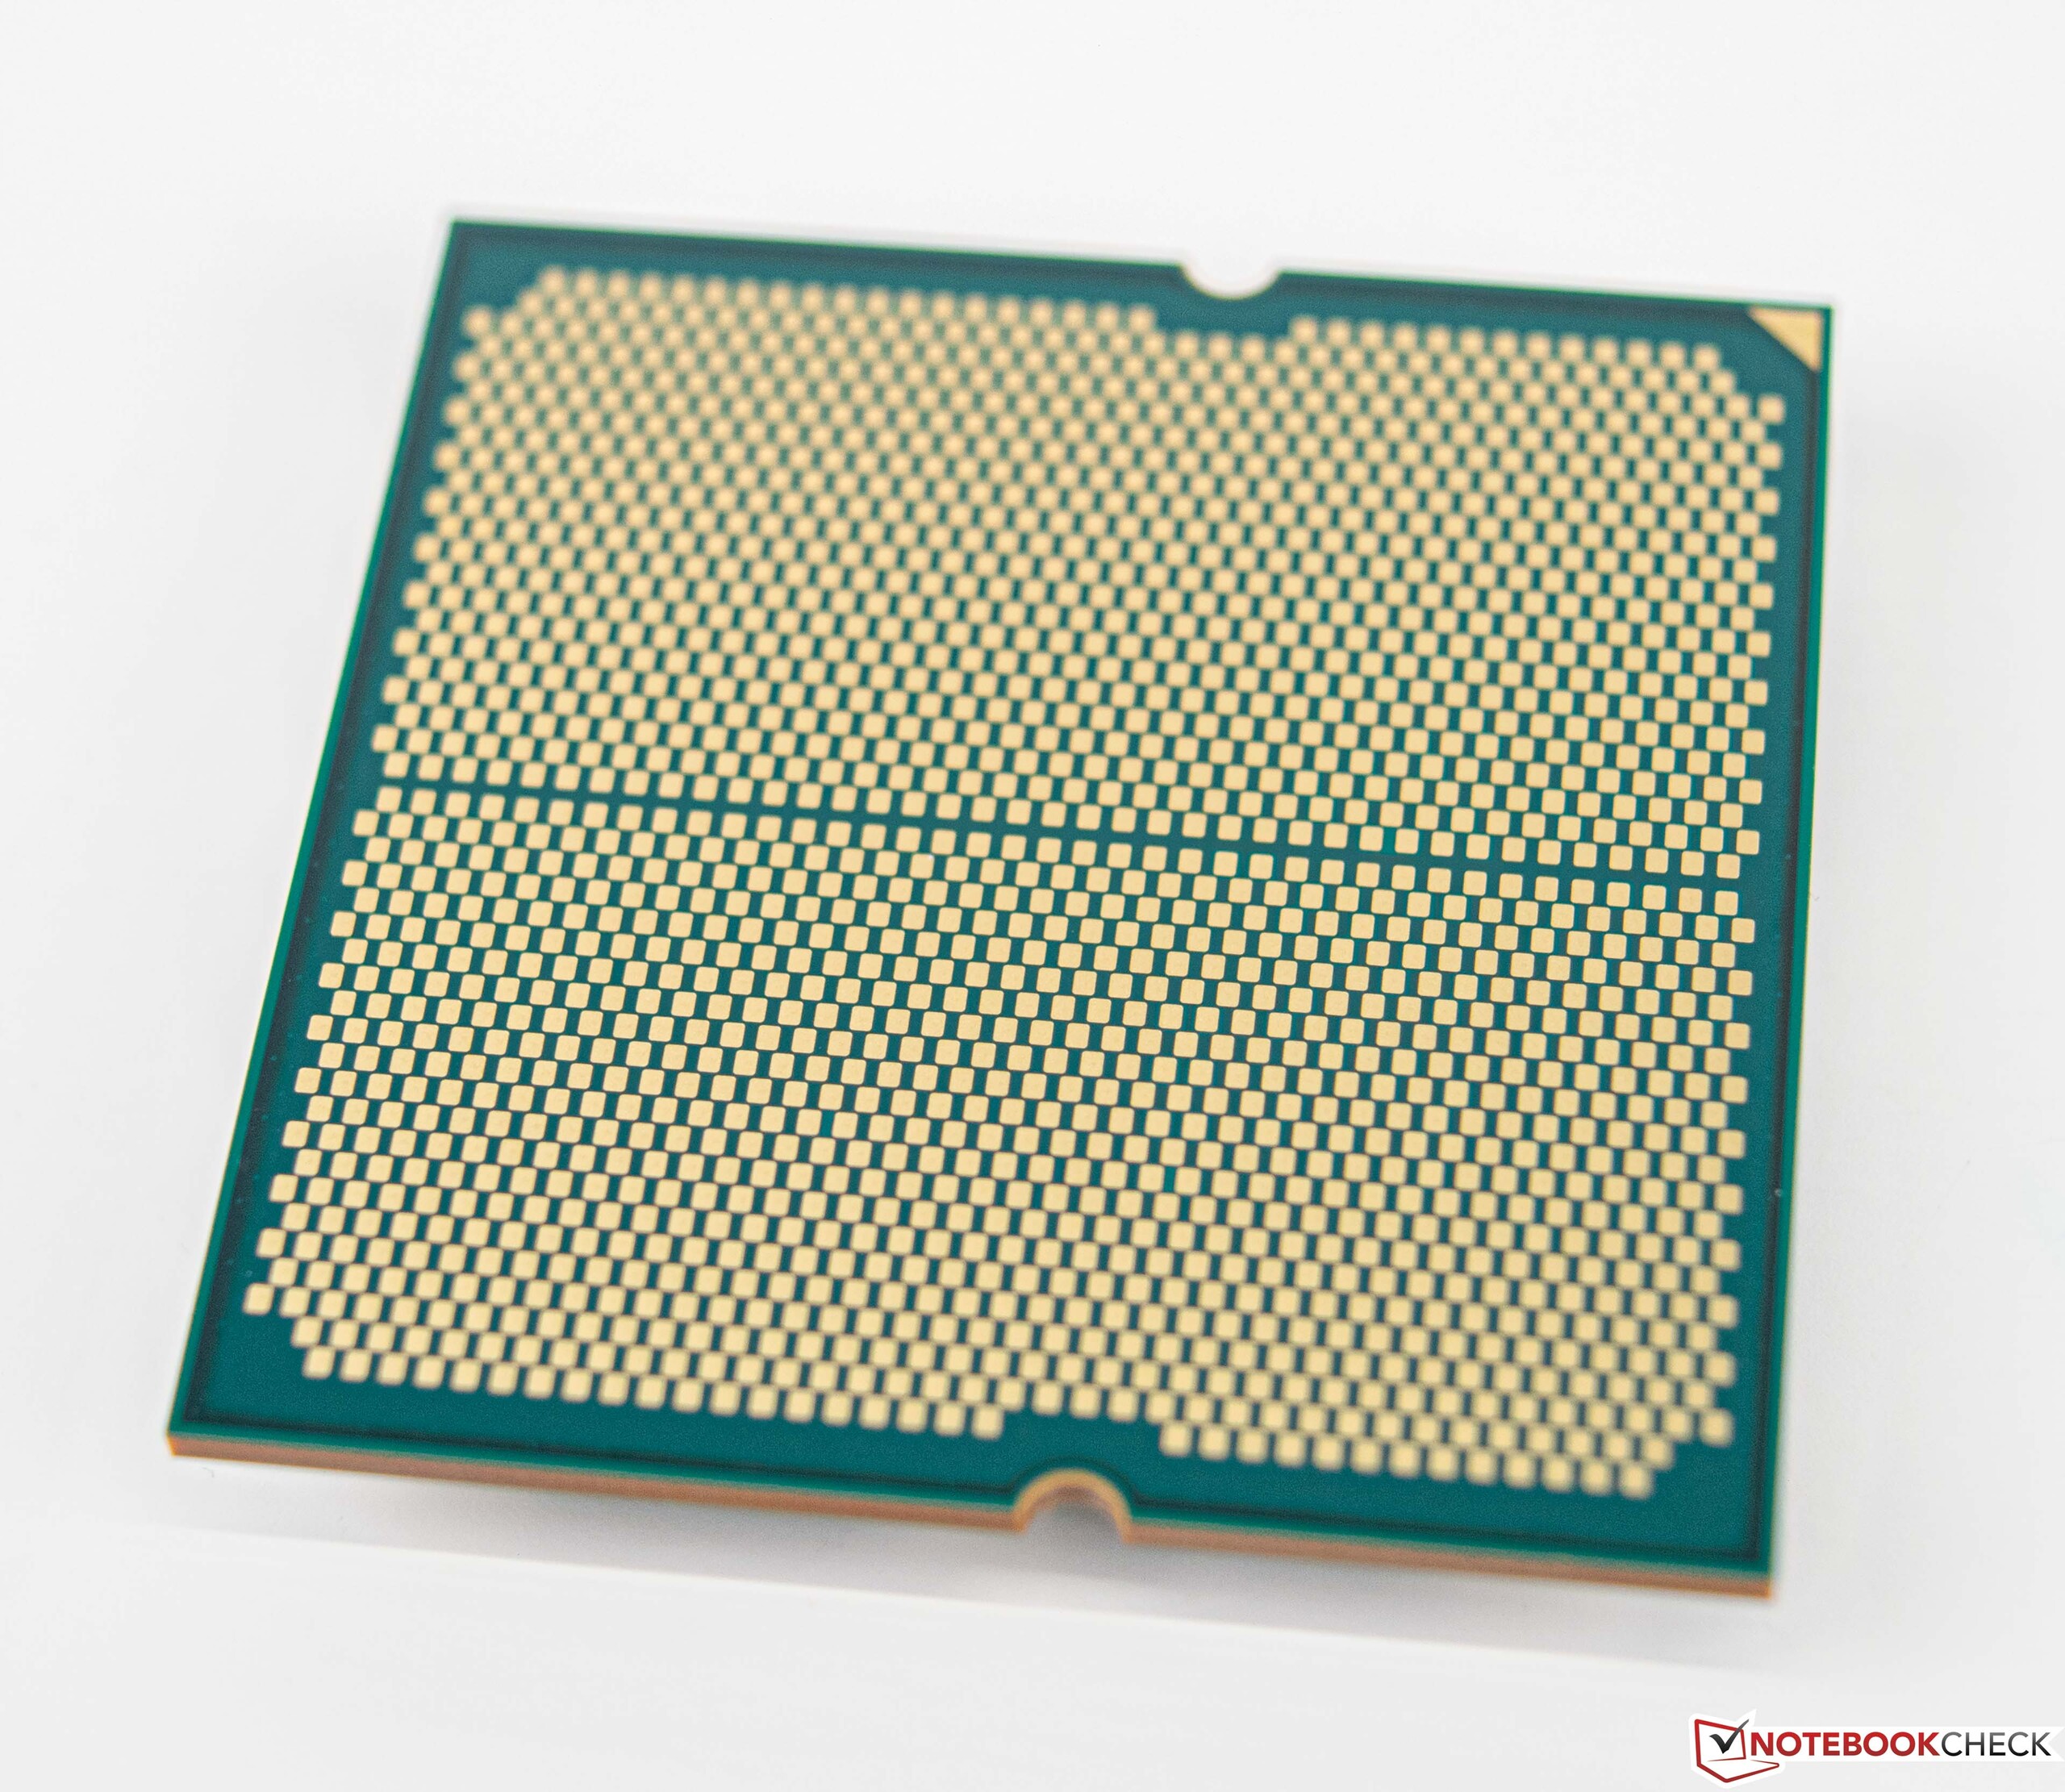
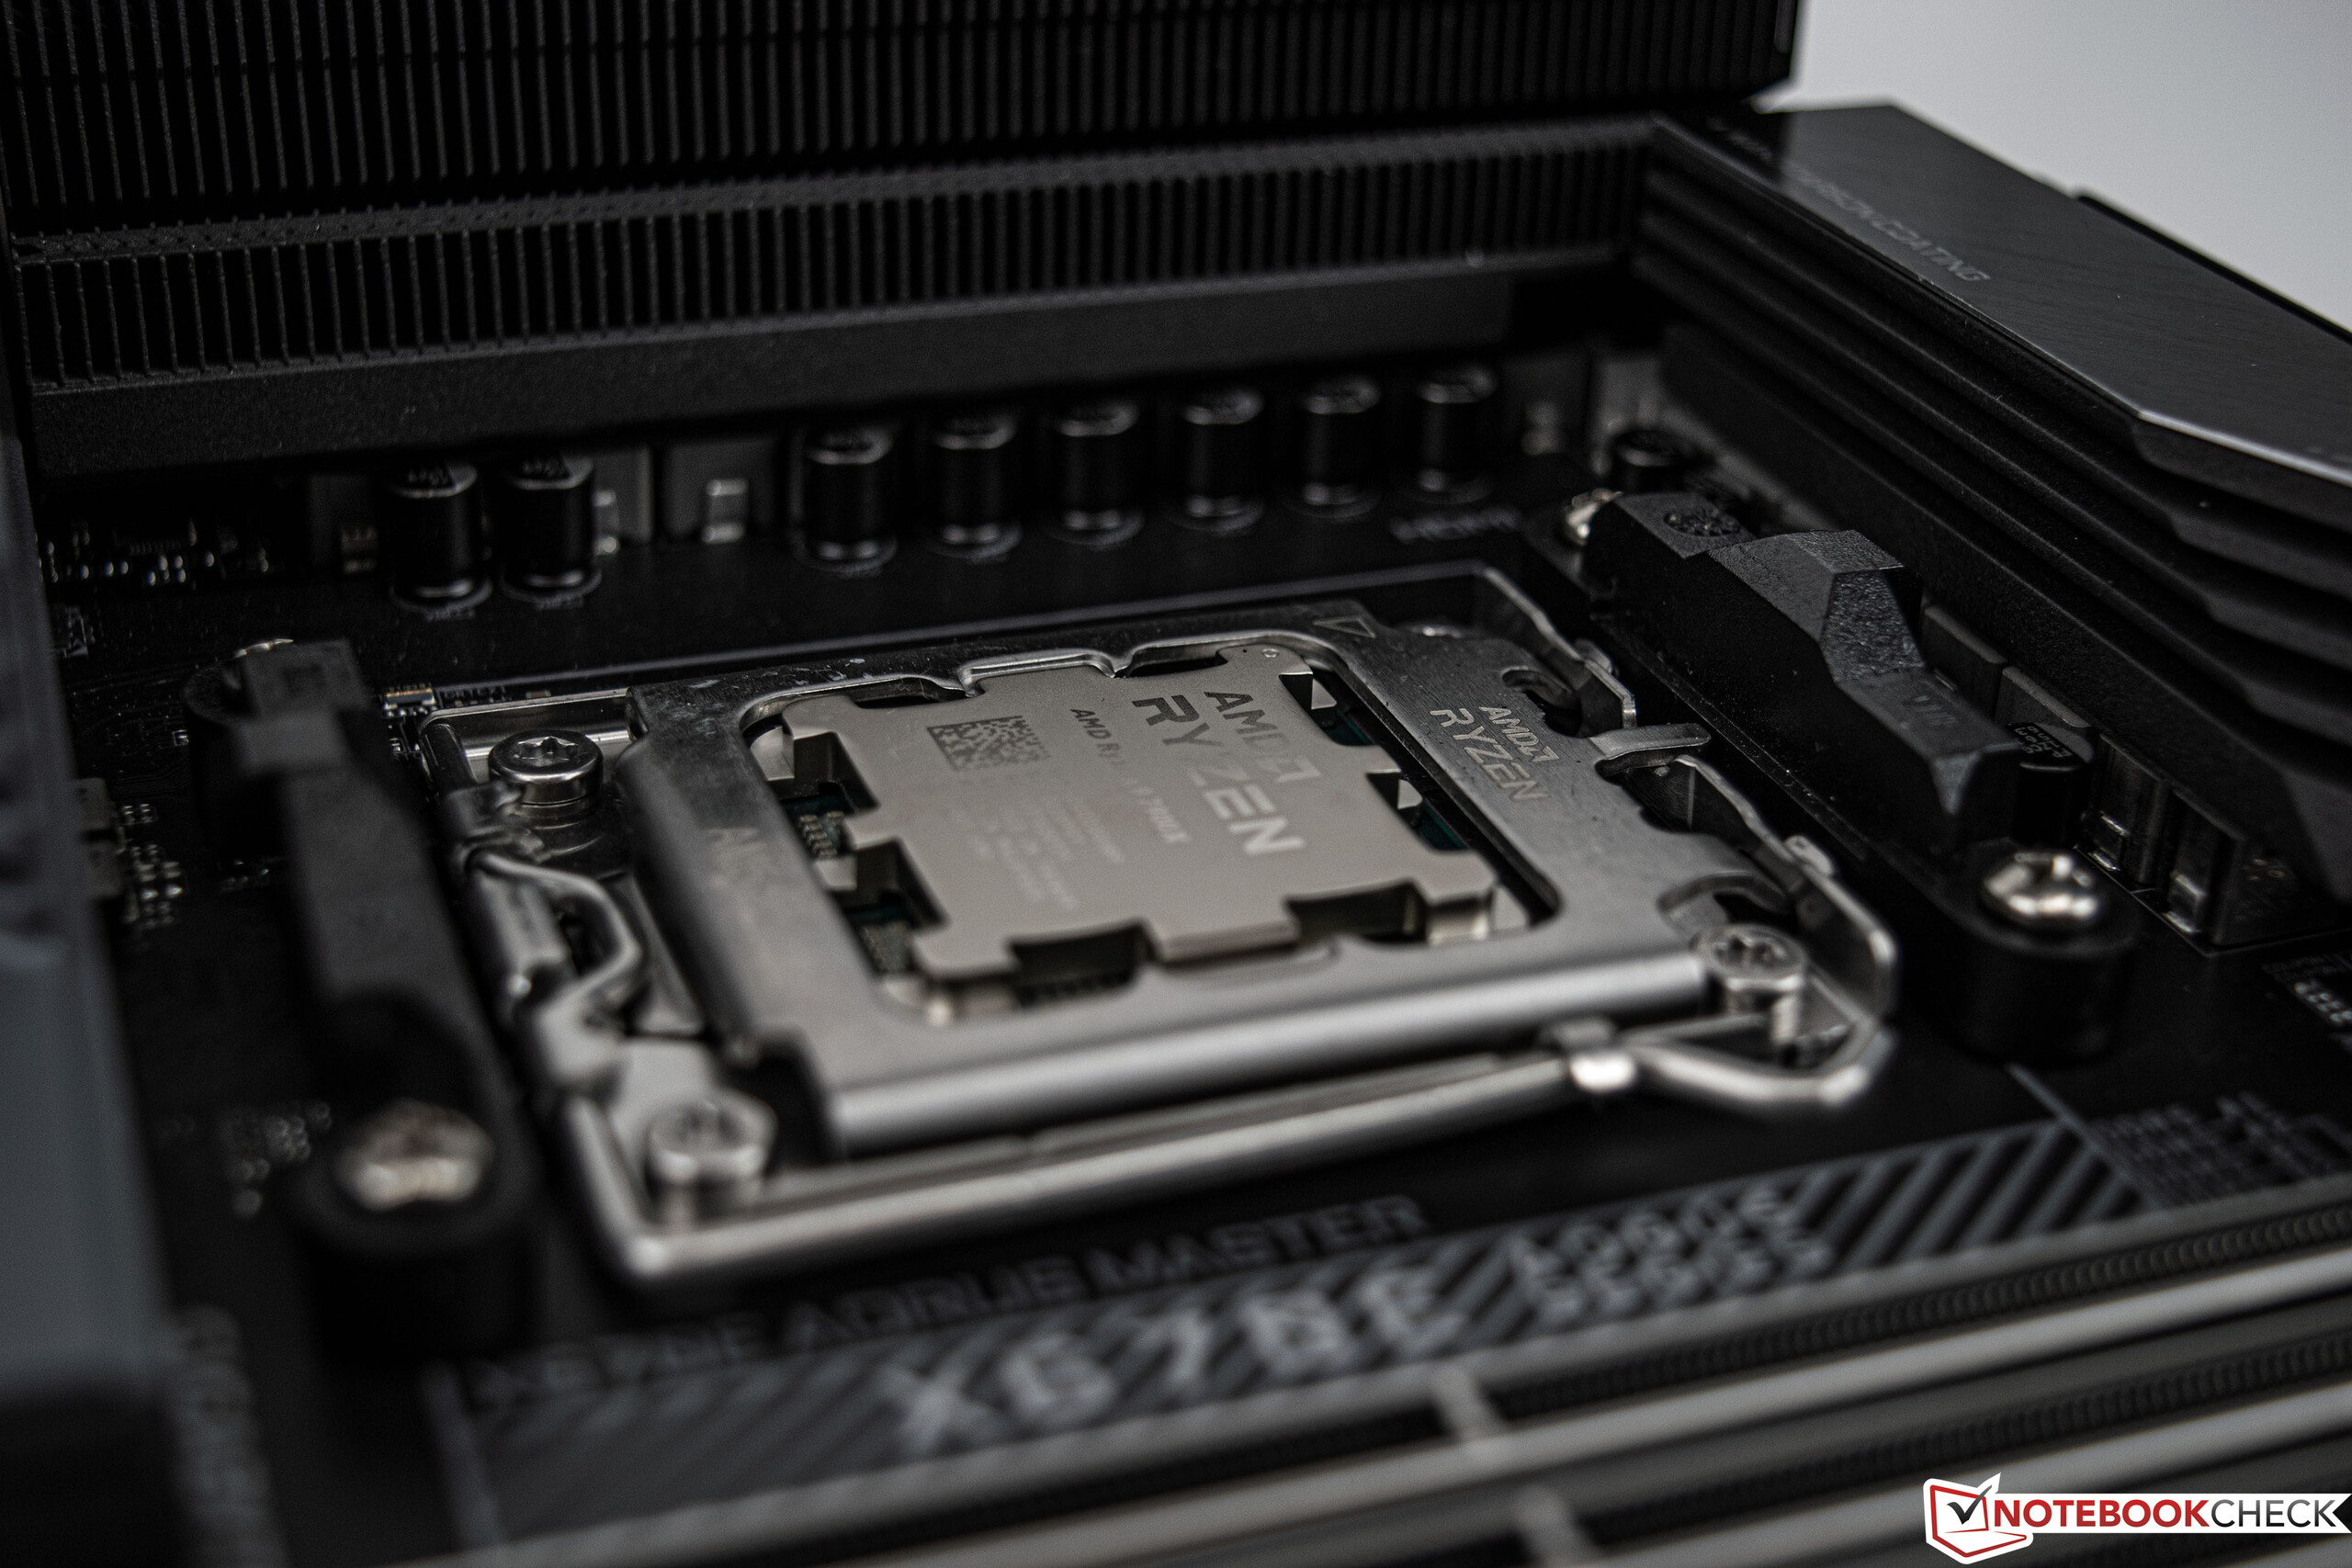
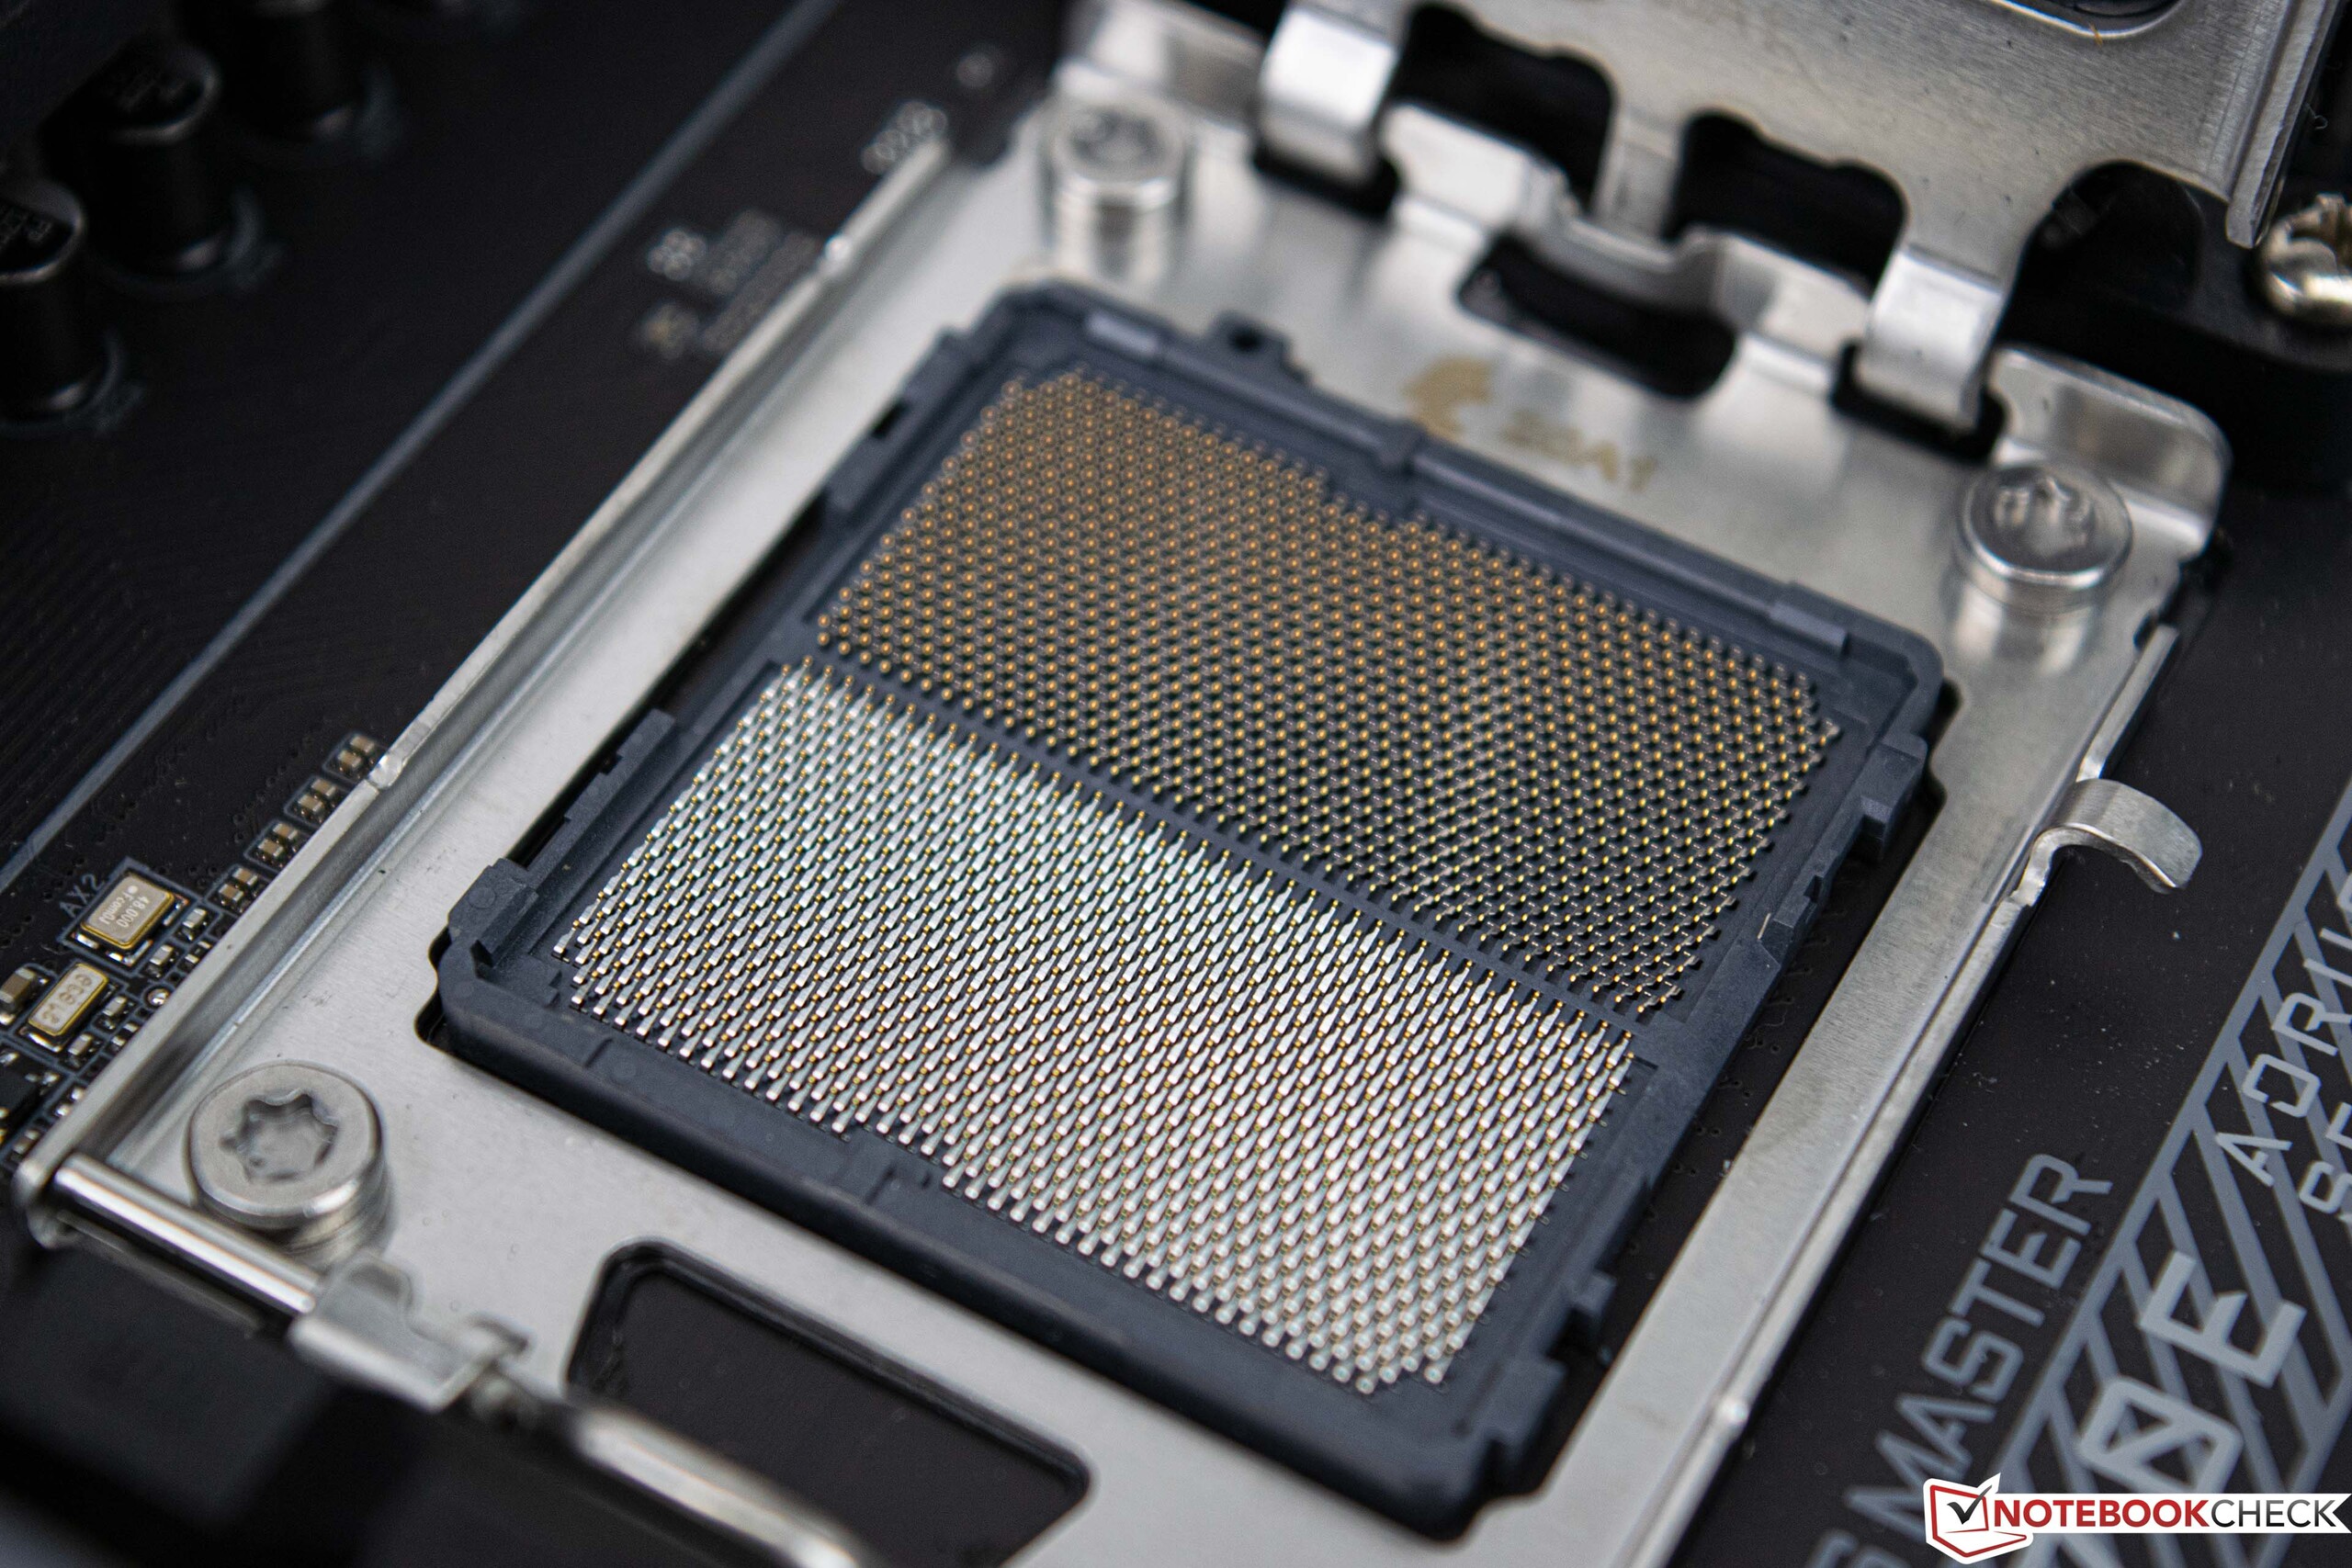
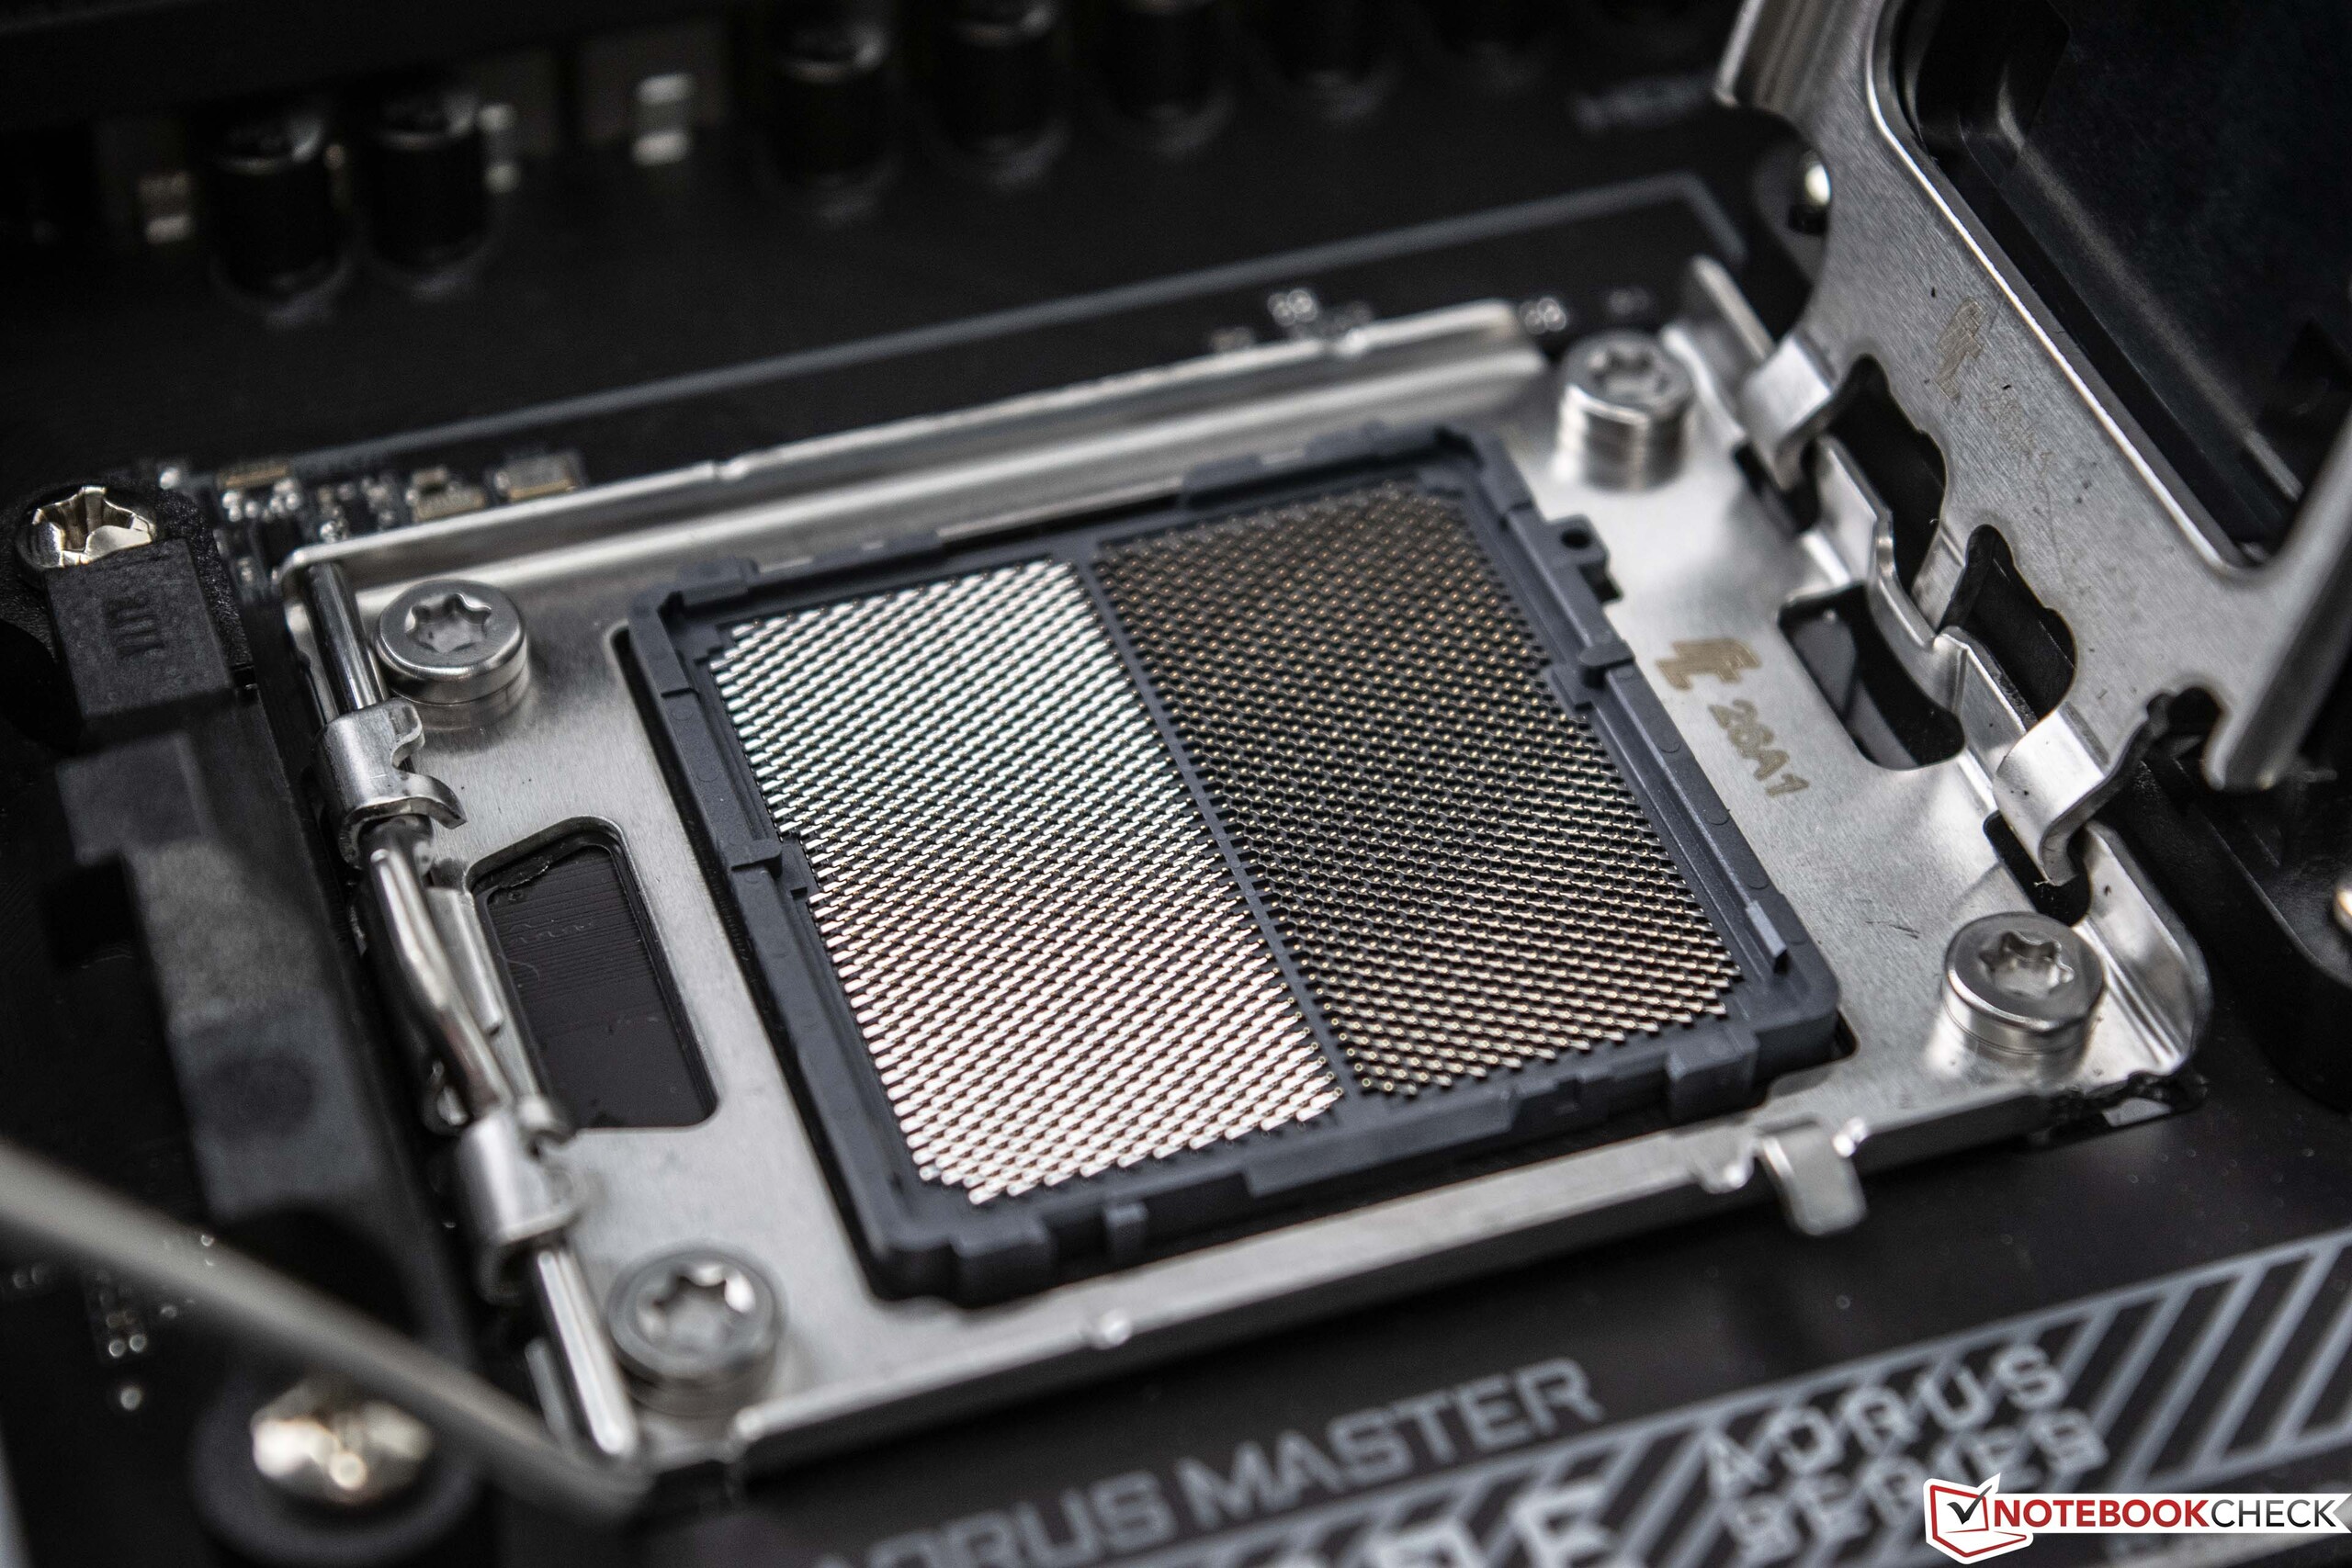
On 08.10.2020, AMD had the last big launch in desktop processors. Today, almost two years later, AMD releases the brand-new AMD Ryzen 7000 models. In addition to the new processors, there are many other innovations that relate to the motherboard and RAM. The AM4 socket is replaced by the new AM5 socket based on a PGA layout. This means that Ryzen 7000 does not have any pins, but only contact surfaces on the underside — 1,718 of them to be exact. Unlike Intel, however, the use of DDR5 has become mandatory with Ryzen 7000. There is no backwards compatibility, which should definitely be considered when calculating the costs for an upgrade.
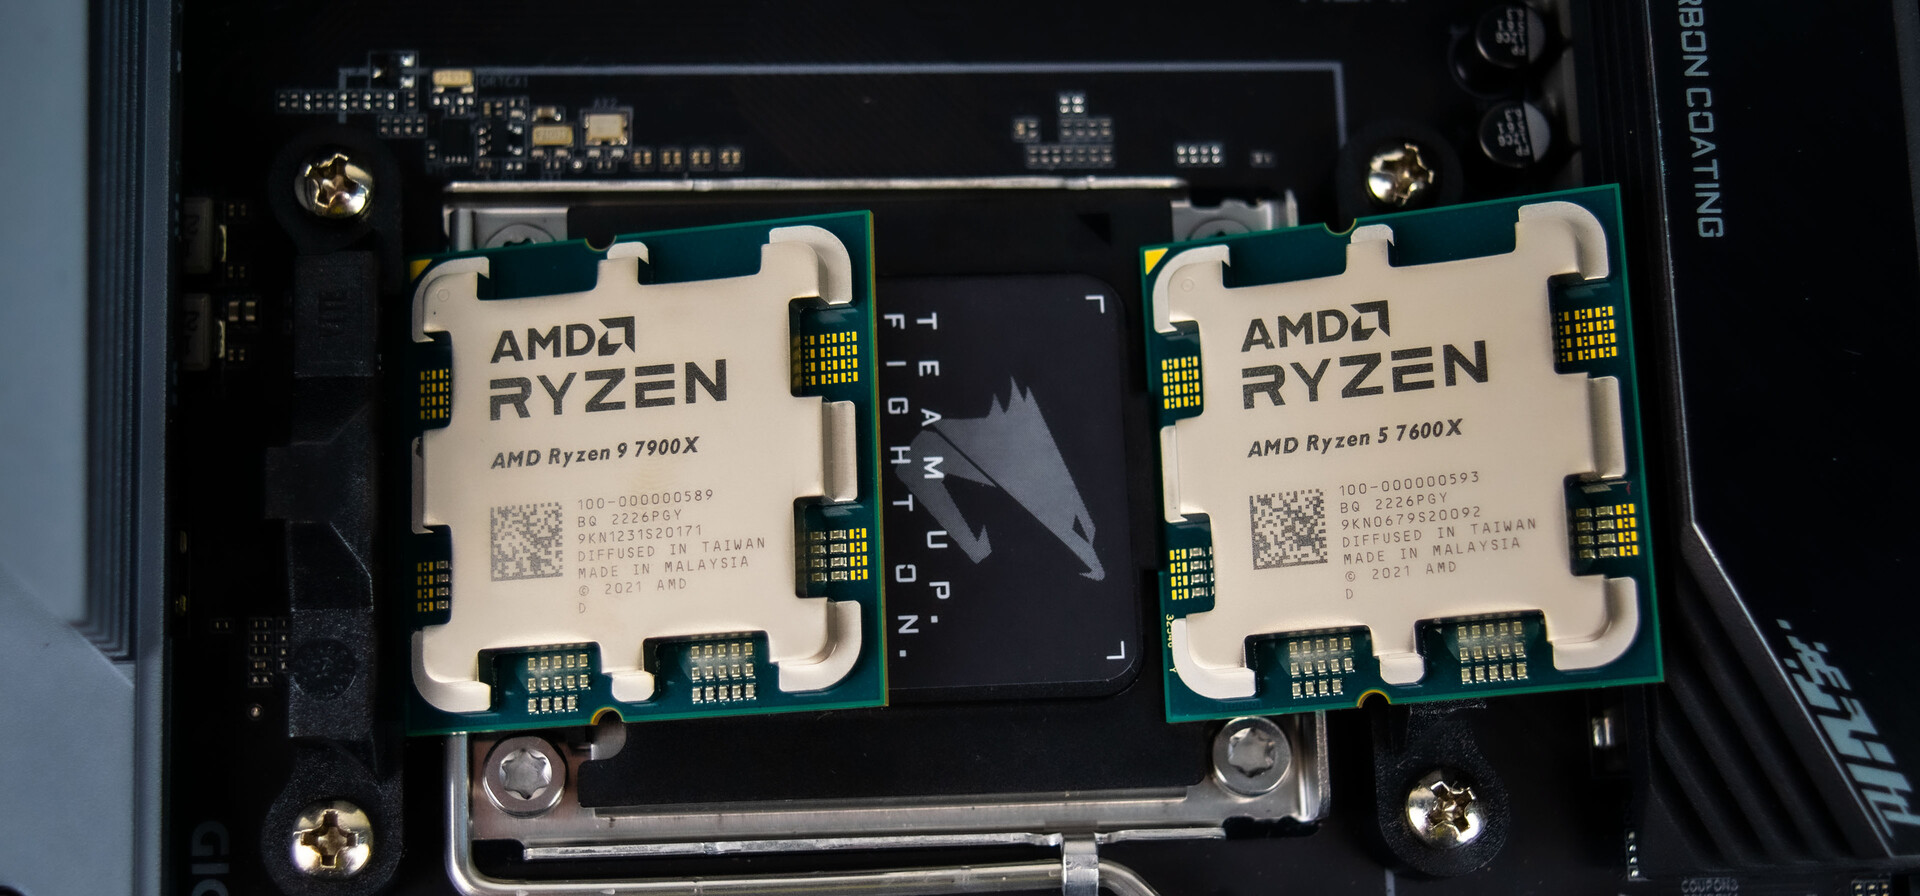
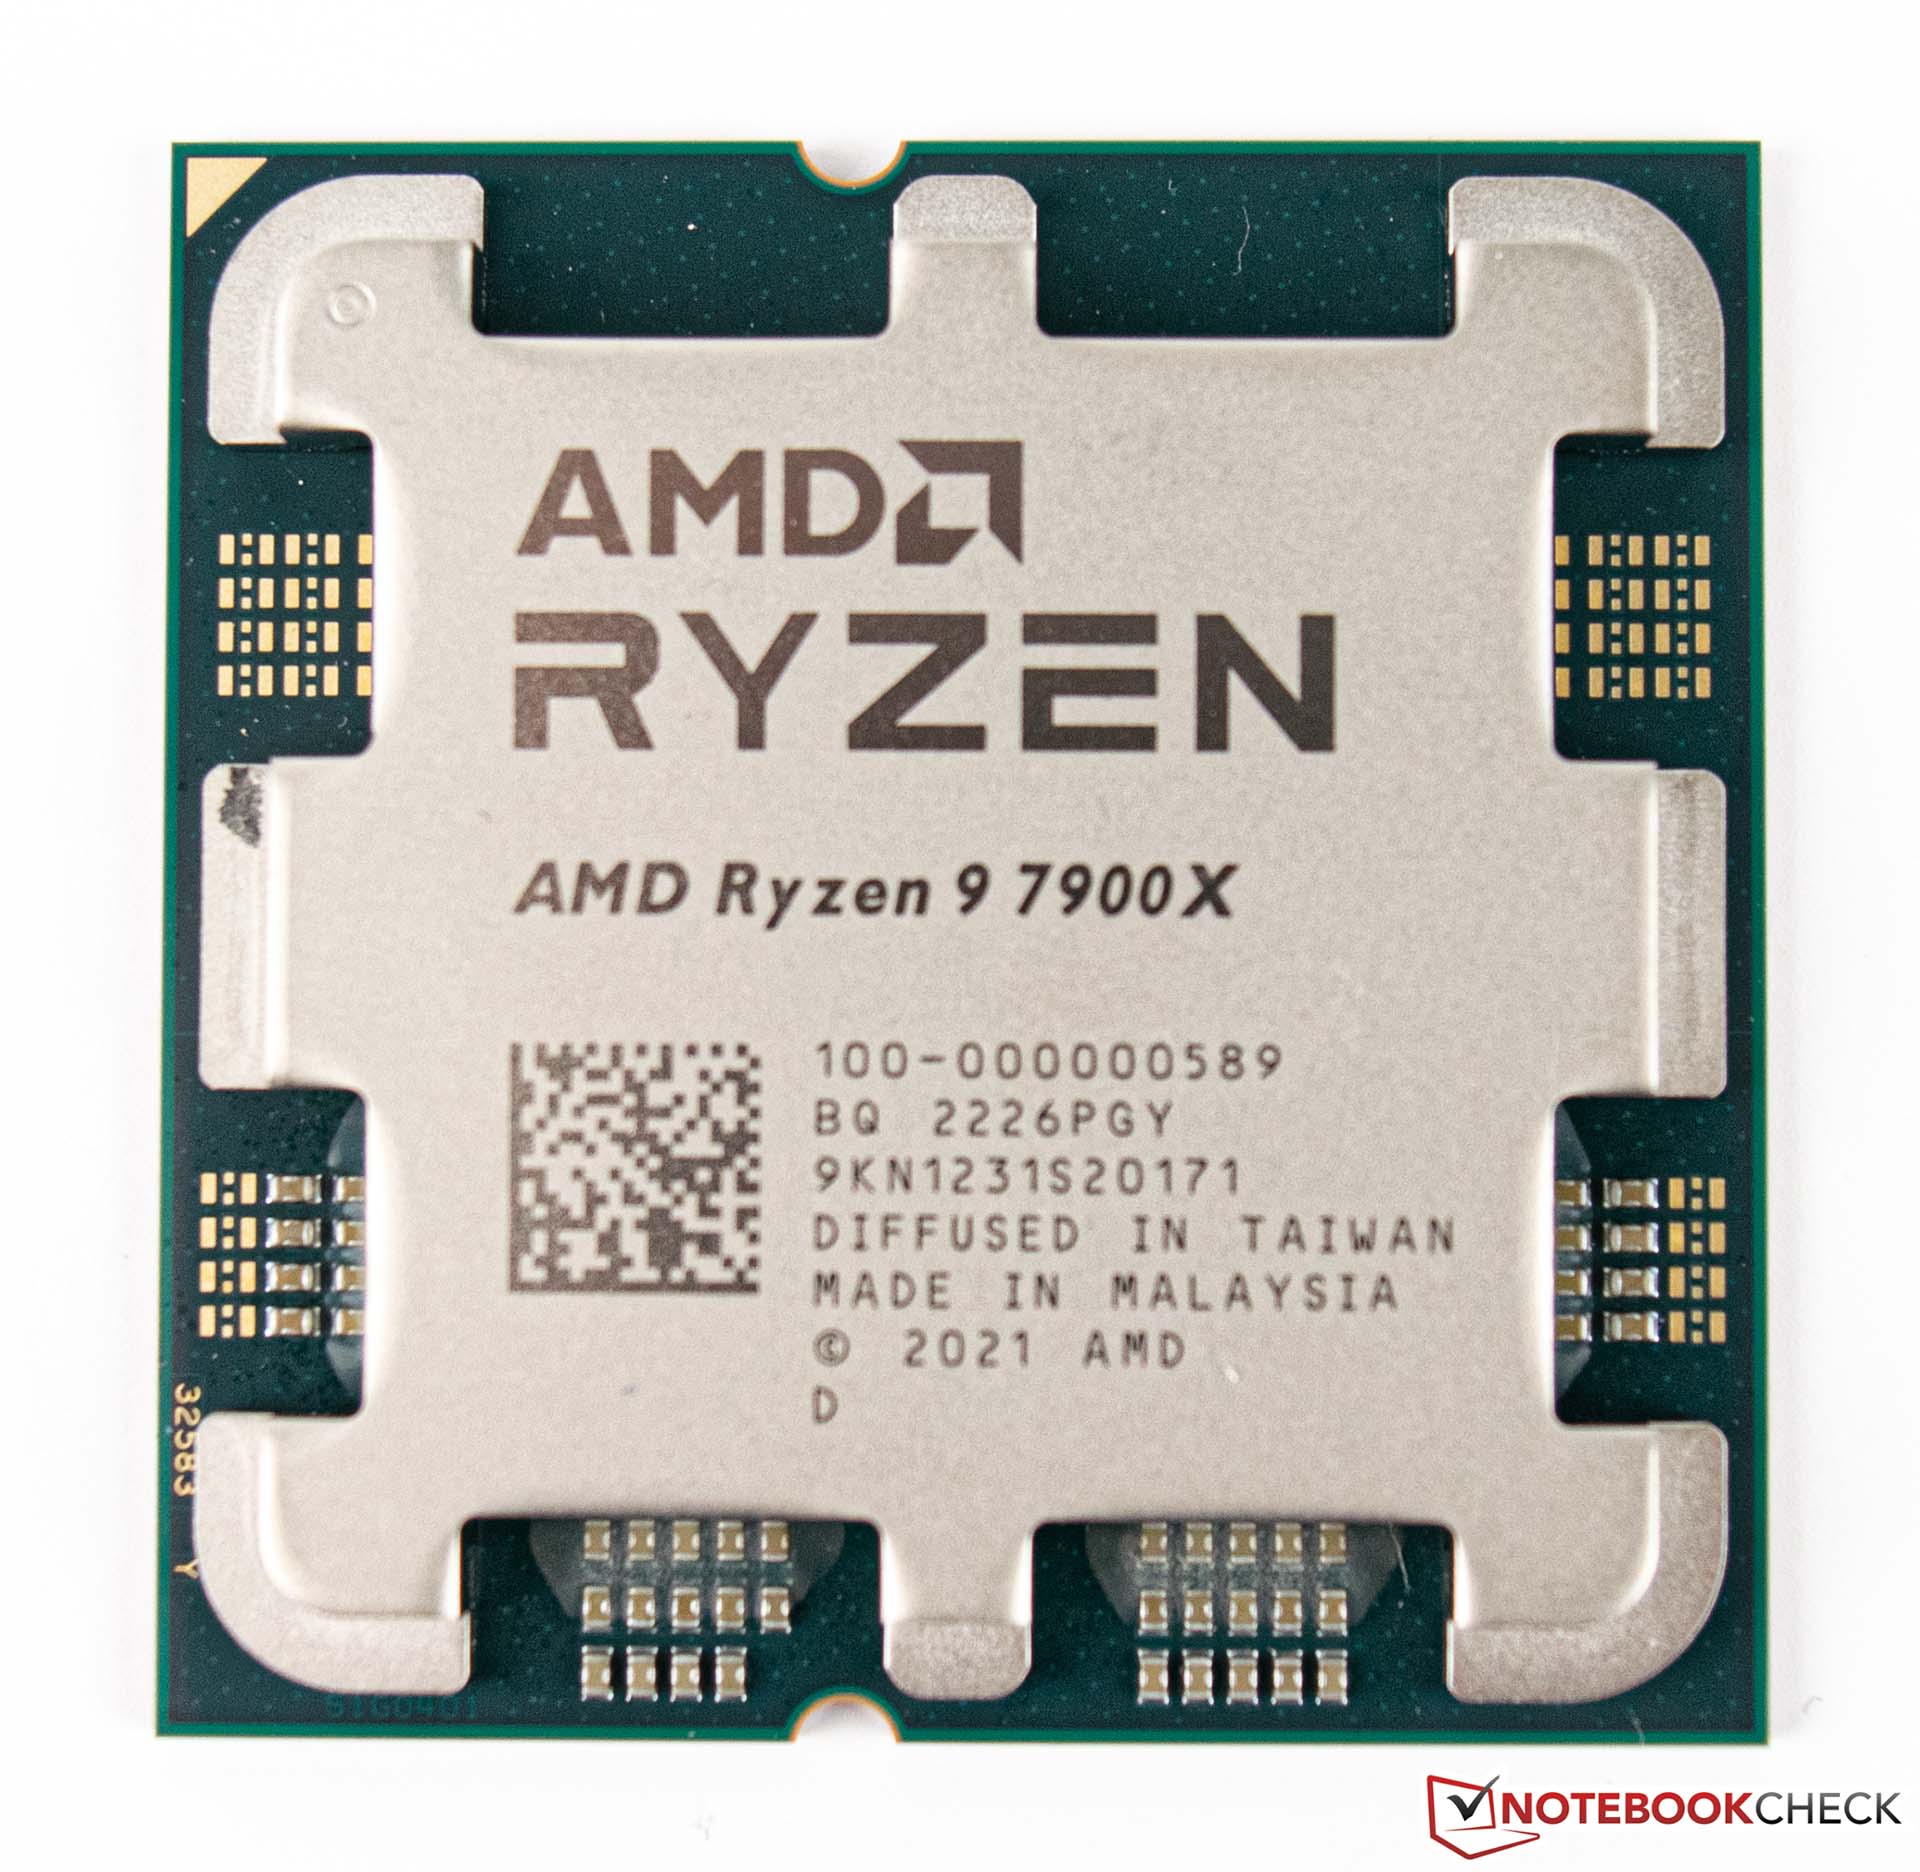
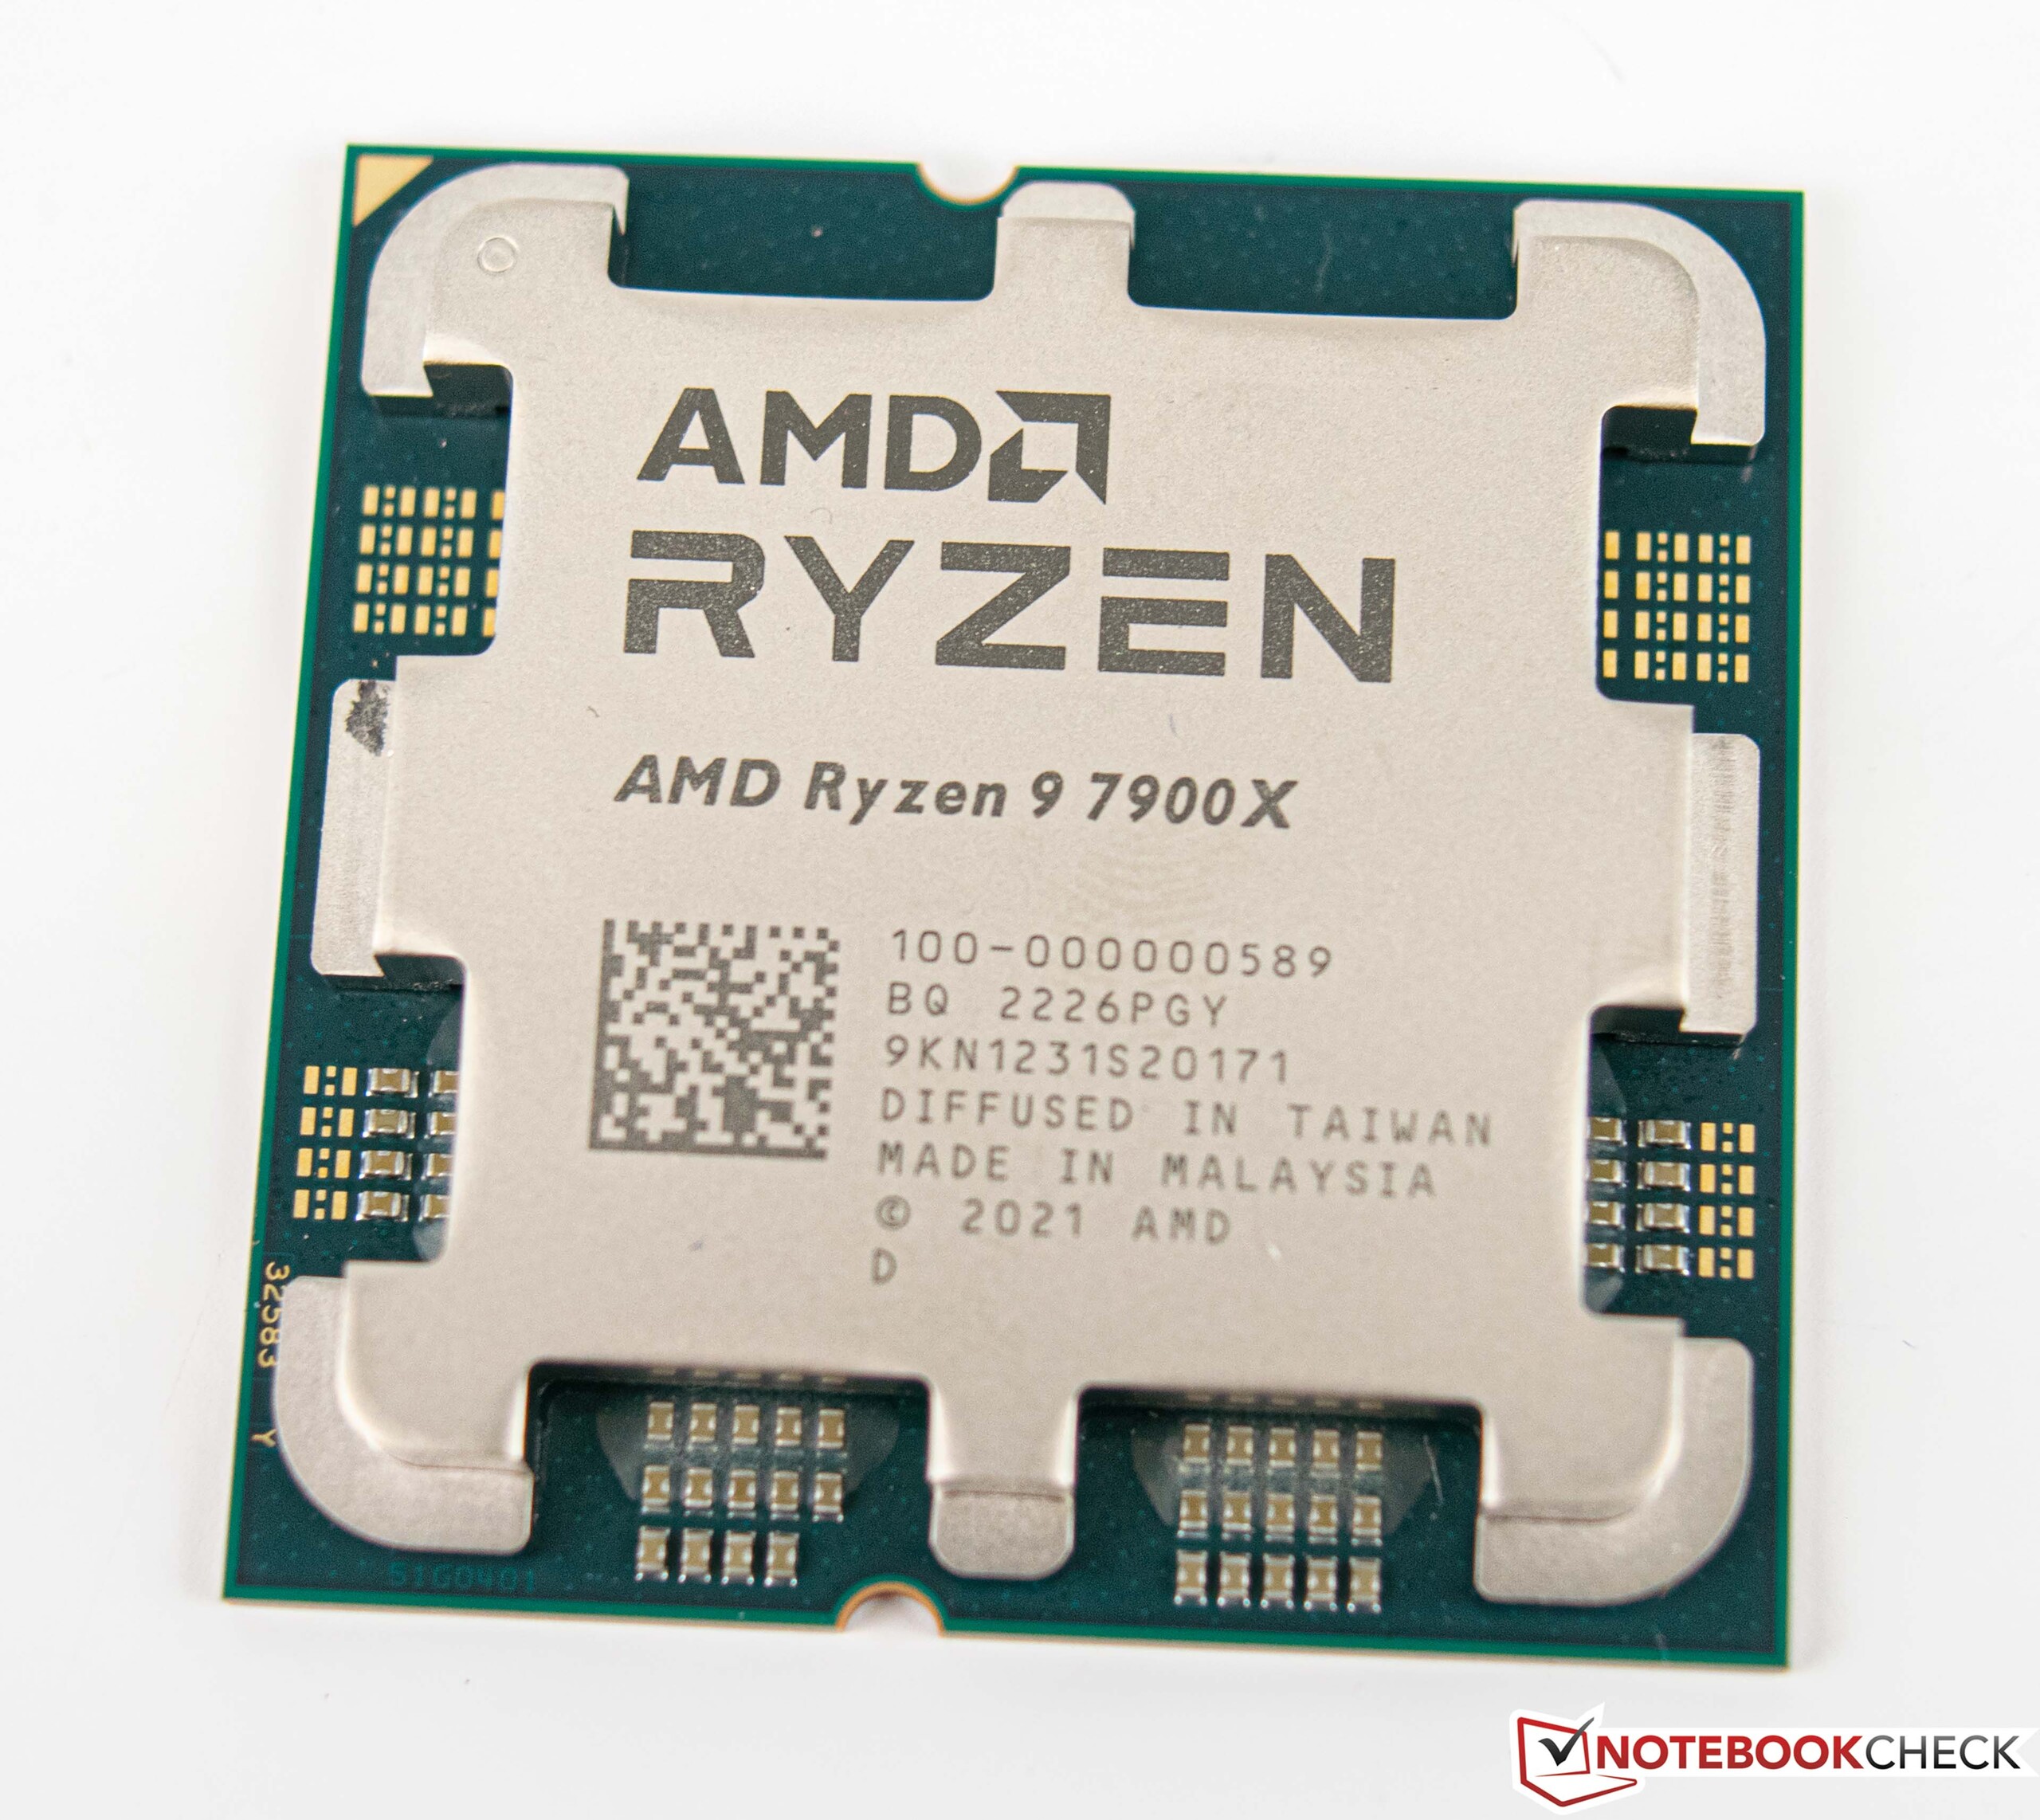
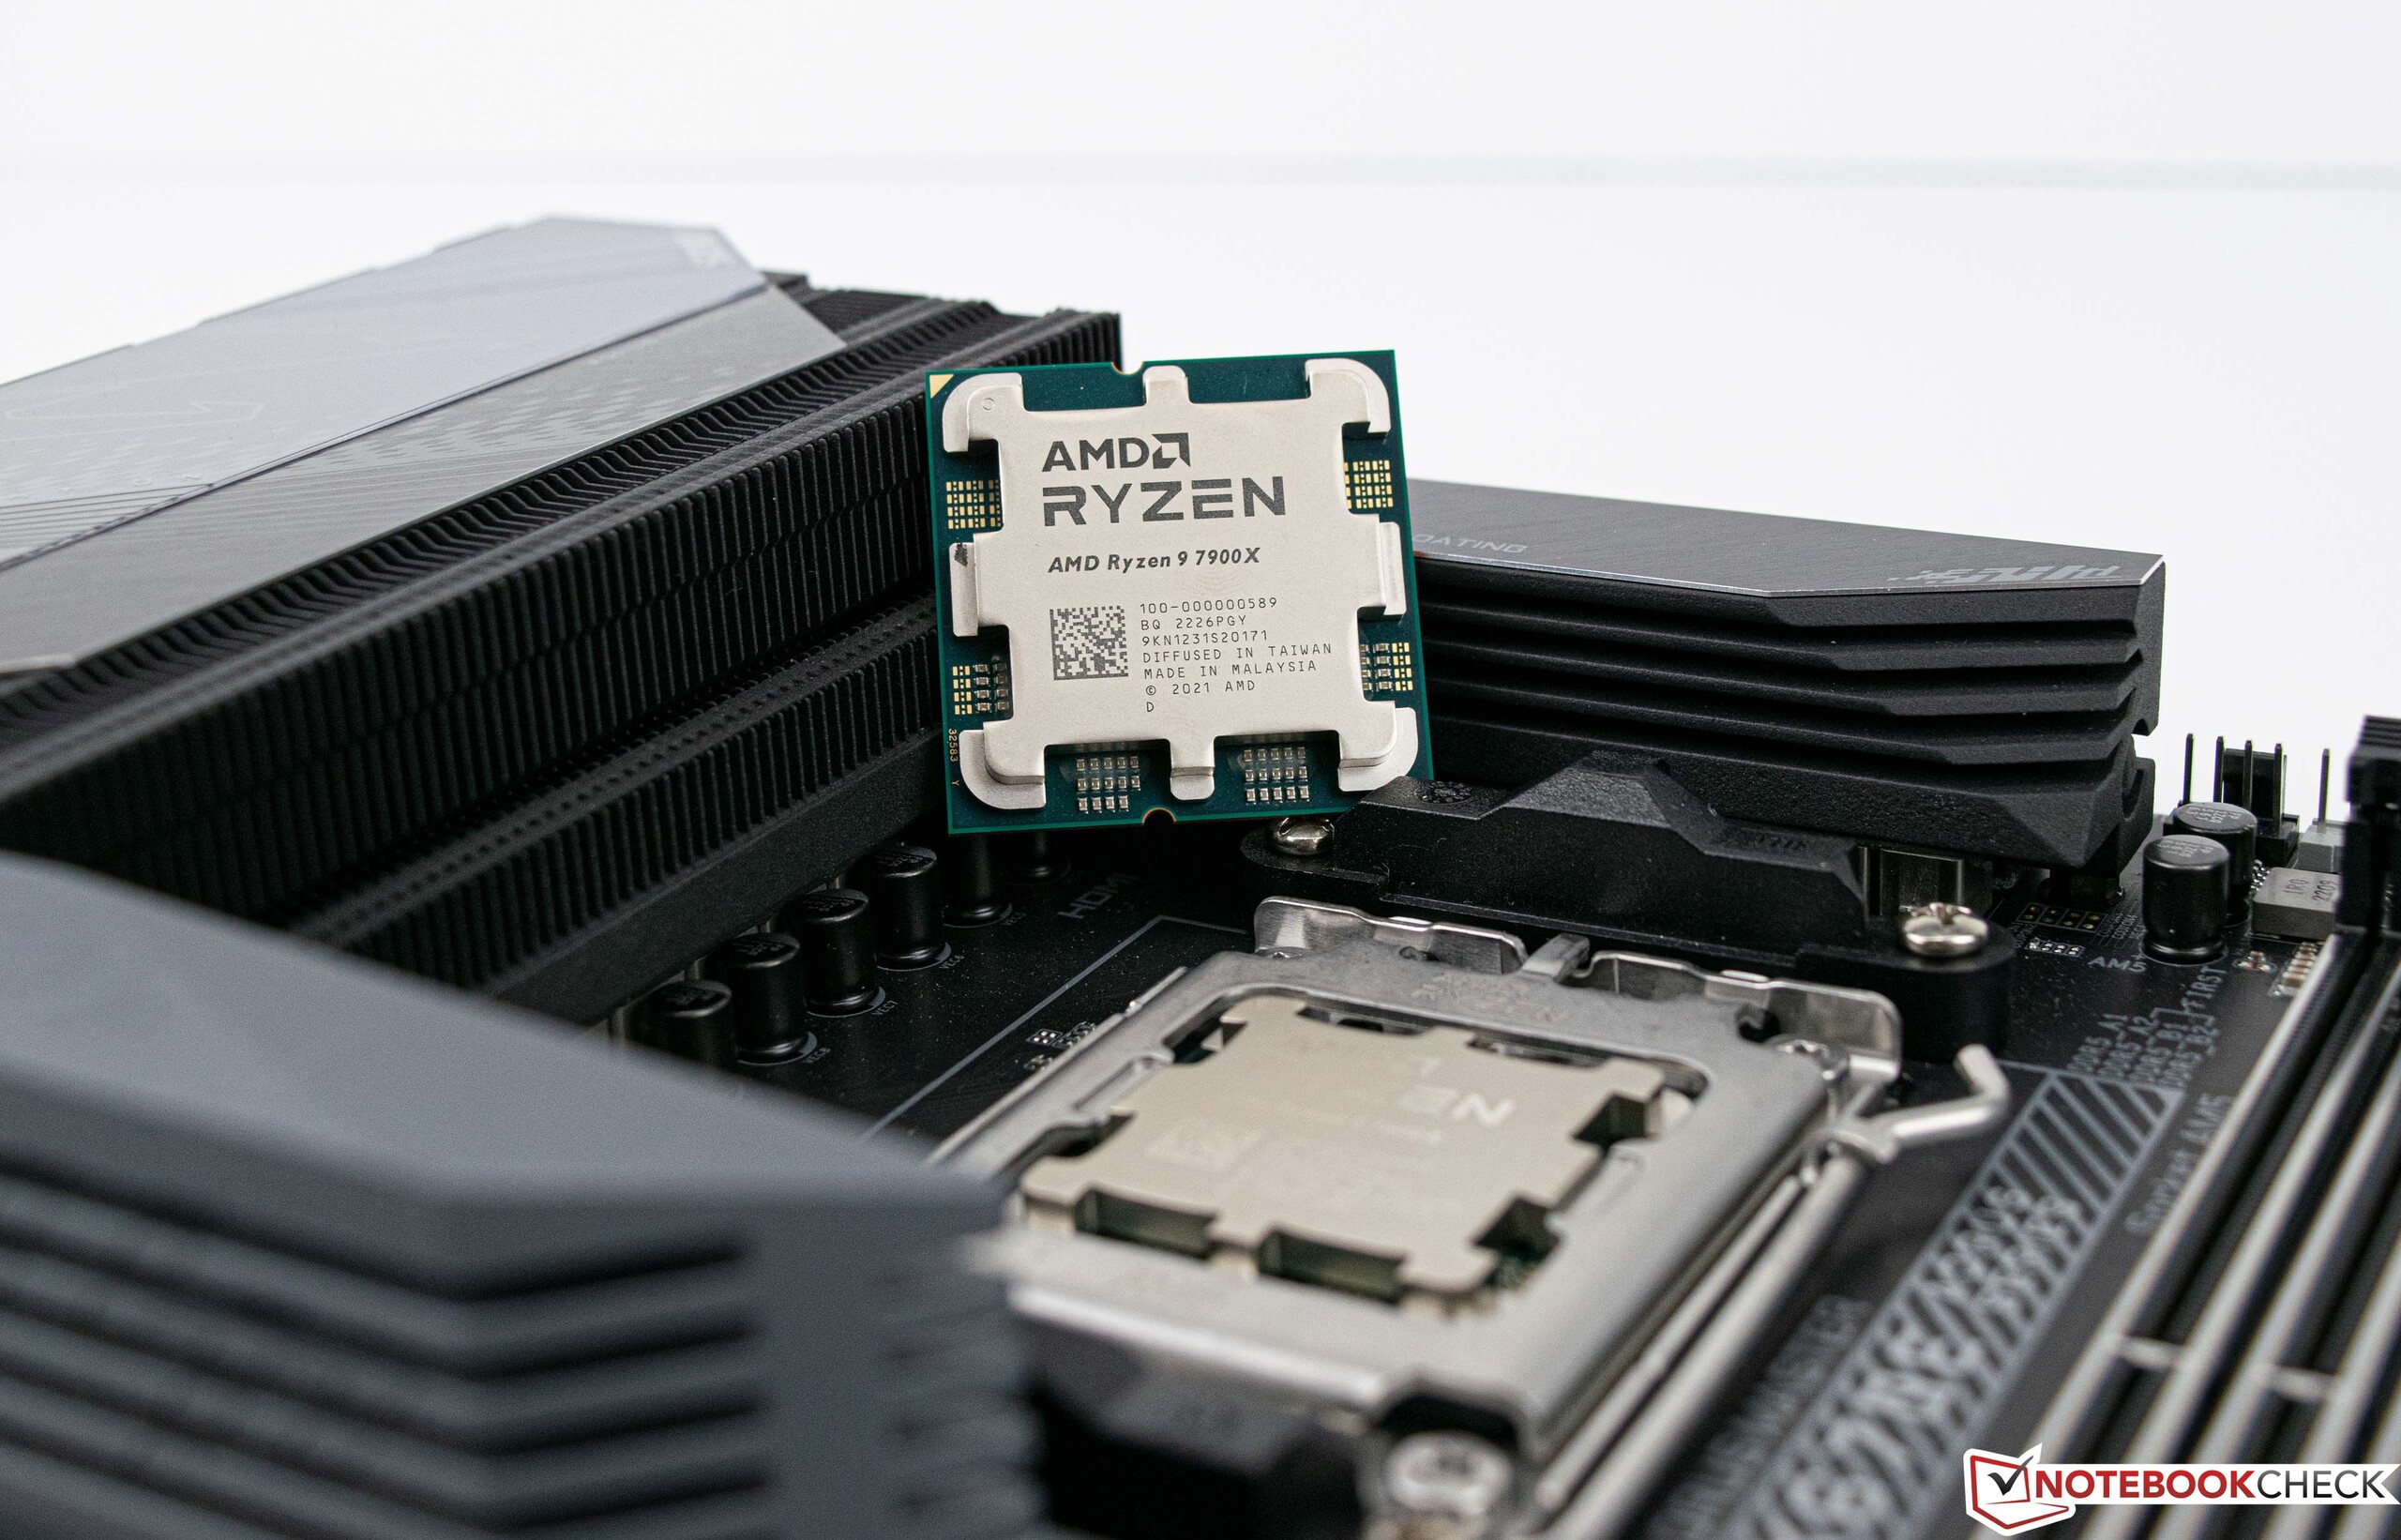
There are further visual differences in the processor itself in terms of the heat spreader compared to the previous models. Internally, however, AMD still relies on the so-called chiplet design, which consists of two CCDs with eight cores each and an I/O die in the AMD Ryzen 9 7950X. As is known, the two CCDs communicate via the Infinity Fabric with the I/O die, which now always includes an iGPU in addition to the new DDR5 memory controller.
The new processors are manufactured at TSMC and AMD takes the next step with the 5 nm process. Higher clock rates can thus be achieved, which AMD also utilizes very well. Up to 5.7 GHz is possible ex-factory in Turbo mode in the Ryzen 9 7950X. The Ryzen 9 7900X still has 5.6 GHz in its spec sheet. At this point, we can already say that these clock rates were also achieved in our tests. Together with the higher IPC and the significantly increased clock rates, users can look forward to a decent performance increase.
However, the performance gain has one drawback, because the TDP of the new Ryzen 9 models has increased upwards to 170 W. AMD even specifies up to 230 W for the entire package (PPT - Package Power Tracking). However, that is still less than what Intel allows for its current processors — up to 241 W under load.
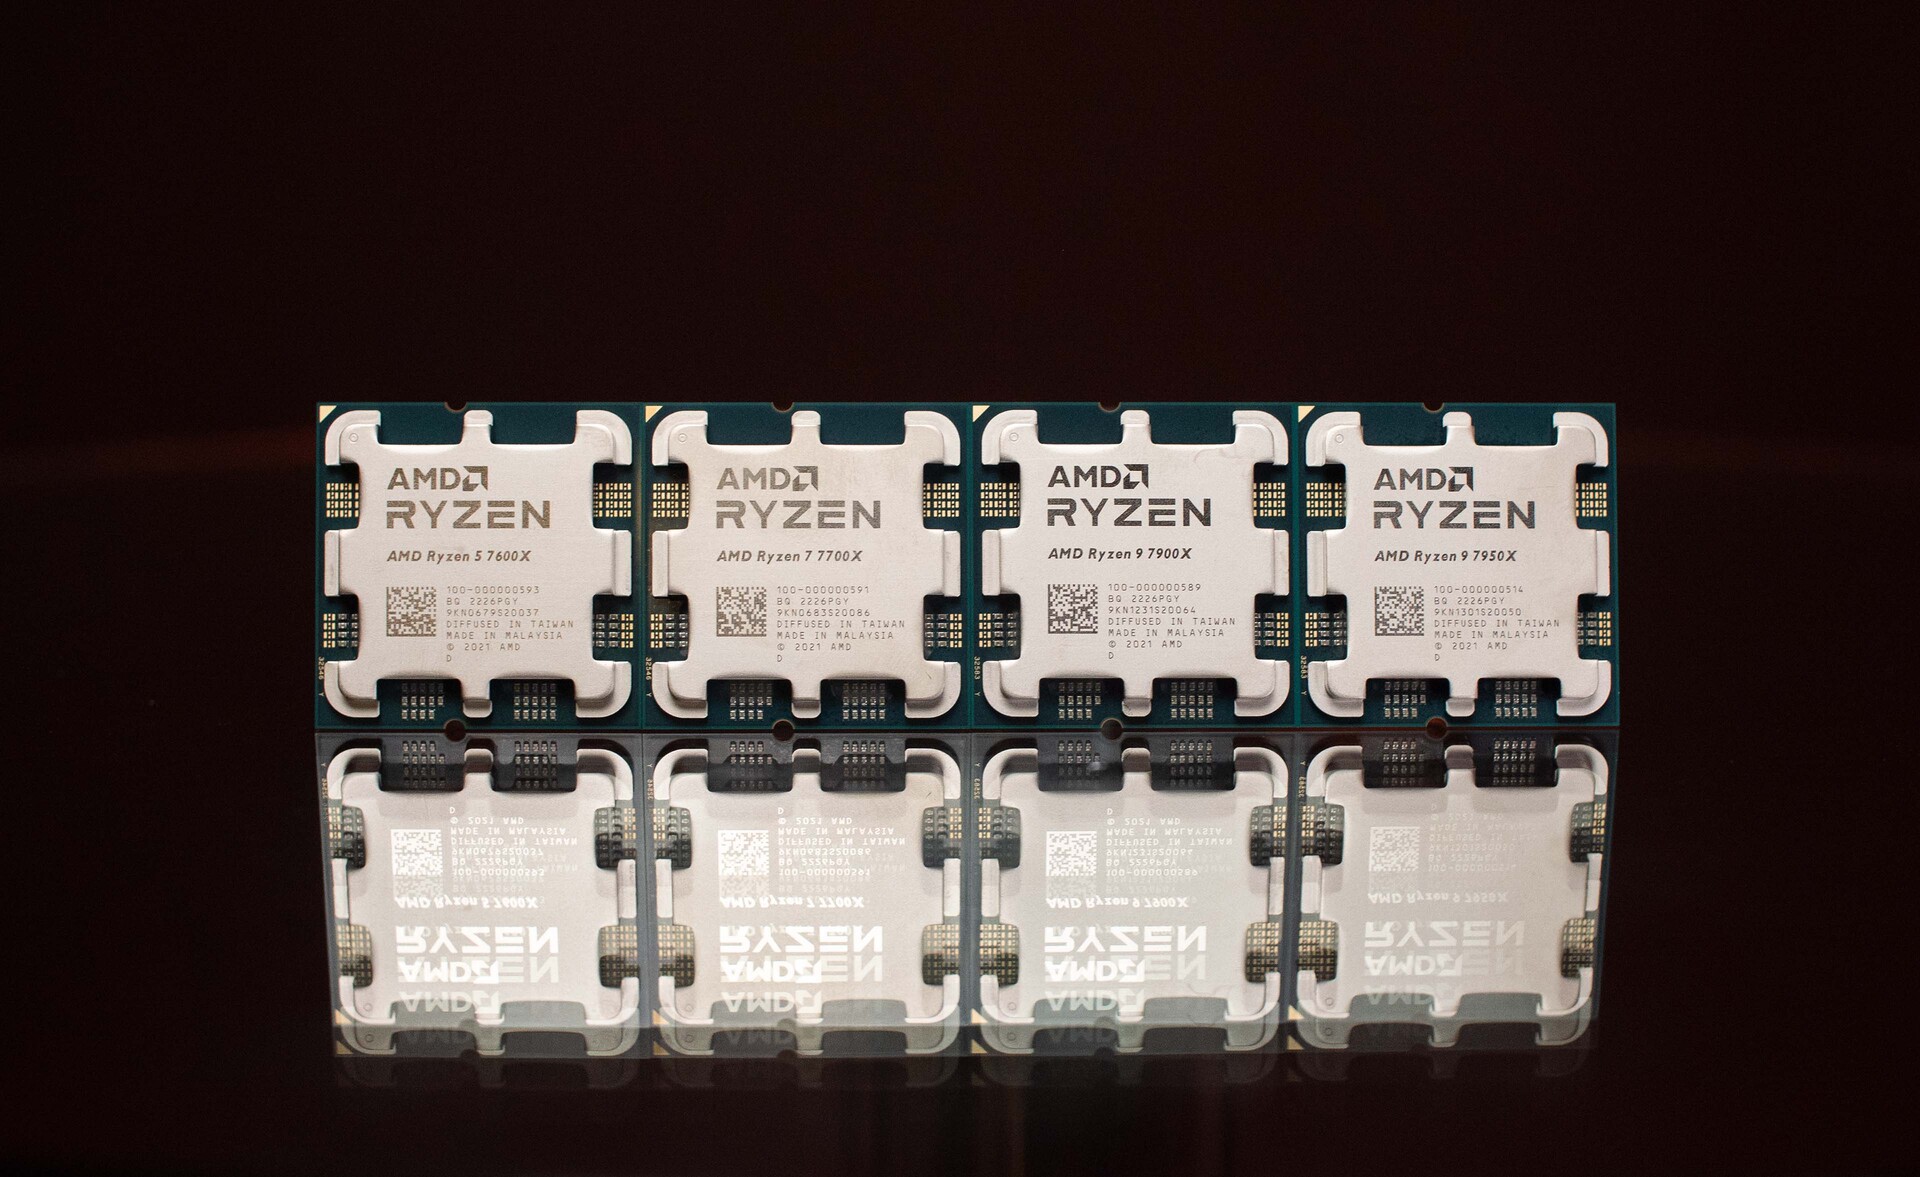
The AMD Ryzen 7000 family at a glance
| Model | Cores/Threads | Base clock | Turbo clock | L2 cache | L3 cache | TDP | PPT | Launch price |
|---|---|---|---|---|---|---|---|---|
| Ryzen 9 7950X | 16/32 | 4.5 GHz | 5.7 GHz | 16x 1 MB | 64 MB | 170 W | 230 W | 699 USD / 849 EUR |
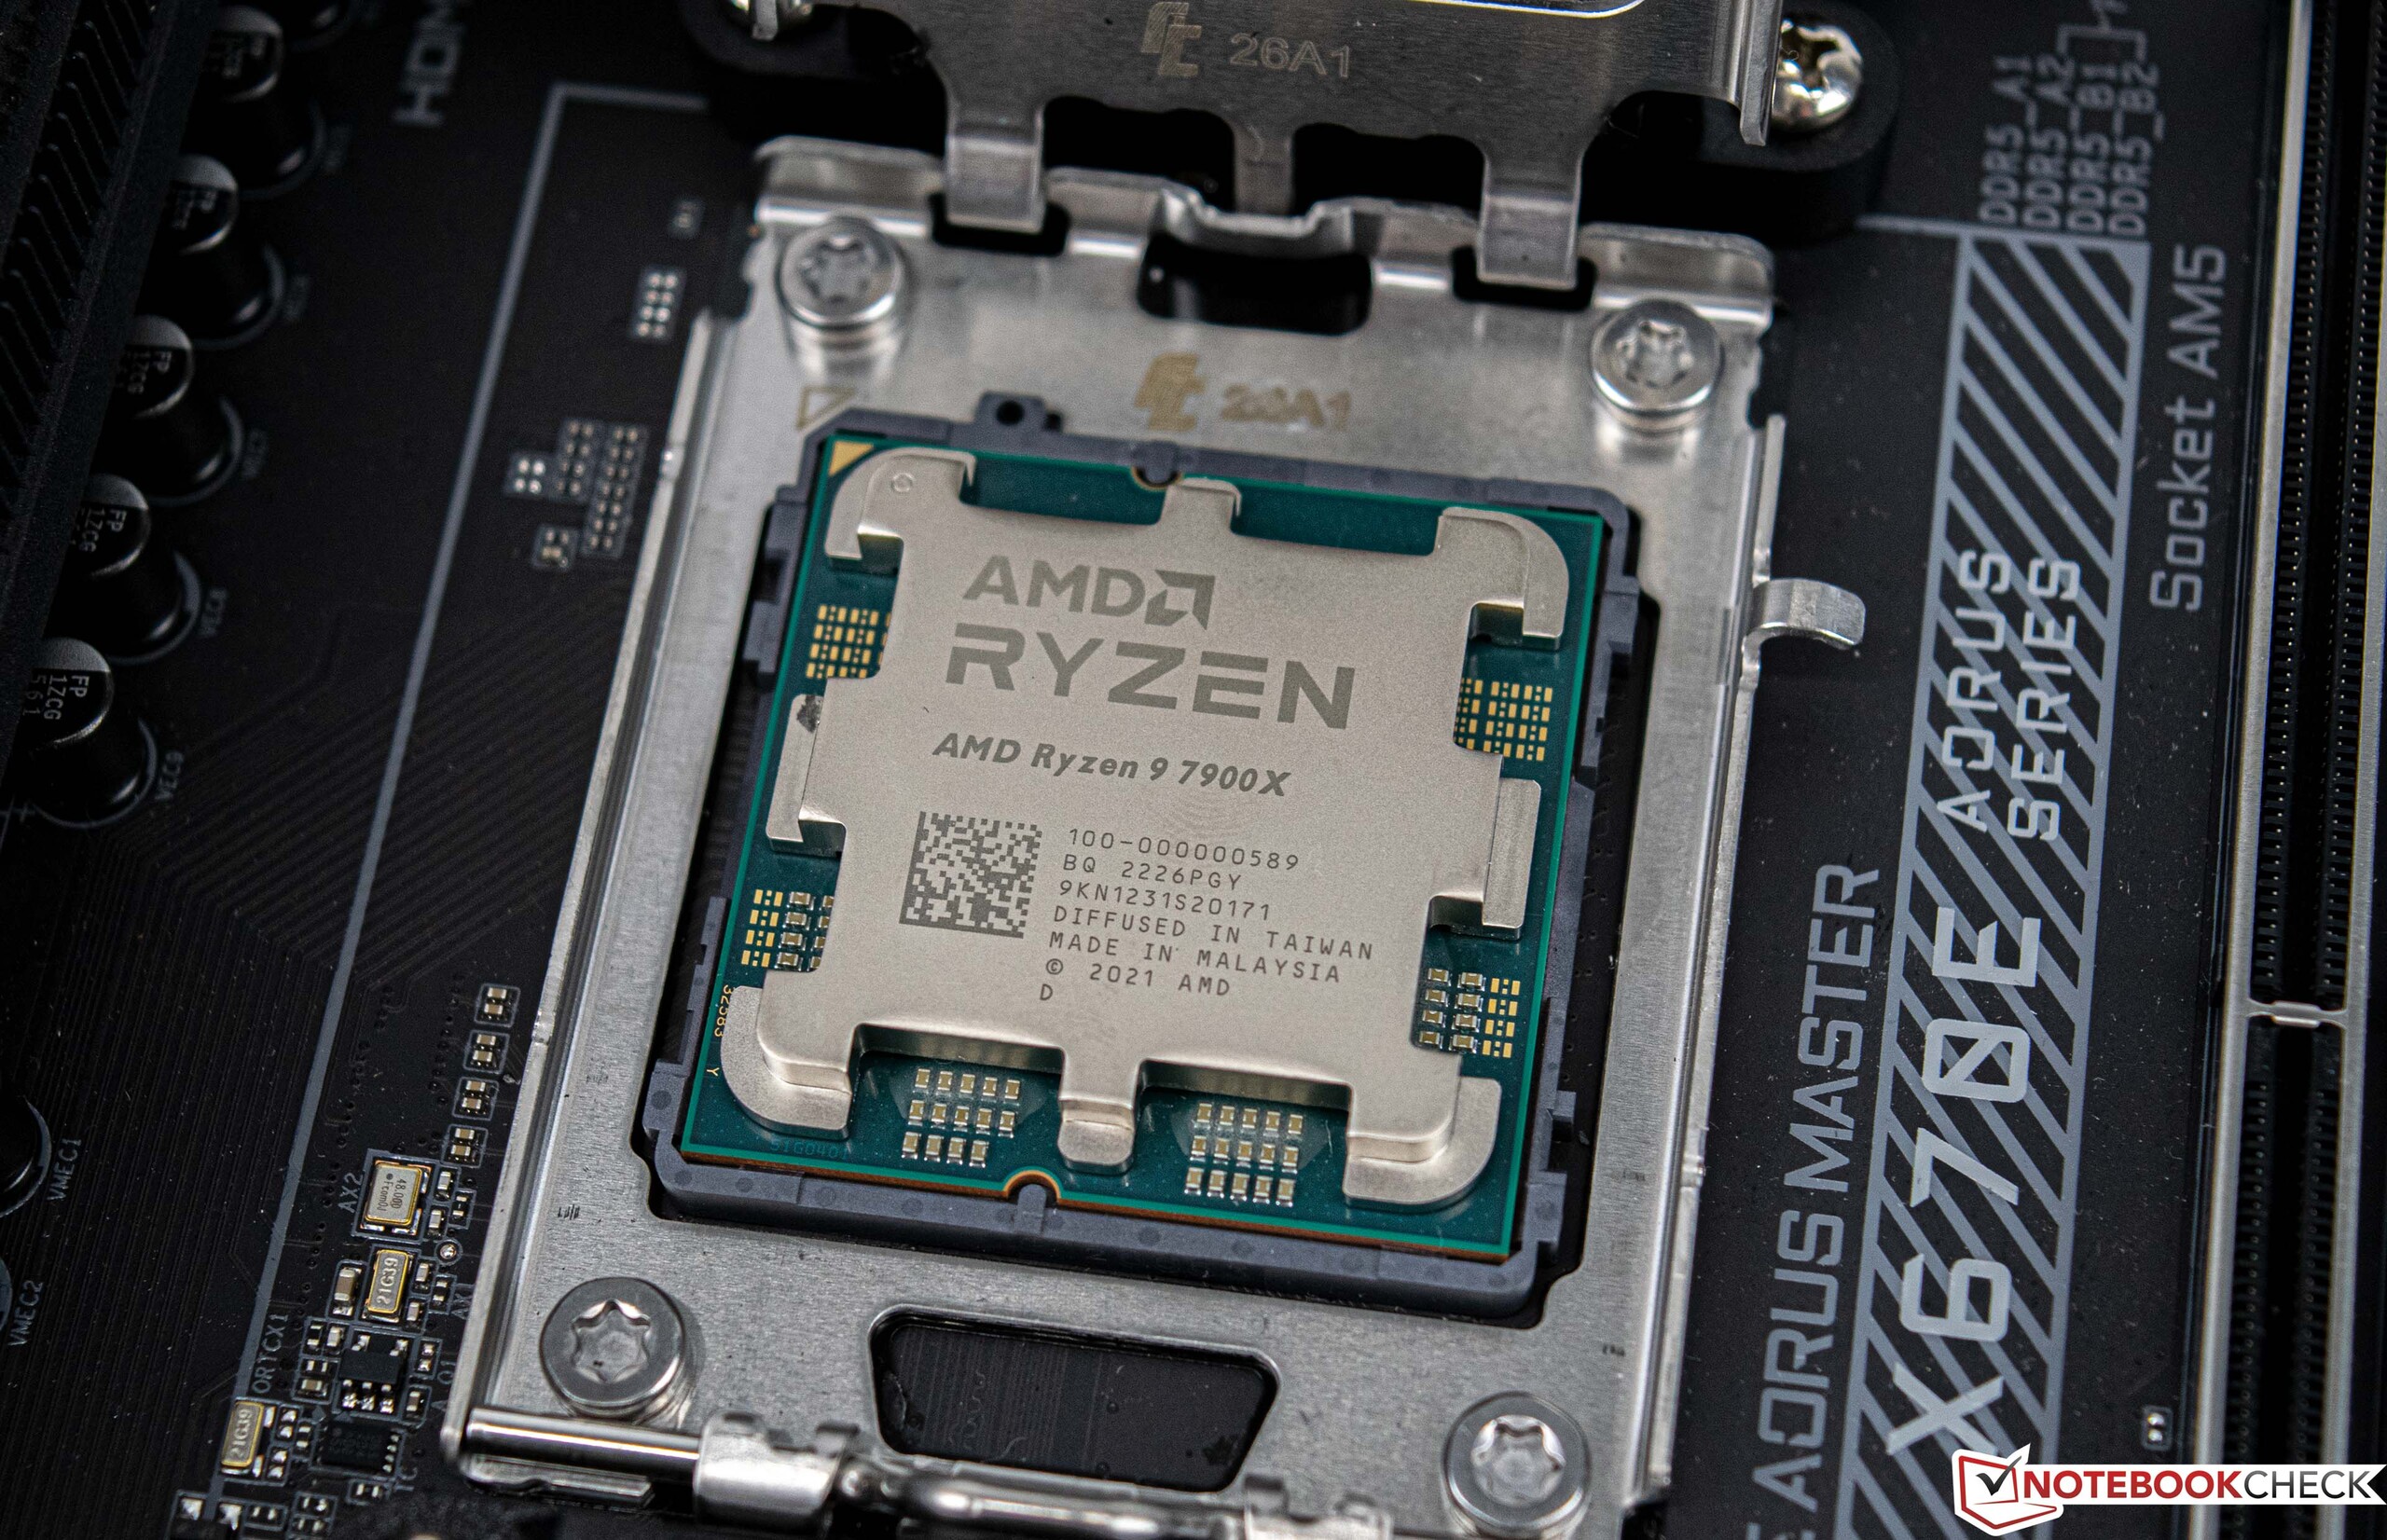
| Ryzen 9 7900X | 12/24 | 4.7 GHz | 5.6 GHz | 12x 1 MB | 64 MB | 170 W | 230 W | 549 USD / 669 EUR |
| Ryzen 7 7700X | 8/16 | 4.5 GHz | 5.4 GHz | 8x 1 MB | 32 MB | 105 W | 142 W | 399 USD / 479 EUR |
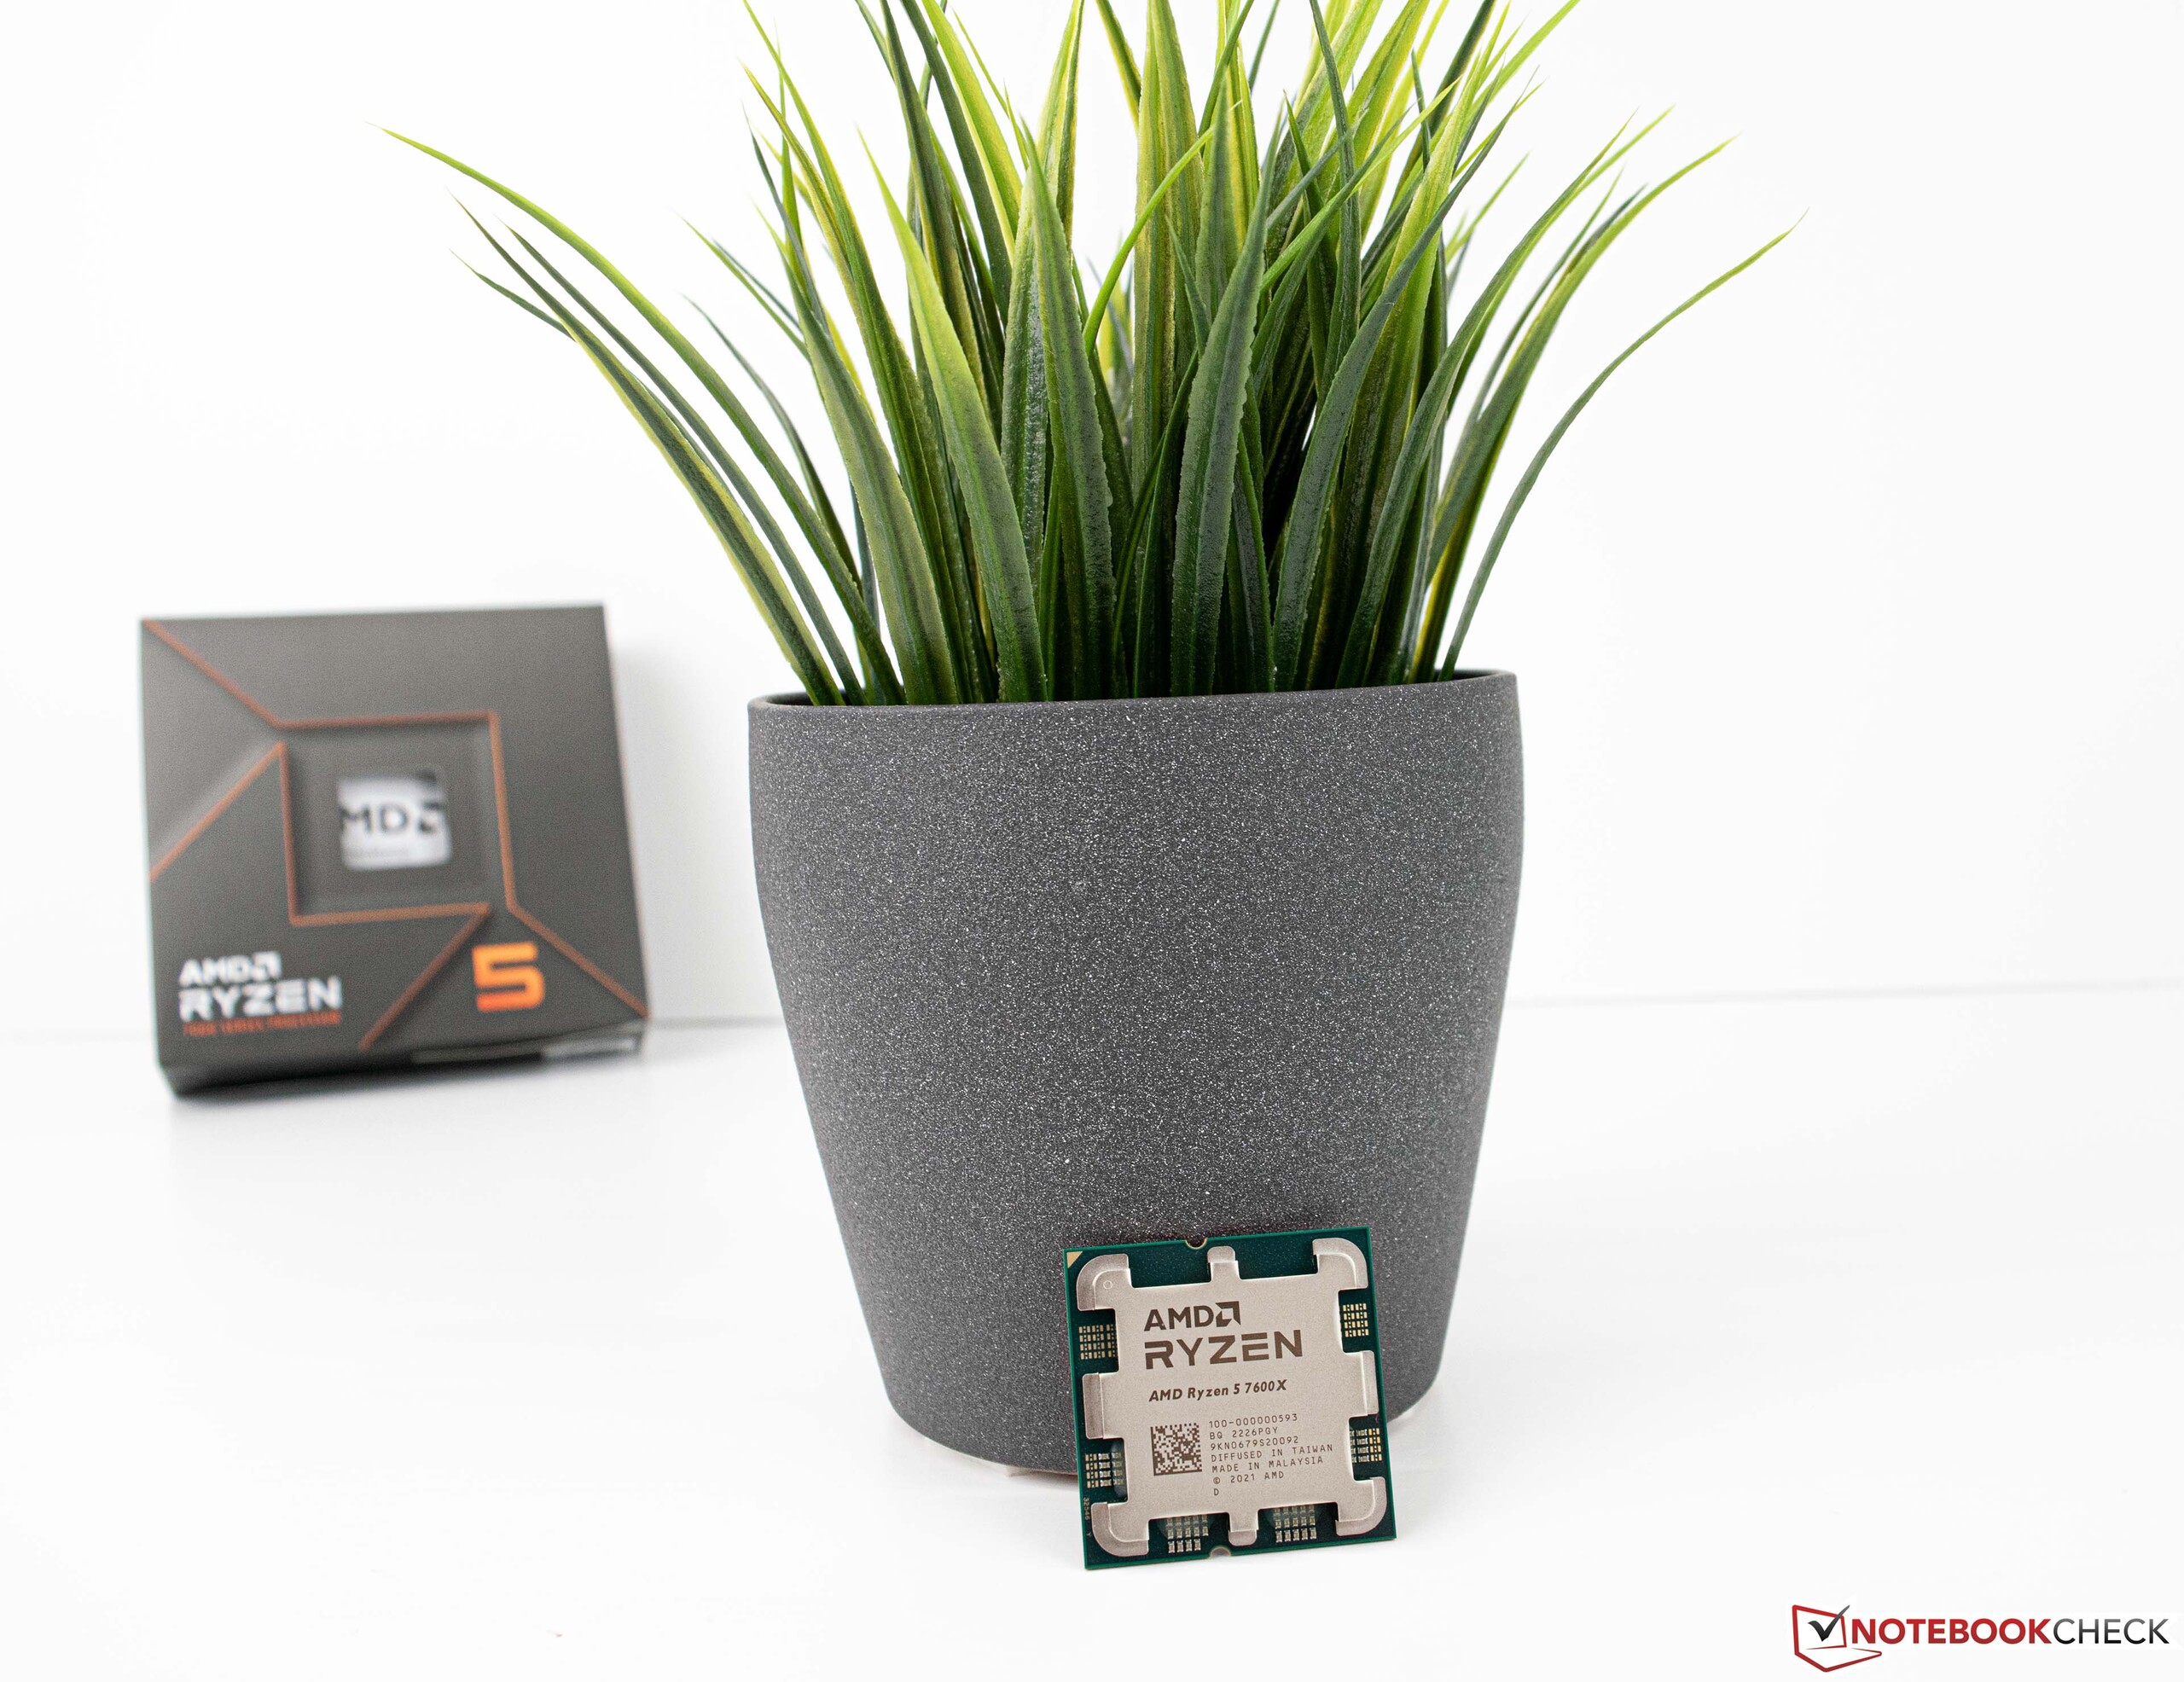
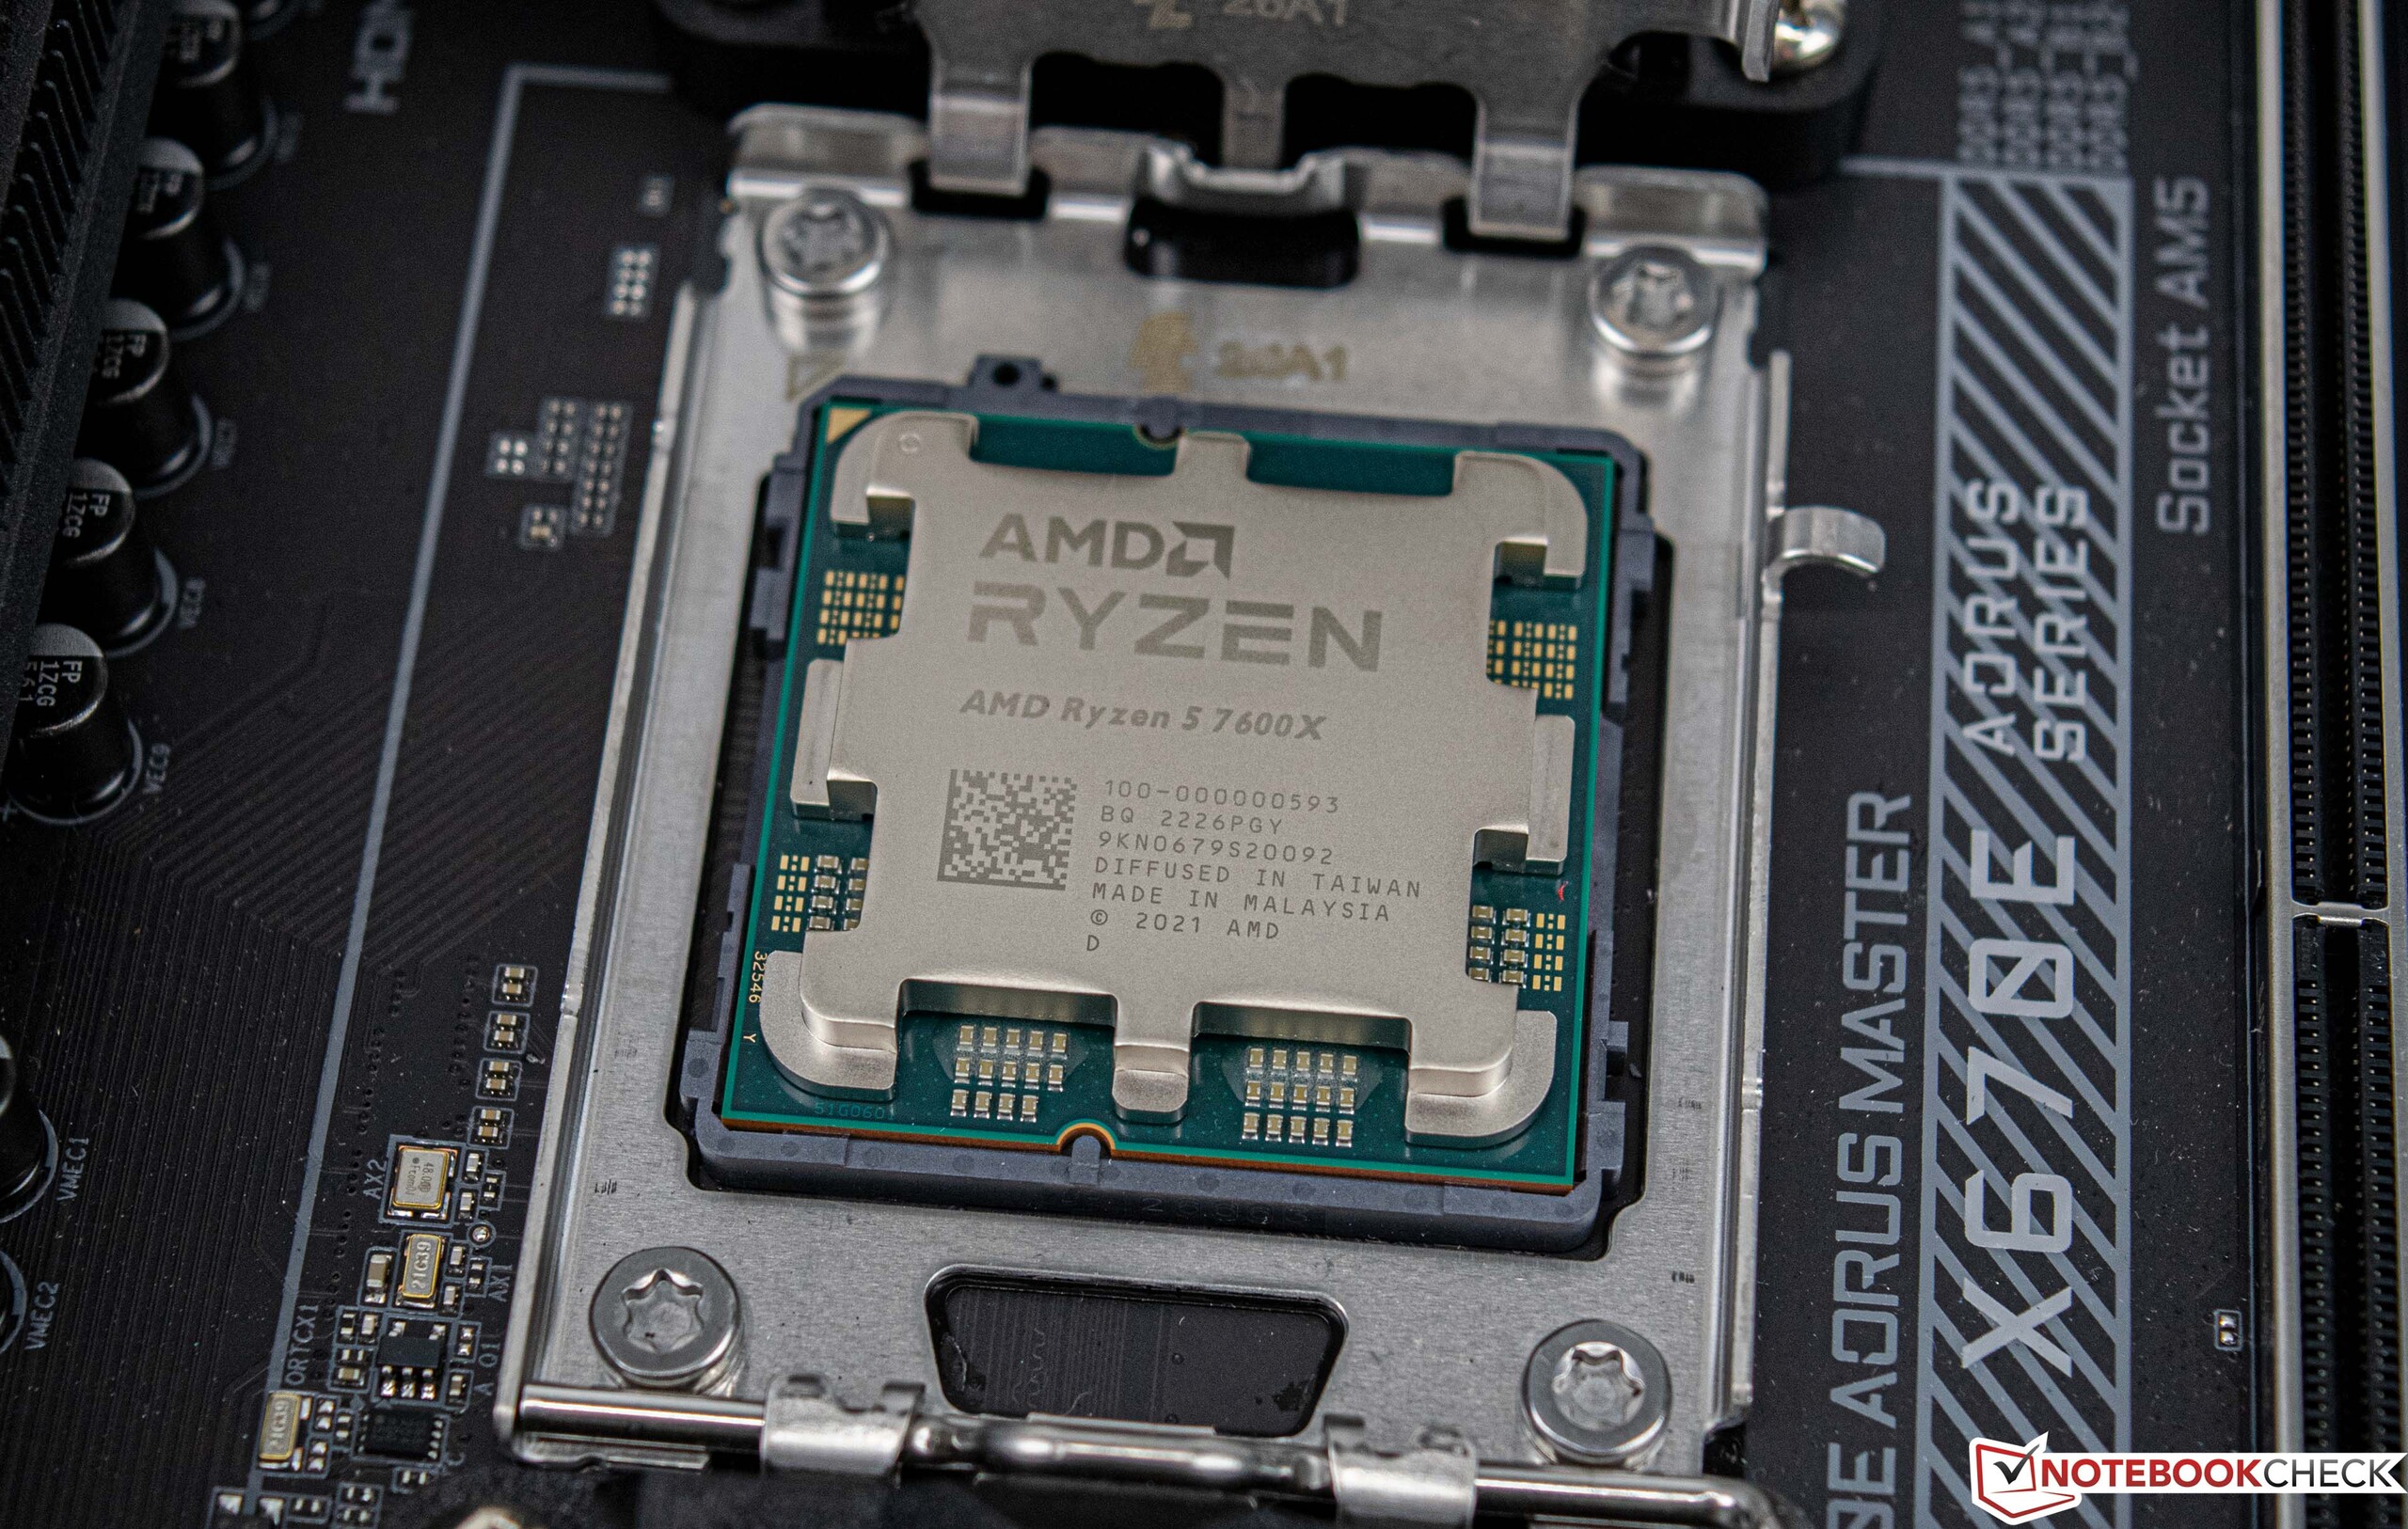
| Ryzen 5 7600X | 6/12 | 4.7 GHz | 5.3 GHz | 6x 1 MB | 32 MB | 105 W | 142 W | 299 USD / 359 EUR |
The test system
We use the following system for the following benchmarks and tests
- Raijintek Pean Benchtable
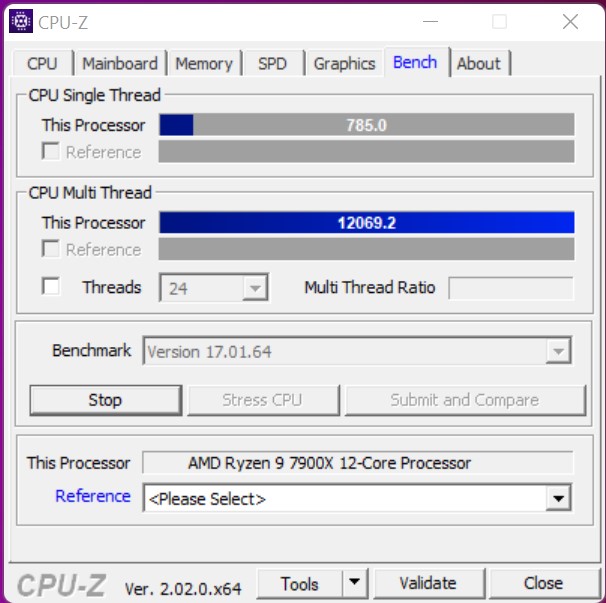
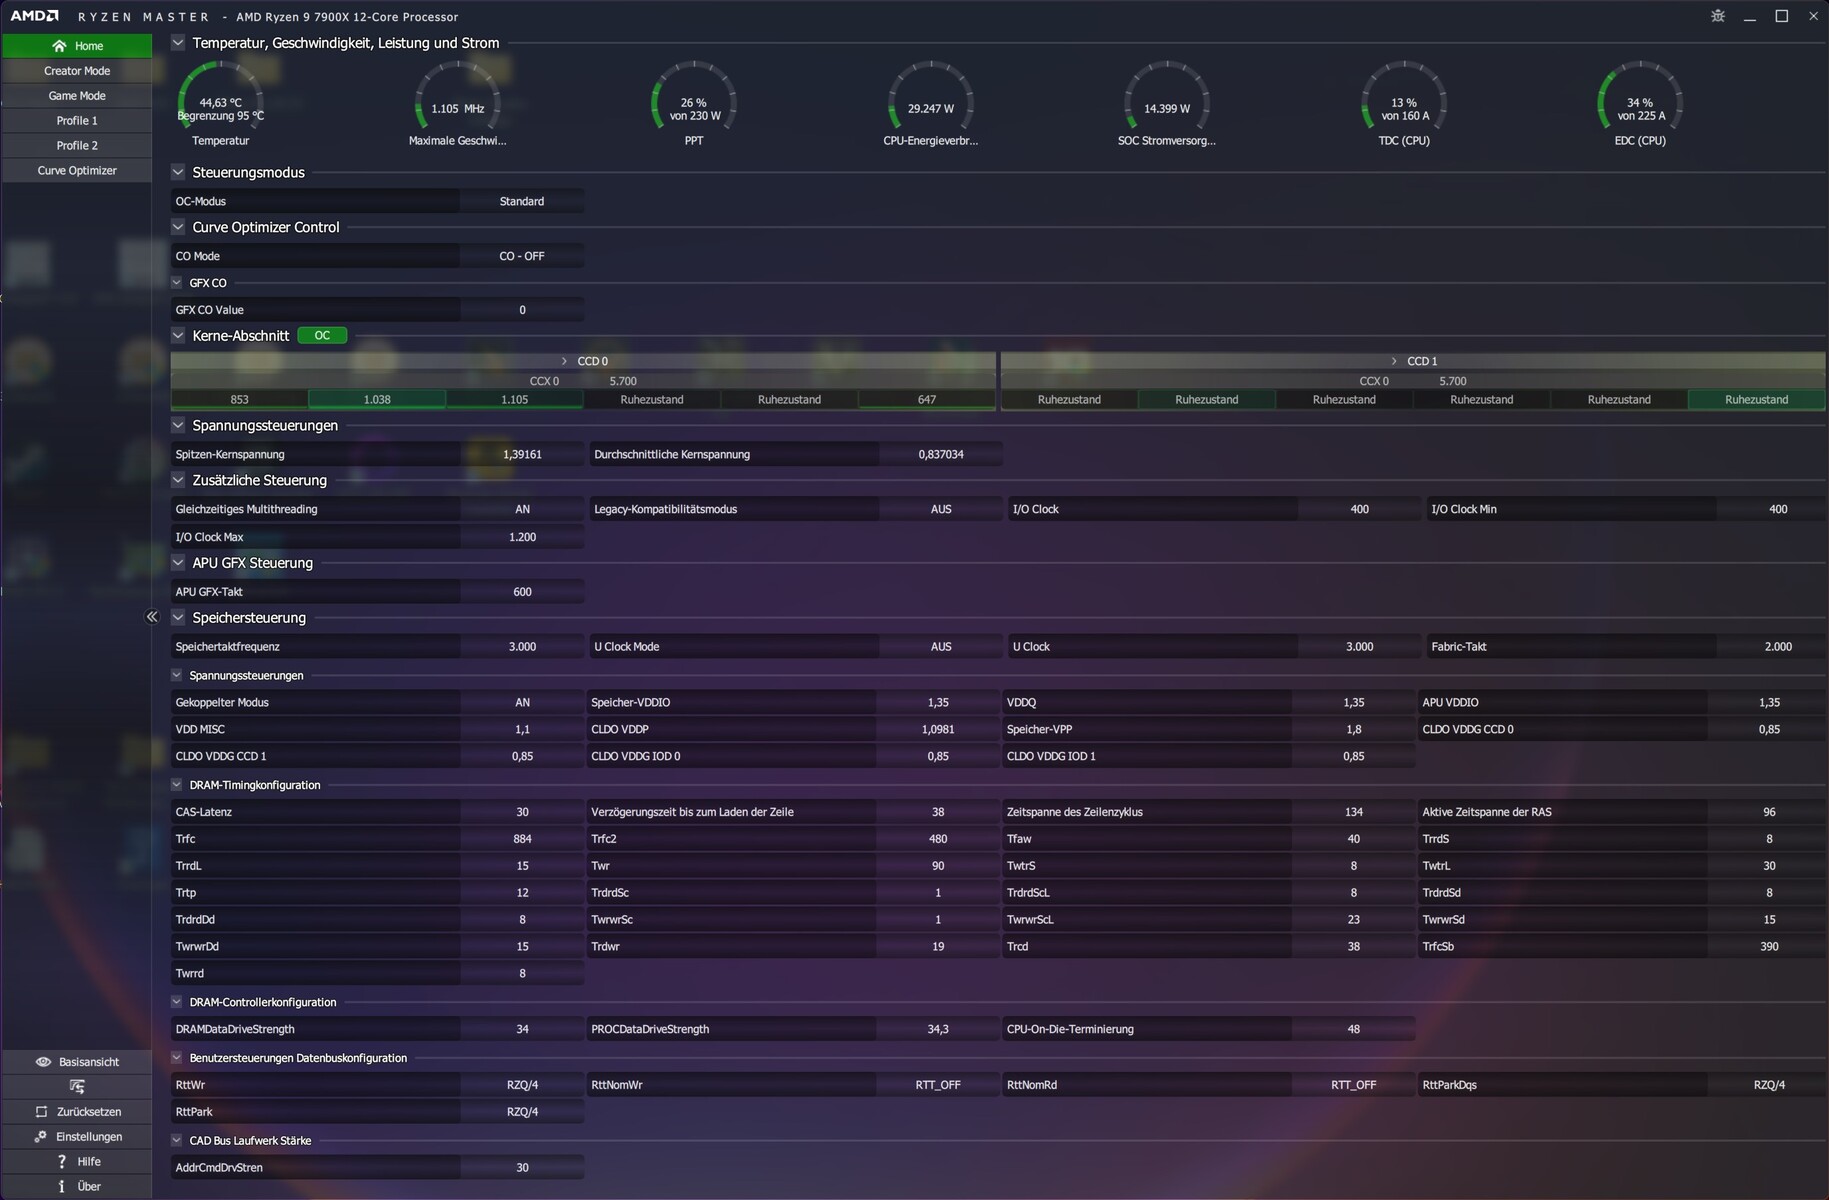
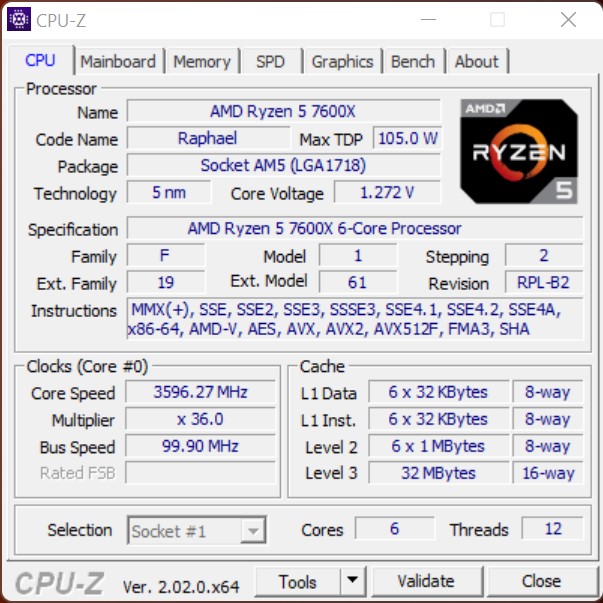
- AMD Ryzen 9 7900X, AMD Ryzen 5 7600X
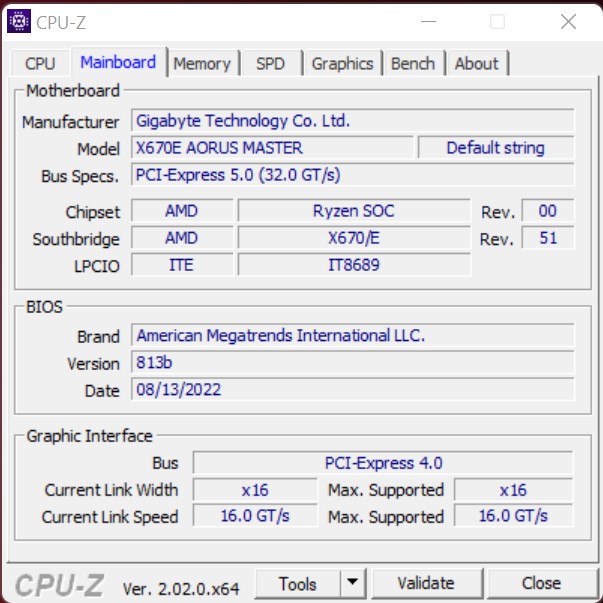
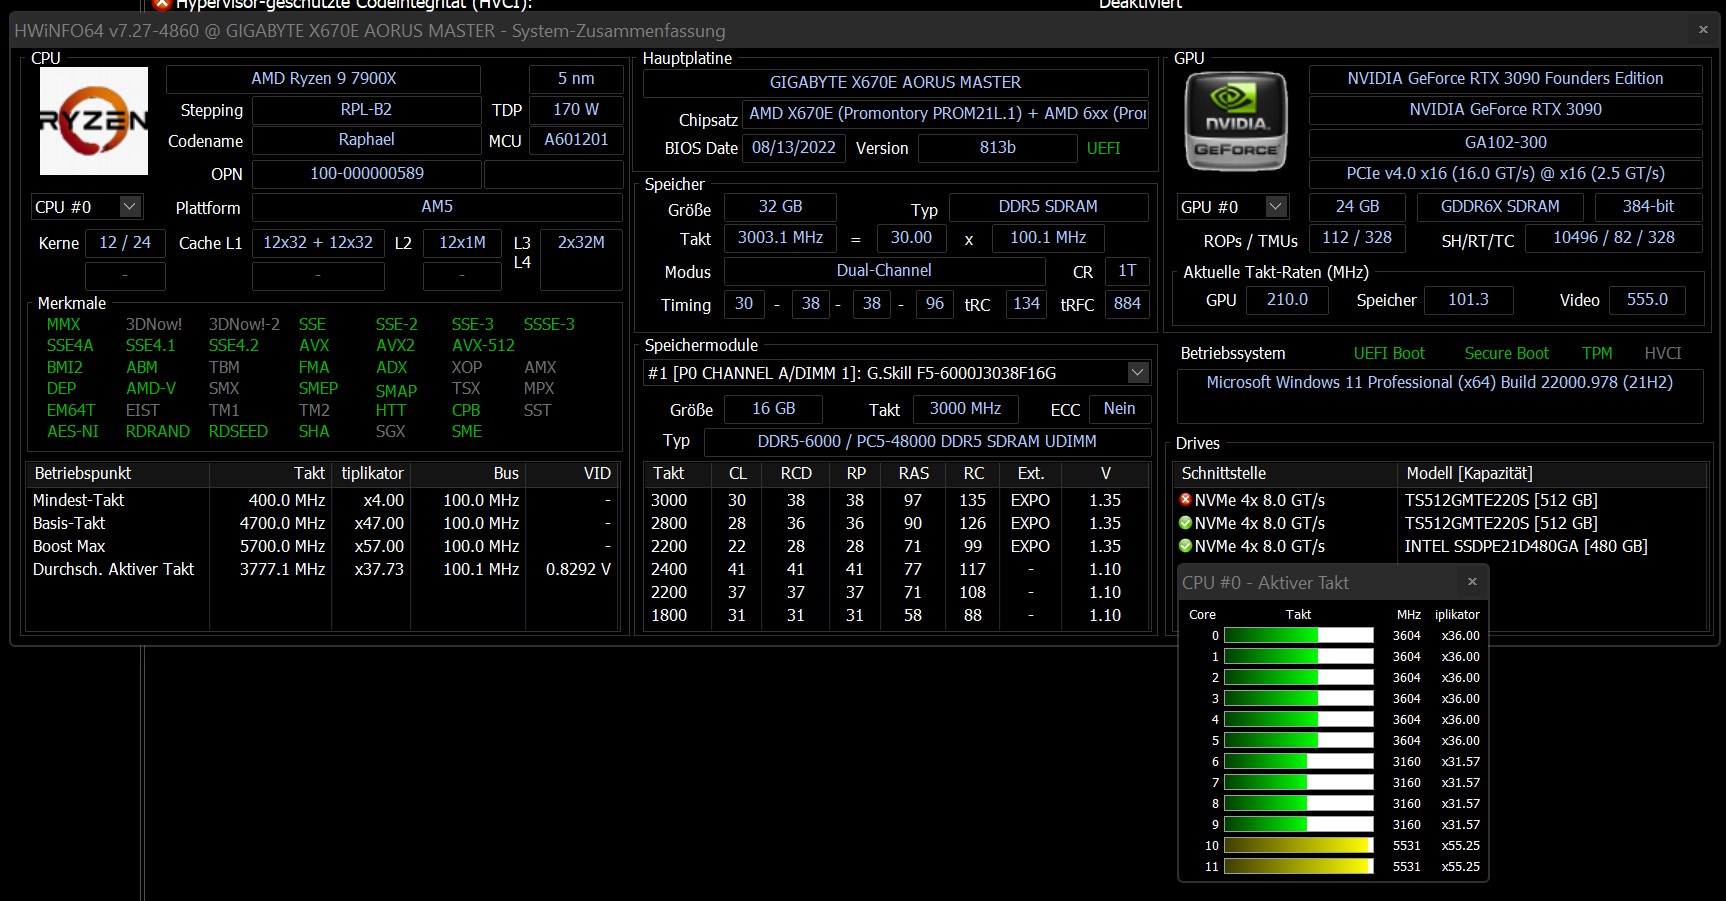
- Gigabyte X670E Aorus Master, BIOS: 813b
- Alphacool Eisbear 280 AiO
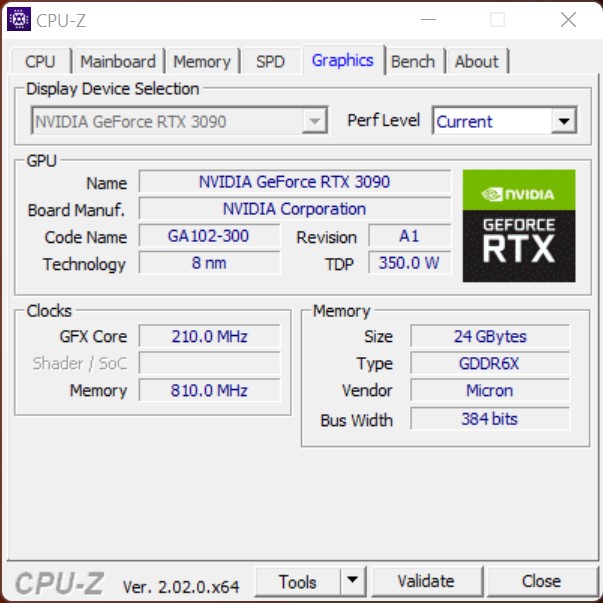
- Nvidia GeForce RTX 3090 Founders Edition
- Corsair HX 1200i power supply
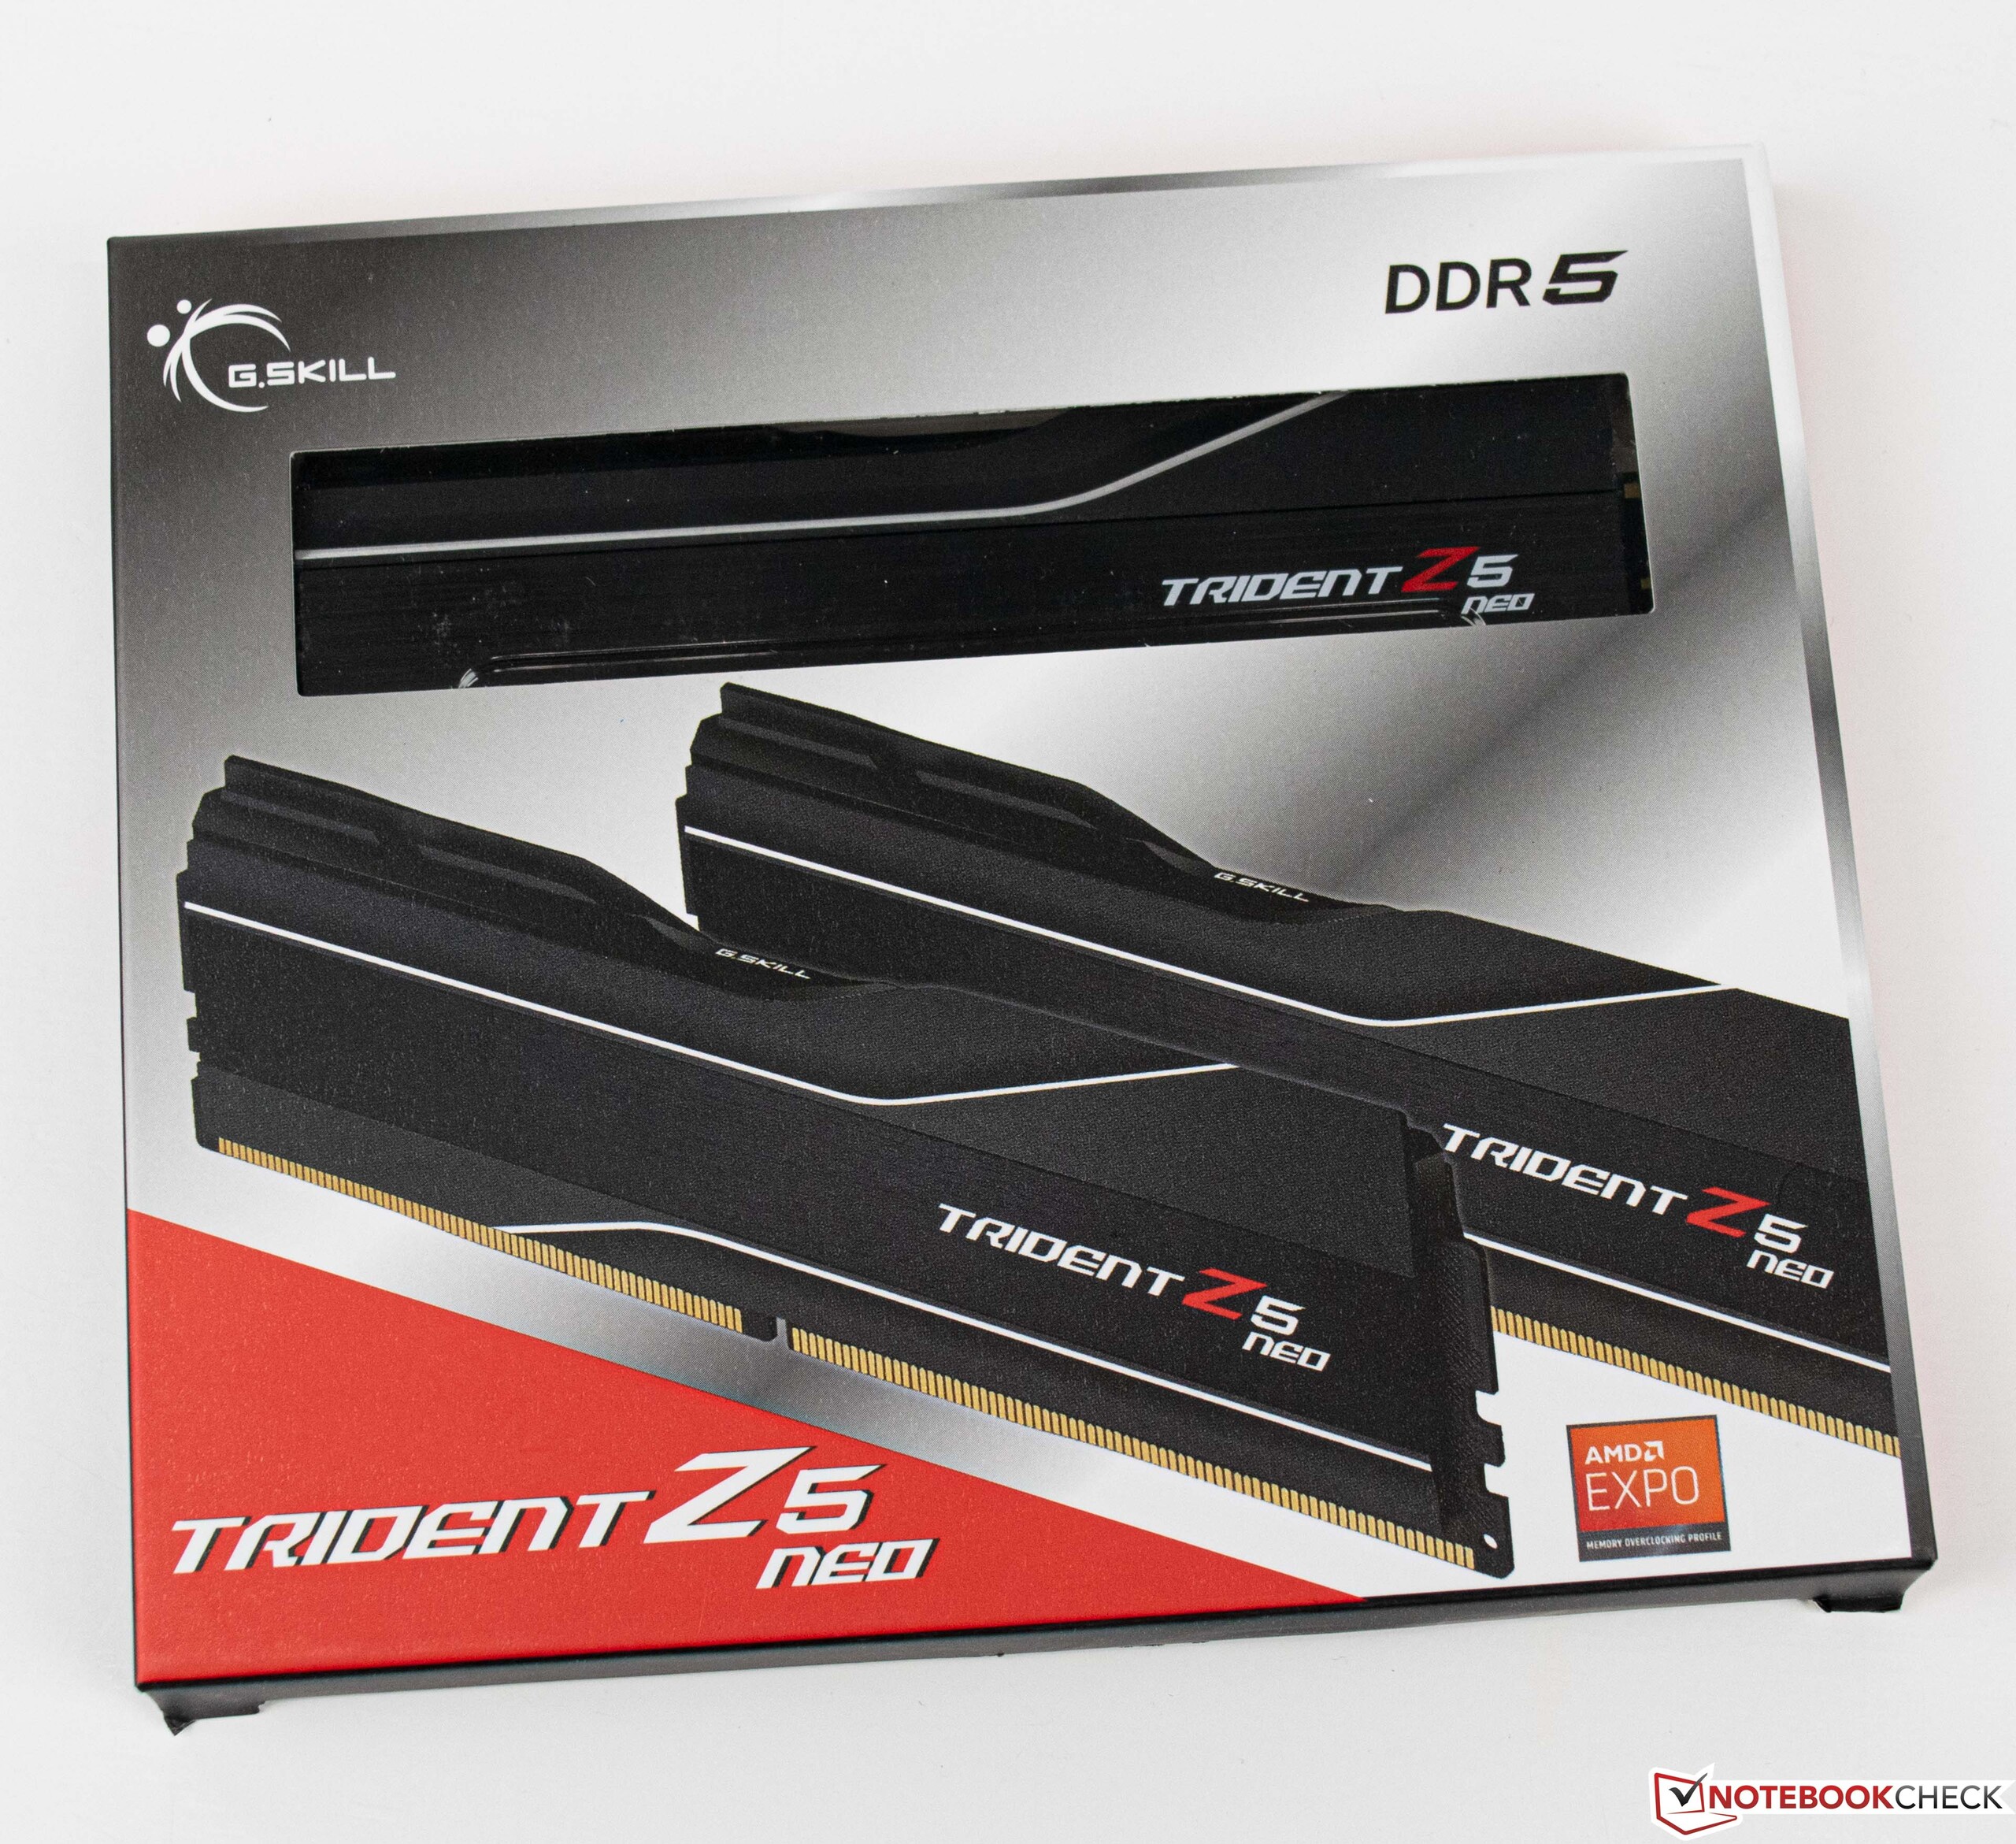
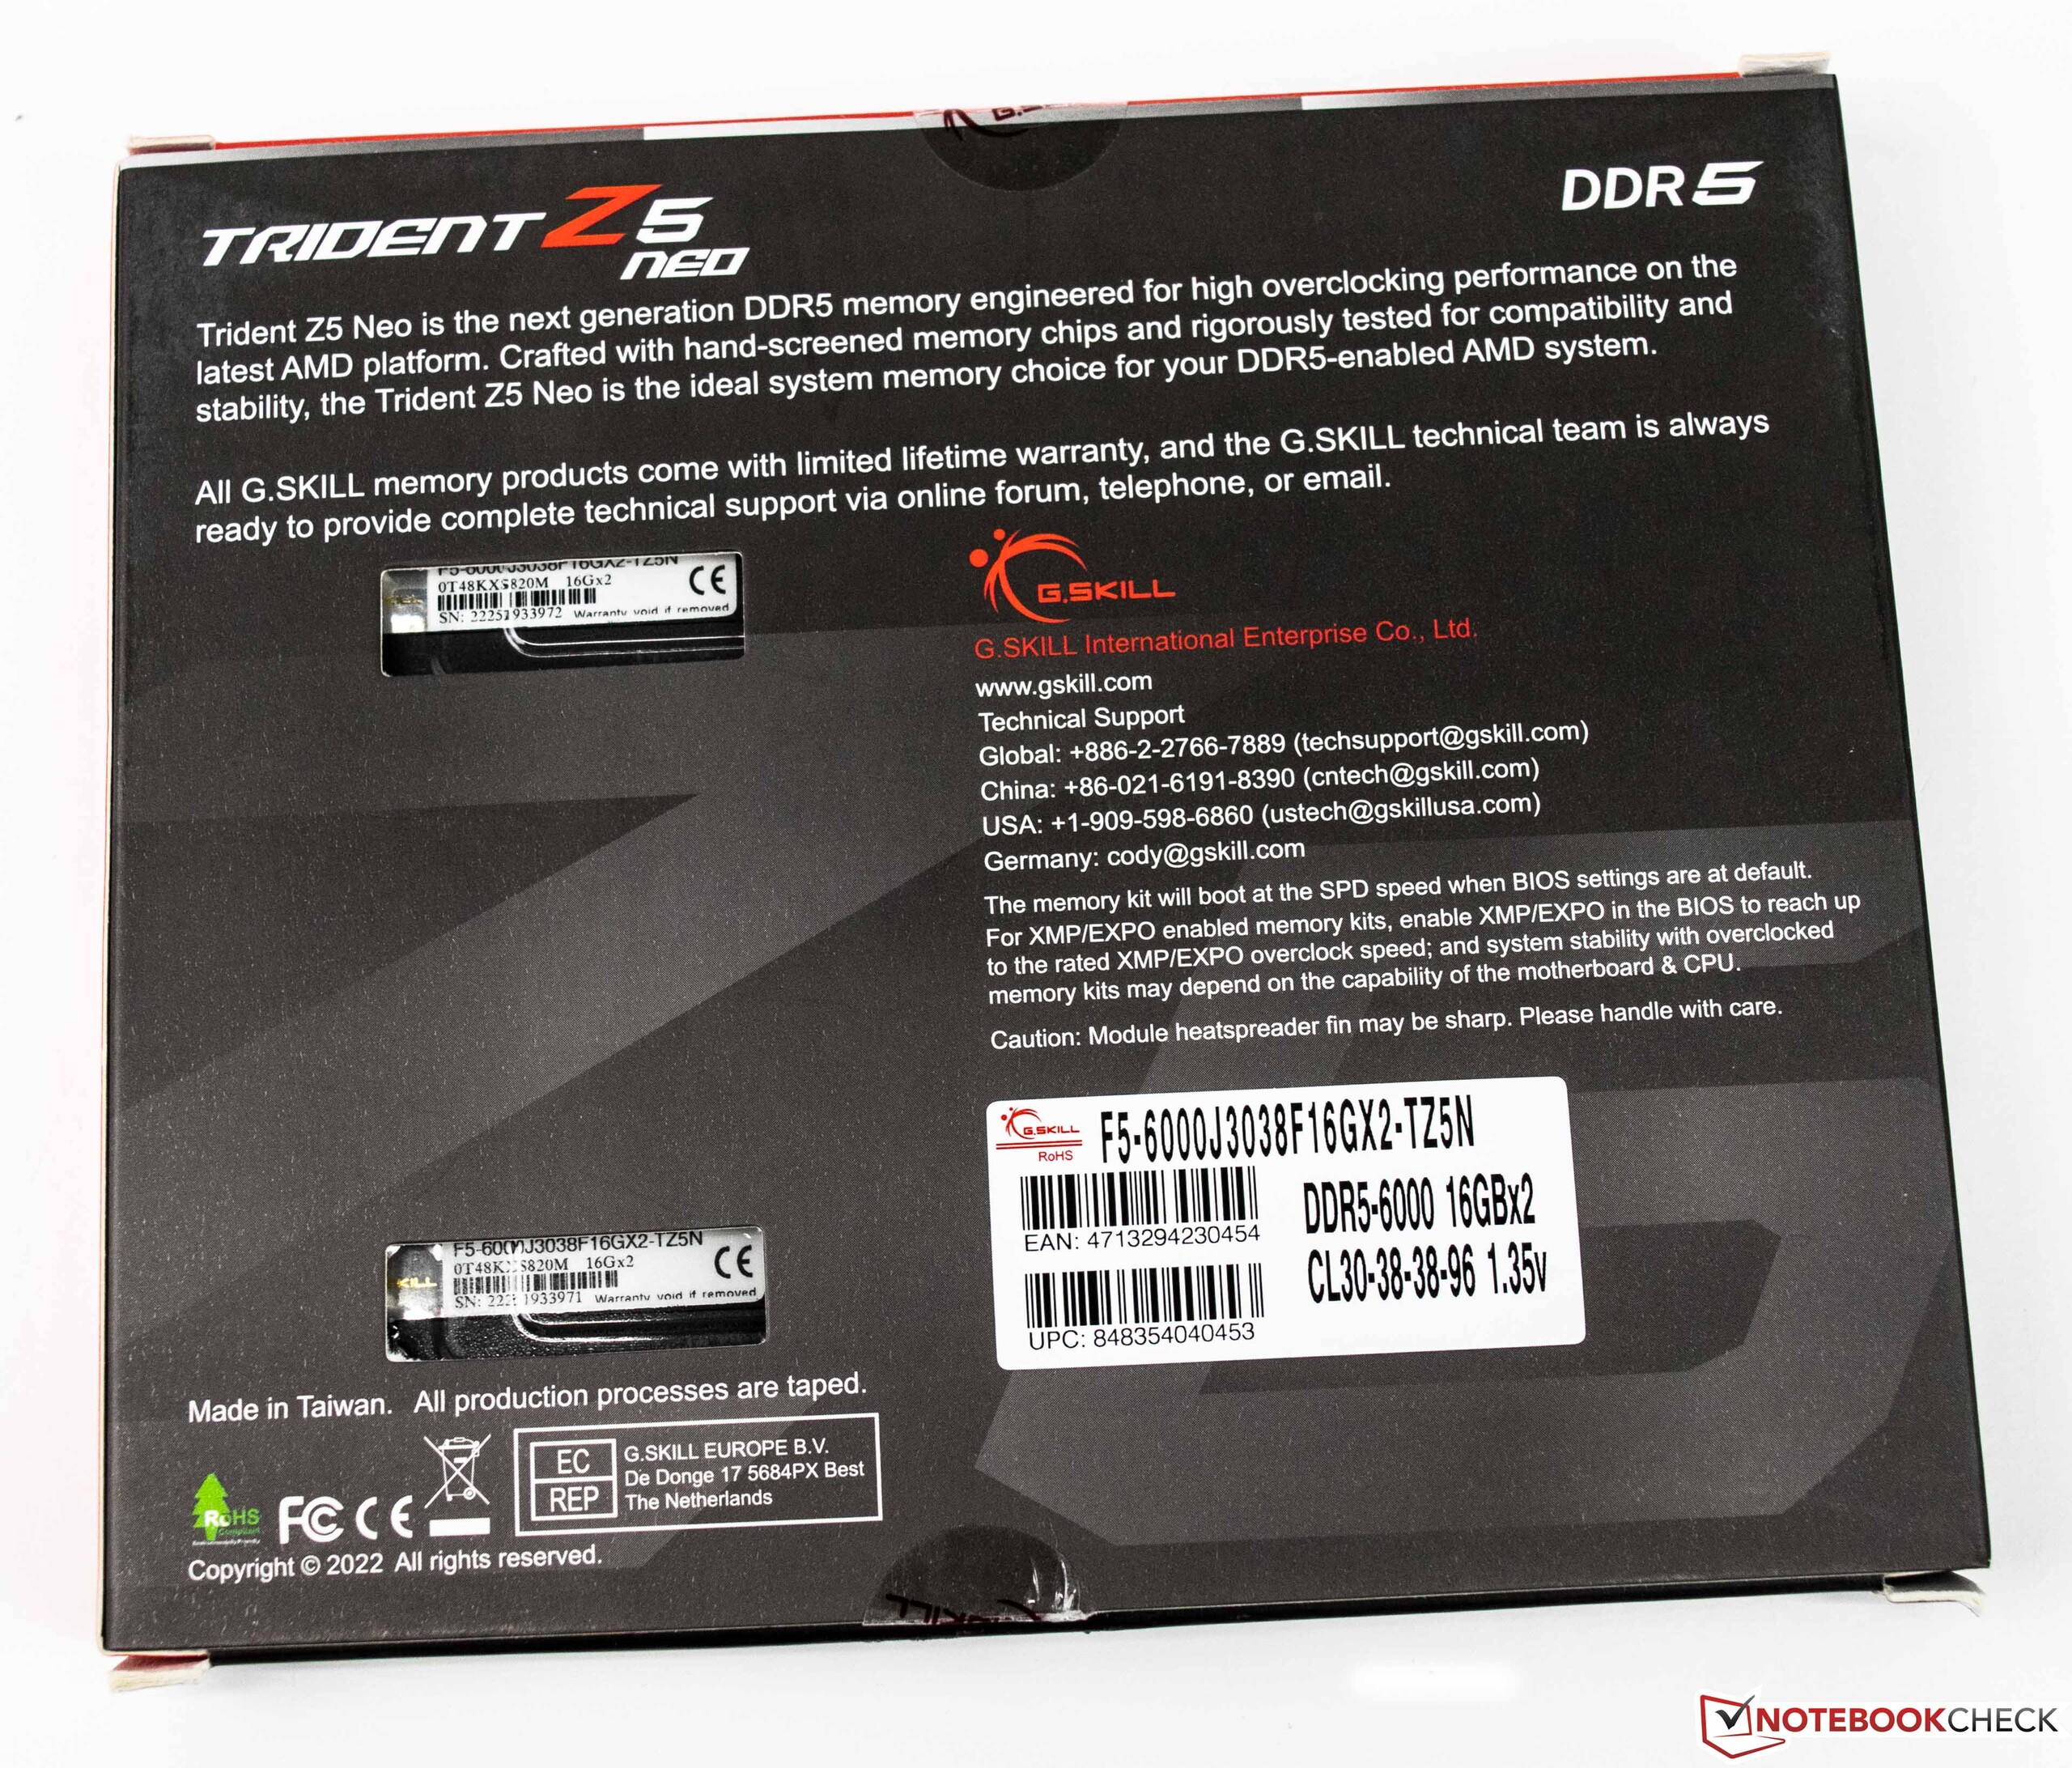
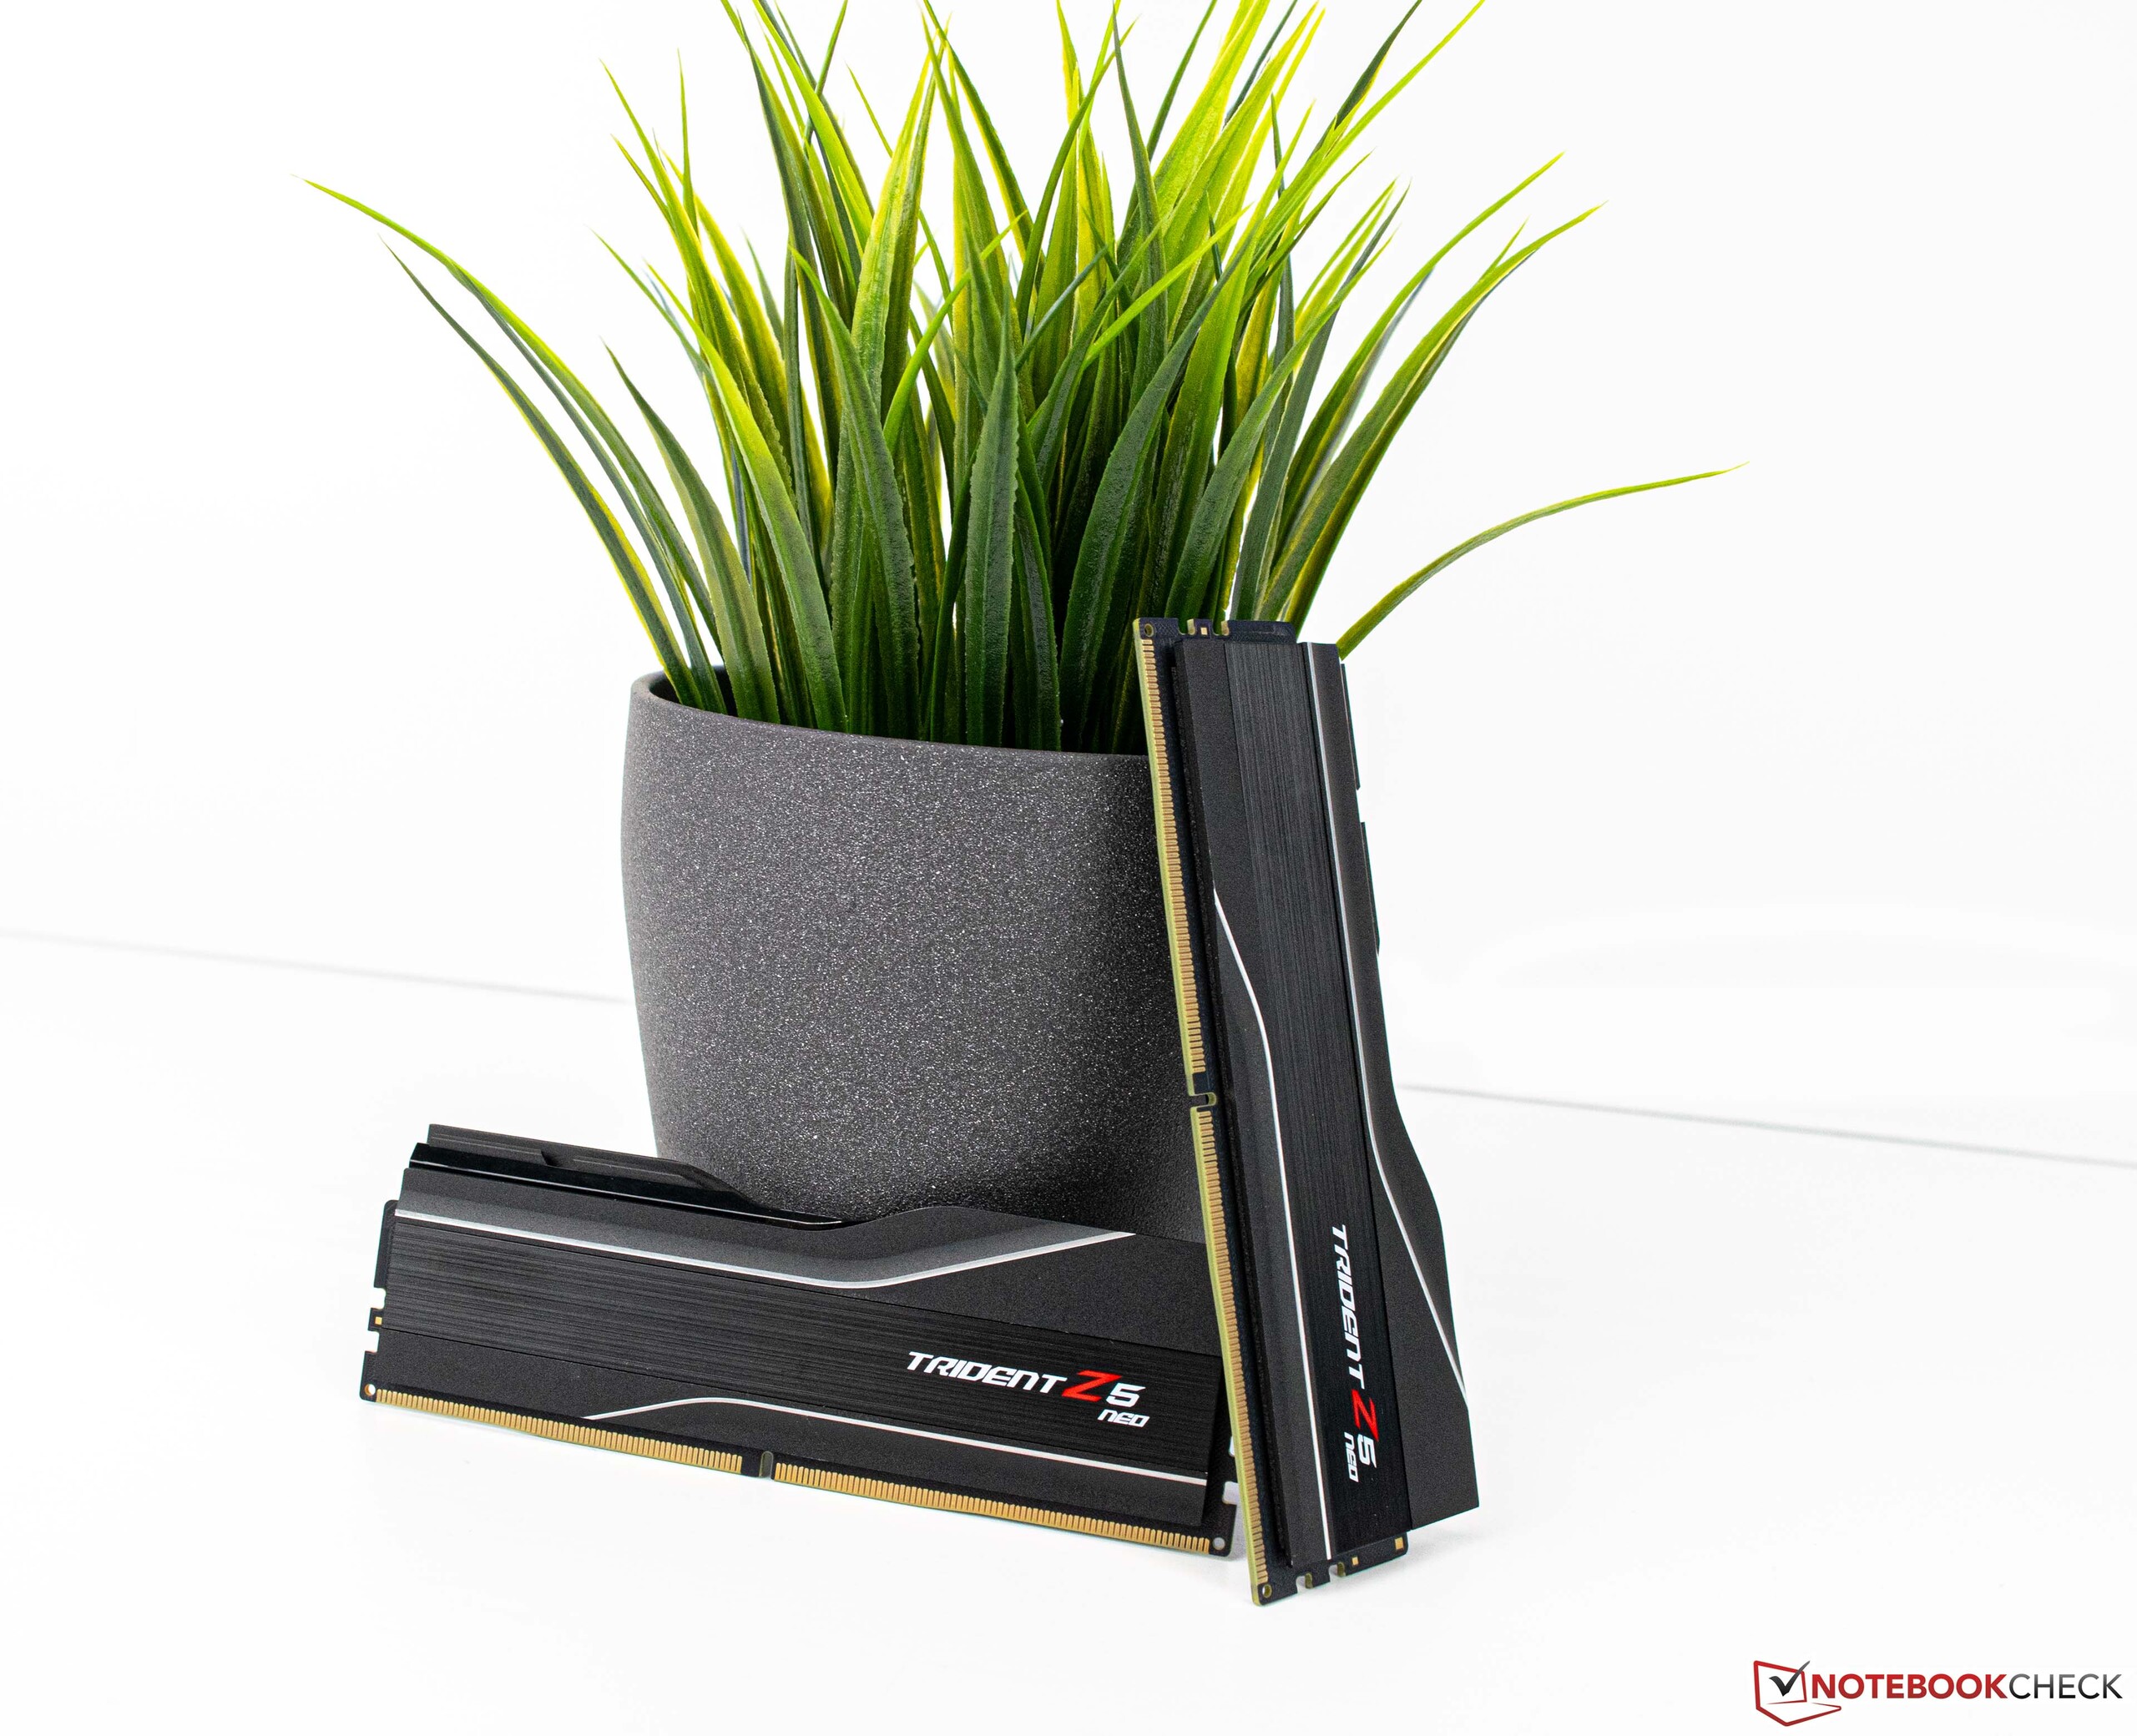
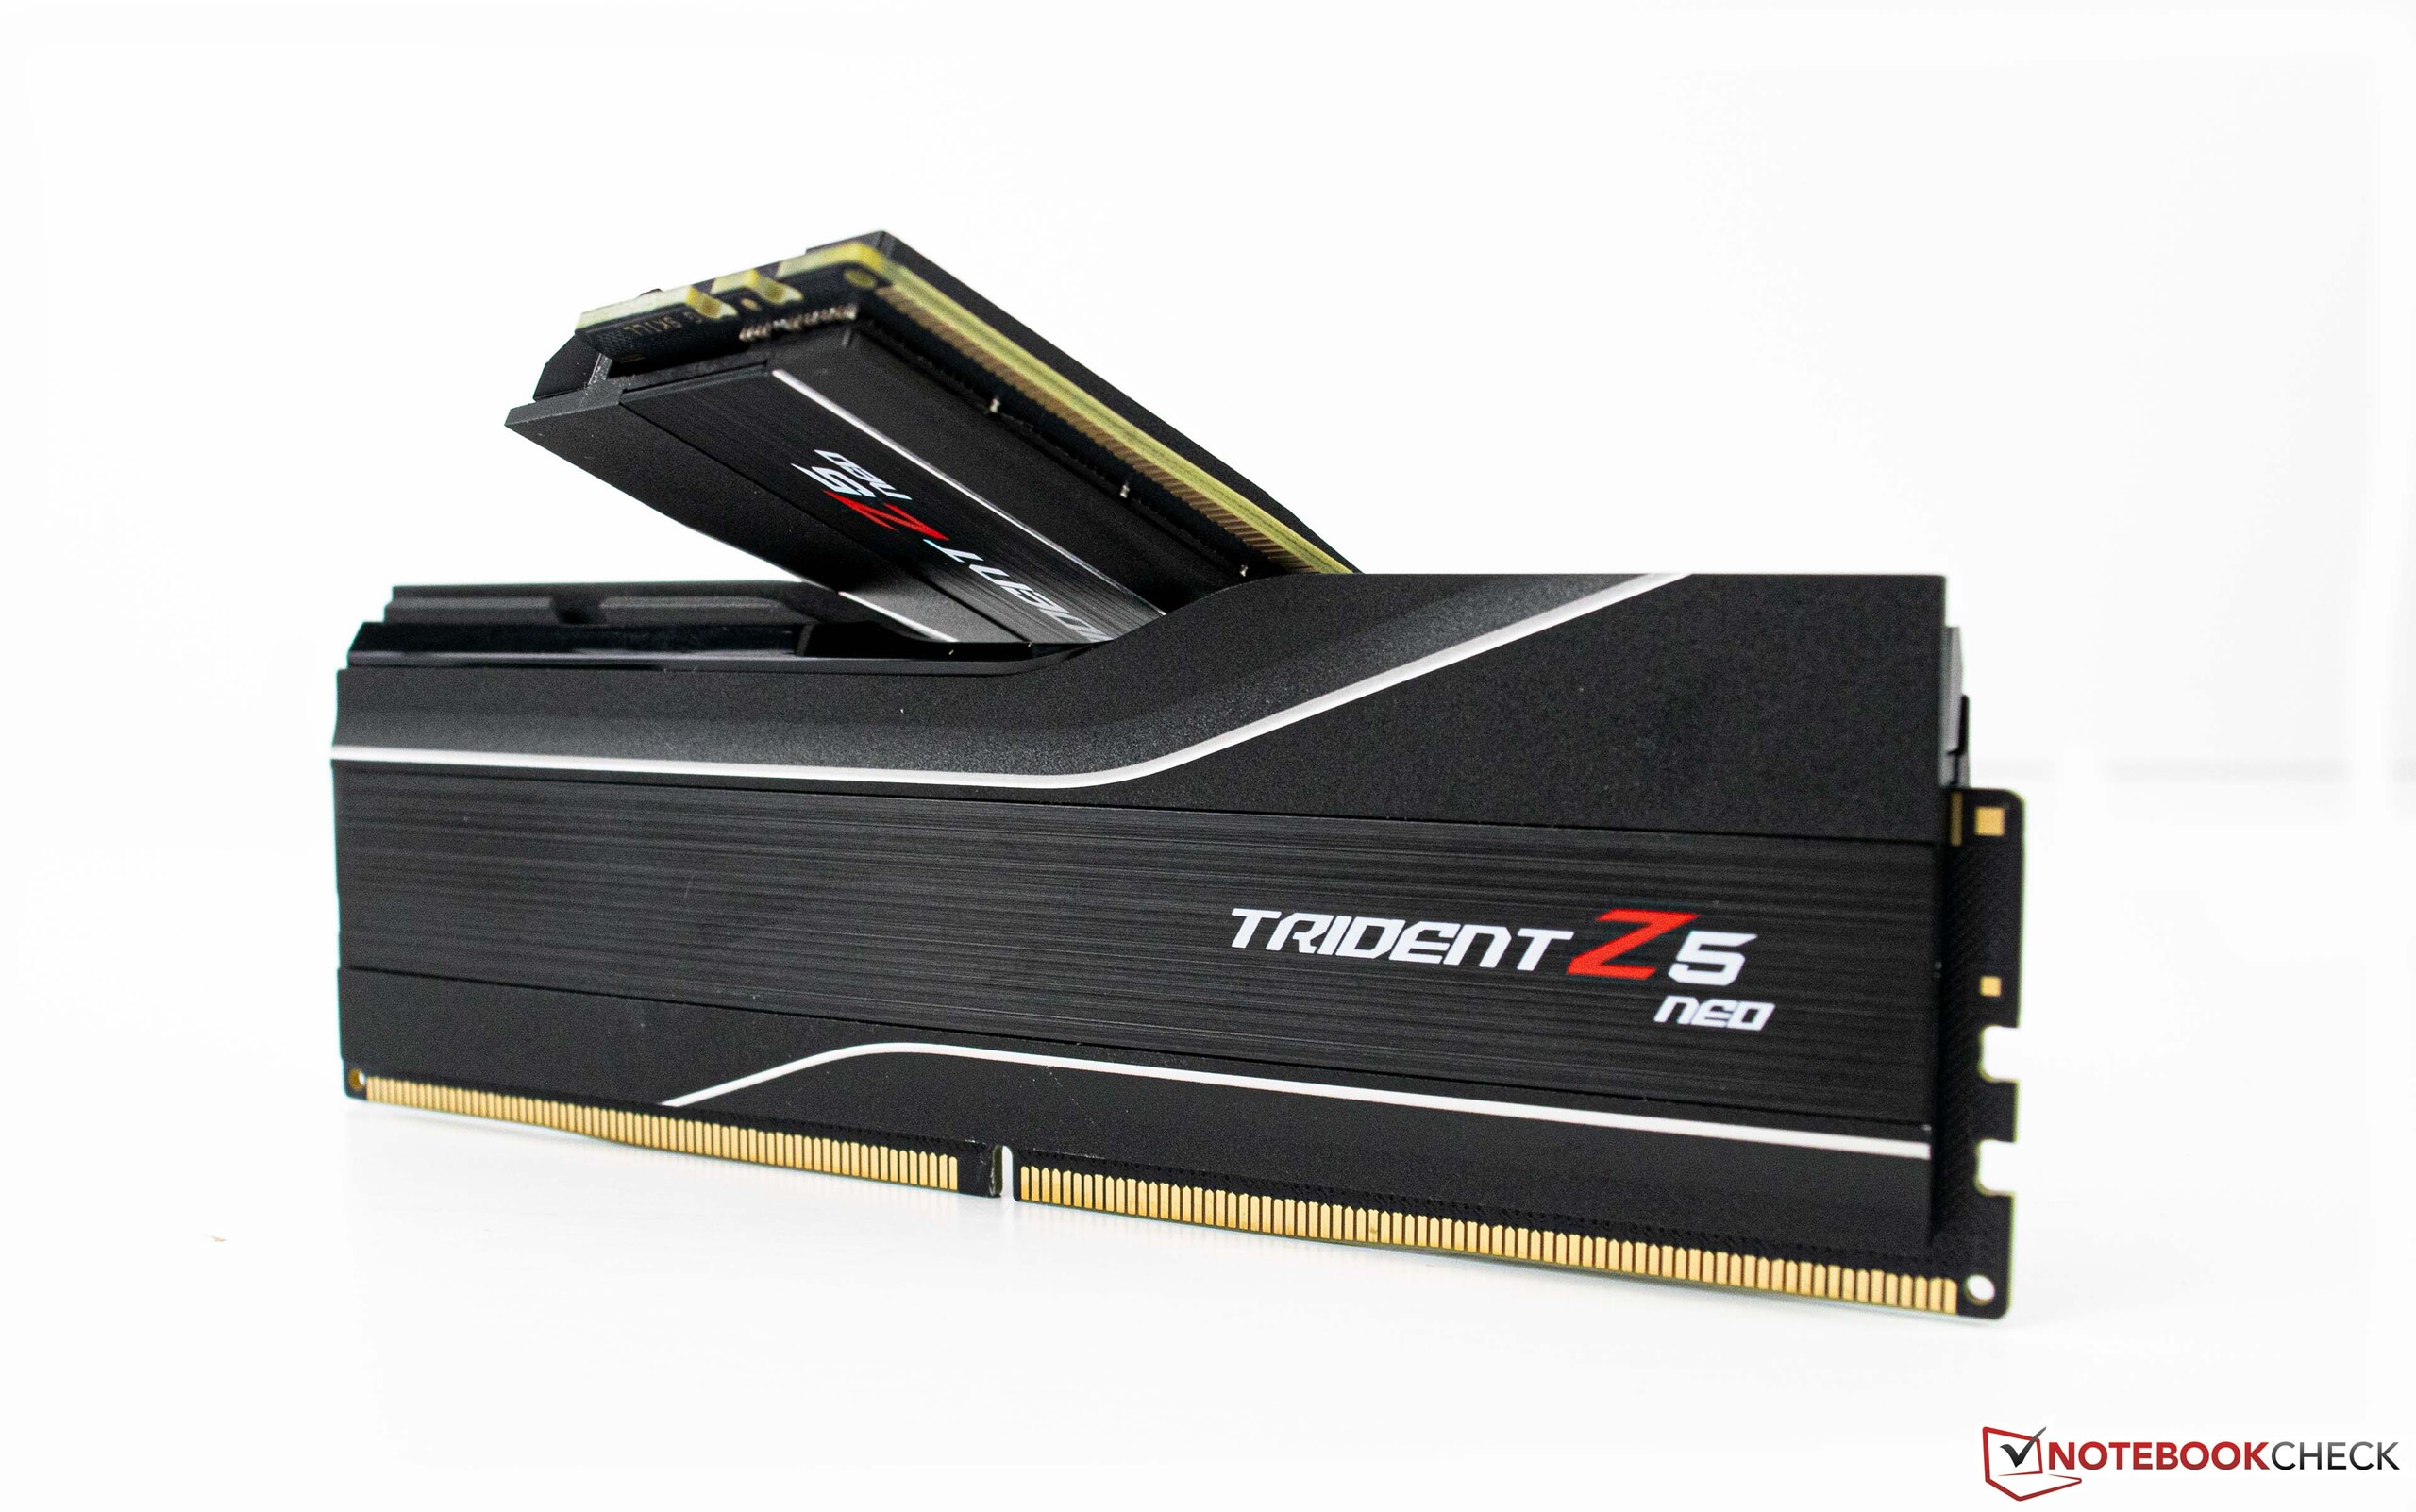
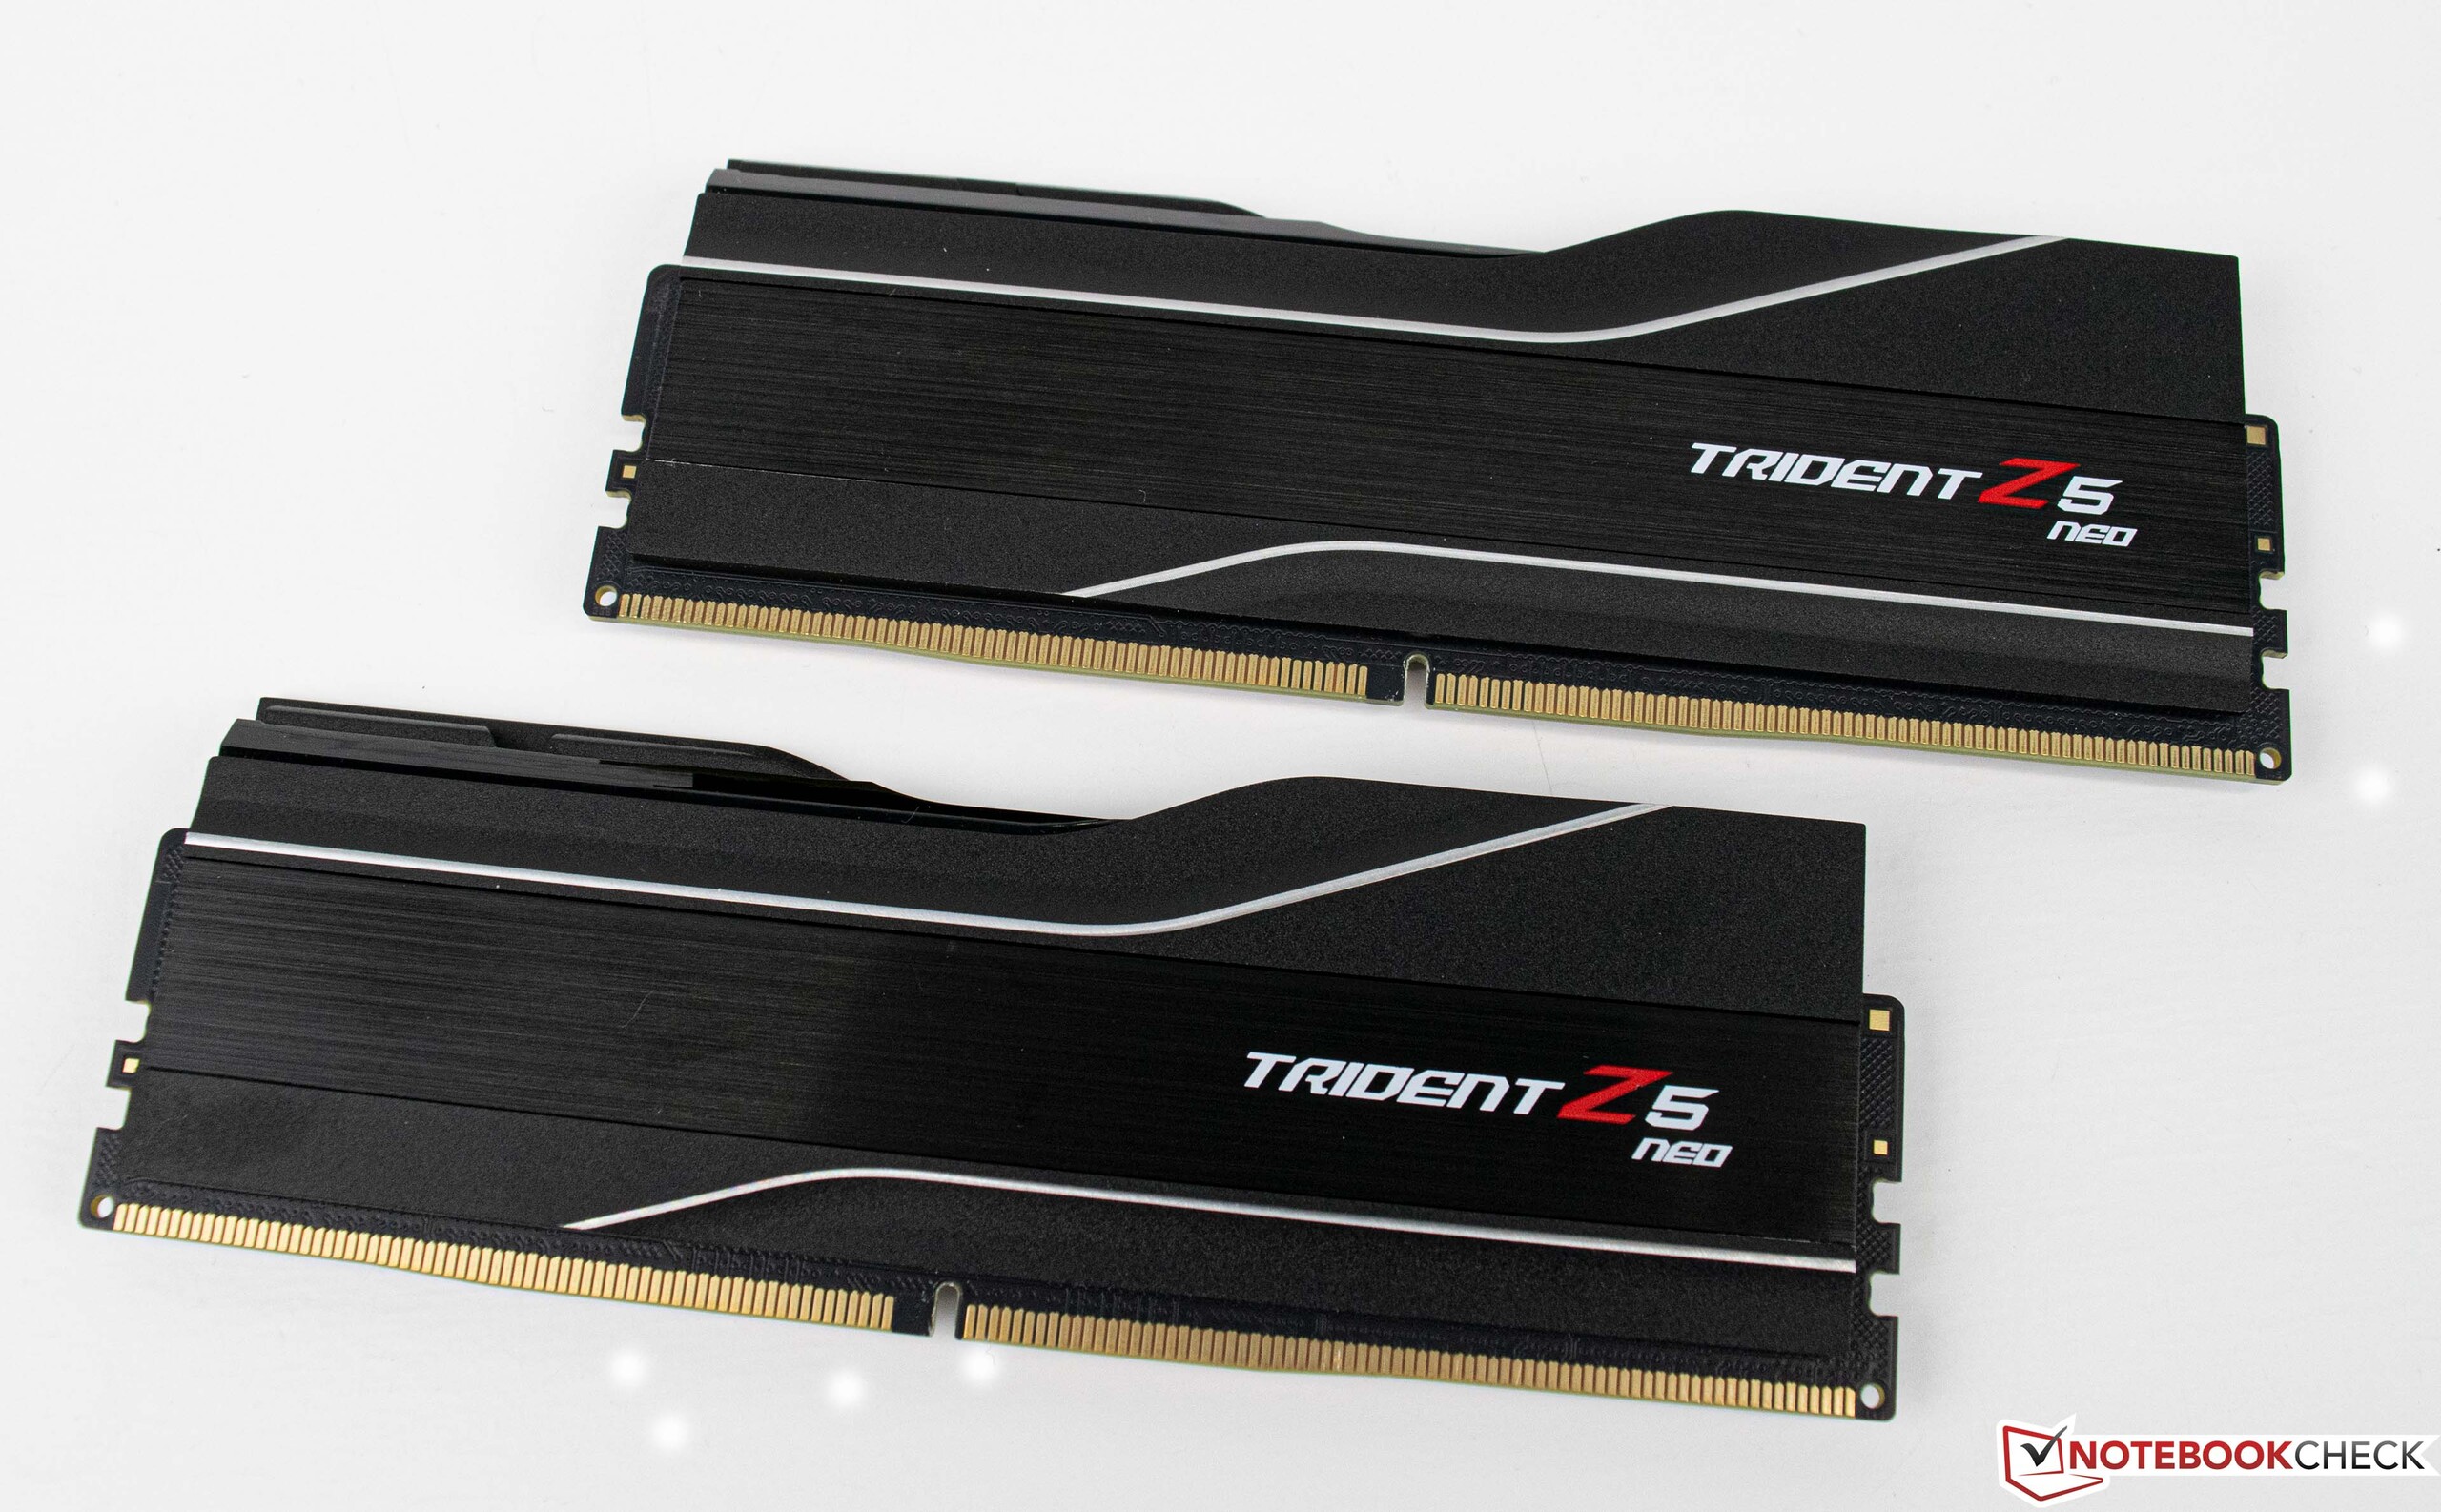
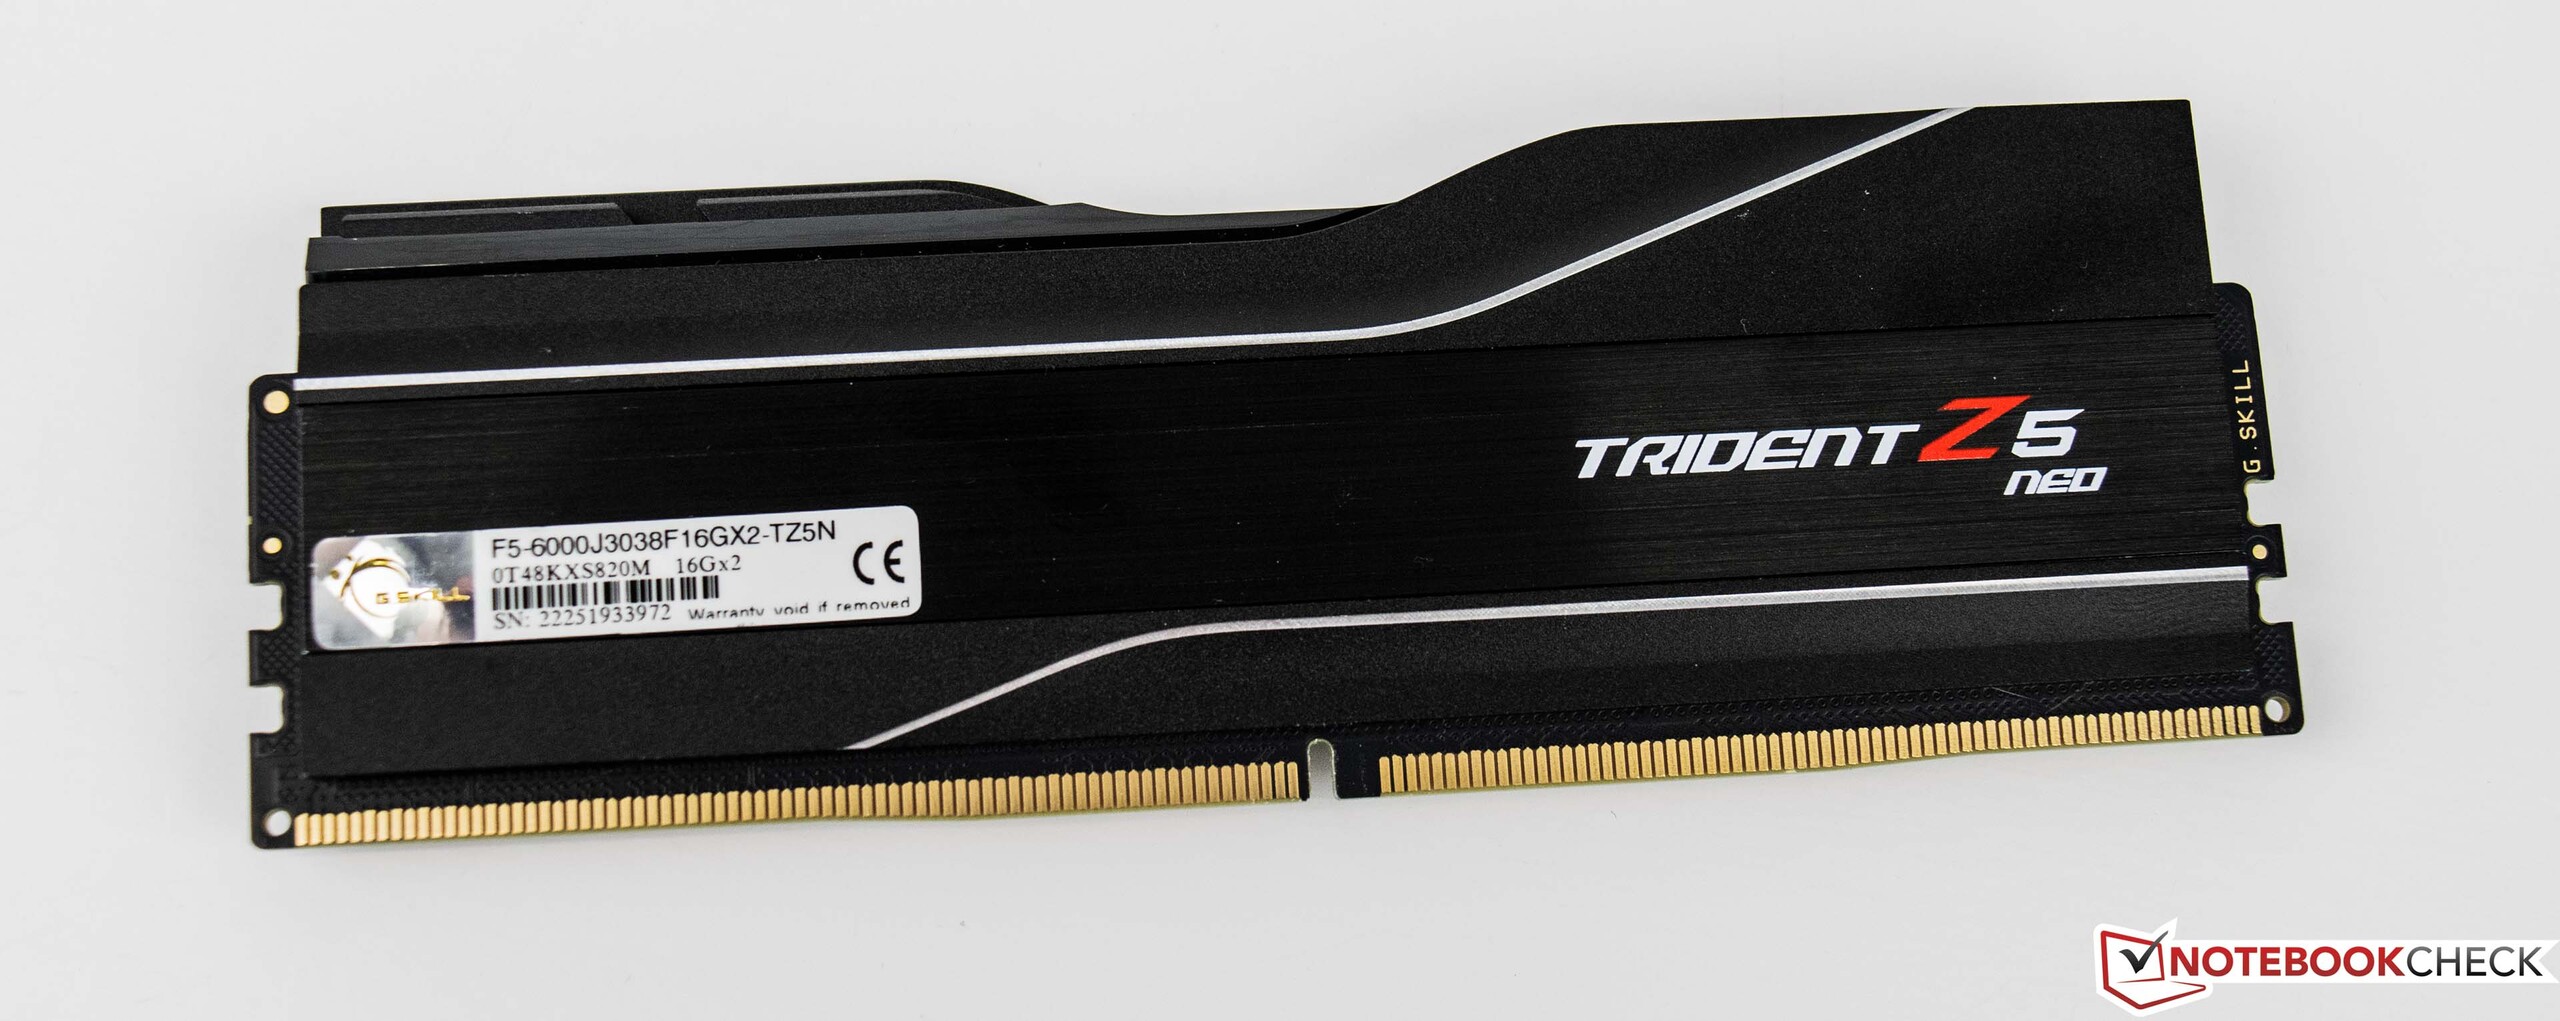
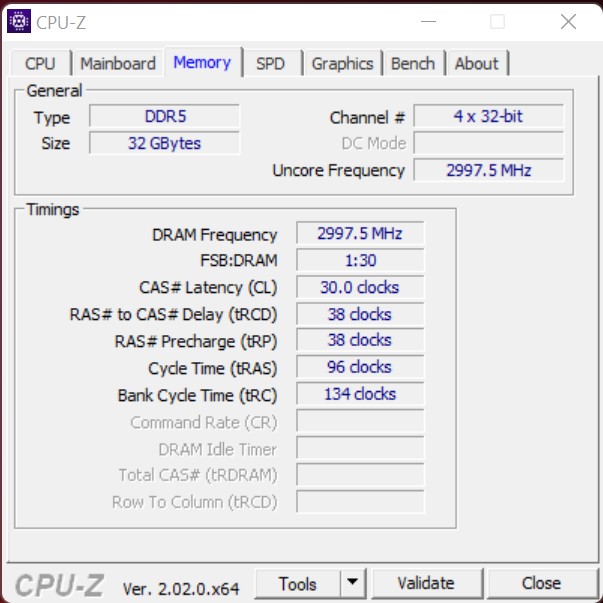
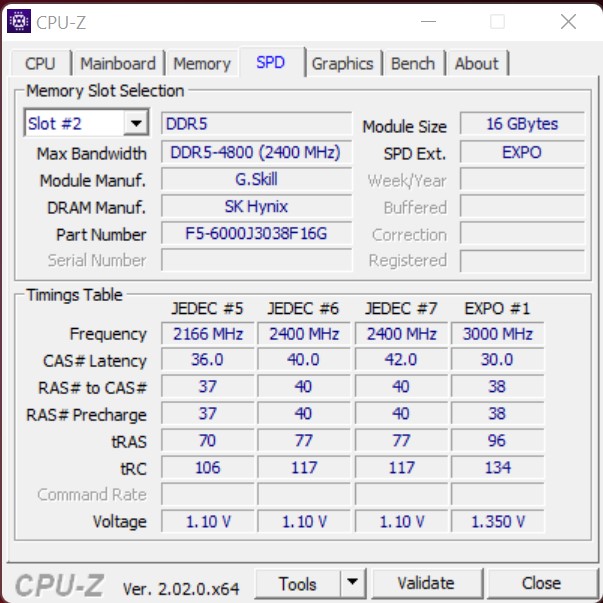
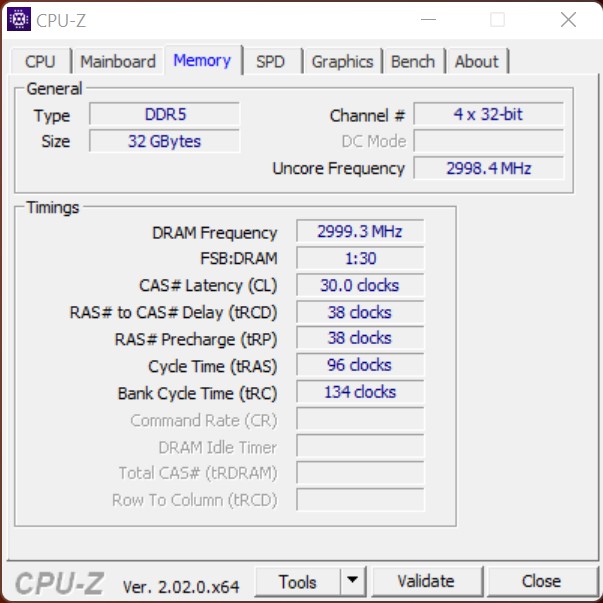
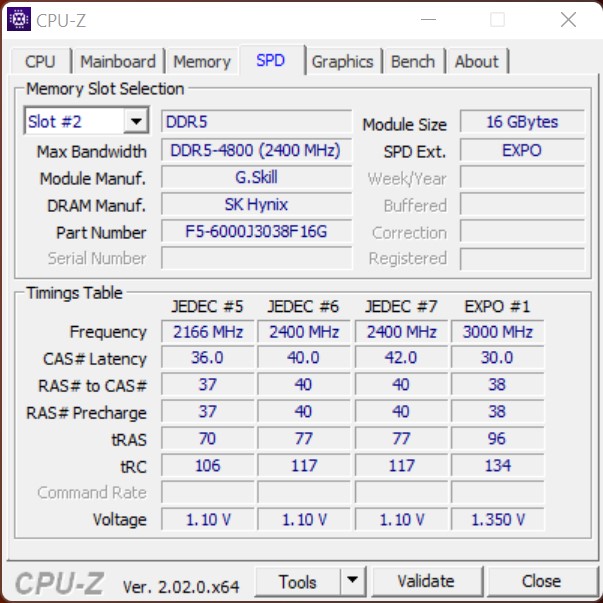
- G.Skill Trident Z5 Neo DDR5-6000 2x 16 GB, EXPO (DDR5-6000 CL30-38-38-96)
- Intel Optane 905P 480 GB PCIe SSD
- 2x Transcend NVMe SSD 512 GB
- Microsoft Windows 11 Professional 64-bit (version 21H2)
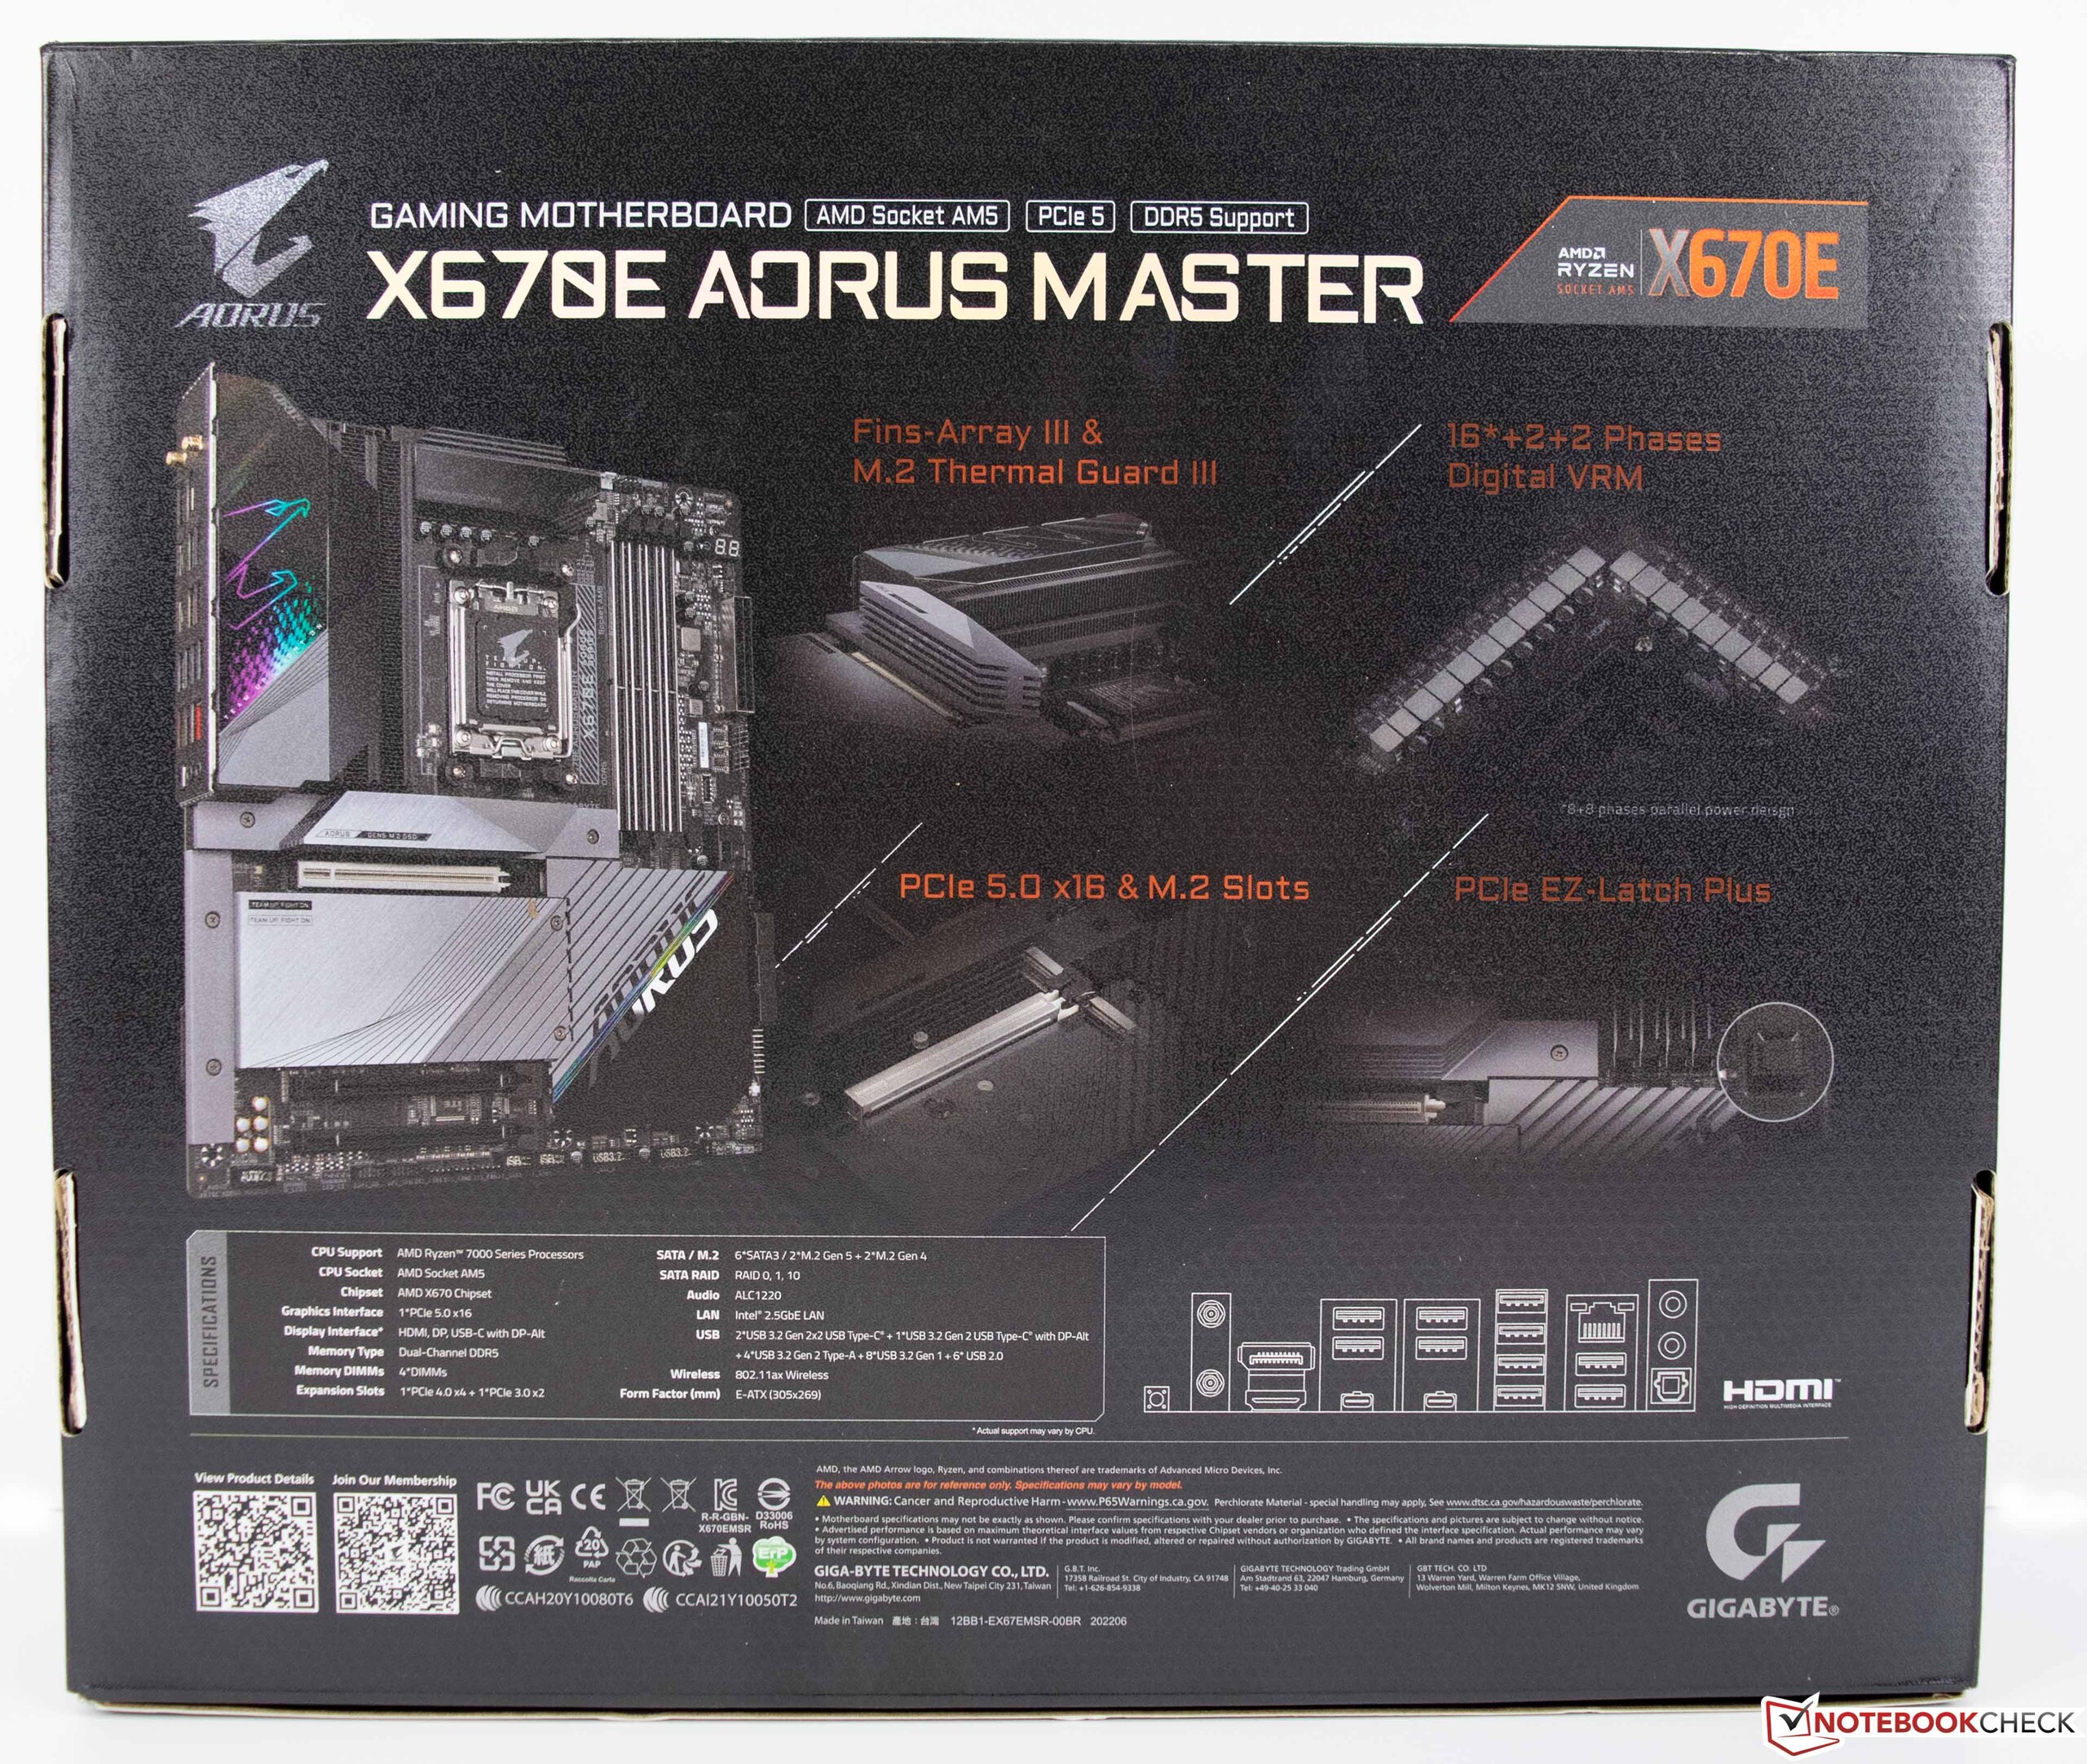
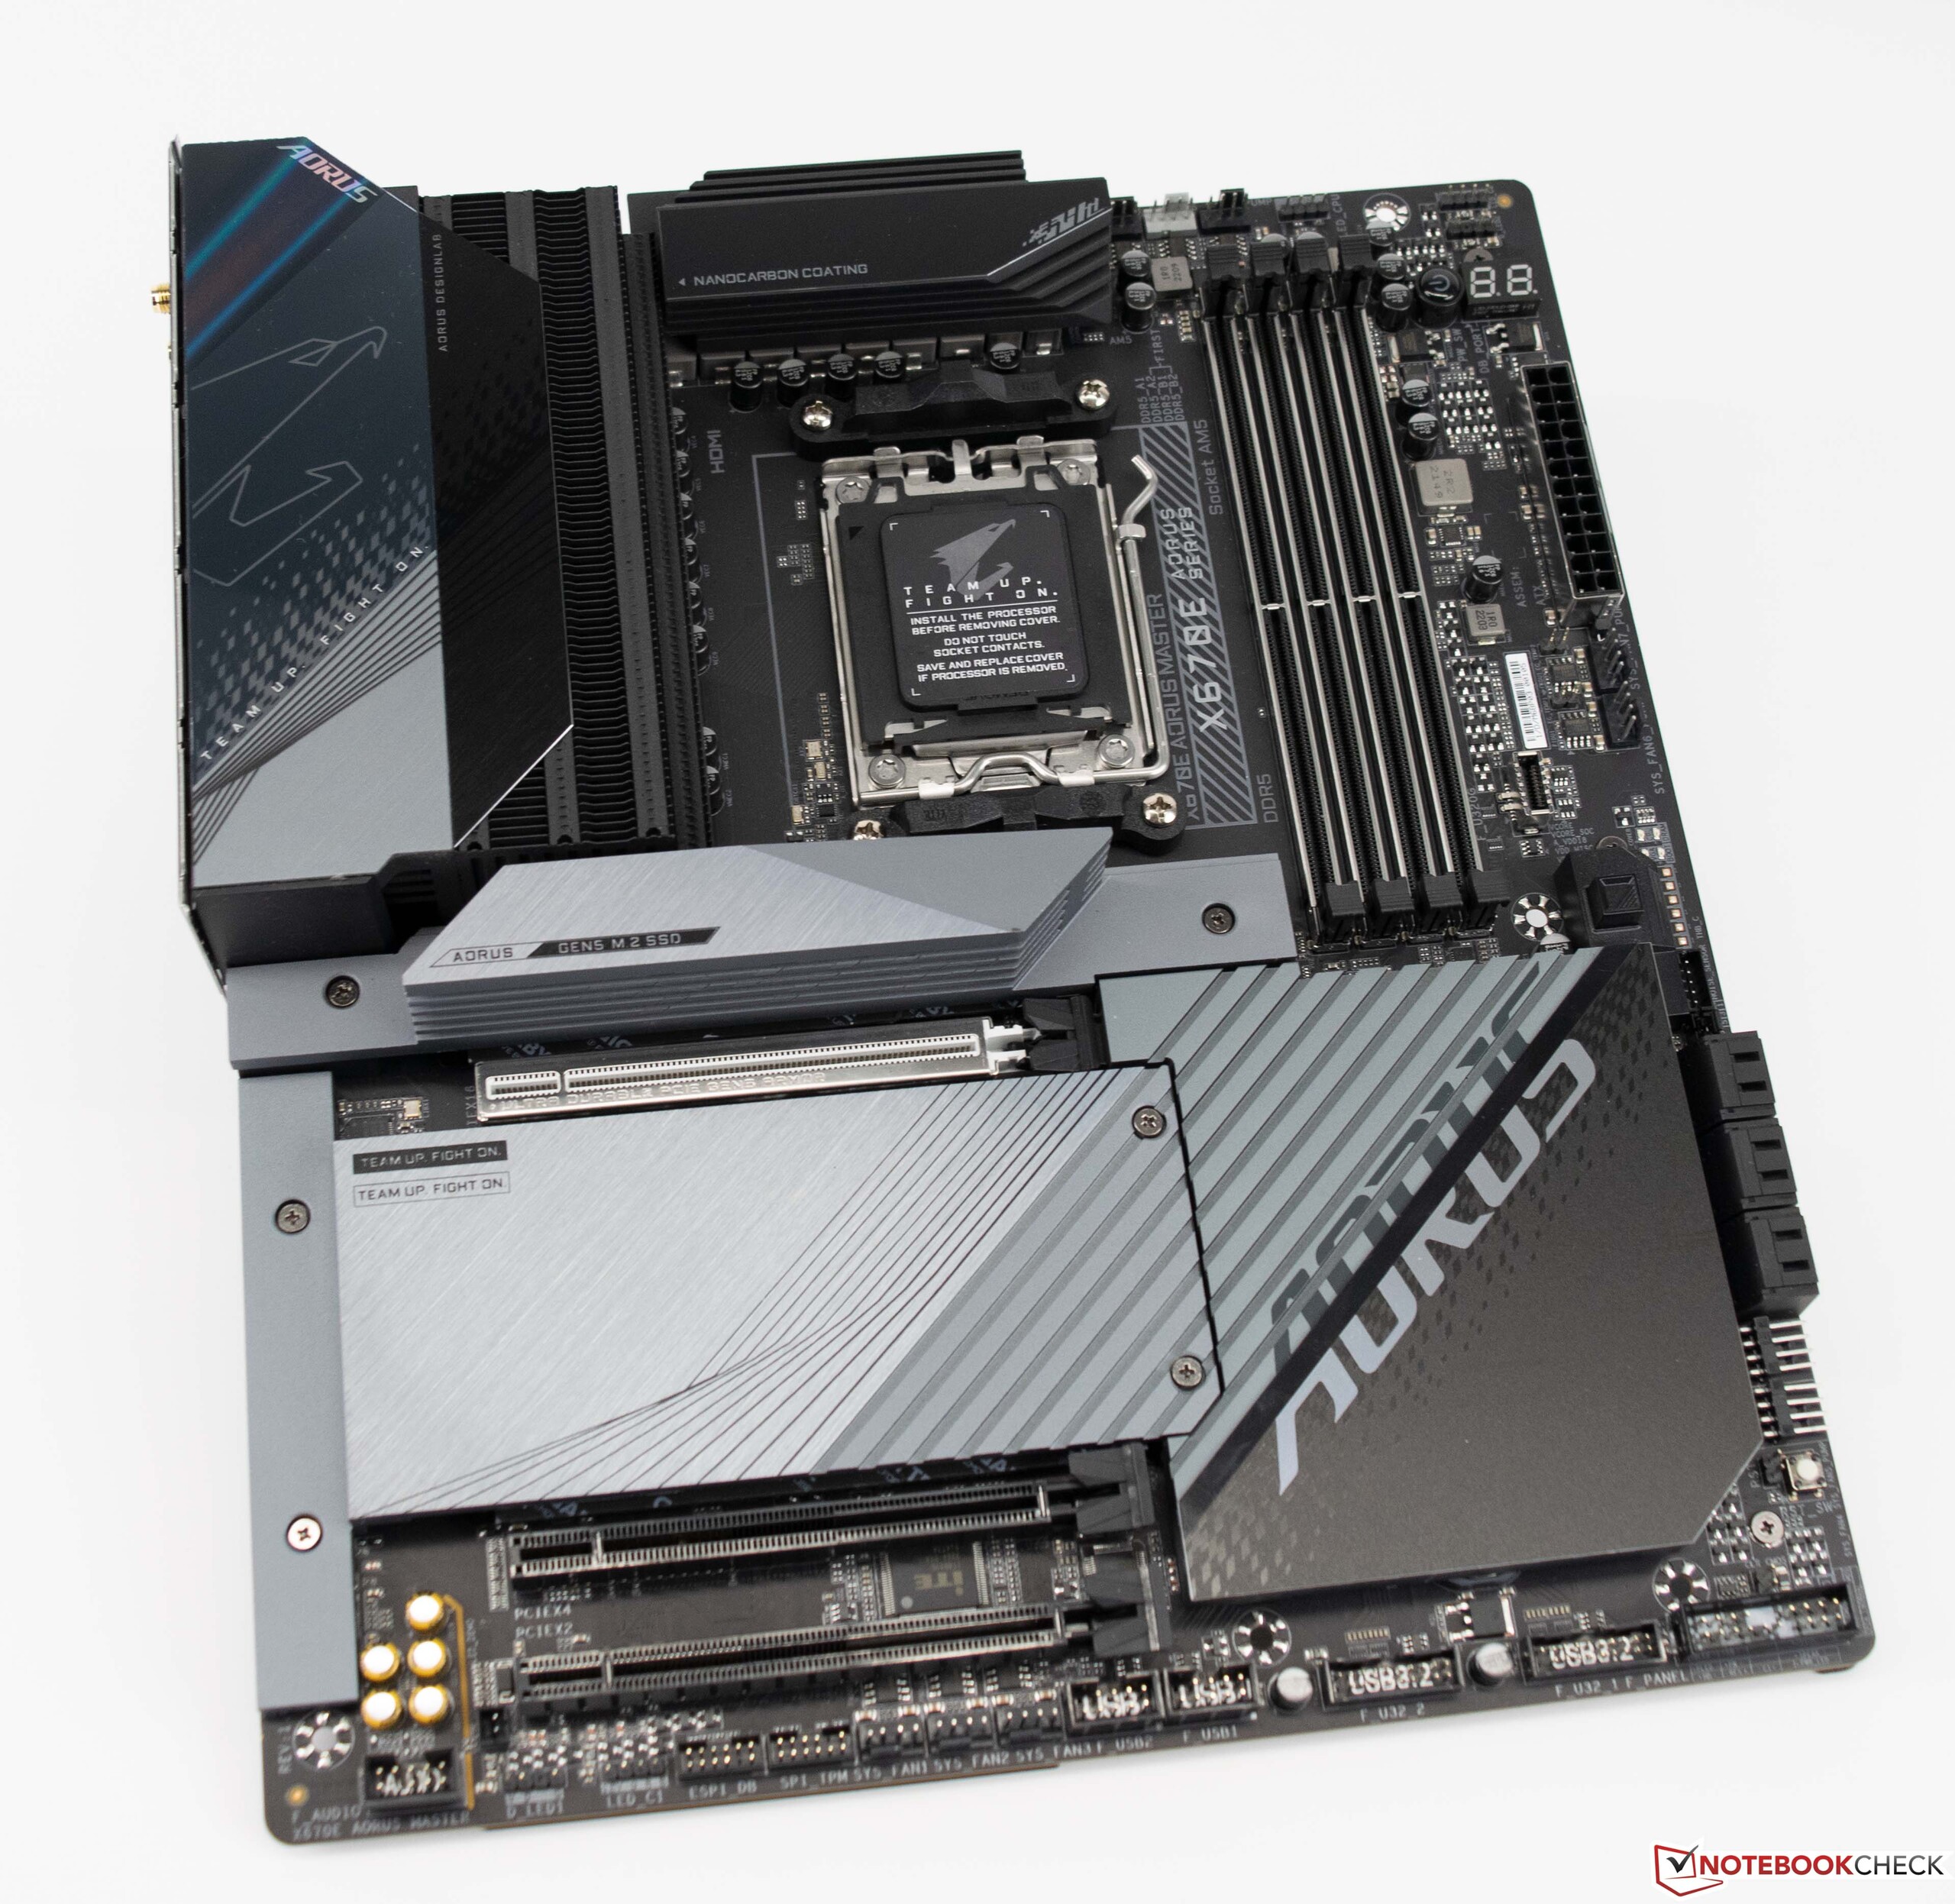
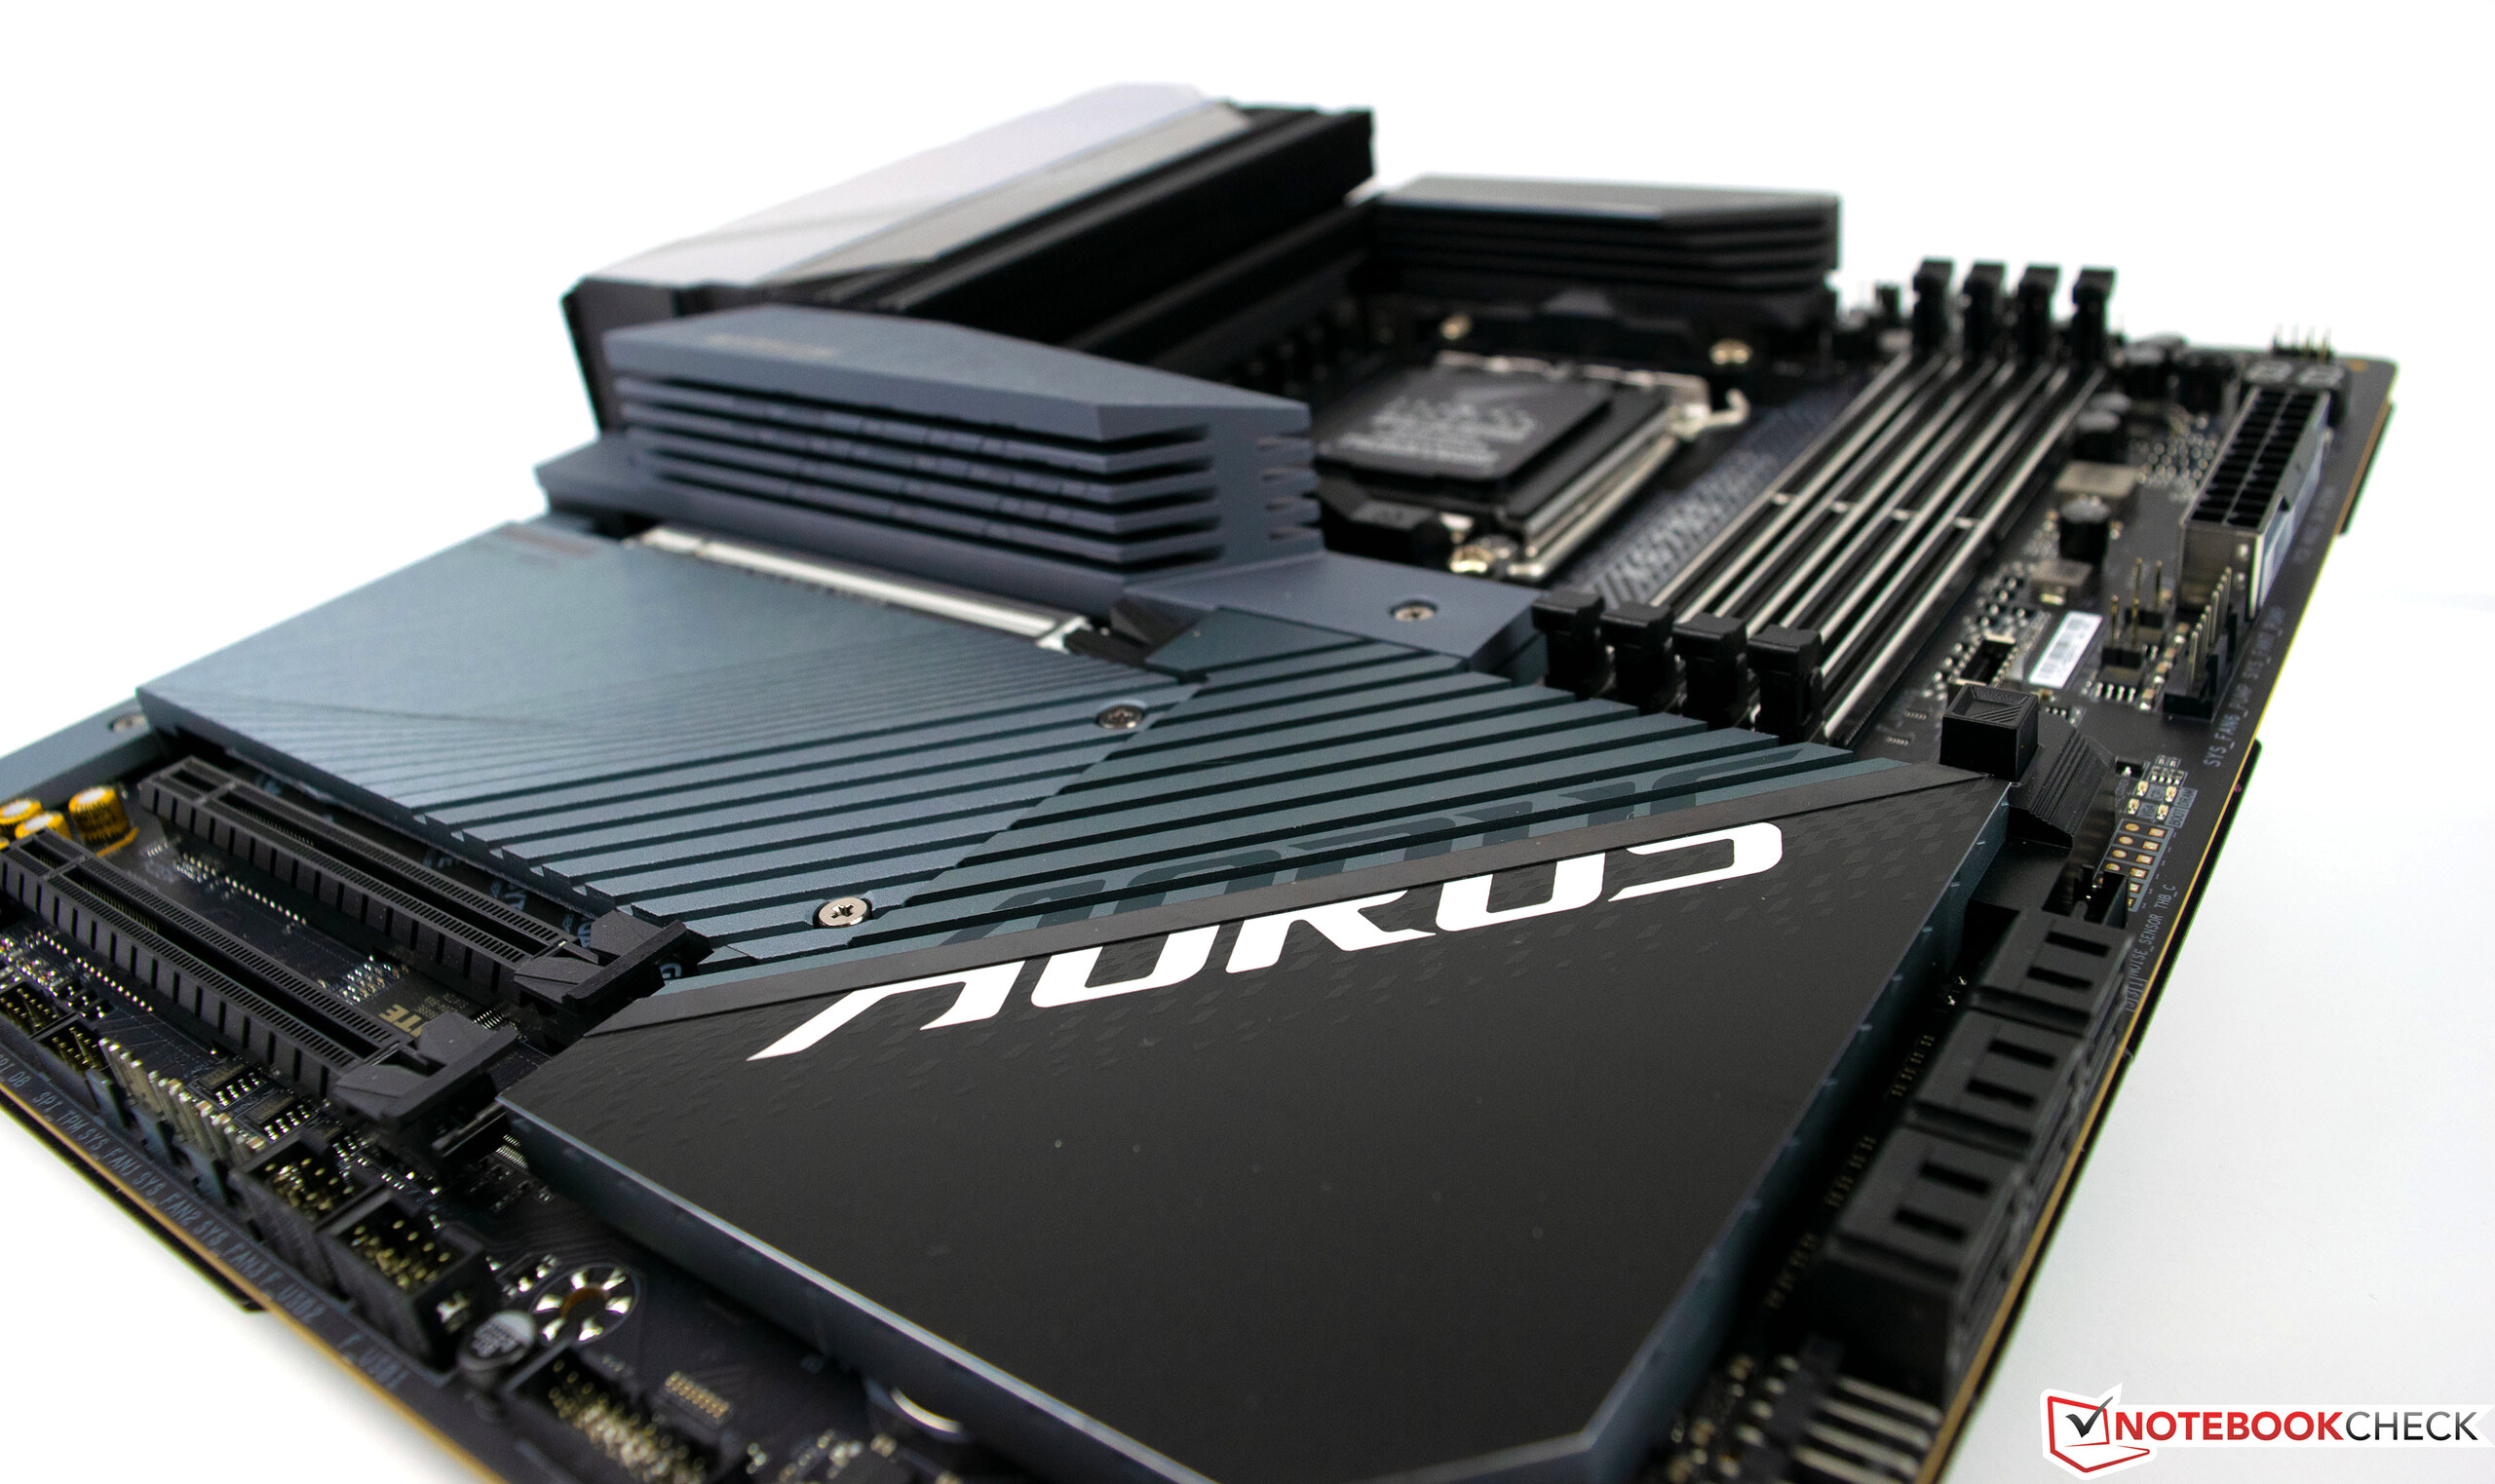
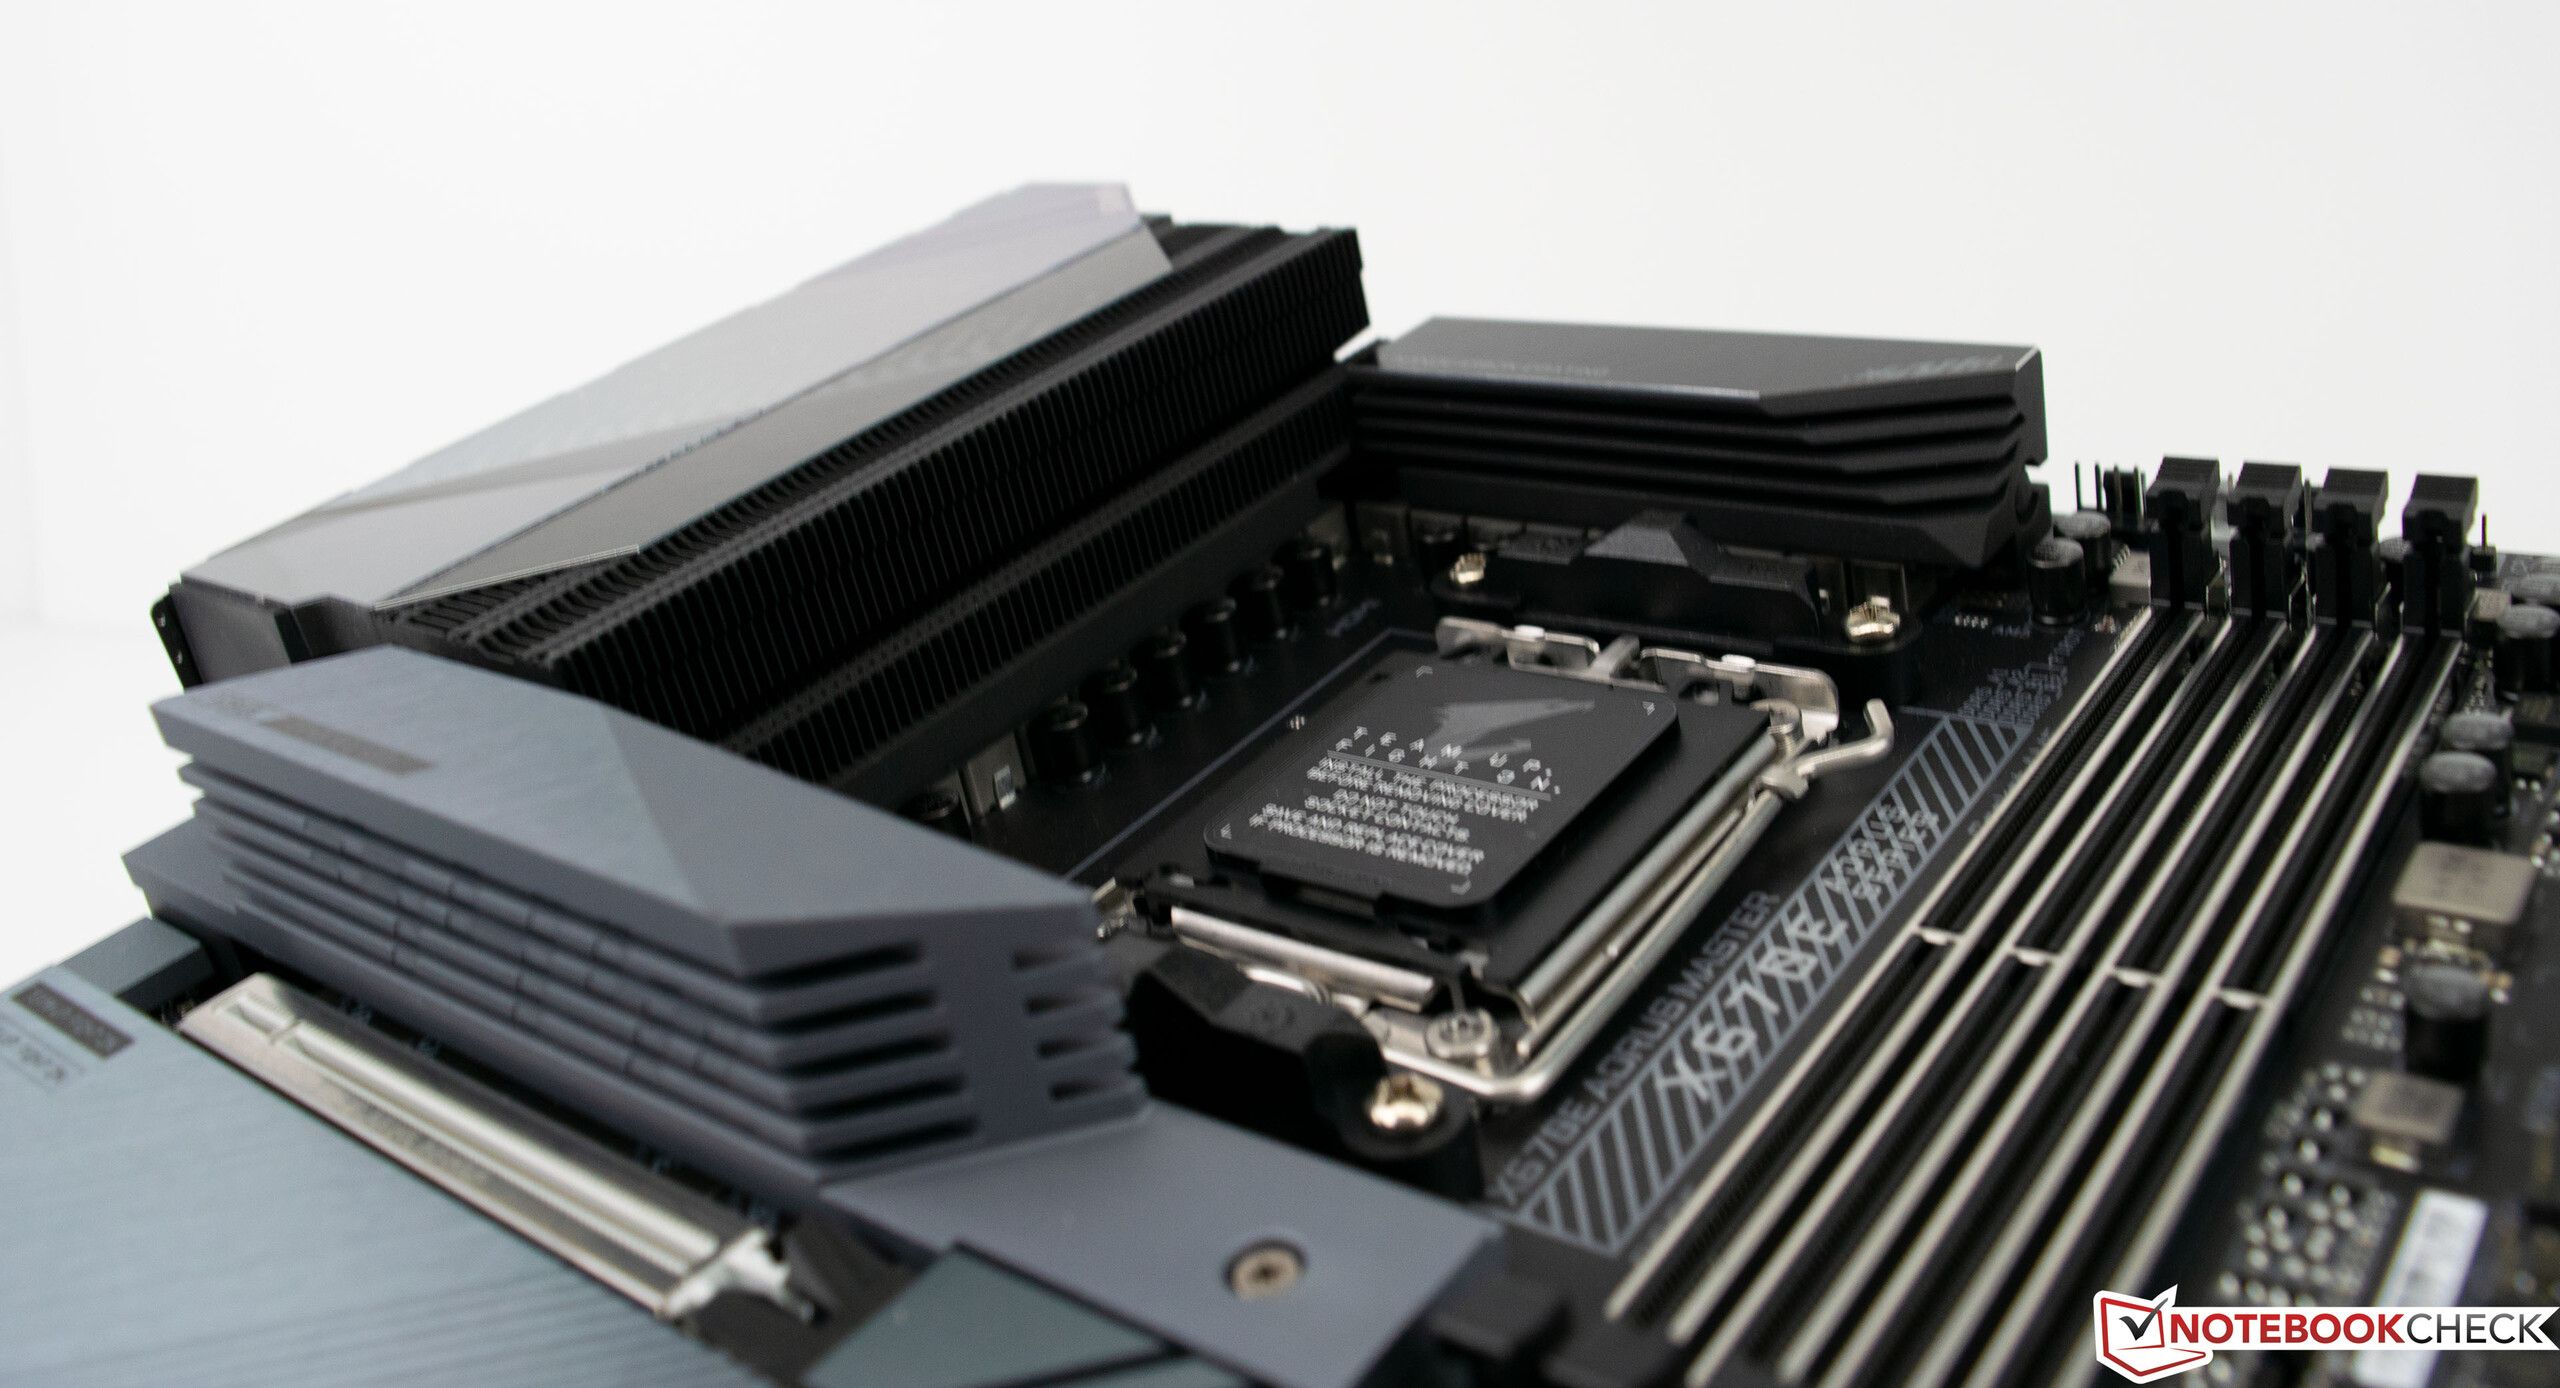
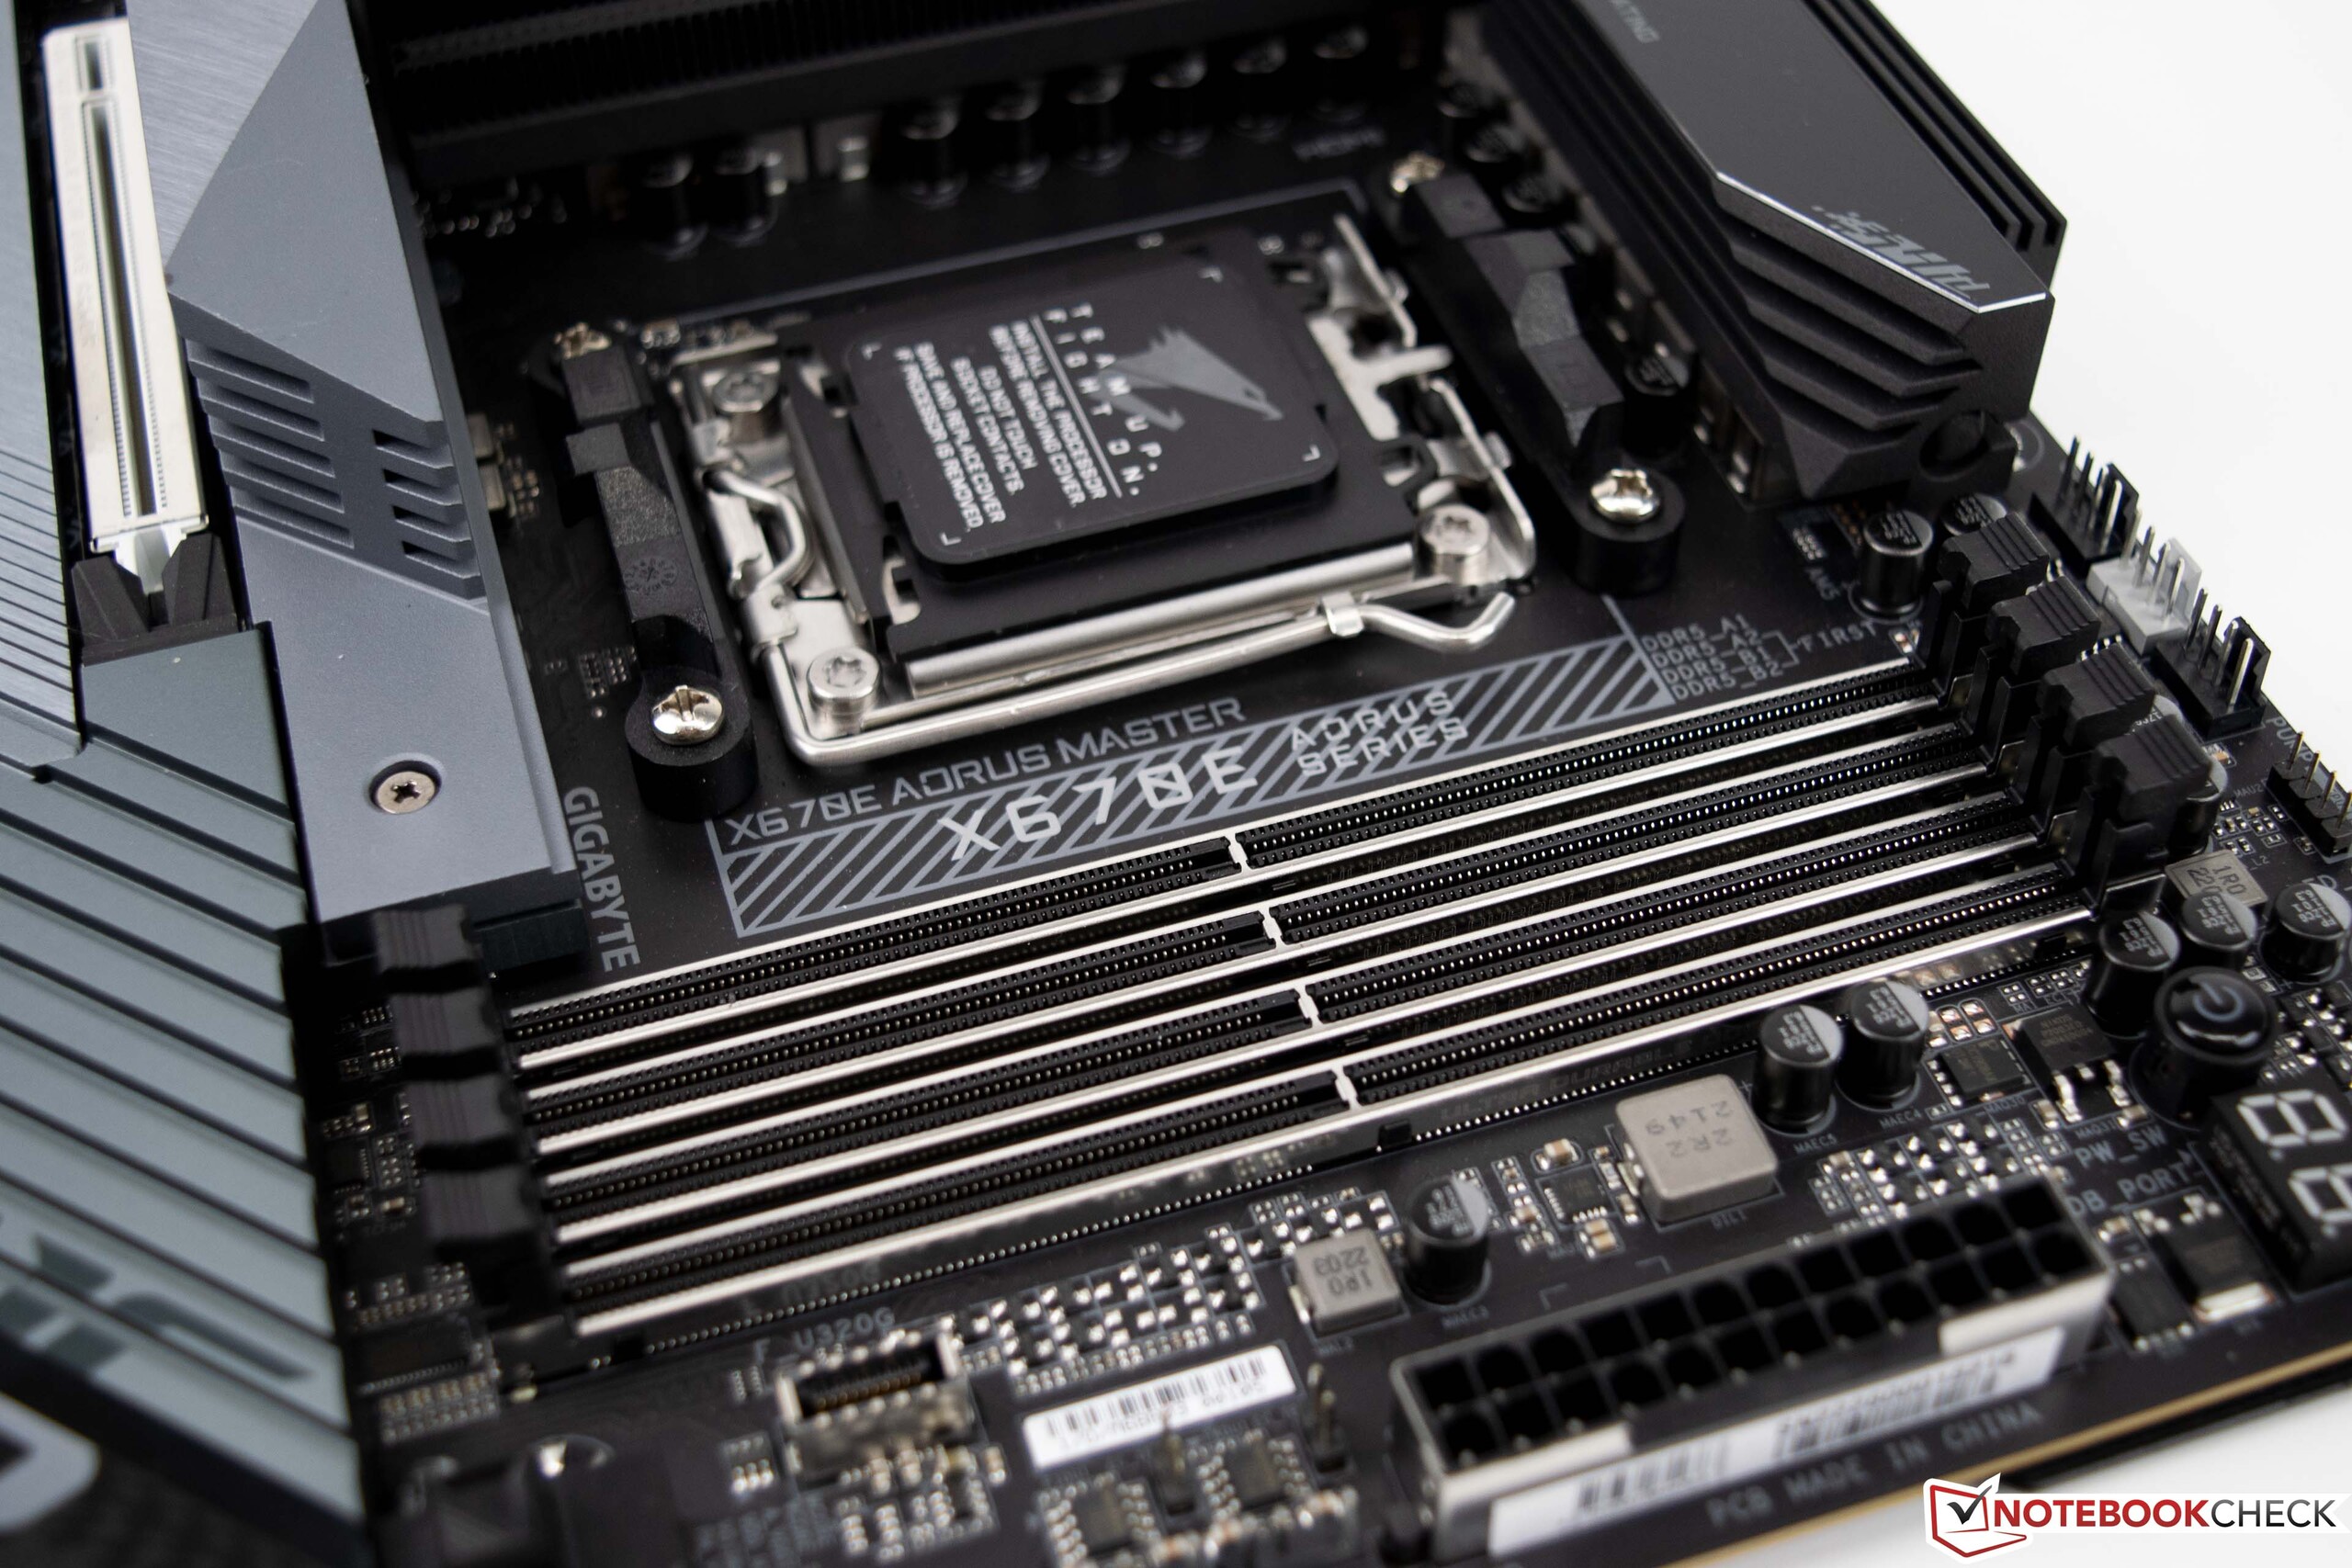
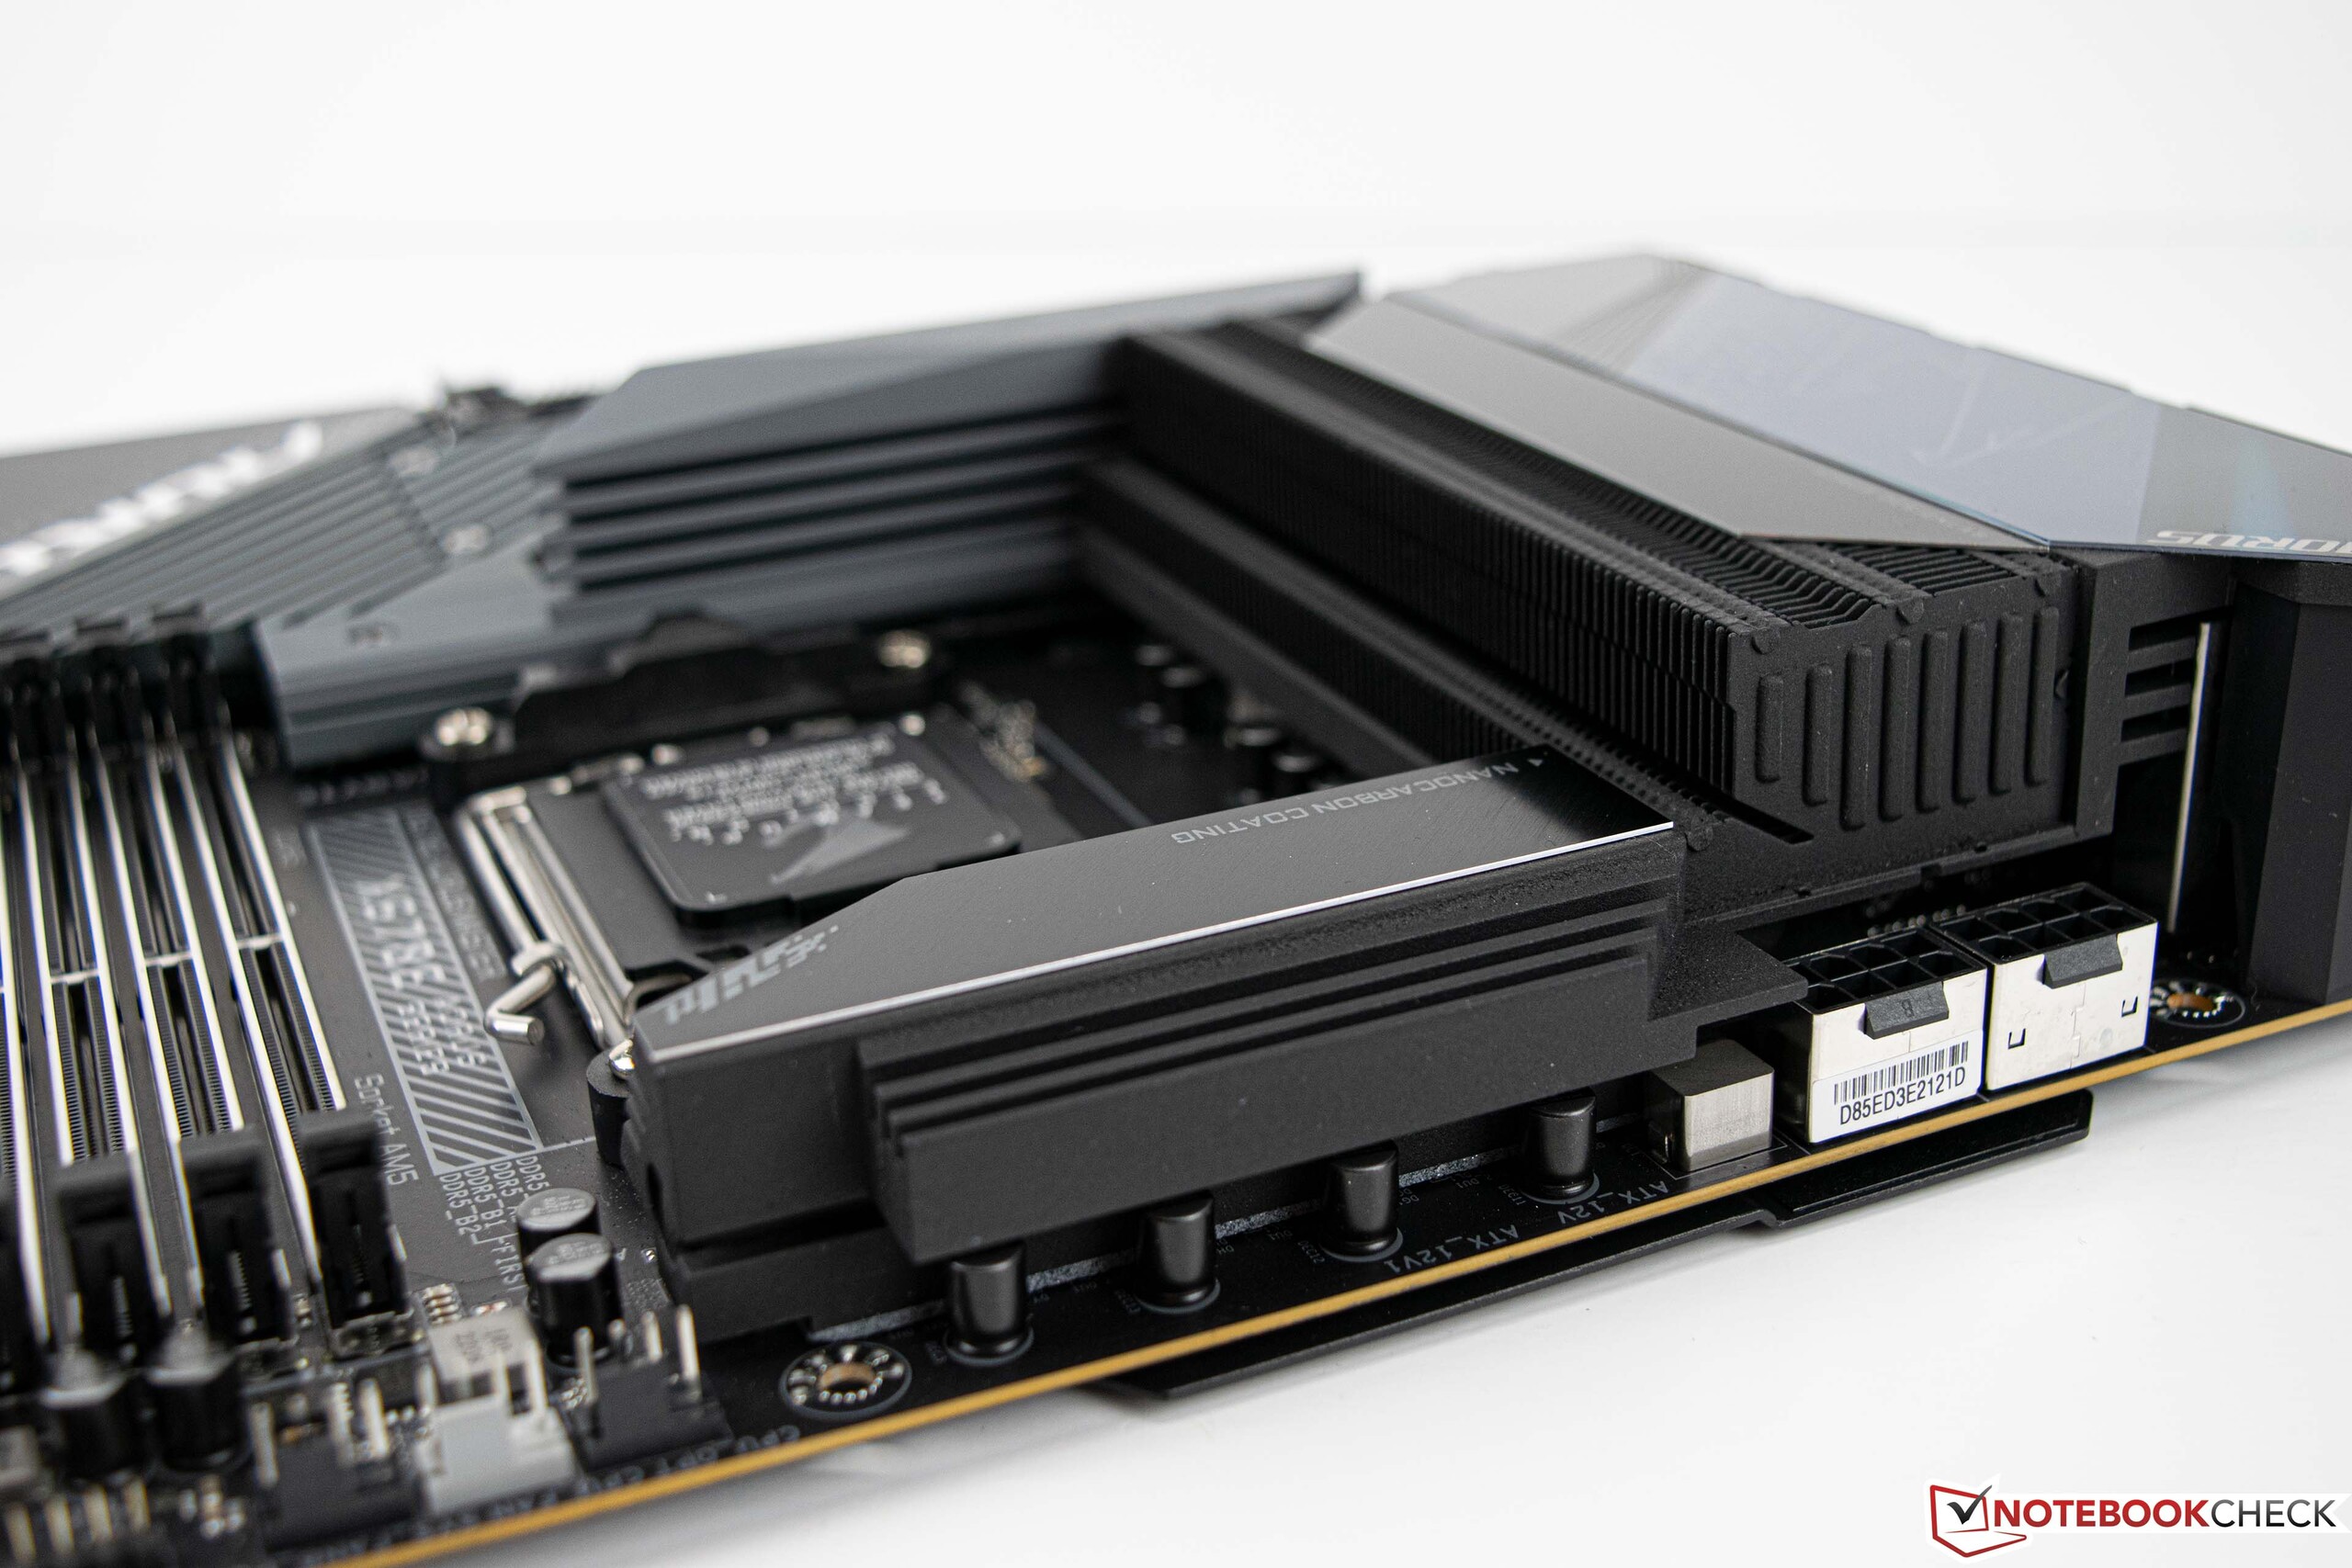
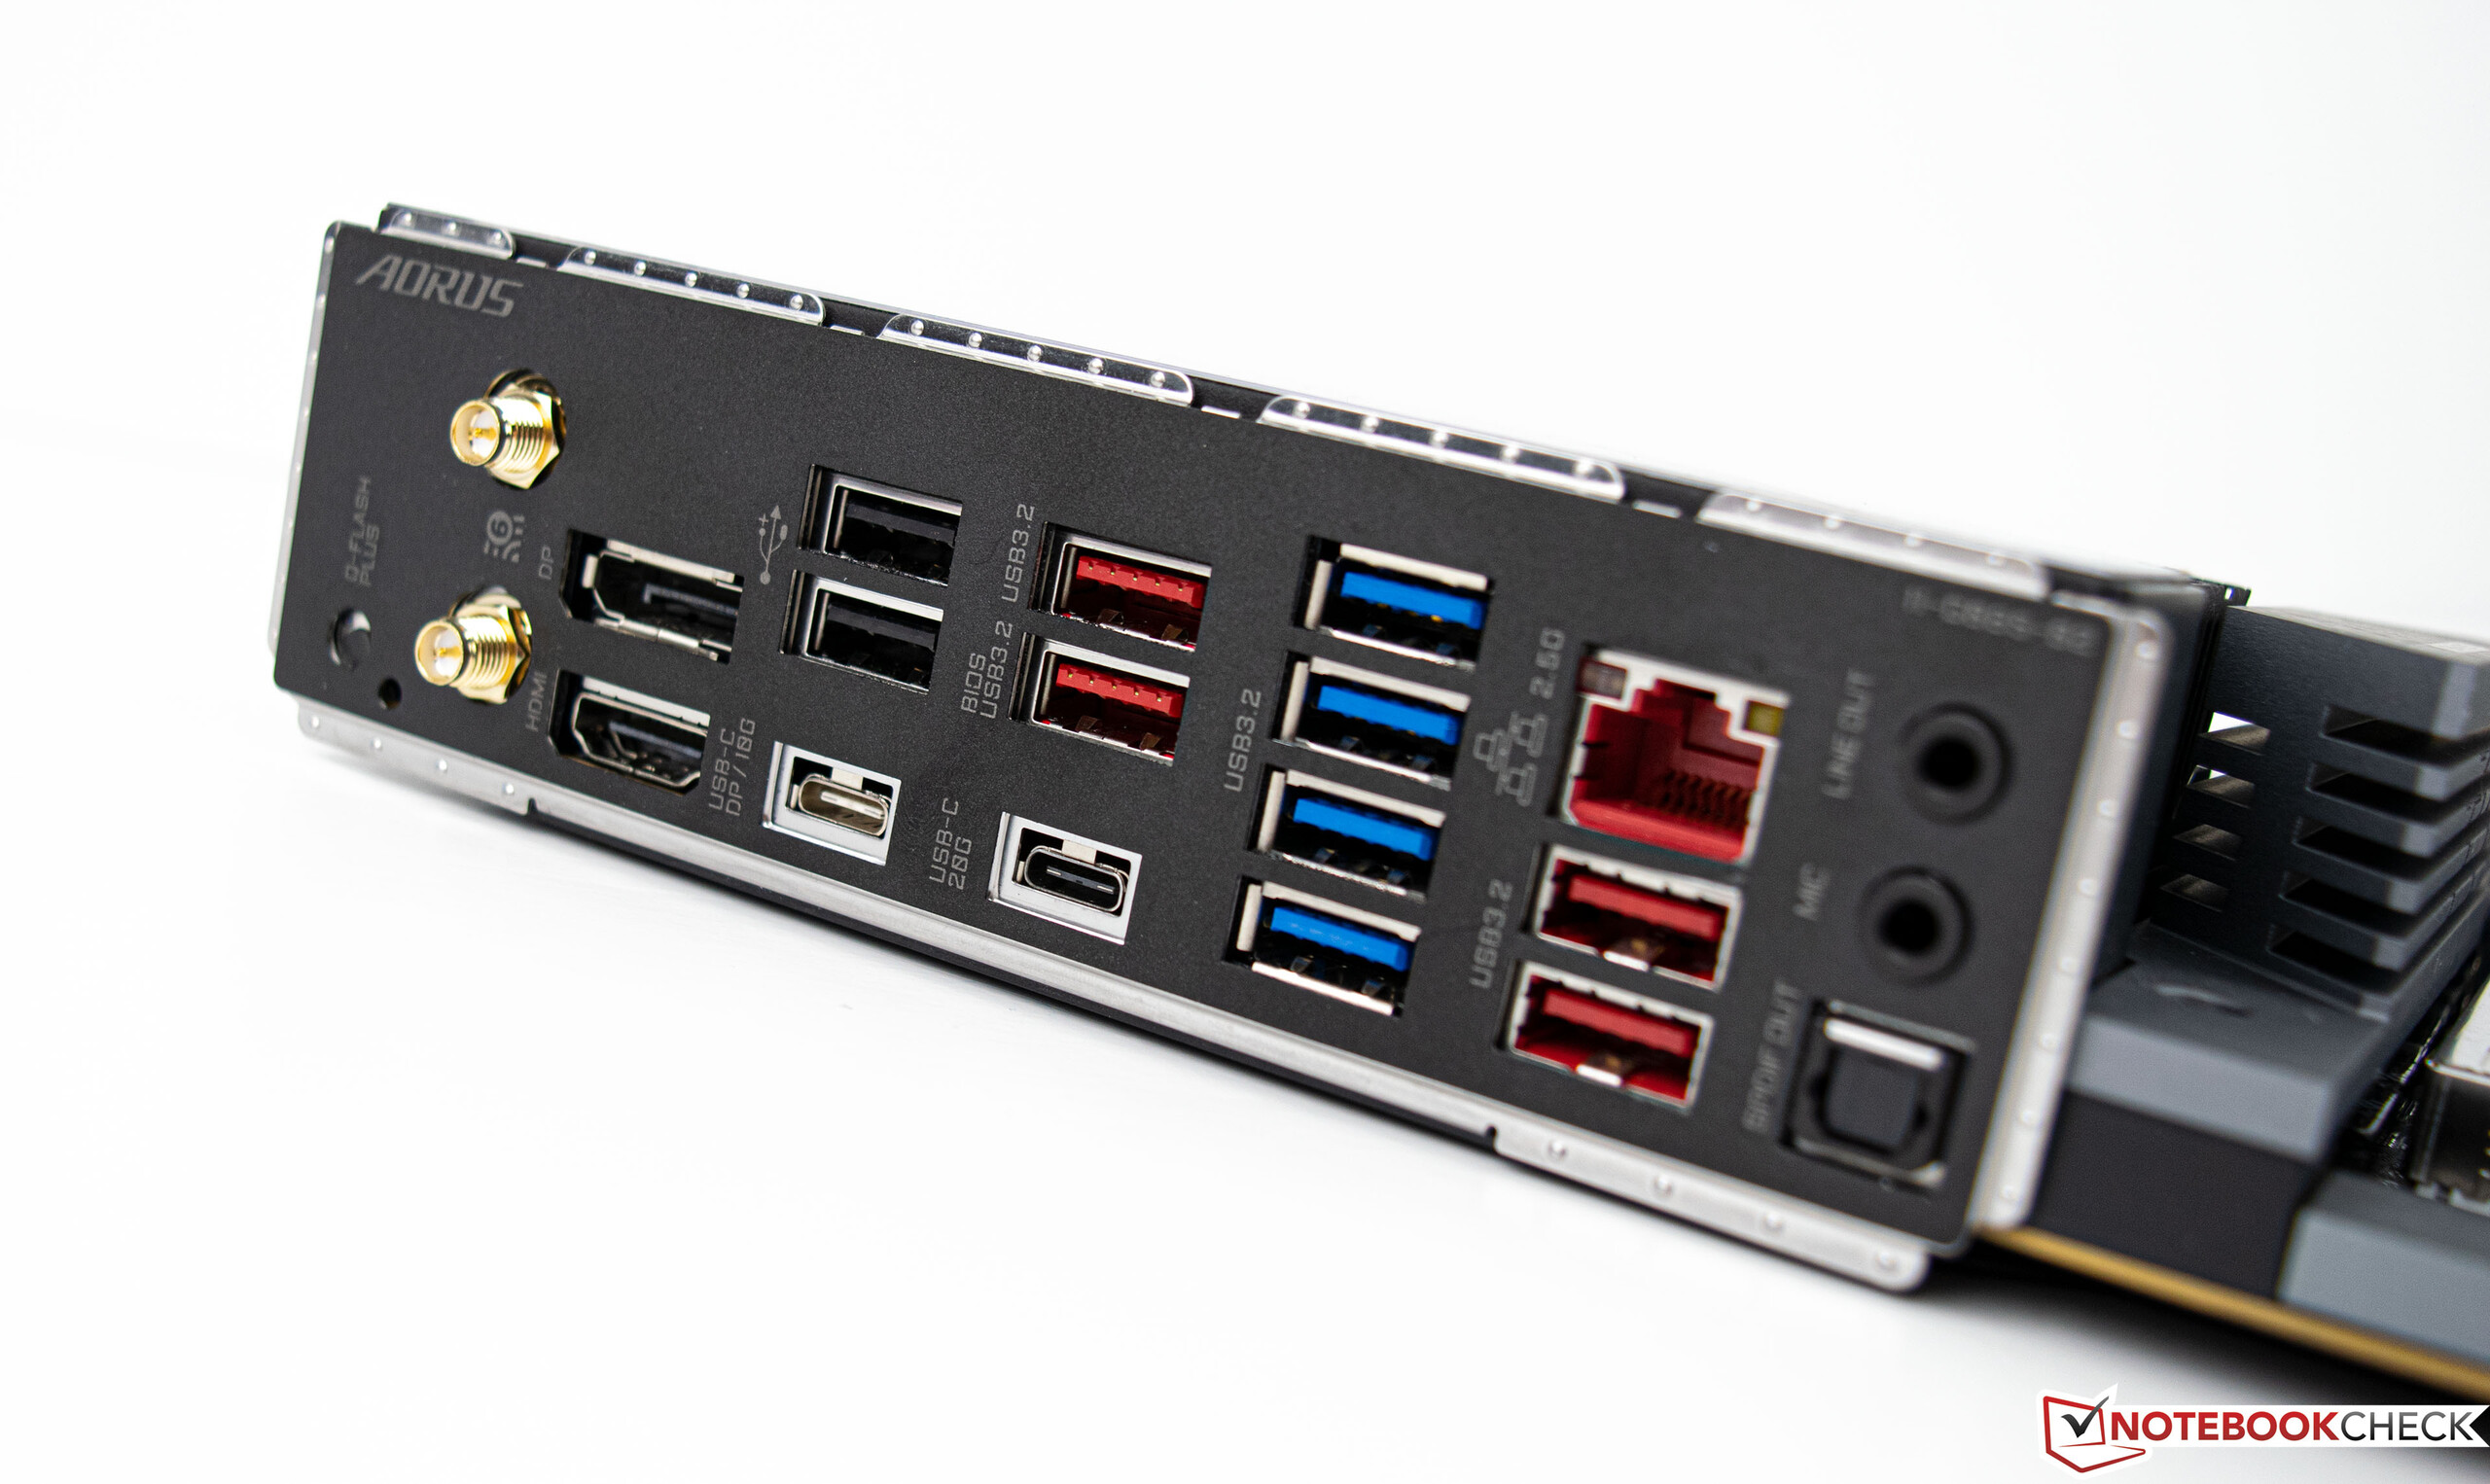
The Gigabyte X670E Aorus Master in detail
We use the Gigabyte X670E Aorus Master as the base for our test. The motherboard offers all the new features that come with the new AMD Ryzen processors. This includes PCIe 5.0 support, which will be used by future SSDs but also graphics cards.
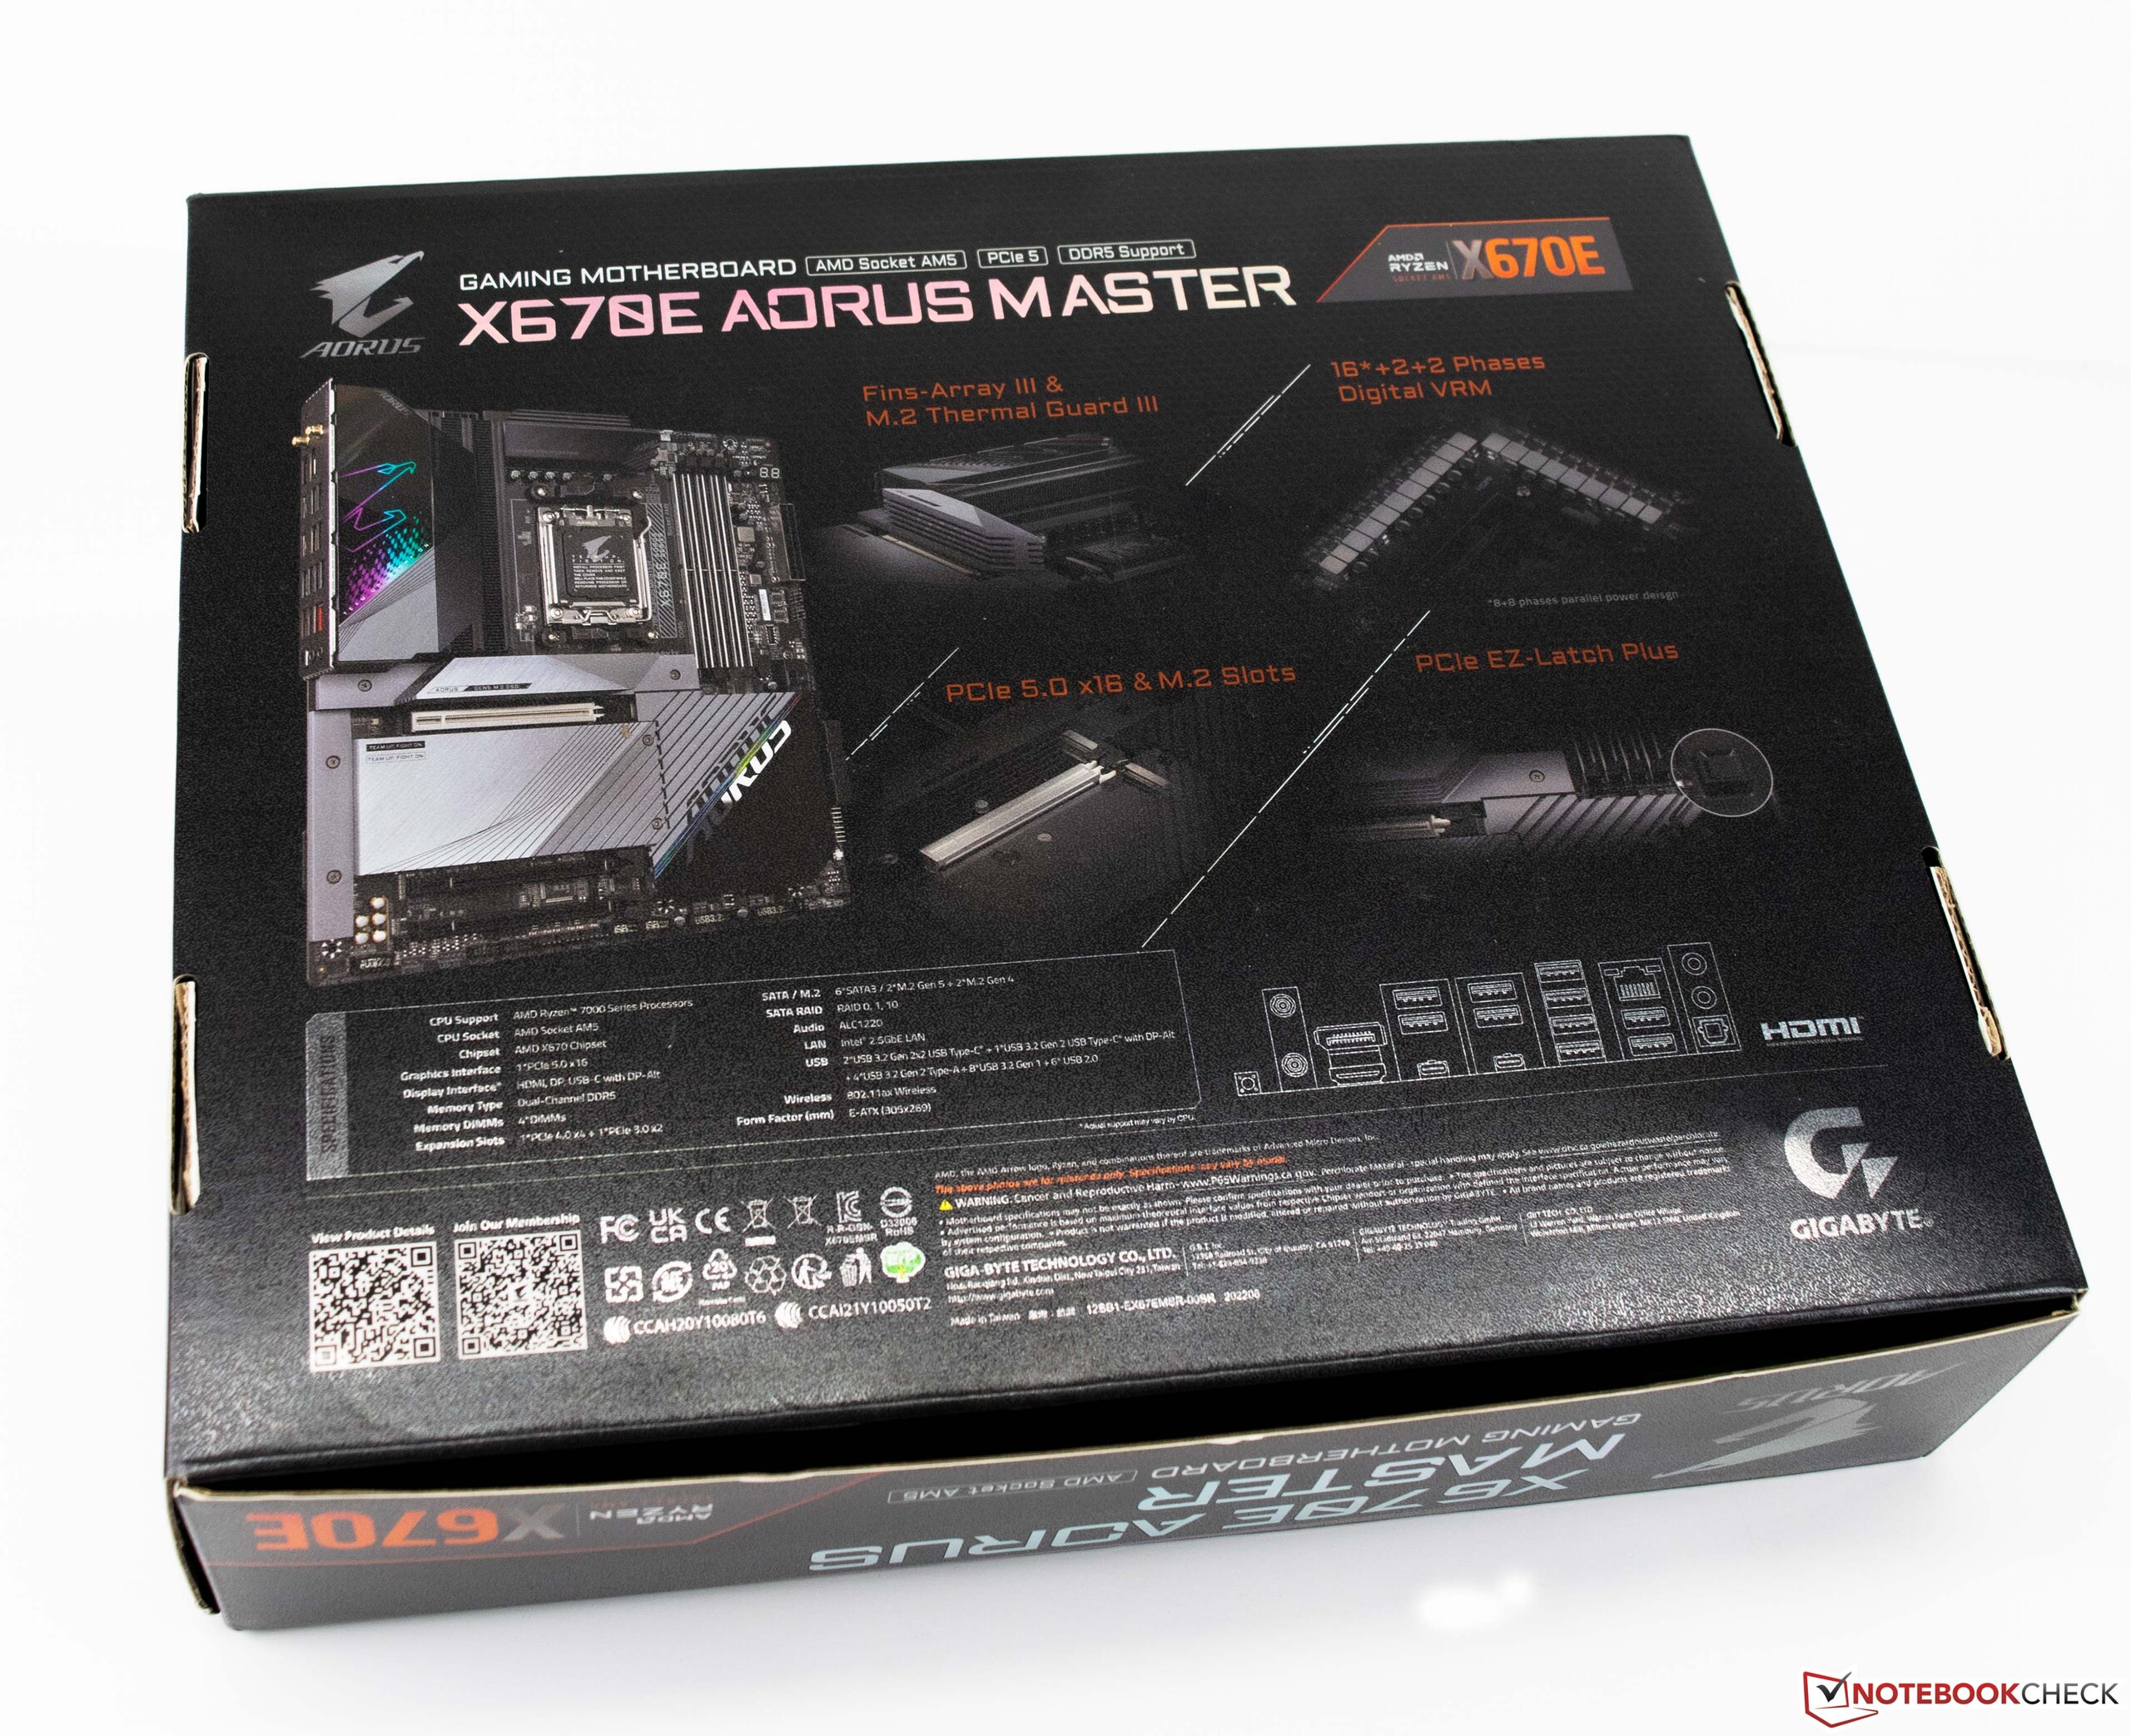
In total, there will be four different chipsets for socket AM5 including X670E, X670, B650E and B650. However, the cheaper boards will only be available in the next few weeks. Gigabyte's flagship offers 16+2+2 phases with the X670 Extreme chipset to ensure good processor power supply even during extreme overclocking. The voltage converters are located under a massive heatsink, which means we did not have any temperature problems even under load.
In total, up to four M.2 SSDs can be stored directly on the motherboard. Nevertheless, only the first M.2 slot offers the new PCIe 5.0 support. An active cooling of the chipset, which was the case in the X570 boards, is not available in the Gigabyte X670E Aorus Master. The new LGA socket aka AM5 offers 1,718 contact areas and is compatible with older AM4 coolers. AMD also talked about the service life of the new AM5 socket during the product launch. It is supposed to serve as a basis until at least 2025.
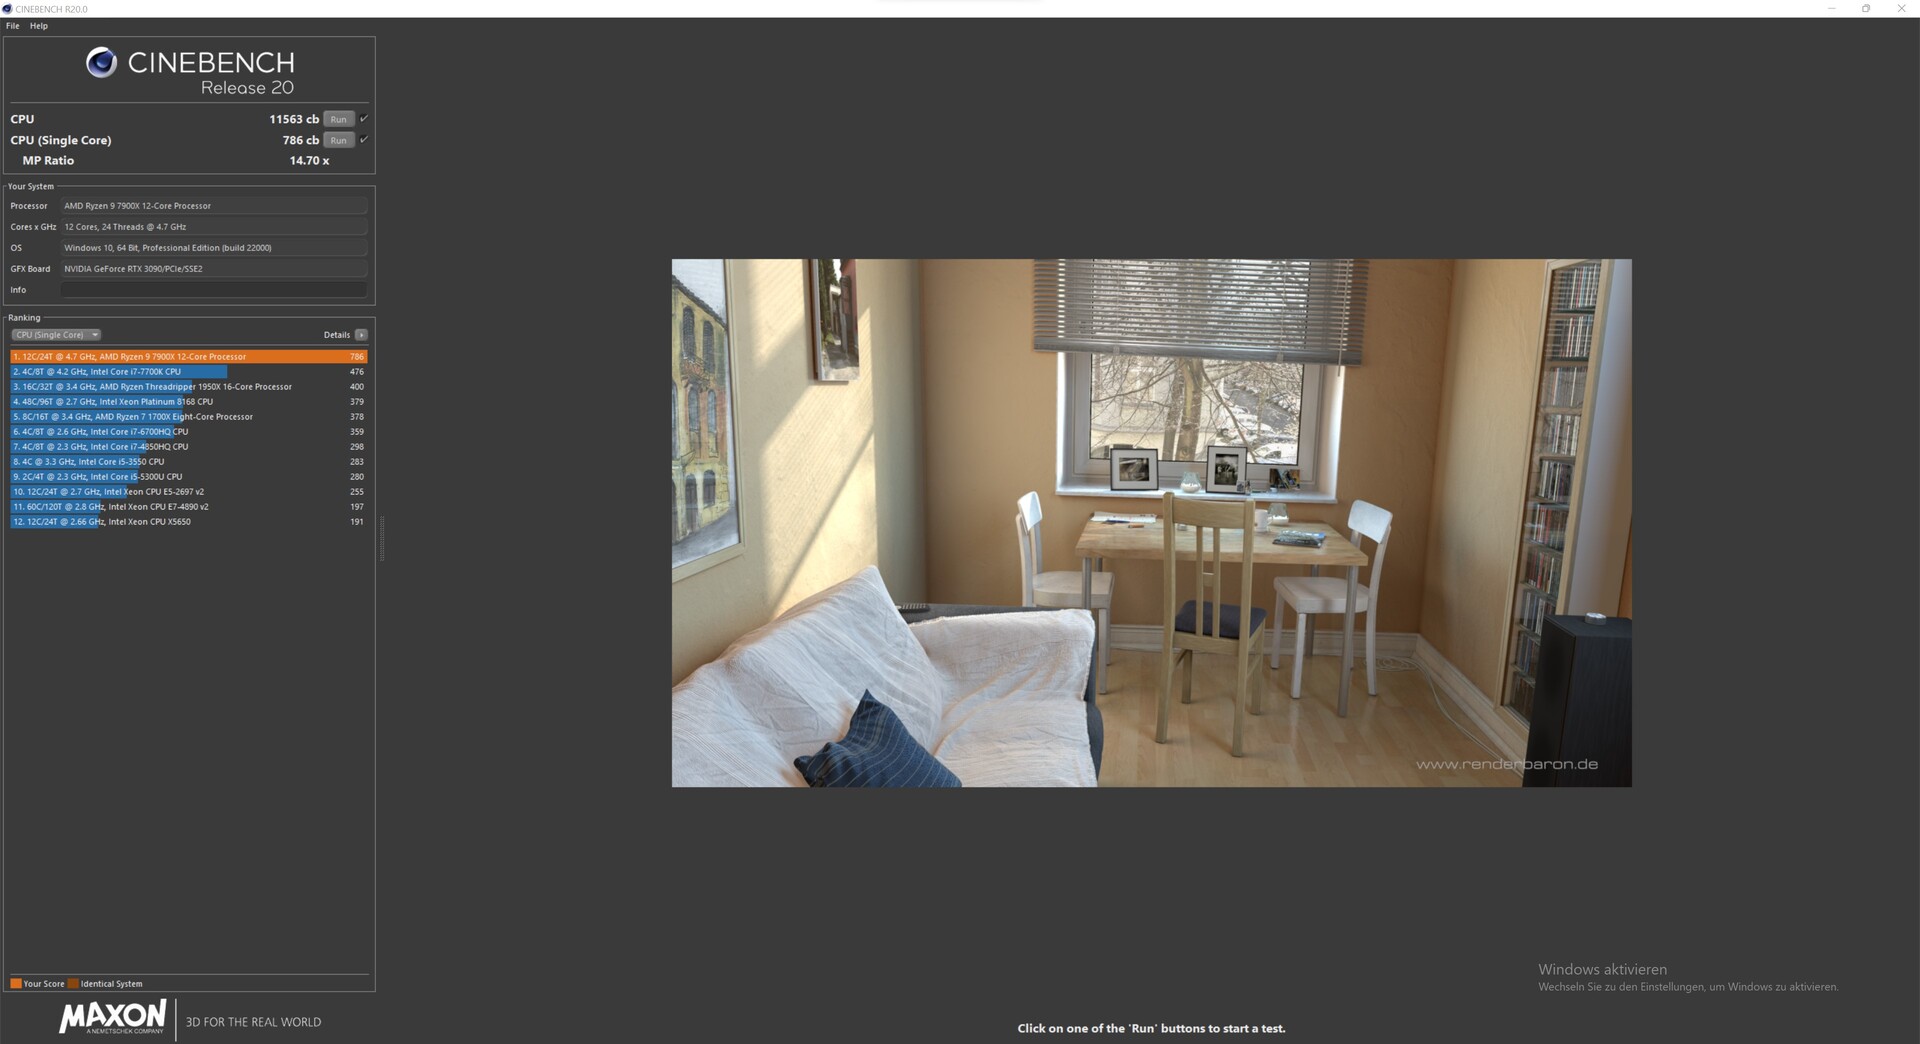
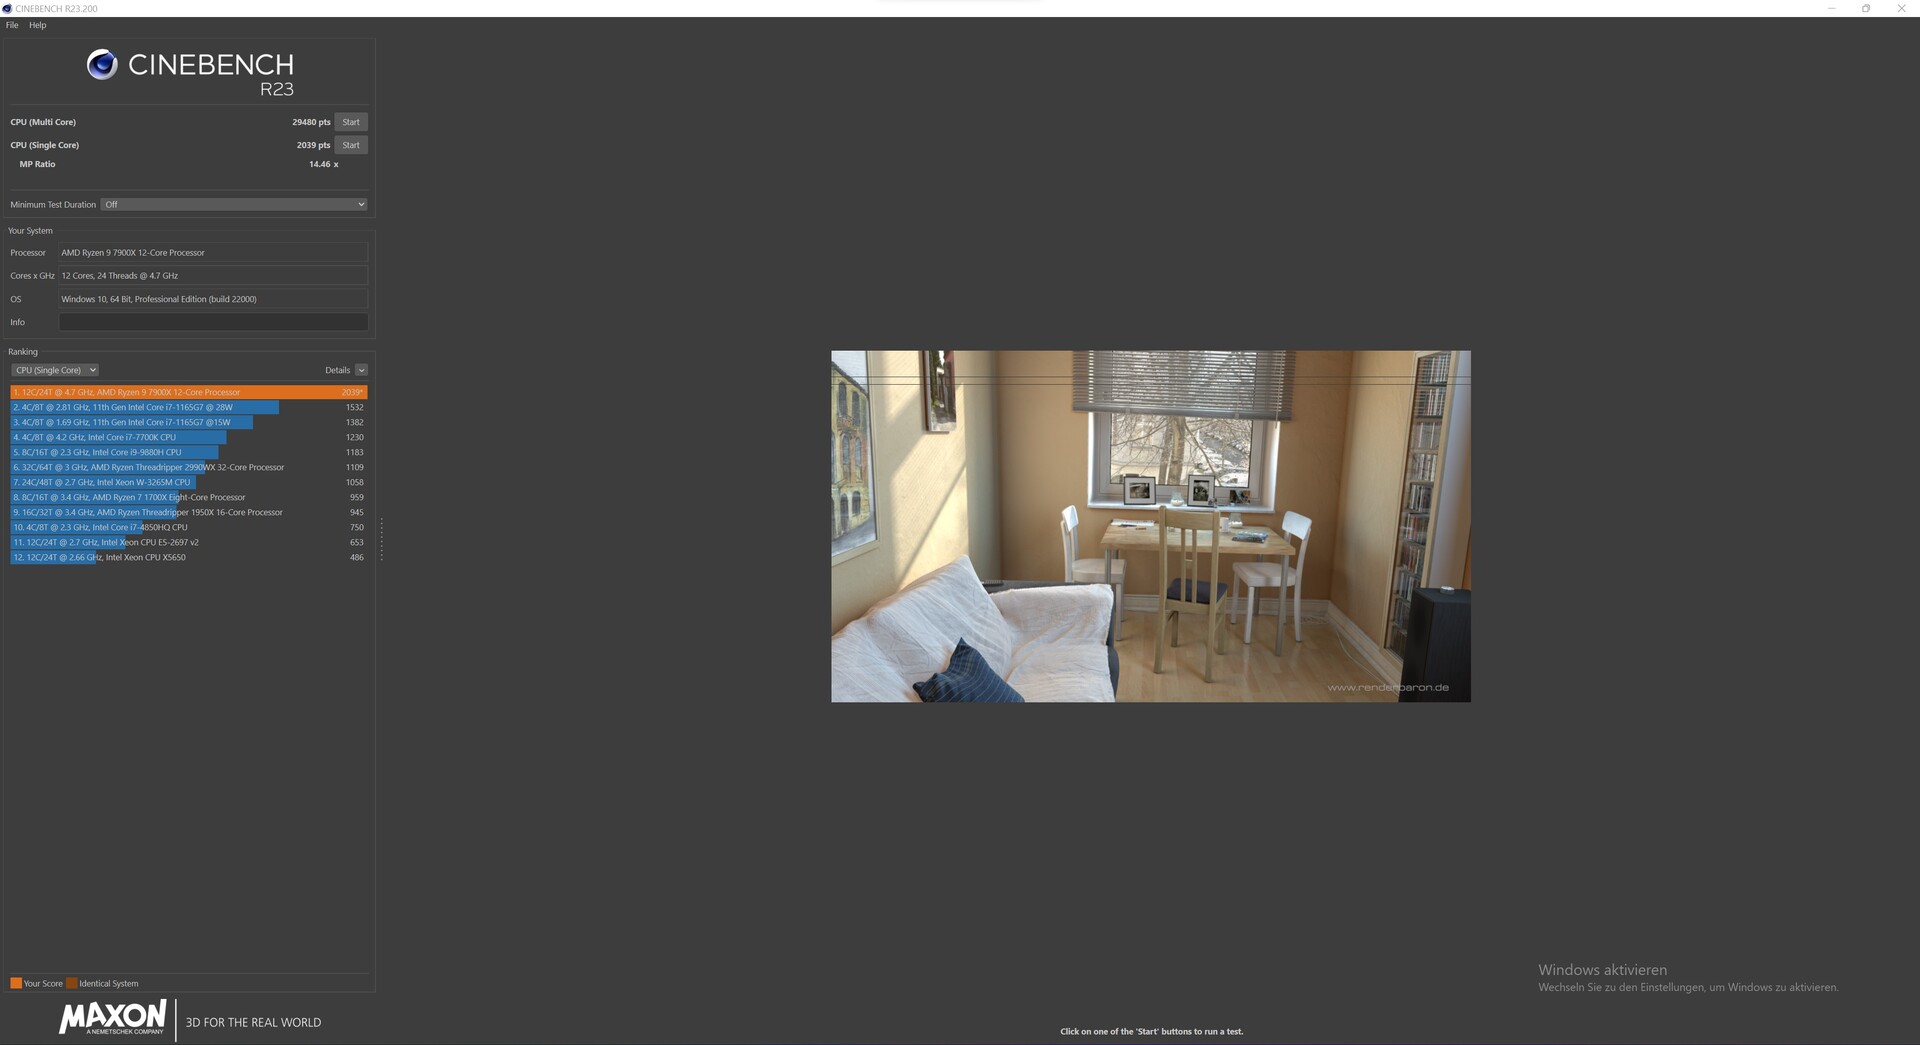
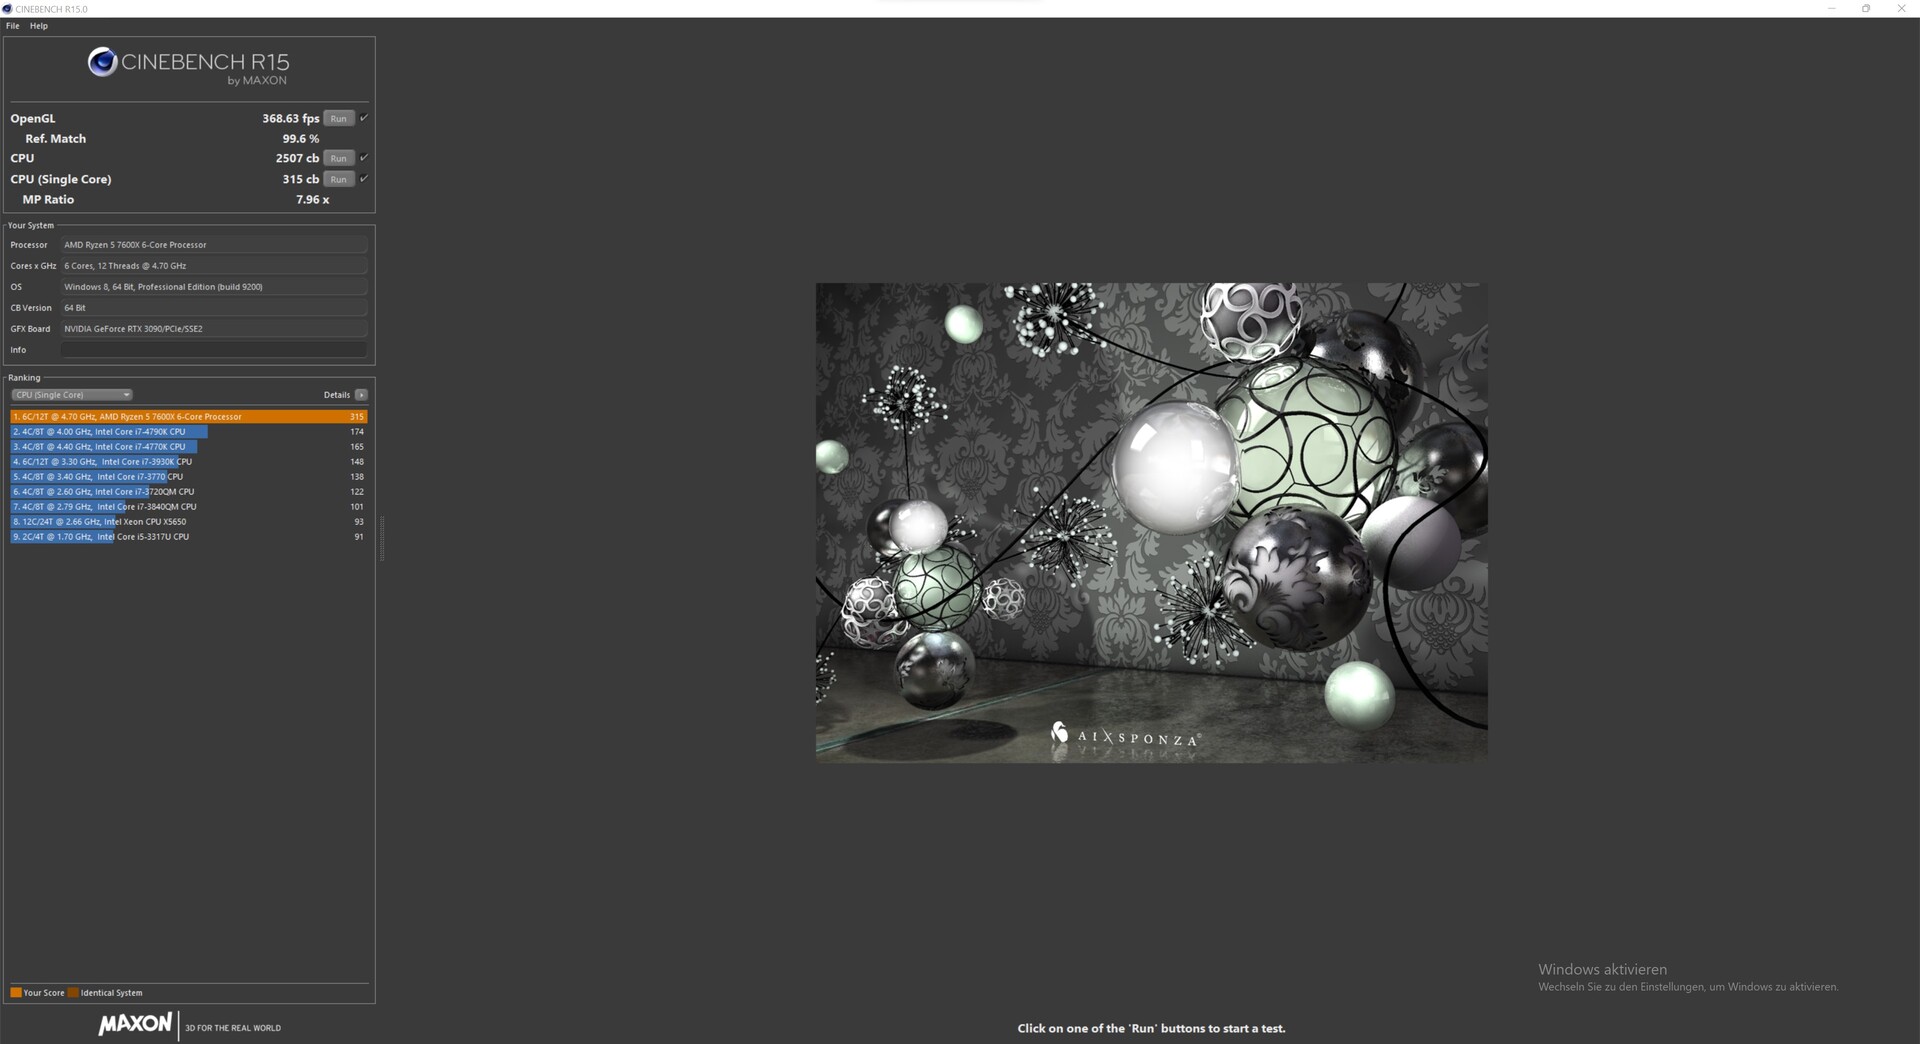
Processor benchmarks
The technical specifications of the new AMD Ryzen 7000 processors already promise a lot, and the new processors can actually prove those in action. Compared to the Ryzen 5000 generation, we record a performance increase of 26% for the AMD Ryzen 9 7900X. The AMD Ryzen 5 7600X can gain almost 20% in the performance rating compared to the AMD Ryzen 5 5600X.
As for the AMD Ryzen 9 7900X, it is even significantly faster than the AMD Ryzen 9 5950X. But the new 12-core can also prevail over the 16-core in the individual benchmarks. Thus, we can assume that the AMD Ryzen 9 7950X can also provide significantly more multi-thread performance. We will also try to run this sample through our test course in the next few days to be able to show the performance of the top model in comparison to the competition. Speaking of the competition, the Intel Core i9-12900K can't keep up with the AMD Ryzen 9 7900X either and has to rank 9% behind our test sample.
The smaller AMD Ryzen 5 7600X performs similarly well and can outperform the AMD Ryzen 5 5600X clearly. The lead over the Intel Core i5-12600K is a bit smaller than the 12-core at about 6%, but it is still there.
It remains to be seen what Intel will come up with in terms of the new Raptor Lake processors. These should follow soon and we are already looking forward to another battle.
AMD Ryzen 9 7900X

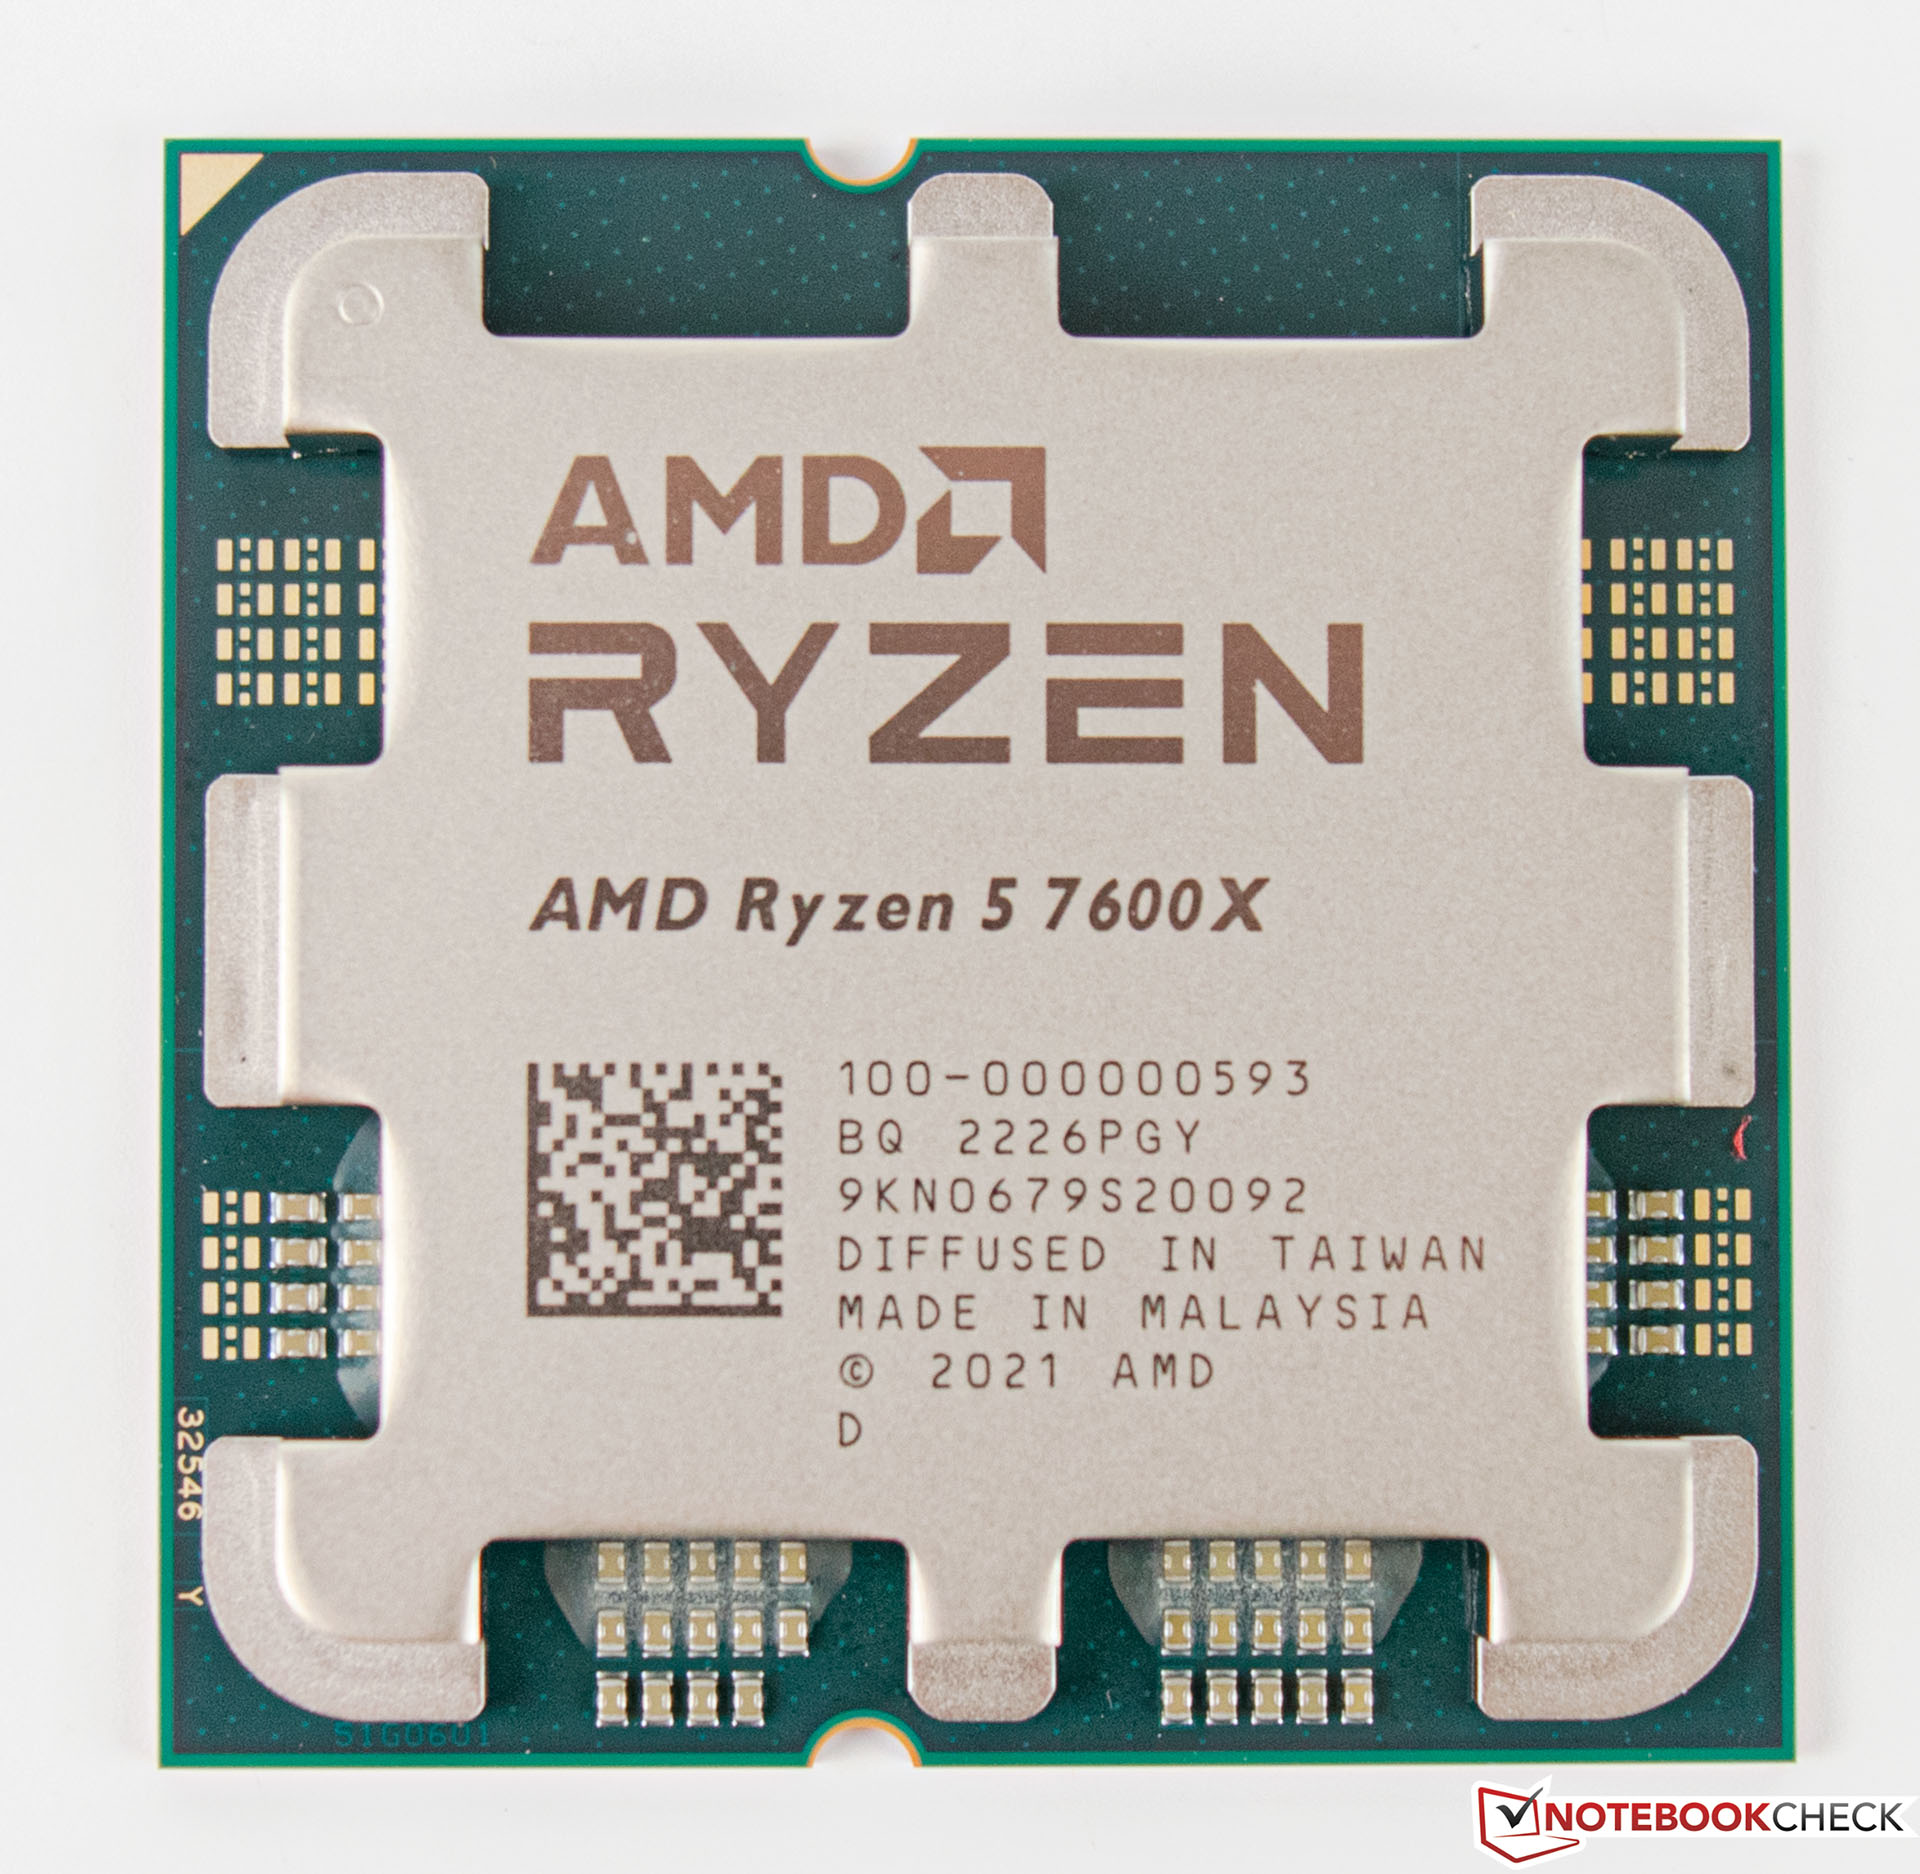
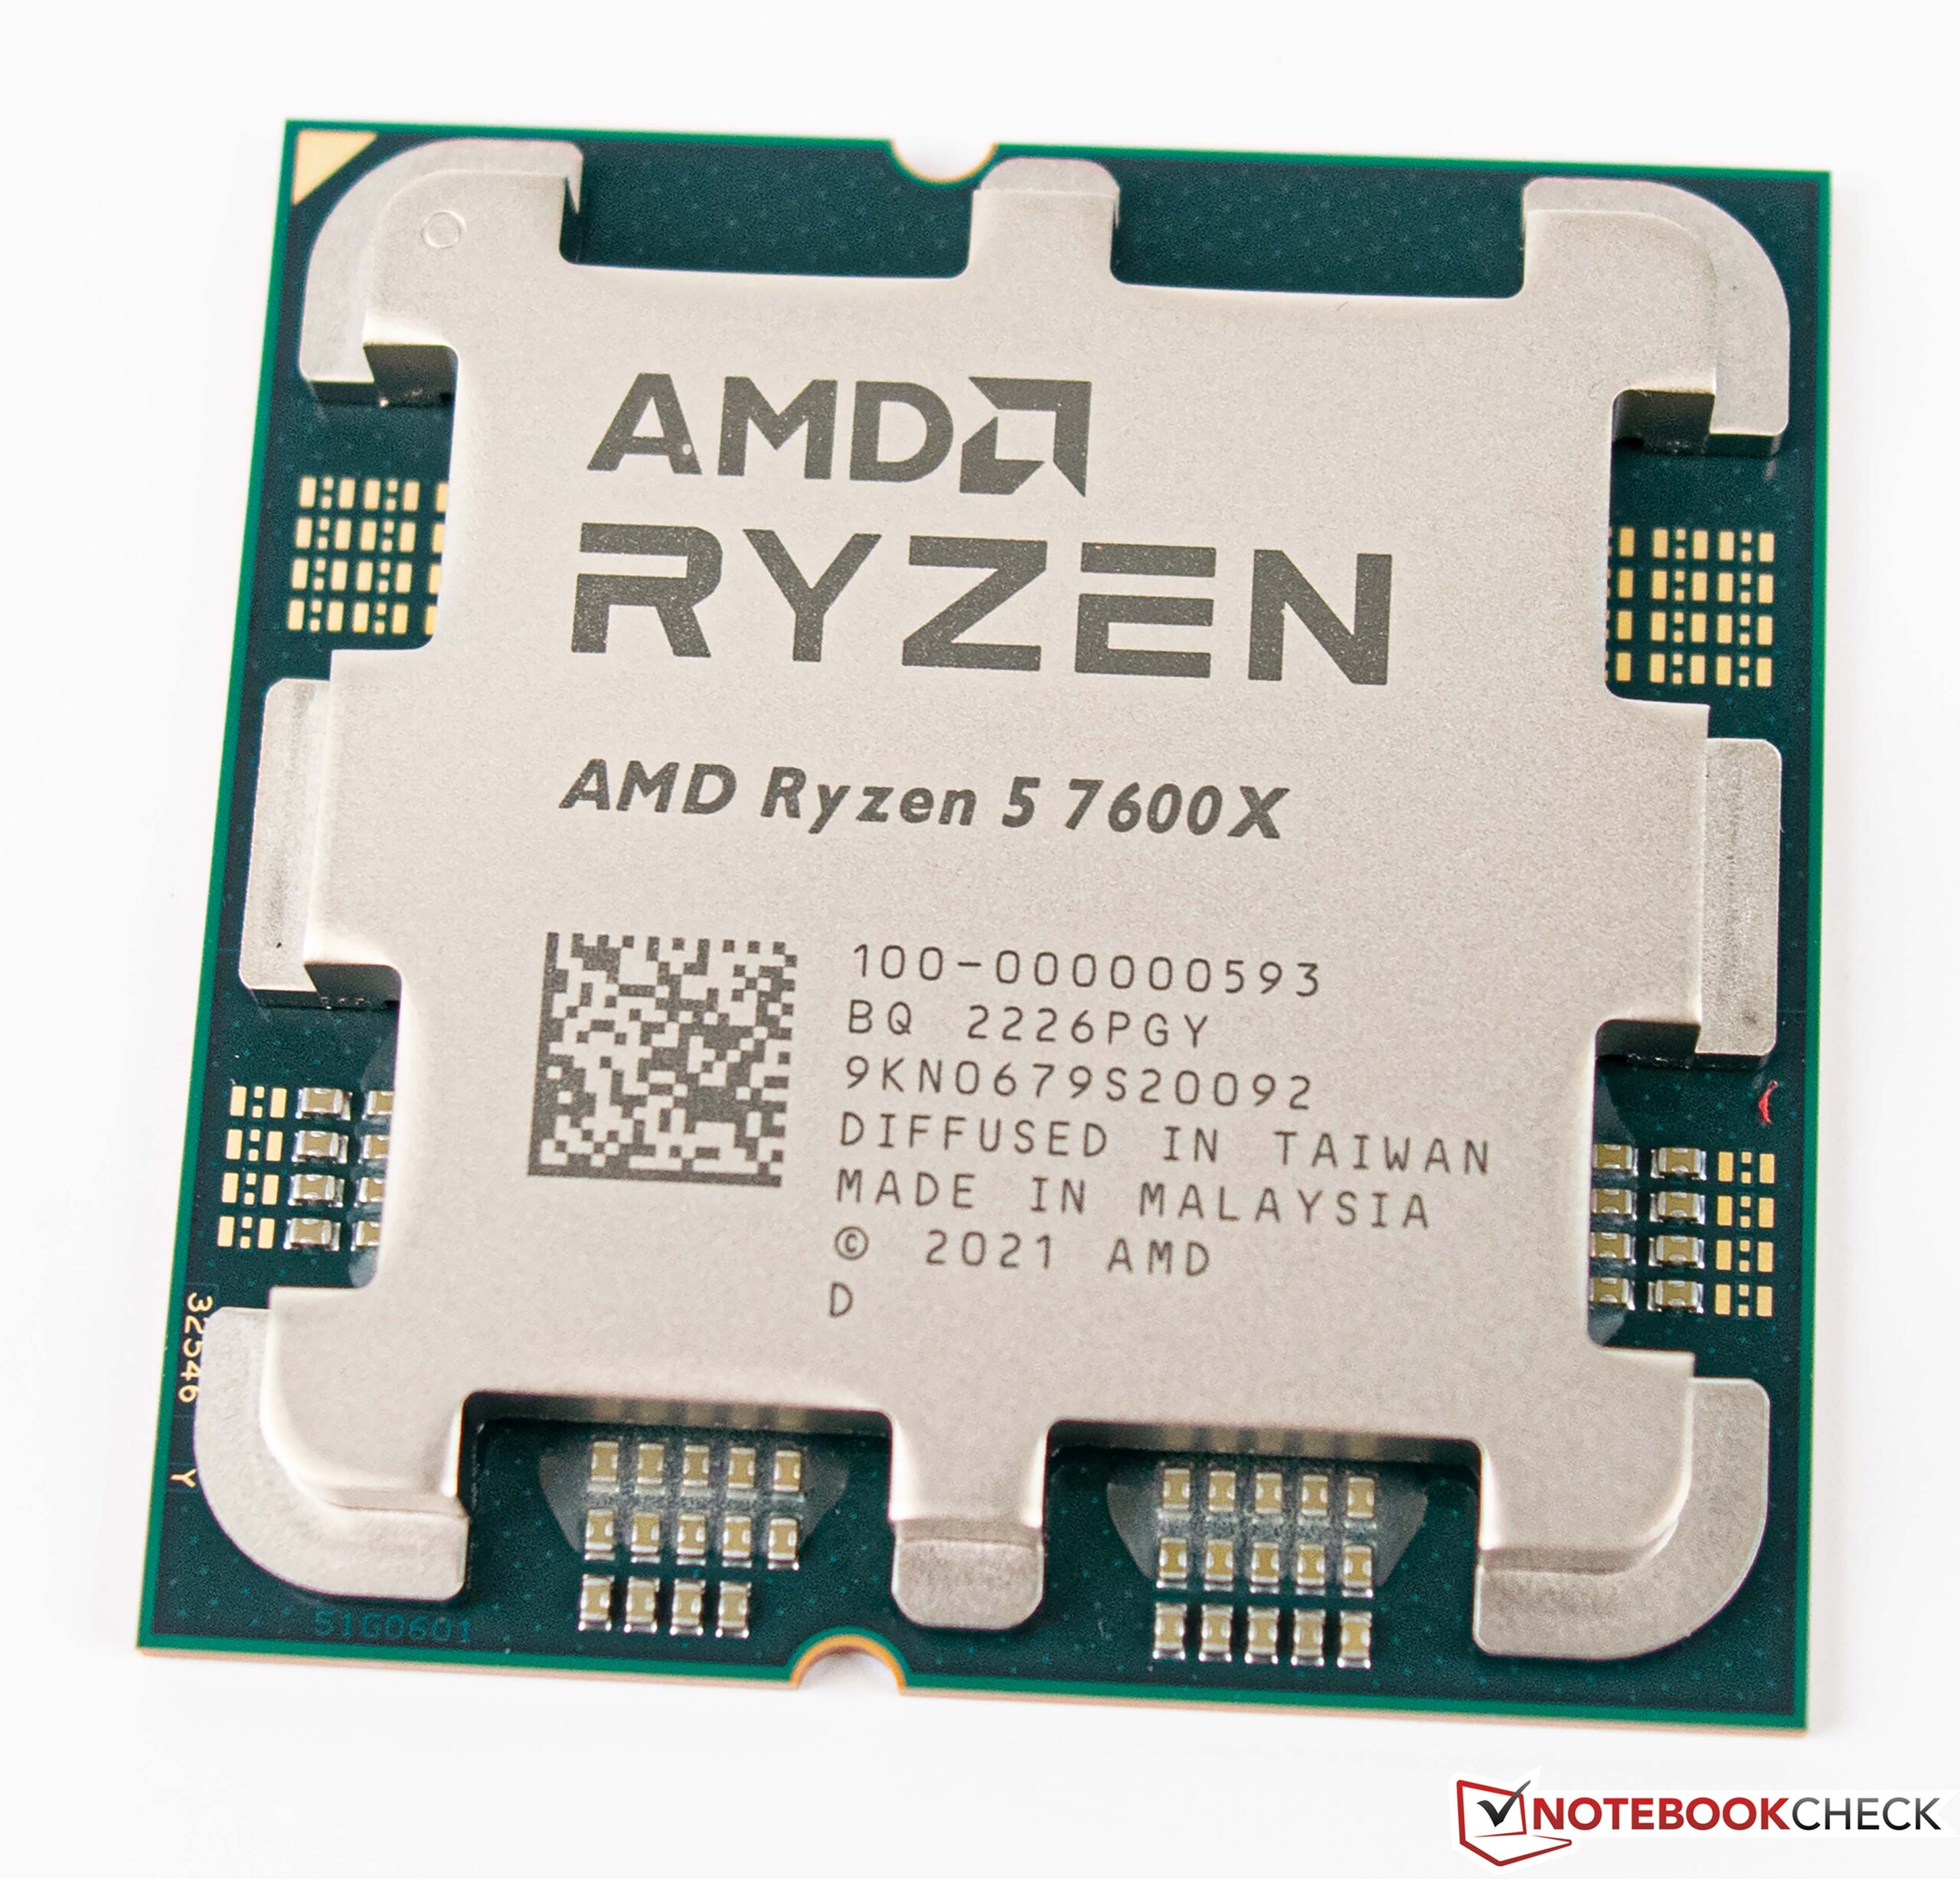
AMD Ryzen 5 7600X

| Performance rating - Percent | |
| AMD Ryzen 9 7900X | |
| Intel Core i9-12900K | |
| AMD Ryzen 9 5950X | |
| AMD Ryzen 5 7600X | |
| Intel Core i5-12600K | |
| AMD Ryzen 9 5900X -2! | |
| AMD Ryzen 5 5600X | |
| Cinebench R10 | |
| Rendering Single CPUs 64Bit | |
| AMD Ryzen 9 7900X | |
| Intel Core i9-12900K | |
| AMD Ryzen 5 7600X | |
| Intel Core i5-12600K | |
| AMD Ryzen 9 5950X | |
| AMD Ryzen 9 5900X | |
| AMD Ryzen 5 5600X | |
| Rendering Multiple CPUs 64Bit | |
| AMD Ryzen 9 7900X | |
| Intel Core i9-12900K | |
| AMD Ryzen 9 5950X | |
| AMD Ryzen 9 5900X | |
| AMD Ryzen 5 7600X | |
| Intel Core i5-12600K | |
| AMD Ryzen 5 5600X | |
| Blender - v2.79 BMW27 CPU | |
| AMD Ryzen 5 5600X | |
| AMD Ryzen 5 7600X | |
| Intel Core i5-12600K | |
| AMD Ryzen 9 5900X | |
| Intel Core i9-12900K | |
| AMD Ryzen 9 5950X | |
| AMD Ryzen 9 7900X | |
| WinRAR - Result | |
| AMD Ryzen 9 7900X | |
| AMD Ryzen 5 7600X | |
| AMD Ryzen 9 5900X | |
| AMD Ryzen 5 5600X | |
| AMD Ryzen 9 5950X | |
| Intel Core i9-12900K | |
| Intel Core i5-12600K | |
| 3DMark 11 - 1280x720 Performance Physics | |
| AMD Ryzen 9 7900X | |
| Intel Core i9-12900K | |
| AMD Ryzen 5 7600X | |
| AMD Ryzen 9 5950X | |
| Intel Core i5-12600K | |
| AMD Ryzen 9 5900X | |
| AMD Ryzen 5 5600X | |
| HWBOT x265 Benchmark v2.2 - 4k Preset | |
| AMD Ryzen 9 7900X | |
| AMD Ryzen 9 5950X | |
| Intel Core i5-12600K | |
| Intel Core i9-12900K | |
| AMD Ryzen 9 5900X | |
| AMD Ryzen 5 7600X | |
| AMD Ryzen 5 5600X | |
| R Benchmark 2.5 - Overall mean | |
| AMD Ryzen 5 5600X | |
| AMD Ryzen 9 5950X | |
| AMD Ryzen 9 5900X | |
| Intel Core i5-12600K | |
| Intel Core i9-12900K | |
| AMD Ryzen 5 7600X | |
| AMD Ryzen 9 7900X | |
| LibreOffice - 20 Documents To PDF | |
| Intel Core i5-12600K | |
| AMD Ryzen 9 5900X | |
| AMD Ryzen 9 5950X | |
| AMD Ryzen 5 5600X | |
| Intel Core i9-12900K | |
| AMD Ryzen 5 7600X | |
| AMD Ryzen 9 7900X | |
| WebXPRT 3 - Overall | |
| AMD Ryzen 9 7900X | |
| AMD Ryzen 5 7600X | |
| Intel Core i9-12900K | |
| Intel Core i5-12600K | |
| AMD Ryzen 9 5950X | |
| AMD Ryzen 5 5600X | |
| AMD Ryzen 9 5900X | |
| Mozilla Kraken 1.1 - Total | |
| AMD Ryzen 5 5600X | |
| AMD Ryzen 9 5900X | |
| AMD Ryzen 9 5950X | |
| Intel Core i5-12600K | |
| Intel Core i9-12900K | |
| AMD Ryzen 5 7600X | |
| AMD Ryzen 9 7900X | |
* ... smaller is better


AMD Ryzen 5 7600X + AMD Ryzen 9 7900X vs. Cinebench R15 multi-loop
The high multi-thread performance can also be maintained permanently in our test setup, as we can see in the results of the Cinebench R15 multi-loop. With an average of 4,785 points, the AMD Ryzen 9 7900X finishes this test better than the AMD Ryzen 9 5950X (4,467 points).
The AMD Ryzen 5 7600X can't quite keep up the lead of the Intel Core i5 12600K although the gap is exceedingly small with only 100 points in the 50 runs. The Intel Core i9-12900K doesn't play a big role here and can't even put the AMD Ryzen 9 7900X under pressure.
Synthetic benchmarks and application performance
The two new AMD processors clearly set the tone in synthetic benchmarks. The AMD Ryzen 9 7900X can place itself ahead of the competition with a clear lead. AMD only has to rank behind Intel in the memory benchmarks. Nevertheless, the gap is only in single-digit percentages.
| PCMark 10 - Score | |
| AMD Ryzen 9 7900X | |
| AMD Ryzen 5 7600X | |
| AMD Ryzen 9 5950X | |
| Intel Core i9-12900K | |
| AMD Ryzen 5 5600X | |
| Intel Core i5-12600K | |
| AMD Ryzen 9 5900X | |
| 3DMark 11 - 1280x720 Performance Physics | |
| AMD Ryzen 9 7900X | |
| Intel Core i9-12900K | |
| AMD Ryzen 5 7600X | |
| AMD Ryzen 9 5950X | |
| Intel Core i5-12600K | |
| Intel Core i9-12900K | |
| AMD Ryzen 9 5900X | |
| AMD Ryzen 5 5600X | |
| CrossMark - Overall | |
| AMD Ryzen 9 7900X | |
| AMD Ryzen 5 7600X | |
| Intel Core i5-12600K | |
| AMD Ryzen 9 5900X | |
| AMD Ryzen 9 5950X | |
| AMD Ryzen 5 5600X | |
| AIDA64 / Memory Copy | |
| Intel Core i5-12600K | |
| AMD Ryzen 9 7900X | |
| AMD Ryzen 9 5900X | |
| AMD Ryzen 5 7600X | |
| AMD Ryzen 9 5950X | |
| Desktop-PC | |
| AMD Ryzen 5 5600X | |
| Average of class (4514 - 234662, n=2085) | |
| AIDA64 / Memory Read | |
| Intel Core i5-12600K | |
| AMD Ryzen 9 7900X | |
| AMD Ryzen 9 5900X | |
| AMD Ryzen 9 5950X | |
| AMD Ryzen 5 5600X | |
| AMD Ryzen 5 7600X | |
| Average of class (4031 - 271066, n=2046) | |
| Desktop-PC | |
| AIDA64 / Memory Write | |
| AMD Ryzen 5 7600X | |
| AMD Ryzen 9 7900X | |
| Intel Core i5-12600K | |
| AMD Ryzen 9 5900X | |
| Average of class (3506 - 242868, n=2051) | |
| Desktop-PC | |
| AMD Ryzen 9 5950X | |
| AMD Ryzen 5 5600X | |
| AIDA64 / Memory Latency | |
| Average of class (8.7 - 536, n=2115) | |
| Intel Core i5-12600K | |
| AMD Ryzen 9 5950X | |
| AMD Ryzen 5 5600X | |
| AMD Ryzen 5 7600X | |
| AMD Ryzen 9 7900X | |
| Desktop-PC | |
| AMD Ryzen 9 5900X | |
* ... smaller is better
Game benchmarks
Let's now turn to the gaming benchmarks. Due to the high single-thread performance of Intel processors, Intel set the tone here for a long time and was gradually put under pressure by AMD with the Ryzen 5000 CPUs. Only with the Intel Core i9-12900K could Intel regain the crown in this aspect. But now there is another change at the top, because the Intel Core i9-12900K is now beaten by the new AMD Ryzen processors of the 7000 generation. The Core i9-12900K even has to subordinate itself to the AMD Ryzen 5 7600X, which is very impressive.
Nevertheless, it has to be put into perspective that the performance difference becomes smaller with increasing resolutions, since it then depends more on the graphics card's performance. Nevertheless, we can partly do without drastic performance increases in favor of the new AMD Ryzen processors at 1080p with maximum details.
Gaming performance in direct comparison with Intel
| Performance rating - Percent | |
| AMD Ryzen 9 7900X | |
| AMD Ryzen 5 7600X | |
| Intel Core i9-12900K | |
| Intel Core i5-12600K -2! | |
| F1 22 | |
| 1920x1080 Low Preset AA:T AF:16x | |
| AMD Ryzen 9 7900X | |
| AMD Ryzen 5 7600X | |
| Intel Core i9-12900K | |
| Intel Core i5-12600K | |
| 1920x1080 Ultra High Preset AA:T AF:16x | |
| Intel Core i9-12900K | |
| Intel Core i5-12600K | |
| AMD Ryzen 5 7600X | |
| AMD Ryzen 9 7900X | |
| Cyberpunk 2077 1.6 | |
| 1920x1080 Ultra Preset | |
| AMD Ryzen 9 7900X | |
| Intel Core i5-12600K | |
| AMD Ryzen 5 7600X | |
| Intel Core i9-12900K | |
| 1920x1080 Low Preset | |
| Intel Core i9-12900K | |
| AMD Ryzen 9 7900X | |
| AMD Ryzen 5 7600X | |
| Intel Core i5-12600K | |
| Far Cry 5 | |
| 1920x1080 Ultra Preset AA:T | |
| Intel Core i9-12900K | |
| AMD Ryzen 9 7900X | |
| AMD Ryzen 5 7600X | |
| Intel Core i5-12600K | |
| 1280x720 Low Preset AA:T | |
| AMD Ryzen 9 7900X | |
| AMD Ryzen 5 7600X | |
| Intel Core i9-12900K | |
| Intel Core i5-12600K | |
| X-Plane 11.11 | |
| 1920x1080 high (fps_test=3) | |
| AMD Ryzen 9 7900X | |
| AMD Ryzen 5 7600X | |
| Intel Core i9-12900K | |
| Intel Core i5-12600K | |
| 1280x720 low (fps_test=1) | |
| AMD Ryzen 5 7600X | |
| AMD Ryzen 9 7900X | |
| Intel Core i9-12900K | |
| Intel Core i5-12600K | |
| Final Fantasy XV Benchmark | |
| 1920x1080 High Quality | |
| AMD Ryzen 9 7900X | |
| AMD Ryzen 5 7600X | |
| Intel Core i9-12900K | |
| Intel Core i5-12600K | |
| 1280x720 Lite Quality | |
| AMD Ryzen 9 7900X | |
| Intel Core i9-12900K | |
| AMD Ryzen 5 7600X | |
| Intel Core i5-12600K | |
| Dota 2 Reborn | |
| 1920x1080 ultra (3/3) best looking | |
| AMD Ryzen 9 7900X | |
| AMD Ryzen 5 7600X | |
| Intel Core i9-12900K | |
| Intel Core i5-12600K | |
| 1280x720 min (0/3) fastest | |
| AMD Ryzen 5 7600X | |
| AMD Ryzen 9 7900X | |
| Intel Core i9-12900K | |
| Intel Core i5-12600K | |
| The Witcher 3 | |
| 1920x1080 Ultra Graphics & Postprocessing (HBAO+) | |
| AMD Ryzen 9 7900X | |
| AMD Ryzen 5 7600X | |
| Intel Core i9-12900K | |
| 1024x768 Low Graphics & Postprocessing | |
| AMD Ryzen 9 7900X | |
| AMD Ryzen 5 7600X | |
| Intel Core i9-12900K | |
| GTA V | |
| 1920x1080 Highest AA:4xMSAA + FX AF:16x | |
| AMD Ryzen 9 7900X | |
| AMD Ryzen 5 7600X | |
| Intel Core i9-12900K | |
| Intel Core i5-12600K | |
| 1024x768 Lowest Settings possible | |
| AMD Ryzen 9 7900X | |
| AMD Ryzen 5 7600X | |
| Intel Core i9-12900K | |
| Intel Core i5-12600K | |
Ryzen 9 7900X with Nvidia GeForce RTX 3090
| low | med. | high | ultra | QHD | 4K | |
|---|---|---|---|---|---|---|
| GTA V (2015) | 187.5 | 187.5 | 187.1 | 161.4 | 151.8 | 182.2 |
| The Witcher 3 (2015) | 773 | 586 | 384 | 188.1 | 156.9 | |
| Dota 2 Reborn (2015) | 293.1 | 257 | 250.4 | 231.65 | 216.7 | |
| Final Fantasy XV Benchmark (2018) | 236 | 231 | 190.8 | 146.6 | 88.8 | |
| X-Plane 11.11 (2018) | 225 | 199.2 | 160.9 | 133.5 | ||
| Far Cry 5 (2018) | 244 | 211 | 203 | 186 | 176 | 110 |
| Strange Brigade (2018) | 741 | 479 | 380 | 329 | 249 | 153.1 |
| Shadow of the Tomb Raider (2018) | 314 | 261 | 251 | 234 | 172.2 | 99.6 |
| Far Cry New Dawn (2019) | 200 | 176 | 169 | 151 | 143 | 109 |
| Metro Exodus (2019) | 311 | 223 | 175.2 | 140.1 | 115.8 | 76.6 |
| Borderlands 3 (2019) | 244 | 213 | 190.8 | 164.1 | 131.6 | 75.3 |
| F1 2020 (2020) | 487 | 403 | 374 | 270 | 218 | 138.8 |
| F1 2021 (2021) | 648 | 548 | 441 | 224 | 175.4 | 105.3 |
| Cyberpunk 2077 1.6 (2022) | 214 | 213 | 174 | 173 | 88 | 46 |
| Tiny Tina's Wonderlands (2022) | 364 | 294 | 212 | 168.5 | 124 | 70.8 |
| F1 22 (2022) | 344 | 361 | 321 | 125.1 | 83.8 | 42.4 |
| The Quarry (2022) | 282 | 216 | 177.7 | 144.4 | 103.6 | 58.9 |
Ryzen 5 7600X with Nvidia GeForce RTX 3090
| low | med. | high | ultra | QHD | 4K | |
|---|---|---|---|---|---|---|
| GTA V (2015) | 187.5 | 187.5 | 186.7 | 155.2 | 148 | 181.9 |
| The Witcher 3 (2015) | 710 | 566 | 265 | 186.4 | 158.1 | |
| Dota 2 Reborn (2015) | 301.3 | 260 | 244.9 | 228.5 | 214.5 | |
| Final Fantasy XV Benchmark (2018) | 233 | 227 | 188.4 | 147.1 | 90.6 | |
| X-Plane 11.11 (2018) | 227 | 193.6 | 151.8 | 127.6 | ||
| Far Cry 5 (2018) | 238 | 208 | 196 | 183 | 171 | 111 |
| Strange Brigade (2018) | 819 | 510 | 402 | 354 | 270 | 161.4 |
| Shadow of the Tomb Raider (2018) | 299 | 251 | 241 | 228 | 172 | 99.7 |
| Far Cry New Dawn (2019) | 191 | 168 | 161 | 144 | 138 | 109 |
| Metro Exodus (2019) | 321 | 221 | 173.1 | 138.5 | 115.4 | 76.3 |
| Borderlands 3 (2019) | 232 | 205 | 185 | 161.2 | 130.7 | 75 |
| F1 2020 (2020) | 587 | 460 | 418 | 302 | 238 | 145.4 |
| F1 2021 (2021) | 699 | 562 | 453 | 227 | 175.8 | 105.6 |
| Cyberpunk 2077 1.6 (2022) | 199 | 198 | 174 | 125 | 88 | 46 |
| Tiny Tina's Wonderlands (2022) | 367 | 294 | 211 | 168.3 | 124 | 70.4 |
| F1 22 (2022) | 333 | 352 | 312 | 126.4 | 84.4 | 42.6 |
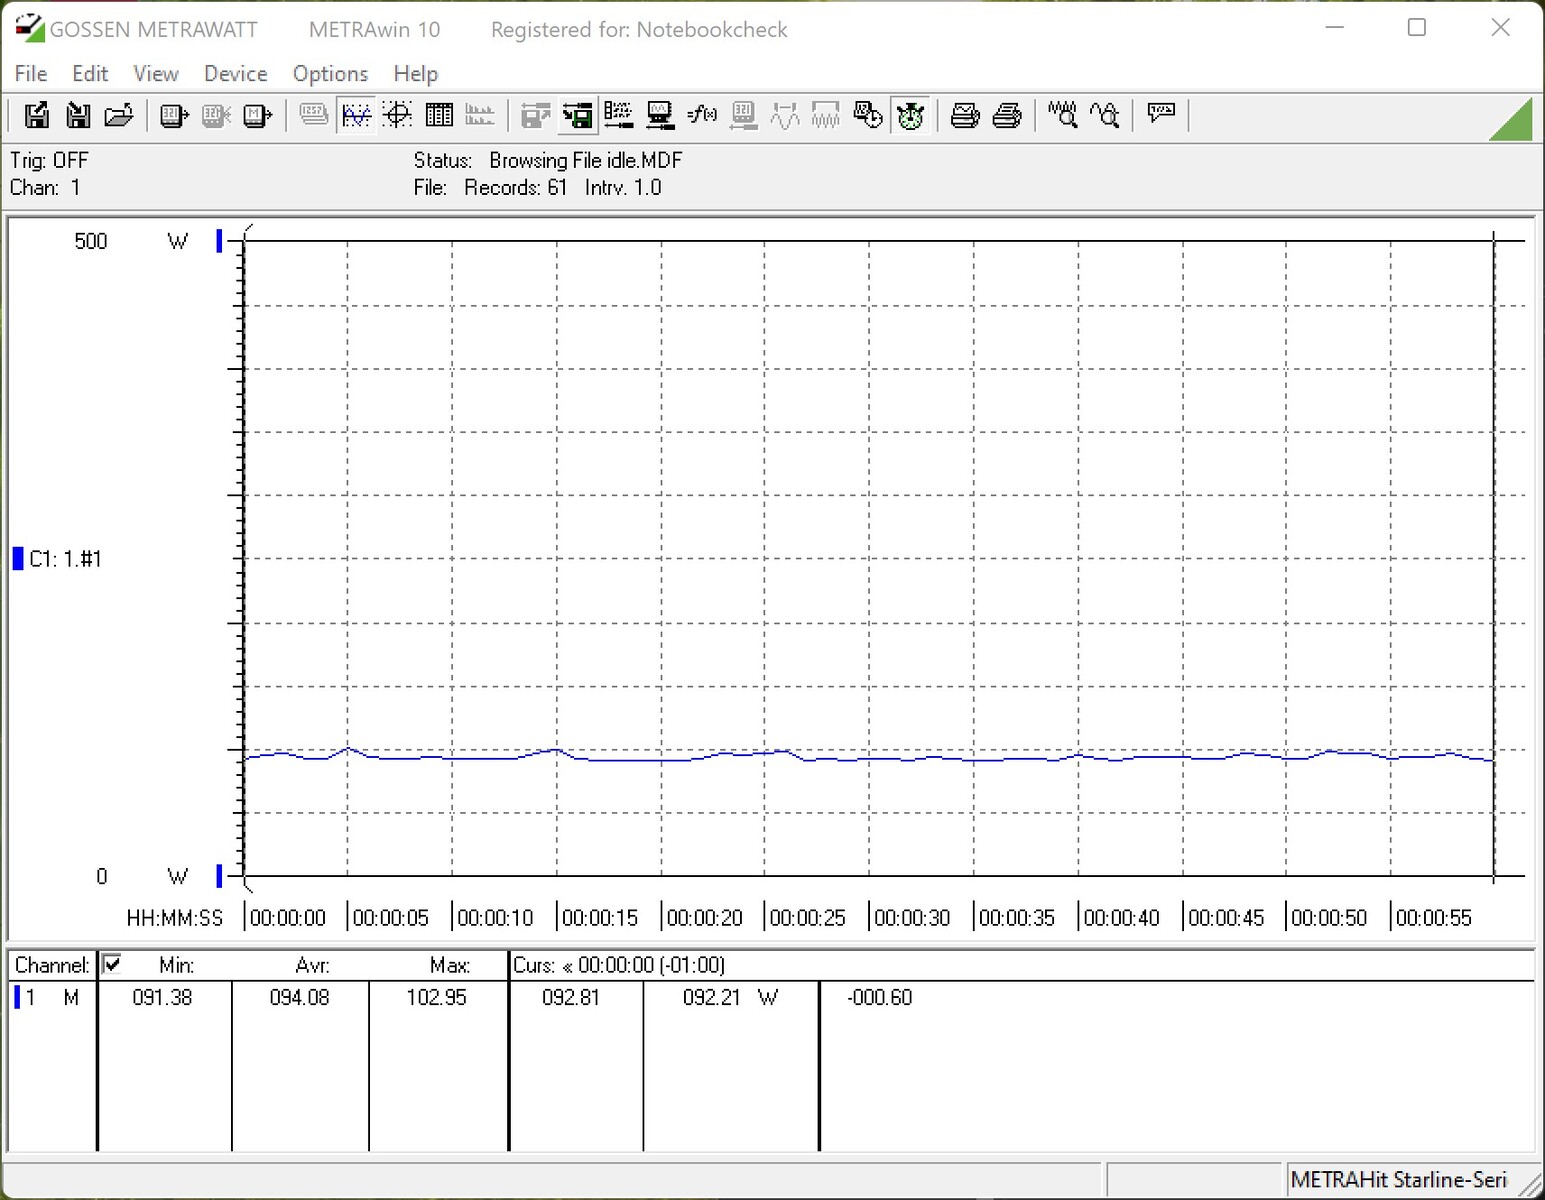
Energy consumption
The high performance of the new AMD Ryzen 7000 processors is accompanied by a significantly increased power consumption. If the AMD Ryzen 9 5900X still came with 105 W (TDP - Thermal Design Power), current Ryzen 9 models can consume 170 W. The PPT (Package Power Tracking) increases from 142 W to 230 W.
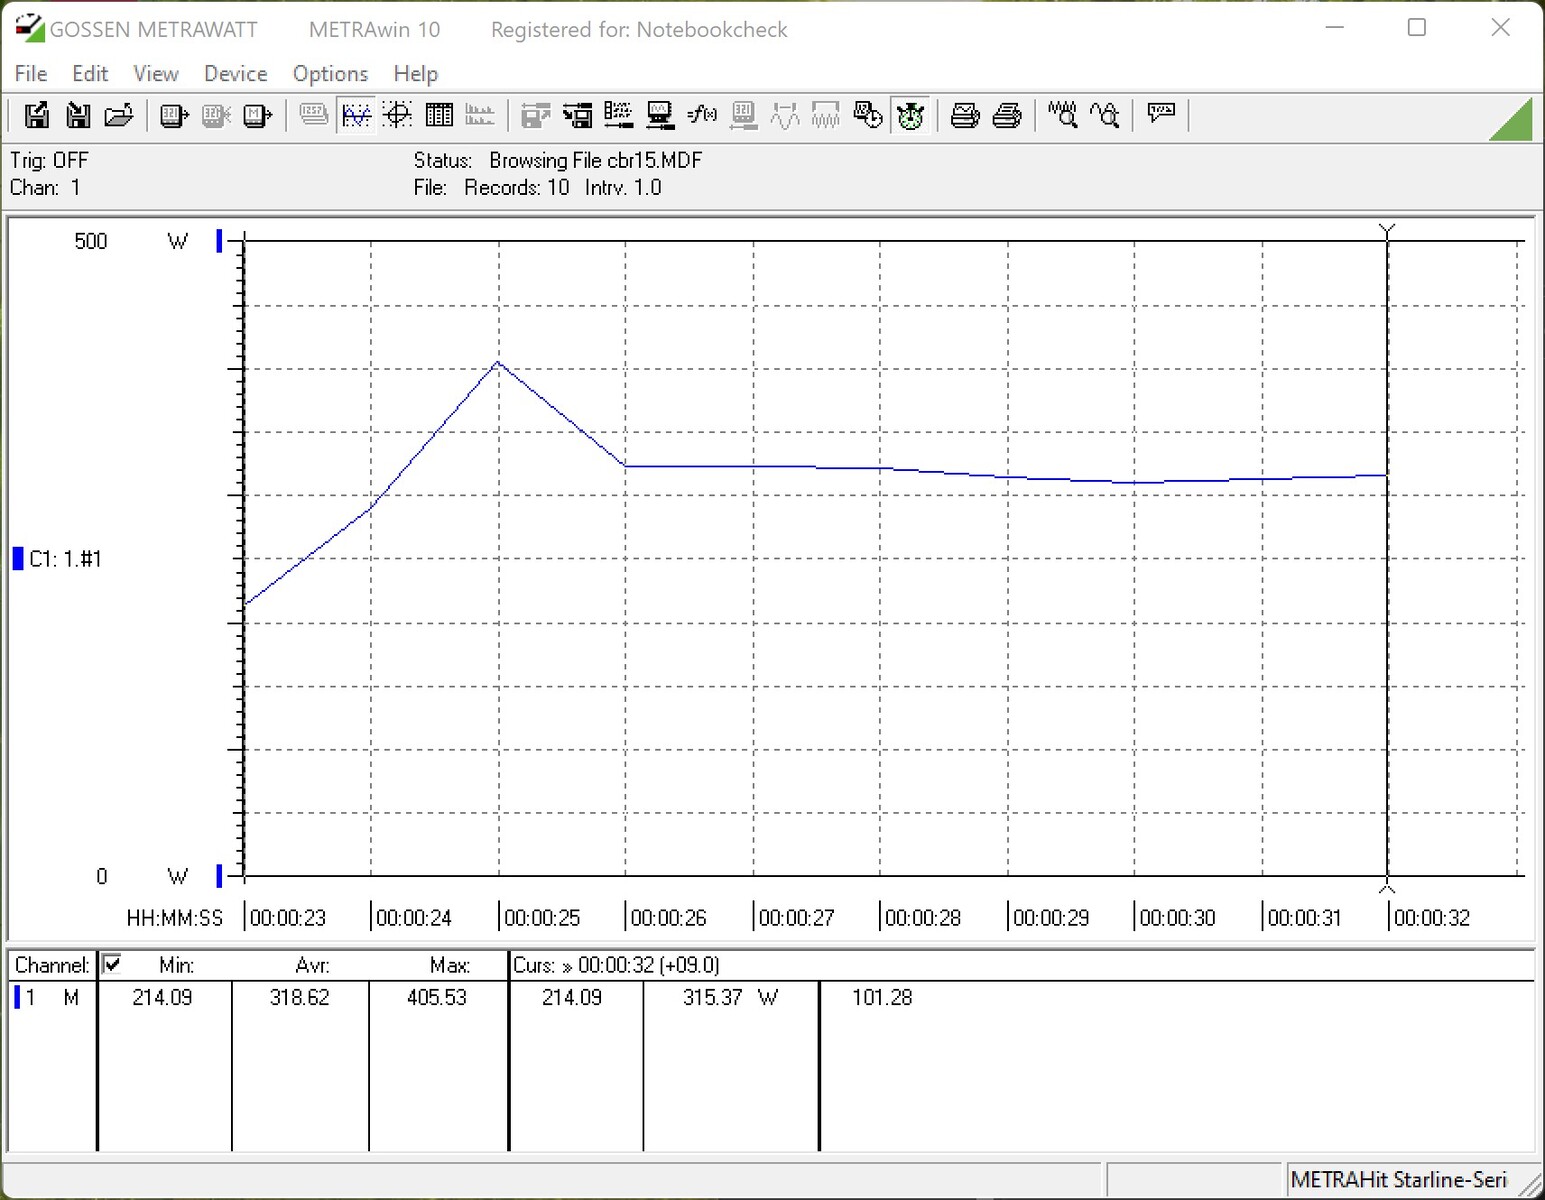
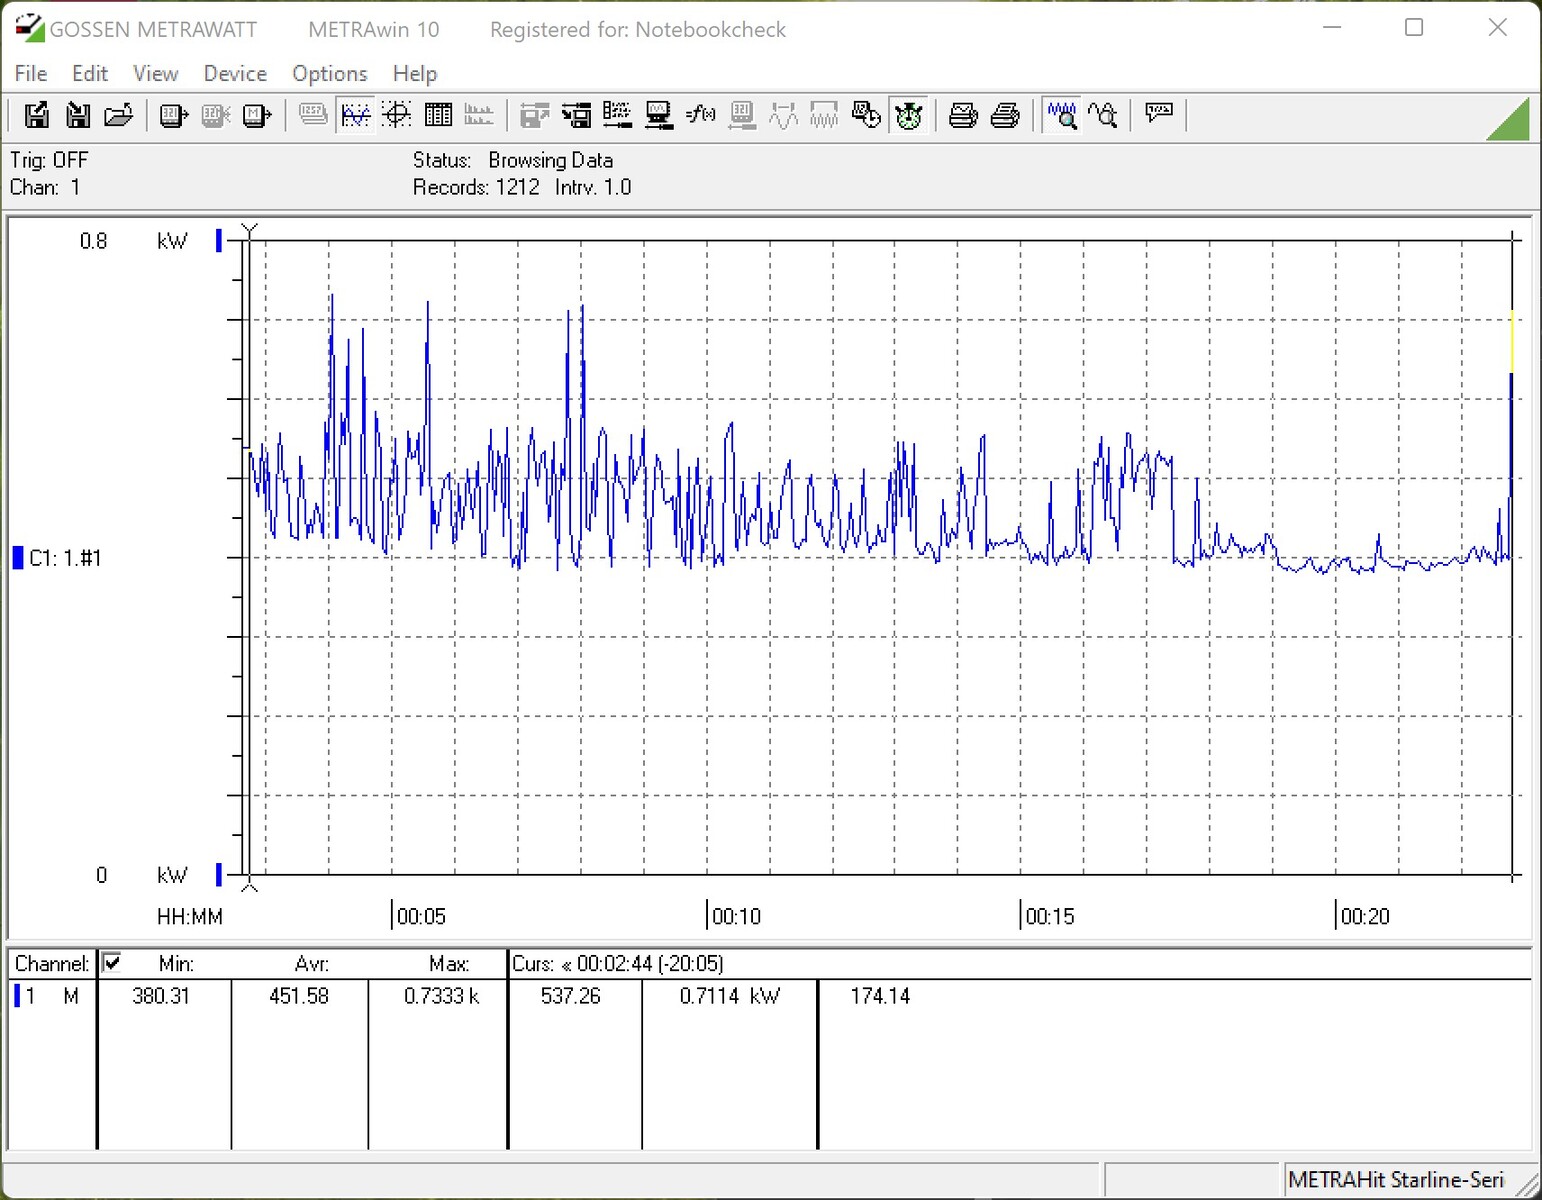
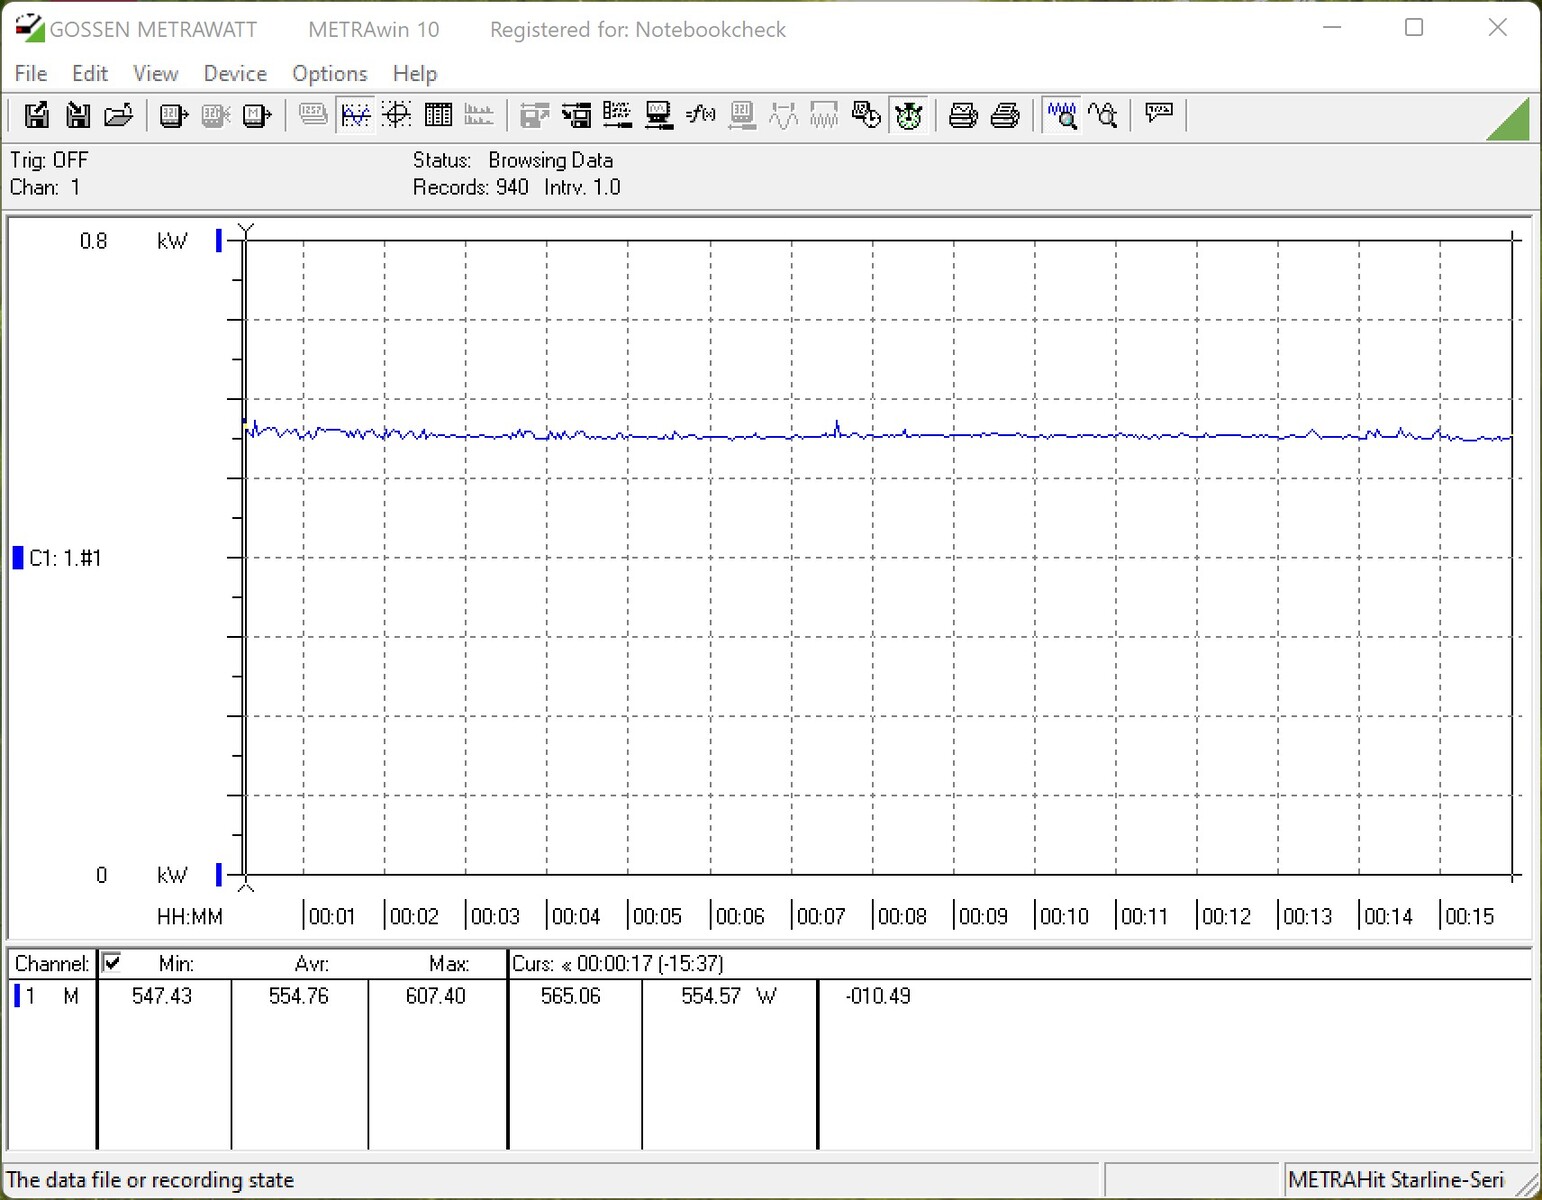
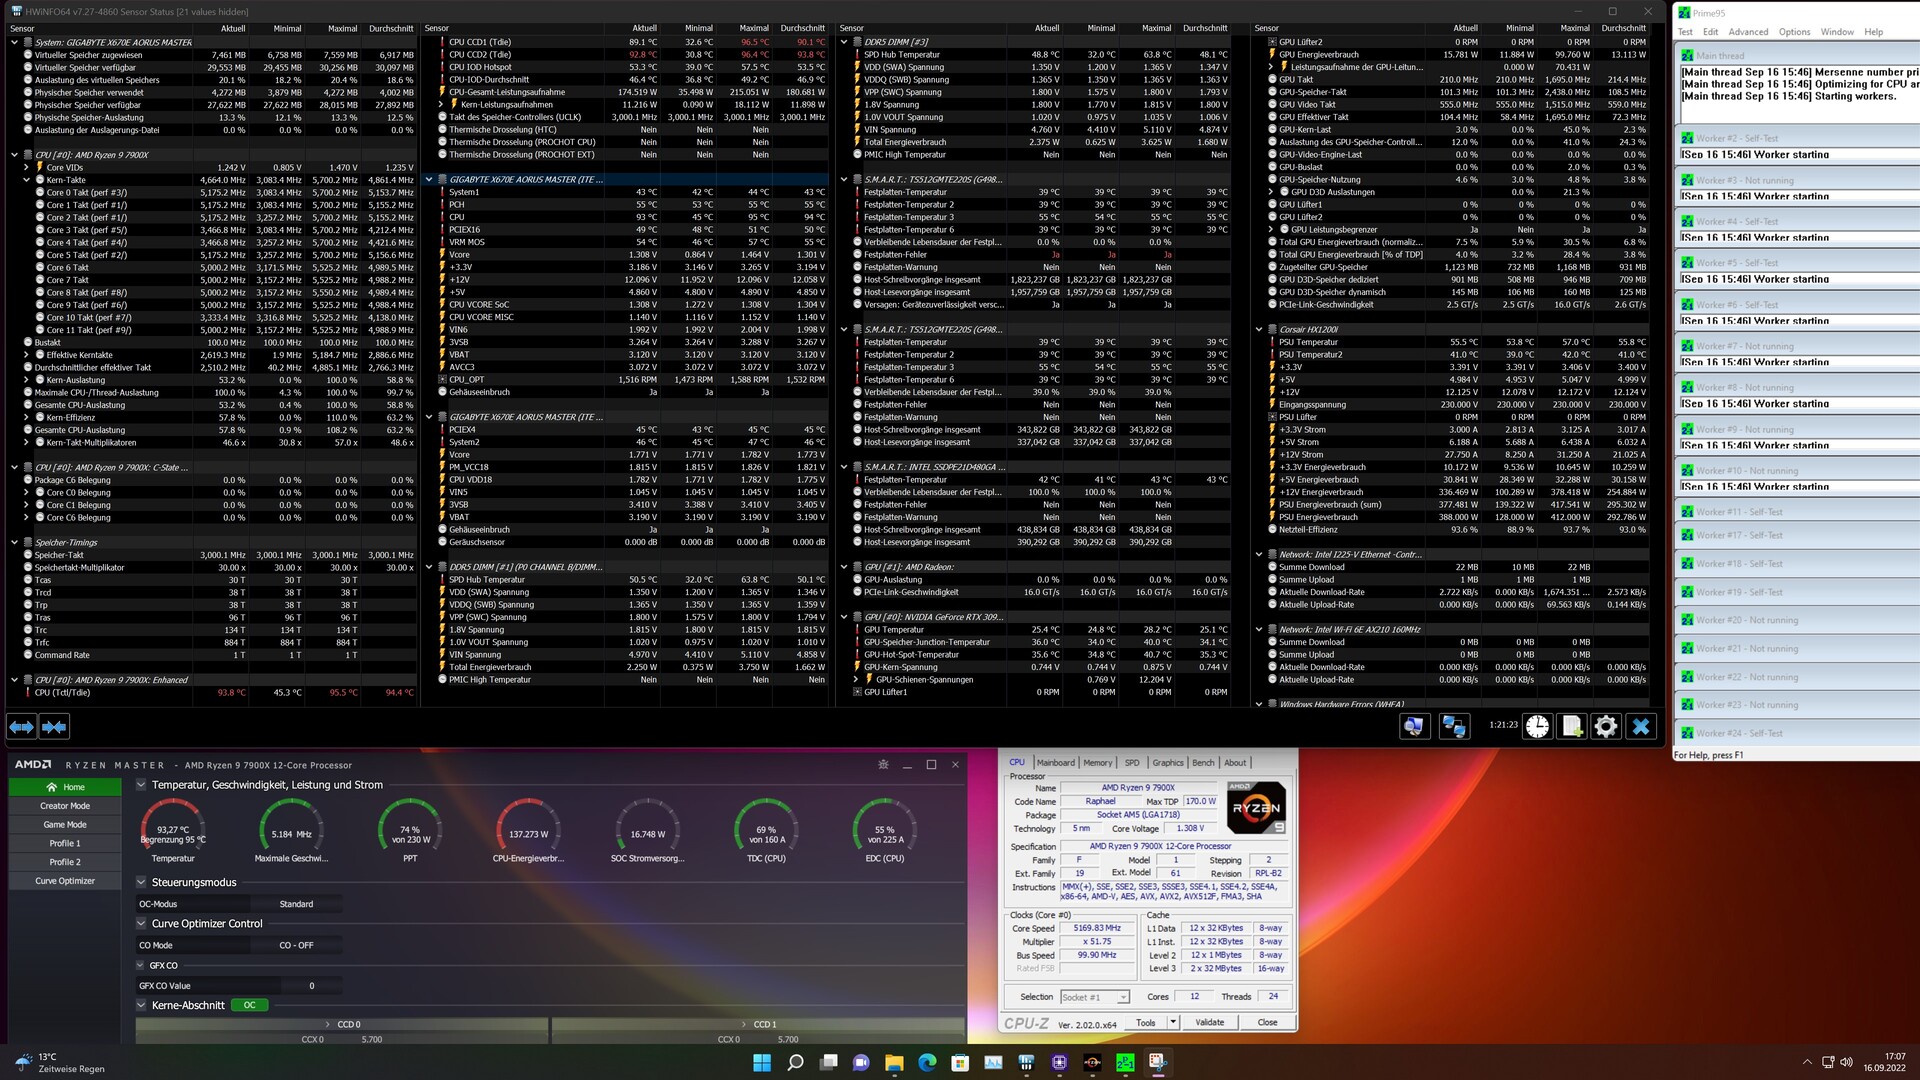
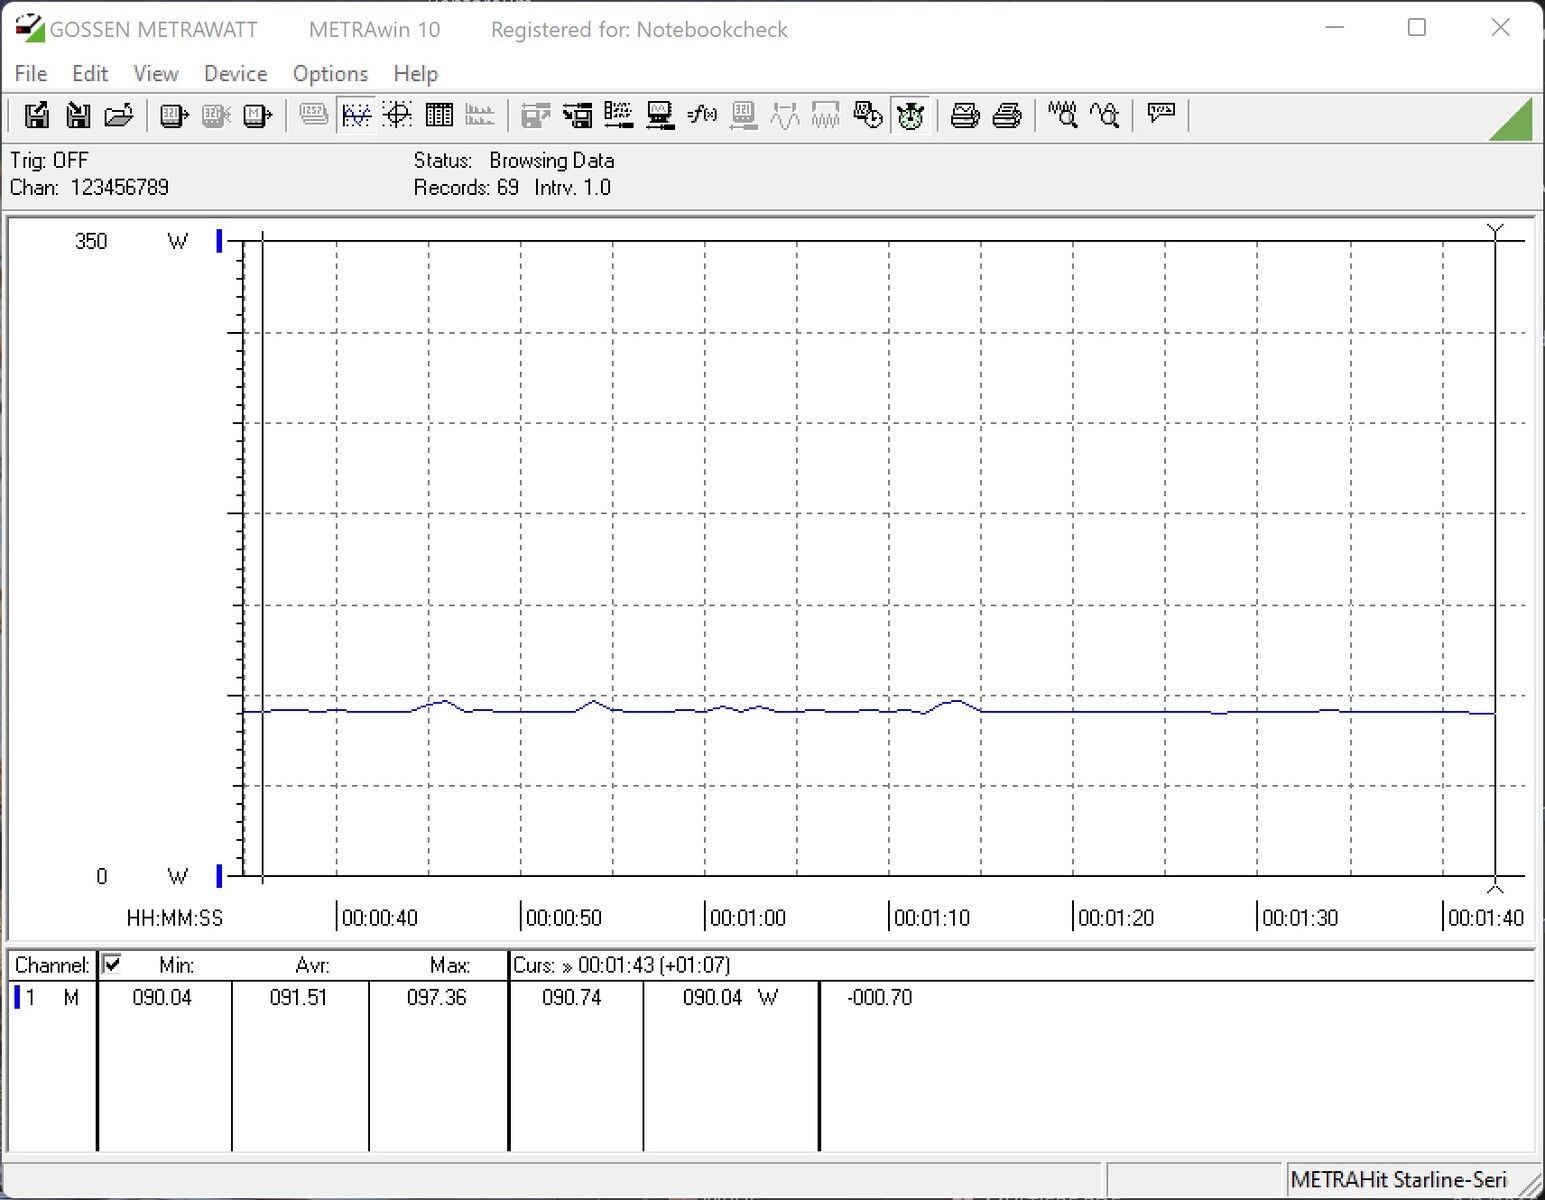
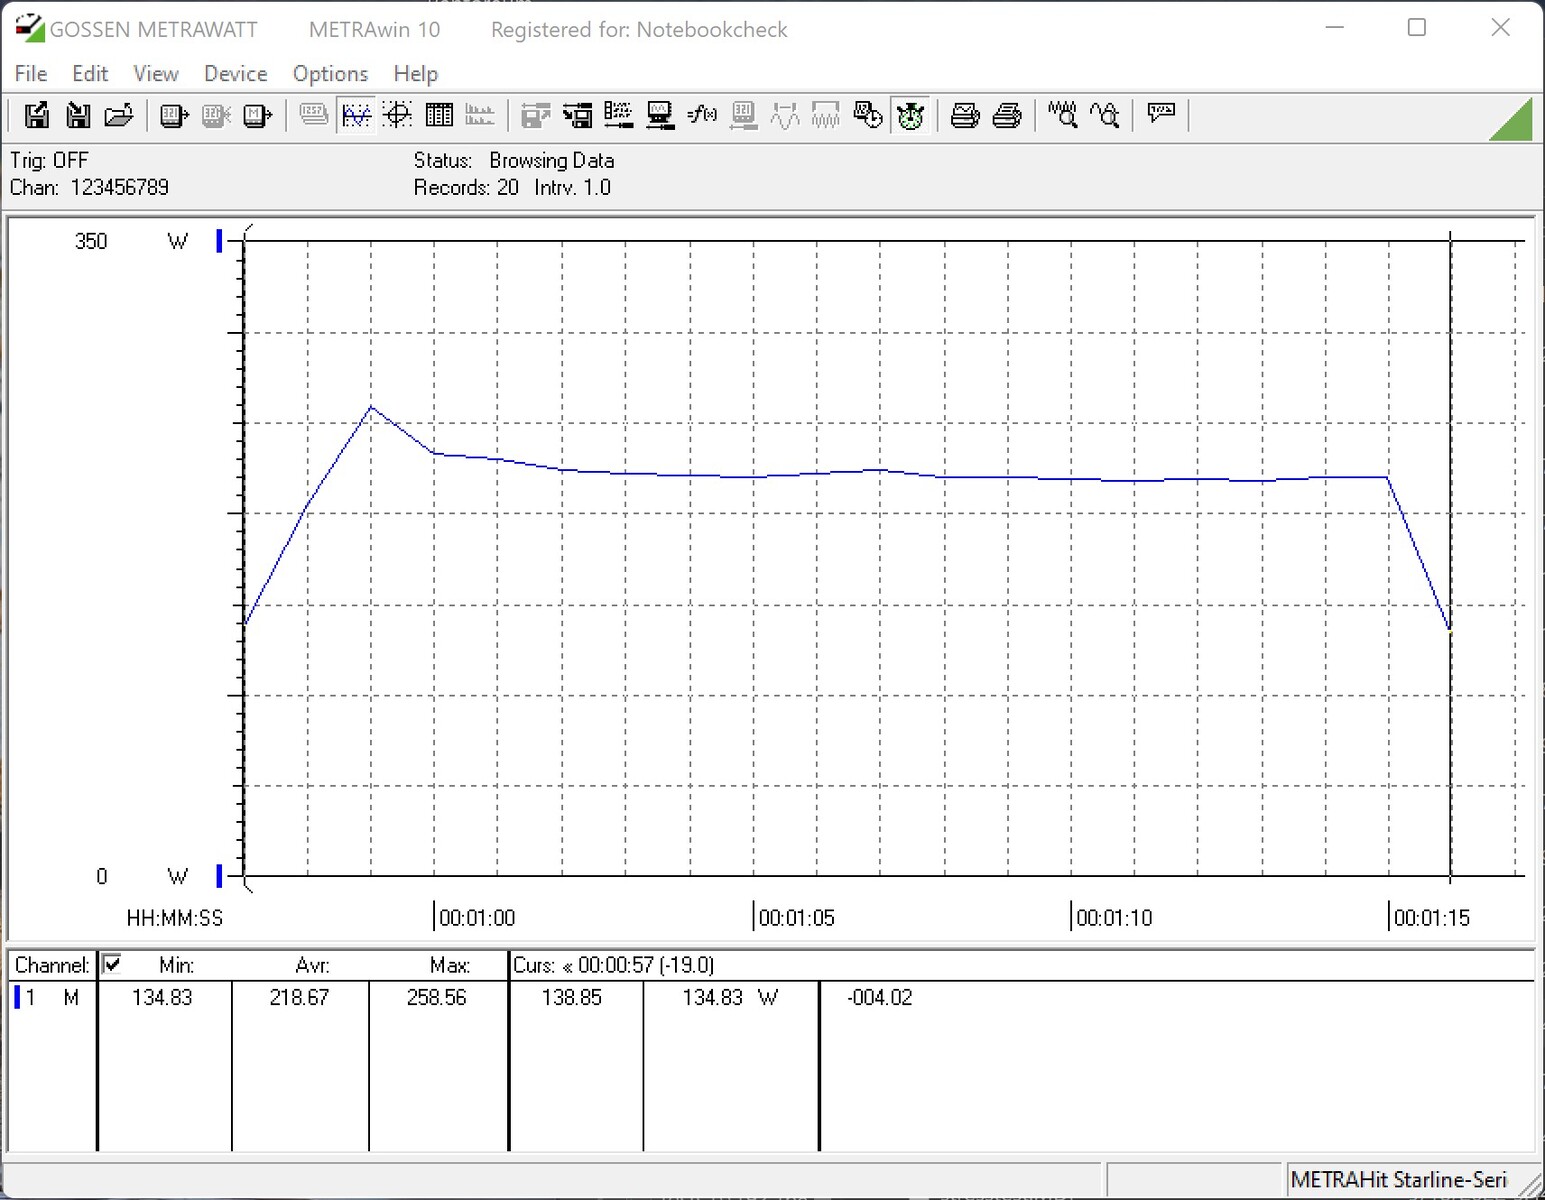
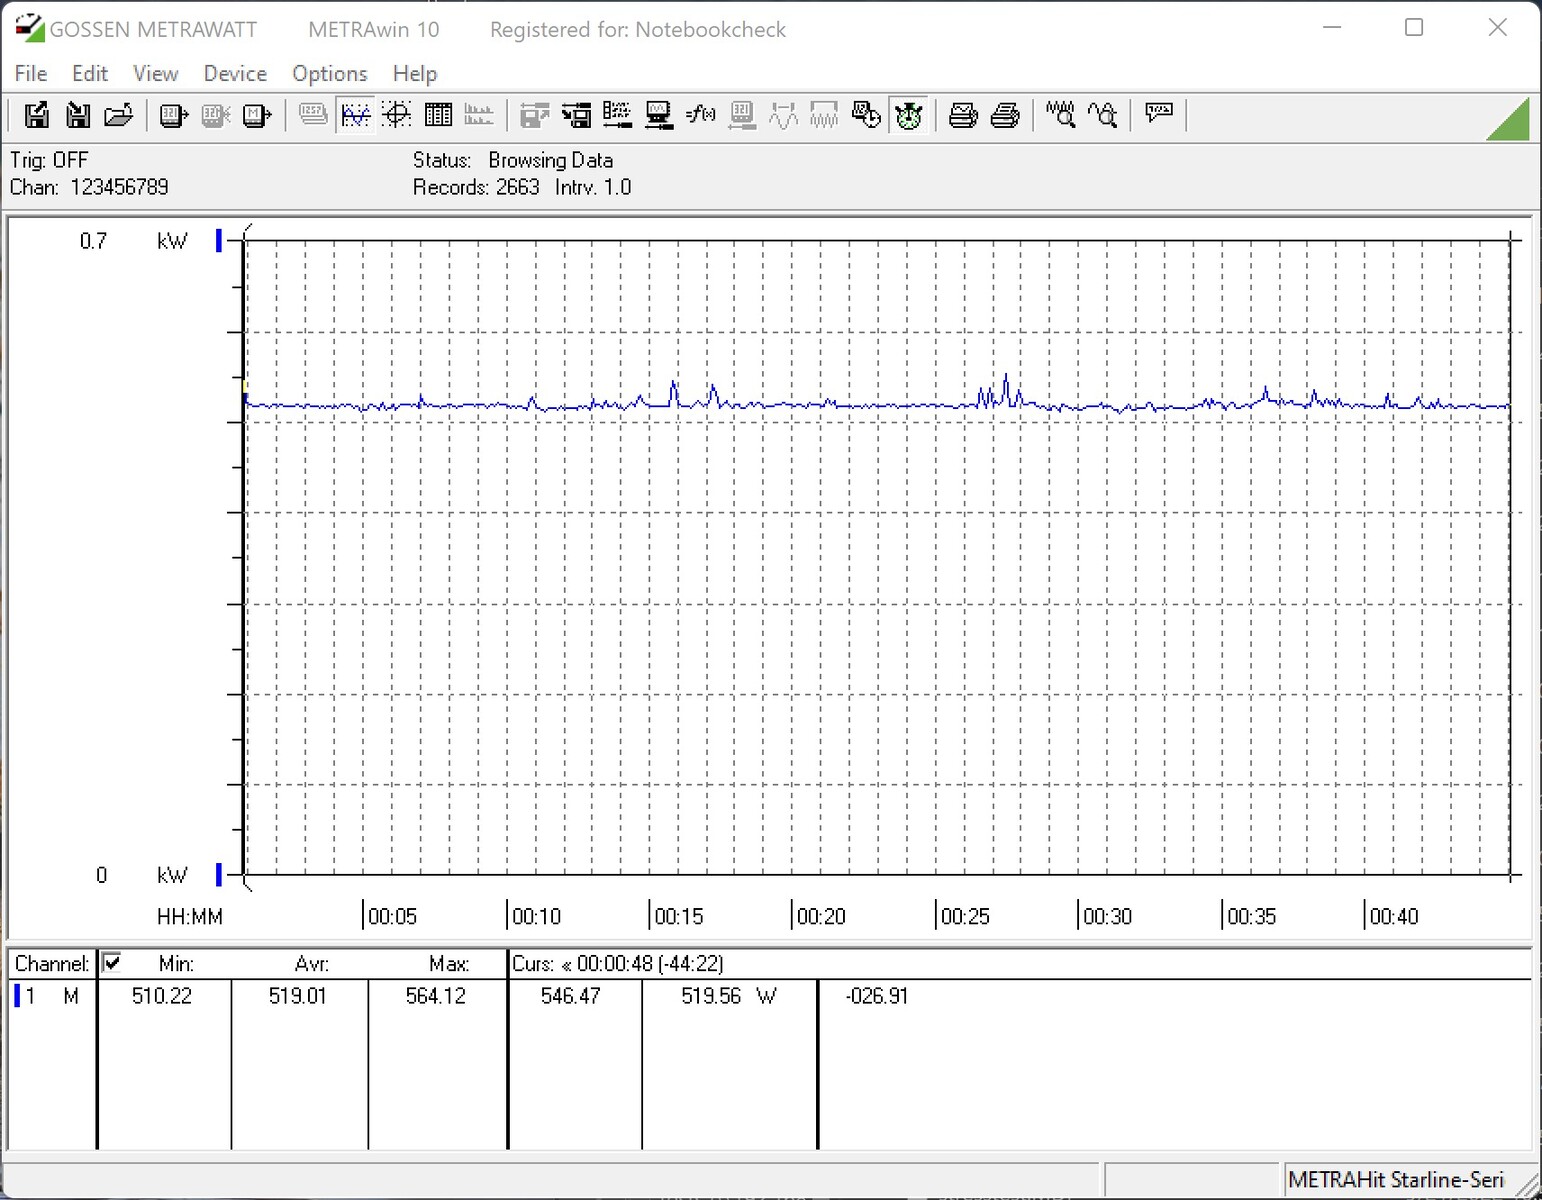
If we take a look at the comparison under load with Cinebech R15-Multi, the AMD Ryzen 9 7900X is only slightly behind the Intel Core i9-12900K in the ranking. Nevertheless, we note a lower performance compared to the AMD Ryzen 9 5900X indicated by a 33% higher power consumption. For the AMD Ryzen 5 7600X, we only note an increase of 26% compared to the AMD Ryzen 5 5600X. We also observed a similar performance increase in the stress test with Prime95. With more than 500 W, the power consumption during gaming is once again significantly higher due to the graphics card. We have to calculate about 350 W for the Nvidia GeForce RTX 3090 alone.
AMD recommends using an appropriate cooling solution for its processors. Thus, you should at least use a 240 or 280 AiO solution when running an AMD Ryzen 9, although a good tower cooler is sufficient for the AMD Ryzen 7 as well as the AMD Ryzen 5. However, our load test shows that our 280 AiO solution already had its problems in the open configuration. The maximum 95 °C temperature that AMD specifies for all new processors is still reached. Our recommendation is to use a 360 AiO solution, regardless of whether Ryzen 9, Ryzen 7 or Ryzen 5 of the 7000 series is to be installed. As a hint, AMD also provides a reference value for the temperatures, which is between 70 and 90 °C.
Eco Mode:
AMD uses this mode to reduce the TDP, which can also be compared with Intel's PL1 and PL2 limitations. Thus, the processors can be operated at 65 W, 105 W or at an unthrottled 170 W.
AMD Ryzen 9 7900X
AMD Ryzen 5 7600X
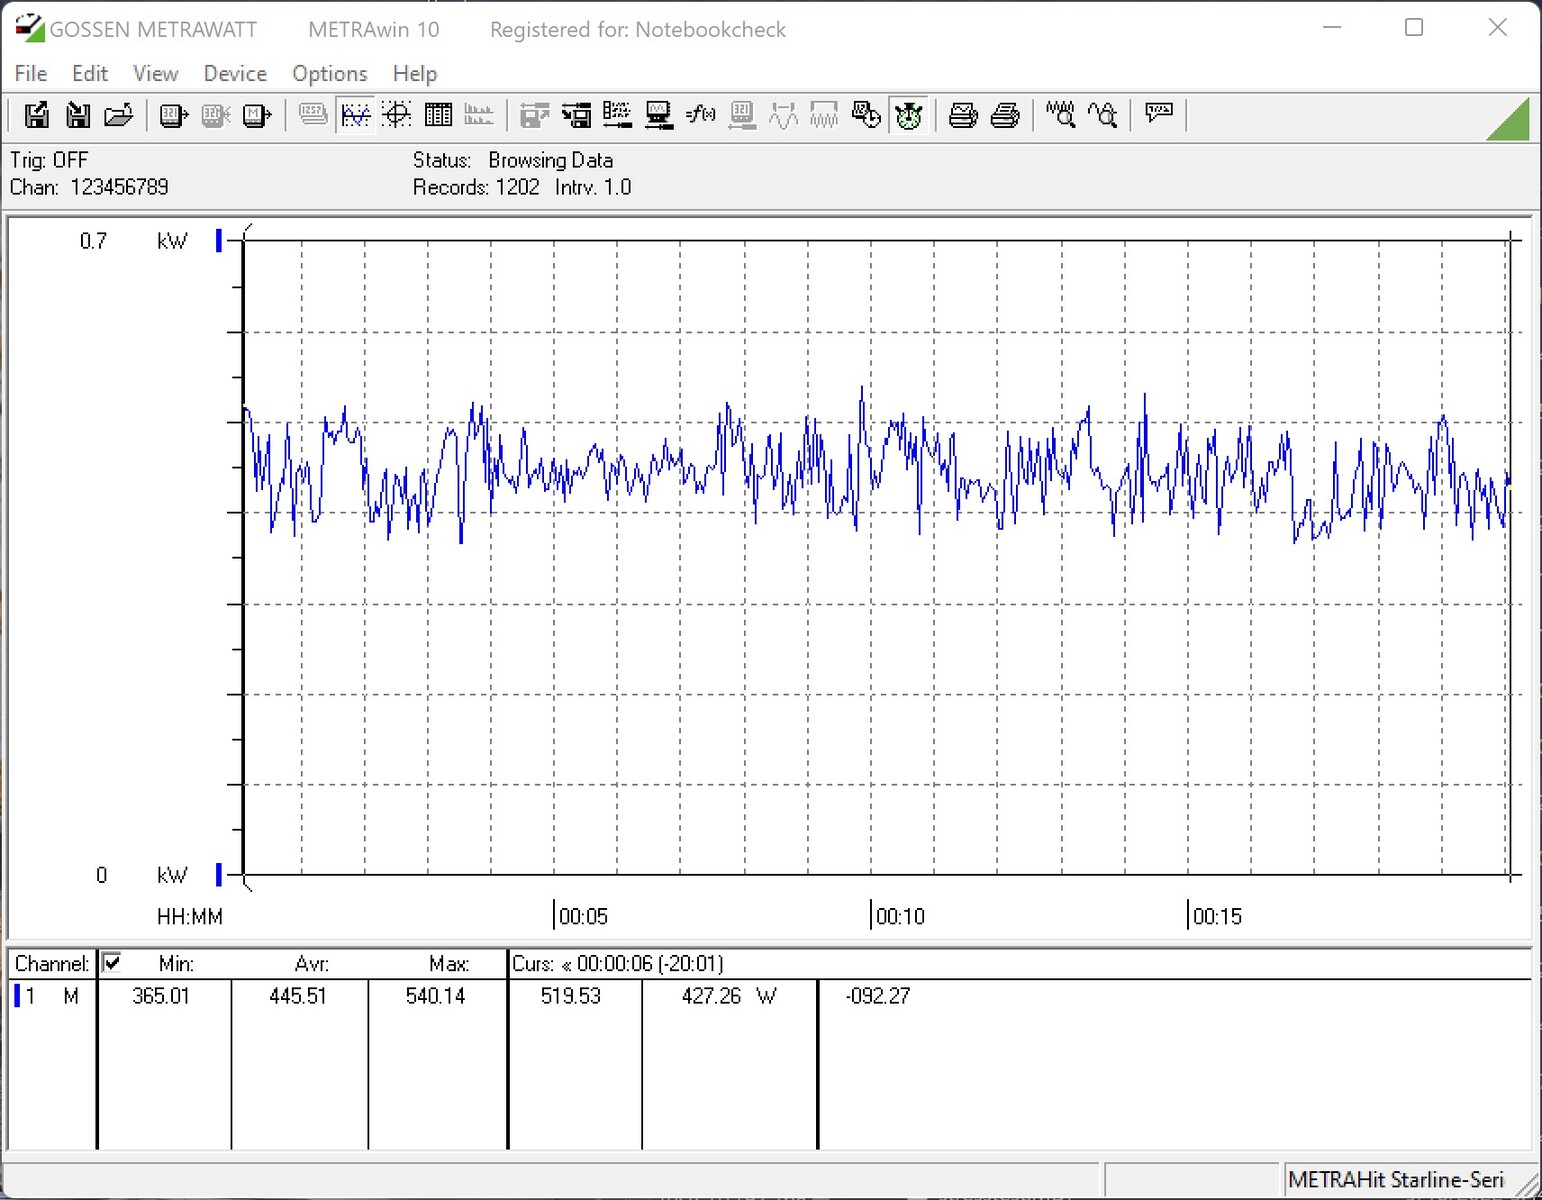
| Power Consumption / Cinebench R15 Multi (external Monitor) | |
| Intel Core i9-12900K (Idle: 70.5 W) | |
| AMD Ryzen 9 7900X | |
| AMD Ryzen 9 5900X (Idle: 78.1 W) | |
| AMD Ryzen 9 5950X (Idle: 78 W) | |
| AMD Ryzen 5 7600X | |
| Intel Core i5-12600K (Idle: 70.45 W) | |
| AMD Ryzen 5 5600X (Idle: 79.23 W) | |
| Power Consumption / Prime95 V2810 Stress (external Monitor) | |
| AMD Ryzen 9 7900X | |
| Intel Core i9-12900K (Idle: 70.5 W) | |
| Intel Core i5-12600K (Idle: 70.45 W) | |
| AMD Ryzen 9 5950X (Idle: 78 W) | |
| AMD Ryzen 9 5900X (Idle: 78.1 W) | |
| AMD Ryzen 5 7600X | |
| AMD Ryzen 5 5600X (Idle: 79.23 W) | |
| Power Consumption / The Witcher 3 ultra (external Monitor) | |
| AMD Ryzen 9 7900X | |
| AMD Ryzen 5 7600X | |
| Nvidia GeForce RTX 3090 Founders Edition (Idle: 91.1 W) | |
| Intel Core i9-12900K (Idle: 70.5 W) | |
| AMD Ryzen 9 5950X (Idle: 78 W) | |
| AMD Ryzen 9 5900X (Idle: 78.1 W) | |
| AMD Ryzen 5 5600X (Idle: 79.23 W) | |
| Intel Core i5-12600K (Idle: 70.45 W) | |
* ... smaller is better
Power Consumption With External Monitor
Pros
Cons
Conclusion: Extremely fast but also performance hungry

After more than five years in which the socket AM4 was the basis of the Ryzen processors, AMD now introduces the new socket AM5 together with the new AMD Ryzen 7000 processors. We like the change from PGA to LGA and the problem with broken-pin CPUs when removing the cooler is finally a thing of the past. This also means that the DDR4 standard is history, because Ryzen 7000 is only compatible with AM5 and DDR5. This is a step that Intel has already taken with the Alder Lake series, although it still supports DDR4 and DDR5.
In terms of performance, AMD has once again significantly increased the performance per clock (IPC). Together with the significantly higher clock rates that are now possible with the smaller 5 nm manufacturing, we record a performance increase of up to 30%. There are no major changes under the heat spreader compared to the Ryzen 5000. There are still two CCDs and an I/O die on the PCB. The I/O die is manufactured in 6 nm and offers an iGPU, which cannot be used for 3D applications with just 2 CUs.
However, we can currently state that AMD delivers a better gaming performance than Intel's Core i9-12900K with the Ryzen 9 7900X and the Ryzen 5 7600X. The Intel Core i9-12900K, which is already a year old, will be replaced in the near future, which might completely change the balance of power again. However, that is only dreams of the future for now and we are evaluating the here and now. In addition, we have not yet looked at AMD's top model, the AMD Ryzen 9 7950X, in this review. There is even more potential to put Intel under even more pressure.
AMD's Ryzen 9 7900X and Ryzen 5 7600X deliver fabulous performance in all aspects. Moreover, there is a worthy successor in Socket AM5 that eradicates the known problems
As so often, the customer is spoiled for choice and has to decide which CPU he prefers. If you only want to play games, you will be very well served with an AMD Ryzen 5 7600X. The 6-core CPU is fast and offers all the advantages of the new Zen 4 generation. The performance difference to the AMD Ryzen 9 7900X is exceedingly small in the tested games. If you are looking for a platform for productive work or are a content creator, you will definitely be happy with the AMD Ryzen 9 7900X, because the high multi-thread performance is better than that of an AMD Ryzen 9 5950X.
Prices and availability
Directly in the AMD store but the current processors can also be purchased from many well-known online stores. AMD quotes an MSRP of 669 Euros for the AMD Ryzen 9 7900X. According to AMD, the entry-level model, the AMD Ryzen 5 7600X, costs 359 Euros.

