Notebookcheck Logo

Zotac Gaming GeForce RTX 3090 Ti AMP Extreme Holo Review: 4K gaming monstrosity with a price to match

The GPU we deserve but not the one we need. The RTX 3090 Ti arrives at an interesting juncture — at a time when the GPU stock situation is gradually easing up and also in the wake of new architectures from Nvidia and AMD expected later this year. The Zotac Gaming GeForce RTX 3090 Ti AMP Extreme Holo seeks to unleash the full might of the complete GA102 GPU. We evaluate how well this card performs in our suite of tests when compared with current Nvidia and AMD flagships.

Nvidia first announced the GeForce RTX 3090 Ti back during CES 2022, but the cards have started to become available only towards the end of March at a US$1,999 MSRP for the Founders Edition. The RTX 3090 Ti is now the new "BFGPU" on the block that supplants the RTX 3090 as the flagship Ampere card by fully maxing out the GA102 GPU and offering significant improvements to memory bandwidth.

Though the RTX 3090 Ti is essentially just an incremental upgrade, it still brings several firsts to the table. For one, this is the first mainstream GeForce desktop card to offer over 1 TB/s memory bandwidth. Nvidia has used new 2 GB Micron GDDR6X memory modules that now offer 21 Gb/s effective memory speeds. The complete GA102 chip also enables modest increases in CUDA core, RT core, and Tensor core counts over the RTX 3090 as you can see in the comparison table below.

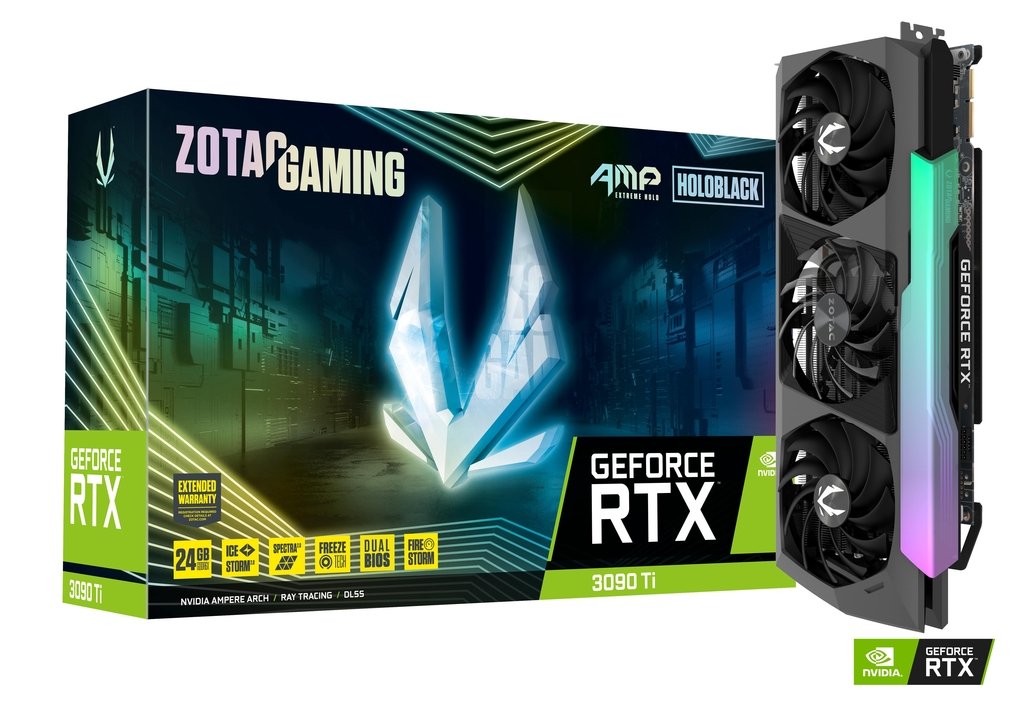
We currently have with us Zotac's flagship card, the Gaming GeForce RTX 3090 Ti AMP Extreme Holo, for review. The Zotac RTX 3090 Ti AMP Extreme Holo presently retails for US$2,099.99 at several online retailers while Indian prices seem to hover around the ₹1,93,000 (US$2,492) mark. This incidentally makes it cheaper than some RTX 3090s on the market.

In this review, we put the Zotac RTX 3090 Ti AMP Extreme Holo though its paces to see whether this incremental upgrade augurs any good for enthusiast gamers looking to play at 4K with maximum eye candy.

Comparison of the RTX 3090 Ti with other NVIDIA GPUs

Specification Zotac RTX 3090 Ti AMP Extreme Holo RTX 3090 Ti FE RTX 3090 FE RTX 3080 Ti FE RTX 3080 FE RTX 3070 FE RTX 3060 Ti FE Titan RTX Titan X Pascal
Chip GA102 GA102 GA102 GA102 GA102 GA104 GA104 TU102 GP102
FinFET process 8 nm 8 nm 8 nm 8 nm 8 nm 8 nm 8 nm 12 nm 16 nm
CUDA cores 10,752 10,752 10,496 10,240 8,704 5,888 4,864 4,608 3,584
Texture units 336 336 328 320 272 184 152 288 224
Tensor cores 336 3rd Gen. 336 3rd Gen. 328 3rd Gen. 320 3rd Gen. 272 3rd Gen. 184 3rd Gen. 152 3rd Gen. 576 2nd Gen.
RT cores 84 2nd Gen. 84 2nd Gen. 82 2nd Gen. 80 2nd Gen. 68 2nd Gen. 46 2nd Gen. 38 2nd Gen. 72
GPU base clock 1,560 MHz 1,560 MHz 1,395 MHz 1,365 MHz 1,440 MHz 1,500 MHz 1,410 MHz 1,350 MHz 1,417 MHz
GPU boost clock 1,890 MHz 1,860 MHz 1,695 MHz 1,665 MHz 1,710 MHz 1,750 MHz 1,665 MHz 1,770 MHz 1,531 MHz
Memory bus 384-bit 384-bit 384-bit 384-bit 320-bit 256-bit 256-bit 384-bit 384-bit
Memory bandwidth 1,008 GB/s 1,008 GB/s 936 GB/s 912 GB/s 760 GB/s 448 GB/s 448 GB/s 672 GB/s 480.4 GB/s
Video memory 24 GB GDDR6X 24 GB GDDR6X 24 GB GDDR6X 12 GB GDDR6X 10 GB GDDR6X 8 GB GDDR6 8 GB GDDR6 24 GB GDDR6 12 GB GDDR5X
Power consumption 450 W 450 W 350 W 350 W 320 W 220 W 200 W 280 W 250 W

A closer look at the Zotac Gaming GeForce RTX 3090 Ti AMP Extreme Holo

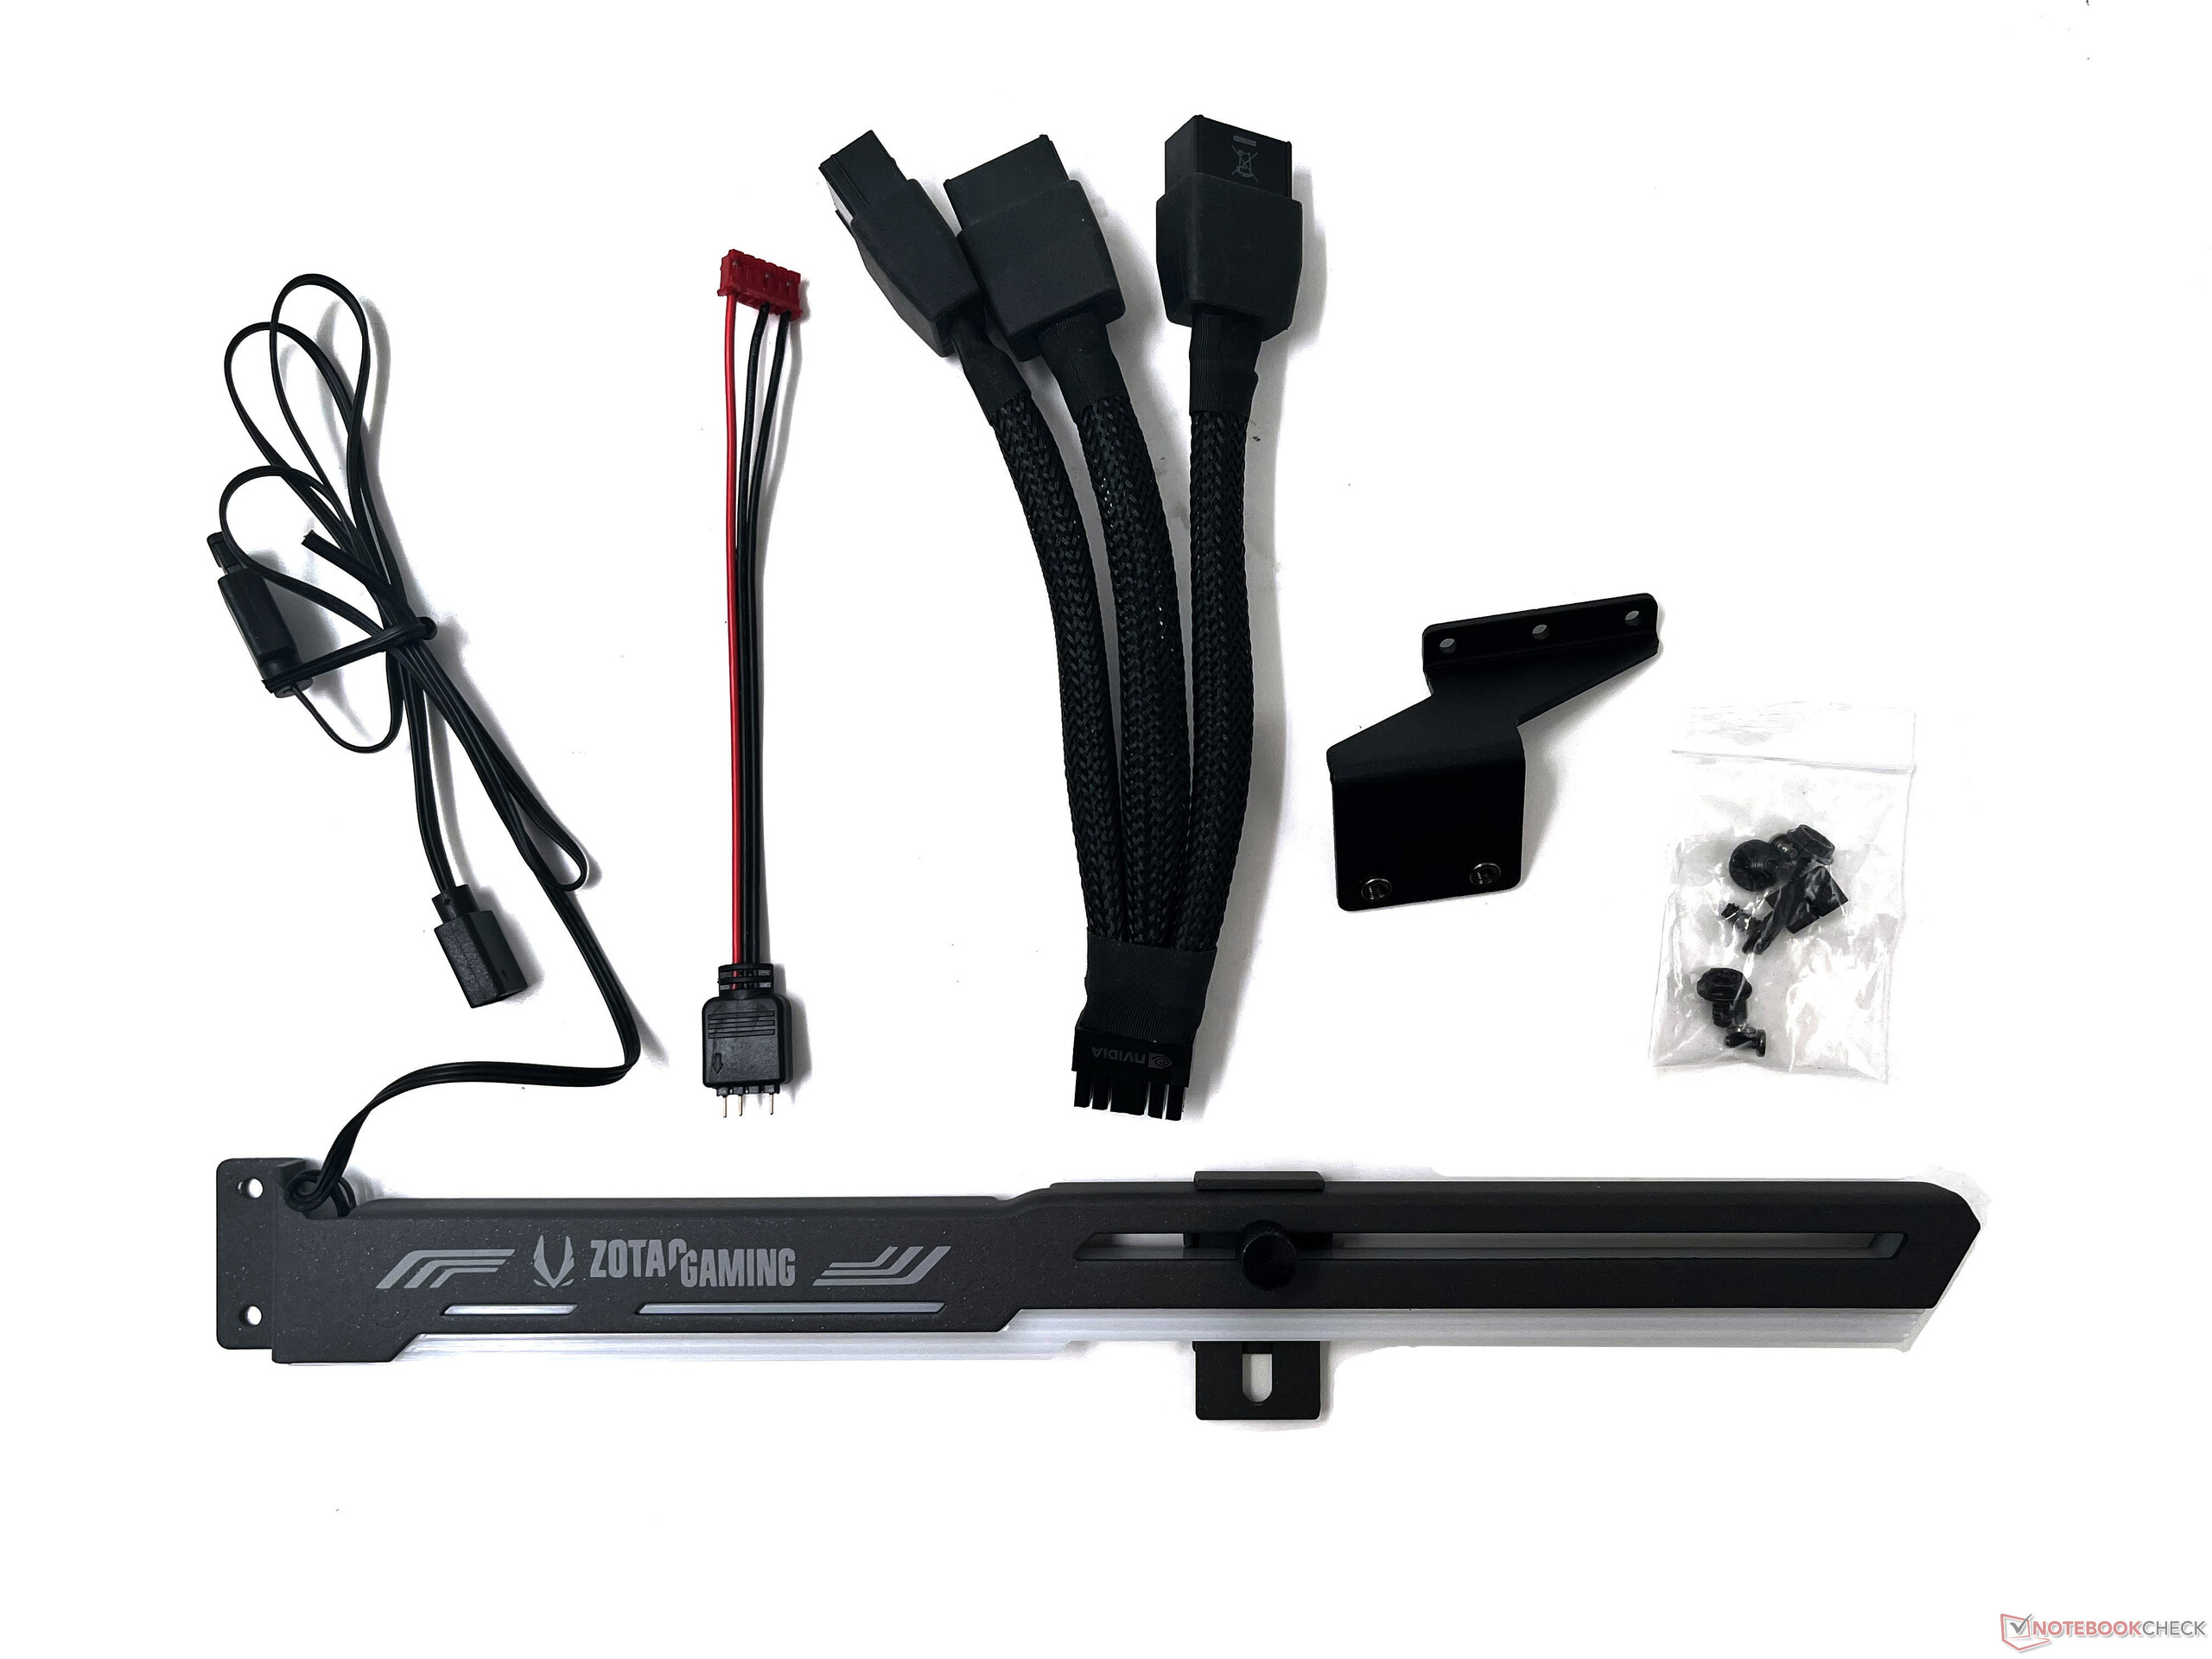
In the massive packaging, you get an RGB GPU support bracket with an accompanying 3-pin RGB connector, a 12-pin PCIe 5 to triple 8-pin PCIe power connector (note that the connector uses only 12 pins of the 16), supporting screws, and the usual paperwork and stickers.

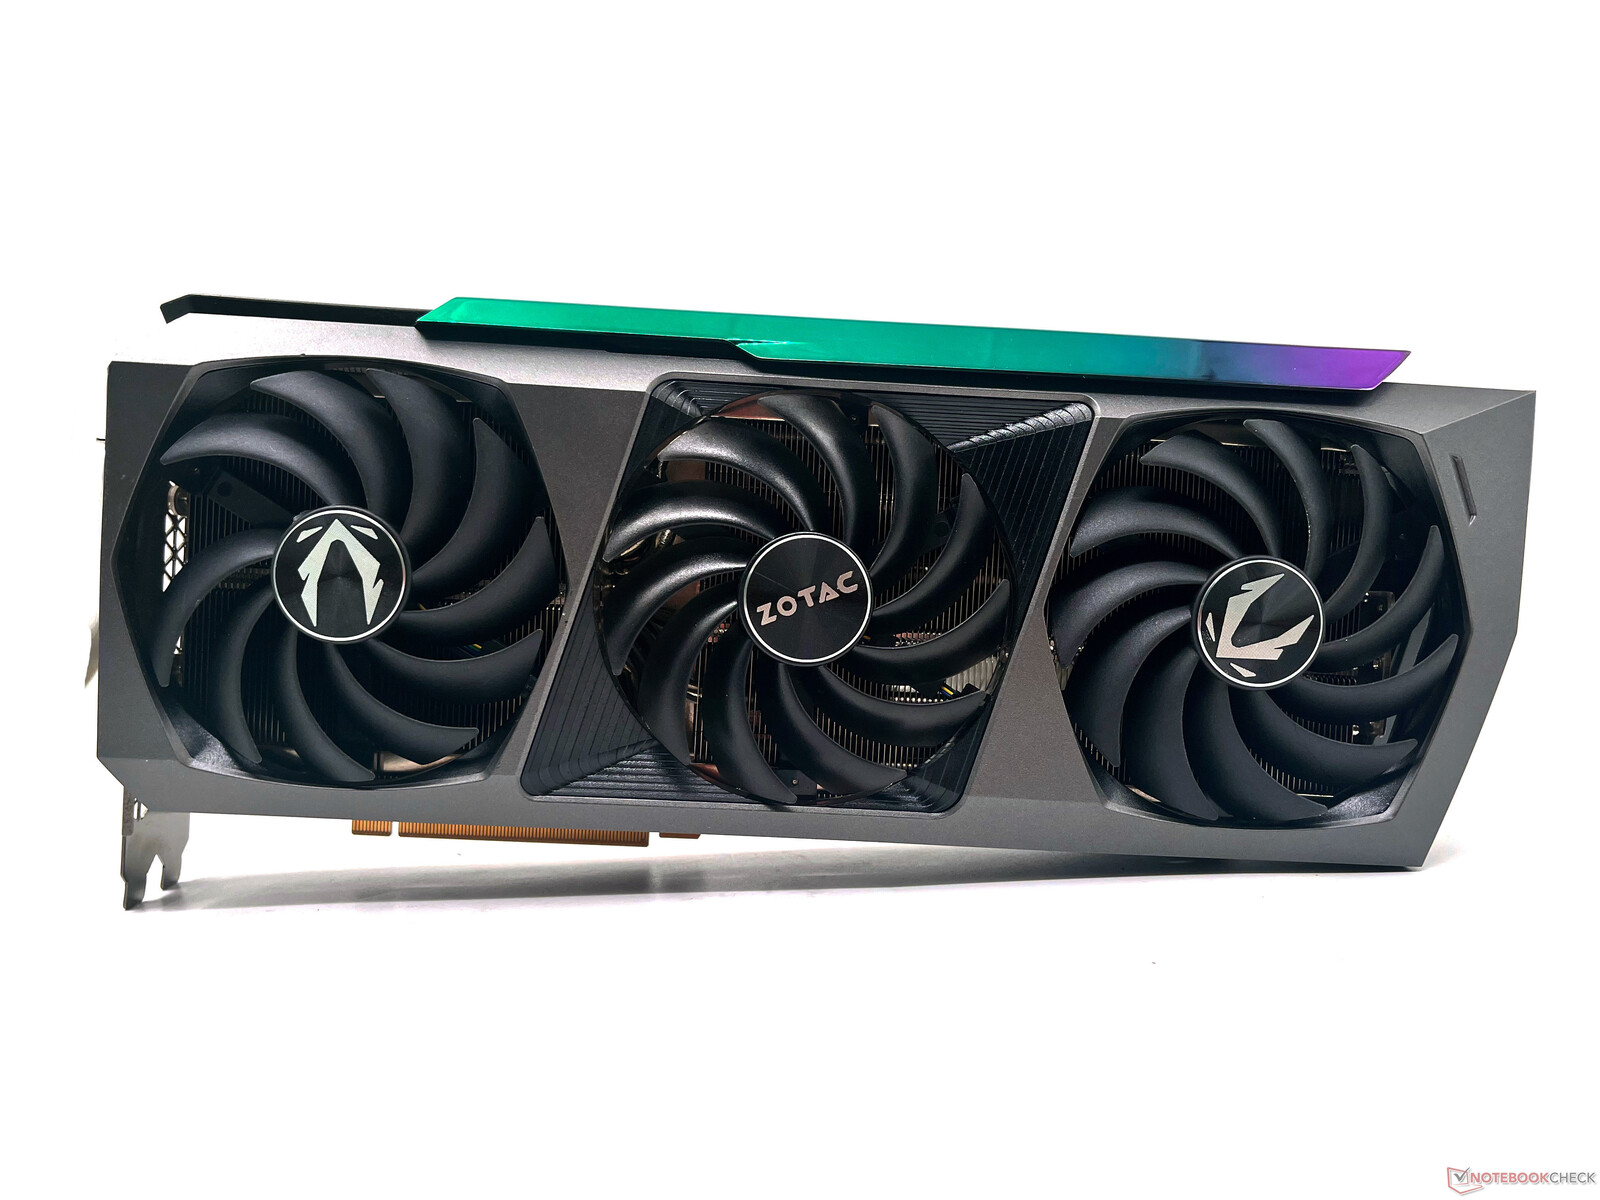
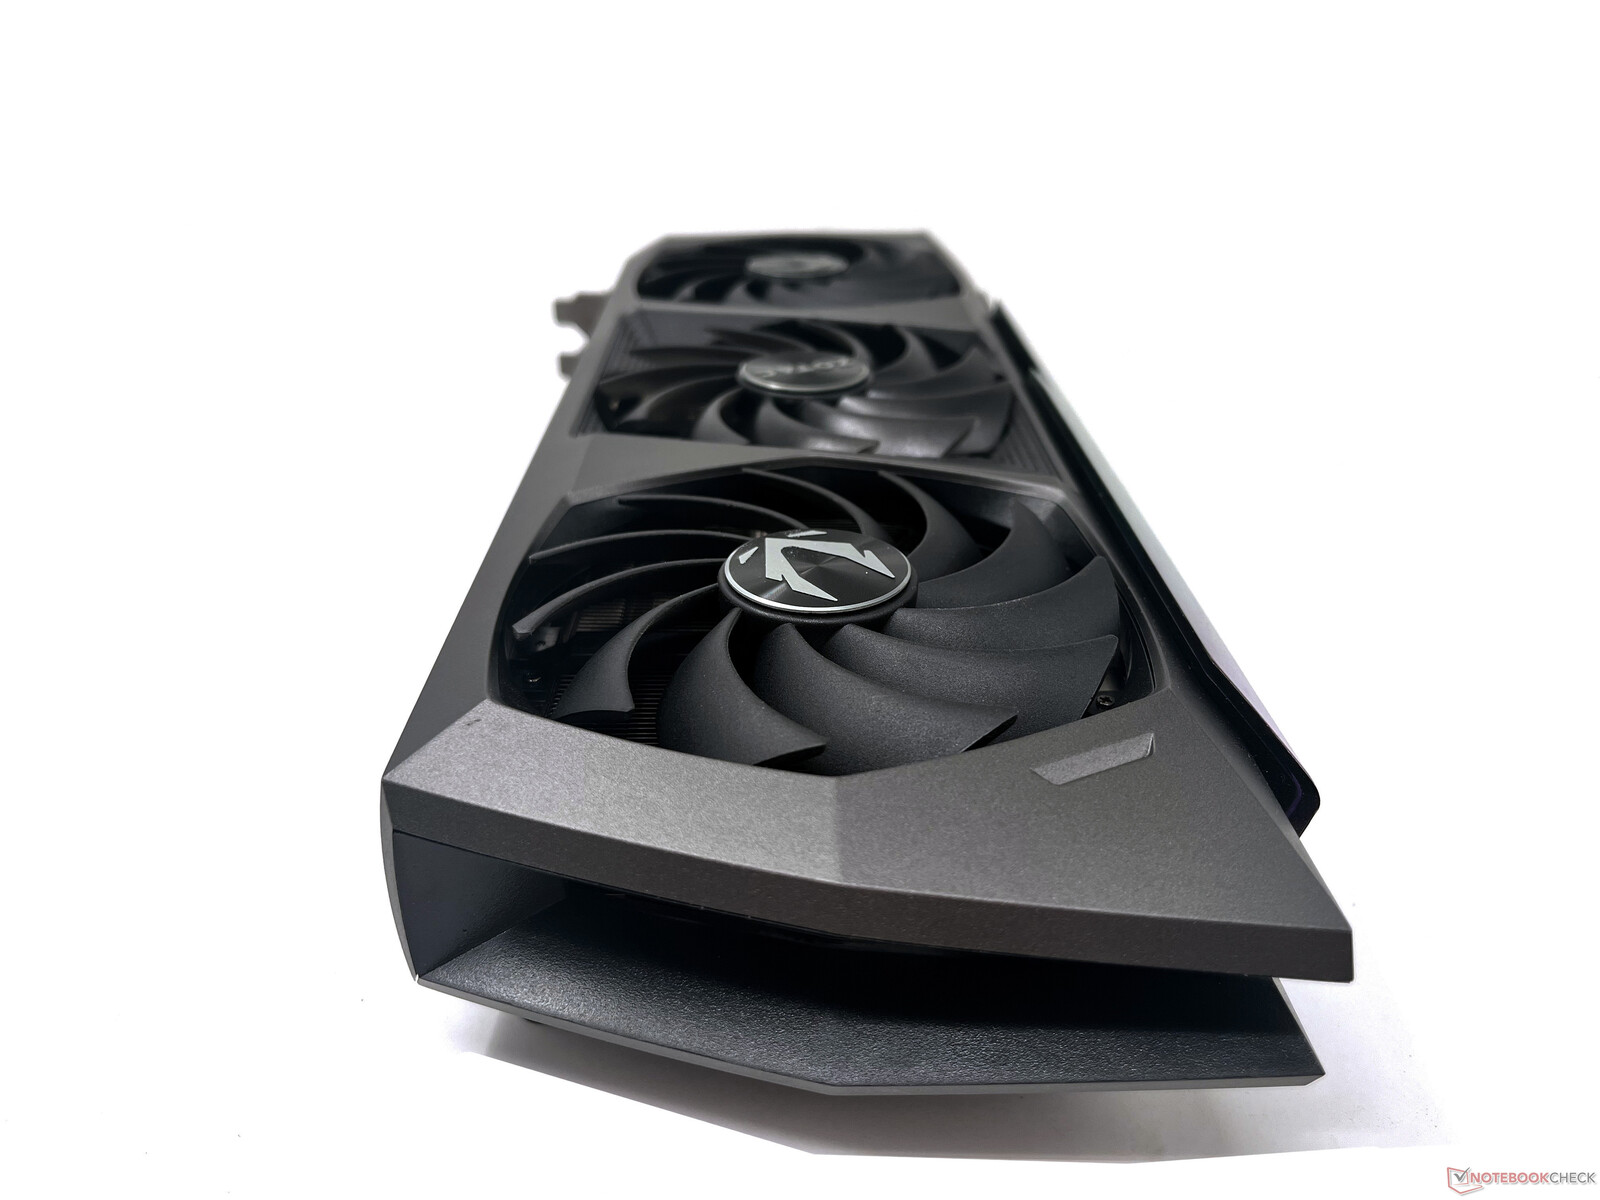
Note: One of the blades belonging to the left-most fan inadvertently snapped during testing. We ran multiple long-duration stress tests and confirmed that it did not affect card stability, functionality, or fan noise in any way. That being said, fan build quality is one area that Zotac can surely improve upon.

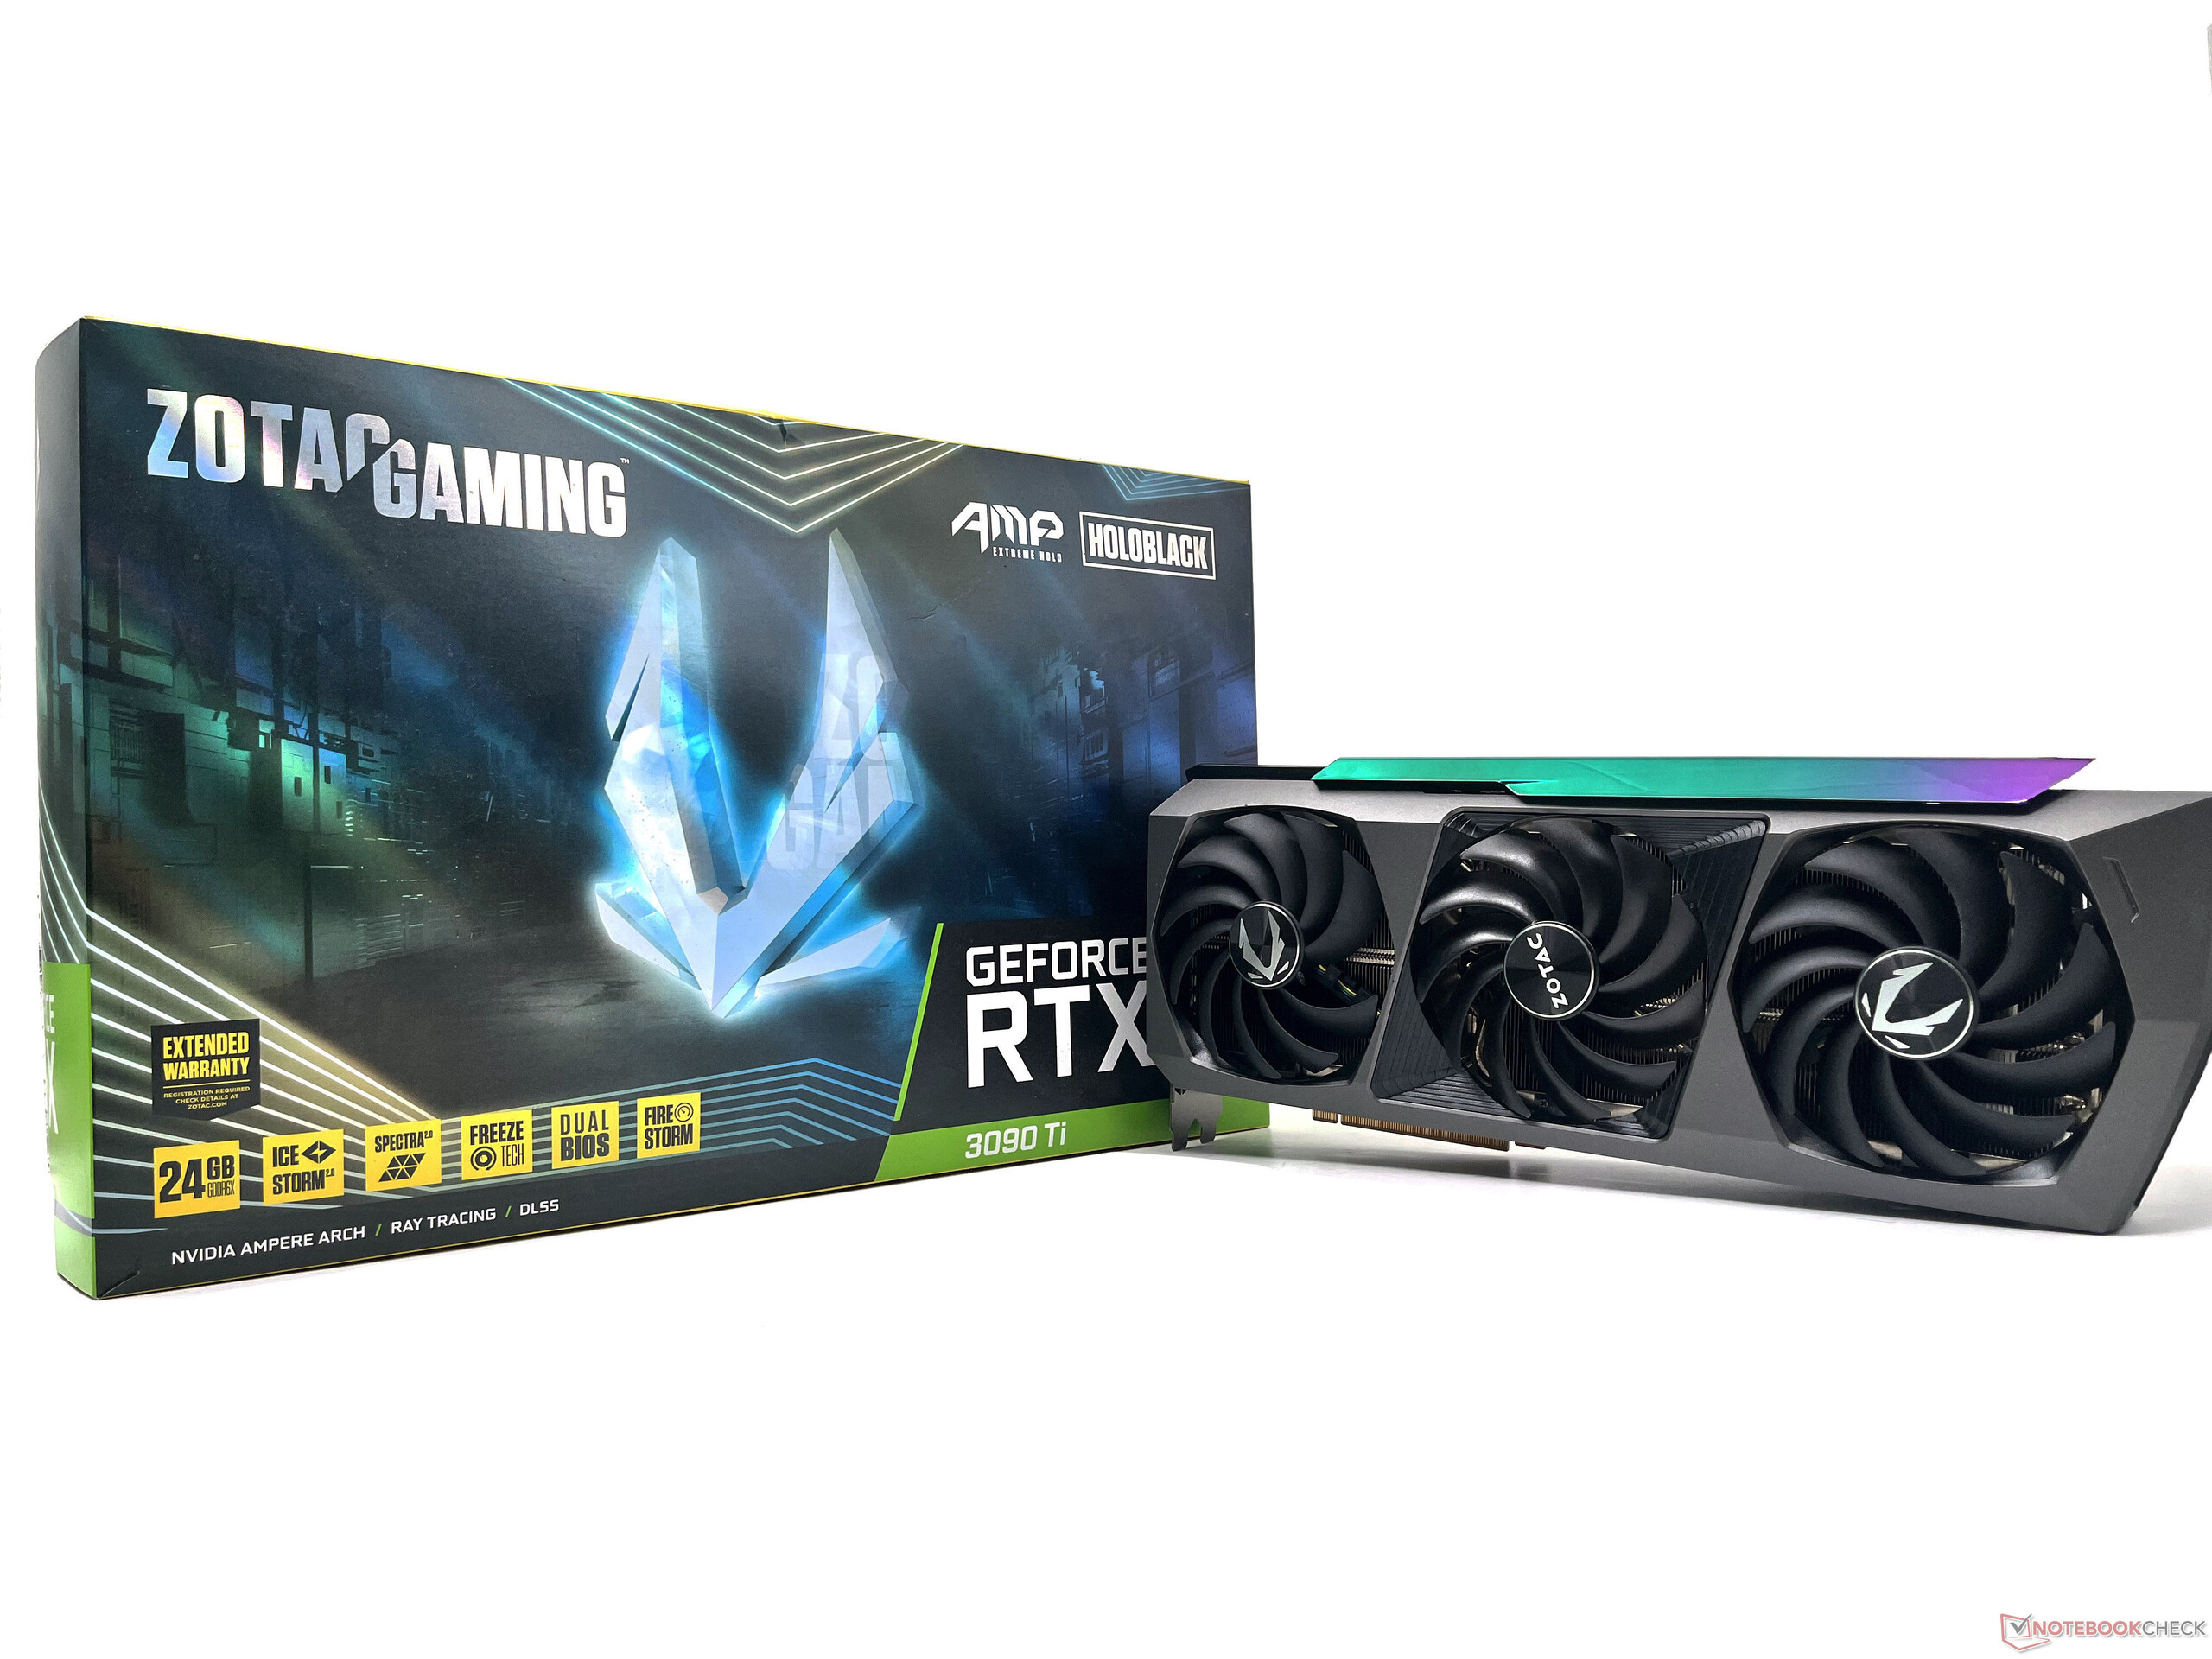
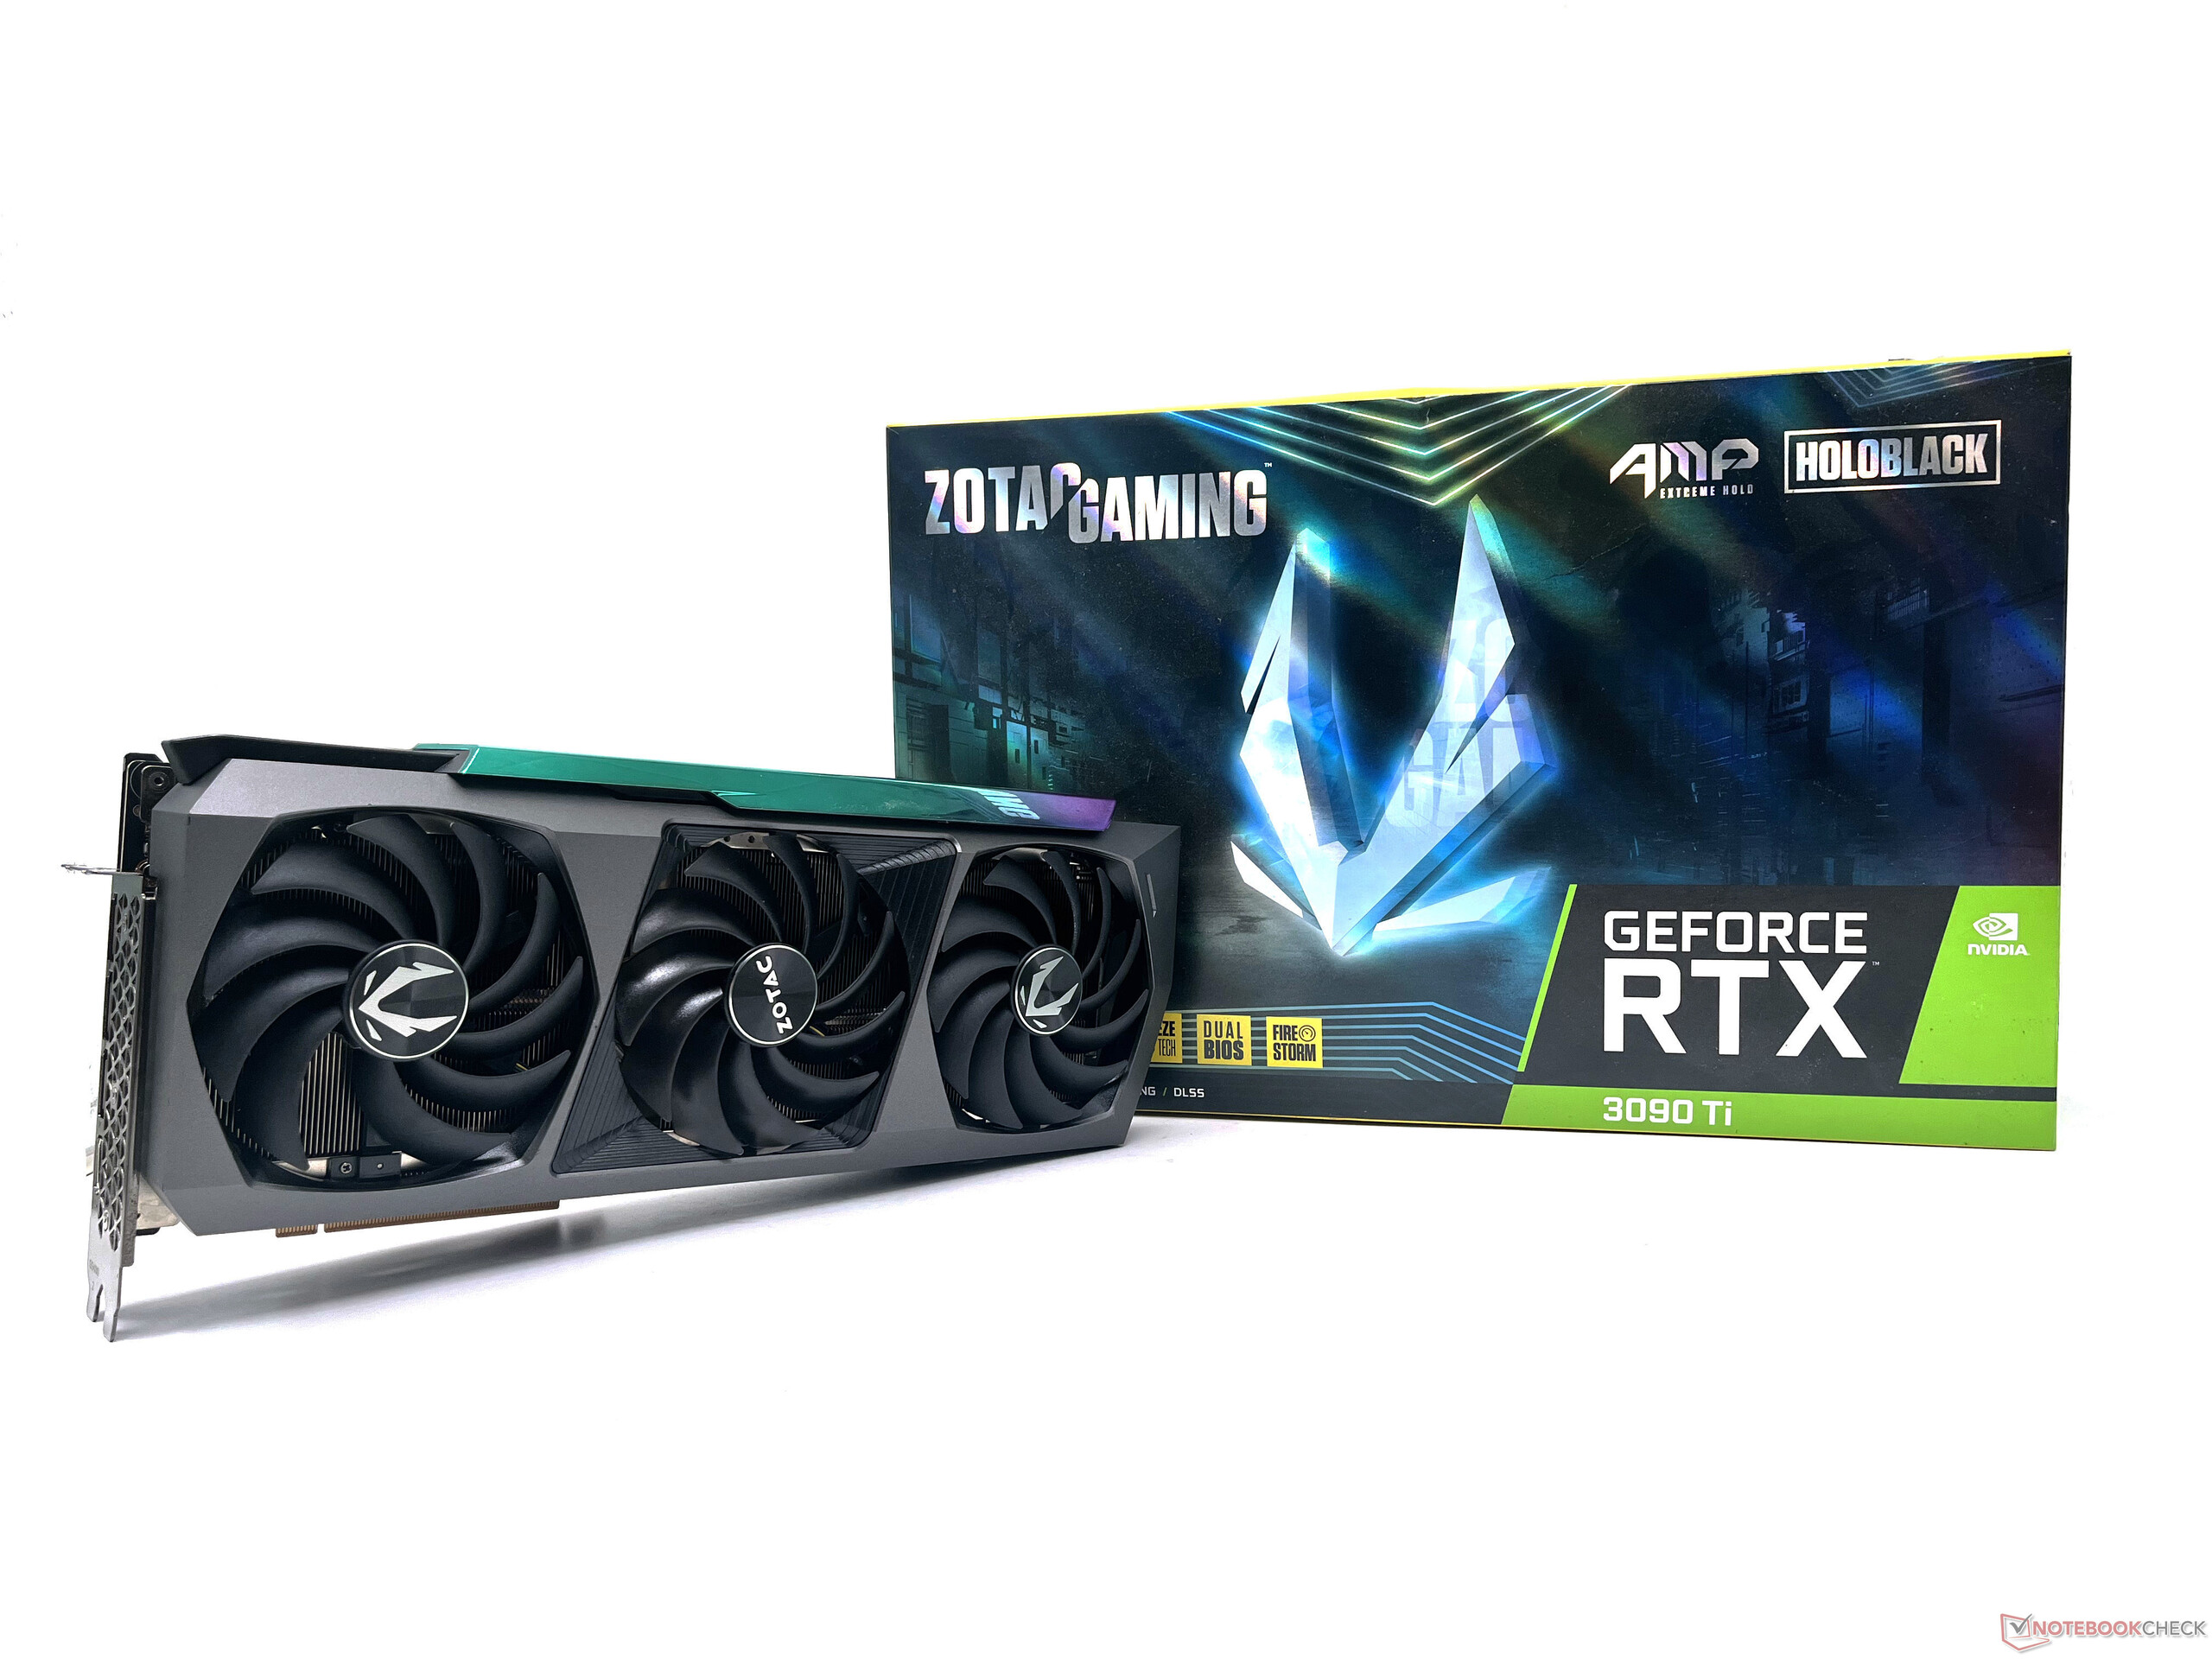
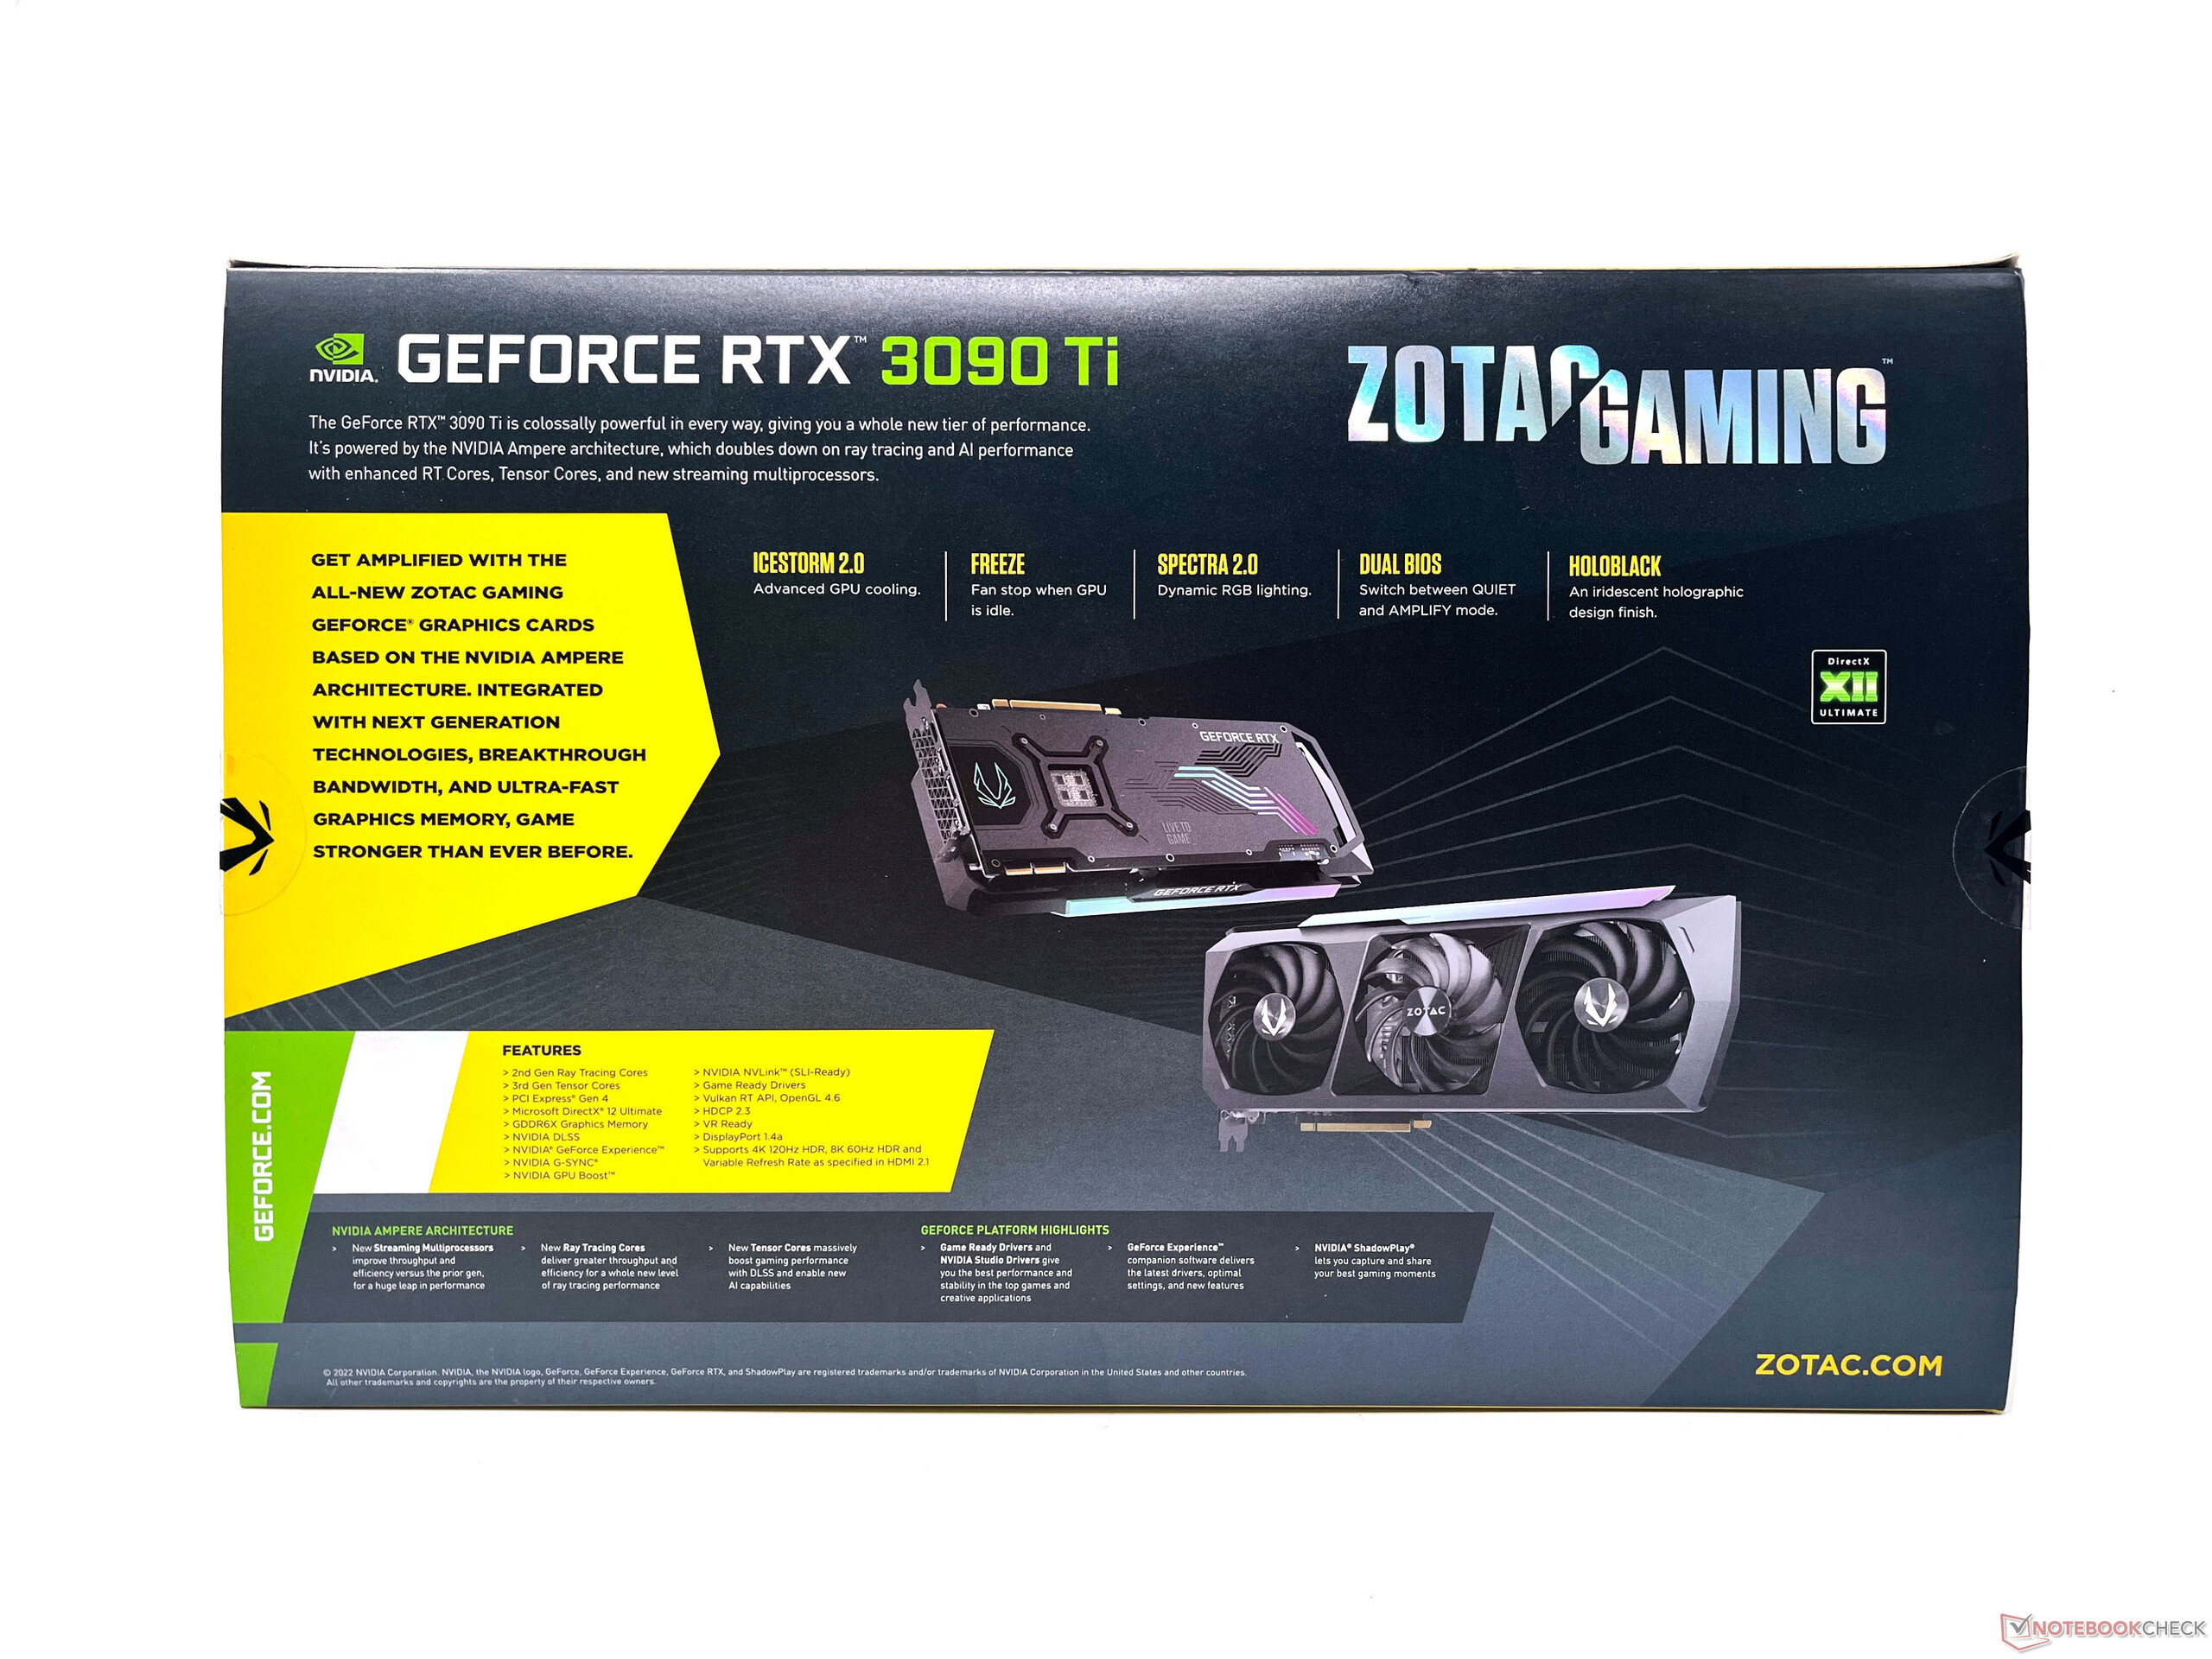
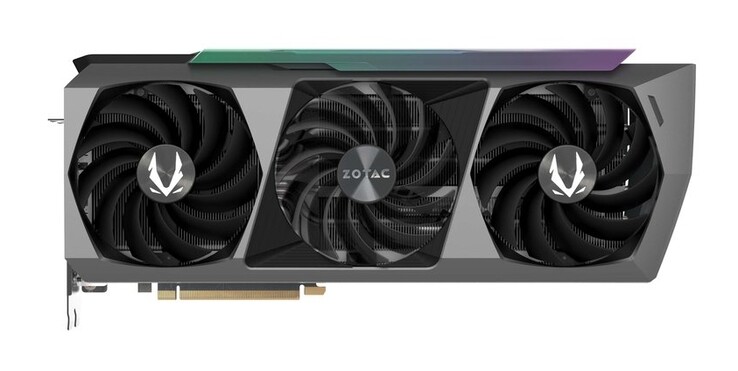
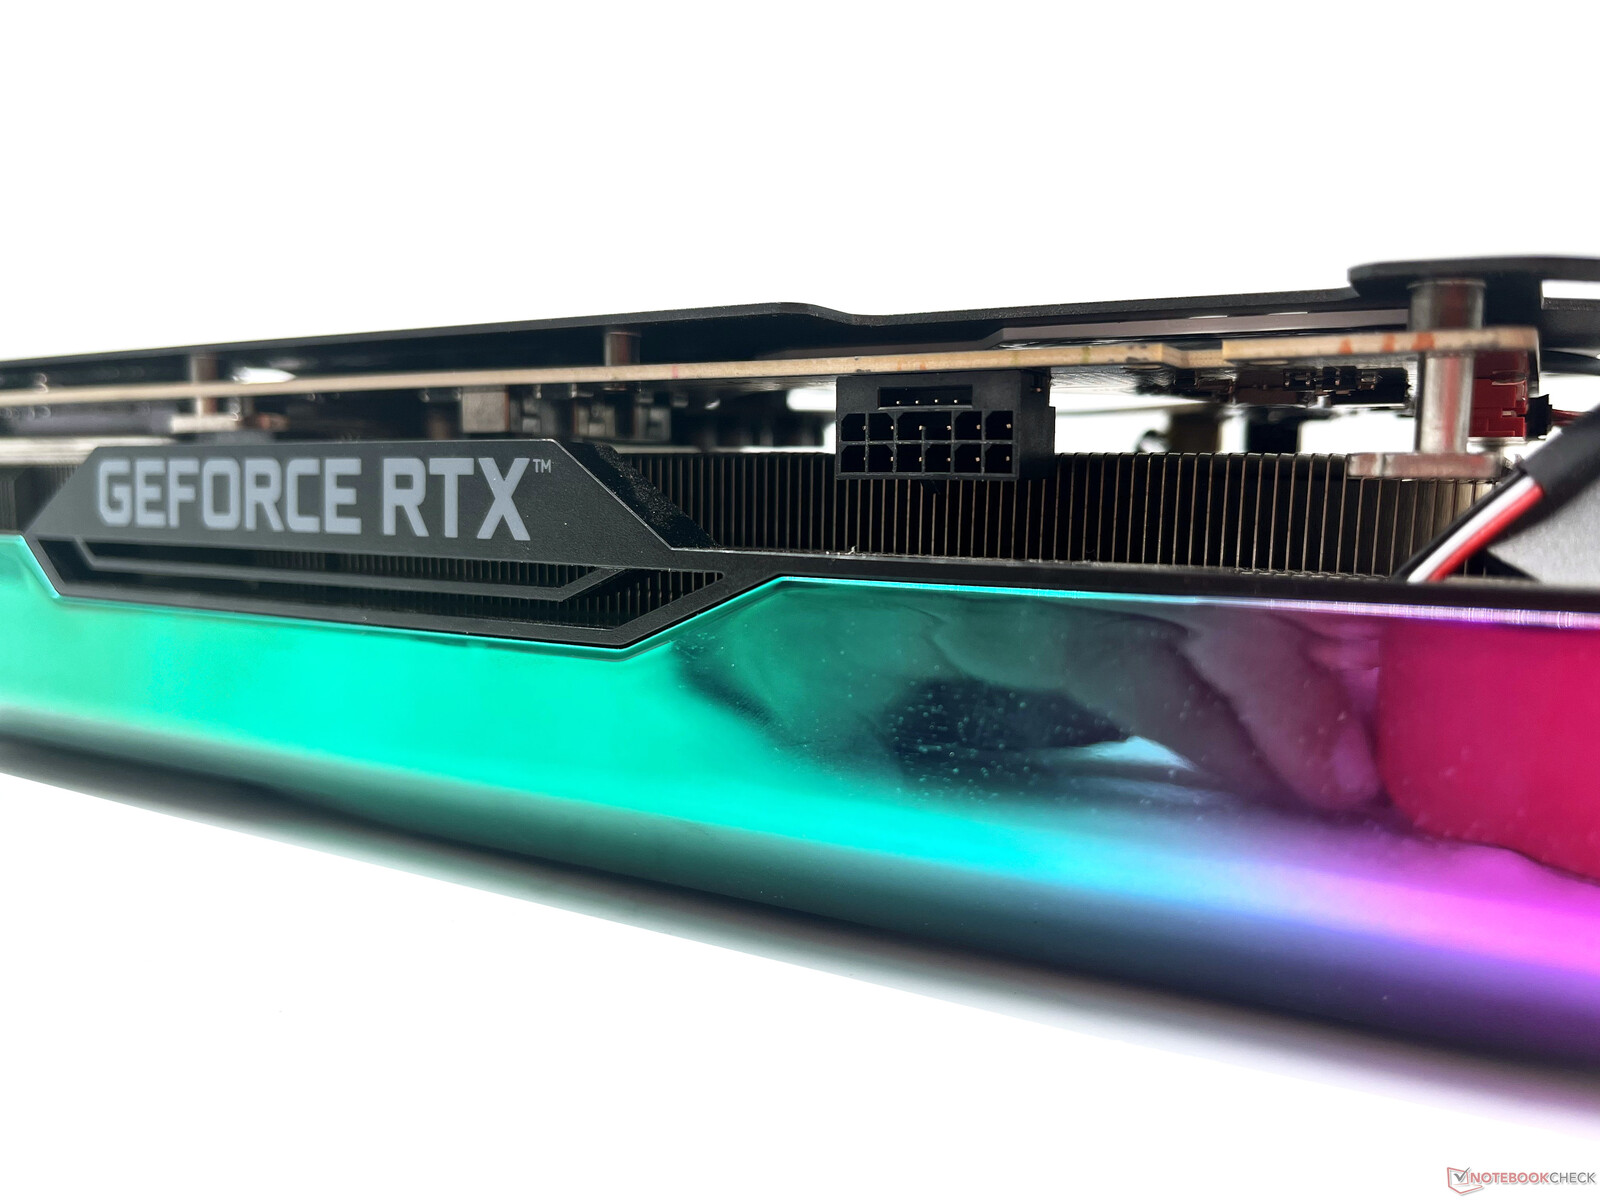
The RTX 3090 Ti AMP Extreme Holo bears a striking resemblance to Zotac's previous flagship, the RTX 3090 AMP Extreme Holo. You get the same triple-slot design, IceStorm 2.0 triple-fan cooler with automatic fan stop, and a prominent RGB strip on the top.

Sporting dimensions of 14 x 5.89 x 2.52 inches, the RTX 3090 Ti AMP Extreme Holo takes up nearly the entire width of a typical ATX case. The card weighs a little more than 2 kg.

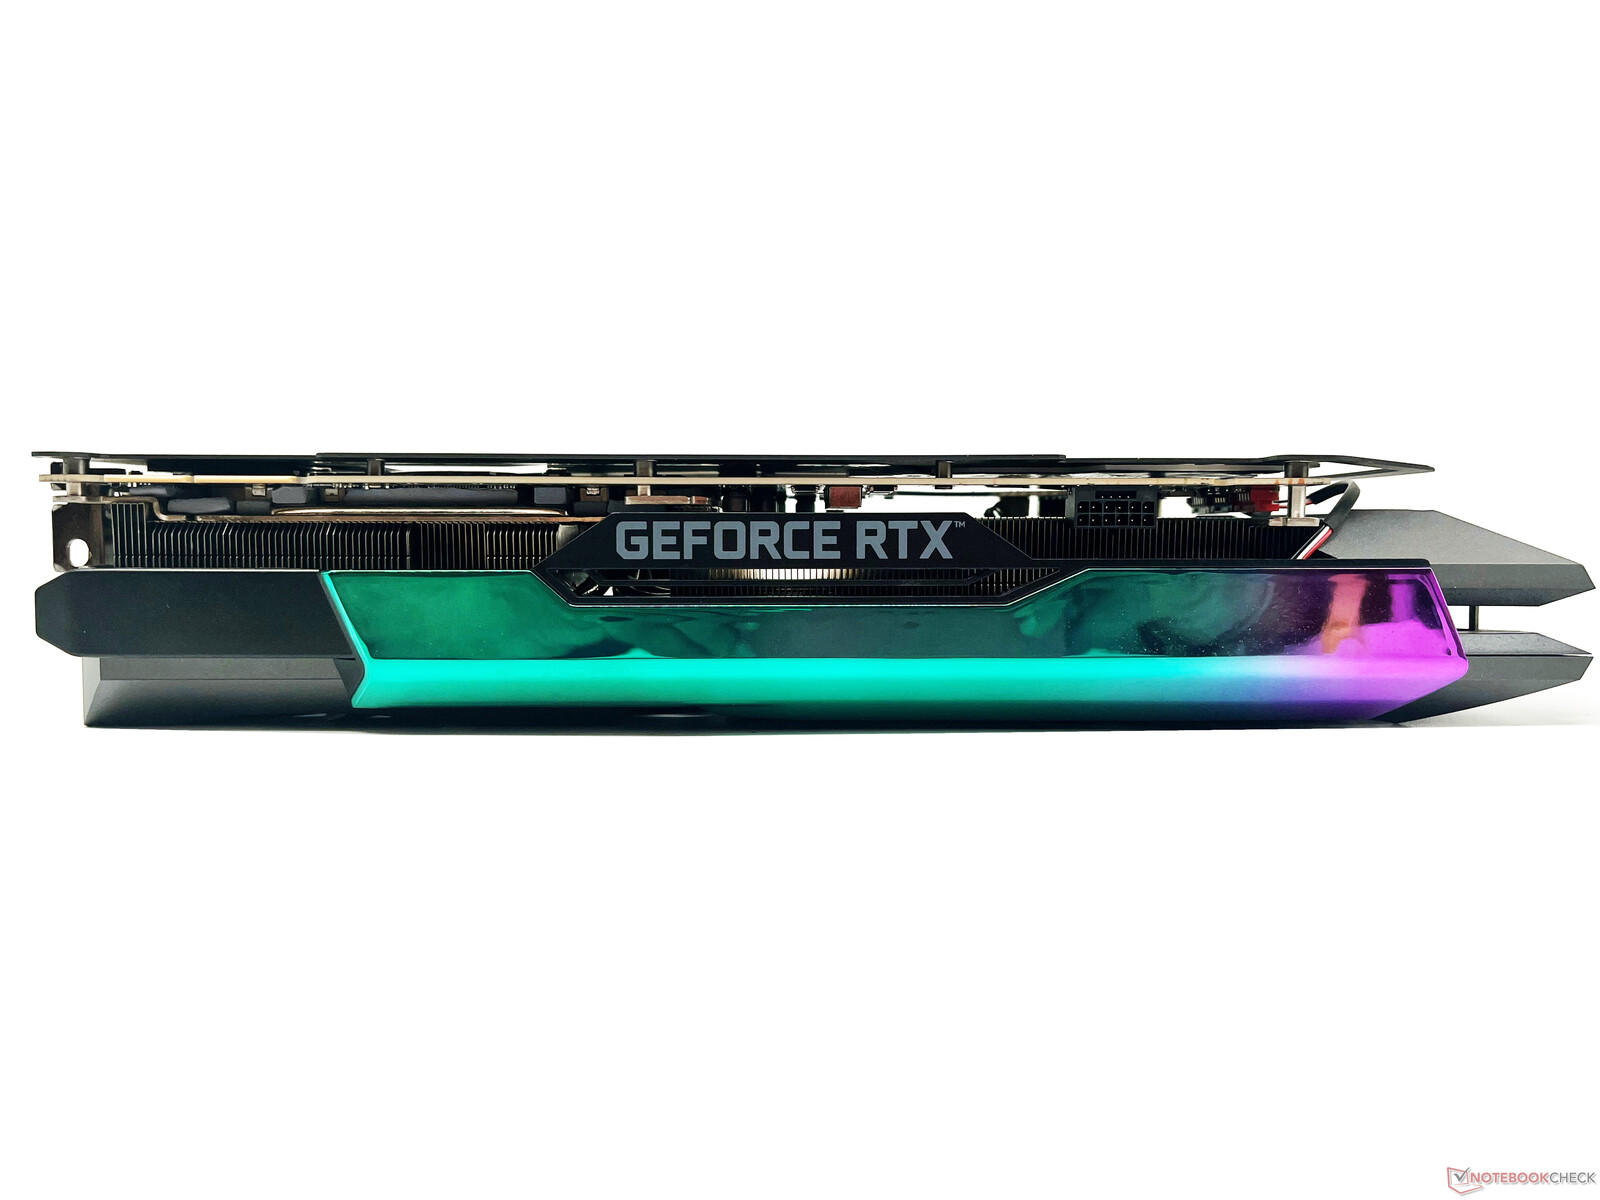
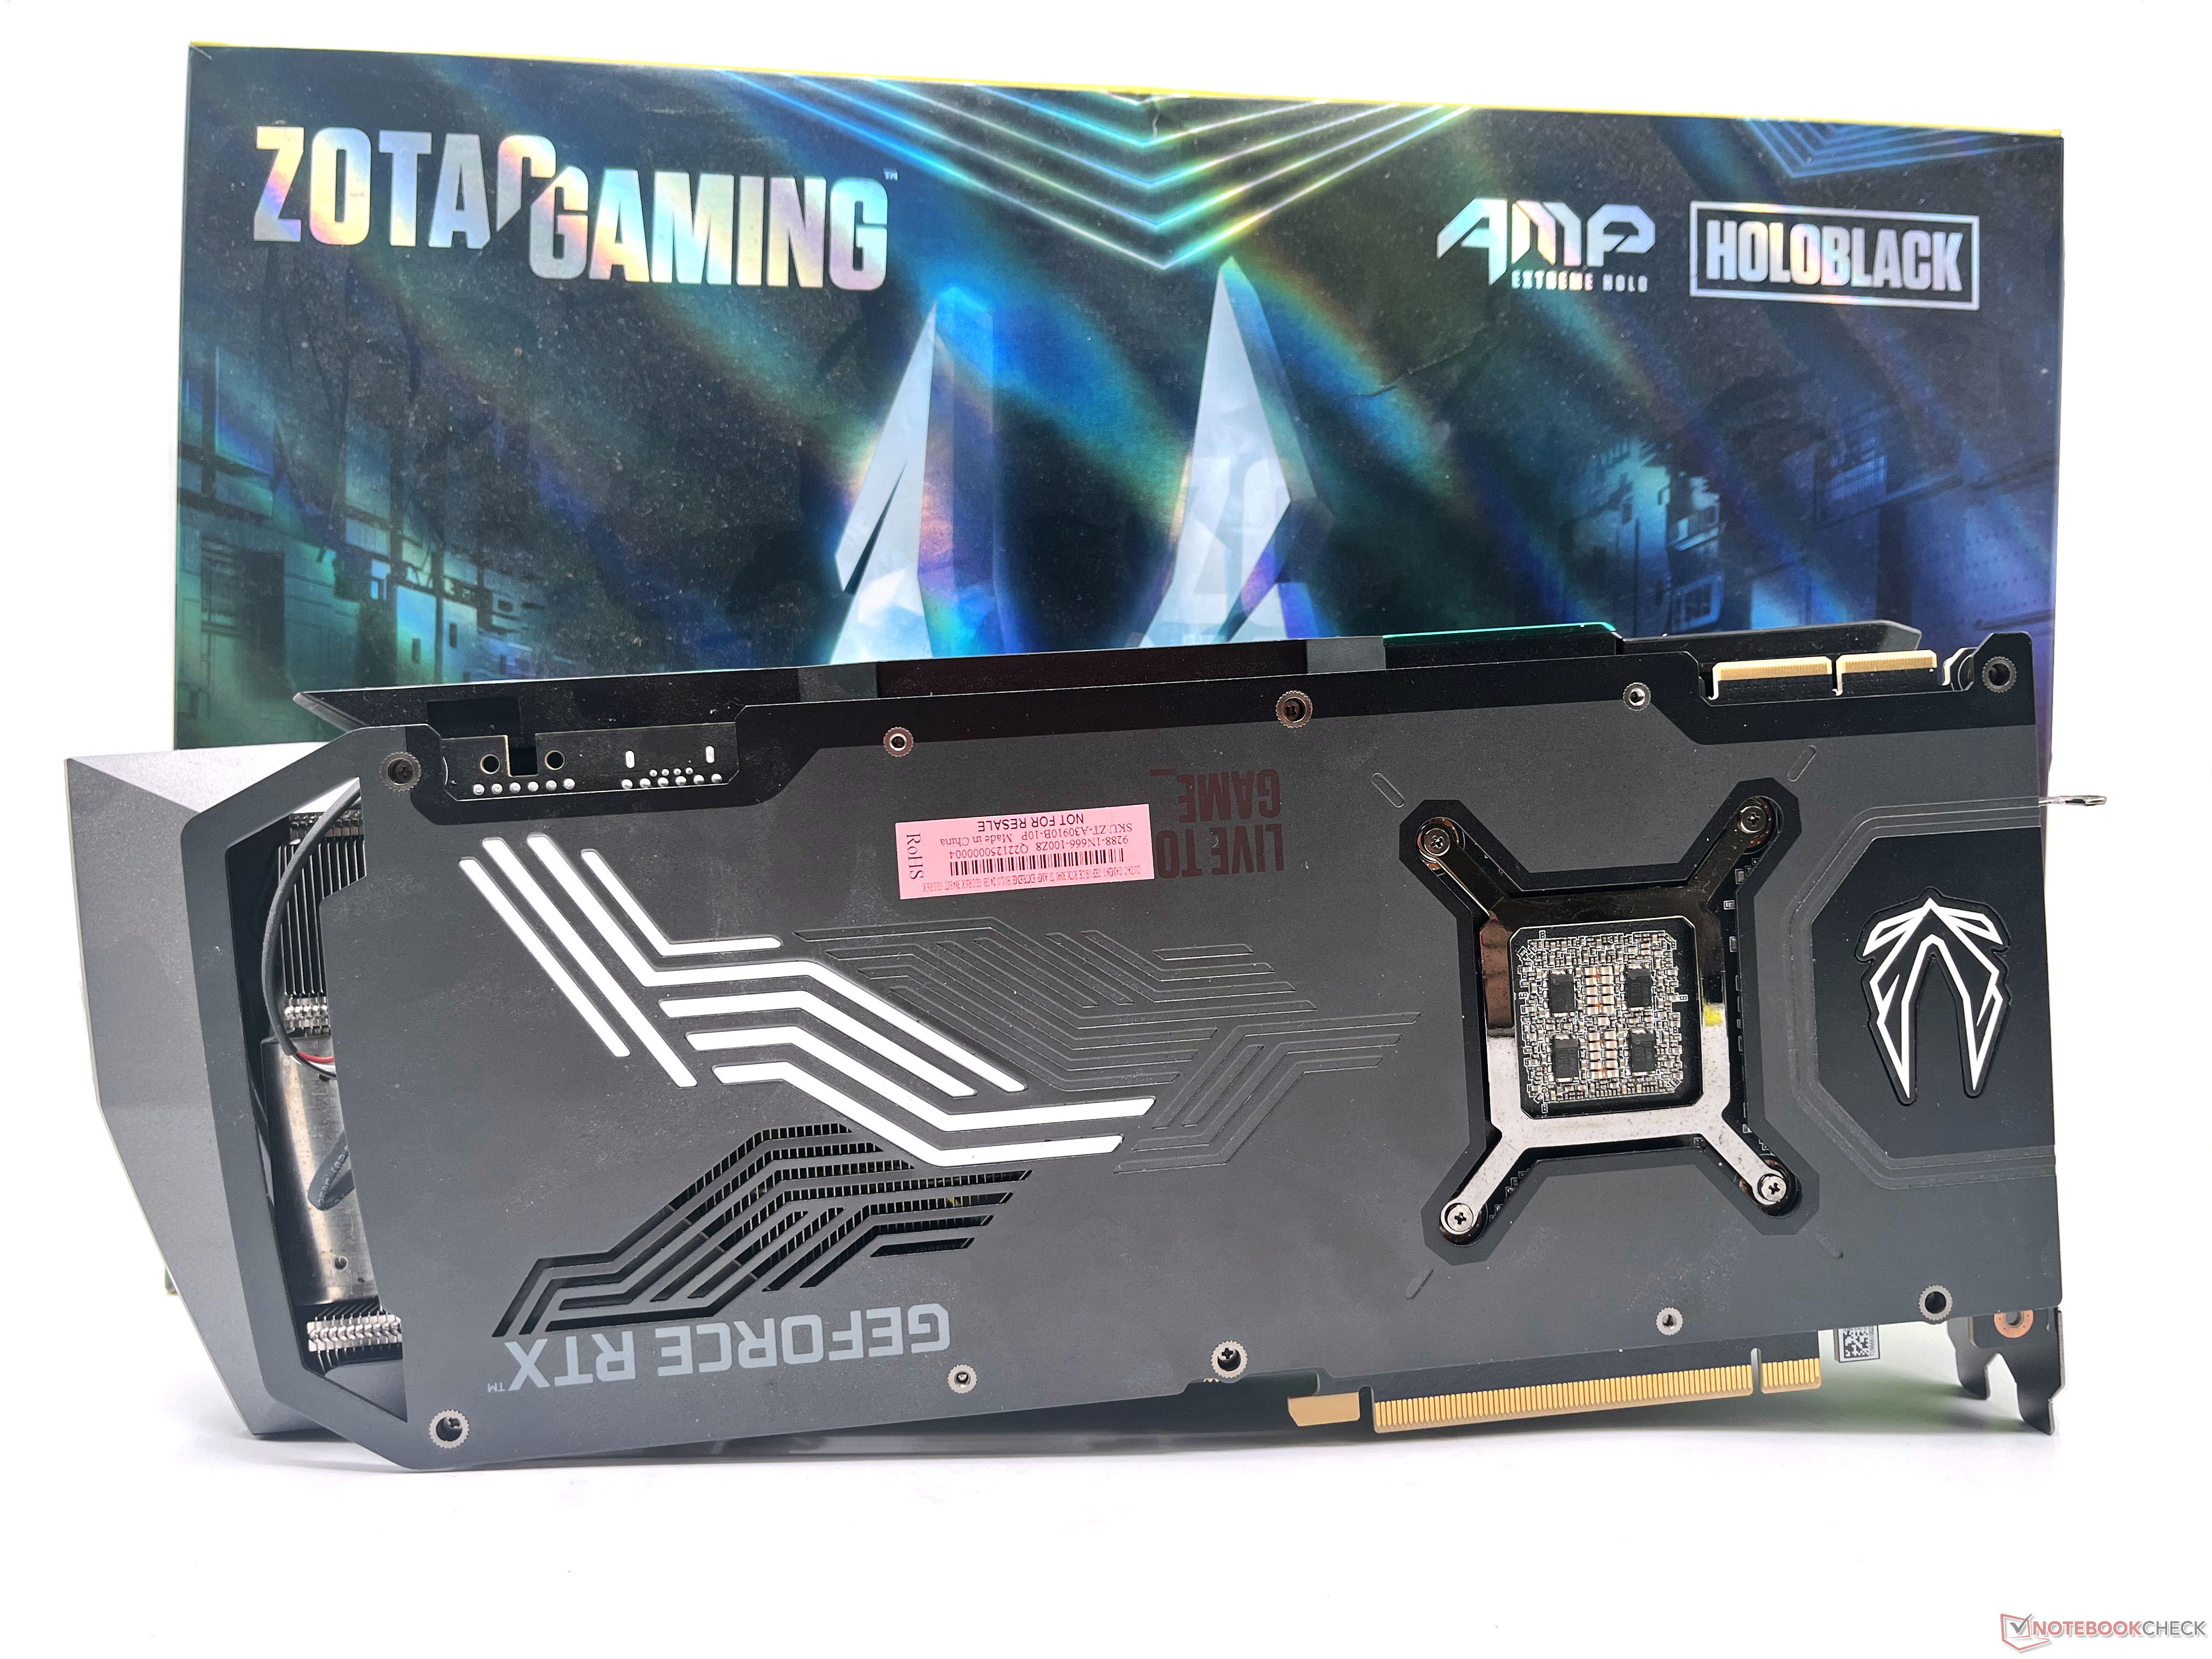
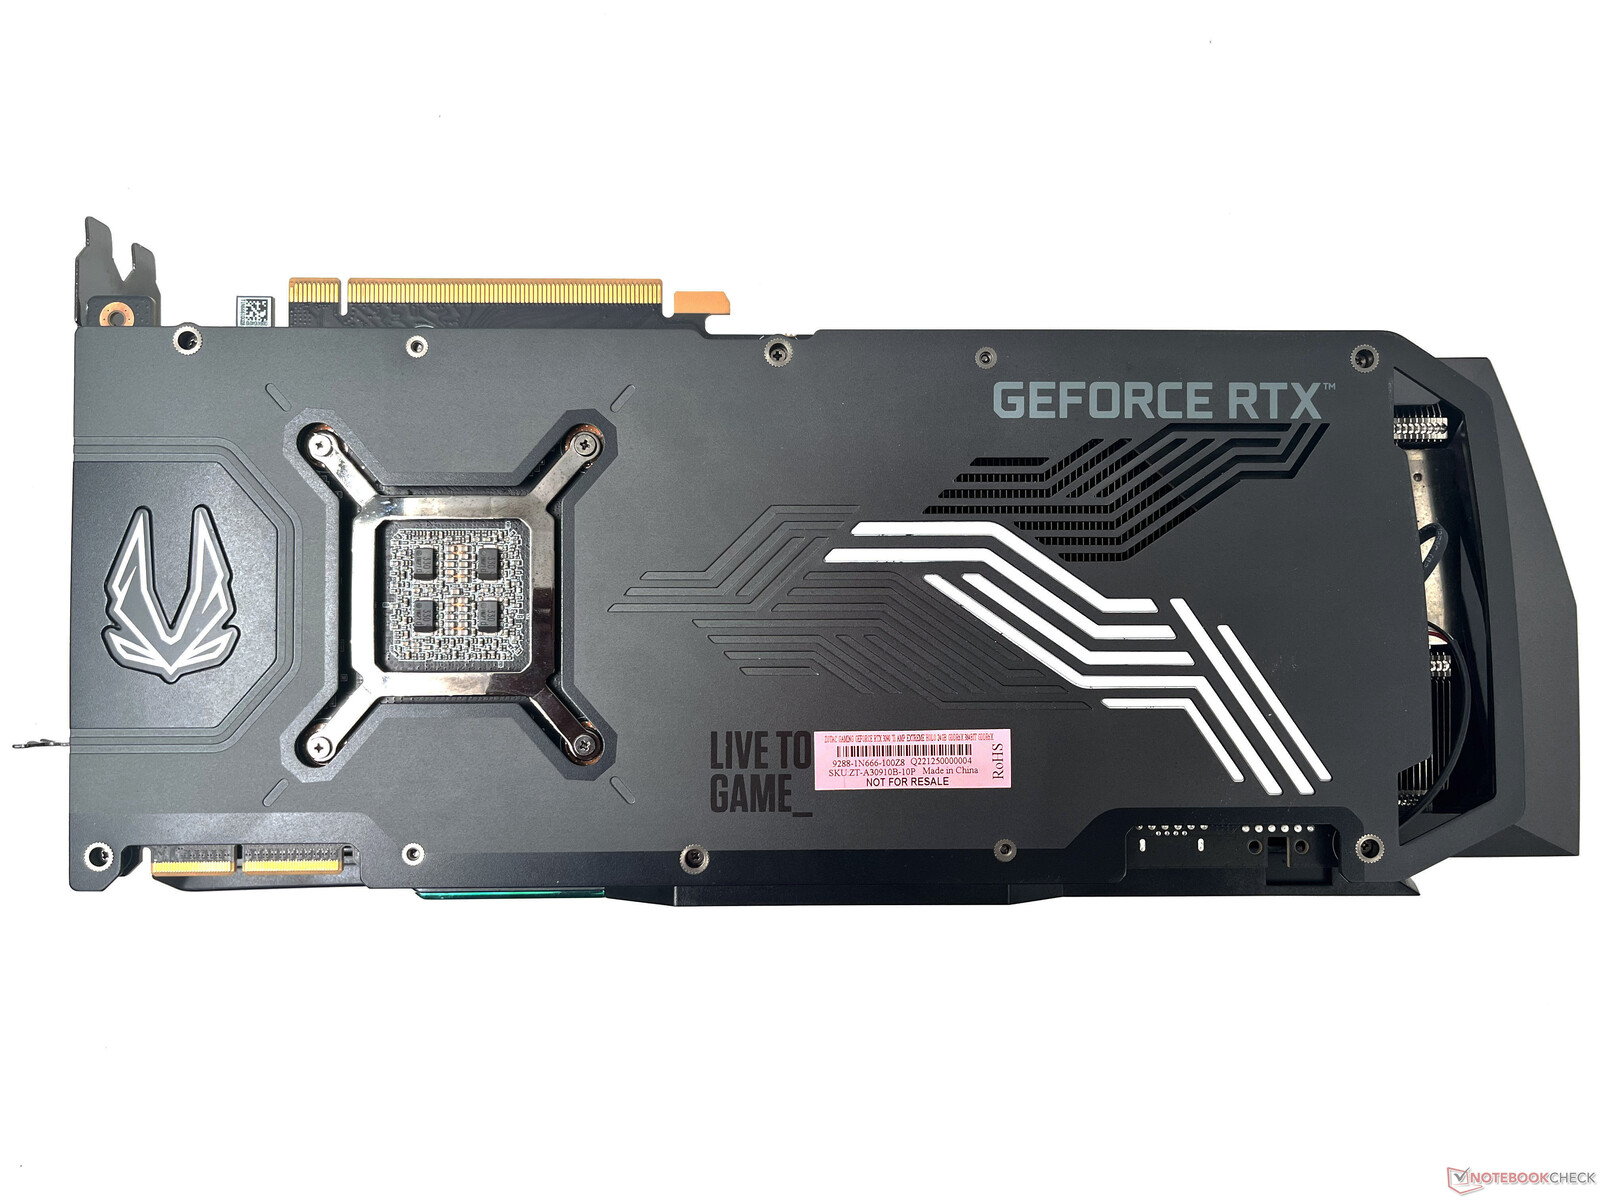
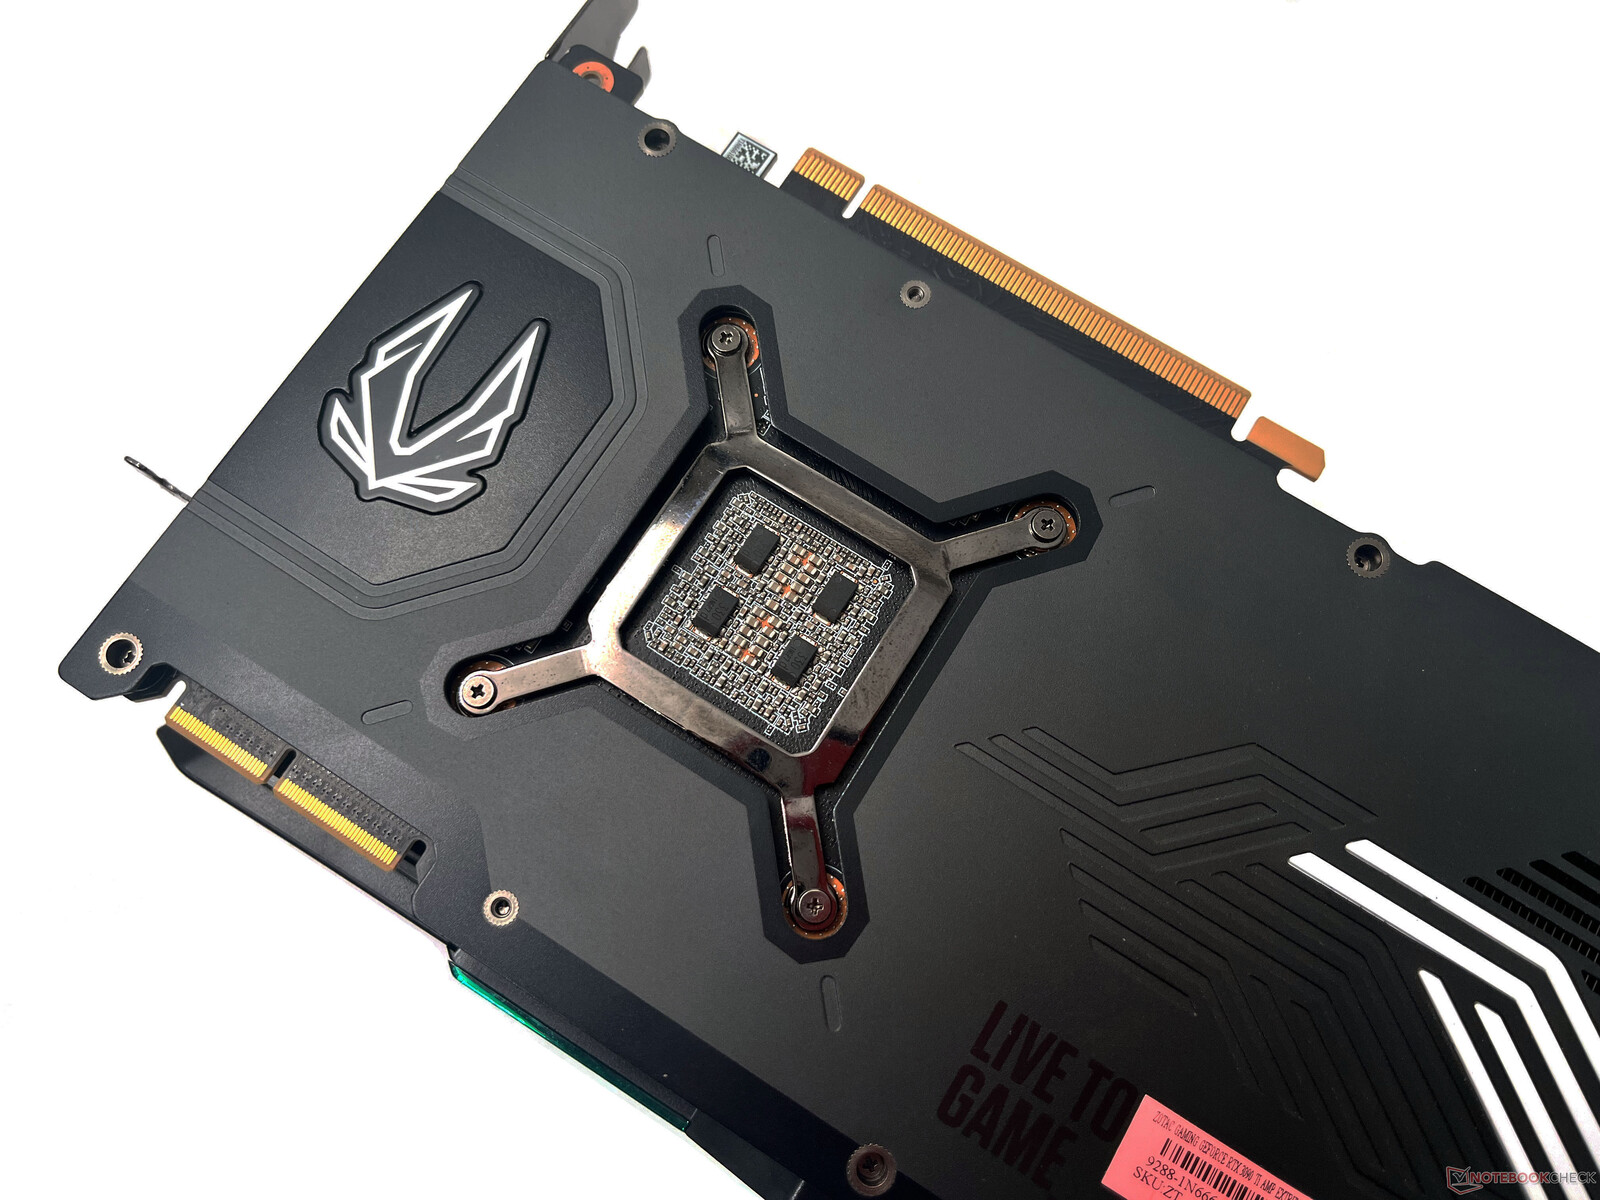
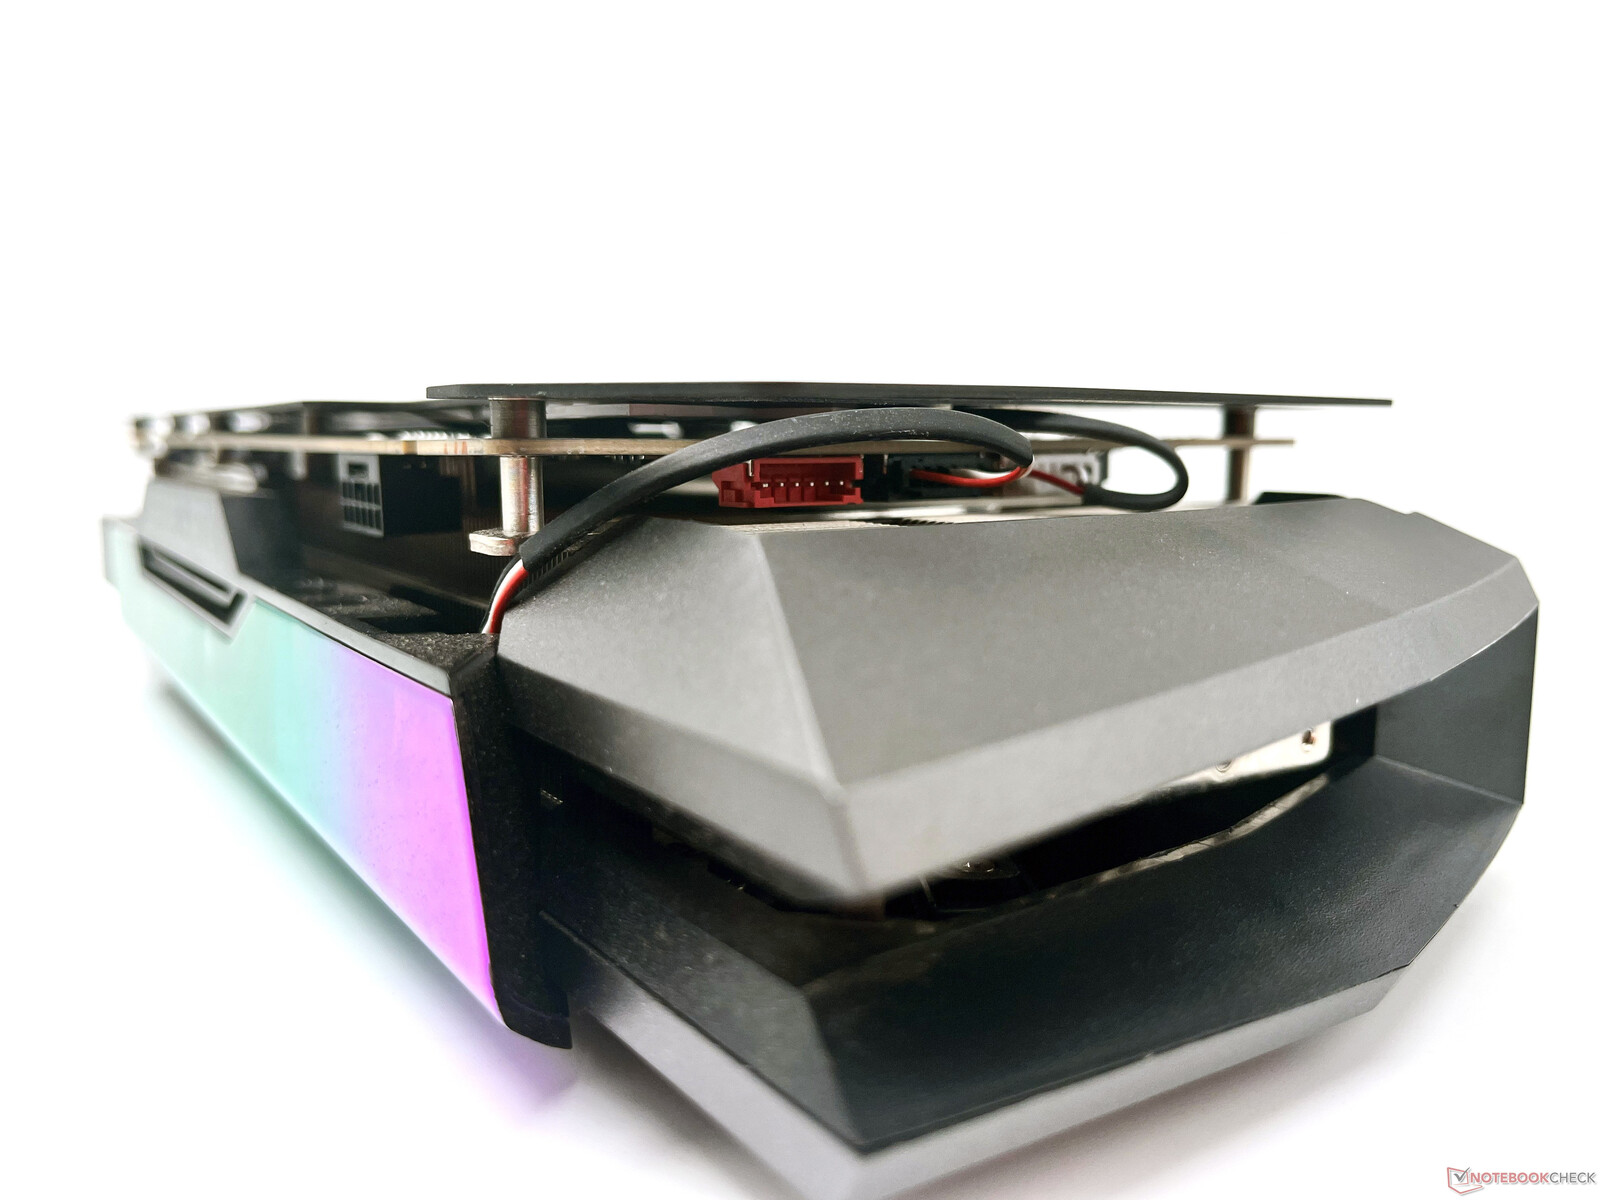
The metal backplate adds some aesthetic value while also offering protection to the card. However, it feels like it extends beyond the length of the PCB unnecessarily from where it begins to feel a bit fragile. There are two RGB zones on the backplate — the Zotac logo near the GPU metal bracket and an RGB stripe area.

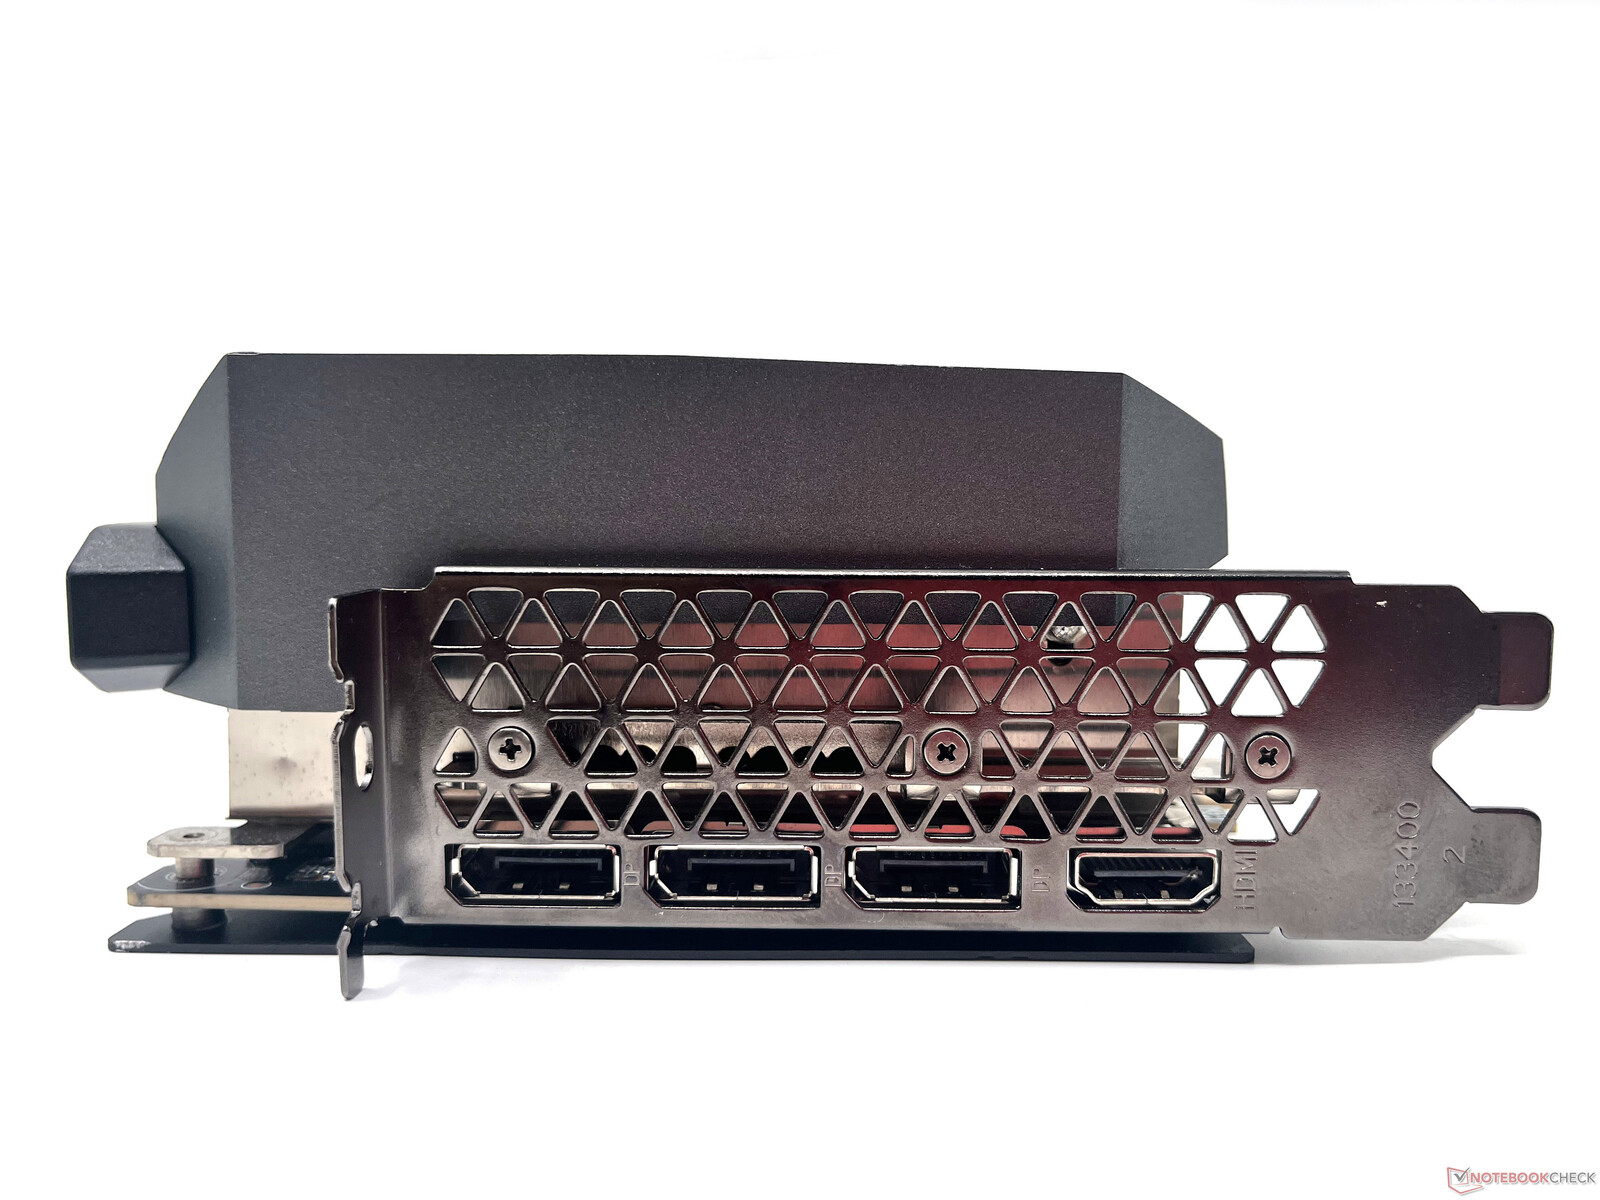
The usual array of display connectors are present, which include 1x HDMI 2.1-out that supports up to 4K 120 Hz HDR or 8K 60 Hz HDR and 3x DisplayPort 1.4a ports that support up to 8K 60 Hz.

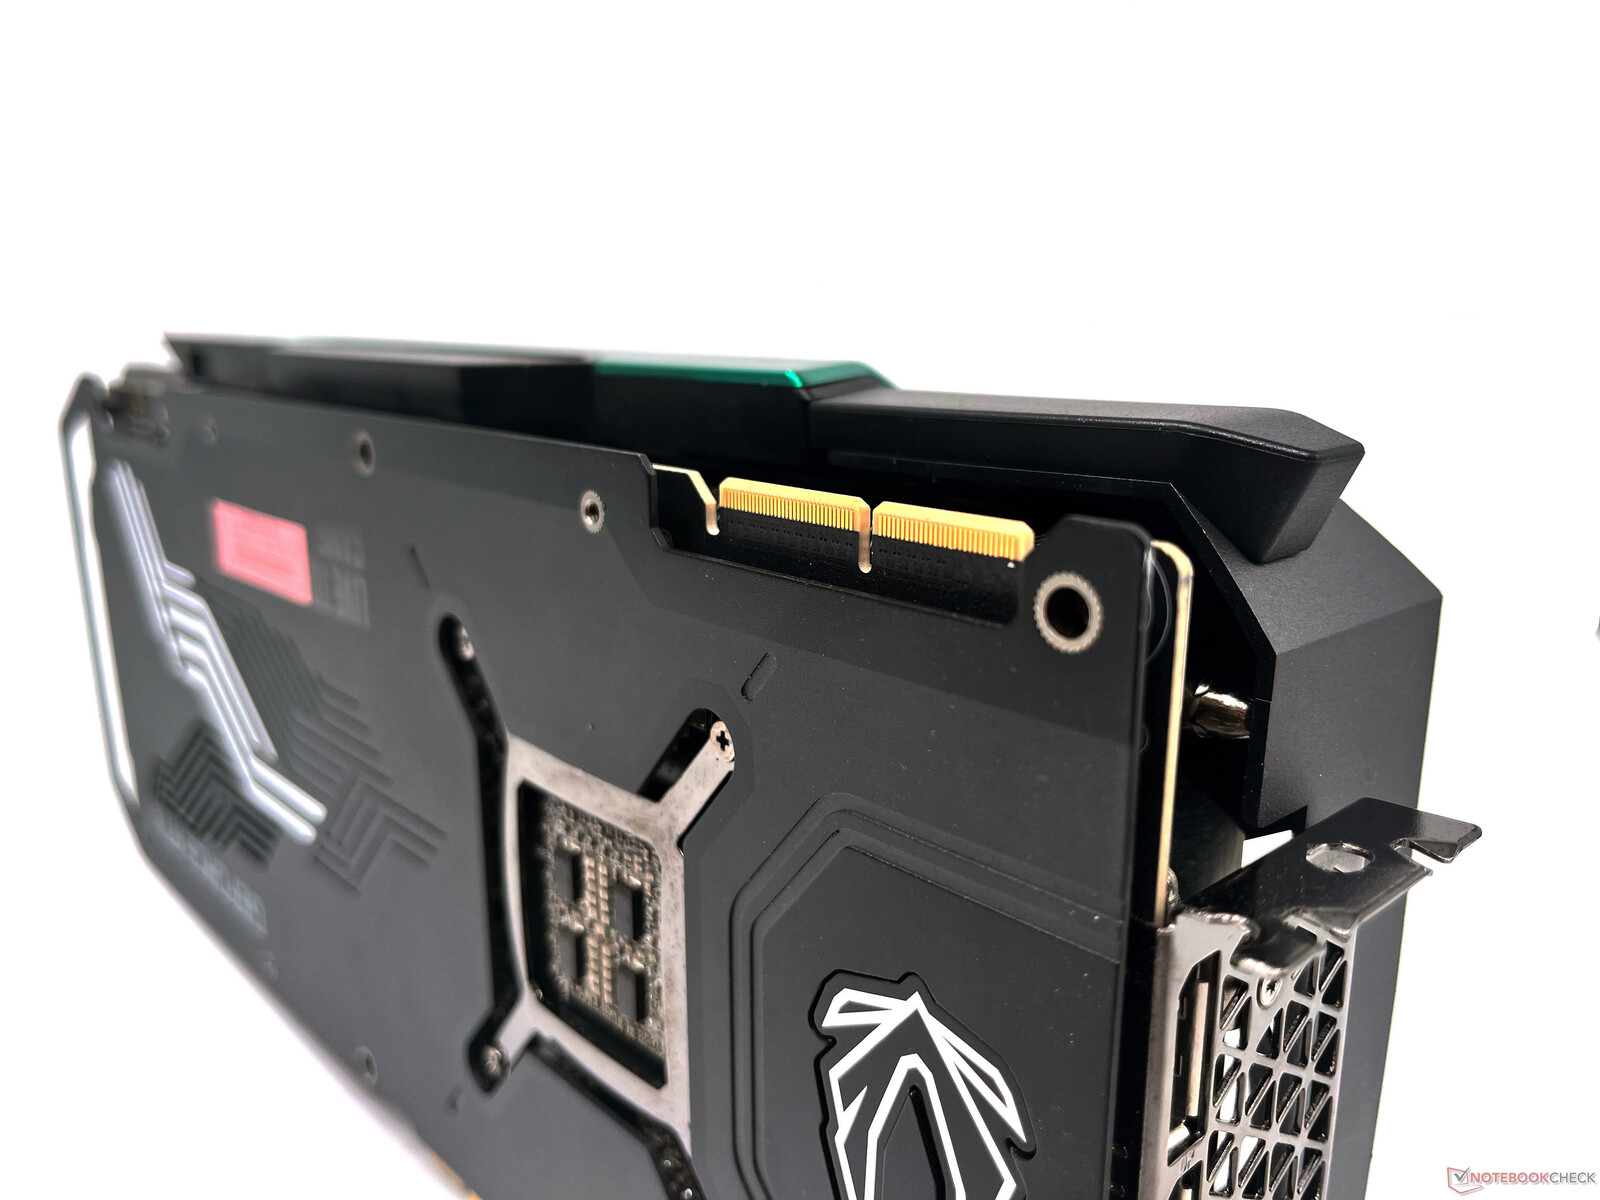
You also get an NVLink connector for SLI, though SLI-ready games are hardly seen these days and running two RTX 3090 Tis together is of no practical consequence for the vast majority of AAA titles out there.

From left: 3x DisplayPort 1.4a ports, 1x HDMI 2.1-out
NVLink connector
NVLink connector

Nvidia uses a 16-pin PCIe Gen 5 power connector for the RTX 3090 Ti Founders Edition that can deliver a full 600 W of power to the card. All RTX 3090 Ti cards, therefore, ship with a 3x 8-pin to 12-pin adapter. The three 8-pins can deliver 150 W each while another 75 W is supplied by the PCIe slot for a total of 525 W power input. Currently, the four small pins in the 16-pin connector remain unused.

Zotac also offers a 3-pin RGB connector if you want to use the GPU support bracket to prevent sag and still not lose out on the RGB bling.

Port for 3-pin RGB header
16-pin PCIe Gen 5 power connector

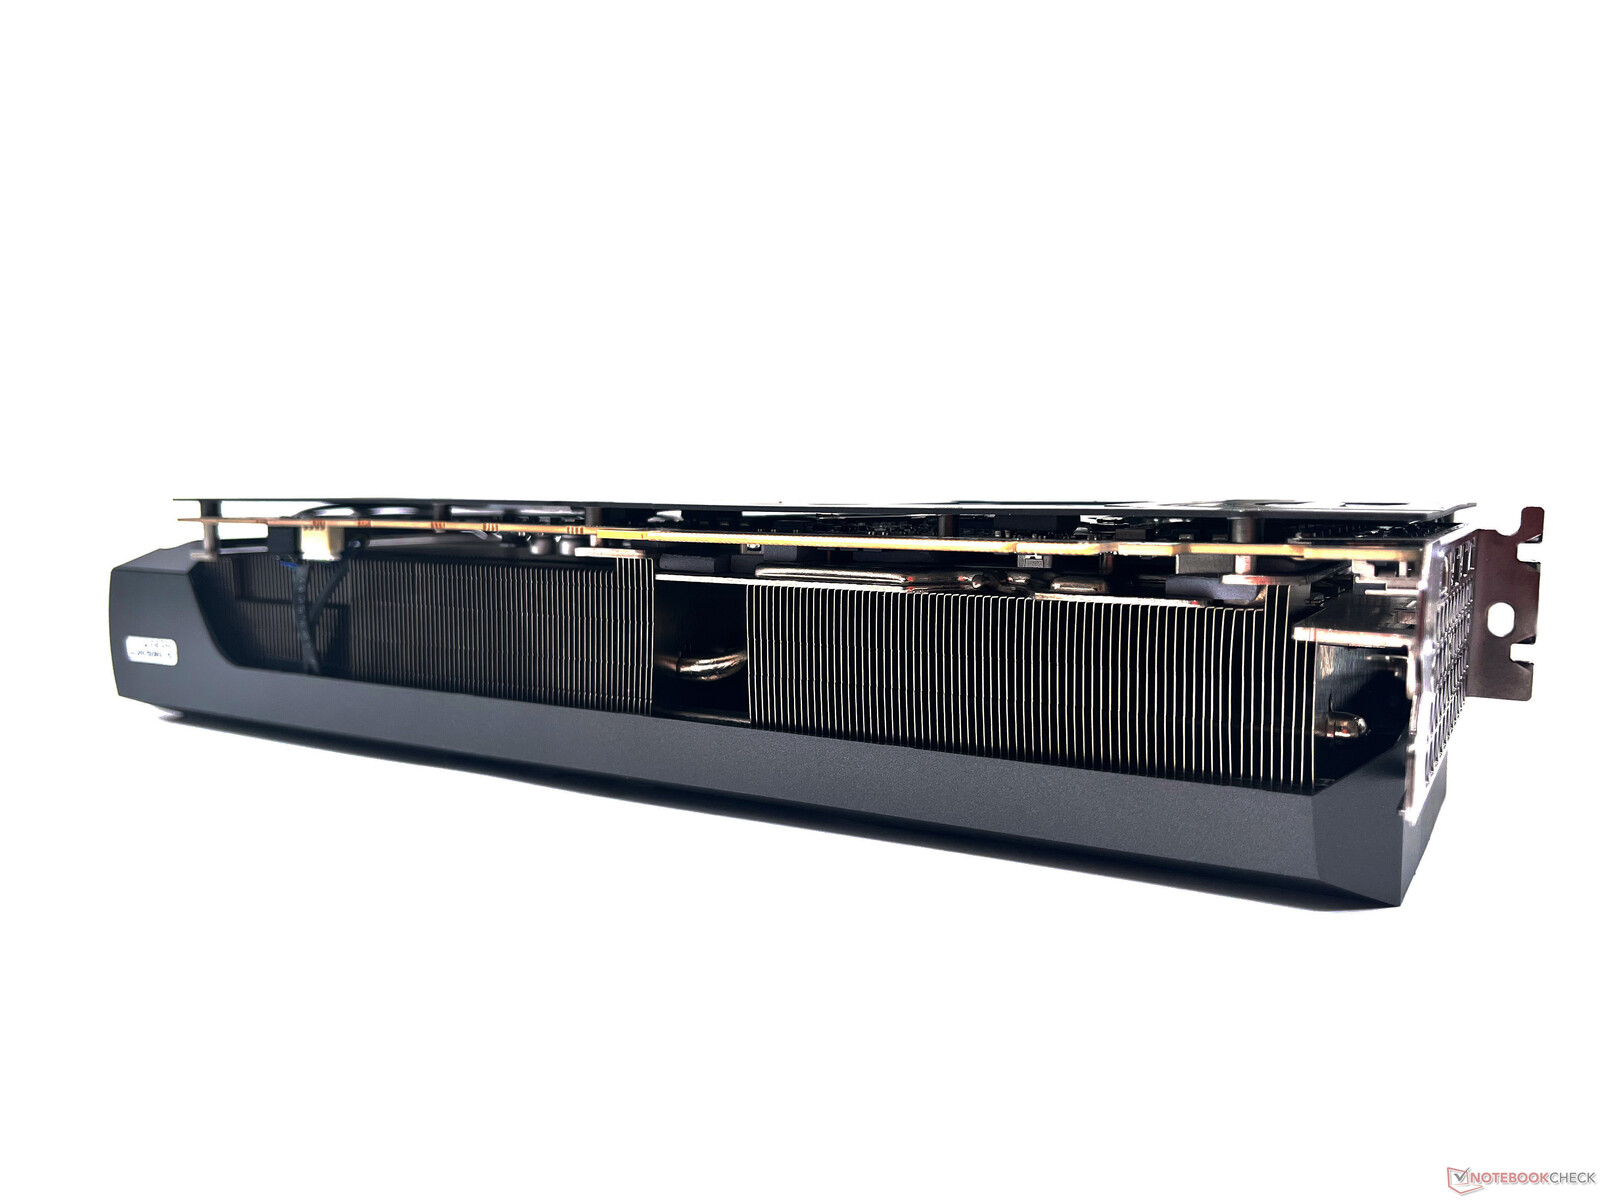
It's not easy to effectively keep a chip of the likes of a GA102 within temperature limits, but Zotac's IceStorm 2.0 cooling system seems to be doing a fairly decent job in this regard as we shall see soon. The fan shroud is longer than the actual board, and it's plastic construction is prone to bending.

Zotac employs a total of eight heatpipes to drive heat away from heatsink that covers the GA102 chip, the VRMs, and the memory.

The Zotac Gaming GeForce RTX 3090 Ti AMP Extreme Holo sports a solid construction overall, but there are weak areas in both the front shroud and the back metal plate that are prone to damage if not taken care of.

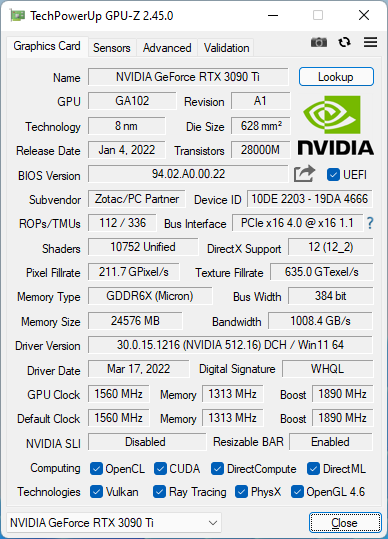
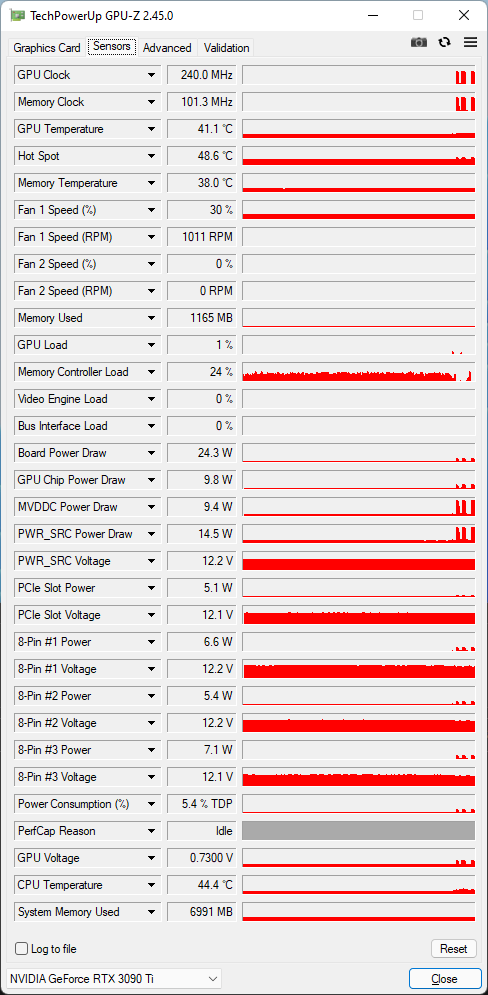
The RTX 3090 Ti AMP Extreme Holo runs at a base clock of 1,560 MHz and is rated to boost up to 1,890 MHz. As is typical with Nvidia cards, the base clock can go a lot lower — we observed around 210 MHz in idle — while the boost clock can increase further depending on the load and available thermal headroom.

The VRAM ECC state can be toggled from the RTX 3090 Ti's Game Ready driver

The 24 GB of GDDR6X VRAM is an overkill for the current crop of AAA games, even for those with heavy textures. However, Nvidia aims the RTX 3090 Ti at creators who also game since there is no Titan offering in the Ampere generation.

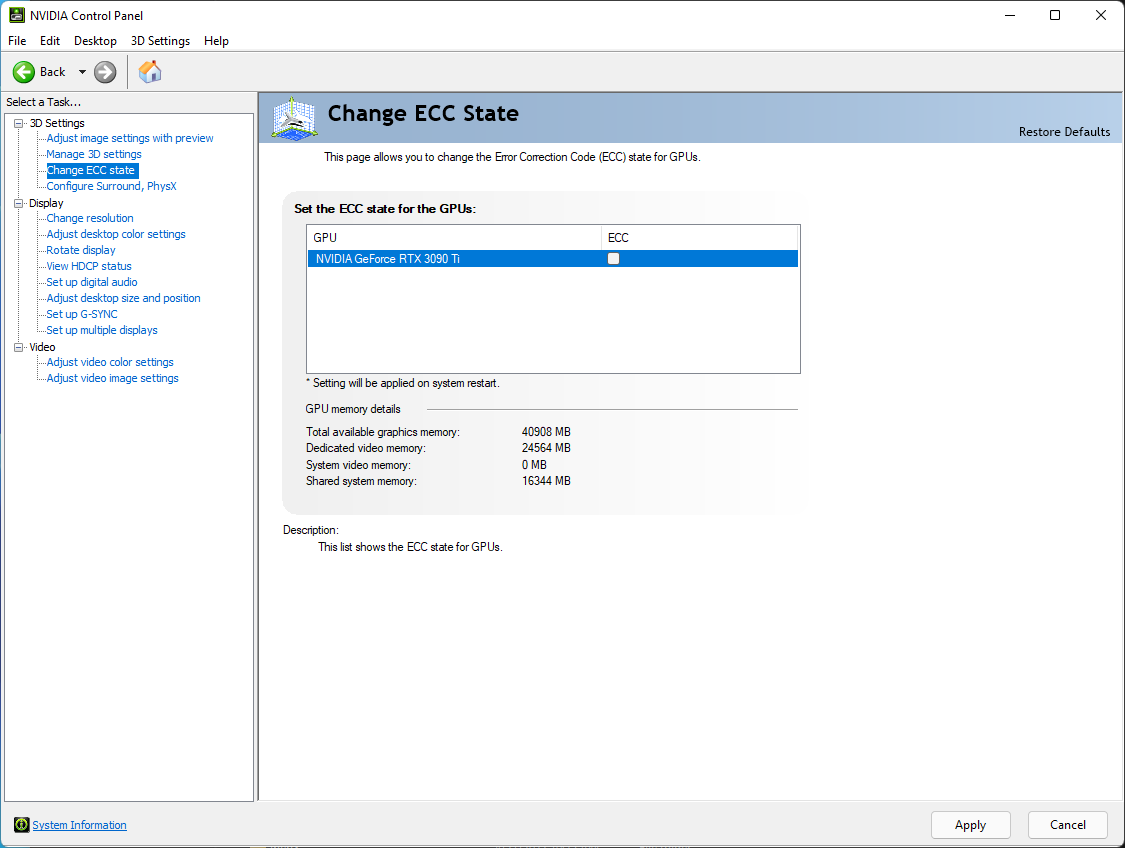
Interestingly, it is possible to toggle ECC support for the Micron memory in this card via the Nvidia Control Panel even with regular Game Ready drivers. Do note that turning on ECC can reduce memory speeds.

The heaps of VRAM surely come in handy when working with professional creative workflows such as 8K Redcode RAW projects in DaVinci Resolve, rendering using Nvidia OptiX in Blender, or storing massive scene data directly in VRAM in OTOY OctaneRender.

We have previously looked at an 8K editing workflow example in DaVinci Resolve in our Zotac Gaming GeForce RTX 3090 Trinity review, so be sure to check that out.

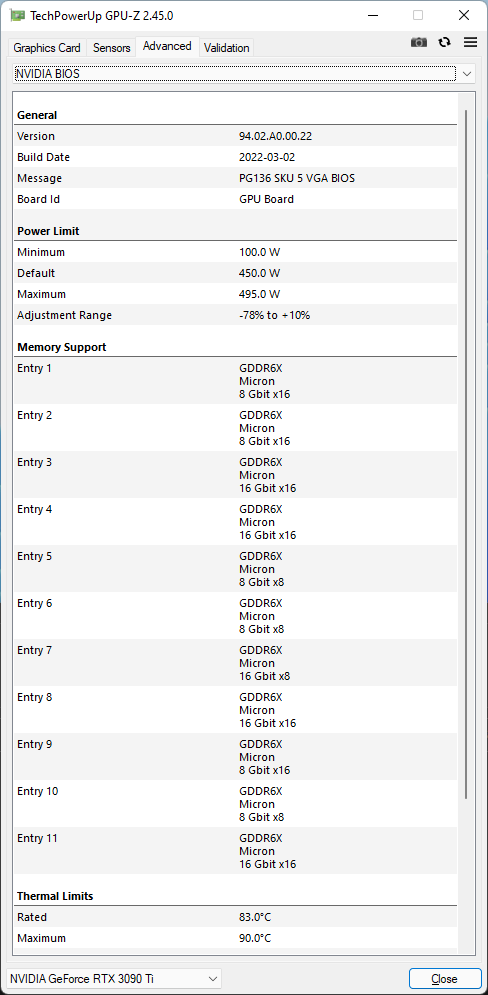
Overclocking potential is nominal with this card. Total graphics power (TGP) limits can be increased by an additional 10% to 495 W either via Zotac's FireStorm Utility, Nvidia GeForce Experience, or your preferred GPU overclocking software.

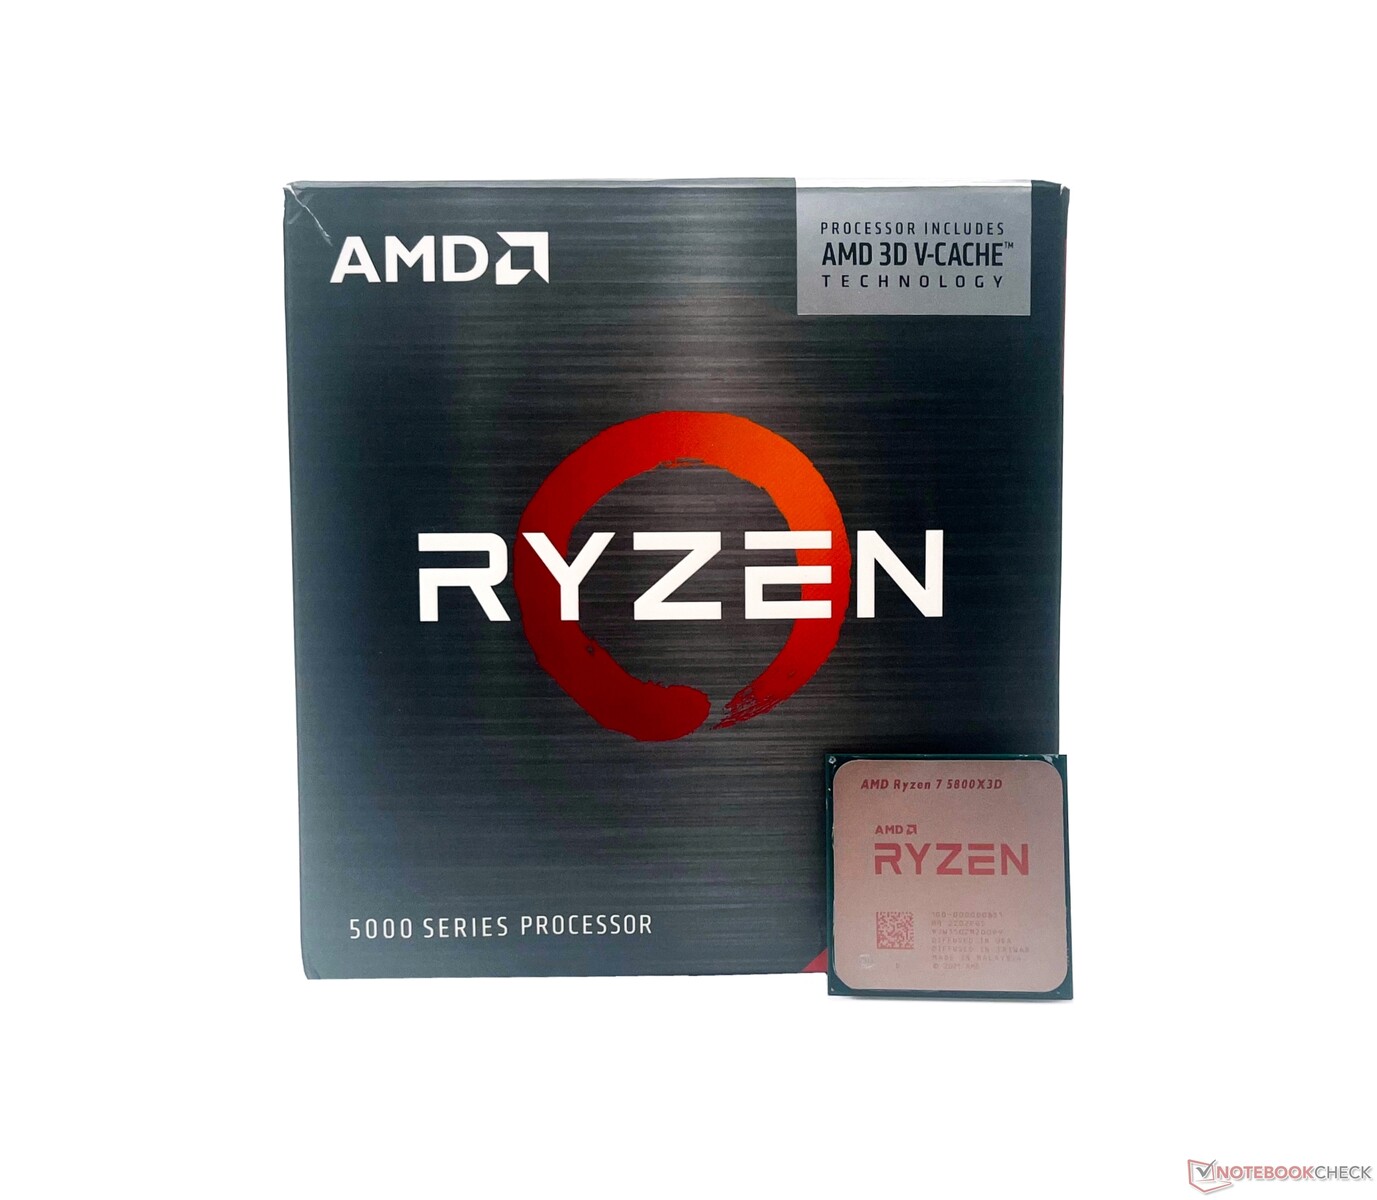
Test bench: RTX 3090 Ti gets paired with the AMD Ryzen 7 5800X3D

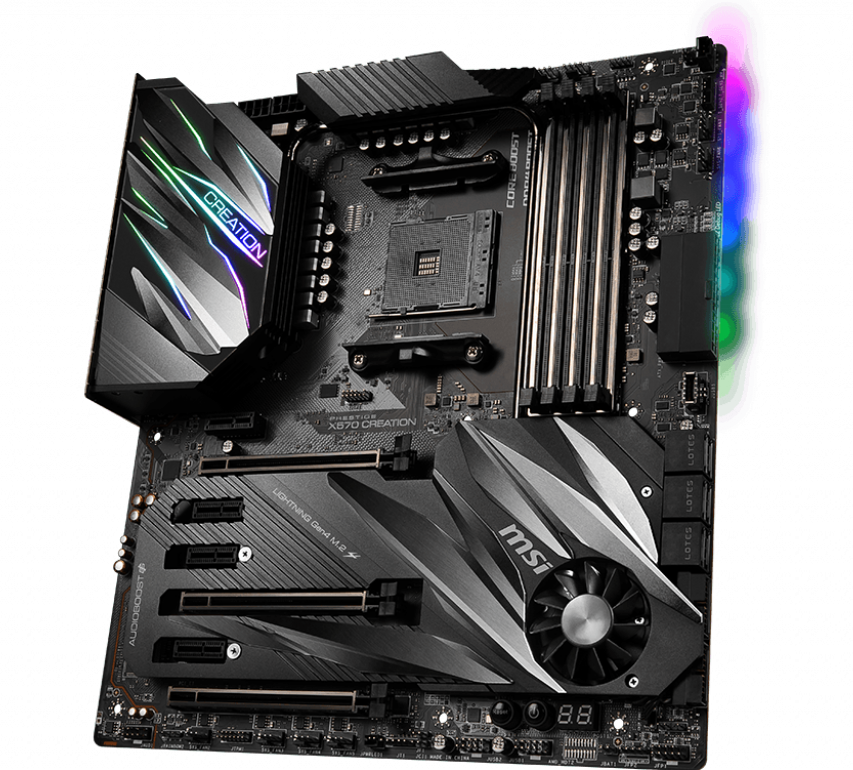
Our test bench is based on the new AMD Ryzen 7 5800X3D processor with 3D V-cache. The Ryzen 7 5800X3D is aimed squarely at gamers, and the increased cache in the processor helps remove any potential CPU bottlenecks. This CPU was installed on an MSI Prestige X570 Creation motherboard updated to the latest AGESA 1.2.0.6c BIOS. 32 GB (16 GB x2) of G.SKILL Trident Z Neo DDR4-3600 RAM with timings 16-19-19-39 was used.

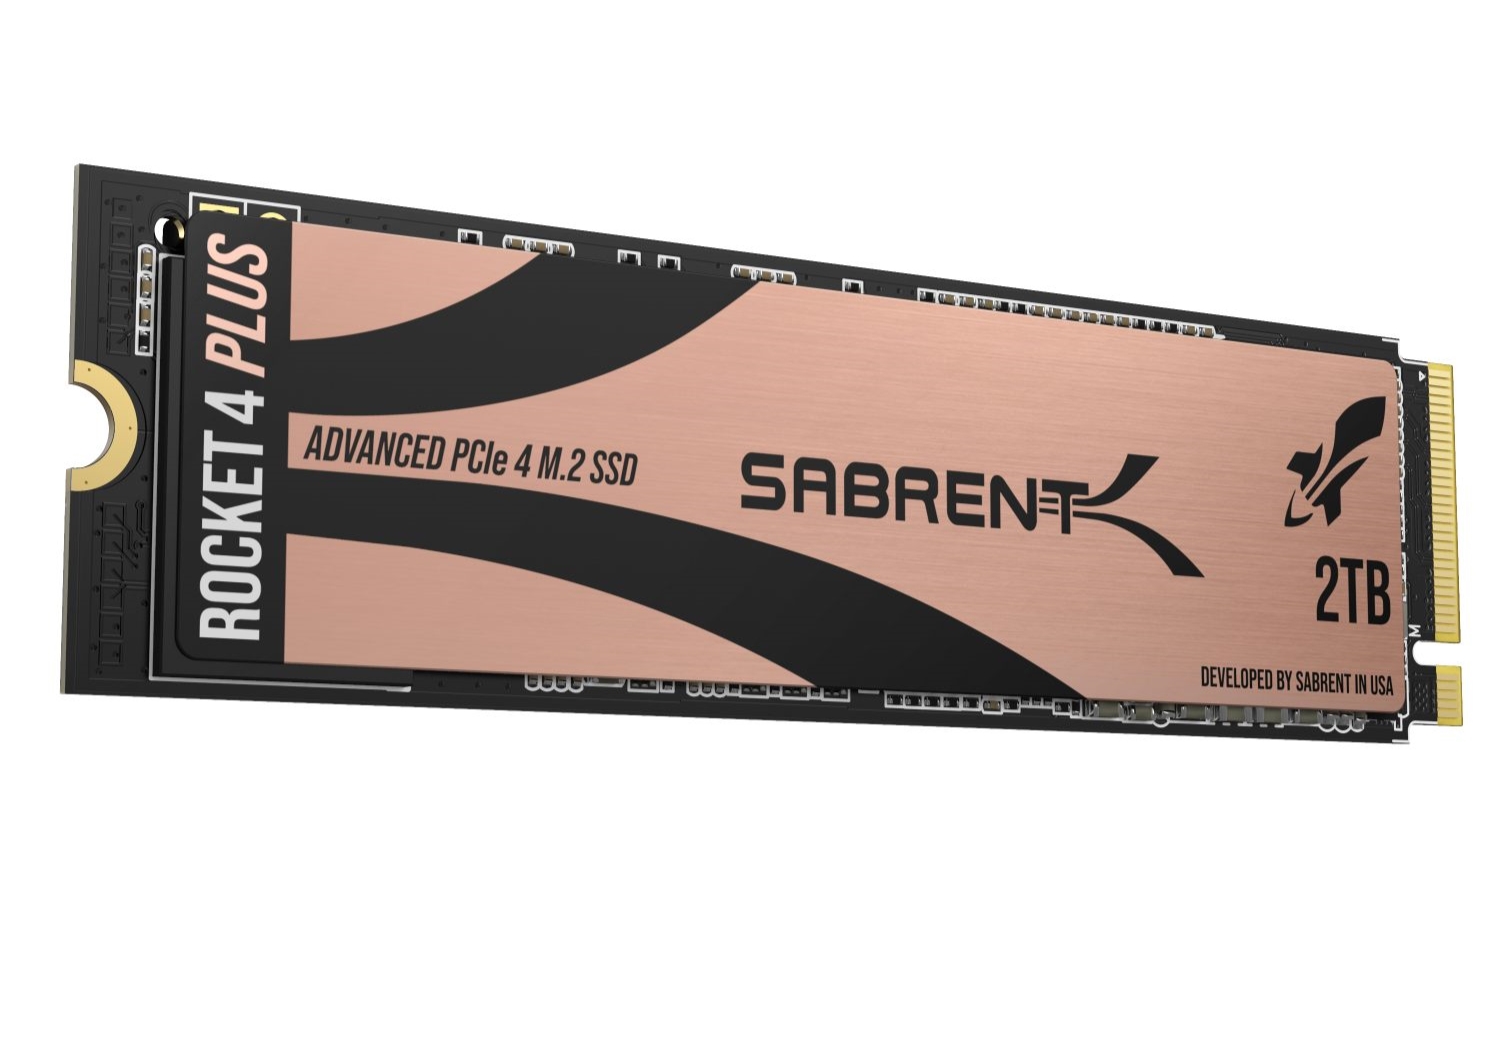
Windows 11 21H2 with the latest patches was installed on a 2 TB Sabrent Rocket 4 Plus Gen4 NVMe SSD. Benchmarks and games were installed on the Sabrent drive as well on 2x 1 TB Crucial MX500 SATA SSDs. Resizable BAR and HAGS were enabled.

The Ryzen 7 5800X3D was ably kept cool with a Corsair iCUE H115i Elite Capellix AIO cooler. The entire build was housed in a Corsair iCUE 4000X RGB case equipped with a Thermaltake Toughpower 850 W 80 Plus Gold PSU.

Note: The Ryzen 7 5800X3D may affect physics scores in synthetics and show slight benefits in 1080p gaming.

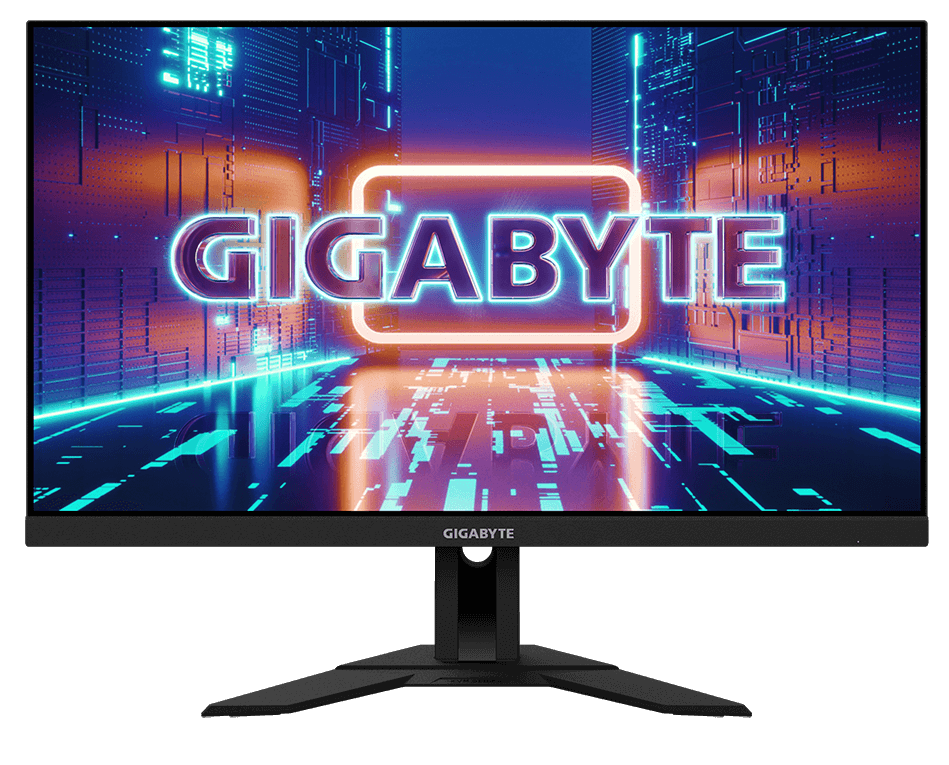
The Gigabyte M28U was chosen as the display of choice. The M28U sports a native 4K 144 Hz resolution and supports AMD FreeSync Premium Pro. It is possible to enable G-Sync for this panel, but we kept it disabled during benchmarking. Desktop scaling was set to 100%.

We would like to thank AMD for facilitating a review sample of the Ryzen 7 5800X3D, Sabrent for the Rocket 4 Plus Gen4, Gigabyte for the M28U gaming monitor, and Corsair for the iCUE Elite Capellix AIO cooler and the iCUE 4000X case.

AMD Ryzen 7 5800X3D
AMD Ryzen 7 5800X3D
MSI Prestige X570 Creation. (Image Source: MSI)
Sabrent Rocket 4 Plus Gen4 2 TB. (Image Source: Sabrent)
Gigabyte M28U. (Image Source: Gigabyte)

Synthetic benchmarks: RTX 3090 Ti leads but Radeon RX 6900 XT isn't far behind

The Zotac RTX 3090 Ti AMP Extreme Holo leads the charts in synthetic tests, but the AMD Radeon RX 6900 XT is right at its heels in most 3DMark tests with the exception of Time Spy Graphics. Compared to an average RTX 3090, the RTX 3090 Ti can be anywhere between 13% to 20% faster depending on the test. Interestingly, the RTX 3080 Ti Founders Edition seems to be on par with the average RTX 3090 scores in most 3DMark test. We see benefits nearing the 60% mark when compared to the Titan RTX, which is a good uplift over one and a half generations. 

Decent gains are observed when compared to RTX 3090 average in Unigine Heaven 4.0. The tables turn a bit in the Unigine Valley 1.0 DirectX benchmark wherein the RTX 3080 Ti manages to get past the mighty RTX 3090 Ti, though just by a whisker. AMD cards seem to compare well to Nvidia flagships in Unigine DirectX tests but seem to take a beating in OpenGL. 

The RTX 3090 Ti AMP Extreme Holo once again leads the pack in Unigine's latest Superposition benchmark across all tested resolutions. As expected, the real might of the card becomes evident in 4K and 8K benchmarks. At 4K, the average RTX 3090 and the RTX 3080 Ti Founders Edition are about 12% behind the new RTX 3090 Ti. The RX 6900 XT falls back by 19% while the Titan RTX lags by 34%.

Similar results are observed in the 8K Optimized version of the benchmark as well, although we see the RX 6900 XT trailing by 30% in this test.

Overall, perceivable gains can be expected with the RTX 3090 Ti in synthetic benchmarks when compared to current Nvidia and AMD flagships though they don't really seem to justify an immediate upgrade.

3DMark
1920x1080 Fire Strike Graphics
Zotac Gaming GeForce RTX 3090 Ti AMP Extreme Holo
AMD Ryzen 7 5800X3D, NVIDIA GeForce RTX 3090 Ti
53110 Points
AMD Radeon RX 6900 XT
AMD Ryzen 9 5950X, AMD Radeon RX 6900 XT
50587 Points -5%
AMD Radeon RX 6800 XT
AMD Ryzen 9 5950X, AMD Radeon RX 6800 XT
49735 Points -6%
Average NVIDIA GeForce RTX 3080 Ti
  (45785 - 48709, n=4)
47180 Points -11%
Average NVIDIA GeForce RTX 3090
  (41298 - 49282, n=16)
46854 Points -12%
NVIDIA GeForce RTX 3080 Ti Founders Edition
AMD Ryzen 7 5800X, NVIDIA GeForce RTX 3080 Ti
45785 Points -14%
Nvidia GeForce RTX 3090 Founders Edition
AMD Ryzen 9 5900X, NVIDIA GeForce RTX 3090
41298 Points -22%
Average NVIDIA GeForce RTX 3080
  (37604 - 40910, n=2)
39257 Points -26%
Average NVIDIA Titan RTX
  (33377 - 40910, n=30)
36062 Points -32%
Average NVIDIA GeForce RTX 2080 Ti (Desktop)
  (32081 - 35851, n=4)
34141 Points -36%
Zotac Gaming GeForce RTX 3070 Twin Edge
AMD Ryzen 9 5950X, NVIDIA GeForce RTX 3070
31252 Points -41%
Average NVIDIA GeForce RTX 3070
  (20357 - 33270, n=7)
28949 Points -45%
NVIDIA GeForce RTX 3060 Ti Founders Edition
AMD Ryzen 9 5950X, NVIDIA GeForce RTX 3060 Ti
28145 Points -47%
Fire Strike Extreme Graphics
Zotac Gaming GeForce RTX 3090 Ti AMP Extreme Holo
AMD Ryzen 7 5800X3D, NVIDIA GeForce RTX 3090 Ti
26797 Points
AMD Radeon RX 6900 XT
AMD Ryzen 9 5950X, AMD Radeon RX 6900 XT
26650 Points -1%
AMD Radeon RX 6800 XT
AMD Ryzen 9 5950X, AMD Radeon RX 6800 XT
25015 Points -7%
Average NVIDIA GeForce RTX 3090
  (22075 - 24730, n=13)
23822 Points -11%
Average NVIDIA GeForce RTX 3080 Ti
  (23127 - 24250, n=4)
23668 Points -12%
NVIDIA GeForce RTX 3080 Ti Founders Edition
AMD Ryzen 7 5800X, NVIDIA GeForce RTX 3080 Ti
23127 Points -14%
Nvidia GeForce RTX 3090 Founders Edition
AMD Ryzen 9 5900X, NVIDIA GeForce RTX 3090
22075 Points -18%
Average NVIDIA GeForce RTX 3080
  (20007 - 20861, n=2)
20434 Points -24%
Average NVIDIA Titan RTX
  (16484 - 20861, n=29)
17649 Points -34%
Average NVIDIA GeForce RTX 2080 Ti (Desktop)
  (15603 - 16856, n=3)
16416 Points -39%
Average NVIDIA GeForce RTX 3070
  (15503 - 16276, n=5)
15859 Points -41%
Zotac Gaming GeForce RTX 3070 Twin Edge
AMD Ryzen 9 5950X, NVIDIA GeForce RTX 3070
15503 Points -42%
NVIDIA GeForce RTX 3060 Ti Founders Edition
AMD Ryzen 9 5950X, NVIDIA GeForce RTX 3060 Ti
13898 Points -48%
3840x2160 Fire Strike Ultra Graphics
Zotac Gaming GeForce RTX 3090 Ti AMP Extreme Holo
AMD Ryzen 7 5800X3D, NVIDIA GeForce RTX 3090 Ti
14026 Points
AMD Radeon RX 6900 XT
AMD Ryzen 9 5950X, AMD Radeon RX 6900 XT
13370 Points -5%
AMD Radeon RX 6800 XT
AMD Ryzen 9 5950X, AMD Radeon RX 6800 XT
12626 Points -10%
Average NVIDIA GeForce RTX 3090
  (11613 - 12587, n=13)
12305 Points -12%
Average NVIDIA GeForce RTX 3080 Ti
  (12050 - 12341, n=4)
12173 Points -13%
NVIDIA GeForce RTX 3080 Ti Founders Edition
AMD Ryzen 7 5800X, NVIDIA GeForce RTX 3080 Ti
12074 Points -14%
Nvidia GeForce RTX 3090 Founders Edition
AMD Ryzen 9 5900X, NVIDIA GeForce RTX 3090
11613 Points -17%
Average NVIDIA GeForce RTX 3080
  (10645 - 10793, n=2)
10719 Points -24%
Average NVIDIA Titan RTX
  (8461 - 10793, n=29)
8868 Points -37%
Average NVIDIA GeForce RTX 3070
  (8043 - 8483, n=5)
8250 Points -41%
Average NVIDIA GeForce RTX 2080 Ti (Desktop)
  (7925 - 8504, n=4)
8226 Points -41%
Zotac Gaming GeForce RTX 3070 Twin Edge
AMD Ryzen 9 5950X, NVIDIA GeForce RTX 3070
8043 Points -43%
NVIDIA GeForce RTX 3060 Ti Founders Edition
AMD Ryzen 9 5950X, NVIDIA GeForce RTX 3060 Ti
7126 Points -49%
2560x1440 Time Spy Graphics
Zotac Gaming GeForce RTX 3090 Ti AMP Extreme Holo
AMD Ryzen 7 5800X3D, NVIDIA GeForce RTX 3090 Ti
21645 Points
Average NVIDIA GeForce RTX 3090
  (18685 - 20433, n=16)
19254 Points -11%
Average NVIDIA GeForce RTX 3080 Ti
  (19041 - 19460, n=4)
19237 Points -11%
NVIDIA GeForce RTX 3080 Ti Founders Edition
AMD Ryzen 7 5800X, NVIDIA GeForce RTX 3080 Ti
19081 Points -12%
Nvidia GeForce RTX 3090 Founders Edition
AMD Ryzen 9 5900X, NVIDIA GeForce RTX 3090
18685 Points -14%
AMD Radeon RX 6900 XT
AMD Ryzen 9 5950X, AMD Radeon RX 6900 XT
18210 Points -16%
AMD Radeon RX 6800 XT
AMD Ryzen 9 5950X, AMD Radeon RX 6800 XT
17603 Points -19%
Average NVIDIA GeForce RTX 3080
  (17467 - 17604, n=2)
17536 Points -19%
Average NVIDIA Titan RTX
  (14216 - 15283, n=29)
14884 Points -31%
Average NVIDIA GeForce RTX 2080 Ti (Desktop)
  (13744 - 14645, n=4)
14283 Points -34%
Zotac Gaming GeForce RTX 3070 Twin Edge
AMD Ryzen 9 5950X, NVIDIA GeForce RTX 3070
13024 Points -40%
Average NVIDIA GeForce RTX 3070
  (11043 - 13579, n=7)
12616 Points -42%
NVIDIA GeForce RTX 3060 Ti Founders Edition
AMD Ryzen 9 5950X, NVIDIA GeForce RTX 3060 Ti
11590 Points -46%
Unigine Heaven 4.0
Extreme Preset DX11
Zotac Gaming GeForce RTX 3090 Ti AMP Extreme Holo
AMD Ryzen 7 5800X3D, NVIDIA GeForce RTX 3090 Ti
308.5 (9.7min - 627.1max) fps
Average NVIDIA GeForce RTX 3080 Ti
  (290 - 312, n=4)
300 fps -3%
Average NVIDIA GeForce RTX 3090
  (272 - 315, n=10)
299 fps -3%
NVIDIA GeForce RTX 3080 Ti Founders Edition
AMD Ryzen 7 5800X, NVIDIA GeForce RTX 3080 Ti
290.2 (50.9min - 582.7max) fps -6%
Nvidia GeForce RTX 3090 Founders Edition
AMD Ryzen 9 5900X, NVIDIA GeForce RTX 3090
274 fps -11%
AMD Radeon RX 6900 XT
AMD Ryzen 9 5950X, AMD Radeon RX 6900 XT
259.5 (49.3min - 537.2max) fps -16%
AMD Radeon RX 6800 XT
AMD Ryzen 9 5950X, AMD Radeon RX 6800 XT
247.9 fps -20%
Average NVIDIA GeForce RTX 3080
  (233 - 253, n=2)
243 fps -21%
Average NVIDIA Titan RTX
  (207 - 248, n=12)
236 fps -24%
Average NVIDIA GeForce RTX 2080 Ti (Desktop)
  (215 - 226, n=3)
222 fps -28%
Zotac Gaming GeForce RTX 3070 Twin Edge
AMD Ryzen 9 5950X, NVIDIA GeForce RTX 3070
213.7 fps -31%
Average NVIDIA GeForce RTX 3070
  (196.4 - 214, n=5)
206 fps -33%
NVIDIA GeForce RTX 3060 Ti Founders Edition
AMD Ryzen 9 5950X, NVIDIA GeForce RTX 3060 Ti
188.6 (43.6min - 434.5max) fps -39%
Extreme Preset OpenGL
Zotac Gaming GeForce RTX 3090 Ti AMP Extreme Holo
AMD Ryzen 7 5800X3D, NVIDIA GeForce RTX 3090 Ti
292.5 (11.4min - 577.9max) fps
Average NVIDIA GeForce RTX 3080 Ti
  (264 - 282, n=4)
274 fps -6%
Average NVIDIA GeForce RTX 3090
  (188.2 - 284, n=9)
268 fps -8%
NVIDIA GeForce RTX 3080 Ti Founders Edition
AMD Ryzen 7 5800X, NVIDIA GeForce RTX 3080 Ti
263.6 (12.2min - 543.3max) fps -10%
Average NVIDIA GeForce RTX 3080
  (232 - 243, n=2)
238 fps -19%
Average NVIDIA Titan RTX
  (203 - 299, n=12)
223 fps -24%
AMD Radeon RX 6900 XT
AMD Ryzen 9 5950X, AMD Radeon RX 6900 XT
206.5 (8.2min - 453.7max) fps -29%
Average NVIDIA GeForce RTX 2080 Ti (Desktop)
  (202 - 213, n=3)
206 fps -30%
AMD Radeon RX 6800 XT
AMD Ryzen 9 5950X, AMD Radeon RX 6800 XT
204 fps -30%
Average NVIDIA GeForce RTX 3070
  (187.5 - 196.1, n=4)
192.5 fps -34%
Nvidia GeForce RTX 3090 Founders Edition
AMD Ryzen 9 5900X, NVIDIA GeForce RTX 3090
188.2 fps -36%
NVIDIA GeForce RTX 3060 Ti Founders Edition
AMD Ryzen 9 5950X, NVIDIA GeForce RTX 3060 Ti
172.3 (11.4min - 371.5max) fps -41%
Unigine Valley 1.0
1920x1080 Extreme HD DirectX AA:x8
Average NVIDIA GeForce RTX 3080 Ti
  (206 - 240, n=4)
228 fps +13%
Average NVIDIA GeForce RTX 3090
  (184.2 - 245, n=10)
223 fps +11%
NVIDIA GeForce RTX 3080 Ti Founders Edition
AMD Ryzen 7 5800X, NVIDIA GeForce RTX 3080 Ti
206 (51.6min - 350.7max) fps +2%
Zotac Gaming GeForce RTX 3090 Ti AMP Extreme Holo
AMD Ryzen 7 5800X3D, NVIDIA GeForce RTX 3090 Ti
201.7 (48.5min - 338.7max) fps
AMD Radeon RX 6900 XT
AMD Ryzen 9 5950X, AMD Radeon RX 6900 XT
200.8 (53.4min - 359.1max) fps 0%
Nvidia GeForce RTX 3090 Founders Edition
AMD Ryzen 9 5900X, NVIDIA GeForce RTX 3090
192.4 fps -5%
AMD Radeon RX 6800 XT
AMD Ryzen 9 5950X, AMD Radeon RX 6800 XT
190.6 fps -6%
Average NVIDIA GeForce RTX 3080
  (176.2 - 181.8, n=2)
179 fps -11%
Average NVIDIA Titan RTX
  (135 - 191.4, n=12)
173.3 fps -14%
Zotac Gaming GeForce RTX 3070 Twin Edge
AMD Ryzen 9 5950X, NVIDIA GeForce RTX 3070
168.1 fps -17%
Average NVIDIA GeForce RTX 2080 Ti (Desktop)
  (159.4 - 164.1, n=3)
162.2 fps -20%
Average NVIDIA GeForce RTX 3070
  (155.1 - 168.5, n=5)
161.2 fps -20%
NVIDIA GeForce RTX 3060 Ti Founders Edition
AMD Ryzen 9 5950X, NVIDIA GeForce RTX 3060 Ti
153.2 (48.2min - 297.9max) fps -24%
1920x1080 Extreme HD Preset OpenGL AA:x8
Zotac Gaming GeForce RTX 3090 Ti AMP Extreme Holo
AMD Ryzen 7 5800X3D, NVIDIA GeForce RTX 3090 Ti
208.4 (49.3min - 353max) fps
Average NVIDIA GeForce RTX 3080 Ti
  (195.1 - 210, n=4)
204 fps -2%
Average NVIDIA GeForce RTX 3090
  (158.8 - 211, n=9)
201 fps -4%
NVIDIA GeForce RTX 3080 Ti Founders Edition
AMD Ryzen 7 5800X, NVIDIA GeForce RTX 3080 Ti
195.1 (46.1min - 342.7max) fps -6%
Average NVIDIA GeForce RTX 3080
  (163.8 - 172, n=2)
167.9 fps -19%
AMD Radeon RX 6900 XT
AMD Ryzen 9 5950X, AMD Radeon RX 6900 XT
167.4 (56.7min - 375.7max) fps -20%
Nvidia GeForce RTX 3090 Founders Edition
AMD Ryzen 9 5900X, NVIDIA GeForce RTX 3090
158.8 fps -24%
AMD Radeon RX 6800 XT
AMD Ryzen 9 5950X, AMD Radeon RX 6800 XT
158.2 fps -24%
Average NVIDIA Titan RTX
  (139.2 - 181.2, n=12)
158.1 fps -24%
Average NVIDIA GeForce RTX 2080 Ti (Desktop)
  (144.5 - 147.8, n=3)
145.8 fps -30%
Average NVIDIA GeForce RTX 3070
  (140.2 - 144.9, n=4)
142.7 fps -32%
NVIDIA GeForce RTX 3060 Ti Founders Edition
AMD Ryzen 9 5950X, NVIDIA GeForce RTX 3060 Ti
132.9 (48.3min - 236.1max) fps -36%
Unigine Superposition
1280x720 720p Low
Average NVIDIA GeForce RTX 3080 Ti
  (43163 - 50738, n=4)
47400 Points +4%
Zotac Gaming GeForce RTX 3090 Ti AMP Extreme Holo
AMD Ryzen 7 5800X3D, NVIDIA GeForce RTX 3090 Ti
45444 Points
Average NVIDIA GeForce RTX 3090
  (33329 - 54879, n=9)
45093 Points -1%
NVIDIA GeForce RTX 3080 Ti Founders Edition
AMD Ryzen 7 5800X, NVIDIA GeForce RTX 3080 Ti
43163 Points -5%
Average NVIDIA Titan RTX
  (25622 - 50876, n=9)
40891 Points -10%
Zotac Gaming GeForce RTX 3070 Twin Edge
AMD Ryzen 9 5950X, NVIDIA GeForce RTX 3070
39277 Points -14%
NVIDIA GeForce RTX 3060 Ti Founders Edition
AMD Ryzen 9 5950X, NVIDIA GeForce RTX 3060 Ti
38414 Points -15%
AMD Radeon RX 6900 XT
AMD Ryzen 9 5950X, AMD Radeon RX 6900 XT
37023 Points -19%
AMD Radeon RX 6800 XT
AMD Ryzen 9 5950X, AMD Radeon RX 6800 XT
36452 Points -20%
Nvidia GeForce RTX 3090 Founders Edition
AMD Ryzen 9 5900X, NVIDIA GeForce RTX 3090
34649 Points -24%
Average NVIDIA GeForce RTX 3070
  (27330 - 40007, n=5)
34576 Points -24%
Average NVIDIA GeForce RTX 3080
  (30851 - 32183, n=2)
31517 Points -31%
1920x1080 1080p High
Zotac Gaming GeForce RTX 3090 Ti AMP Extreme Holo
AMD Ryzen 7 5800X3D, NVIDIA GeForce RTX 3090 Ti
29422 Points
Average NVIDIA GeForce RTX 3080 Ti
  (24997 - 26711, n=4)
26008 Points -12%
Average NVIDIA GeForce RTX 3090
  (23626 - 27207, n=10)
25978 Points -12%
AMD Radeon RX 6900 XT
AMD Ryzen 9 5950X, AMD Radeon RX 6900 XT
25029 Points -15%
NVIDIA GeForce RTX 3080 Ti Founders Edition
AMD Ryzen 7 5800X, NVIDIA GeForce RTX 3080 Ti
24997 Points -15%
Nvidia GeForce RTX 3090 Founders Edition
AMD Ryzen 9 5900X, NVIDIA GeForce RTX 3090
23853 Points -19%
AMD Radeon RX 6800 XT
AMD Ryzen 9 5950X, AMD Radeon RX 6800 XT
22265 Points -24%
Average NVIDIA GeForce RTX 3080
  (21333 - 21912, n=2)
21623 Points -27%
Average NVIDIA Titan RTX
  (19460 - 20658, n=9)
20301 Points -31%
Zotac Gaming GeForce RTX 3070 Twin Edge
AMD Ryzen 9 5950X, NVIDIA GeForce RTX 3070
17491 Points -41%
Average NVIDIA GeForce RTX 3070
  (17054 - 17491, n=5)
17312 Points -41%
NVIDIA GeForce RTX 3060 Ti Founders Edition
AMD Ryzen 9 5950X, NVIDIA GeForce RTX 3060 Ti
15479 Points -47%
1920x1080 1080p Extreme
Zotac Gaming GeForce RTX 3090 Ti AMP Extreme Holo
AMD Ryzen 7 5800X3D, NVIDIA GeForce RTX 3090 Ti
13803 Points
Average NVIDIA GeForce RTX 3090
  (11806 - 12694, n=10)
12227 Points -11%
Average NVIDIA GeForce RTX 3080 Ti
  (12038 - 12347, n=4)
12139 Points -12%
NVIDIA GeForce RTX 3080 Ti Founders Edition
AMD Ryzen 7 5800X, NVIDIA GeForce RTX 3080 Ti
12038 Points -13%
Nvidia GeForce RTX 3090 Founders Edition
AMD Ryzen 9 5900X, NVIDIA GeForce RTX 3090
11806 Points -14%
Average NVIDIA GeForce RTX 3080
  (10572 - 10822, n=2)
10697 Points -23%
AMD Radeon RX 6900 XT
AMD Ryzen 9 5950X, AMD Radeon RX 6900 XT
10683 Points -23%
AMD Radeon RX 6800 XT
AMD Ryzen 9 5950X, AMD Radeon RX 6800 XT
10046 Points -27%
Average NVIDIA Titan RTX
  (8916 - 9285, n=9)
9051 Points -34%
Average NVIDIA GeForce RTX 3070
  (8276 - 8507, n=5)
8354 Points -39%
Zotac Gaming GeForce RTX 3070 Twin Edge
AMD Ryzen 9 5950X, NVIDIA GeForce RTX 3070
8336 Points -40%
NVIDIA GeForce RTX 3060 Ti Founders Edition
AMD Ryzen 9 5950X, NVIDIA GeForce RTX 3060 Ti
7142 Points -48%
3840x2160 4k Optimized
Zotac Gaming GeForce RTX 3090 Ti AMP Extreme Holo
AMD Ryzen 7 5800X3D, NVIDIA GeForce RTX 3090 Ti
18426 Points
Average NVIDIA GeForce RTX 3090
  (15794 - 16868, n=10)
16352 Points -11%
Average NVIDIA GeForce RTX 3080 Ti
  (16108 - 16412, n=4)
16199 Points -12%
NVIDIA GeForce RTX 3080 Ti Founders Edition
AMD Ryzen 7 5800X, NVIDIA GeForce RTX 3080 Ti
16153 Points -12%
Nvidia GeForce RTX 3090 Founders Edition
AMD Ryzen 9 5900X, NVIDIA GeForce RTX 3090
15794 Points -14%
AMD Radeon RX 6900 XT
AMD Ryzen 9 5950X, AMD Radeon RX 6900 XT
14955 Points -19%
Average NVIDIA GeForce RTX 3080
  (13984 - 14243, n=2)
14114 Points -23%
AMD Radeon RX 6800 XT
AMD Ryzen 9 5950X, AMD Radeon RX 6800 XT
13471 Points -27%
Average NVIDIA Titan RTX
  (11937 - 12644, n=9)
12203 Points -34%
Zotac Gaming GeForce RTX 3070 Twin Edge
AMD Ryzen 9 5950X, NVIDIA GeForce RTX 3070
10704 Points -42%
Average NVIDIA GeForce RTX 3070
  (10544 - 10755, n=5)
10667 Points -42%
NVIDIA GeForce RTX 3060 Ti Founders Edition
AMD Ryzen 9 5950X, NVIDIA GeForce RTX 3060 Ti
9224 Points -50%
7680x4320 8k Optimized
Zotac Gaming GeForce RTX 3090 Ti AMP Extreme Holo
AMD Ryzen 7 5800X3D, NVIDIA GeForce RTX 3090 Ti
8213 Points
Average NVIDIA GeForce RTX 3090
  (6969 - 7521, n=10)
7160 Points -13%
NVIDIA GeForce RTX 3080 Ti Founders Edition
AMD Ryzen 7 5800X, NVIDIA GeForce RTX 3080 Ti
7095 Points -14%
Average NVIDIA GeForce RTX 3080 Ti
  (6920 - 7161, n=4)
7070 Points -14%
Nvidia GeForce RTX 3090 Founders Edition
AMD Ryzen 9 5900X, NVIDIA GeForce RTX 3090
7002 Points -15%
Average NVIDIA GeForce RTX 3080
  (6243 - 6346, n=2)
6295 Points -23%
AMD Radeon RX 6900 XT
AMD Ryzen 9 5950X, AMD Radeon RX 6900 XT
5764 Points -30%
Average NVIDIA Titan RTX
  (5255 - 5571, n=9)
5393 Points -34%
AMD Radeon RX 6800 XT
AMD Ryzen 9 5950X, AMD Radeon RX 6800 XT
5256 Points -36%
Average NVIDIA GeForce RTX 3070
  (4587 - 4695, n=5)
4624 Points -44%
Zotac Gaming GeForce RTX 3070 Twin Edge
AMD Ryzen 9 5950X, NVIDIA GeForce RTX 3070
4602 Points -44%
NVIDIA GeForce RTX 3060 Ti Founders Edition
AMD Ryzen 9 5950X, NVIDIA GeForce RTX 3060 Ti
4056 Points -51%
3DMark 11 Performance
49471 points
3DMark Ice Storm Standard Score
233264 points
3DMark Cloud Gate Standard Score
75753 points
3DMark Fire Strike Score
36563 points
3DMark Fire Strike Extreme Score
24198 points
3DMark Time Spy Score
19241 points
Help

Compute benchmarks: RTX 3090 Ti inches past previous Nvidia flagships

Compute benchmarks see perceivable gains over the RTX 3080 Ti Founders Edition and the average RTX 3090. The RTX 3090 Ti shows good leads over the RTX 3090 in Geekbench 5.3 Vulkan as well as in V-Ray 5 CUDA and RTX benchmarks. Interestingly, the advantage over an RTX 3080 Ti seems quite small.

Both the Radeon RX 6900 XT and the RX 6800 XT trail behind the RTX 3090 Ti in most compute tests except for LuxMark 2.0 Sala GPU where the AMD cards consistently show big gains compared to their Nvidia competitors.

ComputeMark v2.1
1024x600 Normal, Score
Zotac Gaming GeForce RTX 3090 Ti AMP Extreme Holo
AMD Ryzen 7 5800X3D, NVIDIA GeForce RTX 3090 Ti
52258 Points
Average NVIDIA GeForce RTX 3080 Ti
  (47377 - 48892, n=4)
48266 Points -8%
Average NVIDIA GeForce RTX 3090
  (44948 - 49118, n=8)
47736 Points -9%
NVIDIA GeForce RTX 3080 Ti Founders Edition
AMD Ryzen 7 5800X, NVIDIA GeForce RTX 3080 Ti
47377 Points -9%
Nvidia GeForce RTX 3090 Founders Edition
AMD Ryzen 9 5900X, NVIDIA GeForce RTX 3090
46018 Points -12%
AMD Radeon RX 6900 XT
AMD Ryzen 9 5950X, AMD Radeon RX 6900 XT
40857 Points -22%
Average NVIDIA GeForce RTX 3080
  (39924 - 41594, n=2)
40759 Points -22%
AMD Radeon RX 6800 XT
AMD Ryzen 9 5950X, AMD Radeon RX 6800 XT
38823 Points -26%
Average NVIDIA GeForce RTX 3070
  (29330 - 30581, n=3)
30004 Points -43%
Average NVIDIA Titan RTX
  (27907 - 29830, n=3)
28802 Points -45%
Average NVIDIA GeForce RTX 2080 Ti (Desktop)
  (26510 - 28145, n=3)
27567 Points -47%
NVIDIA GeForce RTX 3060 Ti Founders Edition
AMD Ryzen 9 5950X, NVIDIA GeForce RTX 3060 Ti
26245 Points -50%
1024x600 Normal, Fluid 3DTex
Zotac Gaming GeForce RTX 3090 Ti AMP Extreme Holo
AMD Ryzen 7 5800X3D, NVIDIA GeForce RTX 3090 Ti
5764 Points
Average NVIDIA GeForce RTX 3090
  (5246 - 5520, n=9)
5444 Points -6%
Average NVIDIA GeForce RTX 3080 Ti
  (5312 - 5422, n=4)
5368 Points -7%
NVIDIA GeForce RTX 3080 Ti Founders Edition
AMD Ryzen 7 5800X, NVIDIA GeForce RTX 3080 Ti
5312 Points -8%
Nvidia GeForce RTX 3090 Founders Edition
AMD Ryzen 9 5900X, NVIDIA GeForce RTX 3090
5246 Points -9%
AMD Radeon RX 6800 XT
AMD Ryzen 9 5950X, AMD Radeon RX 6800 XT
5154 Points -11%
AMD Radeon RX 6900 XT
AMD Ryzen 9 5950X, AMD Radeon RX 6900 XT
5154 Points -11%
Average NVIDIA GeForce RTX 3080
  (4417 - 4450, n=2)
4434 Points -23%
Average NVIDIA Titan RTX
  (3877 - 4027, n=3)
3955 Points -31%
Average NVIDIA GeForce RTX 2080 Ti (Desktop)
  (3589 - 3653, n=3)
3625 Points -37%
Average NVIDIA GeForce RTX 3070
  (2749 - 2791, n=3)
2772 Points -52%
NVIDIA GeForce RTX 3060 Ti Founders Edition
AMD Ryzen 9 5950X, NVIDIA GeForce RTX 3060 Ti
2685 Points -53%
1024x600 Normal, Fluid 2DTexArr
Zotac Gaming GeForce RTX 3090 Ti AMP Extreme Holo
AMD Ryzen 7 5800X3D, NVIDIA GeForce RTX 3090 Ti
4886 Points
Average NVIDIA GeForce RTX 3080 Ti
  (4453 - 4546, n=4)
4498 Points -8%
Average NVIDIA GeForce RTX 3090
  (4344 - 4608, n=9)
4497 Points -8%
NVIDIA GeForce RTX 3080 Ti Founders Edition
AMD Ryzen 7 5800X, NVIDIA GeForce RTX 3080 Ti
4453 Points -9%
Nvidia GeForce RTX 3090 Founders Edition
AMD Ryzen 9 5900X, NVIDIA GeForce RTX 3090
4344 Points -11%
Average NVIDIA GeForce RTX 3080
  (4087 - 4159, n=2)
4123 Points -16%
AMD Radeon RX 6800 XT
AMD Ryzen 9 5950X, AMD Radeon RX 6800 XT
3947 Points -19%
AMD Radeon RX 6900 XT
AMD Ryzen 9 5950X, AMD Radeon RX 6900 XT
3924 Points -20%
Average NVIDIA Titan RTX
  (3691 - 3828, n=3)
3757 Points -23%
Average NVIDIA GeForce RTX 2080 Ti (Desktop)
  (3444 - 3539, n=3)
3499 Points -28%
Average NVIDIA GeForce RTX 3070
  (2666 - 2706, n=3)
2692 Points -45%
NVIDIA GeForce RTX 3060 Ti Founders Edition
AMD Ryzen 9 5950X, NVIDIA GeForce RTX 3060 Ti
2619 Points -46%
1024x600 Normal, Mandel Vector
Zotac Gaming GeForce RTX 3090 Ti AMP Extreme Holo
AMD Ryzen 7 5800X3D, NVIDIA GeForce RTX 3090 Ti
10652 Points
Average NVIDIA GeForce RTX 3080 Ti
  (9513 - 9860, n=4)
9730 Points -9%
NVIDIA GeForce RTX 3080 Ti Founders Edition
AMD Ryzen 7 5800X, NVIDIA GeForce RTX 3080 Ti
9513 Points -11%
Average NVIDIA GeForce RTX 3090
  (8038 - 10097, n=9)
9437 Points -11%
Nvidia GeForce RTX 3090 Founders Edition
AMD Ryzen 9 5900X, NVIDIA GeForce RTX 3090
9236 Points -13%
AMD Radeon RX 6900 XT
AMD Ryzen 9 5950X, AMD Radeon RX 6900 XT
8690 Points -18%
AMD Radeon RX 6800 XT
AMD Ryzen 9 5950X, AMD Radeon RX 6800 XT
8399 Points -21%
Average NVIDIA GeForce RTX 3080
  (7148 - 7540, n=2)
7344 Points -31%
Average NVIDIA GeForce RTX 3070
  (5364 - 6266, n=3)
5707 Points -46%
Average NVIDIA Titan RTX
  (4944 - 5440, n=3)
5158 Points -52%
Average NVIDIA GeForce RTX 2080 Ti (Desktop)
  (4695 - 5092, n=3)
4941 Points -54%
NVIDIA GeForce RTX 3060 Ti Founders Edition
AMD Ryzen 9 5950X, NVIDIA GeForce RTX 3060 Ti
4782 Points -55%
1024x600 Normal, Mandel Scalar
Zotac Gaming GeForce RTX 3090 Ti AMP Extreme Holo
AMD Ryzen 7 5800X3D, NVIDIA GeForce RTX 3090 Ti
12406 Points
Average NVIDIA GeForce RTX 3080 Ti
  (11049 - 11318, n=4)
11196 Points -10%
Average NVIDIA GeForce RTX 3090
  (10650 - 11564, n=9)
11171 Points -10%
NVIDIA GeForce RTX 3080 Ti Founders Edition
AMD Ryzen 7 5800X, NVIDIA GeForce RTX 3080 Ti
11049 Points -11%
AMD Radeon RX 6900 XT
AMD Ryzen 9 5950X, AMD Radeon RX 6900 XT
10834 Points -13%
Nvidia GeForce RTX 3090 Founders Edition
AMD Ryzen 9 5900X, NVIDIA GeForce RTX 3090
10650 Points -14%
AMD Radeon RX 6800 XT
AMD Ryzen 9 5950X, AMD Radeon RX 6800 XT
10018 Points -19%
Average NVIDIA GeForce RTX 3080
  (9554 - 9938, n=2)
9746 Points -21%
Average NVIDIA GeForce RTX 3070
  (7042 - 7314, n=3)
7169 Points -42%
Average NVIDIA Titan RTX
  (5977 - 6406, n=3)
6184 Points -50%
NVIDIA GeForce RTX 3060 Ti Founders Edition
AMD Ryzen 9 5950X, NVIDIA GeForce RTX 3060 Ti
6087 Points -51%
Average NVIDIA GeForce RTX 2080 Ti (Desktop)
  (5679 - 6226, n=3)
6010 Points -52%
1024x600 Normal, QJuliaRayTrace
Zotac Gaming GeForce RTX 3090 Ti AMP Extreme Holo
AMD Ryzen 7 5800X3D, NVIDIA GeForce RTX 3090 Ti
18550 Points
Average NVIDIA GeForce RTX 3080 Ti
  (17050 - 17749, n=4)
17475 Points -6%
Average NVIDIA GeForce RTX 3090
  (16403 - 18223, n=9)
17439 Points -6%
NVIDIA GeForce RTX 3080 Ti Founders Edition
AMD Ryzen 7 5800X, NVIDIA GeForce RTX 3080 Ti
17050 Points -8%
Nvidia GeForce RTX 3090 Founders Edition
AMD Ryzen 9 5900X, NVIDIA GeForce RTX 3090
16543 Points -11%
Average NVIDIA GeForce RTX 3080
  (14718 - 15508, n=2)
15113 Points -19%
AMD Radeon RX 6900 XT
AMD Ryzen 9 5950X, AMD Radeon RX 6900 XT
12255 Points -34%
Average NVIDIA GeForce RTX 3070
  (11510 - 11816, n=3)
11665 Points -37%
AMD Radeon RX 6800 XT
AMD Ryzen 9 5950X, AMD Radeon RX 6800 XT
11304 Points -39%
NVIDIA GeForce RTX 3060 Ti Founders Edition
AMD Ryzen 9 5950X, NVIDIA GeForce RTX 3060 Ti
10072 Points -46%
Average NVIDIA Titan RTX
  (9418 - 10129, n=3)
9748 Points -47%
Average NVIDIA GeForce RTX 2080 Ti (Desktop)
  (9104 - 9690, n=3)
9492 Points -49%
LuxMark v2.0 64Bit
Room GPUs-only
Zotac Gaming GeForce RTX 3090 Ti AMP Extreme Holo
AMD Ryzen 7 5800X3D, NVIDIA GeForce RTX 3090 Ti
6221 Samples/s
Average NVIDIA GeForce RTX 3080 Ti
  (5772 - 6464, n=4)
6138 Samples/s -1%
Average NVIDIA GeForce RTX 3090
  (5727 - 5974, n=8)
5881 Samples/s -5%
Nvidia GeForce RTX 3090 Founders Edition
AMD Ryzen 9 5900X, NVIDIA GeForce RTX 3090
5808 Samples/s -7%
NVIDIA GeForce RTX 3080 Ti Founders Edition
AMD Ryzen 7 5800X, NVIDIA GeForce RTX 3080 Ti
5772 Samples/s -7%
Average NVIDIA GeForce RTX 3080
  (5112 - 5198, n=2)
5155 Samples/s -17%
AMD Radeon RX 6900 XT
AMD Ryzen 9 5950X, AMD Radeon RX 6900 XT
5084 Samples/s -18%
AMD Radeon RX 6800 XT
AMD Ryzen 9 5950X, AMD Radeon RX 6800 XT
5057 Samples/s -19%
Average NVIDIA Titan RTX
  (4643 - 4703, n=2)
4673 Samples/s -25%
Average NVIDIA GeForce RTX 2080 Ti (Desktop)
  (4425 - 4494, n=3)
4449 Samples/s -28%
NVIDIA GeForce RTX 3060 Ti Founders Edition
AMD Ryzen 9 5950X, NVIDIA GeForce RTX 3060 Ti
4046 Samples/s -35%
Average NVIDIA GeForce RTX 3070
  (2187 - 4293, n=3)
3588 Samples/s -42%
Sala GPUs-only
AMD Radeon RX 6900 XT
AMD Ryzen 9 5950X, AMD Radeon RX 6900 XT
31400 Samples/s +96%
AMD Radeon RX 6800 XT
AMD Ryzen 9 5950X, AMD Radeon RX 6800 XT
28023 Samples/s +75%
Zotac Gaming GeForce RTX 3090 Ti AMP Extreme Holo
AMD Ryzen 7 5800X3D, NVIDIA GeForce RTX 3090 Ti
16046 Samples/s
Average NVIDIA GeForce RTX 3080 Ti
  (14871 - 16438, n=4)
15612 Samples/s -3%
Average NVIDIA GeForce RTX 3090
  (14590 - 15088, n=8)
14908 Samples/s -7%
NVIDIA GeForce RTX 3080 Ti Founders Edition
AMD Ryzen 7 5800X, NVIDIA GeForce RTX 3080 Ti
14871 Samples/s -7%
Nvidia GeForce RTX 3090 Founders Edition
AMD Ryzen 9 5900X, NVIDIA GeForce RTX 3090
14670 Samples/s -9%
Average NVIDIA GeForce RTX 3080
  (12797 - 12980, n=2)
12889 Samples/s -20%
Average NVIDIA Titan RTX
  (10799 - 10996, n=2)
10898 Samples/s -32%
Average NVIDIA GeForce RTX 2080 Ti (Desktop)
  (9999 - 10291, n=3)
10156 Samples/s -37%
Average NVIDIA GeForce RTX 3070
  (10096 - 10115, n=3)
10107 Samples/s -37%
NVIDIA GeForce RTX 3060 Ti Founders Edition
AMD Ryzen 9 5950X, NVIDIA GeForce RTX 3060 Ti
9010 Samples/s -44%
Geekbench 5.5
OpenCL Score
Zotac Gaming GeForce RTX 3090 Ti AMP Extreme Holo
AMD Ryzen 7 5800X3D, NVIDIA GeForce RTX 3090 Ti
235251 Points
Average NVIDIA GeForce RTX 3090
  (199930 - 224611, n=19)
214008 Points -9%
NVIDIA GeForce RTX 3080 Ti Founders Edition
AMD Ryzen 7 5800X, NVIDIA GeForce RTX 3080 Ti
213283 Points -9%
Average NVIDIA GeForce RTX 3080 Ti
  (204749 - 213283, n=3)
210244 Points -11%
Nvidia GeForce RTX 3090 Founders Edition
AMD Ryzen 9 5900X, NVIDIA GeForce RTX 3090
199930 Points -15%
Average NVIDIA GeForce RTX 3080
  (164477 - 192091, n=2)
178284 Points -24%
AMD Radeon RX 6900 XT
AMD Ryzen 9 5950X, AMD Radeon RX 6900 XT
172661 Points -27%
AMD Radeon RX 6800 XT
AMD Ryzen 9 5950X, AMD Radeon RX 6800 XT
159072 Points -32%
Average NVIDIA Titan RTX
  (132850 - 153940, n=20)
140450 Points -40%
Average NVIDIA GeForce RTX 3070
  (134961 - 138625, n=4)
136574 Points -42%
NVIDIA GeForce RTX 3060 Ti Founders Edition
AMD Ryzen 9 5950X, NVIDIA GeForce RTX 3060 Ti
123036 Points -48%
Vulkan Score
Zotac Gaming GeForce RTX 3090 Ti AMP Extreme Holo
AMD Ryzen 7 5800X3D, NVIDIA GeForce RTX 3090 Ti
199892 Points
NVIDIA GeForce RTX 3080 Ti Founders Edition
AMD Ryzen 7 5800X, NVIDIA GeForce RTX 3080 Ti
187800 Points -6%
Nvidia GeForce RTX 3090 Founders Edition
AMD Ryzen 9 5900X, NVIDIA GeForce RTX 3090
147831 Points -26%
Average NVIDIA GeForce RTX 3080 Ti
  (76347 - 187800, n=3)
134820 Points -33%
Average NVIDIA GeForce RTX 3090
  (62516 - 168974, n=19)
128422 Points -36%
Average NVIDIA Titan RTX
  (70085 - 138172, n=20)
92754 Points -54%
AMD Radeon RX 6900 XT
AMD Ryzen 9 5950X, AMD Radeon RX 6900 XT
88587 Points -56%
NVIDIA GeForce RTX 3060 Ti Founders Edition
AMD Ryzen 9 5950X, NVIDIA GeForce RTX 3060 Ti
88442 Points -56%
AMD Radeon RX 6800 XT
AMD Ryzen 9 5950X, AMD Radeon RX 6800 XT
81098 Points -59%
Average NVIDIA GeForce RTX 3080
  (76596 - 83486, n=2)
80041 Points -60%
Average NVIDIA GeForce RTX 3070
  (27460 - 107958, n=4)
71908 Points -64%
V-Ray 5 Benchmark
GPU CUDA
Zotac Gaming GeForce RTX 3090 Ti AMP Extreme Holo
AMD Ryzen 7 5800X3D, NVIDIA GeForce RTX 3090 Ti
2195 mpaths
Average NVIDIA GeForce RTX 3080 Ti
  (2045 - 2070, n=3)
2057 mpaths -6%
Average NVIDIA GeForce RTX 3090
  (1616 - 2131, n=14)
2019 mpaths -8%
Nvidia GeForce RTX 3090 Founders Edition
AMD Ryzen 9 5900X, NVIDIA GeForce RTX 3090
1616 mpaths -26%
Average NVIDIA GeForce RTX 3070
  (1109 - 1422, n=2)
1266 mpaths -42%
Average NVIDIA Titan RTX
  (668 - 1052, n=7)
910 mpaths -59%
GPU RTX
Zotac Gaming GeForce RTX 3090 Ti AMP Extreme Holo
AMD Ryzen 7 5800X3D, NVIDIA GeForce RTX 3090 Ti
2880 mpaths
Average NVIDIA GeForce RTX 3090
  (2551 - 2979, n=14)
2813 mpaths -2%
Average NVIDIA GeForce RTX 3080 Ti
  (2727 - 2883, n=3)
2784 mpaths -3%
Nvidia GeForce RTX 3090 Founders Edition
AMD Ryzen 9 5900X, NVIDIA GeForce RTX 3090
2551 mpaths -11%
Average NVIDIA GeForce RTX 3070
  (1610 - 1756, n=2)
1683 mpaths -42%
Average NVIDIA Titan RTX
  (1246 - 1348, n=7)
1299 mpaths -55%

Professional applications: RTX A5000 Laptop GPU clobbers the RTX 3090 Ti

Although the RTX 3090 Ti allows enabling ECC support in the driver, the card is still pretty much a gamer's card and not really a Titan or a Quadro. This is evident from SPECviewperf scores that show even a laptop Quadro RTX 5000 to have much better performance in these applications. The RTX A5000 Laptop GPU is able to perform even better while the Titan RTX still remains a great card if you are into 3D, CAD, CAM, medical, and the likes.

The RTX 3090 Ti is seen nowhere in sight when compared to its direct cousin on the professional side, the RTX A6000, which is also based on the exact GA102 GPU with all 10,752 CUDA cores enabled but with 48 GB VRAM. Therefore, while a fully enabled GA102 lends itself to some serious workstation prowess, it needs the right impetus from Nvidia in the form of certified professional drivers that the RTX 3090 Ti obviously lacks.

The delta with the RTX A5000 Laptop GPU narrows down somewhat in SPECviewperf 2020, which runs in 4K by default. The AMD Radeon RX 6900 XT leads the RTX 3090 Ti in all versions of SPECviewperf and can be a decent choice as well if you are looking for a non-Nvidia option.

Zotac RTX 3090 Ti AEH
AMD Ryzen 7 5800X3D
AMD Radeon RX 6900 XT
AMD Ryzen 9 5950X
NVIDIA GeForce RTX 3060 Ti Founders Edition
AMD Ryzen 9 5950X
GRANDO RM-S (1 Nvidia RTX A6000)
AMD Ryzen Threadripper PRO 3975WX
GRANDO RM-S (4 Nvidia RTX A6000)
AMD Ryzen Threadripper PRO 3975WX
Average NVIDIA GeForce RTX 3090
 
Average NVIDIA Titan RTX
 
Average NVIDIA GeForce RTX 3080 Ti
 
Average NVIDIA RTX A5000 Laptop GPU
 
Average NVIDIA Quadro RTX 5000 (Laptop)
 
SPECviewperf 12
48%
-28%
281%
259%
6%
198%
17%
128%
125%
1900x1060 Solidworks (sw-03)
85.7
167
95%
71.1
-17%
225
163%
208
143%
95.3 ?(71.4 - 108, n=10)
11%
163.9 ?(114.8 - 207, n=28)
91%
103.7 ?(100 - 106, n=3)
21%
168.2
96%
156.7 ?(120 - 230, n=3)
83%
1900x1060 Siemens NX (snx-02)
15.6
47.7
206%
12.3
-21%
351
2150%
333
2035%
15.9 ?(13 - 17.1, n=10)
2%
262 ?(228 - 297, n=28)
1579%
16.7 ?(16.5 - 17.1, n=3)
7%
167.3
972%
184 ?(145 - 258, n=3)
1079%
1900x1060 Showcase (showcase-01)
265
241
-9%
144
-46%
255
-4%
237
-11%
256 ?(236 - 269, n=10)
-3%
193.6 ?(185.7 - 203, n=28)
-27%
256 ?(252 - 264, n=3)
-3%
110.3
-58%
104.3 ?(93 - 126.4, n=3)
-61%
1900x1060 Medical (medical-01)
87.1
88.4
1%
59.4
-32%
159
83%
156
79%
87.9 ?(42.9 - 142, n=10)
1%
93.4 ?(83.9 - 124, n=28)
7%
124.8 ?(89.4 - 143, n=3)
43%
69.8
-20%
109.3
25%
1900x1060 Maya (maya-04)
197
151
-23%
197
0%
144
-27%
147
-25%
263 ?(170 - 322, n=10)
34%
182.2 ?(110.9 - 260, n=28)
-8%
294 ?(283 - 302, n=3)
49%
113.8
-42%
121.4 ?(90.2 - 179, n=3)
-38%
1900x1060 Energy (energy-01)
27.6
30.8
12%
13.9
-50%
39.8
44%
39.3
42%
25 ?(20.4 - 27.7, n=10)
-9%
28.6 ?(27.8 - 30.6, n=28)
4%
26.7 ?(24.9 - 27.6, n=3)
-3%
16.9
-39%
26
-6%
1900x1060 Creo (creo-01)
76.4
127
66%
57.8
-24%
136
78%
127
66%
88.6 ?(69.4 - 101, n=10)
16%
152.1 ?(106.3 - 202, n=28)
99%
96.3 ?(94.3 - 100, n=3)
26%
151.3
98%
144.4 ?(127 - 172.1, n=3)
89%
1900x1060 Catia (catia-04)
150
292
95%
109
-27%
229
53%
208
39%
159.3 ?(127 - 177, n=10)
6%
235 ?(146.7 - 354, n=28)
57%
172 ?(167 - 178, n=3)
15%
177.3
18%
159 ?(125 - 220, n=3)
6%
1900x1060 3ds Max (3dsmax-05)
371
318
-14%
252
-32%
336
-9%
245
-34%
362 ?(320 - 389, n=10)
-2%
283 ?(243 - 315, n=28)
-24%
373 ?(363 - 385, n=3)
1%
193.9 ?(172 - 236, n=3)
-48%
SPECviewperf 13
43%
-32%
279%
258%
-2%
180%
6%
94%
93%
Solidworks (sw-04)
118
214
81%
99.6
-16%
192
63%
191
62%
133.9 ?(82.9 - 155, n=10)
13%
167.9 ?(112.8 - 229, n=28)
42%
150.7 ?(146 - 153, n=3)
28%
151.3 ?(144.9 - 157.7, n=2)
28%
144.1 ?(118.6 - 204, n=4)
22%
Siemens NX (snx-03)
28
85.8
206%
22.3
-20%
638
2179%
604
2057%
27.6 ?(15.6 - 30.7, n=10)
-1%
474 ?(411 - 535, n=28)
1593%
30.1 ?(29.6 - 30.8, n=3)
8%
298 ?(276 - 319, n=2)
964%
307 ?(226 - 465, n=4)
996%
Showcase (showcase-02)
265
241
-9%
145
-45%
255
-4%
239
-10%
244 ?(114 - 268, n=10)
-8%
192.6 ?(184.3 - 199, n=28)
-27%
257 ?(252 - 264, n=3)
-3%
117.9 ?(103.8 - 131.9, n=2)
-56%
104.7 ?(92.4 - 127.1, n=4)
-60%
Medical (medical-02)
113
148
31%
72.2
-36%
184
63%
180
59%
100.7 ?(49.3 - 109, n=10)
-11%
90.3 ?(86.8 - 93.7, n=28)
-20%
106.3 ?(106 - 107, n=3)
-6%
114.3 ?(109.4 - 119.1, n=2)
1%
116.1 ?(98.8 - 133.4, n=2)
3%
Maya (maya-05)
493
395
-20%
344
-30%
415
-16%
405
-18%
515 ?(253 - 580, n=10)
4%
422 ?(292 - 530, n=28)
-14%
574 ?(567 - 586, n=3)
16%
235 ?(220 - 250, n=2)
-52%
235 ?(182.8 - 341, n=4)
-52%
Energy (energy-02)
48.4
60.6
25%
25.6
-47%
132
173%
128
164%
42.7 ?(26.6 - 45.2, n=10)
-12%
52.7 ?(51.8 - 53.9, n=28)
9%
41.4 ?(35.8 - 44.2, n=3)
-14%
63.8 ?(53.2 - 74.3, n=2)
32%
51.7 ?(46.1 - 57.3, n=2)
7%
Creo (creo-02)
353
292
-17%
225
-36%
366
4%
292
-17%
361 ?(176 - 403, n=10)
2%
342 ?(266 - 394, n=28)
-3%
398 ?(389 - 403, n=3)
13%
233 ?(214 - 252, n=2)
-34%
231 ?(185.4 - 320, n=4)
-35%
Catia (catia-05)
230
468
103%
161
-30%
371
61%
359
56%
229 ?(111 - 260, n=10)
0%
374 ?(222 - 546, n=28)
63%
251 ?(241 - 258, n=3)
9%
262 ?(243 - 281, n=2)
14%
239 ?(183.8 - 339, n=4)
4%
3ds Max (3dsmax-06)
373
317
-15%
252
-32%
338
-9%
247
-34%
346 ?(180 - 387, n=10)
-7%
282 ?(243 - 321, n=28)
-24%
372 ?(364 - 382, n=3)
0%
196 ?(183.8 - 208, n=2)
-47%
187.5 ?(168.7 - 232, n=4)
-50%
SPECviewperf 2020
21%
-37%
268%
182%
11%
194%
17%
71%
3840x2160 Solidworks (solidworks-05)
197
112
-43%
109
-45%
169
-14%
141
-28%
178 ?(93.1 - 194, n=8)
-10%
171.2 ?(153 - 336, n=12)
-13%
184
-7%
82.6 ?(72.8 - 92.5, n=3)
-58%
3840x2160 Siemens NX (snx-04)
23.7
85
259%
18.2
-23%
481
1930%
367
1449%
23.3 ?(13.2 - 25.6, n=9)
-2%
372 ?(337 - 454, n=12)
1470%
25.2 ?(24.7 - 25.9, n=3)
6%
152.3 ?(133.4 - 172.2, n=3)
543%
3840x2160 Medical (medical-03)
22.2
30.4
37%
11.4
-49%
37.9
71%
32.1
45%
19.6 ?(9.95 - 23, n=9)
-12%
18.7 ?(16.3 - 41.1, n=12)
-16%
21.8 ?(19.8 - 22.9, n=3)
-2%
22.8 ?(21.4 - 23.6, n=3)
3%
3840x2160 Maya (maya-06)
353
266
-25%
215
-39%
329
-7%
262
-26%
336 ?(181 - 369, n=9)
-5%
277 ?(247 - 445, n=12)
-22%
356 ?(351 - 366, n=3)
1%
127.7 ?(119.2 - 134.5, n=3)
-64%
3840x2160 Energy (energy-03)
31.6
32.6
3%
14.5
-54%
63
99%
46.1
46%
63.7 ?(22.3 - 101, n=9)
102%
49.5 ?(37.7 - 93.9, n=12)
57%
64.3 ?(38.9 - 96.4, n=3)
103%
87.1 ?(39.3 - 138.7, n=3)
176%
3840x2160 Creo (creo-03)
84.5
65.4
-23%
76.6
-9%
111
31%
75.6
-11%
105.5 ?(68.1 - 118, n=9)
25%
127.5 ?(109 - 163, n=12)
51%
113 ?(108 - 117, n=3)
34%
93.3 ?(88.6 - 101.6, n=3)
10%
3840x2160 CATIA (catia-06)
58.6
44.6
-24%
37.9
-35%
82.4
41%
67.5
15%
56.3 ?(32.3 - 60.4, n=9)
-4%
83.6 ?(73.8 - 122, n=12)
43%
59.6 ?(58.4 - 60.4, n=3)
2%
58.4 ?(53 - 64.2, n=3)
0%
3840x2160 3ds Max (3dsmax-07)
145
121
-17%
80.1
-45%
137
-6%
95.7
-34%
133.5 ?(70.2 - 143, n=9)
-8%
119.5 ?(108 - 169, n=12)
-18%
139.3 ?(139 - 140, n=3)
-4%
83.9 ?(77 - 87.8, n=3)
-42%
Total Average (Program / Settings)
37% / 38%
-32% / -32%
276% / 277%
233% / 235%
5% / 5%
191% / 190%
13% / 13%
98% / 98%
109% / 109%

Game benchmarks: Modest leads over RTX 3080 Ti and 3090 in 4K

The Zotac RTX 3090 Ti AMP Extreme Holo unsurprisingly leads the charts in all tested games. Gaming at 4K in the 100 fps region with all the glitz and glamor turned on is definitely possible on this card depending on the game. However, we find only about ~20% benefits in most titles coming from an average RTX 3090 and ~15% compared to the RTX 3080 Ti. 

The RTX 3090 Ti leads in ray tracing performance as expected with anywhere between a 13% and 42% uplift depending on the game and resolution — we observed maximum ray tracing benefits in Far Cry 6 and Metro Exodus at 1080p Ultra. Gaming with ray tracing turned on at 4K requires enabling DLSS to prevent a slideshow as seen in the Cyberpunk 2077 1.5 4K ray tracing results.

The RX 6900 XT struggles with ray tracing and is about ~26% slower on average compared to the RTX 3090 Ti in most titles at 4K Ultra. But the performance tradeoff also comes at much reduced price for the AMD Founders Edition, so it is still not a bad option to consider given that you can still get a good 4K Ultra gaming experience in FSR-enabled titles.

The Witcher 3
3840x2160 Ultra Graphics & Postprocessing (HBAO+)
Zotac Gaming GeForce RTX 3090 Ti AMP Extreme Holo
AMD Ryzen 7 5800X3D, NVIDIA GeForce RTX 3090 Ti
107.5 (97min, 97.56P1 - 129max) fps
Average NVIDIA GeForce RTX 3080 Ti
  (93.1 - 96.4, n=4)
94.7 fps -12%
Average NVIDIA GeForce RTX 3090
  (85.4 - 98.5, n=8)
93.4 fps -13%
NVIDIA GeForce RTX 3080 Ti Founders Edition
AMD Ryzen 7 5800X, NVIDIA GeForce RTX 3080 Ti
93.2 (86min, 86P1 - 103max) fps -13%
Nvidia GeForce RTX 3090 Founders Edition
AMD Ryzen 9 5900X, NVIDIA GeForce RTX 3090
91.8 fps -15%
Average NVIDIA GeForce RTX 3080
  (78 - 85.7, n=2)
81.9 fps -24%
AMD Radeon RX 6900 XT
AMD Ryzen 9 5950X, AMD Radeon RX 6900 XT
76.6 (70min, 70P1 - 84max) fps -29%
Average NVIDIA Titan RTX
 
71.8 fps -33%
Average NVIDIA GeForce RTX 2080 Ti (Desktop)
  (65 - 67, n=3)
65.7 fps -39%
Average NVIDIA GeForce RTX 3070
  (59 - 60.3, n=2)
59.7 fps -44%
Zotac Gaming GeForce RTX 3070 Twin Edge
AMD Ryzen 9 5950X, NVIDIA GeForce RTX 3070
59 (53min, 53.59P1 - 64max) fps -45%
NVIDIA GeForce RTX 3060 Ti Founders Edition
AMD Ryzen 9 5950X, NVIDIA GeForce RTX 3060 Ti
53.5 (49min, 49P1 - 57max) fps -50%
3840x2160 High Graphics & Postprocessing (Nvidia HairWorks Off)
Zotac Gaming GeForce RTX 3090 Ti AMP Extreme Holo
AMD Ryzen 7 5800X3D, NVIDIA GeForce RTX 3090 Ti
172.9 (152min, 152.57P1 - 188max) fps
Average NVIDIA GeForce RTX 3080 Ti
  (149 - 156.8, n=4)
152.4 fps -12%
Average NVIDIA GeForce RTX 3090
  (128 - 160.2, n=12)
151.5 fps -12%
NVIDIA GeForce RTX 3080 Ti Founders Edition
AMD Ryzen 7 5800X, NVIDIA GeForce RTX 3080 Ti
149 (132min, 132.59P1 - 161max) fps -14%
Nvidia GeForce RTX 3090 Founders Edition
AMD Ryzen 9 5900X, NVIDIA GeForce RTX 3090
148 fps -14%
AMD Radeon RX 6900 XT
AMD Ryzen 9 5950X, AMD Radeon RX 6900 XT
122 (105min, 105P1 - 134max) fps -29%
Average NVIDIA GeForce RTX 3080
  (114 - 115, n=2)
114.5 fps -34%
AMD Radeon RX 6800 XT
AMD Ryzen 9 5950X, AMD Radeon RX 6800 XT
110 (97min - 117max) fps -36%
Average NVIDIA Titan RTX
  (94 - 107.1, n=28)
102.4 fps -41%
Average NVIDIA GeForce RTX 2080 Ti (Desktop)
  (96 - 101, n=3)
98.3 fps -43%
Zotac Gaming GeForce RTX 3070 Twin Edge
AMD Ryzen 9 5950X, NVIDIA GeForce RTX 3070
89.6 (81min, 81P1 - 96max) fps -48%
Average NVIDIA GeForce RTX 3070
  (84 - 93.9, n=5)
89.3 fps -48%
NVIDIA GeForce RTX 3060 Ti Founders Edition
AMD Ryzen 9 5950X, NVIDIA GeForce RTX 3060 Ti
81.3 (74min, 74.57P1 - 88max) fps -53%
1920x1080 Ultra Graphics & Postprocessing (HBAO+)
Zotac Gaming GeForce RTX 3090 Ti AMP Extreme Holo
AMD Ryzen 7 5800X3D, NVIDIA GeForce RTX 3090 Ti (110% PT)
196.3 (192min, 193P1 - 200max) fps
Zotac Gaming GeForce RTX 3090 Ti AMP Extreme Holo
AMD Ryzen 7 5800X3D, NVIDIA GeForce RTX 3090 Ti (100% PT)
193.4 (173min, 173.56P1 - 221max) fps -1%
Average NVIDIA GeForce RTX 3080 Ti
  (174 - 184.6, n=4)
180.2 fps -8%
Average NVIDIA GeForce RTX 3090
  (160 - 192.6, n=16)
179.9 fps -8%
NVIDIA GeForce RTX 3080 Ti Founders Edition
AMD Ryzen 7 5800X, NVIDIA GeForce RTX 3080 Ti
174 (163min, 165P1 - 187max) fps -11%
Nvidia GeForce RTX 3090 Founders Edition
AMD Ryzen 9 5900X, NVIDIA GeForce RTX 3090
171.5 fps -13%
AMD Radeon RX 6900 XT
AMD Ryzen 9 5950X, AMD Radeon RX 6900 XT
163.6 (139min - 179max) fps -17%
AMD Radeon RX 6800 XT
AMD Ryzen 9 5950X, AMD Radeon RX 6800 XT
160 (138min - 179max) fps -18%
Average NVIDIA GeForce RTX 3080
  (145 - 152, n=2)
148.5 fps -24%
Average NVIDIA Titan RTX
  (124 - 150, n=28)
137.7 fps -30%
Average NVIDIA GeForce RTX 2080 Ti (Desktop)
  (131 - 136, n=3)
134 fps -32%
Zotac Gaming GeForce RTX 3070 Twin Edge
AMD Ryzen 9 5950X, NVIDIA GeForce RTX 3070
123 (120min, 121P1 - 126max) fps -37%
NVIDIA GeForce RTX 3060 Ti Founders Edition
AMD Ryzen 9 5950X, NVIDIA GeForce RTX 3060 Ti
109 (103min, 105P1 - 113max) fps -44%
Average NVIDIA GeForce RTX 3070
  (52.8 - 132.2, n=7)
106.1 fps -46%
F1 2021
3840x2160 Ultra High Preset + Raytracing AA:T AF:16x
Zotac Gaming GeForce RTX 3090 Ti AMP Extreme Holo
AMD Ryzen 7 5800X3D, NVIDIA GeForce RTX 3090 Ti
114.9 (99min, 100P1 - 128max) fps
Average NVIDIA GeForce RTX 3090
  (100.4 - 110, n=12)
103.5 fps -10%
Average NVIDIA GeForce RTX 3080 Ti
  (101 - 105.6, n=3)
103.3 fps -10%
Nvidia GeForce RTX 3090 Founders Edition
AMD Ryzen 9 5900X, NVIDIA GeForce RTX 3090 (831795)
102 (88min, 87P1 - 114max) fps -11%
Average NVIDIA GeForce RTX 3080
 
91 fps -21%
Average NVIDIA Titan RTX
  (71.9 - 74.5, n=6)
73.3 fps -36%
Average NVIDIA GeForce RTX 2080 Ti (Desktop)
 
68 fps -41%
Average NVIDIA GeForce RTX 3070
  (64 - 67.3, n=2)
65.7 fps -43%
2560x1440 Ultra High Preset + Raytracing AA:T AF:16x
Zotac Gaming GeForce RTX 3090 Ti AMP Extreme Holo
AMD Ryzen 7 5800X3D, NVIDIA GeForce RTX 3090 Ti
189.3 (161min, 161P1 - 209max) fps
Average NVIDIA GeForce RTX 3080 Ti
  (170 - 180.2, n=3)
174.8 fps -8%
Average NVIDIA GeForce RTX 3090
  (153 - 186.2, n=12)
172.1 fps -9%
Nvidia GeForce RTX 3090 Founders Edition
AMD Ryzen 9 5900X, NVIDIA GeForce RTX 3090 (831795)
165 (140min, 122P1 - 182max) fps -13%
Average NVIDIA GeForce RTX 3080
 
149 fps -21%
Average NVIDIA Titan RTX
  (121 - 129, n=6)
125.4 fps -34%
Average NVIDIA GeForce RTX 2080 Ti (Desktop)
 
119 fps -37%
Average NVIDIA GeForce RTX 3070
  (113 - 118, n=2)
115.5 fps -39%
1920x1080 Ultra High Preset + Raytracing AA:T AF:16x
Zotac Gaming GeForce RTX 3090 Ti AMP Extreme Holo
AMD Ryzen 7 5800X3D, NVIDIA GeForce RTX 3090 Ti
242 (172min, 179P1 - 271max) fps
Average NVIDIA GeForce RTX 3080 Ti
  (219 - 234, n=3)
226 fps -7%
Average NVIDIA GeForce RTX 3090
  (154 - 244, n=12)
217 fps -10%
Nvidia GeForce RTX 3090 Founders Edition
AMD Ryzen 9 5900X, NVIDIA GeForce RTX 3090 (831795)
192 (149min, 131P1 - 204max) fps -21%
Average NVIDIA Titan RTX
  (160 - 172, n=6)
166.1 fps -31%
Average NVIDIA GeForce RTX 3070
  (148 - 158, n=2)
153 fps -37%
Average NVIDIA GeForce RTX 3080
 
152 fps -37%
Average NVIDIA GeForce RTX 2080 Ti (Desktop)
 
147 fps -39%
Far Cry 6
3840x2160 Ultra Graphics Quality + HD Textures AA:T
Zotac Gaming GeForce RTX 3090 Ti AMP Extreme Holo
AMD Ryzen 7 5800X3D, NVIDIA GeForce RTX 3090 Ti
90 (74min - 98max) fps
Average NVIDIA GeForce RTX 3080 Ti
  (81.6 - 86.2, n=3)
84.6 fps -6%
Average NVIDIA GeForce RTX 3090
  (77 - 86.7, n=9)
83 fps -8%
Nvidia GeForce RTX 3090 Founders Edition
AMD Ryzen 9 5900X, NVIDIA GeForce RTX 3090
78.3 (68min - 86max) fps -13%
Average NVIDIA GeForce RTX 3080
 
72 fps -20%
Average NVIDIA Titan RTX
  (52.8 - 64.2, n=6)
61.8 fps -31%
Average NVIDIA GeForce RTX 3070
  (26.4 - 57, n=2)
41.7 fps -54%
2560x1440 Ultra Graphics Quality + HD Textures AA:T
Average NVIDIA GeForce RTX 3080 Ti
  (129 - 136.9, n=3)
134 fps +1%
Zotac Gaming GeForce RTX 3090 Ti AMP Extreme Holo
AMD Ryzen 7 5800X3D, NVIDIA GeForce RTX 3090 Ti
132.9 (99min - 155max) fps
Average NVIDIA GeForce RTX 3090
  (89 - 139.2, n=9)
124.3 fps -6%
Nvidia GeForce RTX 3090 Founders Edition
AMD Ryzen 9 5900X, NVIDIA GeForce RTX 3090
107 (82min - 131max) fps -19%
Average NVIDIA Titan RTX
  (80.9 - 109, n=6)
102.3 fps -23%
Average NVIDIA GeForce RTX 3070
  (87 - 95.9, n=2)
91.5 fps -31%
Average NVIDIA GeForce RTX 3080
 
88 fps -34%
1920x1080 Ultra Graphics Quality + HD Textures AA:T
Average NVIDIA GeForce RTX 3080 Ti
  (120.7 - 159.6, n=3)
143.1 fps +1%
Zotac Gaming GeForce RTX 3090 Ti AMP Extreme Holo
AMD Ryzen 7 5800X3D, NVIDIA GeForce RTX 3090 Ti
142 (95min - 187max) fps
Average NVIDIA GeForce RTX 3090
  (94 - 165.4, n=9)
141 fps -1%
Average NVIDIA Titan RTX
  (94.7 - 138.9, n=6)
126.2 fps -11%
Nvidia GeForce RTX 3090 Founders Edition
AMD Ryzen 9 5900X, NVIDIA GeForce RTX 3090
113 (87min - 159max) fps -20%
Average NVIDIA GeForce RTX 3070
  (91 - 114.2, n=2)
102.6 fps -28%
Average NVIDIA GeForce RTX 3080
 
92 fps -35%
1920x1080 Ultra Graphics Quality + HD Textures + DXR AA:T
Zotac Gaming GeForce RTX 3090 Ti AMP Extreme Holo
AMD Ryzen 7 5800X3D, NVIDIA GeForce RTX 3090 Ti
122 (95min - 158max) fps
Average NVIDIA GeForce RTX 3080 Ti
  (112 - 128.6, n=2)
120.3 fps -1%
Average NVIDIA GeForce RTX 3090
  (76 - 130, n=7)
108.9 fps -11%
Average NVIDIA Titan RTX
  (97 - 109.3, n=2)
103.2 fps -15%
Nvidia GeForce RTX 3090 Founders Edition
AMD Ryzen 9 5900X, NVIDIA GeForce RTX 3090
86.7 (70min - 124max) fps -29%
Average NVIDIA GeForce RTX 3080
 
73 fps -40%
Average NVIDIA GeForce RTX 3070
 
71 fps -42%
Call of Duty Vanguard
3840x2160 Ultra Preset
Zotac Gaming GeForce RTX 3090 Ti AMP Extreme Holo
AMD Ryzen 7 5800X3D, NVIDIA GeForce RTX 3090 Ti
93.7 (72.7min, 81.2P0.1, 83.7P1 - 154.8max) fps
Average NVIDIA GeForce RTX 3090
  (82 - 84.8, n=2)
83.4 fps -11%
Nvidia GeForce RTX 3090 Founders Edition
AMD Ryzen 9 5900X, NVIDIA GeForce RTX 3090
82 (45.3min, 70P0.1, 73.4P1 - 112max) fps -12%
Average NVIDIA GeForce RTX 3080
 
77.7 fps -17%
Average NVIDIA Titan RTX
 
59.6 fps -36%
Average NVIDIA GeForce RTX 3070
 
56.8 fps -39%
2560x1440 Ultra Preset
Zotac Gaming GeForce RTX 3090 Ti AMP Extreme Holo
AMD Ryzen 7 5800X3D, NVIDIA GeForce RTX 3090 Ti
149.9 (75.1min, 117.6P0.1, 127P1 - 395max) fps
Average NVIDIA GeForce RTX 3090
  (129 - 138, n=2)
133.5 fps -11%
Nvidia GeForce RTX 3090 Founders Edition
AMD Ryzen 9 5900X, NVIDIA GeForce RTX 3090
129 (94.4min, 102P0.1, 109P1 - 185max) fps -14%
Average NVIDIA GeForce RTX 3080
 
126 fps -16%
Average NVIDIA Titan RTX
 
100 fps -33%
Average NVIDIA GeForce RTX 3070
 
98.1 fps -35%
1920x1080 Ultra Preset
Zotac Gaming GeForce RTX 3090 Ti AMP Extreme Holo
AMD Ryzen 7 5800X3D, NVIDIA GeForce RTX 3090 Ti
191.2 (79.1min, 121.3P0.1, 152.5P1 - 408max) fps
Average NVIDIA GeForce RTX 3090
  (166 - 174, n=2)
170 fps -11%
Nvidia GeForce RTX 3090 Founders Edition
AMD Ryzen 9 5900X, NVIDIA GeForce RTX 3090
166 (121min, 128P0.1, 137P1 - 255max) fps -13%
Average NVIDIA GeForce RTX 3080
 
161 fps -16%
Average NVIDIA Titan RTX
 
133 fps -30%
Average NVIDIA GeForce RTX 3070
 
131 fps -31%
Tiny Tina's Wonderlands
3840x2160 Badass Preset (DX12)
Nvidia GeForce RTX 3090 Founders Edition
AMD Ryzen 9 5900X, NVIDIA GeForce RTX 3090
71.4 fps
Average NVIDIA GeForce RTX 3080 Ti
  (70 - 70.6, n=2)
70.3 fps
Average NVIDIA GeForce RTX 3090
  (67.5 - 73.6, n=11)
70 fps
Average NVIDIA GeForce RTX 3080
 
65.4 fps
Average NVIDIA Titan RTX
  (46.8 - 50.4, n=3)
48.4 fps
Average NVIDIA GeForce RTX 3070
  (44.4 - 46.4, n=2)
45.4 fps
2560x1440 Badass Preset (DX12)
Nvidia GeForce RTX 3090 Founders Edition
AMD Ryzen 9 5900X, NVIDIA GeForce RTX 3090
125.4 fps
Average NVIDIA GeForce RTX 3080 Ti
  (123.1 - 124.7, n=2)
123.9 fps
Average NVIDIA GeForce RTX 3090
  (118.8 - 129, n=11)
123.3 fps
Average NVIDIA GeForce RTX 3080
 
115 fps
Average NVIDIA Titan RTX
  (86.5 - 92.4, n=3)
88.5 fps
Average NVIDIA GeForce RTX 3070
  (80.7 - 85, n=2)
82.9 fps
1920x1080 Badass Preset (DX12)
Average NVIDIA GeForce RTX 3080 Ti
  (168.5 - 171.3, n=2)
169.9 fps
Average NVIDIA GeForce RTX 3090
  (159.4 - 173, n=11)
166.7 fps
Nvidia GeForce RTX 3090 Founders Edition
AMD Ryzen 9 5900X, NVIDIA GeForce RTX 3090
159.4 fps
Average NVIDIA GeForce RTX 3080
 
157 fps
Average NVIDIA Titan RTX
  (121.7 - 124.3, n=3)
123 fps
Average NVIDIA GeForce RTX 3070
  (113.9 - 121, n=2)
117.5 fps
Ghostwire Tokyo
3840x2160 Highest Settings
Zotac Gaming GeForce RTX 3090 Ti AMP Extreme Holo
AMD Ryzen 7 5800X3D, NVIDIA GeForce RTX 3090 Ti
113.2 (28.8min, 56.8P0.1, 68.3P1 - 281max) fps
Average NVIDIA GeForce RTX 3080 Ti
 
108.4 fps -4%
Nvidia GeForce RTX 3090 Founders Edition
AMD Ryzen 9 5900X, NVIDIA GeForce RTX 3090
102.6 (37.9min, 52.8P0.1, 63.7P1 - 231max) fps -9%
Average NVIDIA GeForce RTX 3090
  (97 - 102.6, n=3)
100.1 fps -12%
Average NVIDIA GeForce RTX 3080
 
89.9 fps -21%
Average NVIDIA Titan RTX
  (67.6 - 73.3, n=2)
70.5 fps -38%
Average NVIDIA GeForce RTX 3070
 
63.9 fps -44%
2560x1440 Highest Settings
Average NVIDIA GeForce RTX 3080 Ti
 
211 fps 0%
Zotac Gaming GeForce RTX 3090 Ti AMP Extreme Holo
AMD Ryzen 7 5800X3D, NVIDIA GeForce RTX 3090 Ti
210 (33min, 72.3P0.1, 144.7P1 - 319max) fps
Average NVIDIA GeForce RTX 3090
  (179.2 - 192.5, n=3)
186.4 fps -11%
Nvidia GeForce RTX 3090 Founders Edition
AMD Ryzen 9 5900X, NVIDIA GeForce RTX 3090
179.2 (30.7min, 94.4P0.1, 130.5P1 - 261max) fps -15%
Average NVIDIA GeForce RTX 3080
 
172.5 fps -18%
Average NVIDIA Titan RTX
  (135.9 - 141, n=2)
138.5 fps -34%
Average NVIDIA GeForce RTX 3070
 
130.4 fps -38%
1920x1080 Highest Settings
Average NVIDIA GeForce RTX 3080 Ti
 
278 fps +7%
Zotac Gaming GeForce RTX 3090 Ti AMP Extreme Holo
AMD Ryzen 7 5800X3D, NVIDIA GeForce RTX 3090 Ti
261 (32.3min, 79.8P0.1, 179.6P1 - 410max) fps
Average NVIDIA GeForce RTX 3090
  (218 - 265, n=3)
234 fps -10%
Nvidia GeForce RTX 3090 Founders Edition
AMD Ryzen 9 5900X, NVIDIA GeForce RTX 3090
218 (30.3min, 101.3P0.1, 166.3P1 - 275max) fps -16%
Average NVIDIA GeForce RTX 3080
 
205 fps -21%
Average NVIDIA Titan RTX
  (202 - 205, n=2)
204 fps -22%
Average NVIDIA GeForce RTX 3070
 
195.1 fps -25%
1920x1080 Highest Settings + Maximum Ray Tracing
Zotac Gaming GeForce RTX 3090 Ti AMP Extreme Holo
AMD Ryzen 7 5800X3D, NVIDIA GeForce RTX 3090 Ti
120.2 (33.8min, 55.2P0.1, 79.1P1 - 195.2max) fps
Average NVIDIA GeForce RTX 3080 Ti
 
119.9 fps 0%
Average NVIDIA GeForce RTX 3090
  (106 - 122, n=3)
111.6 fps -7%
Nvidia GeForce RTX 3090 Founders Edition
AMD Ryzen 9 5900X, NVIDIA GeForce RTX 3090
106.7 (34.6min, 49.4P0.1, 73P1 - 156.7max) fps -11%
Average NVIDIA GeForce RTX 3080
 
97.9 fps -19%
Average NVIDIA Titan RTX
  (74.5 - 79, n=2)
76.8 fps -36%
Average NVIDIA GeForce RTX 3070
 
76.3 fps -37%
Control
3840x2160 High Quality Preset (DX11)
Zotac Gaming GeForce RTX 3090 Ti AMP Extreme Holo
AMD Ryzen 7 5800X3D, NVIDIA GeForce RTX 3090 Ti
73.9 (46.2min, 53.2P0.1, 62.6P1 - 167max) fps
NVIDIA GeForce RTX 3080 Ti Founders Edition
AMD Ryzen 7 5800X, NVIDIA GeForce RTX 3080 Ti
64.9 (41.3min, 50.5P0.1, 55.3P1 - 127max) fps -12%
Average NVIDIA GeForce RTX 3080 Ti
  (63.9 - 64.9, n=3)
64.3 fps -13%
Average NVIDIA GeForce RTX 3090
  (61.3 - 66, n=4)
63 fps -15%
Nvidia GeForce RTX 3090 Founders Edition
AMD Ryzen 9 5900X, NVIDIA GeForce RTX 3090
61.3 fps -17%
Average NVIDIA GeForce RTX 3080
  (56.2 - 56.7, n=2)
56.5 fps -24%
AMD Radeon RX 6900 XT
AMD Ryzen 9 5950X, AMD Radeon RX 6900 XT
54.7 (39.8min, 41.7P0.1, 44.9P1 - 65.8max) fps -26%
AMD Radeon RX 6900 XT
AMD Ryzen 9 5950X, AMD Radeon RX 6900 XT (SAM ENABLED)
53.9 (36.6min, 41.7P0.1, 43.5P1 - 64.9max) fps -27%
AMD Radeon RX 6800 XT
AMD Ryzen 9 5950X, AMD Radeon RX 6800 XT
51.6 (46min - 58max) fps -30%
Average NVIDIA Titan RTX
  (45.2 - 47.3, n=3)
46.5 fps -37%
Average NVIDIA GeForce RTX 2080 Ti (Desktop)
  (42.6 - 45.8, n=2)
44.2 fps -40%
Average NVIDIA GeForce RTX 3070
  (40.6 - 42.3, n=3)
41.3 fps -44%
NVIDIA GeForce RTX 3060 Ti Founders Edition
AMD Ryzen 9 5950X, NVIDIA GeForce RTX 3060 Ti
36.1 (28min, 28.5P0.1, 30.7P1 - 52.8max) fps -51%
2560x1440 High Quality Preset (DX11)
Zotac Gaming GeForce RTX 3090 Ti AMP Extreme Holo
AMD Ryzen 7 5800X3D, NVIDIA GeForce RTX 3090 Ti
142.5 (51.8min, 81.9P0.1, 115.5P1 - 567max) fps
Average NVIDIA GeForce RTX 3080 Ti
  (122 - 125.5, n=3)
123.8 fps -13%
NVIDIA GeForce RTX 3080 Ti Founders Edition
AMD Ryzen 7 5800X, NVIDIA GeForce RTX 3080 Ti
122 (52.6min, 86.2P0.1, 99.3P1 - 392max) fps -14%
Average NVIDIA GeForce RTX 3090
  (115.8 - 123.7, n=4)
120.1 fps -16%
Nvidia GeForce RTX 3090 Founders Edition
AMD Ryzen 9 5900X, NVIDIA GeForce RTX 3090
115.8 fps -19%
AMD Radeon RX 6900 XT
AMD Ryzen 9 5950X, AMD Radeon RX 6900 XT
113 (71.5min, 73.2P0.1, 79.6P1 - 164max) fps -21%
AMD Radeon RX 6900 XT
AMD Ryzen 9 5950X, AMD Radeon RX 6900 XT (SAM ENABLED)
113 (68min, 71.3P0.1, 81.1P1 - 193max) fps -21%
AMD Radeon RX 6800 XT
AMD Ryzen 9 5950X, AMD Radeon RX 6800 XT
108 (93min - 123max) fps -24%
Average NVIDIA GeForce RTX 3080
  (105 - 106, n=2)
105.5 fps -26%
Average NVIDIA Titan RTX
  (89 - 93.6, n=3)
91.5 fps -36%
Average NVIDIA GeForce RTX 2080 Ti (Desktop)
  (84 - 89, n=2)
86.5 fps -39%
Average NVIDIA GeForce RTX 3070
  (79.8 - 82.5, n=3)
81.2 fps -43%
NVIDIA GeForce RTX 3060 Ti Founders Edition
AMD Ryzen 9 5950X, NVIDIA GeForce RTX 3060 Ti
71.9 (40min, 52.7P0.1, 59.4P1 - 189max) fps -50%
1920x1080 High Quality Preset (DX11)
Zotac Gaming GeForce RTX 3090 Ti AMP Extreme Holo
AMD Ryzen 7 5800X3D, NVIDIA GeForce RTX 3090 Ti
209 (55.6min, 119.8P0.1, 162.7P1 - 646max) fps
Average NVIDIA GeForce RTX 3080 Ti
  (181 - 190.7, n=3)
186.2 fps -11%
NVIDIA GeForce RTX 3080 Ti Founders Edition
AMD Ryzen 7 5800X, NVIDIA GeForce RTX 3080 Ti
181 (49.7min, 115P0.1, 140P1 - 509max) fps -13%
Average NVIDIA GeForce RTX 3090
  (172.2 - 189.2, n=4)
178.1 fps -15%
AMD Radeon RX 6900 XT
AMD Ryzen 9 5950X, AMD Radeon RX 6900 XT
175 (56.8min, 96P0.1, 112P1 - 314max) fps -16%
AMD Radeon RX 6900 XT
AMD Ryzen 9 5950X, AMD Radeon RX 6900 XT (SAM ENABLED)
174 (54min, 99P0.1, 112P1 - 335max) fps -17%
Nvidia GeForce RTX 3090 Founders Edition
AMD Ryzen 9 5900X, NVIDIA GeForce RTX 3090
172.2 fps -18%
AMD Radeon RX 6800 XT
AMD Ryzen 9 5950X, AMD Radeon RX 6800 XT
168 (145min - 194max) fps -20%
Average NVIDIA GeForce RTX 3080
  (151 - 155, n=2)
153 fps -27%
Average NVIDIA Titan RTX
  (135 - 141.9, n=3)
137.3 fps -34%
Average NVIDIA GeForce RTX 2080 Ti (Desktop)
  (126 - 132, n=2)
129 fps -38%
Average NVIDIA GeForce RTX 3070
  (117 - 124.9, n=3)
121.3 fps -42%
NVIDIA GeForce RTX 3060 Ti Founders Edition
AMD Ryzen 9 5950X, NVIDIA GeForce RTX 3060 Ti
110 (44.9min, 59.8P0.1, 86.1P1 - 407max) fps -47%
1920x1080 High Quality Preset & High Ray Tracing Preset (DX12)
Zotac Gaming GeForce RTX 3090 Ti AMP Extreme Holo
AMD Ryzen 7 5800X3D, NVIDIA GeForce RTX 3090 Ti
130.8 (62.6min, 107.5P0.1, 113.8P1 - 168.3max) fps
Average NVIDIA GeForce RTX 3080 Ti
  (111 - 120.6, n=3)
115.2 fps -12%
NVIDIA GeForce RTX 3080 Ti Founders Edition
AMD Ryzen 7 5800X, NVIDIA GeForce RTX 3080 Ti
114 (5.37min, 73.8P0.1, 94.6P1 - 164max) fps -13%
Average NVIDIA GeForce RTX 3090
  (91.4 - 120.4, n=4)
108.2 fps -17%
Nvidia GeForce RTX 3090 Founders Edition
AMD Ryzen 9 5900X, NVIDIA GeForce RTX 3090
106.9 fps -18%
Average NVIDIA GeForce RTX 3080
  (98.1 - 103, n=2)
100.6 fps -23%
Average NVIDIA Titan RTX
  (63 - 120, n=3)
88.1 fps -33%
AMD Radeon RX 6900 XT
AMD Ryzen 9 5950X, AMD Radeon RX 6900 XT (SAM ENABLED)
76.2 (38.7min, 43.3P0.1, 62.8P1 - 142max) fps -42%
AMD Radeon RX 6900 XT
AMD Ryzen 9 5950X, AMD Radeon RX 6900 XT
73.1 (31.6min, 40.9P0.1, 62.6P1 - 149max) fps -44%
Average NVIDIA GeForce RTX 2080 Ti (Desktop)
  (72 - 76, n=2)
74 fps -43%
Average NVIDIA GeForce RTX 3070
  (57.9 - 75.1, n=3)
68.5 fps -48%
NVIDIA GeForce RTX 3060 Ti Founders Edition
AMD Ryzen 9 5950X, NVIDIA GeForce RTX 3060 Ti
67.7 (23.8min, 27.3P0.1, 58.1P1 - 103max) fps -48%
AMD Radeon RX 6800 XT
AMD Ryzen 9 5950X, AMD Radeon RX 6800 XT
66.9 (60min - 75max) fps -49%
Cyberpunk 2077 1.6
3840x2160 Ray Tracing Ultra Preset (DLSS off)
Zotac Gaming GeForce RTX 3090 Ti AMP Extreme Holo
AMD Ryzen 7 5800X3D, NVIDIA GeForce RTX 3090 Ti (1.52)
24.3 (16.3min - 33.3max) fps
Average NVIDIA GeForce RTX 3090
  (19.8 - 22.1, n=5)
21 fps -14%
Nvidia GeForce RTX 3090 Founders Edition
AMD Ryzen 9 5900X, NVIDIA GeForce RTX 3090
19.8 fps -19%
Average NVIDIA GeForce RTX 3080 Ti
 
18.6 fps -23%
Average NVIDIA Titan RTX
 
13.4 fps -45%
Average NVIDIA GeForce RTX 3080
 
12.1 fps -50%
Average NVIDIA GeForce RTX 3070
  (5.4 - 6.6, n=2)
6 fps -75%
1920x1080 Ray Tracing Ultra Preset (DLSS off)
Zotac Gaming GeForce RTX 3090 Ti AMP Extreme Holo
AMD Ryzen 7 5800X3D, NVIDIA GeForce RTX 3090 Ti (1.52)
74.7 (57.7min - 116.3max) fps
Average NVIDIA GeForce RTX 3080 Ti
 
69.1 fps -7%
Average NVIDIA GeForce RTX 3090
  (61.3 - 68, n=5)
65.5 fps -12%
Nvidia GeForce RTX 3090 Founders Edition
AMD Ryzen 9 5900X, NVIDIA GeForce RTX 3090
61.3 fps -18%
Average NVIDIA GeForce RTX 3080
 
61.1 fps -18%
Average NVIDIA Titan RTX
 
43.3 fps -42%
Average NVIDIA GeForce RTX 3070
  (41.6 - 43.9, n=2)
42.8 fps -43%
3840x2160 Ultra Preset
Zotac Gaming GeForce RTX 3090 Ti AMP Extreme Holo
AMD Ryzen 7 5800X3D, NVIDIA GeForce RTX 3090 Ti (1.52)
53.3 (36.1min - 69.2max) fps
Average NVIDIA GeForce RTX 3080 Ti
 
49.7 fps -7%
Average NVIDIA GeForce RTX 3090
  (43.9 - 48.6, n=7)
46.3 fps -13%
Nvidia GeForce RTX 3090 Founders Edition
AMD Ryzen 9 5900X, NVIDIA GeForce RTX 3090
43.9 fps -18%
Average NVIDIA GeForce RTX 3080
 
42.8 fps -20%
Average NVIDIA Titan RTX
 
32.8 fps -38%
Average NVIDIA GeForce RTX 3070
  (29 - 30.2, n=2)
29.6 fps -44%
2560x1440 Ultra Preset
Zotac Gaming GeForce RTX 3090 Ti AMP Extreme Holo
AMD Ryzen 7 5800X3D, NVIDIA GeForce RTX 3090 Ti (1.52)
103.9 (68min - 147.2max) fps
Average NVIDIA GeForce RTX 3080 Ti
 
99.1 fps -5%
Average NVIDIA GeForce RTX 3090
  (78 - 96, n=7)
90.1 fps -13%
Average NVIDIA GeForce RTX 3080
 
86.1 fps -17%
Nvidia GeForce RTX 3090 Founders Edition
AMD Ryzen 9 5900X, NVIDIA GeForce RTX 3090
78 fps -25%
Average NVIDIA Titan RTX
 
66.2 fps -36%
Average NVIDIA GeForce RTX 3070
  (60.6 - 62.7, n=2)
61.7 fps -41%
1920x1080 Ultra Preset
Zotac Gaming GeForce RTX 3090 Ti AMP Extreme Holo
AMD Ryzen 7 5800X3D, NVIDIA GeForce RTX 3090 Ti (1.52)
151.8 (65.9min - 222max) fps
Average NVIDIA GeForce RTX 3080 Ti
 
146.4 fps -4%
Average NVIDIA GeForce RTX 3080
 
131 fps -14%
Average NVIDIA GeForce RTX 3090
  (78.6 - 173, n=9)
128.8 fps -15%
Average NVIDIA GeForce RTX 3070
  (90.3 - 114, n=2)
102.2 fps -33%
Nvidia GeForce RTX 3090 Founders Edition
AMD Ryzen 9 5900X, NVIDIA GeForce RTX 3090
78.6 fps -48%
Average NVIDIA Titan RTX
 
78.3 fps -48%
Watch Dogs Legion
3840x2160 Ultra Preset (DX12)
Zotac Gaming GeForce RTX 3090 Ti AMP Extreme Holo
AMD Ryzen 7 5800X3D, NVIDIA GeForce RTX 3090 Ti
70.1 (42.4min, 58.37P1 - 143.5max) fps
Average NVIDIA GeForce RTX 3090
  (57.6 - 60.3, n=2)
59 fps -16%
NVIDIA GeForce RTX 3080 Ti Founders Edition
AMD Ryzen 7 5800X, NVIDIA GeForce RTX 3080 Ti
58.7 (19.65min, 47.22P1 - 104.49max) fps -16%
Average NVIDIA GeForce RTX 3080 Ti
 
58.7 fps -16%
Nvidia GeForce RTX 3090 Founders Edition
AMD Ryzen 9 5900X, NVIDIA GeForce RTX 3090
57.6 (24.58min, 45.93P1 - 114.36max) fps -18%
Average NVIDIA GeForce RTX 3080
  (53.5 - 54.1, n=2)
53.8 fps -23%
AMD Radeon RX 6900 XT
AMD Ryzen 9 5950X, AMD Radeon RX 6900 XT (SAM ENABLED)
53.6 (34.78min, 44.93P1 - 72.47max) fps -24%
AMD Radeon RX 6900 XT
AMD Ryzen 9 5950X, AMD Radeon RX 6900 XT
53.5 (33.75min, 44.2P1 - 82.3max) fps -24%
AMD Radeon RX 6800 XT
AMD Ryzen 9 5950X, AMD Radeon RX 6800 XT
49.3 (32.85min, 41.54P1 - 76.12max) fps -30%
Average NVIDIA GeForce RTX 2080 Ti (Desktop)
 
44 fps -37%
Average NVIDIA Titan RTX
 
43.4 fps -38%
Zotac Gaming GeForce RTX 3070 Twin Edge
AMD Ryzen 9 5950X, NVIDIA GeForce RTX 3070
38.9 (22.74min, 31.31P1 - 54.01max) fps -45%
Average NVIDIA GeForce RTX 3070
  (37 - 39.2, n=4)
38 fps -46%
NVIDIA GeForce RTX 3060 Ti Founders Edition
AMD Ryzen 9 5950X, NVIDIA GeForce RTX 3060 Ti
33 (17.58min, 22.09P1 - 51.23max) fps -53%
2560x1440 Ultra Preset (DX12)
Zotac Gaming GeForce RTX 3090 Ti AMP Extreme Holo
AMD Ryzen 7 5800X3D, NVIDIA GeForce RTX 3090 Ti
107.8 (37.5min, 87.55P1 - 159.3max) fps
AMD Radeon RX 6900 XT
AMD Ryzen 9 5950X, AMD Radeon RX 6900 XT (SAM ENABLED)
91.4 (38.16min, 73.25P1 - 135.95max) fps -15%
AMD Radeon RX 6900 XT
AMD Ryzen 9 5950X, AMD Radeon RX 6900 XT
91.1 (31.59min, 72.21P1 - 151.03max) fps -15%
Average NVIDIA GeForce RTX 3090
  (88.3 - 89.7, n=2)
89 fps -17%
NVIDIA GeForce RTX 3080 Ti Founders Edition
AMD Ryzen 7 5800X, NVIDIA GeForce RTX 3080 Ti
88.5 (56.34min, 70.21P1 - 120.47max) fps -18%
Average NVIDIA GeForce RTX 3080 Ti
 
88.5 fps -18%
Nvidia GeForce RTX 3090 Founders Edition
AMD Ryzen 9 5900X, NVIDIA GeForce RTX 3090
88.3 (48.36min, 68.18P1 - 160.5max) fps -18%
AMD Radeon RX 6800 XT
AMD Ryzen 9 5950X, AMD Radeon RX 6800 XT
84.5 (58.88min, 69.45P1 - 137.16max) fps -22%
Average NVIDIA GeForce RTX 3080
  (81.1 - 81.6, n=2)
81.4 fps -24%
Average NVIDIA GeForce RTX 2080 Ti (Desktop)
 
72.9 fps -32%
Average NVIDIA Titan RTX
 
69.9 fps -35%
Average NVIDIA GeForce RTX 3070
  (65.3 - 67, n=4)
66.1 fps -39%
Zotac Gaming GeForce RTX 3070 Twin Edge
AMD Ryzen 9 5950X, NVIDIA GeForce RTX 3070
65.3 (41.29min, 53.17P1 - 88.97max) fps -39%
NVIDIA GeForce RTX 3060 Ti Founders Edition
AMD Ryzen 9 5950X, NVIDIA GeForce RTX 3060 Ti
59.1 (34.72min, 48.11P1 - 97.67max) fps -45%
1920x1080 Ultra Preset (DX12)
Zotac Gaming GeForce RTX 3090 Ti AMP Extreme Holo
AMD Ryzen 7 5800X3D, NVIDIA GeForce RTX 3090 Ti
130.2 (80.06min, 100.27P1 - 192.77max) fps
AMD Radeon RX 6900 XT
AMD Ryzen 9 5950X, AMD Radeon RX 6900 XT (SAM ENABLED)
121 (67.26min, 95.56P1 - 184.97max) fps -7%
AMD Radeon RX 6900 XT
AMD Ryzen 9 5950X, AMD Radeon RX 6900 XT
120 (81.32min, 93.02P1 - 209.32max) fps -8%
AMD Radeon RX 6800 XT
AMD Ryzen 9 5950X, AMD Radeon RX 6800 XT
112 (75.12min, 87.97P1 - 181.69max) fps -14%
Nvidia GeForce RTX 3090 Founders Edition
AMD Ryzen 9 5900X, NVIDIA GeForce RTX 3090
107 (24.35min, 77.46P1 - 174.03max) fps -18%
Average NVIDIA GeForce RTX 3090
  (103 - 107, n=2)
105 fps -19%
Average NVIDIA GeForce RTX 3080
  (99.3 - 103, n=2)
101.2 fps -22%
NVIDIA GeForce RTX 3080 Ti Founders Edition
AMD Ryzen 7 5800X, NVIDIA GeForce RTX 3080 Ti
97 (45.96min, 71.89P1 - 141.44max) fps -25%
Average NVIDIA GeForce RTX 3080 Ti
 
97 fps -25%
Average NVIDIA GeForce RTX 2080 Ti (Desktop)
 
89.6 fps -31%
Average NVIDIA Titan RTX
 
85.5 fps -34%
Zotac Gaming GeForce RTX 3070 Twin Edge
AMD Ryzen 9 5950X, NVIDIA GeForce RTX 3070
84.9 (55.86min, 67.74P1 - 127.49max) fps -35%
Average NVIDIA GeForce RTX 3070
  (79 - 89, n=4)
84.7 fps -35%
NVIDIA GeForce RTX 3060 Ti Founders Edition
AMD Ryzen 9 5950X, NVIDIA GeForce RTX 3060 Ti
76.6 (48.47min, 62.15P1 - 115.84max) fps -41%
1920x1080 Ultra Preset + Ultra Ray Tracing (DX12)
Zotac Gaming GeForce RTX 3090 Ti AMP Extreme Holo
AMD Ryzen 7 5800X3D, NVIDIA GeForce RTX 3090 Ti
88.7 (50.06min, 72.42P1 - 118.24max) fps
Average NVIDIA GeForce RTX 3090
  (75.7 - 78.2, n=2)
77 fps -13%
Nvidia GeForce RTX 3090 Founders Edition
AMD Ryzen 9 5900X, NVIDIA GeForce RTX 3090
75.7 (33.41min, 58.92P1 - 126.05max) fps -15%
NVIDIA GeForce RTX 3080 Ti Founders Edition
AMD Ryzen 7 5800X, NVIDIA GeForce RTX 3080 Ti
75.1 (46.11min, 60.08P1 - 100.67max) fps -15%
Average NVIDIA GeForce RTX 3080 Ti
 
75.1 fps -15%
AMD Radeon RX 6800 XT
AMD Ryzen 9 5950X, AMD Radeon RX 6800 XT
71.4 (47.71min, 55.63P1 - 113.42max) fps -20%
Average NVIDIA GeForce RTX 3080
  (70.9 - 71.3, n=2)
71.1 fps -20%
Average NVIDIA GeForce RTX 2080 Ti (Desktop)
 
55.8 fps -37%
AMD Radeon RX 6900 XT
AMD Ryzen 9 5950X, AMD Radeon RX 6900 XT
55.6 (35.81min, 41.86P1 - 76.28max) fps -37%
AMD Radeon RX 6900 XT
AMD Ryzen 9 5950X, AMD Radeon RX 6900 XT (SAM ENABLED)
55.5 (36.48min, 43.27P1 - 76.42max) fps -37%
Average NVIDIA Titan RTX
 
55.4 fps -38%
Average NVIDIA GeForce RTX 3070
  (51.7 - 61, n=4)
55.1 fps -38%
Zotac Gaming GeForce RTX 3070 Twin Edge
AMD Ryzen 9 5950X, NVIDIA GeForce RTX 3070
51.7 (15.03min, 25.28P1 - 71.97max) fps -42%
NVIDIA GeForce RTX 3060 Ti Founders Edition
AMD Ryzen 9 5950X, NVIDIA GeForce RTX 3060 Ti
48.3 (26.43min, 38.03P1 - 84.29max) fps -46%
Metro Exodus
3840x2160 Ultra Quality AF:16x
Zotac Gaming GeForce RTX 3090 Ti AMP Extreme Holo
AMD Ryzen 7 5800X3D, NVIDIA GeForce RTX 3090 Ti
84.3 (52.3min - 132.19max) fps
Average NVIDIA GeForce RTX 3080 Ti
  (74.2 - 77.1, n=4)
75.7 fps -10%
Average NVIDIA GeForce RTX 3090
  (70.6 - 77.3, n=12)
75 fps -11%
NVIDIA GeForce RTX 3080 Ti Founders Edition
AMD Ryzen 7 5800X, NVIDIA GeForce RTX 3080 Ti
74.2 (43.62min - 125.9max) fps -12%
Nvidia GeForce RTX 3090 Founders Edition
AMD Ryzen 9 5900X, NVIDIA GeForce RTX 3090
70.6 (41.43min - 118.98max) fps -16%
AMD Radeon RX 6900 XT
AMD Ryzen 9 5950X, AMD Radeon RX 6900 XT
66.7 (42.71min - 92.25max) fps -21%
Average NVIDIA GeForce RTX 3080
  (64.1 - 65.9, n=2)
65 fps -23%
AMD Radeon RX 6800 XT
AMD Ryzen 9 5950X, AMD Radeon RX 6800 XT
56.3 (40.14min - 64.28max) fps -33%
Average NVIDIA Titan RTX
  (51.3 - 57.9, n=27)
54.9 fps -35%
Average NVIDIA GeForce RTX 2080 Ti (Desktop)
  (47.5 - 51, n=3)
49.7 fps -41%
Average NVIDIA GeForce RTX 3070
  (48.3 - 49.7, n=5)
48.9 fps -42%
Zotac Gaming GeForce RTX 3070 Twin Edge
AMD Ryzen 9 5950X, NVIDIA GeForce RTX 3070
48.3 (29.65min - 105.2max) fps -43%
NVIDIA GeForce RTX 3060 Ti Founders Edition
AMD Ryzen 9 5950X, NVIDIA GeForce RTX 3060 Ti
42.7 (25.98min - 91.32max) fps -49%
2560x1440 Ultra Quality AF:16x
Zotac Gaming GeForce RTX 3090 Ti AMP Extreme Holo
AMD Ryzen 7 5800X3D, NVIDIA GeForce RTX 3090 Ti
125.3 (64.48min - 207.3max) fps
Average NVIDIA GeForce RTX 3080 Ti
  (110 - 118, n=4)
114 fps -9%
Average NVIDIA GeForce RTX 3090
  (102 - 118.2, n=12)
113.2 fps -10%
NVIDIA GeForce RTX 3080 Ti Founders Edition
AMD Ryzen 7 5800X, NVIDIA GeForce RTX 3080 Ti
110 (55.44min - 188.15max) fps -12%
Nvidia GeForce RTX 3090 Founders Edition
AMD Ryzen 9 5900X, NVIDIA GeForce RTX 3090
106 (54.88min - 173.25max) fps -15%
AMD Radeon RX 6900 XT
AMD Ryzen 9 5950X, AMD Radeon RX 6900 XT
102 (59.52min - 156.84max) fps -19%
Average NVIDIA GeForce RTX 3080
  (92.2 - 97.4, n=2)
94.8 fps -24%
AMD Radeon RX 6800 XT
AMD Ryzen 9 5950X, AMD Radeon RX 6800 XT
94.6 (55.44min - 143.68max) fps -25%
Average NVIDIA Titan RTX
  (69 - 92.9, n=26)
84 fps -33%
Average NVIDIA GeForce RTX 3070
  (74.4 - 78.3, n=5)
75.8 fps -40%
Zotac Gaming GeForce RTX 3070 Twin Edge
AMD Ryzen 9 5950X, NVIDIA GeForce RTX 3070
75.4 (39.91min - 127.26max) fps -40%
Average NVIDIA GeForce RTX 2080 Ti (Desktop)
  (71.9 - 77.9, n=3)
75.3 fps -40%
NVIDIA GeForce RTX 3060 Ti Founders Edition
AMD Ryzen 9 5950X, NVIDIA GeForce RTX 3060 Ti
66.2 (36.92min - 129.84max) fps -47%
1920x1080 Ultra Quality AF:16x
Zotac Gaming GeForce RTX 3090 Ti AMP Extreme Holo
AMD Ryzen 7 5800X3D, NVIDIA GeForce RTX 3090 Ti
145.9 (68.14min - 232.99max) fps
Average NVIDIA GeForce RTX 3080 Ti
  (131 - 144.2, n=5)
135.4 fps -7%
Average NVIDIA GeForce RTX 3090
  (108 - 145, n=12)
135.3 fps -7%
NVIDIA GeForce RTX 3080 Ti Founders Edition
AMD Ryzen 7 5800X, NVIDIA GeForce RTX 3080 Ti
131 (62.29min - 206.31max) fps -10%
NVIDIA GeForce RTX 3080 Ti Founders Edition
AMD Ryzen 7 5800X, NVIDIA GeForce RTX 3080 Ti
131 (62.29min - 206.31max) fps -10%
Nvidia GeForce RTX 3090 Founders Edition
AMD Ryzen 9 5900X, NVIDIA GeForce RTX 3090
124 (65.58min - 188.71max) fps -15%
AMD Radeon RX 6900 XT
AMD Ryzen 9 5950X, AMD Radeon RX 6900 XT
123 (67.67min - 199.52max) fps -16%
AMD Radeon RX 6800 XT
AMD Ryzen 9 5950X, AMD Radeon RX 6800 XT
115 (64.52min - 181.92max) fps -21%
Average NVIDIA GeForce RTX 3080
  (111 - 116, n=2)
113.5 fps -22%
Average NVIDIA Titan RTX
  (73 - 116, n=27)
102.2 fps -30%
Average NVIDIA GeForce RTX 3070
  (91.3 - 97.7, n=5)
93.9 fps -36%
Average NVIDIA GeForce RTX 2080 Ti (Desktop)
  (89.7 - 98.6, n=3)
93.8 fps -36%
Zotac Gaming GeForce RTX 3070 Twin Edge
AMD Ryzen 9 5950X, NVIDIA GeForce RTX 3070
93.6 (45.01min - 161.08max) fps -36%
NVIDIA GeForce RTX 3060 Ti Founders Edition
AMD Ryzen 9 5950X, NVIDIA GeForce RTX 3060 Ti
84.9 (43.89min - 144.89max) fps -42%
1920x1080 Ultra Quality DXR AF:16x
Zotac Gaming GeForce RTX 3090 Ti AMP Extreme Holo
AMD Ryzen 7 5800X3D, NVIDIA GeForce RTX 3090 Ti
128.5 (64.07min - 193.95max) fps
Average NVIDIA GeForce RTX 3080 Ti
  (110 - 121.2, n=4)
114.8 fps -11%
NVIDIA GeForce RTX 3080 Ti Founders Edition
AMD Ryzen 7 5800X, NVIDIA GeForce RTX 3080 Ti
112 (53.98min - 169.75max) fps -13%
Average NVIDIA GeForce RTX 3090
  (68.6 - 122.2, n=12)
111.4 fps -13%
Average NVIDIA GeForce RTX 3080
  (91.5 - 102, n=2)
96.8 fps -25%
AMD Radeon RX 6900 XT
AMD Ryzen 9 5950X, AMD Radeon RX 6900 XT
90.5 (55.53min - 126.79max) fps -30%
Average NVIDIA Titan RTX
  (69 - 95.5, n=23)
86.1 fps -33%
AMD Radeon RX 6800 XT
AMD Ryzen 9 5950X, AMD Radeon RX 6800 XT
85.5 (52.71min - 120.38max) fps -33%
Zotac Gaming GeForce RTX 3070 Twin Edge
AMD Ryzen 9 5950X, NVIDIA GeForce RTX 3070
82.1 (47.4min - 134.03max) fps -36%
Average NVIDIA GeForce RTX 2080 Ti (Desktop)
  (78.6 - 84.9, n=3)
81.8 fps -36%
Average NVIDIA GeForce RTX 3070
  (80.4 - 83, n=5)
81.6 fps -36%
NVIDIA GeForce RTX 3060 Ti Founders Edition
AMD Ryzen 9 5950X, NVIDIA GeForce RTX 3060 Ti
70.8 (38.7min - 118.79max) fps -45%
Nvidia GeForce RTX 3090 Founders Edition
AMD Ryzen 9 5900X, NVIDIA GeForce RTX 3090
68.6 (37.68min - 117.88max) fps -47%
Forza Horizon 5
3840x2160 Extreme Preset
Zotac Gaming GeForce RTX 3090 Ti AMP Extreme Holo
AMD Ryzen 7 5800X3D, NVIDIA GeForce RTX 3090 Ti
89 fps
Average NVIDIA GeForce RTX 3080 Ti
  (84 - 90, n=3)
87 fps -2%
Average NVIDIA GeForce RTX 3090
  (77 - 85, n=5)
82.2 fps -8%
Nvidia GeForce RTX 3090 Founders Edition
AMD Ryzen 9 5900X, NVIDIA GeForce RTX 3090
77 fps -13%
Average NVIDIA GeForce RTX 3080
 
75 fps -16%
Average NVIDIA GeForce RTX 3070
  (62 - 73, n=2)
67.5 fps -24%
Average NVIDIA Titan RTX
  (62 - 65, n=2)
63.5 fps -29%
2560x1440 Extreme Preset
Average NVIDIA GeForce RTX 3080 Ti
  (111 - 124, n=3)
117.3 fps +3%
Zotac Gaming GeForce RTX 3090 Ti AMP Extreme Holo
AMD Ryzen 7 5800X3D, NVIDIA GeForce RTX 3090 Ti
114 fps
Average NVIDIA GeForce RTX 3090
  (100 - 114, n=5)
108.2 fps -5%
Nvidia GeForce RTX 3090 Founders Edition
AMD Ryzen 9 5900X, NVIDIA GeForce RTX 3090
100 fps -12%
Average NVIDIA GeForce RTX 3080
 
93 fps -18%
Average NVIDIA GeForce RTX 3070
  (85 - 100, n=2)
92.5 fps -19%
Average NVIDIA Titan RTX
  (84 - 87, n=2)
85.5 fps -25%
1920x1080 Extreme Preset
Average NVIDIA GeForce RTX 3080 Ti
  (126 - 141, n=3)
132 fps +4%
Zotac Gaming GeForce RTX 3090 Ti AMP Extreme Holo
AMD Ryzen 7 5800X3D, NVIDIA GeForce RTX 3090 Ti
127 fps
Average NVIDIA GeForce RTX 3090
  (106 - 129, n=5)
120.4 fps -5%
Nvidia GeForce RTX 3090 Founders Edition
AMD Ryzen 9 5900X, NVIDIA GeForce RTX 3090
111 fps -13%
Average NVIDIA GeForce RTX 3070
  (97 - 115, n=2)
106 fps -17%
Average NVIDIA GeForce RTX 3080
 
100 fps -21%
Average NVIDIA Titan RTX
  (96 - 100, n=2)
98 fps -23%
low med. high ultraQHD4K
GTA V (2015) 179.9 151.8 146.4 179.5
The Witcher 3 (2015) 394 196.3 172.9
Dota 2 Reborn (2015) 257.7 231.2 217.1 194.1 184.2
Final Fantasy XV Benchmark (2018) 222 226 186.1 151.6 96.3
X-Plane 11.11 (2018) 169.1 158.1 135.9 115.7
Shadow of the Tomb Raider (2018) 265 257 244 184 106
Metro Exodus (2019) 213 175.2 145.9 125.3 84.3
Total War: Three Kingdoms (2019) 342.6 248.9 176.6 117.9 59.9
Control (2019) 240 209 142.5 73.9
Borderlands 3 (2019) 204 187.6 173.3 143.1 83.8
Mafia Definitive Edition (2020) 240 231 173.9 99.2
Watch Dogs Legion (2020) 171.4 154.2 130.2 107.8 70.1
Assassin´s Creed Valhalla (2020) 160 138 123 108 73
F1 2021 (2021) 537 470 242 189.3 114.9
Far Cry 6 (2021) 179 162 142 132.9 90
Call of Duty Vanguard (2021) 195.5 207 191.2 149.9 93.7
Forza Horizon 5 (2021) 200 188 127 114 89
Rainbow Six Extraction (2022) 411 347 315 290 208 116
Dying Light 2 (2022) 202 171.4 153 113.2 64.3
GRID Legends (2022) 228 202 173.4 156.6 153.2 120.5
Elden Ring (2022) 60 60 60 60 60 60
Cyberpunk 2077 1.6 (2022) 219 201 172.8 151.8 103.9 53.3
Ghostwire Tokyo (2022) 263 260 261 261 210 113.2
Tiny Tina's Wonderlands (2022) 277 231 190.2 142.6 81.1

Emissions: Excellent cooling with an onboard jet engine

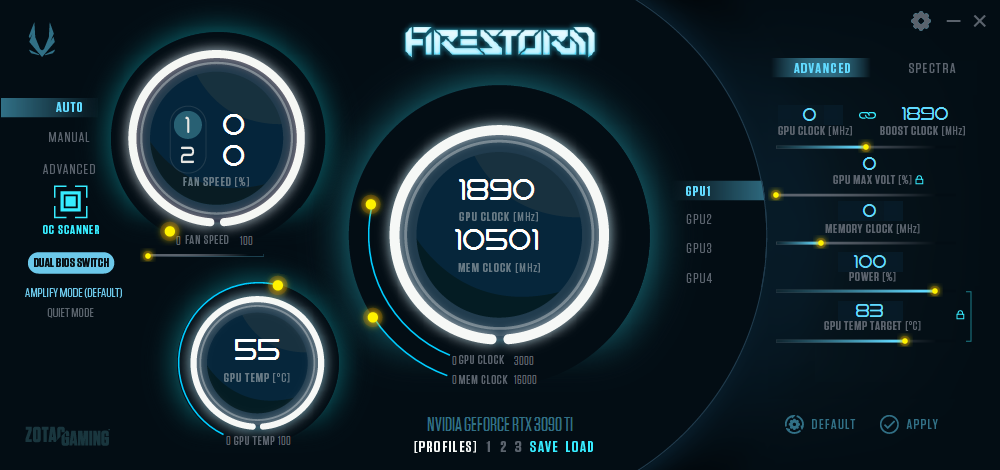
Zotac uses a triple-fan, eight heatpipe cooling mechanism dubbed IceStorm 2.0 that helps prevent thermal throttling under most workloads. The RTX 3090 Ti AMP Extreme Holo is compatible with Zotac's FireStorm utility that allows changing power and temperature targets, fan speed curves, GPU voltage, and GPU and memory clocks.

The RTX 3090 Ti AMP Extreme Holo supports a dual-BIOS function. However, there is no physical switch present on the card and you will have to resort to the FireStorm utility to toggle between Quiet and Amplify (default) modes modes, which inevitably mandates a system restart each time. You can configure up to four quick presets in the app.

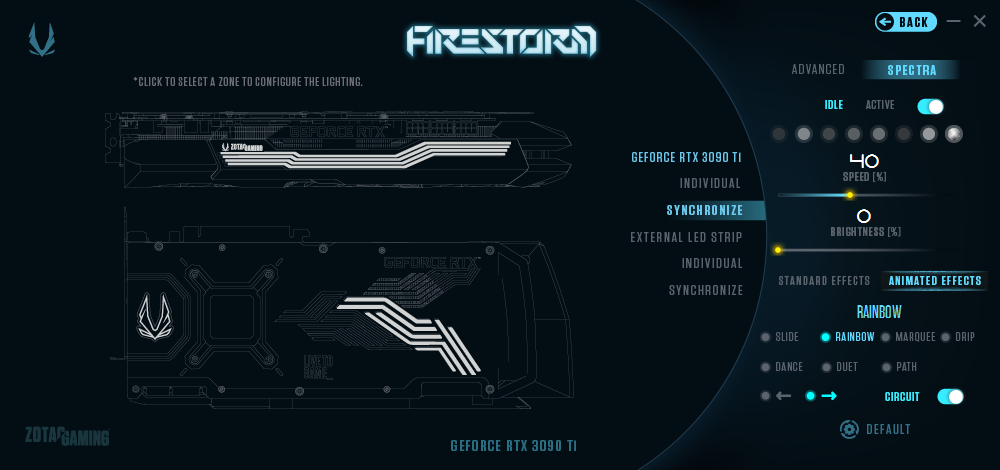
The Spectra function allows configuring RGB effects in the three designated lighting zones. The RGB lighting from the card or the attached RGB LED strip in the support bracket can be synced with the rest of the system.

Zotac FireStorm - GPU functions
Zotac FireStorm - RGB effects and lighting zones

Stress tests

The RTX 3090 Ti AMP Extreme Holo affords a nominal TGP increase of about 10% to 495 W. Our stress test results show that the card is able to operate consistently at both 100% and 110% power targets (PTs).

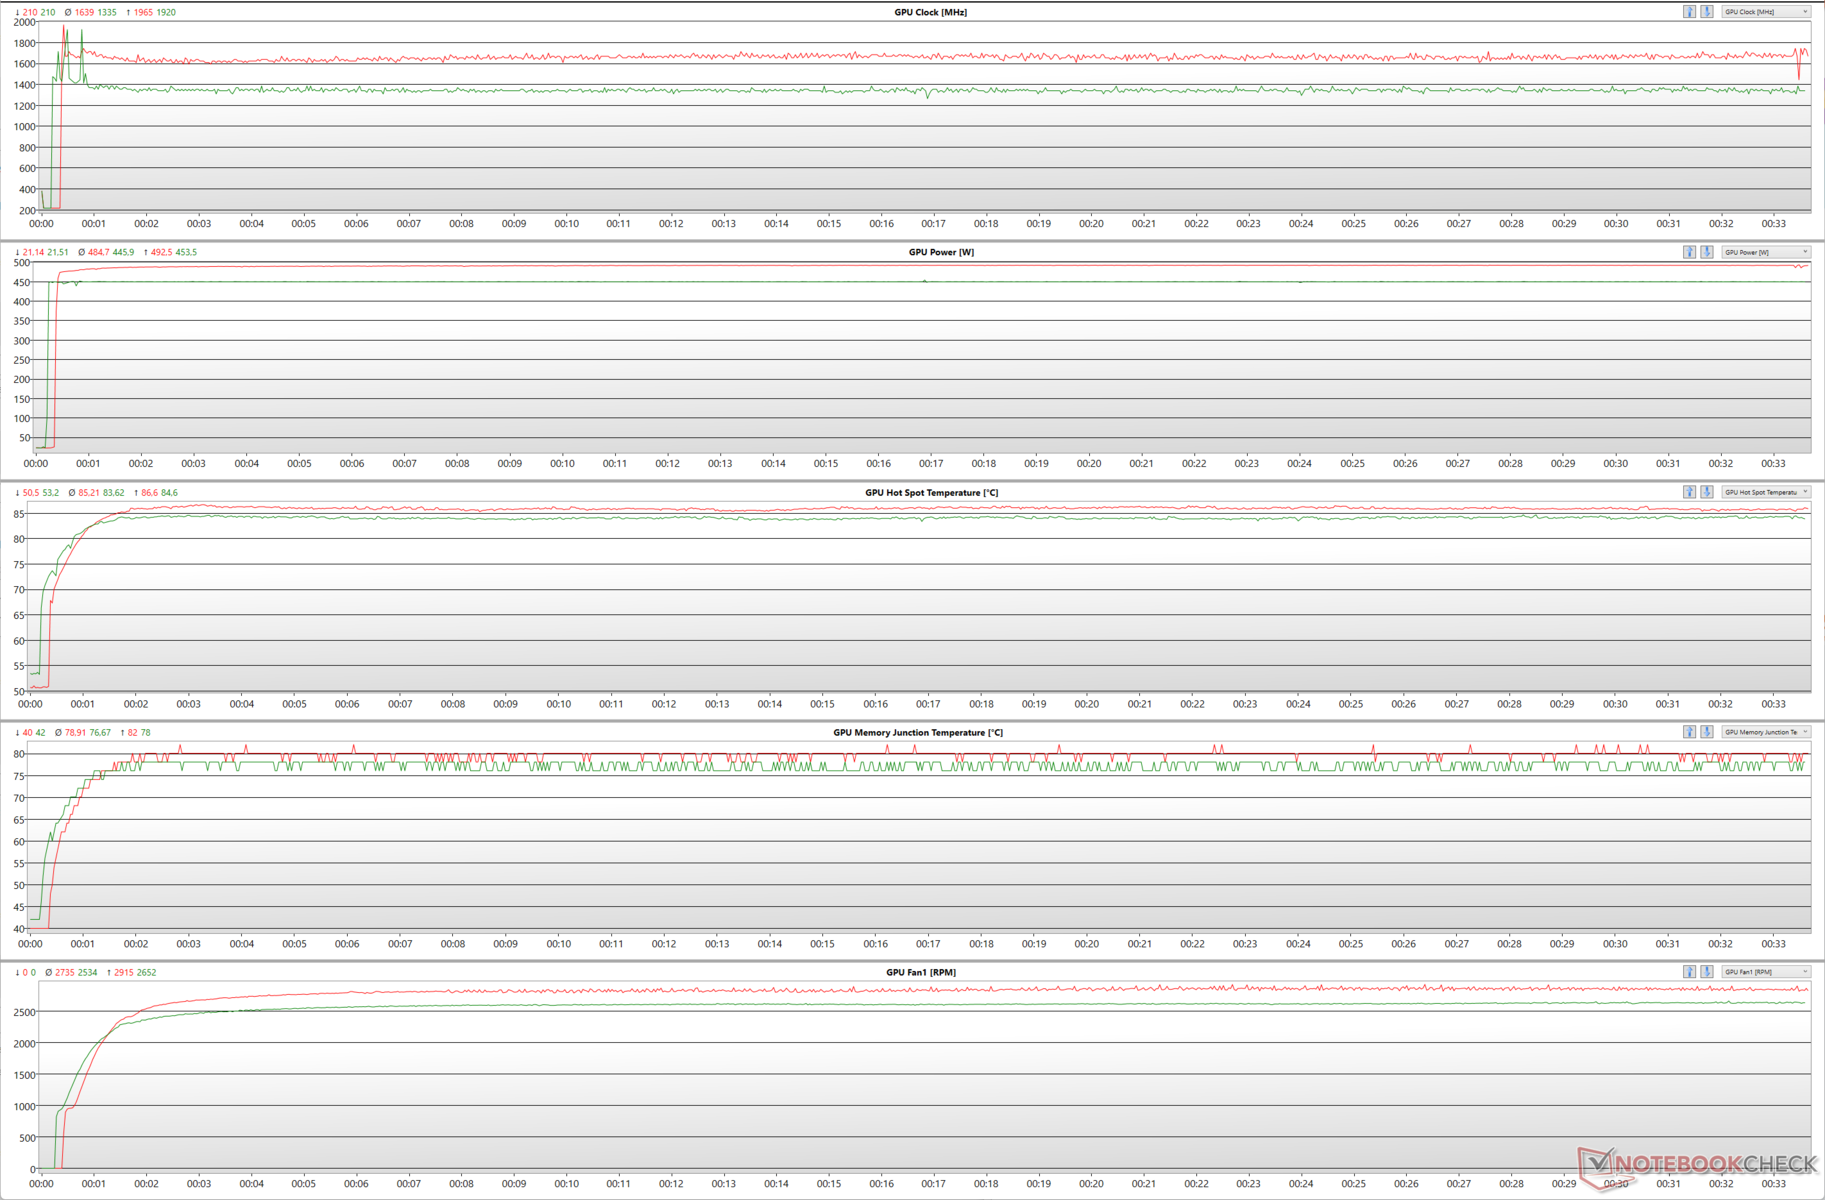
Synthetic stress with FurMark (1,280x720; AA off) at both PTs show no cooling or throttling issues. At 100% PT, we see the GPU clocks averaging close to the 1,400 MHz mark and the fan speeds just above 2,500 RPM. The hot spot temperature is just shy of 85 °C.

Increasing the TGP to 495 W results in nearly 200 MHz higher clocks just above the 1,600 MHz mark, though this results in hot spot temperatures above 85 °C and consequently higher fan speeds at almost 3,000 RPM.

In a real-world stress test with The Witcher 3 at 1080p Ultra, the RTX 3090 Ti is able to maintain ~2,100 MHz clocks highly consistently without any throttling. However, at 110% PT, we observed a ~5 °C increase in hot spot temperatures and a ~400 RPM increase in fan speeds from the default 100% PT.

GPU parameters during FurMark stress (Green - 100% PT; Red - 110% PT)
GPU parameters during The Witcher 3 stress (Green - 100% PT; Red - 110% PT)

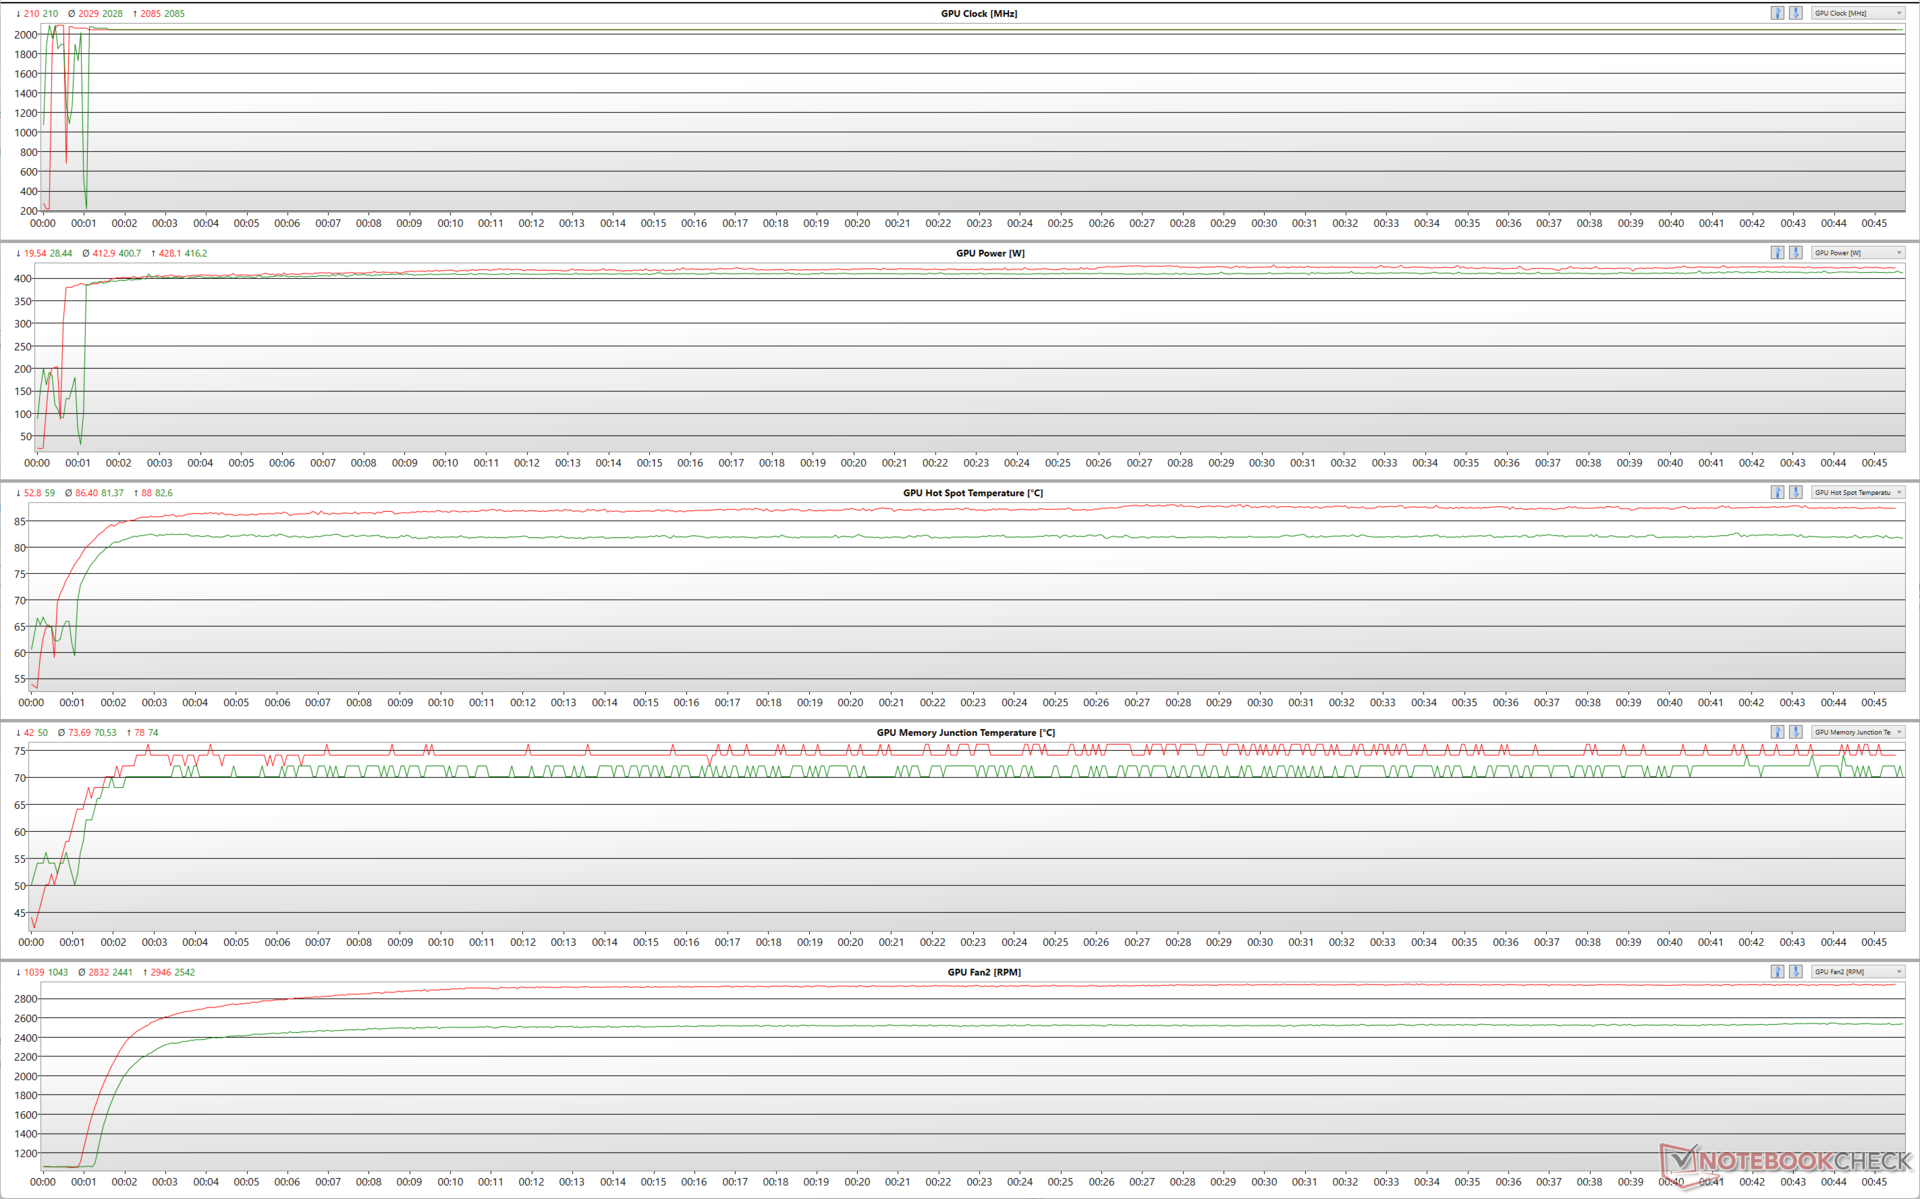
Zotac's cooling ensures near-consistent framerates without any major drops throughout the duration of The Witcher 3 stress test at 1080p Ultra. This holds true at both 100% and 110% PTs.

Overall, Zotac seems to have done an excellent job in the cooling department. However, this comes at the expense of increased fan noise as we shall soon see.

The Witcher 3 FPS Chart

0153045607590105120135150165180195Tooltip
Zotac Gaming GeForce RTX 3090 Ti AMP Extreme Holo R7 5800X3D, NVIDIA GeForce RTX 3090 Ti; 110% PT: Ø196.3 (192-200)
Zotac Gaming GeForce RTX 3090 Ti AMP Extreme Holo R7 5800X3D, NVIDIA GeForce RTX 3090 Ti; 100% PT: Ø195.3 (190-200)

Surface temperatures

Zotac RTX 3090 Ti heatmap during stress

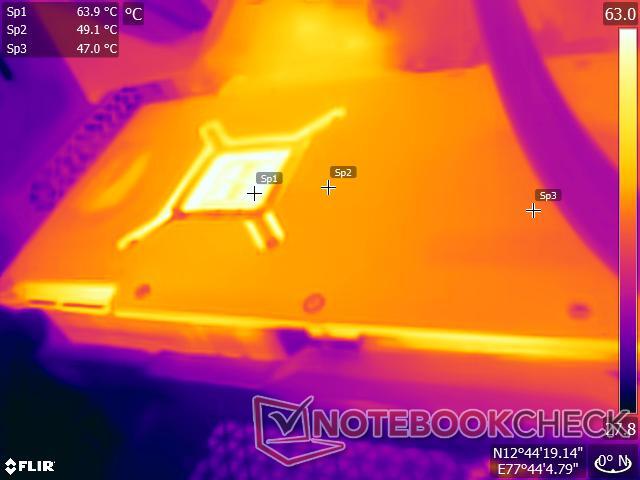
The card's metal backplate seems to be doing a good job in effective heat dissipation. We recorded about 64 °C in the GPU area and close to 50 °C near the memory and VRMs under stress in a 22 °C ambient temperature.

The card occupies the entire length of a typical ATX case, so we recommend an E-ATX case to allow for enough space around the card and for easier cable management.

Needless to say, having good case ventilation with capable intake and exhaust fans is paramount to prevent any potential heat buildup around the card itself.

Noise levels

FurMark Stress: Green - Ambient; Blue - Idle; Brown - Quiet BIOS; Red - Amplify BIOS

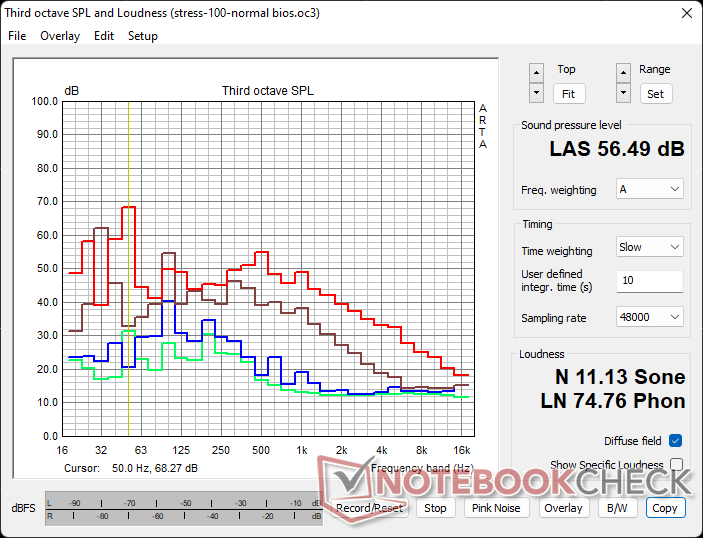
Fan noise was measured at a fixed 20 cm distance from the closed case with all other case fans turned off except the Corsair H115i Capellix AIO pump, which was set to operate in the Quiet profile.

At 100% PT, we recorded fan noise levels of 47.26 dB(A) in the Quiet BIOS mode while stressing with FurMark at 1,280x720 with AA off. Switching back to the default Amplify BIOS mode results in a 19.5% increase in fan noise levels to 56.49 dB(A).

The Witcher 3 Stress: Green - Ambient; Blue - Idle; Brown - Quiet BIOS; Red - Amplify BIOS

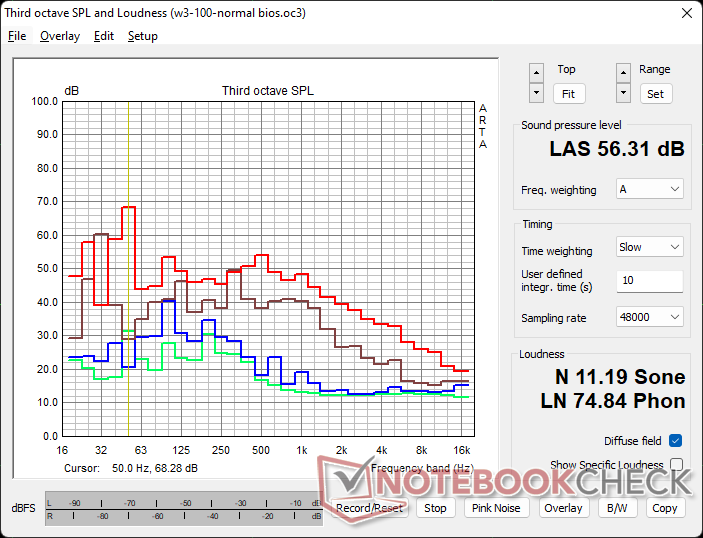
With The Witcher 3 at 1080p Ultra and 100% PT, we measured up to 48.40 dB(A) fan noise in the Quiet BIOS mode, which rises to 56.31 dB(A) in the Amplify BIOS mode.

The noise levels seem high but given the efficient cooling the fans provide, this disquieting tradeoff is a necessity. Zotac implements a complete fan-stop in idle, and users can manually adjust the fan curves as they deem fit.

Power consumption: Be prepared for bloated energy bills

Our test bench consumes 102 W in idle with a total of five fans (three Corsair SP 120 mm case fans and two Corsair ML 120 mm radiator fans) and the Elite Capellix AIO pump running in a Balanced profile with all RGB lighting turned off.

Power consumption with the RTX 3090 Ti is on the higher side as expected. In a synthetic FurMark load, we observe the average system power consumption to be close to the 600 W mark — 31% higher than a Radeon RX 6900 XT and and 19% higher than the RTX 3090 Founders Edition.

Switching between the Quiet and Amplify BIOS modes did not seem to make any difference to the average system power consumption. However, the pattern in which the system consumes power is somewhat different in both modes as seen in the graph below.

Increasing the power target by an additional 10% results in the Zotac card guzzling nearly 650 W without any real performance benefit.

Running The Witcher 3 at 1080p Ultra results in the Zotac RTX 3090 Ti being 15% and 21% dearer in energy requirement compared to the RX 6900 XT and the RTX 3090 Founders Edition, respectively at 100% PT. We observed only a minimal increase in average power consumption at 110% PT.

Power Consumption: External Monitor

03570105140175210245280315350385420455490525560595630665Tooltip
Zotac Gaming GeForce RTX 3090 Ti AMP Extreme Holo; 1280x720 FurMark 1.19 GPU Stress Test (external Monitor); 110% PT: Ø648 (629-658)
Zotac Gaming GeForce RTX 3090 Ti AMP Extreme Holo; 1280x720 FurMark 1.19 GPU Stress Test (external Monitor); 100% PT; Quiet BIOS: Ø599 (587-666)
Zotac Gaming GeForce RTX 3090 Ti AMP Extreme Holo; 1280x720 FurMark 1.19 GPU Stress Test (external Monitor); 100% PT; Amplify BIOS: Ø598 (584-608)
Zotac Gaming GeForce RTX 3090 Ti AMP Extreme Holo; 1920x1080 The Witcher 3 ultra (external Monitor); 110% PT: Ø569 (555-580)
Zotac Gaming GeForce RTX 3090 Ti AMP Extreme Holo; 1920x1080 The Witcher 3 ultra (external Monitor); 100% PT: Ø561 (533-582)
Power Consumption
1280x720 FurMark 1.19 GPU Stress Test (external Monitor)
Zotac Gaming GeForce RTX 3090 Ti AMP Extreme Holo
AMD Ryzen 7 5800X3D, NVIDIA GeForce RTX 3090 Ti (110% PT, Idle: 102 W)
648 (629min, 637P1 - 658max) Watt *
Zotac Gaming GeForce RTX 3090 Ti AMP Extreme Holo
AMD Ryzen 7 5800X3D, NVIDIA GeForce RTX 3090 Ti (100% PT; Quiet BIOS, Idle: 102 W)
599 (587min, 588P1 - 666max) Watt * +8%
Zotac Gaming GeForce RTX 3090 Ti AMP Extreme Holo
AMD Ryzen 7 5800X3D, NVIDIA GeForce RTX 3090 Ti (100% PT; Amplify BIOS, Idle: 102 W)
598 (584min, 595P1 - 608max) Watt * +8%
Nvidia GeForce RTX 3090 Founders Edition
AMD Ryzen 9 5900X, NVIDIA GeForce RTX 3090 (Idle: 91.1 W)
502 (425min - 525max) Watt * +23%
Average NVIDIA GeForce RTX 3080
  (Idle: 492 - 505, n=2 W)
499 Watt * +23%
Average NVIDIA GeForce RTX 3090
  (Idle: 281 - 551, n=7 W)
466 Watt * +28%
Average NVIDIA GeForce RTX 3080 Ti
  (Idle: 427 - 513, n=3 W)
464 Watt * +28%
AMD Radeon RX 6900 XT
AMD Ryzen 9 5950X, AMD Radeon RX 6900 XT (Idle: 99.15 W)
456.8 (378.13min - 484.67max) Watt * +30%
AMD Radeon RX 6800 XT
AMD Ryzen 9 5950X, AMD Radeon RX 6800 XT (Idle: 99.5 W)
447.9 (413min - 484max) Watt * +31%
Zotac Gaming GeForce RTX 3070 Twin Edge
AMD Ryzen 9 5950X, NVIDIA GeForce RTX 3070 (109% PT, Idle: 114.96 W)
393 (384min, 385P1 - 406max) Watt * +39%
Zotac Gaming GeForce RTX 3070 Twin Edge
AMD Ryzen 9 5950X, NVIDIA GeForce RTX 3070 (100% PT, Idle: 114.96 W)
375 (365min, 366P1 - 421max) Watt * +42%
Average NVIDIA GeForce RTX 2080 Ti (Desktop)
  (Idle: 330 - 439, n=3 W)
390 Watt * +40%
NVIDIA GeForce RTX 3060 Ti Founders Edition
AMD Ryzen 9 5950X, NVIDIA GeForce RTX 3060 Ti (Idle: 111.39 W)
350 (336min, 336P1 - 398max) Watt * +46%
Average NVIDIA GeForce RTX 3070
  (Idle: 281 - 393, n=6 W)
348 Watt * +46%
1920x1080 The Witcher 3 ultra (external Monitor)
Zotac Gaming GeForce RTX 3090 Ti AMP Extreme Holo
AMD Ryzen 7 5800X3D, NVIDIA GeForce RTX 3090 Ti (110% PT, Idle: 102 W)
569 (555min, 557P1 - 580max) Watt *
Zotac Gaming GeForce RTX 3090 Ti AMP Extreme Holo
AMD Ryzen 7 5800X3D, NVIDIA GeForce RTX 3090 Ti (100% PT, Idle: 102 W)
561 (533min, 542P1 - 582max) Watt * +1%
Average NVIDIA GeForce RTX 3090
  (Idle: 464 - 597, n=16 W)
523 Watt * +8%
Average NVIDIA GeForce RTX 3080 Ti
  (Idle: 490 - 528, n=3 W)
506 Watt * +11%
AMD Radeon RX 6800 XT
AMD Ryzen 9 5950X, AMD Radeon RX 6800 XT (Idle: 99.5 W)
505 (389min - 543max) Watt * +11%
Average NVIDIA GeForce RTX 3080
  (Idle: 498 - 505, n=2 W)
502 Watt * +12%
AMD Radeon RX 6900 XT
AMD Ryzen 9 5950X, AMD Radeon RX 6900 XT (Idle: 99.15 W)
488.3 (459.99min - 512.79max) Watt * +14%
Nvidia GeForce RTX 3090 Founders Edition
AMD Ryzen 9 5900X, NVIDIA GeForce RTX 3090 (Idle: 91.1 W)
463.7 (450min - 487max) Watt * +19%
Average NVIDIA GeForce RTX 2080 Ti (Desktop)
  (Idle: 359 - 467, n=3 W)
422 Watt * +26%
Average NVIDIA Titan RTX
  (Idle: 371 - 463, n=26 W)
407 Watt * +28%
Zotac Gaming GeForce RTX 3070 Twin Edge
AMD Ryzen 9 5950X, NVIDIA GeForce RTX 3070 (Idle: 114.96 W)
406 (397min, 399P1 - 421max) Watt * +29%
Average NVIDIA GeForce RTX 3070
  (Idle: 317 - 550, n=5 W)
401 Watt * +30%
NVIDIA GeForce RTX 3060 Ti Founders Edition
AMD Ryzen 9 5950X, NVIDIA GeForce RTX 3060 Ti (Idle: 111.39 W)
379 (270min, 364P1 - 409max) Watt * +33%

* ... smaller is better

Pros

+ Good overall build quality and included GPU support bracket
+ Full GA102 GPU and 1 TB/s Micron memory modules with ECC support
+ Chart-topping performance in synthetics and games
+ Highly effective IceStorm 2.0 cooling system
+ Dual-BIOS mode

Cons

- Individual fan build quality could be better
- Does not really warrant an immediate upgrade over existing Nvidia and AMD flagships for gaming
- High fan noise emissions
- Significantly increased power consumption for the performance on offer
- No physical BIOS switch

Verdict: Meager gains overshadowed by upcoming GPUs

Zotac Gaming GeForce RTX 3090 Ti AMP Extreme Holo GPU. Review unit courtesy of Nvidia India.

The RTX 3090 Ti becomes available at a time when gamers are only beginning to heave a sigh of relief from the arduous availability issues we've seen during the whole of last year. For all intents and purposes, the RTX 3090 Ti is only an incremental upgrade over the RTX 3090, which was already a behemoth card to begin with. The immediate advantages over an existing RTX 3090 or even the RTX 3080 Ti are not significant.

Zotac, for its part, has done a great job with the Gaming GeForce RTX 3090 Ti AMP Extreme Holo save for some minor niggles with respect to the build quality. The card nearly occupies the entire breadth of a typical ATX case, so this is something you have to factor particularly with respect to effective case cooling. You also get a handy GPU support bracket to prevent sag replete with RGB goodness. The triple 8-pin to 12-pin converter does make cable management a bit cumbersome, but that is the nature of the beast.

Having a full GA102 core as the more expensive RTX A6000 is good on paper, but you'll have to take a call whether the added burden on your purse is of any benefit to your favorite game(s) or content creation workflows.

The RTX 3090 Ti AMP Extreme Holo surely performs better than the average RTX 3090 and the RTX 3080 Ti in most tests. The increased CUDA core count and memory bandwidth see compute benchmarks being able to fully utilize the RTX 3090 Ti's potential compared to previous Nvidia flagships. The card does allow the user to configure the ECC memory state, but even professional laptop GPUs are able to comfortably ace the RTX 3090 Ti in CAD/CAM workloads owing to driver optimizations.

Improvements are noticeable in gaming benchmarks as well, especially at 4K, but the overall uplift from an RTX 3080 Ti or an RTX 3090 is unlikely to be noticed by most gamers. That being said, those into competitive gaming at lower resolutions will find the RTX 3090 Ti being able to pump frames to high refresh rate displays without breaking a sweat.

Zotac has to be commended for the excellent cooling system comprised of three fans and eight heatpipes that enable the card to perform without any major throttling issues across all tested workloads. However, this comes at the expense of high fan noise levels. The RTX 3090 Ti does not make any claims of being energy-efficient and happily guzzles all the power it can. We hear things are going to get even worse with upcoming flagship GPUs, so this is surely an area of concern.

At an MSRP of US$1,999 for the RTX 3090 Ti Founders Edition and about US$2,100 for the Zotac Gaming GeForce RTX 3090 Ti AMP Extreme Holo, the question still remains: Who is this card actually for?

If gaming is your mainstay, there are probably more cost-effective options even for 4K. The AMD Radeon RX 6900 XT retails for a whole US$1,000 less at MSRP and is a great performer if ray tracing and DLSS don't mean anything to you for the moment. The RTX 3080 Ti Founders Edition goes for about US$1,199 MSRP and makes for a decent buy if you aren't planning on storing massive render data directly in VRAM. If you're ready to shell out for the RTX 3090 Ti, the RTX 3090 Founders Edition at US$1,499 MSRP is not a bad option to consider — you still get oodles of VRAM and a near-complete GA102 die. 

Nvidia and AMD are rumored to introduce their next gen AD102 Lovelace and Navi 31 GPUs later this year. Intel is expected to enter the fray as well with the Arc Alchemist 770/780, so playing the waiting game at this stage in the card's lifecycle could be a safe bet if you're planning on a long-term investment.

The RTX 3090 Ti's complete GA102 GPU and more than 1 TB/s memory bandwidth does aid heavy-duty creative workflows and 4K Ultra gaming. For most other purposes, it's probably an overkill. 

Price and Availability

The Zotac Gaming GeForce RTX 3090 Ti AMP Extreme Holo is currently available on the Zotac Store and Amazon for US$2,099.99.

In India, the RTX 3090 Ti AMP Extreme Holo is not currently listed on Amazon but is available from other retailers including MD Computers, Prime ABGB, and others close to the ₹1,93,000 mark.

Pricecompare

static version load dynamic
Loading Comments
Comment on this article
Please share our article, every link counts!
> Expert Reviews and News on Laptops, Smartphones and Tech Innovations > Reviews > Zotac Gaming GeForce RTX 3090 Ti AMP Extreme Holo Review: 4K gaming monstrosity with a price to match
Vaidyanathan Subramaniam, 2022-05-16 (Update: 2022-07-29)