MSI Vector GP66 12UGS laptop review: 150 W TGP GeForce RTX 3070 Ti sweet spot
MSI was one of the first major players to make available 12th gen Alder Lake-H gaming laptops earlier last month. Though the new MSI models are almost visually identical to last year's 11th gen models, they carry with them faster CPUs and GPUs as well as new display options that enthusiasts can appreciate.
The unit in review today is the Vector GP66 which succeeds last year's GP66 Leopard. Our specific configuration with the Core i9-12900H CPU, 150 W GeForce RTX 3070 Ti GPU, 32 GB RAM, 360 Hz 1080p IPS display, and 1 TB NVMe SSD can be found online for about $2400 USD. Other SKUs are available with the RTX 3060, RTX 3080, QHD 165 Hz or FHD 144 Hz display, or Core i7-12700H instead.
Alternatives to the MSI Vector include other upper midrange 15.6-inch gaming laptops like the Asus ROG Strix series, Razer Blade 15 Base Model, Dell G15 series, or the Lenovo Legion S7 series. The MSI Vector should not be confused with the Maingear Vector.
More MSI reviews:
Potential Competitors in Comparison
Rating | Date | Model | Weight | Height | Size | Resolution | Price |
|---|---|---|---|---|---|---|---|
| 86.9 % v7 (old) | 03 / 2022 | MSI Vector GP66 12UGS i9-12900H, GeForce RTX 3070 Ti Laptop GPU | 2.3 kg | 23.4 mm | 15.60" | 1920x1080 | |
| 85.4 % v7 (old) | 12 / 2021 | MSI GP66 Leopard 11UH-028 i7-11800H, GeForce RTX 3080 Laptop GPU | 2.3 kg | 23.4 mm | 15.60" | 1920x1080 | |
| 79.2 % v7 (old) | 09 / 2021 | MSI Katana GF66 11UG-220 i7-11800H, GeForce RTX 3070 Laptop GPU | 2.3 kg | 25 mm | 15.60" | 1920x1080 | |
| 85.9 % v7 (old) | 06 / 2021 | Asus TUF Gaming F15 FX506HM i7-11800H, GeForce RTX 3060 Laptop GPU | 2.3 kg | 24.9 mm | 15.60" | 1920x1080 | |
| 85.5 % v7 (old) | 03 / 2021 | Razer Blade 15 Base Edition 2021, i7-10750H RTX 3060 i7-10750H, GeForce RTX 3060 Laptop GPU | 2.1 kg | 19.9 mm | 15.60" | 1920x1080 | |
| 84.7 % v7 (old) | 06 / 2021 | Alienware m15 R5 Ryzen Edition R7 5800H, GeForce RTX 3060 Laptop GPU | 2.5 kg | 22.85 mm | 15.60" | 1920x1080 |
Case
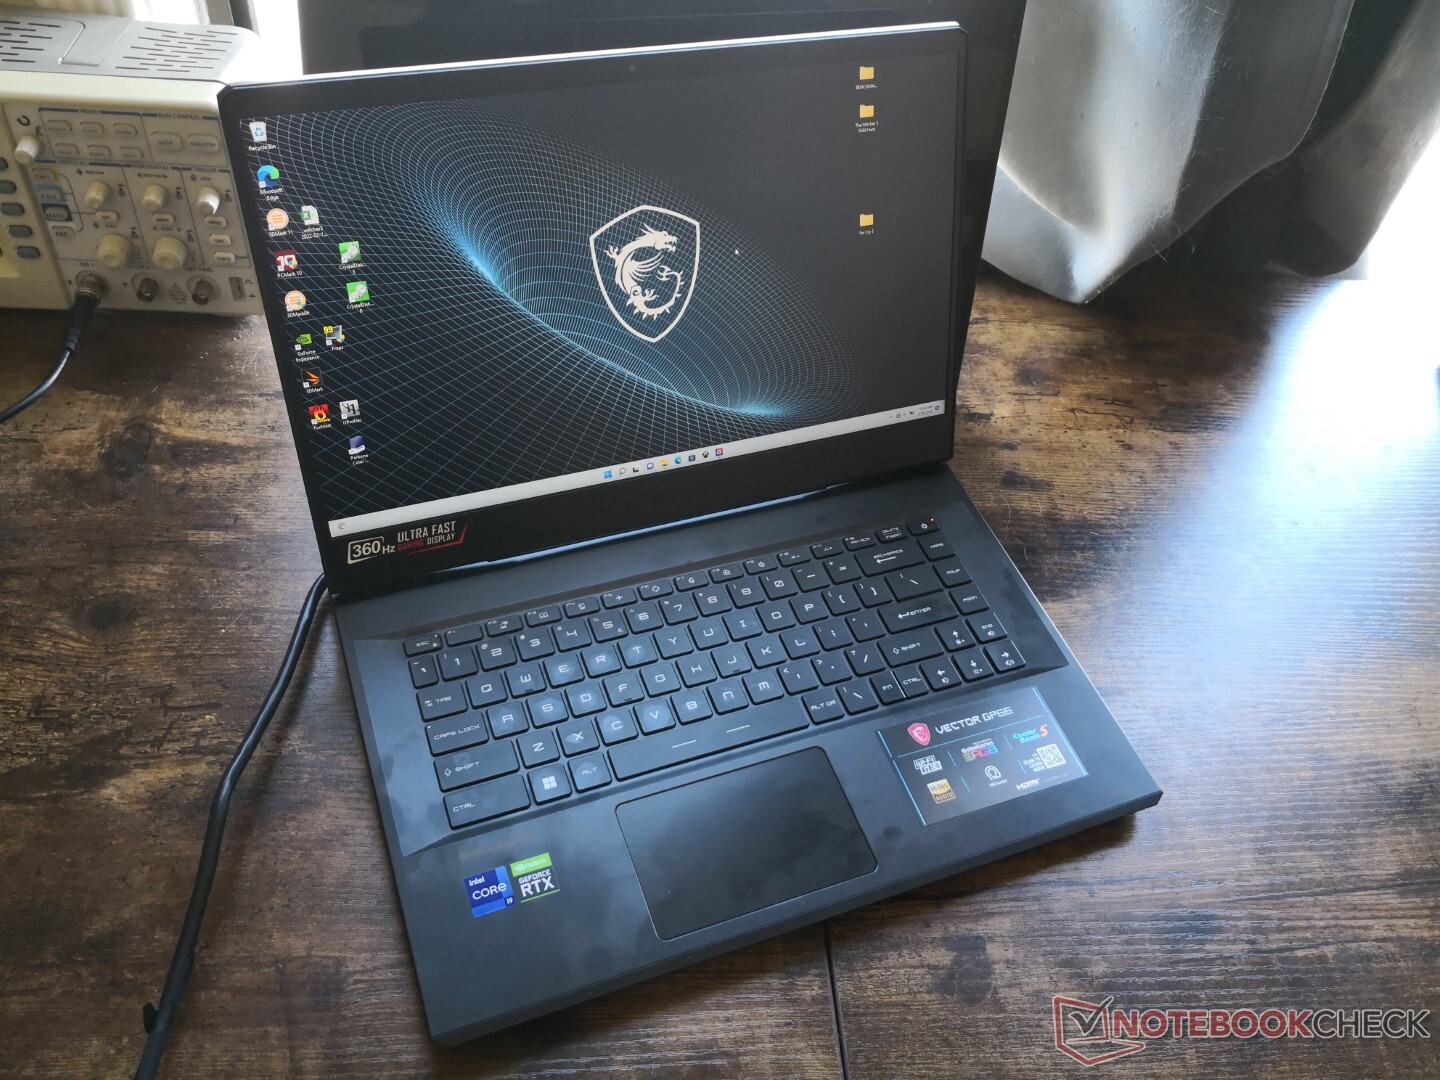
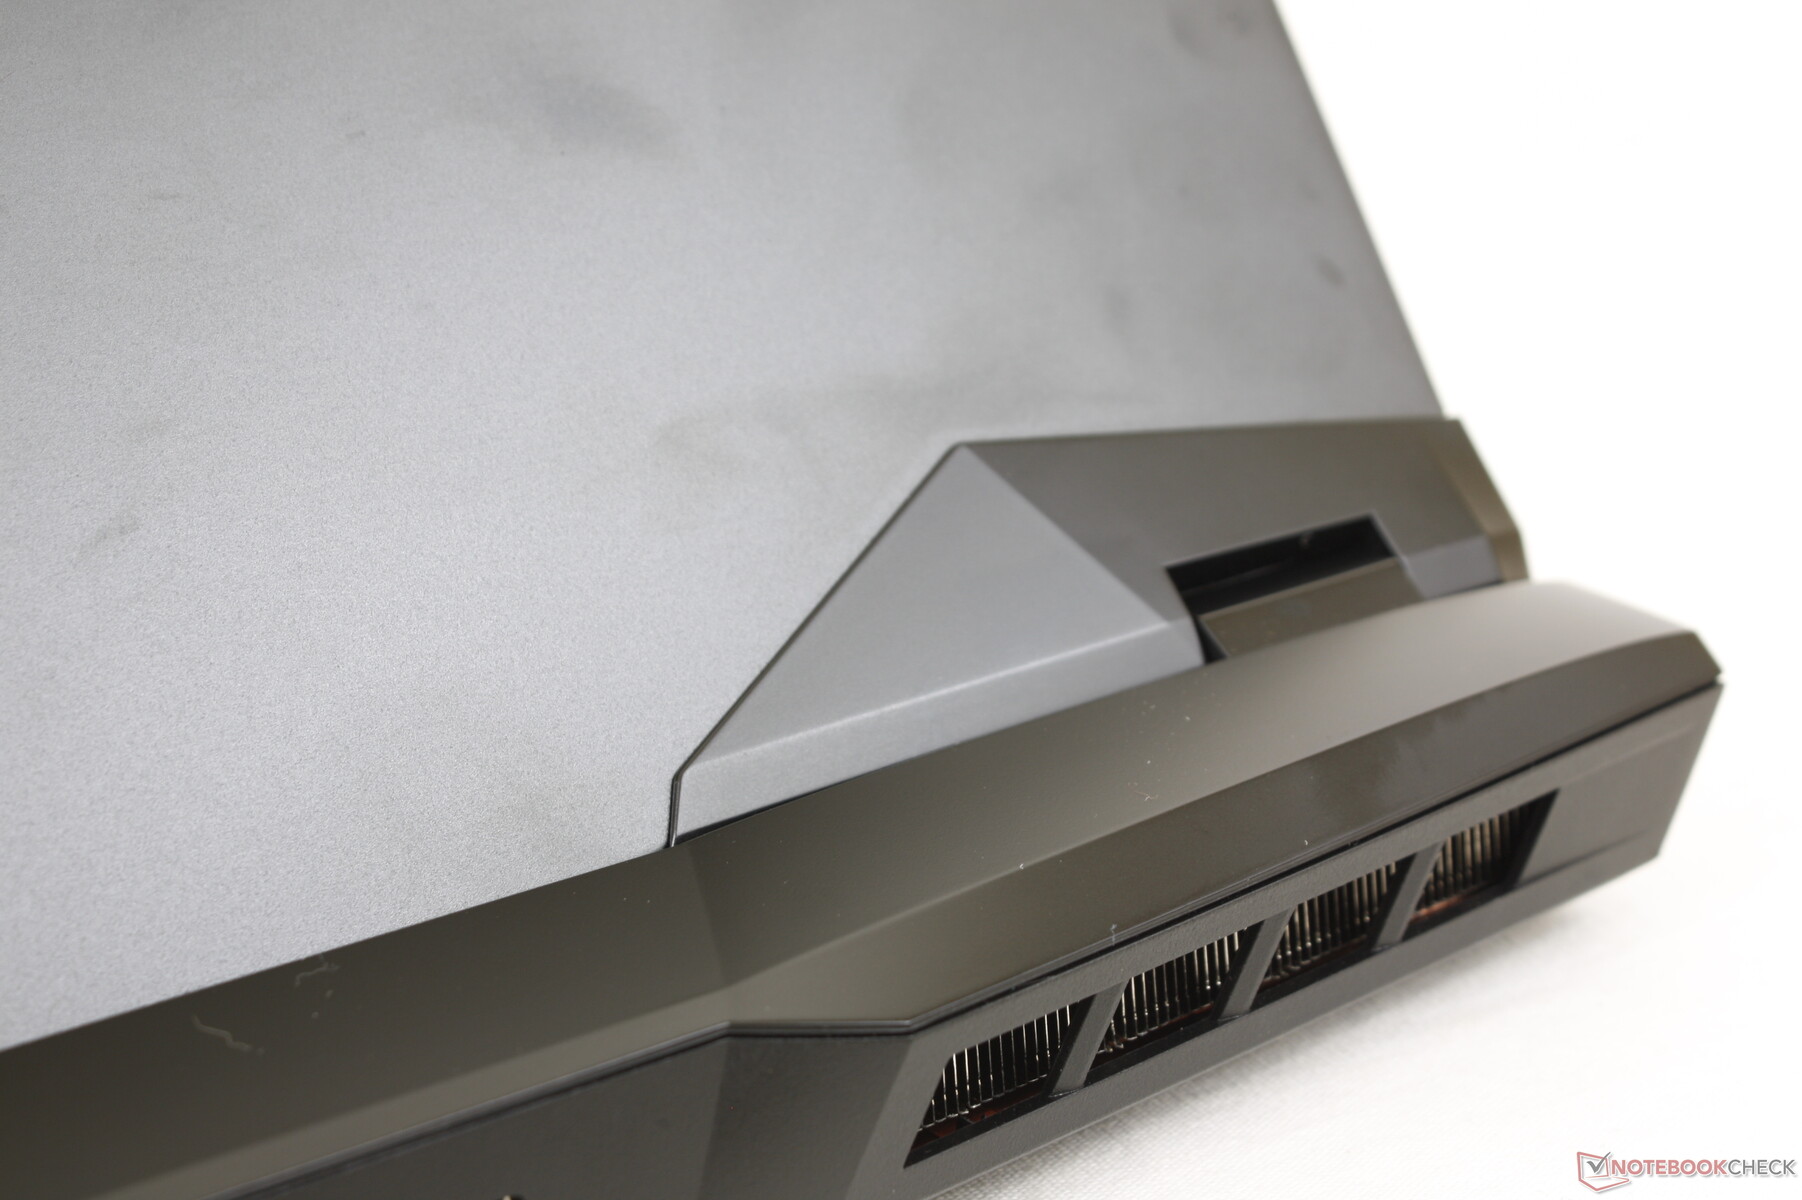
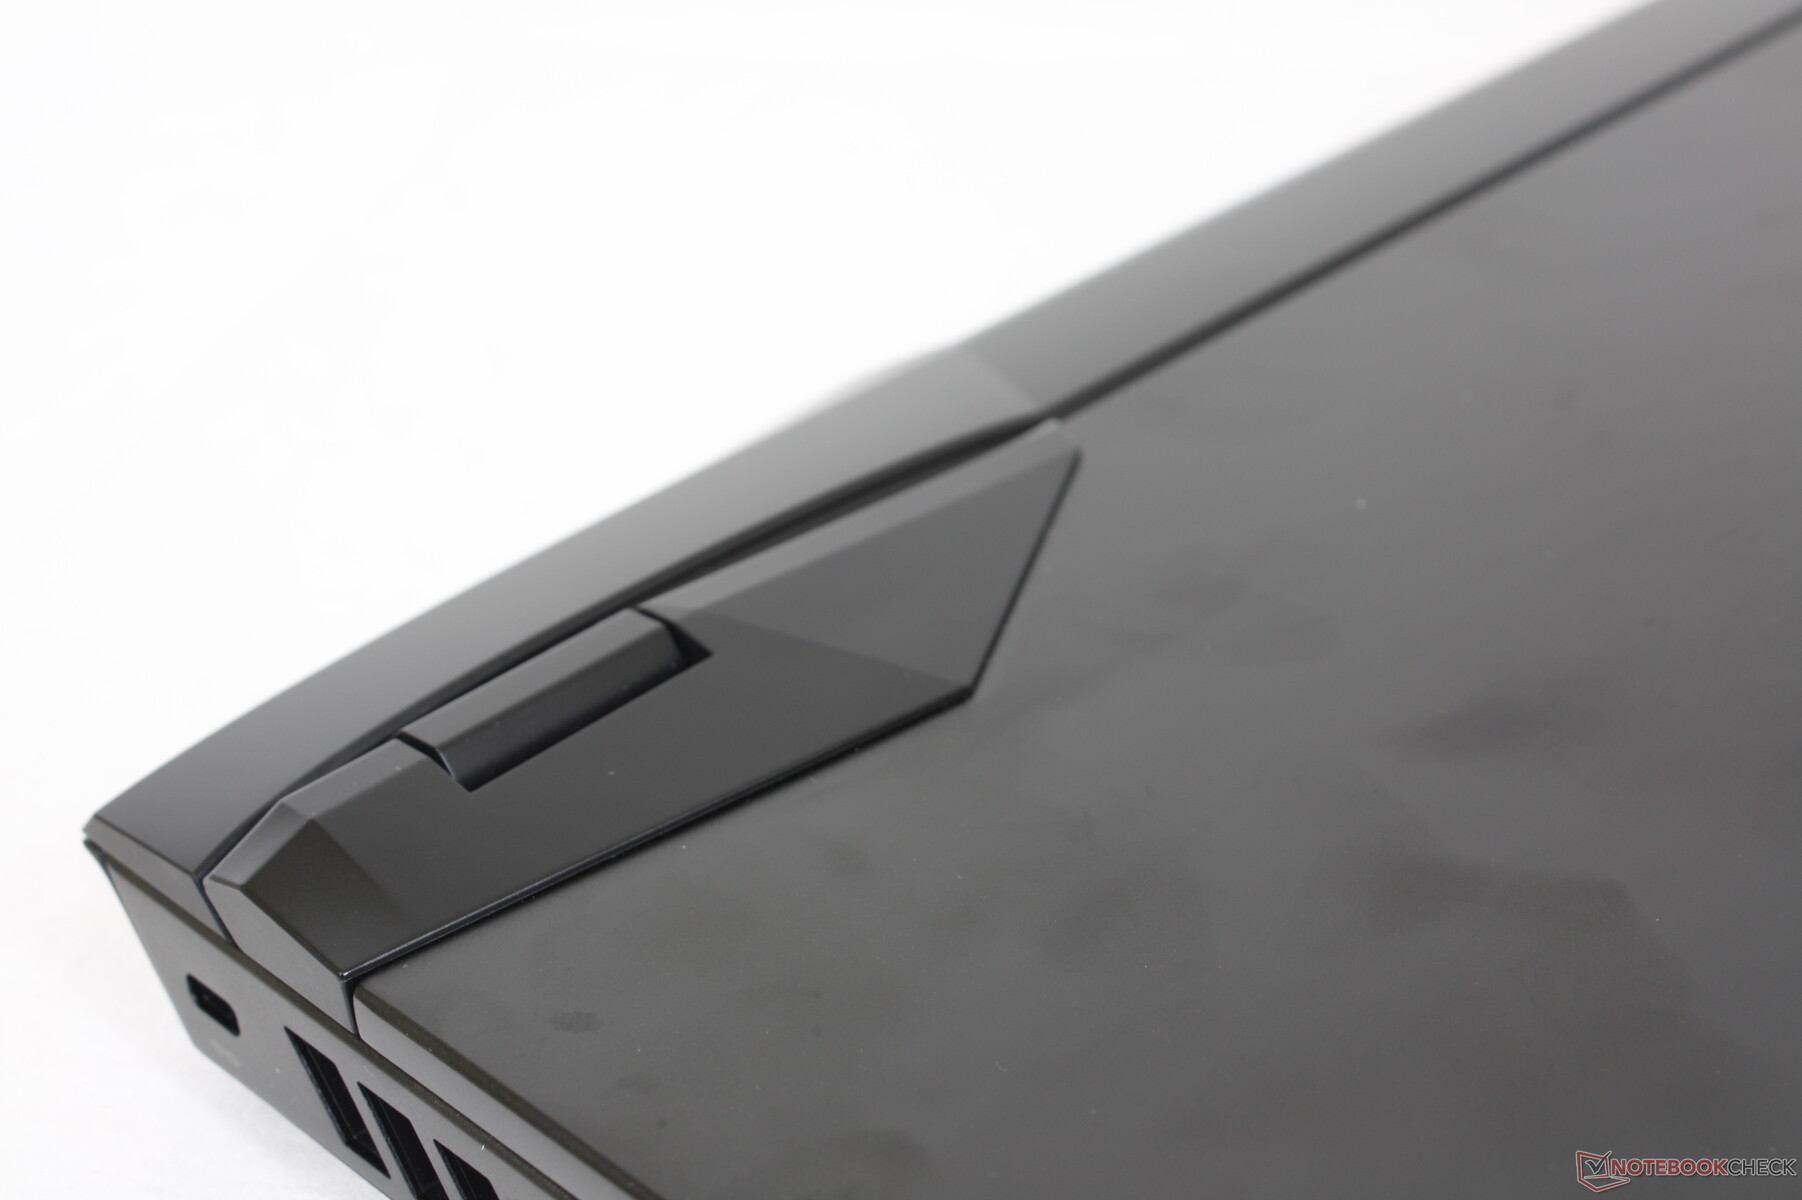
MSI redesigned its GP66 early last year and so it's still too early for another visual refresh. Thus, we recommend checking out our existing reviews on the GP66 with 10th gen Intel and GP66 with 11th gen Intel as most of our comments on the chassis still apply for our GP66 12th gen Intel model here. There are still some minor differences regarding the ports, however, which we will go over in the next section.
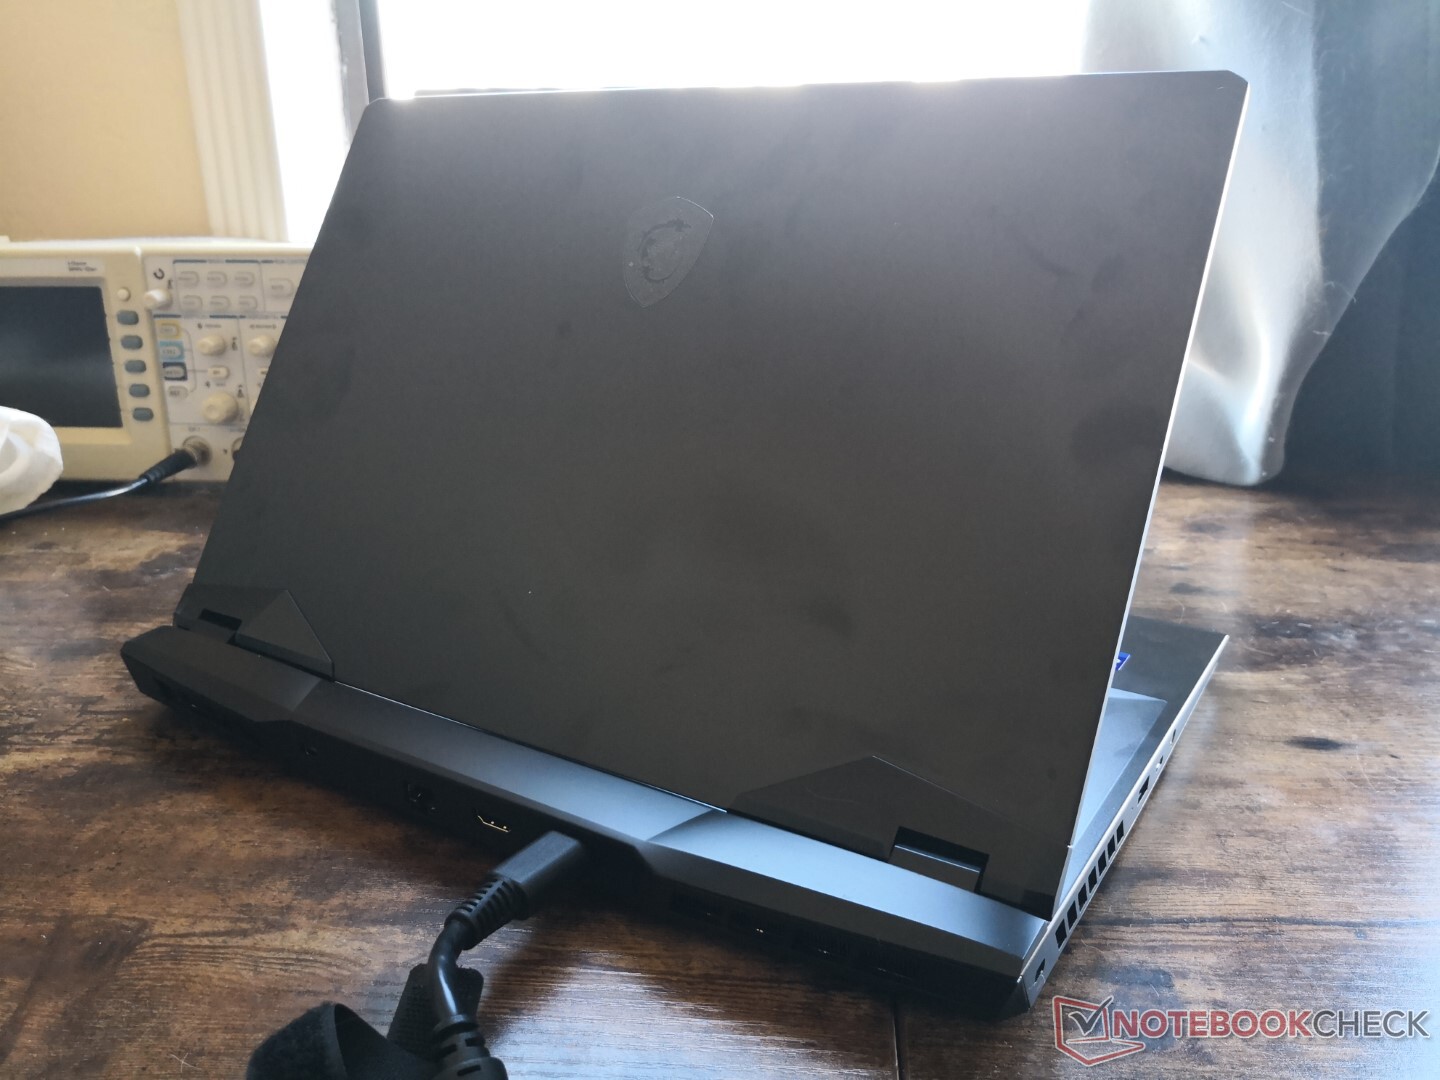
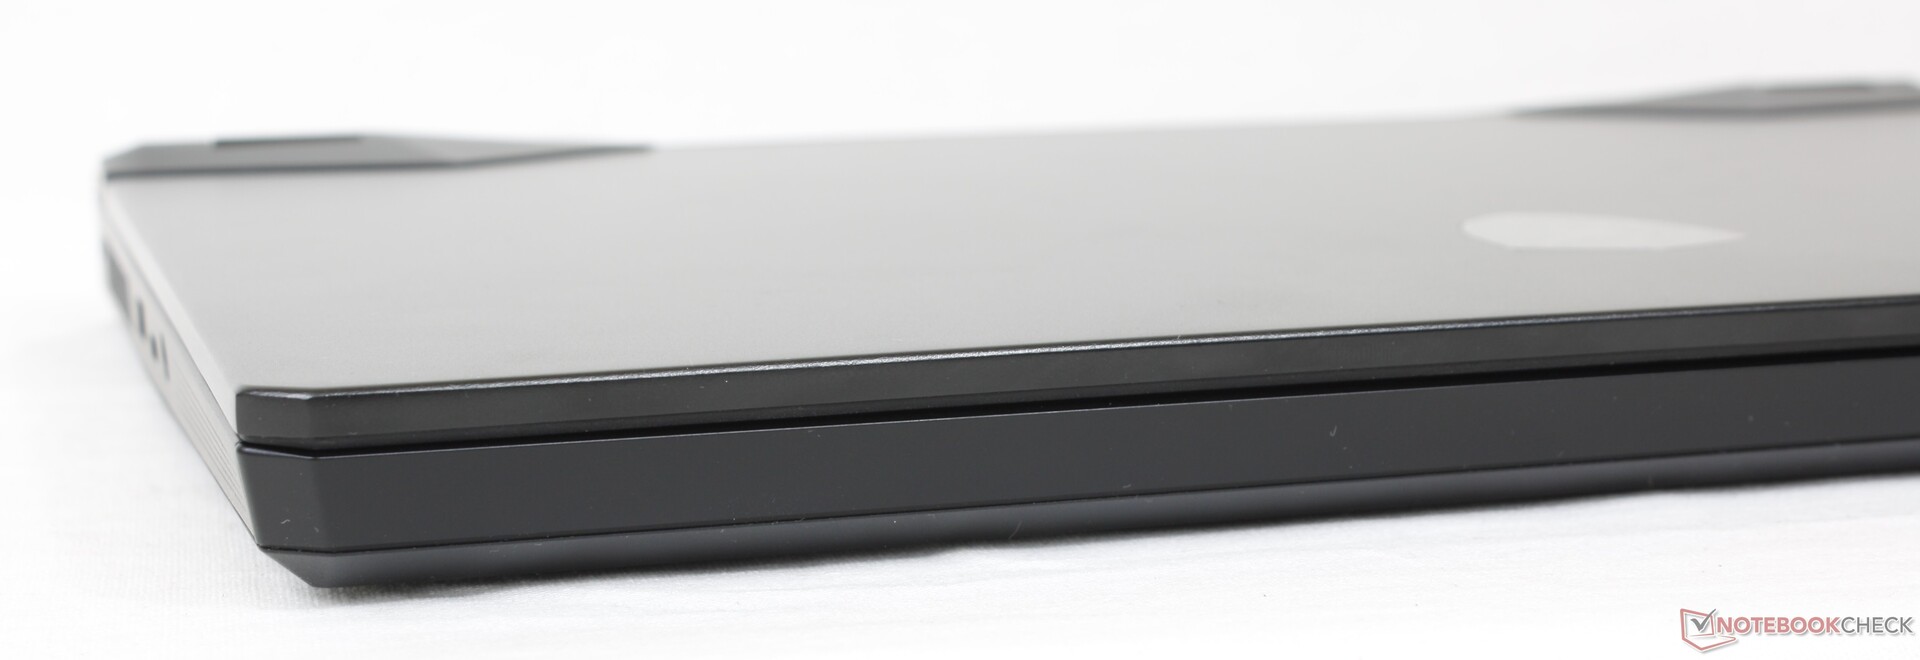
The lack of any major changes means that the 2022 Vector GP66 still suffers from the same flaws that we found on our 2021 GP66 Leopard. In particular, the front edge piece of our unit would sometimes become loose to leave less-than-positive first impressions. The visual design is otherwise a sleeker and more subtle derivative of the larger GE or GT series.

Connectivity
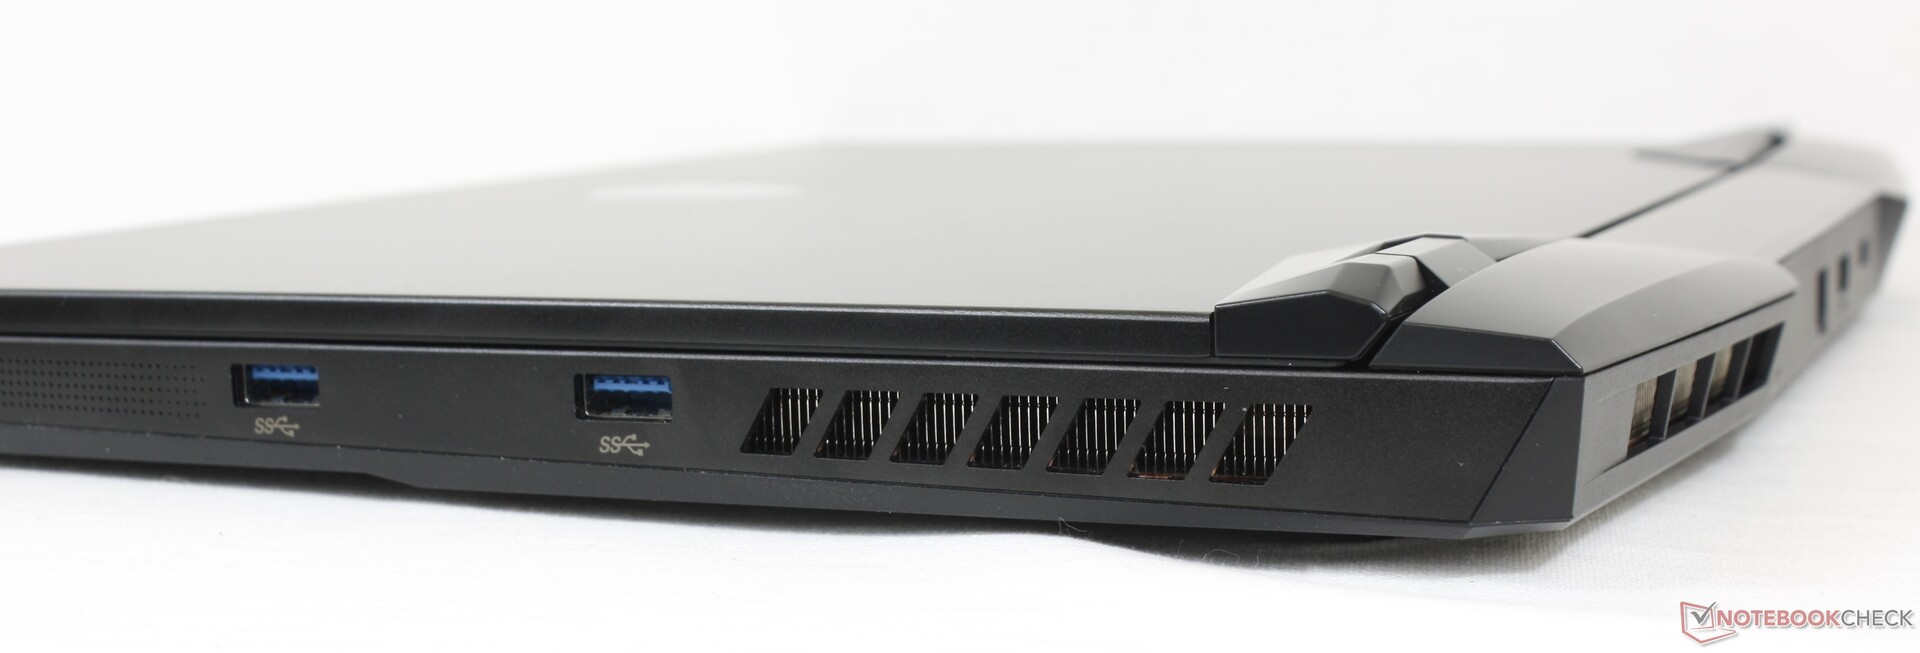
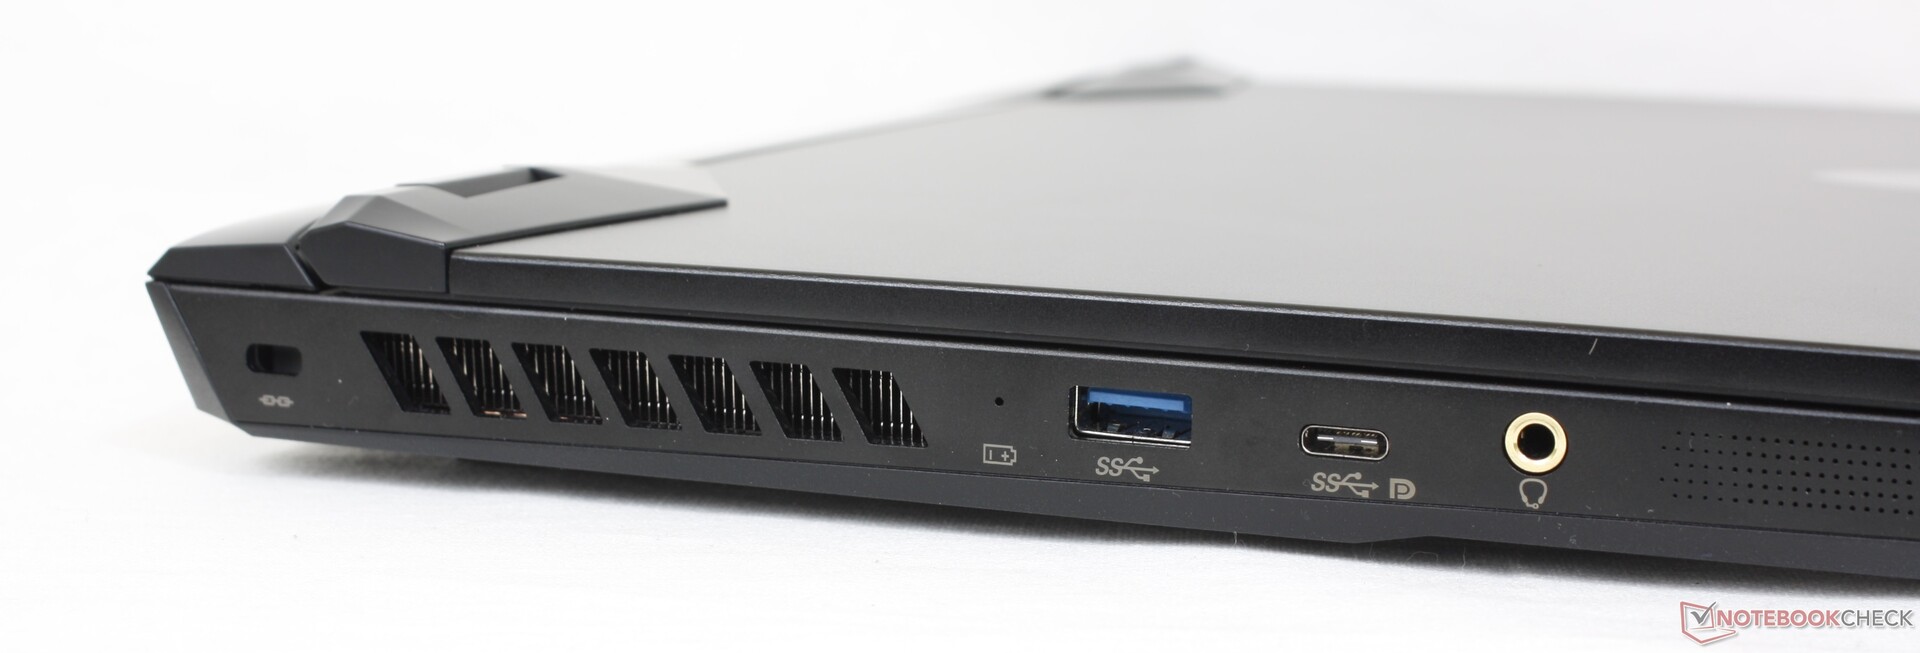
Port options are slightly different than what was offered on the GP66 Leopard. For one, the USB-C port that was along the rear of the GP66 Leopard is now along the left edge for easier access. Additionally, a mini-DisplayPort has been added for increased compatibility with external monitors supporting adaptive sync.
Note that the USB-C port continues to not support Thunderbolt. Users will have to upgrade to the pricier MSI GS, GE, or GT series for such a feature.

Communication
Webcam
The camera remains 720p and with no support for IR or Windows Hello. MSI laptops continue to use an electronic shutter instead of a physical shutter unlike on most Ultrabooks or business laptops.


Maintenance
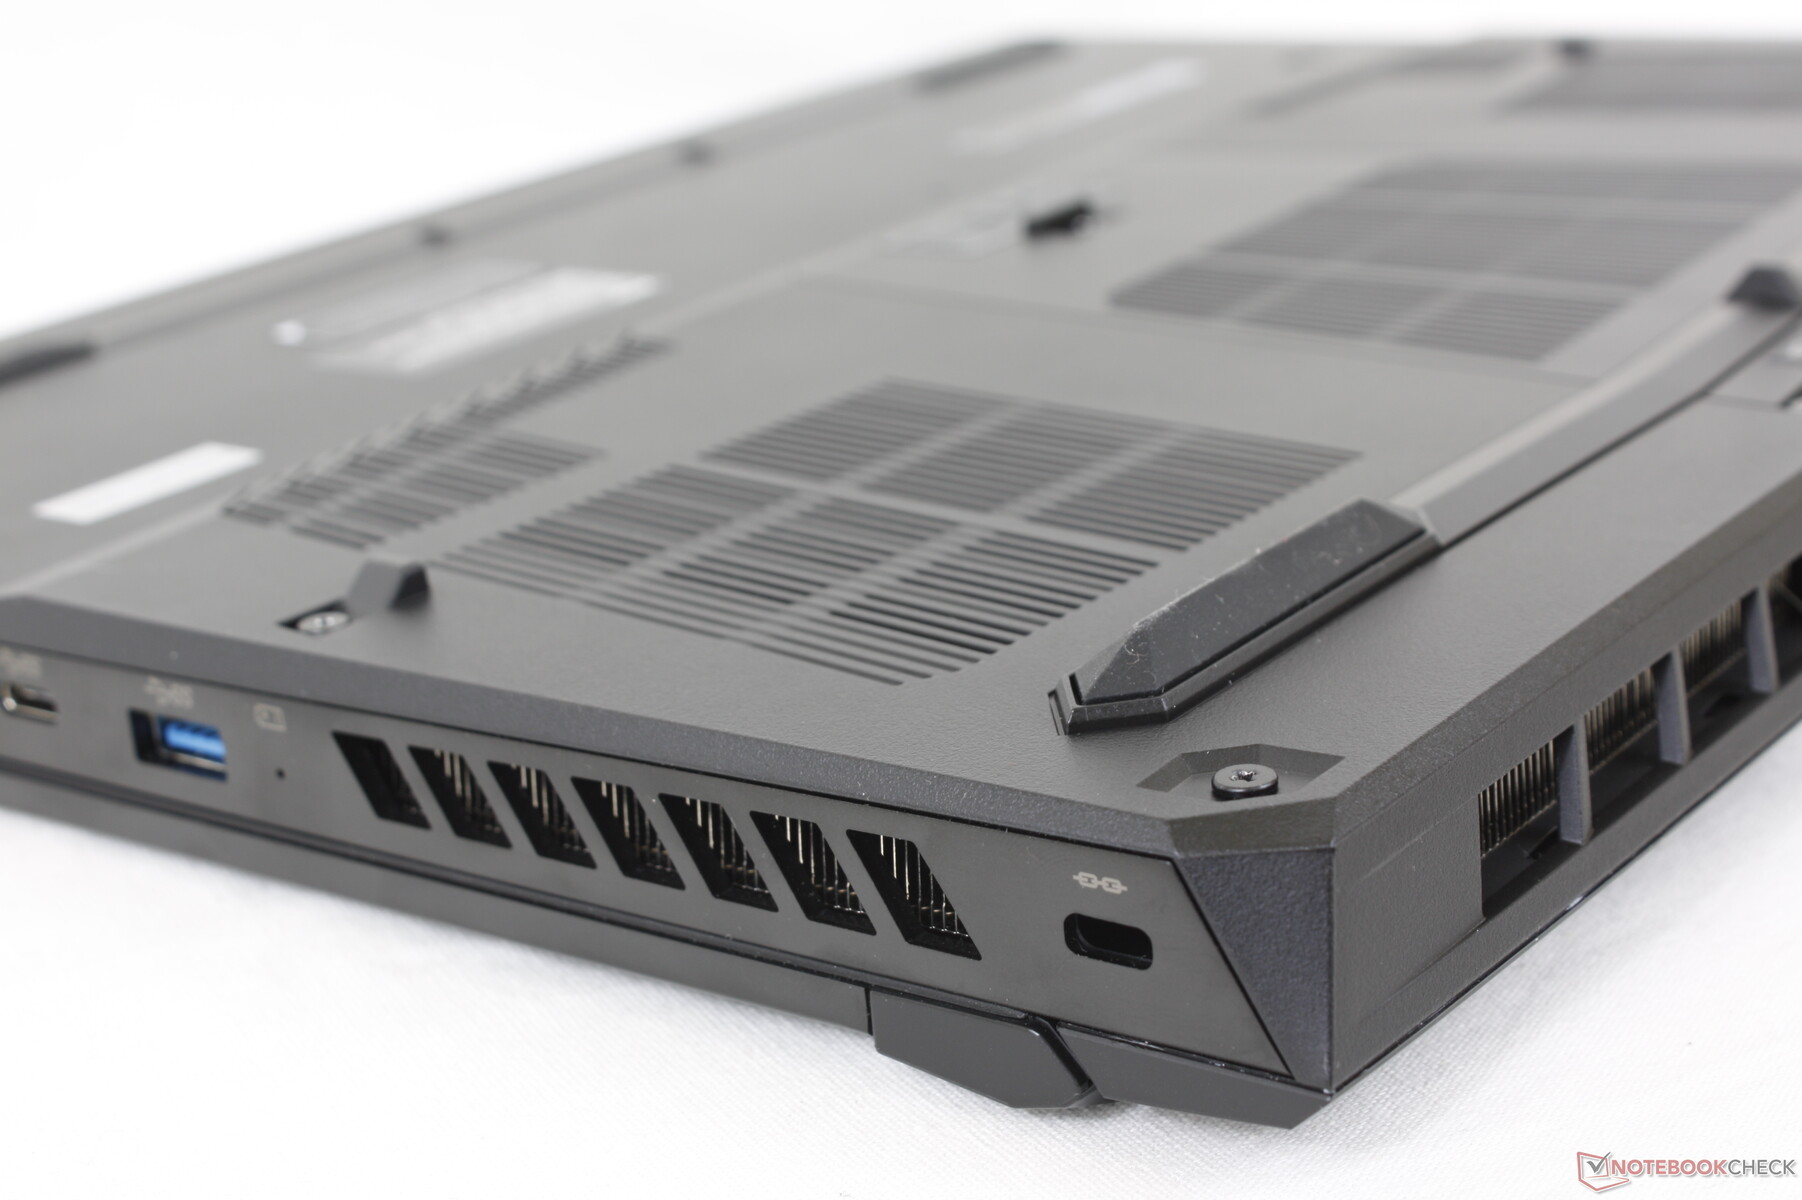
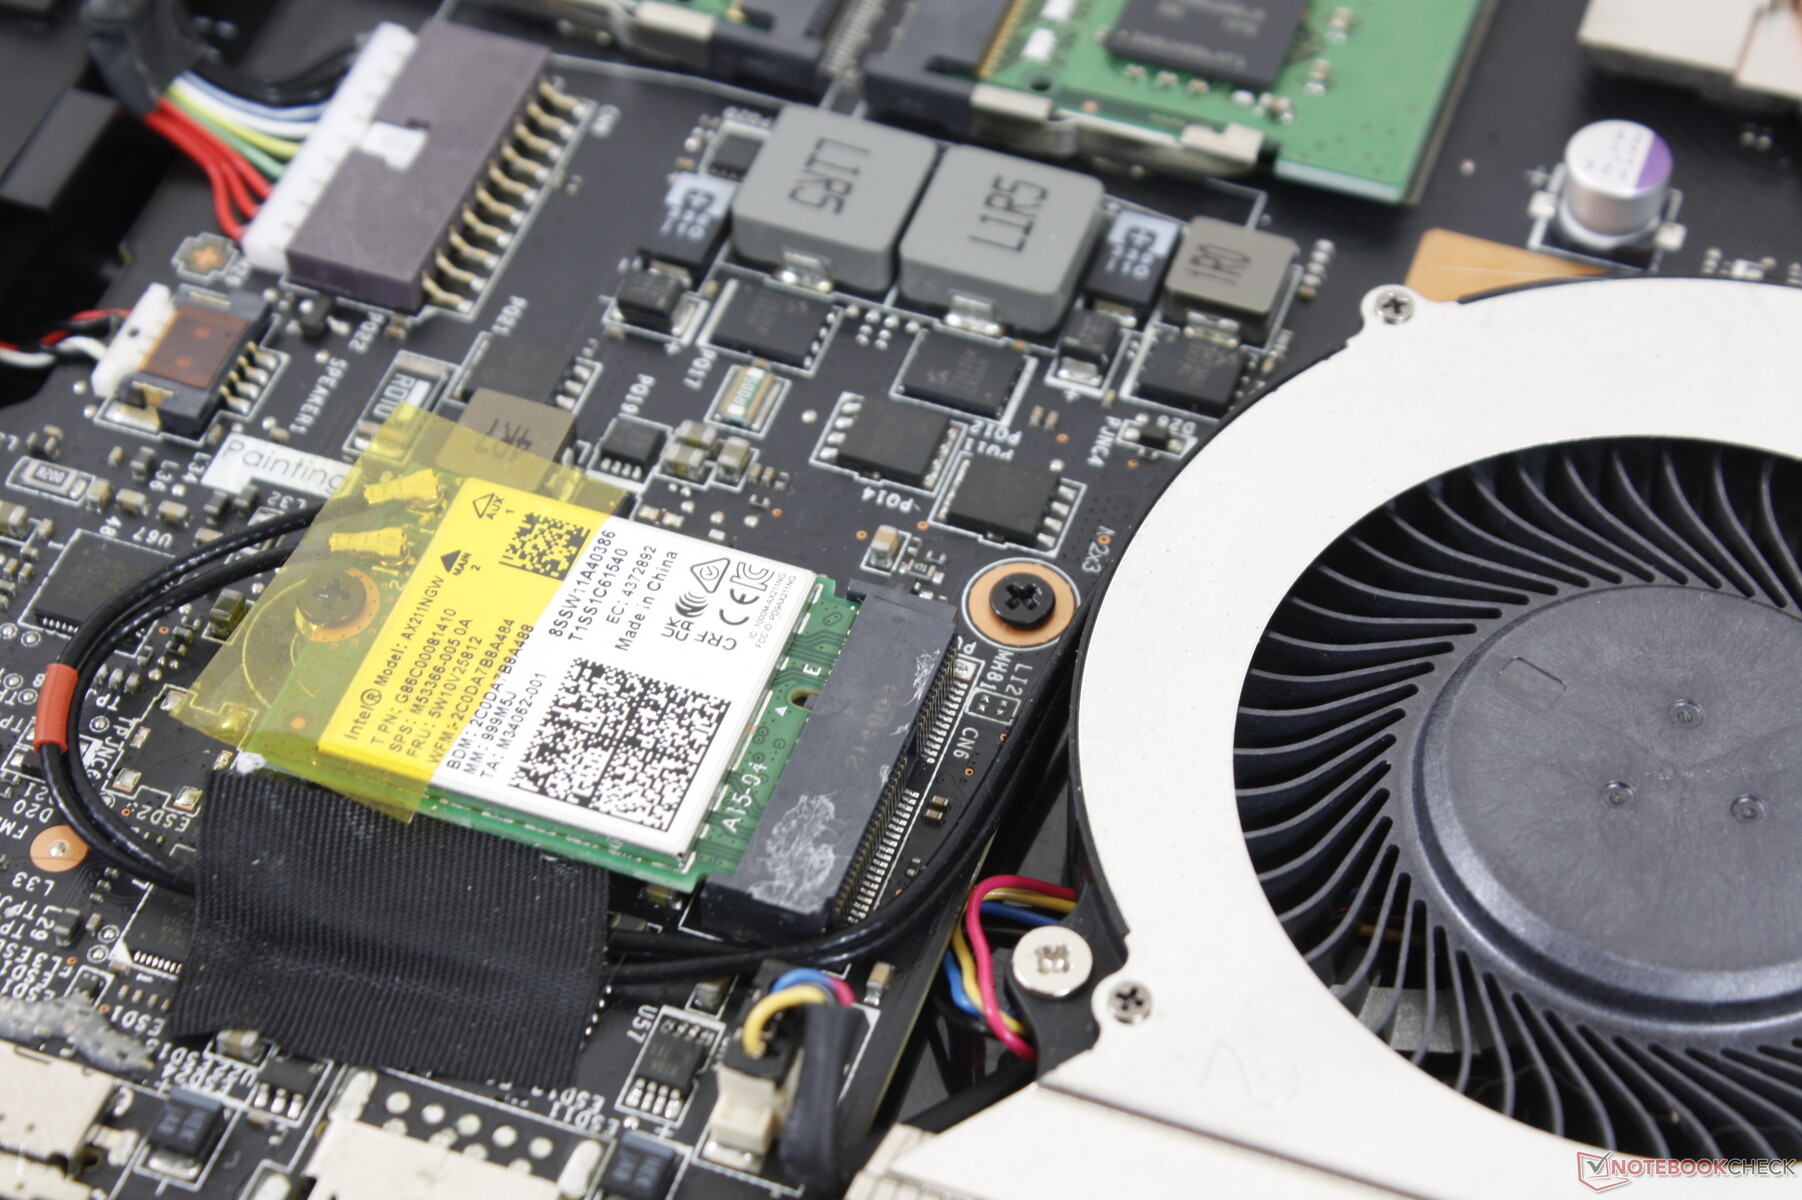
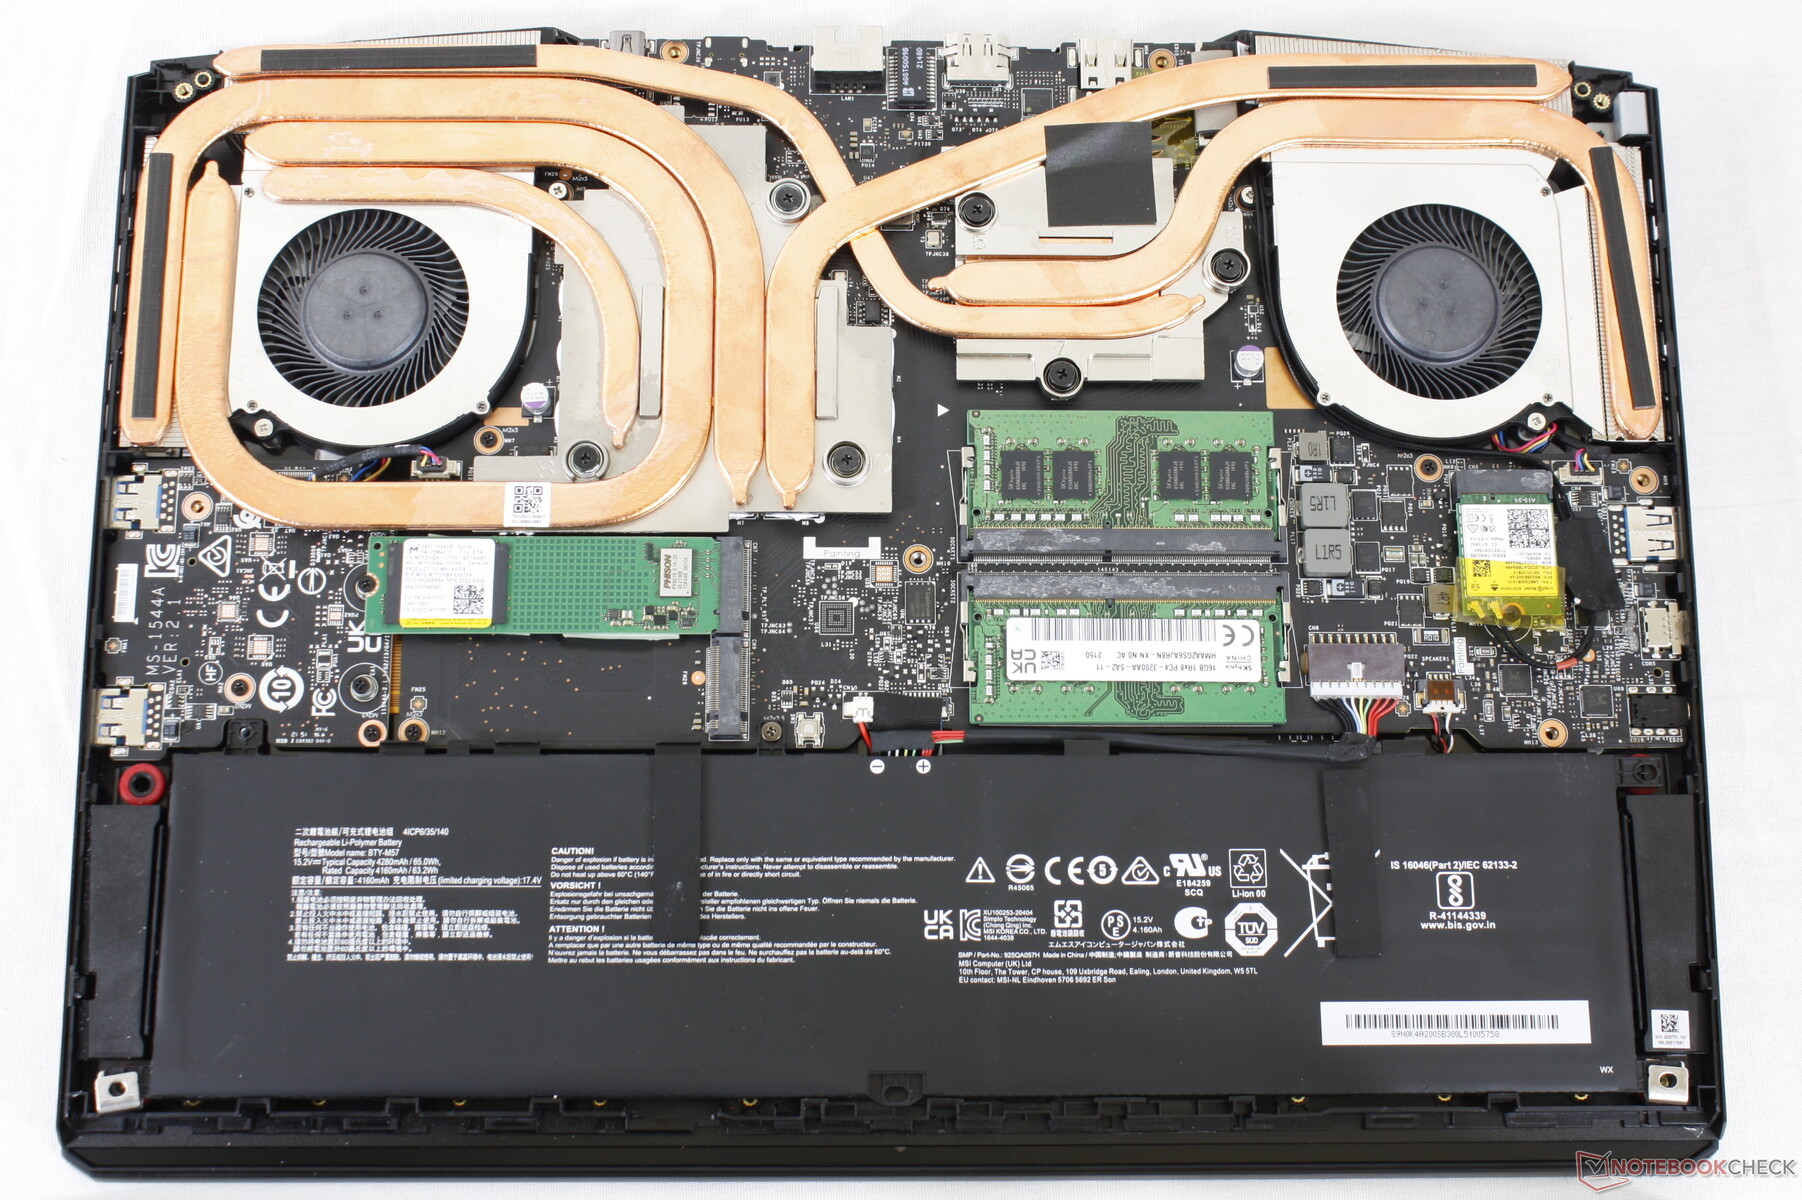
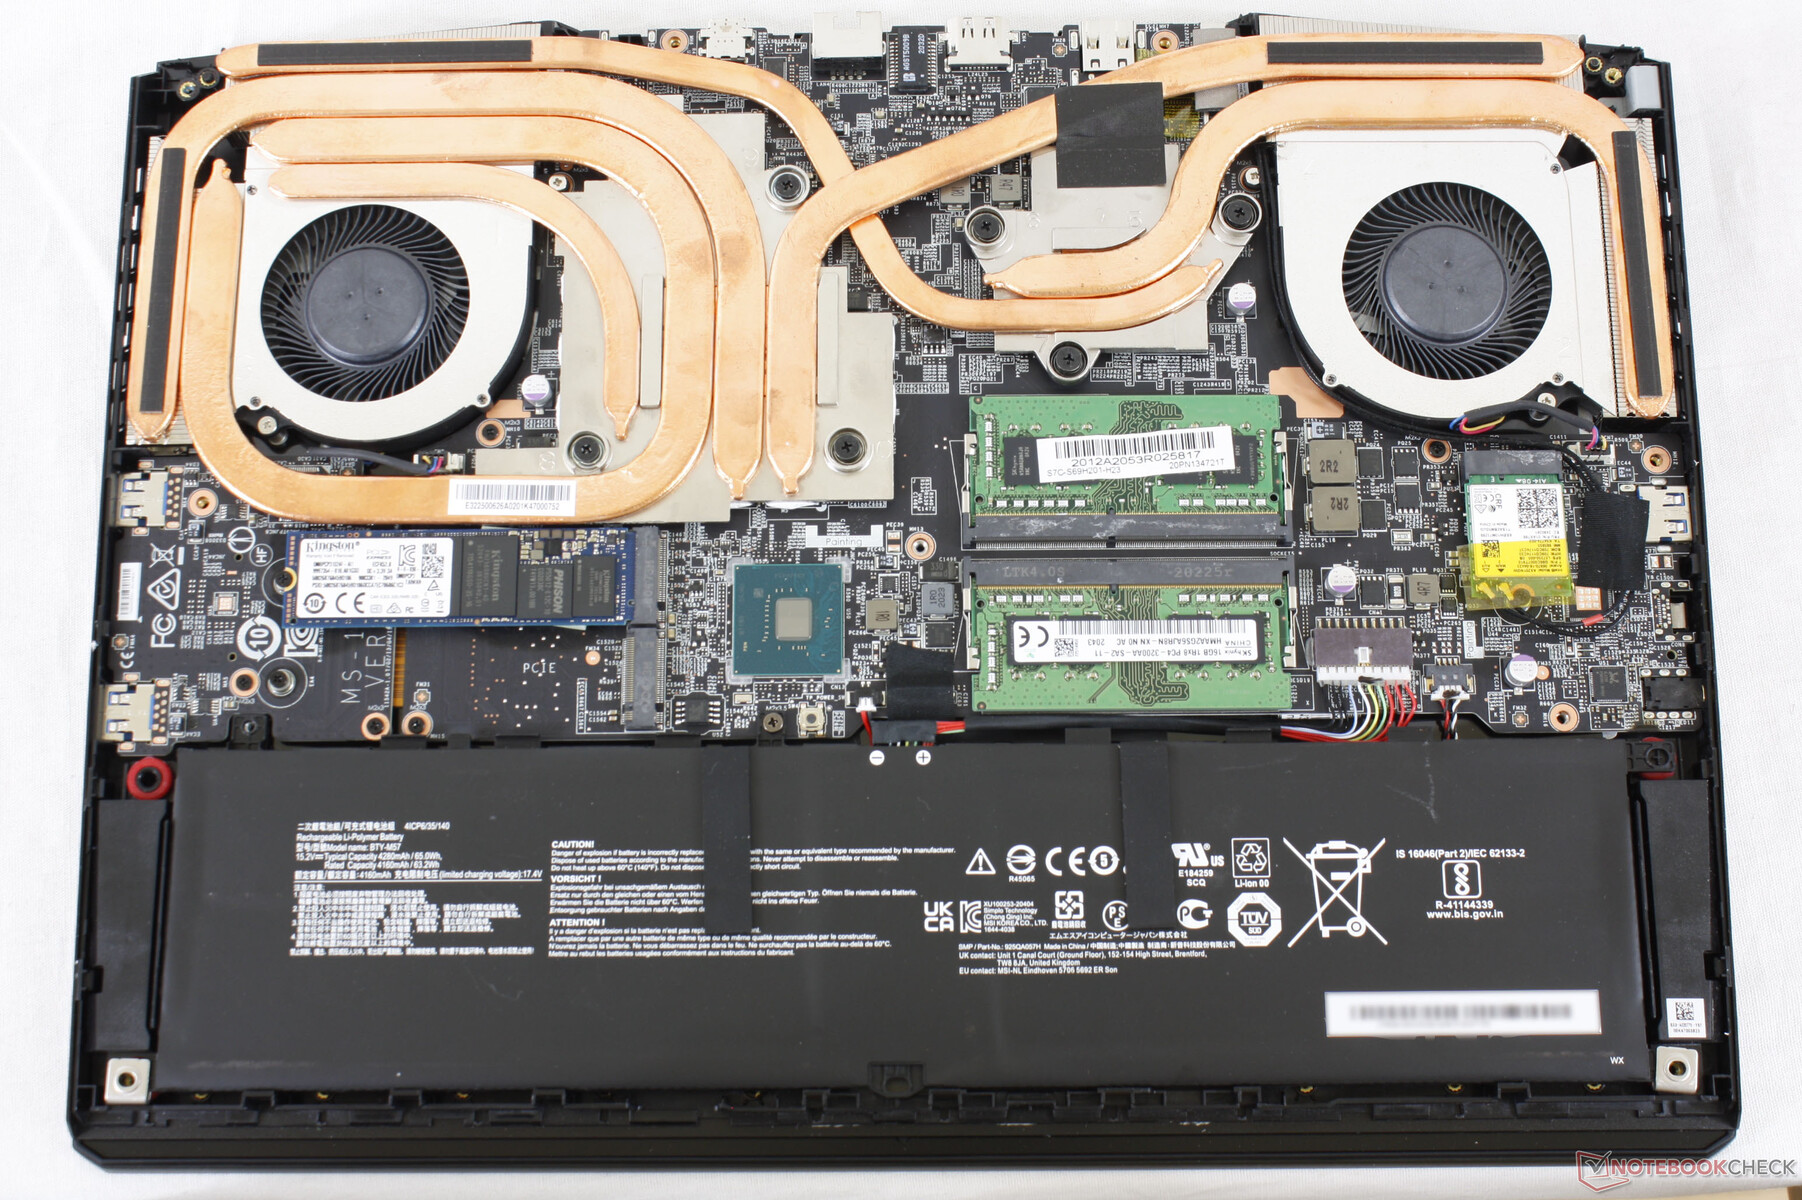
The bottom panel is secured by 11 Philips screws with none underneath any rubber footing for easier servicing. Note that a 'factory seal' sticker must be broken, however.
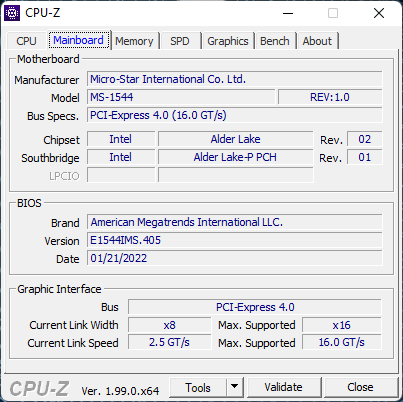
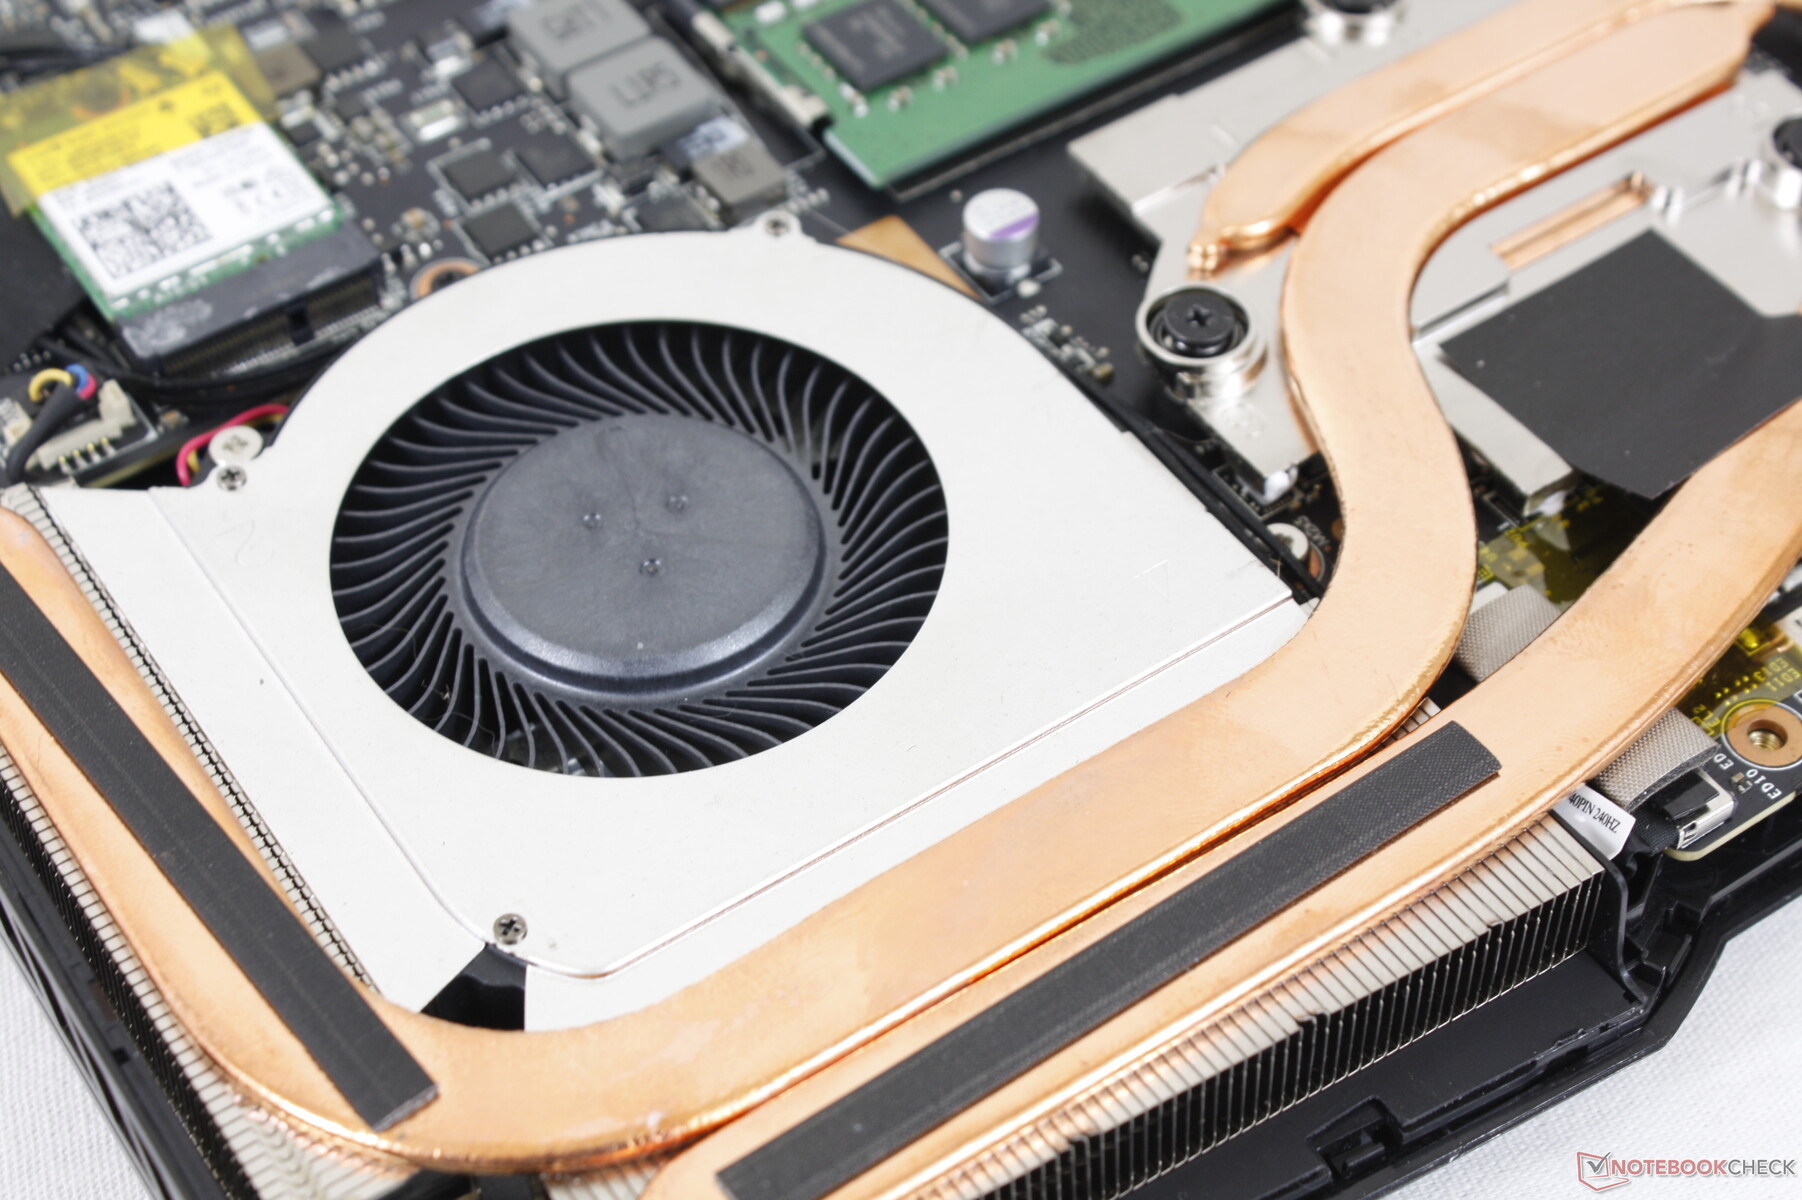
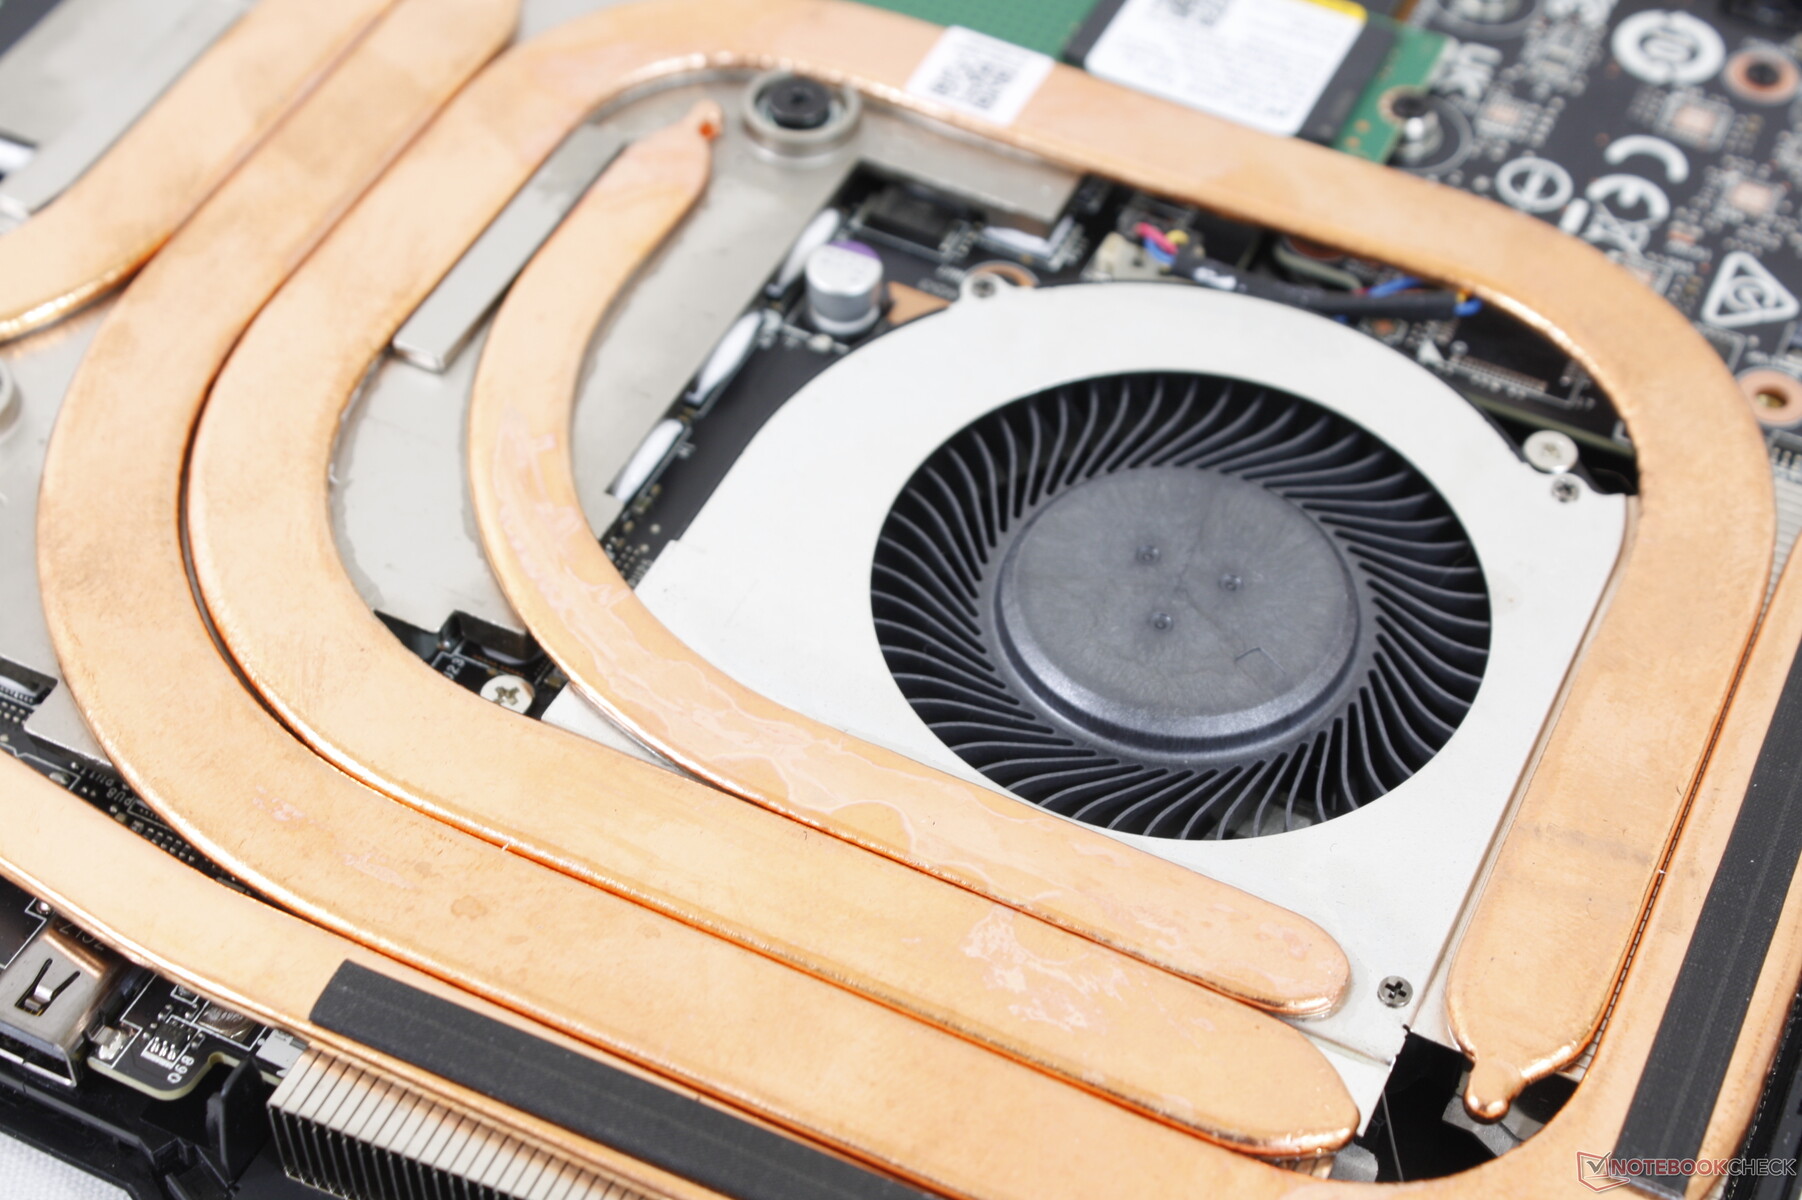
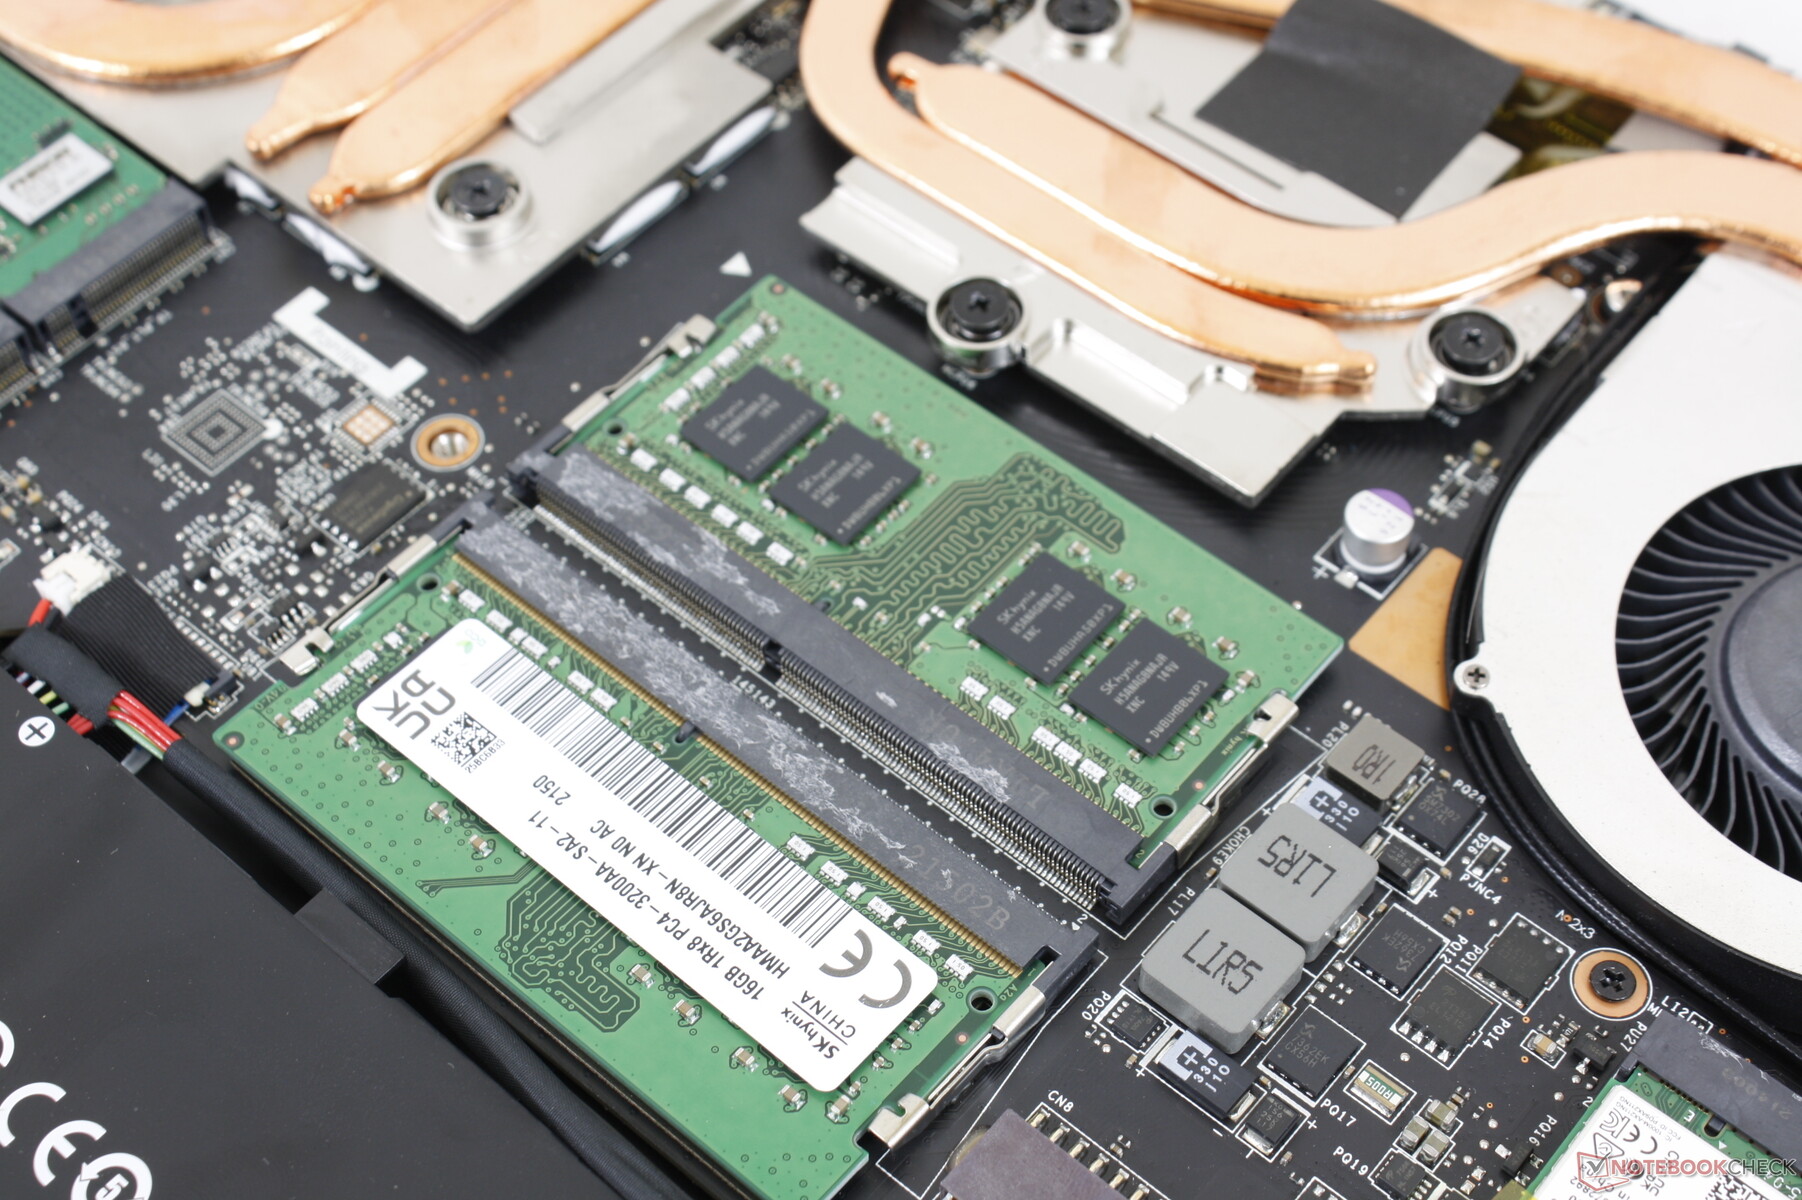
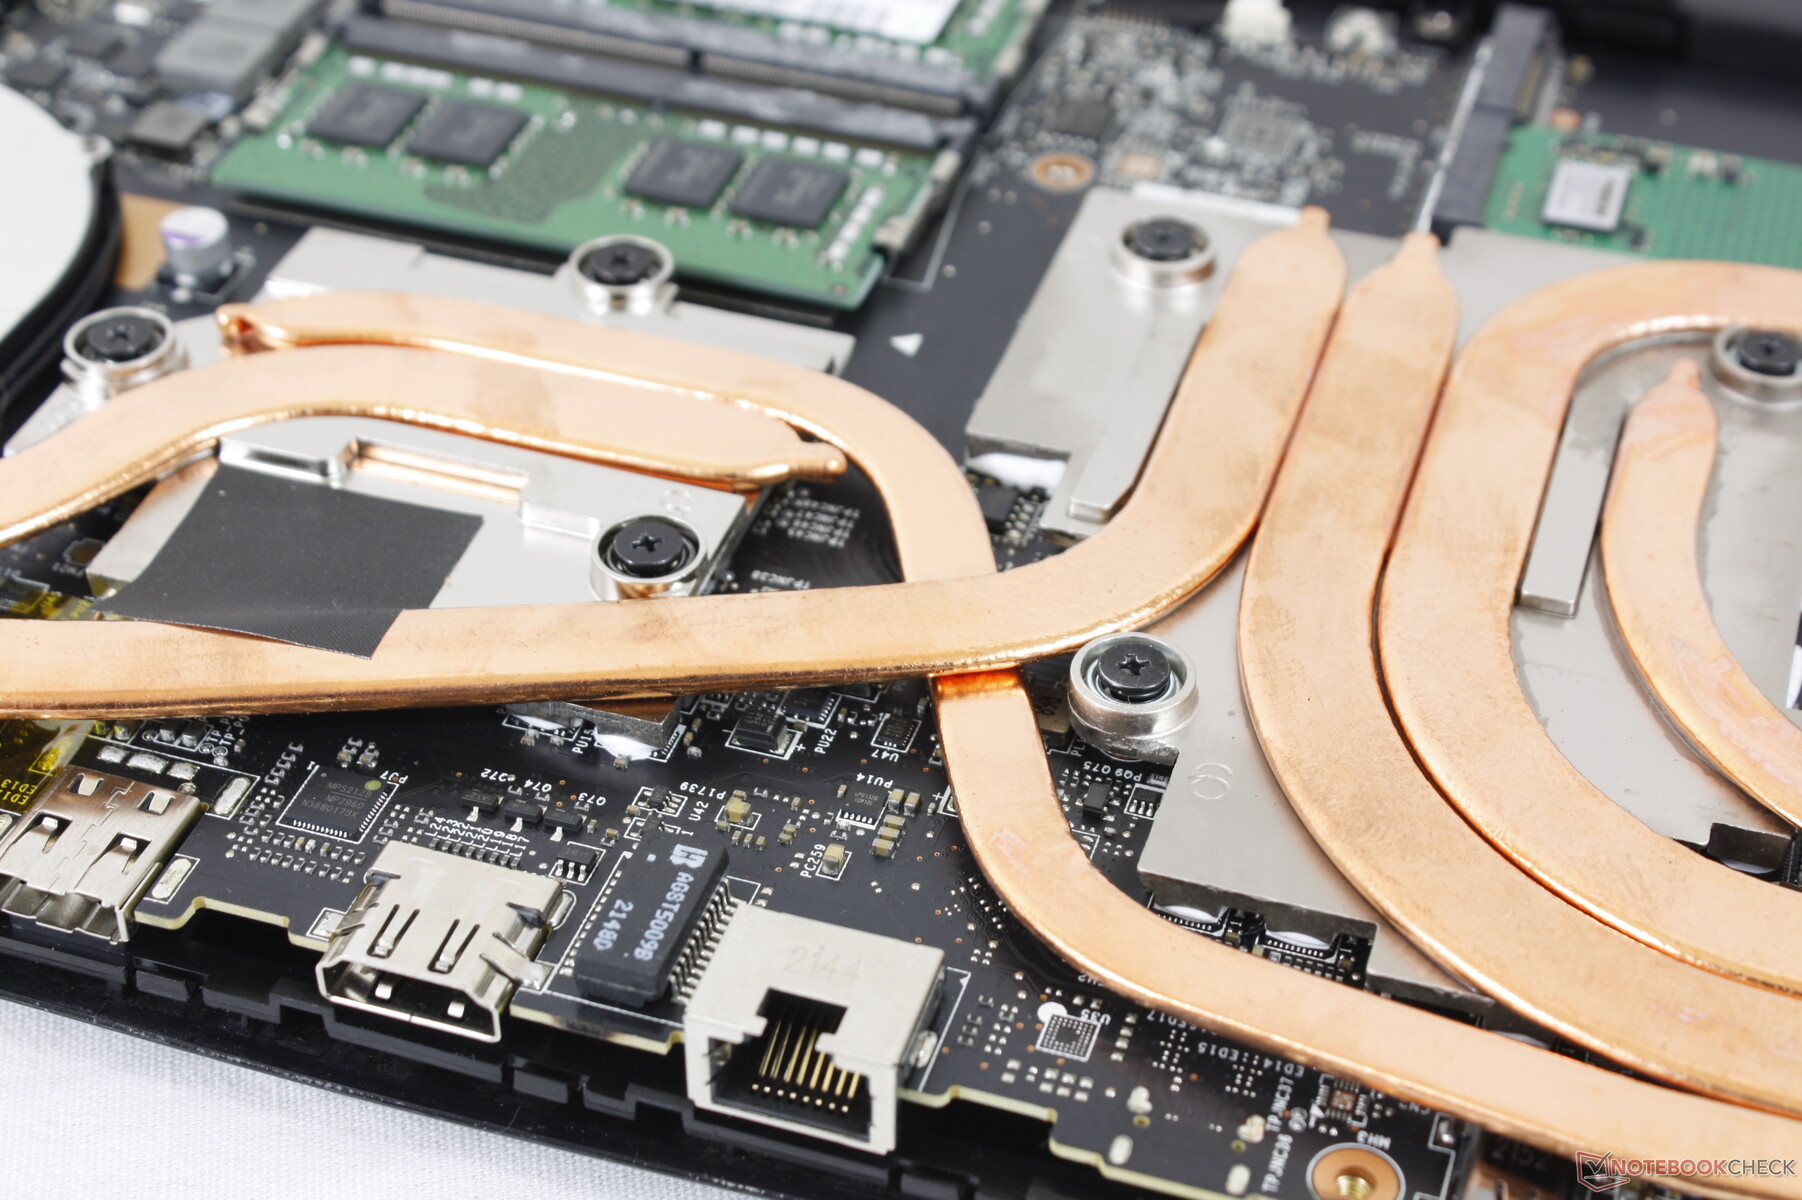
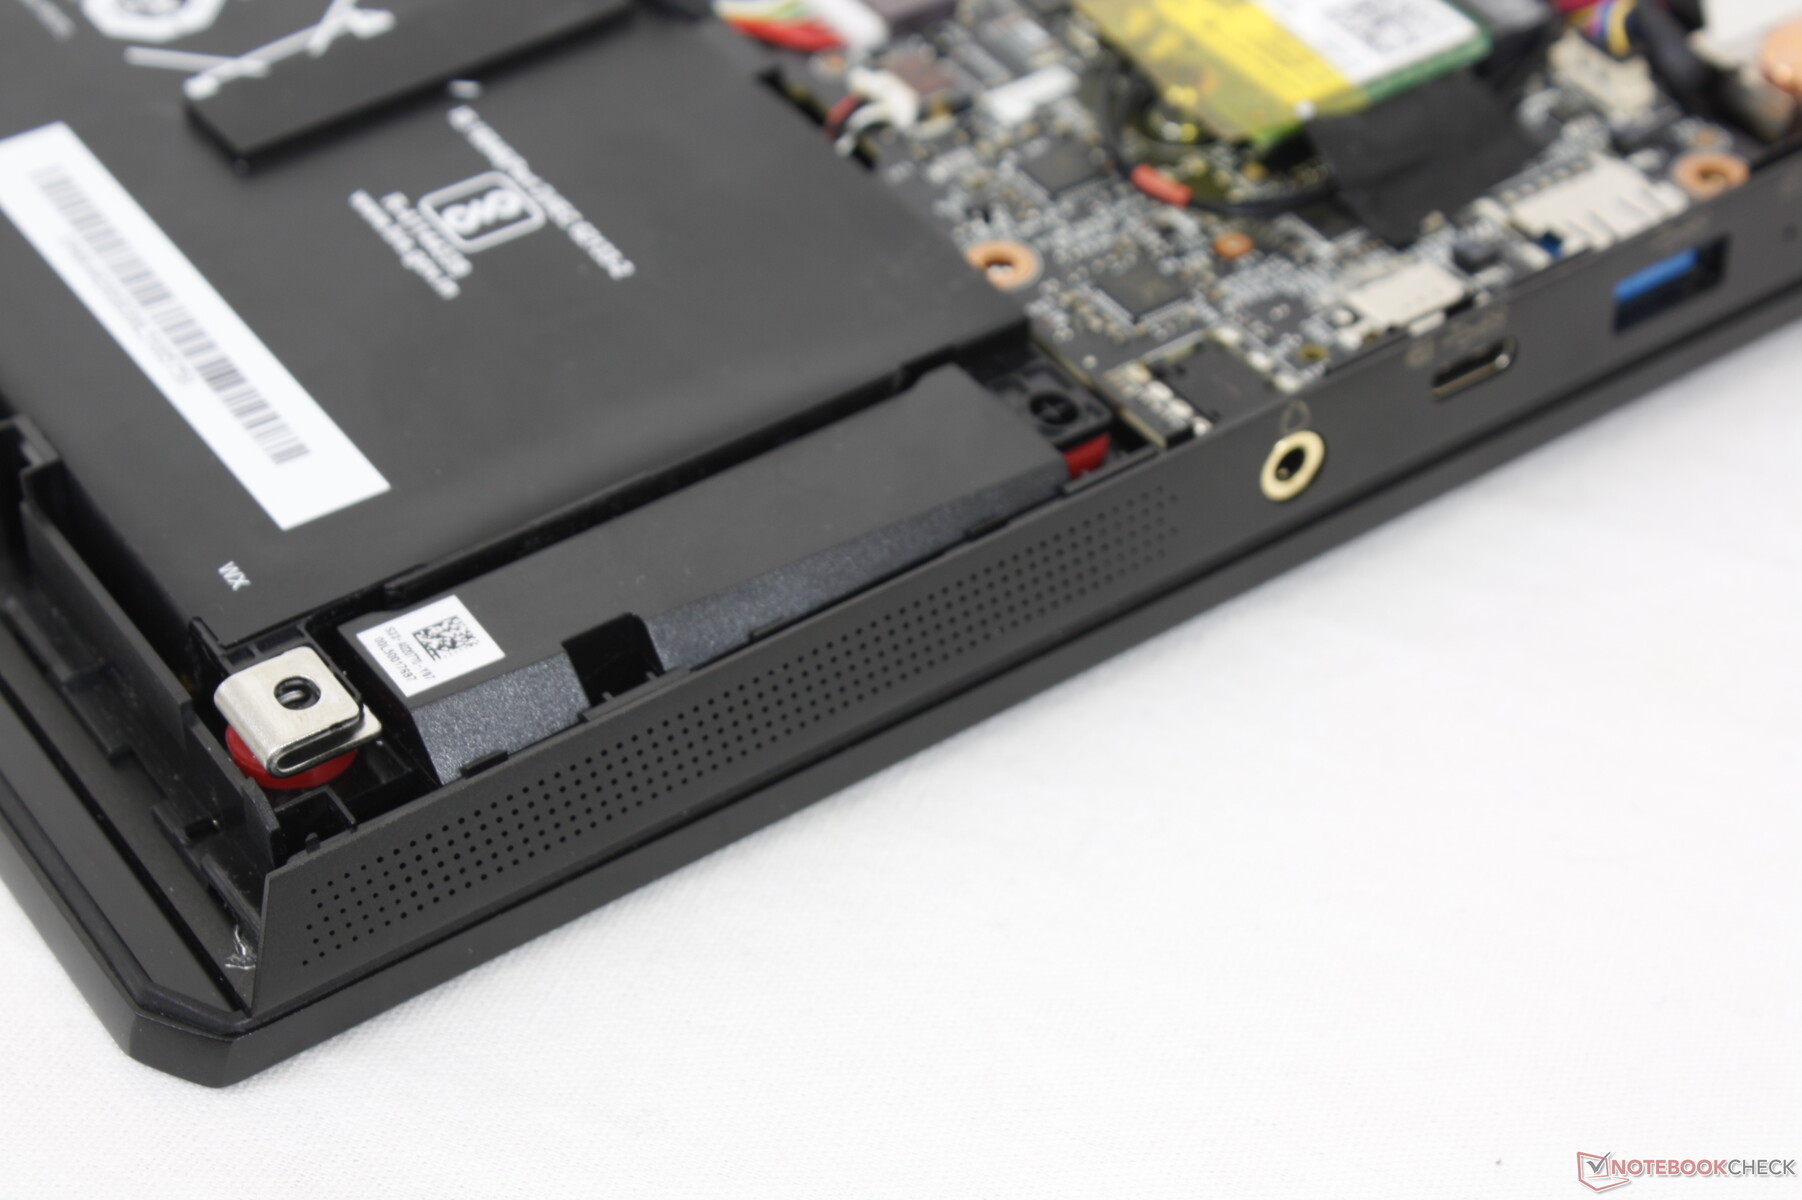
Internal layout is essentially identical to the GP66 Leopard as shown below. Users have direct access to both SODIMM slots and both M.2 2280 PCIe4 x4 slots. Higher-end laptops like the GM7AG8P may come with support for faster DDR5 RAM instead.
Accessories and Warranty
There are no extras in the box other than the AC adapter or paperwork. The usual one-year limited warranty applies in the U.S..
Input Devices
Keyboard and Touchpad
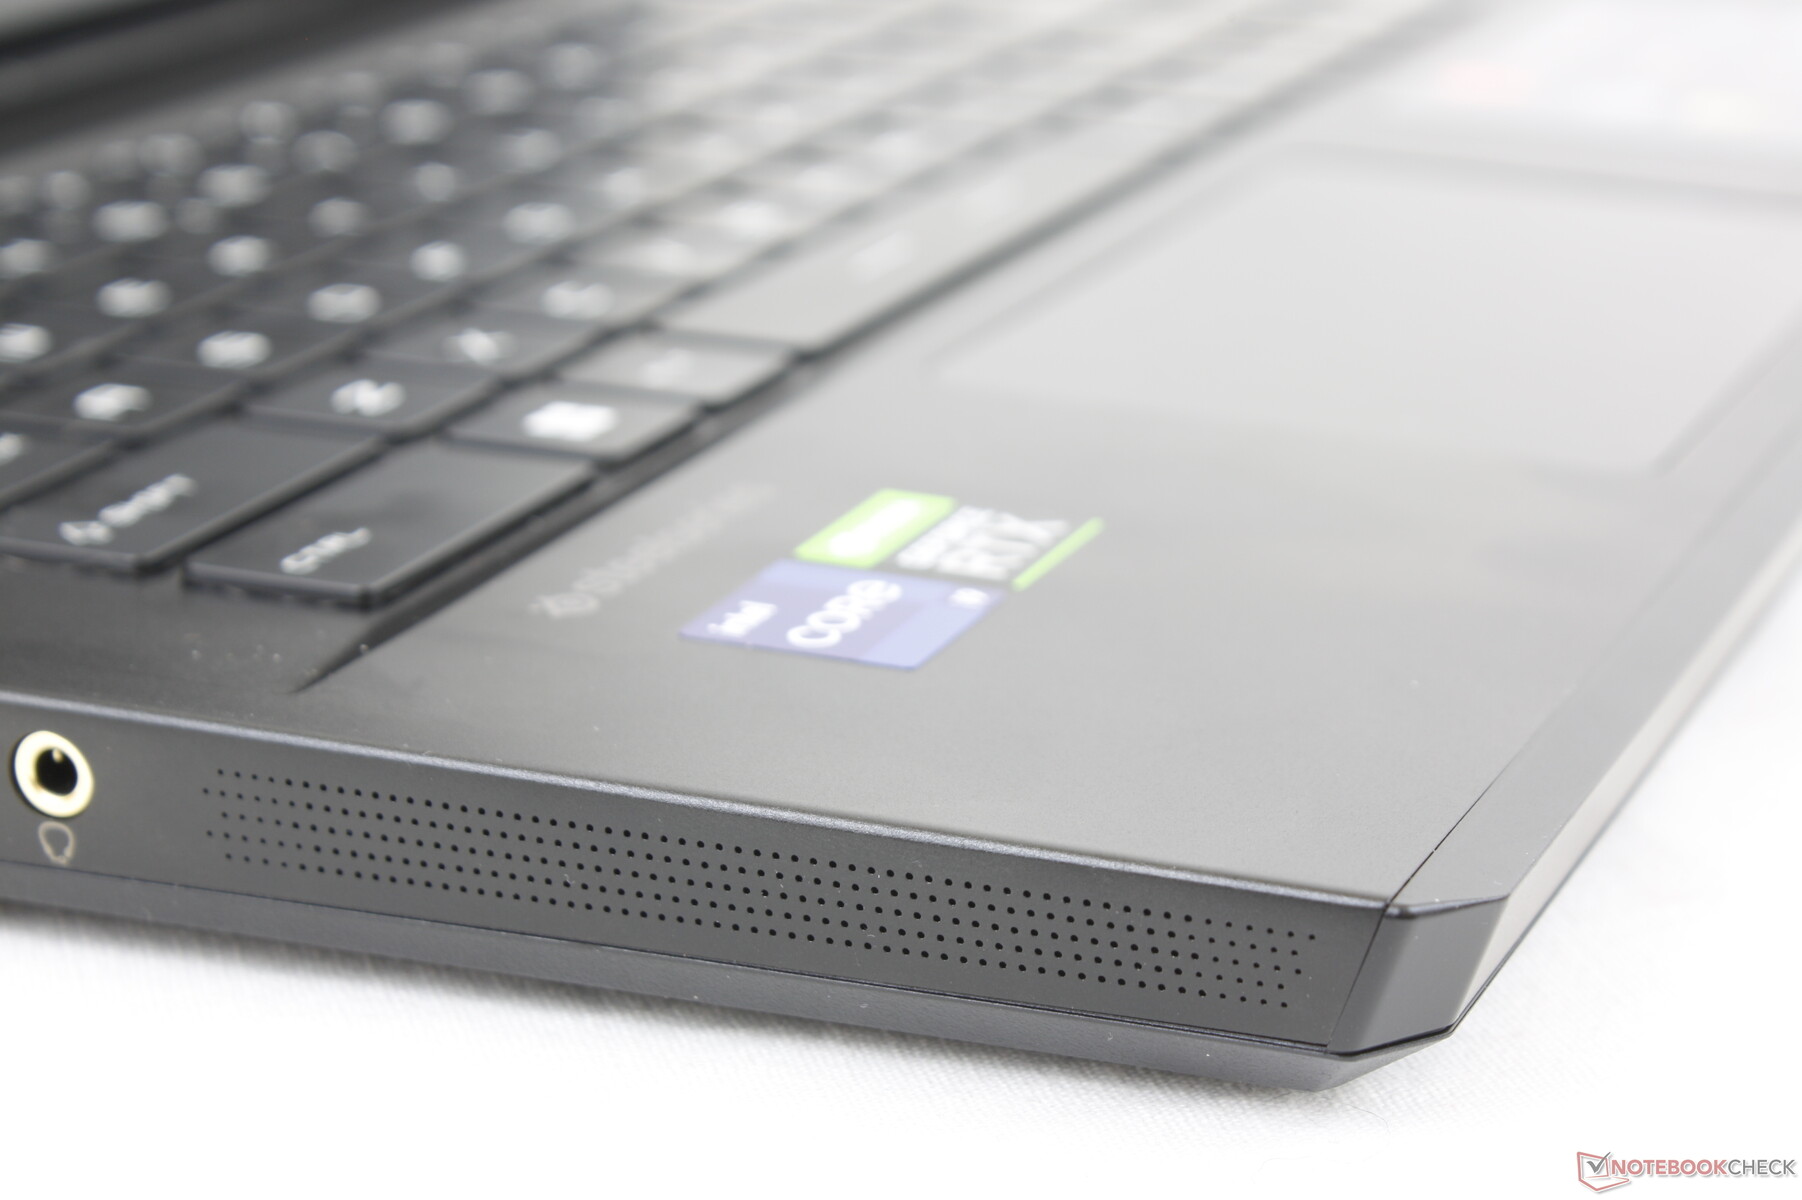
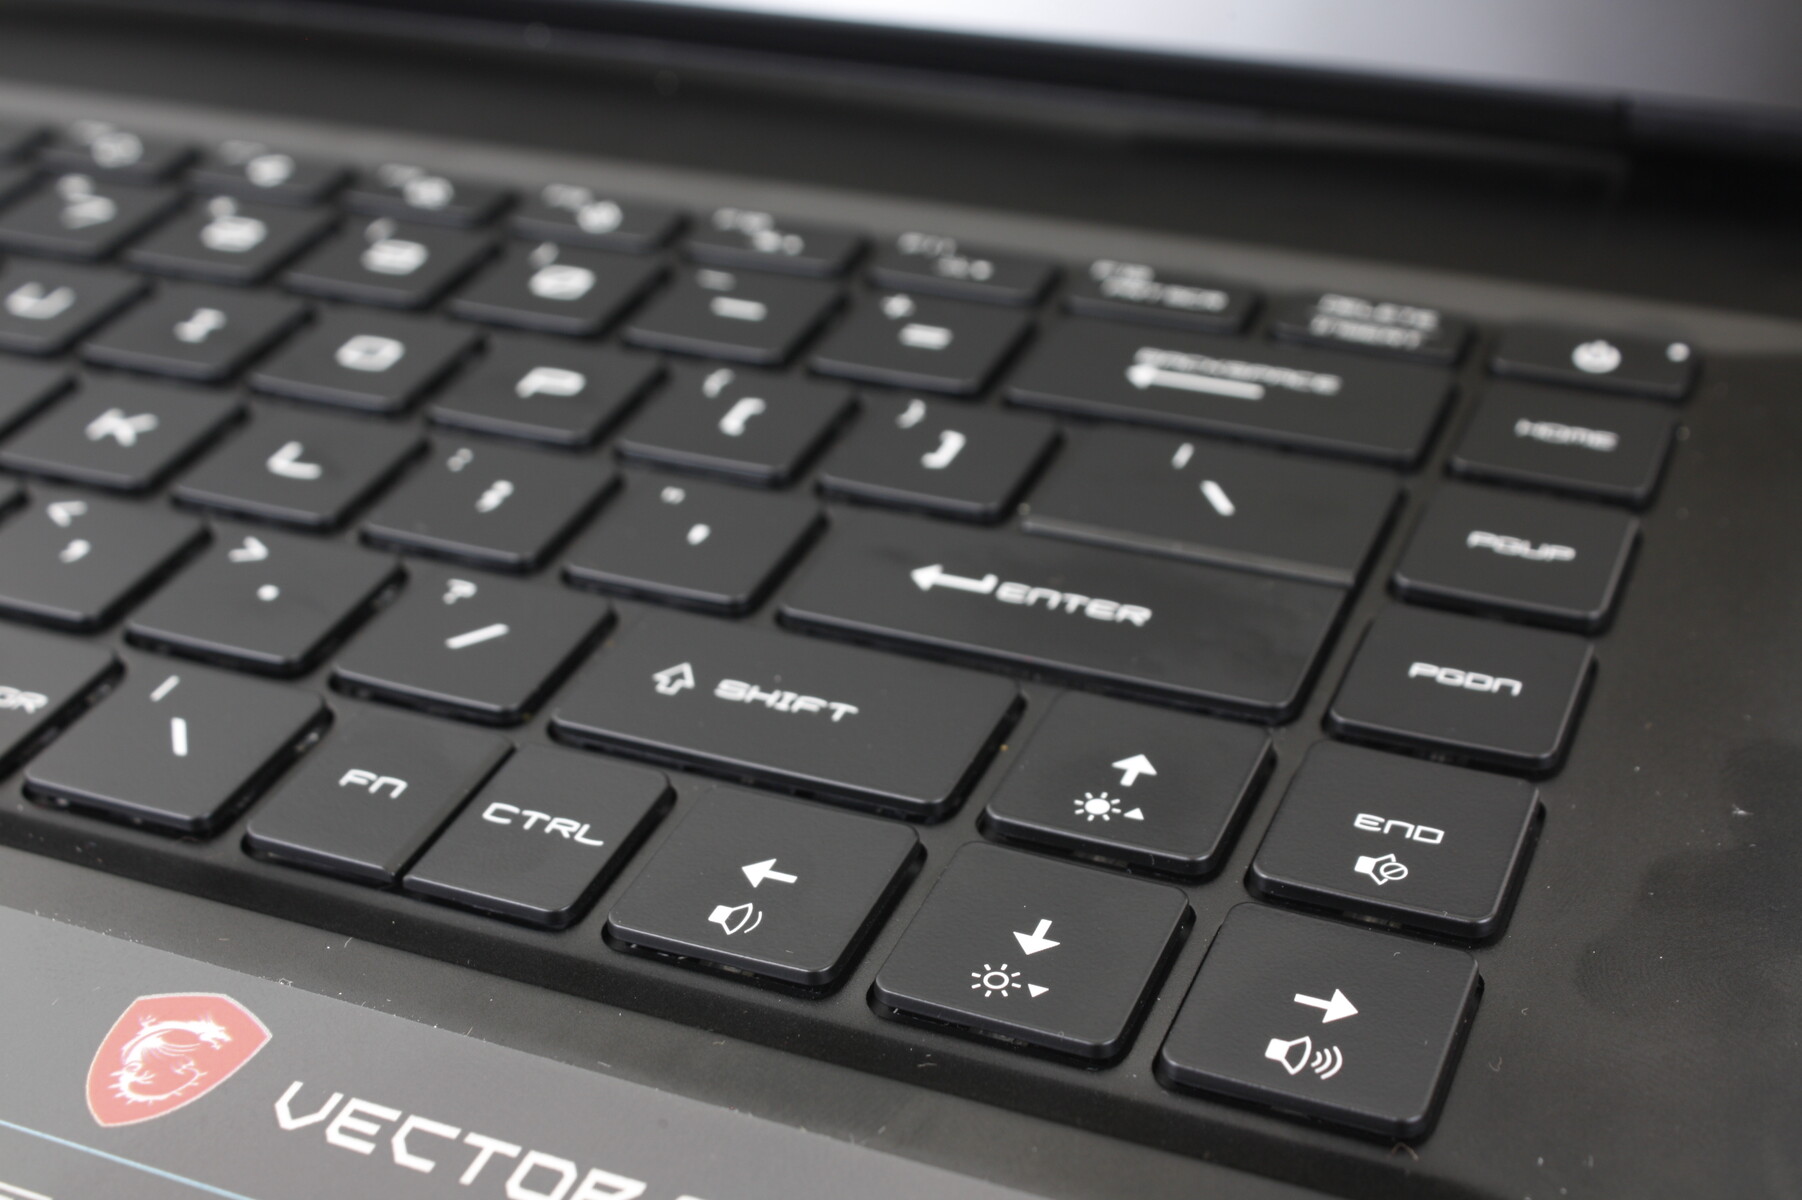
The per-key RGB lighting keyboard and clickpad (10.5 x 6.5 cm) remain unchanged from the original 2020 GP66 Leopard. Though the typing experience is satisfactory if not a little on the soft side, clicking on the clickpad continues to be too spongy. Cursor control was easier on the older GP65 as it integrated physical mouse buttons that were dropped when transitioning to the GP66 design.


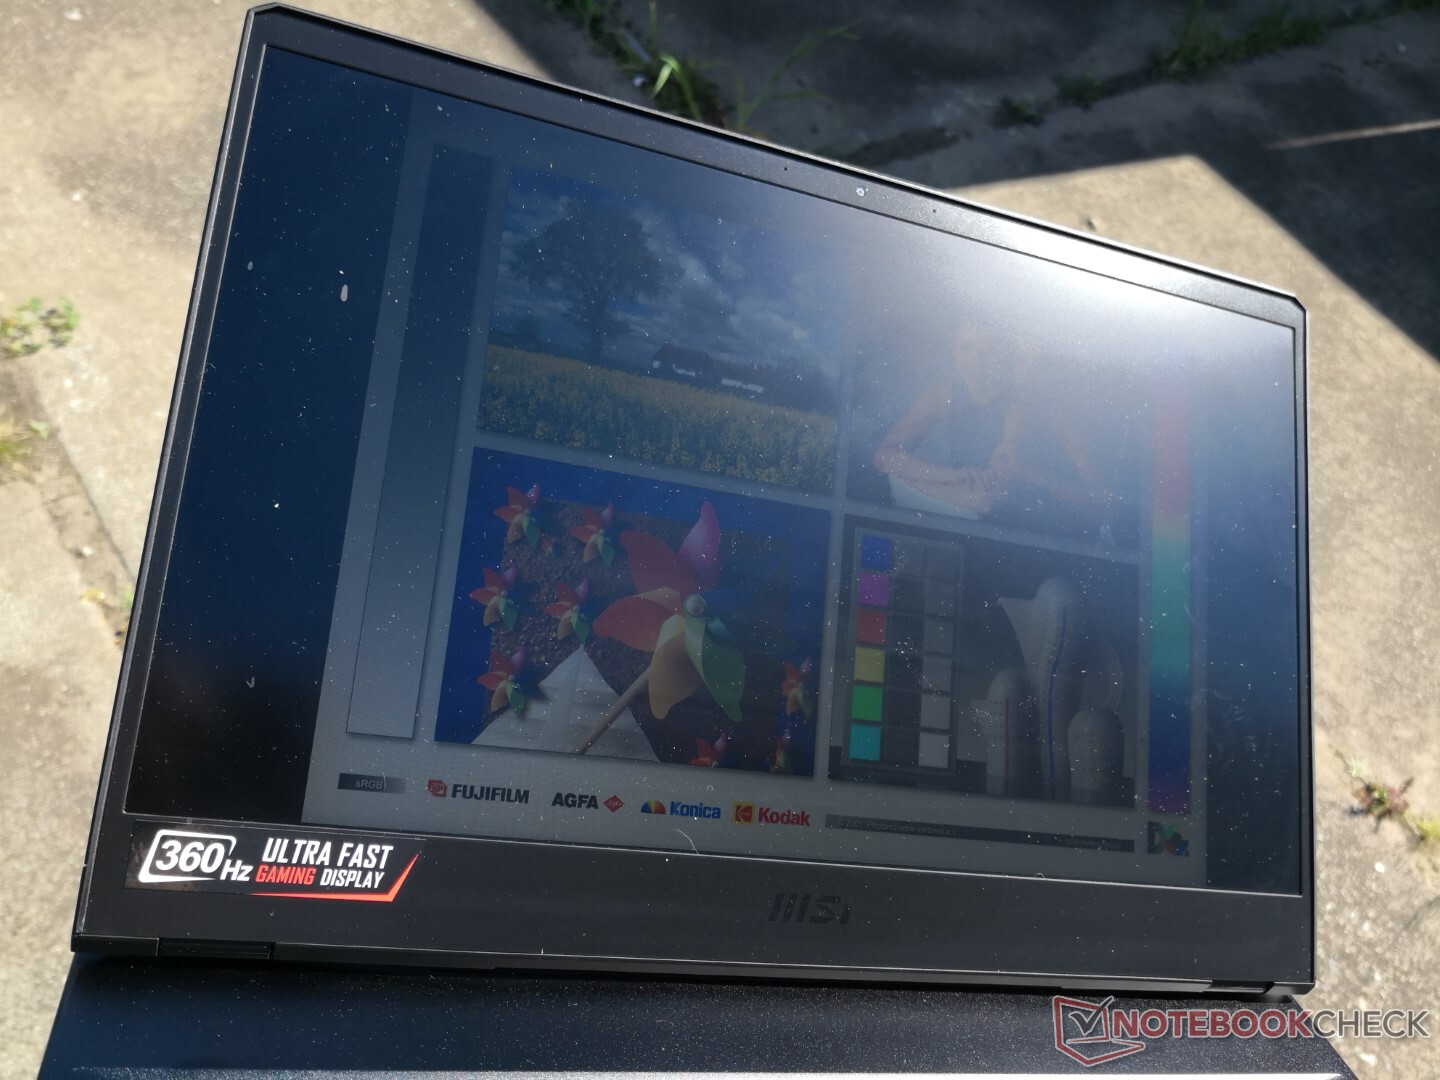
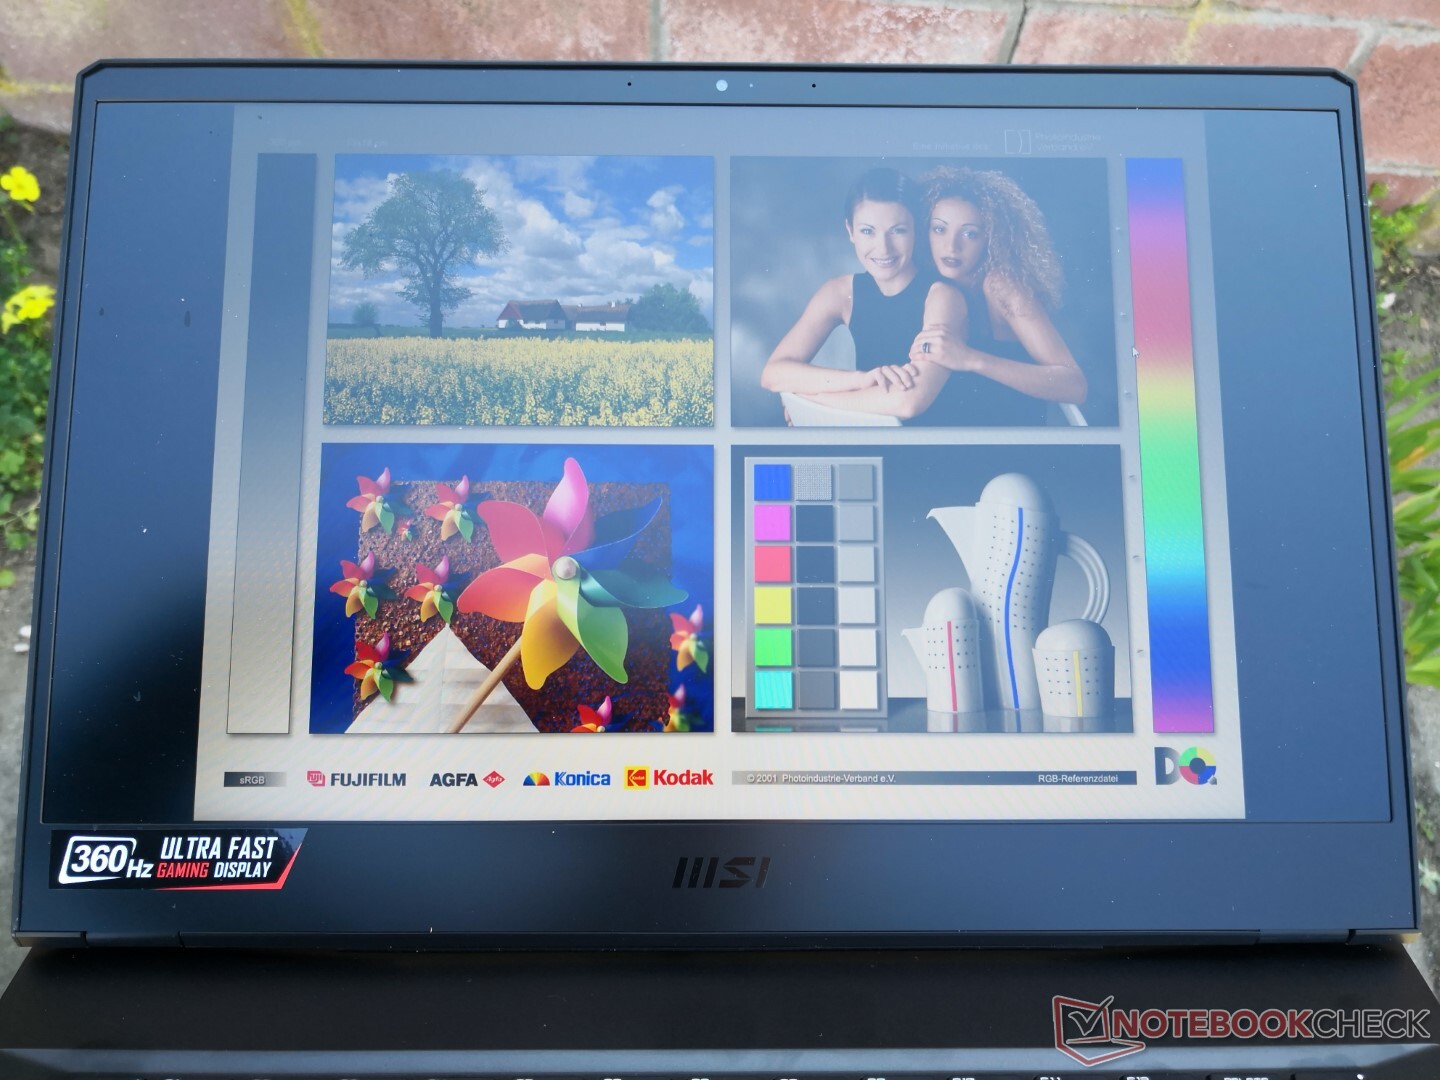
Display
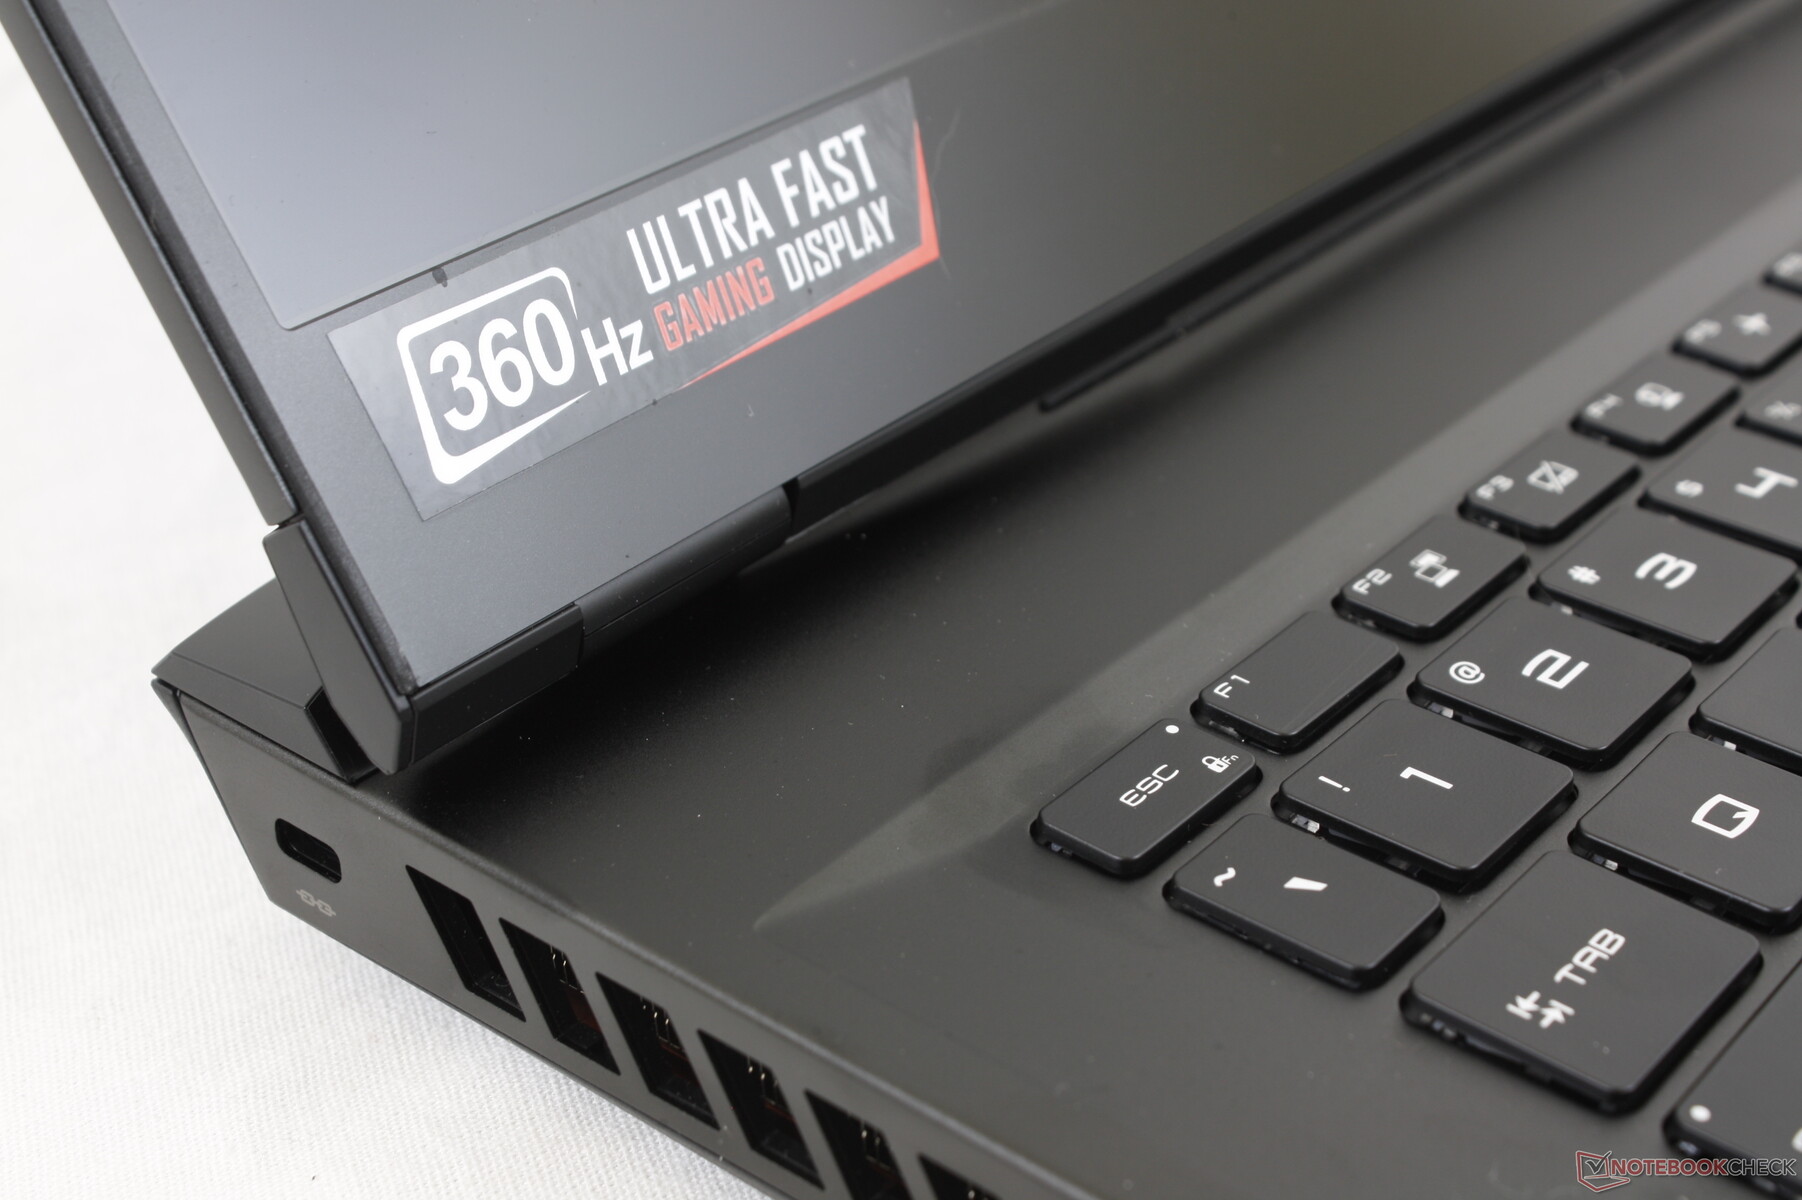
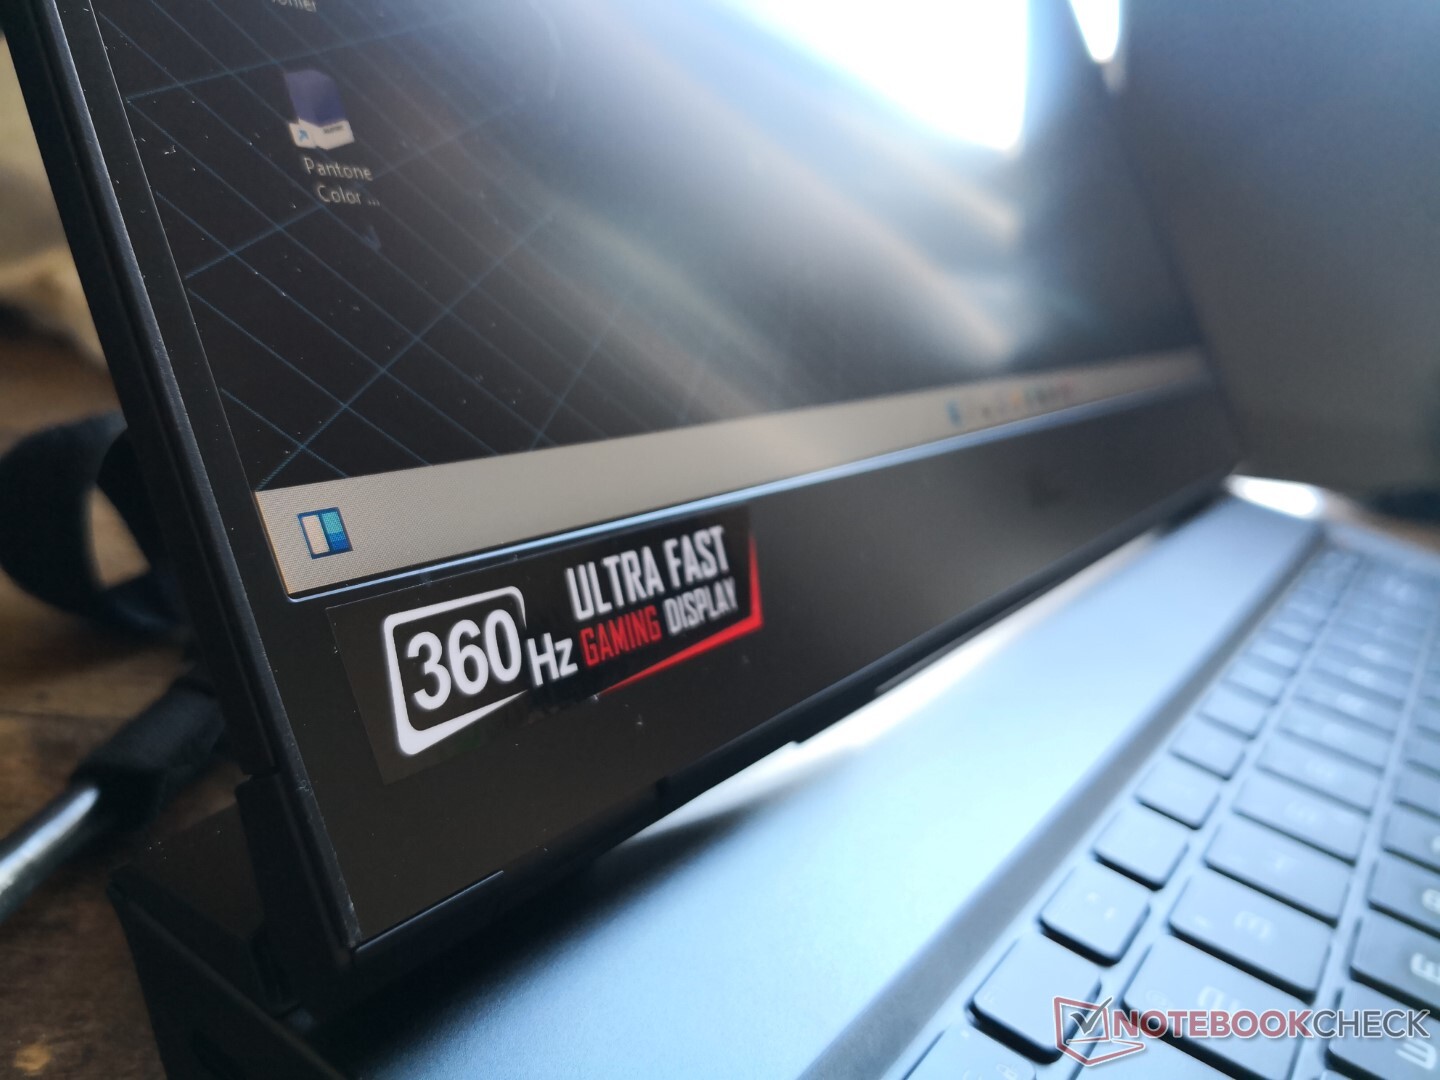
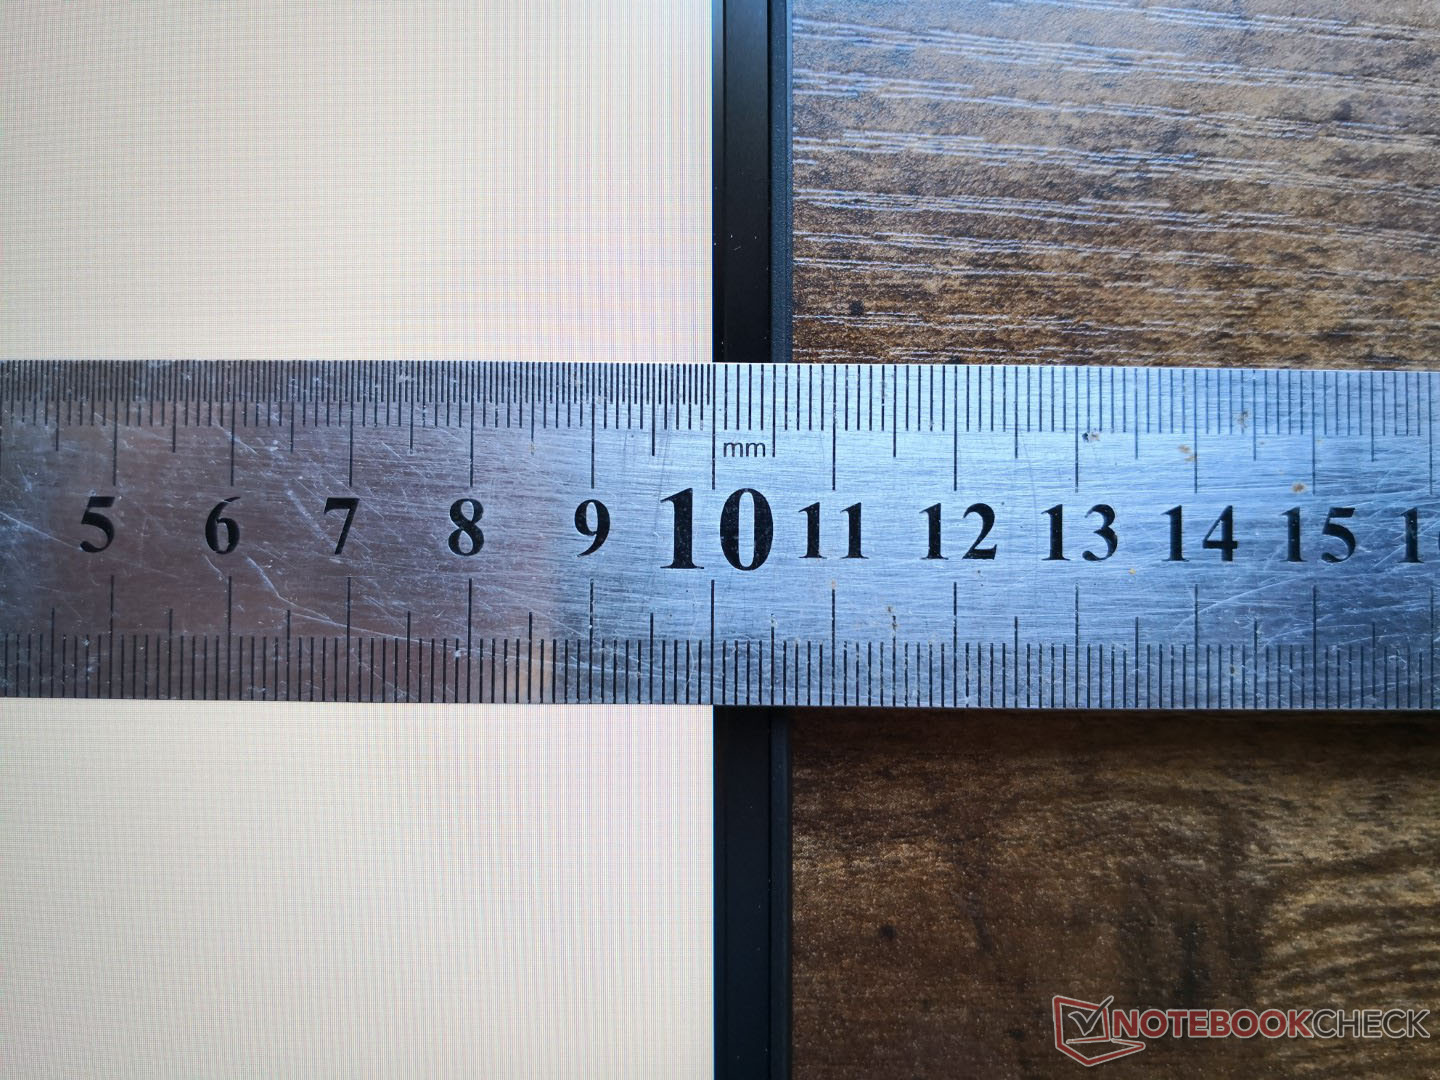
The Vector GP66 is the first laptop in our database to come with the 360 Hz BOE NE156FHM-NZ3 IPS panel in contrast to the 144 Hz LG LP156WFG-SPB3 IPS panel on our older GP66 Leopard. The BOE panel offers both faster refresh rates and gray-to-gray response times while maintaining the same full sRGB coverage and contrast ratio as the aforementioned LG panel. Maximum brightness is slightly lower but not by noticeable margins. It's a high-end panel fit for an upper midrange gaming PC.
Keep in mind that MSI is also offering a slower 144 Hz option on less expensive SKUs of the Vector GP66. Colors on this 144 Hz panel are significantly worse at only ~60 percent of sRGB and so it may be wise to avoid these SKUs if display quality is a priority.


| |||||||||||||||||||||||||
Brightness Distribution: 85 %
Center on Battery: 353.1 cd/m²
Contrast: 929:1 (Black: 0.38 cd/m²)
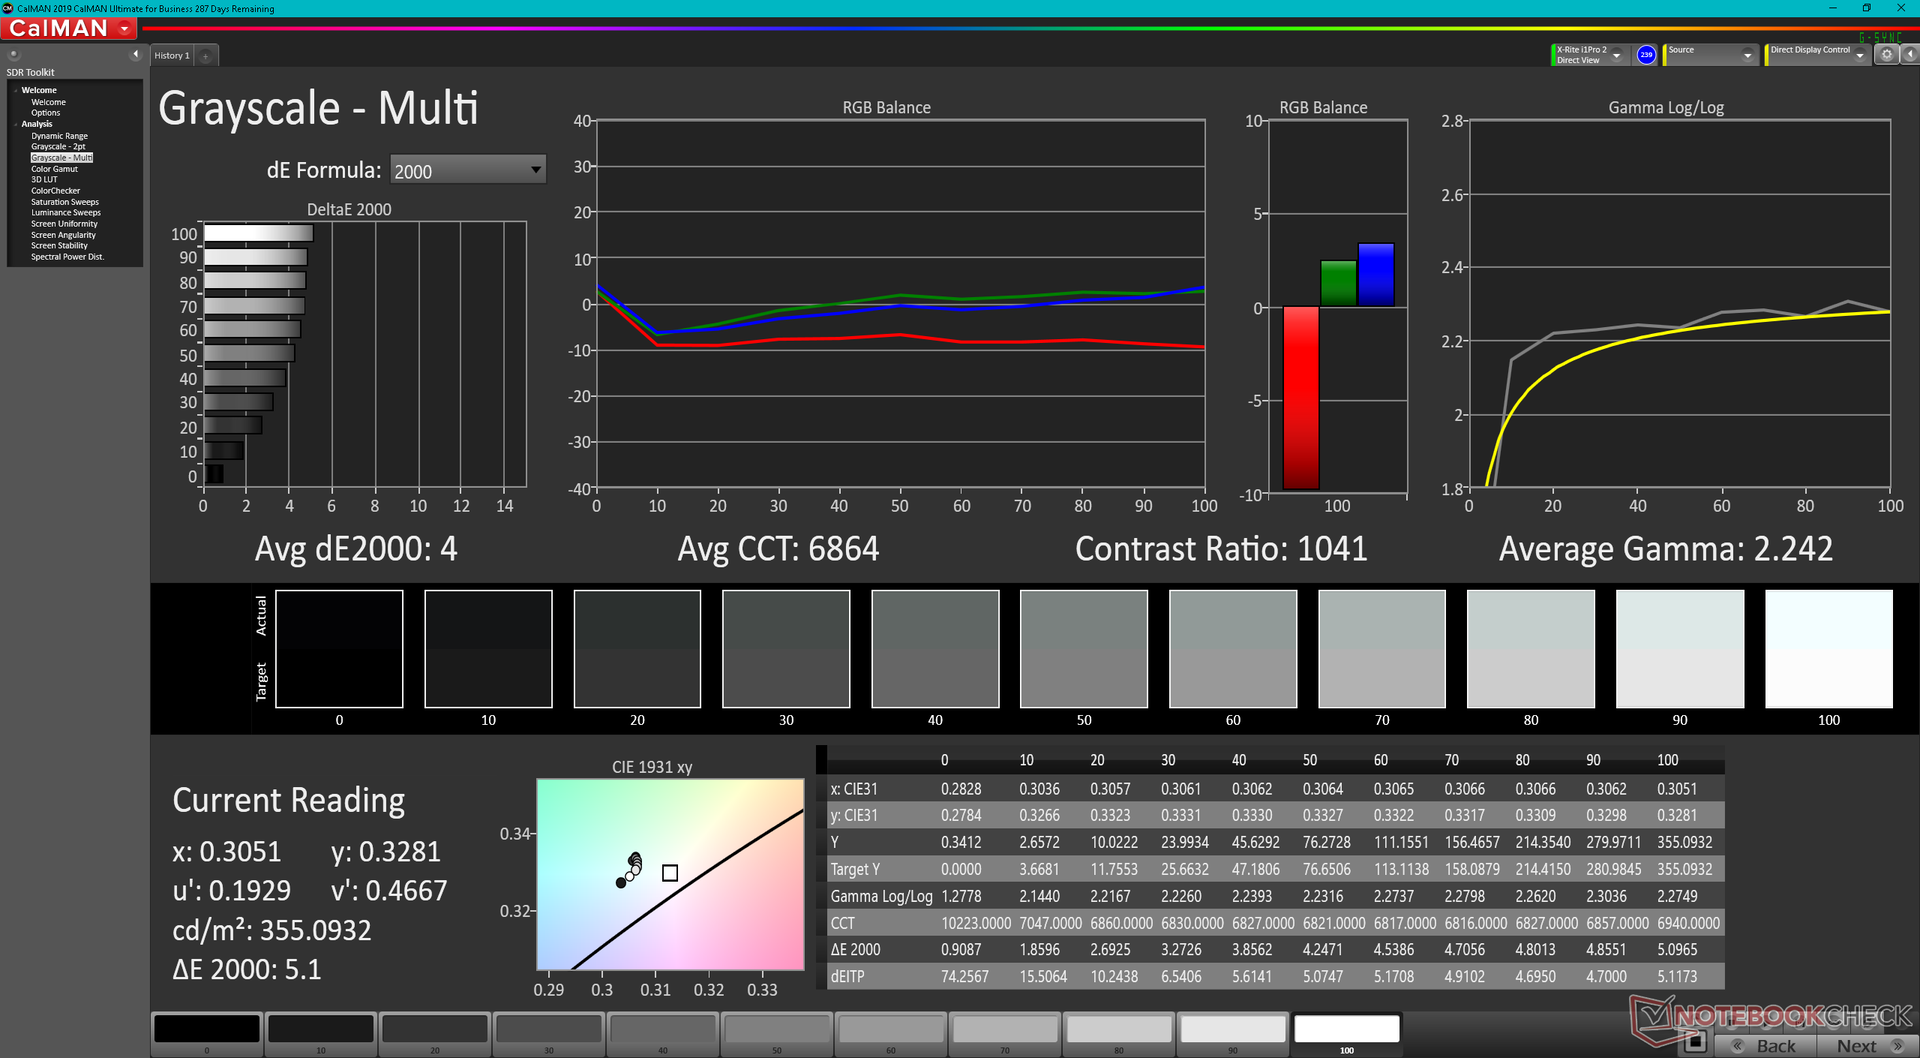
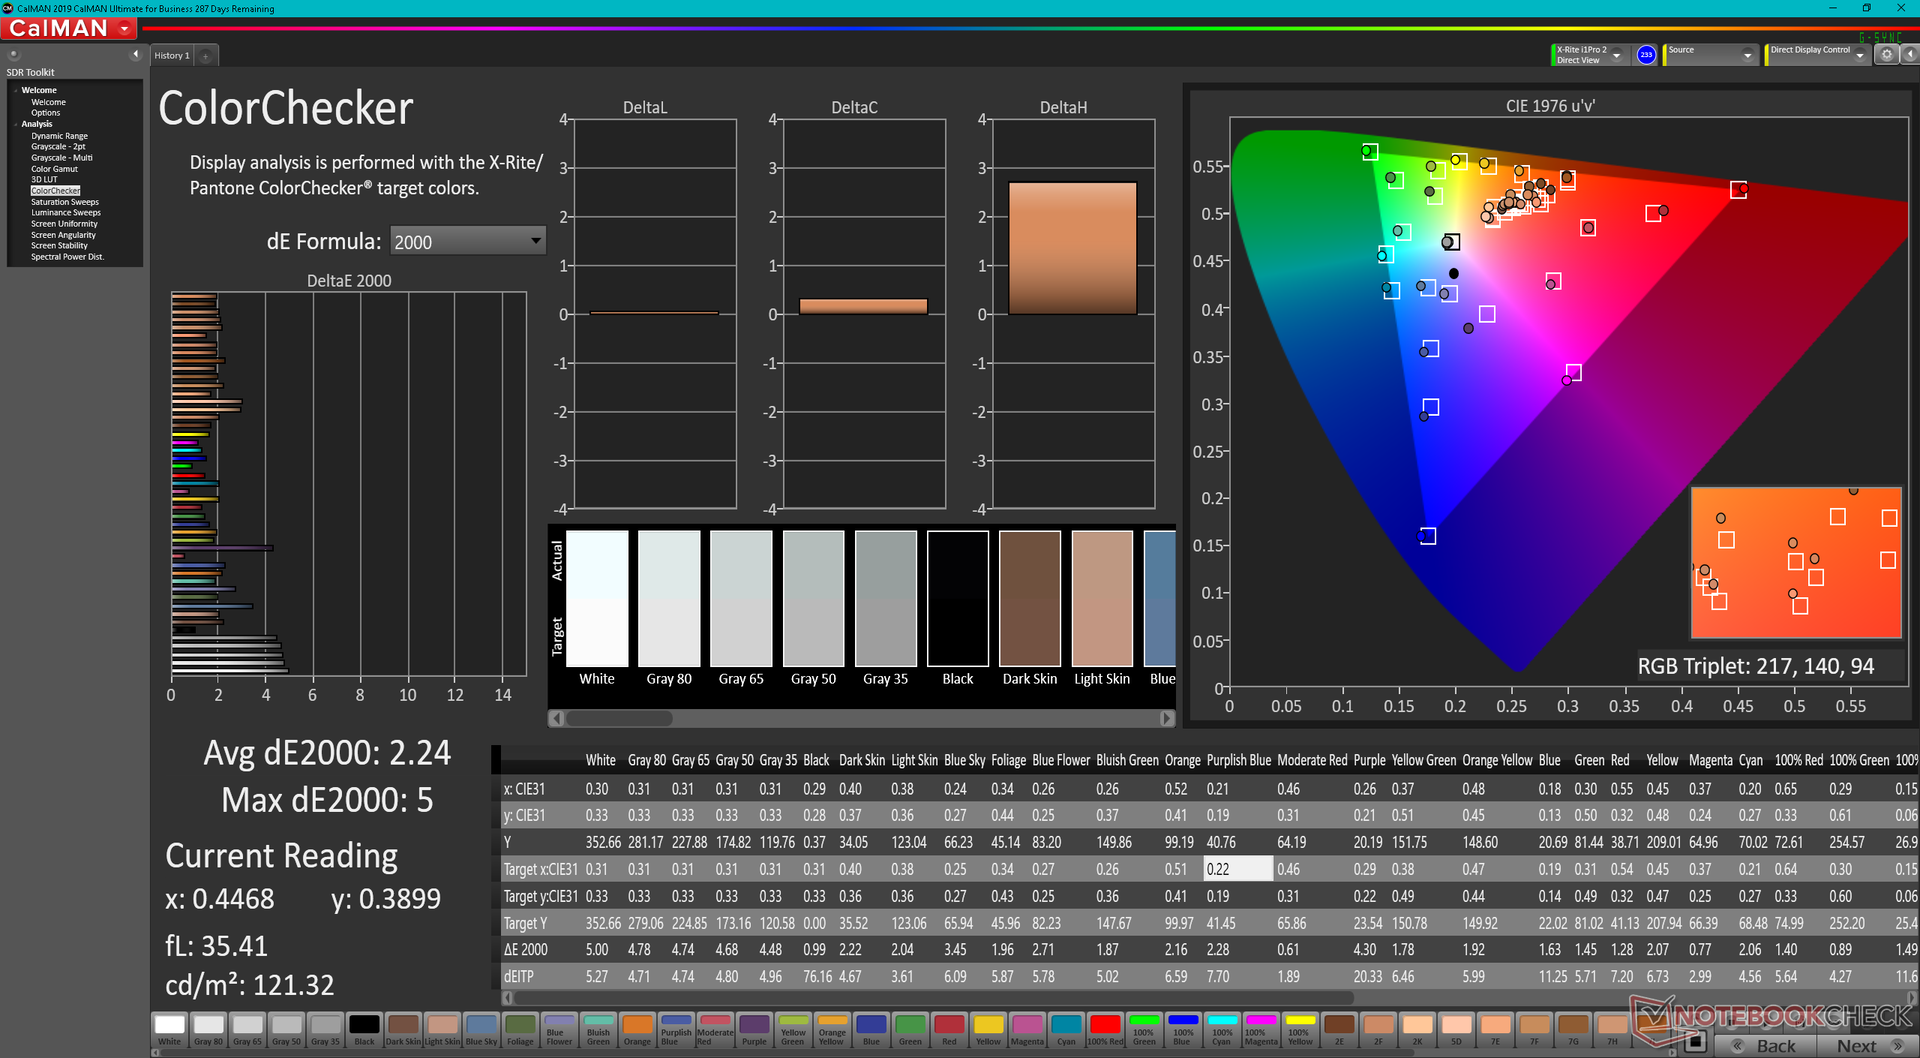
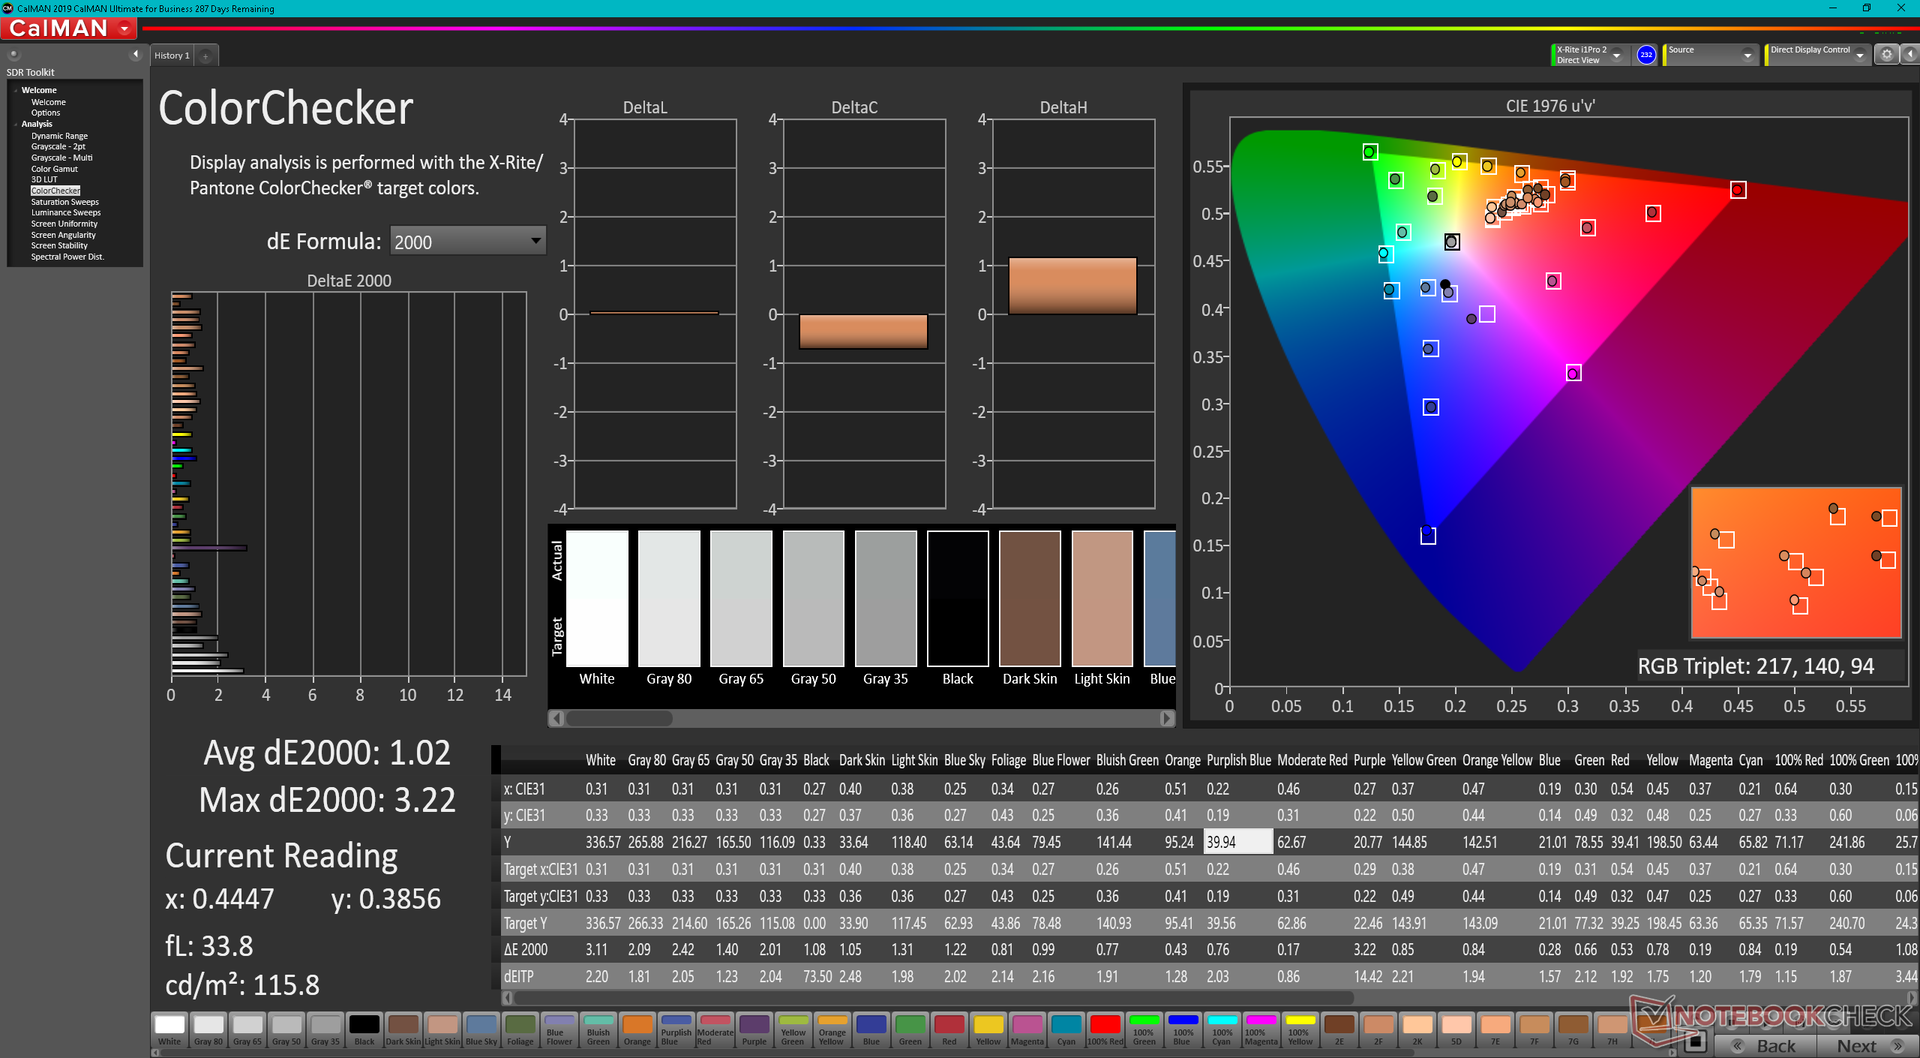
ΔE ColorChecker Calman: 2.24 | ∀{0.5-29.43 Ø4.75}
calibrated: 1.02
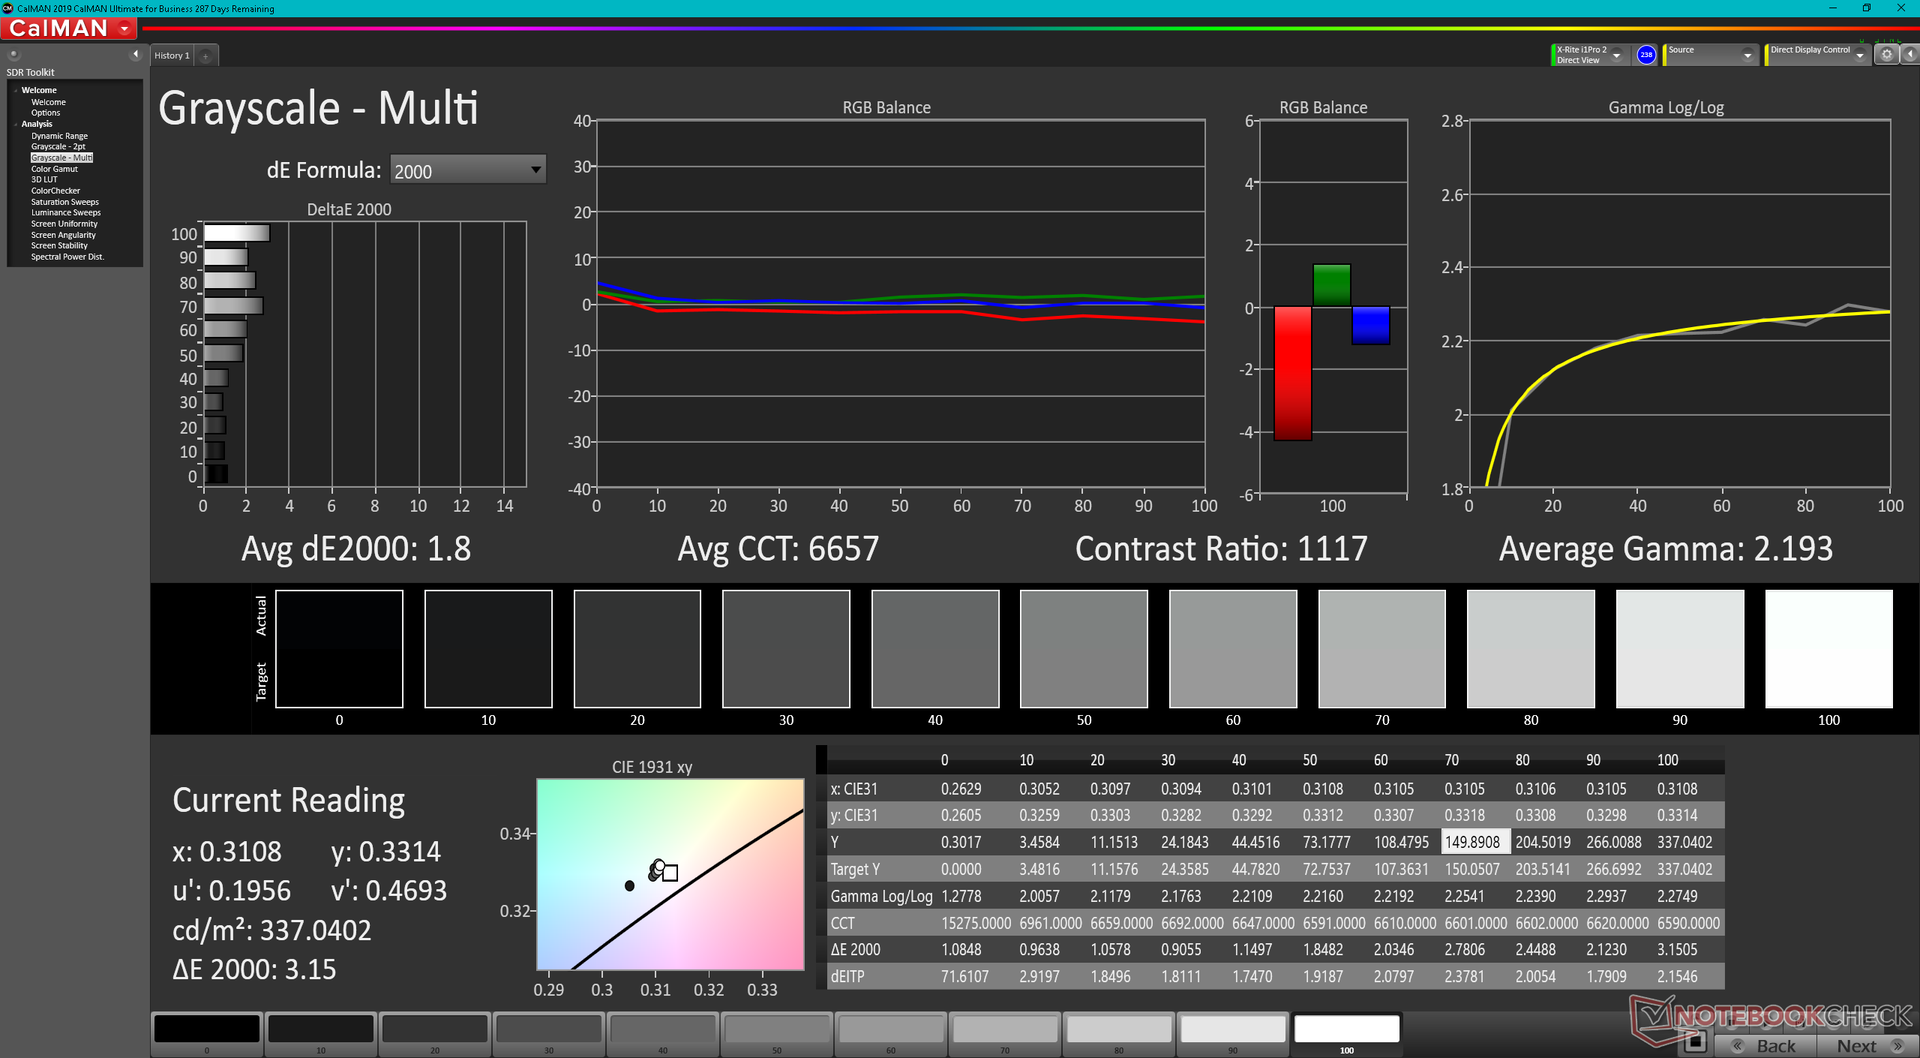
ΔE Greyscale Calman: 4 | ∀{0.09-98 Ø5}
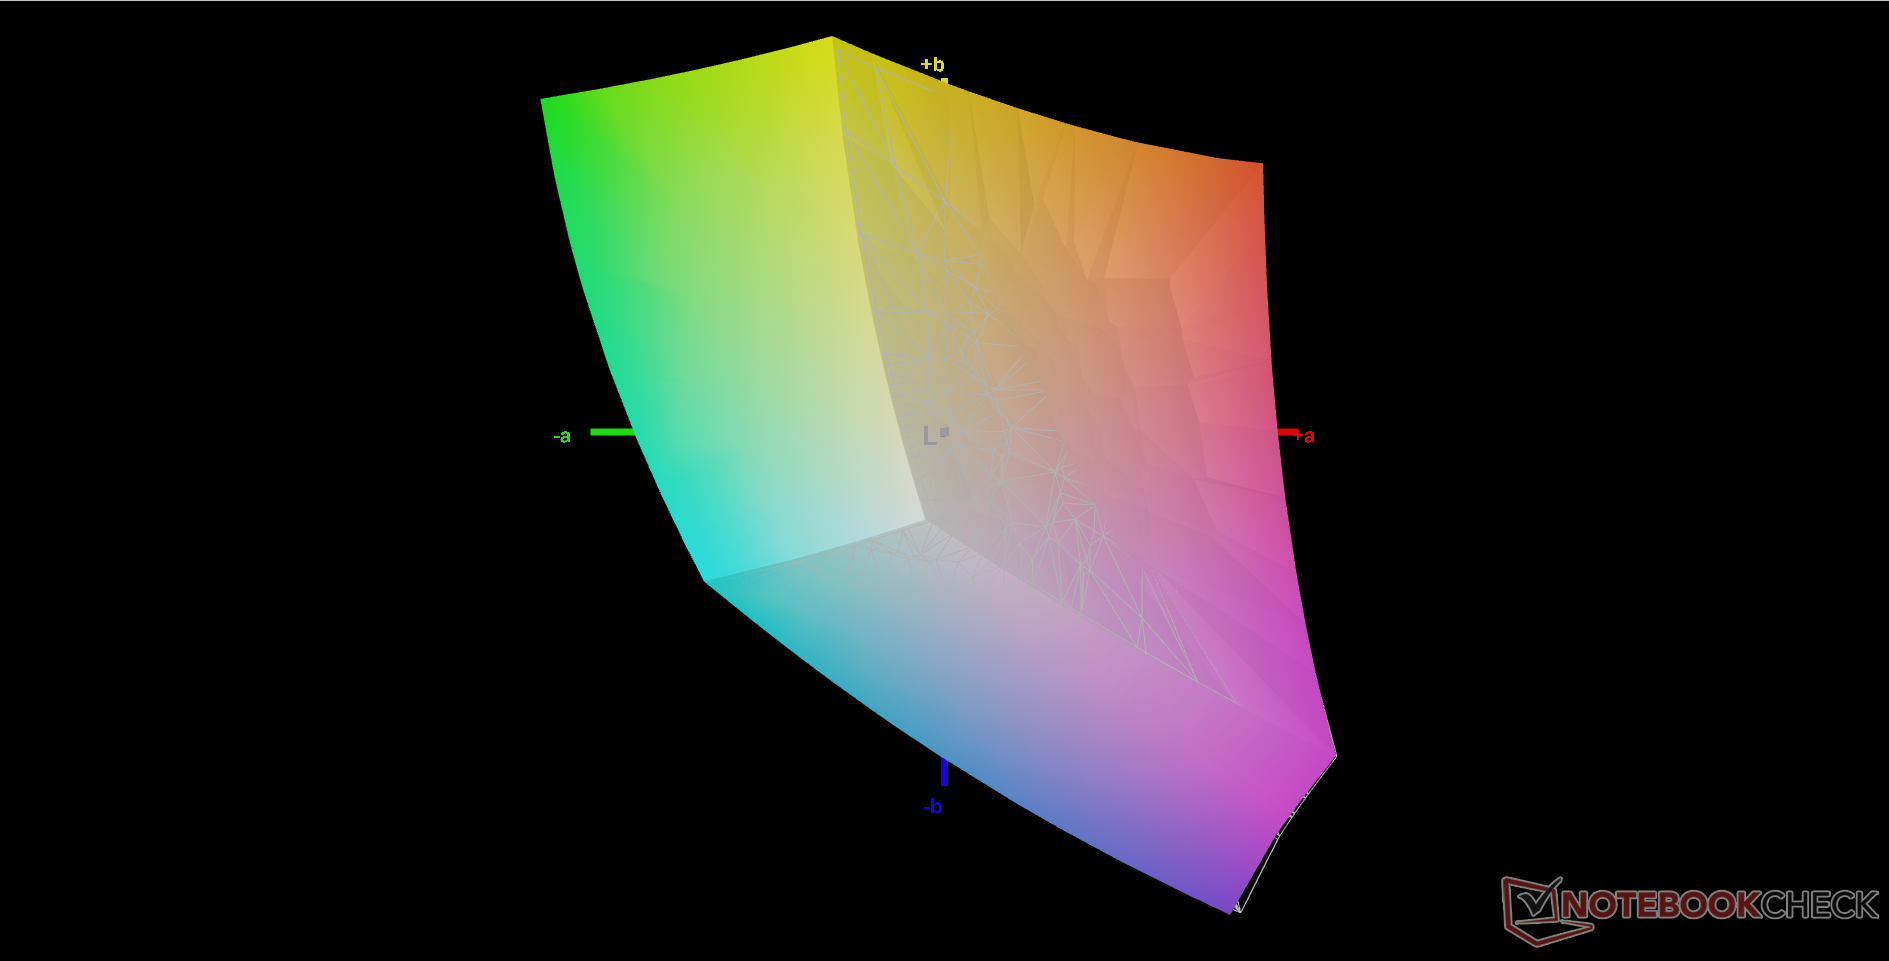
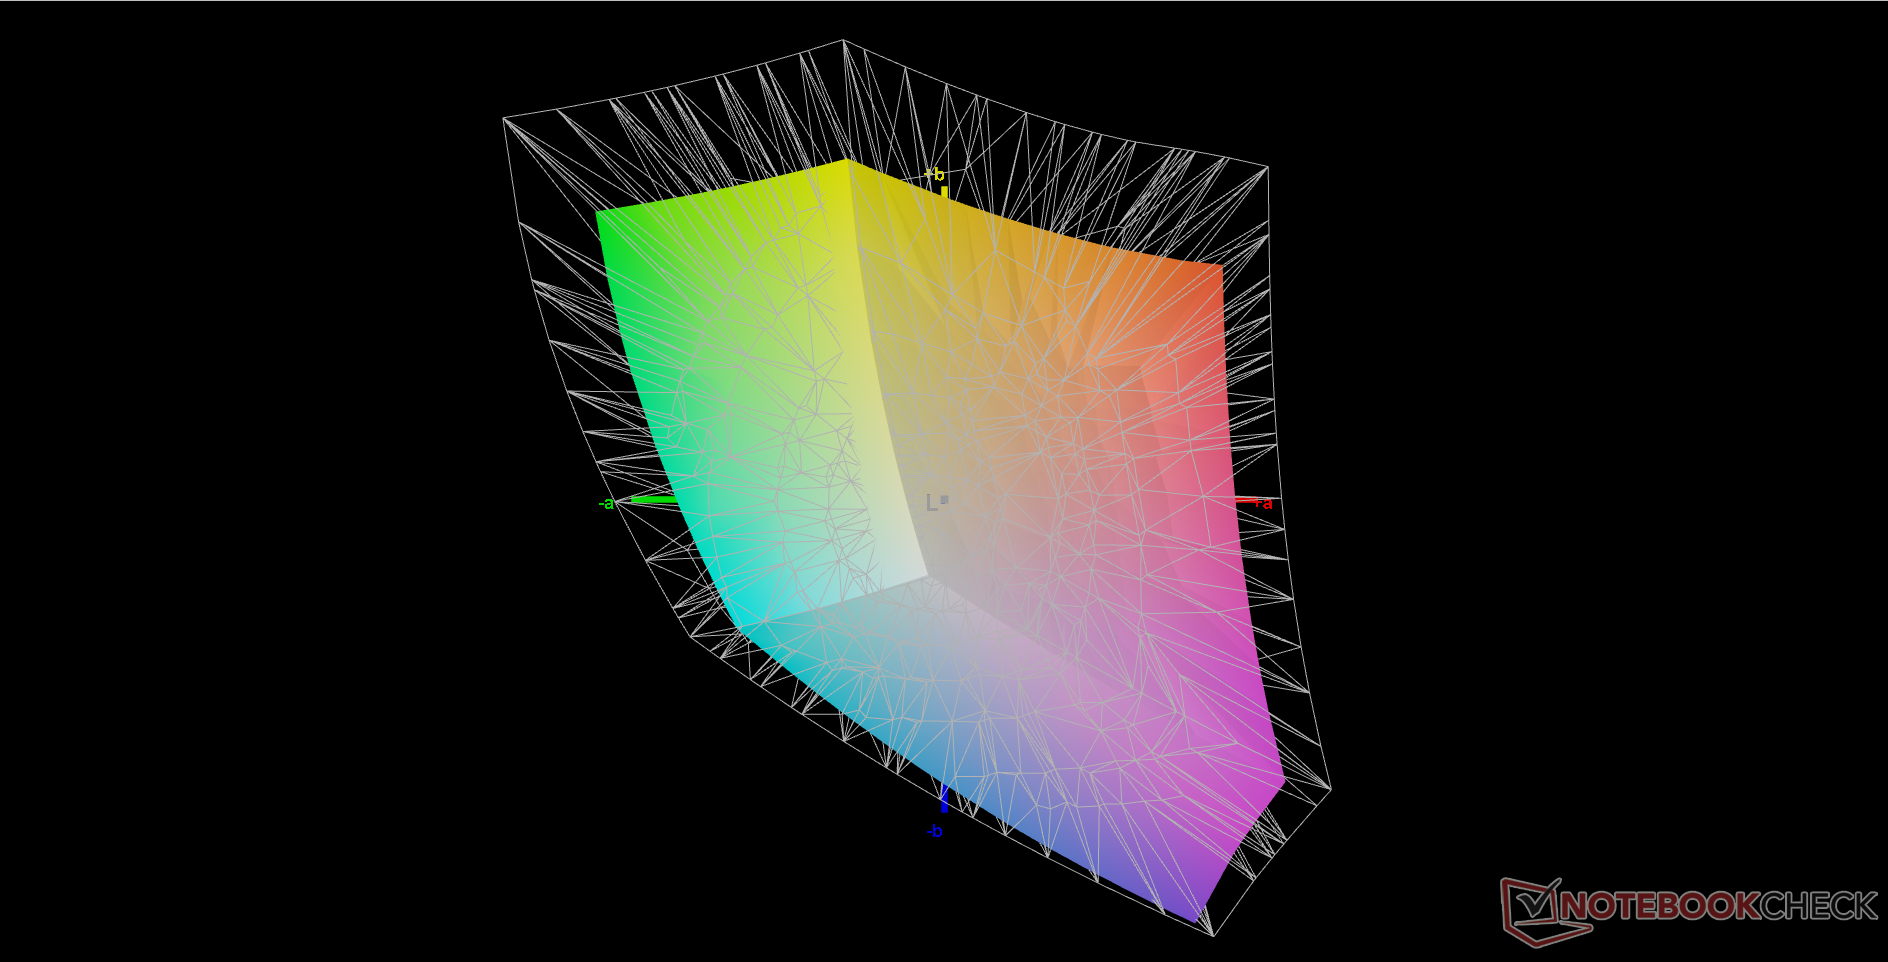
72.1% AdobeRGB 1998 (Argyll 3D)
99.5% sRGB (Argyll 3D)
70.1% Display P3 (Argyll 3D)
Gamma: 2.24
CCT: 6864 K
| MSI Vector GP66 12UGS BOE NE156FHM-NZ3, IPS, 1920x1080, 15.6" | MSI GP66 Leopard 11UH-028 LGD0625 (LP156WFG-SPB3), IPS, 1920x1080, 15.6" | MSI Katana GF66 11UG-220 AU Optronics B156HAN08.0, IPS, 1920x1080, 15.6" | Asus TUF Gaming F15 FX506HM Chi Mei N156HRA-EA1, IPS, 1920x1080, 15.6" | Razer Blade 15 Base Edition 2021, i7-10750H RTX 3060 BOE NV156FHM-N4K, IPS, 1920x1080, 15.6" | Alienware m15 R5 Ryzen Edition B156HAN, IPS, 1920x1080, 15.6" | |
|---|---|---|---|---|---|---|
| Display | -6% | -7% | -39% | -8% | ||
| Display P3 Coverage (%) | 70.1 | 65.2 -7% | 65.4 -7% | 41.9 -40% | 64.3 -8% | |
| sRGB Coverage (%) | 99.5 | 95.8 -4% | 91.3 -8% | 62.9 -37% | 91.8 -8% | |
| AdobeRGB 1998 Coverage (%) | 72.1 | 66 -8% | 66.7 -7% | 43.3 -40% | 65.5 -9% | |
| Response Times | -77% | -23% | -258% | -28% | 22% | |
| Response Time Grey 50% / Grey 80% * (ms) | 5.8 ? | 14 ? -141% | 7.4 ? -28% | 28.4 ? -390% | 8.8 ? -52% | 4 ? 31% |
| Response Time Black / White * (ms) | 9.6 ? | 10.8 ? -13% | 11.2 ? -17% | 21.6 ? -125% | 10 ? -4% | 8.4 ? 12% |
| PWM Frequency (Hz) | 1000 ? | |||||
| Screen | -21% | -30% | -71% | -32% | 2% | |
| Brightness middle (cd/m²) | 353.1 | 390 10% | 307 -13% | 268.3 -24% | 317.2 -10% | 329 -7% |
| Brightness (cd/m²) | 325 | 362 11% | 321 -1% | 257 -21% | 306 -6% | 321 -1% |
| Brightness Distribution (%) | 85 | 87 2% | 83 -2% | 84 -1% | 89 5% | 92 8% |
| Black Level * (cd/m²) | 0.38 | 0.41 -8% | 0.27 29% | 0.34 11% | 0.31 18% | 0.27 29% |
| Contrast (:1) | 929 | 951 2% | 1137 22% | 789 -15% | 1023 10% | 1219 31% |
| Colorchecker dE 2000 * | 2.24 | 2.66 -19% | 4.67 -108% | 5.05 -125% | 4.37 -95% | 2.78 -24% |
| Colorchecker dE 2000 max. * | 5 | 7.14 -43% | 7.53 -51% | 15.43 -209% | 6.62 -32% | 4.88 2% |
| Colorchecker dE 2000 calibrated * | 1.02 | 2.56 -151% | 2.41 -136% | 3.21 -215% | 2.67 -162% | 1.63 -60% |
| Greyscale dE 2000 * | 4 | 3.63 9% | 4.5 -13% | 5.5 -38% | 4.5 -13% | 2.5 37% |
| Gamma | 2.24 98% | 2.57 86% | 2.276 97% | 2.35 94% | 2.4 92% | 2.106 104% |
| CCT | 6864 95% | 6894 94% | 6824 95% | 7392 88% | 7418 88% | 6201 105% |
| Color Space (Percent of AdobeRGB 1998) (%) | 59.2 | 76 | ||||
| Color Space (Percent of sRGB) (%) | 91.4 | 99 | ||||
| Total Average (Program / Settings) | -35% /
-26% | -20% /
-24% | -123% /
-91% | -23% /
-26% | 12% /
5% |
* ... smaller is better
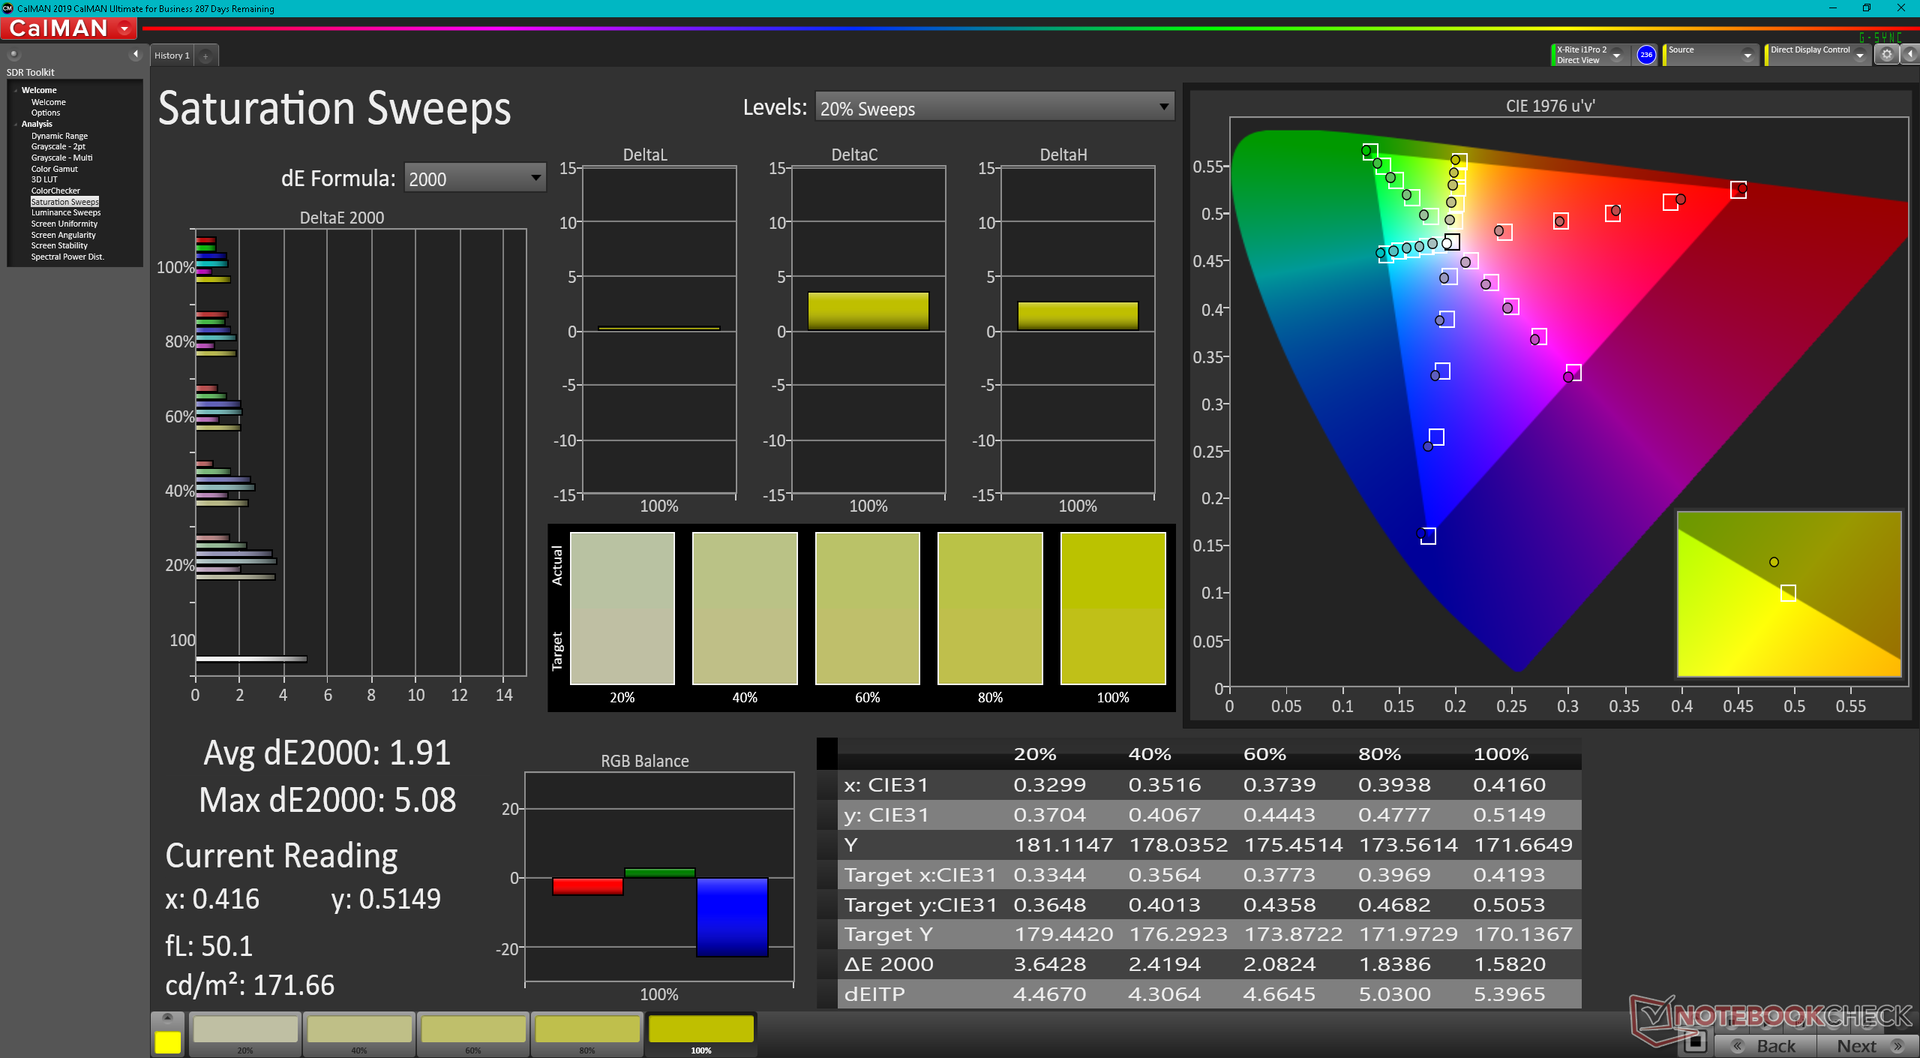
The panel covers all of sRGB and even a bit more of AdobeRGB when compared to panels on the GF66 Katana or GP66 Leopard. We're glad to see a high quality panel here as opposed to the Chi Mei on the Asus TUF Gaming F15 that covers a significantly narrower gamut.
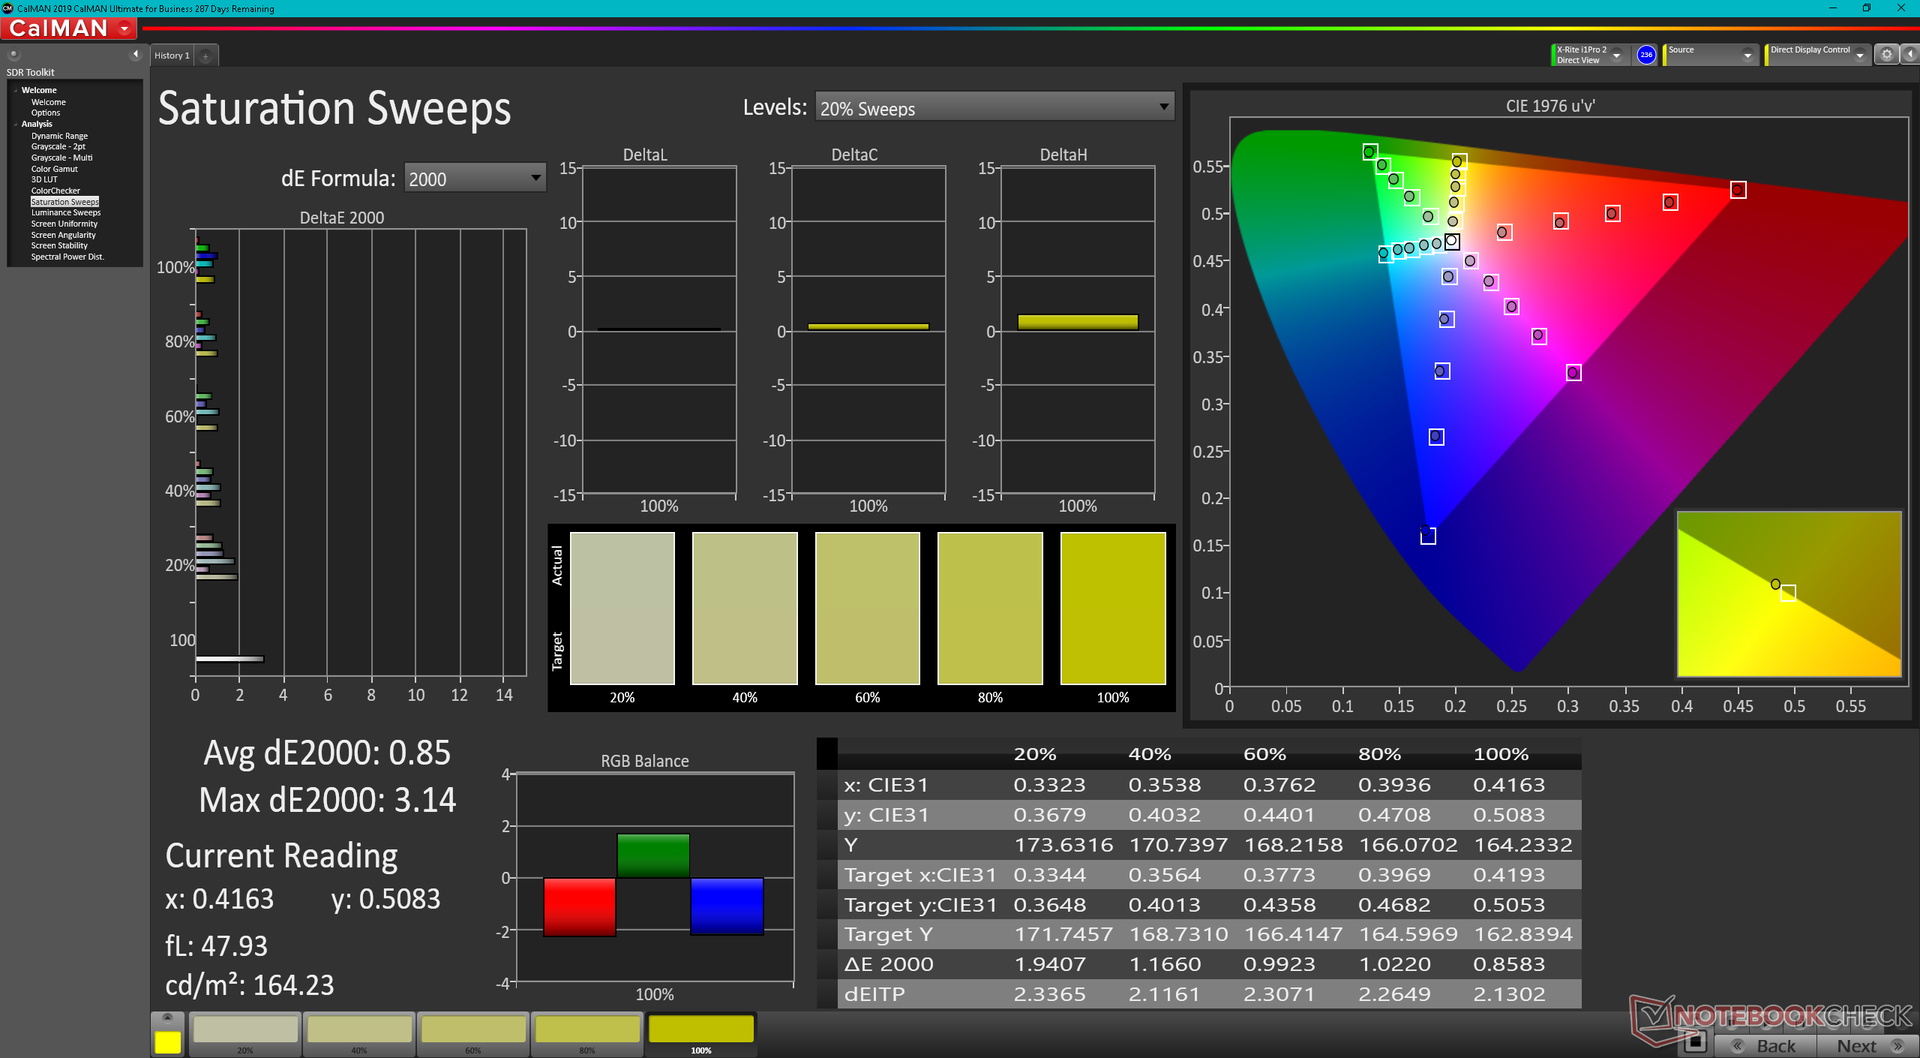
The display is decently calibrated out-of-the-box even though its color temperature could be slightly warmer. An X-Rite colorimeter calibration addresses this to improve the average grayscale and color DeltaE values from 4 and 2.24 to just 1.8 and 1.02, respectively.
Display Response Times
| ↔ Response Time Black to White | ||
|---|---|---|
| 9.6 ms ... rise ↗ and fall ↘ combined | ↗ 5.2 ms rise | 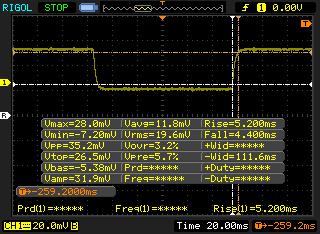 |
| ↘ 4.4 ms fall | ||
| The screen shows fast response rates in our tests and should be suited for gaming. In comparison, all tested devices range from 0.1 (minimum) to 240 (maximum) ms. » 26 % of all devices are better. This means that the measured response time is better than the average of all tested devices (20 ms). | ||
| ↔ Response Time 50% Grey to 80% Grey | ||
| 5.8 ms ... rise ↗ and fall ↘ combined | ↗ 3.4 ms rise | 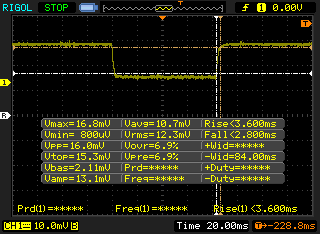 |
| ↘ 2.4 ms fall | ||
| The screen shows very fast response rates in our tests and should be very well suited for fast-paced gaming. In comparison, all tested devices range from 0.165 (minimum) to 636 (maximum) ms. » 18 % of all devices are better. This means that the measured response time is better than the average of all tested devices (31.4 ms). | ||
Screen Flickering / PWM (Pulse-Width Modulation)
| Screen flickering / PWM not detected | 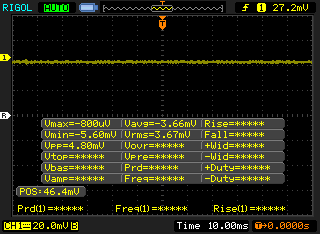 | ||
In comparison: 53 % of all tested devices do not use PWM to dim the display. If PWM was detected, an average of 7966 (minimum: 5 - maximum: 343500) Hz was measured. | |||

Performance
Testing Conditions
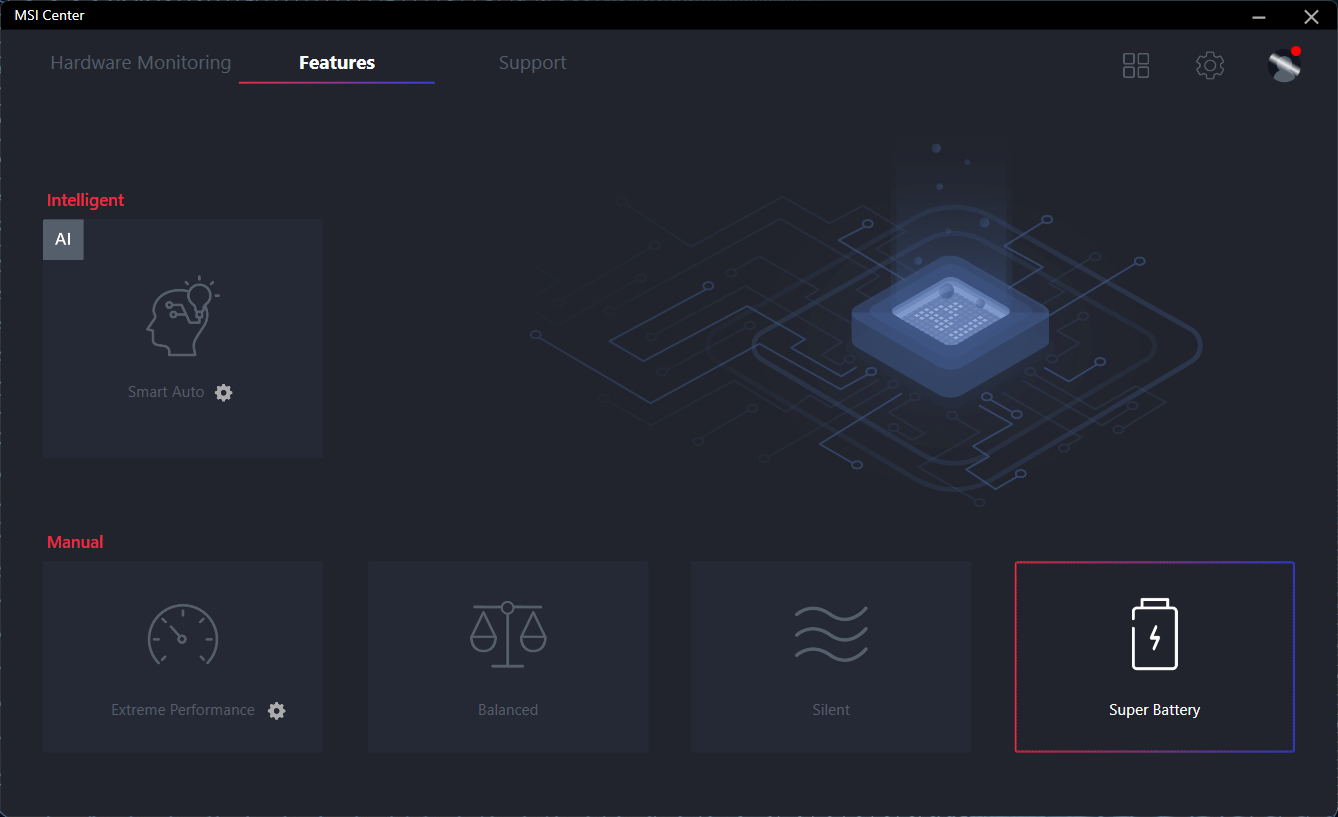
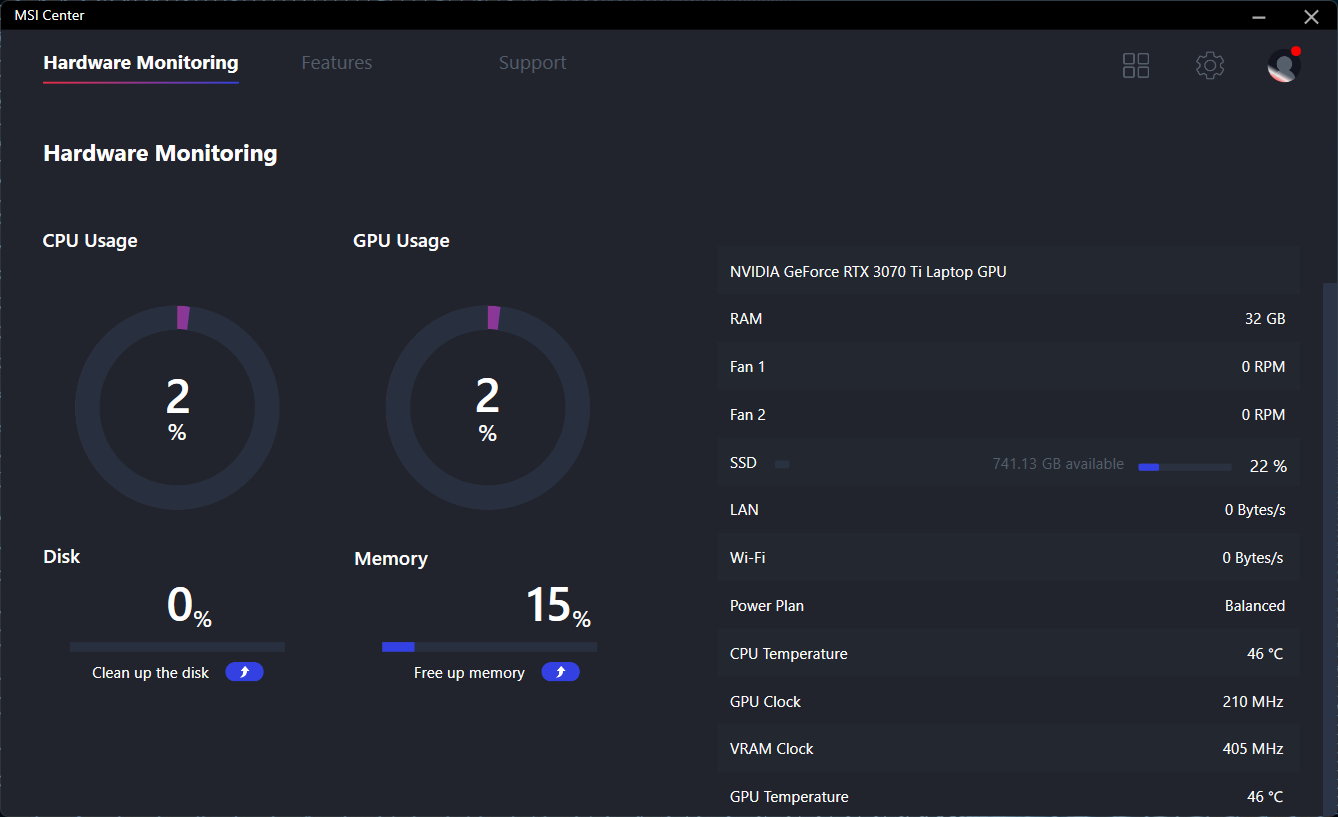
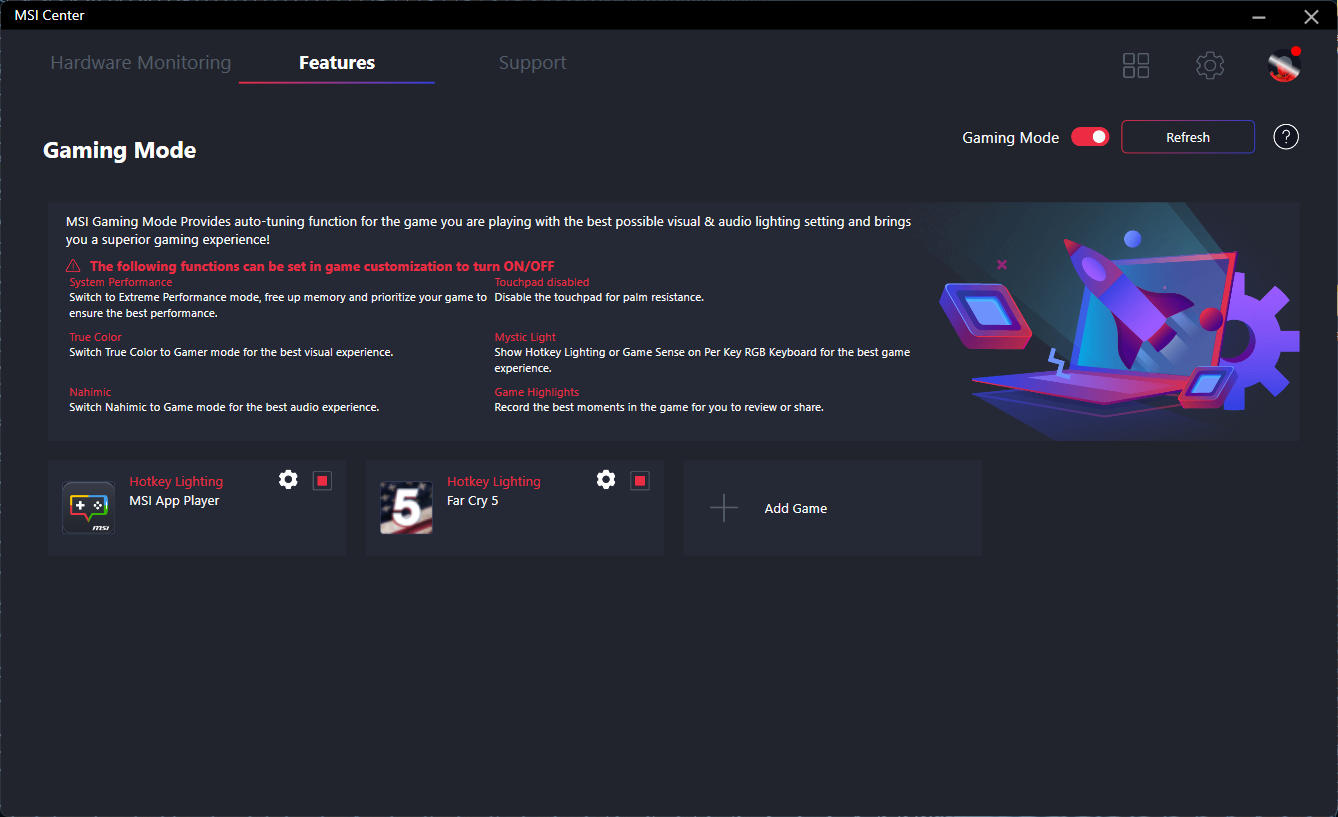
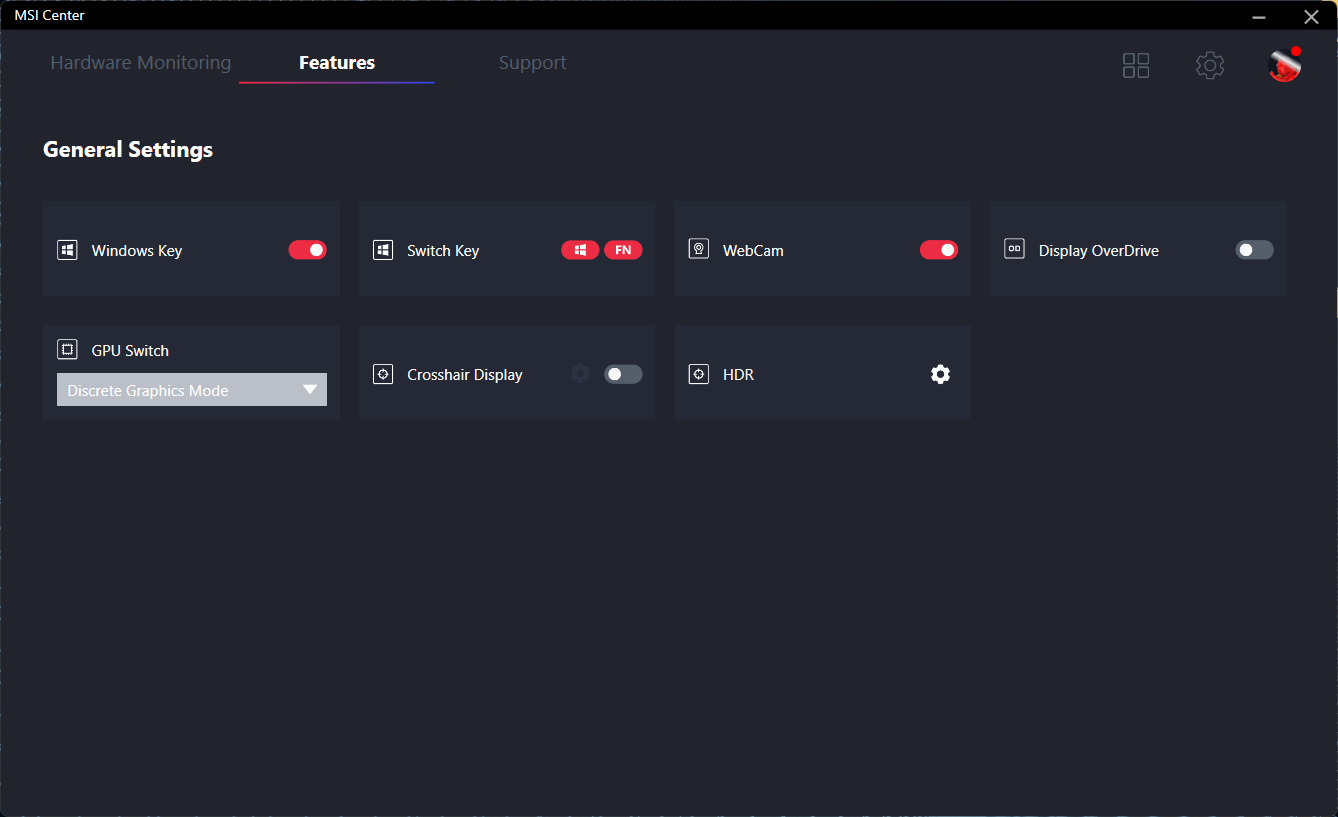
Our unit was set to Extreme Performance mode with the discrete GPU active via the MSI Center software for the highest possible scores. We highly recommend users become familiar with this software as many important features are toggled here including MSHybrid, hardware monitoring, HDR, and other QoL settings. For keyboard lighting effects, users must rely on the pre-installed SteelSeries GG software.
A reboot is required if switching between MSHybrid and discrete GPU modes.
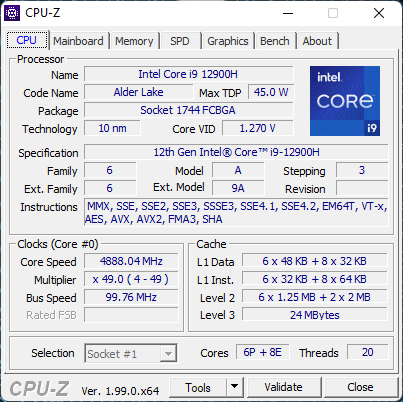
Processor
The Core i9-12900H is about 25 percent and 35 percent faster in single-threaded and multi-threaded applications, respectively, when compared to the last generation Core i7-11800H as found on the GP66 Leopard. Overall performance can even outpace the more power-hungry desktop Core i9-11900K. The AMD Zen 3 H-series previously held the performance crown prior to the launch of Intel's Alder Lake-H series.
More information on the Alder Lake can be found on our overview of the platform here.
Cinebench R15 Multi Loop
Cinebench R23: Multi Core | Single Core
Cinebench R15: CPU Multi 64Bit | CPU Single 64Bit
Blender: v2.79 BMW27 CPU
7-Zip 18.03: 7z b 4 | 7z b 4 -mmt1
Geekbench 5.5: Multi-Core | Single-Core
HWBOT x265 Benchmark v2.2: 4k Preset
LibreOffice : 20 Documents To PDF
R Benchmark 2.5: Overall mean
| Cinebench R20 / CPU (Multi Core) | |
| Intel Core i9-12900K | |
| MSI Vector GP66 12UGS | |
| MSI MEG Z590 ACE | |
| Average Intel Core i9-12900H (2681 - 7471, n=28) | |
| Eurocom Nightsky ARX315 | |
| MSI GP66 Leopard 11UH-028 | |
| HP ZBook Fury 15 G8 | |
| MSI Alpha 15 B5EEK-008 | |
| MSI Delta 15 A5EFK | |
| Alienware m15 R4 | |
| MSI GE65 Raider 9SF-049US | |
| Razer Blade 15 Advanced Model Early 2021 | |
| Cinebench R20 / CPU (Single Core) | |
| Intel Core i9-12900K | |
| MSI Vector GP66 12UGS | |
| Average Intel Core i9-12900H (624 - 738, n=28) | |
| MSI MEG Z590 ACE | |
| HP ZBook Fury 15 G8 | |
| Eurocom Nightsky ARX315 | |
| MSI GP66 Leopard 11UH-028 | |
| MSI Delta 15 A5EFK | |
| MSI Alpha 15 B5EEK-008 | |
| Alienware m15 R4 | |
| Razer Blade 15 Advanced Model Early 2021 | |
| MSI GE65 Raider 9SF-049US | |
| Cinebench R23 / Multi Core | |
| Intel Core i9-12900K | |
| MSI Vector GP66 12UGS | |
| MSI MEG Z590 ACE | |
| Average Intel Core i9-12900H (7359 - 19648, n=28) | |
| Eurocom Nightsky ARX315 | |
| MSI GP66 Leopard 11UH-028 | |
| HP ZBook Fury 15 G8 | |
| MSI Alpha 15 B5EEK-008 | |
| MSI Delta 15 A5EFK | |
| Razer Blade 15 Advanced Model Early 2021 | |
| Cinebench R23 / Single Core | |
| Intel Core i9-12900K | |
| MSI Vector GP66 12UGS | |
| Average Intel Core i9-12900H (1634 - 1930, n=28) | |
| MSI MEG Z590 ACE | |
| HP ZBook Fury 15 G8 | |
| Eurocom Nightsky ARX315 | |
| MSI GP66 Leopard 11UH-028 | |
| MSI Delta 15 A5EFK | |
| MSI Alpha 15 B5EEK-008 | |
| Razer Blade 15 Advanced Model Early 2021 | |
| Cinebench R15 / CPU Multi 64Bit | |
| Intel Core i9-12900K | |
| Average Intel Core i9-12900H (1395 - 3077, n=28) | |
| MSI Vector GP66 12UGS | |
| MSI MEG Z590 ACE | |
| Eurocom Nightsky ARX315 | |
| MSI Delta 15 A5EFK | |
| MSI GP66 Leopard 11UH-028 | |
| MSI Alpha 15 B5EEK-008 | |
| HP ZBook Fury 15 G8 | |
| MSI GE65 Raider 9SF-049US | |
| Alienware m15 R4 | |
| Razer Blade 15 Advanced Model Early 2021 | |
| Cinebench R15 / CPU Single 64Bit | |
| Intel Core i9-12900K | |
| MSI Vector GP66 12UGS | |
| Average Intel Core i9-12900H (235 - 277, n=29) | |
| MSI MEG Z590 ACE | |
| Eurocom Nightsky ARX315 | |
| HP ZBook Fury 15 G8 | |
| MSI Delta 15 A5EFK | |
| MSI Alpha 15 B5EEK-008 | |
| MSI GP66 Leopard 11UH-028 | |
| Alienware m15 R4 | |
| Razer Blade 15 Advanced Model Early 2021 | |
| MSI GE65 Raider 9SF-049US | |
| Blender / v2.79 BMW27 CPU | |
| Razer Blade 15 Advanced Model Early 2021 | |
| Alienware m15 R4 | |
| HP ZBook Fury 15 G8 | |
| MSI Alpha 15 B5EEK-008 | |
| MSI GP66 Leopard 11UH-028 | |
| MSI Delta 15 A5EFK | |
| Average Intel Core i9-12900H (160 - 451, n=28) | |
| Eurocom Nightsky ARX315 | |
| MSI Vector GP66 12UGS | |
| MSI MEG Z590 ACE | |
| Intel Core i9-12900K | |
| 7-Zip 18.03 / 7z b 4 | |
| Intel Core i9-12900K | |
| Eurocom Nightsky ARX315 | |
| MSI Vector GP66 12UGS | |
| MSI MEG Z590 ACE | |
| Average Intel Core i9-12900H (34684 - 76677, n=28) | |
| MSI Delta 15 A5EFK | |
| MSI Alpha 15 B5EEK-008 | |
| MSI GP66 Leopard 11UH-028 | |
| HP ZBook Fury 15 G8 | |
| Alienware m15 R4 | |
| Razer Blade 15 Advanced Model Early 2021 | |
| 7-Zip 18.03 / 7z b 4 -mmt1 | |
| Intel Core i9-12900K | |
| Eurocom Nightsky ARX315 | |
| MSI MEG Z590 ACE | |
| MSI Vector GP66 12UGS | |
| Average Intel Core i9-12900H (5302 - 6289, n=28) | |
| HP ZBook Fury 15 G8 | |
| MSI Delta 15 A5EFK | |
| MSI GP66 Leopard 11UH-028 | |
| MSI Alpha 15 B5EEK-008 | |
| Alienware m15 R4 | |
| Razer Blade 15 Advanced Model Early 2021 | |
| Geekbench 5.5 / Multi-Core | |
| Intel Core i9-12900K | |
| MSI Vector GP66 12UGS | |
| Average Intel Core i9-12900H (8519 - 14376, n=31) | |
| MSI MEG Z590 ACE | |
| Eurocom Nightsky ARX315 | |
| MSI GP66 Leopard 11UH-028 | |
| MSI Delta 15 A5EFK | |
| MSI Alpha 15 B5EEK-008 | |
| Alienware m15 R4 | |
| Razer Blade 15 Advanced Model Early 2021 | |
| Geekbench 5.5 / Single-Core | |
| Intel Core i9-12900K | |
| MSI Vector GP66 12UGS | |
| Average Intel Core i9-12900H (1631 - 1897, n=31) | |
| MSI MEG Z590 ACE | |
| Eurocom Nightsky ARX315 | |
| MSI GP66 Leopard 11UH-028 | |
| MSI Delta 15 A5EFK | |
| MSI Alpha 15 B5EEK-008 | |
| Alienware m15 R4 | |
| Razer Blade 15 Advanced Model Early 2021 | |
| HWBOT x265 Benchmark v2.2 / 4k Preset | |
| Intel Core i9-12900K | |
| MSI Vector GP66 12UGS | |
| MSI MEG Z590 ACE | |
| Eurocom Nightsky ARX315 | |
| Average Intel Core i9-12900H (8.05 - 22.5, n=28) | |
| MSI Delta 15 A5EFK | |
| MSI GP66 Leopard 11UH-028 | |
| MSI Alpha 15 B5EEK-008 | |
| HP ZBook Fury 15 G8 | |
| Alienware m15 R4 | |
| Razer Blade 15 Advanced Model Early 2021 | |
| LibreOffice / 20 Documents To PDF | |
| MSI Alpha 15 B5EEK-008 | |
| Razer Blade 15 Advanced Model Early 2021 | |
| MSI Delta 15 A5EFK | |
| HP ZBook Fury 15 G8 | |
| Alienware m15 R4 | |
| MSI GP66 Leopard 11UH-028 | |
| Eurocom Nightsky ARX315 | |
| Average Intel Core i9-12900H (36.8 - 59.8, n=28) | |
| MSI MEG Z590 ACE | |
| Intel Core i9-12900K | |
| MSI Vector GP66 12UGS | |
| R Benchmark 2.5 / Overall mean | |
| Razer Blade 15 Advanced Model Early 2021 | |
| Alienware m15 R4 | |
| MSI GP66 Leopard 11UH-028 | |
| HP ZBook Fury 15 G8 | |
| MSI Alpha 15 B5EEK-008 | |
| MSI Delta 15 A5EFK | |
| Eurocom Nightsky ARX315 | |
| MSI MEG Z590 ACE | |
| Average Intel Core i9-12900H (0.4218 - 0.506, n=28) | |
| MSI Vector GP66 12UGS | |
| Intel Core i9-12900K | |
* ... smaller is better
AIDA64: FP32 Ray-Trace | FPU Julia | CPU SHA3 | CPU Queen | FPU SinJulia | FPU Mandel | CPU AES | CPU ZLib | FP64 Ray-Trace | CPU PhotoWorxx
| Performance rating | |
| MSI GP66 Leopard 11UH-028 | |
| Alienware m15 R5 Ryzen Edition | |
| Average Intel Core i9-12900H | |
| MSI Vector GP66 12UGS | |
| MSI Katana GF66 11UG-220 -9! | |
| Asus TUF Gaming F15 FX506HM -9! | |
| AIDA64 / FP32 Ray-Trace | |
| MSI GP66 Leopard 11UH-028 | |
| Alienware m15 R5 Ryzen Edition | |
| Average Intel Core i9-12900H (4074 - 18289, n=29) | |
| MSI Vector GP66 12UGS | |
| AIDA64 / FPU Julia | |
| Alienware m15 R5 Ryzen Edition | |
| MSI GP66 Leopard 11UH-028 | |
| Average Intel Core i9-12900H (22307 - 93236, n=29) | |
| MSI Vector GP66 12UGS | |
| AIDA64 / CPU SHA3 | |
| MSI GP66 Leopard 11UH-028 | |
| Alienware m15 R5 Ryzen Edition | |
| Average Intel Core i9-12900H (1378 - 4215, n=29) | |
| MSI Vector GP66 12UGS | |
| AIDA64 / CPU Queen | |
| MSI Vector GP66 12UGS | |
| Average Intel Core i9-12900H (78172 - 111241, n=28) | |
| Alienware m15 R5 Ryzen Edition | |
| MSI GP66 Leopard 11UH-028 | |
| AIDA64 / FPU SinJulia | |
| Alienware m15 R5 Ryzen Edition | |
| MSI GP66 Leopard 11UH-028 | |
| MSI Vector GP66 12UGS | |
| Average Intel Core i9-12900H (5709 - 10410, n=29) | |
| AIDA64 / FPU Mandel | |
| Alienware m15 R5 Ryzen Edition | |
| MSI GP66 Leopard 11UH-028 | |
| Average Intel Core i9-12900H (11257 - 45581, n=29) | |
| MSI Vector GP66 12UGS | |
| AIDA64 / CPU AES | |
| MSI GP66 Leopard 11UH-028 | |
| Alienware m15 R5 Ryzen Edition | |
| MSI Vector GP66 12UGS | |
| Average Intel Core i9-12900H (31935 - 151546, n=29) | |
| AIDA64 / CPU ZLib | |
| MSI Vector GP66 12UGS | |
| Average Intel Core i9-12900H (449 - 1193, n=29) | |
| MSI GP66 Leopard 11UH-028 | |
| Alienware m15 R5 Ryzen Edition | |
| Asus TUF Gaming F15 FX506HM | |
| MSI Katana GF66 11UG-220 | |
| AIDA64 / FP64 Ray-Trace | |
| MSI GP66 Leopard 11UH-028 | |
| Alienware m15 R5 Ryzen Edition | |
| Average Intel Core i9-12900H (2235 - 10511, n=29) | |
| MSI Vector GP66 12UGS | |
| AIDA64 / CPU PhotoWorxx | |
| Average Intel Core i9-12900H (20960 - 48269, n=30) | |
| MSI Vector GP66 12UGS | |
| MSI GP66 Leopard 11UH-028 | |
| Alienware m15 R5 Ryzen Edition | |
System Performance
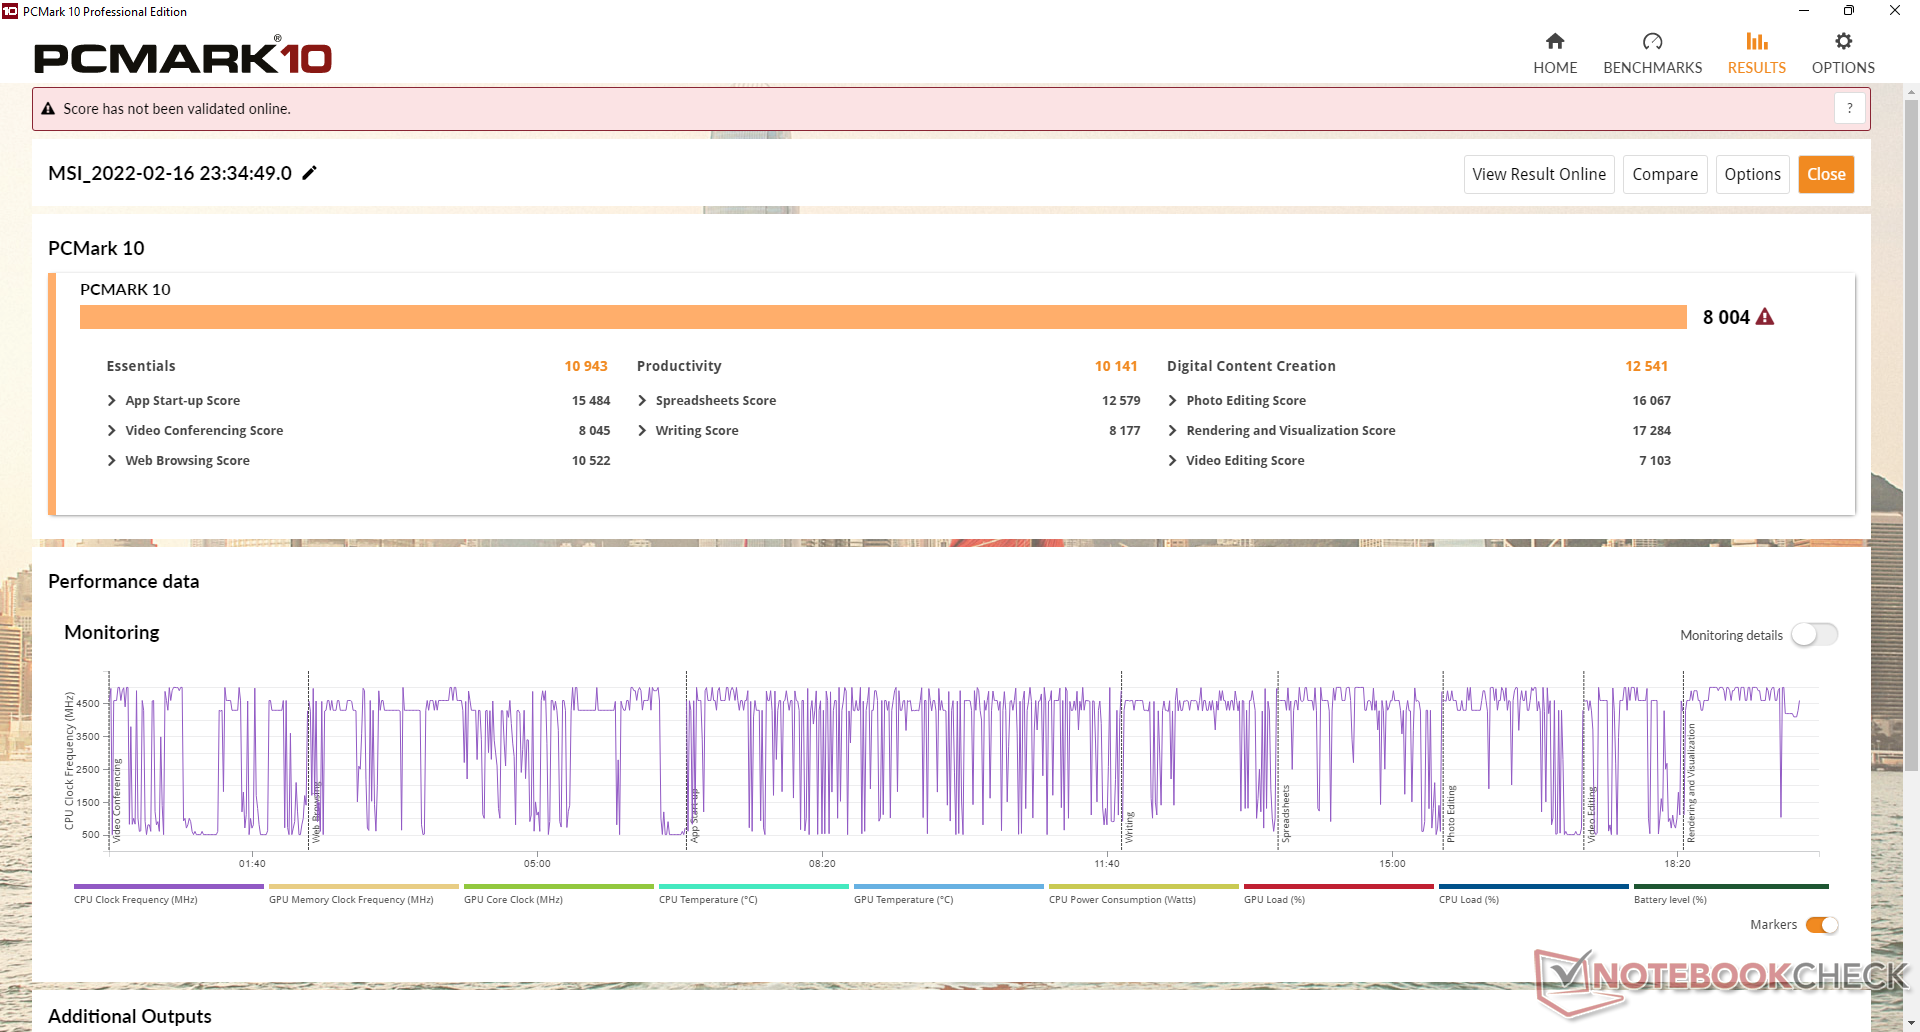
PCMark results are some of the highest in our database at just over 8000 points. The MSI Raider GE76 equipped with the unlocked Core i9-12900HK and faster GeForce RTX 3080 Ti would return essentially identical scores to our GP66.
It's worth noting that we experienced wake and sleep issues with our test unit where the screen would sometimes remain black when switching between GPU modes or when entering sleep mode. A hard reboot would then be required.
| PCMark 10 / Score | |
| MSI Vector GP66 12UGS | |
| Average Intel Core i9-12900H, NVIDIA GeForce RTX 3070 Ti Laptop GPU (7087 - 8072, n=6) | |
| MSI GP66 Leopard 11UH-028 | |
| Asus TUF Gaming F15 FX506HM | |
| MSI Katana GF66 11UG-220 | |
| Alienware m15 R5 Ryzen Edition | |
| Razer Blade 15 Base Edition 2021, i7-10750H RTX 3060 | |
| PCMark 10 / Essentials | |
| MSI Vector GP66 12UGS | |
| Average Intel Core i9-12900H, NVIDIA GeForce RTX 3070 Ti Laptop GPU (10266 - 11663, n=6) | |
| Asus TUF Gaming F15 FX506HM | |
| MSI GP66 Leopard 11UH-028 | |
| Razer Blade 15 Base Edition 2021, i7-10750H RTX 3060 | |
| Alienware m15 R5 Ryzen Edition | |
| MSI Katana GF66 11UG-220 | |
| PCMark 10 / Productivity | |
| Average Intel Core i9-12900H, NVIDIA GeForce RTX 3070 Ti Laptop GPU (9402 - 10742, n=6) | |
| MSI Vector GP66 12UGS | |
| MSI Katana GF66 11UG-220 | |
| Alienware m15 R5 Ryzen Edition | |
| Asus TUF Gaming F15 FX506HM | |
| MSI GP66 Leopard 11UH-028 | |
| Razer Blade 15 Base Edition 2021, i7-10750H RTX 3060 | |
| PCMark 10 / Digital Content Creation | |
| MSI Vector GP66 12UGS | |
| Average Intel Core i9-12900H, NVIDIA GeForce RTX 3070 Ti Laptop GPU (10009 - 12541, n=6) | |
| MSI GP66 Leopard 11UH-028 | |
| MSI Katana GF66 11UG-220 | |
| Asus TUF Gaming F15 FX506HM | |
| Alienware m15 R5 Ryzen Edition | |
| Razer Blade 15 Base Edition 2021, i7-10750H RTX 3060 | |
| PCMark 10 Score | 8004 points | |
Help | ||
| AIDA64 / Memory Copy | |
| Average Intel Core i9-12900H (34438 - 74264, n=29) | |
| MSI Vector GP66 12UGS | |
| MSI GP66 Leopard 11UH-028 | |
| Alienware m15 R5 Ryzen Edition | |
| AIDA64 / Memory Read | |
| Average Intel Core i9-12900H (36365 - 74642, n=29) | |
| MSI GP66 Leopard 11UH-028 | |
| MSI Vector GP66 12UGS | |
| Alienware m15 R5 Ryzen Edition | |
| AIDA64 / Memory Write | |
| Average Intel Core i9-12900H (32276 - 67858, n=29) | |
| MSI Vector GP66 12UGS | |
| MSI GP66 Leopard 11UH-028 | |
| Alienware m15 R5 Ryzen Edition | |
| AIDA64 / Memory Latency | |
| MSI GP66 Leopard 11UH-028 | |
| MSI Vector GP66 12UGS | |
| Average Intel Core i9-12900H (74.7 - 118.1, n=28) | |
| Alienware m15 R5 Ryzen Edition | |
| Asus TUF Gaming F15 FX506HM | |
| MSI Katana GF66 11UG-220 | |
| MSI Katana GF66 11UG-220 | |
* ... smaller is better
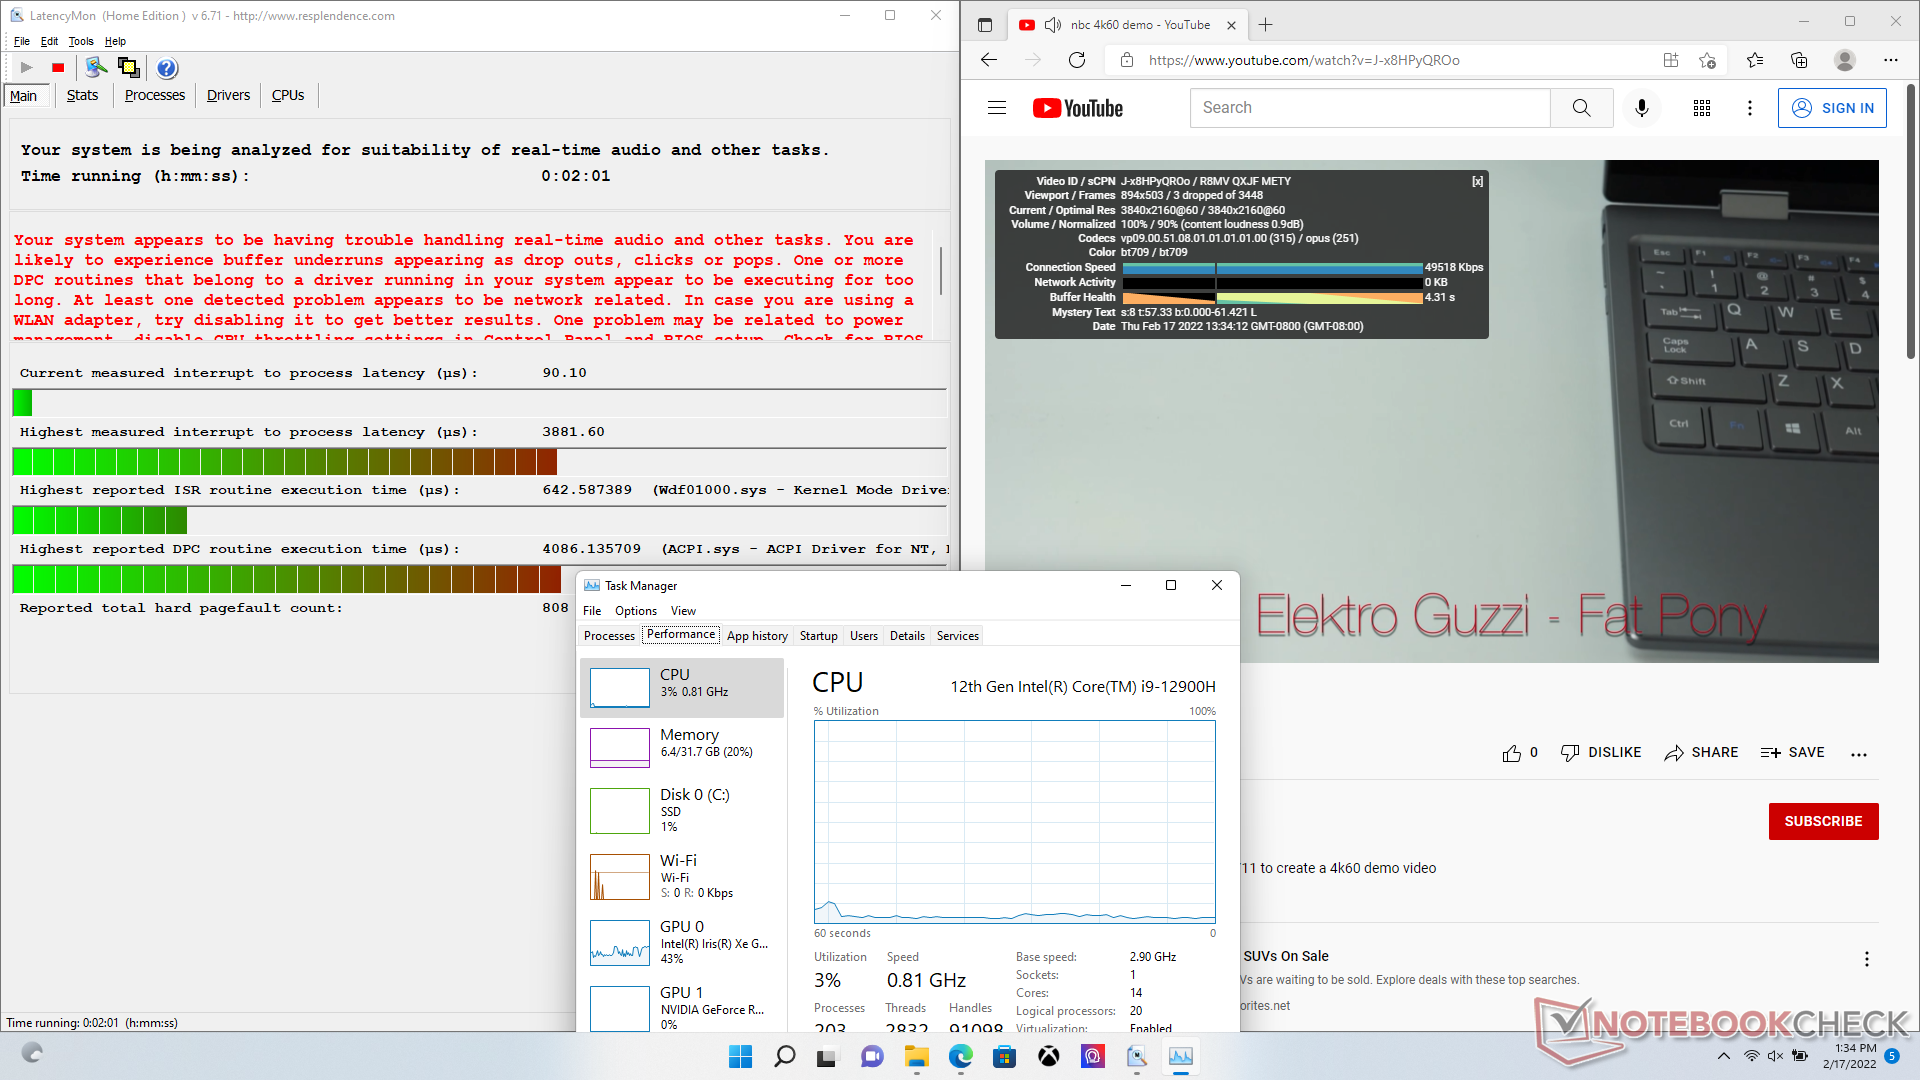
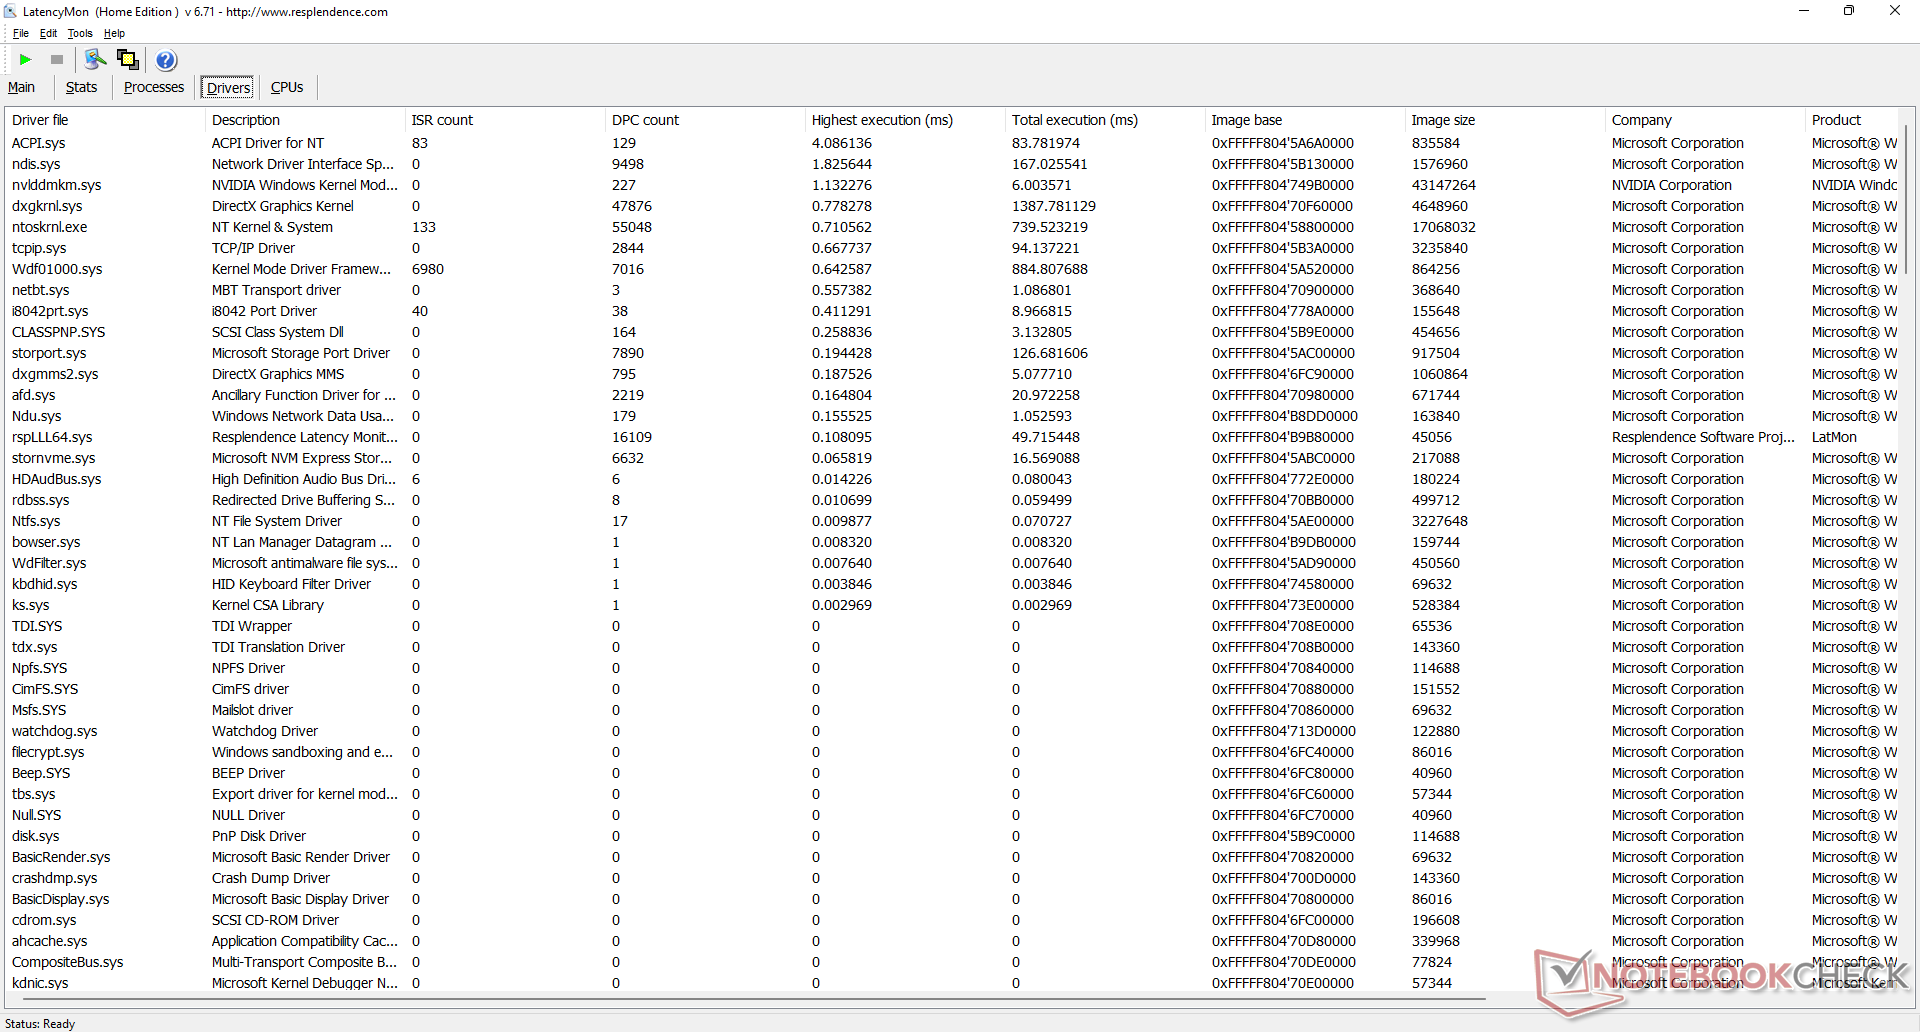
DPC Latency
LatencyMon reveals DPC issues when opening multiple browser tabs on our homepage. 4K video playback at 60 FPS is otherwise smooth with only 3 dropped frames during our minute-long video test.
| DPC Latencies / LatencyMon - interrupt to process latency (max), Web, Youtube, Prime95 | |
| MSI Vector GP66 12UGS | |
| Asus TUF Gaming F15 FX506HM | |
| MSI Katana GF66 11UG-220 | |
| MSI GP66 Leopard 11UH-028 | |
| Razer Blade 15 Base Edition 2021, i7-10750H RTX 3060 | |
| Alienware m15 R5 Ryzen Edition | |
* ... smaller is better
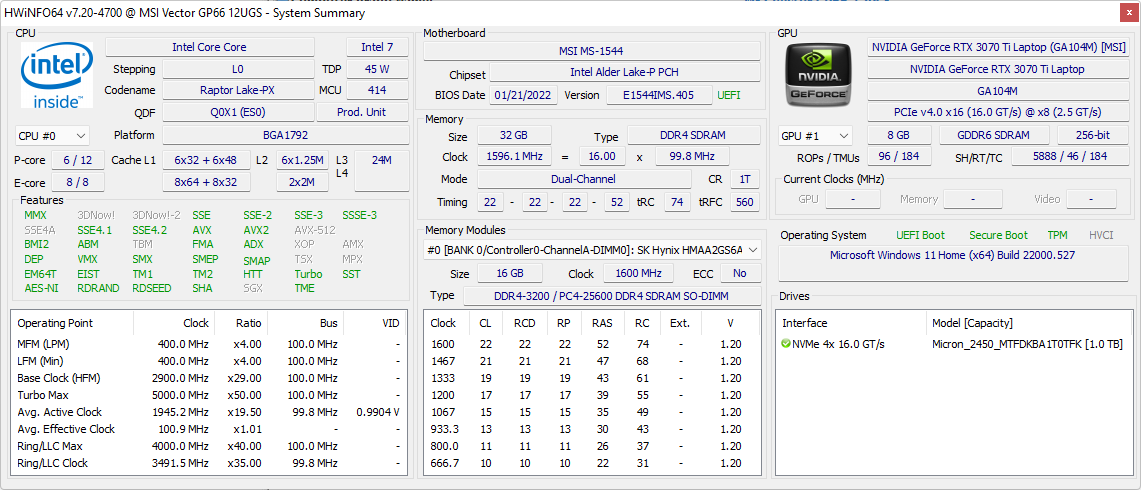
Storage Devices
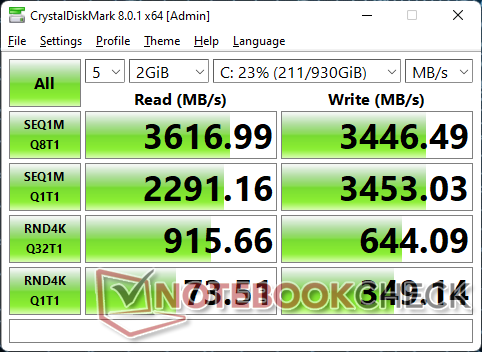
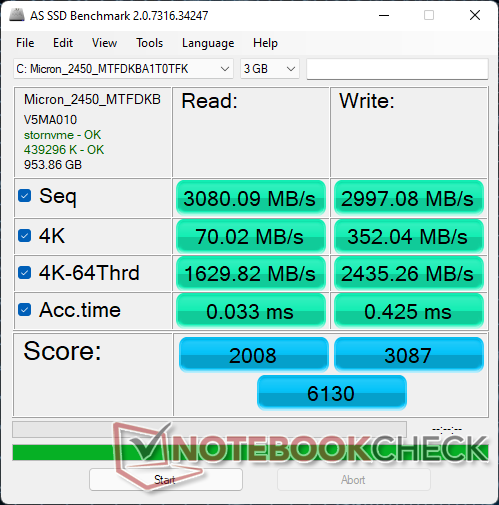
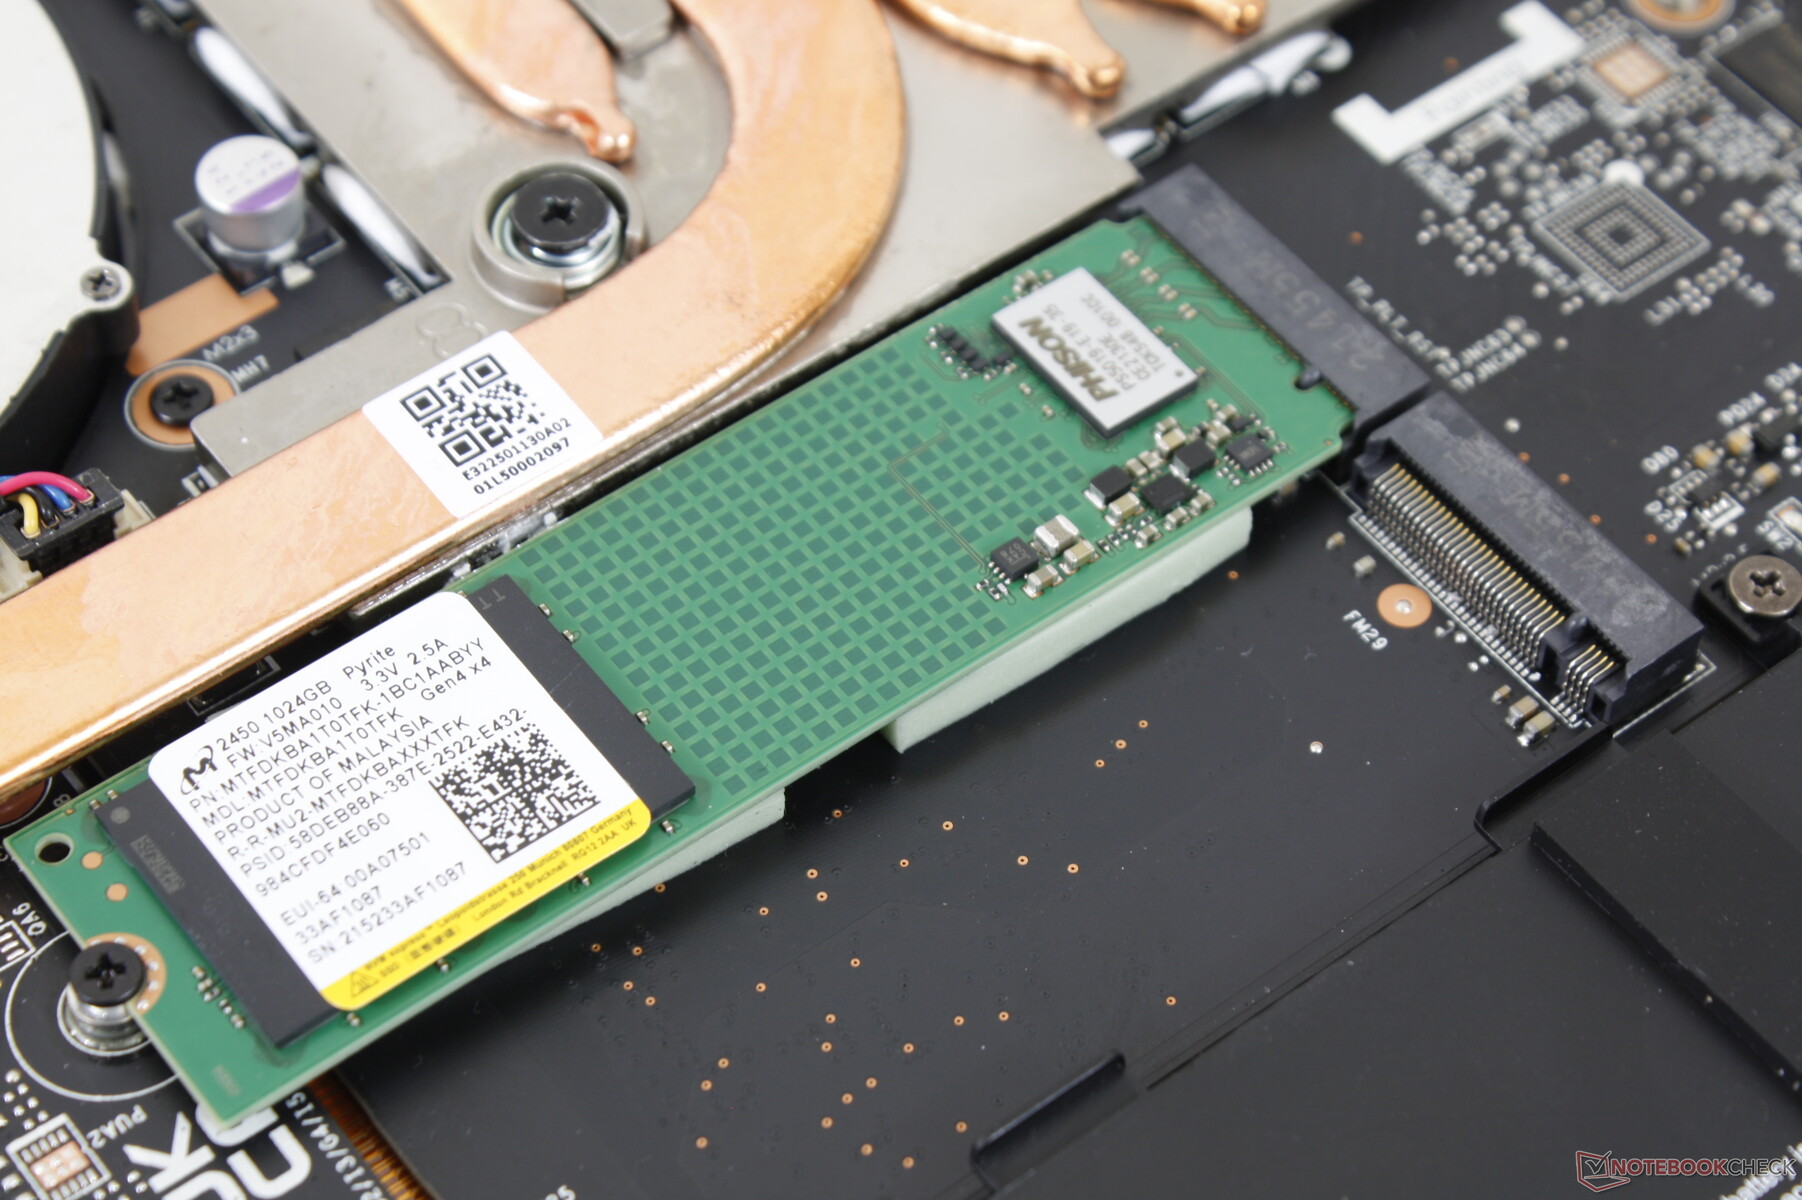
Our test unit comes equipped with the budget 1 TB Micron 2450 MTFDKBA1T0TFK PCIe4 x4 NVMe SSD. Unlike many other PCIe4 x4 SSDs that can reach transfer rates north of 7000 MB/s, the 1 TB Micron 2450 only promises up to 3500 MB/s read and 3000 MB/s write to be comparable to most PCIe3 x4 SSDs instead. Of course, users can still swap out or install a faster PCIe4 x4 drive if desired much like what was included on our GP66 Leopard. Higher-end MSI models like the GT or GS series are more likely to come with faster PCIe4 drives from Samsung.
The drive in our sample would exhibit no issues maintaining its maximum read rate of 3500 MB/s for extended periods.

* ... smaller is better
Disk Throttling: DiskSpd Read Loop, Queue Depth 8
GPU Performance
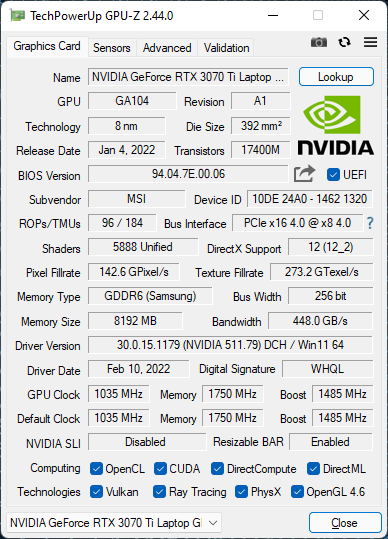
Graphics performance is only about 5 to 10 percent slower than the mobile GeForce RTX 3080 Ti or about 15 to 20 percent faster than the mobile GeForce RTX 3070 as found on the ADATA XPG Xenia 15. These results put our mobile GeForce RTX 3070 Ti within 5 to 15 percent of the desktop GeForce RTX 3070.
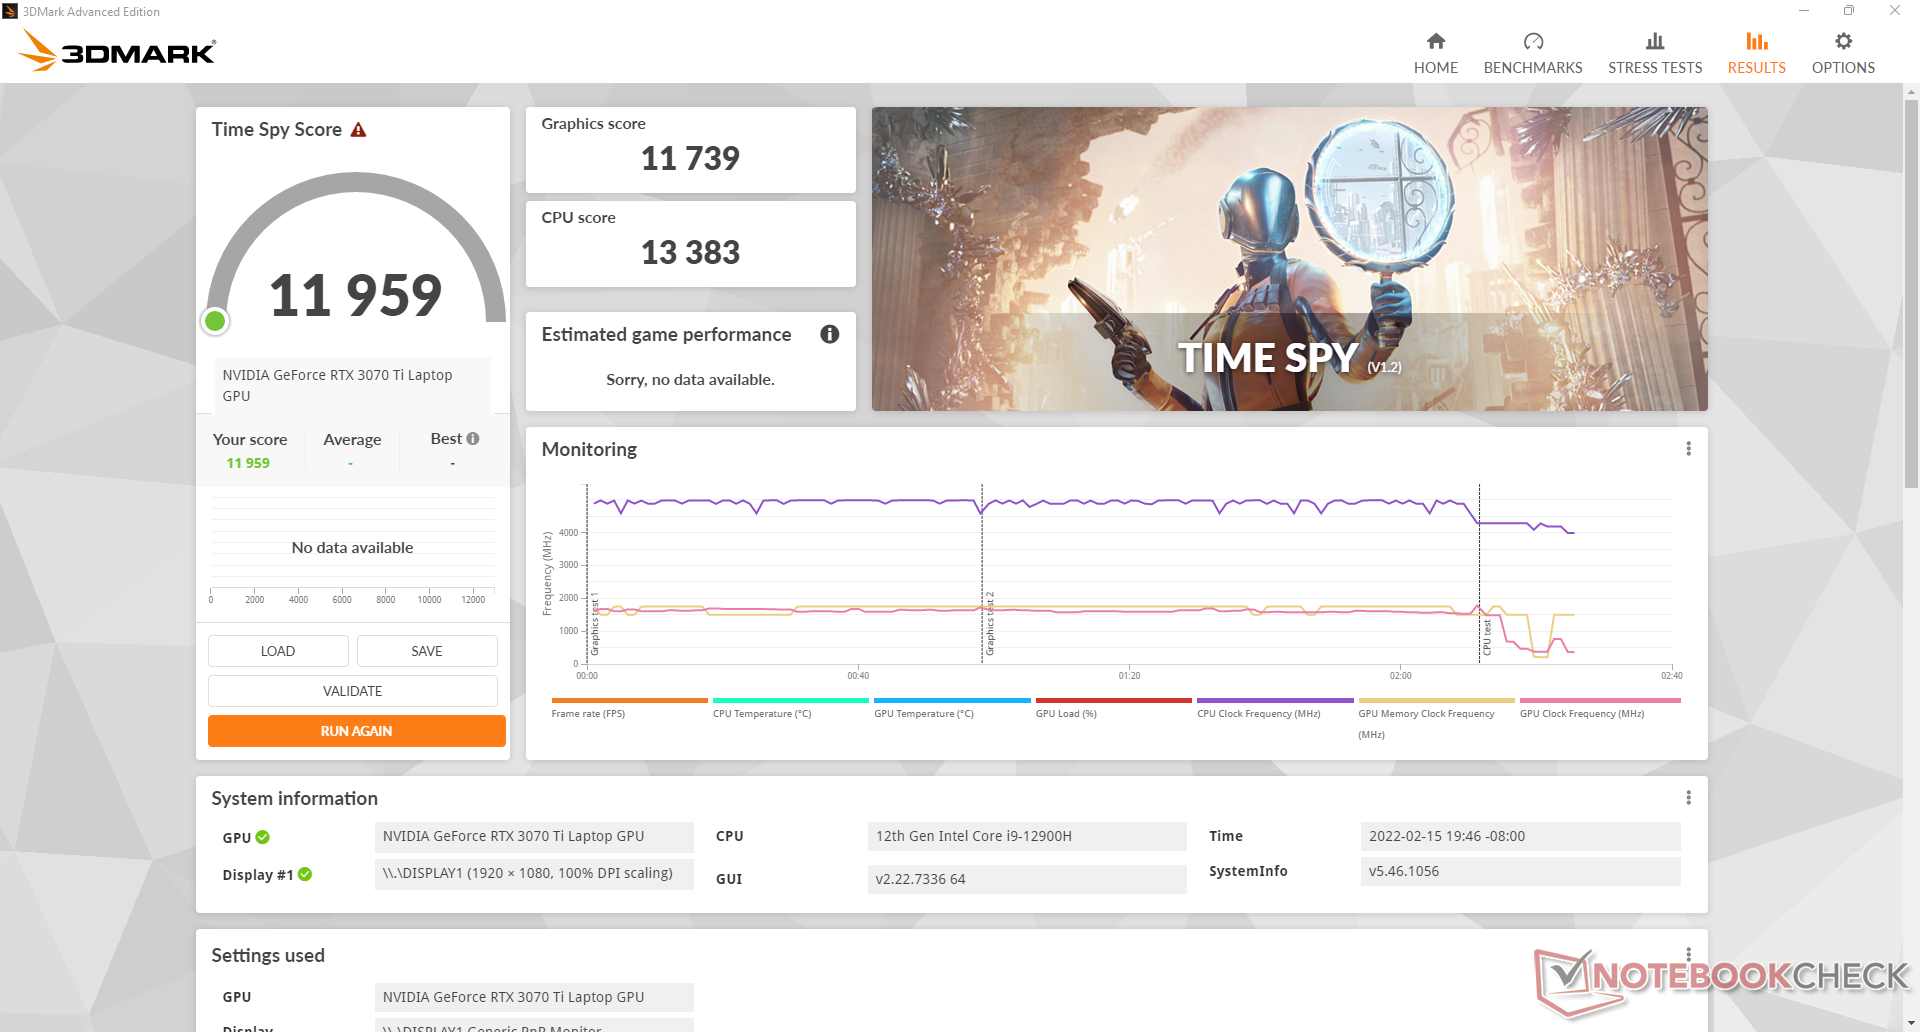
Running on MSHybrid mode instead of dGPU mode will not impart a performance deficit. The Time Spy Graphics score on MSHybrid mode is essentially the same as the score on dGPU mode (11880 points vs. 11739 points).
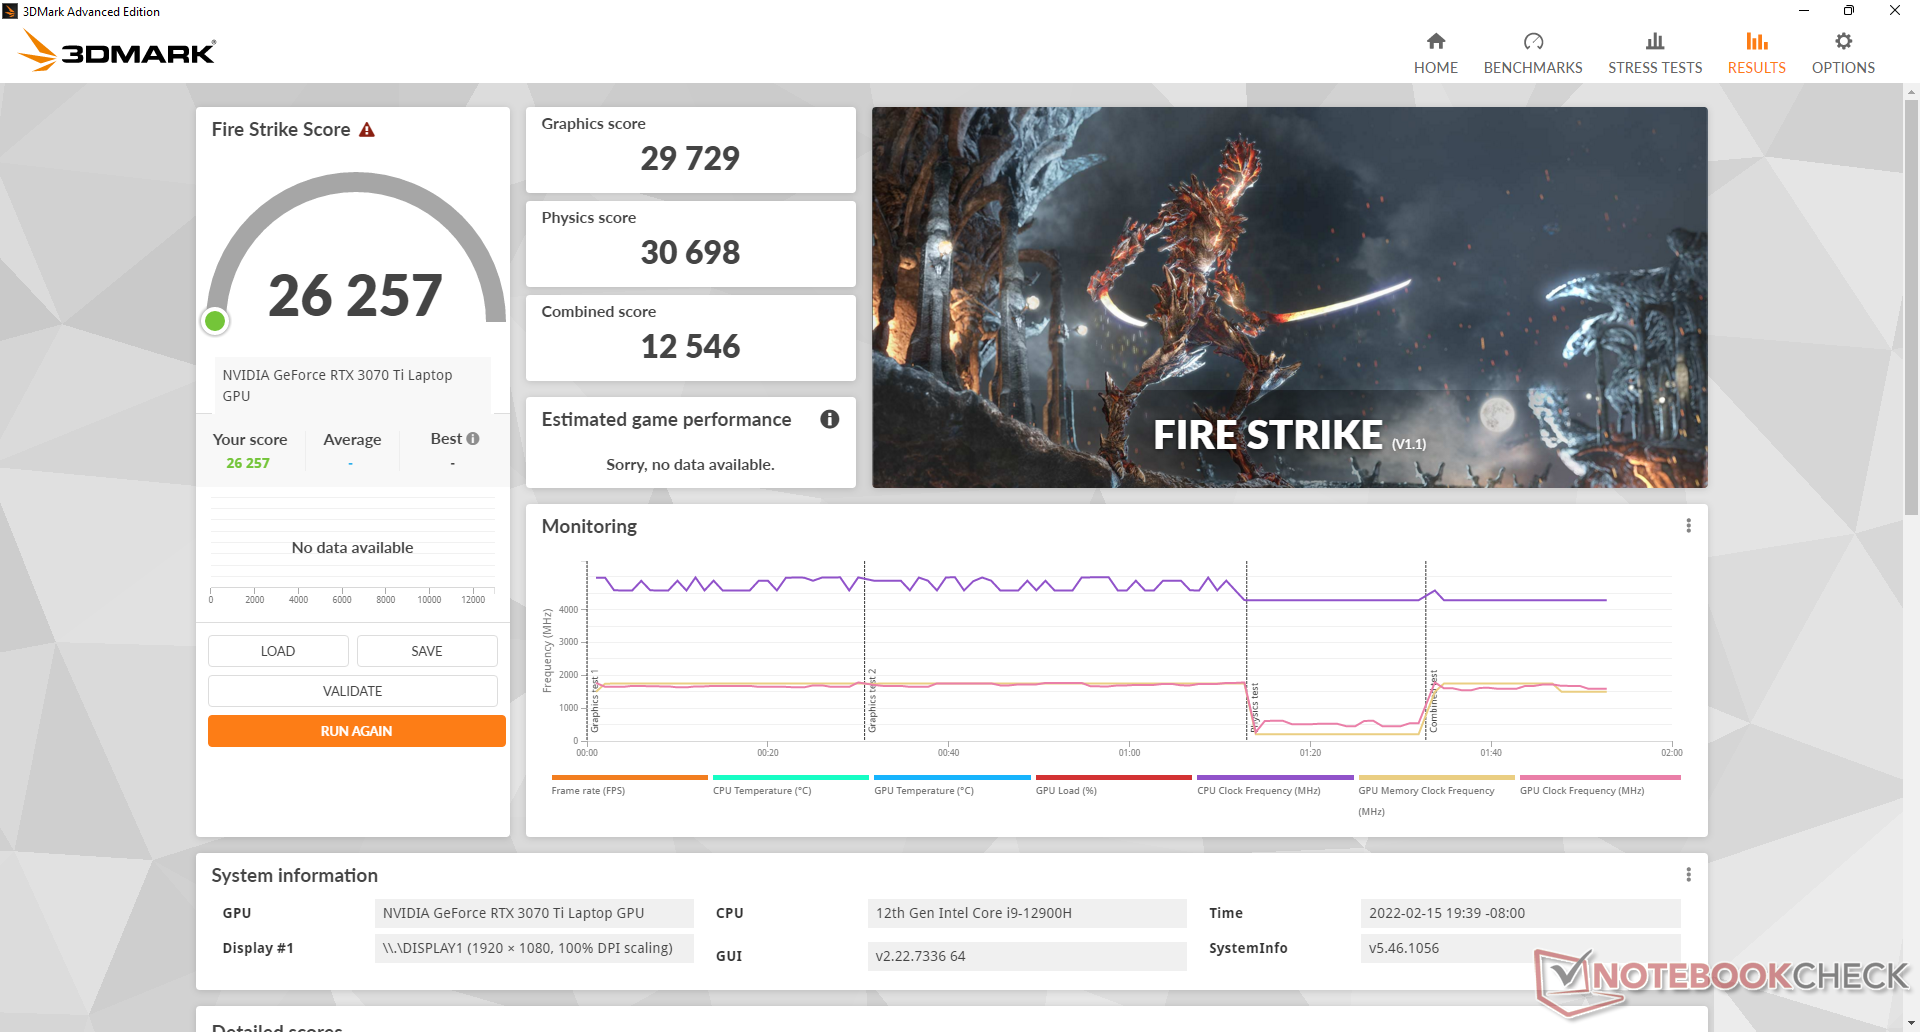
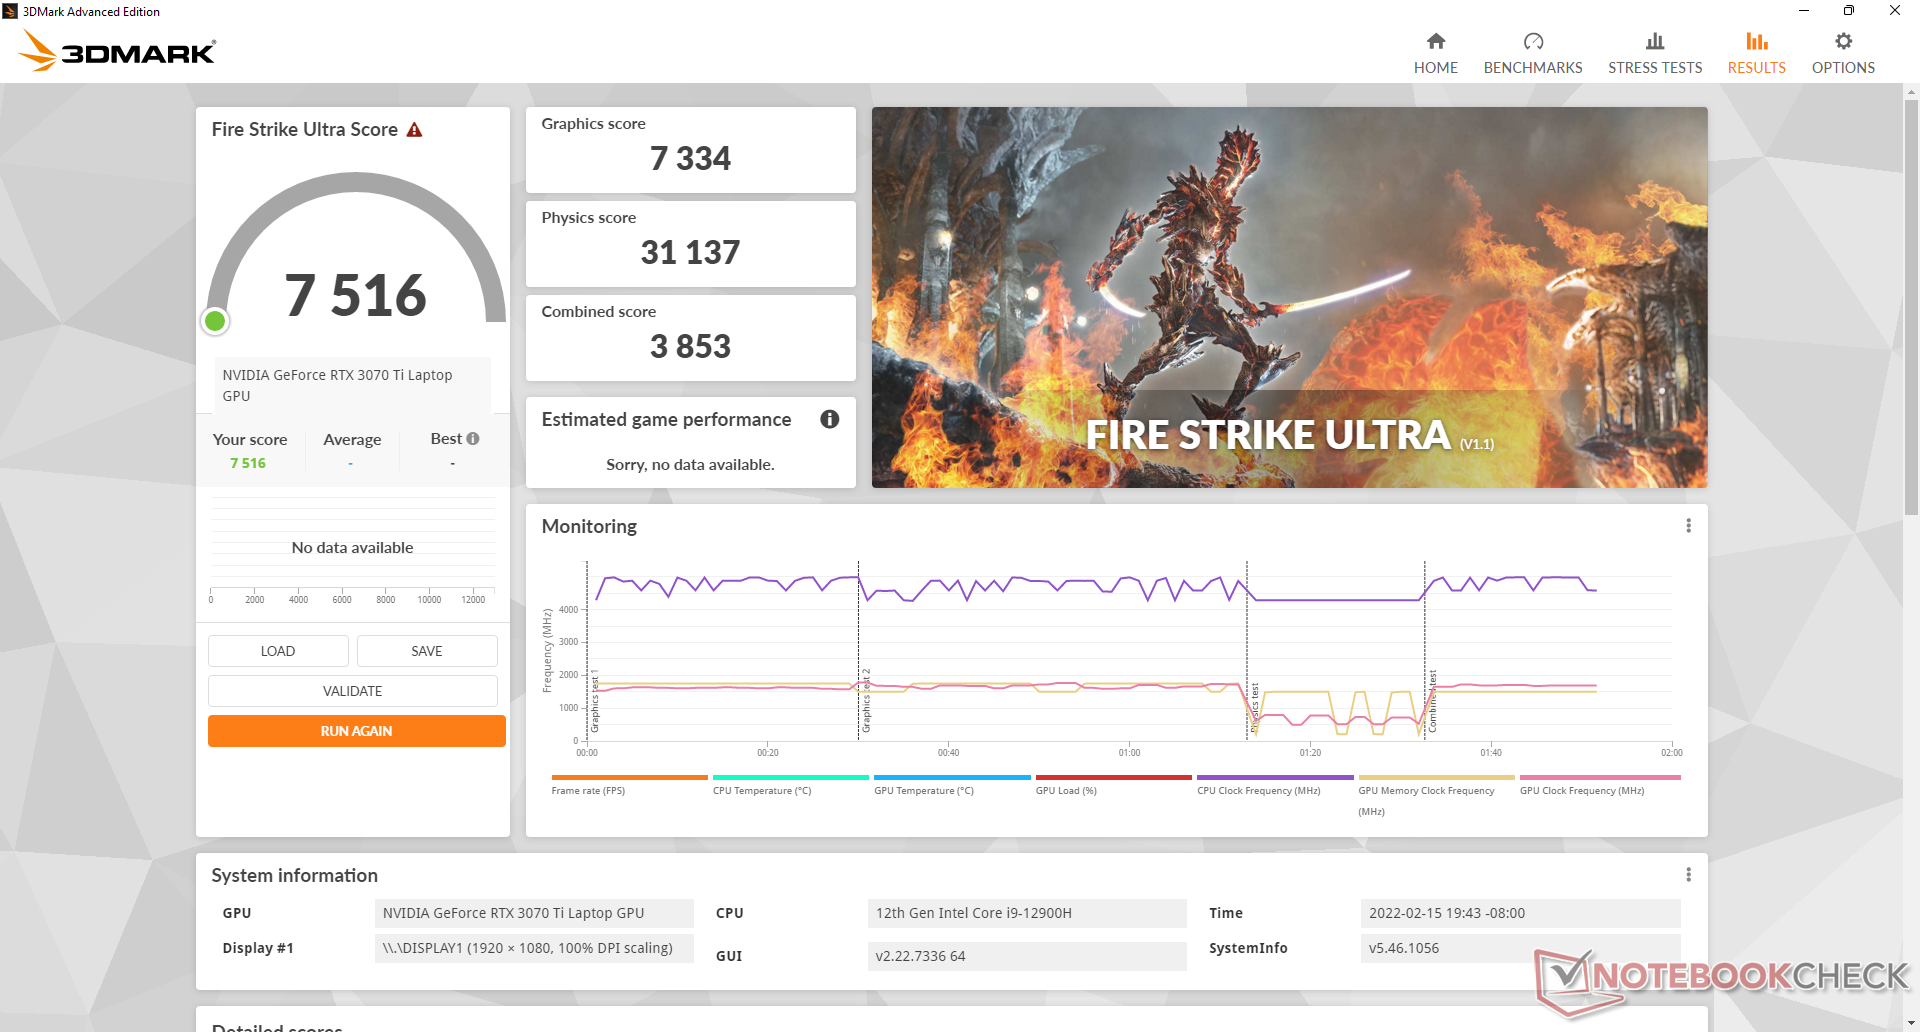
Graphics performance on Balanced mode is reduced by only 4 to 5 percent with the tradeoffs being much quieter fan noise and warmer processors and surfaces. Our Fire Strike Graphics score would drop to 28508 points from 29729 points when running on Balanced mode.
Note that 3DMark scores are up to 20 percent faster than on the MSI GS66 equipped with the same GeForce RTX 3070 Ti due to the higher TGP target of our GP66 (150 W vs. 105 W).
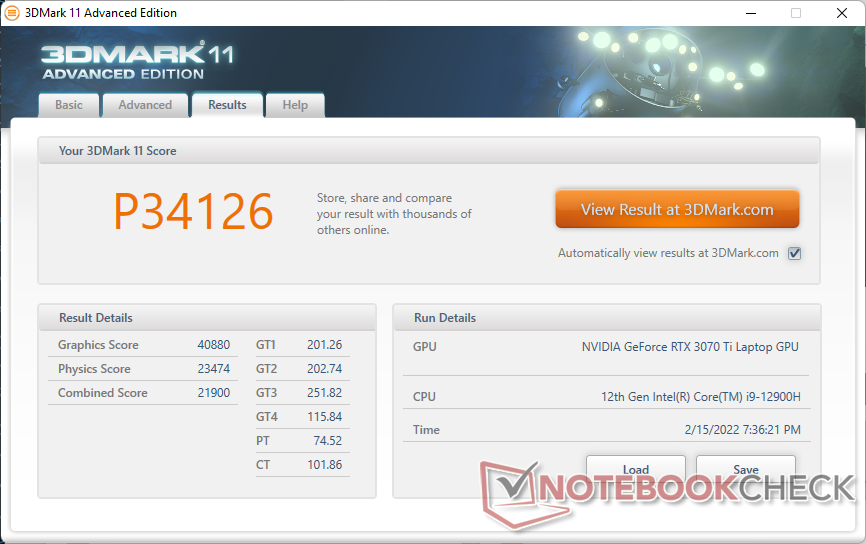

| 3DMark 11 Performance | 34126 points | |
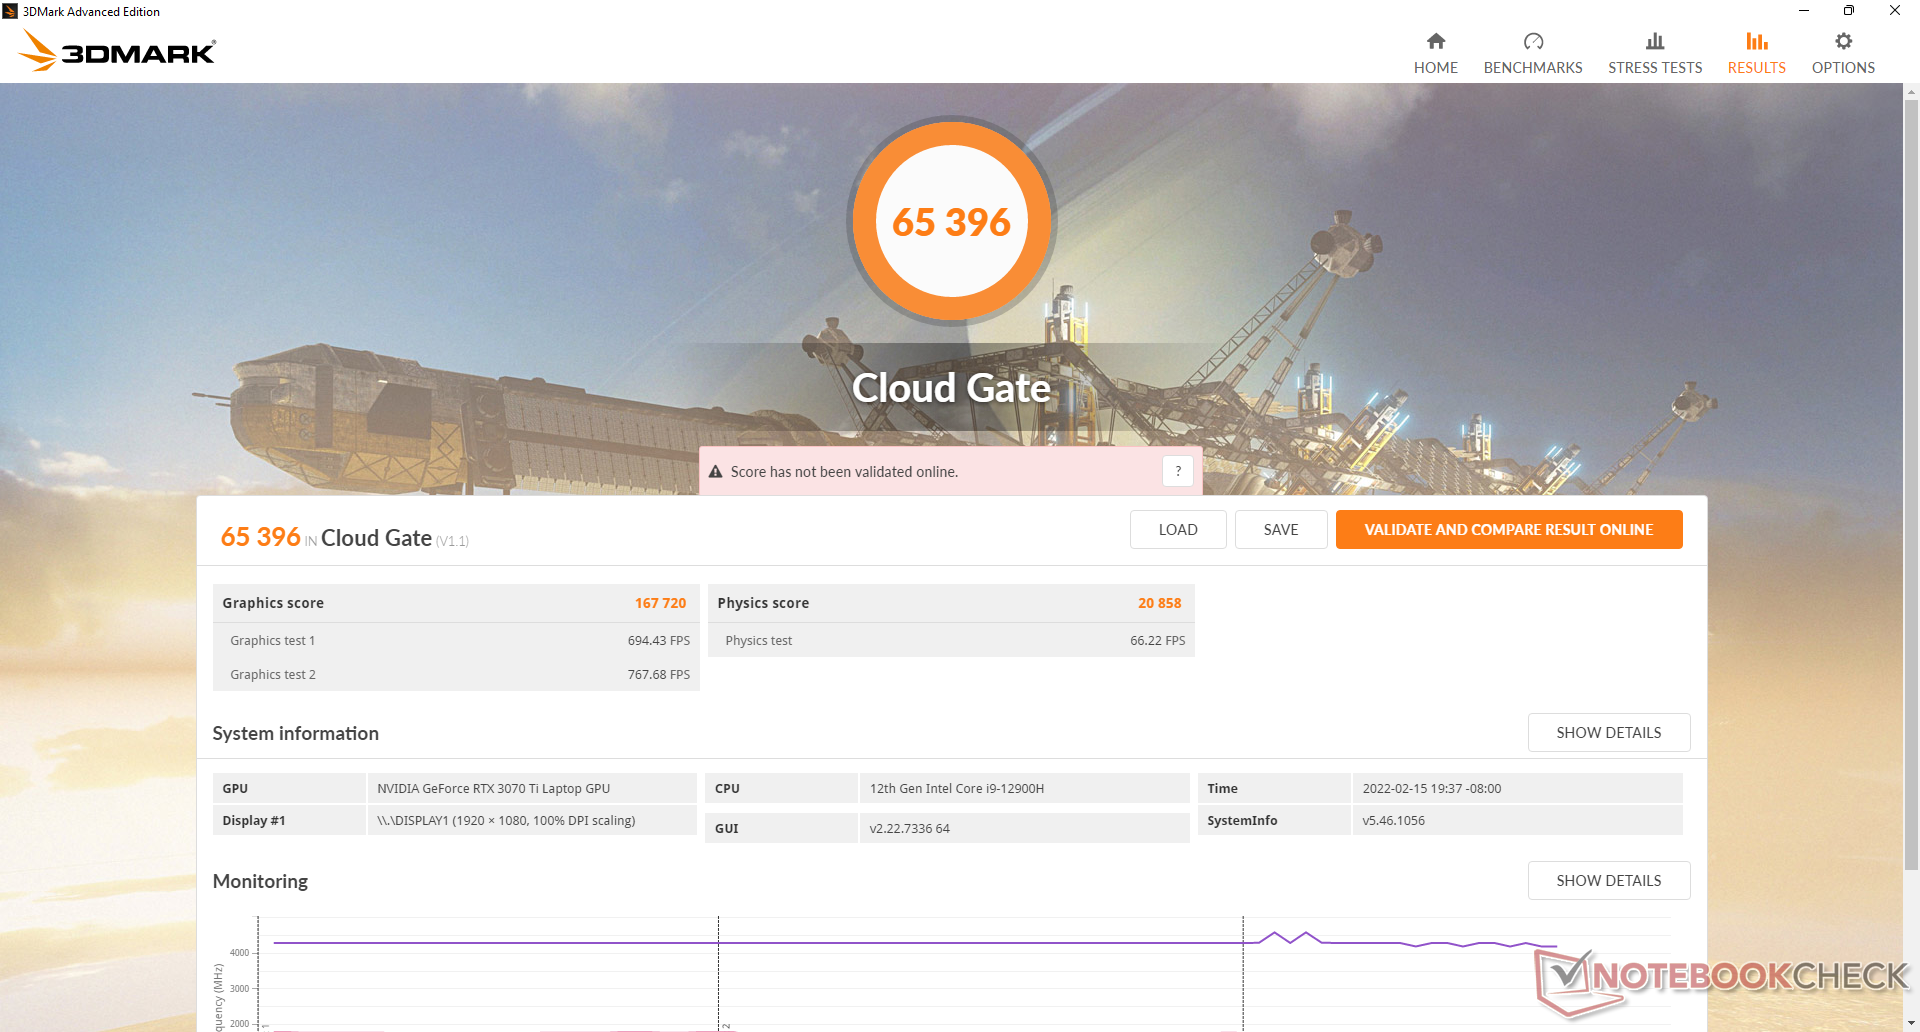
| 3DMark Cloud Gate Standard Score | 65396 points | |
| 3DMark Fire Strike Score | 26257 points | |
| 3DMark Time Spy Score | 11959 points | |
Help | ||
Witcher 3 FPS Chart
| low | med. | high | ultra | |
|---|---|---|---|---|
| GTA V (2015) | 185 | 184 | 179 | 123 |
| The Witcher 3 (2015) | 492.3 | 360 | 223.9 | 114.6 |
| Dota 2 Reborn (2015) | 185 | 169 | 164 | 155 |
| Final Fantasy XV Benchmark (2018) | 207 | 152 | 115 | |
| X-Plane 11.11 (2018) | 161 | 143 | 112 | |
| Far Cry 5 (2018) | 180 | 152 | 145 | 136 |
| Strange Brigade (2018) | 471 | 298 | 244 | 213 |
Emissions
System Noise
Fan noise is highly dependent on the four MSI Center power profiles: Super Battery, Silent, Balanced, and Extreme Performance. There will always be some fan noise at around 26.8 dB(A) against a silent background of 24.7 dB(A) even when set to Silent mode, but this level is low enough to be hard to notice during day-to-day use. We recommend this mode if simply web browsing or video streaming as the fans would pulse much less frequently when compared to the other two faster modes.
Gaming on Balanced mode would result in a fan noise of just under 40 dB(A) compared to 58 dB(A) if on Extreme Performance mode. GPU performance will be a tad slower on Balanced mode, but the noise savings is significant. The upper 50 dB(A) range is generally louder than most other gaming laptops we've tested.
Noise level
| Idle |
| 23.4 / 23.4 / 27.4 dB(A) |
| Load |
| 36 / 58 dB(A) |
 | ||
30 dB silent 40 dB(A) audible 50 dB(A) loud |
||
min: | ||
| MSI Vector GP66 12UGS GeForce RTX 3070 Ti Laptop GPU, i9-12900H | MSI GP66 Leopard 11UH-028 GeForce RTX 3080 Laptop GPU, i7-11800H, Samsung PM9A1 MZVL21T0HCLR | MSI Katana GF66 11UG-220 GeForce RTX 3070 Laptop GPU, i7-11800H, Kingston OM8PDP3512B-AI1 | Asus TUF Gaming F15 FX506HM GeForce RTX 3060 Laptop GPU, i7-11800H, SK Hynix HFM001TD3JX013N | Razer Blade 15 Base Edition 2021, i7-10750H RTX 3060 GeForce RTX 3060 Laptop GPU, i7-10750H, Samsung SSD PM981a MZVLB512HBJQ | Alienware m15 R5 Ryzen Edition GeForce RTX 3060 Laptop GPU, R7 5800H, Toshiba KBG40ZNS512G NVMe | |
|---|---|---|---|---|---|---|
| Noise | 1% | -19% | 7% | -0% | -5% | |
| off / environment * (dB) | 22.9 | 23 -0% | 25 -9% | 24.8 -8% | 25.3 -10% | 24 -5% |
| Idle Minimum * (dB) | 23.4 | 23 2% | 34 -45% | 24.6 -5% | 25.4 -9% | 24 -3% |
| Idle Average * (dB) | 23.4 | 23 2% | 35 -50% | 24.9 -6% | 25.4 -9% | 25 -7% |
| Idle Maximum * (dB) | 27.4 | 30.11 -10% | 36 -31% | 24.9 9% | 25.4 7% | 35 -28% |
| Load Average * (dB) | 36 | 41.86 -16% | 48 -33% | 27.1 25% | 42.5 -18% | 44 -22% |
| Witcher 3 ultra * (dB) | 58.2 | 47.79 18% | 46 21% | 46.4 20% | 42 28% | 48 18% |
| Load Maximum * (dB) | 58 | 53 9% | 49 16% | 49 16% | 52.2 10% | 50 14% |
* ... smaller is better
Temperature
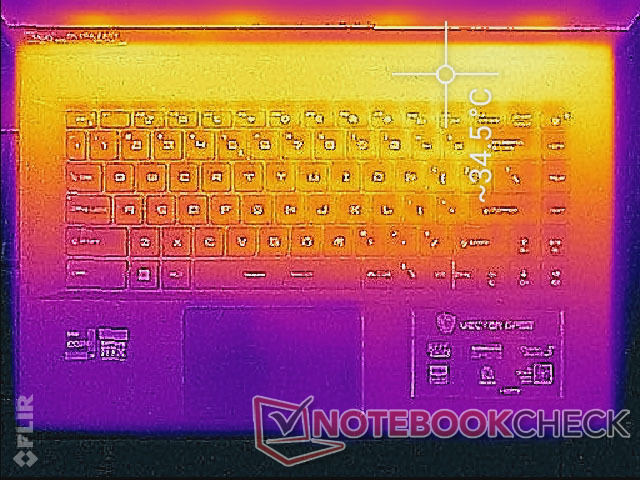
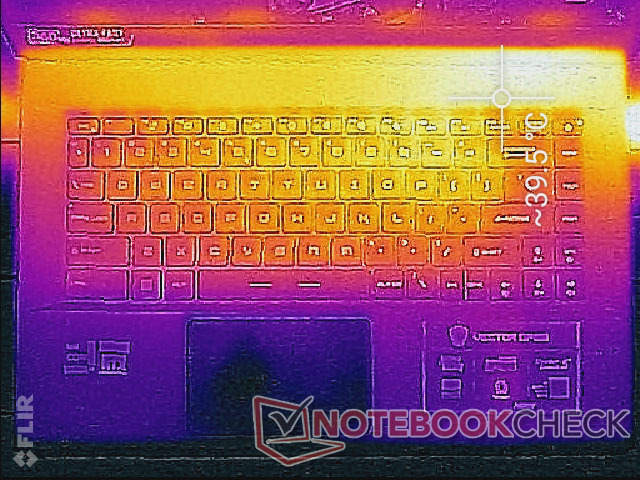
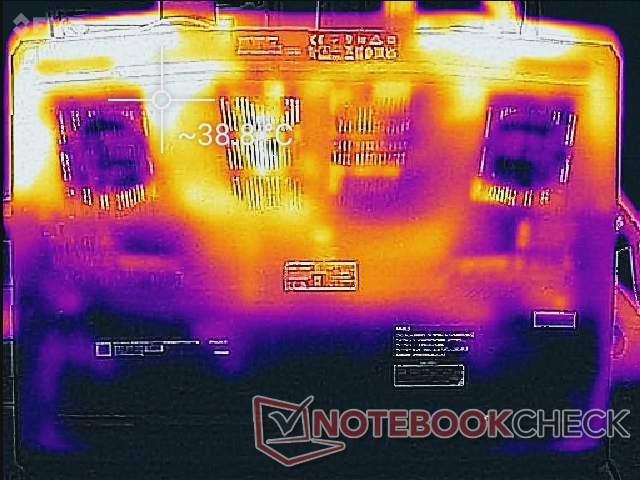
Surface temperatures are highly dependent on the MSI Center power profile setting. When on Balanced mode, hot spots can be as warm as 49 C compared to only 42 C if on the Extreme Performance setting since a higher fan RPM ceiling is tied to Extreme Performance mode.
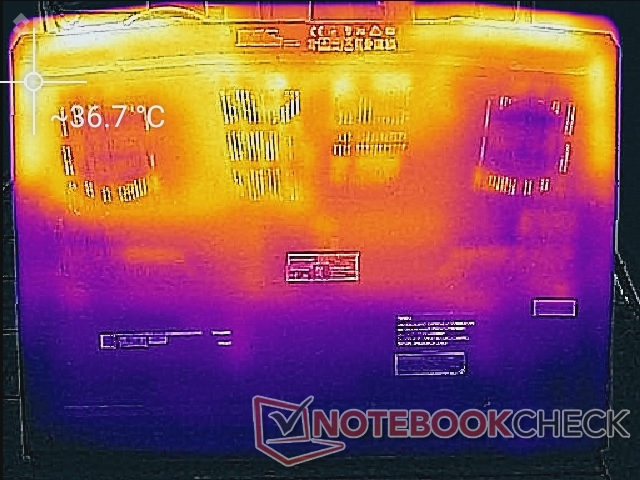
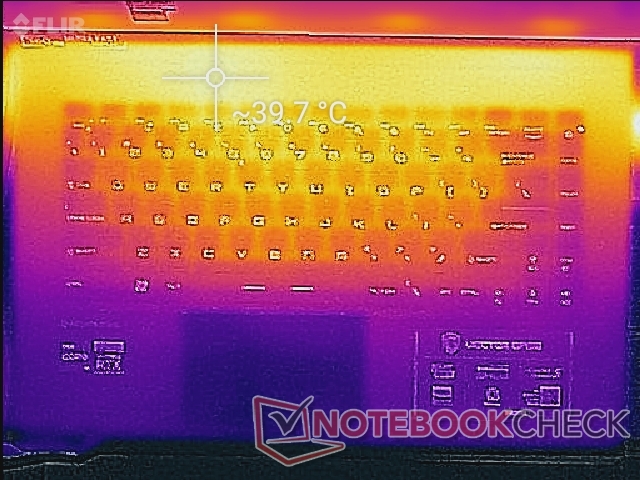
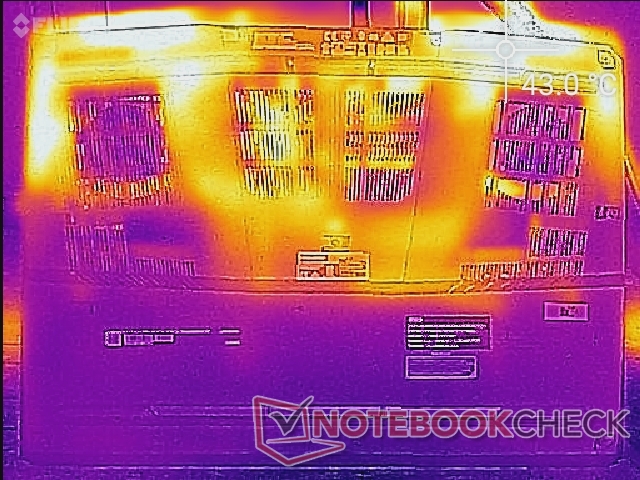
Hot spots are concentrated along the rear quadrants of the chassis as shown by our temperature maps below. The keyboard keys and palm rests can be warm but never bothersome or uncomfortable. The thinner GS66 or Razer Blade 15 have warmer palm rests and keyboards in comparison by more than a few degrees each on average.
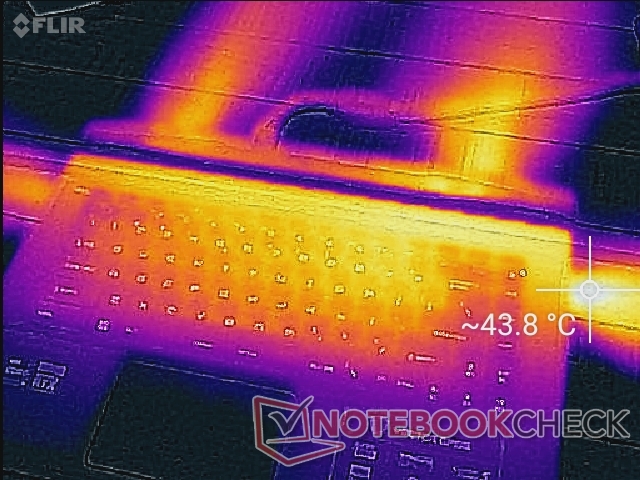
(±) The maximum temperature on the upper side is 40.2 °C / 104 F, compared to the average of 40.4 °C / 105 F, ranging from 21.2 to 68.8 °C for the class Gaming.
(±) The bottom heats up to a maximum of 43.8 °C / 111 F, compared to the average of 43.3 °C / 110 F
(+) In idle usage, the average temperature for the upper side is 29.6 °C / 85 F, compared to the device average of 33.9 °C / 93 F.
(+) Playing The Witcher 3, the average temperature for the upper side is 30.7 °C / 87 F, compared to the device average of 33.9 °C / 93 F.
(+) The palmrests and touchpad are cooler than skin temperature with a maximum of 24.8 °C / 76.6 F and are therefore cool to the touch.
(+) The average temperature of the palmrest area of similar devices was 28.8 °C / 83.8 F (+4 °C / 7.2 F).
| MSI Vector GP66 12UGS Intel Core i9-12900H, NVIDIA GeForce RTX 3070 Ti Laptop GPU | MSI GP66 Leopard 11UH-028 Intel Core i7-11800H, NVIDIA GeForce RTX 3080 Laptop GPU | MSI Katana GF66 11UG-220 Intel Core i7-11800H, NVIDIA GeForce RTX 3070 Laptop GPU | Asus TUF Gaming F15 FX506HM Intel Core i7-11800H, NVIDIA GeForce RTX 3060 Laptop GPU | Razer Blade 15 Base Edition 2021, i7-10750H RTX 3060 Intel Core i7-10750H, NVIDIA GeForce RTX 3060 Laptop GPU | Alienware m15 R5 Ryzen Edition AMD Ryzen 7 5800H, NVIDIA GeForce RTX 3060 Laptop GPU | |
|---|---|---|---|---|---|---|
| Heat | -2% | -8% | 8% | -6% | -21% | |
| Maximum Upper Side * (°C) | 40.2 | 49 -22% | 56 -39% | 46.4 -15% | 45.2 -12% | 62 -54% |
| Maximum Bottom * (°C) | 43.8 | 47 -7% | 49 -12% | 45.4 -4% | 48 -10% | 61 -39% |
| Idle Upper Side * (°C) | 34.8 | 31 11% | 36 -3% | 26 25% | 34.4 1% | 36 -3% |
| Idle Bottom * (°C) | 37 | 33 11% | 28 24% | 27.4 26% | 37.2 -1% | 33 11% |
* ... smaller is better
Stress Test
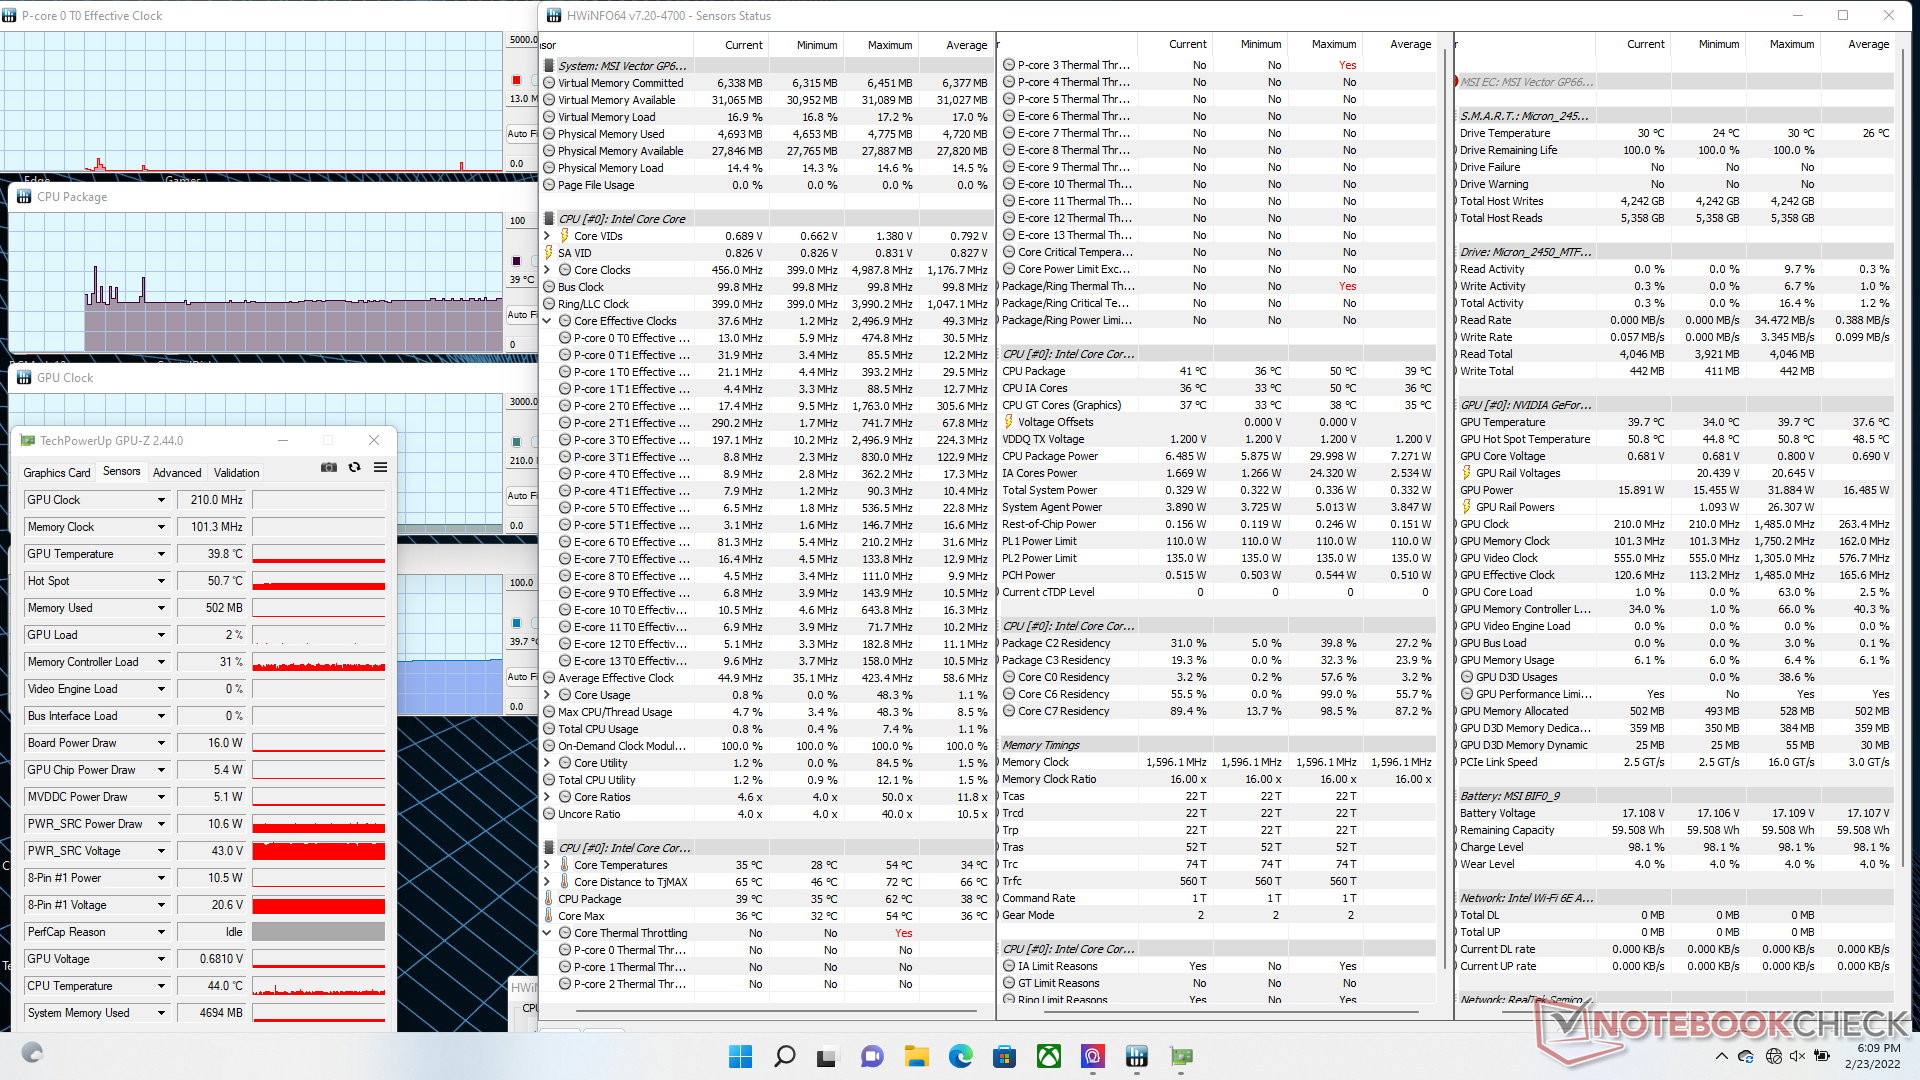
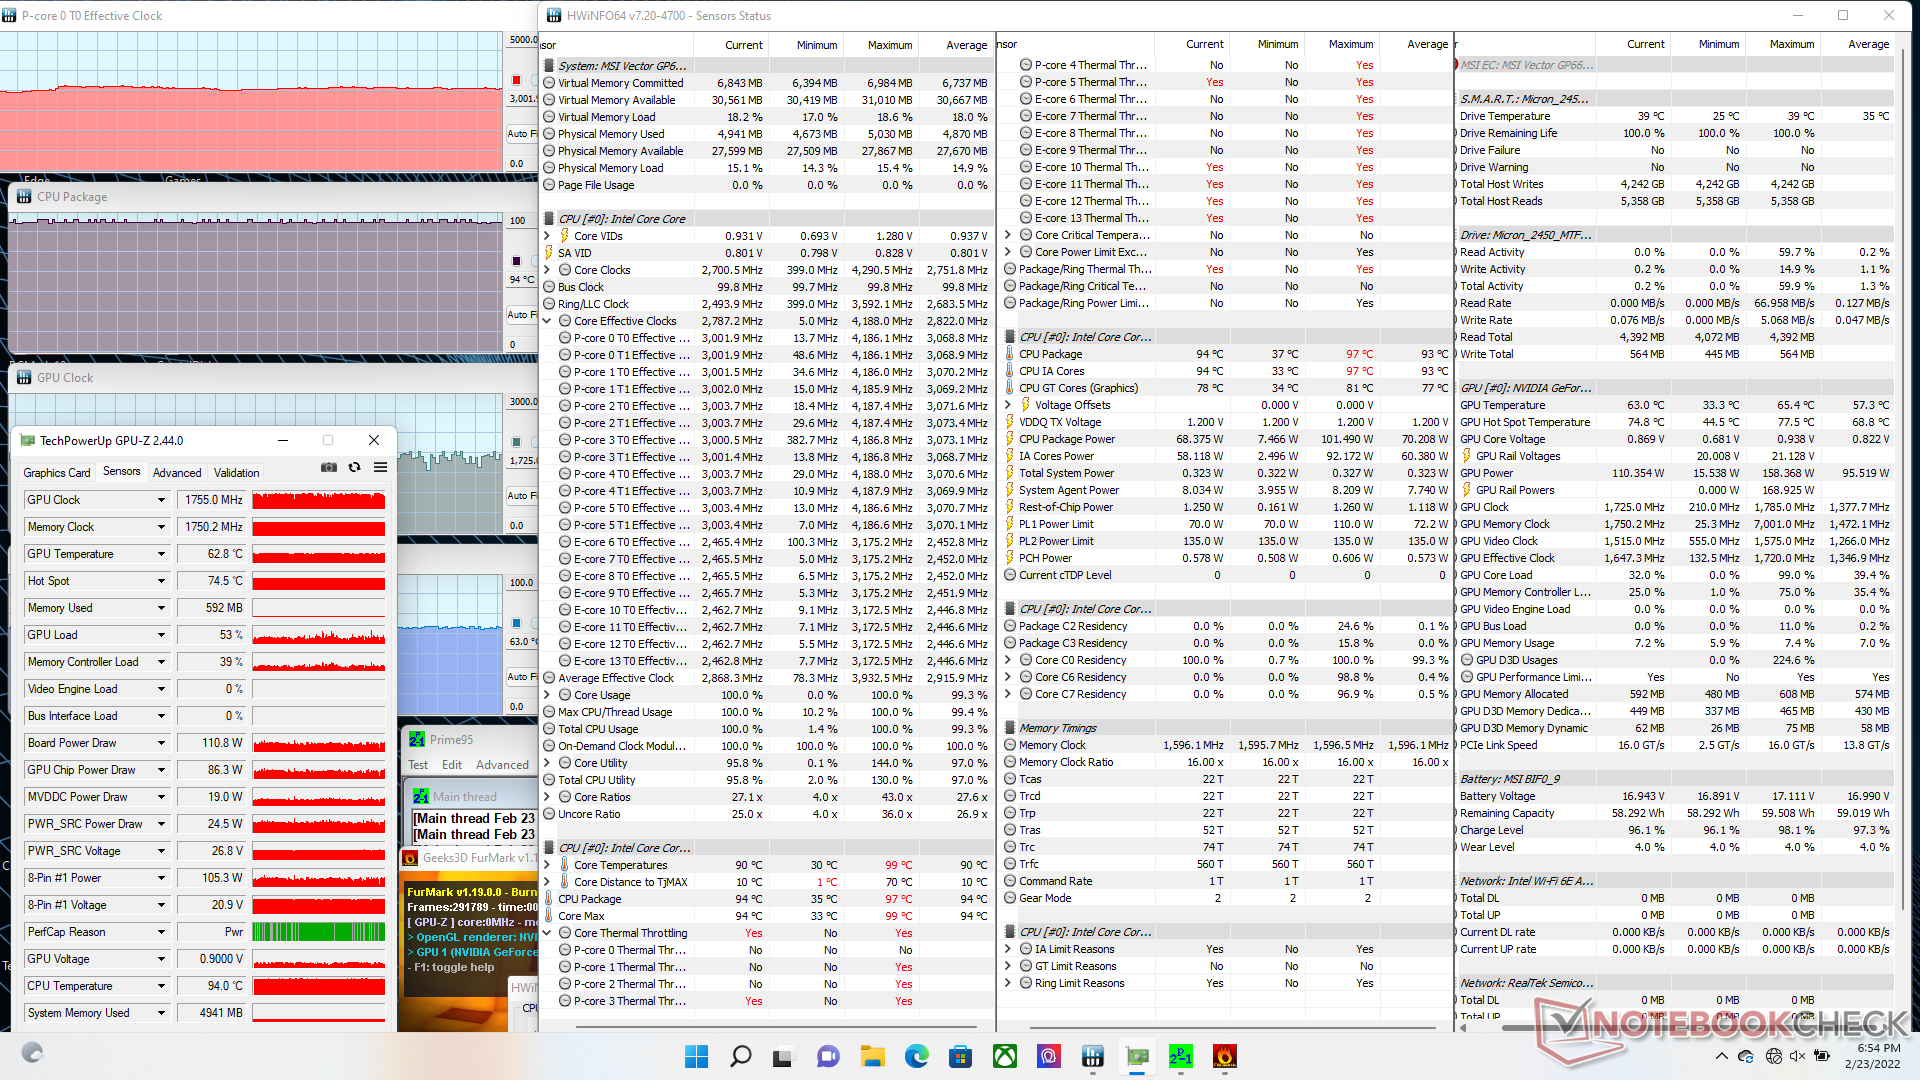
When stressed with Prime95 on the Extreme Performance profile, CPU clock rates would boost to 4.2 GHz for just a second or two before quickly dropping to 3.7 GHz. After another minute or so, clock rates would drop even further to just 3 GHz in order to maintain a core temperature of 90 C. CPU package power would initially spike to 100 W when starting Prime95 before falling and stabilizing at 70 W. The same Core i9-12900H CPU in the larger Uniwill Technology GM7AG8P would run both faster (3.2 GHz vs. 3.0 GHz) and cooler (80 C vs 90 C), respectively, and at a higher stable TDP (75 W vs. 70 W) than what we recorded on our Vector GP66.
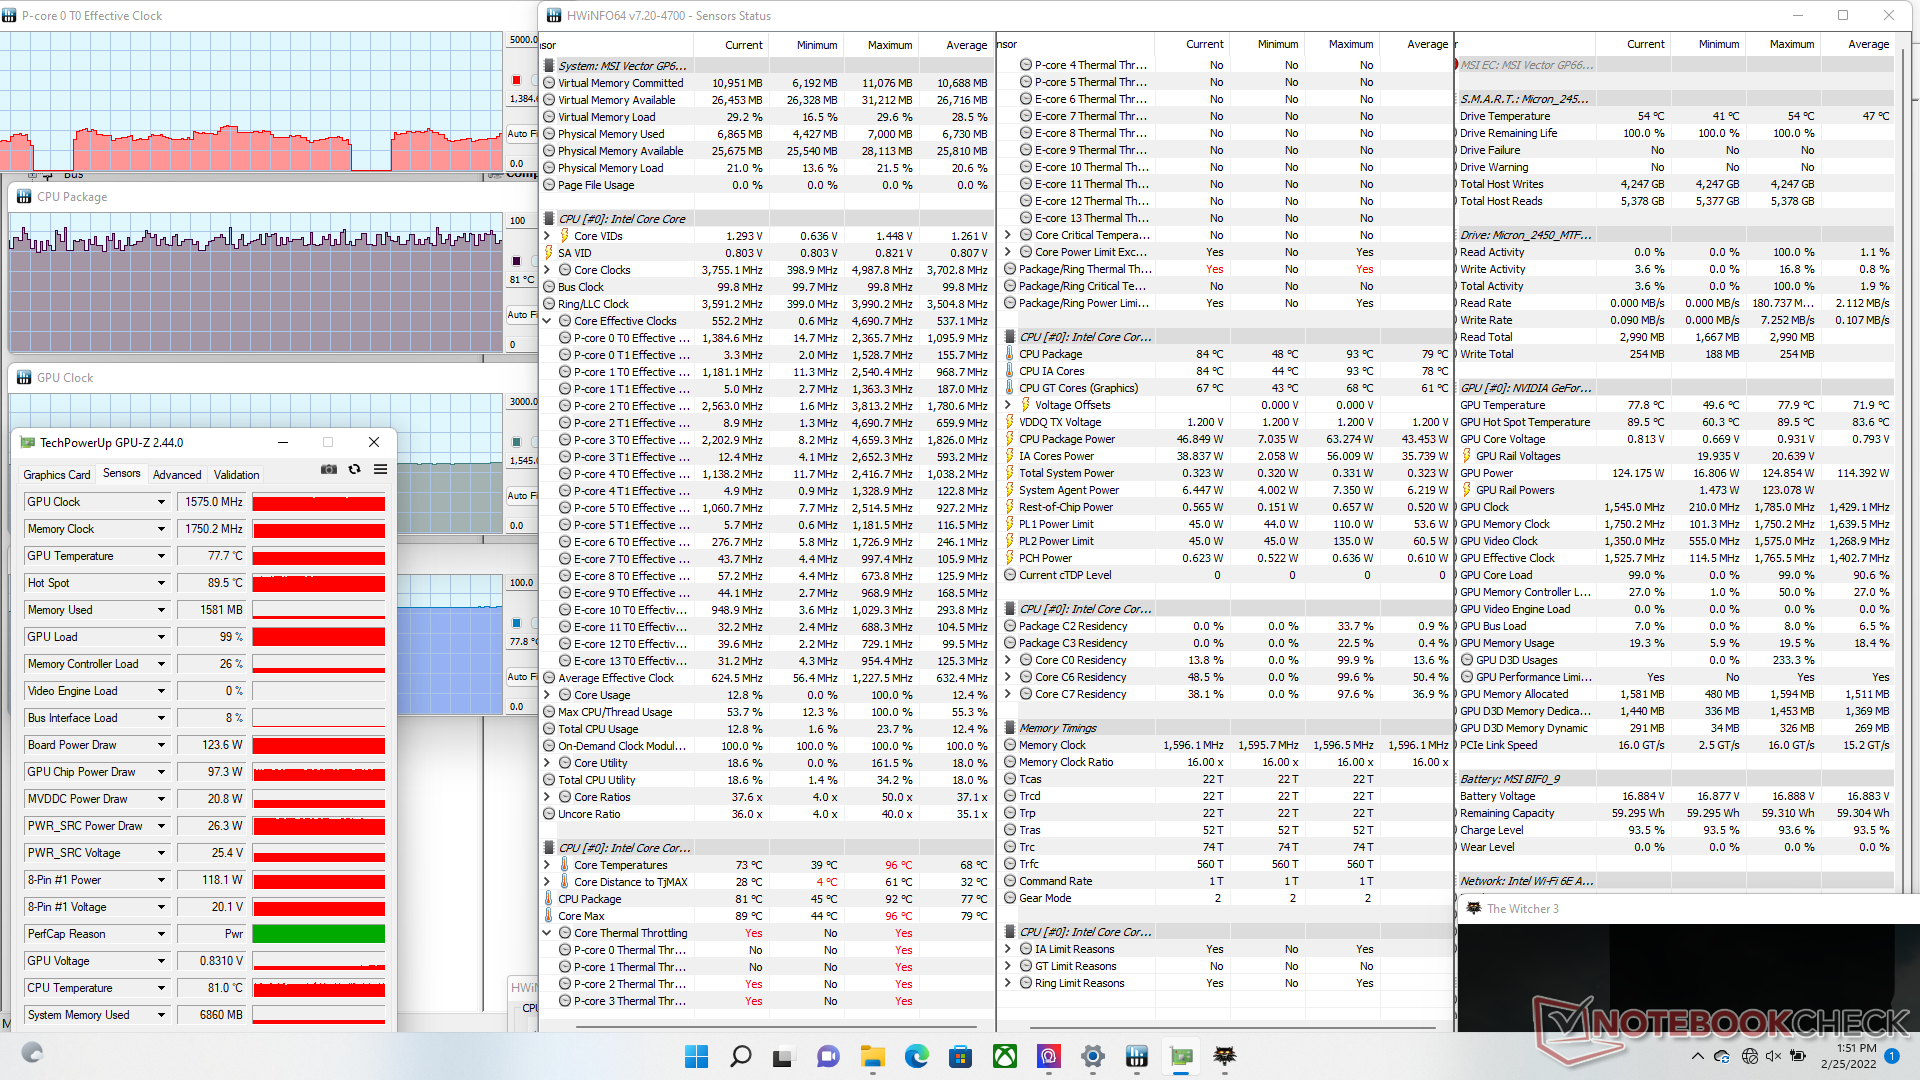
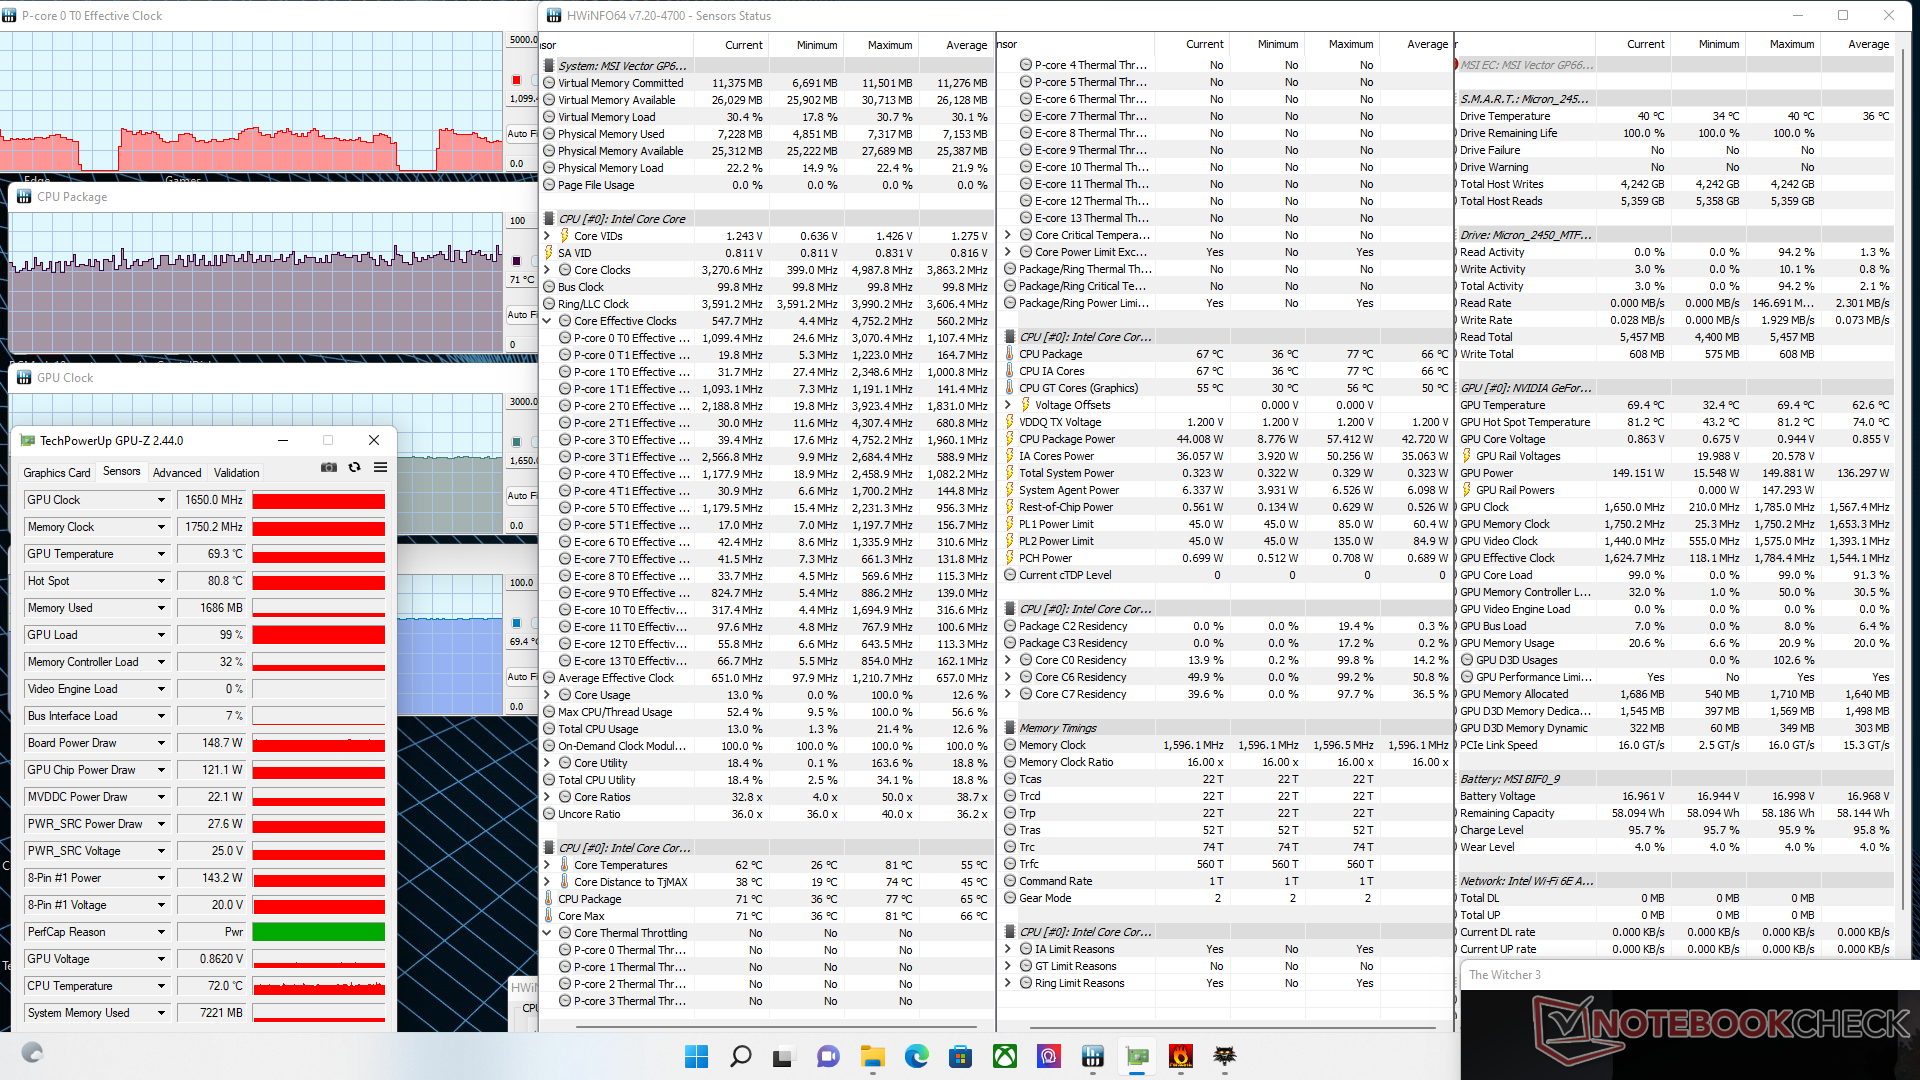
CPU and GPU temperatures would stabilize at 71 C and 70 C, respectively, when running Witcher 3 on the Extreme Performance profile. Dropping down to the Balanced profile would result in higher CPU and GPU temperatures of 85 C and 78 C, respectively, and a slightly slower GPU clock rate (1650 MHz vs. 1755 MHz) as well. Clock rates are nonetheless significantly faster than what we observed on the MSI GS66 (1155 MHz) which comes with same GeForce RTX 3070 Ti GPU albeit at a lower TGP (105 W vs 150 W).
Running on battery power will limit performance significantly. A Fire Strike test on batteries would return Physics and Graphics of 10913 points and 6061 points, respectively, compared to 30698 and 29729 points when on mains.

| CPU Clock (GHz) | GPU Clock (MHz) | Average CPU Temperature (°C) | Average GPU Temperature (°C) | |
| System Idle (Balanced mode) | -- | -- | 39 | 40 |
| Prime95 Stress (Extreme Performance mode) | 3.0 | -- | 90 | 33 |
| Prime95 + FurMark Stress (Extreme Performance mode) | 3.0 | 1755 | 94 | 63 |
| Witcher 3 Stress (Extreme Performance mode) | ~1.0 | 1650 | 71 | 70 |
| Witcher 3 Stress (Balanced mode) | ~1.0 | 1515 | 85 | 78 |
Speakers
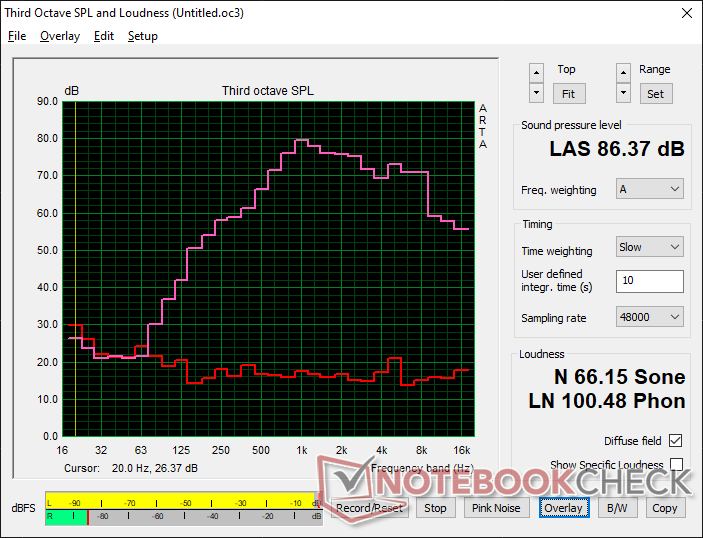
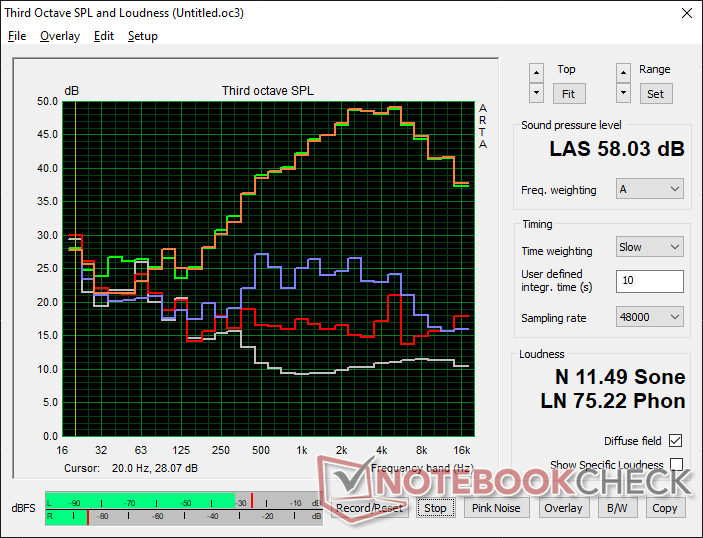
MSI Vector GP66 12UGS audio analysis
(+) | speakers can play relatively loud (86.4 dB)
Bass 100 - 315 Hz
(-) | nearly no bass - on average 19.2% lower than median
(±) | linearity of bass is average (9.1% delta to prev. frequency)
Mids 400 - 2000 Hz
(±) | higher mids - on average 6.5% higher than median
(+) | mids are linear (5.8% delta to prev. frequency)
Highs 2 - 16 kHz
(+) | balanced highs - only 3.7% away from median
(+) | highs are linear (6.5% delta to prev. frequency)
Overall 100 - 16.000 Hz
(±) | linearity of overall sound is average (18.1% difference to median)
Compared to same class
» 56% of all tested devices in this class were better, 8% similar, 36% worse
» The best had a delta of 6%, average was 18%, worst was 132%
Compared to all devices tested
» 38% of all tested devices were better, 8% similar, 54% worse
» The best had a delta of 4%, average was 24%, worst was 134%
Apple MacBook Pro 16 2021 M1 Pro audio analysis
(+) | speakers can play relatively loud (84.7 dB)
Bass 100 - 315 Hz
(+) | good bass - only 3.8% away from median
(+) | bass is linear (5.2% delta to prev. frequency)
Mids 400 - 2000 Hz
(+) | balanced mids - only 1.3% away from median
(+) | mids are linear (2.1% delta to prev. frequency)
Highs 2 - 16 kHz
(+) | balanced highs - only 1.9% away from median
(+) | highs are linear (2.7% delta to prev. frequency)
Overall 100 - 16.000 Hz
(+) | overall sound is linear (4.6% difference to median)
Compared to same class
» 0% of all tested devices in this class were better, 0% similar, 100% worse
» The best had a delta of 5%, average was 17%, worst was 45%
Compared to all devices tested
» 0% of all tested devices were better, 0% similar, 100% worse
» The best had a delta of 4%, average was 24%, worst was 134%
Energy Management
Power Consumption

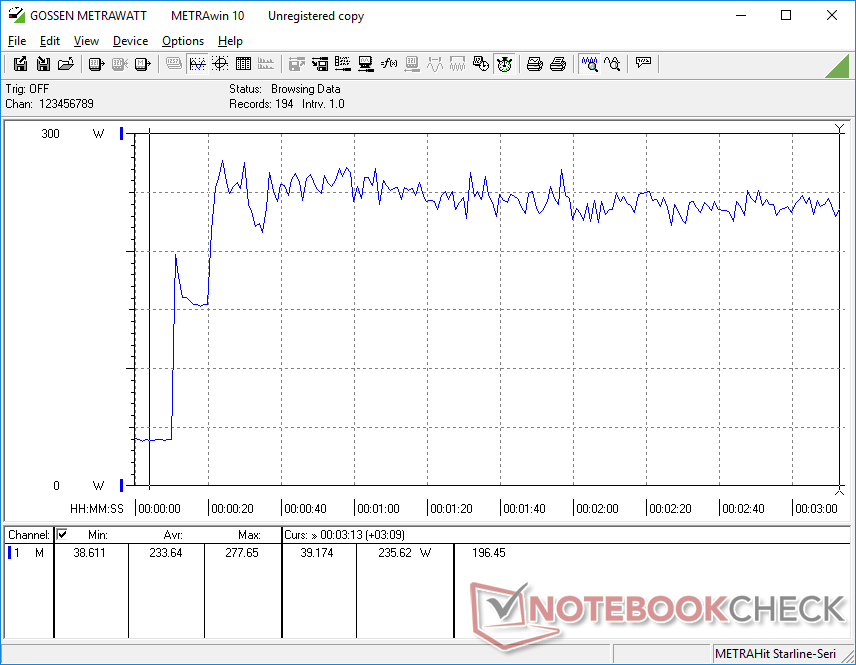
Expect higher power consumption overall on the Vector GP66 when compared to last year's GP66 Leopard due to its higher native display refresh rate (360 Hz vs. 144 Hz), higher CPU PL targets (70 W vs. 45 W), and higher TGP (150 W vs. 140 W). Running games will draw about 20 W more from the outlet to be more demanding than many other 17-inch gaming laptops equipped with GeForce RTX 3080 graphics. Though users are getting higher performance year-over-year especially in terms of the CPU, performance-per-watt may not be all that much better.
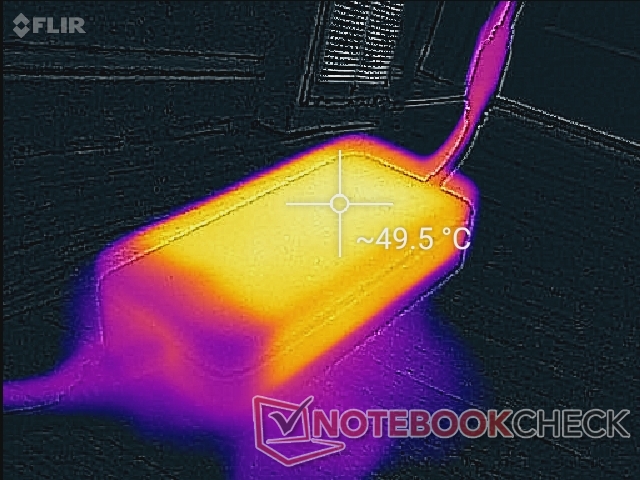
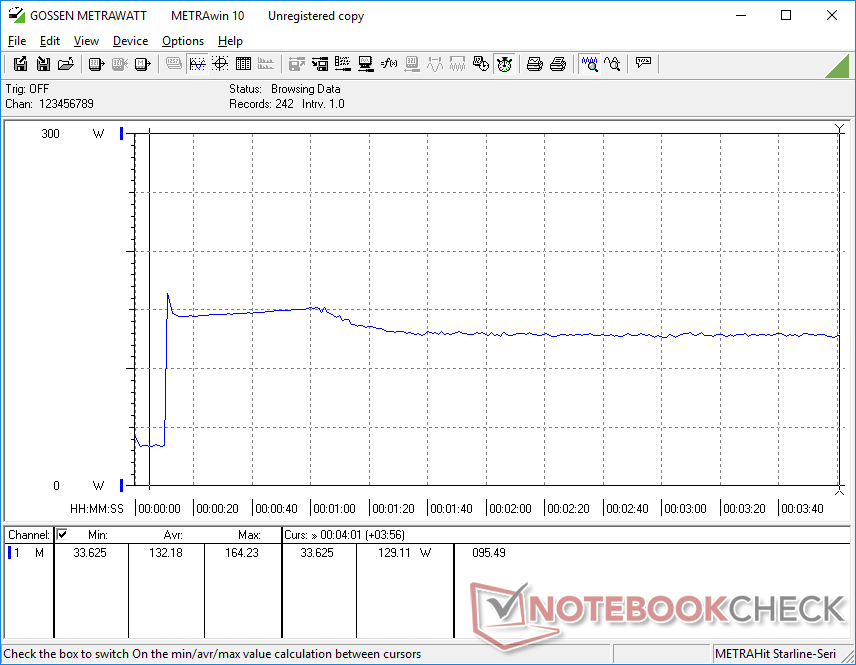
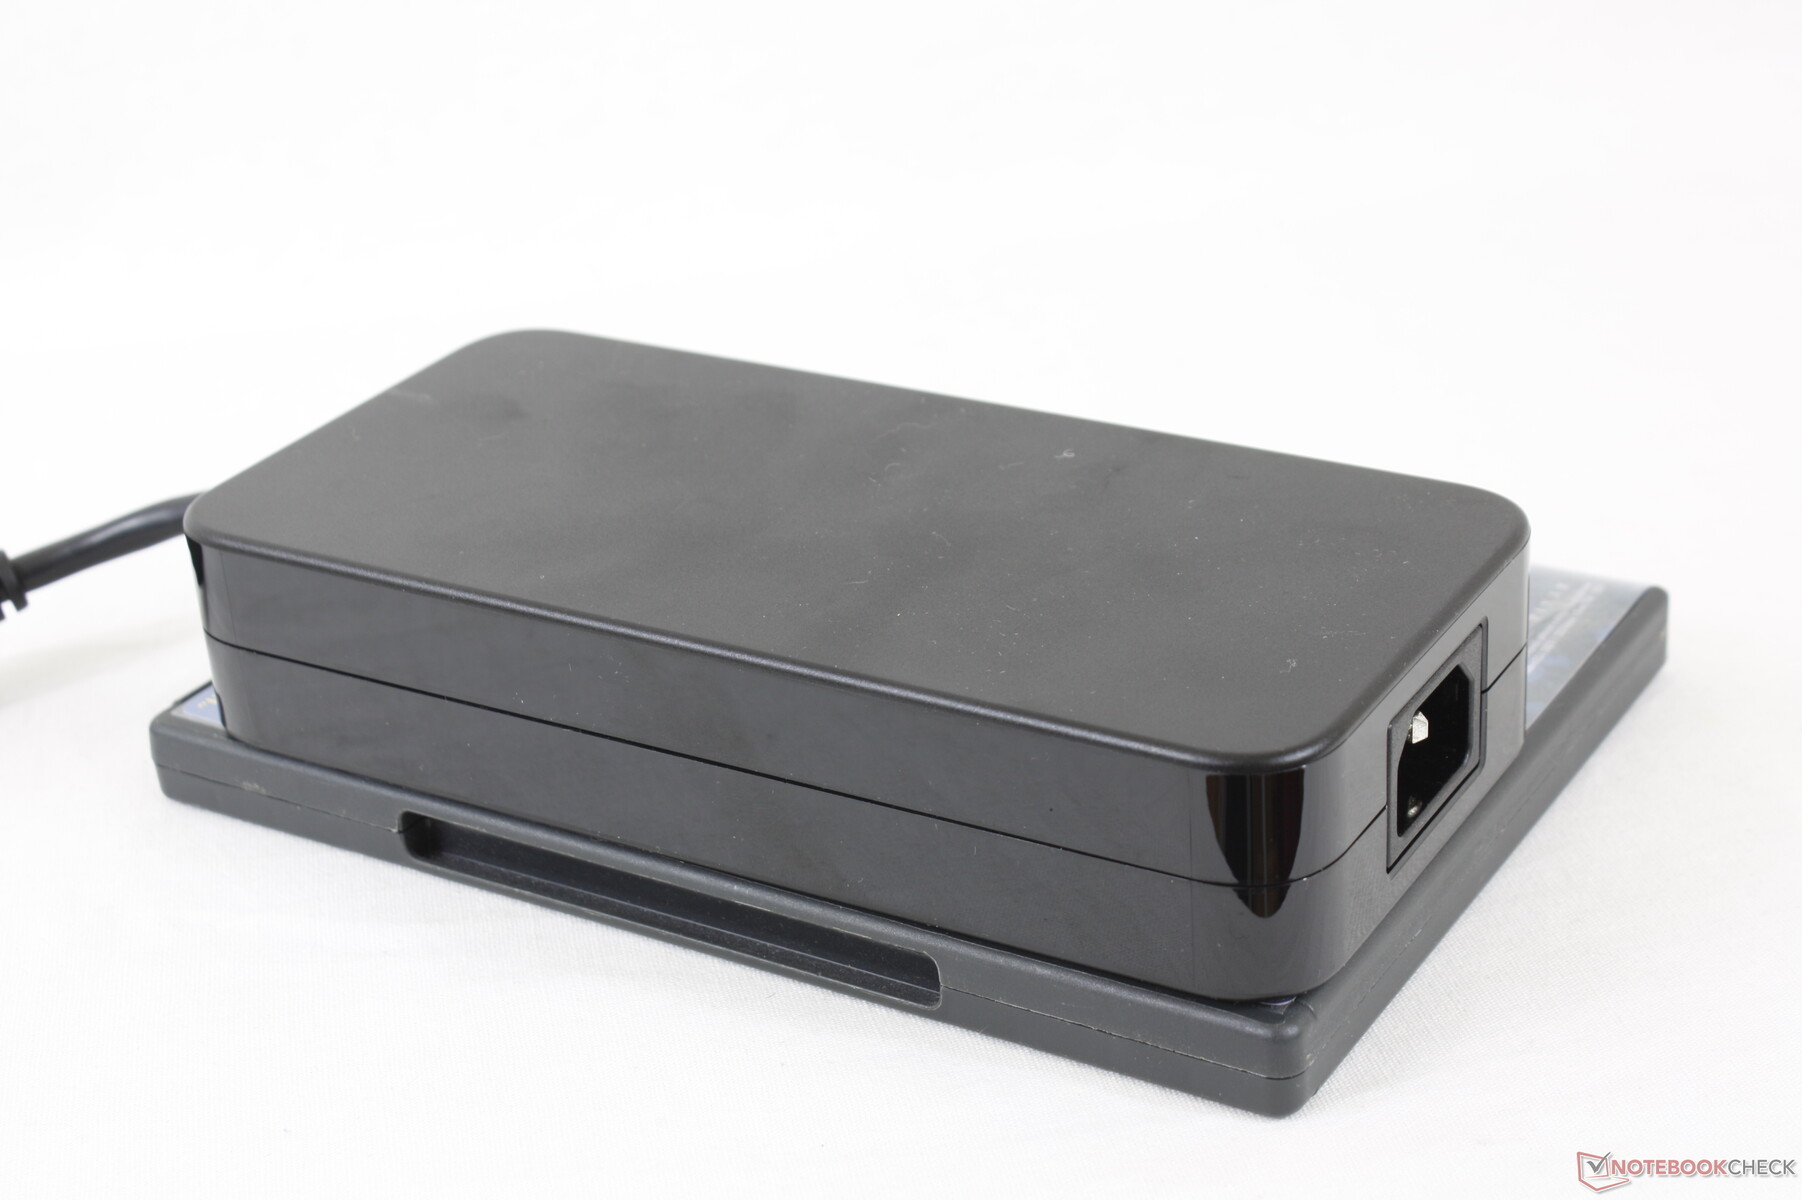
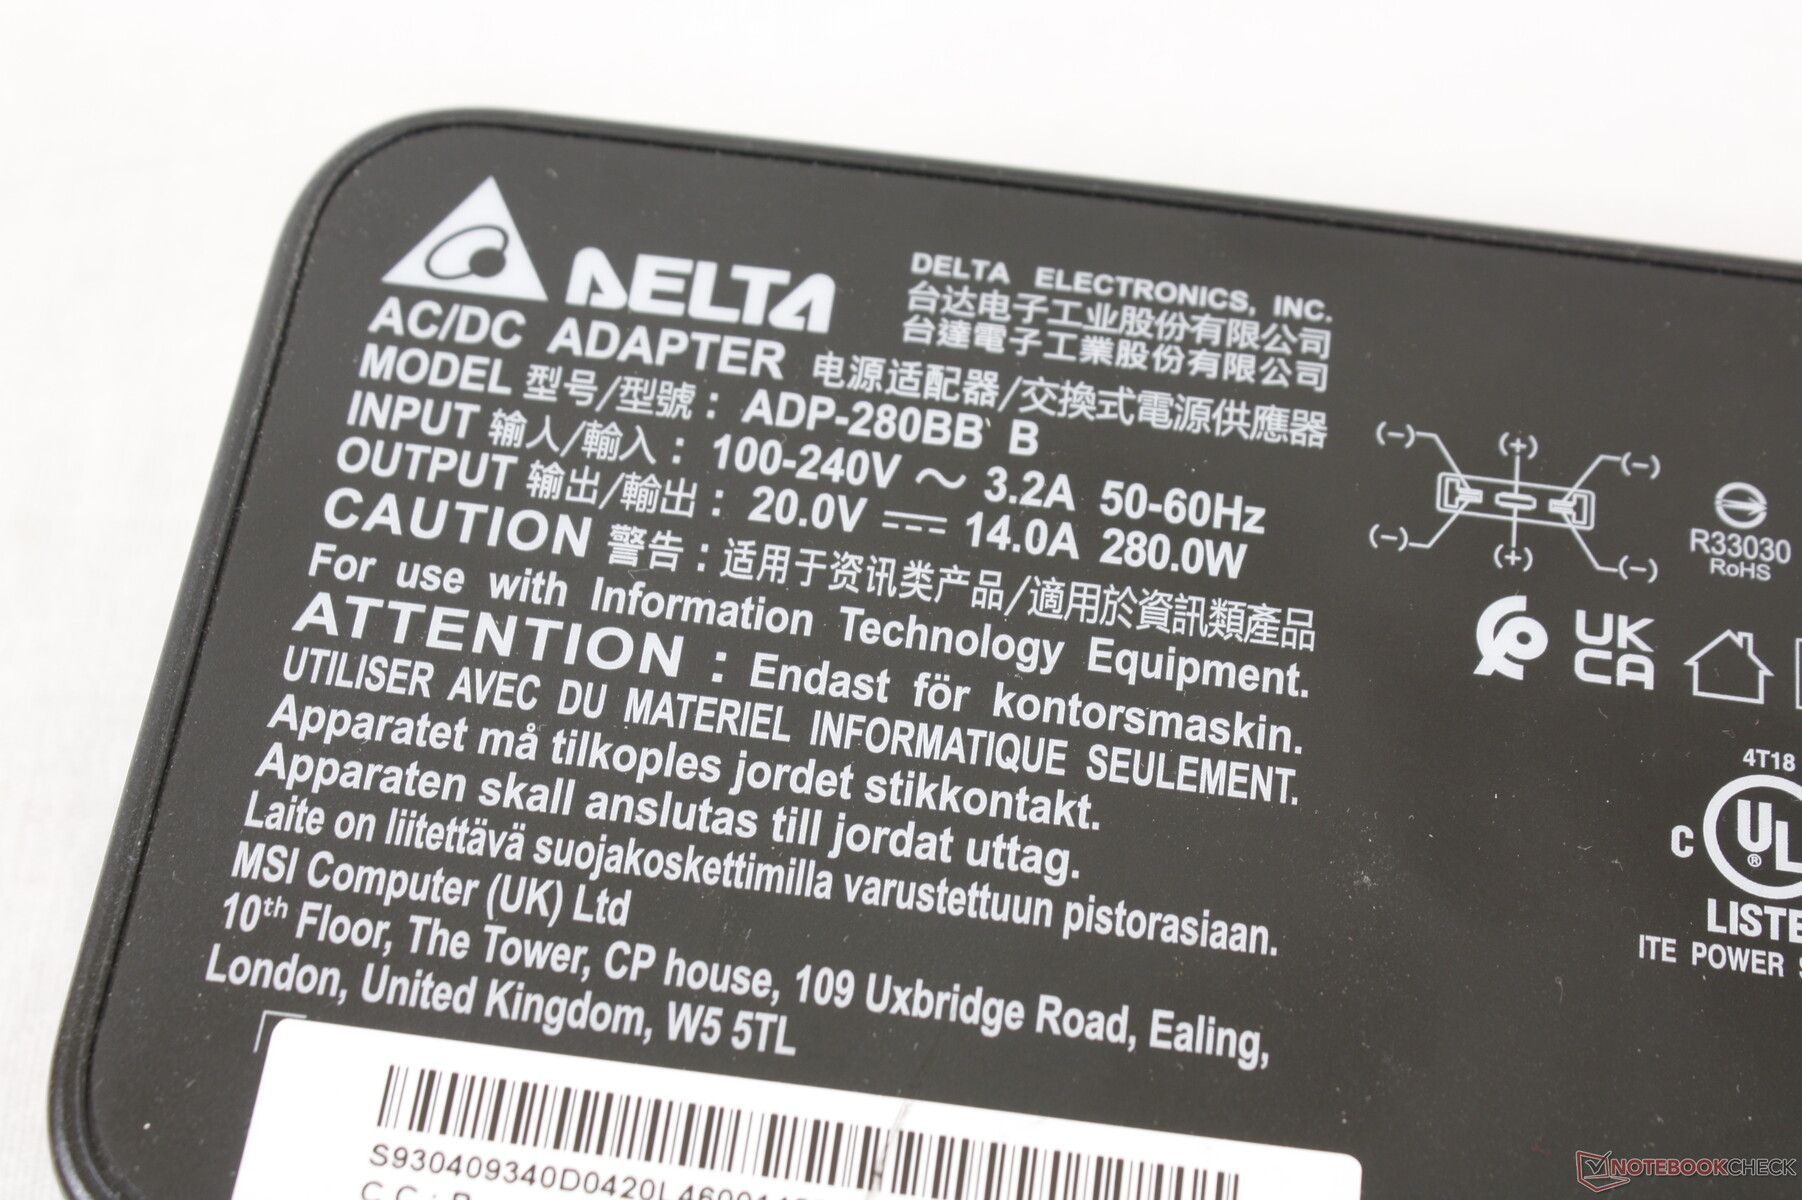
We're able to record a temporary maximum draw of 278 W from the large 280 W (~18 x 8.5 x 3.5 cm) AC adapter when running both Prime95 and FurMark simultaneously. The battery will still recharge at a decent rate when gaming.
| Off / Standby | |
| Idle | |
| Load |
|
Key:
min: | |
| MSI Vector GP66 12UGS i9-12900H, GeForce RTX 3070 Ti Laptop GPU, , IPS, 1920x1080, 15.6" | MSI GP66 Leopard 11UH-028 i7-11800H, GeForce RTX 3080 Laptop GPU, Samsung PM9A1 MZVL21T0HCLR, IPS, 1920x1080, 15.6" | MSI Katana GF66 11UG-220 i7-11800H, GeForce RTX 3070 Laptop GPU, Kingston OM8PDP3512B-AI1, IPS, 1920x1080, 15.6" | Asus TUF Gaming F15 FX506HM i7-11800H, GeForce RTX 3060 Laptop GPU, SK Hynix HFM001TD3JX013N, IPS, 1920x1080, 15.6" | Razer Blade 15 Base Edition 2021, i7-10750H RTX 3060 i7-10750H, GeForce RTX 3060 Laptop GPU, Samsung SSD PM981a MZVLB512HBJQ, IPS, 1920x1080, 15.6" | Alienware m15 R5 Ryzen Edition R7 5800H, GeForce RTX 3060 Laptop GPU, Toshiba KBG40ZNS512G NVMe, IPS, 1920x1080, 15.6" | |
|---|---|---|---|---|---|---|
| Power Consumption | 24% | 38% | 36% | 28% | 23% | |
| Idle Minimum * (Watt) | 17.5 | 13 26% | 8 54% | 9.5 46% | 11.7 33% | 11 37% |
| Idle Average * (Watt) | 20.1 | 17 15% | 12 40% | 12.1 40% | 16 20% | 14 30% |
| Idle Maximum * (Watt) | 47.3 | 18 62% | 22 53% | 22.5 52% | 29.3 38% | 25 47% |
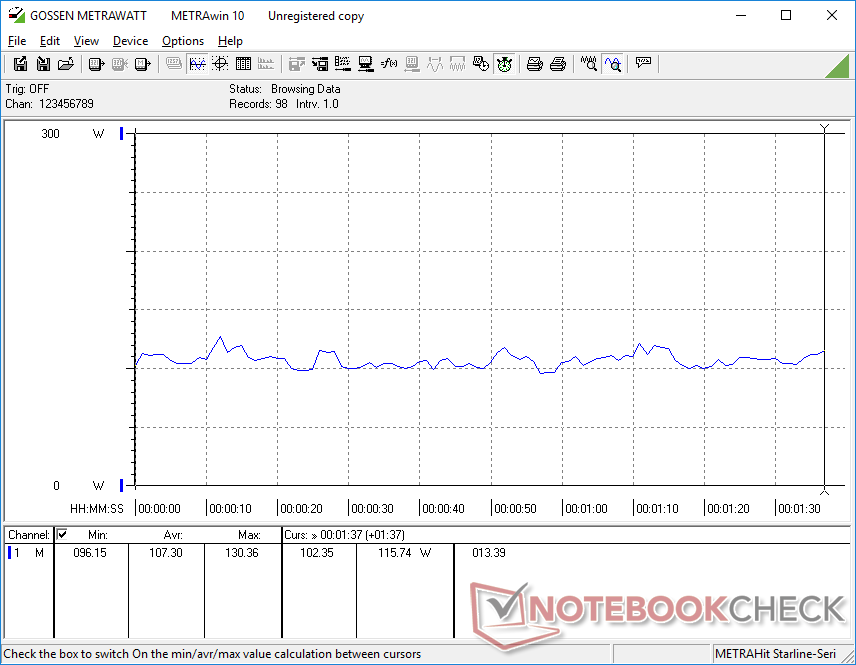
| Load Average * (Watt) | 107.3 | 96 11% | 98 9% | 99.5 7% | 95.6 11% | 123 -15% |
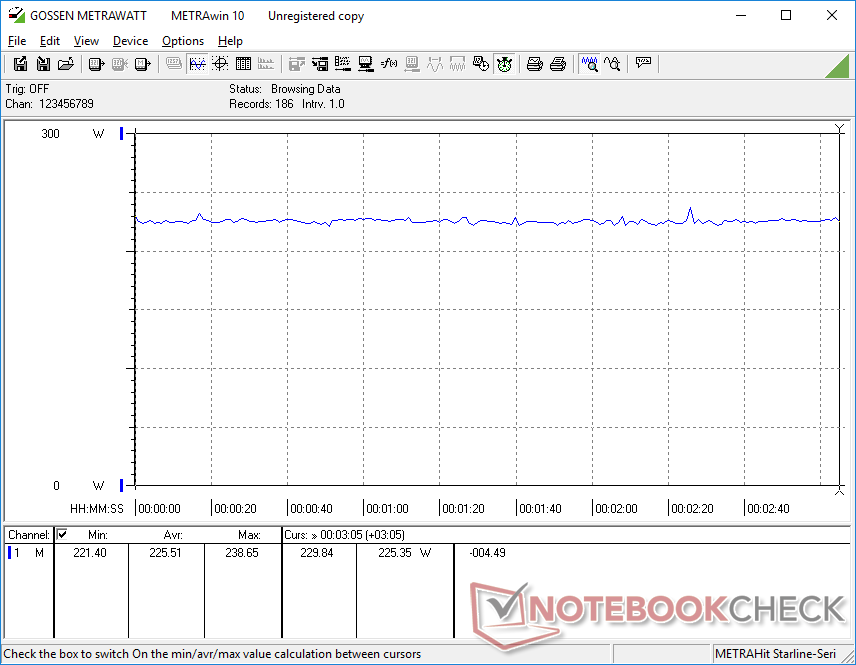
| Witcher 3 ultra * (Watt) | 225 | 207 8% | 152 32% | 157 30% | 141.3 37% | 176 22% |
| Load Maximum * (Watt) | 277.7 | 223 20% | 162 42% | 173.5 38% | 197 29% | 226 19% |
* ... smaller is better
Power Consumption Witcher 3 / Stresstest
Power Consumption external Monitor
Battery Life
Battery capacity is the same between the GP66 Vector and last year's GP66 Leopard at 65 Wh. Nonetheless, we're able to record longer WLAN runtimes on the newer model by just over two additional hours. We recommend running the system on MSHybrid mode to extend battery life if dGPU mode is not a priority.
Charging from empty to full capacity with the included AC adapter takes about 2.5 hours compared to 2 hours or faster on most other laptops. Charging with USB-C adapters is not supported unlike on many alternatives from Asus or Razer.
| MSI Vector GP66 12UGS i9-12900H, GeForce RTX 3070 Ti Laptop GPU, 65 Wh | MSI GP66 Leopard 11UH-028 i7-11800H, GeForce RTX 3080 Laptop GPU, 65 Wh | MSI Katana GF66 11UG-220 i7-11800H, GeForce RTX 3070 Laptop GPU, 90 Wh | Asus TUF Gaming F15 FX506HM i7-11800H, GeForce RTX 3060 Laptop GPU, 90 Wh | Razer Blade 15 Base Edition 2021, i7-10750H RTX 3060 i7-10750H, GeForce RTX 3060 Laptop GPU, 65 Wh | Alienware m15 R5 Ryzen Edition R7 5800H, GeForce RTX 3060 Laptop GPU, 86 Wh | |
|---|---|---|---|---|---|---|
| Battery runtime | -9% | 9% | 59% | 11% | 22% | |
| Reader / Idle (h) | 7.9 | 9.1 15% | 11 39% | 7.8 -1% | 14.7 86% | |
| WiFi v1.3 (h) | 5.7 | 3.6 -37% | 5.3 -7% | 7.9 39% | 4.8 -16% | 5.1 -11% |
| Load (h) | 1 | 1.2 20% | 1.2 20% | 2 100% | 1.5 50% | 0.9 -10% |
| H.264 (h) | 3.5 | 8.8 | ||||
| Witcher 3 ultra (h) | 0.8 | 1.6 |
Pros
Cons
Verdict

The improved thermals of the GP66 over the GP65 have allowed it to support more powerful 150 W TGP graphics compared to only ~100 W on the Razer Blade 15 or MSI GS66 series. In other words, you're getting one of the best versions of the mobile GeForce RTX 3070 Ti on any 15.6-inch laptop at the moment due to the higher TGP ceiling of the GP66. The GS66 may be thinner and more portable, but its GeForce RTX 3070 Ti is also noticeably slower as a direct consequence. For a more balanced experience, the GP66 would be the better option.
Extreme Performance mode is necessary if you want to squeeze out as much performance from the GPU as possible. This mode is also the loudest in terms of fan noise meaning the louder-than-average fans are unavoidable if maximum performance is desired. Gaming on Balanced mode instead would limit fan noise significantly for only a small ~5 percent dip in graphics performance. We find this mode to be ideal for players who don't like using headphones or are otherwise bothered by extra-loud gaming laptops.
The Vector GP66 balances portability and performance better than most other ultra-thin gaming laptops with its higher-power 150 W GPU options.
For future revisions, we would love to see improvements to both the spongy clickpad and performance sustainability of the PCIe4 x4 SSD. The clickpad is a downgrade from the older GP65 while the lack of an internal SSD heat spreader means transfer rates on most PCIe4 x4 SSDs will throttle after a short period of intensive use.
Price and Availability
Our exact configuration as reviewed is currently available on Best Buy for $2400 USD.
MSI Vector GP66 12UGS
- 03/03/2022 v7 (old)
Allen Ngo
Price comparison
