

MSI Katana GF66 11UG review: A gaming laptop with wasted potential

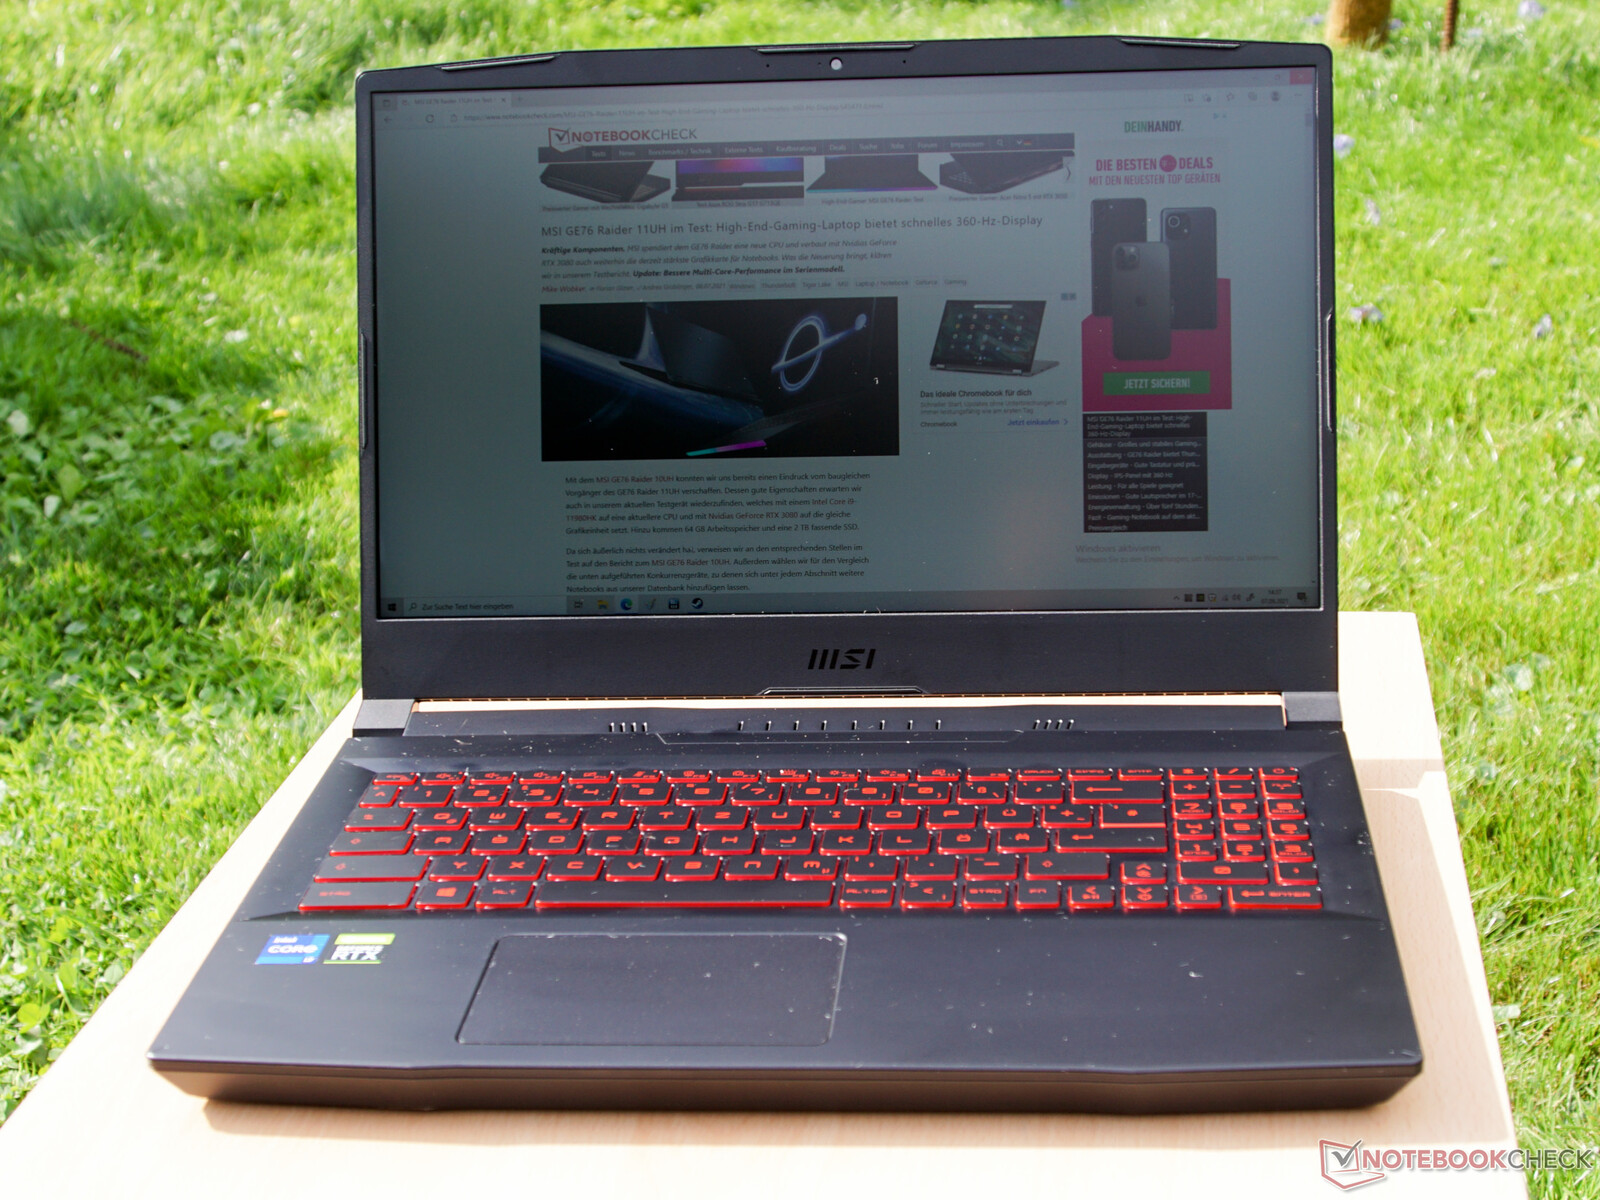
The MSI Katana GF66 11UG-220 is one of a whole series of new gaming laptops with Intel processors of the 11th generation and RTX 3000 series graphics cards that MSI has introduced only in May of 2021. The exterior of the simple, yet elegant laptop was designed by the illustrator Nagano Tsuyoshi, an artist who is also known in Japan for his Star Wars covers.
According to MSI, the Katana laptop was created with the same high craftsmanship that is also necessary for creating the famous Japanese swords. At least, the test configuration with an Intel Core i7-11800H, 16 GB of RAM, an Nvidia GeForce RTX 3070, and 512 GB NVMe SSD promises a high performance. As the operating system, only FreeDOS is preinstalled. For our test, we installed Windows 10 Home on the system. The competitors for this test include the Asus TUF Dash F15, the Lenovo Legion 5 Pro 16, the Gigabyte Aero 15 OLED, the Razer Blade 15, and the Schenker XMG Neo 15.
Possible Competitors in Comparison
Rating | Date | Model | Weight | Height | Size | Resolution | Price |
|---|---|---|---|---|---|---|---|
| 79.2 % v7 (old) | 09 / 2021 | MSI Katana GF66 11UG-220 i7-11800H, GeForce RTX 3070 Laptop GPU | 2.3 kg | 25 mm | 15.60" | 1920x1080 | |
| 87.4 % v7 (old) | 08 / 2021 | Lenovo Legion 5 Pro 16ACH6H (82JQ001PGE) R7 5800H, GeForce RTX 3070 Laptop GPU | 2.6 kg | 26.85 mm | 16.00" | 2560x1600 | |
| 85.6 % v7 (old) | 08 / 2021 | Gigabyte Aero 15 OLED XD i7-11800H, GeForce RTX 3070 Laptop GPU | 2.2 kg | 20 mm | 15.60" | 3840x2160 | |
| 82.4 % v7 (old) | 02 / 2021 | Asus TUF Dash F15 FX516PR i7-11370H, GeForce RTX 3070 Laptop GPU | 2 kg | 20 mm | 15.60" | 1920x1080 | |
| 88.9 % v7 (old) | 07 / 2021 | Razer Blade 15 Advanced (Mid 2021) i7-11800H, GeForce RTX 3080 Laptop GPU | 2 kg | 16.99 mm | 15.60" | 1920x1080 | |
| 87 % v7 (old) | 06 / 2021 | SCHENKER XMG Neo 15 Tiger Lake i7-11800H, GeForce RTX 3080 Laptop GPU | 2.2 kg | 26 mm | 15.60" | 2560x1440 |
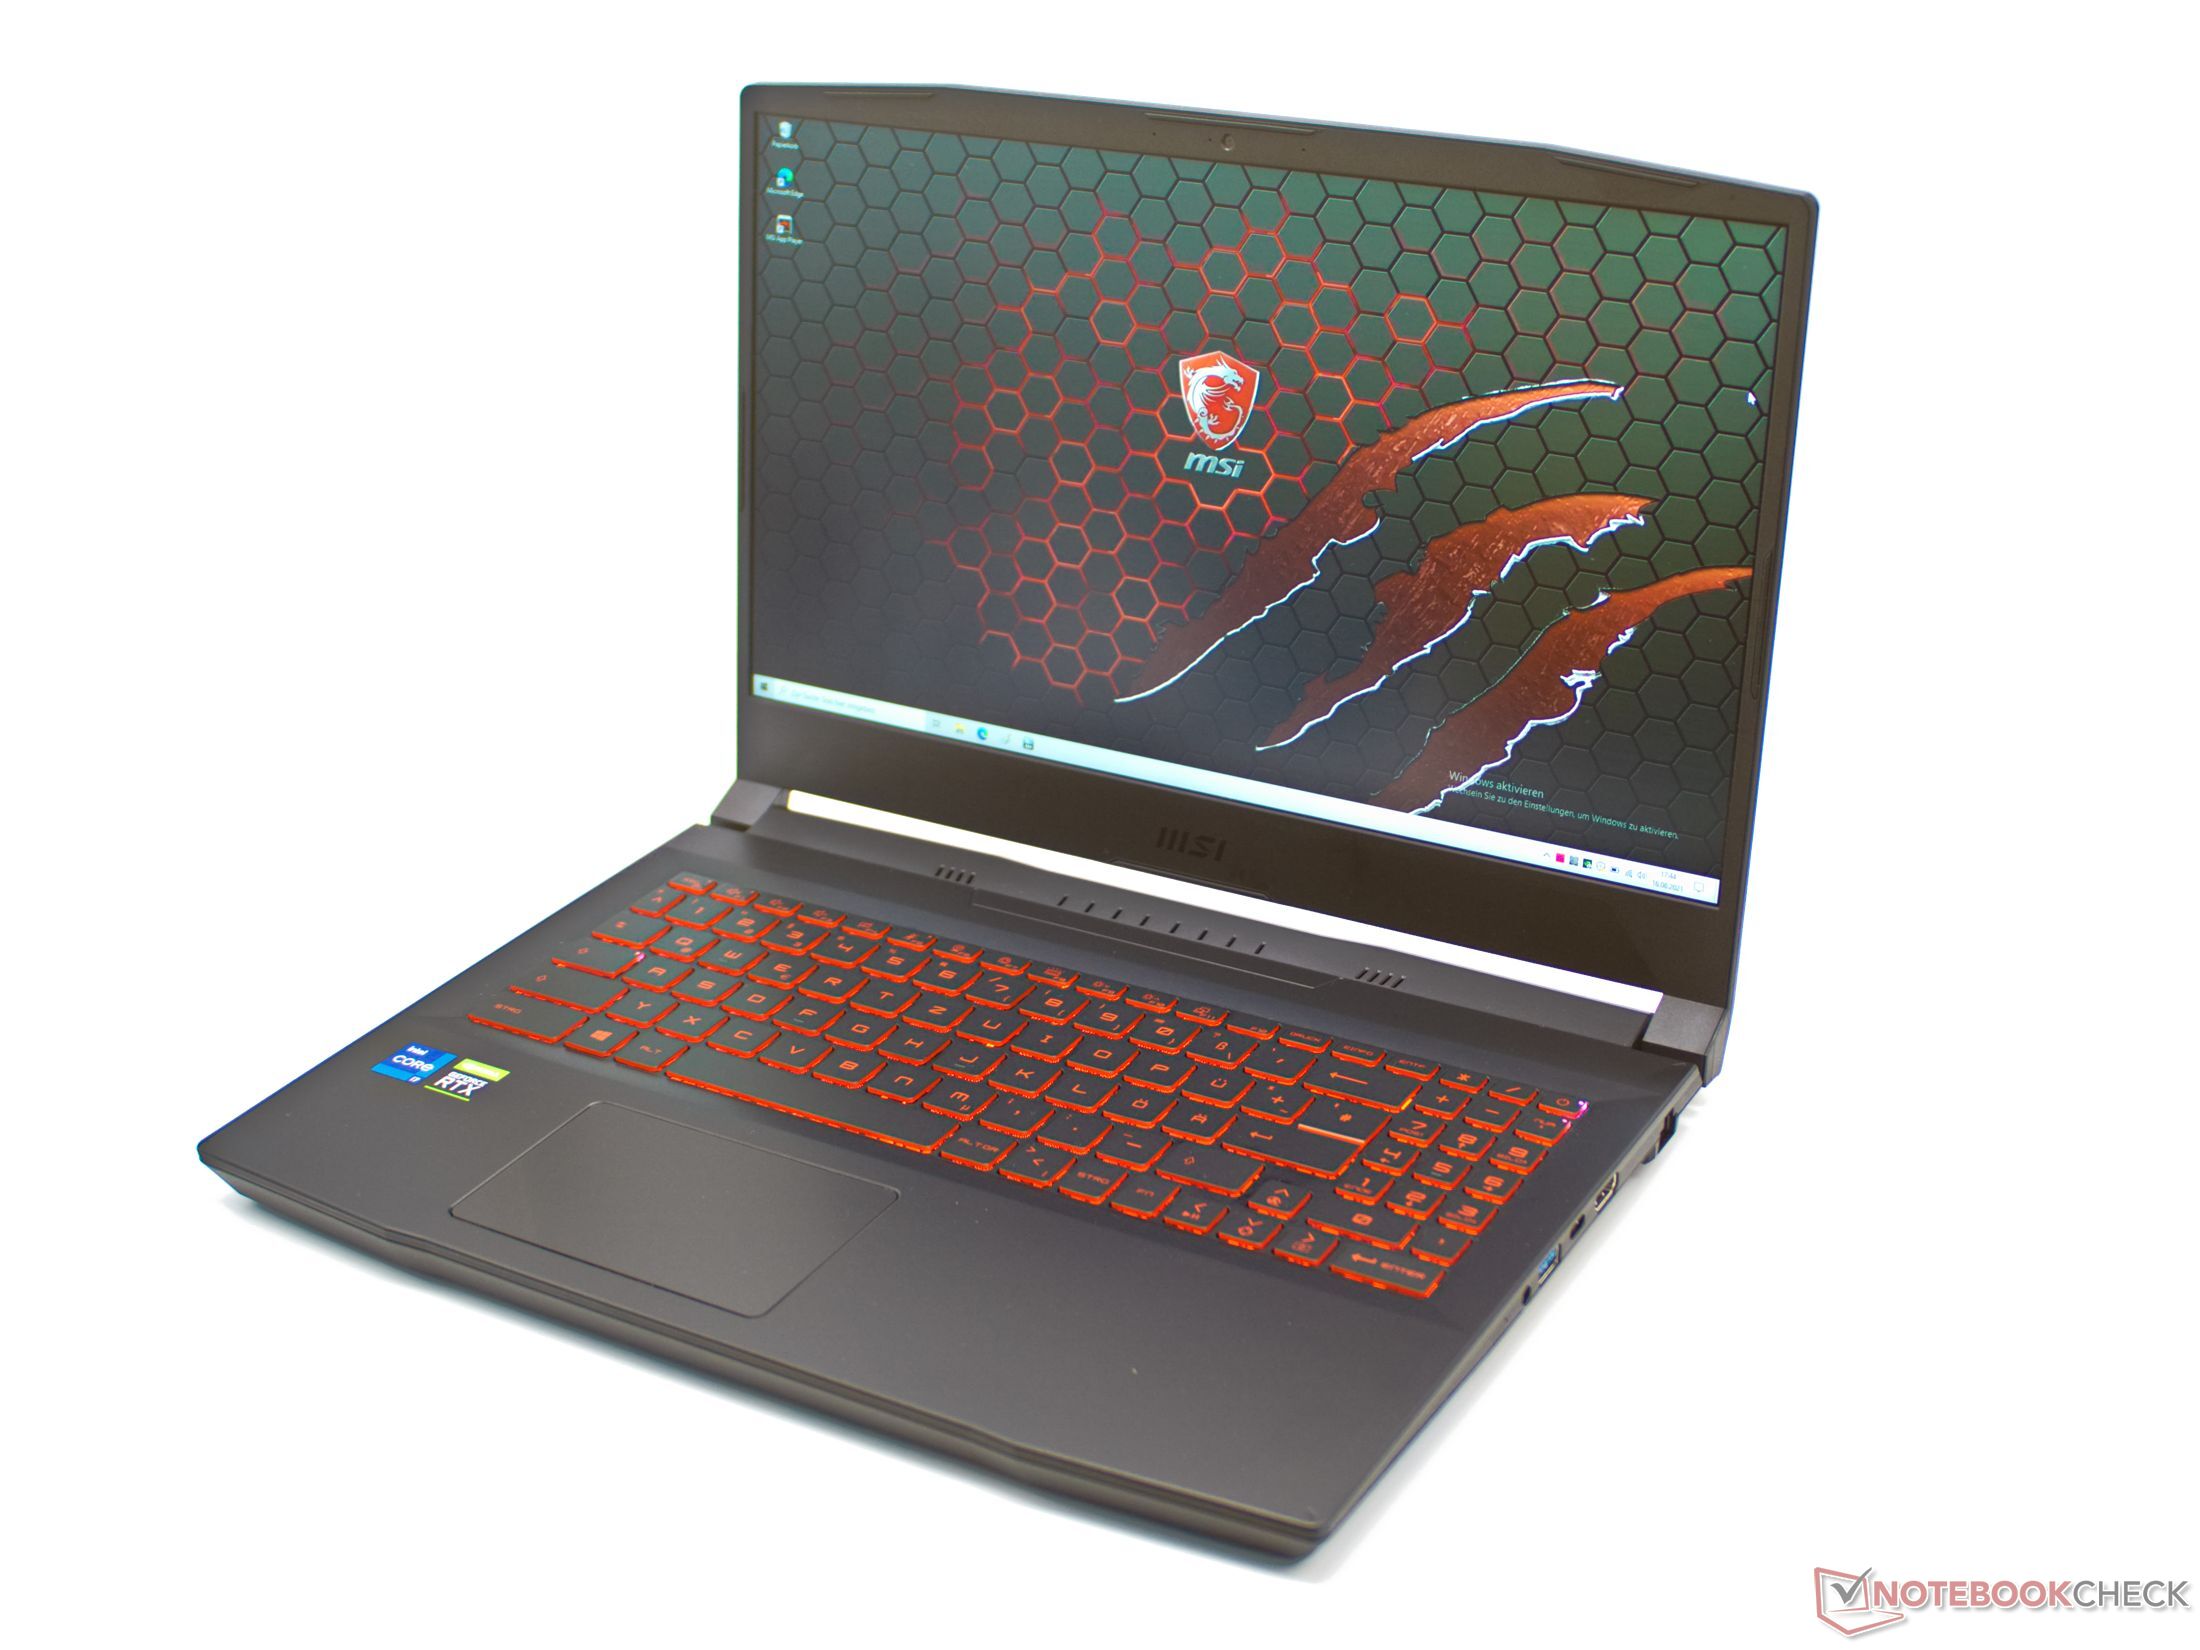
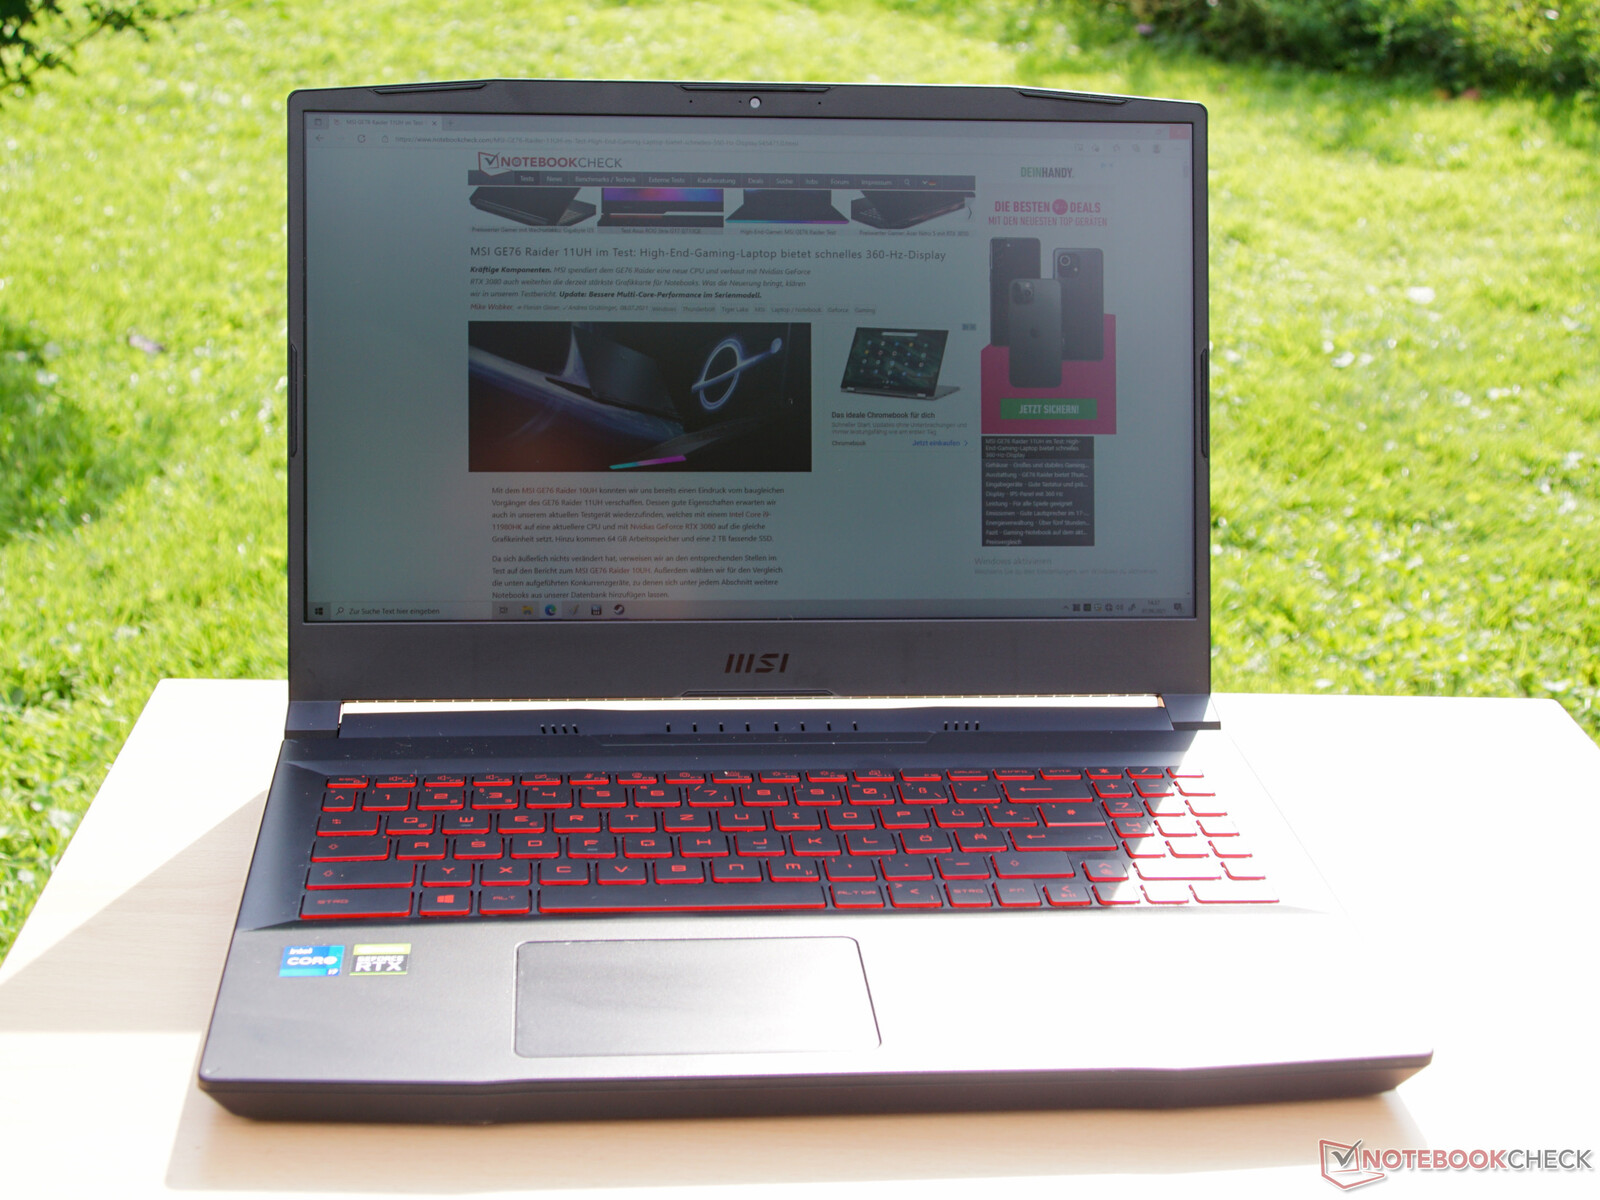
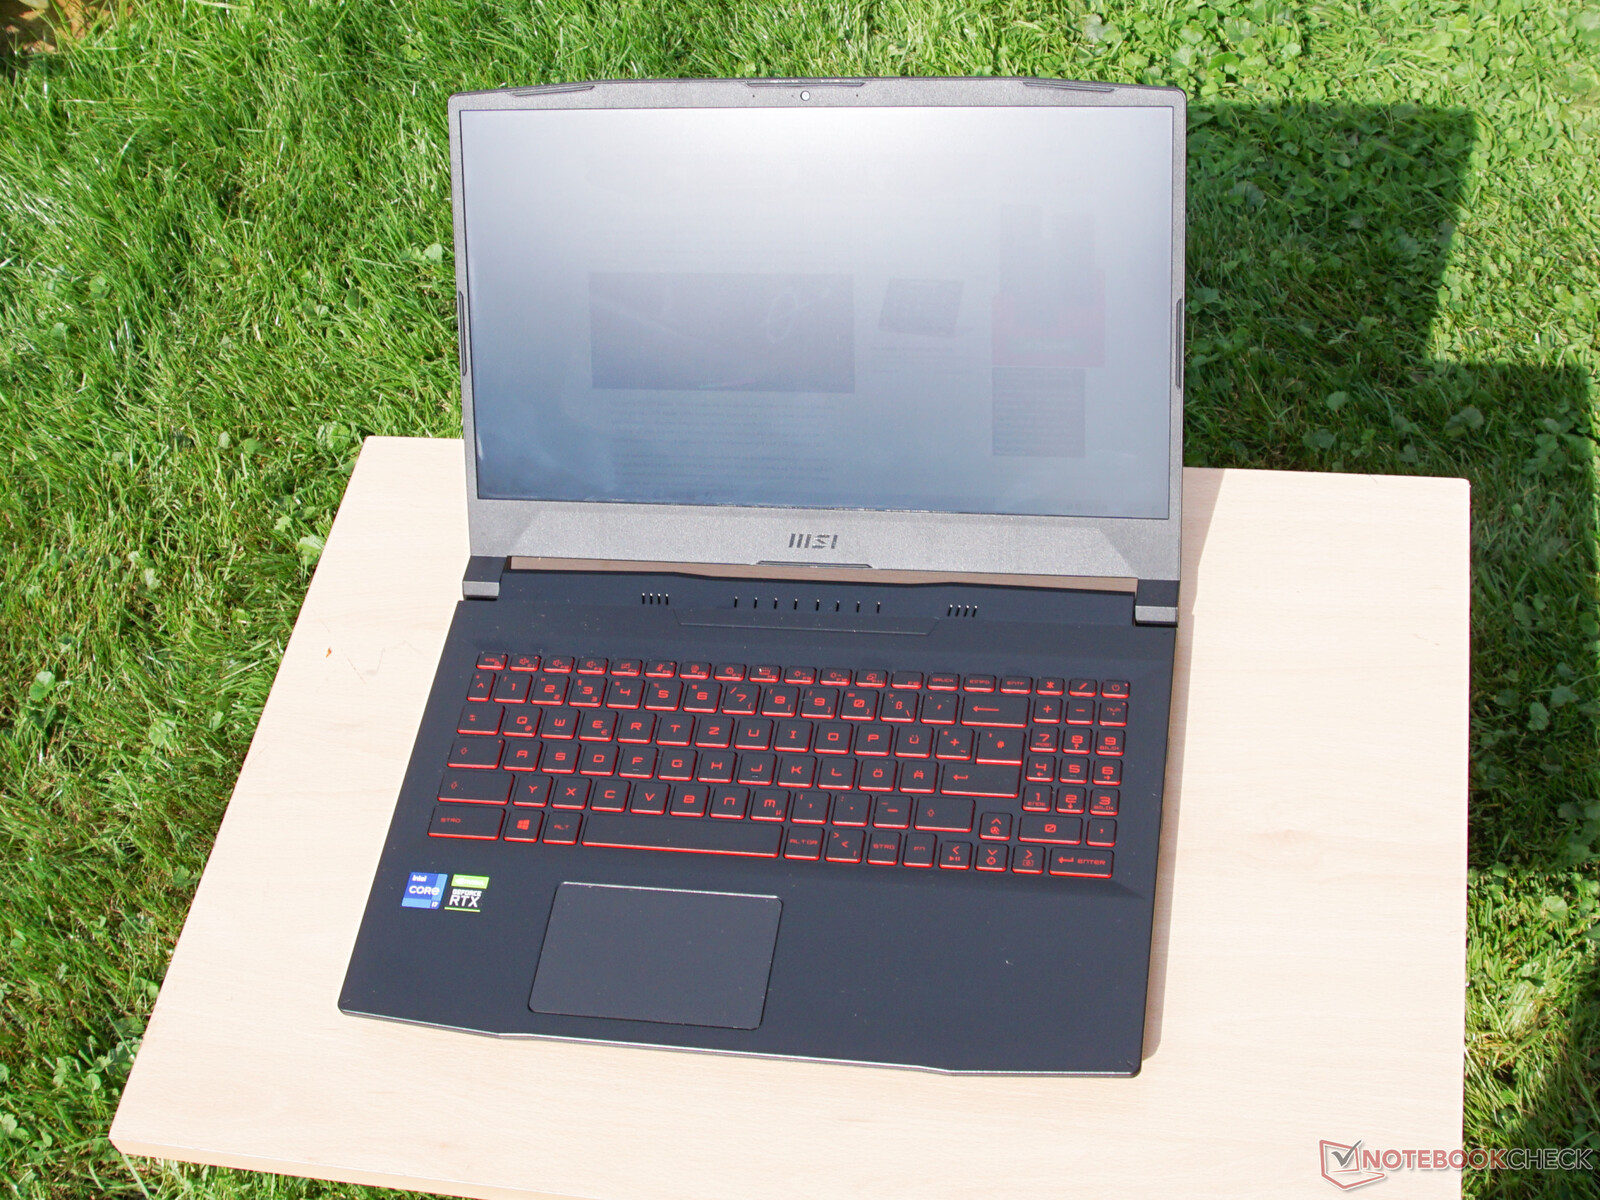
Case - The case of the gaming laptop is simple but elegant
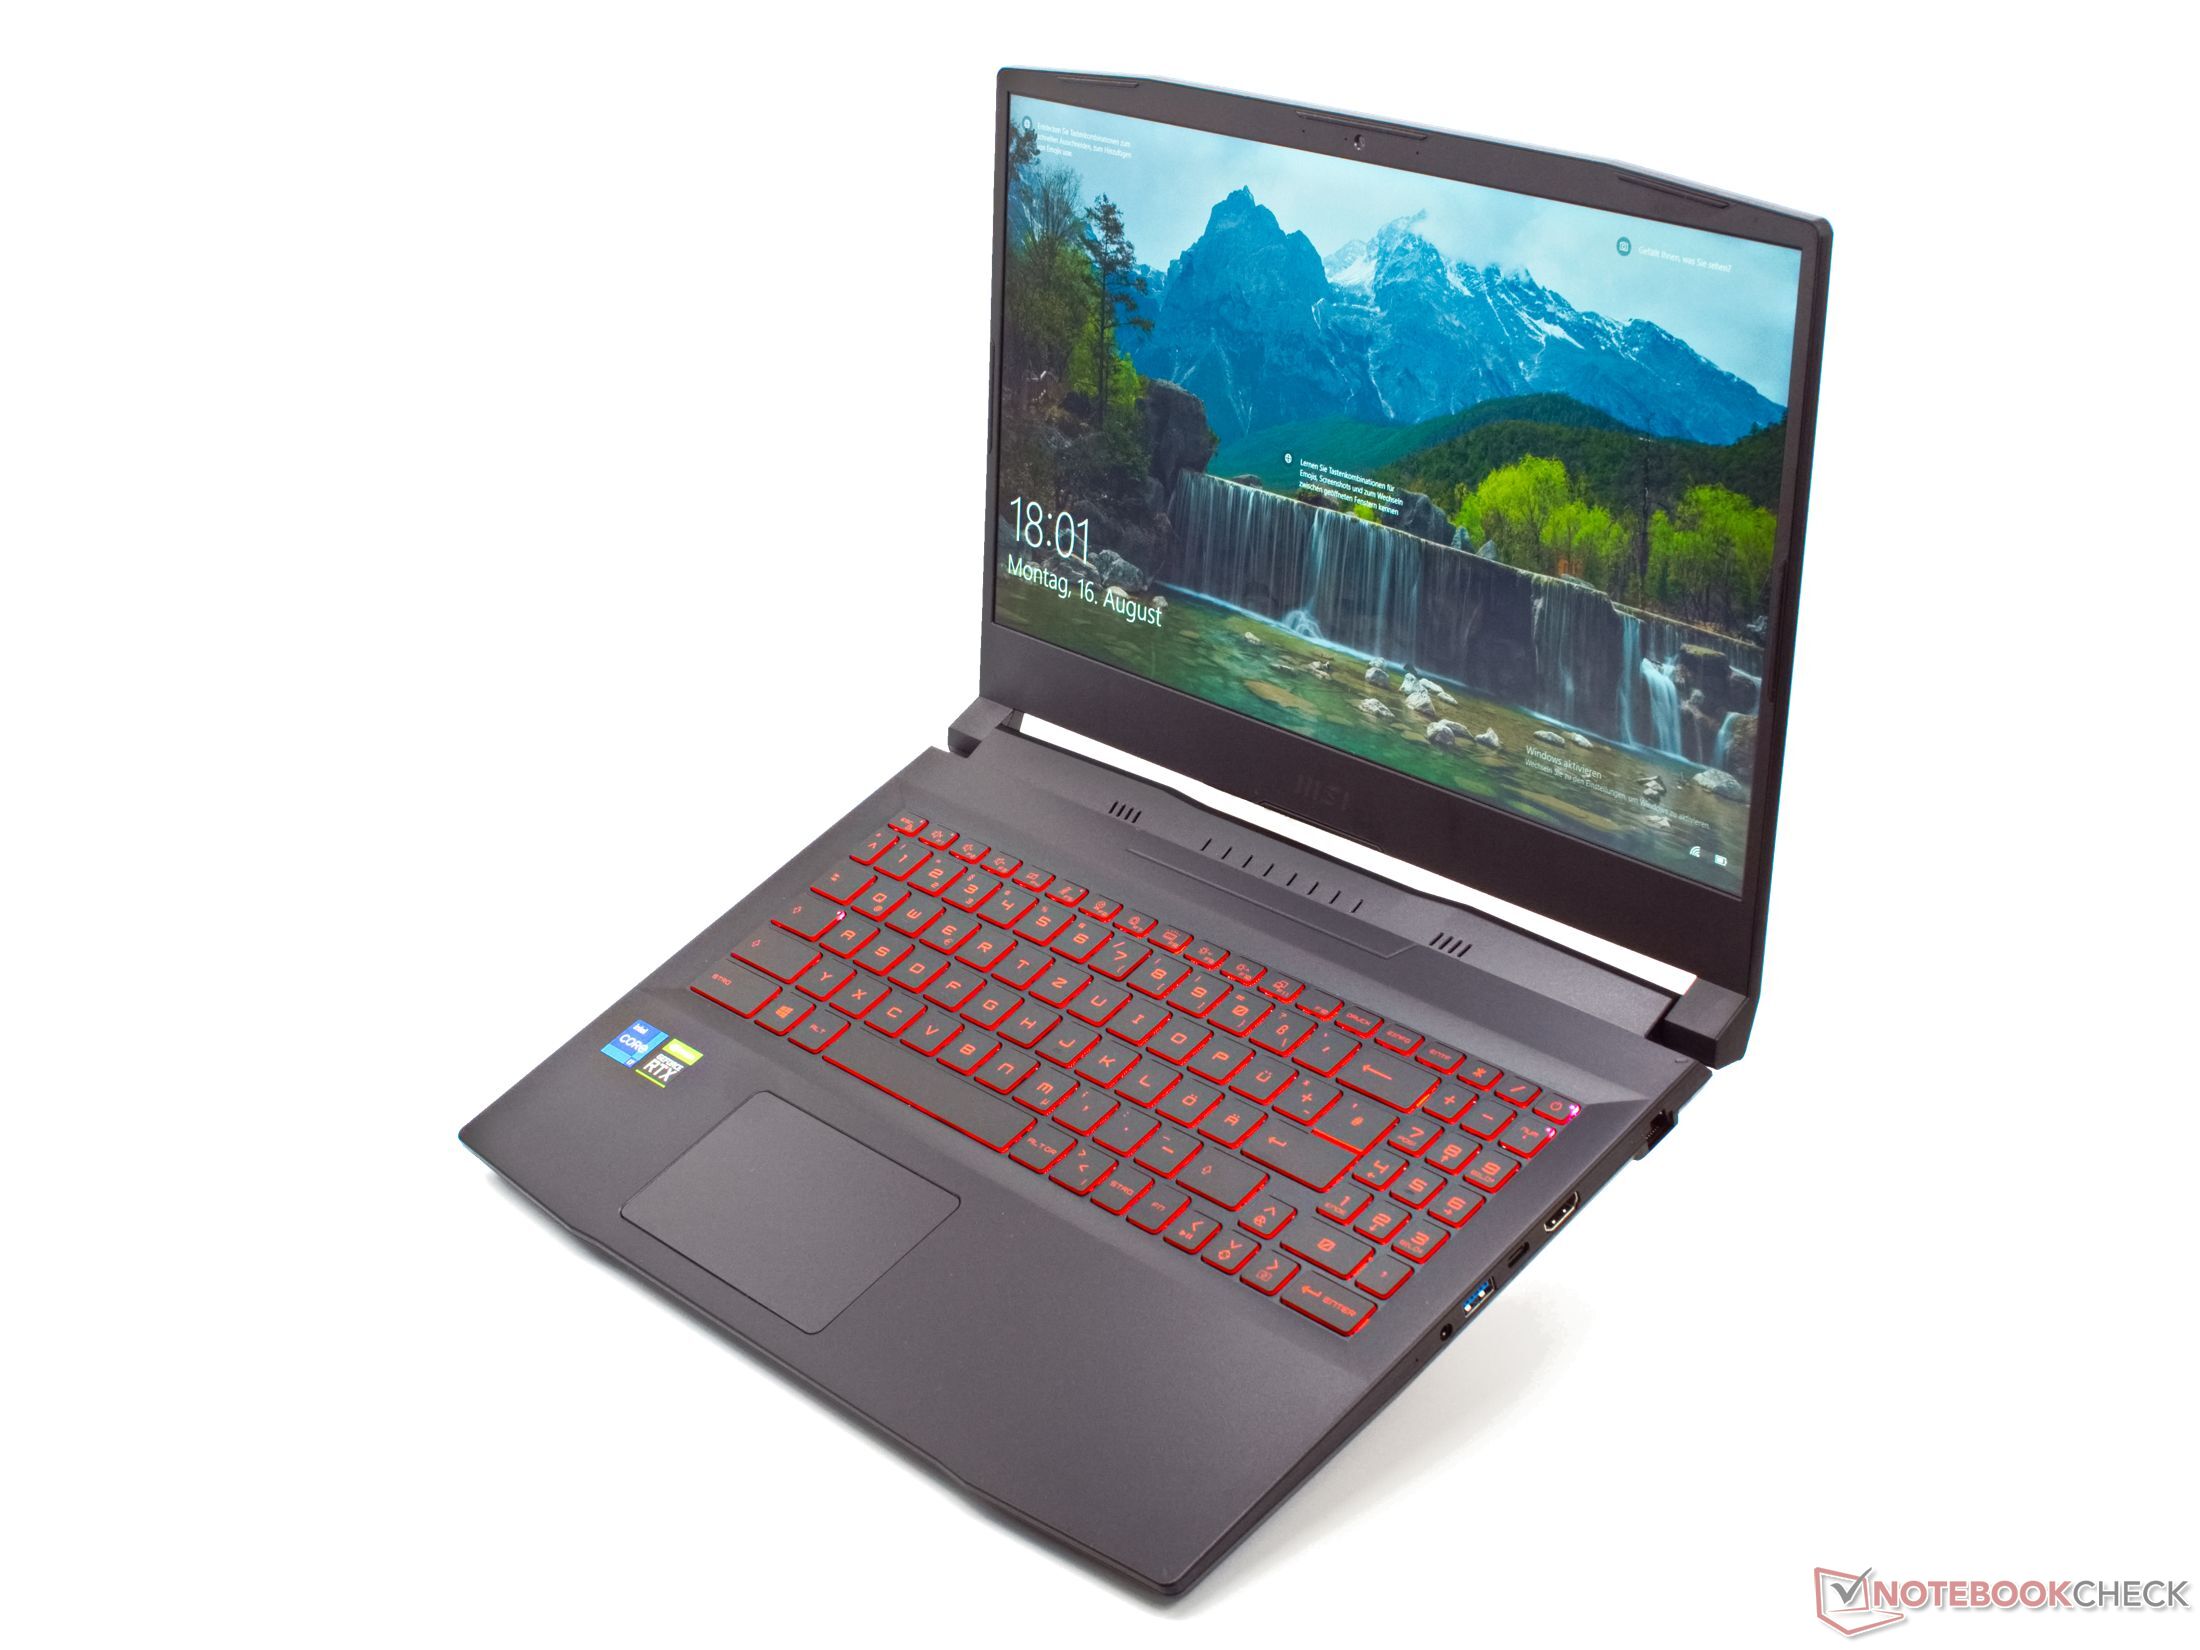
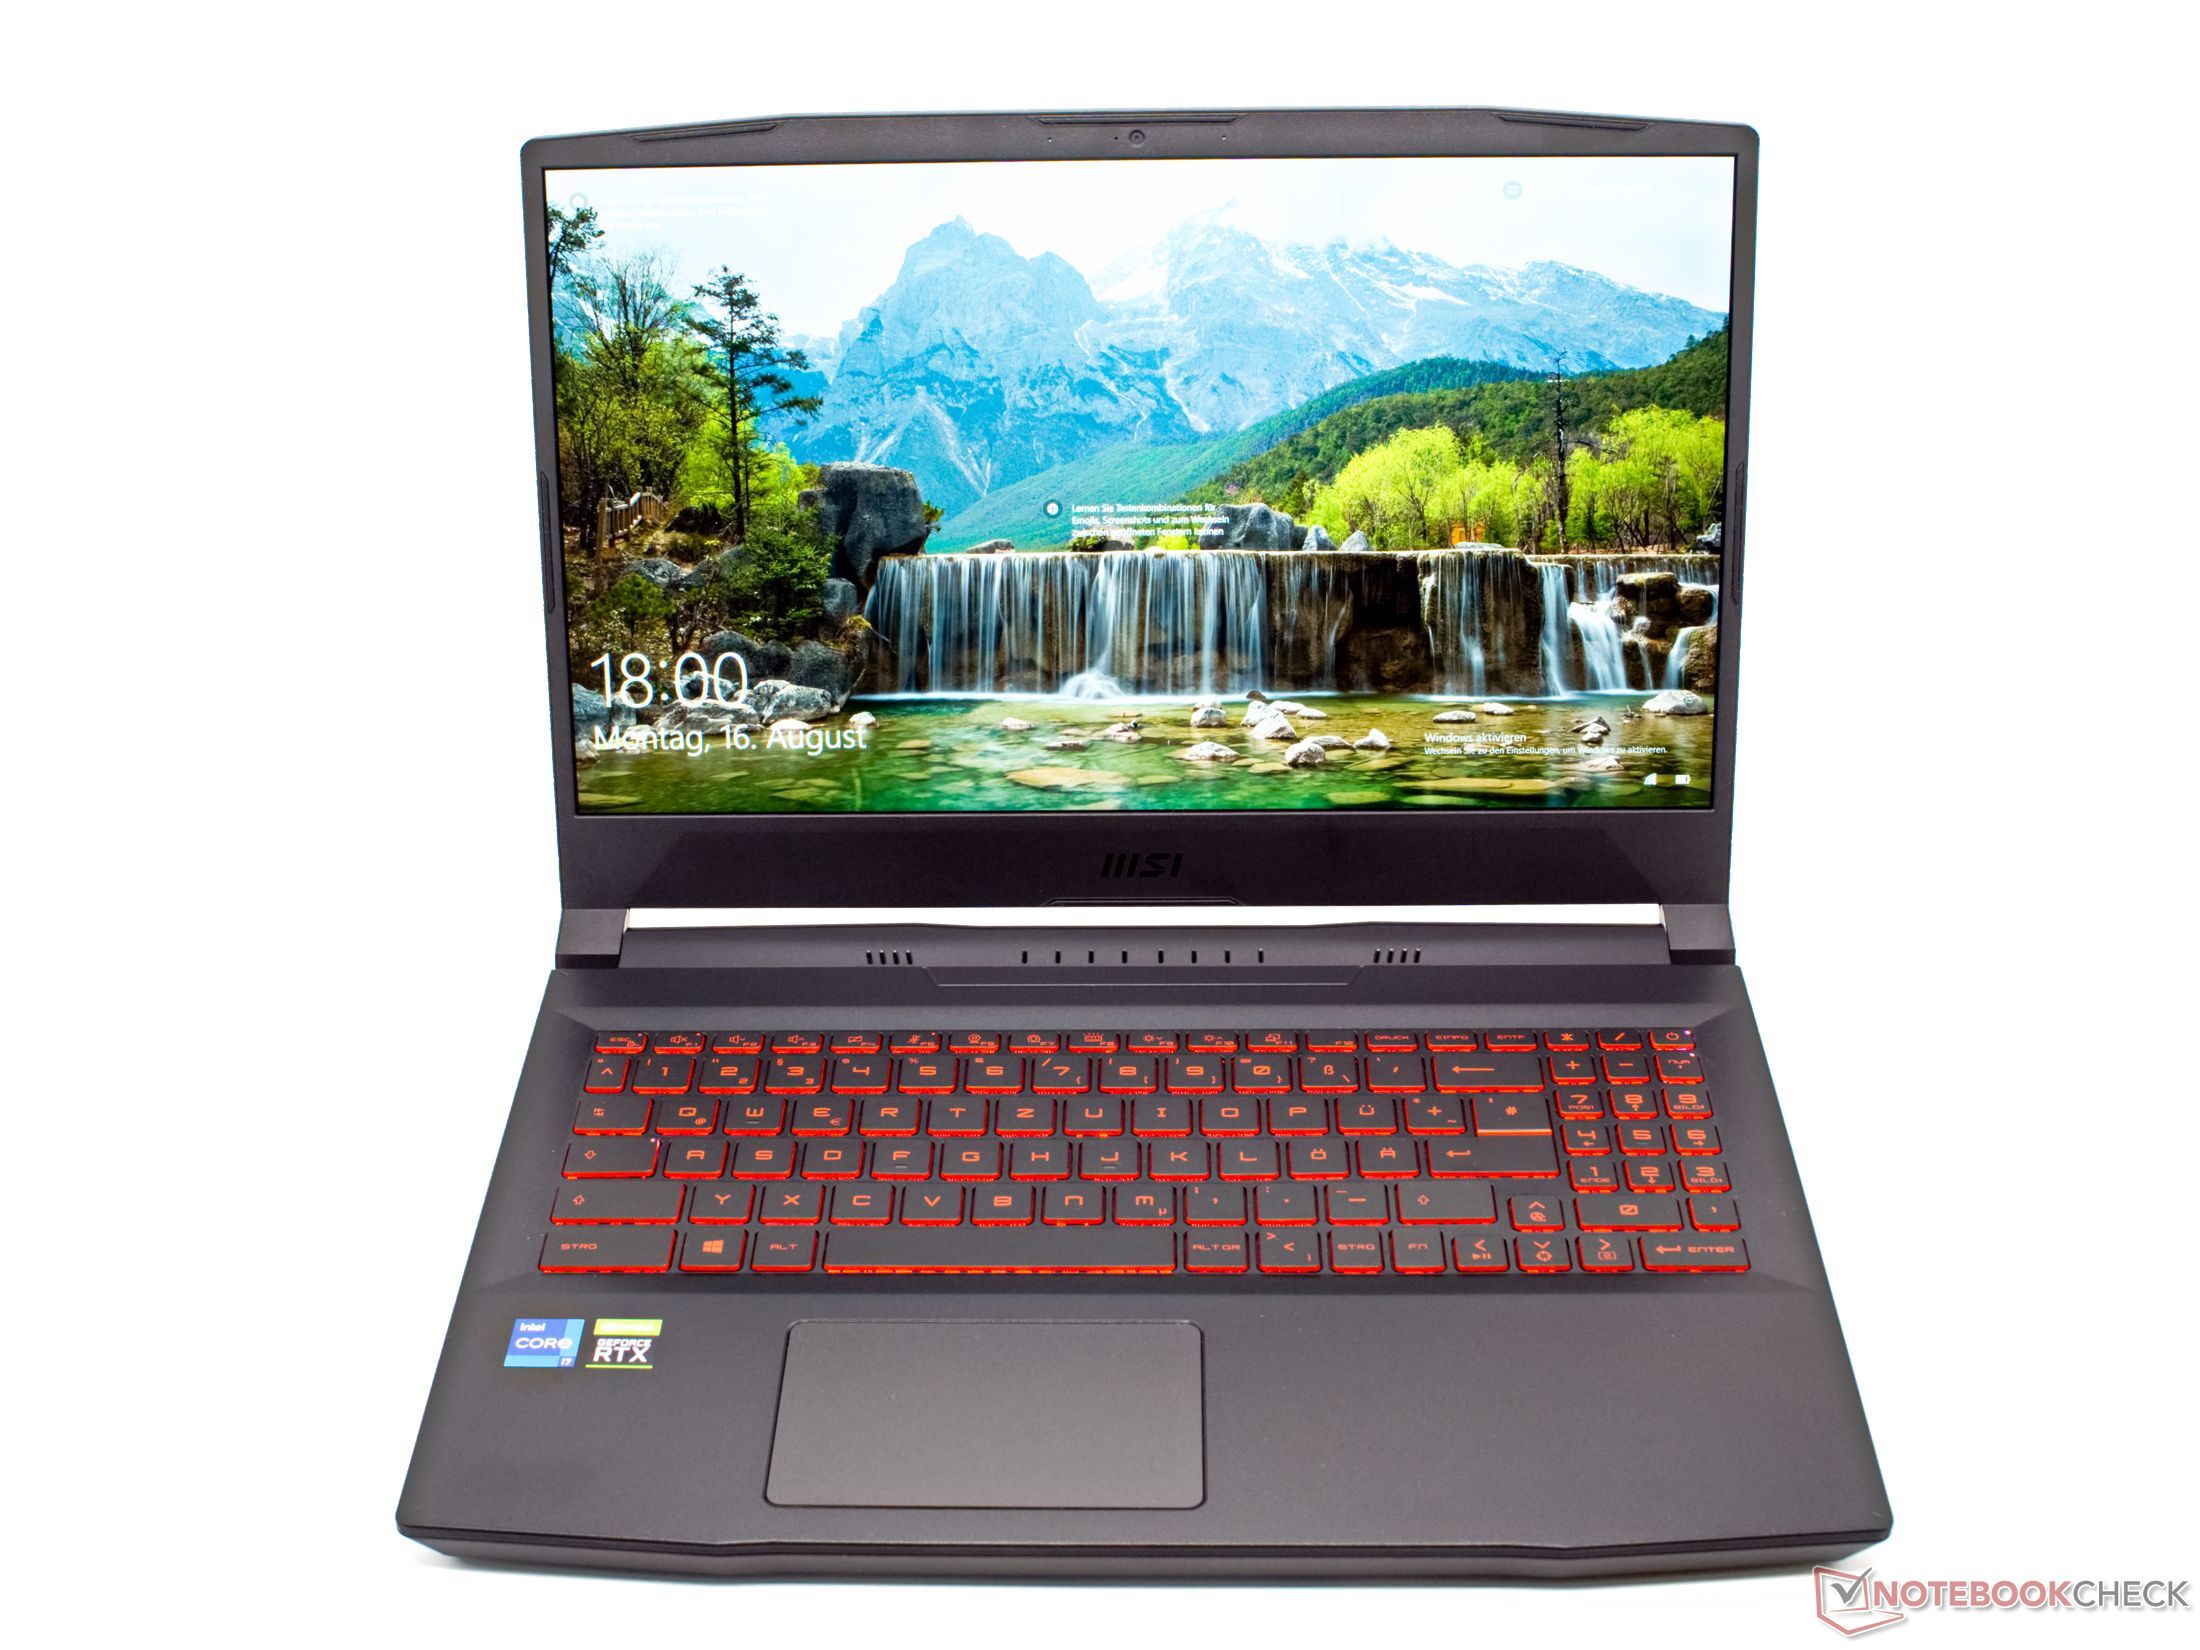
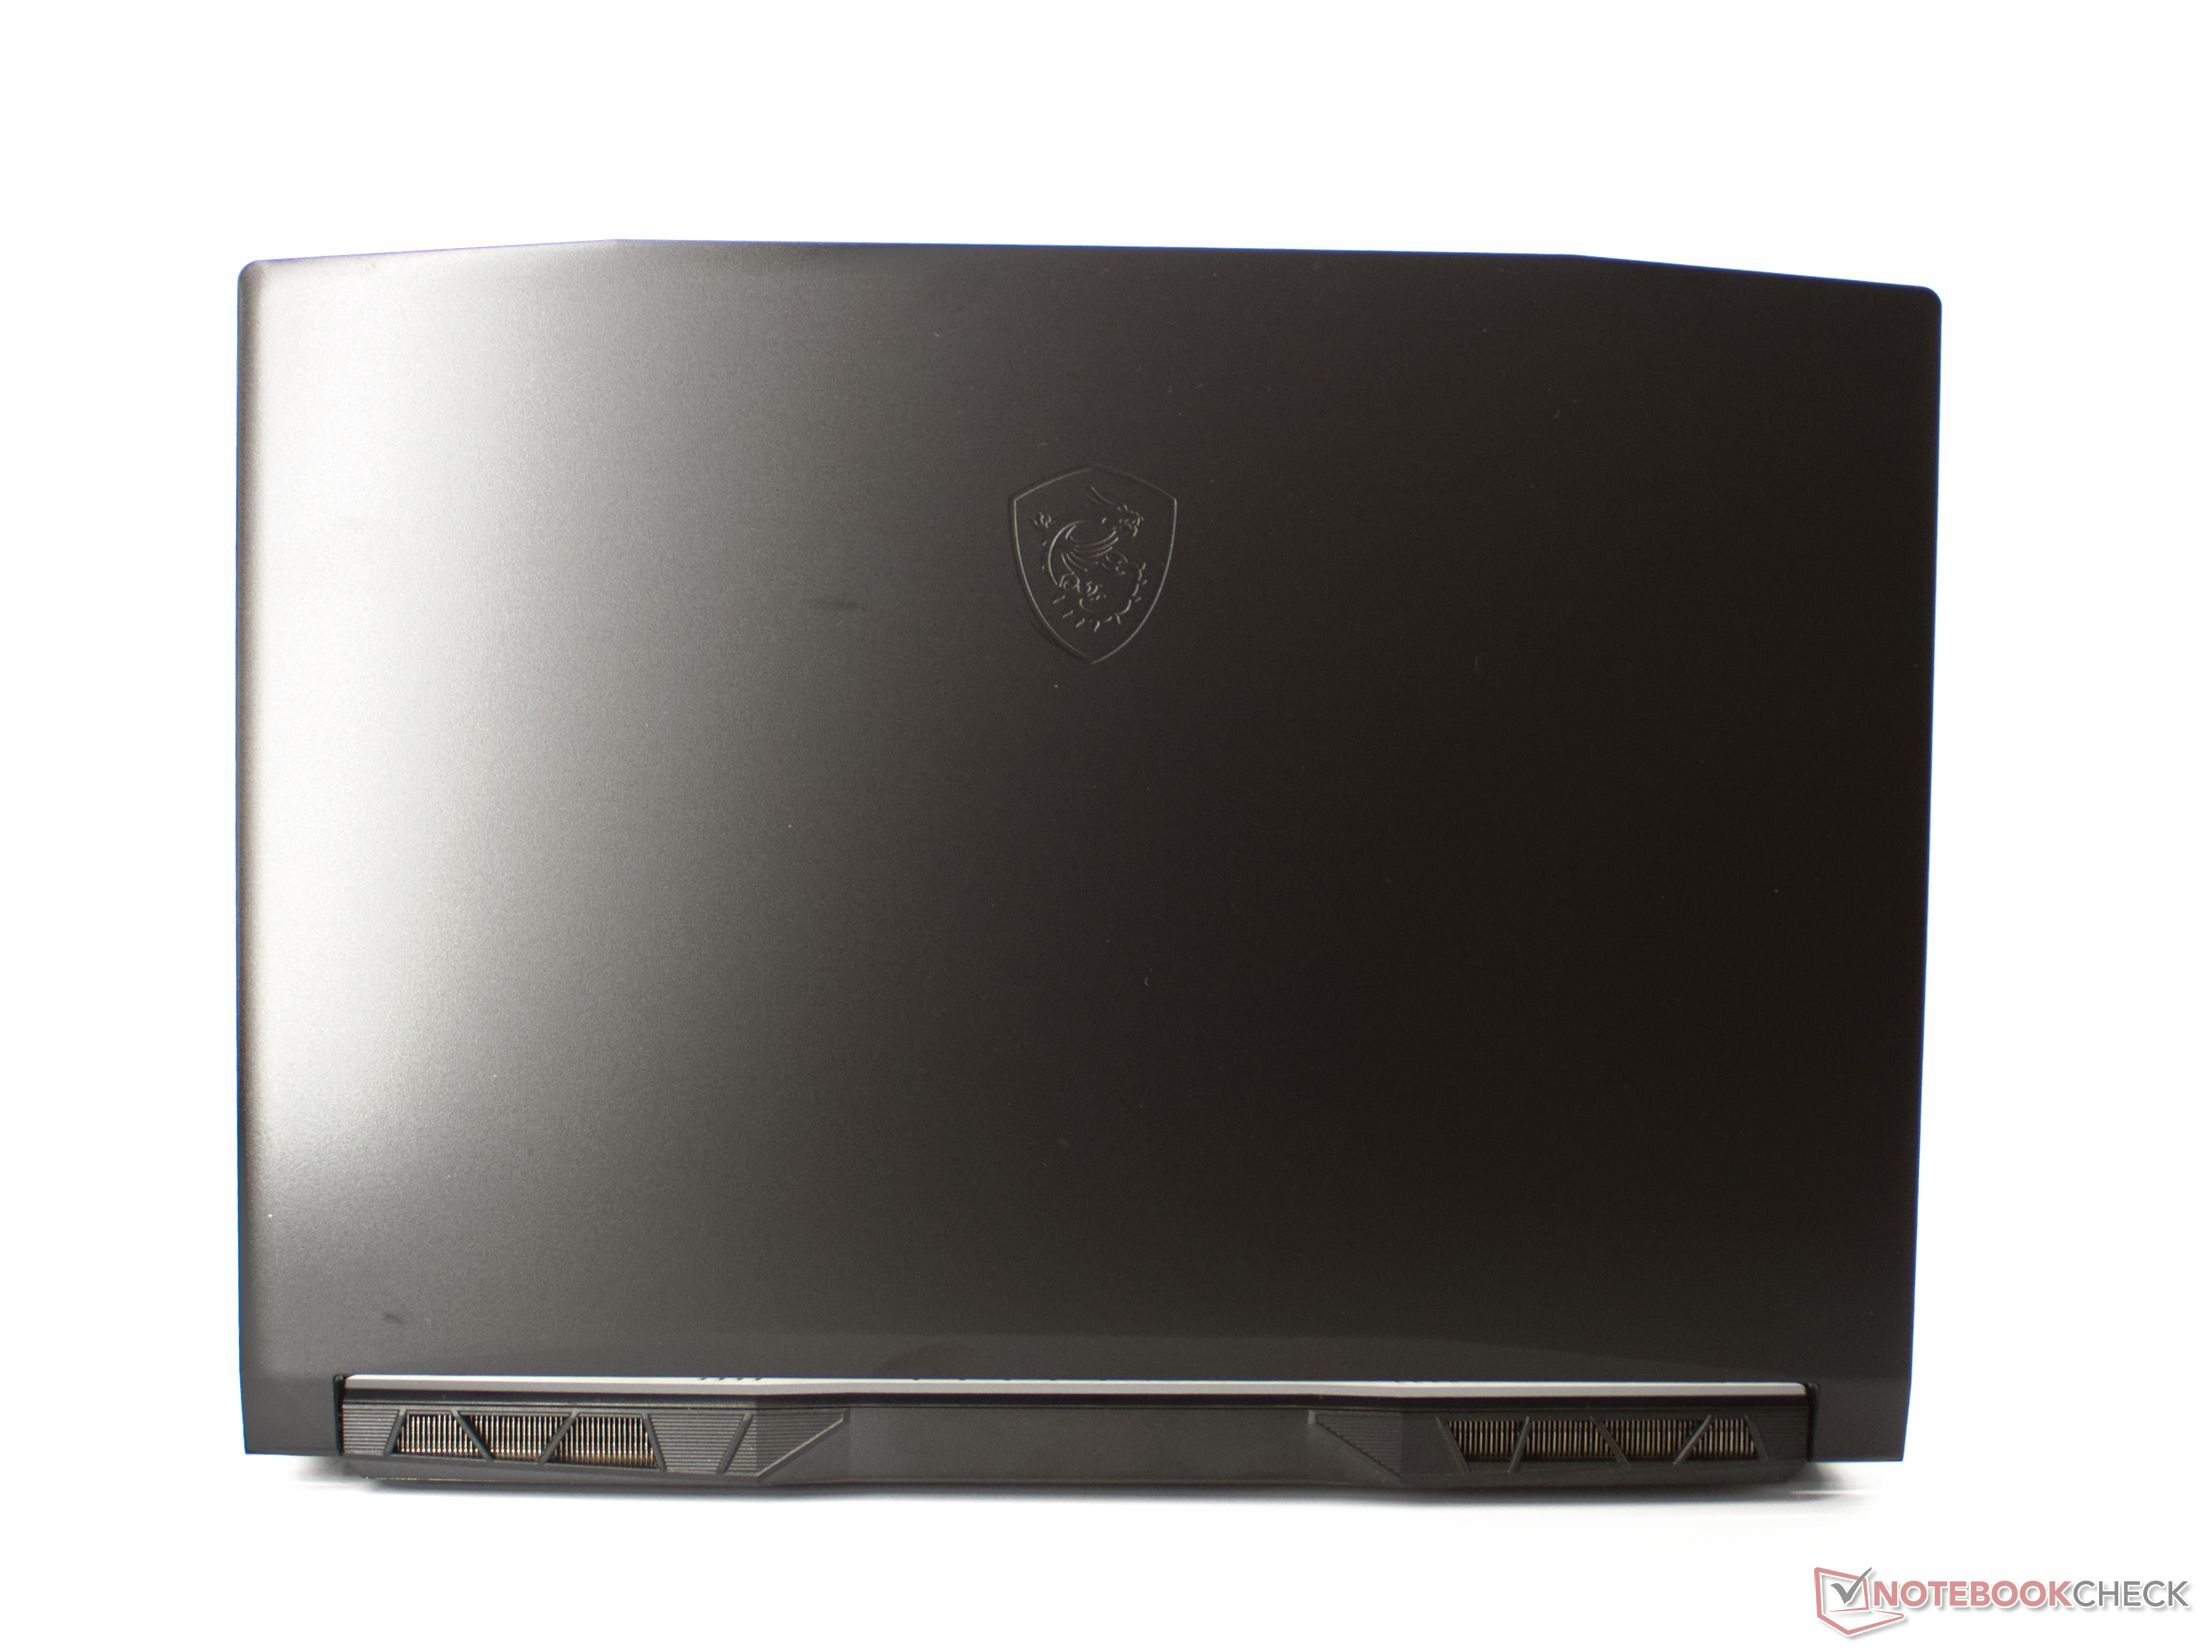
Among gaming laptops, the case of the MSI Katana GF66 stands out particularly with its inconspicuousness. The laptop is cased completely in black plastic. In terms of the design, MSI also uses only few accents. However, these few elements ensure a distinctive design. Brushed surfaces on the sides, the small angles above the display, the dragon logo on the lid, and the angled hinges give the gaming laptop an aggressive exterior when you look at it again.
In terms of the workmanship, the MSI laptop shows only a single weakness. While all the gaps are tight and the case stability is quite high, the display hinges tend to wobble a bit too easily. The display, which can also be opened up to a 180° angle using a single hand, even drops lower when there are only some slight vibrations.
In terms of their size and weight, the 15 to 16-inch gaming laptops are similar. At least 2 kg (~4.4 lb) plus the power supply are a lot of weight to lug around.
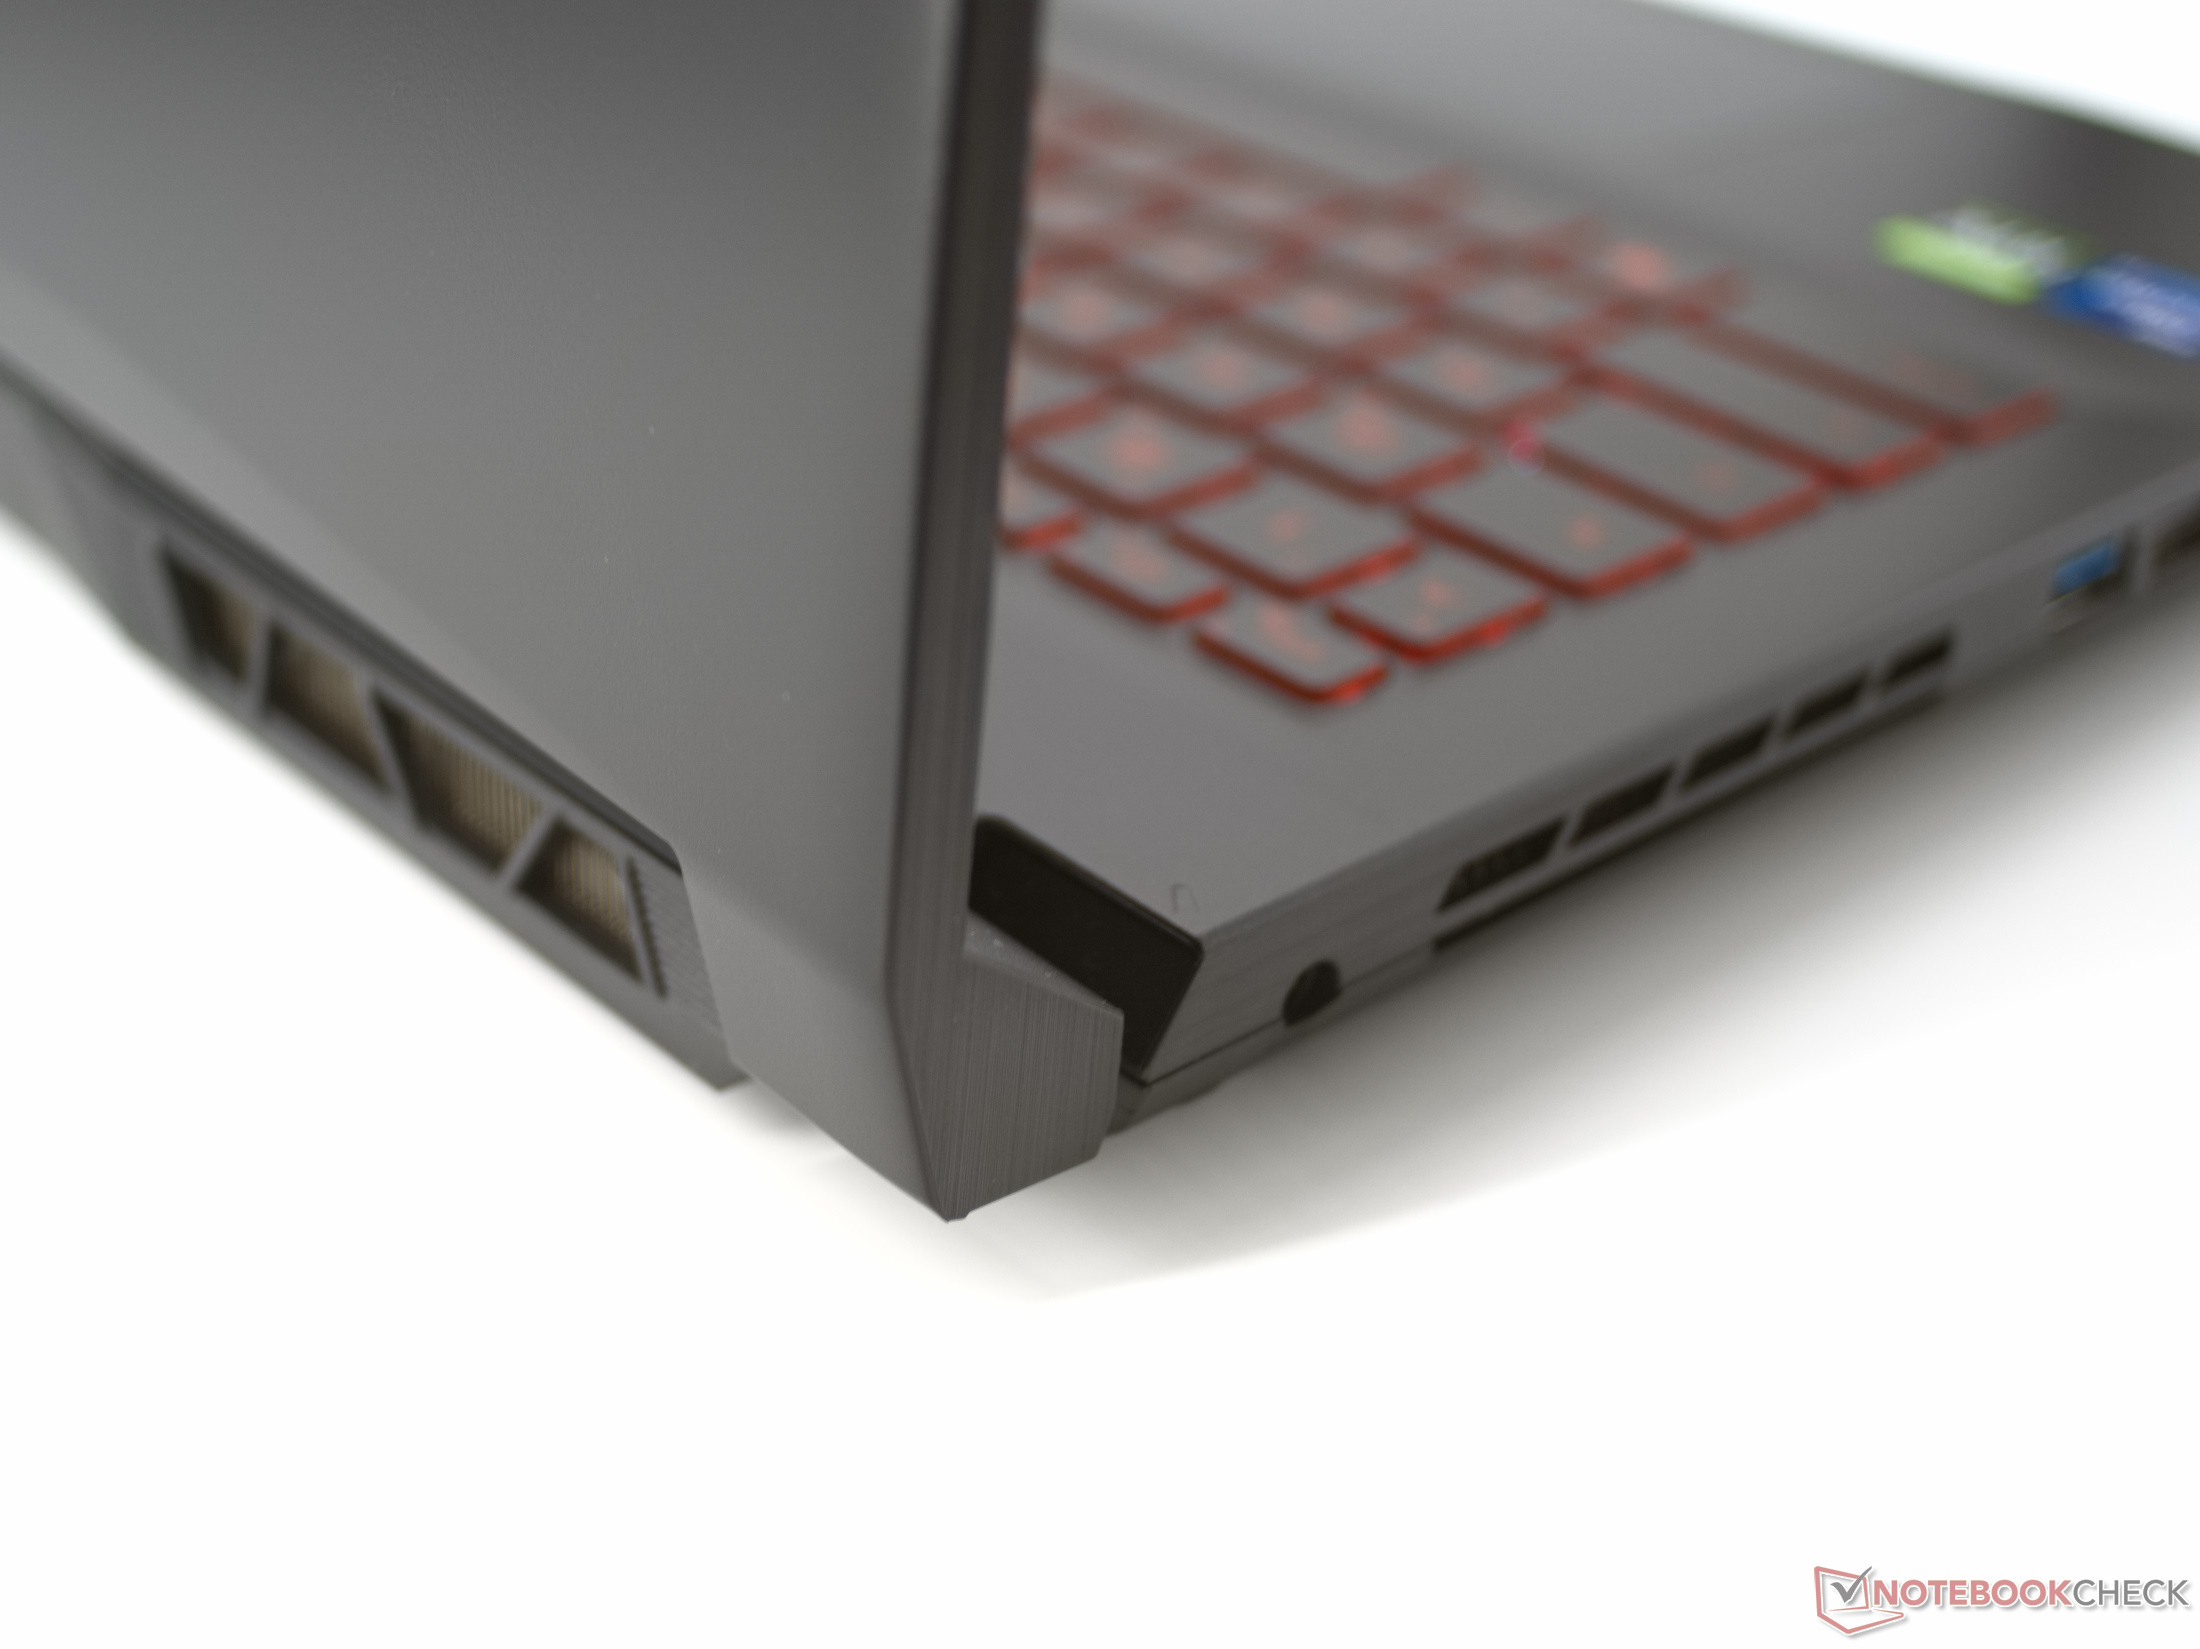
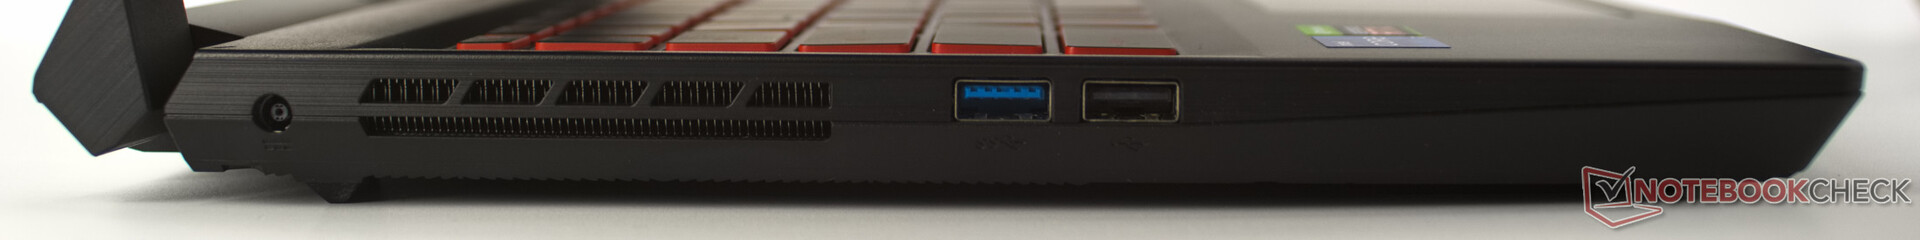
Equipment - Without Thunderbolt or DisplayPort, the connections are not up to date anymore
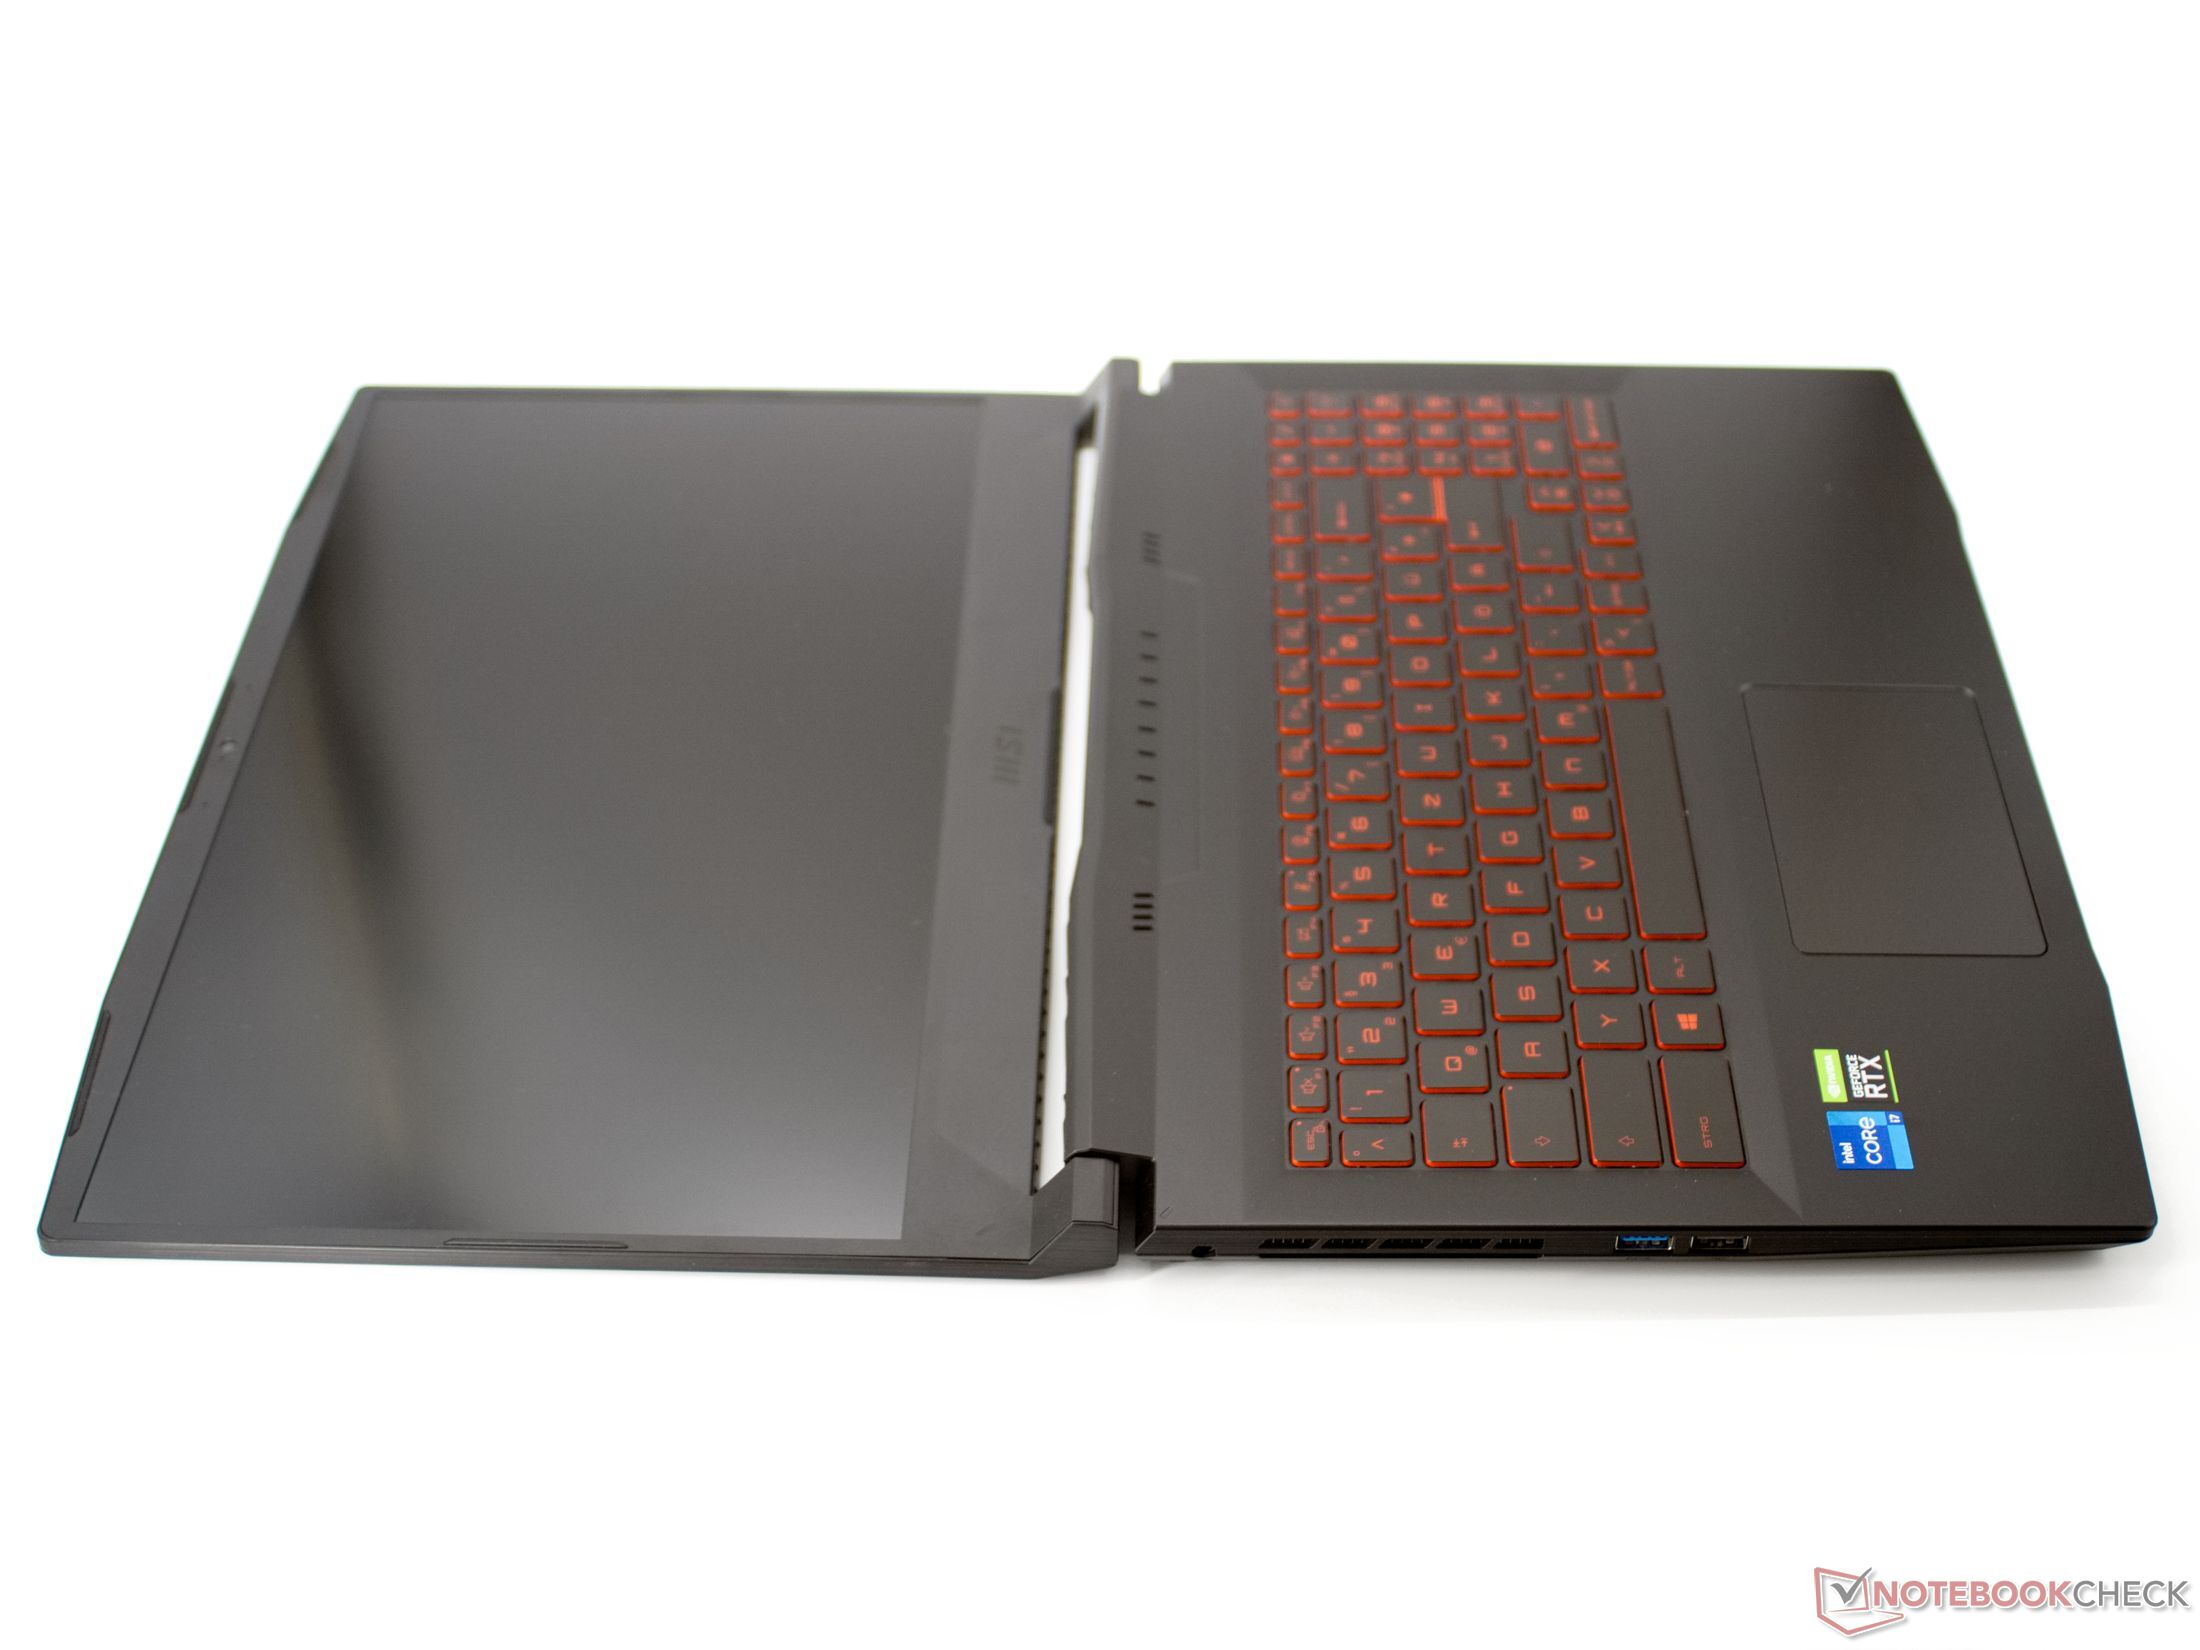
With only 3 USB Type-A ports and a single USB Type-C port, the connections of the Katana GF66 are quite limited, particularly since the USB-C connection does not offer any Thunderbolt or PowerDelivery functionality. This means that the HDMI connection on the right side is the only option to connect an external display. You also have to do without an SD card slot in the MSI gaming laptop.
In addition, the positioning of some of the connections are also unfortunate. Due to the angled power plug, it can happen that the warm air is blown right onto the cable, and all the USB connections are in the center of the case.

Communication
In the MSI Katana GF66, an Intel AX201 adapter is handling WLAN ax and Bluetooth 5.2. In terms of the selection and position of the antenna, MSI did everything right, so that the transfer rates using the WLAN card are above average.
Webcam
The 720p webcam shows the bad image quality that is typical for current laptops. Blurry contrasts and a high color deviation also characterize this lens.


Security
The current Intel processors like the one in our test unit support the necessary security features for Windows 11 such as TPM 2.0 and SecureBoot. MSI did not integrate any additional security features into the gaming laptop.
Accessories
The box of the laptop only includes the 180-Watt power supply and a small collection of papers with some important information.
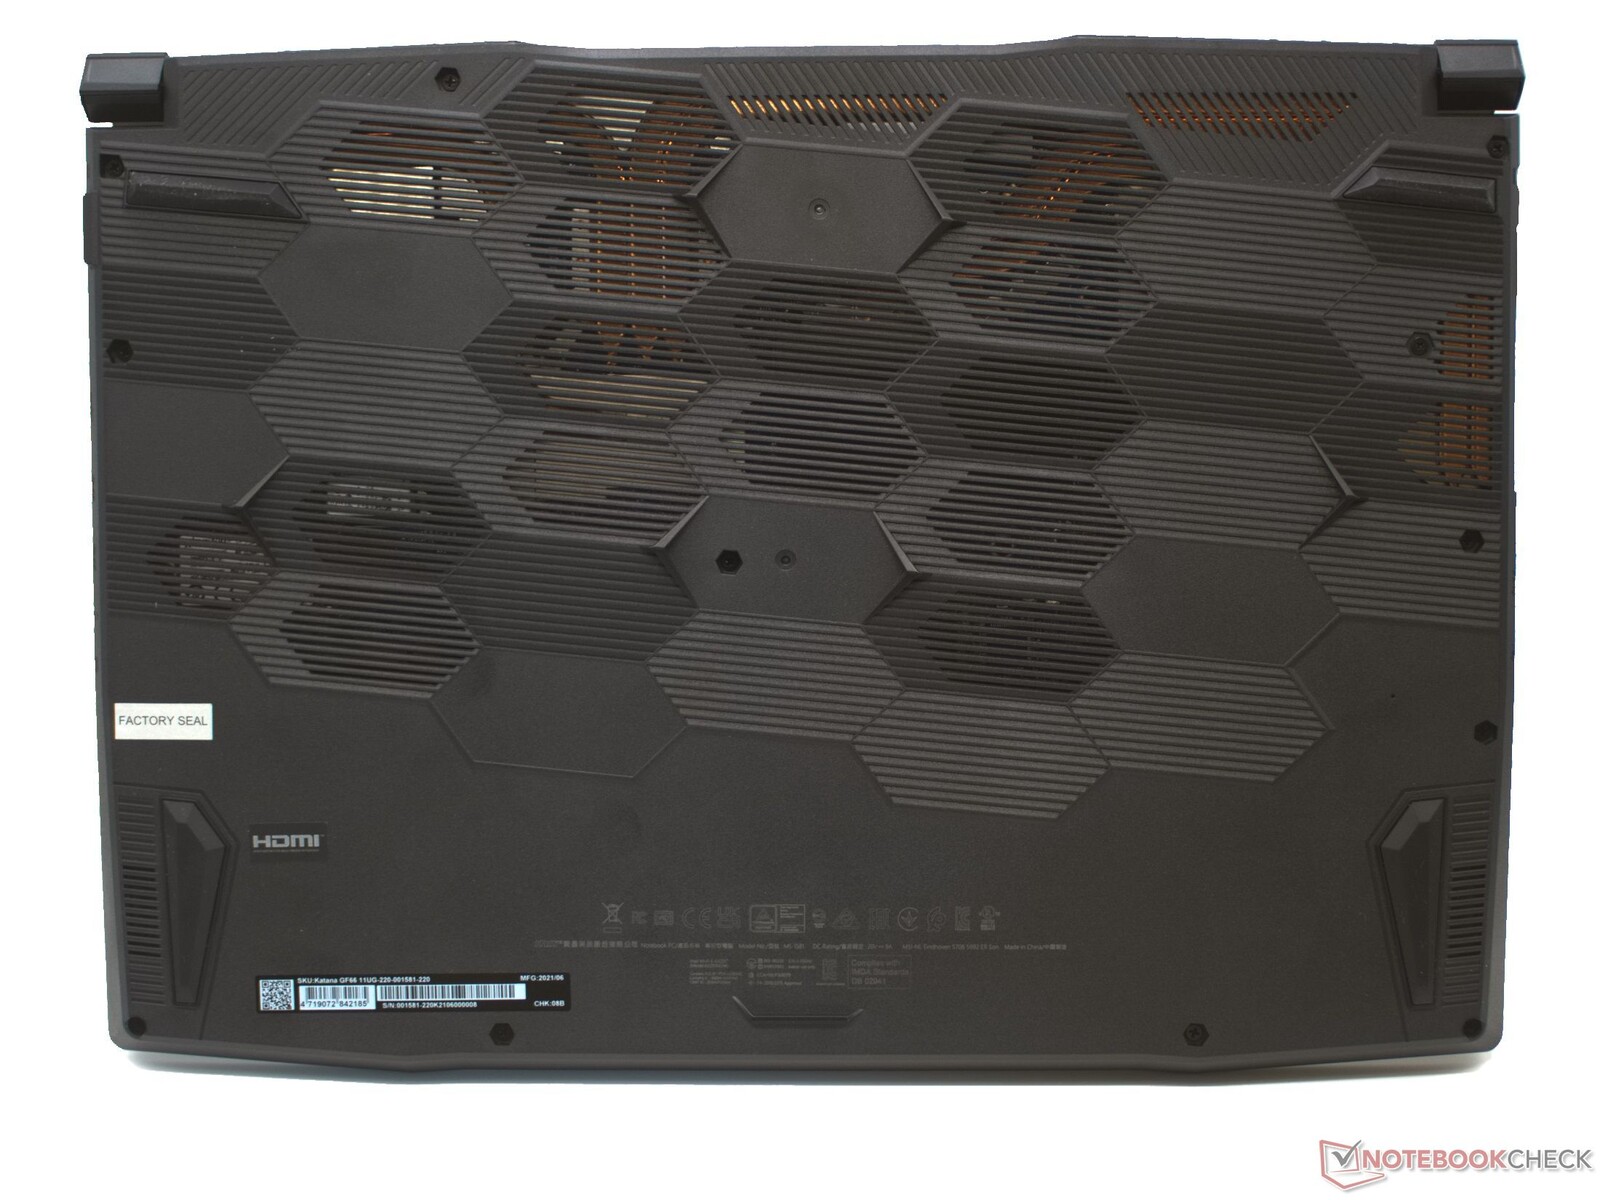
Maintenance
In principle, the MSI Katana GF66 can be opened fairly easily. There are 12 PH1 screws that fasten the bottom cover to the base unit. After removing them, you can then go around the gap around the cover with a plastic prying tool to get access to the insides. However, the provider of our testing unit loaner has asked that we don't break the manufacturer's seal. We therefore cannot offer you any views into the insides of our test unit. But peeking through the large fan vents, we can still take some guesses.
The working memory and SSD, as well as the WLAN module can be replaced, and there is also a connection for an additional storage module in the device. The large fans should also be easy to clean.
Warranty
MSI offers a 24-month manufacturer warranty for the GF66. Defective devices are picked up and repaired at a central location from which they are then also sent back to the customer.
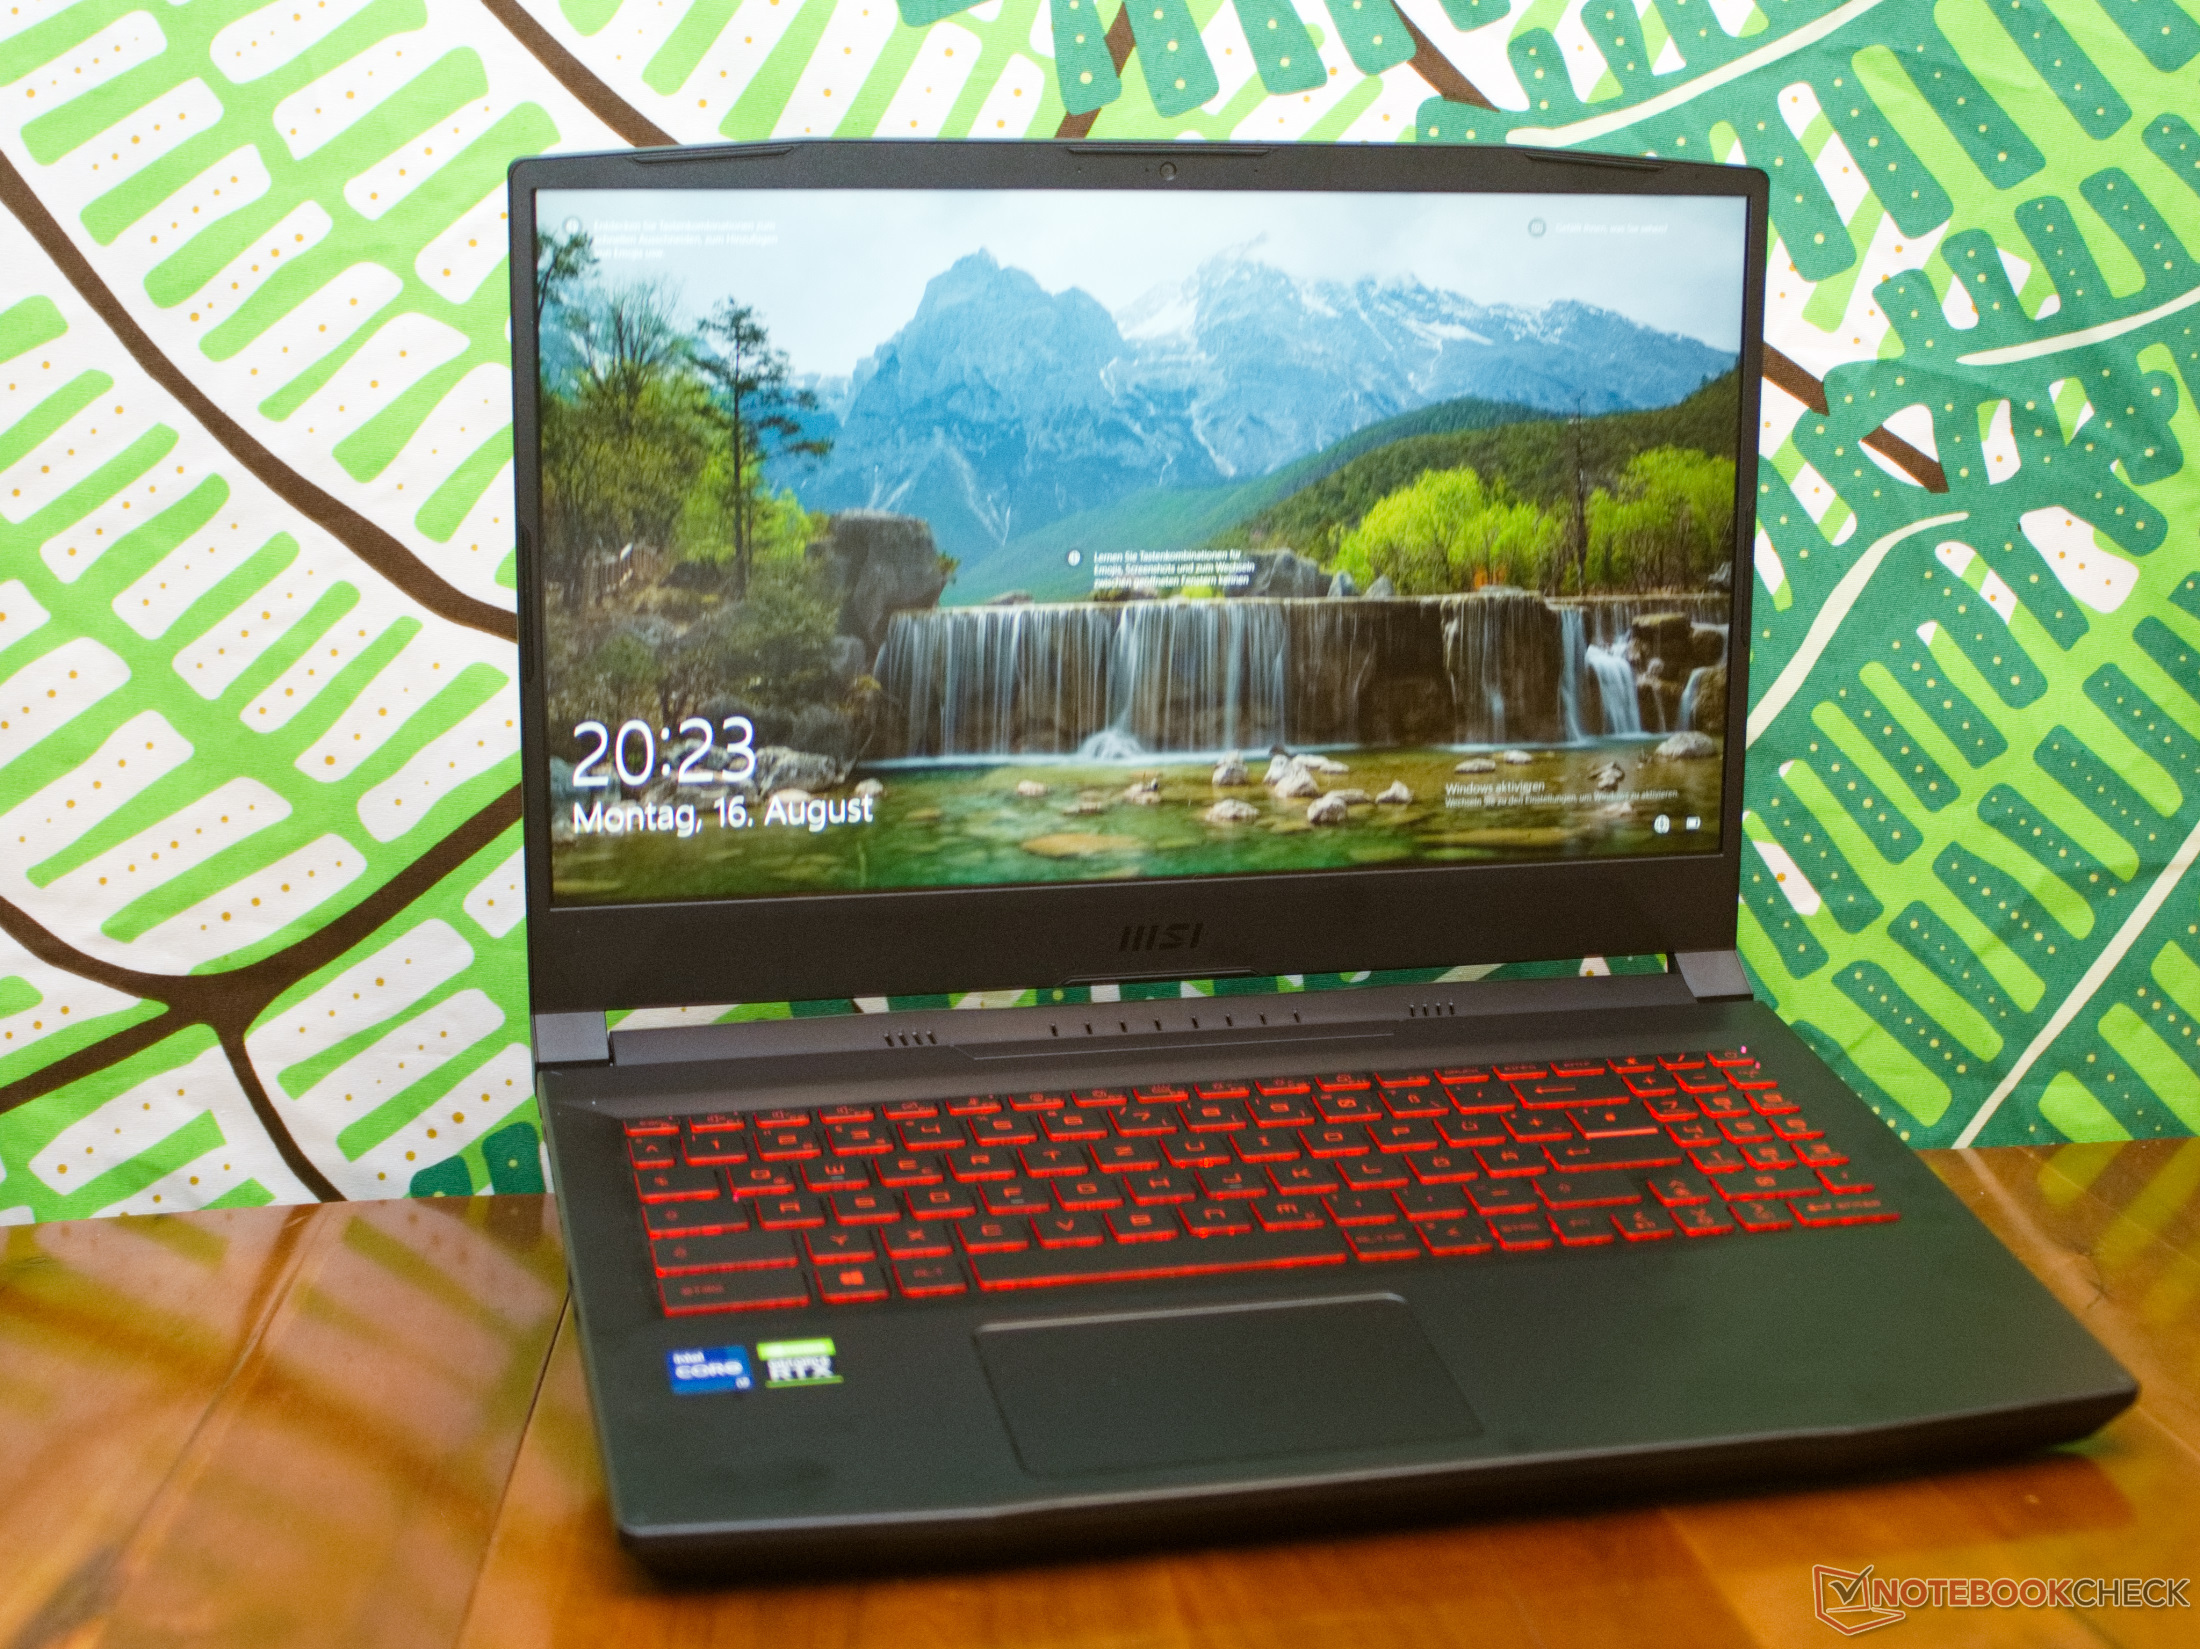
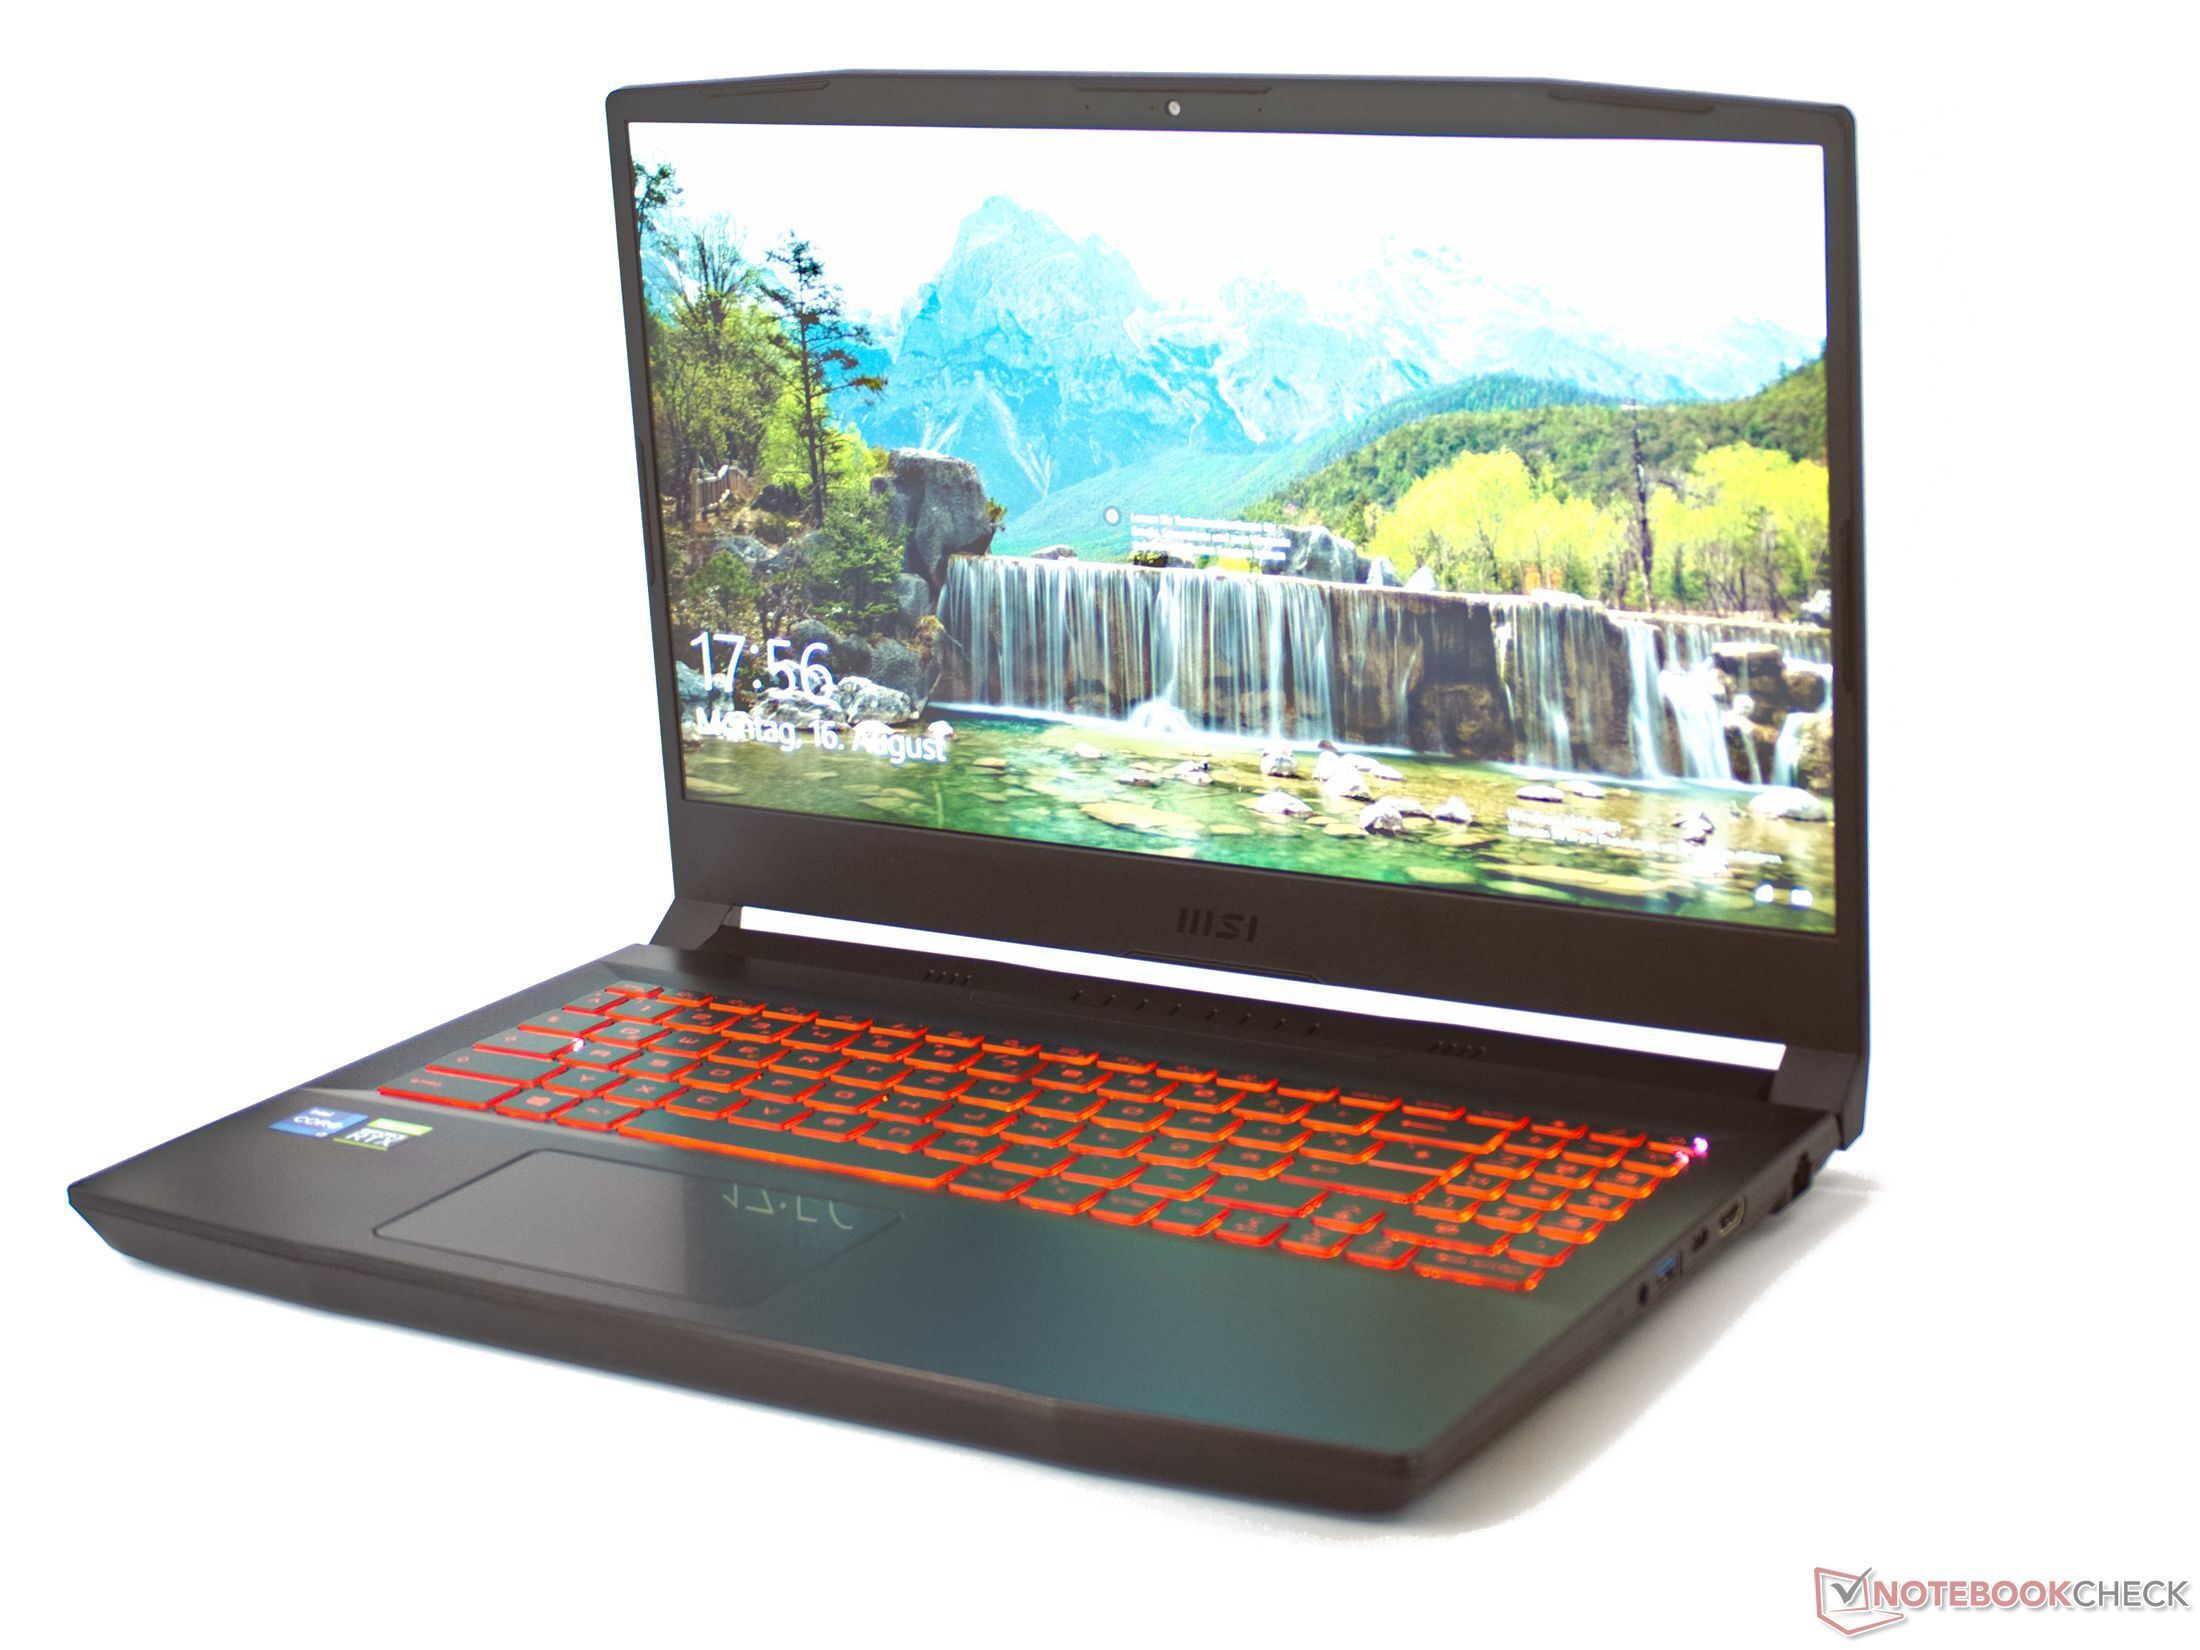
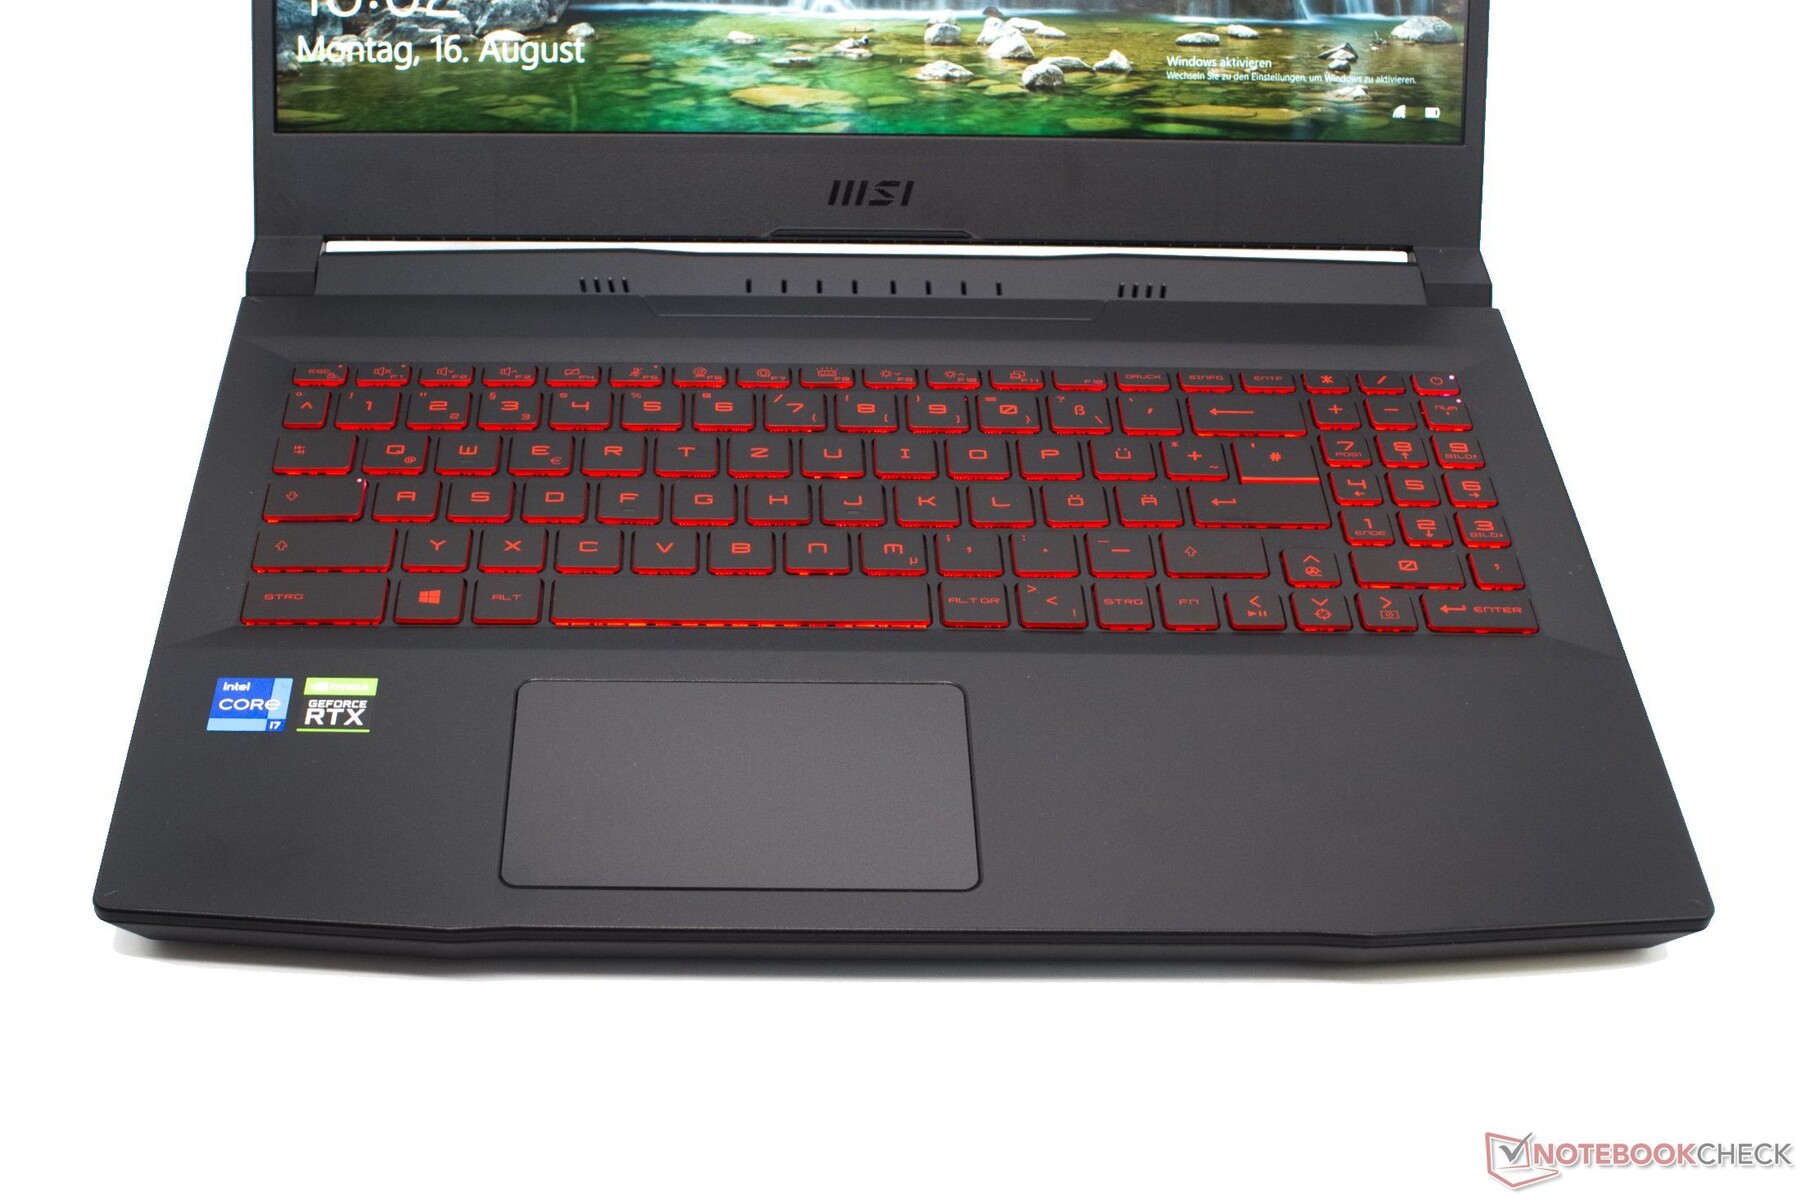
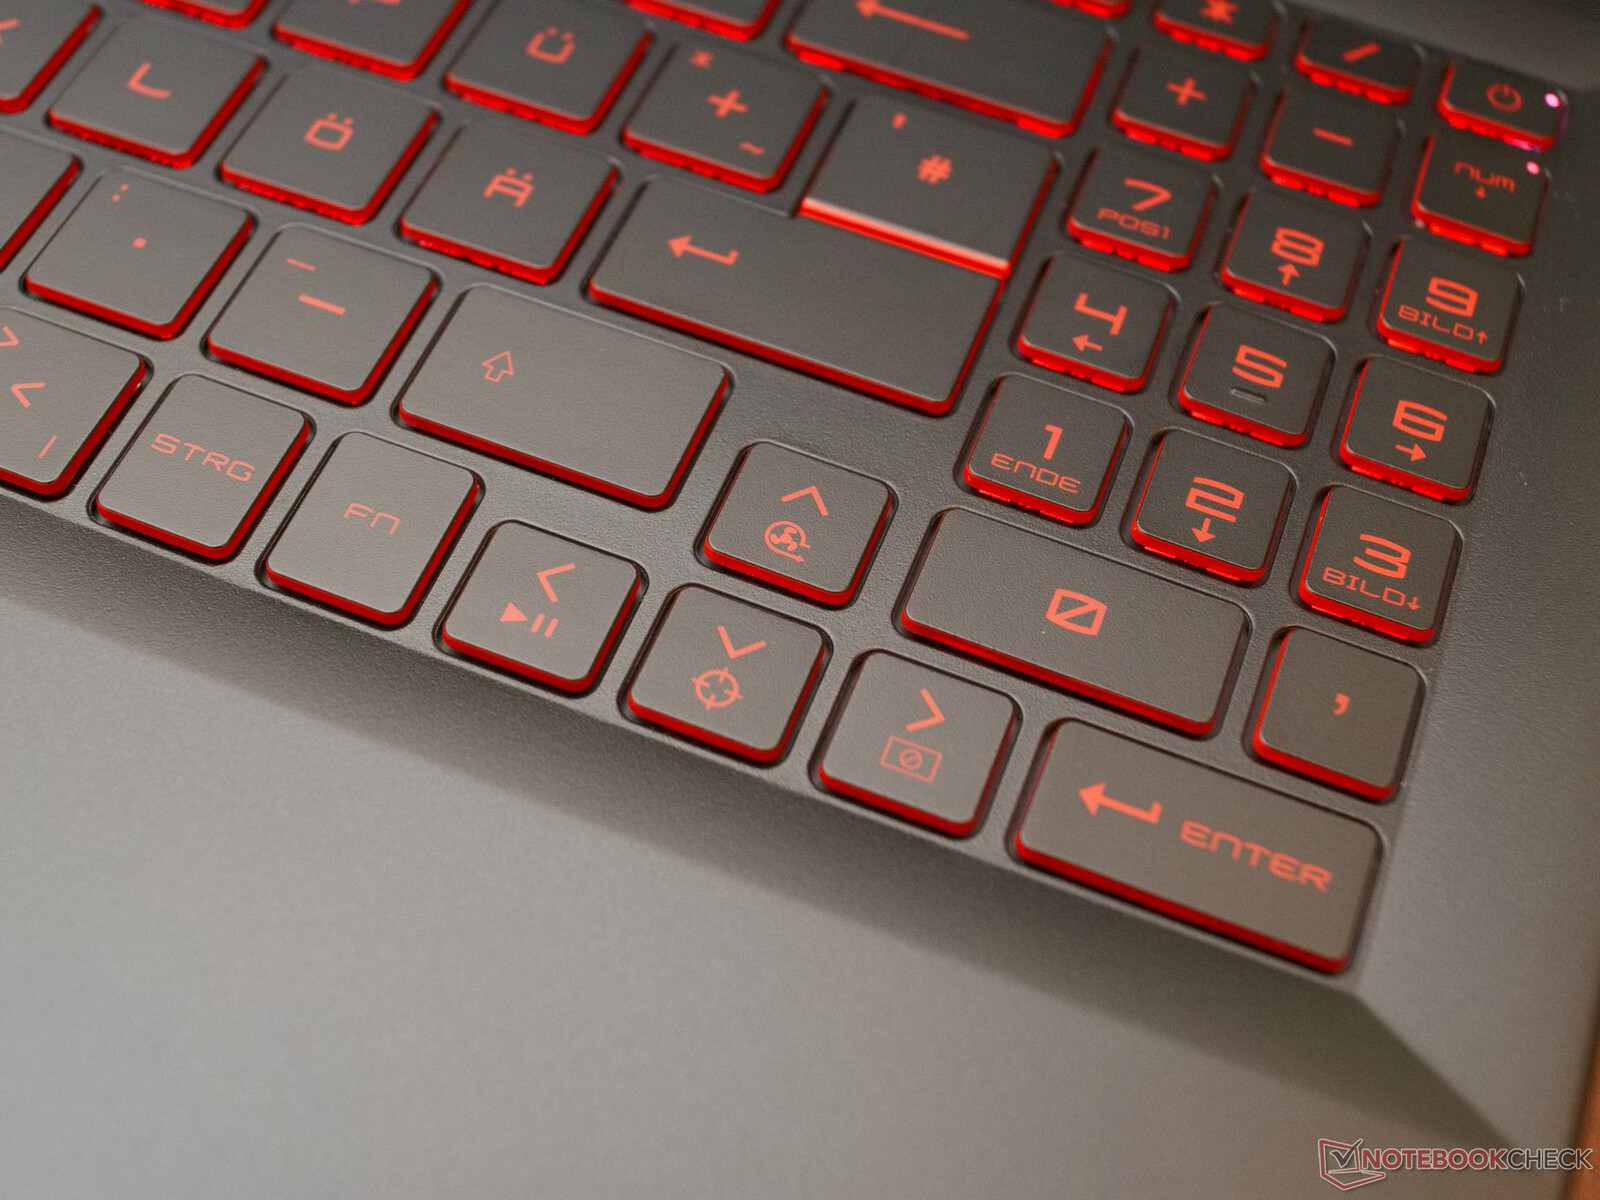
Input Devices - A full keyboard in red
Keyboard
The keyboard, which is illuminated in red, offers a full layout including a number block, although that turned out slightly smaller. The typing experience using the large keys feels comfortable. For a laptop keyboard, the keys offer a surprisingly high typing resistance with a clear pressure point. Even this keyboard can be pressed down with some strong pressure, however you have to use a considerable amount of force to be able to do this. A small blemish of the keyboard is the fact that the smooth surface will immediately show fingerprints.
The red background illumination can be adjusted in three steps. The red light does not create any glare in the eyes, regardless of the adjustment level.
Unfortunately, we were unable to find a driver for the function keys that would enable all the keys during the time of our test. The three key combinations with the F5, F6, and F7 keys did not offer any function.
Touchpad
With a size of 6.5 cm × 10.5 cm (~2.6 x 4.1 in), the touchpad turned out quite small. On the other hand, it is very responsive and does not show any weakness in the inputs.
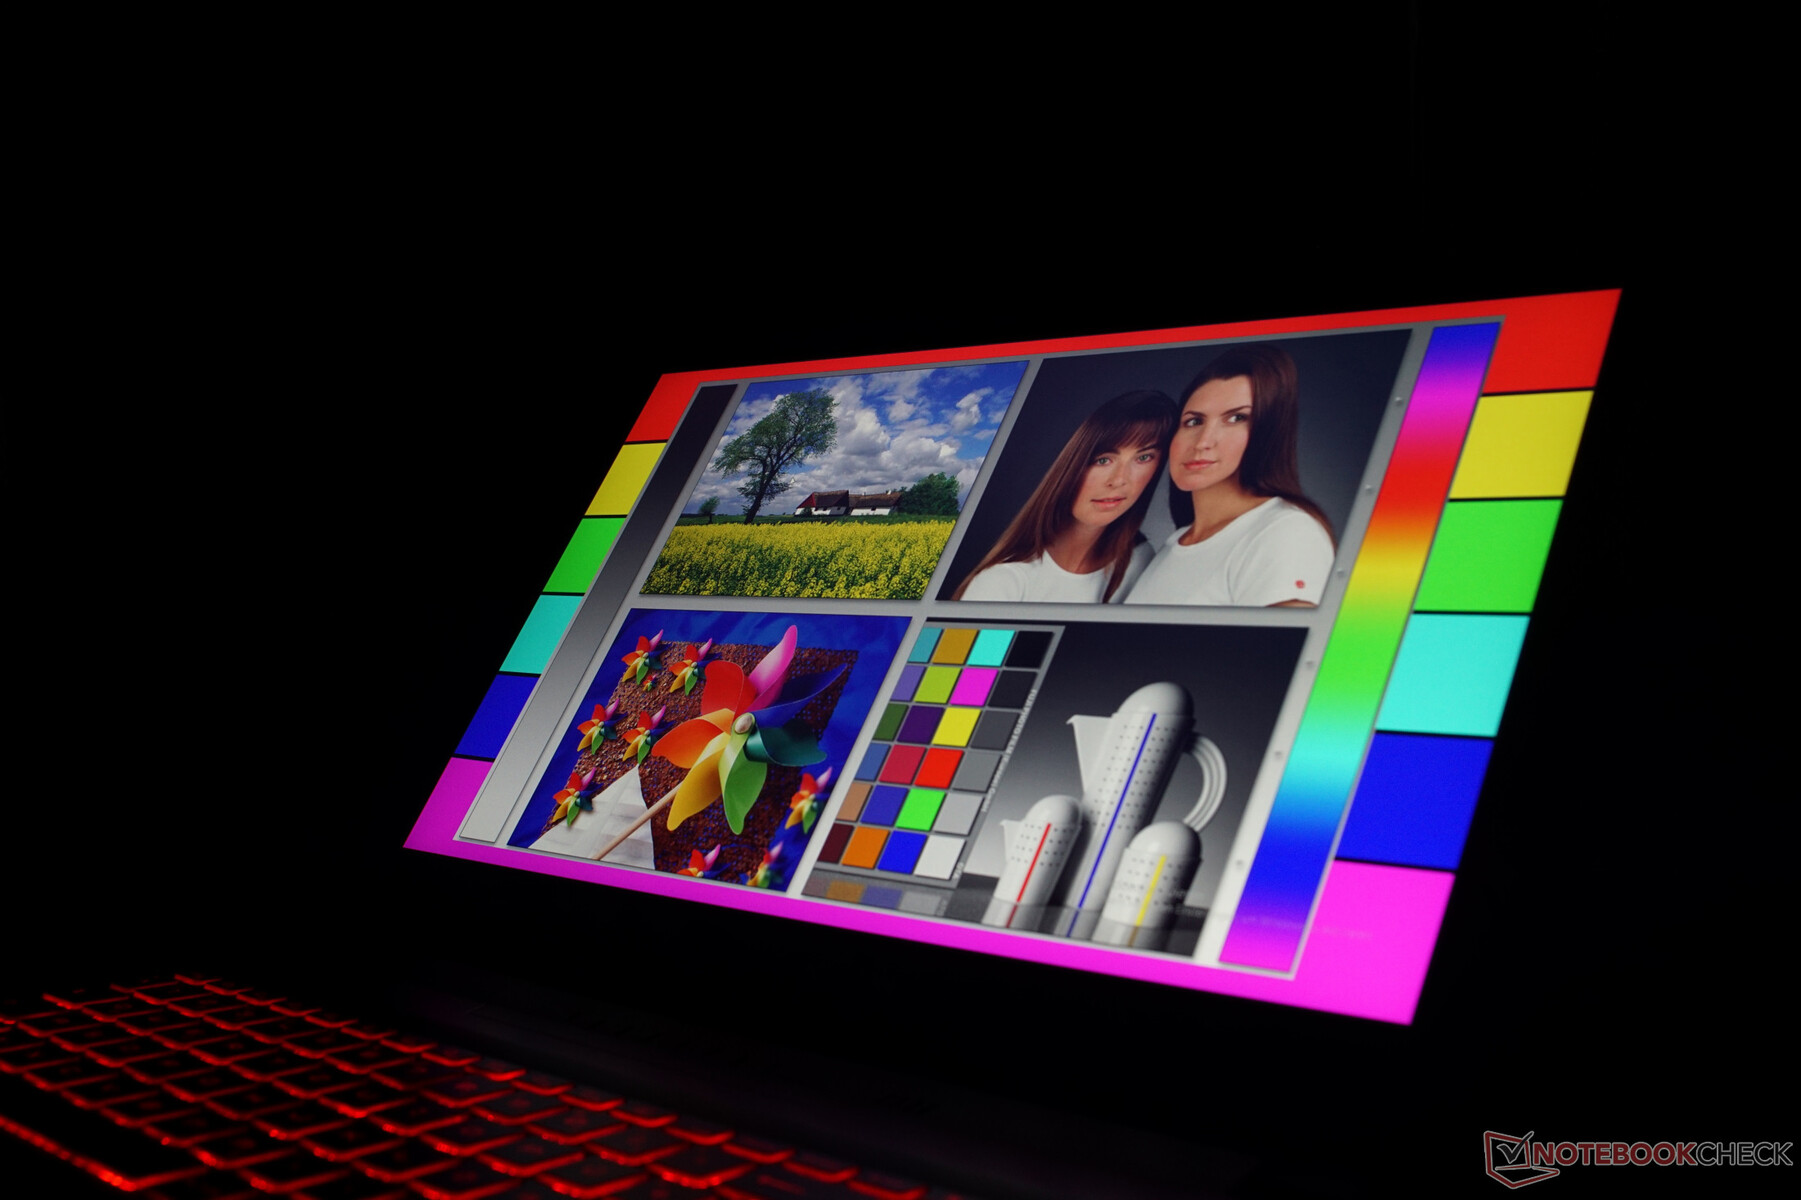
Display - 144 Hz does not ensure a good display
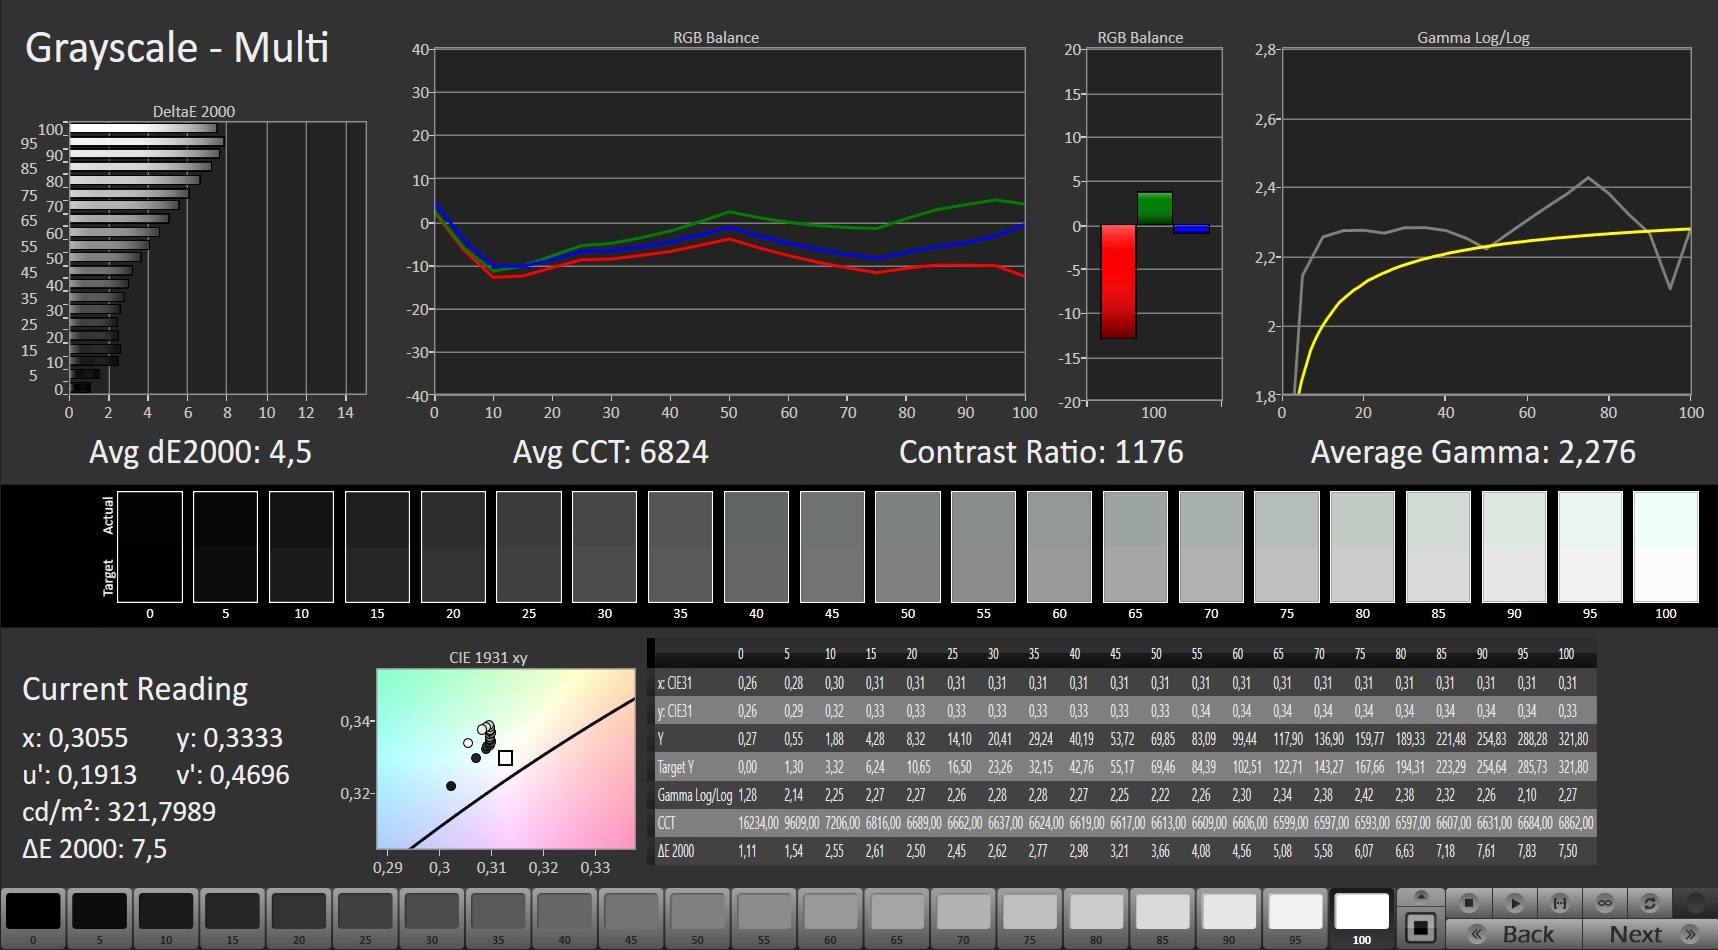
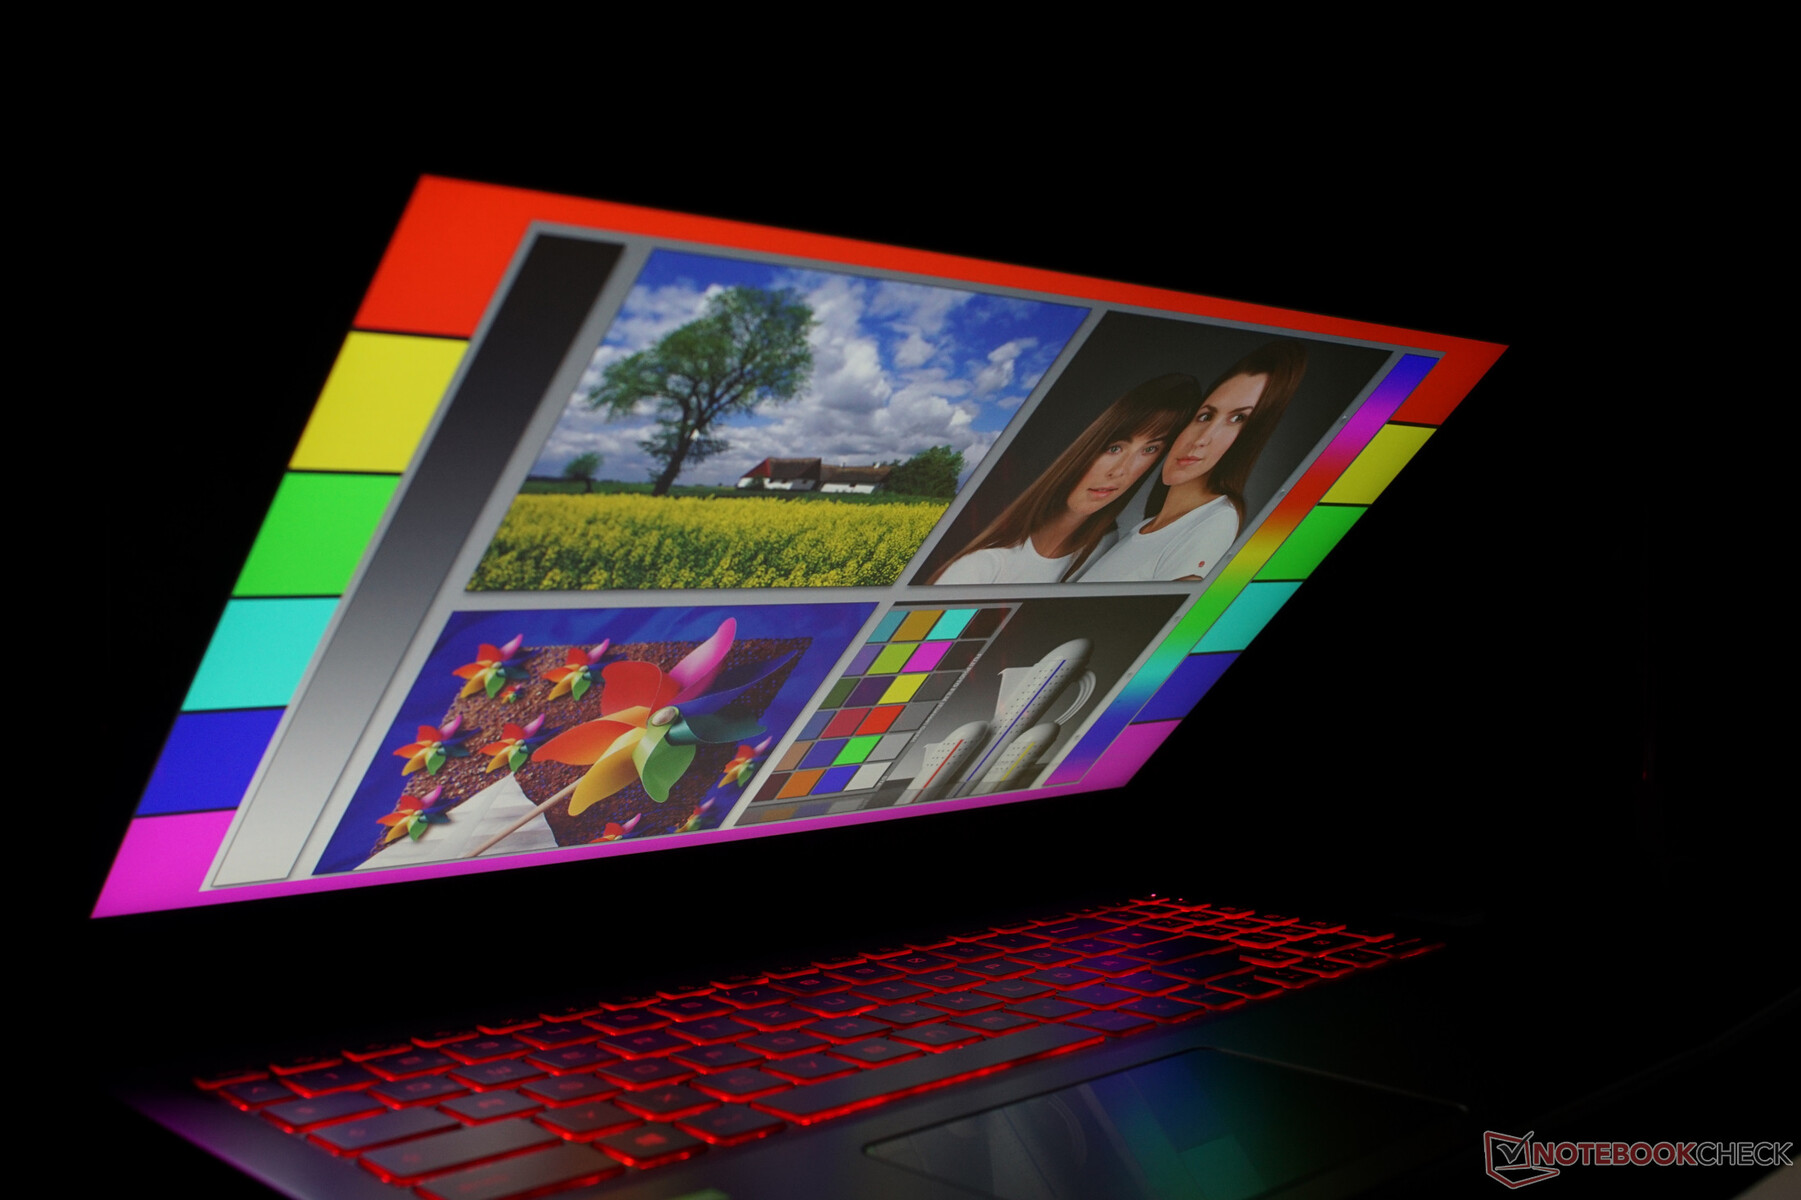
The matte 144-Hz display panel with a Full HD resolution shows quite good response times. And at 321 cd/m², the display is also fairly bright. However, larger halos can form in some image areas that are also clearly noticeable during some dark image sequences. In our test unit, the bright spots are concentrated on the right side of the display.
In terms of the display technology used, MSI specifies "Wide View (IPS Level)."

| |||||||||||||||||||||||||
Brightness Distribution: 83 %
Center on Battery: 307 cd/m²
Contrast: 1137:1 (Black: 0.27 cd/m²)
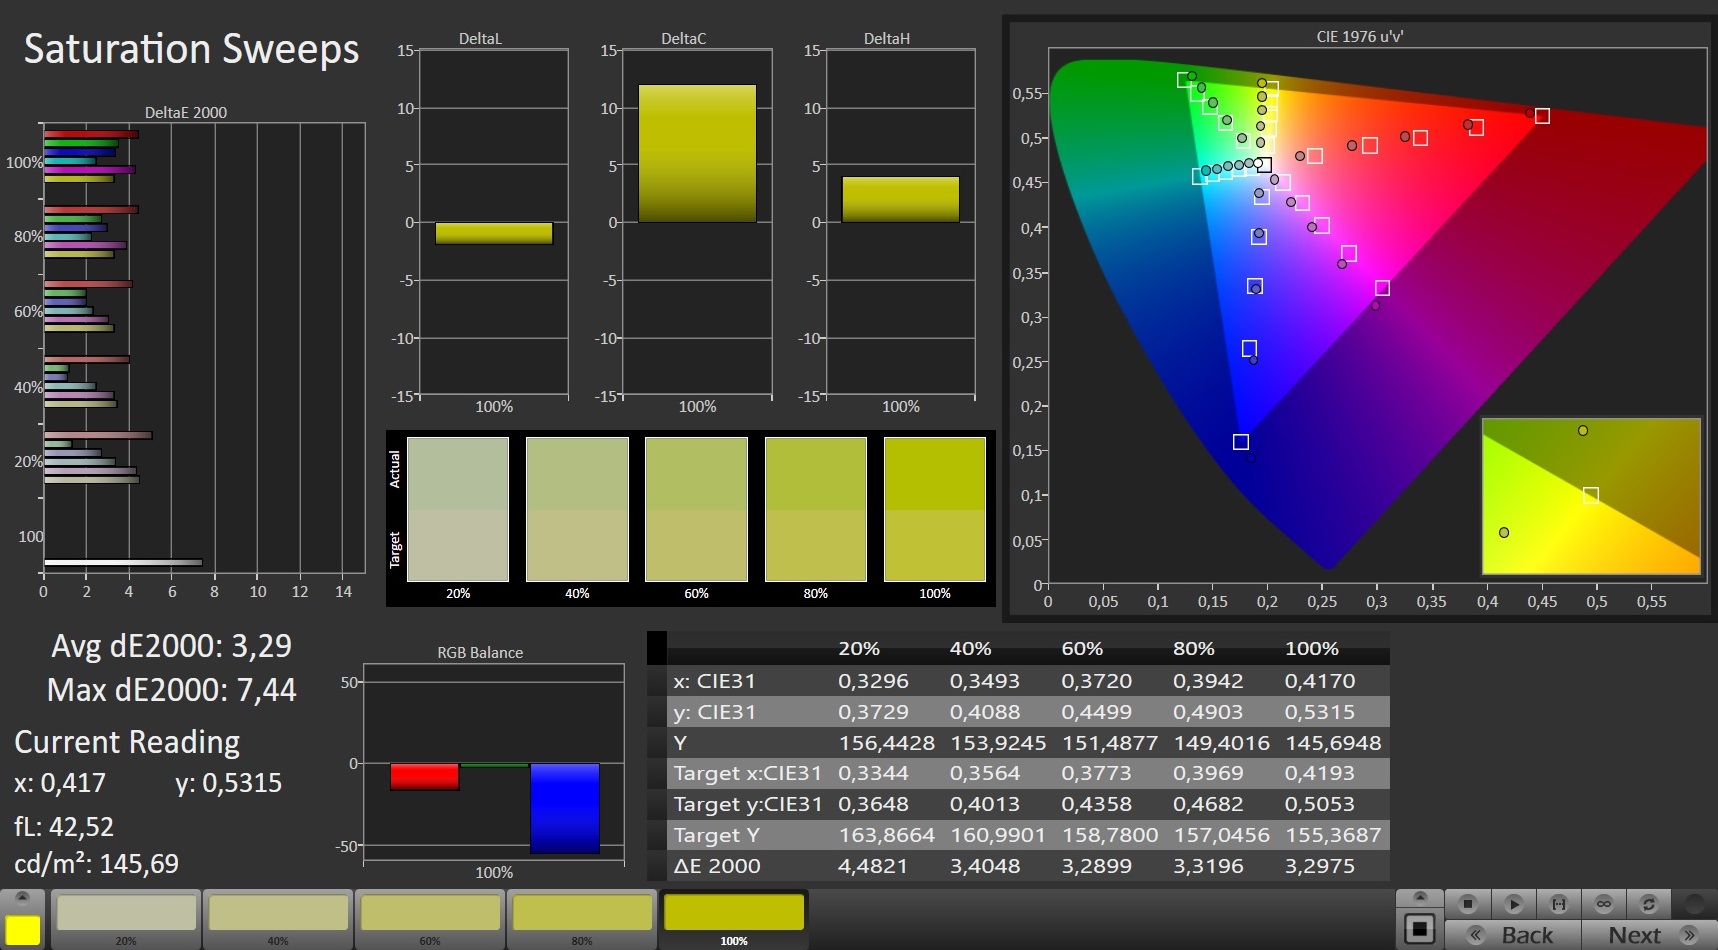
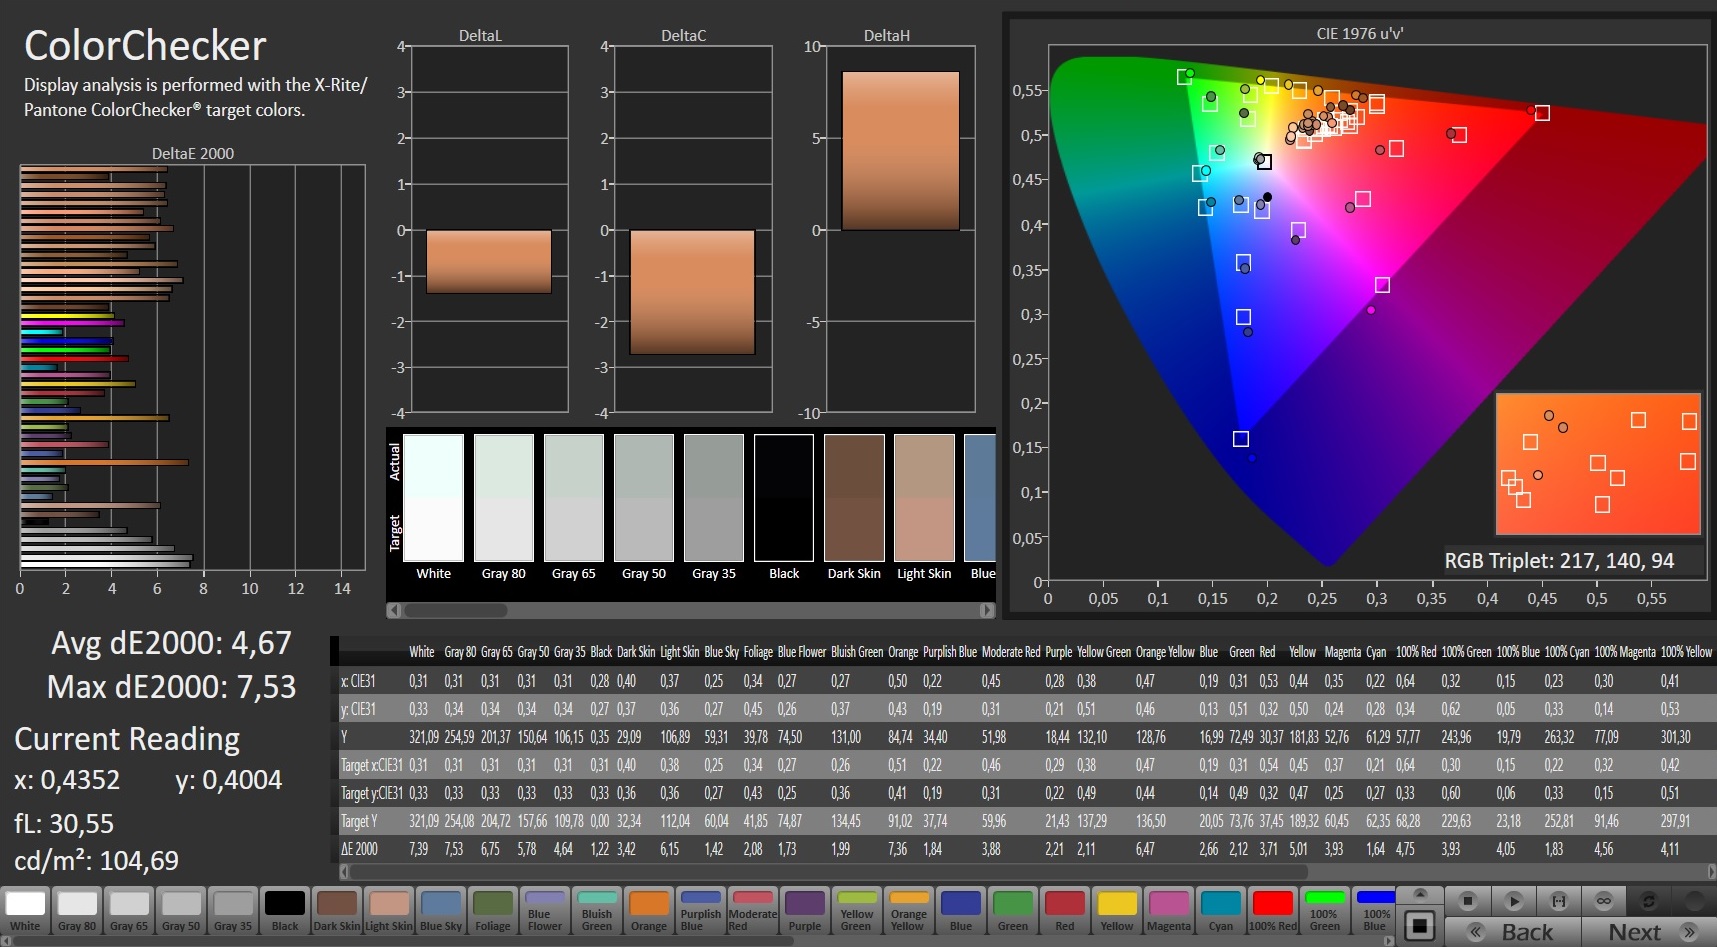
ΔE ColorChecker Calman: 4.67 | ∀{0.5-29.43 Ø4.81}
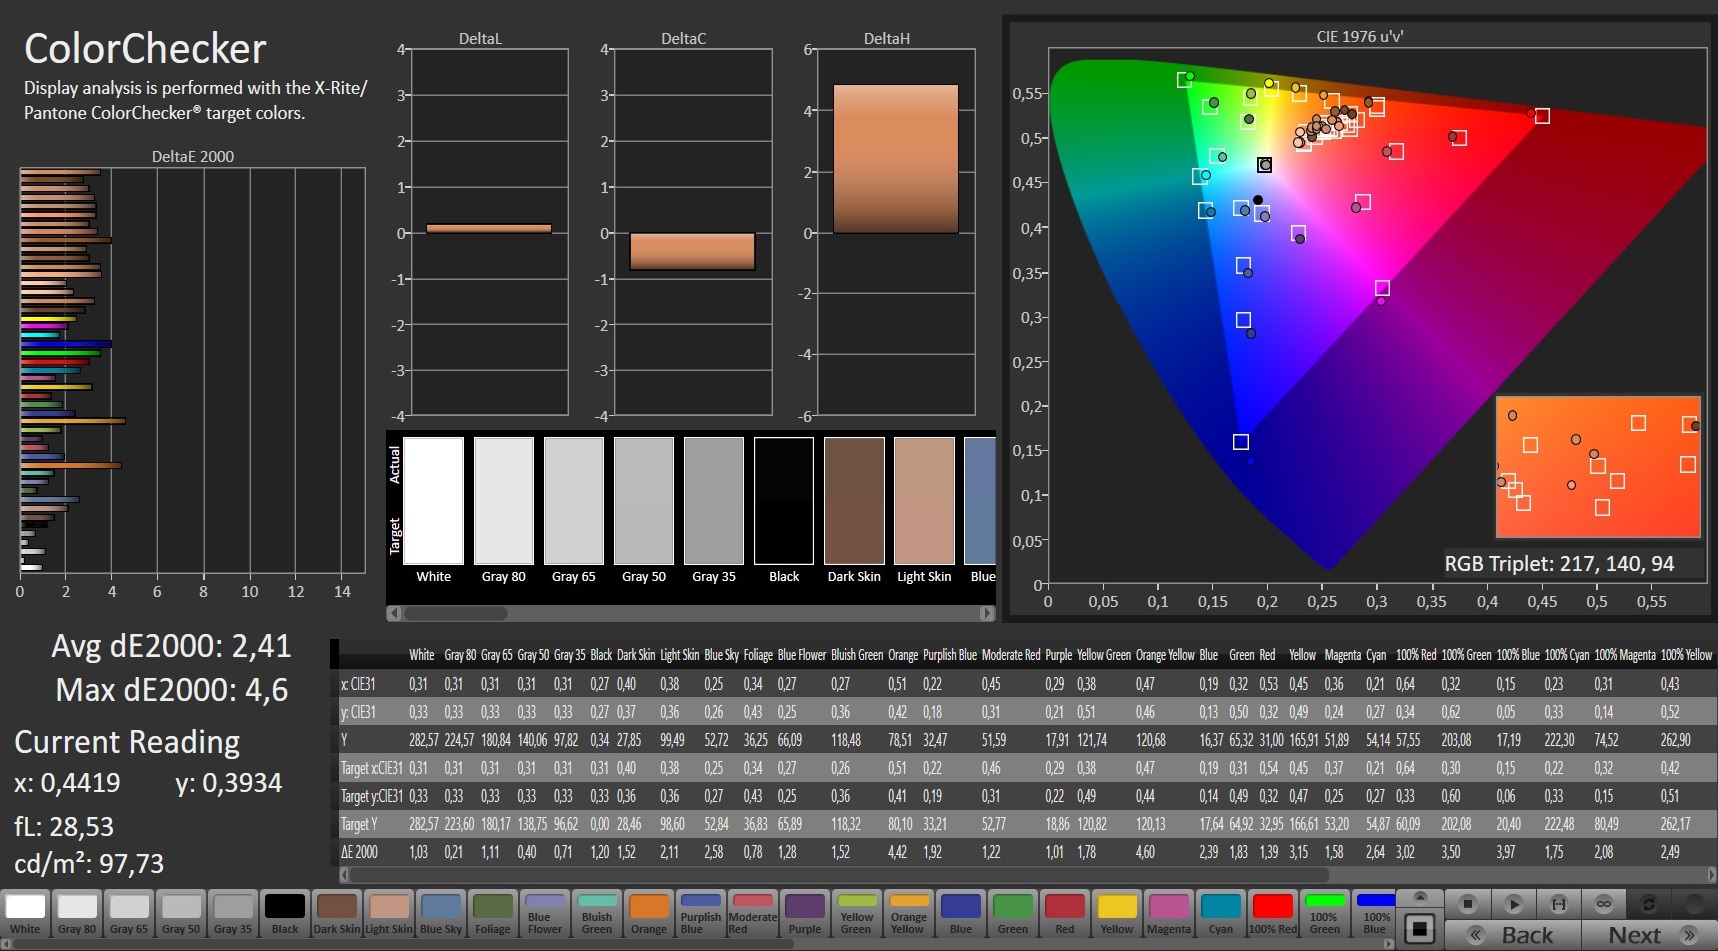
calibrated: 2.41
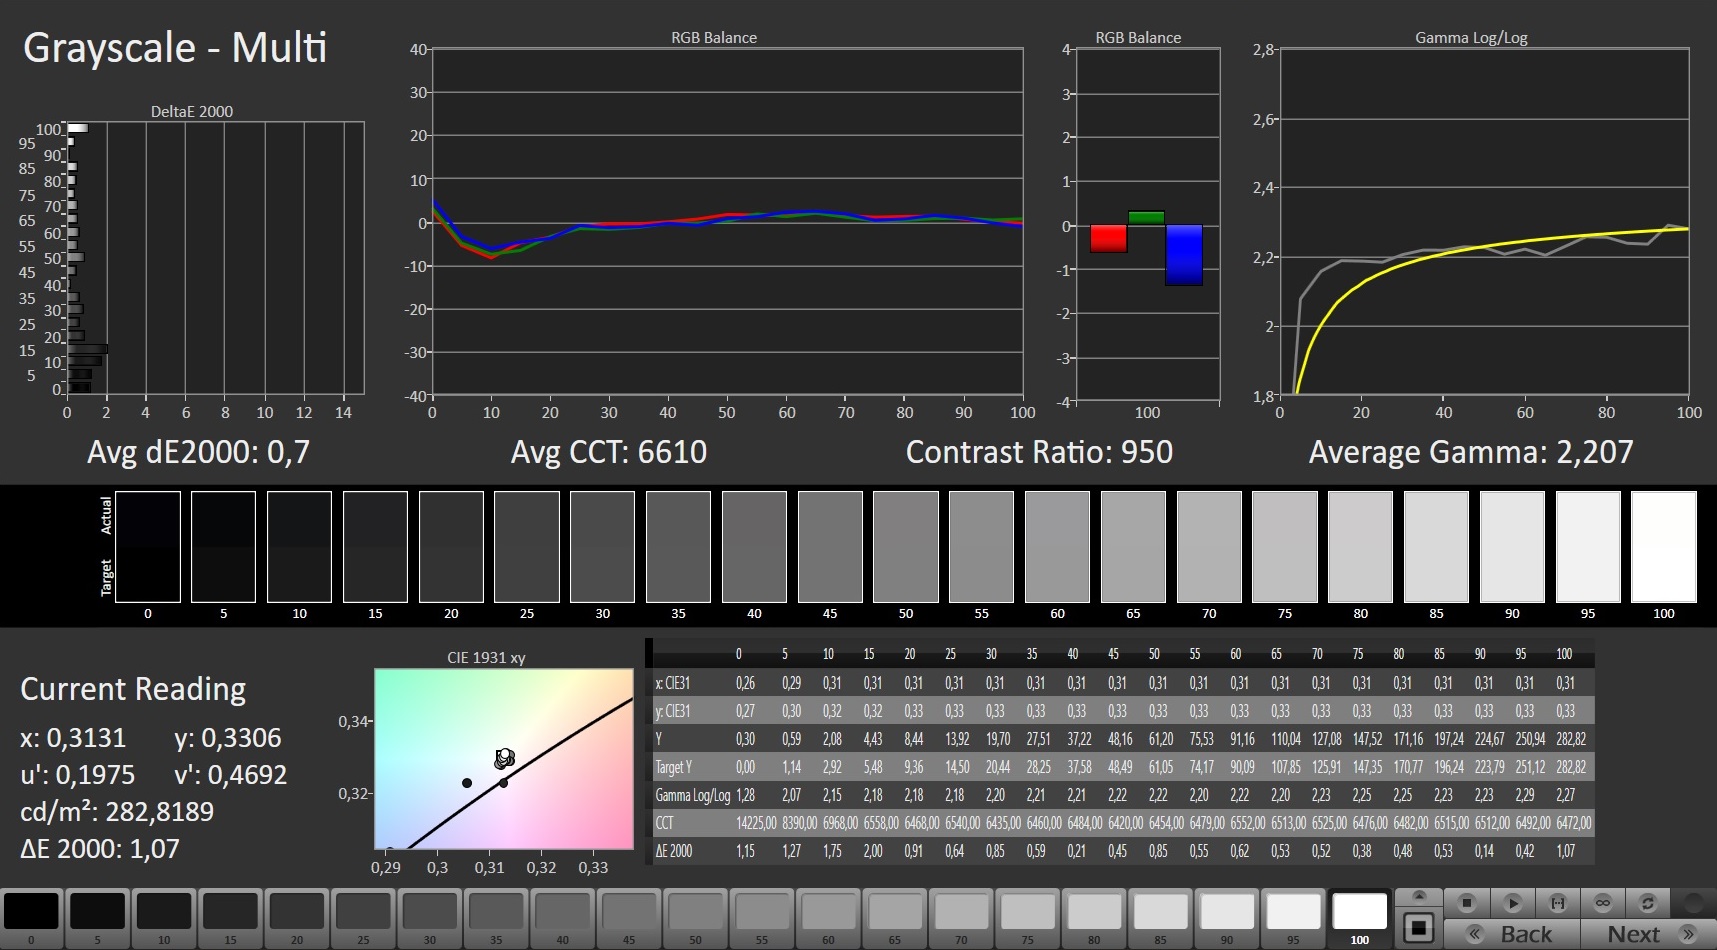
ΔE Greyscale Calman: 4.5 | ∀{0.09-98 Ø5.1}
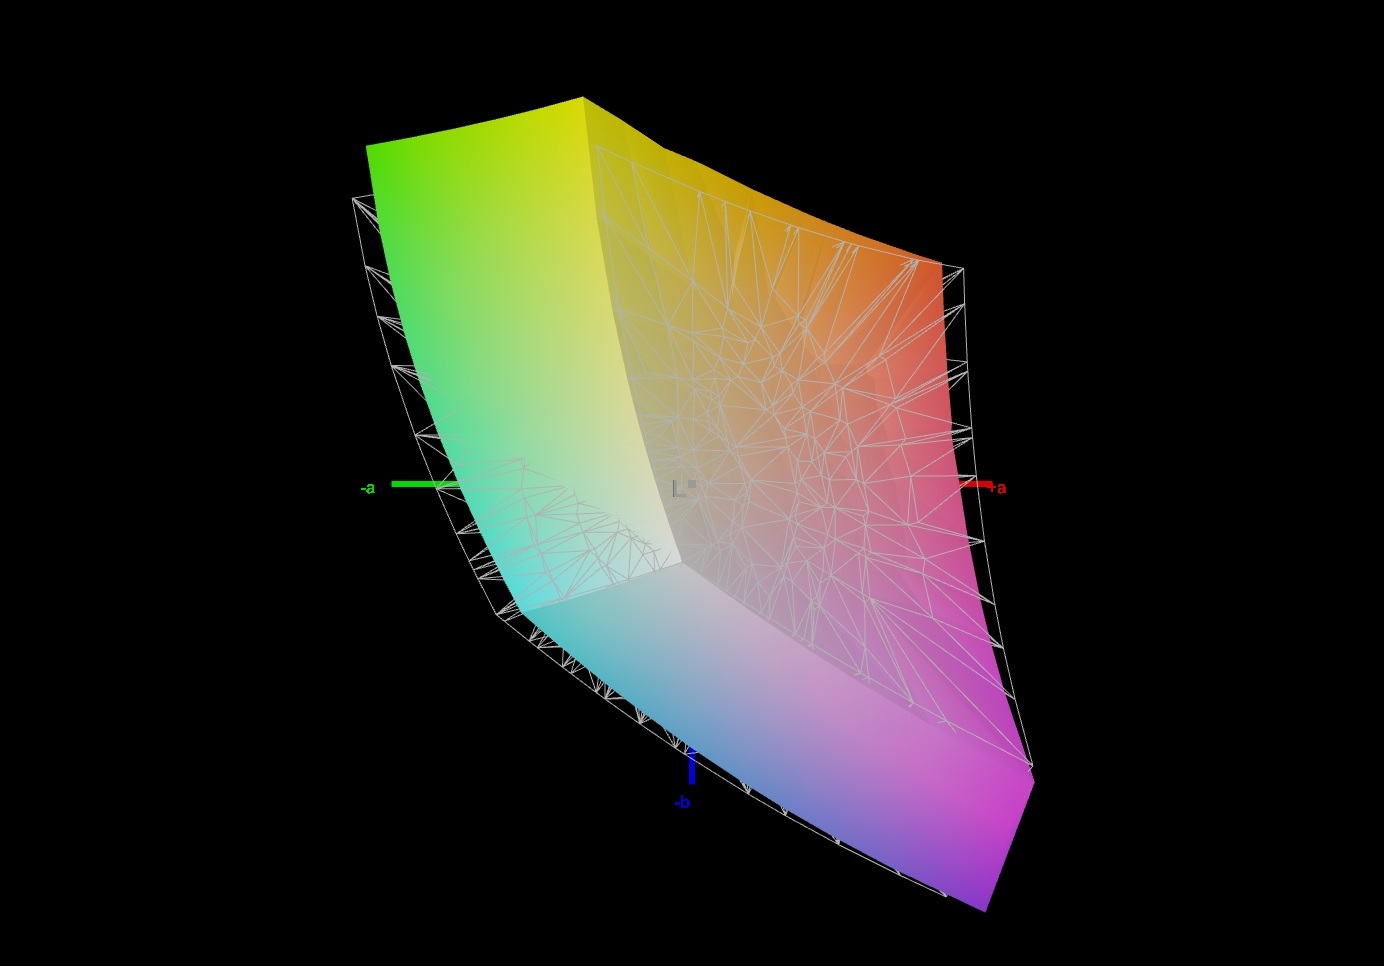
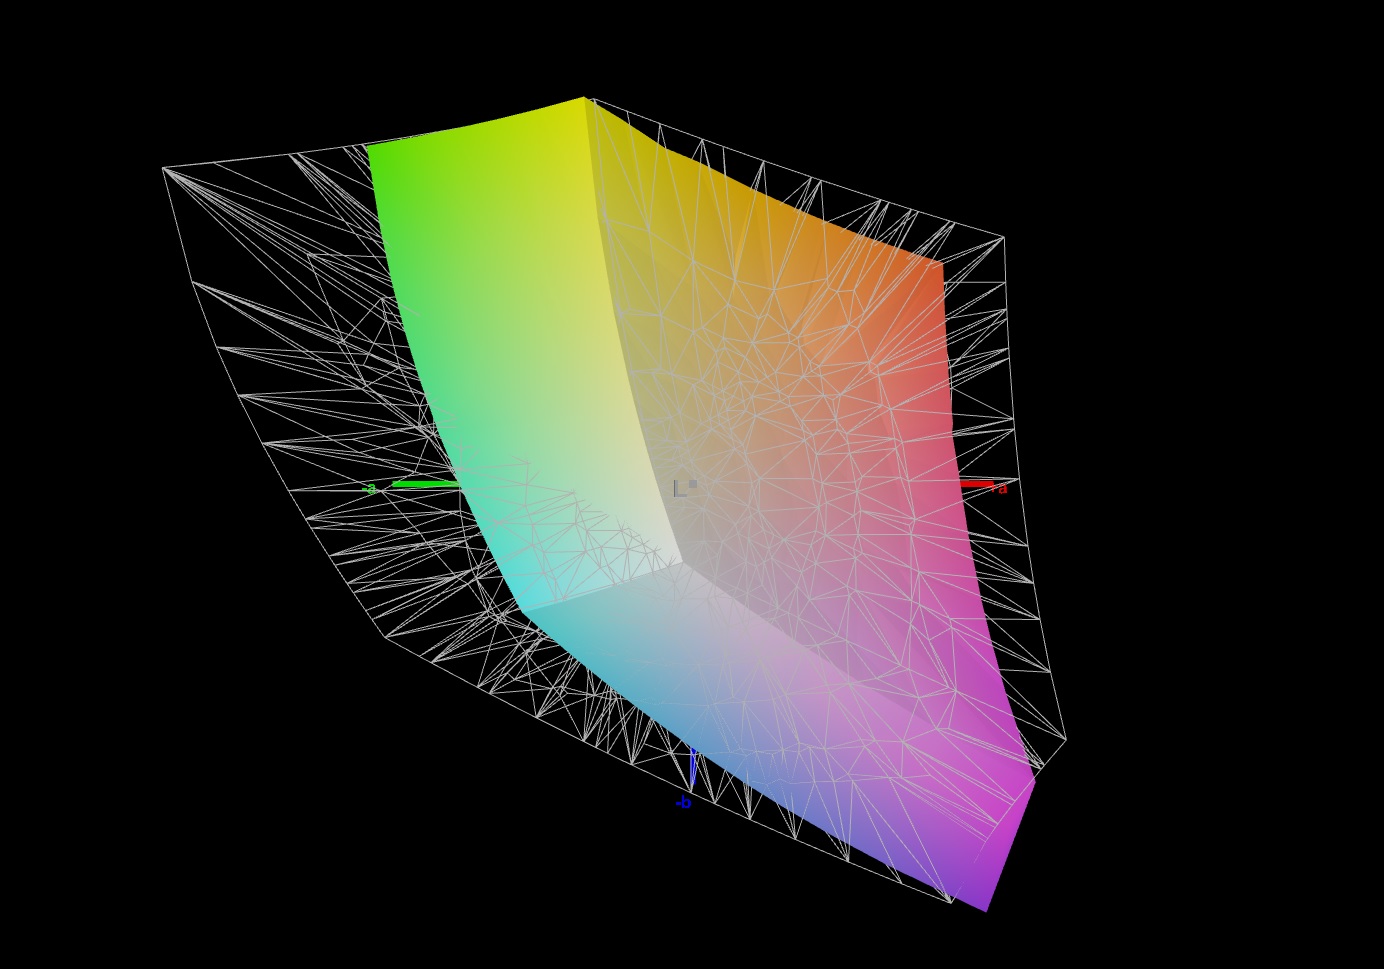
66.7% AdobeRGB 1998 (Argyll 3D)
91.3% sRGB (Argyll 3D)
65.4% Display P3 (Argyll 3D)
Gamma: 2.276
CCT: 6824 K
| MSI Katana GF66 11UG-220 AU Optronics B156HAN08.0, IPS, 1920x1080, 15.6" | Lenovo Legion 5 Pro 16ACH6H (82JQ001PGE) CSOT T3 MNG007DA1-1, IPS, 2560x1600, 16" | Gigabyte Aero 15 OLED XD Samsung SDC4143, OLED, 3840x2160, 15.6" | Asus TUF Dash F15 FX516PR LQ156M1JW26 (SHP1532), IPS, 1920x1080, 15.6" | Razer Blade 15 Advanced (Mid 2021) TL156VDXP02-0, IPS, 1920x1080, 15.6" | SCHENKER XMG Neo 15 Tiger Lake BOE CQ NE156QHM-NY2, IPS, 2560x1440, 15.6" | |
|---|---|---|---|---|---|---|
| Display | 9% | 37% | 4% | 4% | 6% | |
| Display P3 Coverage (%) | 65.4 | 99.9 53% | 66.9 2% | 66.9 2% | 68.6 5% | |
| sRGB Coverage (%) | 91.3 | 99 8% | 100 10% | 98.1 7% | 97.1 6% | 98.6 8% |
| AdobeRGB 1998 Coverage (%) | 66.7 | 73 9% | 99.5 49% | 67.9 2% | 69 3% | 69.3 4% |
| Response Times | 17% | 72% | -26% | 27% | -62% | |
| Response Time Grey 50% / Grey 80% * (ms) | 7.4 ? | 9.2 ? -24% | 2.8 ? 62% | 12 ? -62% | 4.2 ? 43% | 16 ? -116% |
| Response Time Black / White * (ms) | 11.2 ? | 4.8 57% | 2 ? 82% | 10 ? 11% | 10 ? 11% | 12 ? -7% |
| PWM Frequency (Hz) | 240 ? | 23580 ? | ||||
| Screen | 28% | 128% | 17% | 19% | 4% | |
| Brightness middle (cd/m²) | 307 | 551 79% | 440 43% | 286 -7% | 353.4 15% | 324 6% |
| Brightness (cd/m²) | 321 | 523 63% | 446 39% | 275 -14% | 340 6% | 307 -4% |
| Brightness Distribution (%) | 83 | 88 6% | 92 11% | 91 10% | 92 11% | 91 10% |
| Black Level * (cd/m²) | 0.27 | 0.54 -100% | 0.04 85% | 0.25 7% | 0.31 -15% | 0.27 -0% |
| Contrast (:1) | 1137 | 1020 -10% | 11000 867% | 1144 1% | 1140 0% | 1200 6% |
| Colorchecker dE 2000 * | 4.67 | 1.8 61% | 2.53 46% | 2.43 48% | 2.17 54% | 3.36 28% |
| Colorchecker dE 2000 max. * | 7.53 | 2.53 66% | 7.82 -4% | 6.33 16% | 5.69 24% | 9.87 -31% |
| Colorchecker dE 2000 calibrated * | 2.41 | 1.66 31% | 2.57 -7% | 0.83 66% | 1.05 56% | 1.23 49% |
| Greyscale dE 2000 * | 4.5 | 1.85 59% | 1.2 73% | 3.5 22% | 3.4 24% | 5.8 -29% |
| Gamma | 2.276 97% | 2.3 96% | 2.206 100% | 2.32 95% | 2.2 100% | 2.311 95% |
| CCT | 6824 95% | 6338 103% | 6371 102% | 7145 91% | 6830 95% | 7087 92% |
| Color Space (Percent of AdobeRGB 1998) (%) | 72.81 | 68 | 69 | |||
| Color Space (Percent of sRGB) (%) | 99.41 | 91 | 93 | |||
| Total Average (Program / Settings) | 18% /
23% | 79% /
101% | -2% /
8% | 17% /
17% | -17% /
-5% |
* ... smaller is better
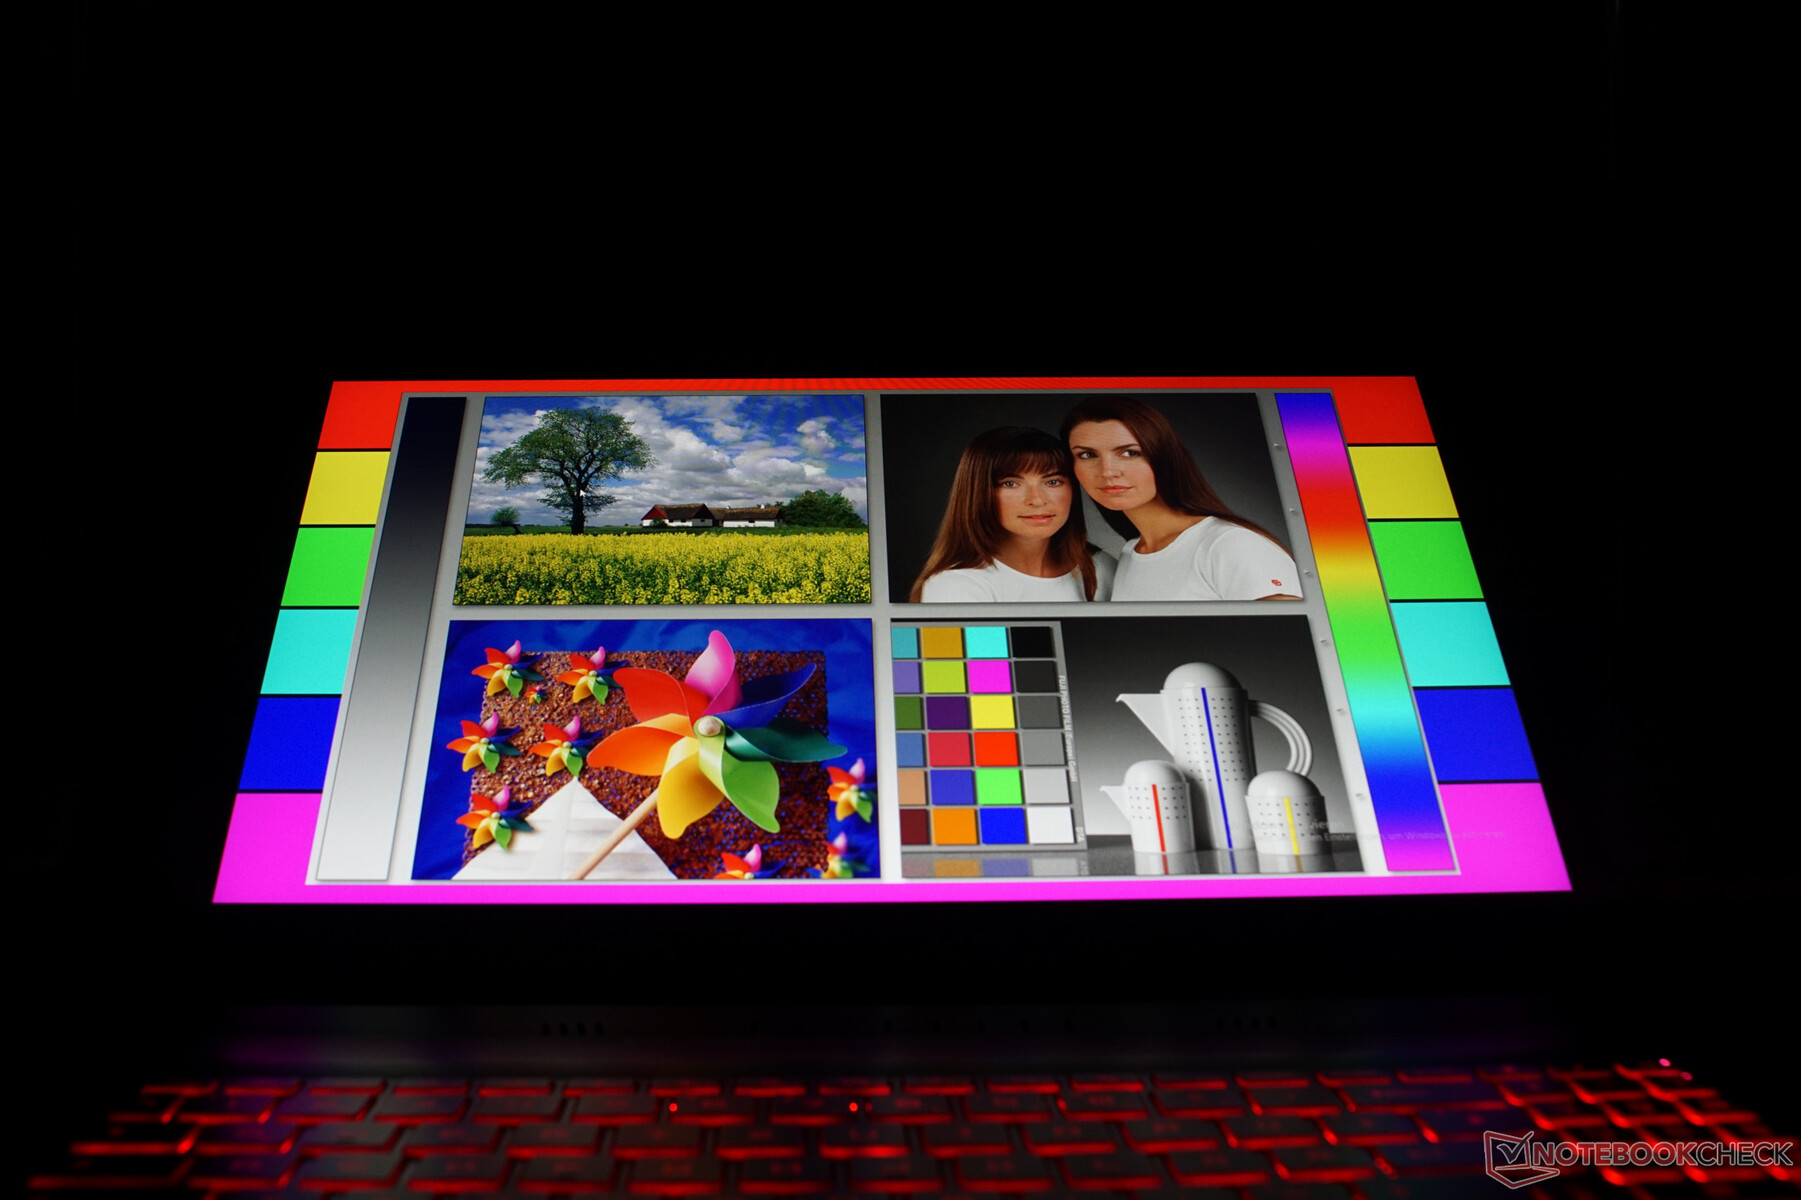
The contrast ratio of the MSI laptop is fairly high, but some halos are noticeable in certain scenes. Only by reducing the display brightness by about 20%, these brighter areas won't be as noticeable in dark sequences anymore. Then the display is able to convince with a saturated black. While a 91.3% coverage of the sRGB color space isn't bad, considering that this is a gaming laptop, it could have been a bit more. You should also use a color profile under Windows. The average color deviation of the display could be reduced significantly by using our ICC file, which you can download from the link in the info box. Once it is calibrated, the display produces a fairly good image.

Outdoor Usage
The matte display of the Katana GF66 can be easily read outdoors. There are hardly any reflections on the surface. The bright display is only overwhelmed by direct sun light.
Display Response Times
| ↔ Response Time Black to White | ||
|---|---|---|
| 11.2 ms ... rise ↗ and fall ↘ combined | ↗ 6 ms rise | 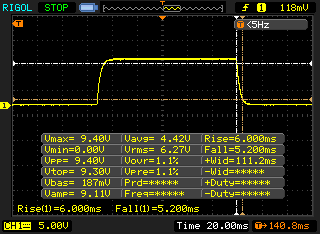 |
| ↘ 5.2 ms fall | ||
| The screen shows good response rates in our tests, but may be too slow for competitive gamers. In comparison, all tested devices range from 0.1 (minimum) to 240 (maximum) ms. » 29 % of all devices are better. This means that the measured response time is better than the average of all tested devices (20.4 ms). | ||
| ↔ Response Time 50% Grey to 80% Grey | ||
| 7.4 ms ... rise ↗ and fall ↘ combined | ↗ 3.8 ms rise | 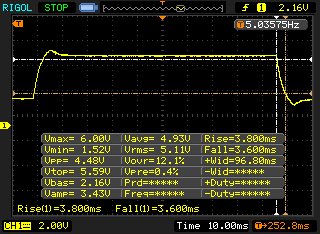 |
| ↘ 3.6 ms fall | ||
| The screen shows very fast response rates in our tests and should be very well suited for fast-paced gaming. In comparison, all tested devices range from 0.165 (minimum) to 636 (maximum) ms. » 18 % of all devices are better. This means that the measured response time is better than the average of all tested devices (31.9 ms). | ||
Screen Flickering / PWM (Pulse-Width Modulation)
| Screen flickering / PWM not detected | 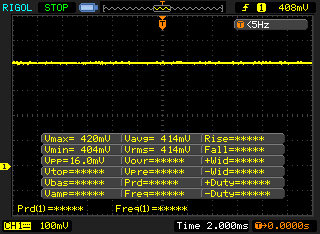 | ||
In comparison: 53 % of all tested devices do not use PWM to dim the display. If PWM was detected, an average of 8249 (minimum: 5 - maximum: 343500) Hz was measured. | |||
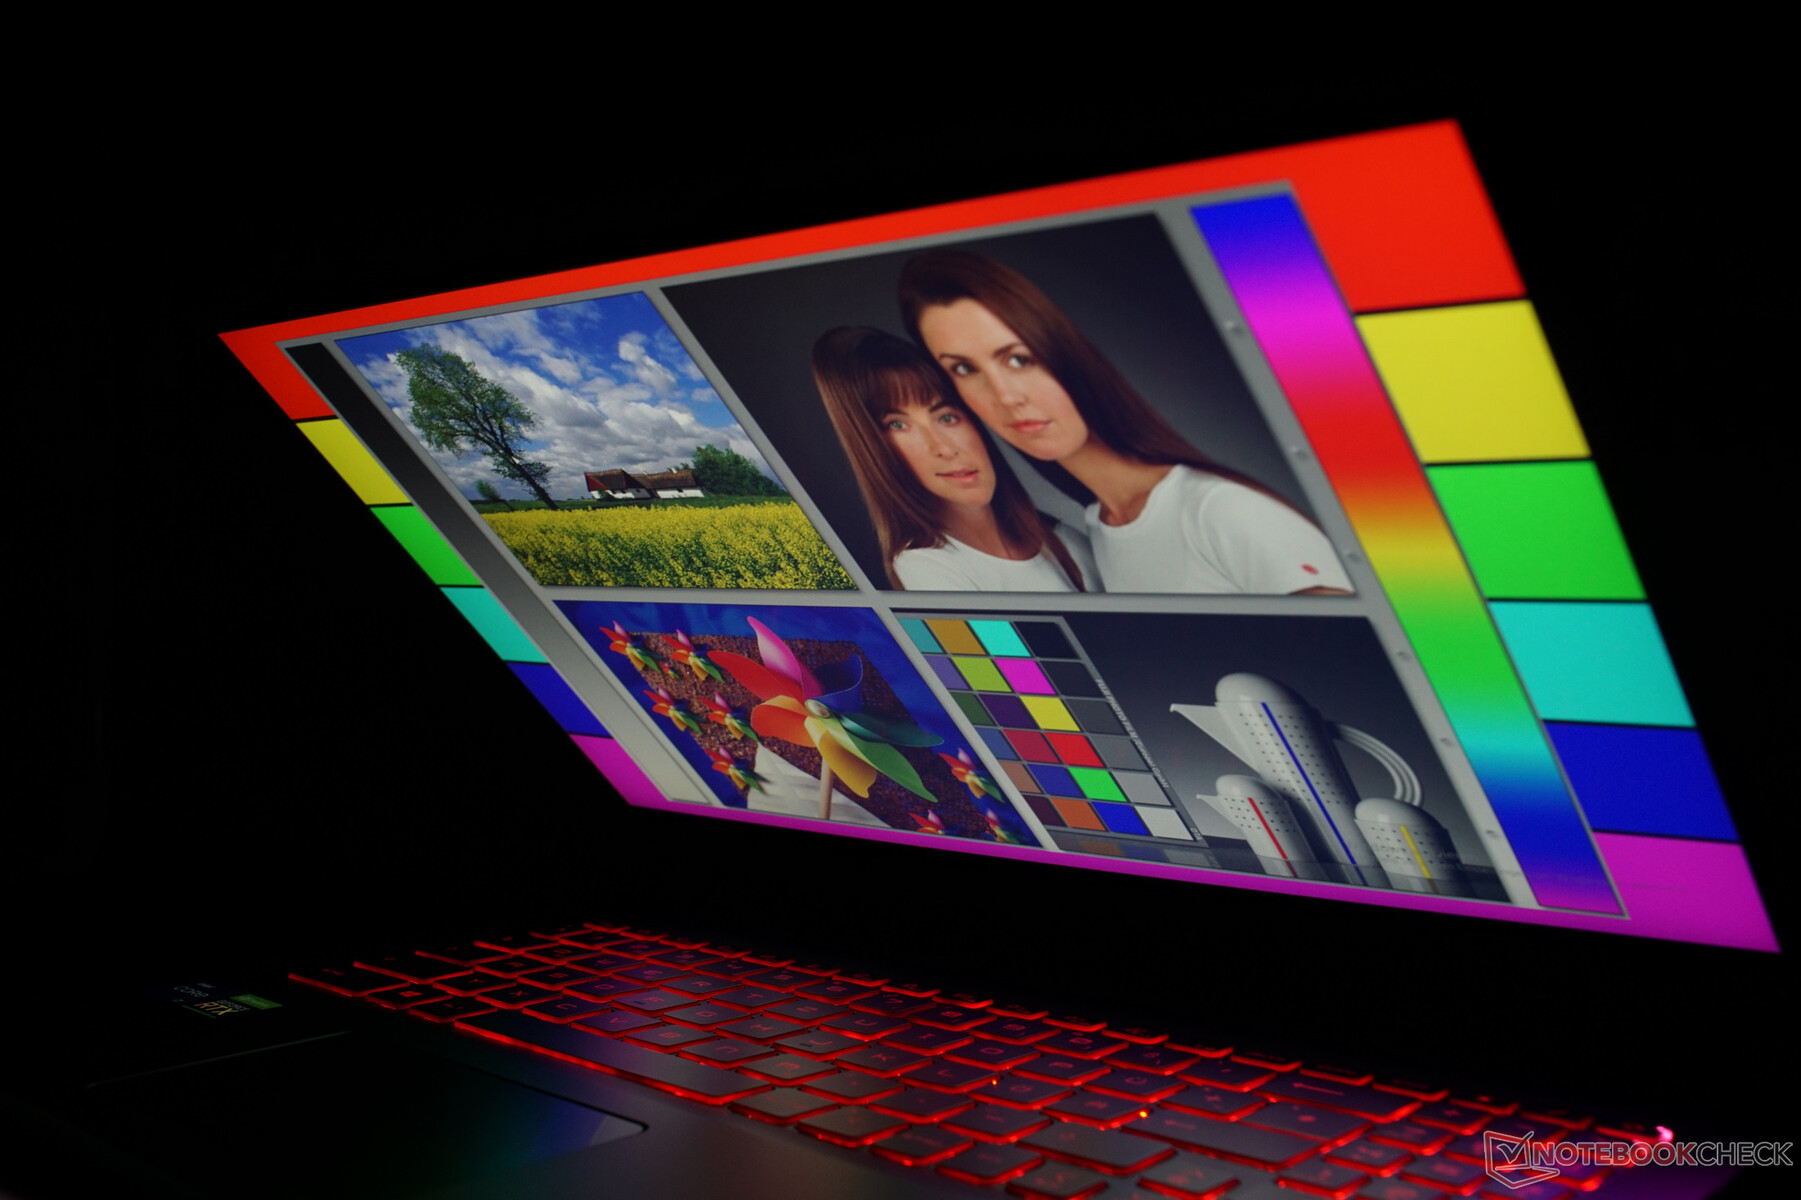
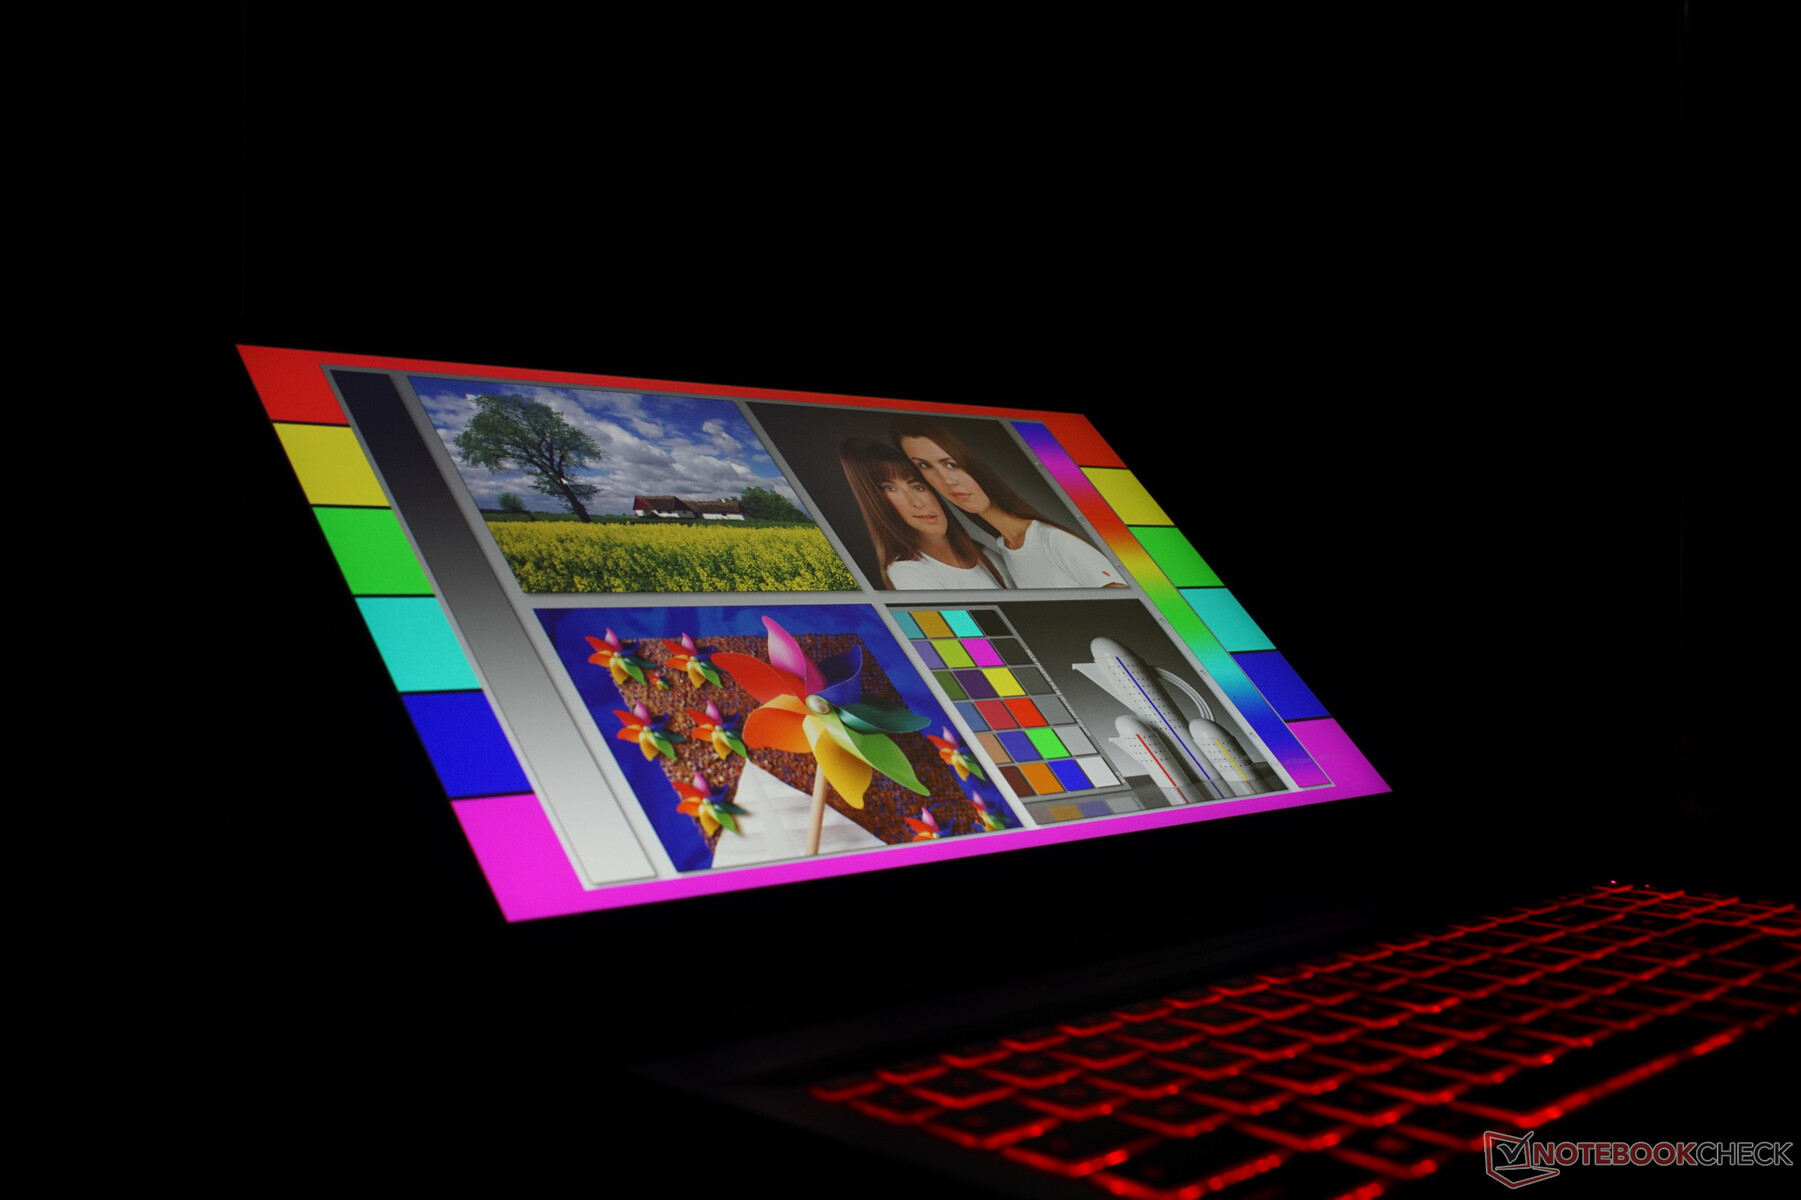
The color reproduction of the display is stable from all viewing angles, and the only noticeable differences are in the brightness.

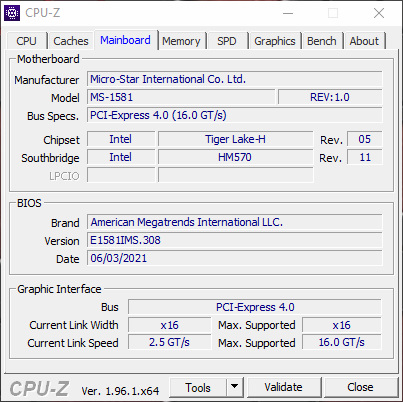
Performance - Intel comes within striking distance of AMD
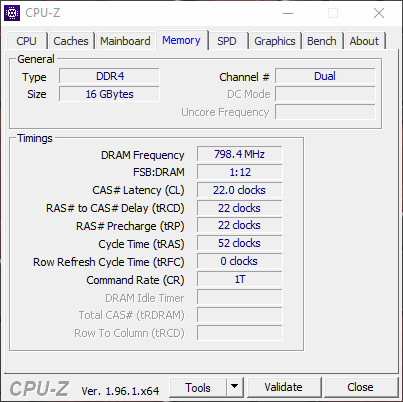
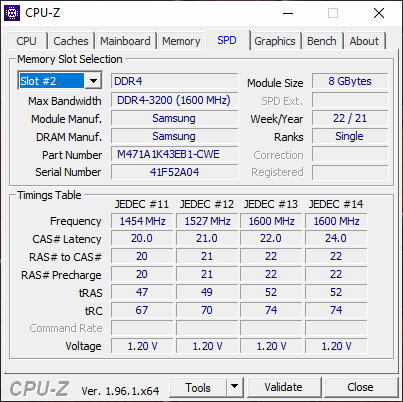
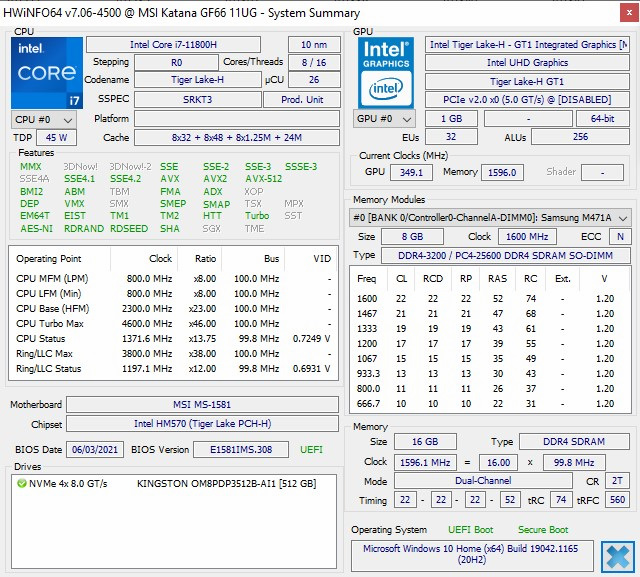
MSI offers a large variety of configuration options for the Katana GF66. Our test unit is equipped with an Intel Core i7-11800H processor, an NVIDIA®GeForce RTX 3070 Laptop GPU, 16 GB of DDR4-3200 RAM, and a 512-GB NVMe SSD. In addition, our laptop offers the option to expand the storage. The manufacturer's website also shows many other configurations with RTX 3050, 3060, and 3070 graphics cards, as well as i5 and i7 processors with 8 or 16 GB of working memory. The configuration options also include an available M.2 slot. In addition, the gaming laptop is available with or without Microsoft Windows 10.
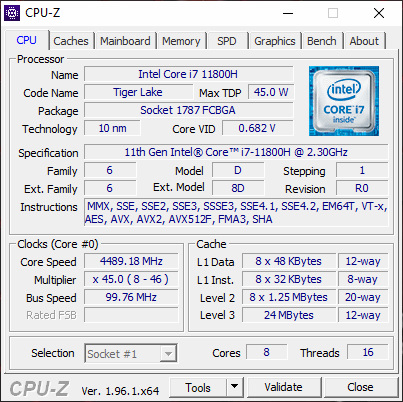
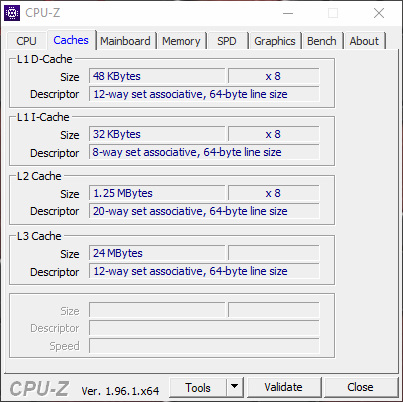

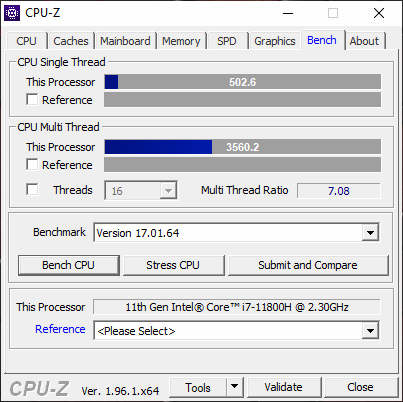
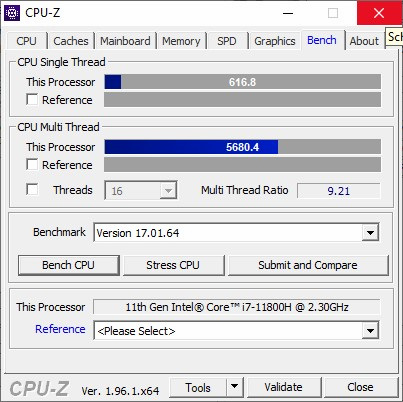
Processor
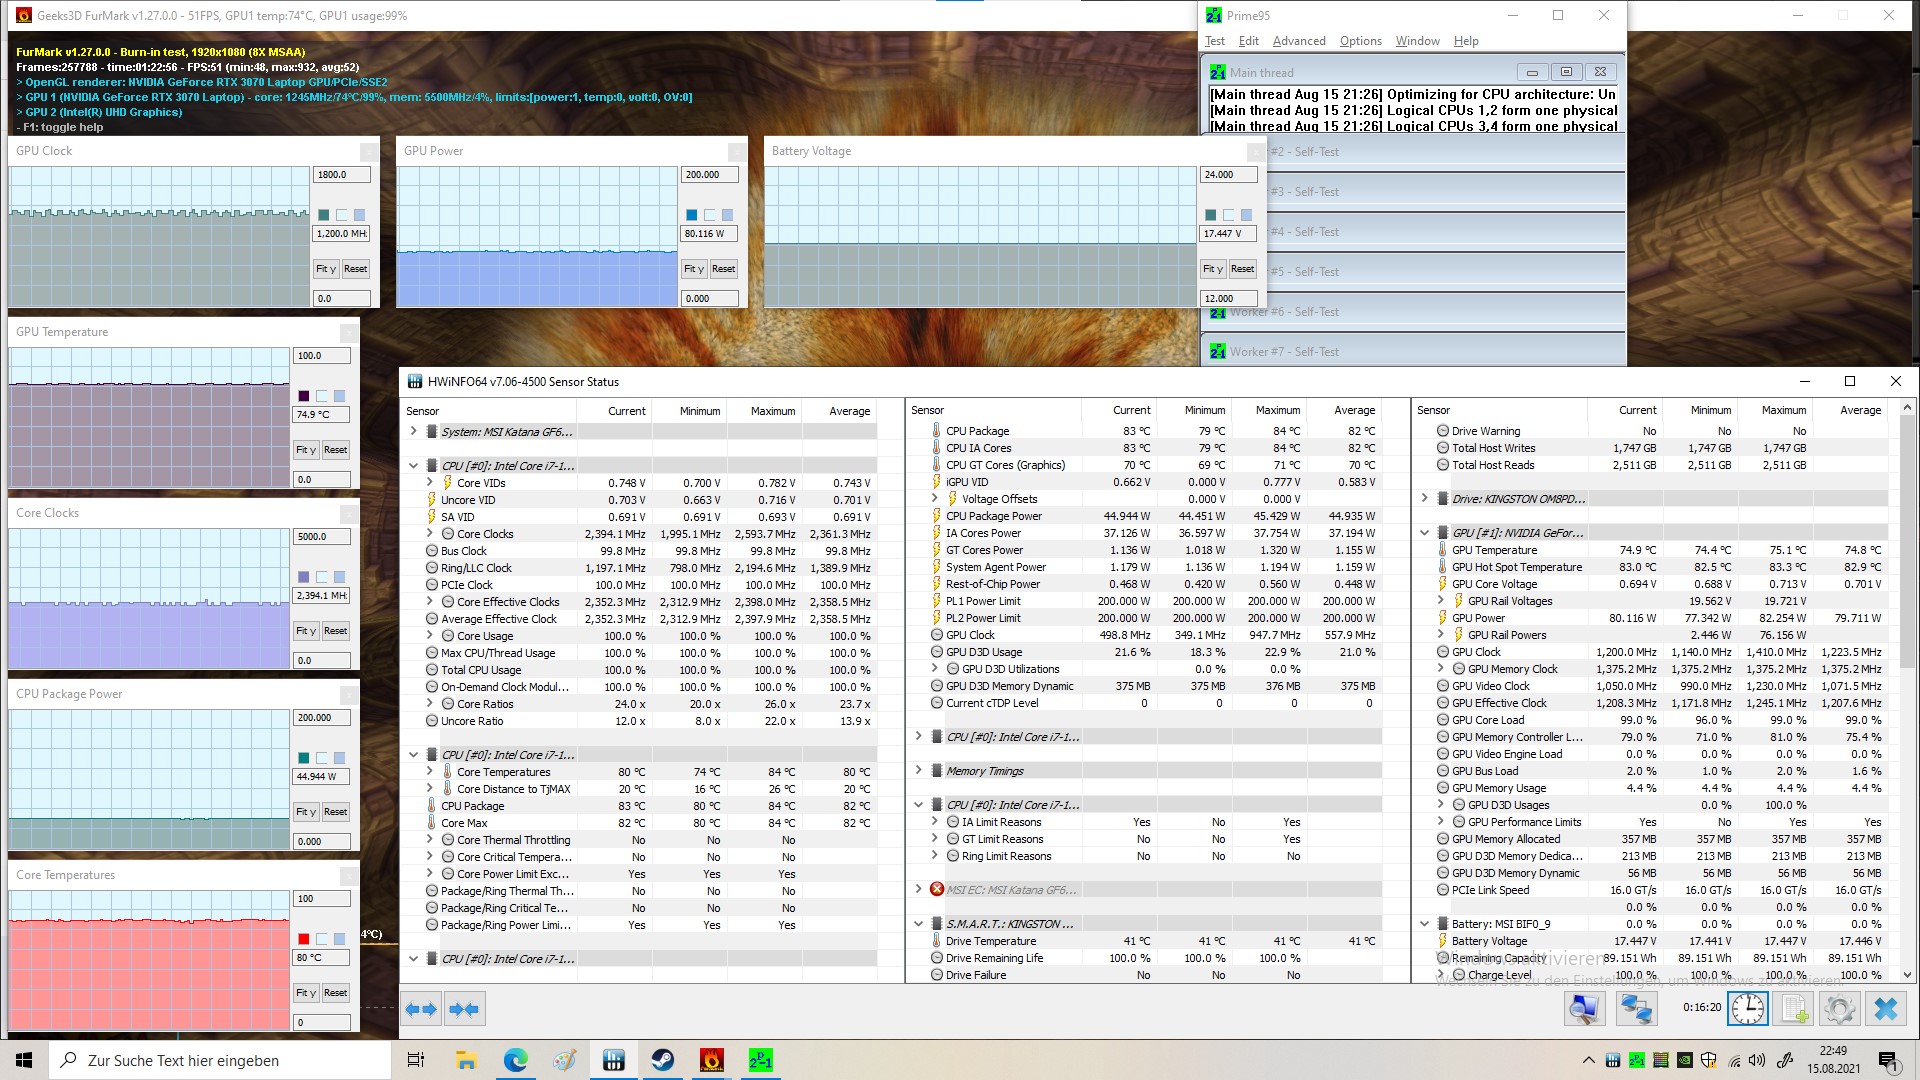
The Intel Core i7-11800H is a powerful SoC processor for power-hungry devices that is based on the Tiger Lake architecture. In the GF66, the processor briefly reaches a clock speed of up to 4.6 GHz. The TDP is unlocked, so that the Intel Core i7 is only limited by the current temperature. However, the available options to dissipate the heat limit the performance of the laptop in the long run, even if the fans are adjusted via the [FN]+[↑] key combination to run constantly at the highest speed. The fans won't run at their full speed by themselves. In the 30-minute Cinebench loop, the power consumption of the single runs was at about 74 watts. We can also see a considerable difference here, if we don't fix the fans at full speed, since the average points will then drop from 1900 to 1316. The 11th generation of Intel's laptop processors can come significantly closer to the performance of the current AMD laptop processors. In the Multicore mode of Cinebench R15, the Intel Core i7-11800H is able to beat the Ryzen 7 5800H of the Lenovo Legion 5 Pro at least in several runs.
Cinebench R15 Multi Constant Load Test
* ... smaller is better
System Performance
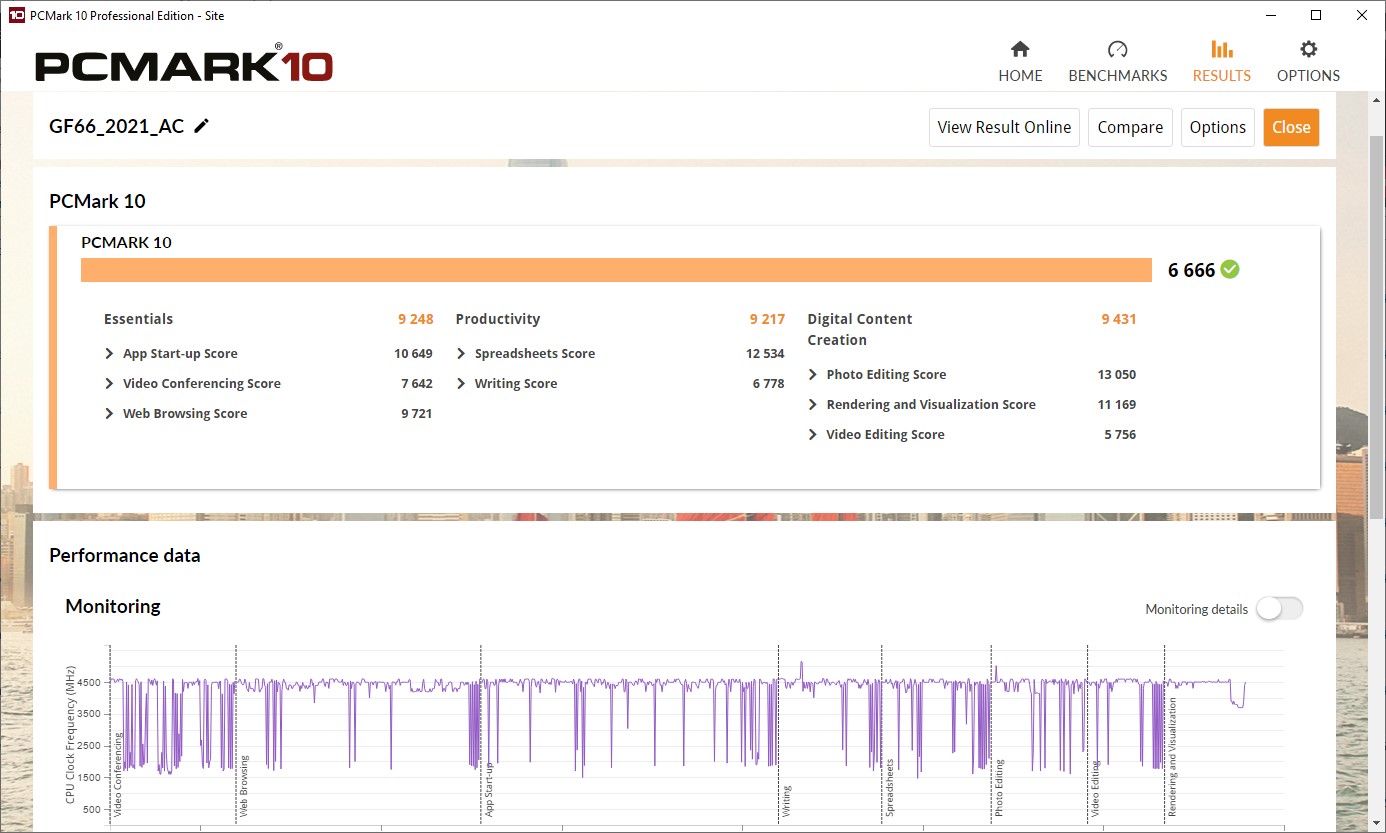
The system performance is at a good level. The laptop offers sufficient available resources for office tasks, surfing, gaming, and image and video processing. However, with 6666 points in PCMark 10, the MSI laptop does not perform at the high level of other gaming laptops. One of the reasons for this could be traced back to the power supply. At only 180 watts, the power supply is sized extremely small. According to HWinfo, the CPU was using more than 74 watts of power in the test. Since the Nvidia chip also demands up to 100 watts of power, the supplied power is insufficient for the whole system, if all the components are supposed to perform at their highest levels. The working memory, display, SSD, WLAN, and other components also need power. In addition, the system performance of the laptop depends on the values adjusted in the UEFI and on the fan mode. We performed several attempts to optimize the system performance before running the following benchmarks. However, the fact that MSI does not offer any Windows software to do this (at least at the time of the test on their German home page), the process is quite cumbersome and requires several reboots and test runs.
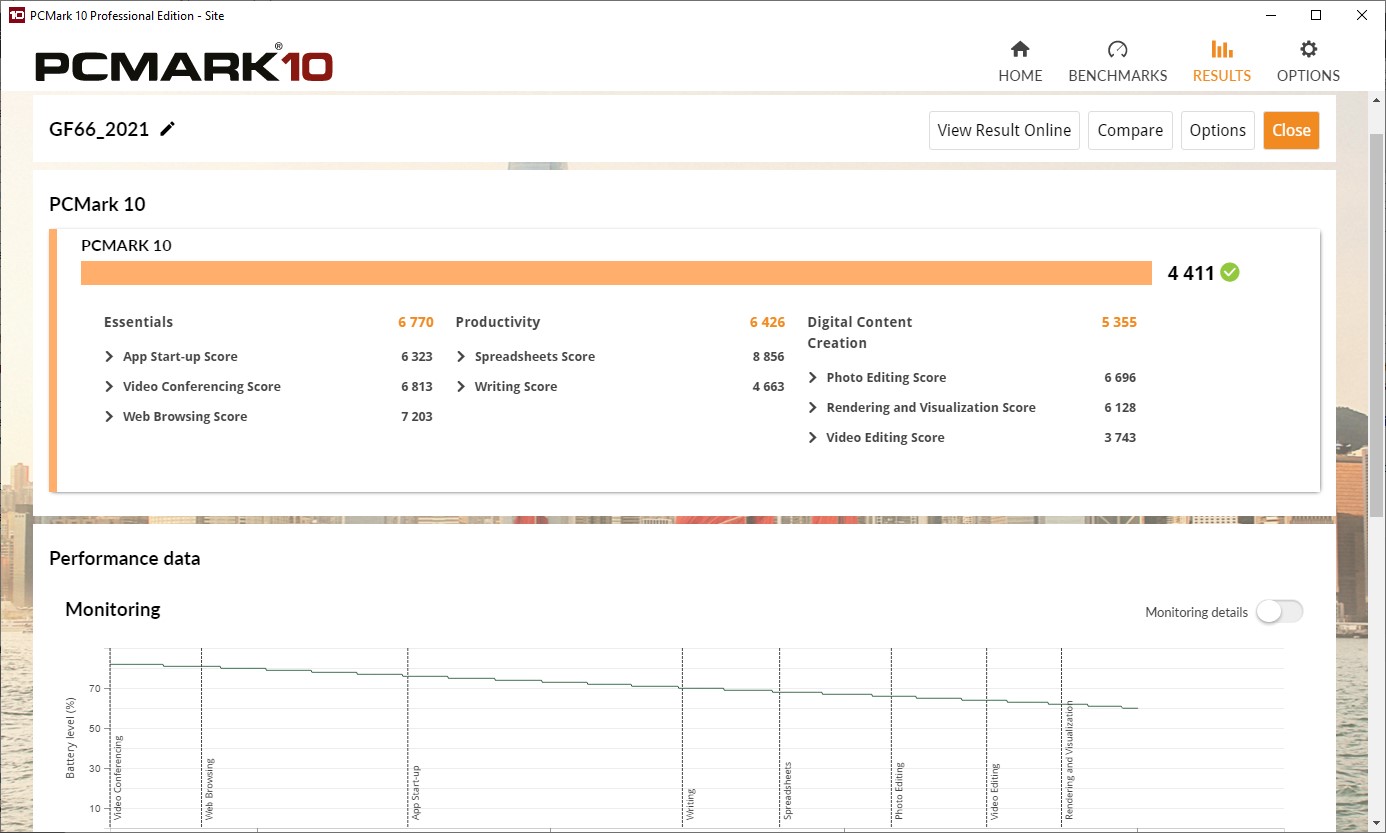
In mains operation, the laptop performs subjectively at a high level. All the applications start quickly and the laptop responds immediately to inputs. On the other hand, the MSI GF66 appears a little more sluggish in battery operation. The benchmark using PCMark 10 confirms this. A more than 2000-point difference to mains operation is in parts clearly noticeable.
| PCMark 10 / Score | |
| Average of class Gaming (5776 - 9852, n=117, last 2 years) | |
| Razer Blade 15 Advanced (Mid 2021) | |
| SCHENKER XMG Neo 15 Tiger Lake | |
| Gigabyte Aero 15 OLED XD | |
| Average Intel Core i7-11800H, NVIDIA GeForce RTX 3070 Laptop GPU (6126 - 7311, n=11) | |
| Lenovo Legion 5 Pro 16ACH6H (82JQ001PGE) | |
| MSI Katana GF66 11UG-220 | |
| Asus TUF Dash F15 FX516PR | |
| PCMark 10 / Essentials | |
| Razer Blade 15 Advanced (Mid 2021) | |
| Average of class Gaming (9057 - 12600, n=119, last 2 years) | |
| SCHENKER XMG Neo 15 Tiger Lake | |
| Average Intel Core i7-11800H, NVIDIA GeForce RTX 3070 Laptop GPU (9248 - 10832, n=11) | |
| Gigabyte Aero 15 OLED XD | |
| Lenovo Legion 5 Pro 16ACH6H (82JQ001PGE) | |
| Asus TUF Dash F15 FX516PR | |
| MSI Katana GF66 11UG-220 | |
| PCMark 10 / Productivity | |
| Average of class Gaming (6662 - 14612, n=117, last 2 years) | |
| Gigabyte Aero 15 OLED XD | |
| Asus TUF Dash F15 FX516PR | |
| MSI Katana GF66 11UG-220 | |
| Average Intel Core i7-11800H, NVIDIA GeForce RTX 3070 Laptop GPU (8571 - 9669, n=11) | |
| Razer Blade 15 Advanced (Mid 2021) | |
| SCHENKER XMG Neo 15 Tiger Lake | |
| Lenovo Legion 5 Pro 16ACH6H (82JQ001PGE) | |
| PCMark 10 / Digital Content Creation | |
| Average of class Gaming (7440 - 19351, n=117, last 2 years) | |
| SCHENKER XMG Neo 15 Tiger Lake | |
| Razer Blade 15 Advanced (Mid 2021) | |
| Gigabyte Aero 15 OLED XD | |
| Average Intel Core i7-11800H, NVIDIA GeForce RTX 3070 Laptop GPU (7627 - 10851, n=11) | |
| Lenovo Legion 5 Pro 16ACH6H (82JQ001PGE) | |
| MSI Katana GF66 11UG-220 | |
| Asus TUF Dash F15 FX516PR | |
| PCMark 10 Score | 6666 points | |
Help | ||
DPC Latencies
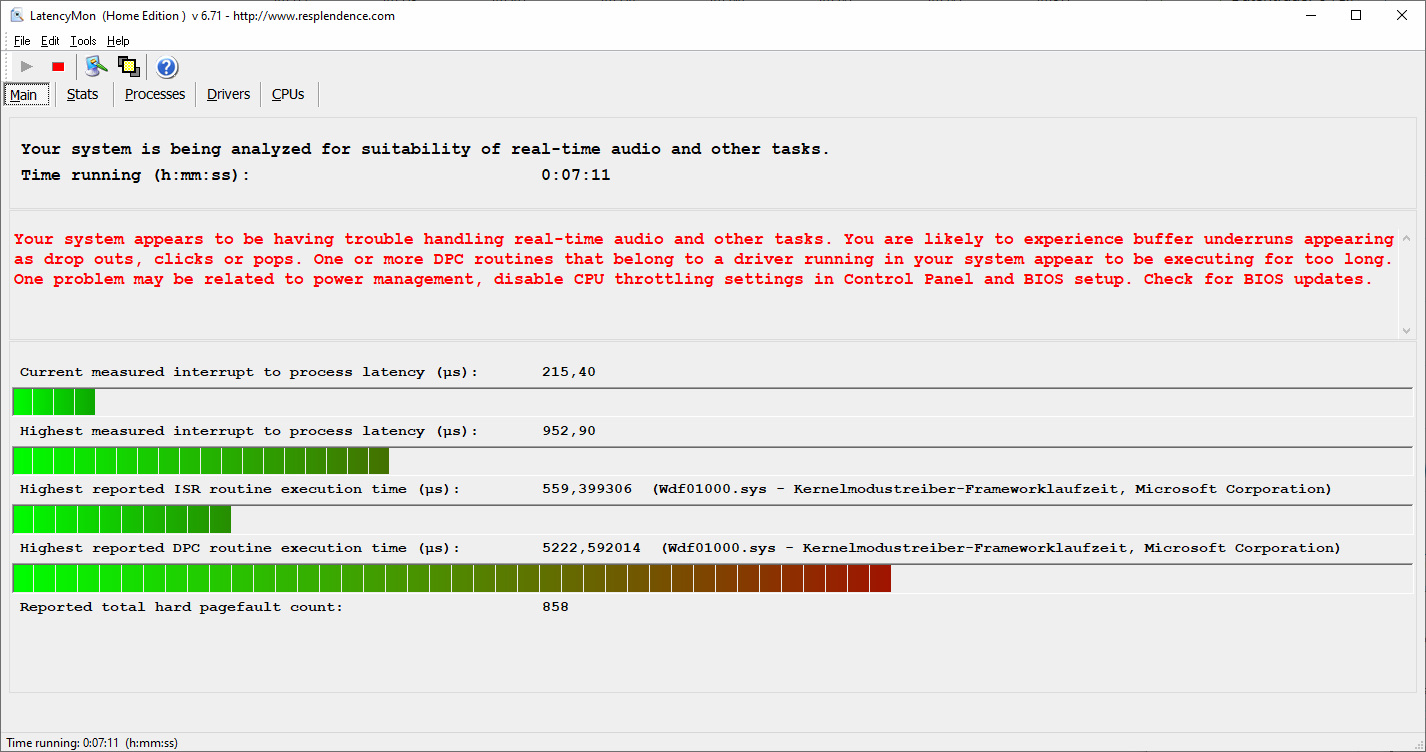
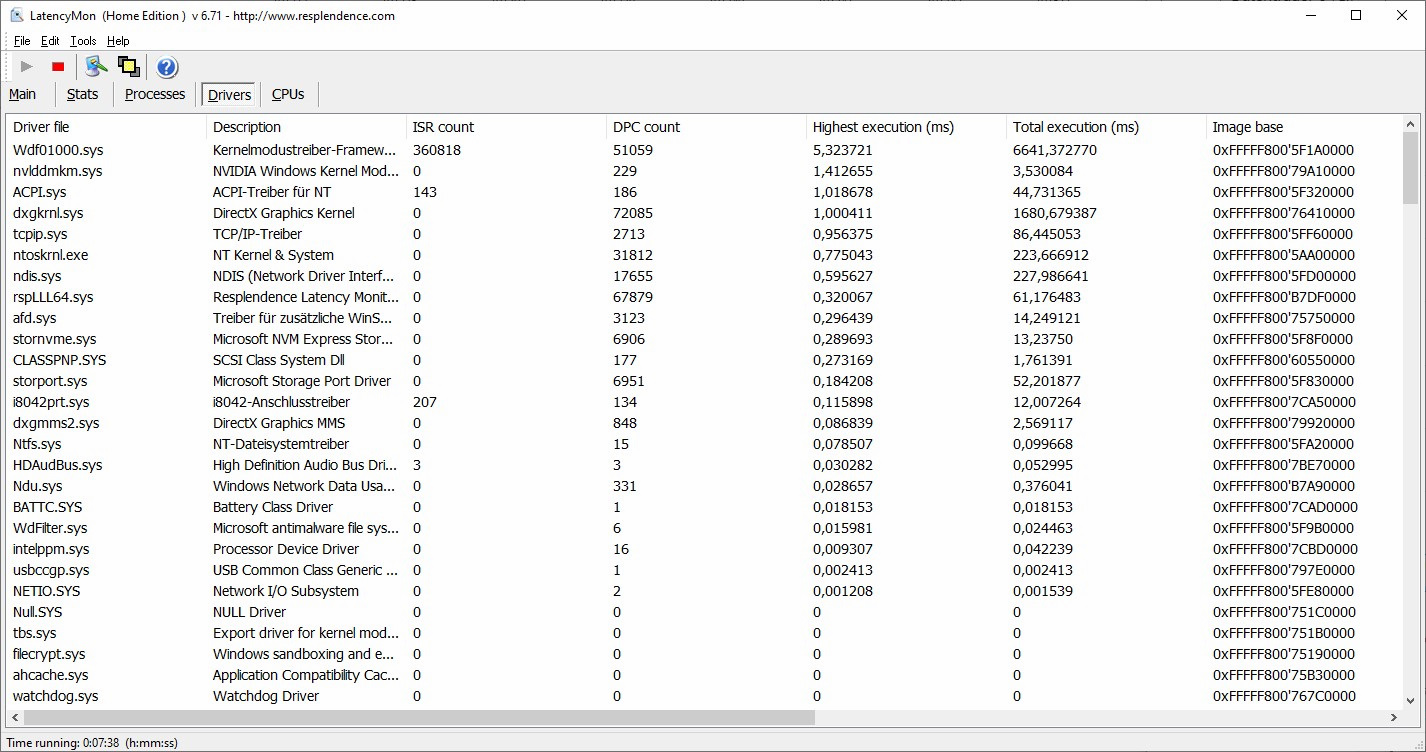
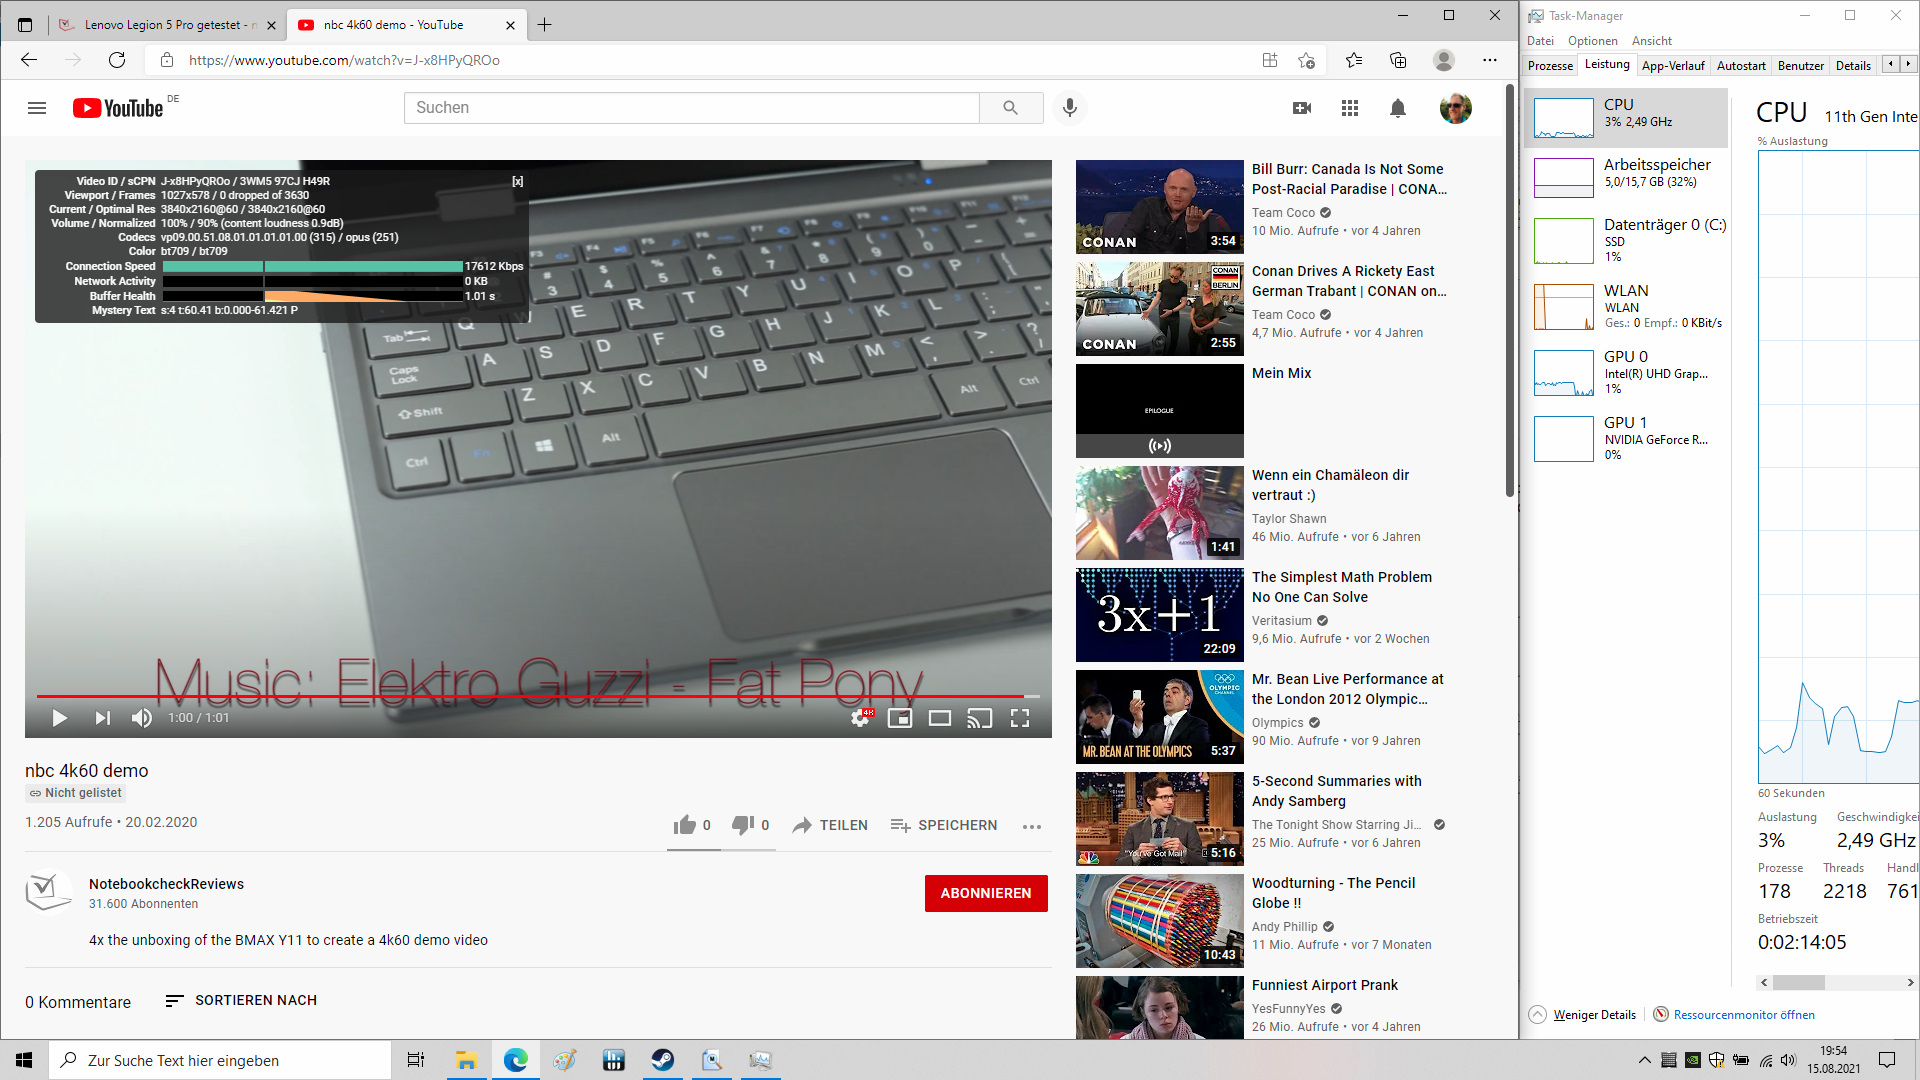
With DPC latencies of 952 µs, the MSI gaming laptop falls into the average of the test devices. This is another instance of Microsoft's kernel mode driver (WDF01000.sys) leading to problems. Depending on the upgrade, there could be some improvements here. The GF66 mastered the reproduction of our 4k 60-Hz YouTube test video with zero dropped frames.
| DPC Latencies / LatencyMon - interrupt to process latency (max), Web, Youtube, Prime95 | |
| Razer Blade 15 Advanced (Mid 2021) | |
| Lenovo Legion 5 Pro 16ACH6H (82JQ001PGE) | |
| Asus TUF Dash F15 FX516PR | |
| MSI Katana GF66 11UG-220 | |
| Gigabyte Aero 15 OLED XD | |
| SCHENKER XMG Neo 15 Tiger Lake | |
* ... smaller is better
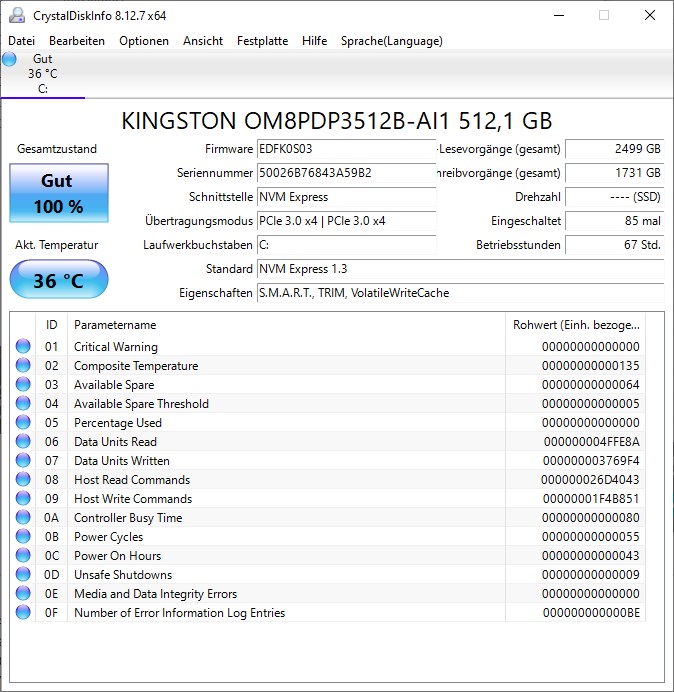
Storage Solution
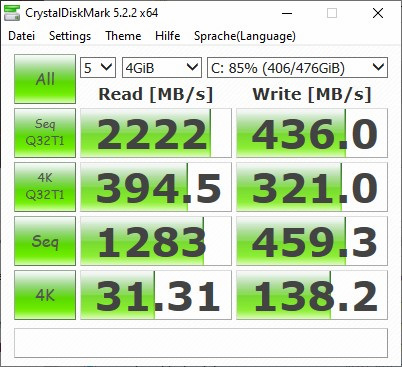
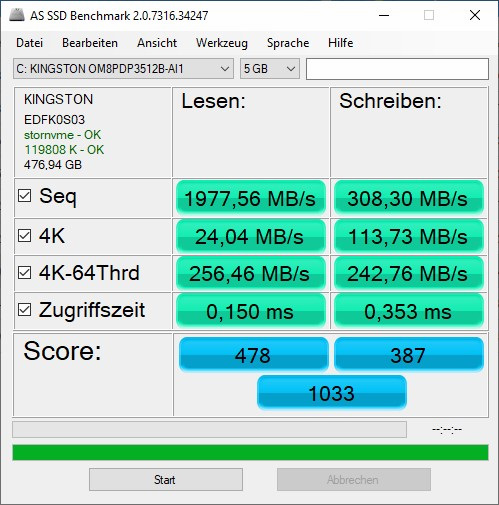
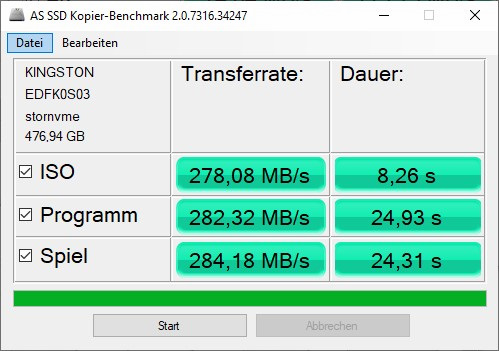
The 512-GB SSD from Kingston delivers acceptable values in the benchmarks with CrystalDiskMark and AS SSD. The preinstalled storage will hardly be sufficient for an extensive library of games. However, the storage of the GF66 can be expanded.
| MSI Katana GF66 11UG-220 Kingston OM8PDP3512B-AI1 | Lenovo Legion 5 Pro 16ACH6H (82JQ001PGE) WDC PC SN730 SDBPNTY-1T00 | Gigabyte Aero 15 OLED XD Samsung PM9A1 MZVL21T0HCLR | Asus TUF Dash F15 FX516PR SK Hynix HFM001TD3JX013N | Razer Blade 15 Advanced (Mid 2021) SSSTC CA6-8D1024 | SCHENKER XMG Neo 15 Tiger Lake Samsung SSD 980 Pro 1TB MZ-V8P1T0BW | |
|---|---|---|---|---|---|---|
| CrystalDiskMark 5.2 / 6 | 109% | 348% | 92% | 338% | 271% | |
| Write 4K (MB/s) | 138.2 | 89.9 -35% | 231.4 67% | 129.6 -6% | 295.6 114% | 162.7 18% |
| Read 4K (MB/s) | 31.31 | 30.98 -1% | 89.5 186% | 44.71 43% | 85.7 174% | 79 152% |
| Write Seq (MB/s) | 459.3 | 4208 816% | 1929 320% | 4149 803% | 2865 524% | |
| Read Seq (MB/s) | 1283 | 4512 252% | 2035 59% | 4203 228% | 3411 166% | |
| Write 4K Q32T1 (MB/s) | 321 | 371.6 16% | 648 102% | 425.9 33% | 715 123% | 522 63% |
| Read 4K Q32T1 (MB/s) | 394.5 | 470.6 19% | 691 75% | 433.4 10% | 709 80% | 508 29% |
| Write Seq Q32T1 (MB/s) | 436 | 3065 603% | 5111 1072% | 1390 219% | 4681 974% | 4765 993% |
| Read Seq Q32T1 (MB/s) | 2222 | 3370 52% | 7002 215% | 3505 58% | 6905 211% | 7083 219% |
| AS SSD | 173% | 542% | 220% | 523% | 437% | |
| Seq Read (MB/s) | 1978 | 2695 36% | 5357 171% | 2671 35% | 5739 190% | 4830 144% |
| Seq Write (MB/s) | 308.3 | 2384 673% | 3978 1190% | 1501 387% | 4201 1263% | 2032 559% |
| 4K Read (MB/s) | 24.04 | 29.75 24% | 50.6 110% | 39.65 65% | 53.8 124% | 62.3 159% |
| 4K Write (MB/s) | 113.7 | 52 -54% | 156.2 37% | 69 -39% | 179.2 58% | 146.4 29% |
| 4K-64 Read (MB/s) | 256.5 | 1193 365% | 2465 861% | 1209 371% | 2959 1054% | 1305 409% |
| 4K-64 Write (MB/s) | 242.8 | 1107 356% | 3360 1284% | 1650 580% | 1891 679% | 3708 1427% |
| Access Time Read * (ms) | 0.15 | 0.136 9% | 0.08 47% | 0.093 38% | 0.027 82% | 0.029 81% |
| Access Time Write * (ms) | 0.353 | 0.36 -2% | 0.027 92% | 0.055 84% | 0.154 56% | 0.027 92% |
| Score Read (Points) | 478 | 1493 212% | 3052 538% | 1516 217% | 3587 650% | 1850 287% |
| Score Write (Points) | 387 | 1397 261% | 3914 911% | 1869 383% | 2490 543% | 4058 949% |
| Score Total (Points) | 1033 | 3636 252% | 8449 718% | 4105 297% | 7821 657% | 6724 551% |
| Copy ISO MB/s (MB/s) | 278.1 | 1007 262% | 3027 988% | 1709 515% | ||
| Copy Program MB/s (MB/s) | 282.3 | 43.11 -85% | 1177 317% | 1250 343% | ||
| Copy Game MB/s (MB/s) | 284.2 | 621 119% | 2170 664% | 1909 572% | ||
| Total Average (Program / Settings) | 141% /
154% | 445% /
460% | 156% /
166% | 431% /
456% | 354% /
376% |
* ... smaller is better

Constant Performance Reading: DiskSpd Read Loop, Queue Depth 8
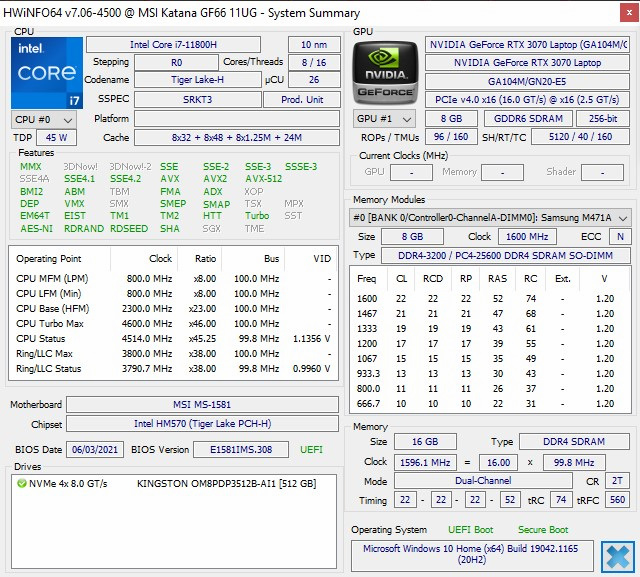
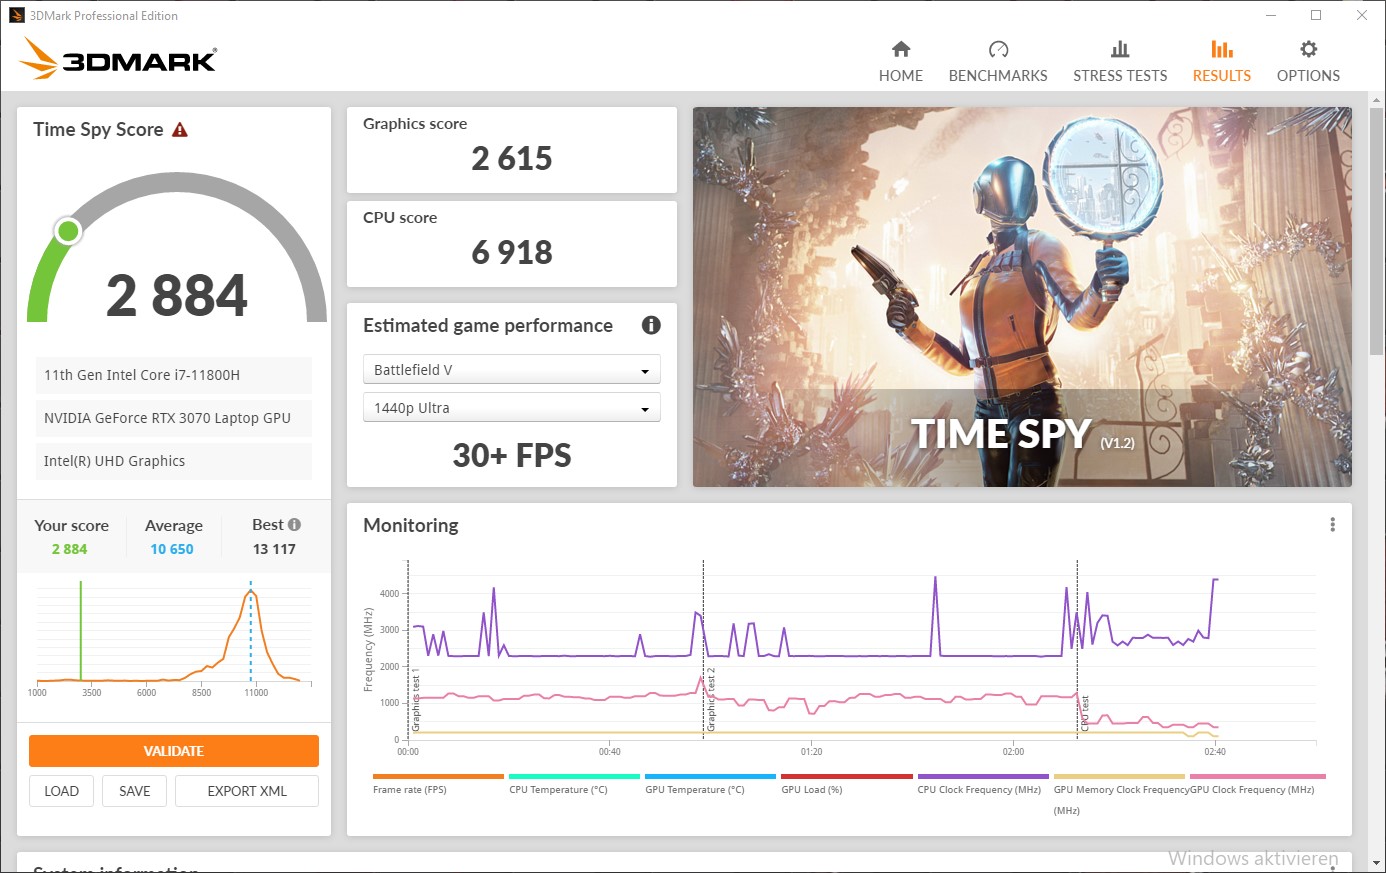
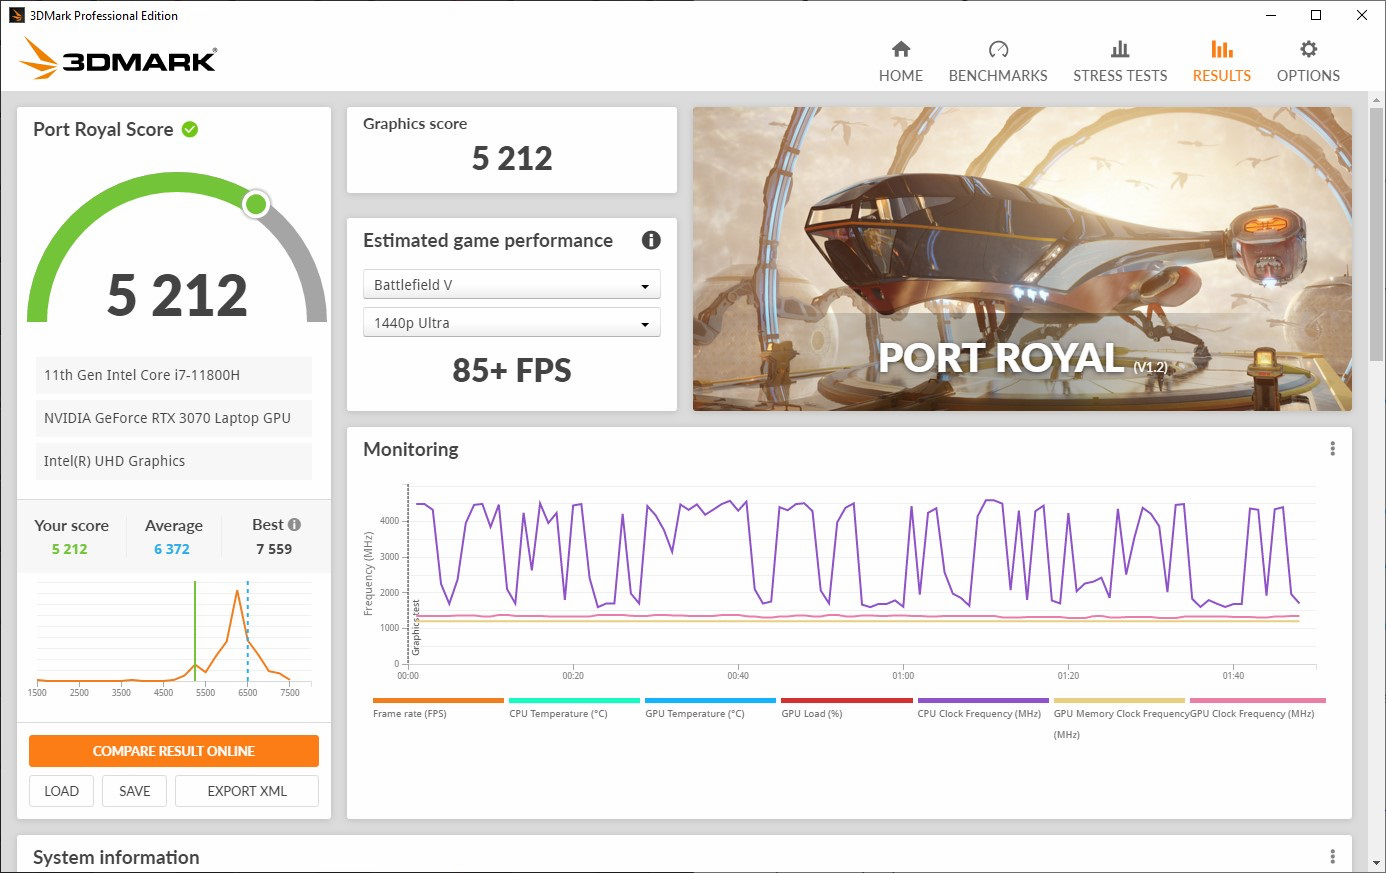
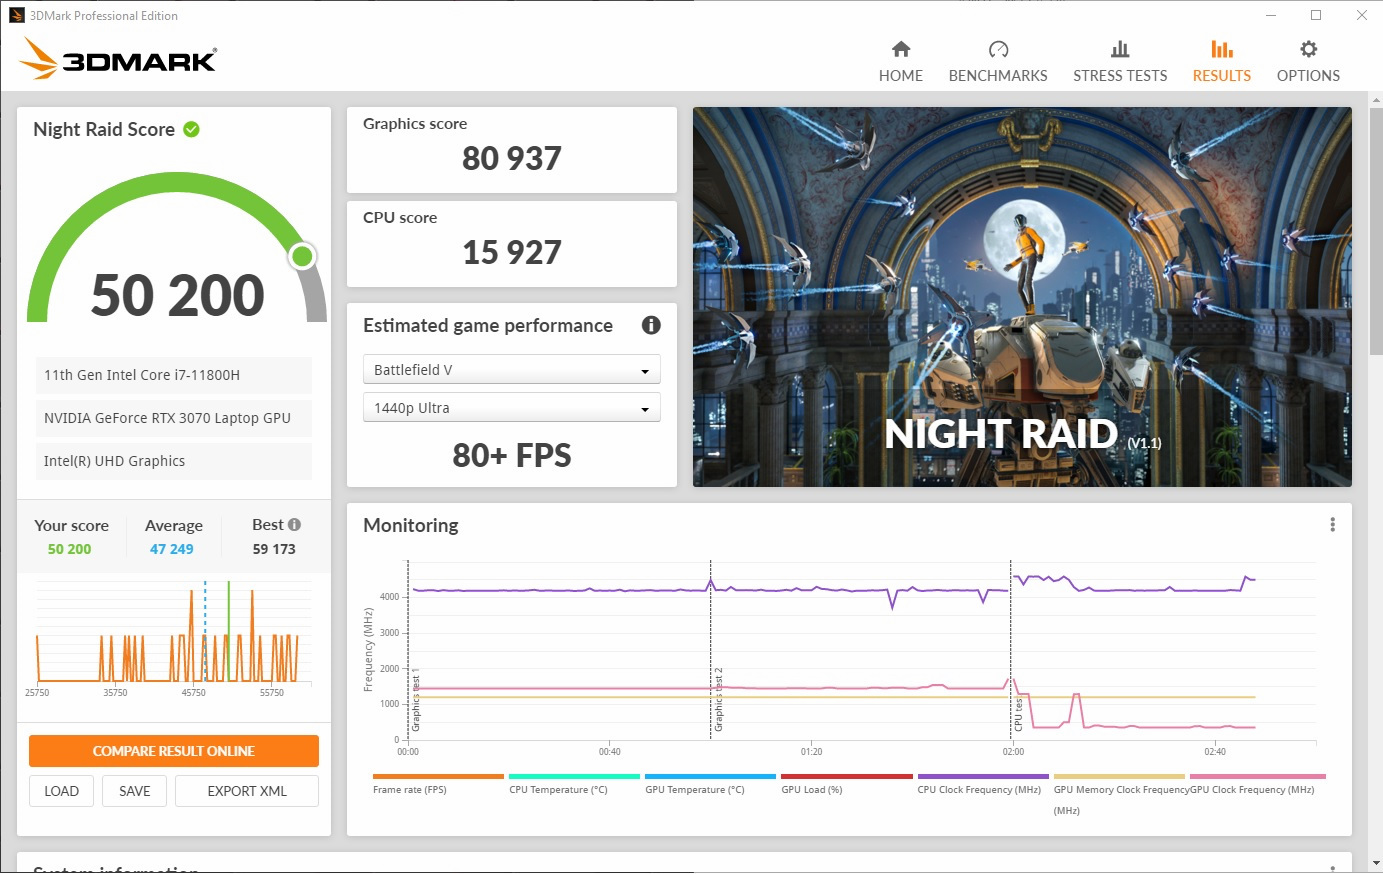
Graphics Card
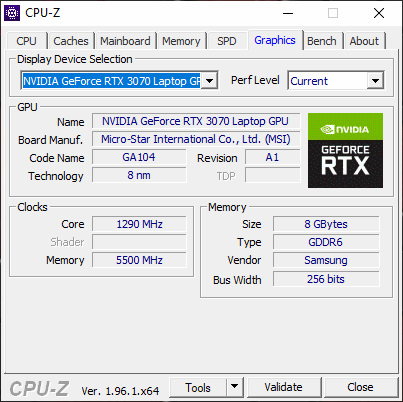
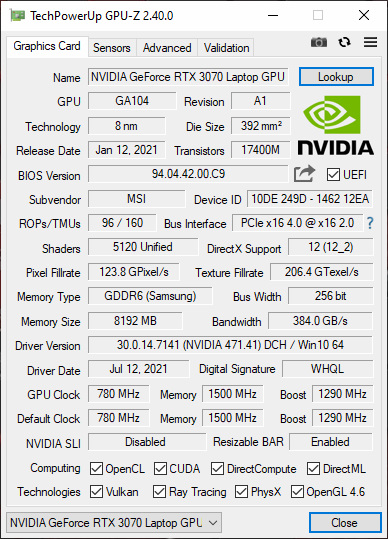
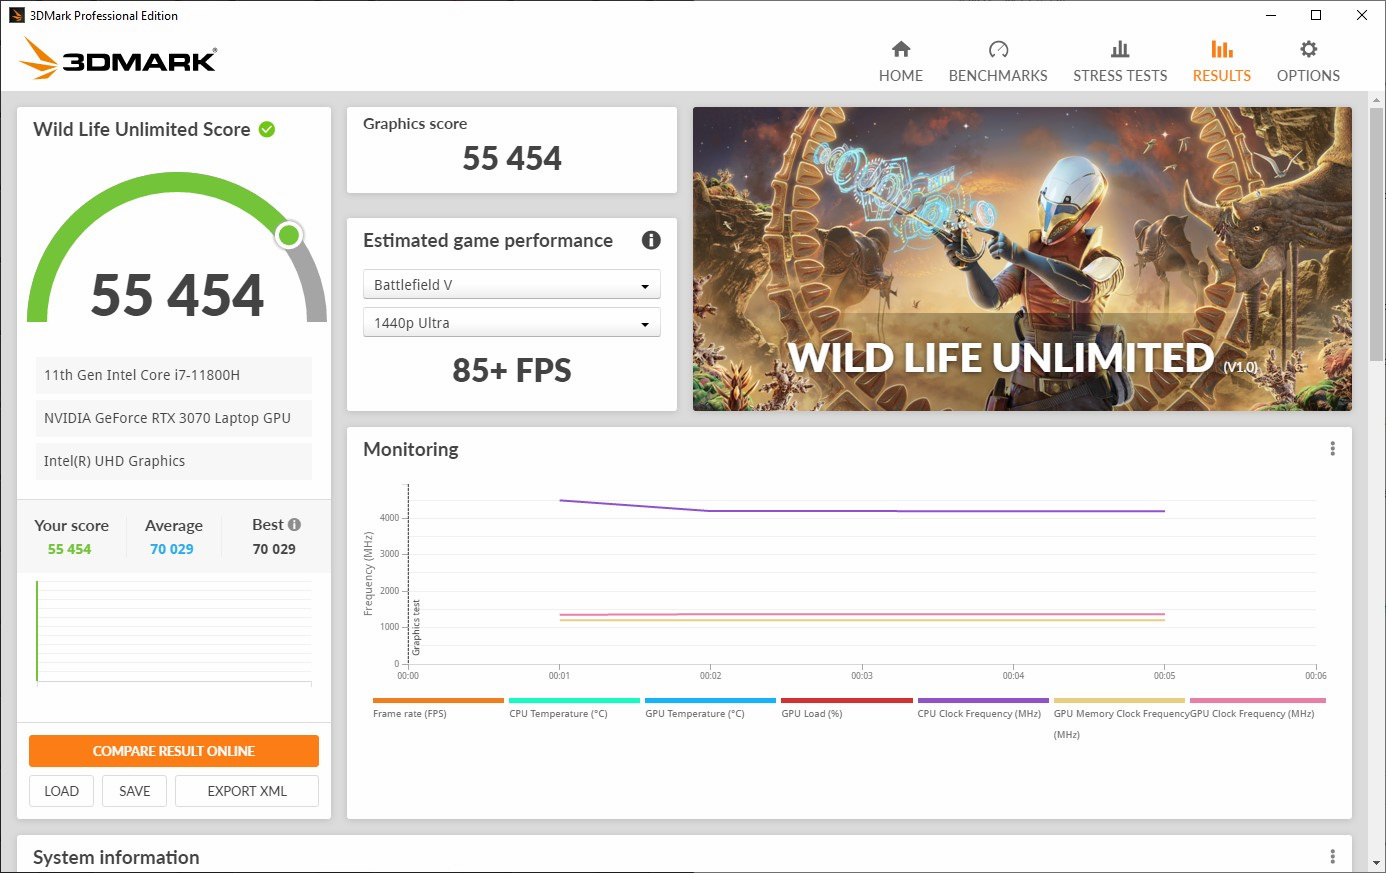
The laptop edition of the Nvidia GeForce RTX 3070 is one of the fastest graphics cards for laptops. The dedicated graphics card with 5120 shader units has 8 GB of GDDR6 working memory at its disposal. While the working memory could be fully used up by the current games, it is sufficient for the Full HD resolution of the MSI GF66. However, the results of the 3DMark benchmarks show that the graphics card is unable to develop its full potential. Other gaming laptops with the Nvidia chip achieve significantly higher points.
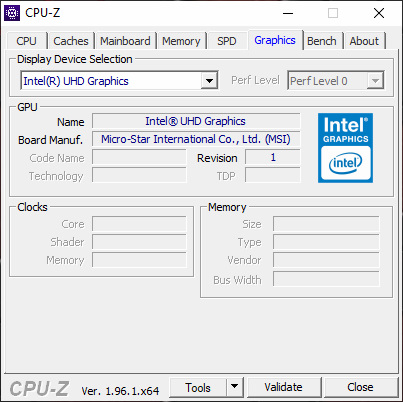
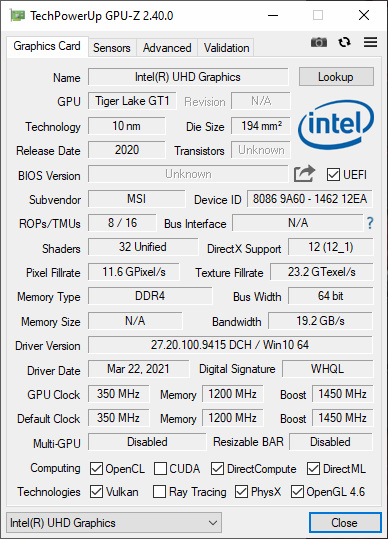
For less demanding graphics tasks, the laptop can also use the integrated UHD graphics of the Intel i7, which allows it to significantly reduce the power consumption during idle operation.
Without being plugged in, the laptop does not receive sufficient power from the battery to run the Nvidia chip at full speed. The performance in games and the benchmarks drops significantly to about one-third of the performance of running it in mains operation.


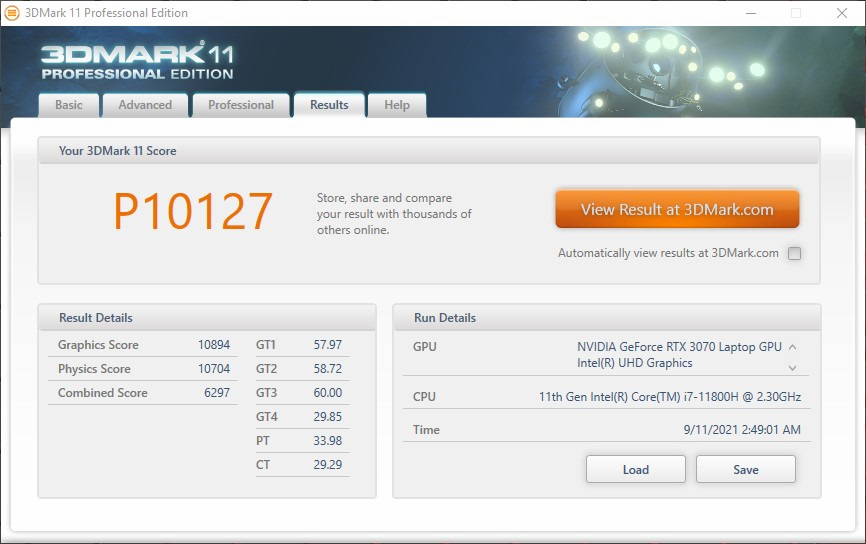
| 3DMark 11 Performance | 10127 points | |
| 3DMark Ice Storm Standard Score | 100884 points | |
| 3DMark Fire Strike Score | 18594 points | |
| 3DMark Fire Strike Extreme Score | 10194 points | |
| 3DMark Time Spy Score | 8715 points | |
Help | ||
Gaming Performance
The MSI laptop delivered good results in all the games we tested. The frame rates at full display resolution were more than acceptable even in the highest quality settings.
However, when gaming in battery operation, you have to expect a significantly worse quality. In "The Witcher 3," the frame rates dropped by more than 50 FPS (FHD/Ultra), after we unplugged the laptop.
| Far Cry New Dawn - 1920x1080 High Preset | |
| MSI Katana GF66 11UG-220 | |
| Average NVIDIA GeForce RTX 3070 Laptop GPU (80 - 112, n=6) | |
| Lenovo Legion 5 Pro 16ACH6H (82JQ001PGE) | |
| Asus TUF Dash F15 FX516PR | |
| F1 2021 | |
| 1920x1080 High Preset AA:T AF:16x | |
| Average of class Gaming (220 - 292, n=3, last 2 years) | |
| Lenovo Legion 5 Pro 16ACH6H (82JQ001PGE) | |
| Average NVIDIA GeForce RTX 3070 Laptop GPU (66.1 - 256, n=16) | |
| MSI Katana GF66 11UG-220 | |
| 1920x1080 Ultra High Preset + Raytracing AA:T AF:16x | |
| Average of class Gaming (123.1 - 146.7, n=3, last 2 years) | |
| Lenovo Legion 5 Pro 16ACH6H (82JQ001PGE) | |
| Average NVIDIA GeForce RTX 3070 Laptop GPU (33.1 - 123.1, n=23) | |
| MSI Katana GF66 11UG-220 | |
| 2560x1440 Ultra High Preset + Raytracing AA:T AF:16x | |
| Average of class Gaming (95.2 - 104.6, n=3, last 2 years) | |
| Lenovo Legion 5 Pro 16ACH6H (82JQ001PGE) | |
| Average NVIDIA GeForce RTX 3070 Laptop GPU (67.1 - 90.2, n=11) | |
| MSI Katana GF66 11UG-220 | |
| 3840x2160 Ultra High Preset + Raytracing AA:T AF:16x | |
| Average NVIDIA GeForce RTX 3070 Laptop GPU (37.1 - 51.1, n=3) | |
| MSI Katana GF66 11UG-220 | |
| F1 2020 | |
| 1920x1080 High Preset AA:T AF:16x | |
| Lenovo Legion 5 Pro 16ACH6H (82JQ001PGE) | |
| Average NVIDIA GeForce RTX 3070 Laptop GPU (118 - 238, n=7) | |
| Gigabyte Aero 15 OLED XD | |
| MSI Katana GF66 11UG-220 | |
| Asus TUF Dash F15 FX516PR | |
| 1920x1080 Ultra High Preset AA:T AF:16x | |
| Lenovo Legion 5 Pro 16ACH6H (82JQ001PGE) | |
| Average NVIDIA GeForce RTX 3070 Laptop GPU (97 - 173, n=7) | |
| Gigabyte Aero 15 OLED XD | |
| MSI Katana GF66 11UG-220 | |
| Asus TUF Dash F15 FX516PR | |
In the constant load test with "The Witcher 3," the frame rate drops fairly significantly in the first few minutes, before it levels out at around 70 FPS.
The Witcher 3 FPS Chart
| low | med. | high | ultra | QHD | 4K | |
|---|---|---|---|---|---|---|
| GTA V (2015) | 184 | 177 | 164 | 93.5 | ||
| The Witcher 3 (2015) | 381.1 | 263.4 | 122.1 | 80.9 | ||
| Dota 2 Reborn (2015) | 164 | 140 | 131 | 122 | 109 | |
| Final Fantasy XV Benchmark (2018) | 161 | 105 | 75.7 | 56.2 | ||
| X-Plane 11.11 (2018) | 115 | 98.9 | 79.7 | 80.2 | ||
| Far Cry 5 (2018) | 158 | 122 | 113 | 107 | ||
| Strange Brigade (2018) | 405 | 199 | 163 | 143 | ||
| Far Cry New Dawn (2019) | 133 | 108 | 103 | 91 | ||
| F1 2020 (2020) | 266 | 178 | 158 | 125 | ||
| Cyberpunk 2077 1.0 (2020) | 112.1 | 75.4 | 62 | 53.7 | ||
| F1 2021 (2021) | 276 | 179 | 161 | 91.2 | 67.1 | 37.1 |
Emissions - The MSI laptop gets loud and hot
Noise Emissions
In "normal" fan mode, the fans do not get extremely loud, but they will also never rev up to full speed on their own. This means that the laptop will overheat fairly quickly in some situations. On the other hand, if you use the key combination to set the fans to run at full speed, the loud noise of the gaming laptop can become quite annoying in the long run. So good headphones are a must for long gaming sessions.
Noise Level
| Idle |
| 34 / 35 / 36 dB(A) |
| Load |
| 48 / 49 dB(A) |
 | ||
30 dB silent 40 dB(A) audible 50 dB(A) loud |
||
min: | ||
Temperature
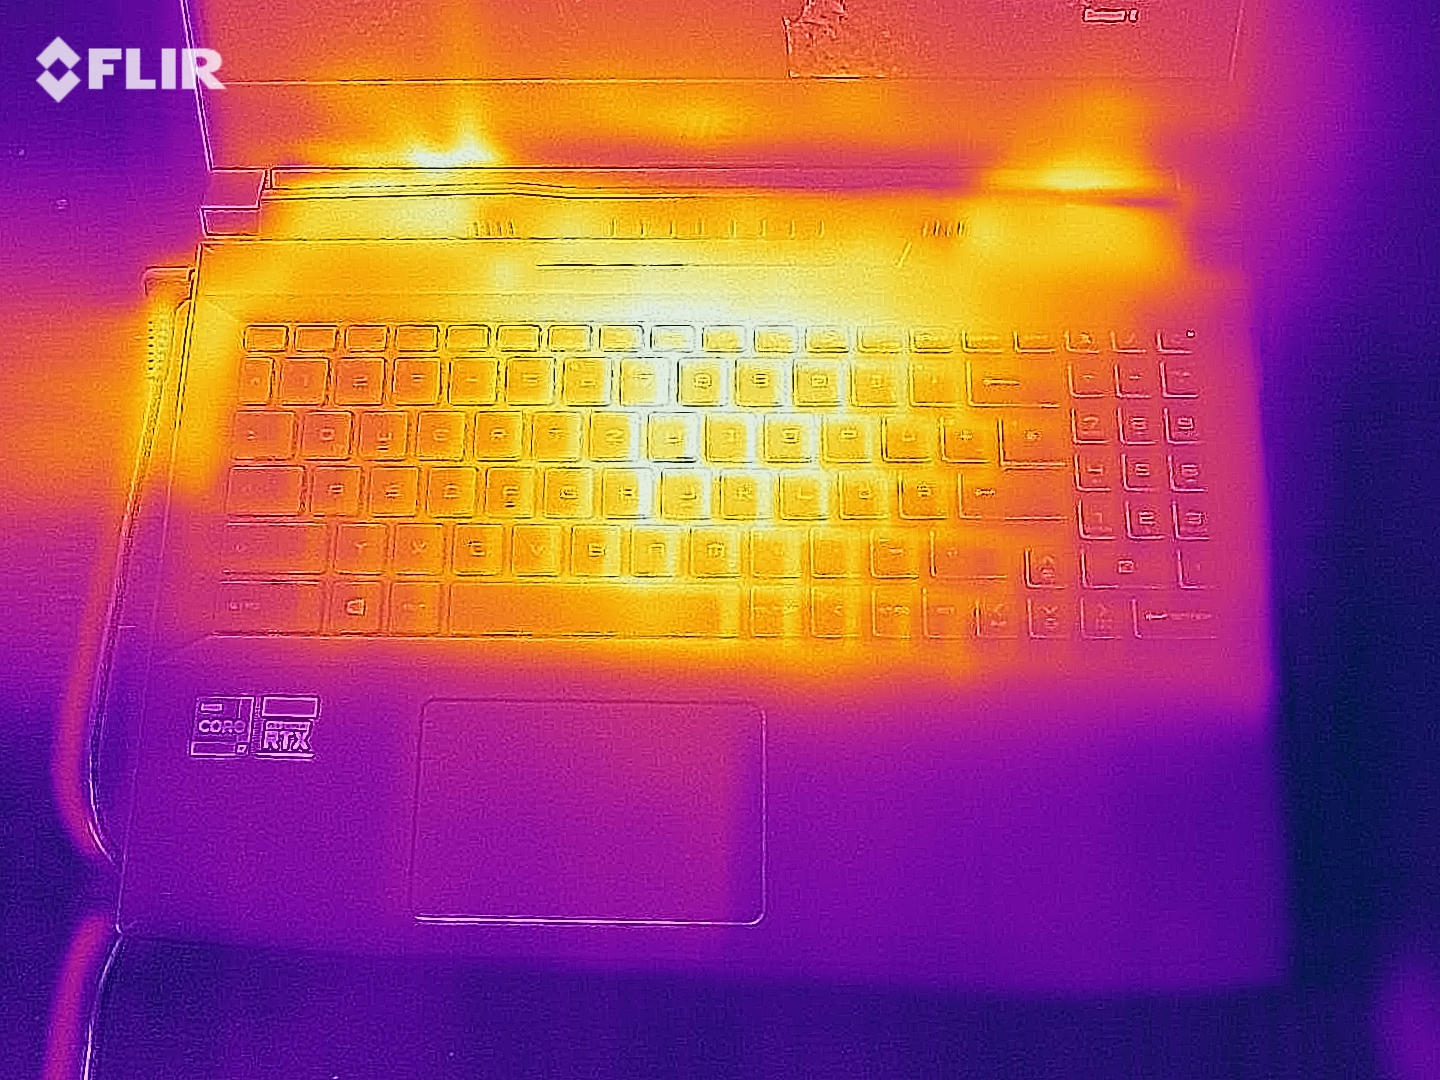
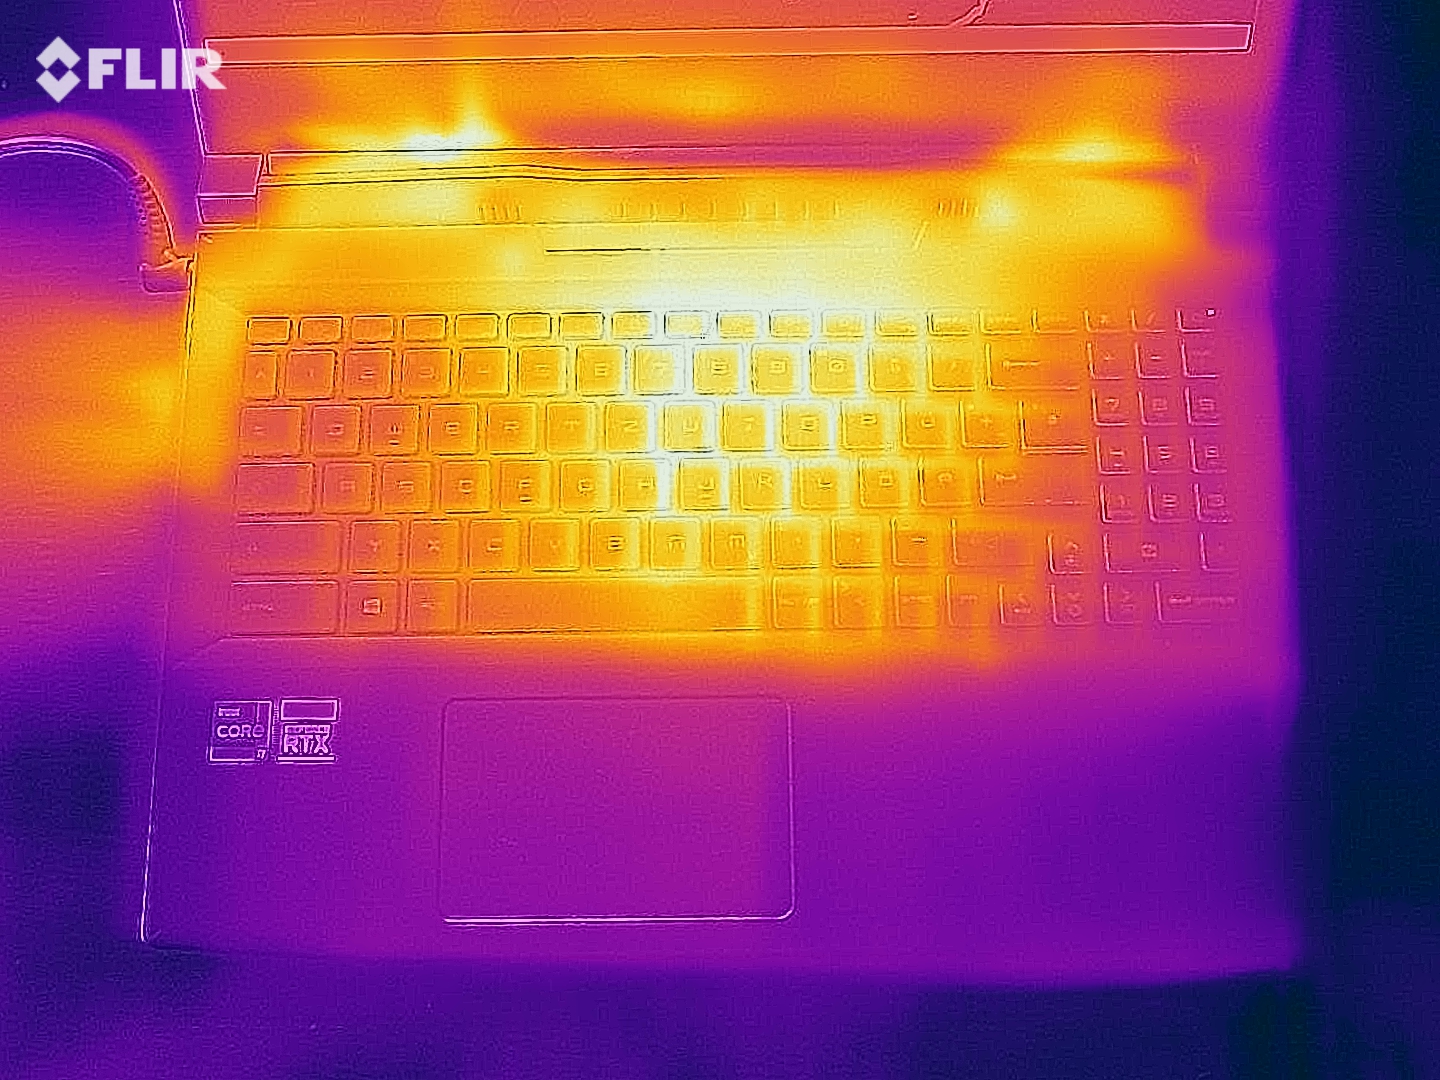
In the stress test, the surface of the laptop became quite warm. When gaming, the temperature of the keyboard can become uncomfortable in the long run. However, the surface temperature also drops quickly if you take a break, and the surface already feels cool again after 10 minutes. The palm rests and the ClickPad of the laptop will never get hot under any circumstances.
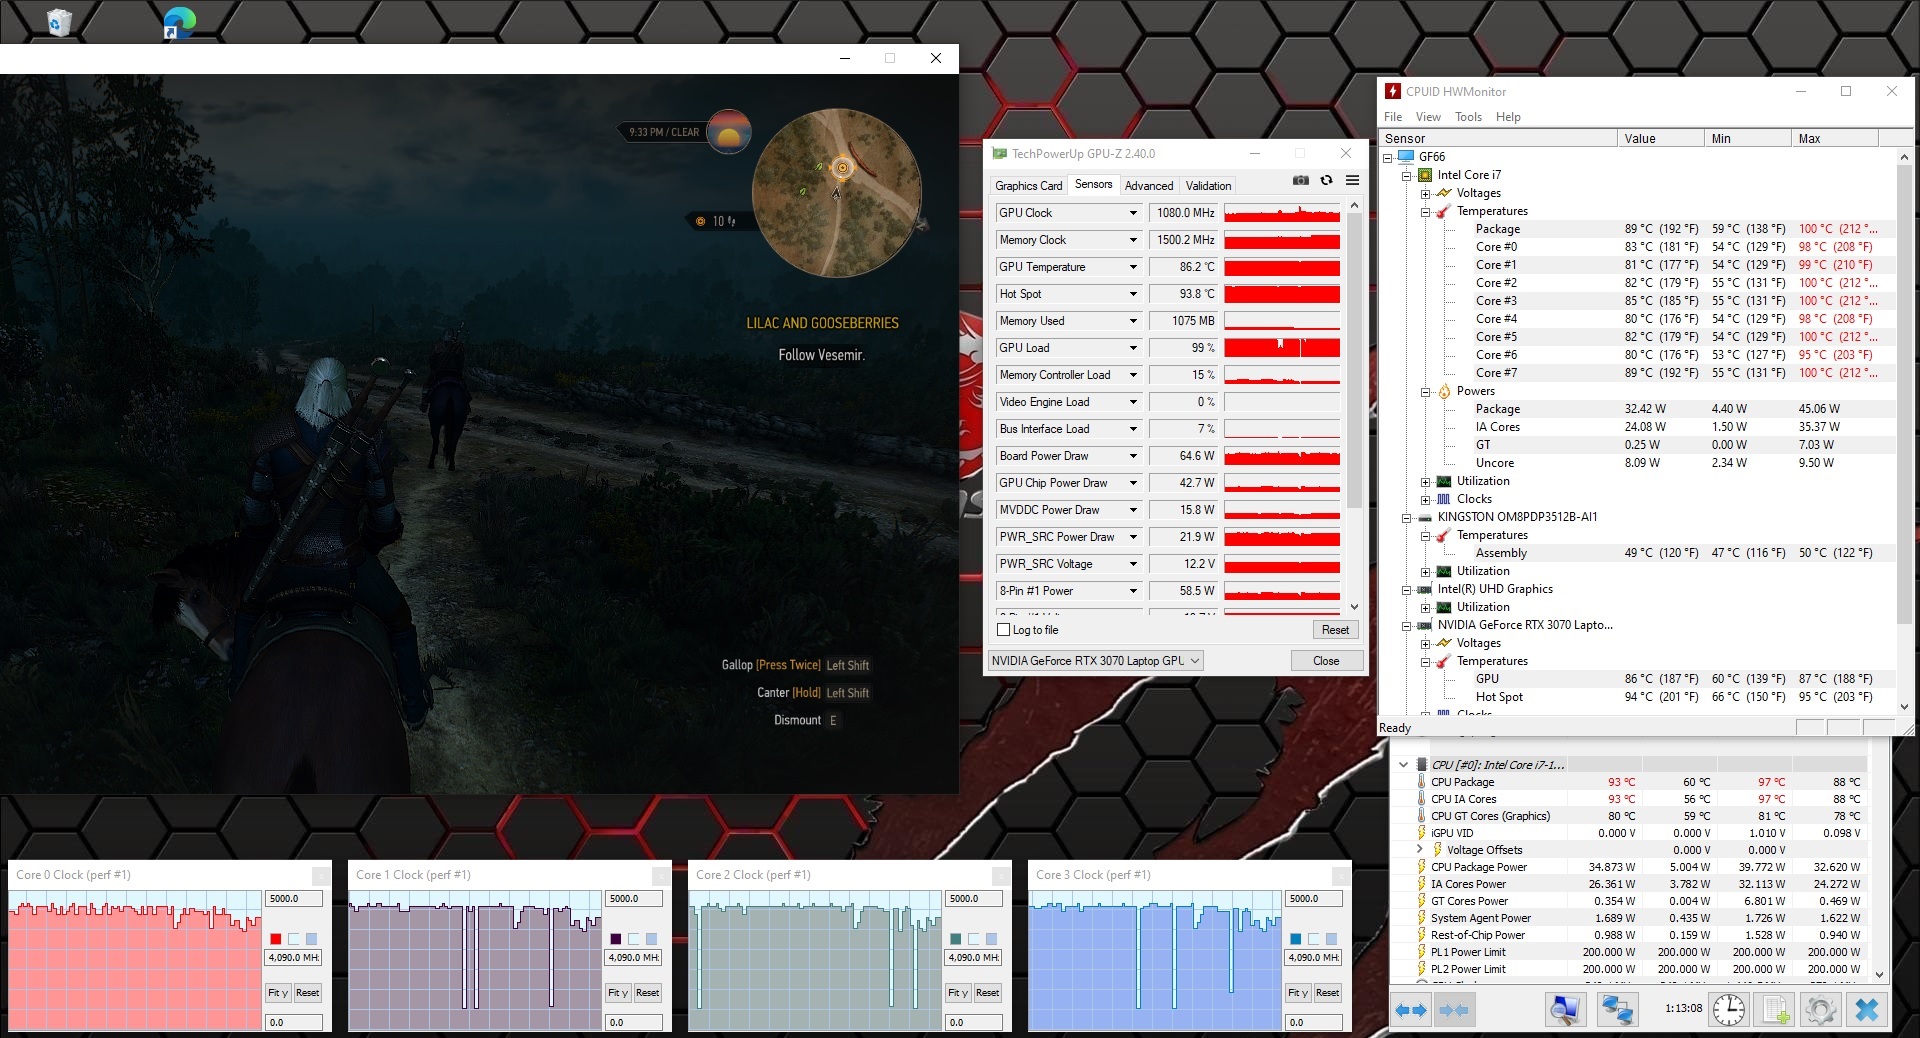
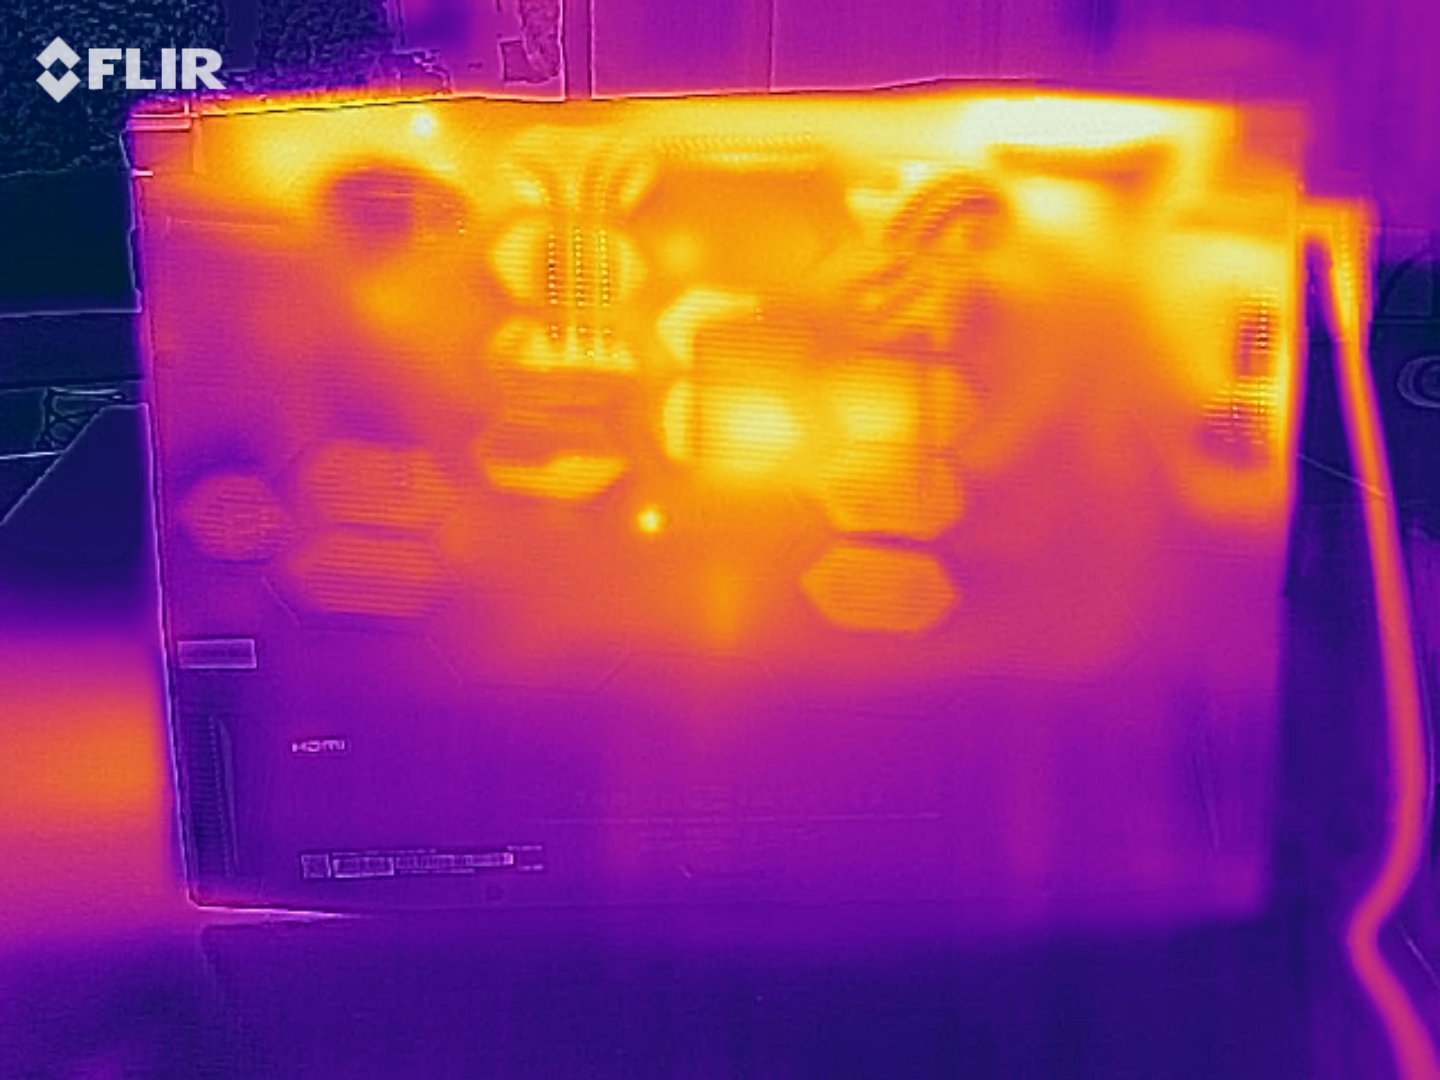

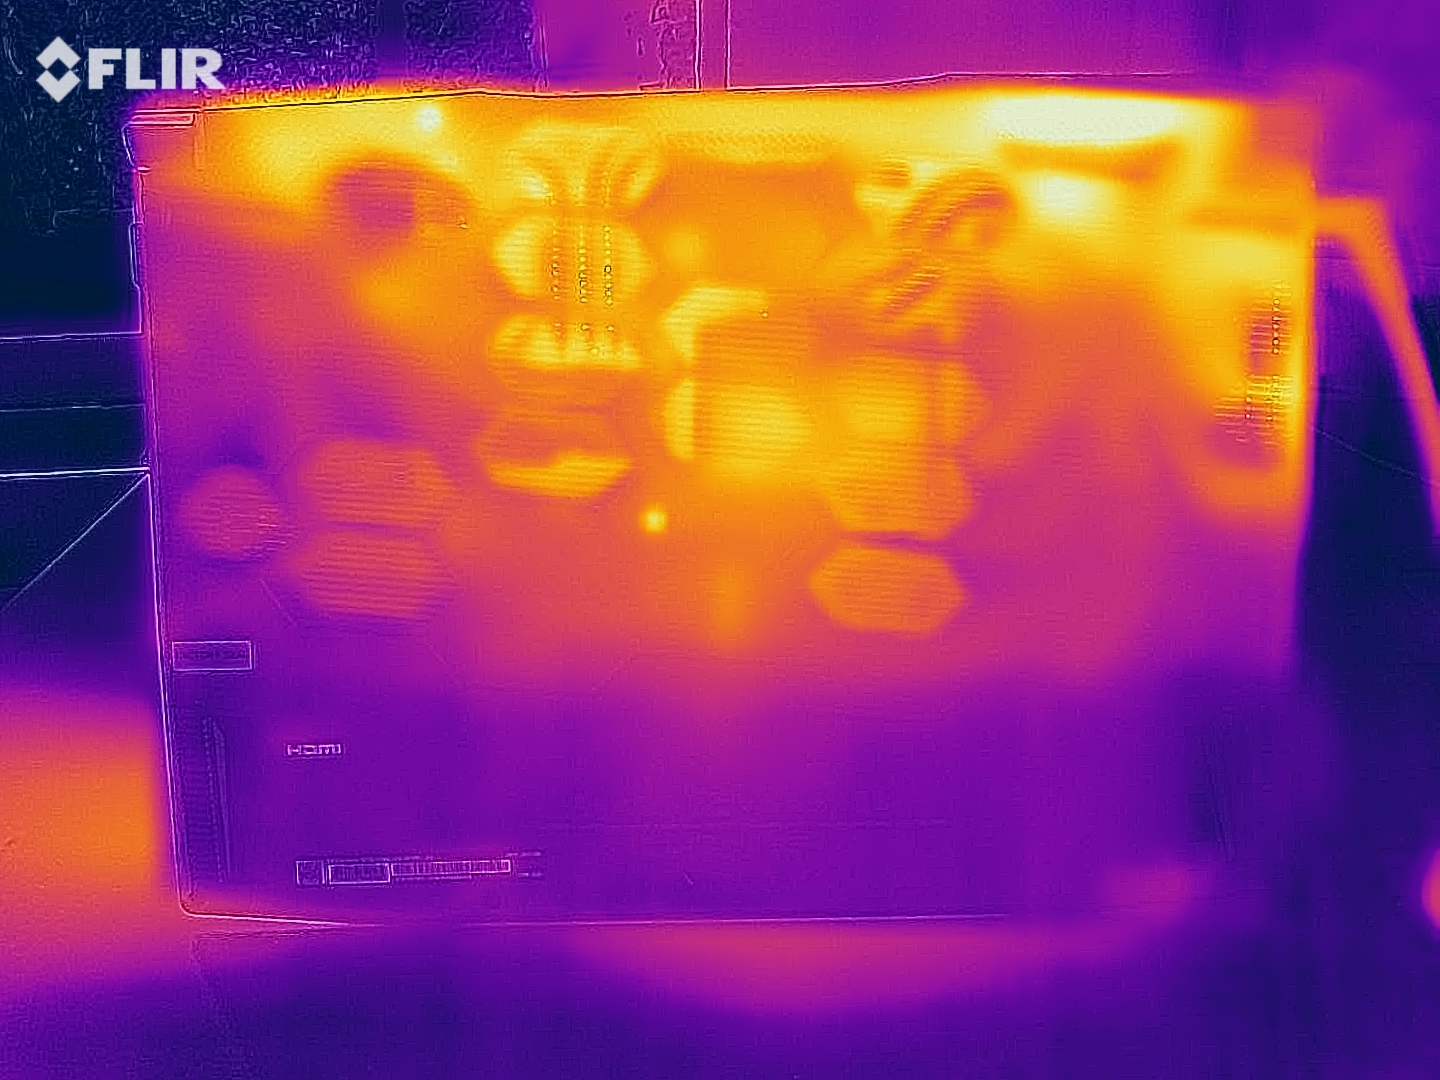
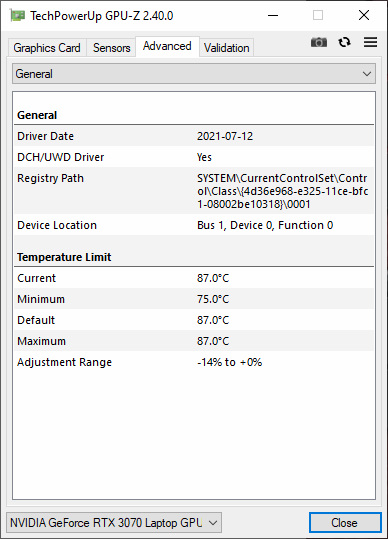
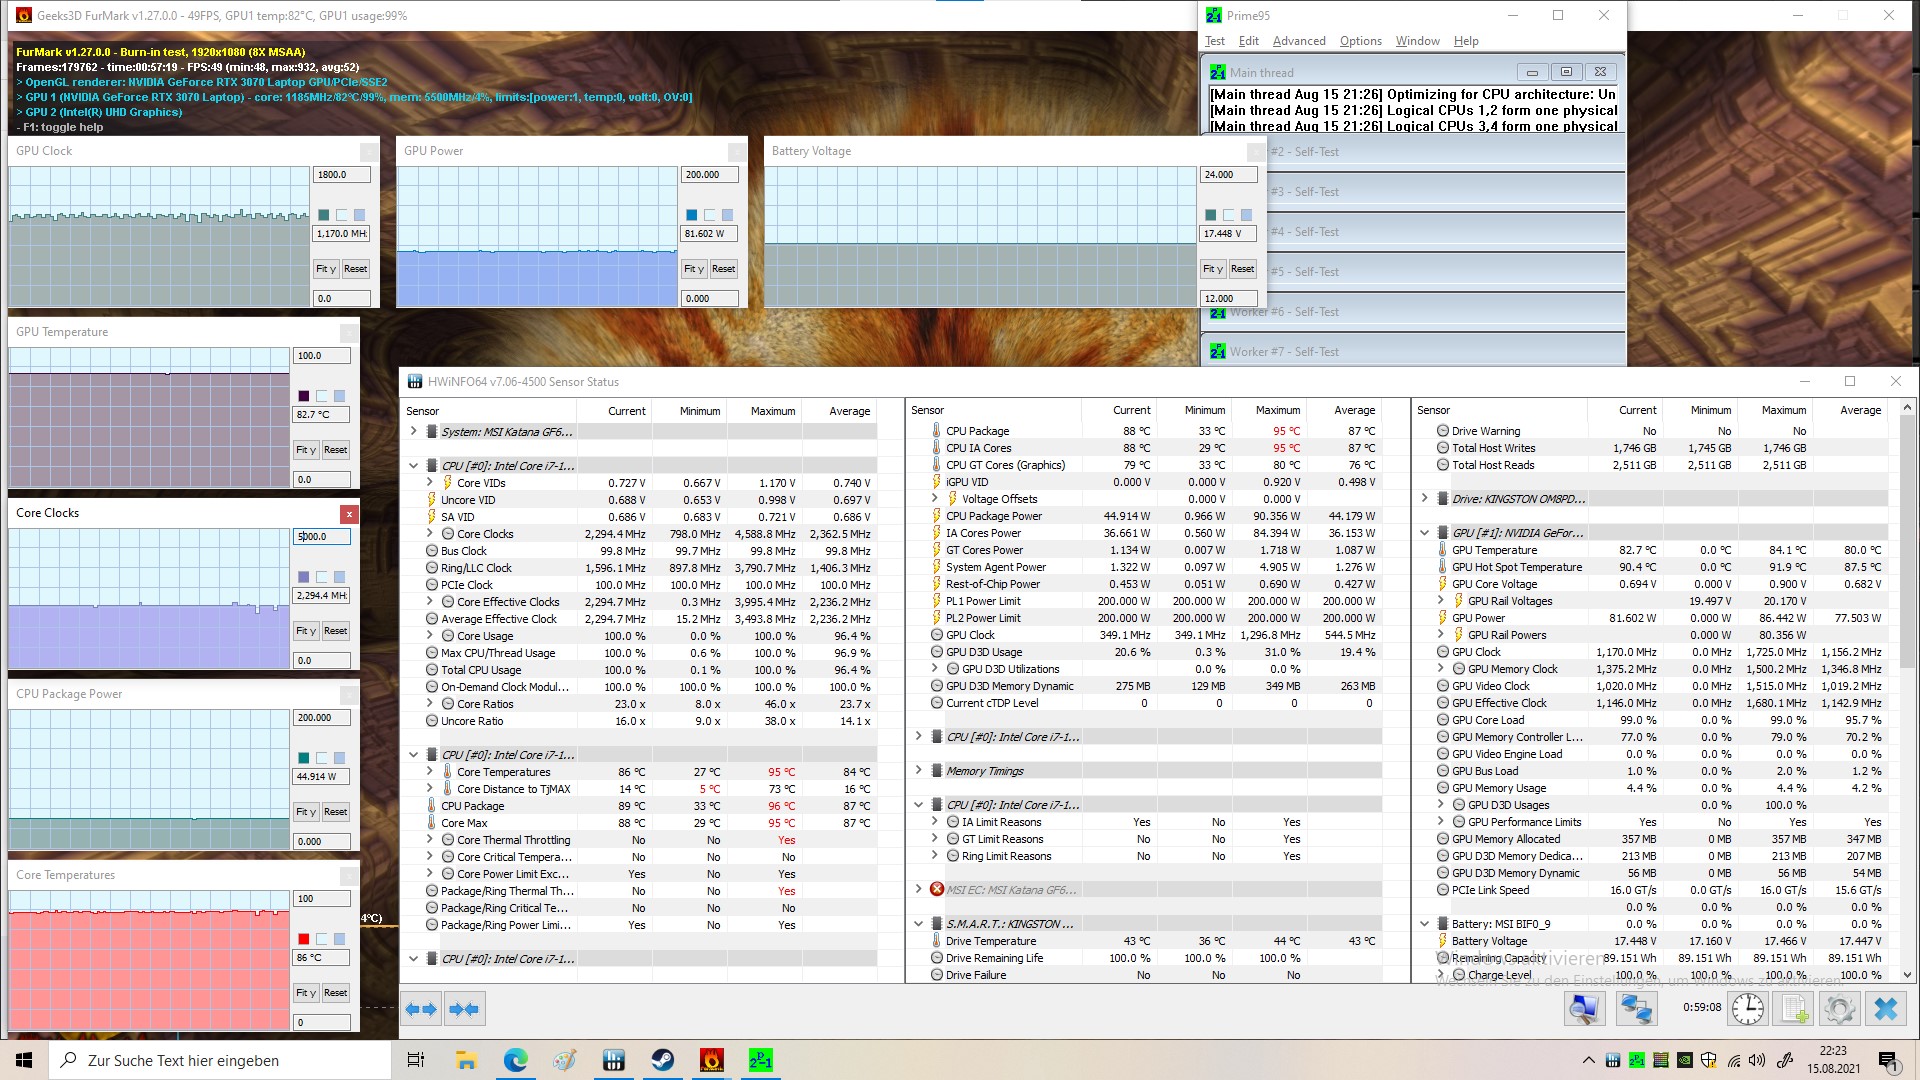
Without revving up the fans to full speed, the CPU and GPU overheat fairly quickly in the stress test and are then throttled. There is some thermal throttling at times. We created the heat maps of the laptop during the first stress test. At that point, the performance plan in the UEFI was set to the balanced mode. In the second stress test, we used the performance mode in the UEFI. Overall, we determined that the graphics and processor temperatures were hardly impacted by this.
After the second stress test, we ran the laptop for another 20 minutes with the fans running at maximum speed. During this time, the average temperatures of the CPU and GPU dropped by about 5 °C (9 °F) each.
(-) The maximum temperature on the upper side is 56 °C / 133 F, compared to the average of 40.5 °C / 105 F, ranging from 21.2 to 68.8 °C for the class Gaming.
(-) The bottom heats up to a maximum of 49 °C / 120 F, compared to the average of 43.3 °C / 110 F
(+) In idle usage, the average temperature for the upper side is 28.9 °C / 84 F, compared to the device average of 33.9 °C / 93 F.
(-) Playing The Witcher 3, the average temperature for the upper side is 45.8 °C / 114 F, compared to the device average of 33.9 °C / 93 F.
(-) The palmrests and touchpad can get very hot to the touch with a maximum of 40 °C / 104 F.
(-) The average temperature of the palmrest area of similar devices was 28.9 °C / 84 F (-11.1 °C / -20 F).
Speakers
The speakers of the MSI GF66 sound quite tinny and are not particularly loud. If the fans run at full speed, the volume of the speakers is hardly sufficient. Fortunately, you can also connect external speakers via the audio port or Bluetooth.
MSI Katana GF66 11UG-220 audio analysis
(±) | speaker loudness is average but good (78 dB)
Bass 100 - 315 Hz
(-) | nearly no bass - on average 21.2% lower than median
(±) | linearity of bass is average (8.6% delta to prev. frequency)
Mids 400 - 2000 Hz
(±) | higher mids - on average 5.4% higher than median
(±) | linearity of mids is average (8.9% delta to prev. frequency)
Highs 2 - 16 kHz
(+) | balanced highs - only 0.8% away from median
(+) | highs are linear (2.1% delta to prev. frequency)
Overall 100 - 16.000 Hz
(±) | linearity of overall sound is average (18.1% difference to median)
Compared to same class
» 56% of all tested devices in this class were better, 8% similar, 36% worse
» The best had a delta of 6%, average was 18%, worst was 132%
Compared to all devices tested
» 37% of all tested devices were better, 8% similar, 56% worse
» The best had a delta of 4%, average was 24%, worst was 134%
Apple MacBook 12 (Early 2016) 1.1 GHz audio analysis
(+) | speakers can play relatively loud (83.6 dB)
Bass 100 - 315 Hz
(±) | reduced bass - on average 11.3% lower than median
(±) | linearity of bass is average (14.2% delta to prev. frequency)
Mids 400 - 2000 Hz
(+) | balanced mids - only 2.4% away from median
(+) | mids are linear (5.5% delta to prev. frequency)
Highs 2 - 16 kHz
(+) | balanced highs - only 2% away from median
(+) | highs are linear (4.5% delta to prev. frequency)
Overall 100 - 16.000 Hz
(+) | overall sound is linear (10.2% difference to median)
Compared to same class
» 7% of all tested devices in this class were better, 2% similar, 91% worse
» The best had a delta of 5%, average was 19%, worst was 53%
Compared to all devices tested
» 4% of all tested devices were better, 1% similar, 94% worse
» The best had a delta of 4%, average was 24%, worst was 134%
Lenovo Legion 5 Pro 16ACH6H (82JQ001PGE) audio analysis
(±) | speaker loudness is average but good (76.1 dB)
Bass 100 - 315 Hz
(±) | reduced bass - on average 10.8% lower than median
(±) | linearity of bass is average (14.7% delta to prev. frequency)
Mids 400 - 2000 Hz
(±) | higher mids - on average 6.7% higher than median
(±) | linearity of mids is average (7.8% delta to prev. frequency)
Highs 2 - 16 kHz
(±) | reduced highs - on average 5.2% lower than median
(±) | linearity of highs is average (8.6% delta to prev. frequency)
Overall 100 - 16.000 Hz
(±) | linearity of overall sound is average (17.4% difference to median)
Compared to same class
» 47% of all tested devices in this class were better, 11% similar, 41% worse
» The best had a delta of 6%, average was 18%, worst was 132%
Compared to all devices tested
» 31% of all tested devices were better, 8% similar, 60% worse
» The best had a delta of 4%, average was 24%, worst was 134%
Power Management - The powerful 90 Wh battery lasts for 9 hours at most
Power Consumption
The power consumption of the MSI GF66 gaming laptop is significantly below average, and the laptop is clearly more efficient here than most of its competitors.
| Off / Standby | |
| Idle | |
| Load |
|
Key:
min: | |
| MSI Katana GF66 11UG-220 i7-11800H, GeForce RTX 3070 Laptop GPU | Lenovo Legion 5 Pro 16ACH6H (82JQ001PGE) R7 5800H, GeForce RTX 3070 Laptop GPU | Gigabyte Aero 15 OLED XD i7-11800H, GeForce RTX 3070 Laptop GPU | Asus TUF Dash F15 FX516PR i7-11370H, GeForce RTX 3070 Laptop GPU | Razer Blade 15 Advanced (Mid 2021) i7-11800H, GeForce RTX 3080 Laptop GPU | SCHENKER XMG Neo 15 Tiger Lake i7-11800H, GeForce RTX 3080 Laptop GPU | Average of class Gaming | |
|---|---|---|---|---|---|---|---|
| Power Consumption | -14% | -64% | 6% | -61% | -34% | -52% | |
| Idle Minimum * (Watt) | 8 | 10.45 -31% | 23 -188% | 9 -13% | 19.5 -144% | 15 -88% | 14.5 ? -81% |
| Idle Average * (Watt) | 12 | 14.92 -24% | 26 -117% | 11 8% | 23.3 -94% | 17 -42% | 20.7 ? -73% |
| Idle Maximum * (Watt) | 22 | 16.02 27% | 34 -55% | 16 27% | 40.1 -82% | 22 -0% | 27.7 ? -26% |
| Load Average * (Watt) | 98 | 119.65 -22% | 99 -1% | 107 -9% | 98.9 -1% | 101 -3% | 111.7 ? -14% |
| Witcher 3 ultra * (Watt) | 152 | 174.9 -15% | 163 -7% | 121 20% | 174 -14% | 195 -28% | |
| Load Maximum * (Watt) | 162 | 187.26 -16% | 190 -17% | 162 -0% | 214 -32% | 230 -42% | 266 ? -64% |
* ... smaller is better
Power Consumption The Witcher 3
Battery Life
With more than 5 hours while surfing and more than 9 hours of idle operation, the battery in the MSI laptop delivers fairly decent runtimes. Under full load, the 70 minutes of battery life are also decent, if you consider the high system performance. Overall, the current gaming laptops have gained some endurance. With these values, the GF66 laptop would still have achieved quite a good result last year, but currently this only places it in the middle of the field.
| MSI Katana GF66 11UG-220 i7-11800H, GeForce RTX 3070 Laptop GPU, 90 Wh | Lenovo Legion 5 Pro 16ACH6H (82JQ001PGE) R7 5800H, GeForce RTX 3070 Laptop GPU, 80 Wh | Gigabyte Aero 15 OLED XD i7-11800H, GeForce RTX 3070 Laptop GPU, 99 Wh | Asus TUF Dash F15 FX516PR i7-11370H, GeForce RTX 3070 Laptop GPU, 76 Wh | Razer Blade 15 Advanced (Mid 2021) i7-11800H, GeForce RTX 3080 Laptop GPU, 80 Wh | SCHENKER XMG Neo 15 Tiger Lake i7-11800H, GeForce RTX 3080 Laptop GPU, 93 Wh | Average of class Gaming | |
|---|---|---|---|---|---|---|---|
| Battery Runtime | -3% | 60% | 74% | 11% | 66% | 17% | |
| Reader / Idle (h) | 9.1 | 9.1 0% | 16 76% | 9.76 ? 7% | |||
| WiFi v1.3 (h) | 5.3 | 7 32% | 8.5 60% | 9.1 72% | 5.9 11% | 5.6 6% | 6.5 ? 23% |
| Load (h) | 1.2 | 0.7 -42% | 2.7 125% | 1.435 ? 20% | |||
| Witcher 3 ultra (h) | 2.2 | 1.039 ? | |||||
| H.264 (h) | 5.9 | 7.77 ? |
Pros
Cons
Verdict - Room for improvement

The MSI Katana GF66 11UG-220 is a solid device for gaming. However, you will look in vain for any special performance or equipment characteristics in this laptop. On the other hand, it does not have to hide with its performance either. At least in the mobile PC area, the performance of the current Intel processors approaches that of the powerful AMD processors. With the Nvidia GeForce RTX 3070, you will at least get a decent gaming experience.
Unfortunately, the MSI Katana GF66 does not develop its full potential.
The available software for the gaming laptop (at least on the German MSI homepage at the time of the test) leaves room for improvement. We would at least wish for a tool to control the performance without having to reboot the laptop. The drivers of the keyboard could also use some improvement.
Particularly in the performance of the Nvidia chip, we can also think of some improvement by using a larger power supply. The performance of the graphics card is clearly hampered by the meager TGP of 85 watts.
However, we also come to the overall conclusion that the gaming laptop runs cleanly. Those who don't look at each frame in terms of the frame rates will be able to have some fun playing current games with the laptop without any problems.
Even though the price level of the laptop is still in the entry-level segment, the purchase price of currently about 1600 Euros (~$1891) is quite high for a laptop without Windows.
Price and Availability
The MSI Katana GF66 11UG-600 with an Intel Core i7 and Nvidia RTX 3050 is currently available from Amazon for $1699 in the US.
MSI Katana GF66 11UG-220
- 09/13/2021 v7 (old)
Marc Herter


Price comparison

