

Gigabyte Aero 15 OLED XD laptop review: Next-generation 4K OLED
The Gigabyte Aero series focuses on multimedia as well as content creation; therefore, it tries to cater to the high requirements of graphic designers and media designers. There's also some room for gaming in the Aero series, because since Nvidia has given manufacturers the freedom to influence the performance (TDP) of the RTX 30XX graphics cards, powerful GPUs, such as the RTX 3070 found in our review unit, have also found a place.
As not much has changed externally, we will refer to the review of the Gigabyte Aero 15 OLED XC in the corresponding sections of our review.
We choose the competing devices listed below for the comparison, to which additional laptops can be added under each section.
Possible contenders in comparison
Rating | Date | Model | Weight | Height | Size | Resolution | Price |
|---|---|---|---|---|---|---|---|
| 85.6 % v7 (old) | 08 / 2021 | Gigabyte Aero 15 OLED XD i7-11800H, GeForce RTX 3070 Laptop GPU | 2.2 kg | 20 mm | 15.60" | 3840x2160 | |
| 85 % v7 (old) | 07 / 2021 | Asus TUF Gaming A15 FA506QR-AZ061T R7 5800H, GeForce RTX 3070 Laptop GPU | 2.3 kg | 24 mm | 15.60" | 1920x1080 | |
| 85 % v7 (old) | 02 / 2021 | Asus ROG Strix G15 G513QR R9 5900HX, GeForce RTX 3070 Laptop GPU | 2.3 kg | 27.2 mm | 15.60" | 1920x1080 | |
| 85.6 % v7 (old) | 03 / 2021 | Gigabyte Aero 15 OLED XC i7-10870H, GeForce RTX 3070 Laptop GPU | 2.2 kg | 20 mm | 15.60" | 3840x2160 | |
| 85.8 % v7 (old) | 06 / 2021 | Asus ZenBook Pro Duo UX582 LR-1BH2 i7-10870H, GeForce RTX 3070 Laptop GPU | 2.4 kg | 21.5 mm | 15.60" | 3840x2160 |
Case - Identical to the predecessor except for minor modifications
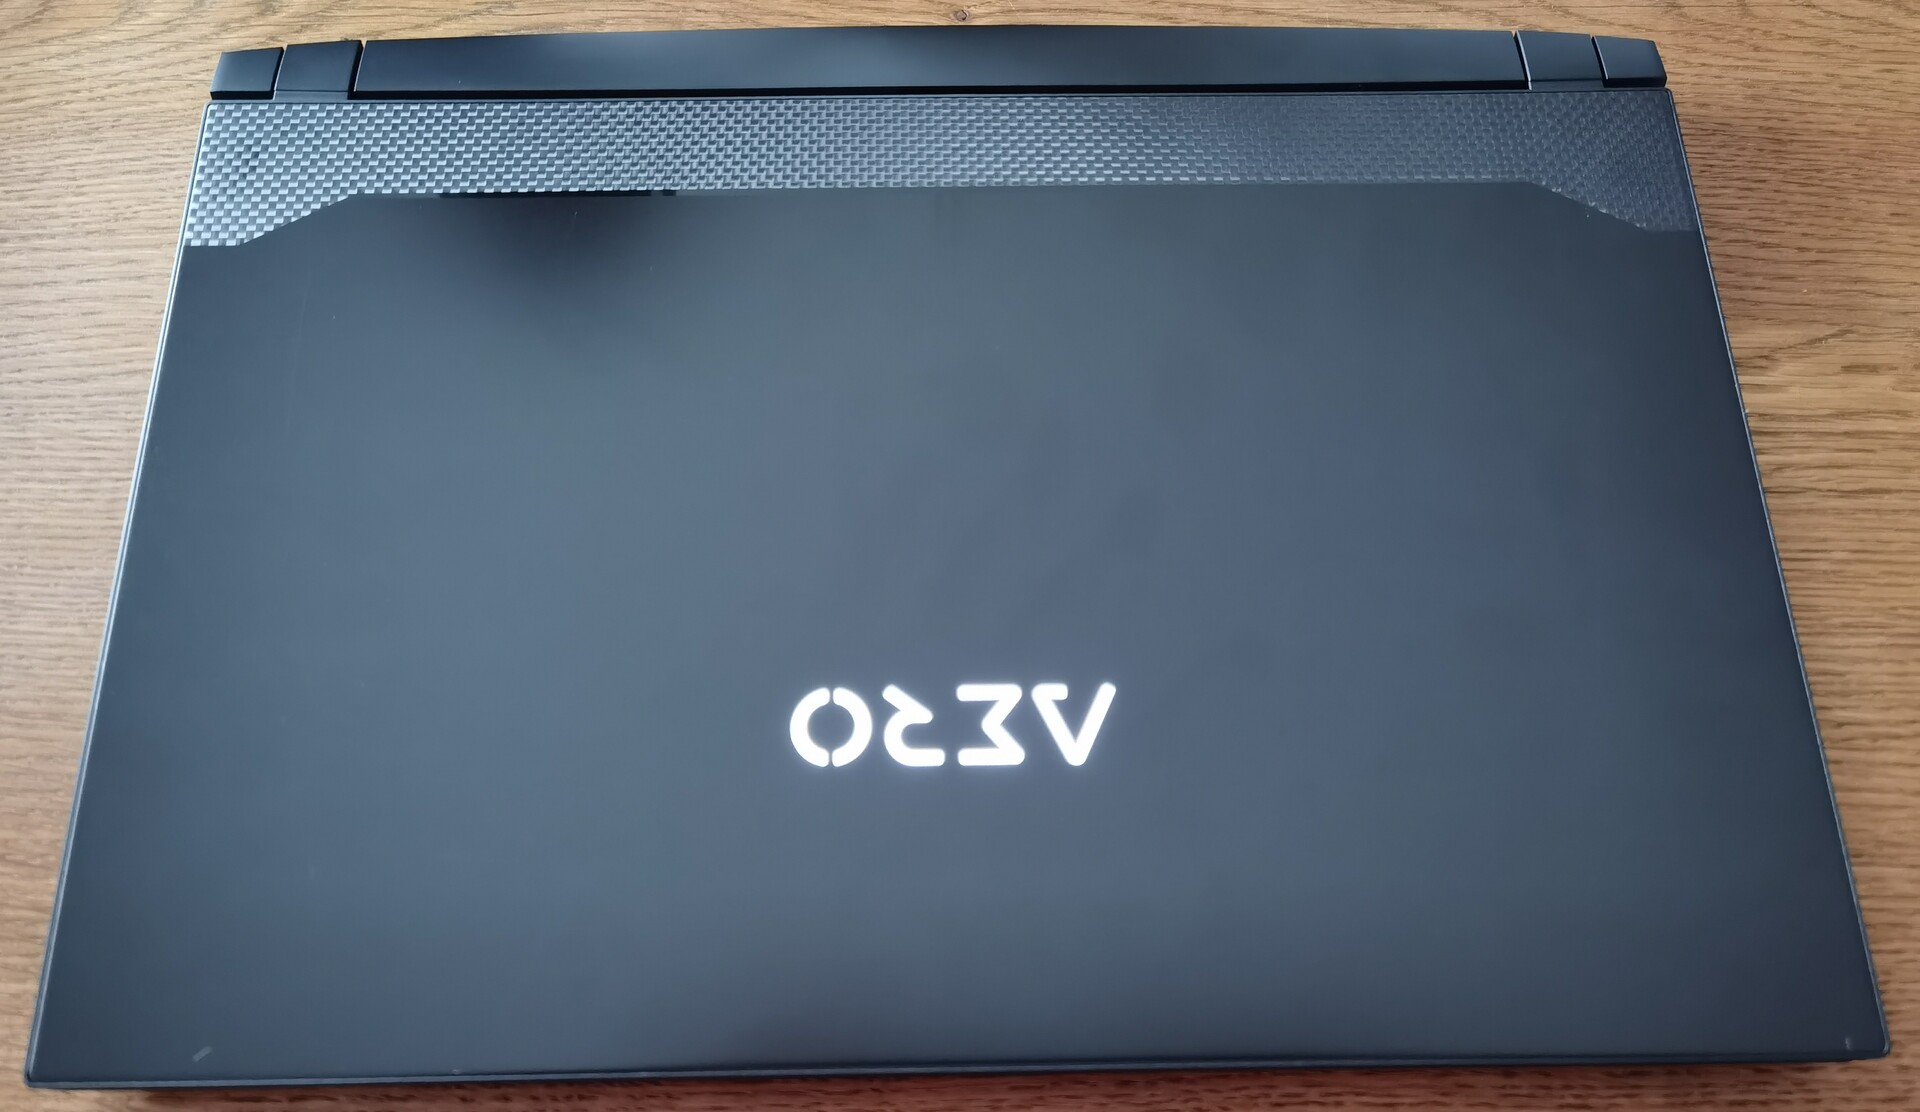
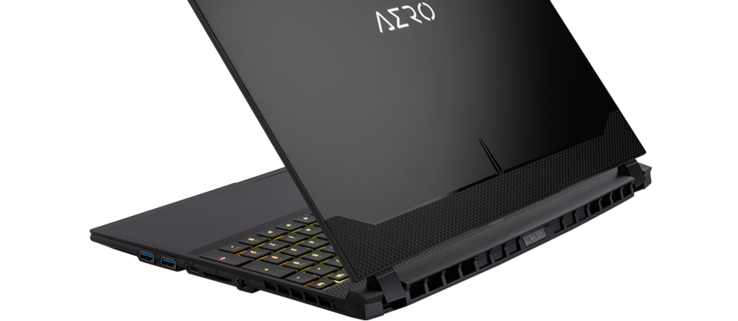
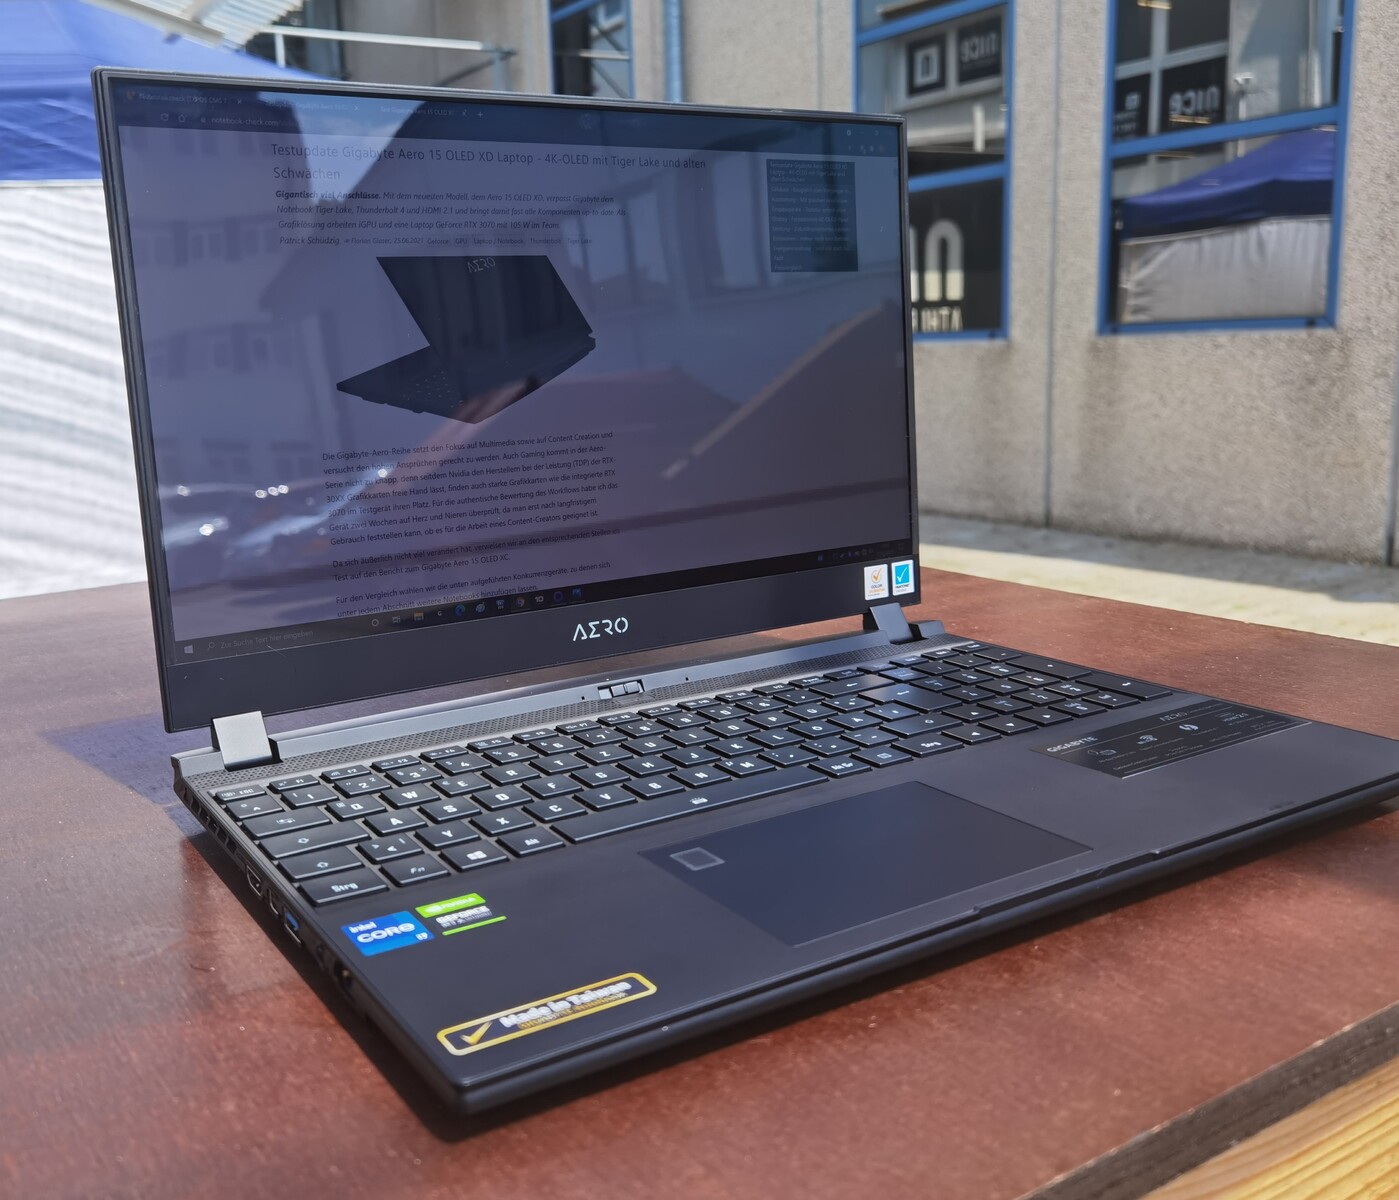
Since the case hasn't changed much compared to the predecessor, we refer to the Gigabyte Aero 15 OLED XC here. Only the pattern of the display lid's surface has undergone a change. It's also worth mentioning that the lid closes automatically when it has an aperture height of around 10 centimeters or below. In addition, the display lid's upper bezel is recessed, which makes it easier to lift the lid.
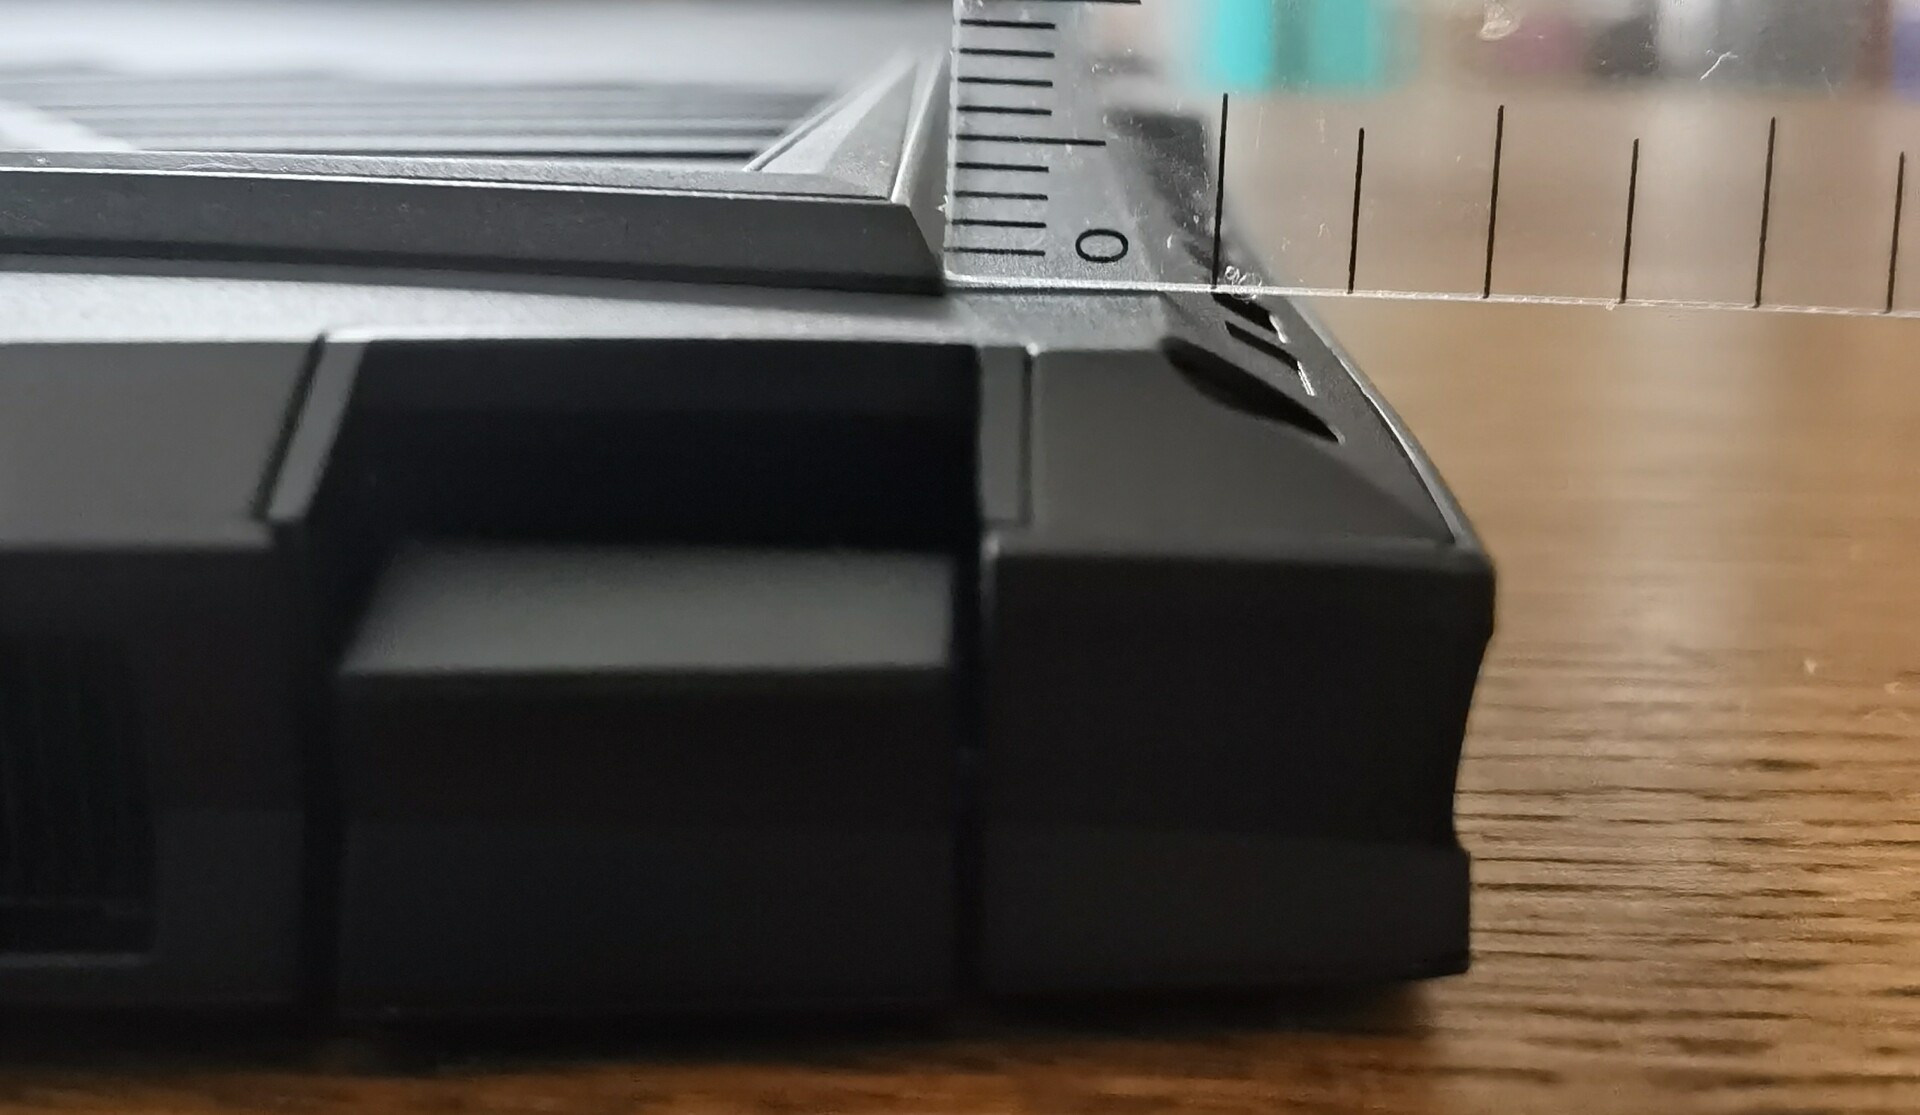
The size and weight haven't changed, either. If you compare the test device with the competition, the Aero 15 OLED XD stands out with the lowest weight and a height of two centimeters.
Connectivity - Same ports, upgrade to Thunderbolt 4
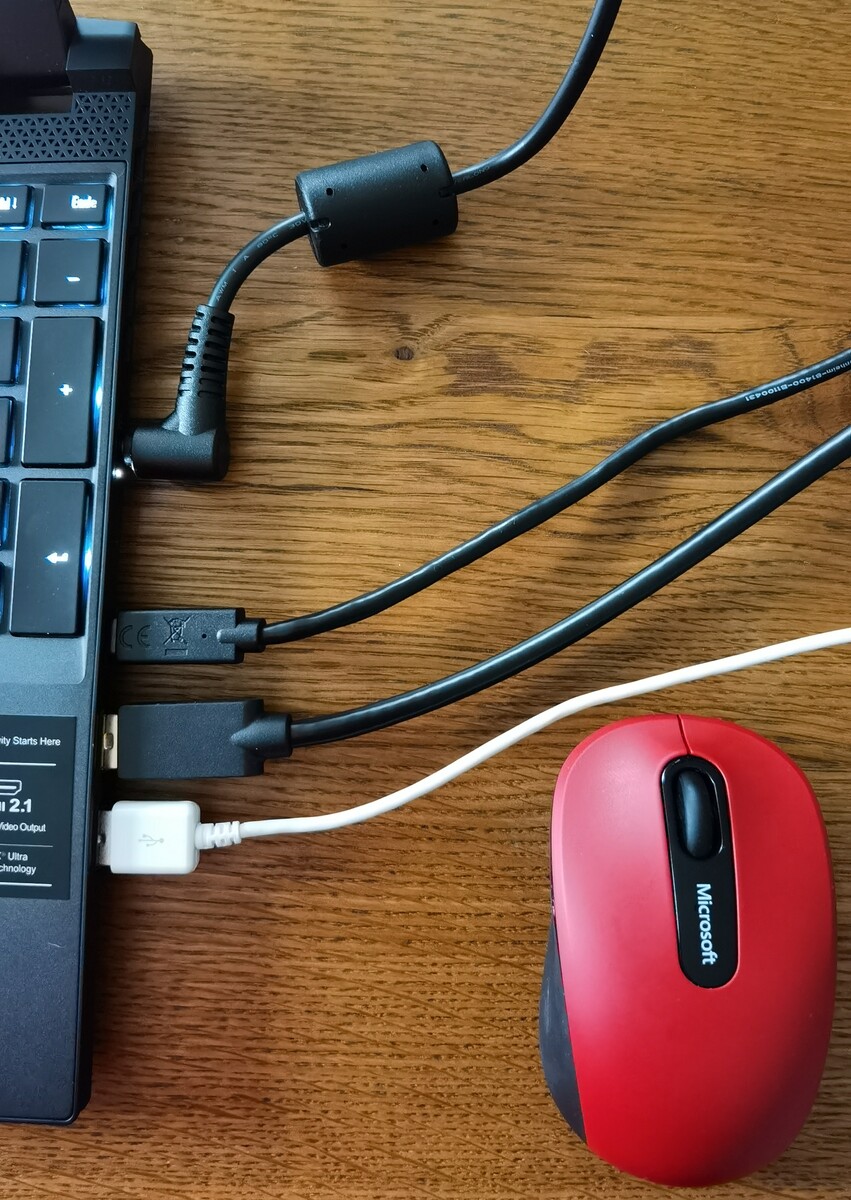
The Aero 15 OLED XD is equipped with all the ports a creator could need. These include a full-fledged SD card reader and an Ethernet port. The fact that Gigabyte has managed to integrate a complete Ethernet port into the slim chassis is remarkable! Unfortunately, however, nothing has changed in comparison to the predecessor apart from the addition of the Thunderbolt 4 port. We would have wished for a better placement of the ports on the right, since working with a mouse is difficult when the power adapter, the Thunderbolt 4 port, and the two USB Type-A ports are in use. Unfortunately, Gigabyte sacrificed the entire rear section in favor of the cooling system, where at least the power supply is usually found.


SD card reader
The Aero 15 OLED XD has a full-fledged SD card reader that delivers good results with our 128 GB UHS-II AV PRO V60 microSD reference memory card. The predecessor managed about 10% higher performance with the Toshiba Exceria Pro at the same read speed.
| SD Card Reader | |
| average JPG Copy Test (av. of 3 runs) | |
| Gigabyte Aero 15 OLED XC (Toshiba Exceria Pro SDXC 64 GB UHS-II) | |
| Aorus 15P XC (Toshiba Exceria Pro SDXC 64 GB UHS-II) | |
| Gigabyte Aero 15 OLED XD (AV PRO microSD 128 GB V60) | |
| Alienware m15 R4 (AV PRO microSD 128 GB V60) | |
| Average of class Gaming (20 - 207, n=72, last 2 years) | |
| maximum AS SSD Seq Read Test (1GB) | |
| Alienware m15 R4 (AV PRO microSD 128 GB V60) | |
| Gigabyte Aero 15 OLED XC (Toshiba Exceria Pro SDXC 64 GB UHS-II) | |
| Aorus 15P XC (Toshiba Exceria Pro SDXC 64 GB UHS-II) | |
| Gigabyte Aero 15 OLED XD (AV PRO microSD 128 GB V60) | |
| Average of class Gaming (25.8 - 261, n=71, last 2 years) | |
Communication
Gigabyte keeps using the Intel AX200 WLAN module, which supports Bluetooth 5.1 and Wi-Fi 6 among other things (the rates are still slightly higher than with the predecessor). In comparison, the Asus TUF Gaming A15 outperforms our review sample by 19% in the data transfer test and even by a whole 40% in the data reception test.
Webcam
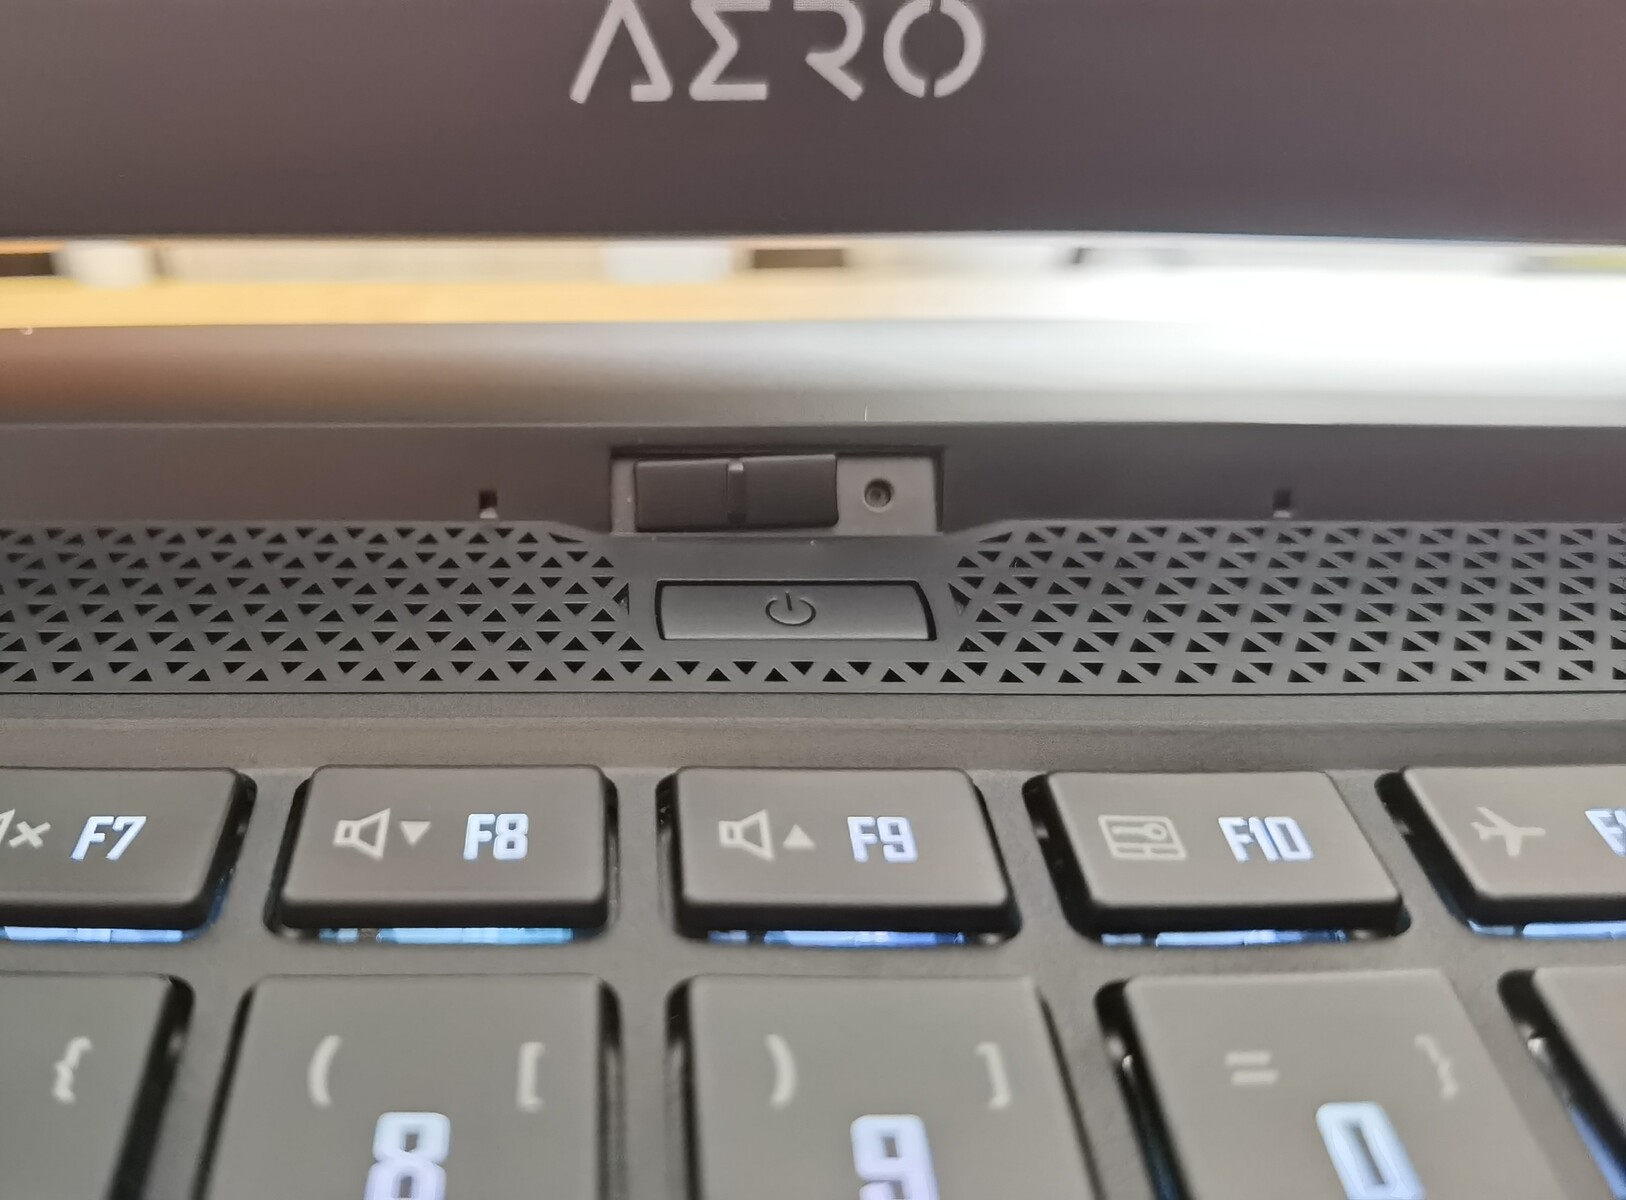
The selection of the webcam's position raises a few questions on our part. Although there's a manual switch here to hide the webcam, it has an inferior quality compared to the case. Furthermore, it provides an unfavorable viewing angle from below. Anyone who's dependent on a webcam would wish for a better one here. Above all, there would have been enough room for a larger sensor and a resulting improvement in resolution. In our opinion, the narrow display bezel could have been forgone in the top area in order to at least provide a webcam in a normal position.


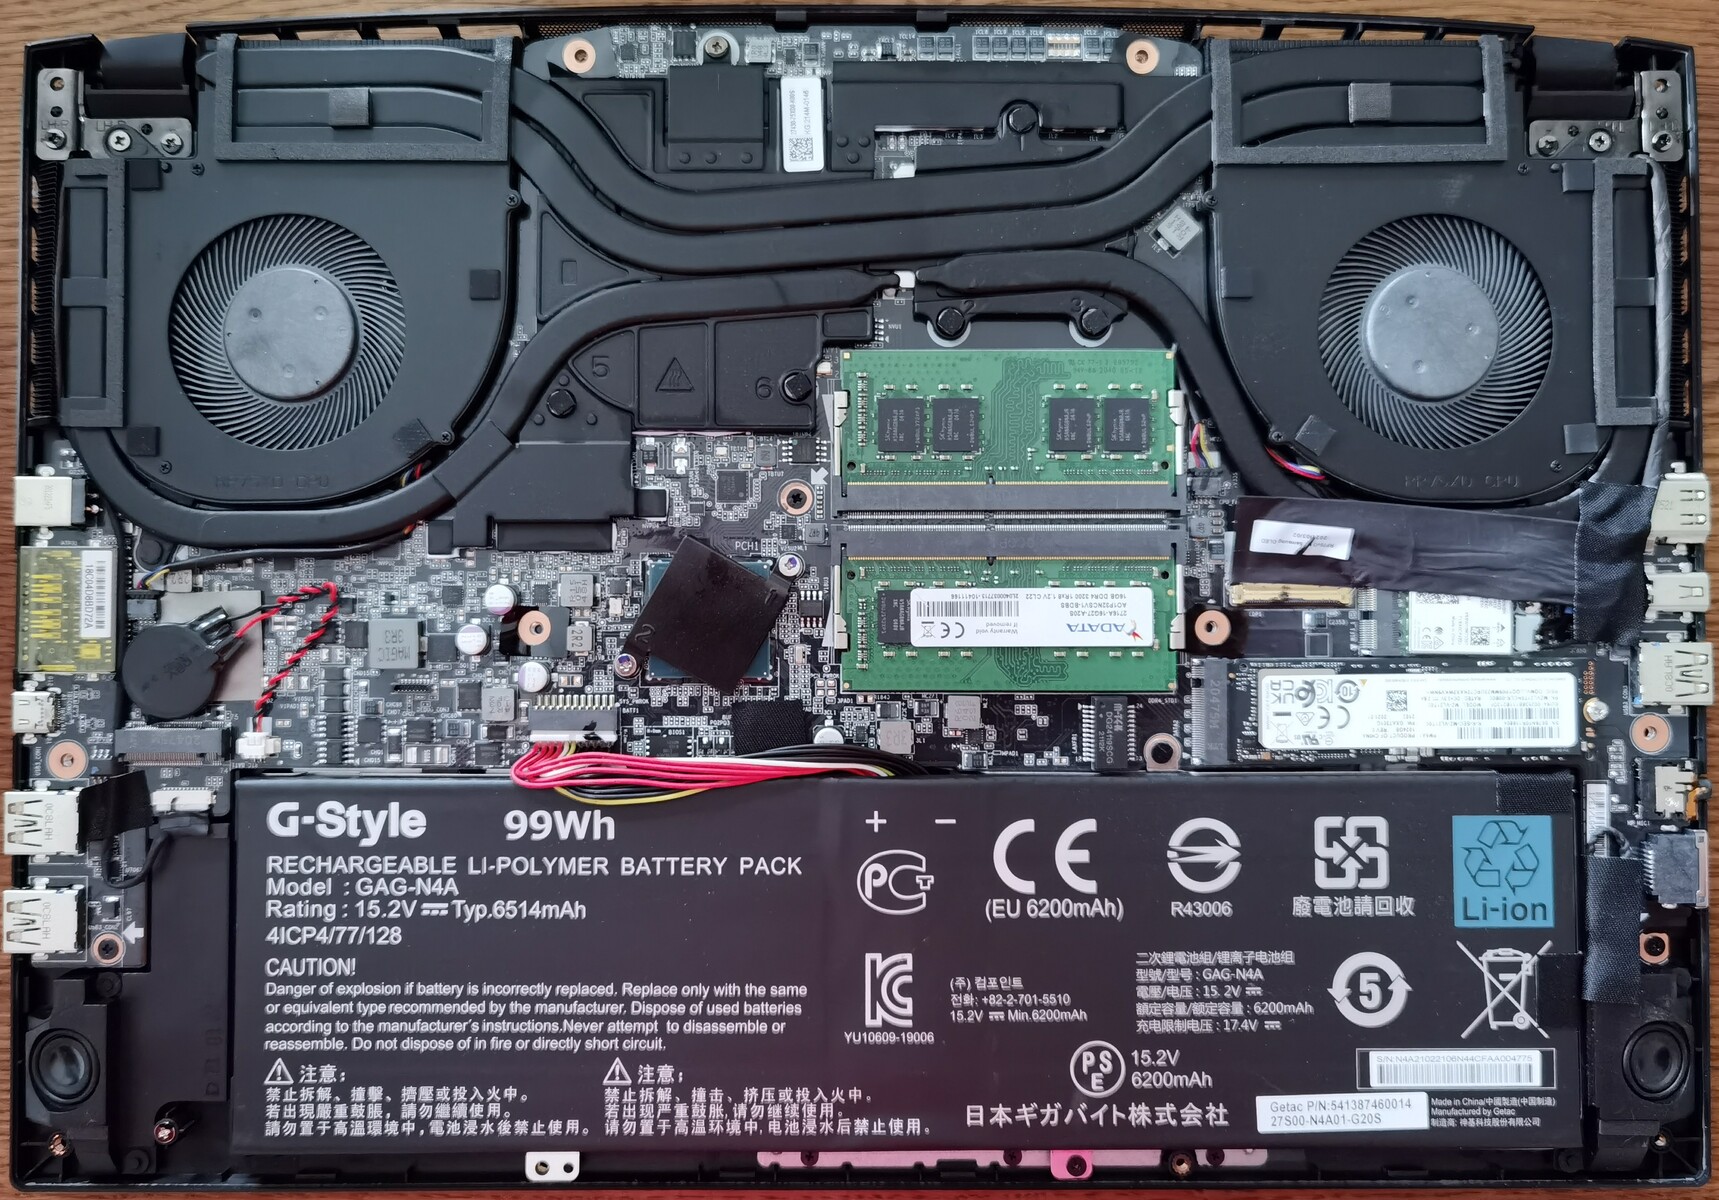
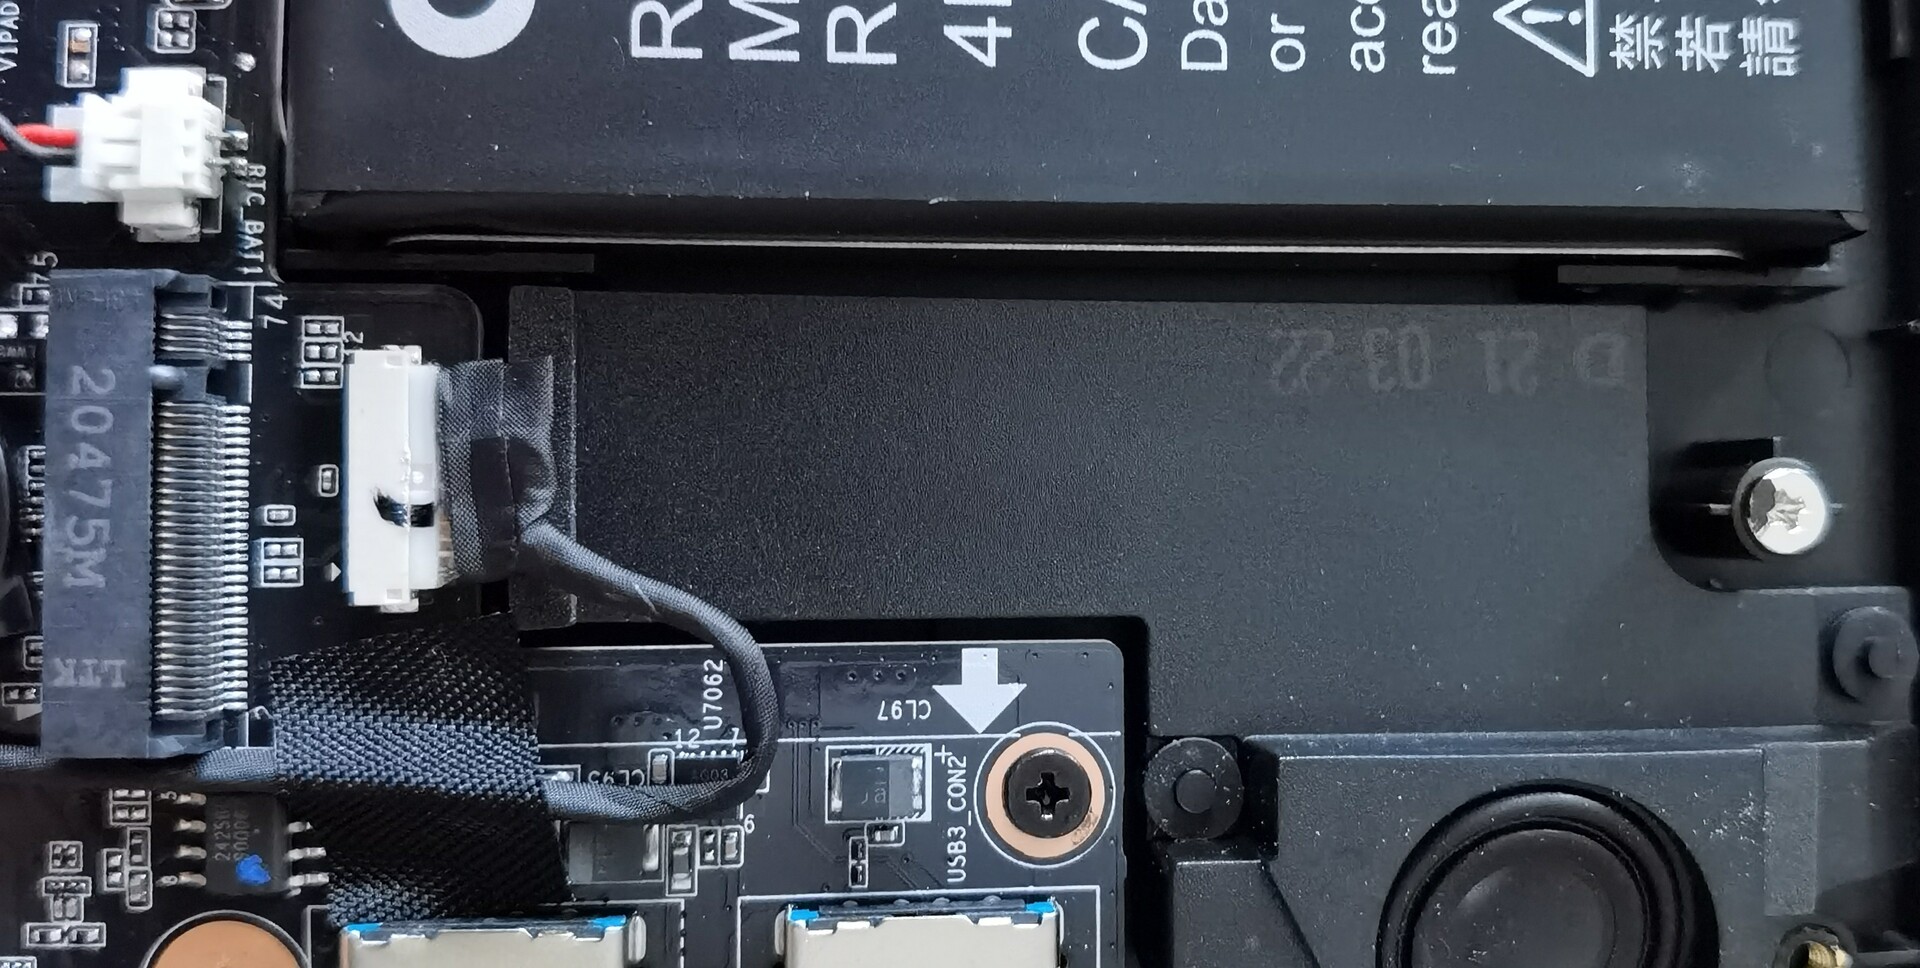
Maintenance
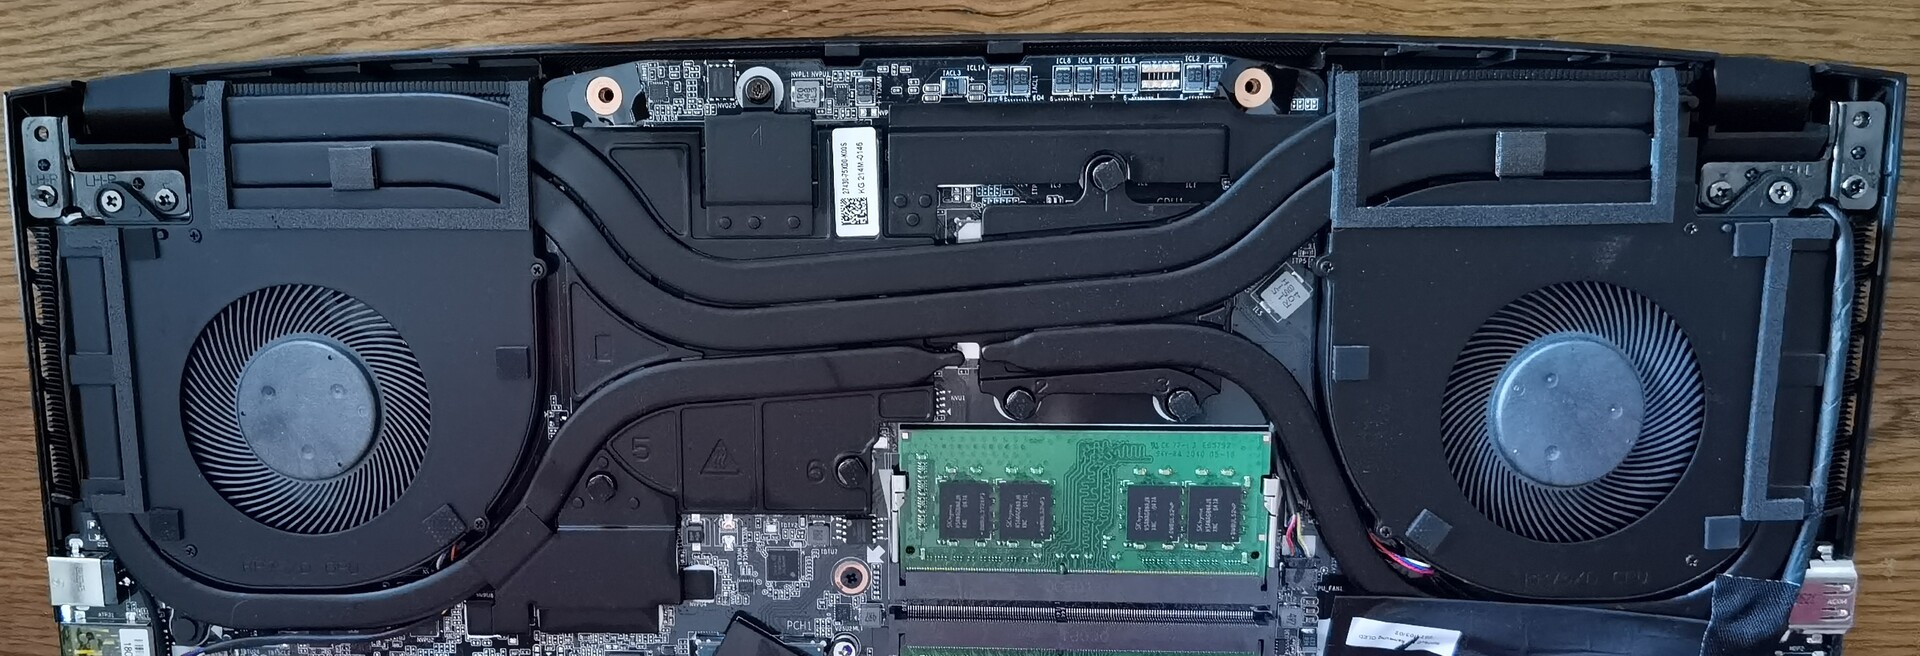
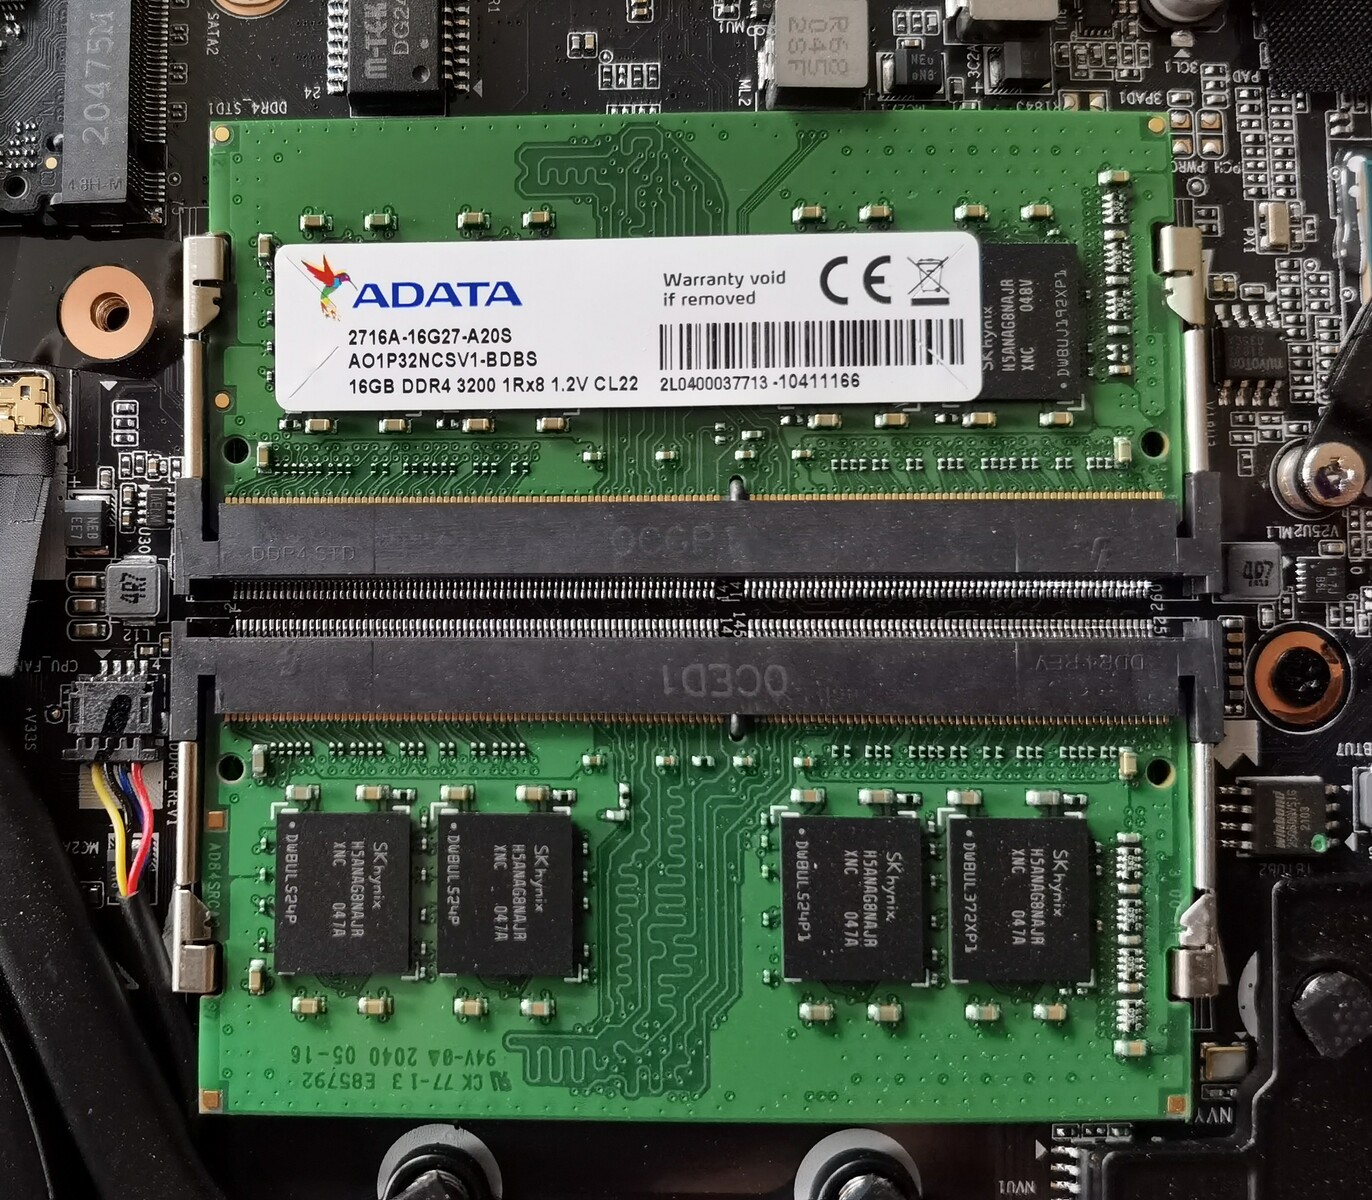
In order to be able to open the case, 12 Torx TR6 screws need to be removed. Like in the predecessor, two of them are covered with seals. Judging from experience, Gigabyte probably wants to make it more difficult to open the device or to indicate whether the device has been opened in warranty cases. This also makes it difficult to replace the SSD, RAM, and WLAN module. Other components can't be replaced easily and with little effort. At least Gigabyte has made full use of the space in the Aero 15, allowing users to install a second M.2 SSD as a result.
Warranty
Gigabyte Germany offers users a two-year warranty period. If you want to extend the warranty, you have to register the device online.
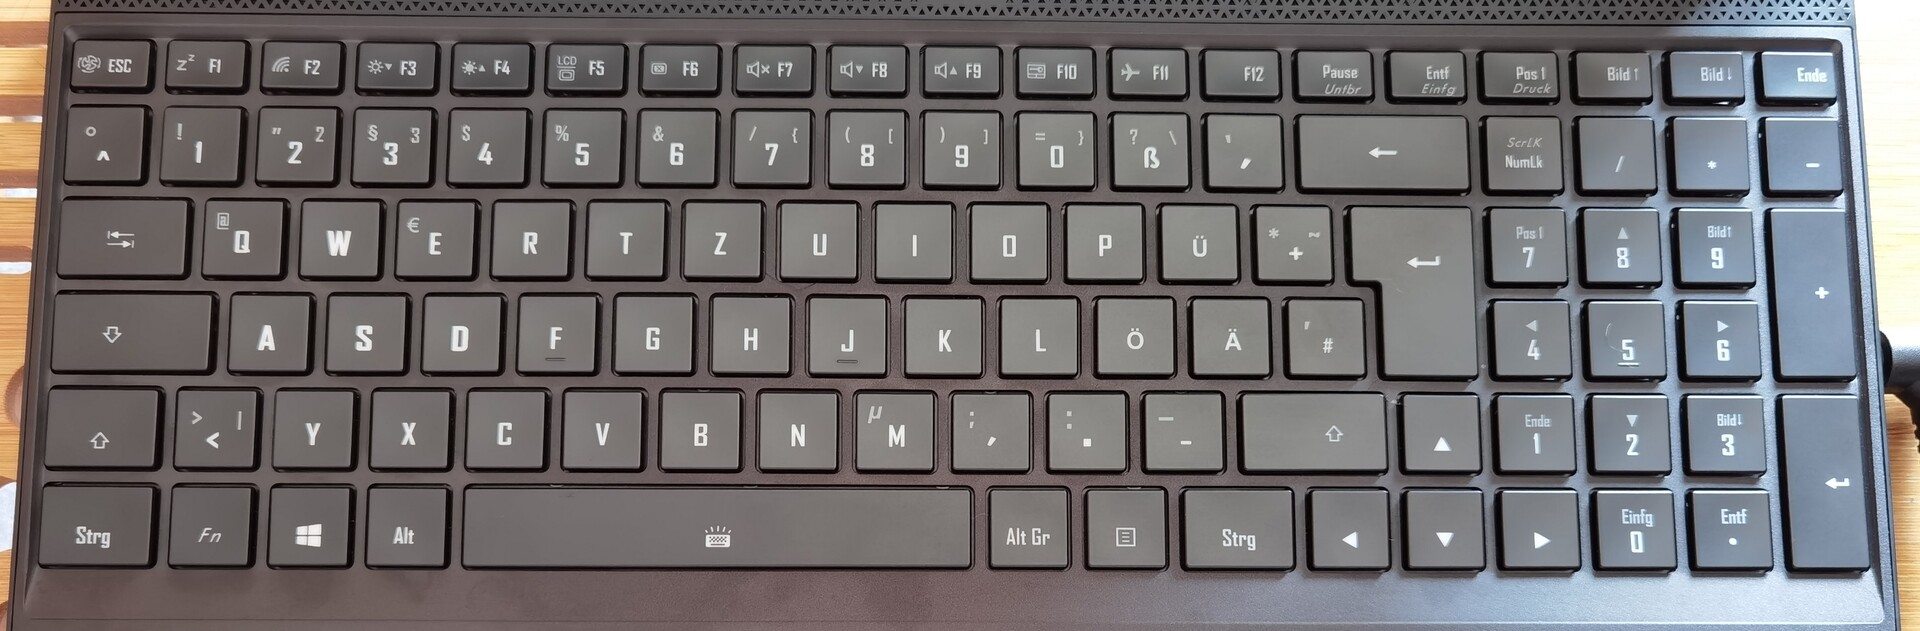
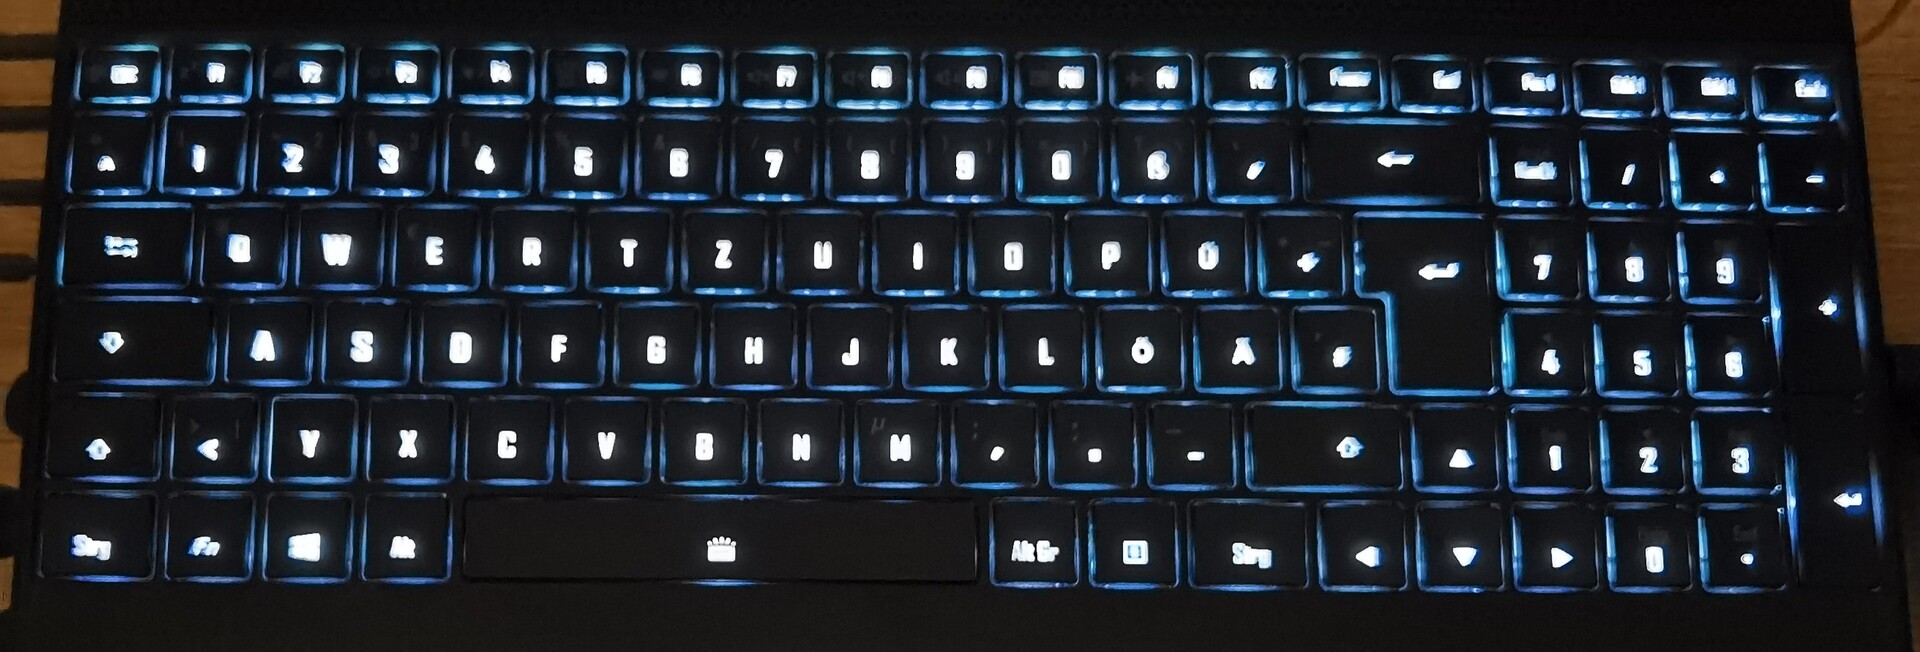
Input devices - Keyboard once again lacks illumination for special characters
Keyboard
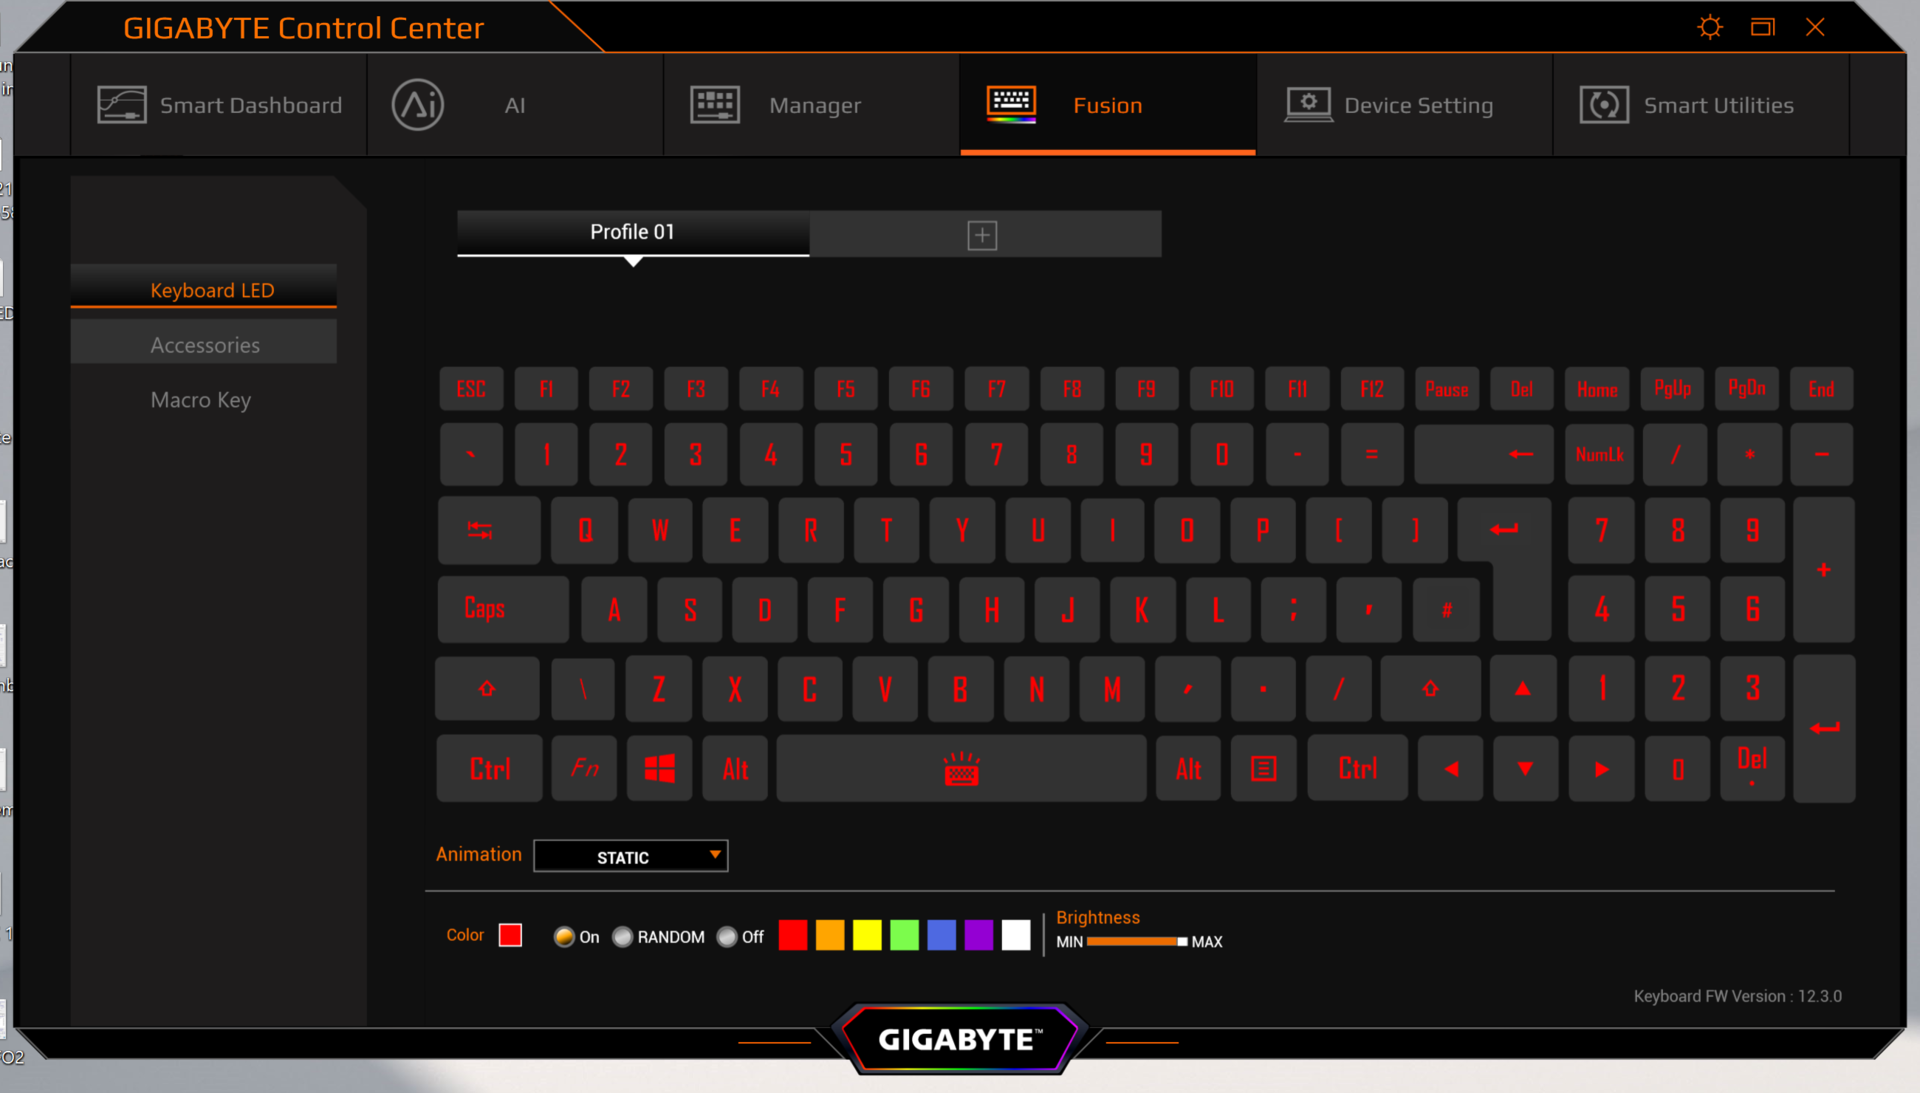
The Aero 15 OLED XD has a full-sized keyboard with normal-sized keys. The user will experience a rather mushy typing experience and a rather poor and imprecise pressure point. The key volume is average and could be perceived as being too loud by sensitive users. We noticed a "squeaking" noise when pressing the space bar lightly. In addition, it feels very wobbly, which often led to typos when entering longer text passages. Gigabyte could have learned from its predecessor when it comes to the individual RGB lighting, because once again, the keyboard's special characters are not illuminated. As a result, it's hard or even impossible to recognize the special characters at night or in poor lighting conditions, something that we found to be quite annoying. Furthermore, the keyboard is very susceptible to fingerprints.
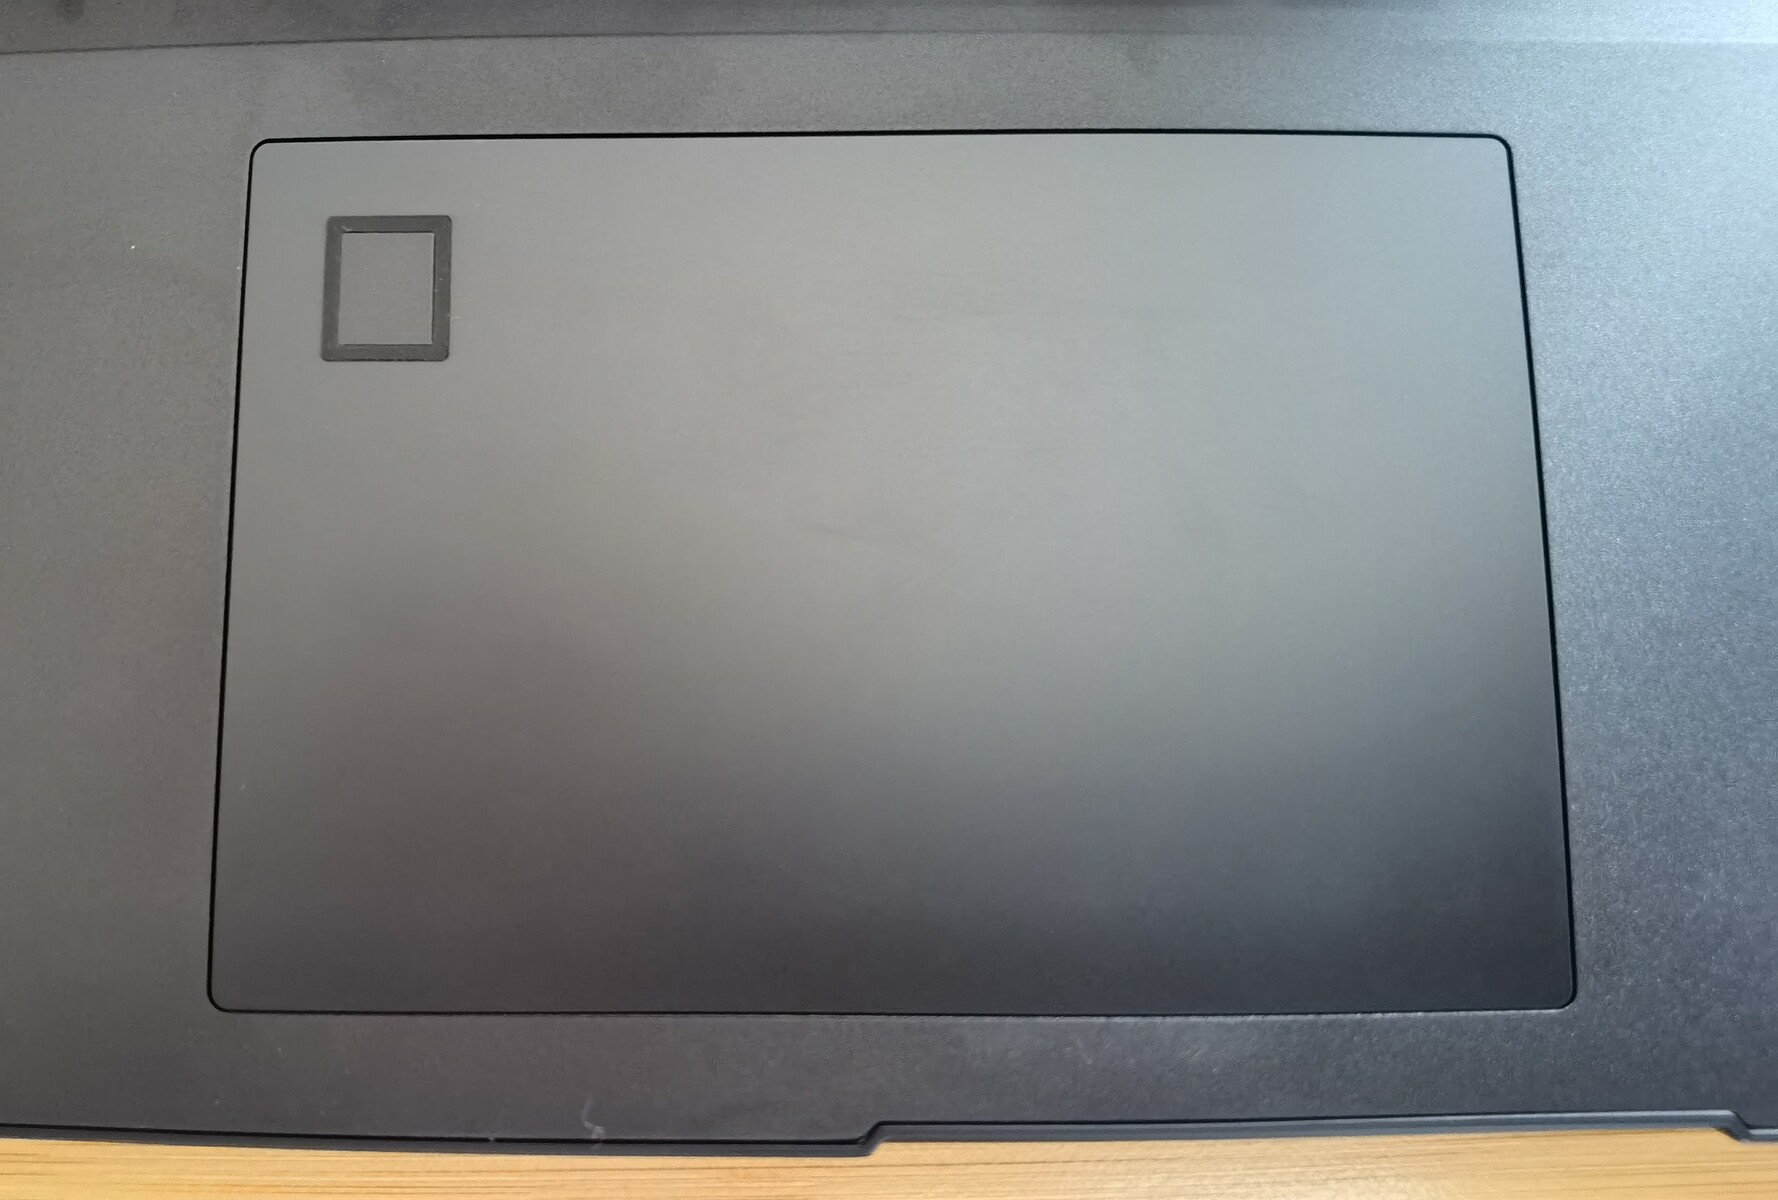
Touchpad
As in the predecessor, the touchpad is compact but offers good gliding properties. The integrated fingerprint sensor further hinders the use of the already small touchpad. The integrated mouse buttons have a clear pressure point and decent feedback. The touchpad is also susceptible to fingerprints.
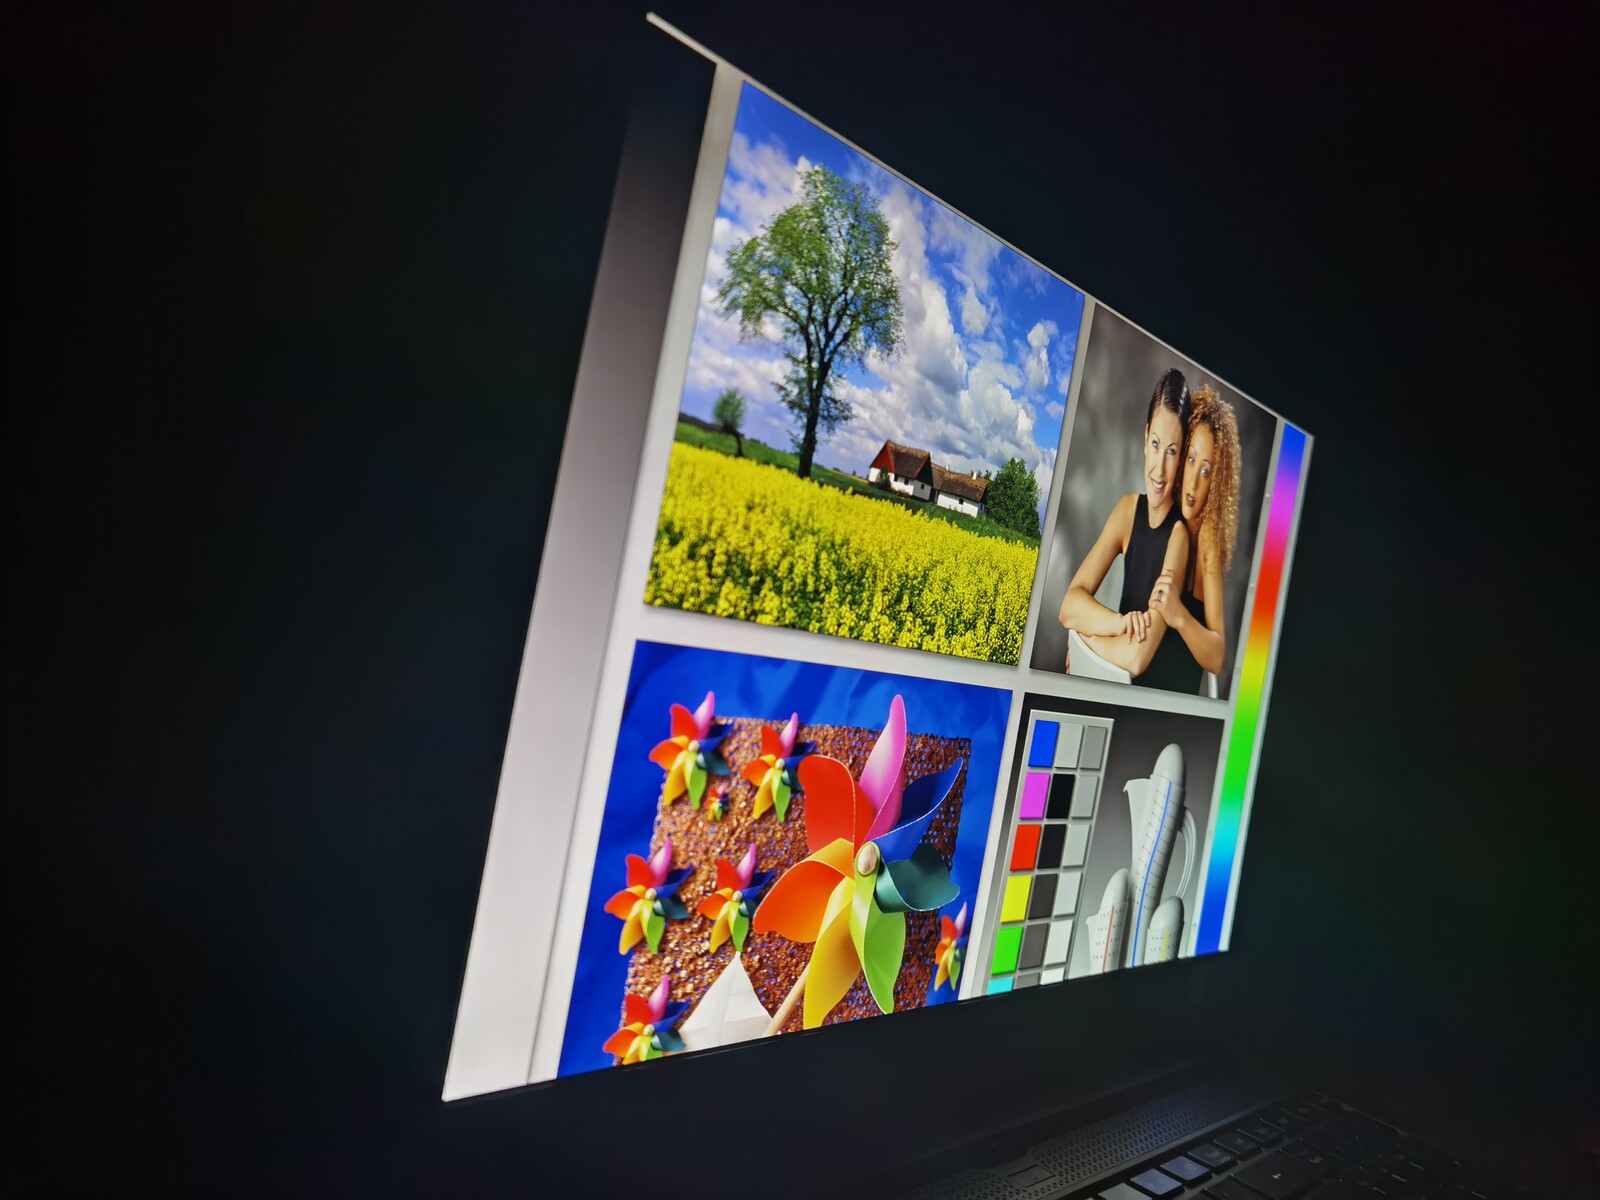
Display - Fantastic 4K OLED panel with 60 Hz
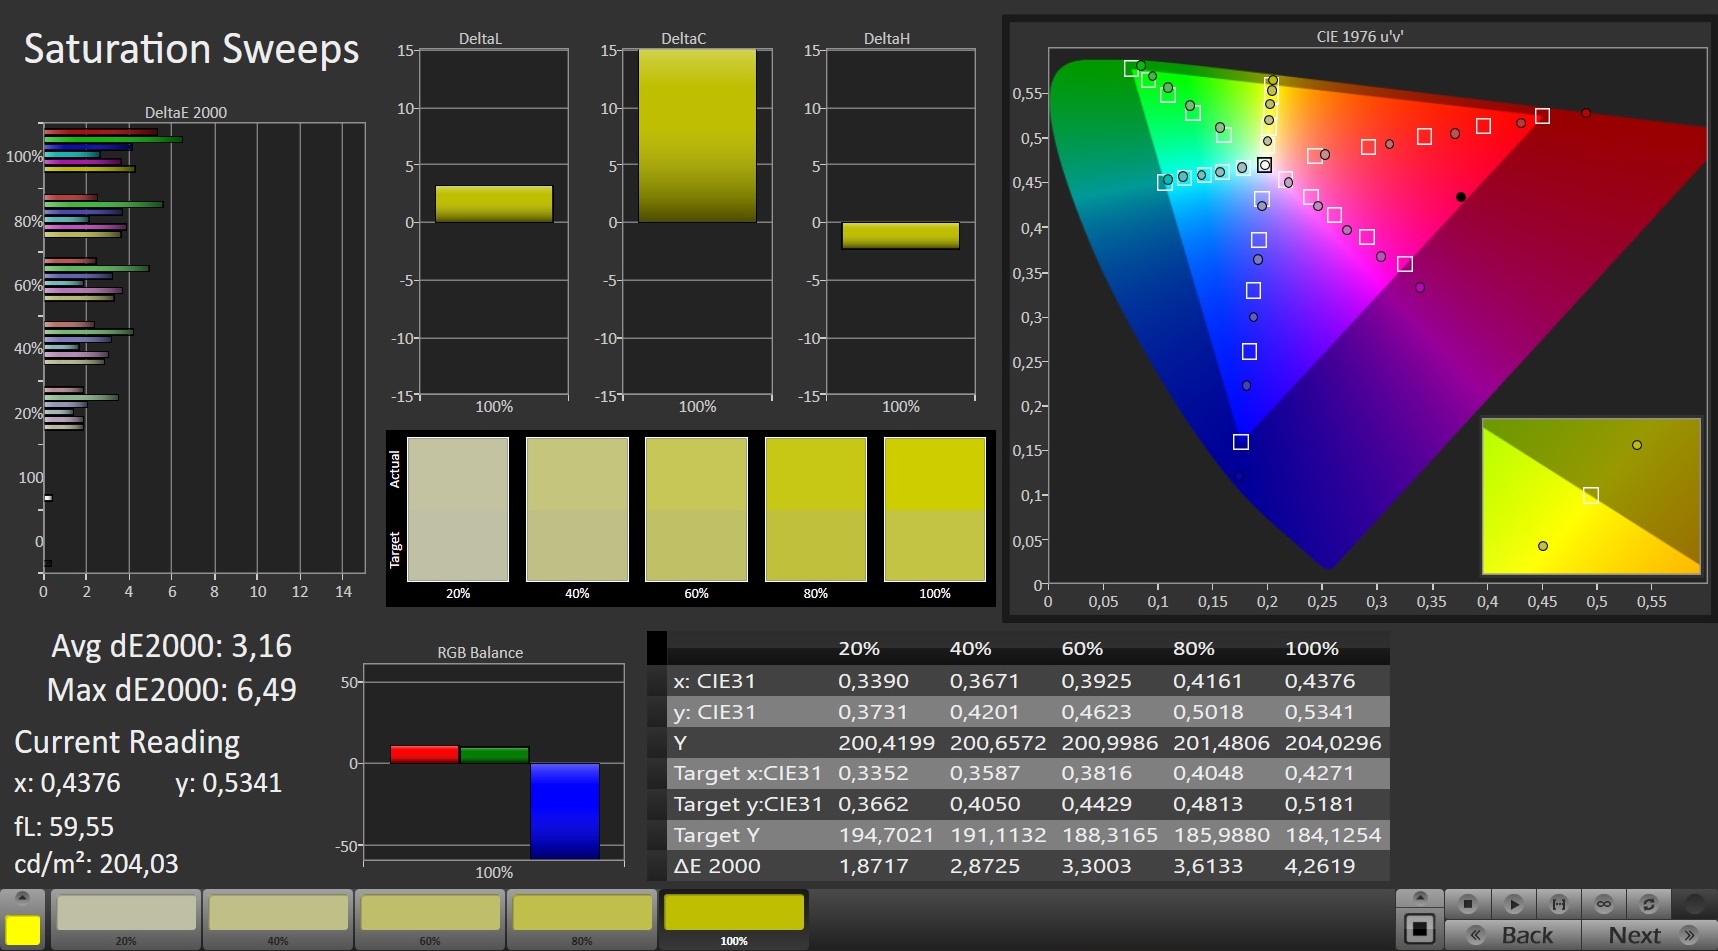
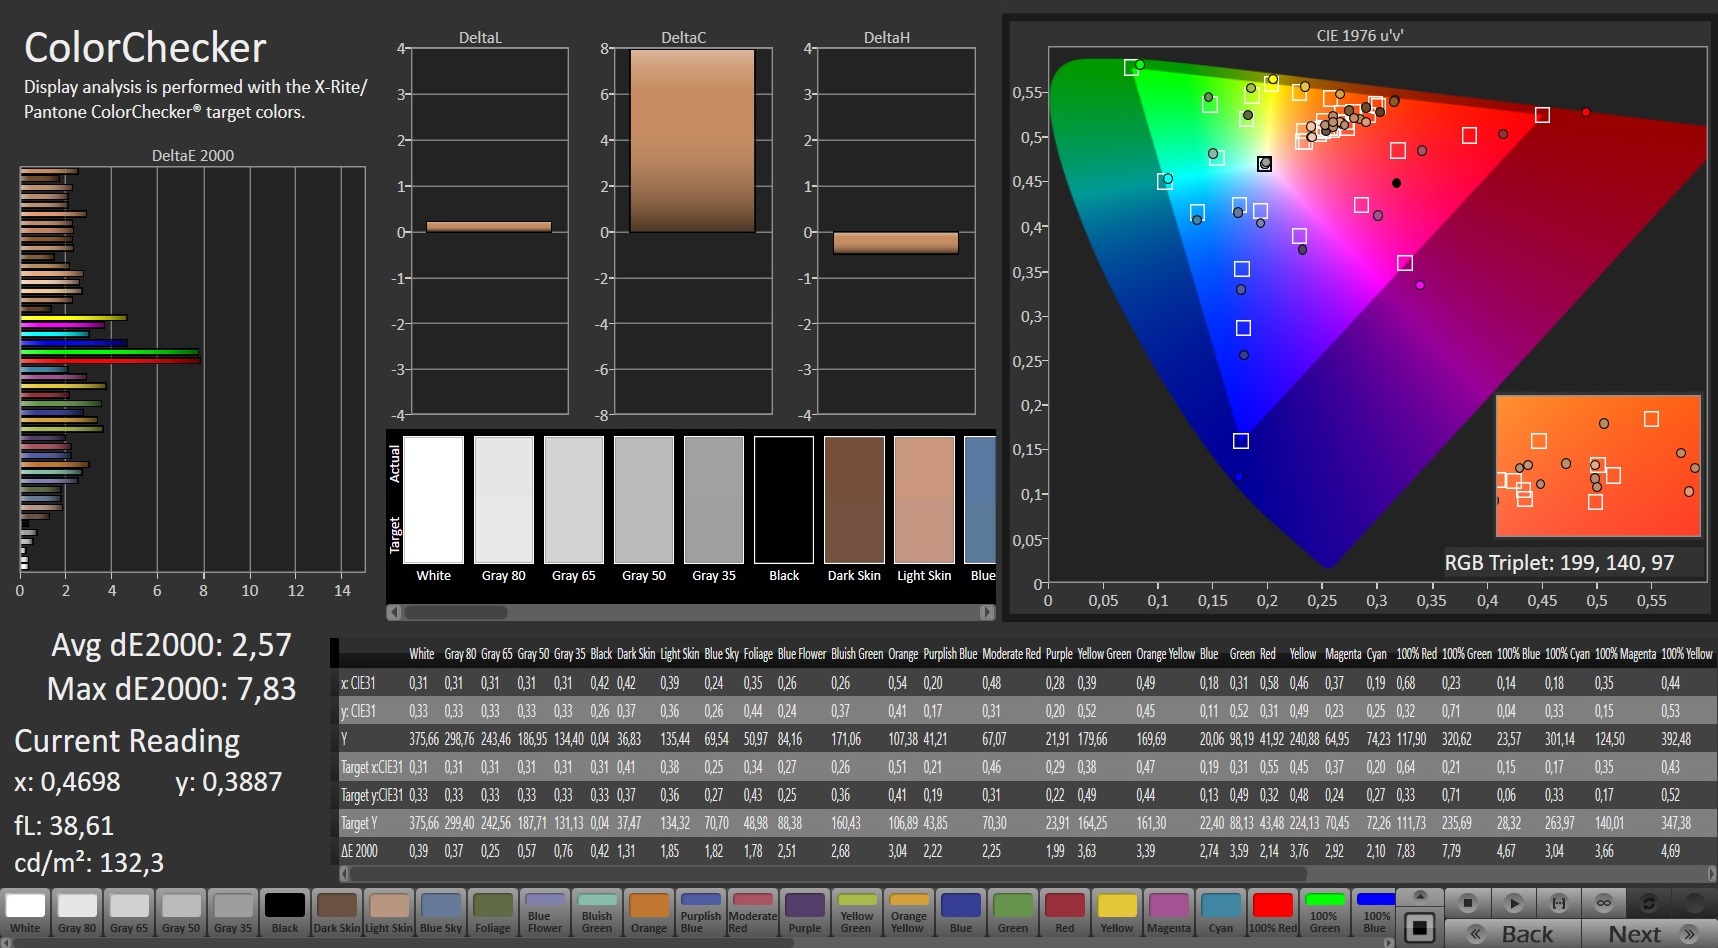
The 4K AMOLED panel used has a resolution of 3840x2160 pixels and features a Pantone X-Rite certification, which makes the device particularly appealing for designers and professional image editors. The resulting color accuracy combined with the OLED panel delivers a very good picture. Gigabyte gets almost everything right here, as the high resolution provides more space on the display. This also becomes noticeable when editing videos, for instance with a longer timeline in Adobe Premiere.
Unfortunately, there is no 120 Hz option. The built-in panel only comes with a 60 Hz refresh rate, which puts users at a disadvantage when playing fast-paced games.
As is usual for OLED panels, brightness is regulated using PWM. Since the frequency here is low at 240 Hz, users can suffer from eye strain, headaches, and nausea during longer workflows.
| |||||||||||||||||||||||||
Brightness Distribution: 92 %
Center on Battery: 440 cd/m²
Contrast: 11000:1 (Black: 0.04 cd/m²)
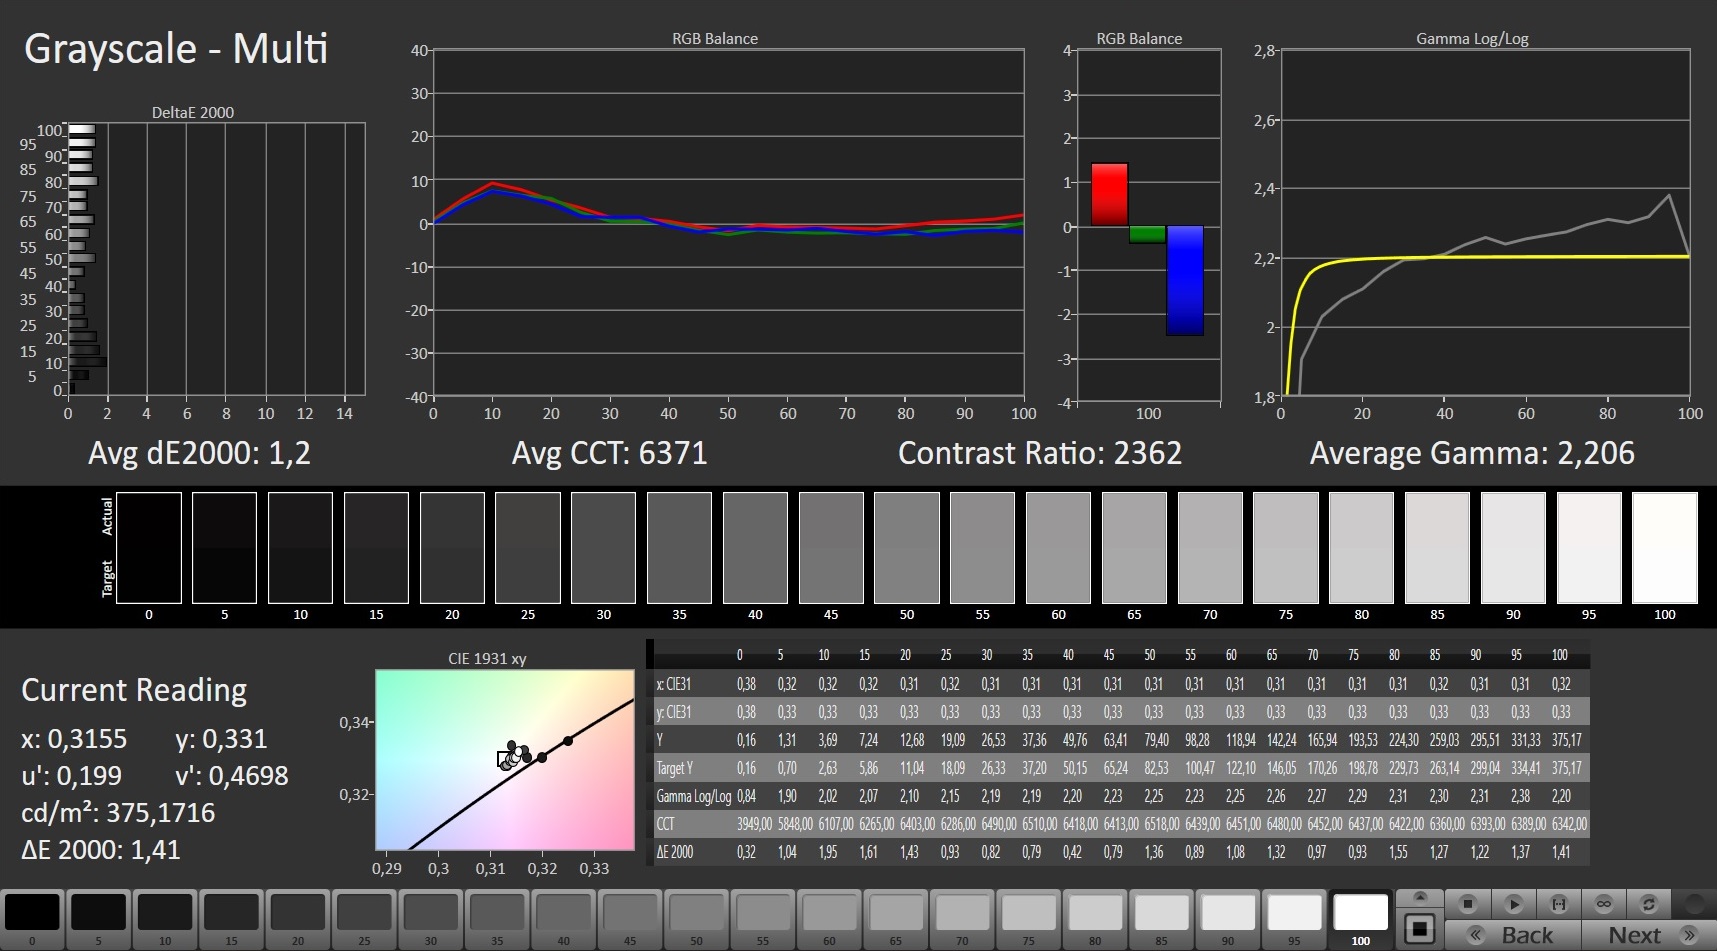
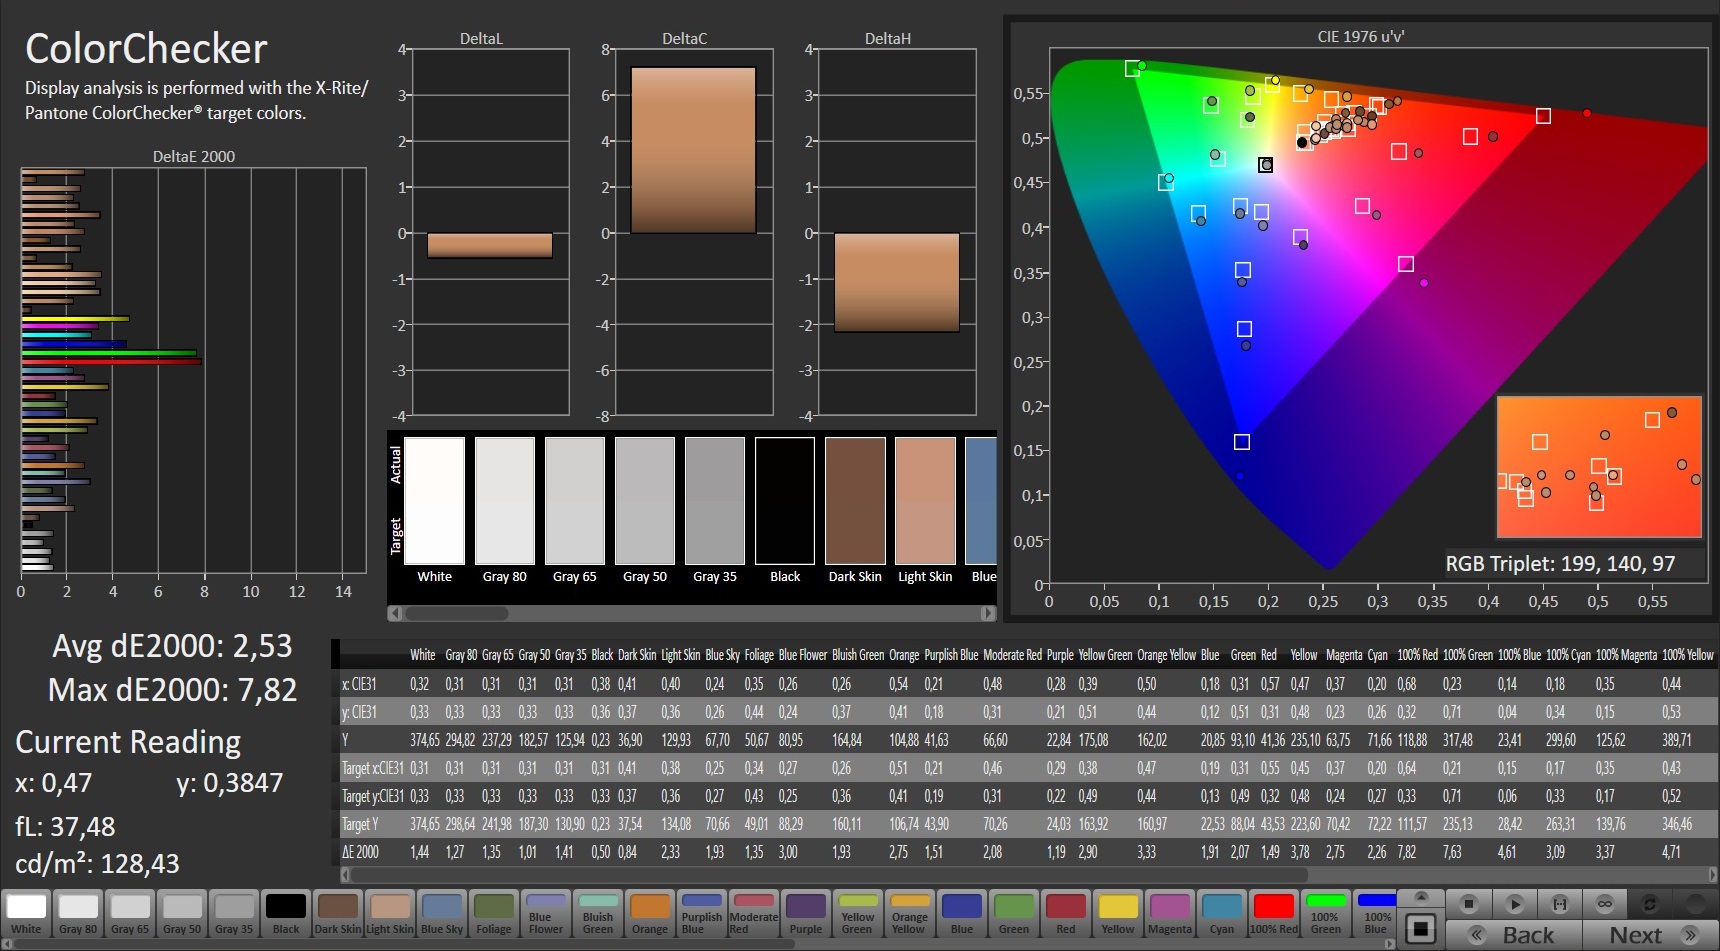
ΔE ColorChecker Calman: 2.53 | ∀{0.5-29.43 Ø4.82}
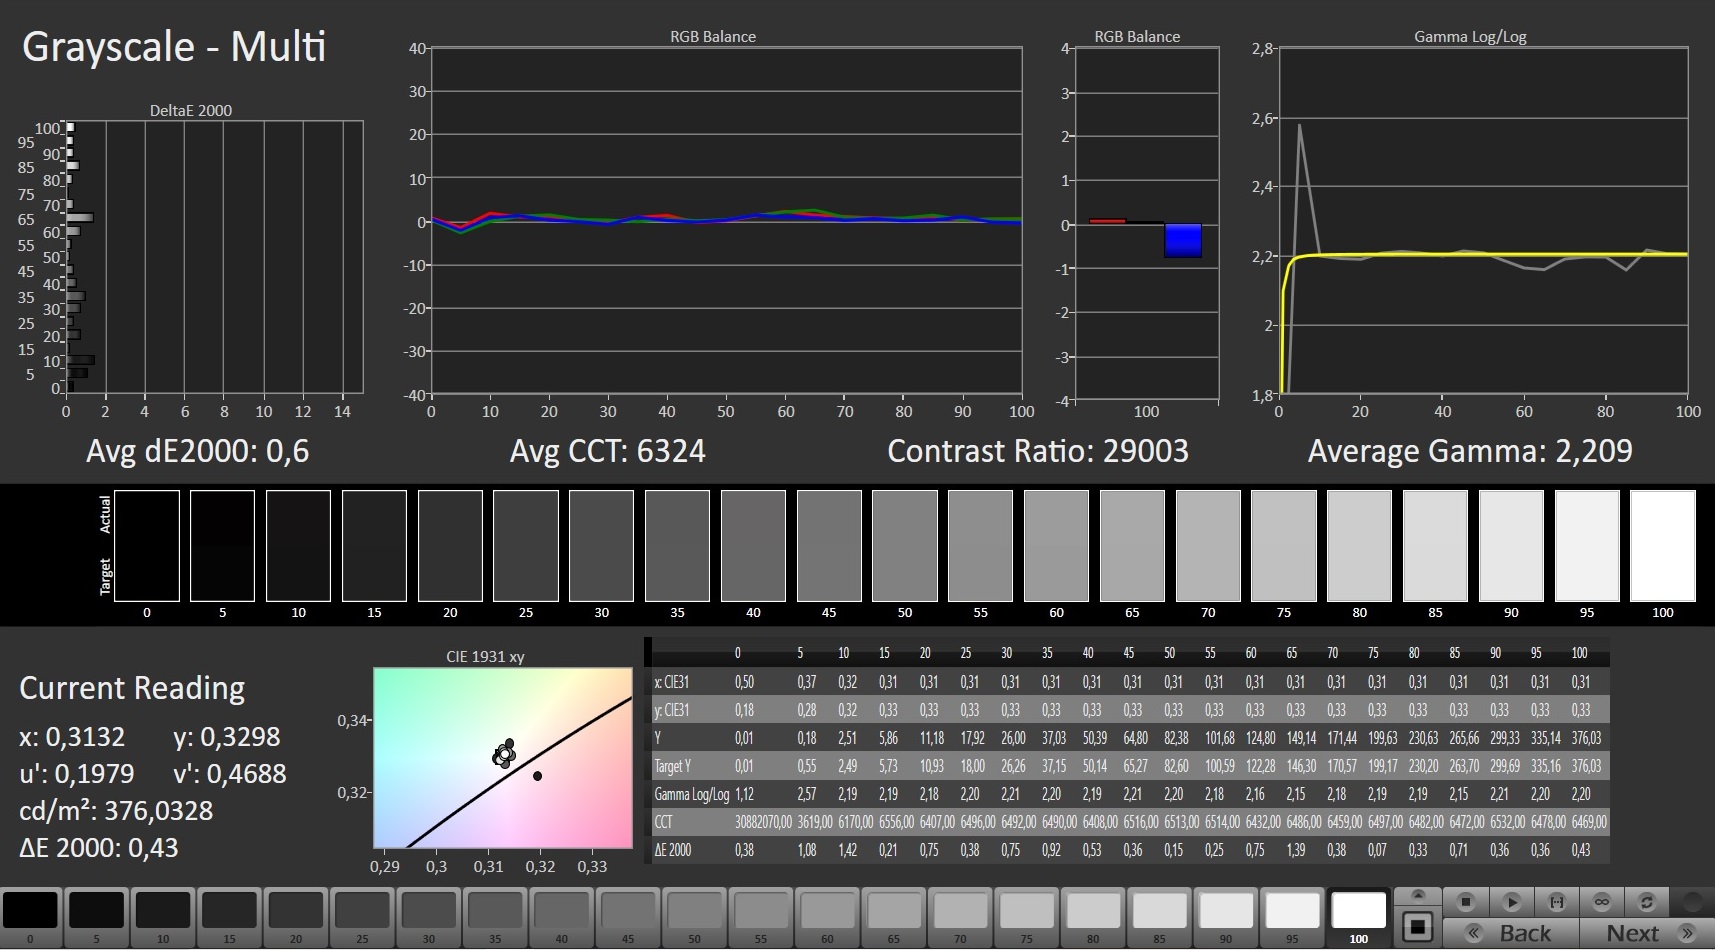
calibrated: 2.57
ΔE Greyscale Calman: 1.2 | ∀{0.09-98 Ø5.1}
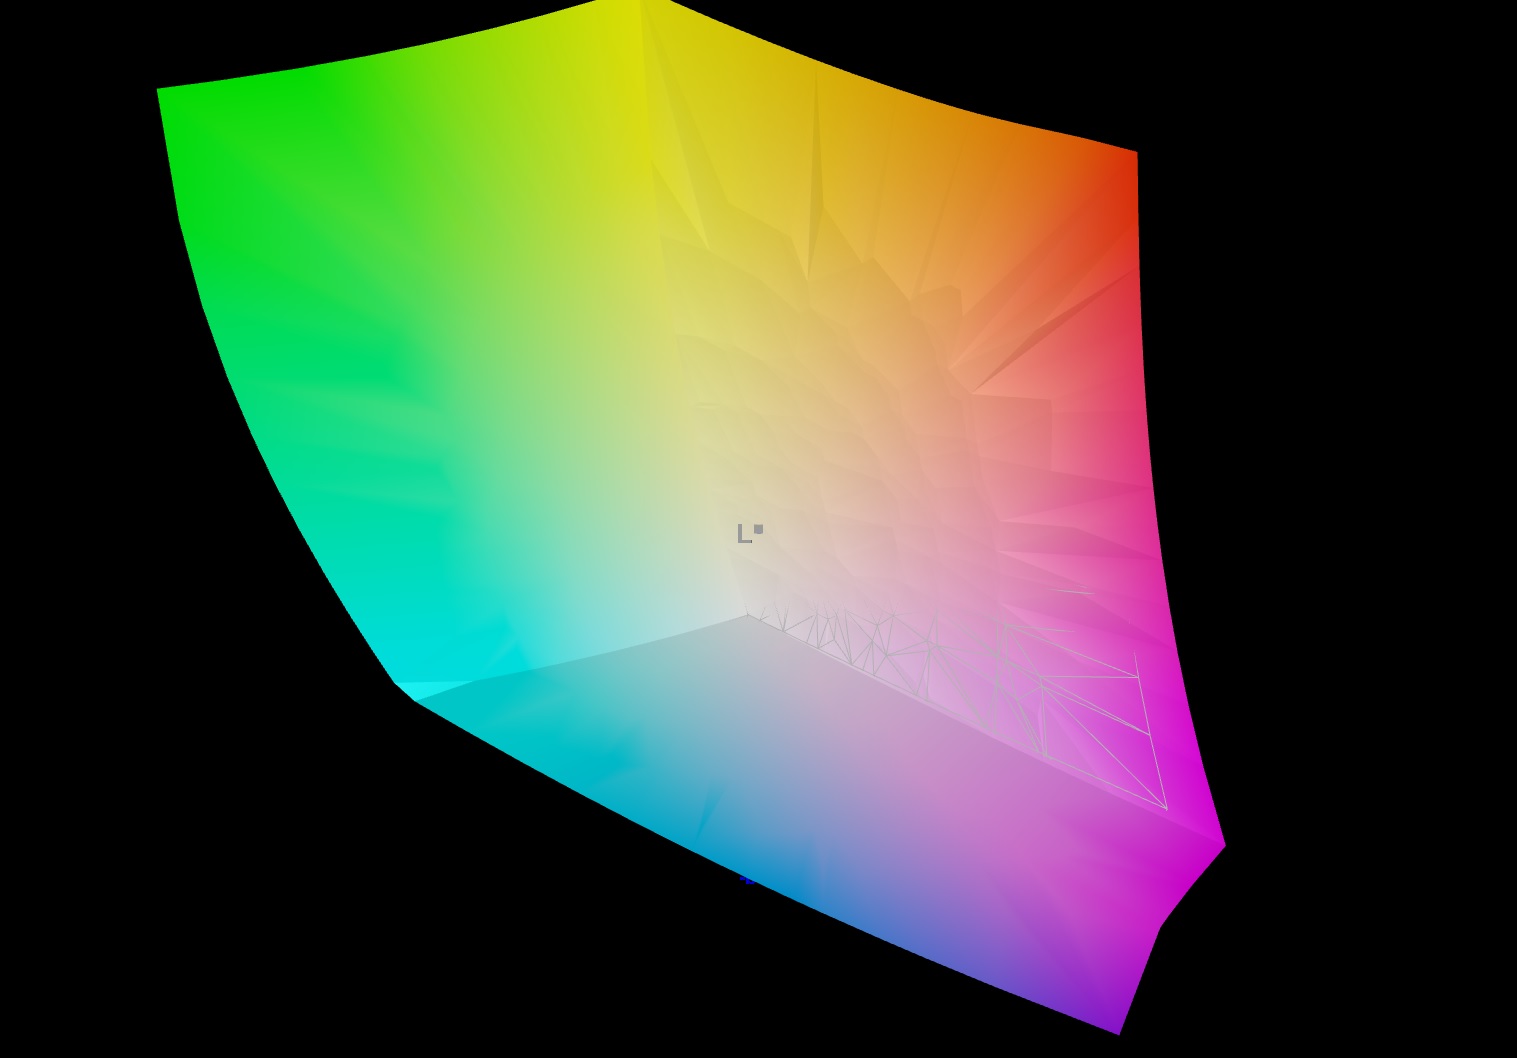
99.5% AdobeRGB 1998 (Argyll 3D)
100% sRGB (Argyll 3D)
99.9% Display P3 (Argyll 3D)
Gamma: 2.206
CCT: 6371 K
| Gigabyte Aero 15 OLED XD Samsung SDC4143, OLED, 3840x2160, 15.6" | Asus TUF Gaming A15 FA506QR-AZ061T Sharp SHP1532, IPS, 1920x1080, 15.6" | Asus ROG Strix G15 G513QR LQ156M1JW25, IPS, 1920x1080, 15.6" | Gigabyte Aero 15 OLED XC SDCA029, OLED, 3840x2160, 15.6" | Asus ZenBook Pro Duo UX582 LR-1BH2 SDC4143, OLED + IPS, 3840x2160, 15.6" | |
|---|---|---|---|---|---|
| Display | -23% | -0% | 0% | ||
| Display P3 Coverage | 99.9 | 67.7 -32% | 99.9 0% | 99.9 0% | |
| sRGB Coverage | 100 | 94.3 -6% | 100 0% | 100 0% | |
| AdobeRGB 1998 Coverage | 99.5 | 68.2 -31% | 98.5 -1% | 99.7 0% | |
| Response Times | -315% | -277% | 12% | -3% | |
| Response Time Grey 50% / Grey 80% * | 2.8 ? | 12 ? -329% | 8.2 ? -193% | 2.4 ? 14% | 2.4 ? 14% |
| Response Time Black / White * | 2 ? | 8 ? -300% | 9.2 ? -360% | 1.8 ? 10% | 2.4 ? -20% |
| PWM Frequency | 240 ? | 1250 ? | 240 ? | 59.5 ? | |
| Screen | -72% | -103% | -3% | -20% | |
| Brightness middle | 440 | 297 -32% | 308 -30% | 442 0% | 345 -22% |
| Brightness | 446 | 268 -40% | 288 -35% | 452 1% | 332 -26% |
| Brightness Distribution | 92 | 84 -9% | 86 -7% | 95 3% | 87 -5% |
| Black Level * | 0.04 | 0.22 -450% | 0.23 -475% | 0.05 -25% | |
| Contrast | 11000 | 1350 -88% | 1339 -88% | 8840 -20% | |
| Colorchecker dE 2000 * | 2.53 | 1.36 46% | 3.28 -30% | 2.69 -6% | 3.3 -30% |
| Colorchecker dE 2000 max. * | 7.82 | 3.82 51% | 8.51 -9% | 8.27 -6% | 7.2 8% |
| Colorchecker dE 2000 calibrated * | 2.57 | 0.83 68% | 2.59 -1% | 2.6 -1% | |
| Greyscale dE 2000 * | 1.2 | 1.88 -57% | 5 -317% | 0.9 25% | 2 -67% |
| Gamma | 2.206 100% | 2.48 89% | 2.057 107% | 2.172 101% | 2.01 109% |
| CCT | 6371 102% | 6768 96% | 7393 88% | 6434 101% | 6566 99% |
| Color Space (Percent of AdobeRGB 1998) | 63 | 68 | 99 | 89.2 | |
| Color Space (Percent of sRGB) | 99 | 90 | 100 | 100 | |
| Total Average (Program / Settings) | -194% /
-121% | -134% /
-110% | 3% /
-0% | -8% /
-12% |
* ... smaller is better
The glossy 4K display is razor-sharp, and all other values, such as the black level and contrast ratio, also deliver fantastic scores thanks to the OLED technology. With our measurement, we can also confirm that the laptop is very well suited for digital image and video editing. With a coverage of 100% and 99.5%, respectively, the sRGB and AdobeRGB color spaces are (almost) completely covered.
When it comes to display brightness, you get good rates here. The brightness distribution is 92%, and the maximum brightness is about 446 cd/m² according to our independent measurements.

Outdoor use is possible with the Aero 15 OLED XD, but you should look for a place in the shade, because the display offers a high brightness, but it's also reflective.

Display Response Times
| ↔ Response Time Black to White | ||
|---|---|---|
| 2 ms ... rise ↗ and fall ↘ combined | ↗ 1 ms rise | 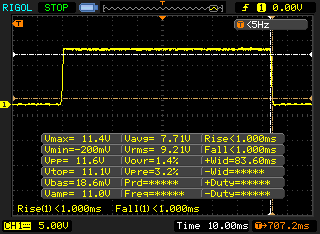 |
| ↘ 1 ms fall | ||
| The screen shows very fast response rates in our tests and should be very well suited for fast-paced gaming. In comparison, all tested devices range from 0.1 (minimum) to 240 (maximum) ms. » 9 % of all devices are better. This means that the measured response time is better than the average of all tested devices (20.4 ms). | ||
| ↔ Response Time 50% Grey to 80% Grey | ||
| 2.8 ms ... rise ↗ and fall ↘ combined | ↗ 1.6 ms rise | 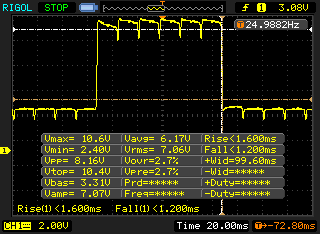 |
| ↘ 1.2 ms fall | ||
| The screen shows very fast response rates in our tests and should be very well suited for fast-paced gaming. In comparison, all tested devices range from 0.165 (minimum) to 636 (maximum) ms. » 10 % of all devices are better. This means that the measured response time is better than the average of all tested devices (31.9 ms). | ||
Screen Flickering / PWM (Pulse-Width Modulation)
| Screen flickering / PWM detected | 240 Hz | ≤ 83 % brightness setting | 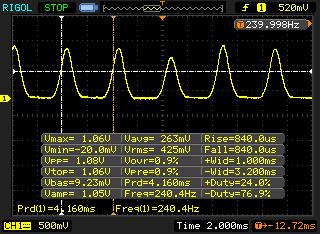 |
The display backlight flickers at 240 Hz (worst case, e.g., utilizing PWM) Flickering detected at a brightness setting of 83 % and below. There should be no flickering or PWM above this brightness setting. The frequency of 240 Hz is relatively low, so sensitive users will likely notice flickering and experience eyestrain at the stated brightness setting and below. In comparison: 53 % of all tested devices do not use PWM to dim the display. If PWM was detected, an average of 8287 (minimum: 5 - maximum: 343500) Hz was measured. | |||
Thanks to the OLED panel, the viewing angles of the Aero 15 are excellent in all directions.
Performance - Future-proof performance package
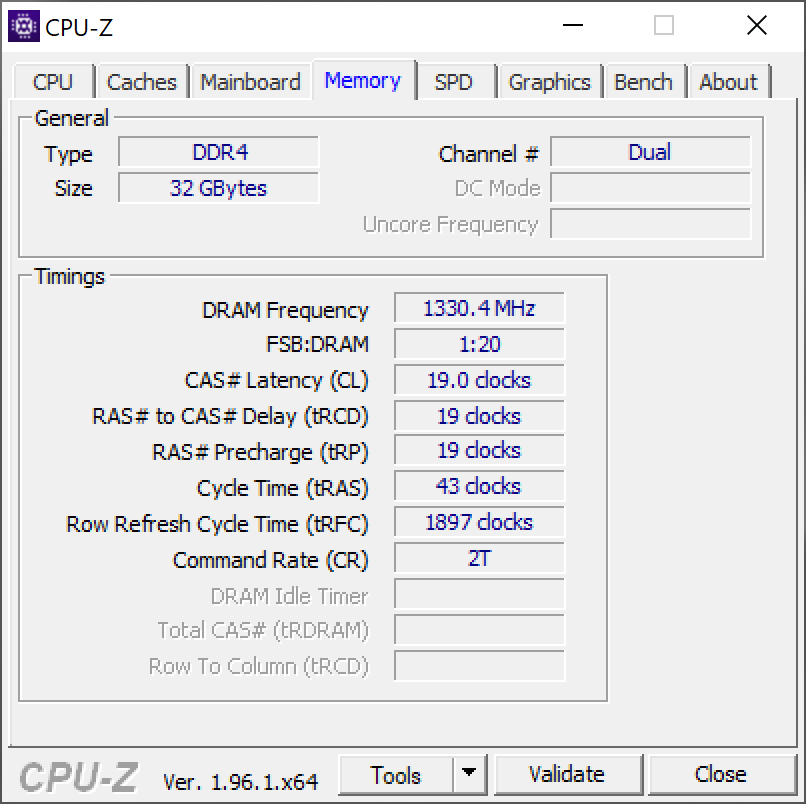
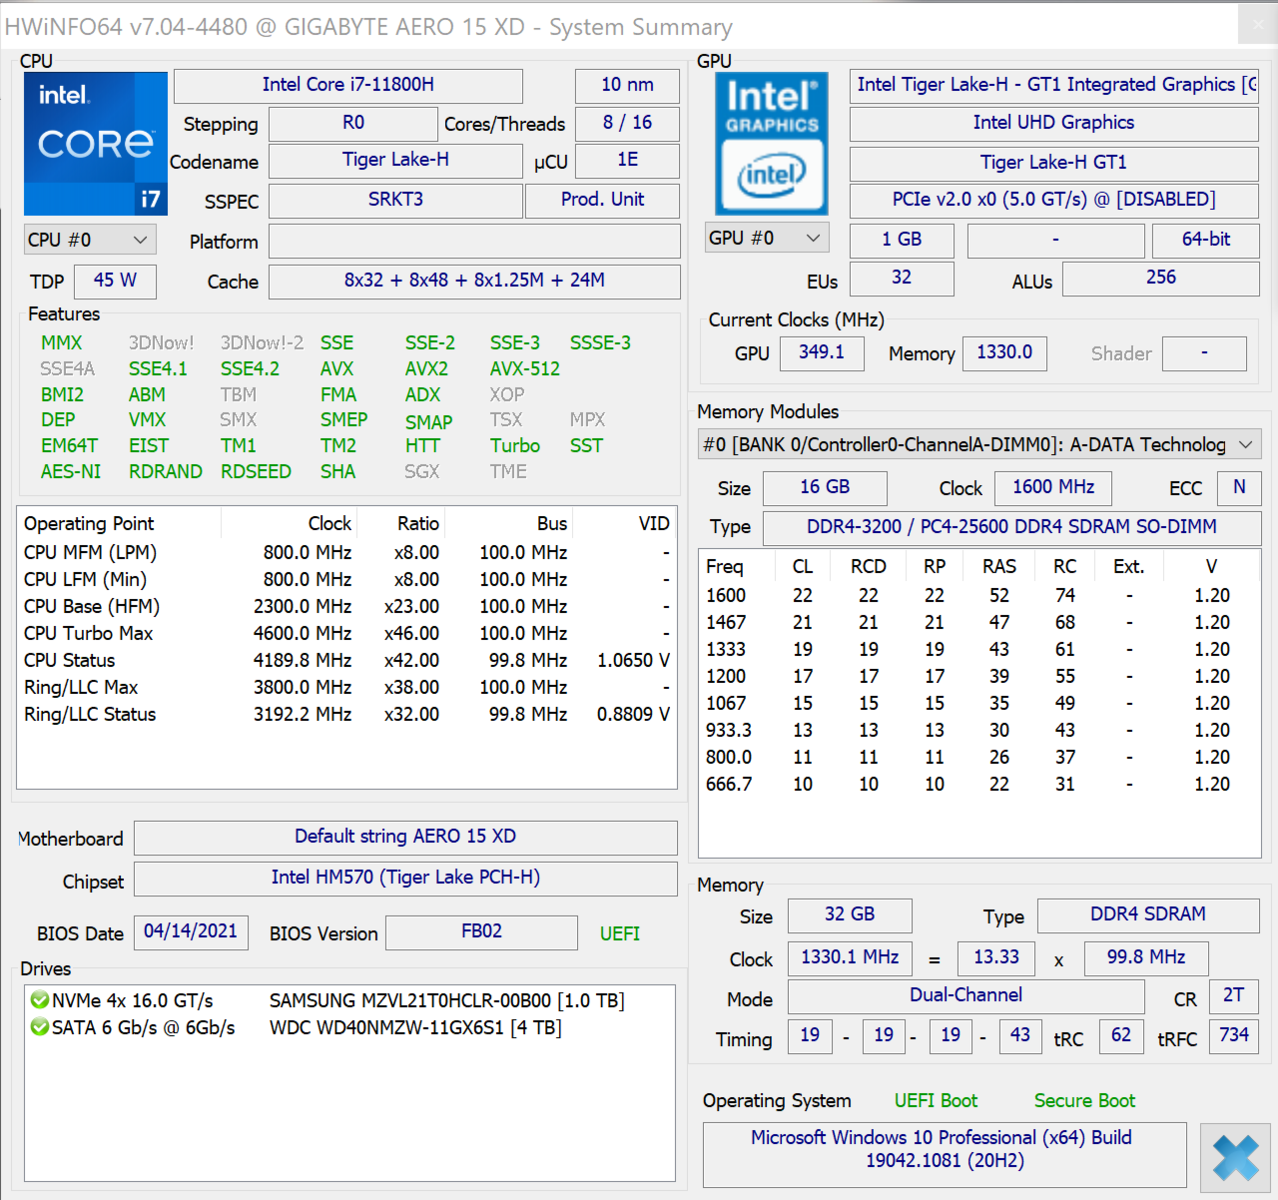
Our test device is equipped with an Intel Core i7-11800H, a laptop version of the GeForce RTX 3070 with a 105-watt TDP, and an NVMe SSD. In addition, there's 32 GB of DDR4-3200 RAM that runs in dual-channel mode. With this package, Gigabyte provides customers with sufficient performance for all common multimedia applications as well as for all the performance-hungry programs needed for video and image editing.
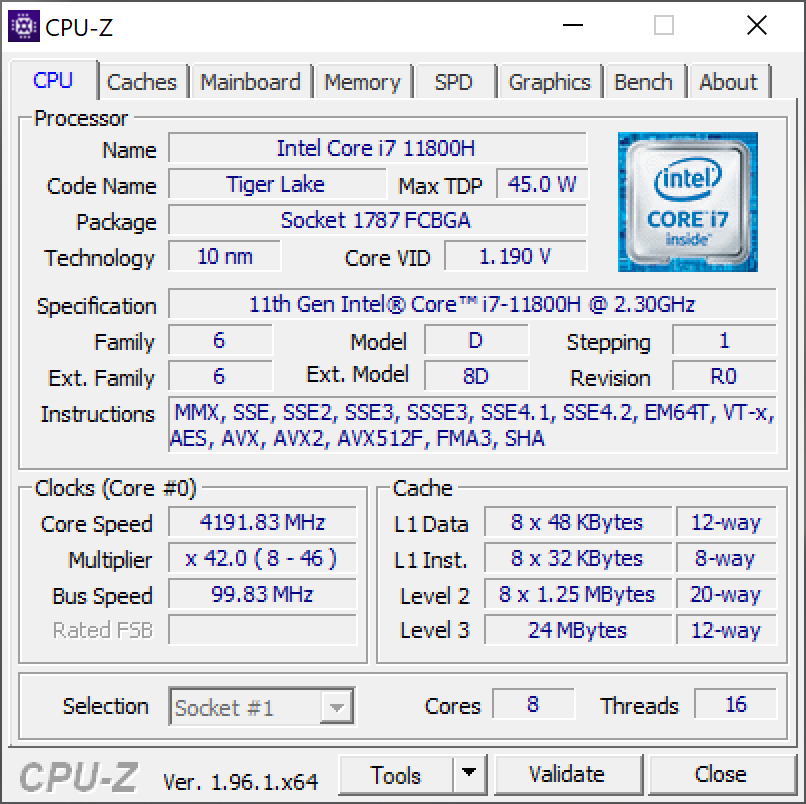
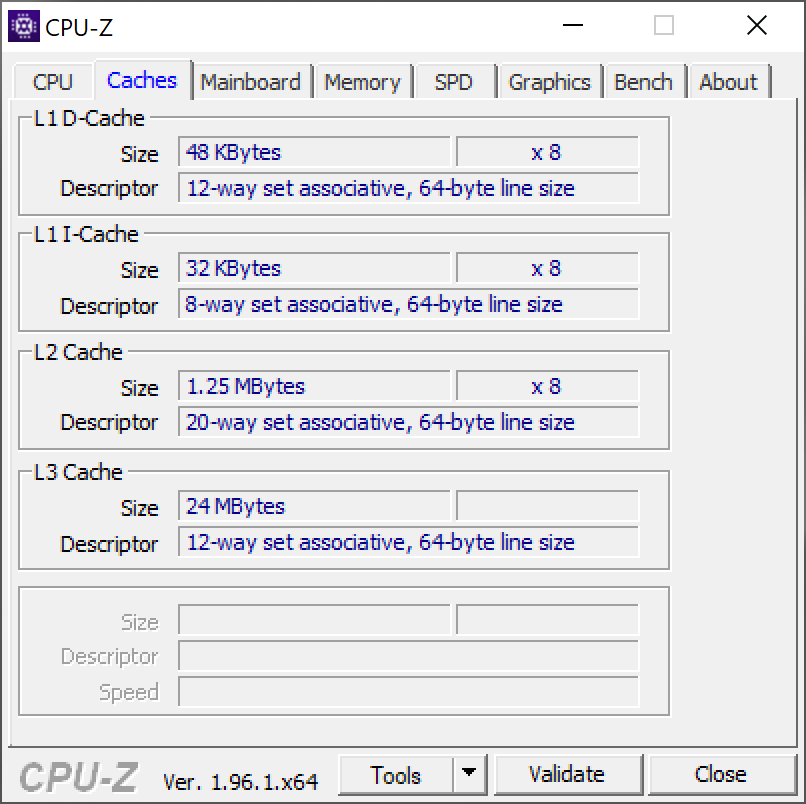
Processor
The processor used here is the Intel Core i7-11800H: An octa-core CPU from Intel's current Tiger Lake portfolio that is suitable for gaming laptops as well as workstations. The eight processor cores can run at clock rates from 2,300 MHz to 4,600 MHz and process up to 16 threads.
Gigabyte has deliberately chosen Tiger Lake instead of AMD with creators in mind. Video editing is even faster thanks to Intel's Quick Sync technology. The performance offered is very high, but it can't fully keep up with the AMD 5900HX.
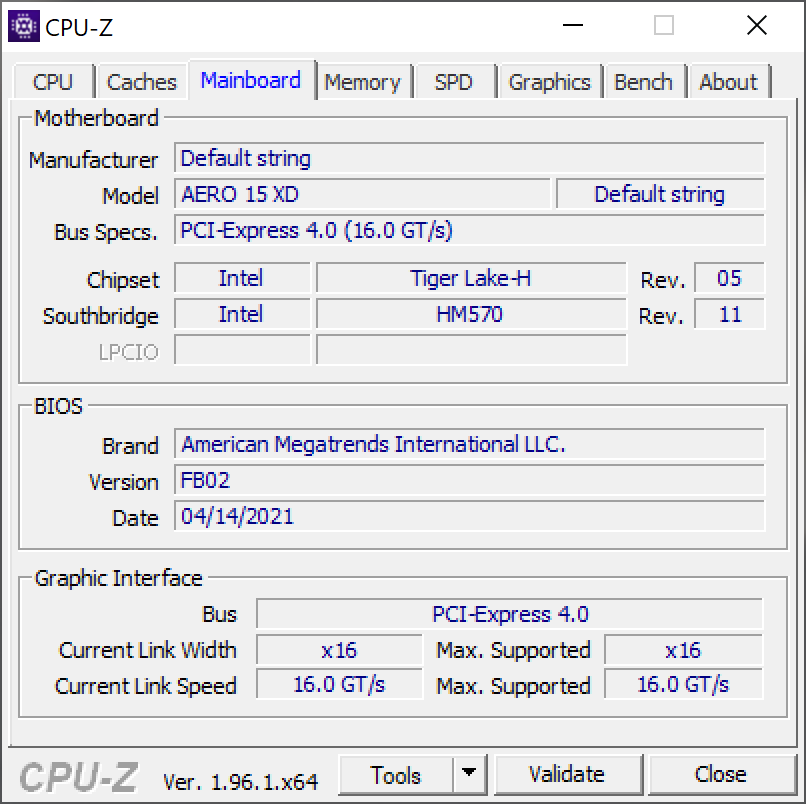
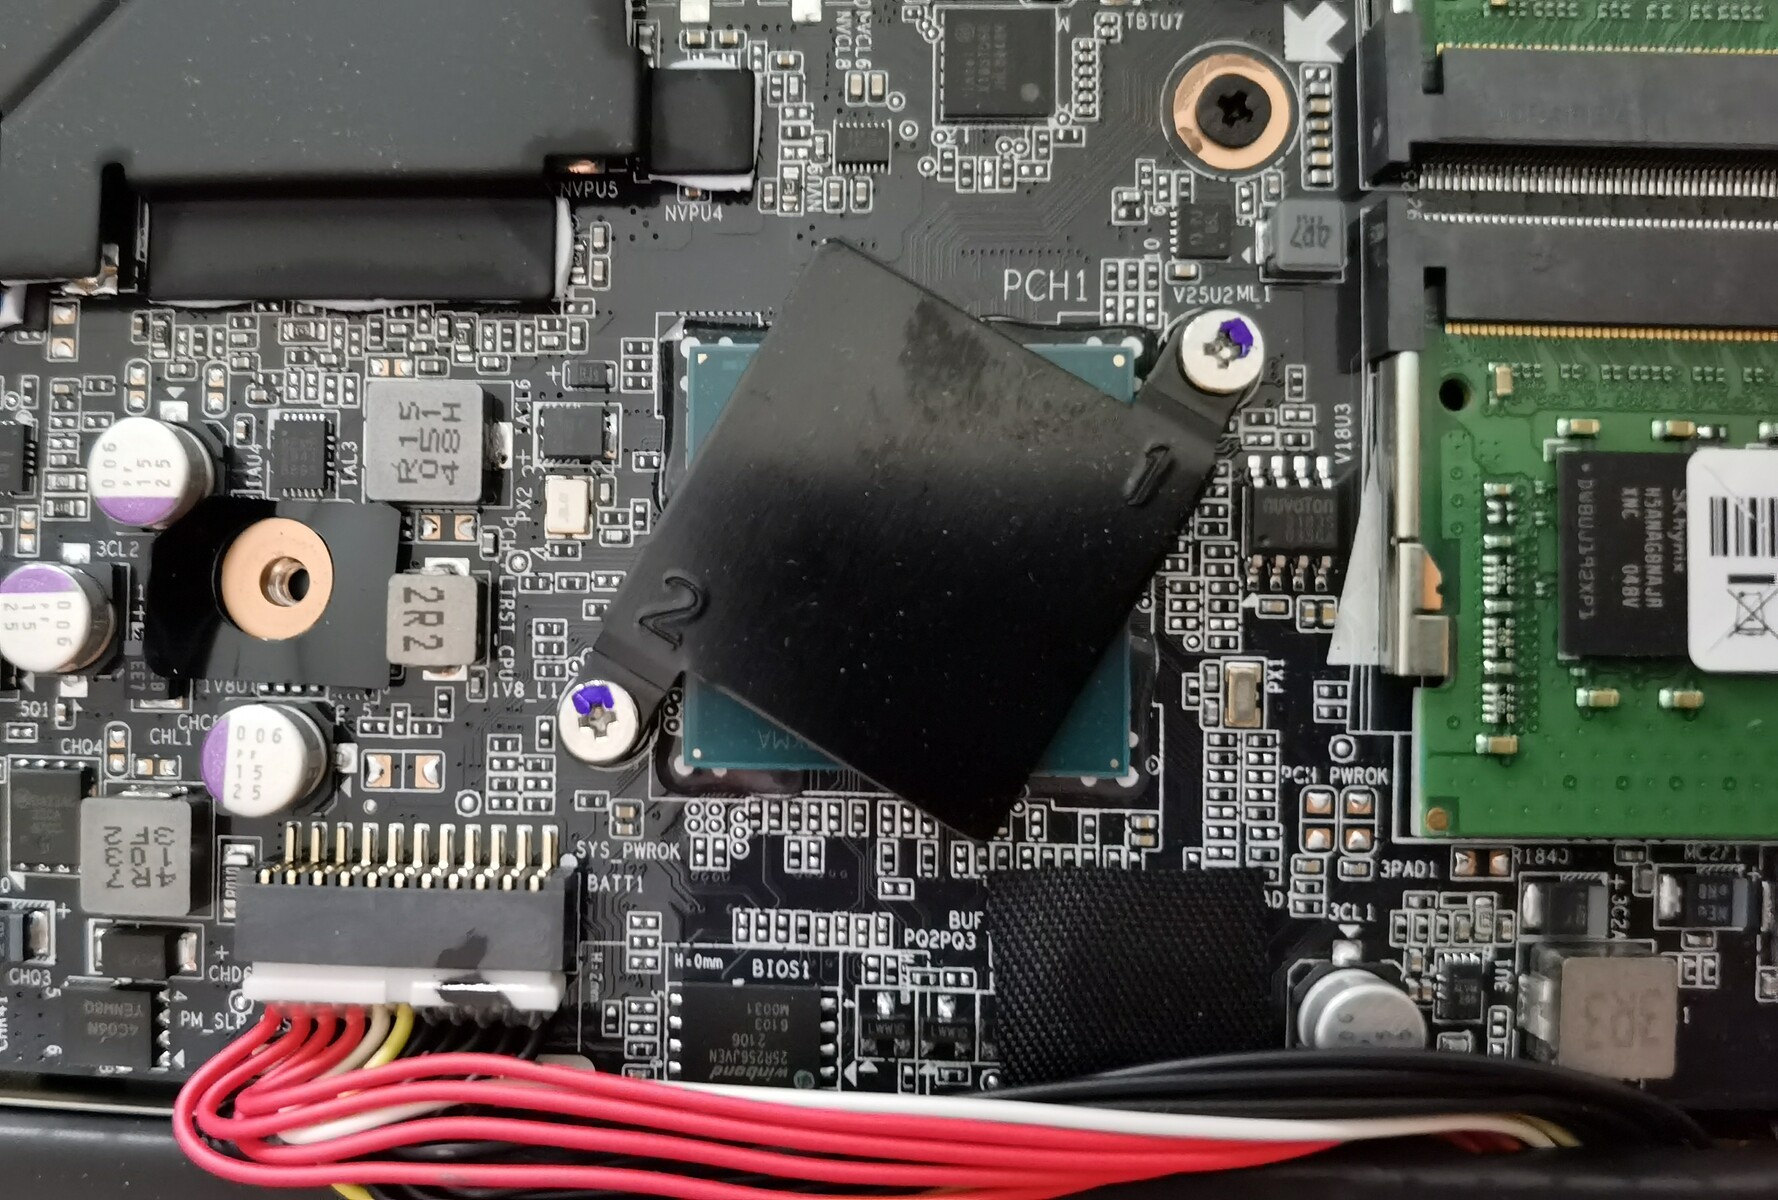
A closer look at the hardware inside revealed that the chipset has been equipped with passive cooling. Besides that, Gigabyte works with the Windforce Infinity Next Gen cooling system here, which is equipped with four heat pipes, two of which share the GPU's and CPU's waste heat. The two razor-sharp fans have 71 blades.
Our CPU Benchmarks article shows whether the performance of other laptops can keep up in comparison.
Cinebench R15 Multi loop
* ... smaller is better
System performance
In the PCMark 10 benchmarks, which simulate daily work on the computer and then measure how powerful the device is based on various categories, our test device shows excellent scores. All competing devices are outperformed in the overall score. What's interesting is that the 11800H used here in combination with 32 GB of DDR4-3200 RAM and the fast NVMe SSD even leaves the ASUS ROG Strix G15 G513QR with the AMD Ryzen 9 5900HX behind.
| PCMark 10 / Score | |
| Average of class Gaming (5776 - 9852, n=129, last 2 years) | |
| Gigabyte Aero 15 OLED XD | |
| Asus ROG Strix G15 G513QR | |
| Asus TUF Gaming A15 FA506QR-AZ061T | |
| Average Intel Core i7-11800H, NVIDIA GeForce RTX 3070 Laptop GPU (6126 - 7311, n=11) | |
| Alienware m15 R4 | |
| Gigabyte Aero 15 OLED XC | |
| Asus ZenBook Pro Duo UX582 LR-1BH2 | |
| PCMark 10 / Essentials | |
| Average of class Gaming (9057 - 12600, n=130, last 2 years) | |
| Asus TUF Gaming A15 FA506QR-AZ061T | |
| Average Intel Core i7-11800H, NVIDIA GeForce RTX 3070 Laptop GPU (9248 - 10832, n=11) | |
| Gigabyte Aero 15 OLED XD | |
| Alienware m15 R4 | |
| Gigabyte Aero 15 OLED XC | |
| Asus ZenBook Pro Duo UX582 LR-1BH2 | |
| PCMark 10 / Productivity | |
| Average of class Gaming (6662 - 14612, n=129, last 2 years) | |
| Gigabyte Aero 15 OLED XD | |
| Asus TUF Gaming A15 FA506QR-AZ061T | |
| Average Intel Core i7-11800H, NVIDIA GeForce RTX 3070 Laptop GPU (8571 - 9669, n=11) | |
| Alienware m15 R4 | |
| Gigabyte Aero 15 OLED XC | |
| Asus ZenBook Pro Duo UX582 LR-1BH2 | |
| PCMark 10 / Digital Content Creation | |
| Average of class Gaming (7440 - 19351, n=129, last 2 years) | |
| Gigabyte Aero 15 OLED XD | |
| Average Intel Core i7-11800H, NVIDIA GeForce RTX 3070 Laptop GPU (7627 - 10851, n=11) | |
| Alienware m15 R4 | |
| Asus TUF Gaming A15 FA506QR-AZ061T | |
| Gigabyte Aero 15 OLED XC | |
| Asus ZenBook Pro Duo UX582 LR-1BH2 | |
| PCMark 10 Score | 7062 points | |
Help | ||
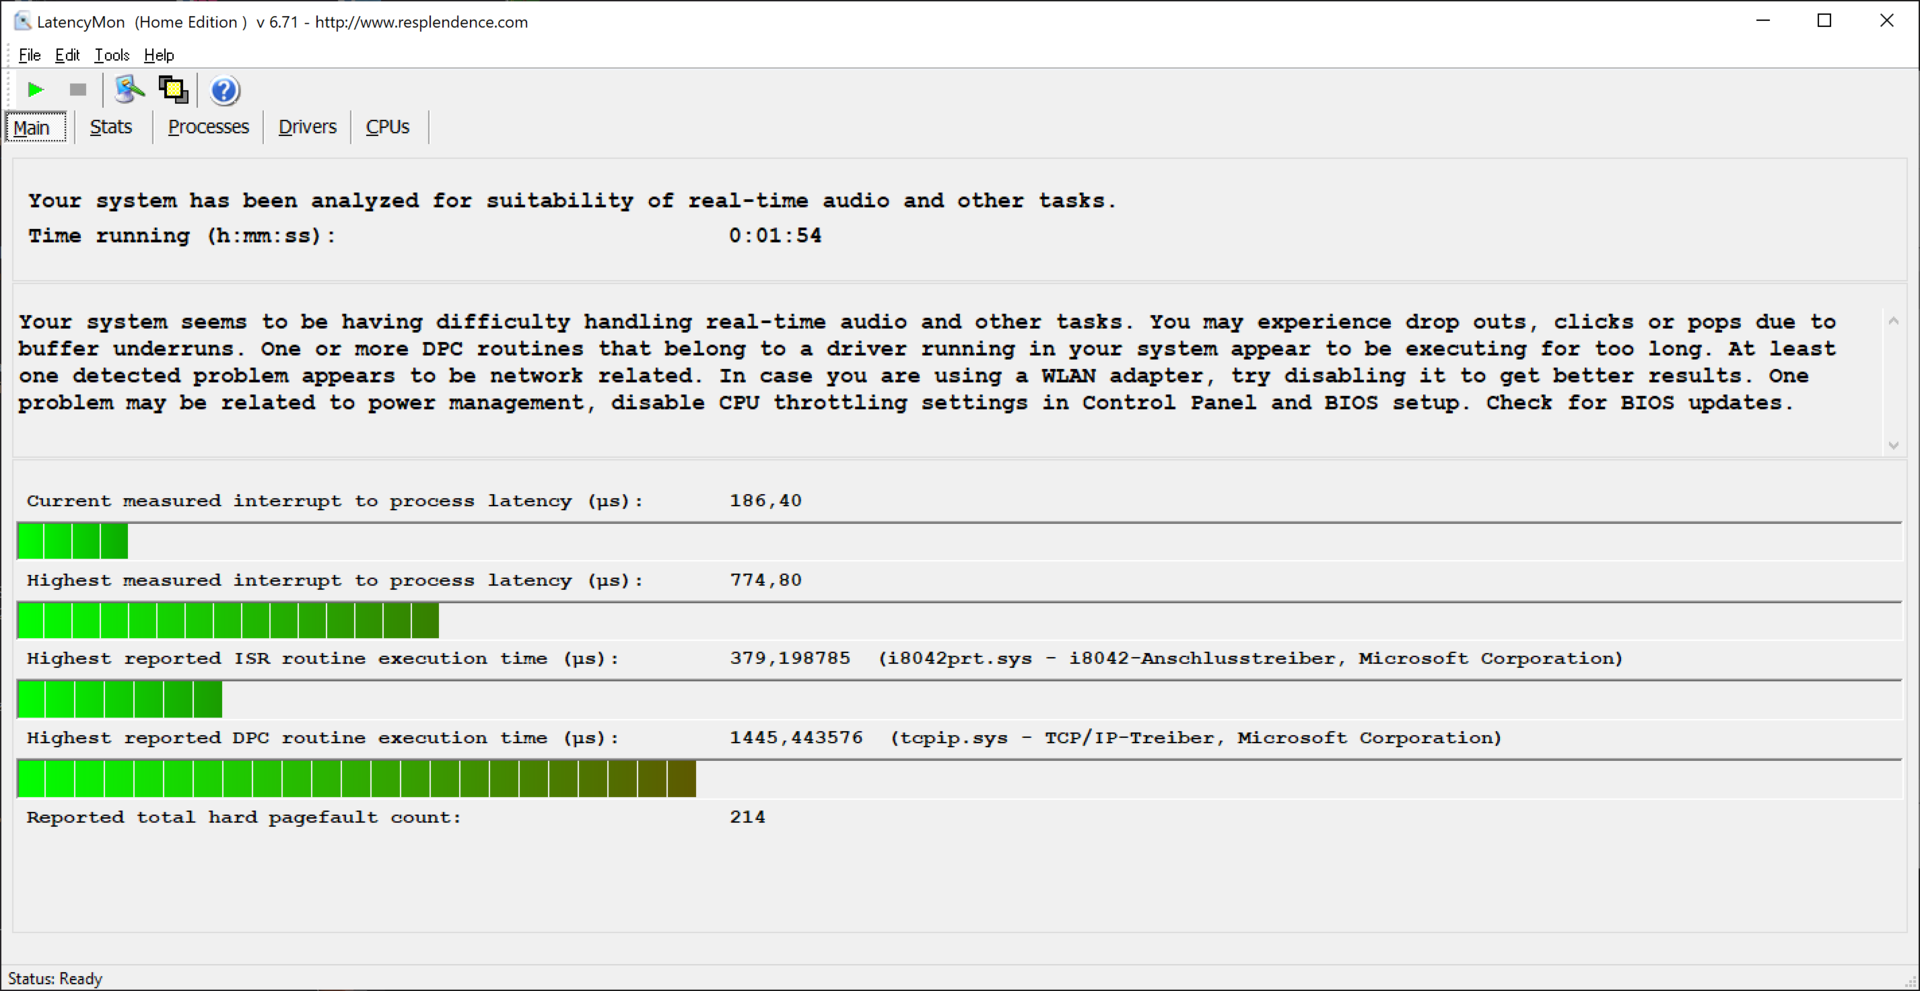
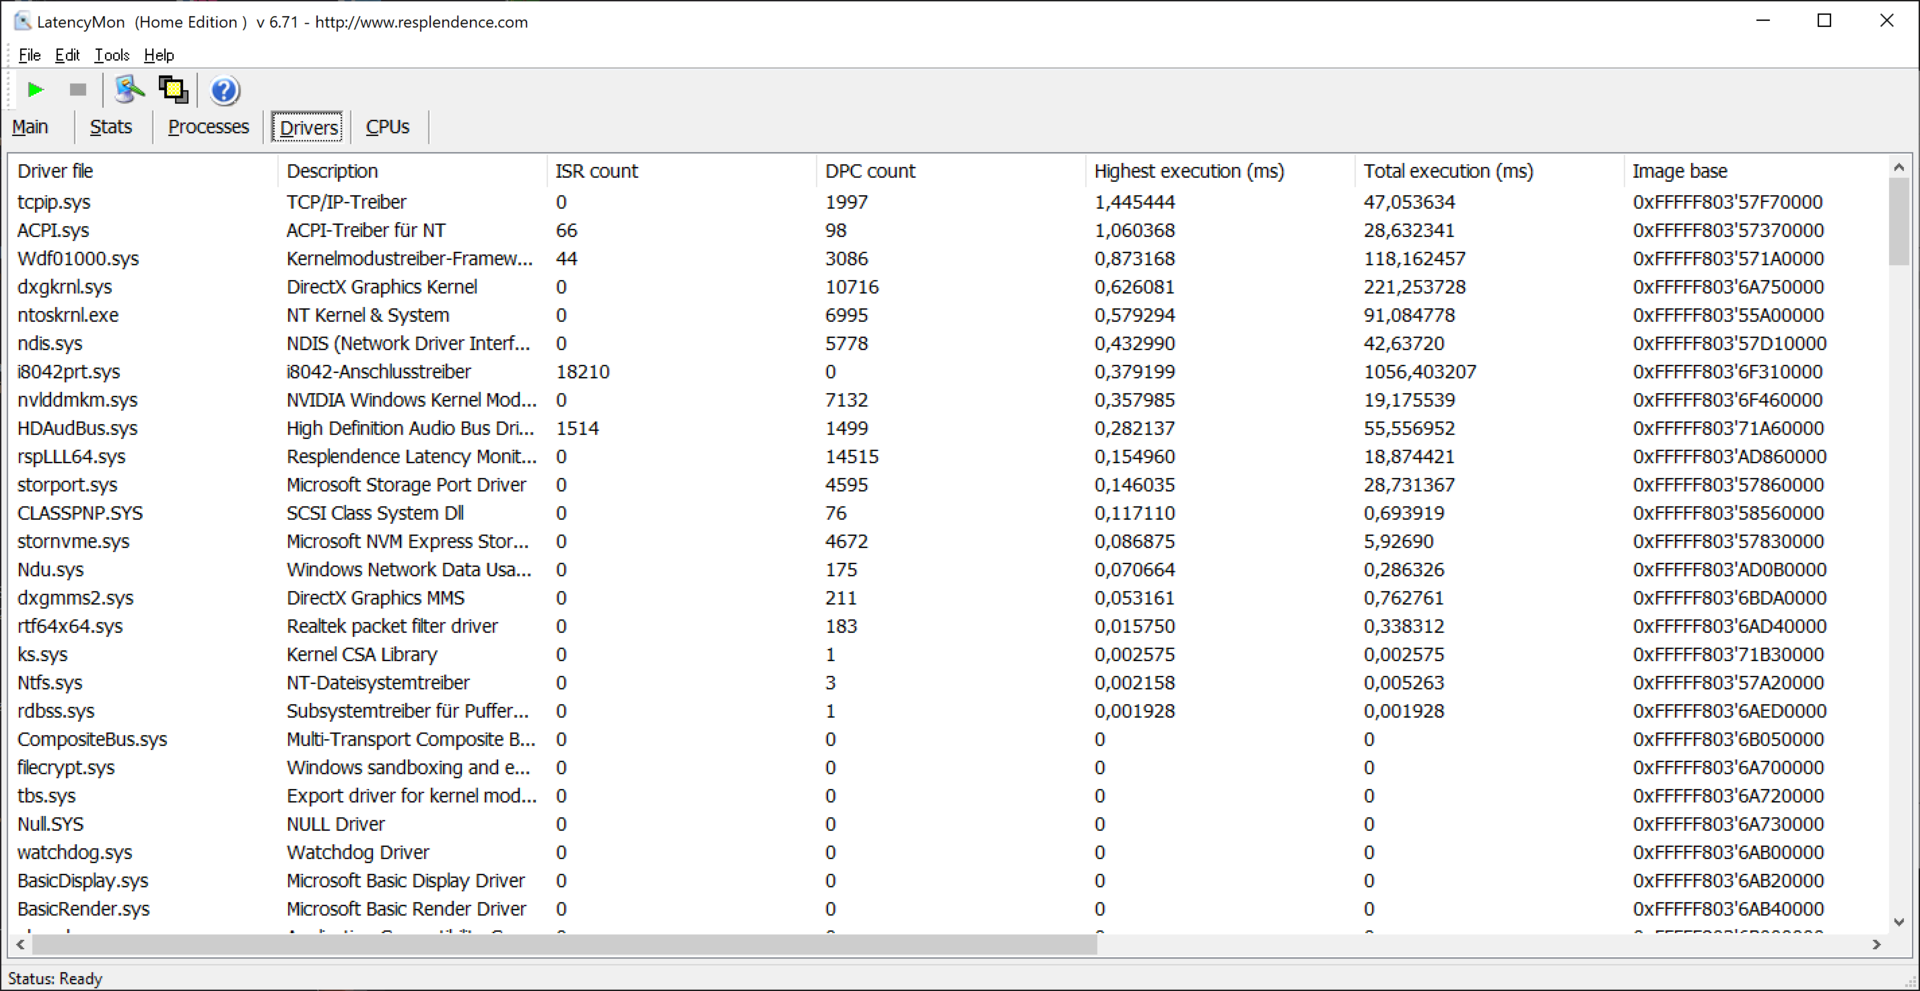
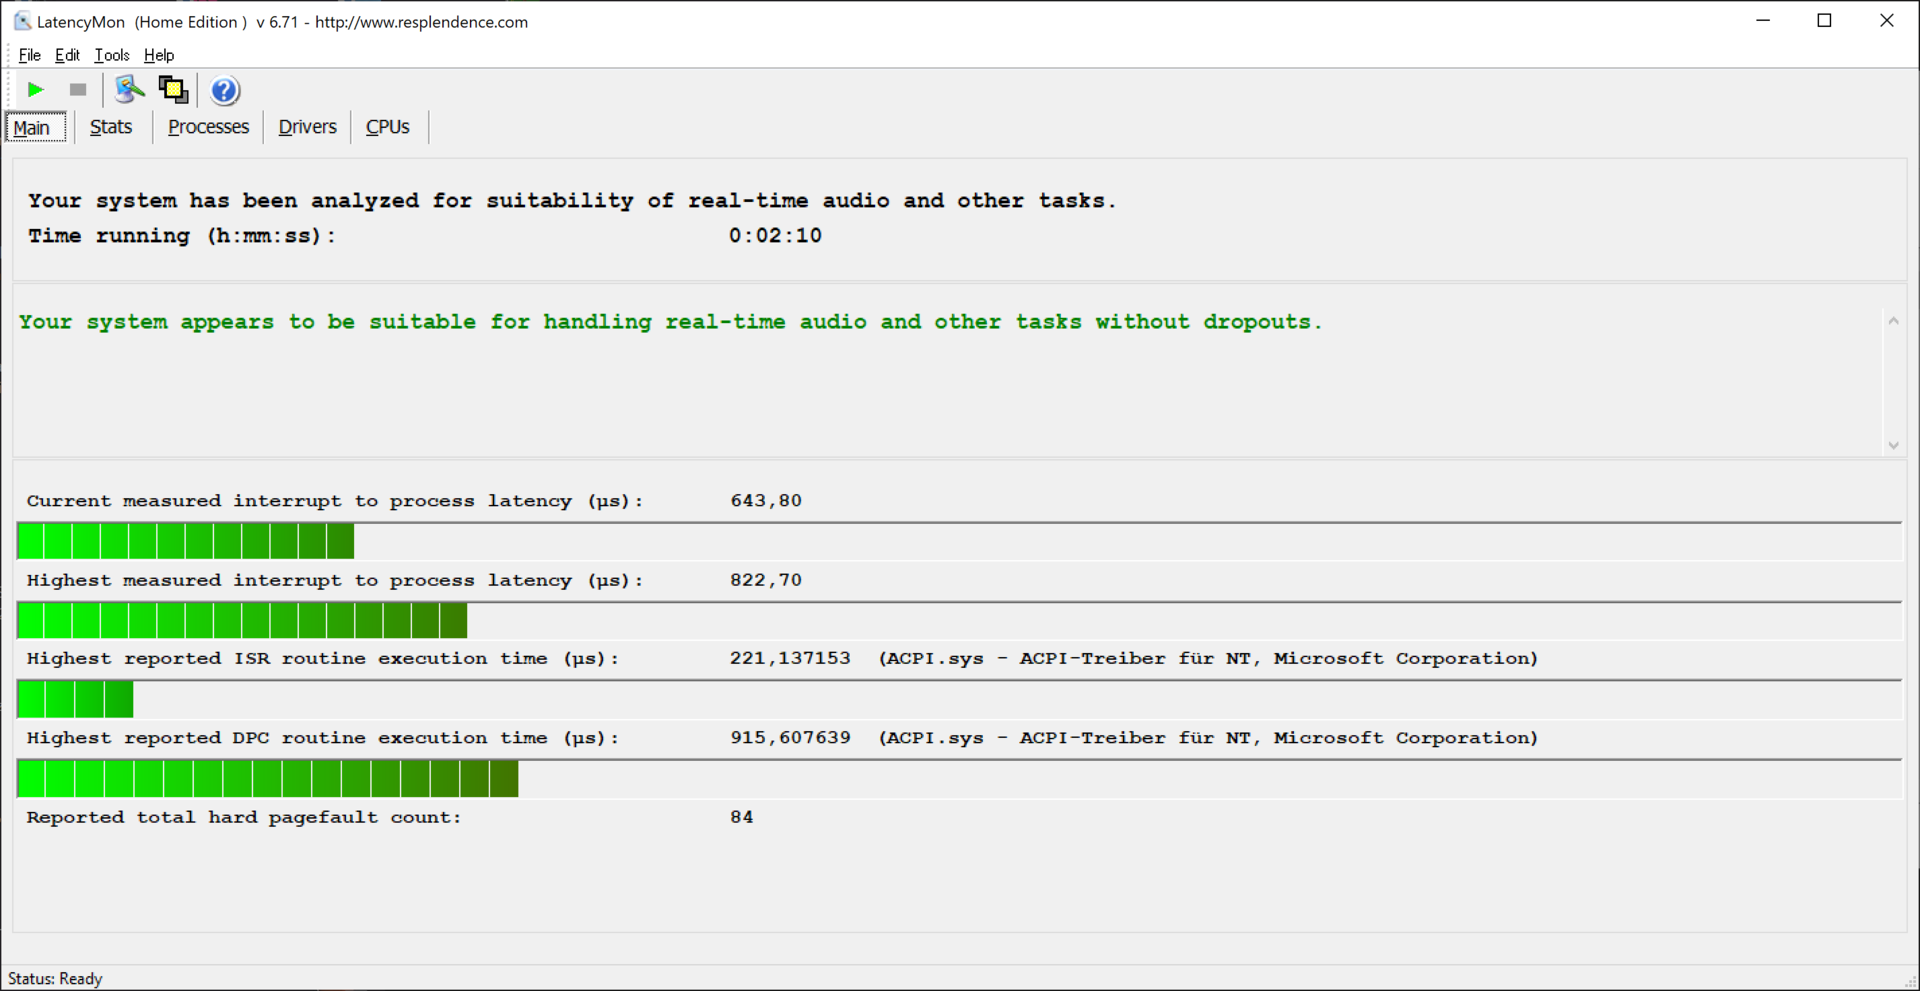
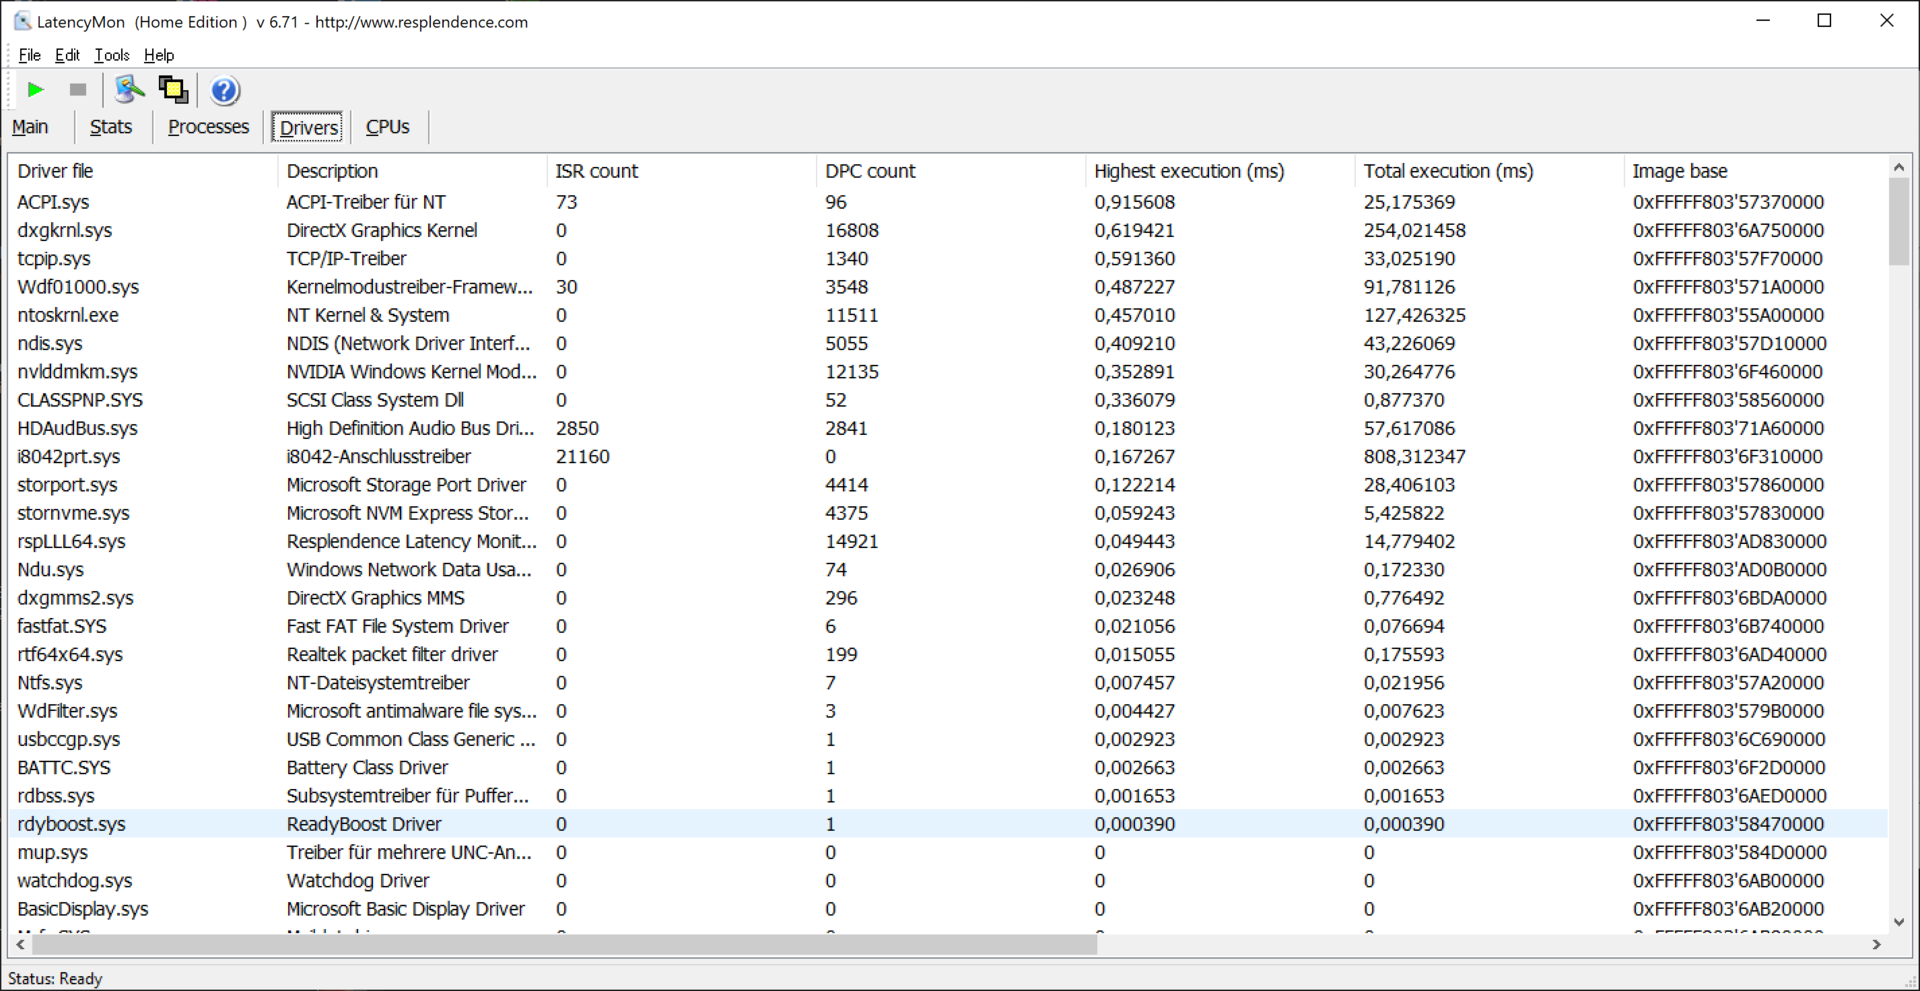
DPC latencies
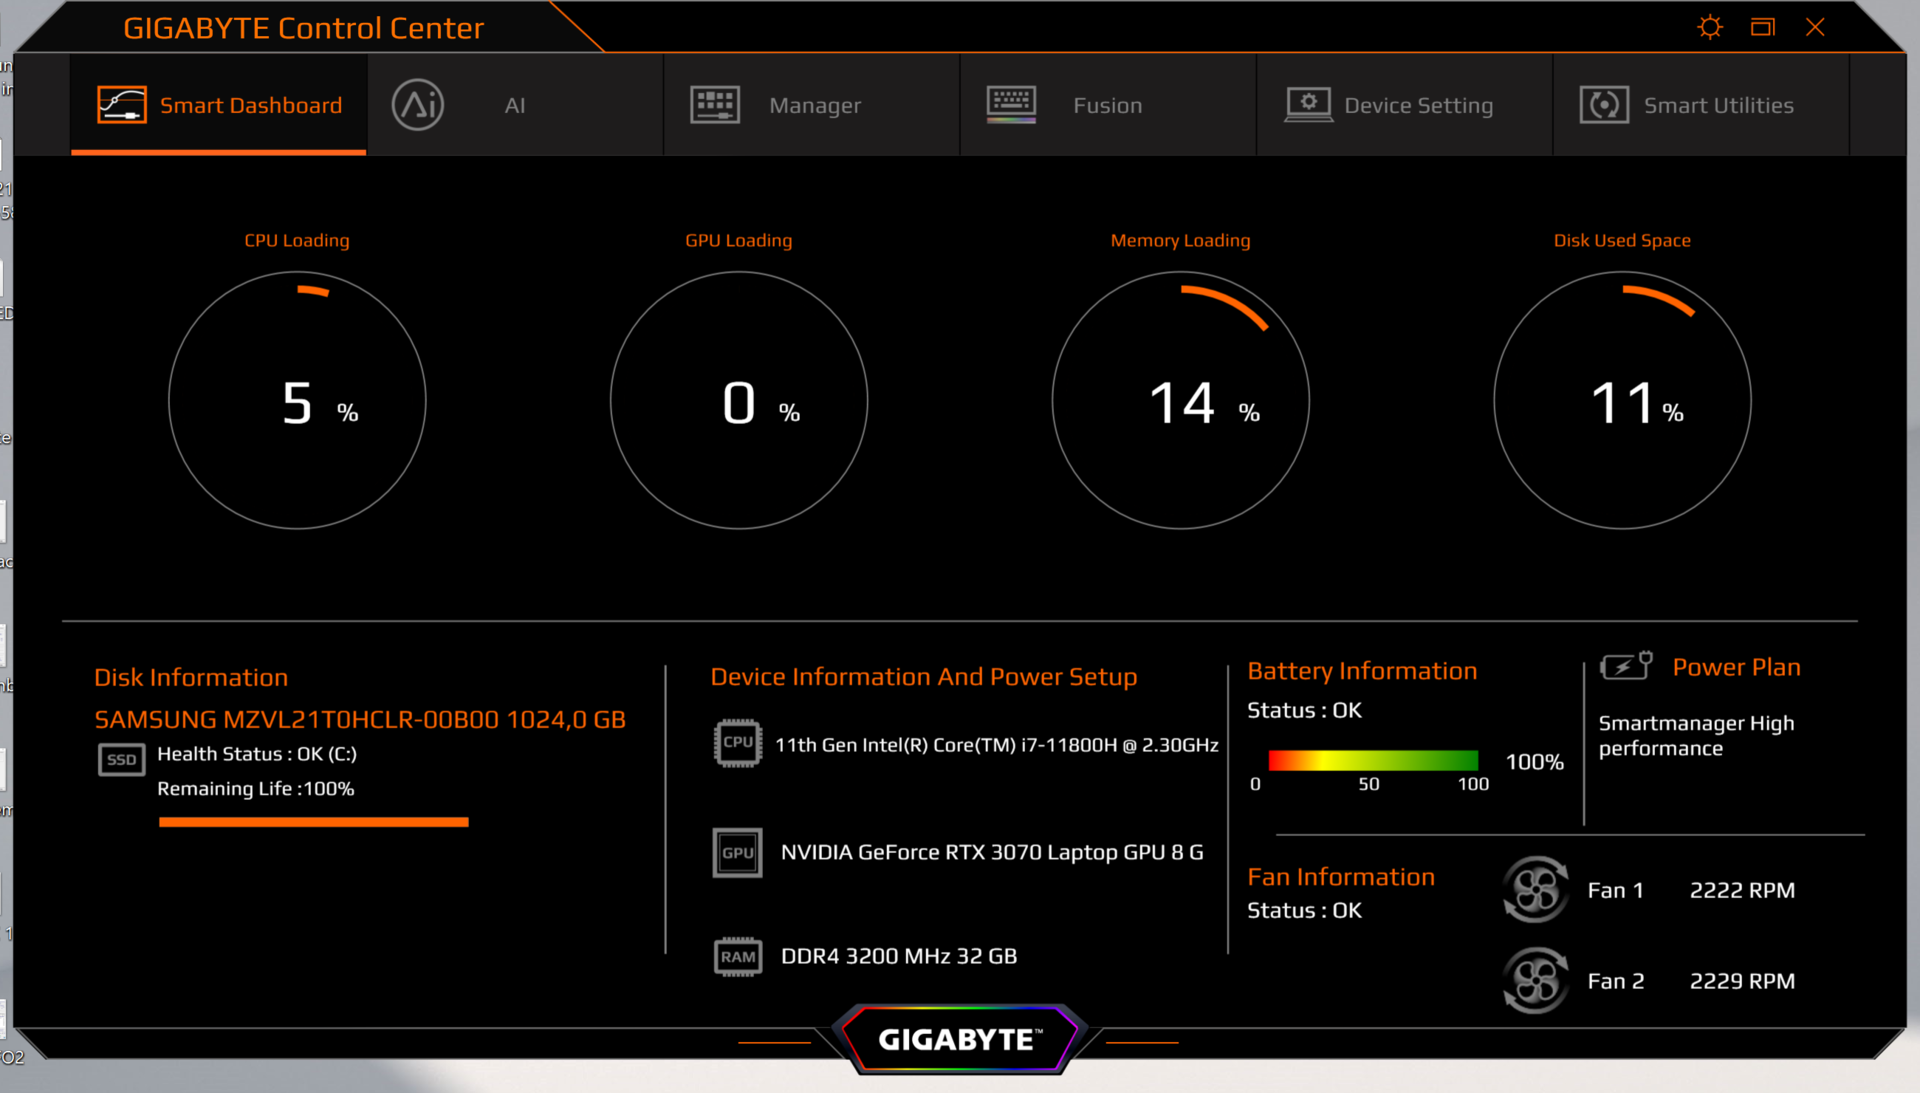
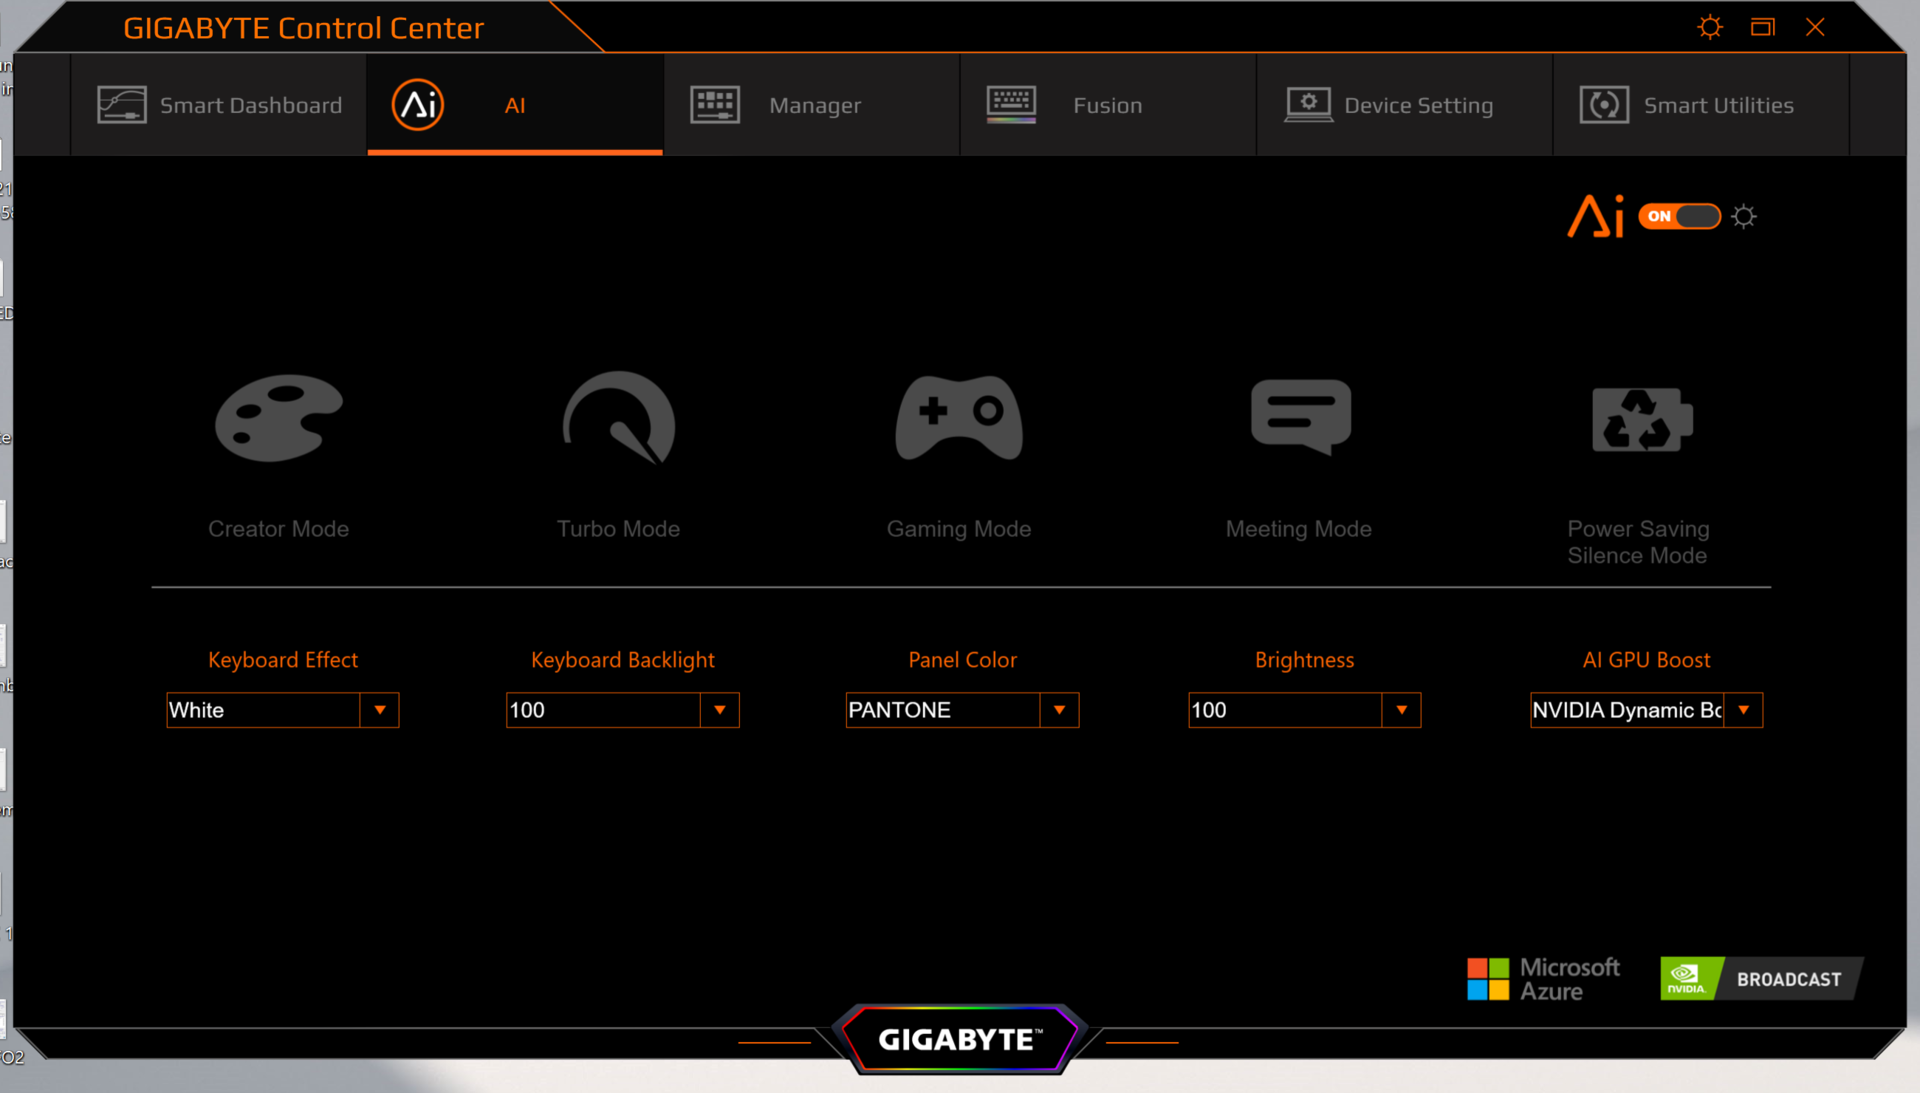
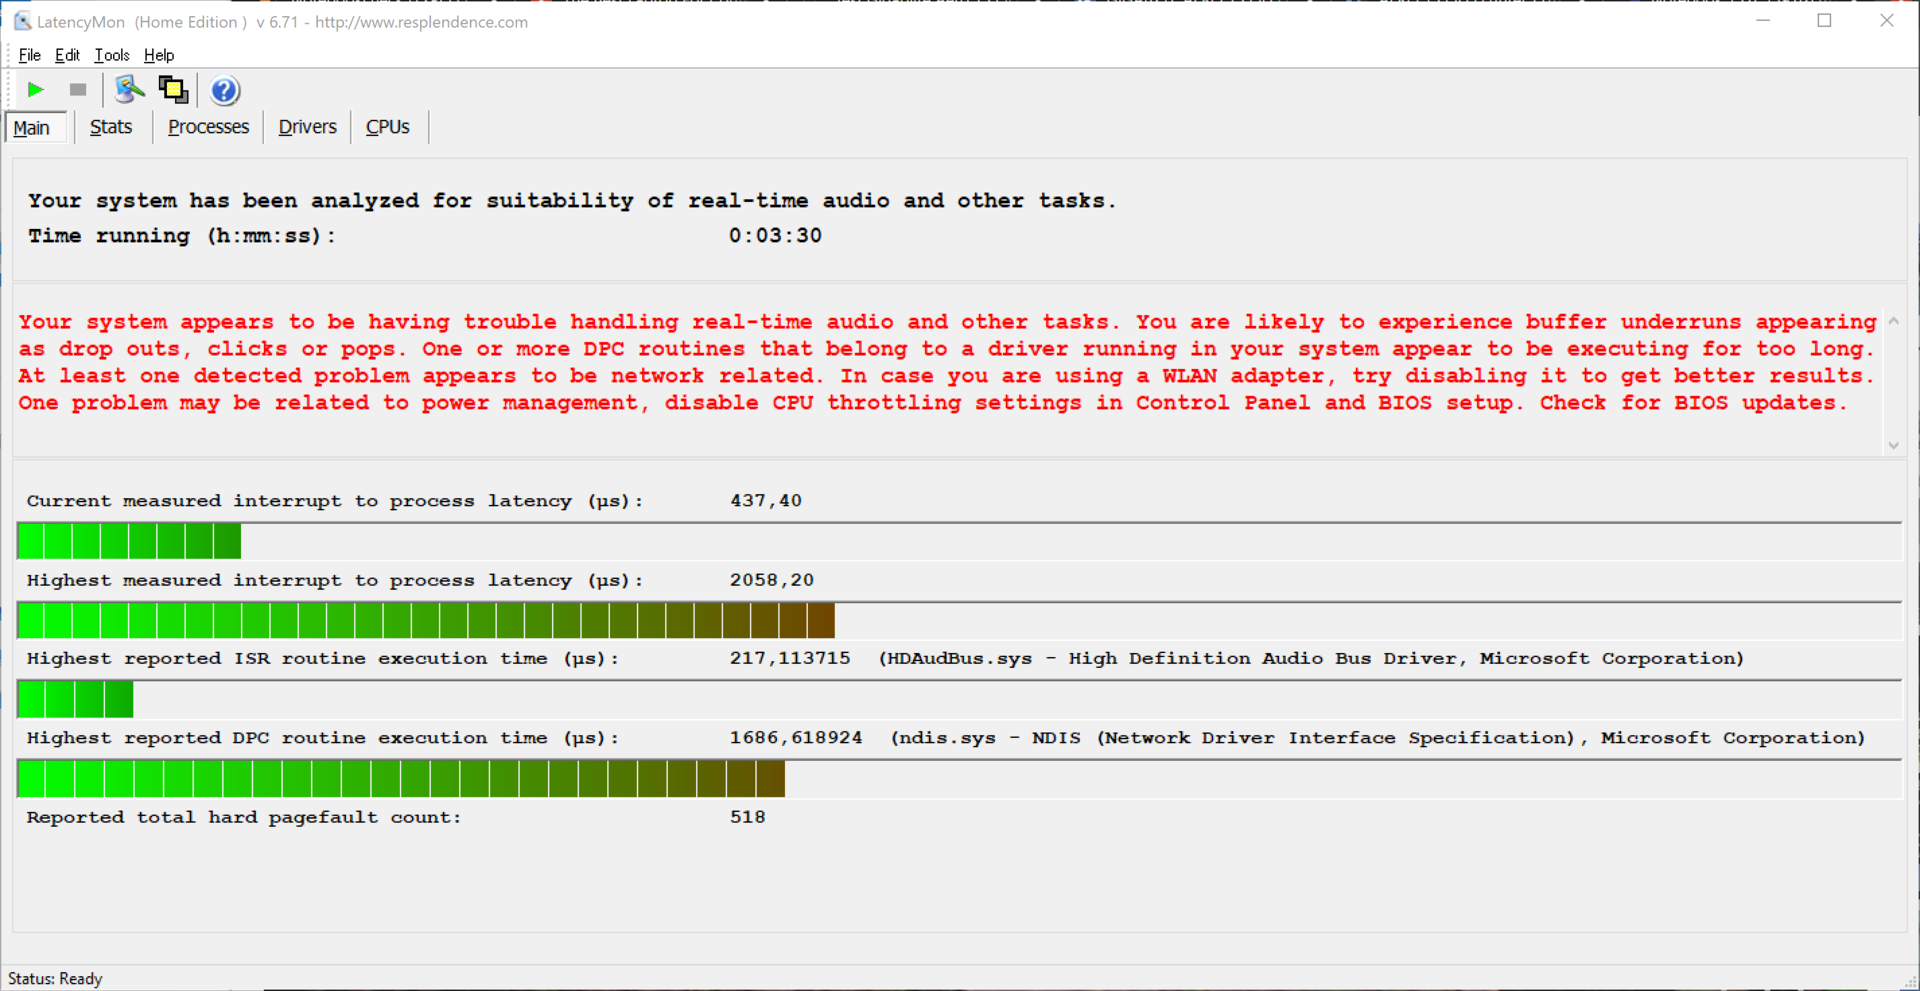
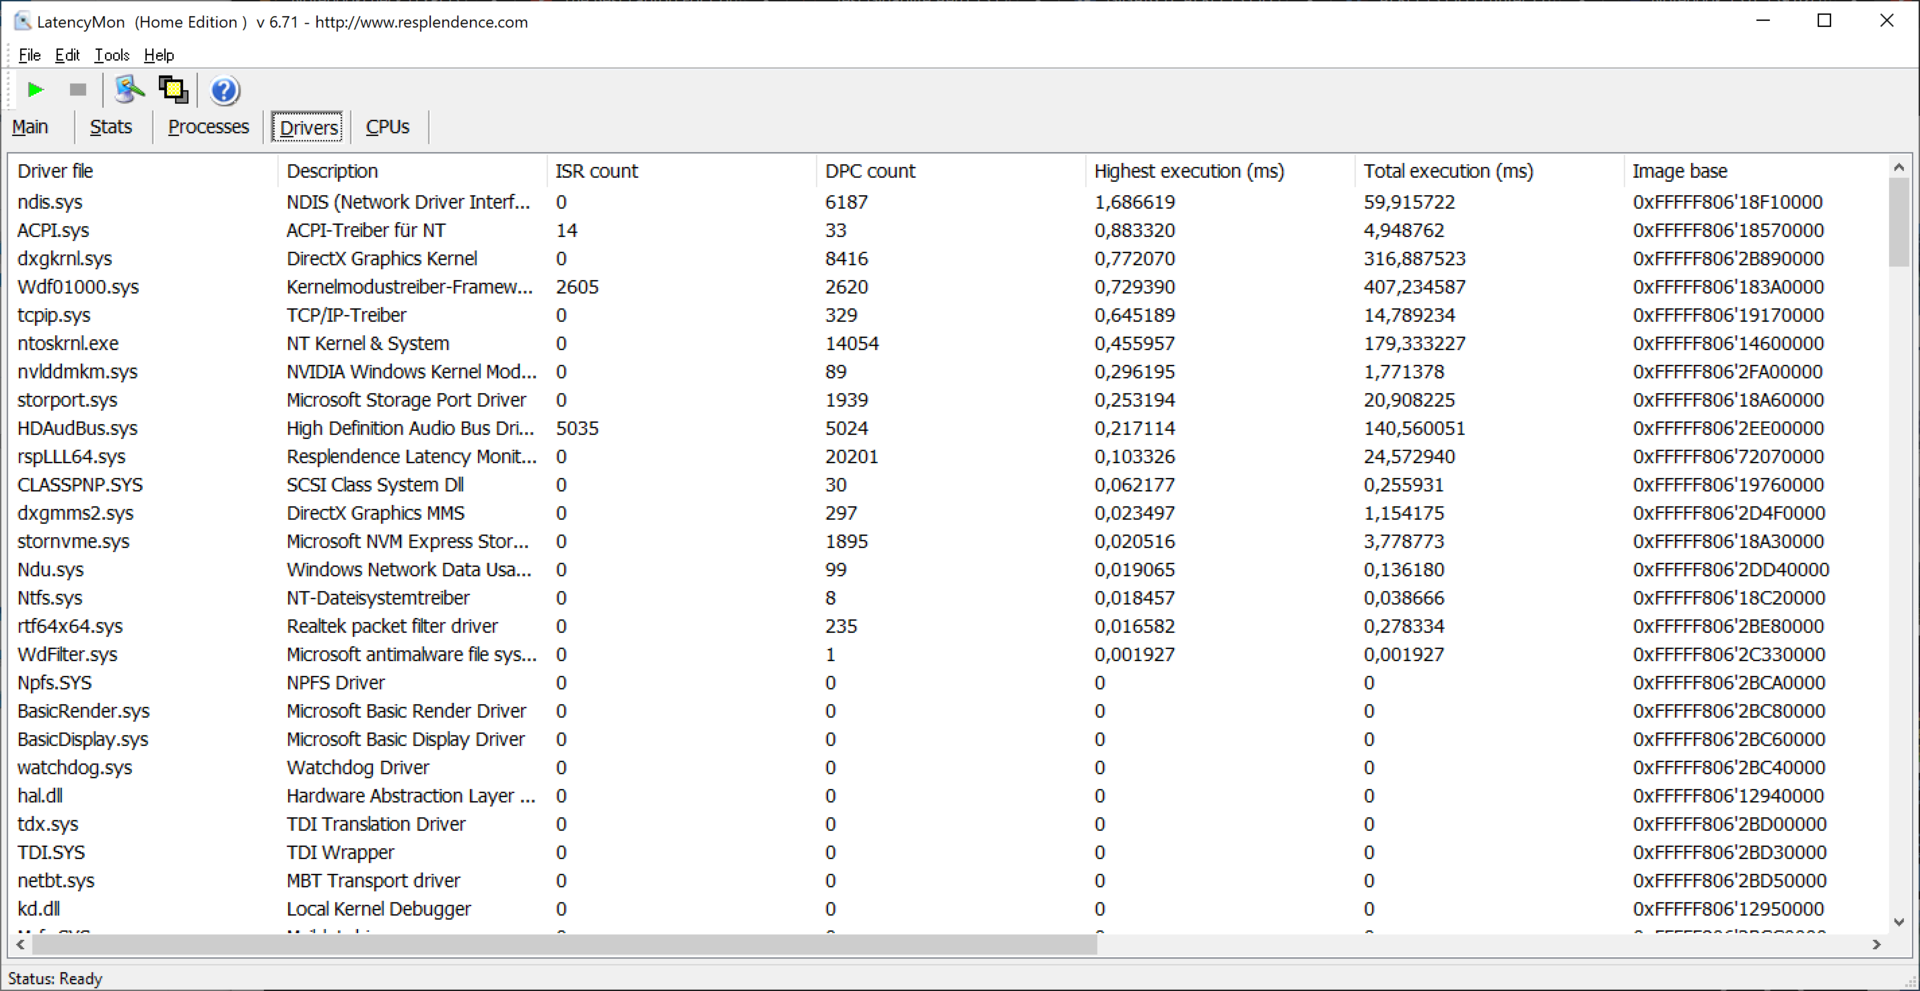
Contrary to expectations for the laptop's intended purpose, Latency-Mon shows problematically high DPC latencies in AI mode, indicating that the laptop isn't suitable for editing video and audio files in real time. Upon closer inspection, we discovered that this is probably due to the Control Center settings. In the Creator, Gaming, and AI modes, the values are too high according to the tool. Apparently, the only solution is to turn on Turbo mode, which is quite loud, though.
| DPC Latencies / LatencyMon - interrupt to process latency (max), Web, Youtube, Prime95 | |
| Gigabyte Aero 15 OLED XC | |
| Asus TUF Gaming A15 FA506QR-AZ061T | |
| Asus ZenBook Pro Duo UX582 LR-1BH2 | |
| Gigabyte Aero 15 OLED XD | |
| Asus ROG Strix G15 G513QR | |
* ... smaller is better
Storage
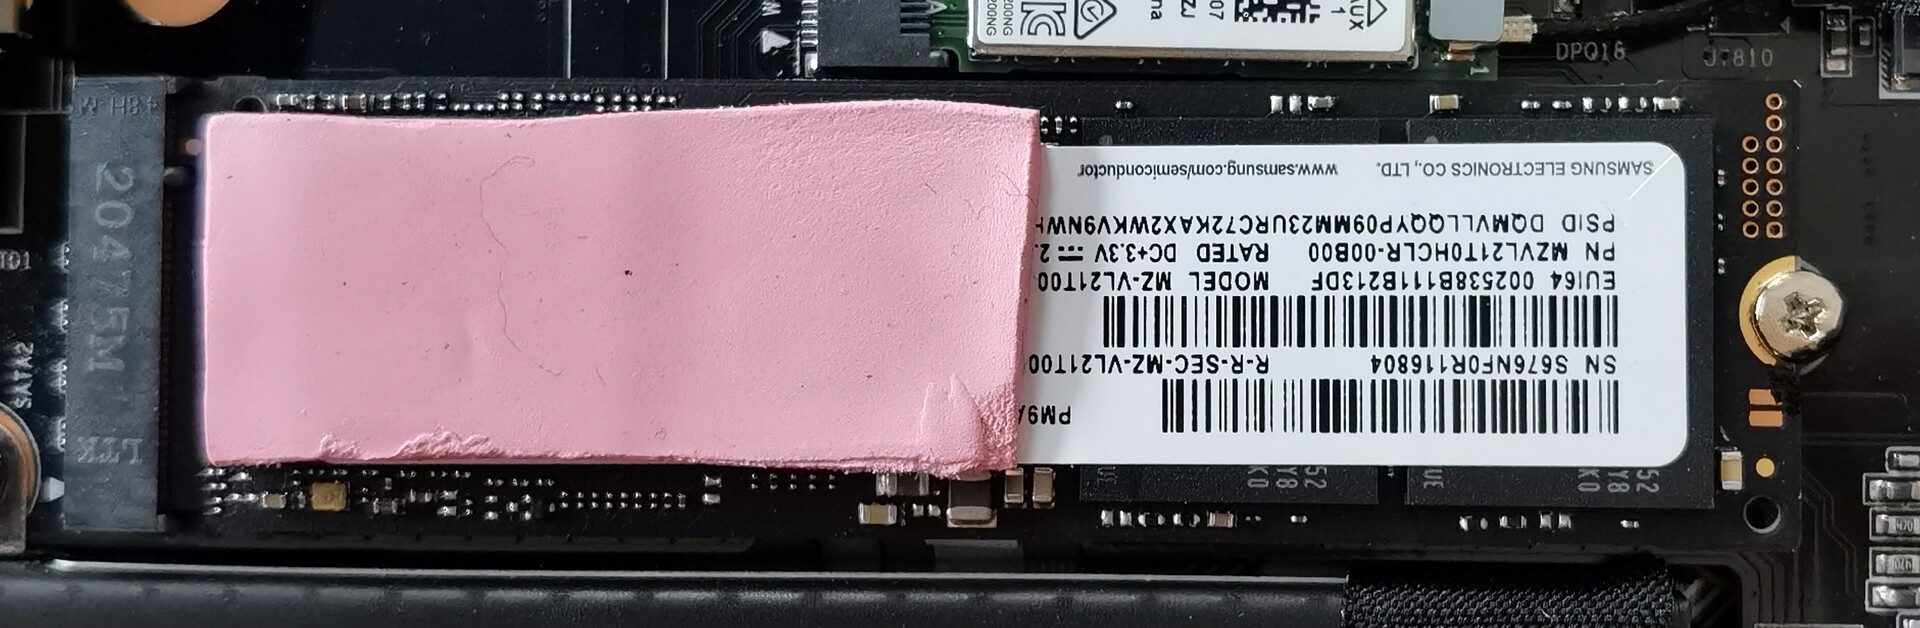
By using a suitable NVMe SSD connected via PCI Express Gen 4, the Aero 15 OLED XD outperforms the entire competition in our storage tests and offers very good rates. The OEM sibling of the Samsung 980 Pro, the Samsung PM9A1, achieves 7,000 MB per second in the SeqWrite test and over 5,000 MB per second in the SeqRead test in CrystalDiskMark. Gigabyte also has creators in mind here by offering the option of installing another NVMe SSD. However, this is only connected via PCI Express Gen 3.
Further information and benchmark comparisons can be found in our HDD/SSD Benchmarks article.
| Gigabyte Aero 15 OLED XD Samsung PM9A1 MZVL21T0HCLR | Asus TUF Gaming A15 FA506QR-AZ061T SK Hynix HFM001TD3JX013N | Asus ROG Strix G15 G513QR SK Hynix HFM001TD3JX013N | Gigabyte Aero 15 OLED XC WDC PC SN730 SDBPNTY-1T00 | Asus ZenBook Pro Duo UX582 LR-1BH2 Samsung PM981a MZVLB1T0HBLR | |
|---|---|---|---|---|---|
| CrystalDiskMark 5.2 / 6 | -35% | -42% | -56% | ||
| Write 4K | 231.4 | 182.5 -21% | 126 -46% | 102.8 -56% | |
| Read 4K | 89.5 | 73.2 -18% | 44.94 -50% | 51.9 -42% | |
| Write Seq | 4208 | 3005 -29% | 2763 -34% | 1625 -61% | |
| Read Seq | 4512 | 2358 -48% | 1671 -63% | 1720 -62% | |
| Write 4K Q32T1 | 648 | 389.5 -40% | 451.6 -30% | 313.4 -52% | |
| Read 4K Q32T1 | 691 | 463.8 -33% | 552 -20% | 329.4 -52% | |
| Write Seq Q32T1 | 5111 | 3166 -38% | 3060 -40% | 1604 -69% | |
| Read Seq Q32T1 | 7002 | 3590 -49% | 3192 -54% | 3321 -53% | |
| AS SSD | -20% | -28% | -37% | -41% | |
| Seq Read | 5357 | 3133 -42% | 2881 -46% | 2331 -56% | 1938 -64% |
| Seq Write | 3978 | 2969 -25% | 1570 -61% | 2312 -42% | 1248 -69% |
| 4K Read | 50.6 | 55.2 9% | 52.4 4% | 39.13 -23% | 47.35 -6% |
| 4K Write | 156.2 | 129.7 -17% | 124 -21% | 98.1 -37% | 93.7 -40% |
| 4K-64 Read | 2465 | 1891 -23% | 1334 -46% | 1663 -33% | 1060 -57% |
| 4K-64 Write | 3360 | 1795 -47% | 2189 -35% | 2138 -36% | 1932 -42% |
| Access Time Read * | 0.08 | 0.052 35% | 0.055 31% | 0.099 -24% | 0.061 24% |
| Access Time Write * | 0.027 | 0.028 -4% | 0.03 -11% | 0.038 -41% | 0.04 -48% |
| Score Read | 3052 | 2259 -26% | 1675 -45% | 1935 -37% | 1301 -57% |
| Score Write | 3914 | 2221 -43% | 2470 -37% | 2468 -37% | 2151 -45% |
| Score Total | 8449 | 5630 -33% | 4943 -41% | 5388 -36% | 4092 -52% |
| Copy ISO MB/s | 1277 | 2903 | 2841 | ||
| Copy Program MB/s | 575 | 686 | 613 | ||
| Copy Game MB/s | 1272 | 1594 | 1391 | ||
| Total Average (Program / Settings) | -28% /
-26% | -28% /
-28% | -40% /
-39% | -49% /
-48% |
* ... smaller is better

Continuous load read: DiskSpd Read Loop, Queue Depth 8
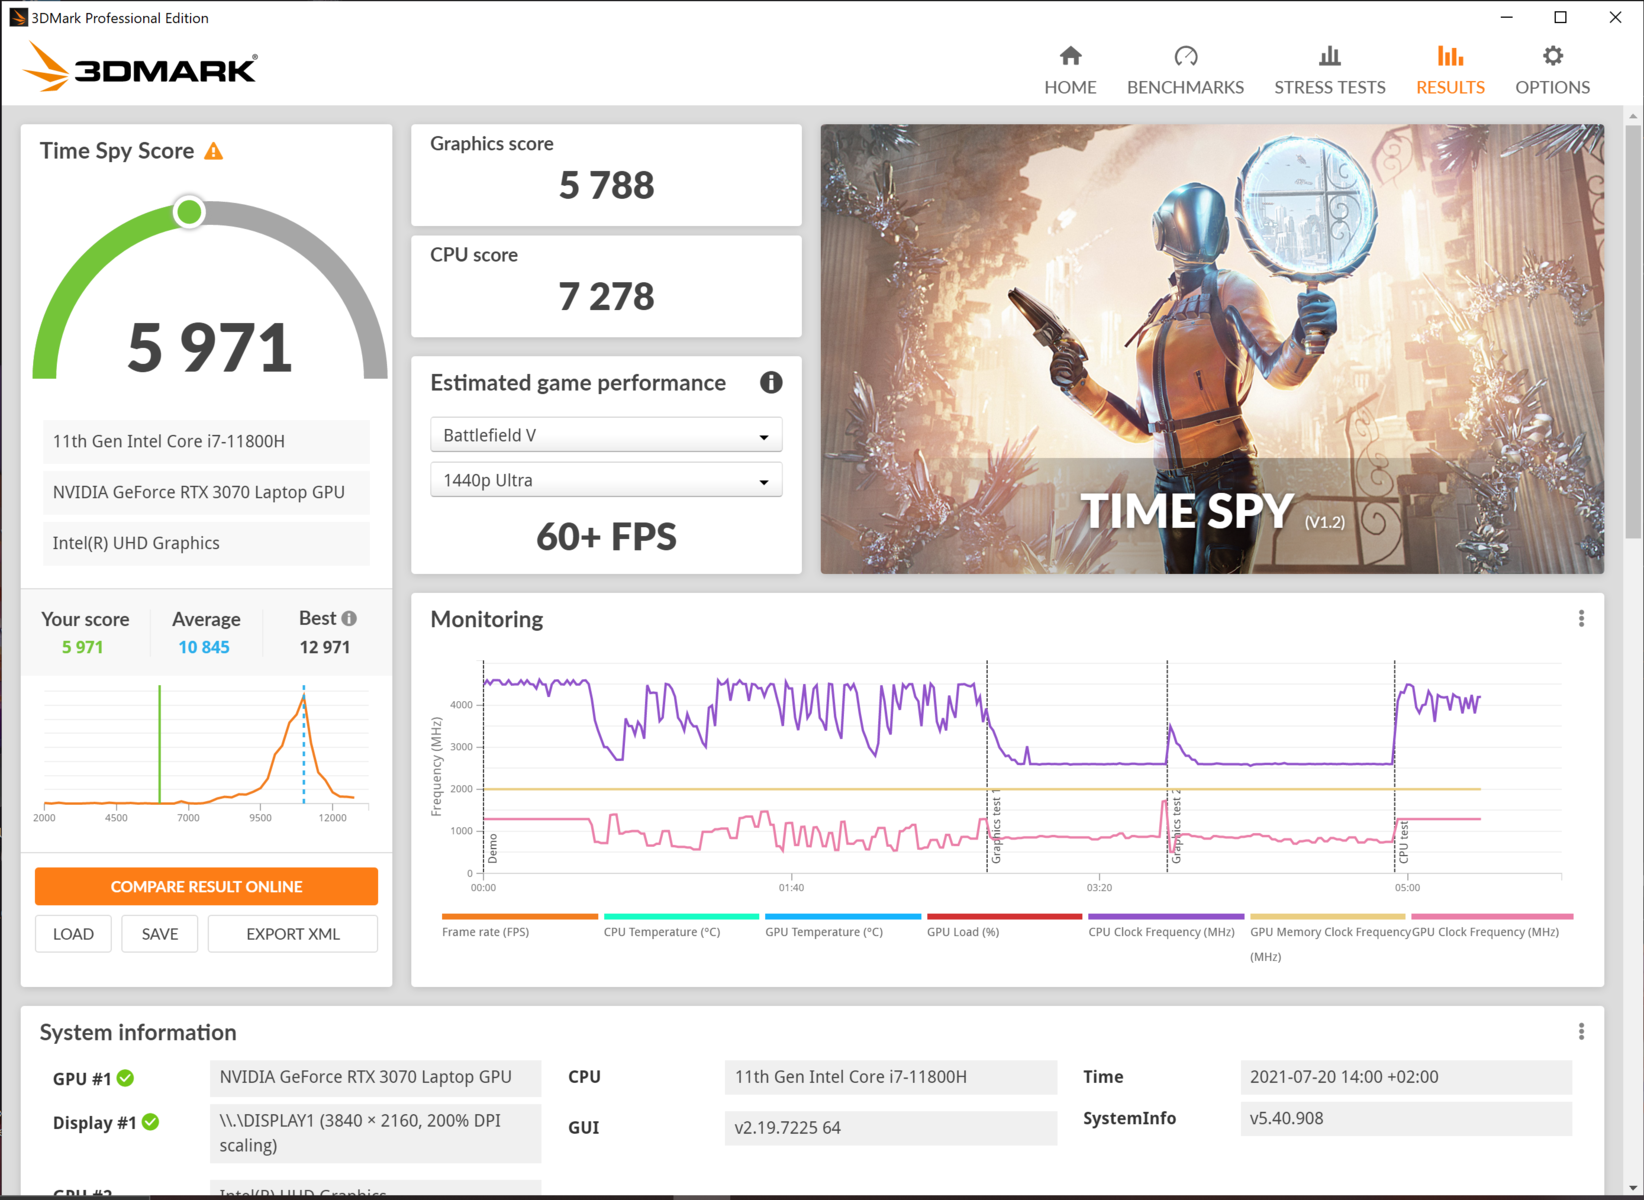
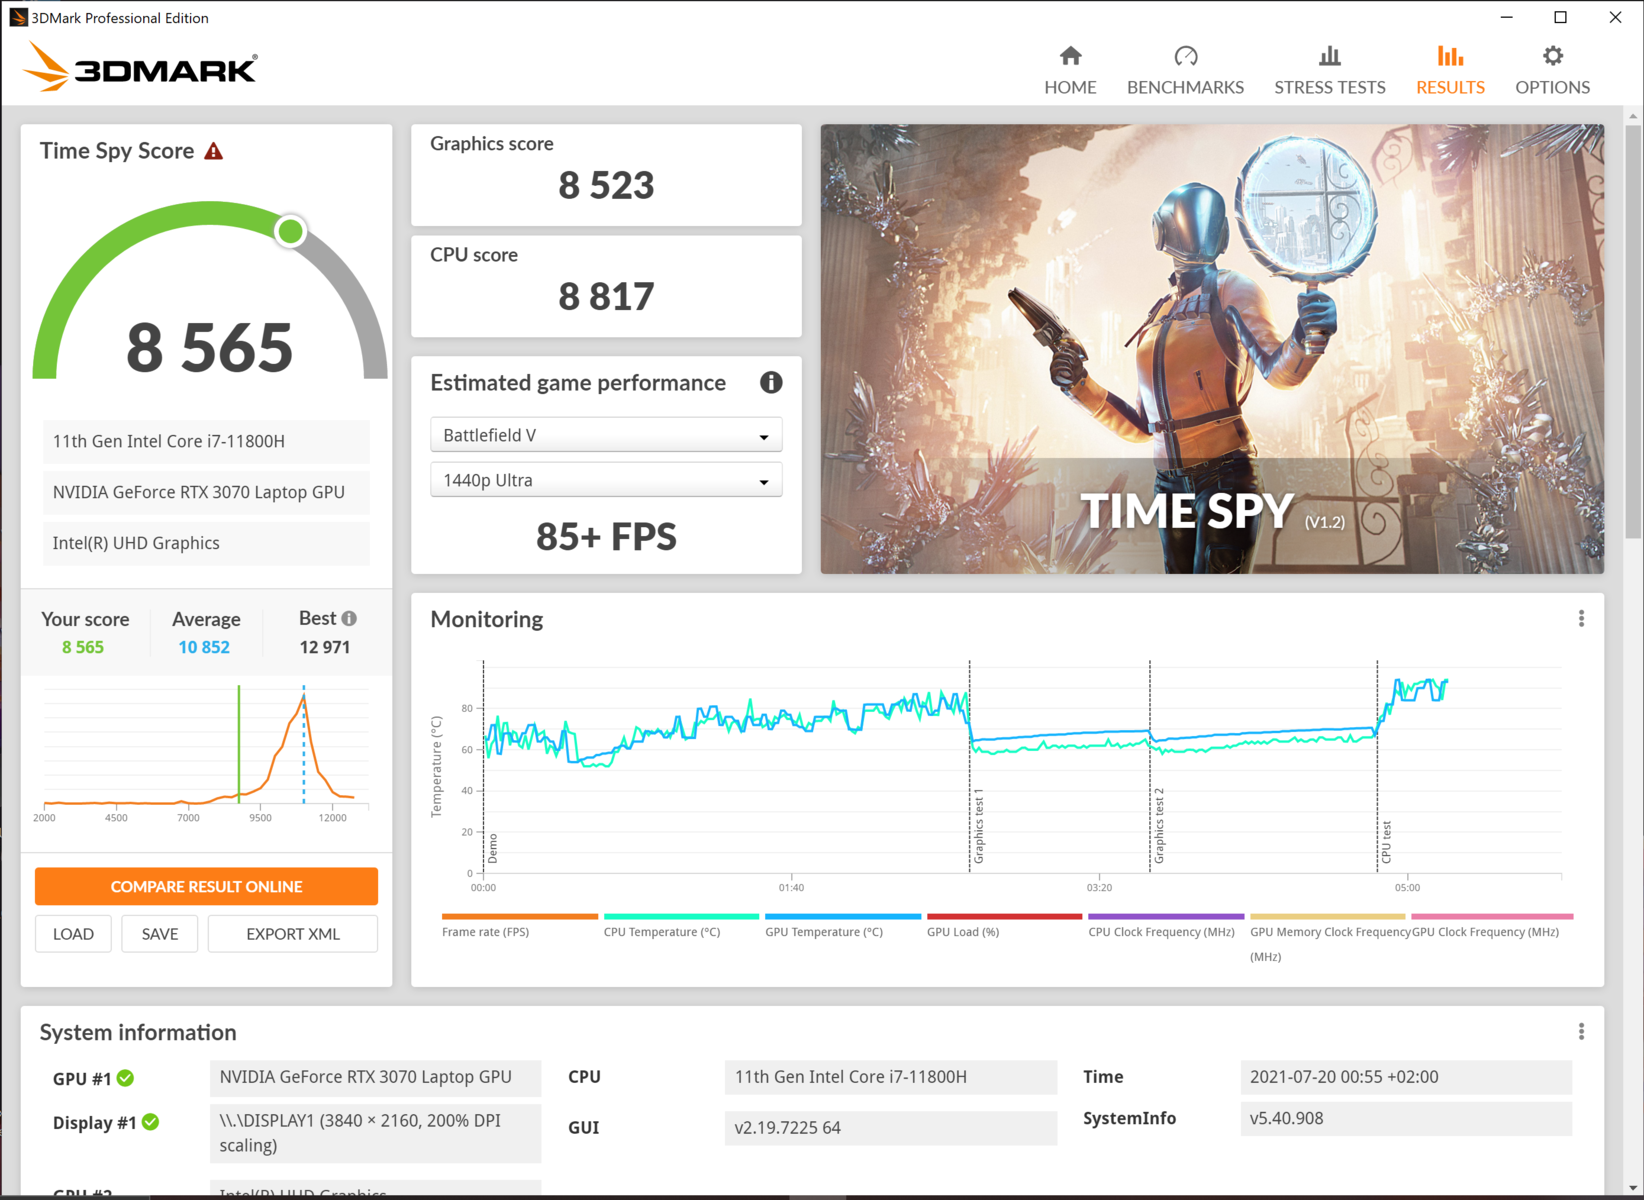
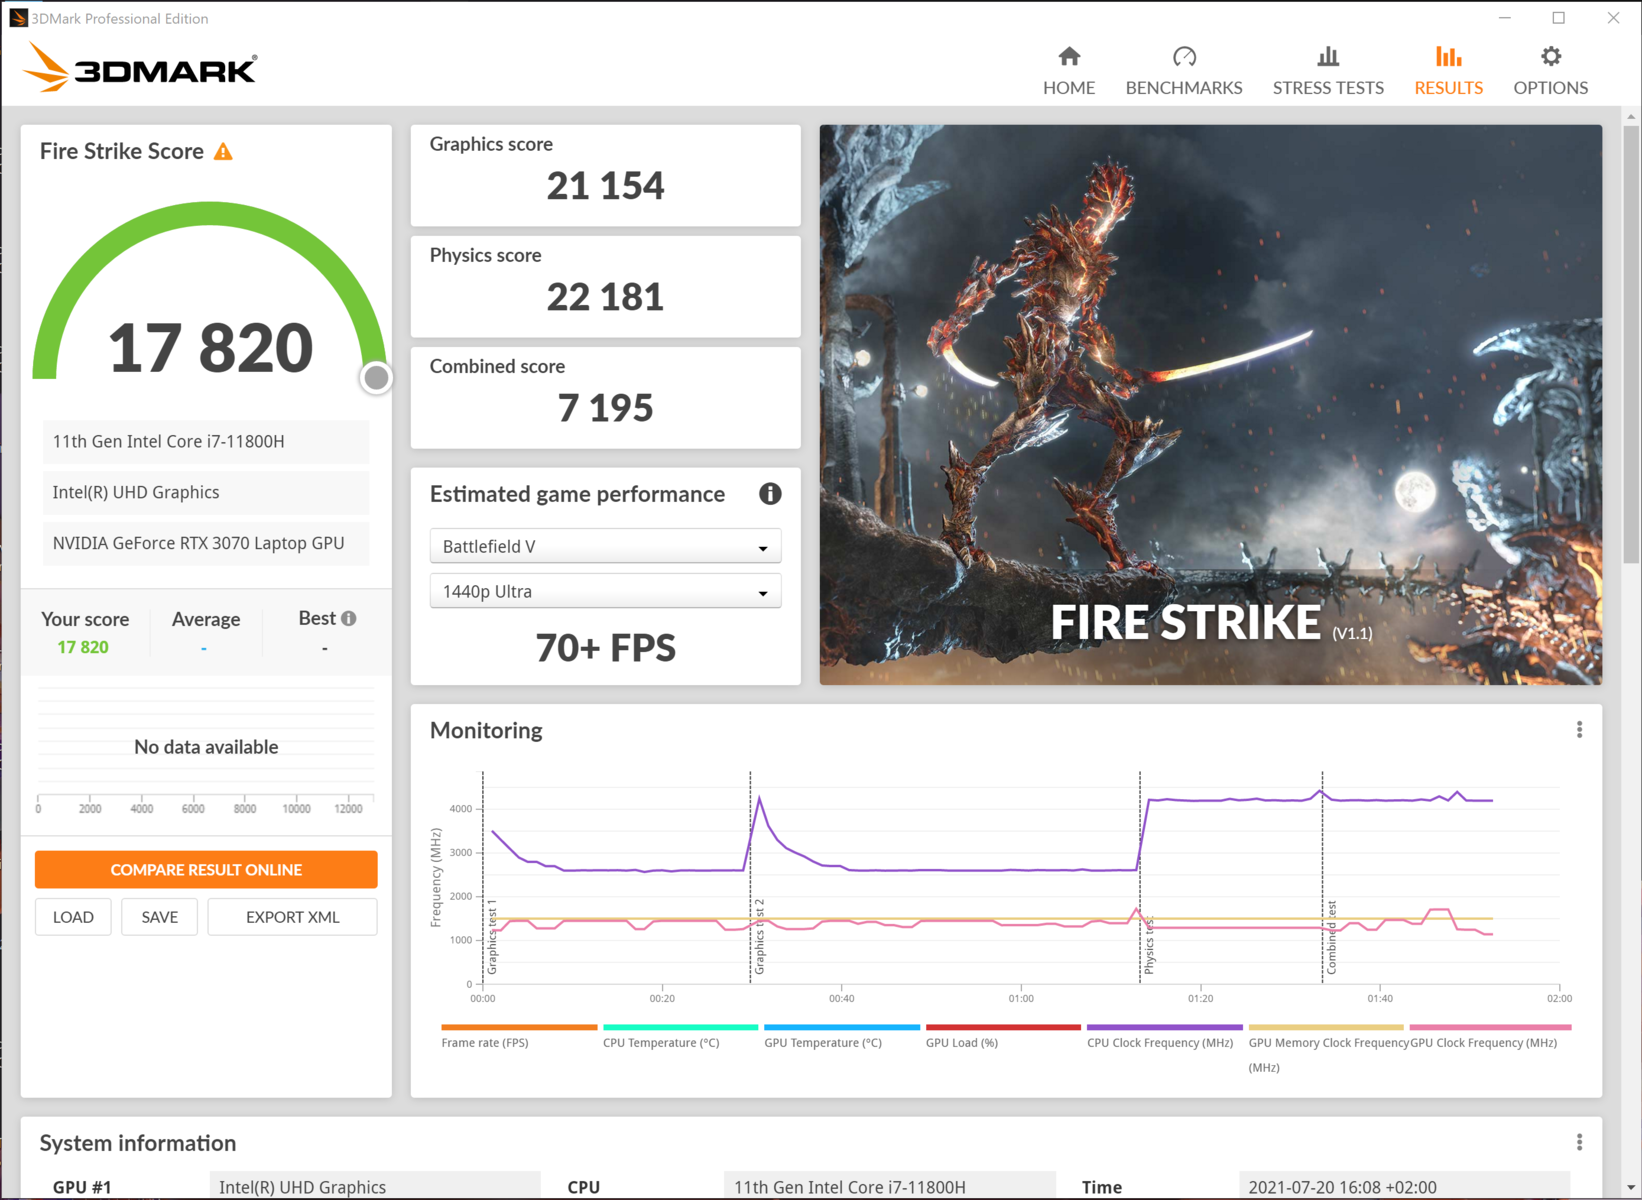
Graphics card
Our configuration of the test device uses a laptop version of the Nvidia GeForce RTX 3070 that has a TDP of 105 watts. If you let Gigabyte's Control Center's Microsoft Azure AI automatically manage the performance profiles, the maximum performance is not achieved, and the 3DMark scores are even slightly lower than those of the predecessor. Our recommendation is to manually switch to Turbo mode for titles that require maximum performance. In some cases, the fan control of the different performance profiles is not optimized. The fans don't respond fast enough when manually switching to Game mode at times, which can lead to unwanted performance drops.
Generally, we weren't able to achieve full performance on battery power. Furthermore, the Nvidia Studio driver for creators does its job, and there's only a minor difference compared to the gaming driver.
The performance offered by other graphics cards that we've tested can be found in our GPU Benchmarks article.

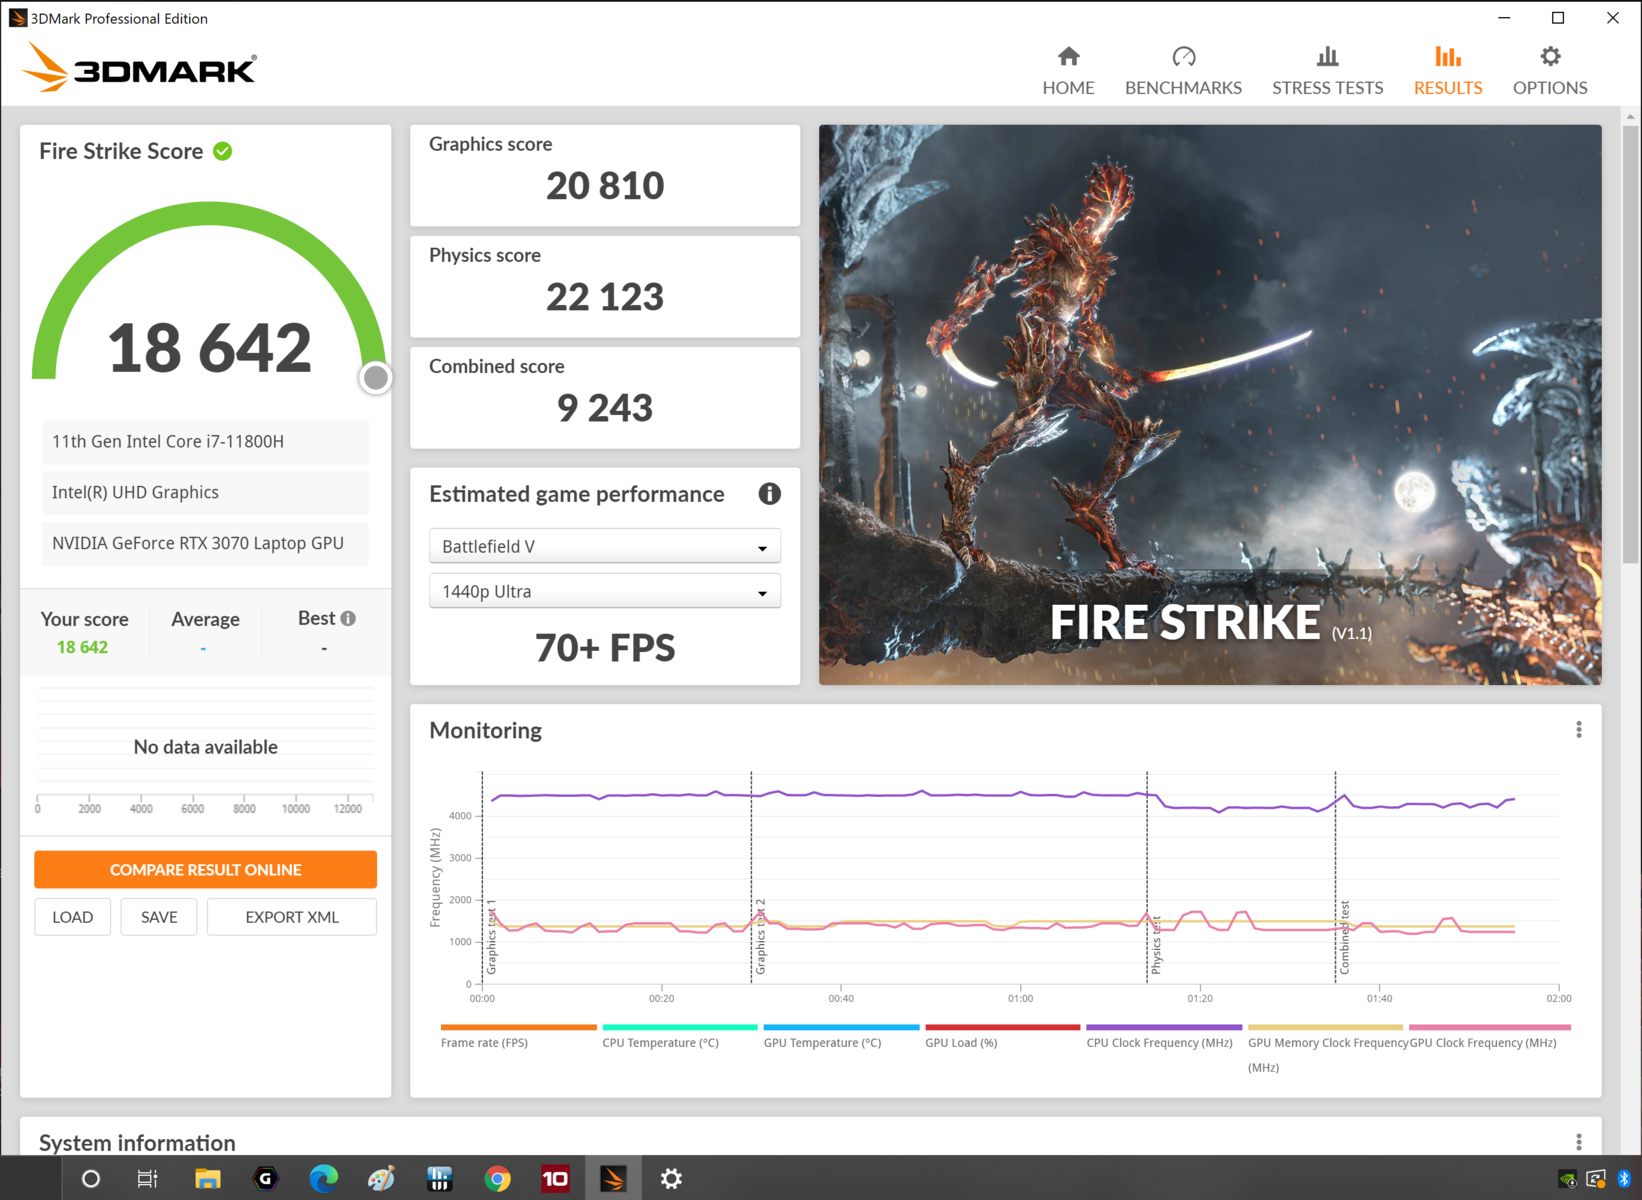
| 3DMark 06 Standard Score | 47262 points | |
| 3DMark 11 Performance | 25754 points | |
| 3DMark Fire Strike Score | 19887 points | |
| 3DMark Time Spy Score | 8565 points | |
Help | ||
Gaming performance
Thanks to the RTX 3070 with its 105-watt TDP and the great 4K display, the Gigabyte Aero 15 OLED XD is also suitable for 4K titles. If you tweak the details a bit, you'll achieve smooth frame rates in almost every game. Compared with the competition, the manufacturer delivers a somewhat inconsistent, but high performance. In some titles, our test device even beats devices with a higher TDP, such as the Asus Strix G15 G513QR. Unfortunately, the Aero 15 OLED XD doesn't come close to the Alienware m15 R4's performance. If you compare it with the older Gigabyte Aero 15 OLED XC, its performance is identical to the successor. However, there's no 120 Hz panel here, but only one with 60 Hz. This more or less automatically disqualifies the laptop for competitive gaming, since you would have to connect an external monitor to prevent disadvantages.
| The Witcher 3 | |
| 1920x1080 High Graphics & Postprocessing (Nvidia HairWorks Off) | |
| Average of class Gaming (40.1 - 424, n=53, last 2 years) | |
| Gigabyte Aero 15 OLED XD | |
| Asus ZenBook Pro Duo UX582 LR-1BH2 | |
| Gigabyte Aero 15 OLED XC | |
| Average NVIDIA GeForce RTX 3070 Laptop GPU (122.1 - 207, n=34) | |
| Asus ROG Strix G15 G513QR | |
| 1920x1080 Ultra Graphics & Postprocessing (HBAO+) | |
| Average of class Gaming (18.4 - 224, n=78, last 2 years) | |
| Alienware m15 R4 | |
| Asus ROG Strix G15 G513QR | |
| Gigabyte Aero 15 OLED XC | |
| Average NVIDIA GeForce RTX 3070 Laptop GPU (34.9 - 109, n=52) | |
| Gigabyte Aero 15 OLED XD | |
| Asus ZenBook Pro Duo UX582 LR-1BH2 | |
| Asus ZenBook Pro Duo UX582 LR-1BH2 | |
| Asus TUF Gaming A15 FA506QR-AZ061T | |
Frame rates remain constant in our test with The Witcher 3 and only decrease slightly. We didn't detect any major frame drops, and our test device delivers very good performance compared with the competition.
The Witcher 3 FPS diagram
| low | med. | high | ultra | QHD | 4K | |
|---|---|---|---|---|---|---|
| GTA V (2015) | 184 | 175 | 159 | 94 | 78.4 | 83.3 |
| The Witcher 3 (2015) | 339 | 241 | 173 | 91.6 | 64.3 | |
| Dota 2 Reborn (2015) | 158 | 142.2 | 135.8 | 126.7 | 107.1 | |
| Final Fantasy XV Benchmark (2018) | 172 | 118 | 88.9 | 66.5 | 39.4 | |
| X-Plane 11.11 (2018) | 122 | 104 | 84 | 57.8 | ||
| Far Cry 5 (2018) | 138 | 117 | 111 | 103 | 94 | 51 |
| Strange Brigade (2018) | 427 | 211 | 173 | 152 | 114 | 68.1 |
| F1 2020 (2020) | 119 | 186 | 159 | 132 | 99.8 | 57.7 |
| Immortals Fenyx Rising (2020) | 104 | 89 | 87 | 69 | 56 | 37 |
| Cyberpunk 2077 1.0 (2020) | 116 | 81 | 67 | 58 | 39 | 17 |
Emissions - Hot and variable fan behavior
Noise emissions
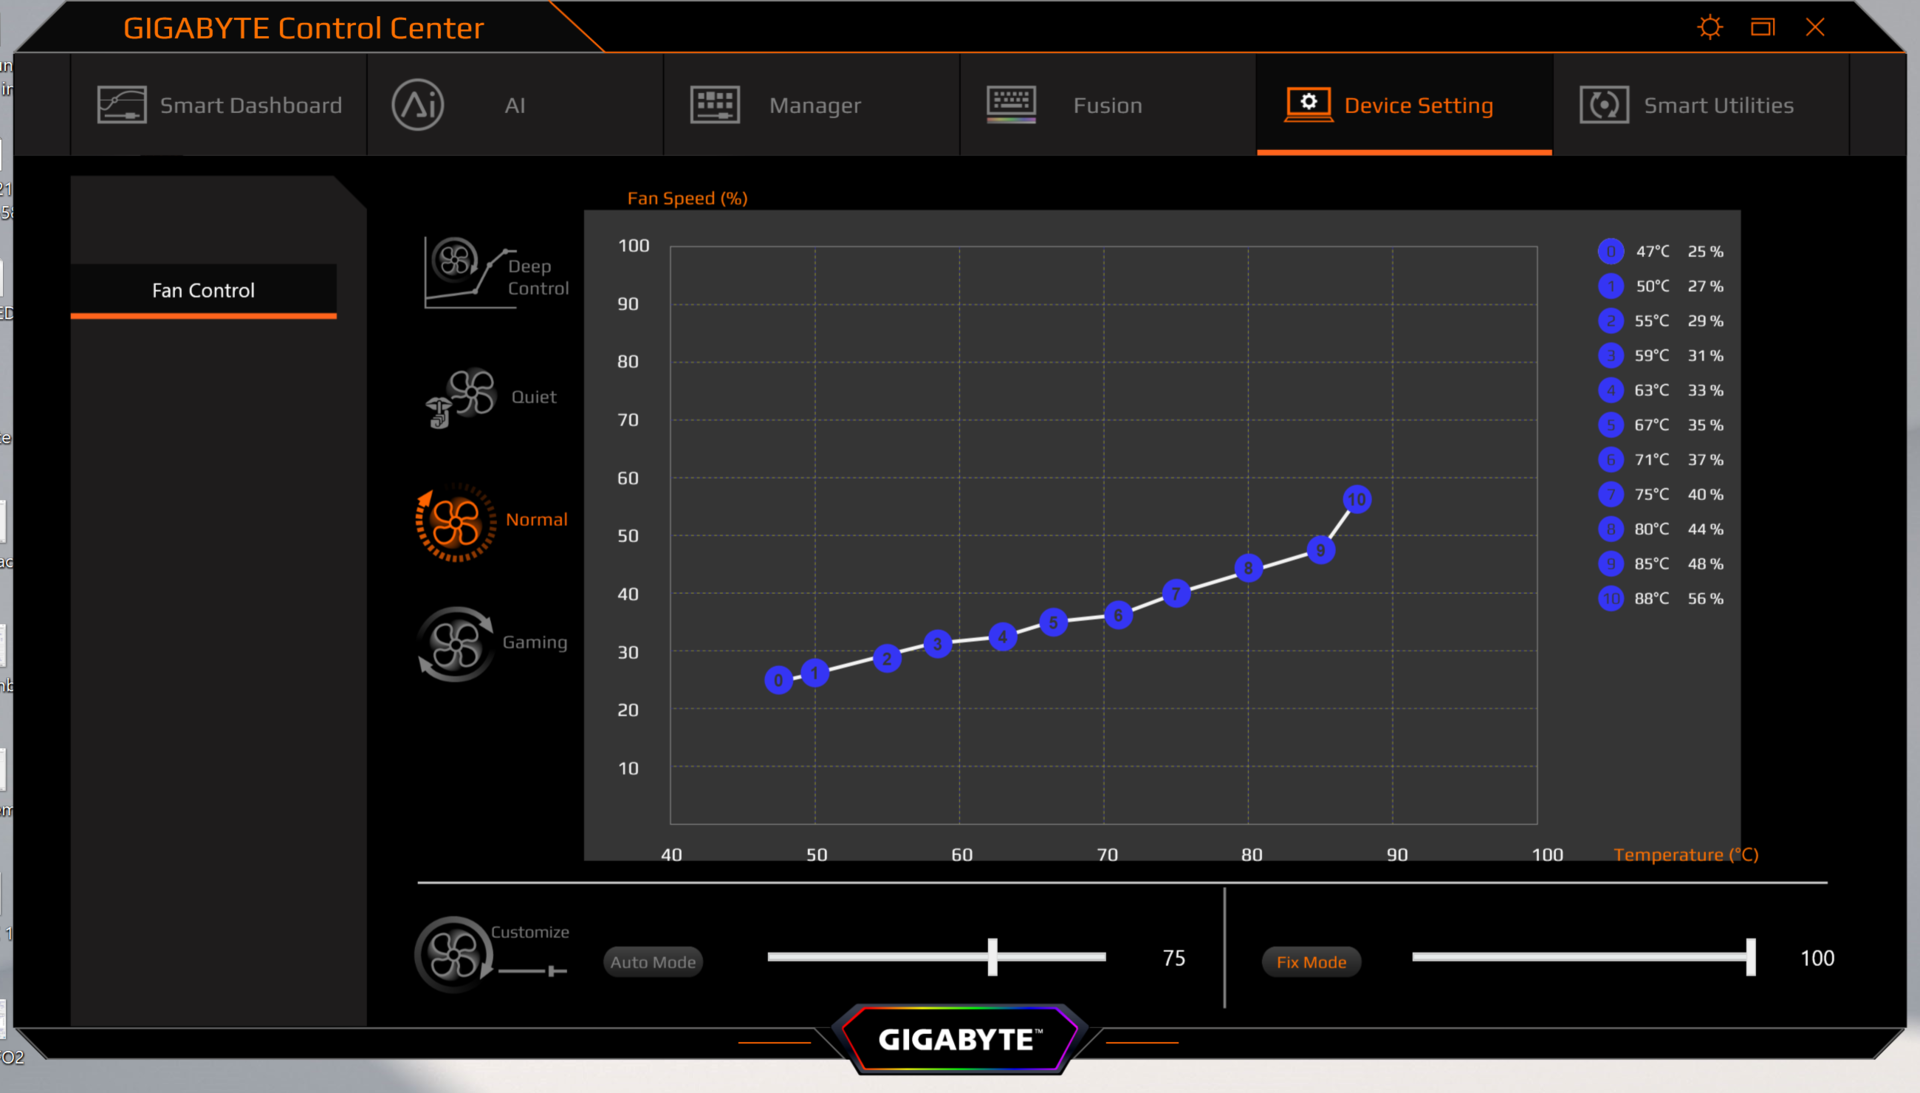
Our test device remains relatively quiet in idle usage and under low load. Unfortunately, the fan speed also fluctuates here. Only in Meeting mode do the fans of the Aero 15 OLED XD remain at a constant and only slightly perceptible level. We found the noise pattern to be a bit high-frequency in the test, making it a disruption when working. In this case, we recommend manually adjusting the fan curve and deactivating the AI of Gigabyte's Control Center. Although the fans behave variably under load, the noise level remains within a tolerable range, and it only gets truly loud in exceptional situations.
Noise Level
| Idle |
| 30 / 32 / 35 dB(A) |
| Load |
| 44 / 60 dB(A) |
 | ||
30 dB silent 40 dB(A) audible 50 dB(A) loud |
||
min: | ||
Temperature
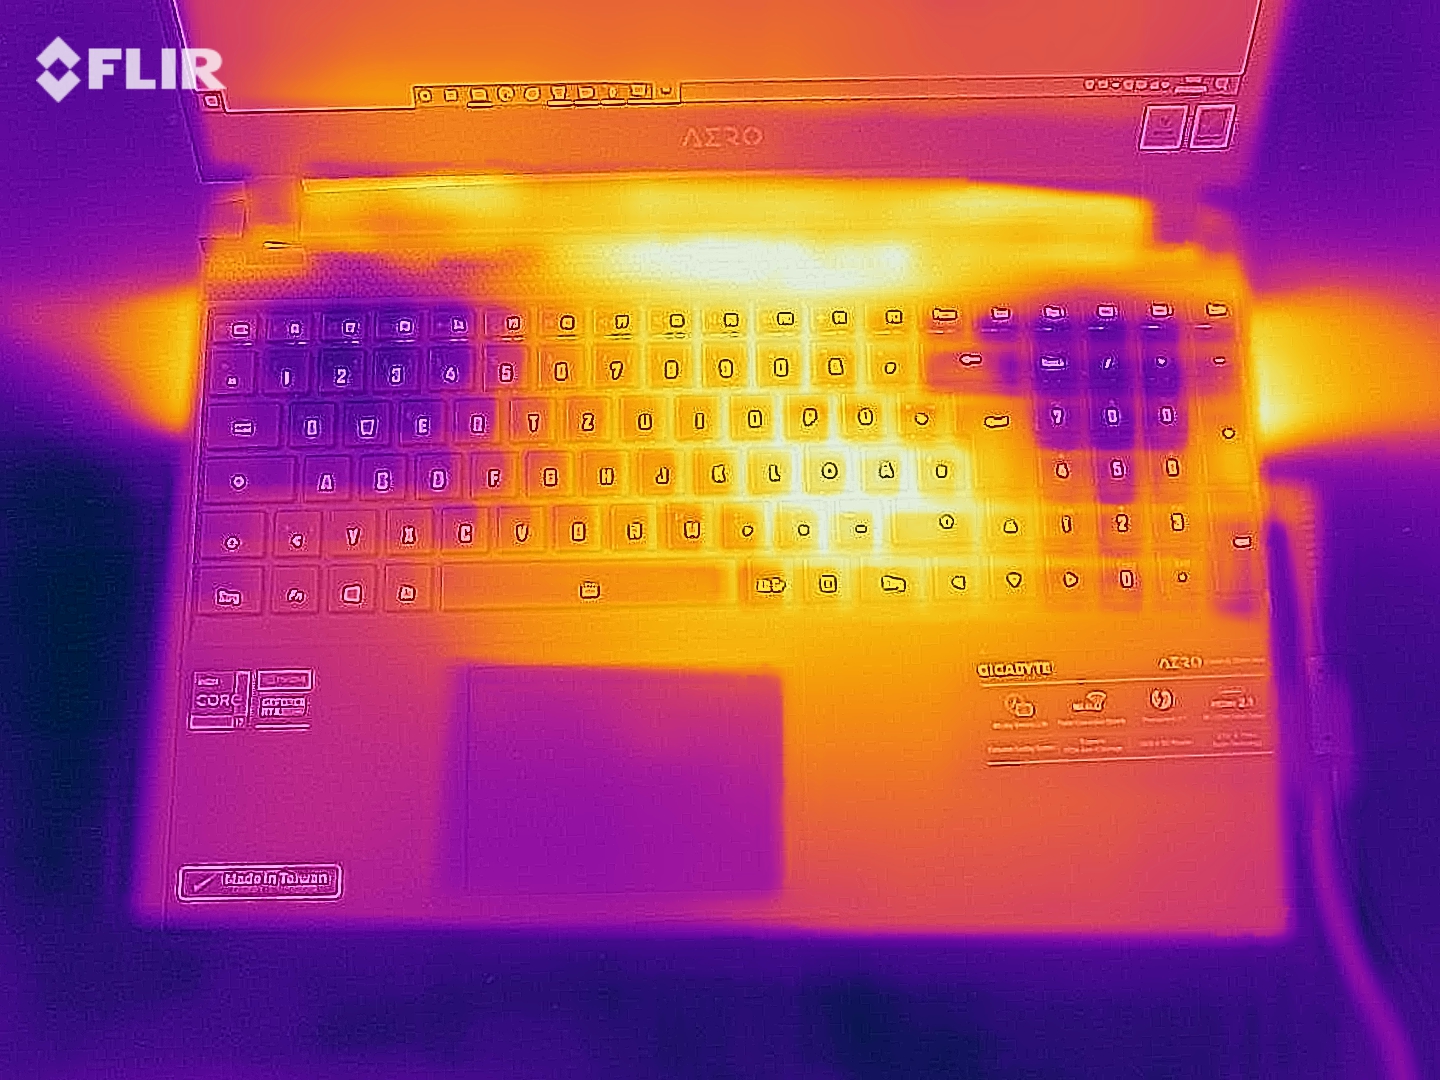
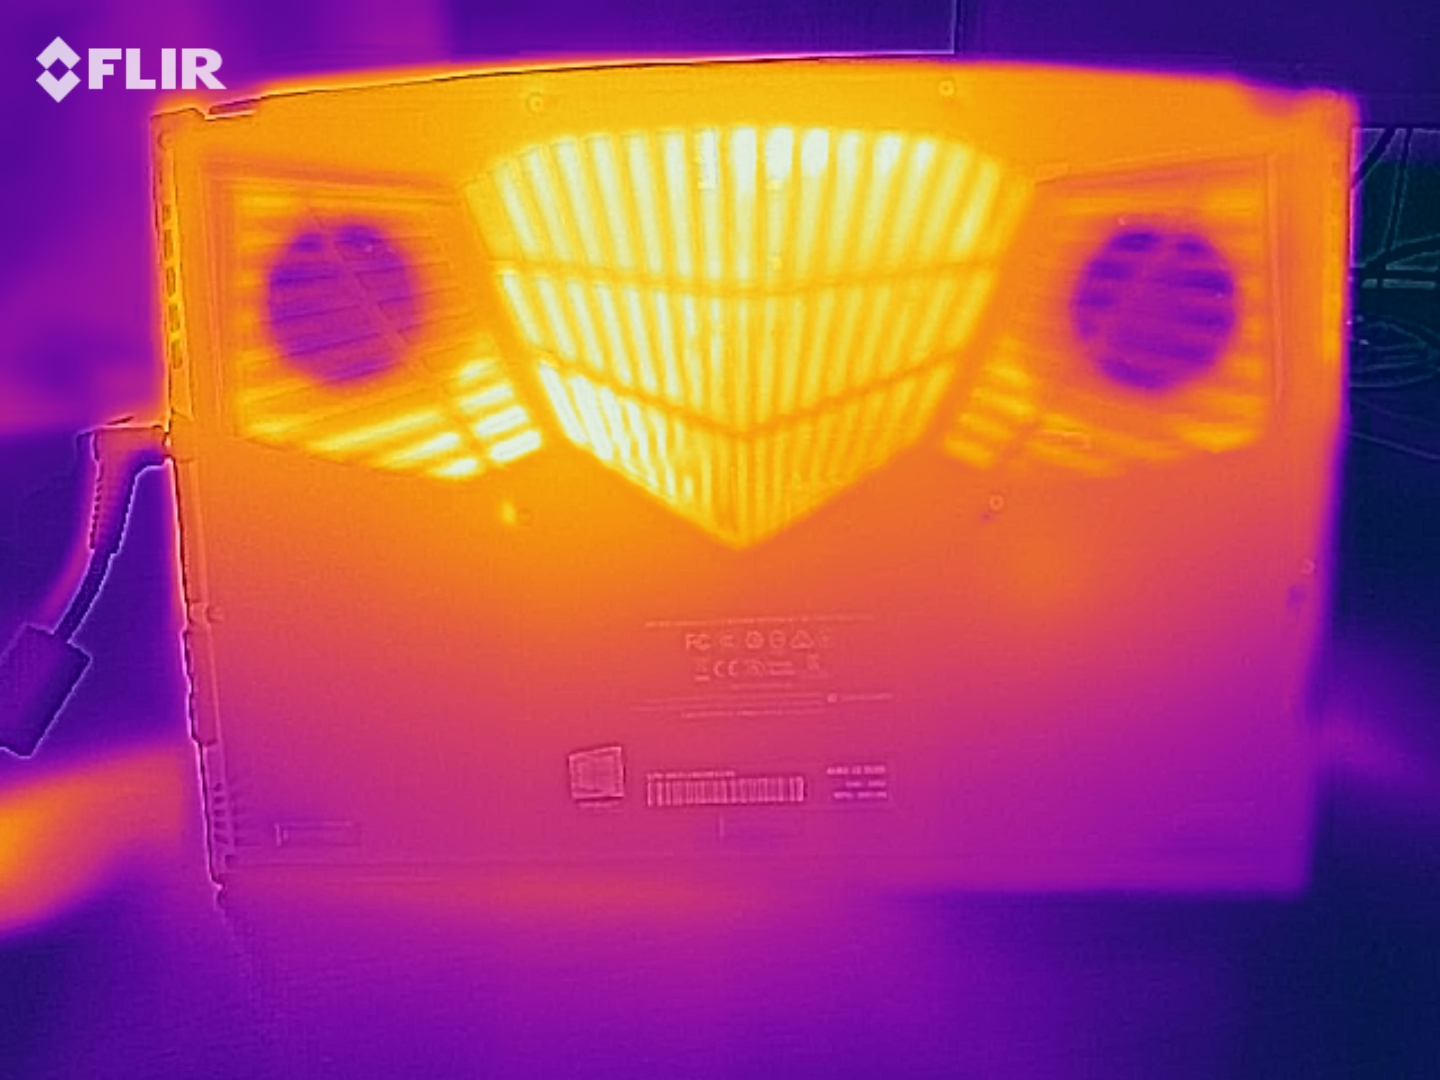
Gigabyte focuses here on a largely quiet operation at the expense of high temperatures. Since the powerful NVMe SSD is cooled with a thermal pad that conducts waste heat through the case's bottom, the latter can get even hotter in addition to the temperature increase caused by the slow-responding fans. Not only does the laptop get very warm in extreme scenarios, but also in idle usage or while browsing the web. The fact that the keyboard surface also heats up in the process hits the nail on the head and makes the overall picture look even worse.
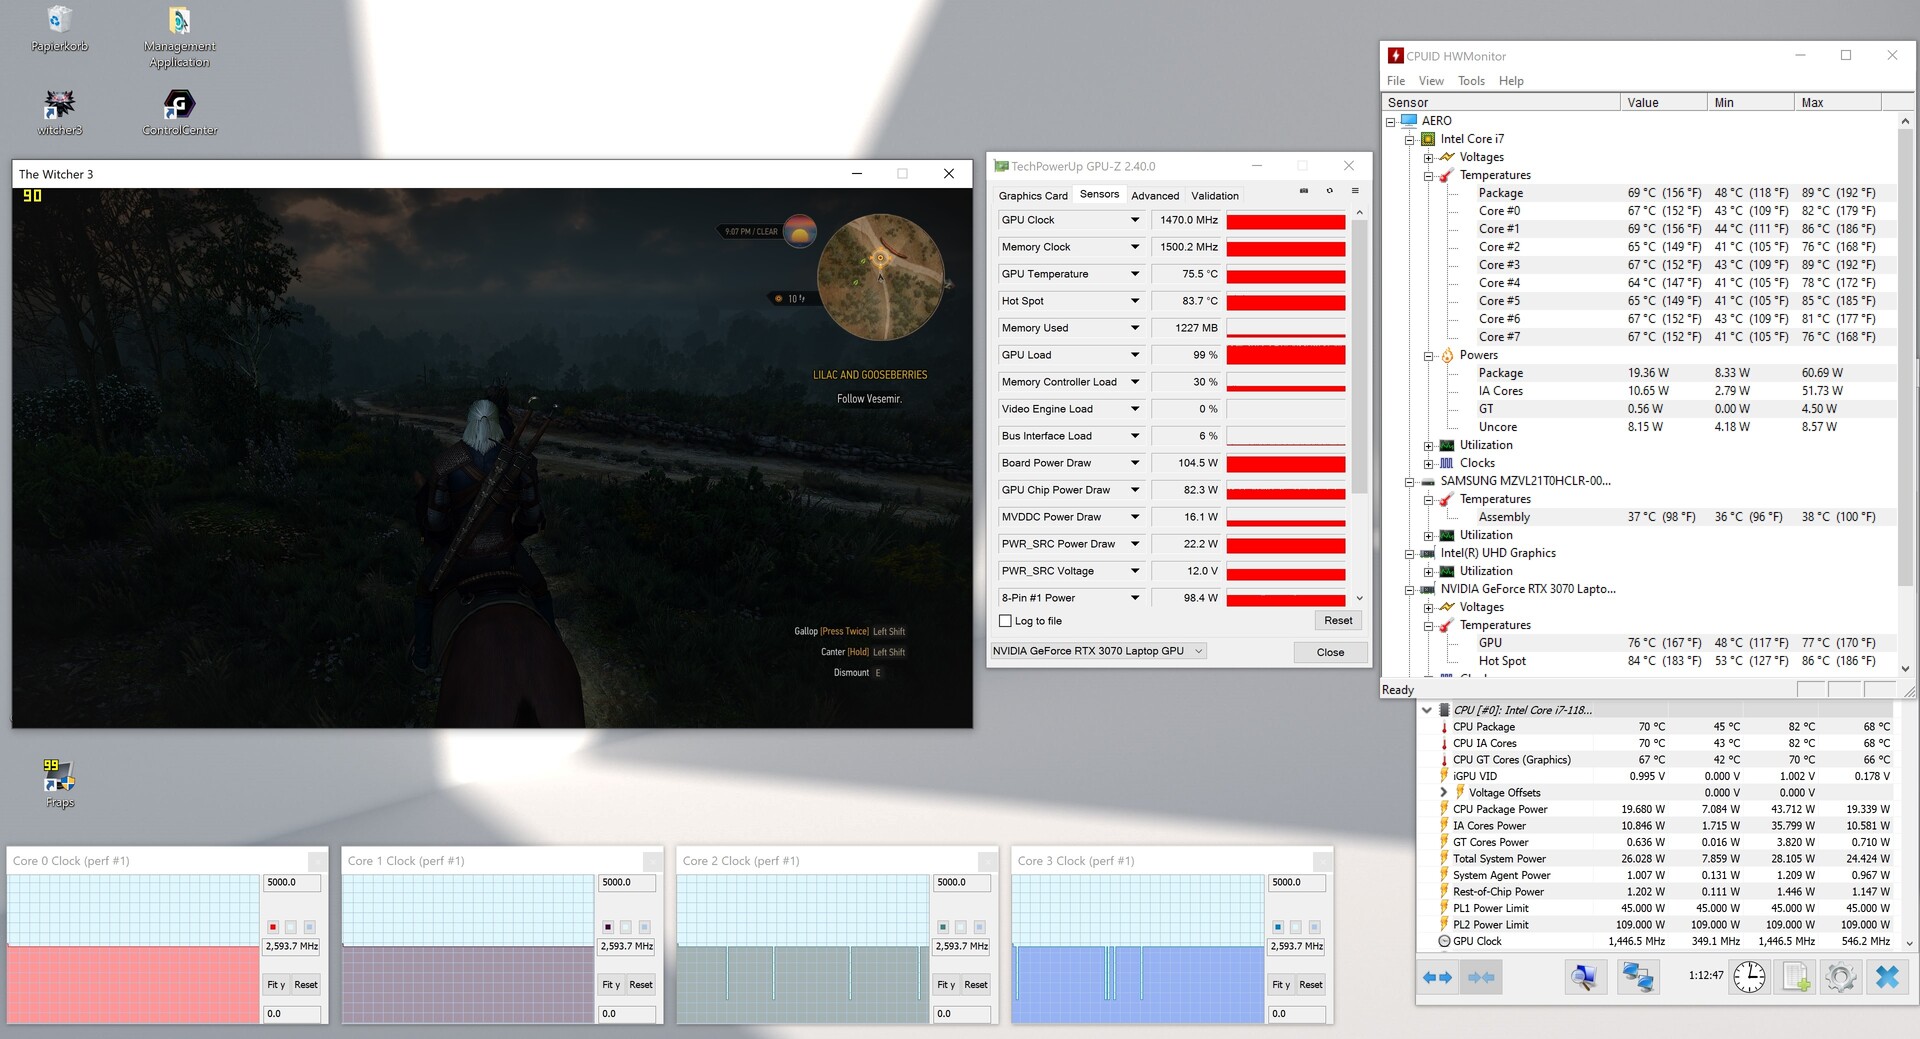
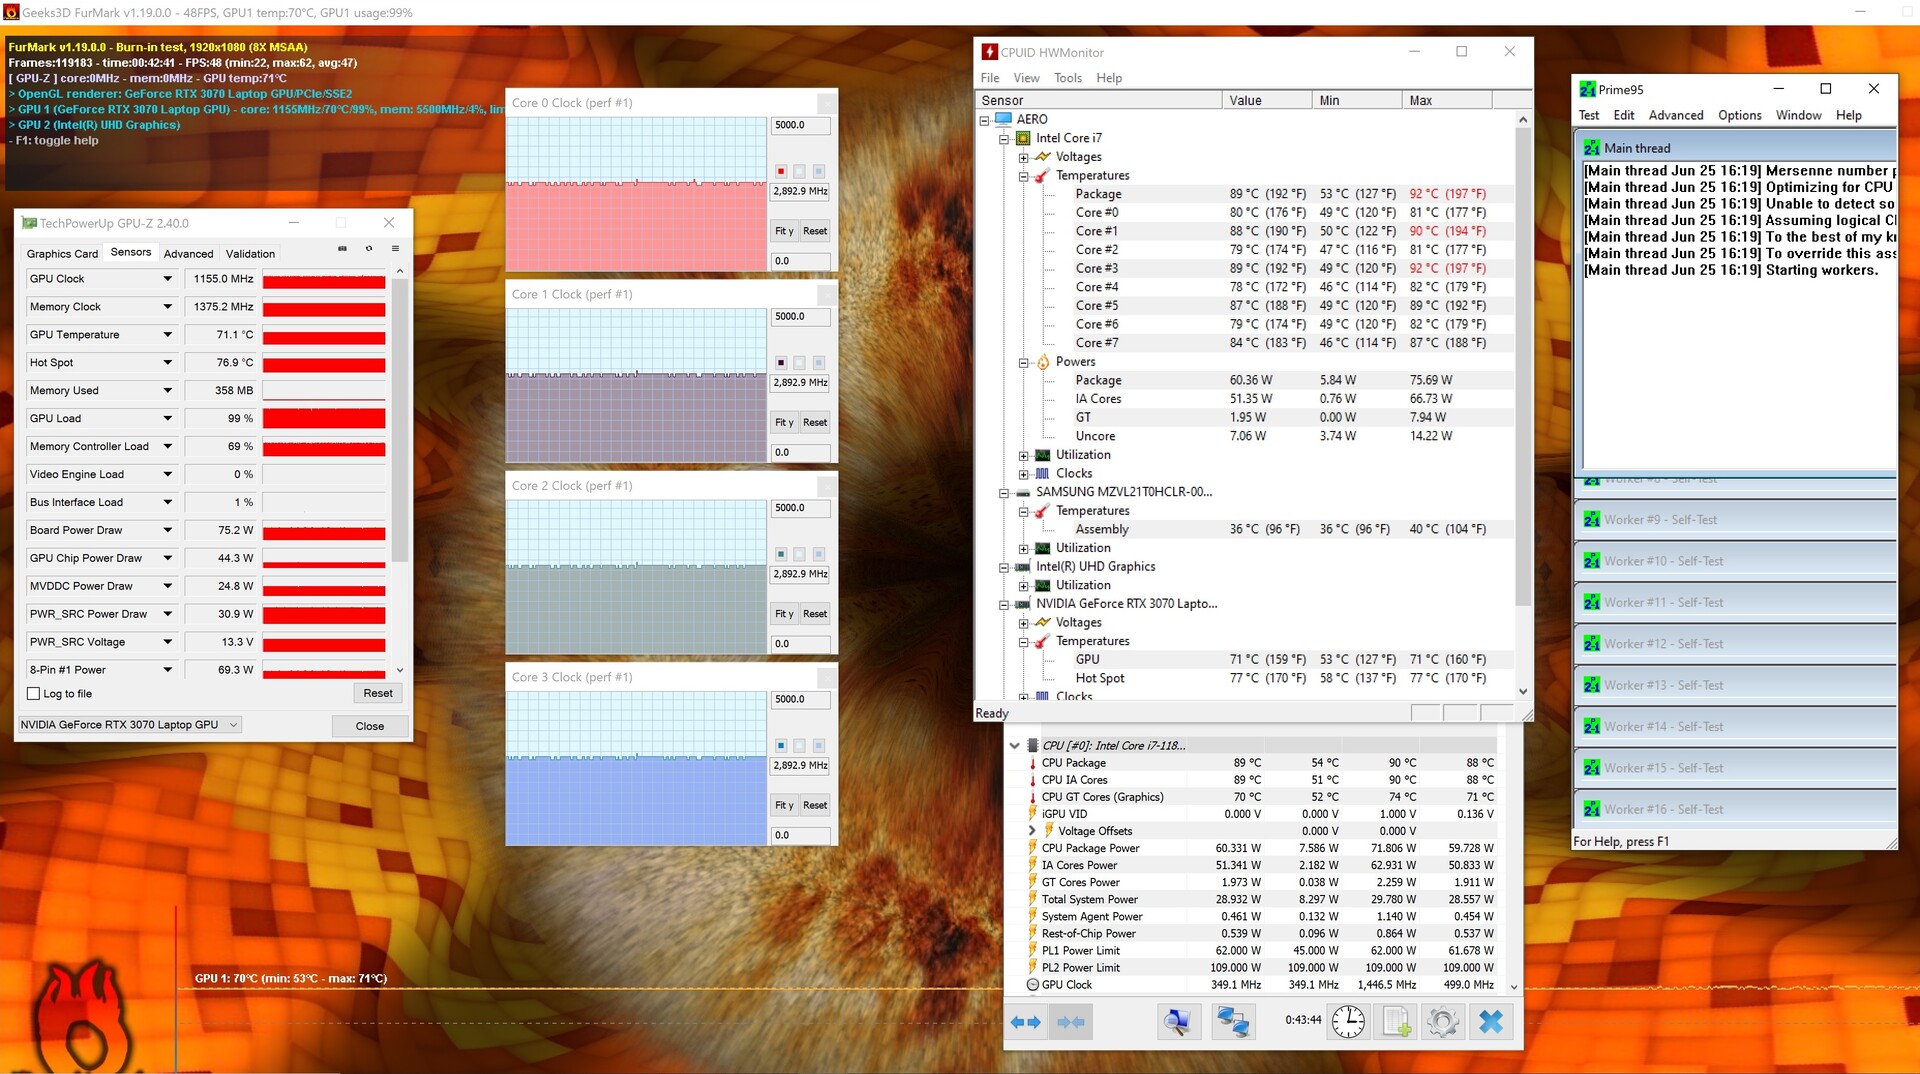
In the stress test, the Aero 15 OLED XD's CPU begins at just over 4,000 MHz and then stabilizes at 2,900 MHz. An interesting aspect is the temperature, which rises to 92 °C (~198 °F) within a very short period of time and then settles at 80 °C (~176 °F) to 90 °C (~194 °F). The graphics card remains relatively cool at a clock rate of 1,445 MHz and 1,155 MHz, respectively, and reaches a maximum temperature of only 71 °C (~160 °F). We weren't able to register any issues in everyday use, since such an extreme situation should rarely occur anyway.
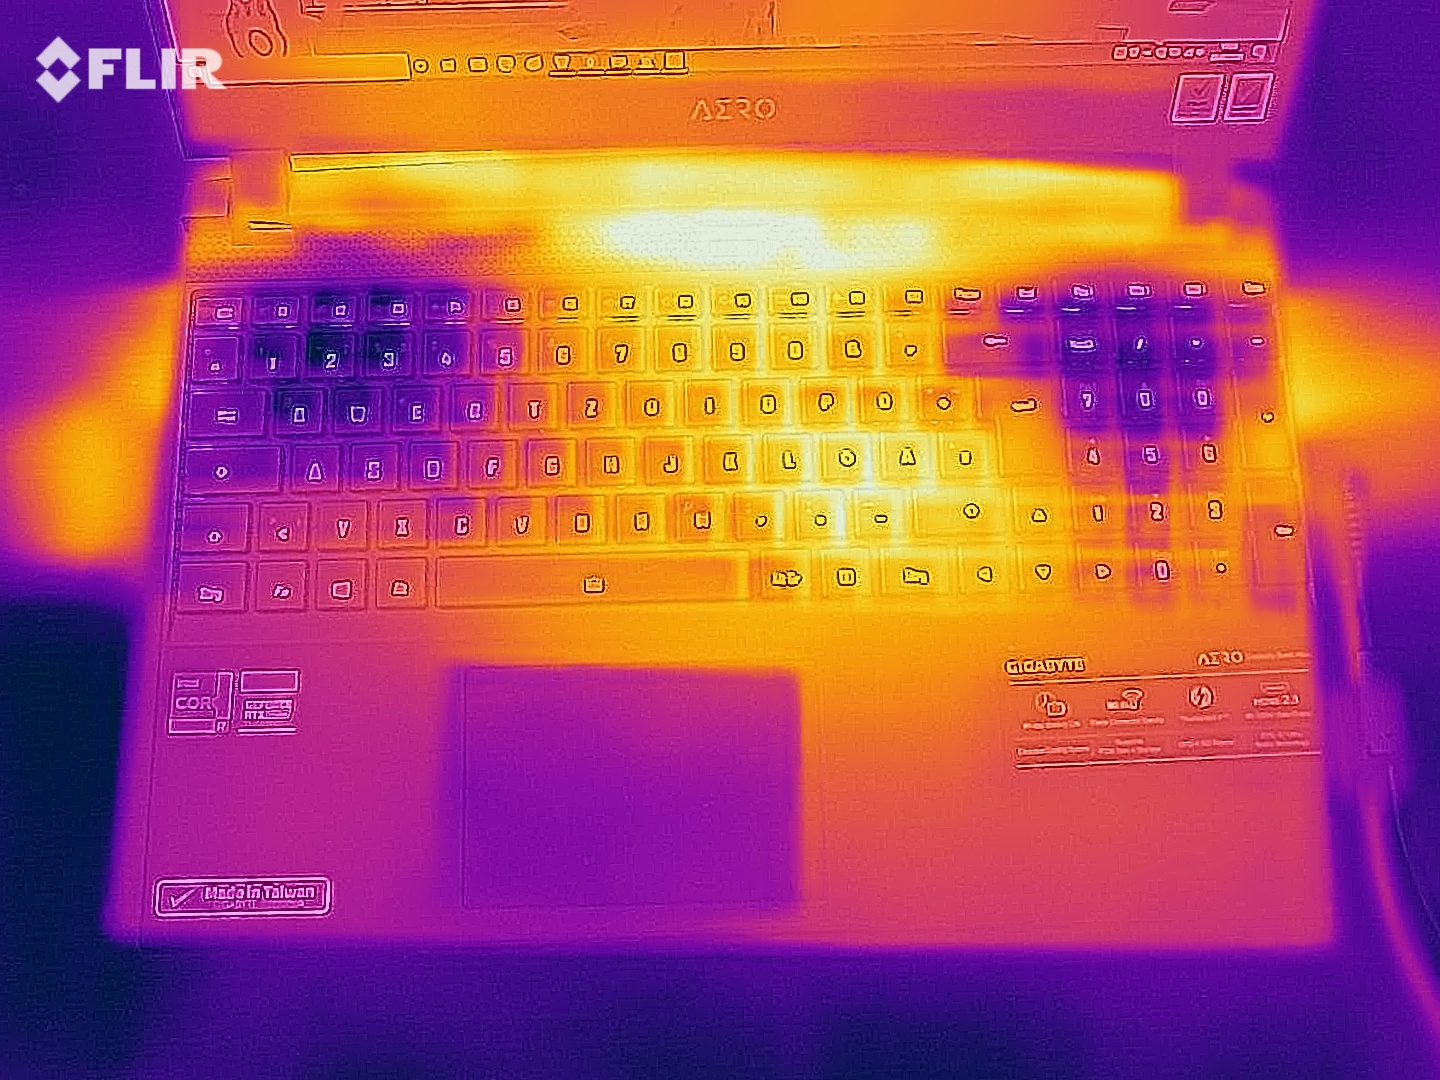
(±) The maximum temperature on the upper side is 45 °C / 113 F, compared to the average of 40.5 °C / 105 F, ranging from 21.2 to 68.8 °C for the class Gaming.
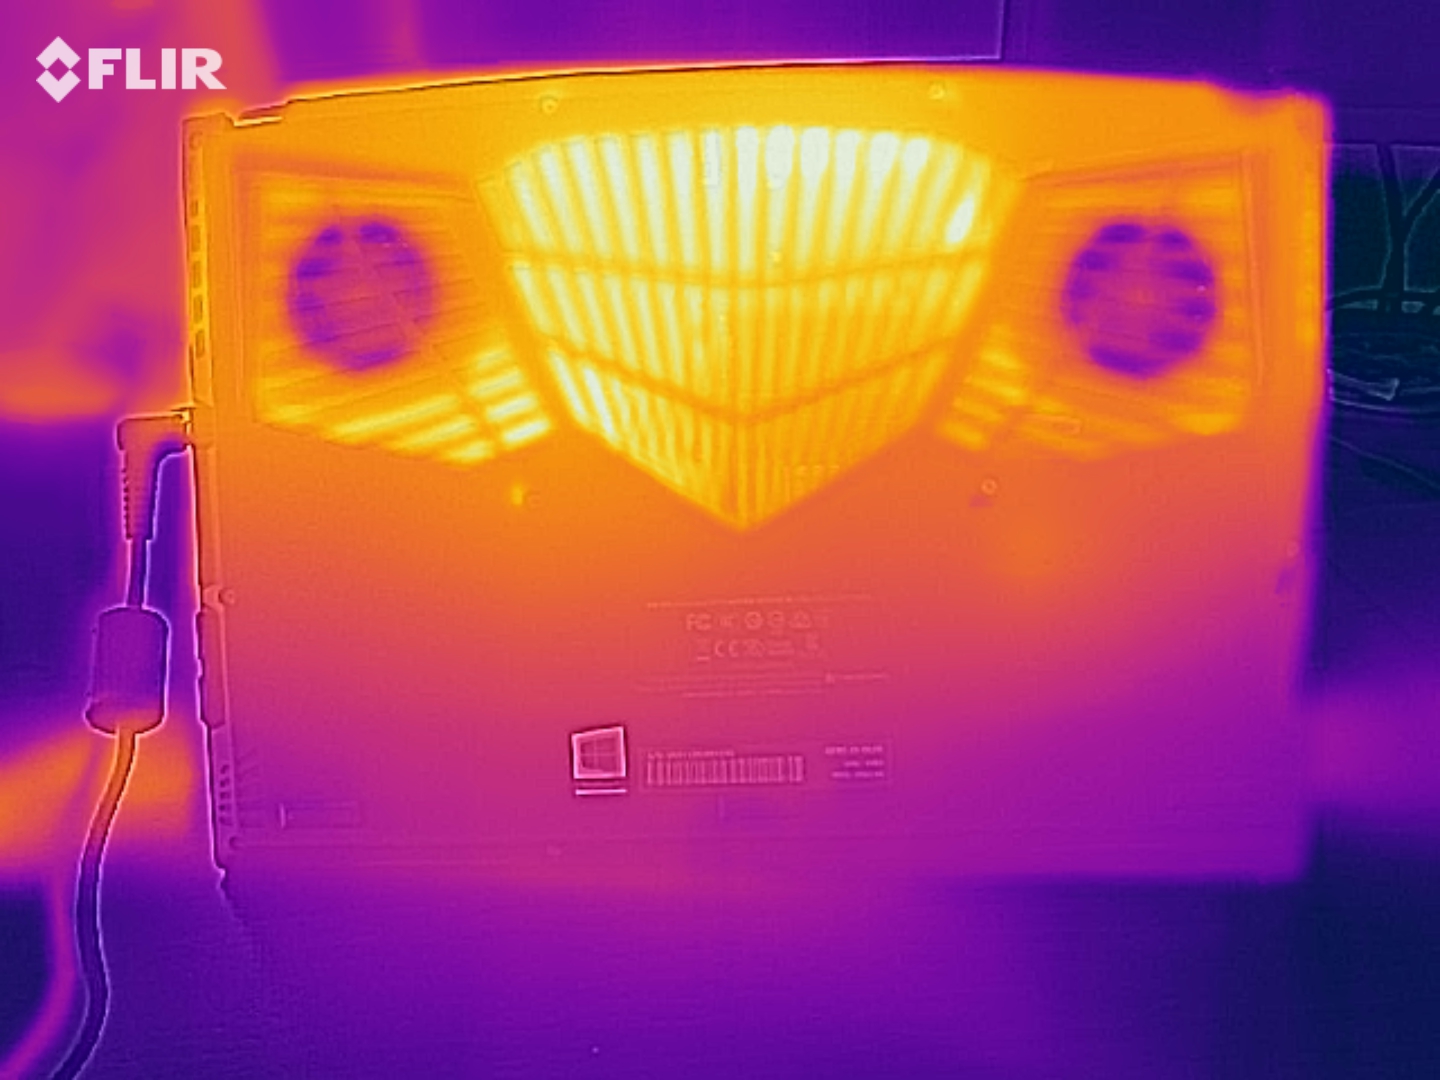
(-) The bottom heats up to a maximum of 54 °C / 129 F, compared to the average of 43.3 °C / 110 F
(+) In idle usage, the average temperature for the upper side is 30.9 °C / 88 F, compared to the device average of 33.9 °C / 93 F.
(-) Playing The Witcher 3, the average temperature for the upper side is 41.2 °C / 106 F, compared to the device average of 33.9 °C / 93 F.
(±) The palmrests and touchpad can get very hot to the touch with a maximum of 38 °C / 100.4 F.
(-) The average temperature of the palmrest area of similar devices was 28.9 °C / 84 F (-9.1 °C / -16.4 F).
Speakers
When it comes to the speakers, Gigabyte managed to provide balanced mids in the Aero 15 OLED XD, but the nearly absent bass has hardly improved. In addition, voices don't sound all that muffled now as they did in the predecessor. We also agreed on this point: The Aero 15 OLED XD offers enough quality for VoIP applications or YouTube videos, but users who want more will have to resort to the integrated audio jack or to Bluetooth.
Gigabyte Aero 15 OLED XD audio analysis
(±) | speaker loudness is average but good (75 dB)
Bass 100 - 315 Hz
(-) | nearly no bass - on average 21.1% lower than median
(±) | linearity of bass is average (12.7% delta to prev. frequency)
Mids 400 - 2000 Hz
(+) | balanced mids - only 4.8% away from median
(±) | linearity of mids is average (7.7% delta to prev. frequency)
Highs 2 - 16 kHz
(+) | balanced highs - only 3.5% away from median
(±) | linearity of highs is average (8.1% delta to prev. frequency)
Overall 100 - 16.000 Hz
(±) | linearity of overall sound is average (19.8% difference to median)
Compared to same class
» 69% of all tested devices in this class were better, 6% similar, 25% worse
» The best had a delta of 6%, average was 18%, worst was 132%
Compared to all devices tested
» 49% of all tested devices were better, 7% similar, 44% worse
» The best had a delta of 4%, average was 24%, worst was 134%
Gigabyte Aero 15 OLED XC audio analysis
(+) | speakers can play relatively loud (84 dB)
Bass 100 - 315 Hz
(-) | nearly no bass - on average 23.4% lower than median
(±) | linearity of bass is average (10.2% delta to prev. frequency)
Mids 400 - 2000 Hz
(±) | higher mids - on average 5.1% higher than median
(+) | mids are linear (4.3% delta to prev. frequency)
Highs 2 - 16 kHz
(+) | balanced highs - only 2.9% away from median
(±) | linearity of highs is average (7.2% delta to prev. frequency)
Overall 100 - 16.000 Hz
(±) | linearity of overall sound is average (17.6% difference to median)
Compared to same class
» 47% of all tested devices in this class were better, 8% similar, 45% worse
» The best had a delta of 5%, average was 18%, worst was 45%
Compared to all devices tested
» 33% of all tested devices were better, 8% similar, 59% worse
» The best had a delta of 4%, average was 24%, worst was 134%
Energy management - Now with even higher power consumption
Energy consumption
Power consumption has increased compared to the predecessor despite it having the same CPU and GPU TDP as well as comparable brightness. In this way, the minimum value is 23 to 34 watts, depending on the profile and brightness, and it even surpasses the Asus ZenBook Pro Duo. Although the latter offers less brightness, it has two displays, one of which is an OLED panel and the other a panel with IPS technology.
We measured a maximum consumption of 190 watts under load, which is an improvement compared to the predecessor. Gigabyte was careful here, and the included 230-watt power adapter has sufficient capacity.
| Off / Standby | |
| Idle | |
| Load |
|
Key:
min: | |
| Gigabyte Aero 15 OLED XD i7-11800H, GeForce RTX 3070 Laptop GPU, Samsung PM9A1 MZVL21T0HCLR, OLED, 3840x2160, 15.6" | Asus TUF Gaming A15 FA506QR-AZ061T R7 5800H, GeForce RTX 3070 Laptop GPU, SK Hynix HFM001TD3JX013N, IPS, 1920x1080, 15.6" | Asus ROG Strix G15 G513QR R9 5900HX, GeForce RTX 3070 Laptop GPU, SK Hynix HFM001TD3JX013N, IPS, 1920x1080, 15.6" | Gigabyte Aero 15 OLED XC i7-10870H, GeForce RTX 3070 Laptop GPU, WDC PC SN730 SDBPNTY-1T00, OLED, 3840x2160, 15.6" | Asus ZenBook Pro Duo UX582 LR-1BH2 i7-10870H, GeForce RTX 3070 Laptop GPU, Samsung PM981a MZVLB1T0HBLR, OLED + IPS, 3840x2160, 15.6" | Alienware m15 R4 i9-10980HK, GeForce RTX 3070 Laptop GPU, Micron 2300 1TB MTFDHBA1T0TDV, IPS, 1920x1080, 15.6" | Average NVIDIA GeForce RTX 3070 Laptop GPU | Average of class Gaming | |
|---|---|---|---|---|---|---|---|---|
| Power Consumption | 25% | 14% | 16% | 23% | -39% | 9% | 8% | |
| Idle Minimum * | 23 | 10.2 56% | 4 83% | 11 52% | 9 61% | 35 -52% | 15.6 ? 32% | 14 ? 39% |
| Idle Average * | 26 | 12.8 51% | 9 65% | 14 46% | 14 46% | 39 -50% | 20.1 ? 23% | 20.1 ? 23% |
| Idle Maximum * | 34 | 15 56% | 36 -6% | 34 -0% | 15 56% | 48 -41% | 29.4 ? 14% | 26.6 ? 22% |
| Load Average * | 99 | 130 -31% | 130 -31% | 95 4% | 107.2 -8% | 135 -36% | 110.8 ? -12% | 108 ? -9% |
| Witcher 3 ultra * | 163 | 137 16% | 174 -7% | 152 7% | 156 4% | 194 -19% | ||
| Load Maximum * | 190 | 184 3% | 227 -19% | 216 -14% | 235 -24% | 252 -33% | 214 ? -13% | 259 ? -36% |
* ... smaller is better
Energy consumption during The Witcher 3
Battery life
Like the predecessor, the Aero 15 OLED XD is equipped with a 99 Wh battery, offering the maximum battery capacity allowed to still be able to board an airplane. If you compare the rates of our standardized Wi-Fi test (web-browsing script, 150 cd/m² brightness), Gigabyte manages a decent 8:28 hours with its Tiger Lake processor, which is not what you would expect based on the power consumption rates. This is an unusually high rate, which is likely due to the aggressive energy management. Nevertheless, increasing brightness to the maximum level during this test reduces the runtime by more than half.
| Gigabyte Aero 15 OLED XD i7-11800H, GeForce RTX 3070 Laptop GPU, 99 Wh | Gigabyte Aero 15 OLED XC i7-10870H, GeForce RTX 3070 Laptop GPU, 99 Wh | Asus TUF Gaming A15 FA506QR-AZ061T R7 5800H, GeForce RTX 3070 Laptop GPU, 90 Wh | Asus ROG Strix G15 G513QR R9 5900HX, GeForce RTX 3070 Laptop GPU, 90 Wh | Asus ZenBook Pro Duo UX582 LR-1BH2 i7-10870H, GeForce RTX 3070 Laptop GPU, 92 Wh | Alienware m15 R4 i9-10980HK, GeForce RTX 3070 Laptop GPU, 86 Wh | Average of class Gaming | |
|---|---|---|---|---|---|---|---|
| Battery Runtime | -21% | 35% | -13% | -13% | -68% | -35% | |
| WiFi v1.3 | 508 | 399 -21% | 685 35% | 441 -13% | 441 -13% | 164 -68% | 390 ? -23% |
| Witcher 3 ultra | 131 | 69.5 ? -47% | |||||
| H.264 | 427 | 809 | 492 | 461 ? | |||
| Load | 202 | 145 | 100 | 76 | 52 | 87.2 ? | |
| Reader / Idle | 1043 | 220 | 577 ? |
Pros
Cons
Verdict
The manufacturer wanted to pack as much performance as possible into the tightest of spaces, and it managed to do so at the expense of high heat emissions. We were also positively impressed by the amount of ports that Gigabyte packed into the case, which is only a mere two centimeters thick. However, their positioning on the right side was a bit unfavorable. In our opinion, the power supply could have been easily moved to the back, so as not to hinder working with a mouse. The company has certainly developed a device for content creators that provides users with good performance and modern ports on a long-term basis.
Tiger Lake combined with the fast NVMe SSD, which is connected via PCI Express Gen 4, cuts an extremely fine figure. A full-fledged HDMI 2.1 port, Thunderbolt 4, and the option to add another SSD round off the package. The full-fledged SD card reader and the Ethernet port deliver high transfer rates as well. The Nvidia GeForce RTX 3070 offers a TDP of 105 watts and even brings 4K titles smoothly onto the screen, as long as you tweak the details a bit. Compared with the predecessor, battery life in our standardized Wi-Fi test now lasts nearly 2 hours more before the test device has to be plugged in again.
The first impression of the Gigabyte Aero 15 OLED XD is glorious. A simple, high-quality design combined with the fantastic, very bright OLED display including a Pantone X-Rite certification, as well as the sturdy aluminum chassis really stand out.
We found the mushy keyboard to be a negative aspect in our test; it could quickly lead to frustration when typing for a prolonged period of time. In addition, the already wobbly space bar squeaked when being lightly pressed in our test sample. Using the keyboard at night can turn into a cat-and-mouse game, since the keyboard's special characters aren't illuminated. Except for the somewhat small surface, we couldn't find any other weaknesses in the touchpad. Furthermore, the built-in keys convince with a perceptible and solid feedback. Unfortunately, users who require a webcam will be disappointed here. The webcam's positioning below the display doesn't make a good impression.
The sluggish fans are also a disadvantage, since they sometimes fail to provide the necessary airflow in time, leading to high temperature peaks developing quickly, which causes the CPU to throttle.
Instead of the 60 Hz 4K OLED display, gamers would probably have wished for one with 120 Hz, since high frame rates are slowly becoming the standard in the 4K sector. Thanks to the performance and the fantastic display, we can recommend the device to to designers or professional image editors. Nevertheless, gamers haven't been left out: The RTX 3070 with 105 watts consistently delivers a very good performance.
Price and availability
Gigabyte Aero 15 OLED XD
- 07/23/2021 v7 (old)
Patrick Schüdzig
More articles related to this device
Gigabyte Aero 15 OLED XD (Aero 15 Series)Related Articles

Price comparison
