Notebookcheck Logo

Intel Core i5-11600K vs Intel Core i5-8300H vs Intel Xeon E-2176M

Intel Core i5-11600K

► remove from comparison Intel i5-11600K

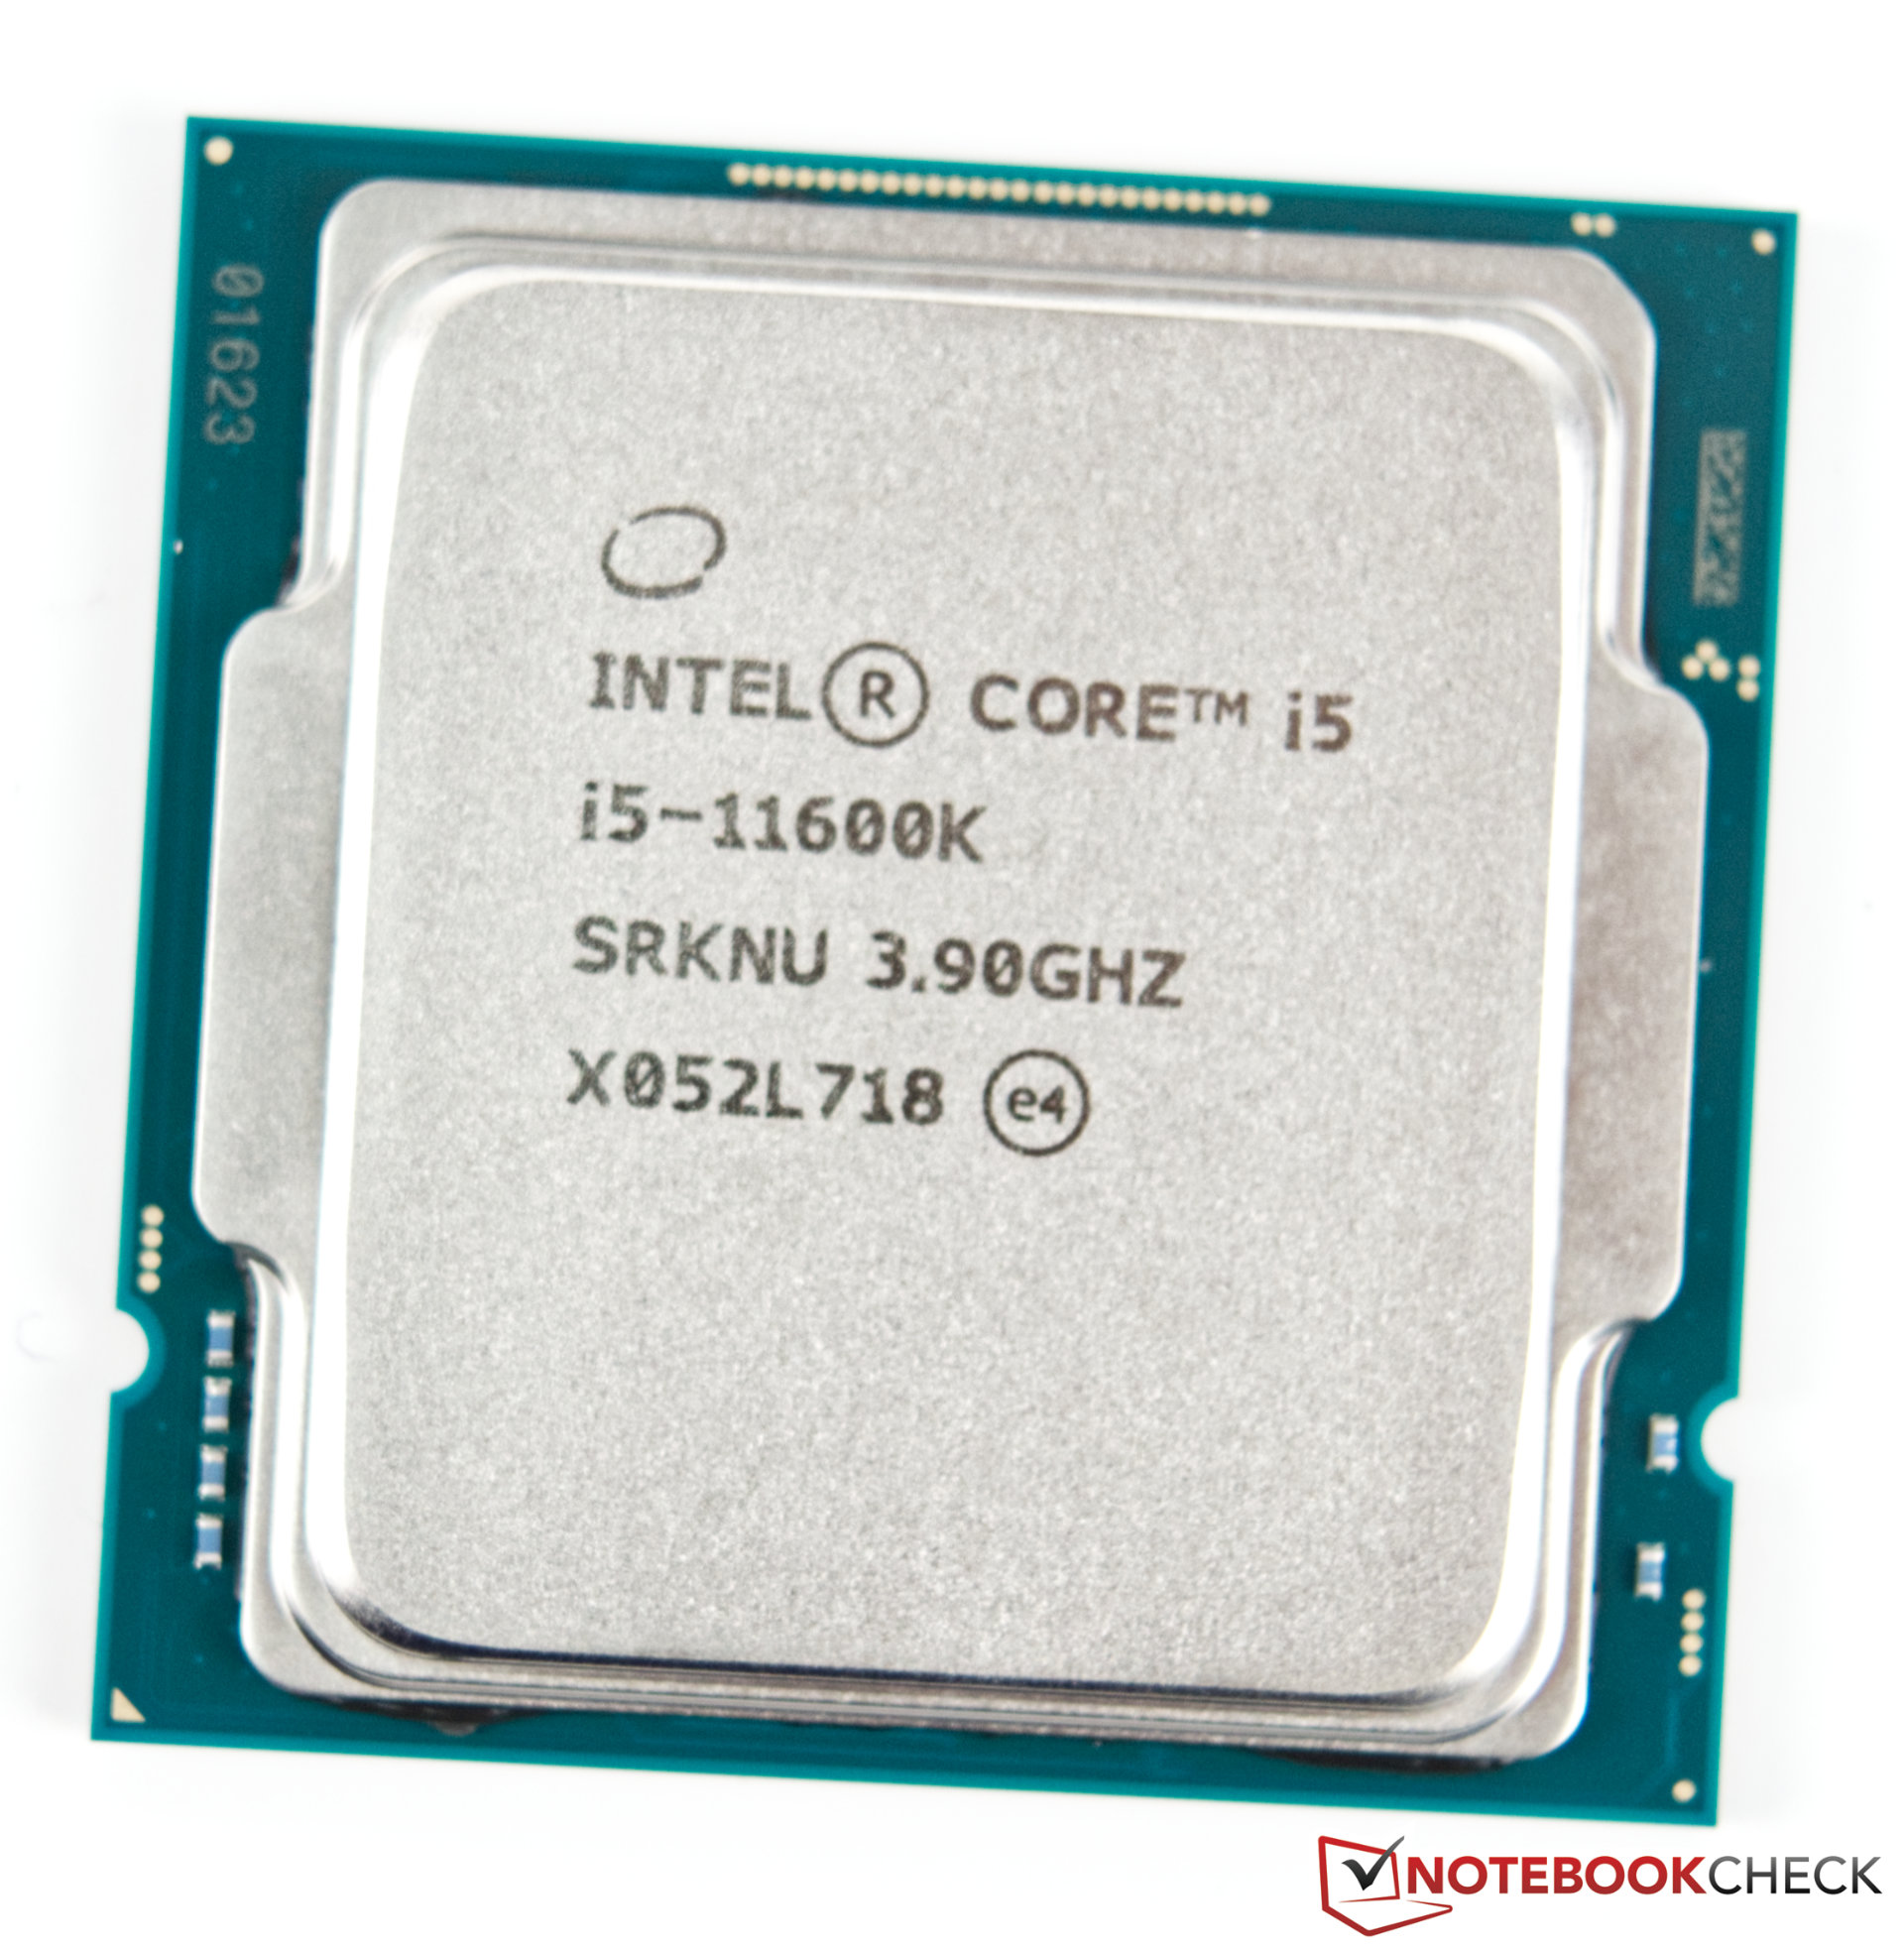
The Intel Core i5-11600K is a high-end desktop CPU based on the Rocket Lake architecture. The CPU offers 6 cores and 12 threads clocked at 3.9 - 4.9 GHz (Turbo Boost 2.0 only). Using all cores, the CPU can clock up to 4.6 GHz.  

The TDP is rated at 125 Watt (PL1, power limit sustained load) but the PL2 is set to around 250 Watt for short term boosts (up to 56 seconds). 

The Sunny Cove processor cores (known from the Ice Lake mobile CPUs) offer larger caches and an improved IPC (up to 19%). Furthermore, the chip also includes (partly) integrated WiFi 6E and Thunderbolt 4. The platform supports PCIe 4.0 and Intel DL Boost for AI acceleration.

Thanks to the faster core architecture, the 11600K can beat the old i5-10600K by around 20 percent. Therefore, the i5-11600K is a good mid range choice for gaming.

The faster Rocket Lake-S CPUs also integrate a new Intel UHD Graphics 750 that is based on the current Intel Xe architecture (e.g. mobile Tiger Lake) and offers 32 EUs. In the 11600K, the GPU is clocked from 350 - 1300 MHz.

The CPU is manufactured on the old 14nm process like the Comet Lake predecessors. The power consumption is not as high, as the Core i9-11900K, but can't come close to the power efficient Ryzen 5 5600X.

Intel Core i5-8300H

► remove from comparison Intel i5-8300H

The Intel Core i5-8300H is a fast processor for laptops with four cores based on the Coffee Lake architecture and was announced early 2018. The processor clocks at between 2.3 and 4 GHz (3.9 with 4 cores) and can execute up to eight threads simultaneously thanks to Hyper-Threading. According to Intel, the CPU is manufactured in an improved 14nm (14nm++) process.

The Coffee Lake architecture is similar to Kaby Lake and differs only in the amount of cores (now six cores for the high end versions) and the improved 14nm process (14nm++ according to Intel).

Performance

The Intel Core i5-8300H should perform similar as the older Core i7-7820HQ (2.9 - 4 GHz). The faster Coffee Lake CPUs, like the Core i7-8750H offers two additional cores and is therefore up to 50% faster in multithreaded benchmarks. Still, the performance of the i5-8300H should be sufficient for even demanding applications and games.

Graphics

The integrated Intel UHD Graphics 630 iGPU is supposed to offer a slightly higher performance as its clock rate has been increased by 50 MHz (rumored). The architecture is identical to that of the Intel HD Graphics 630. We do expect a performance improvement, but as a low-end solution it will probably only display current games smoothly at reduced details - if at all.

Power Consumption

Intel specifies the TDP with 45 watts and therefore the i5 is only suited for big laptops with good cooling solutions. Using cTDP-down, the CPU can also be configured to 35 Watt resulting in a reduced performance.

Intel Xeon E-2176M

► remove from comparison Intel E-2176M

The Intel Xeon E-2176M is a high-end processor for professional laptops with six cores based on the Coffee Lake architecture. The processor clocks at between 2.7 - 4.4 GHz (4.1 GHz with 6 cores) and can execute up to twelve threads simultaneously thanks to Hyper-Threading. 

According to Intel, the CPU is manufactured in an improved 14nm (14nm++) process. The Xeon E-2176M is the second fastest model after the Xeon E-2178M / Core i9-8950HK in early 2018. Compared to the similar consumer Core i7-8850H, the mobile Xeon offers support for ECC main memory, is slightly higher clocked and offers more L3 cache.

The Coffee Lake architecture is similar to Kaby Lake and differs only in the amount of cores (now six cores for the high end versions) and the improved 14nm process (14nm++ according to Intel).

Performance

Due to the two additional cores, performance has increased by almost 50% compared to a similar clocked Kaby Lake processor.

Graphics

The integrated Intel UHD Graphics 630 iGPU is unchanged to the older Intel HD Graphics 630 an maybe only slightly higher clocked. We do expect a performance improvement, but as a low-end solution it will probably only display current games smoothly at reduced details - if at all.

Power Consumption

Intel specifies the TDP with 45 watts and therefore the i9 is only suited for big laptops with good cooling solutions.

ModelIntel Core i5-11600KIntel Core i5-8300HIntel Xeon E-2176M
CodenameRocket LakeCoffee Lake-HCoffee Lake-H
SeriesIntel Rocket LakeIntel Coffee LakeIntel Coffee Lake
Series: Coffee Lake Coffee Lake-H
Intel Core i9-11900K3.5 - 5.3 GHz8 / 16 cores16 MB L3
Intel Core i7-11700K3.6 - 5 GHz8 / 16 cores16 MB L3
Intel Core i7-117002.5 - 4.9 GHz8 / 16 cores16 MB L3
Intel Core i5-11600K « 3.9 - 4.9 GHz6 / 12 cores12 MB L3
Intel Core i5-11400F2.6 - 4.4 GHz6 / 12 cores12 MB L3
Intel Core i5-11400T1.3 - 3.7 GHz6 / 12 cores12 MB L3
Intel Core i9-9980HK2.4 - 5 GHz8 / 16 cores16 MB L3
Intel Core i9-9880H2.3 - 4.8 GHz8 / 16 cores16 MB L3
Intel Core i9-8950HK2.9 - 4.8 GHz6 / 12 cores12 MB L3
Intel Xeon E-2186M2.9 - 4.8 GHz6 / 12 cores12 MB L3
Intel Xeon E-2276M2.8 - 4.7 GHz6 / 12 cores12 MB L3
Intel Core i7-9850H2.6 - 4.6 GHz6 / 12 cores12 MB L3
Intel Core i7-9750H2.6 - 4.5 GHz6 / 12 cores12 MB L3
Intel Xeon E-2176M2.7 - 4.4 GHz6 / 12 cores12 MB L3
Intel Core i7-8850H2.6 - 4.3 GHz6 / 12 cores9 MB L3
Intel Core i7-8750H2.2 - 4.1 GHz6 / 12 cores9 MB L3
Intel Core i5-9400H2.5 - 4.3 GHz4 / 8 cores8 MB L3
Intel Core i5-9300HF2.4 - 4.1 GHz4 / 8 cores8 MB L3
Intel Core i5-9300H2.4 - 4.1 GHz4 / 8 cores8 MB L3
Intel Core i5-8400H2.5 - 4.2 GHz4 / 8 cores8 MB L3
Intel Core i5-8300H « 2.3 - 4 GHz4 / 8 cores8 MB L3
Intel Core i3-8100H3 GHz4 / 4 cores8 MB L3
Intel Core i9-9980HK2.4 - 5 GHz8 / 16 cores16 MB L3
Intel Core i9-9880H2.3 - 4.8 GHz8 / 16 cores16 MB L3
Intel Core i9-8950HK2.9 - 4.8 GHz6 / 12 cores12 MB L3
Intel Xeon E-2186M2.9 - 4.8 GHz6 / 12 cores12 MB L3
Intel Xeon E-2276M2.8 - 4.7 GHz6 / 12 cores12 MB L3
Intel Core i7-9850H2.6 - 4.6 GHz6 / 12 cores12 MB L3
Intel Core i7-9750H2.6 - 4.5 GHz6 / 12 cores12 MB L3
Intel Xeon E-2176M « 2.7 - 4.4 GHz6 / 12 cores12 MB L3
Intel Core i7-8850H2.6 - 4.3 GHz6 / 12 cores9 MB L3
Intel Core i7-8750H2.2 - 4.1 GHz6 / 12 cores9 MB L3
Intel Core i5-9400H2.5 - 4.3 GHz4 / 8 cores8 MB L3
Intel Core i5-9300HF2.4 - 4.1 GHz4 / 8 cores8 MB L3
Intel Core i5-9300H2.4 - 4.1 GHz4 / 8 cores8 MB L3
Intel Core i5-8400H2.5 - 4.2 GHz4 / 8 cores8 MB L3
Intel Core i5-8300H2.3 - 4 GHz4 / 8 cores8 MB L3
Intel Core i3-8100H3 GHz4 / 4 cores8 MB L3
Clock3900 - 4900 MHz2300 - 4000 MHz2700 - 4400 MHz
L1 Cache480 KB256 KB384 KB
L2 Cache3 MB1 MB1.5 MB
L3 Cache12 MB8 MB12 MB
Cores / Threads6 / 124 / 86 / 12
TDP125 Watt45 Watt45 Watt
Technology14 nm14 nm14 nm
max. Temp.100 °C100 °C100 °C
SocketLGA1200FCBGA1440
FeaturesDDR4-3200 RAM, PCIe 4, 8 GT/s bus, DL Boost, GNA, vPro, MMX, SSE, SSE2, SSE3, SSSE3, SSE4.1, SSE4.2, AVX, AVX2, AVX-512, BMI2, ABM, FMA, ADX, VMX, SMEP, SMAP, MPX, EIST, TM1, TM2, HT, Turbo, SST, AES-NI, RDRAND, RDSEED, SHADual-Channel DDR4 Memory Controller, HyperThreading, AVX, AVX2, Quick Sync, Virtualization, AES-NIDual-Channel DDR4 Memory Controller, HyperThreading, AVX, AVX2, Quick Sync, Virtualization, AES-NI
iGPUIntel UHD Graphics Xe 750 32EUs (Rocket Lake) (350 - 1300 MHz)Intel UHD Graphics 630 (350 - 1000 MHz)Intel UHD Graphics 630 (350 MHz)
Architecturex86x86x86
Announced
Manufacturerark.intel.comark.intel.com
$250 U.S.

Benchmarks

Performance Rating - CB R15 + R20 + 7-Zip + X265 + Blender + 3DM11 CPU - i5-11600K
35.9 pt (60%)
Restrict / Search: Model: Max. age: years
Cinebench R23 - Cinebench R23 Multi Core
min: 11124     avg: 11218     median: 11217.5 (10%)     max: 11311 Points
Cinebench R23 - Cinebench R23 Single Core
min: 1500     avg: 1530     median: 1529.5 (64%)     max: 1559 Points
Cinebench R20 - Cinebench R20 CPU (Single Core)
min: 576     avg: 586     median: 585.5 (64%)     max: 595 Points
Cinebench R20 - Cinebench R20 CPU (Multi Core)
min: 4254     avg: 4302     median: 4301.5 (10%)     max: 4349 Points
Cinebench R15 - Cinebench R15 CPU Multi 64 Bit
min: 1738     avg: 1744     median: 1744 (11%)     max: 1750 Points
min: 609     avg: 793     median: 812 (5%)     max: 850 Points
min: 987     avg: 1067     median: 1095 (7%)     max: 1118 Points
Cinebench R15 - Cinebench R15 CPU Single 64 Bit
min: 234     avg: 238     median: 238 (66%)     max: 242 Points
min: 151     avg: 168.6     median: 170 (47%)     max: 174 Points
min: 169     avg: 181.7     median: 187 (52%)     max: 189 Points
Cinebench R11.5 - Cinebench R11.5 CPU Multi 64 Bit
19.3 Points (25%)
min: 6.2     avg: 7.9     median: 7.8 (10%)     max: 8.79 Points
min: 9.32     avg: 11.3     median: 12.3 (16%)     max: 12.4 Points
Cinebench R11.5 - Cinebench R11.5 CPU Single 64 Bit
2.9 Points (68%)
min: 1.72     avg: 1.9     median: 1.9 (45%)     max: 1.96 Points
min: 1.99     avg: 2.1     median: 2 (48%)     max: 2.12 Points
Cinebench R10 - Cinebench R10 Rend. Single (32bit)
9745 Points (59%)
min: 6115     avg: 6392     median: 6463.5 (39%)     max: 6524 Points
min: 6928     avg: 7681     median: 6973 (42%)     max: 9142 Points
Cinebench R10 - Cinebench R10 Rend. Multi (32bit)
49408 Points (36%)
min: 20061     avg: 22328     median: 22266.5 (16%)     max: 24718 Points
min: 31923     avg: 35912     median: 32132 (23%)     max: 43681 Points
Cinebench R10 - Cinebench R10 Rend. Multi (64bit)
64663 Points (41%)
min: 28616     avg: 30319     median: 30318.5 (19%)     max: 32021 Points
Cinebench R10 - Cinebench R10 Rend. Single (64bit)
12957 Points (16%)
min: 8277     avg: 8392     median: 8391.5 (10%)     max: 8506 Points
wPrime 2.10 - wPrime 2.0 1024m *
107.6 s (1%)
min: 205.9     avg: 255.6     median: 265.3 (3%)     max: 285.8 s
min: 147     avg: 163.3     median: 163.3 (2%)     max: 179.6 s
wPrime 2.10 - wPrime 2.0 32m *
4.9 s (1%)
min: 6.42     avg: 7.9     median: 7.7 (2%)     max: 9.762 s
min: 4.909     avg: 5.3     median: 5.3 (1%)     max: 5.77 s
WinRAR - WinRAR 4.0
7850 Points (12%)
min: 3947     avg: 4625     median: 4624.5 (7%)     max: 5302 Points
7-Zip 18.03 - 7-Zip 18.03 Multi Thread 4 runs
min: 44620     avg: 44971     median: 44971 (26%)     max: 45322 MIPS
7-Zip 18.03 - 7-Zip 18.03 Single Thread 4 runs
min: 5987     avg: 6062     median: 6061.5 (71%)     max: 6136 MIPS
X264 HD Benchmark 4.0 - x264 Pass 2
min: 100.5     avg: 100.8     median: 100.8 (3%)     max: 101 fps
min: 39     avg: 43.7     median: 40.2 (1%)     max: 52 fps
min: 58.2     avg: 63.1     median: 63.1 (2%)     max: 67.9 fps
X264 HD Benchmark 4.0 - x264 Pass 1
min: 279     avg: 289     median: 289 (7%)     max: 299 fps
min: 163.2     avg: 173.4     median: 169 (4%)     max: 188 fps
min: 195.8     avg: 203.6     median: 203.6 (5%)     max: 211.3 fps
HWBOT x265 Benchmark v2.2 - HWBOT x265 4k Preset
min: 14     avg: 14.4     median: 14.4 (25%)     max: 14.7 fps
8.7 fps (15%)
TrueCrypt - TrueCrypt Serpent
0.9 GB/s (26%)
0.4 GB/s (11%)
min: 0.601     avg: 0.7     median: 0.7 (20%)     max: 0.756 GB/s
TrueCrypt - TrueCrypt Twofish
1.5 GB/s (26%)
0.6 GB/s (10%)
min: 1     avg: 1.1     median: 1.1 (19%)     max: 1.2 GB/s
TrueCrypt - TrueCrypt AES
9.7 GB/s (25%)
3.9 GB/s (10%)
min: 6.1     avg: 6.9     median: 6.9 (18%)     max: 7.6 GB/s
Blender - Blender 2.79 BMW27 CPU *
min: 264.5     avg: 267.3     median: 267.3 (2%)     max: 270 Seconds
min: 465.8     avg: 510     median: 509.9 (4%)     max: 554 Seconds
R Benchmark 2.5 - R Benchmark 2.5 *
min: 0.506     avg: 0.5     median: 0.5 (11%)     max: 0.528 sec
3DMark 06 - CPU - 3DMark 06 - CPU
14519 Points (31%)
min: 7203     avg: 9007     median: 9757 (21%)     max: 10061 Points
Super Pi mod 1.5 XS 1M - Super Pi mod 1.5 XS 1M *
6.8 s (1%)
min: 9.264     avg: 9.4     median: 9.4 (2%)     max: 9.8 s
min: 8.508     avg: 8.6     median: 8.6 (2%)     max: 8.69 s
Super Pi mod 1.5 XS 2M - Super Pi mod 1.5 XS 2M *
14.8 s (1%)
min: 20.9     avg: 21.2     median: 21.1 (1%)     max: 21.74 s
min: 18.78     avg: 19     median: 19 (1%)     max: 19.26 s
Super Pi Mod 1.5 XS 32M - Super Pi mod 1.5 XS 32M *
353.7 s (2%)
min: 546     avg: 551     median: 548.5 (2%)     max: 559 s
min: 475.2     avg: 477     median: 477 (2%)     max: 478.8 s
3DMark Vantage - 3DM Vant. Perf. CPU no Physx
100%
1 E-2176M +
min: 38520     avg: 39431     median: 39431 (30%)     max: 40342 Points
3DMark 11 - 3DM11 Performance Physics
min: 15381     avg: 16381     median: 16381 (40%)     max: 17381 Points
min: 6234     avg: 8139     median: 8154 (20%)     max: 9415 Points
min: 10234     avg: 11628     median: 11727 (29%)     max: 12923 Points
3DMark - 3DMark Ice Storm Physics
min: 70567     avg: 75640     median: 75640 (61%)     max: 80713 Points
min: 48575     avg: 52494     median: 53016 (43%)     max: 56026 Points
min: 30521     avg: 44313     median: 44313 (36%)     max: 58105 Points
3DMark - 3DMark Ice Storm Extreme Physics
79747 Points (65%)
min: 48063     avg: 51178     median: 51009 (41%)     max: 55273 Points
min: 30553     avg: 43412     median: 43412 (35%)     max: 56271 Points
3DMark - 3DMark Ice Storm Unlimited Physics
81270 Points (65%)
min: 45639     avg: 53927     median: 56262.5 (45%)     max: 57543 Points
min: 59124     avg: 59647     median: 59646.5 (48%)     max: 60169 Points
3DMark - 3DMark Cloud Gate Physics
min: 14147     avg: 14403     median: 14402.5 (36%)     max: 14658 Points
min: 6260     avg: 7613     median: 7857 (20%)     max: 8471 Points
min: 5617     avg: 8399     median: 9331 (24%)     max: 10250 Points
3DMark - 3DMark Fire Strike Standard Physics
min: 21677     avg: 22154     median: 22154 (39%)     max: 22631 Points
min: 9136     avg: 10979     median: 11196 (20%)     max: 11971 Points
min: 11097     avg: 13737     median: 14418 (26%)     max: 15696 Points
3DMark - 3DMark Time Spy CPU
min: 8286     avg: 8884     median: 8884 (37%)     max: 9482 Points
min: 3270     avg: 3571     median: 3571 (15%)     max: 3872 Points
min: 3916     avg: 4729     median: 4728.5 (20%)     max: 5541 Points
Geekbench 6.5 - Geekbench 6.5 Single-Core
2284 Points (55%)
Geekbench 6.5 - Geekbench 6.5 Multi-Core
9480 Points (37%)
Geekbench 5.5 - Geekbench 5.1 - 5.5 64 Bit Single-Core
min: 1694     avg: 1723     median: 1723 (65%)     max: 1752 Points
990 Points (38%)
Geekbench 5.5 - Geekbench 5.1 - 5.5 64 Bit Multi-Core
min: 8336     avg: 8430     median: 8429.5 (15%)     max: 8523 Points
3270 Points (6%)
Geekbench 5.0 - Geekbench 5.0 64 Bit Single-Core
1731 Points (8%)
Geekbench 5.0 - Geekbench 5.0 64 Bit Multi-Core
8542 Points (27%)
Geekbench 4.4 - Geekbench 4.1 - 4.4 64 Bit Single-Core
7438 Points (74%)
4770 Points (48%)
min: 4077     avg: 4660     median: 4660 (47%)     max: 5243 Points
Geekbench 4.4 - Geekbench 4.1 - 4.4 64 Bit Multi-Core
33266 Points (33%)
14790 Points (14%)
min: 19388     avg: 20690     median: 20689.5 (20%)     max: 21991 Points
Geekbench 3 - Geekbench 3 32 Bit Multi-Core
15050 Points (27%)
Geekbench 3 - Geekbench 3 32 Bit Single-Core
3740 Points (49%)
Mozilla Kraken 1.1 - Kraken 1.1 Total Score *
min: 587     avg: 598     median: 597.5 (1%)     max: 608 ms
min: 1095     avg: 1146     median: 1133 (1%)     max: 1209 ms
min: 1048     avg: 1054     median: 1054 (1%)     max: 1060 ms
Sunspider - Sunspider 1.0 Total Score *
88.5 ms (1%)
116%
1 E-2176M +
76.2 ms (1%)
Octane V2 - Octane V2 Total Score
min: 30806     avg: 32869     median: 33251 (24%)     max: 34659 Points
109%
1 E-2176M +
min: 35521     avg: 36102     median: 36101.5 (26%)     max: 36682 Points
WebXPRT 3 - WebXPRT 3 Score
min: 263     avg: 271.5     median: 271.5 (49%)     max: 280 Points
CrossMark - CrossMark Overall
1652 Points (62%)
Power Consumption - Prime95 Power Consumption - external Monitor *
min: 187     avg: 204.7     median: 199 (34%)     max: 228 Watt
Power Consumption - Cinebench R15 Multi Power Consumption - external Monitor *
min: 177     avg: 195.3     median: 189 (34%)     max: 219.9 Watt
213%
1 E-2176M +
88.9 Watt (16%)
Power Consumption - Power Efficiency - Cinebench R15 Multi external Monitor
min: 7.9     avg: 8.9     median: 8.9 (7%)     max: 9.89 Points per Watt
142%
1 E-2176M +
12.6 Points per Watt (9%)

Average Benchmarks Intel Core i5-11600K → 100% n=26

Average Benchmarks Intel Core i5-8300H → 55% n=26

Average Benchmarks Intel Xeon E-2176M → 68% n=26

- Range of benchmark values for this graphics card
red legend - Average benchmark values for this graphics card
* Smaller numbers mean a higher performance
1 This benchmark is not used for the average calculation

v1.34
log 18. 07:03:47

#0 ran 0s before starting gpusingle class +0s ... 0s

#1 checking url part for id 13163 +0s ... 0s

#2 checking url part for id 9570 +0s ... 0s

#3 checking url part for id 9904 +0s ... 0s

#4 redirected to Ajax server, took 1760763827s time from redirect:0 +0s ... 0s

#5 did not recreate cache, as it is less than 5 days old! Created at Thu, 16 Oct 2025 05:21:56 +0200 +0s ... 0s

#6 composed specs +0.007s ... 0.008s

#7 did output specs +0s ... 0.008s

#8 getting avg benchmarks for device 13163 +0.004s ... 0.012s

#9 got single benchmarks 13163 +0.006s ... 0.017s

#10 getting avg benchmarks for device 9570 +0.001s ... 0.018s

#11 got single benchmarks 9570 +0.024s ... 0.042s

#12 getting avg benchmarks for device 9904 +0.001s ... 0.043s

#13 got single benchmarks 9904 +0.006s ... 0.049s

#14 got avg benchmarks for devices +0s ... 0.049s

#15 min, max, avg, median took s +0.049s ... 0.098s

#16 return log +0s ... 0.098s

Please share our article, every link counts!
Mail Logo
> Expert Reviews and News on Laptops, Smartphones and Tech Innovations > Benchmarks / Tech > Processor Comparison - Head 2 Head
Redaktion, 2017-09- 8 (Update: 2023-07- 1)