Notebookcheck Logo

AMD Ryzen 7 2700X vs AMD Ryzen 3 3200U

AMD Ryzen 7 2700X

► remove from comparison AMD R7 2700X

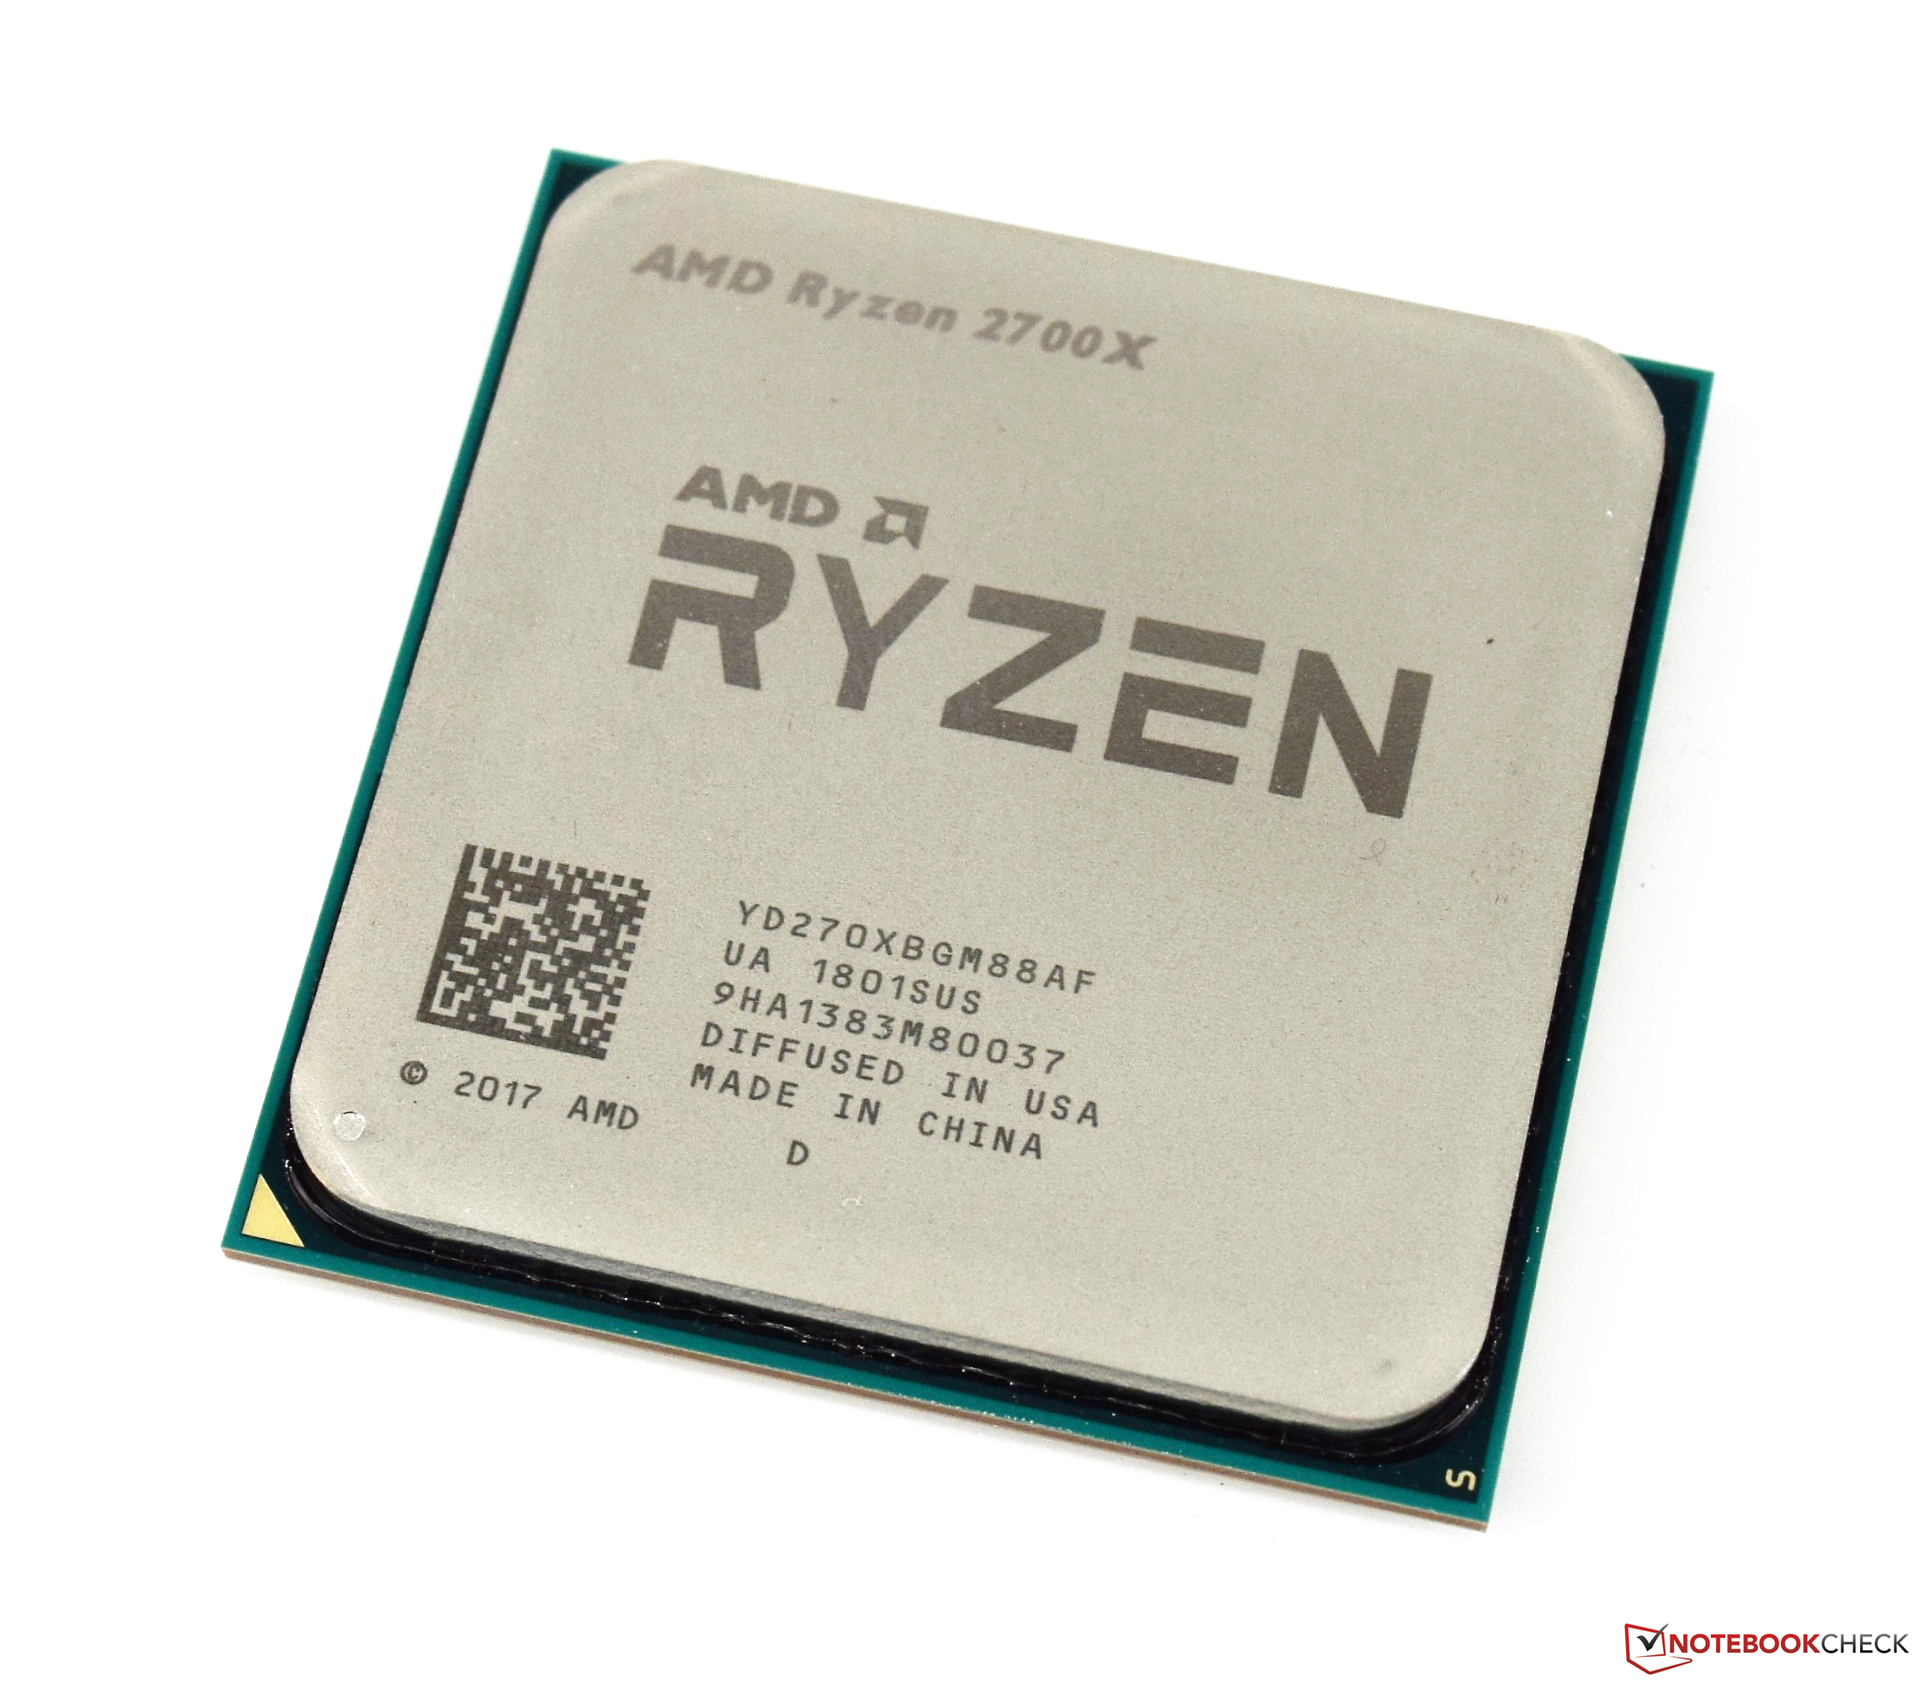
The AMD Ryzen 7 2700X is a high-end desktop processor with 8 cores (16 threads) that was announced early 2018. It is based on the revised Zen+ cores and at launch the fastest Ryzen CPU. The CPU cores clock at 3.7 GHz base and using Precision Boost 2 up to 4.3 GHz. All 8 cores and 16 threads can clock up to 4 GHz. The 8 cores are divided in two cluster (4 cores each with own L3 cache) connected via Infinity Fabric.

Compared to the older first Ryzen generation (e.g., Ryzen 5 1700X), the second generation is manufactured in an improved process (12nm called), offers and improved Precision Boost 2 (especially in partial load of the cores) and faster cache and memory speeds.

See our second generation Ryzen review for detailed benchmarks and information.

AMD Ryzen 3 3200U

► remove from comparison AMD R3 3200U

The AMD Ryzen 3 3200U is a dual-core SoC designed for laptops that was announced in January 2019. The Ryzen features two Zen cores with support for the thread-doubling SMT tech, clocked at 2.6 GHz - 3.5 GHz. The built-in Radeon RX Vega 3 iGPU has 3 CUs (192 unified shaders) clocked at up to 1,200 MHz. The default TDP is 15 W which makes the Ryzen a good fit for thin mid-range laptops.

In comparison to the faster Ryzen 3000 CPUs, the 3200U is not using the newer Zen+ microarchitecture and is still manufactured in 14nm. Compared to the old Ryzen 3 2200U, the 3200U therefore only offers a 100 MHz higher clock speed.

The Ryzen 3 is compatible with single-channel or dual-channel DDR4-2400 RAM.

Please go to our Raven Ridge launch article for details on the architecture and more.

Performance

The average 3200U in our extensive database is anything but a performance monster, its multi-thread benchmark scores only just matching those of the Core i3-8130U and the Pentium N6000. While not as atrociously slow as most N-series and J-series Intel chips, this specific Ryzen is good enough for basic day-to-day activities only.

Your mileage may vary depending on how high the CPU power limits are and how competent the cooling solution of your system is.

Power consumption

This Ryzen 3 series chip has a default TDP, also known as the long-term power limit, of 15 W. Laptop makers are free to change that to anything between 12 W and 25 W; most will go for a higher value to extract more performance out of it. Either way, an active cooling solution will be needed to dissipate the heat.

The R3 3200U is built with a 14 nm manufacturing process for low, as of early 2023, energy efficiency.

ModelAMD Ryzen 7 2700XAMD Ryzen 3 3200U
SeriesAMD Ryzen 7AMD Picasso (Ryzen 3000 APU)
CodenameZen+Picasso-U (Zen)
Series: Ryzen 7 Zen+
AMD Ryzen 7 2700X « 3.7 - 4.3 GHz8 / 16 cores16 MB L3
AMD Ryzen 7 2700 compare3.2 - 4.1 GHz8 / 16 cores16 MB L3
Clock3700 - 4300 MHz2600 - 3500 MHz
L2 Cache4 MB1 MB
L3 Cache16 MB4 MB
Cores / Threads8 / 162 / 4
TDP105 Watt15 Watt
Transistors4940 Million4500 Million
Technology12 nm14 nm
Die Size213 mm2
SocketAM4 (1331)FP5
FeaturesSSE4.2, SSE4A, AMD-V, AES, AVX2, FMA3, SHADDR4-2400 RAM, PCIe 3, MMX, SSE, SSE2, SSE3, SSSE3, SSE4A, SSE4.1, SSE4.2, AVX, AVX2, BMI2, ABM, FMA, ADX, SMEP, SMAP, SMT, CPB, AES-NI, RDRAND, RDSEED, SHA, SME
Architecturex86x86
$329 U.S.
Announced
L1 Cache192 KB
max. Temp.105 °C
iGPUAMD Radeon RX Vega 3 ( - 1200 MHz)
Manufacturerwww.amd.com

Benchmarks

Performance Rating - CB R15 + R20 + 7-Zip + X265 + Blender + 3DM11 CPU - R3 3200U
23.5 pt (33%)
Cinebench R23 - Cinebench R23 Multi Core
min: 1767     avg: 1786     median: 1786 (2%)     max: 1804 Points
Cinebench R23 - Cinebench R23 Single Core
min: 208     avg: 584     median: 765 (33%)     max: 780 Points
Cinebench R20 - Cinebench R20 CPU (Single Core)
430 Points (48%)
min: 274     avg: 298.2     median: 301 (33%)     max: 318 Points
Cinebench R20 - Cinebench R20 CPU (Multi Core)
3944 Points (10%)
min: 453     avg: 607     median: 690 (2%)     max: 727 Points
Cinebench R15 - Cinebench R15 CPU Multi 64 Bit
min: 1740     avg: 1768     median: 1762 (11%)     max: 1801 Points
min: 318     avg: 335     median: 334 (2%)     max: 353 Points
Cinebench R15 - Cinebench R15 CPU Single 64 Bit
min: 175.5     avg: 175.7     median: 175.7 (53%)     max: 176 Points
min: 126     avg: 128.3     median: 129 (39%)     max: 130 Points
Cinebench R11.5 - Cinebench R11.5 CPU Multi 64 Bit
18.7 Points (24%)
Cinebench R11.5 - Cinebench R11.5 CPU Single 64 Bit
2 Points (49%)
Cinebench R10 - Cinebench R10 Rend. Single (32bit)
5256 Points (32%)
4258 Points (26%)
Cinebench R10 - Cinebench R10 Rend. Multi (32bit)
34763 Points (25%)
9284 Points (7%)
Cinebench R10 - Cinebench R10 Rend. Multi (64bit)
57811 Points (40%)
Cinebench R10 - Cinebench R10 Rend. Single (64bit)
8673 Points (11%)
wPrime 2.10 - wPrime 2.0 1024m *
96.6 s (1%)
483.5 s (6%)
wPrime 2.10 - wPrime 2.0 32m *
3.5 s (1%)
14 s (3%)
WinRAR - WinRAR 4.0
4779 Points (8%)
1613 Points (3%)
7-Zip 18.03 - 7-Zip 18.03 Multli Thread 4 runs
45814 MIPS (26%)
min: 8785     avg: 9083     median: 9081.5 (5%)     max: 9382 MIPS
7-Zip 18.03 - 7-Zip 18.03 Single Thread 4 runs
4647 MIPS (56%)
min: 3333     avg: 3371     median: 3372 (40%)     max: 3406 MIPS
X264 HD Benchmark 4.0 - x264 Pass 2
104.5 fps (36%)
19.5 fps (7%)
X264 HD Benchmark 4.0 - x264 Pass 1
226.7 fps (52%)
97.8 fps (23%)
HWBOT x265 Benchmark v2.2 - HWBOT x265 4k Preset
min: 1.864     avg: 2     median: 2 (3%)     max: 2.03 fps
TrueCrypt - TrueCrypt Serpent
1 GB/s (0%)
0.2 GB/s (0%)
TrueCrypt - TrueCrypt Twofish
1.6 GB/s (28%)
0.4 GB/s (6%)
TrueCrypt - TrueCrypt AES
10.6 GB/s (28%)
2.2 GB/s (6%)
Blender - Blender 2.79 BMW27 CPU *
min: 264     avg: 266.8     median: 266.8 (2%)     max: 269.6 Seconds
min: 1439     avg: 1484     median: 1485 (10%)     max: 1528 Seconds
R Benchmark 2.5 - R Benchmark 2.5 *
0.6 sec (13%)
min: 0.846     avg: 0.8     median: 0.8 (18%)     max: 0.852 sec
3DMark 06 - CPU - 3DMark 06 - CPU
min: 10429     avg: 10651     median: 10643 (23%)     max: 10823 Points
3755 Points (8%)
Super Pi mod 1.5 XS 1M - Super Pi mod 1.5 XS 1M *
10.8 s (2%)
12.5 s (3%)
Super Pi mod 1.5 XS 2M - Super Pi mod 1.5 XS 2M *
23.2 s (1%)
29 s (1%)
Super Pi Mod 1.5 XS 32M - Super Pi mod 1.5 XS 32M *
578 s (3%)
730 s (3%)
3DMark Vantage - 3DM Vant. Perf. CPU no Physx
min: 55102     avg: 57950     median: 58836.5 (52%)     max: 59792 Points
3DMark 11 - 3DM11 Performance Physics
min: 12874     avg: 14926     median: 15098 (41%)     max: 15552 Points
min: 3653     avg: 3758     median: 3772 (10%)     max: 3835 Points
3DMark - 3DMark Ice Storm Physics
min: 71788     avg: 75803     median: 76251 (62%)     max: 77677 Points
min: 40774     avg: 42358     median: 41370 (34%)     max: 45919 Points
3DMark - 3DMark Ice Storm Extreme Physics
min: 73539     avg: 76030     median: 76288 (62%)     max: 77262 Points
min: 39108     avg: 41332     median: 41308 (34%)     max: 43602 Points
3DMark - 3DMark Ice Storm Unlimited Physics
min: 74344     avg: 76804     median: 76312 (64%)     max: 79006 Points
min: 44389     avg: 48213     median: 48111 (41%)     max: 52242 Points
3DMark - 3DMark Cloud Gate Physics
min: 13090     avg: 14891     median: 15060.5 (38%)     max: 15851 Points
min: 3321     avg: 3335     median: 3329 (8%)     max: 3362 Points
3DMark - 3DMark Fire Strike Standard Physics
min: 20189     avg: 21001     median: 20923.5 (37%)     max: 21975 Points
min: 4743     avg: 4930     median: 4867 (9%)     max: 5241 Points
3DMark - 3DMark Time Spy CPU
min: 8241     avg: 8676     median: 8747 (37%)     max: 8954 Points
min: 1509     avg: 1536     median: 1541 (6%)     max: 1553 Points
Geekbench 5.5 - Geekbench 5.1 - 5.4 64 Bit Single-Core
min: 1131     avg: 1177     median: 1177 (50%)     max: 1223 Points
min: 770     avg: 803     median: 796.5 (34%)     max: 847 Points
Geekbench 5.5 - Geekbench 5.1 - 5.4 64 Bit Multi-Core
min: 6372     avg: 7022     median: 7021.5 (13%)     max: 7671 Points
min: 1604     avg: 1661     median: 1651.5 (3%)     max: 1736 Points
Geekbench 5.0 - Geekbench 5.0 64 Bit Single-Core
1126 Points (5%)
min: 823     avg: 827     median: 826.5 (4%)     max: 830 Points
Geekbench 5.0 - Geekbench 5.0 64 Bit Multi-Core
7878 Points (25%)
min: 1529     avg: 1649     median: 1649 (5%)     max: 1769 Points
Geekbench 4.4 - Geekbench 4.1 - 4.4 64 Bit Single-Core
min: 4999     avg: 5050     median: 5049.5 (50%)     max: 5100 Points
min: 3366     avg: 3562     median: 3562 (36%)     max: 3758 Points
Geekbench 4.4 - Geekbench 4.1 - 4.4 64 Bit Multi-Core
min: 25919     avg: 27790     median: 27789.5 (31%)     max: 29660 Points
min: 6553     avg: 7143     median: 7143 (8%)     max: 7733 Points
Geekbench 4.0 - Geekbench 4.0 64 Bit Single-Core
3626 Points (49%)
Geekbench 4.0 - Geekbench 4.0 64 Bit Multi-Core
7237 Points (18%)
Geekbench 3 - Geekbench 3 32 Bit Multi-Core
6922 Points (12%)
Geekbench 3 - Geekbench 3 32 Bit Single-Core
3282 Points (64%)
Geekbench 3 - Geekbench 3 64 Bit Multi-Core
7496 Points (12%)
Geekbench 3 - Geekbench 3 64 Bit Single-Core
3673 Points (55%)
Geekbench 2 - 32 Bit - Geekbench Stream
7535 Points (61%)
Geekbench 2 - 32 Bit - Geekbench Memory
5586 Points (51%)
Geekbench 2 - 32 Bit - Geekbench Floating Point
9447 Points (19%)
Geekbench 2 - 32 Bit - Geekbench Integer
7540 Points (15%)
Geekbench 2 - 32 Bit - Geekbench Total Score
7816 Points (20%)
Mozilla Kraken 1.1 - Kraken 1.1 Total Score *
min: 1185     avg: 1243     median: 1205.5 (1%)     max: 1374 ms
Sunspider - Sunspider 1.0 Total Score *
130.3 ms (1%)
Octane V2 - Octane V2 Total Score
23991 Points (22%)
WebXPRT 3 - WebXPRT 3 Score
min: 137     avg: 142.3     median: 139 (29%)     max: 154 Points
Power Consumption - Prime95 Power Consumption - external Monitor *
211.2 Watt (36%)
17.2 Watt (3%)
Power Consumption - Cinebench R15 Multi Power Consumption - external Monitor *
219.2 Watt (40%)
19.4 Watt (4%)
Power Consumption - Cinebench R15 Multi Power Efficiency - external Monitor
8.2 Points per Watt (6%)
18.2 Points per Watt (14%)

Average Benchmarks AMD Ryzen 7 2700X → 100% n=35

Average Benchmarks AMD Ryzen 3 3200U → 51% n=35

- Range of benchmark values for this graphics card
- Average benchmark values for this graphics card
* Smaller numbers mean a higher performance
1 This benchmark is not used for the average calculation

Add one or more devices and compare

In the following list you can select (and also search for) devices that should be added to the comparison. You can select more than one device.

restrict list:

show all (including archived), 2024, 2023
v1.26
log 02. 01:27:01

#0 checking url part for id 9978 +0s ... 0s

#1 checking url part for id 11191 +0s ... 0s

#2 not redirecting to Ajax server +0s ... 0s

#3 did not recreate cache, as it is less than 5 days old! Created at Wed, 01 May 2024 05:34:47 +0200 +0.001s ... 0.001s

#4 composed specs +0.026s ... 0.027s

#5 did output specs +0s ... 0.027s

#6 getting avg benchmarks for device 9978 +0.004s ... 0.031s

#7 got single benchmarks 9978 +0.068s ... 0.099s

#8 getting avg benchmarks for device 11191 +0.02s ... 0.119s

#9 got single benchmarks 11191 +0.04s ... 0.159s

#10 got avg benchmarks for devices +0s ... 0.159s

#11 min, max, avg, median took s +0.415s ... 0.574s

#12 return log +0.027s ... 0.601s

Please share our article, every link counts!
> Expert Reviews and News on Laptops, Smartphones and Tech Innovations > Benchmarks / Tech > Processor Comparison - Head 2 Head
Redaktion, 2017-09- 8 (Update: 2023-07- 1)