

NVIDIA Quadro P620 vs Intel HD Graphics P630 vs Intel UHD Graphics P630
NVIDIA Quadro P620
► remove from comparison
The Nvidia Quadro P620 is an entry-level mobile workstation graphics card for laptops. It uses a GP107 Pascal chip with a 128 Bit memory bus and therefore similar to the old Quadro P1000 with reduced clock speeds. Compared to consumer cards, there is no similar specified card currently and therefore the P620 slots in between the GeForce MX250 and GTX 1050. With a theoretical peak of 1.5 TFLOPS, the performance is clearly ahead of the old P600 with 1.2 TFLOPS.
The Quadro GPUs offer certified drivers, which are optimized for stability and performance in professional applications (CAD, DCC, medical, prospection, and visualizing applications). The performance in these areas is therefore much better compared to corresponding consumer GPUs.
Intel HD Graphics P630
► remove from comparison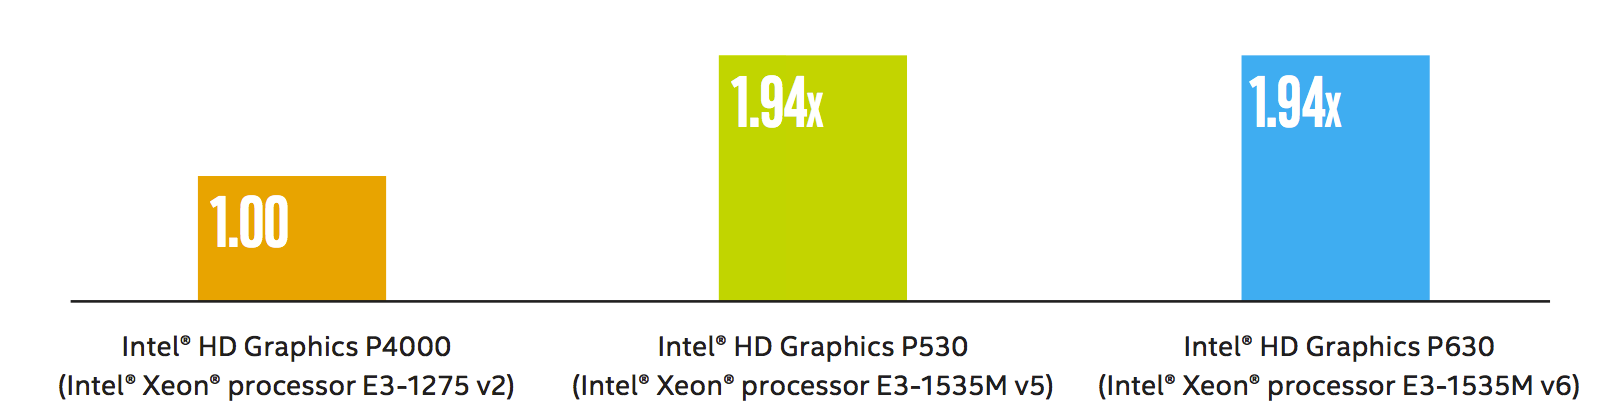
The Intel HD Graphics P630 (GT2) is an integrated graphics unit, which can be found in various Xeon workstation processors of the Kaby Lake generation. The "GT2" version of the Skylake GPU offers 24 Execution Units (EUs) clocked at up to 1050 MHz (depending on the CPU model). Due to its lack of dedicated graphics memory or eDRAM cache, the P630 has to access the main memory (2x 64bit DDR3L-1600 / DDR4-2133). It uses the same silicon as the consumer HD Graphics 630 in Kaby-Lake-H processors but features optimized drivers for workstaion and CAD software. According to Intel it is certified for 15 applications (see list).
Performance
According to Intel, the performance of the P630 is identical to the Intel HD Graphis P530 (Skylake predecessor) processor graphics card and 1.94x faster than the old Intel HD Graphics P4000. Compared to consumer cards, the gaming performance should be on a similar level to the dedicated GeForce 920M and will handle old games (as of 2015) in low or medium settings.
Features
The revised video engine in the Kaby Lake chips now supports H.265/HEVC Main10 profile at 10-bit color depth and also the VP9 codec in hardware. Furthermore, HDCP 2.2 is also supported in all chips, which allows Netflix 4K videos, for instance.
Power Consumption
The HD Graphics P630 can be found in mobile quad-core Xeon processors with 45 W TDP and also desktop processors of the Xeon range with higher TDPs.
Source: http://www.intel.com/content/dam/www/public/us/en/documents/guides/hd-graphics-performance-guide.pdf
Intel UHD Graphics P630
► remove from comparisonThe Intel UHD Graphics P630 (GT2) is a professional integrated graphics card, which can be found in various Xeon desktop and notebook processors of the Coffee-Lake generation. The "GT2" version of the GPU offers 24 Execution Units (EUs) and the clocks depend on the CPU model. Due to its lack of dedicated graphics memory or eDRAM cache, the UHD P630 has to access the main memory (2x 64-bit DDR3L-1600 / DDR4-2133). Compared to the older HD Graphics P630 (Kaby-Lake), the newer UHD GPU is identical but can be clocked slightly higher. Compared to the regular UHD 630, the P630 supports ECC main memory and is intended for professional applications.
Performance
The exact performance of the UHD Graphics P630 depends on various factors like TDP, L3 Cache, memory (DDR3/DDR4) and maximum clock rate of the specific model. However, it should be fairly similar to the HD Graphics 530 and HD Graphics 630 and therefore only suited for low demanding games like Overwatch or Farming Simulator 2017 (low details).
Features
The features of the UHD P630 are the same as for the HD 630 and therefore H.265/HEVC Main10 profile at 10-bit color depth are supported in hardware. Furthermore, HDCP 2.2 is also supported in all chips, which allows Netflix 4K videos, for instance. HDMI 2.0 however is still only supported with an external converter chip (LSPCon).
Power Consumption
The UHD Graphics P630 can be found in several notebook and desktop processors of different TDP classes.
| NVIDIA Quadro P620 | Intel HD Graphics P630 | Intel UHD Graphics P630 | ||||||||||||||||||||||||||||||||||||||||||||||||||||||||||||||||||||||||||||||||||||||||||||||||||||||||||||||||||||||
| Gen. 9.5 Series |
|
|
| |||||||||||||||||||||||||||||||||||||||||||||||||||||||||||||||||||||||||||||||||||||||||||||||||||||||||||||||||||||
| Architecture | Pascal | Gen. 9.5 Kaby Lake | Gen. 9.5 | |||||||||||||||||||||||||||||||||||||||||||||||||||||||||||||||||||||||||||||||||||||||||||||||||||||||||||||||||||||
| Pipelines | 512 - unified | 24 - unified | 24 - unified | |||||||||||||||||||||||||||||||||||||||||||||||||||||||||||||||||||||||||||||||||||||||||||||||||||||||||||||||||||||
| Core Speed | 1177 - 1442 (Boost) MHz | 300 - 1200 (Boost) MHz | ||||||||||||||||||||||||||||||||||||||||||||||||||||||||||||||||||||||||||||||||||||||||||||||||||||||||||||||||||||||
| Memory Speed | 6000 MHz | |||||||||||||||||||||||||||||||||||||||||||||||||||||||||||||||||||||||||||||||||||||||||||||||||||||||||||||||||||||||
| Memory Bus Width | 128 Bit | 64/128 Bit | 64/128 Bit | |||||||||||||||||||||||||||||||||||||||||||||||||||||||||||||||||||||||||||||||||||||||||||||||||||||||||||||||||||||
| Memory Type | GDDR5 | |||||||||||||||||||||||||||||||||||||||||||||||||||||||||||||||||||||||||||||||||||||||||||||||||||||||||||||||||||||||
| Max. Amount of Memory | 4 GB | |||||||||||||||||||||||||||||||||||||||||||||||||||||||||||||||||||||||||||||||||||||||||||||||||||||||||||||||||||||||
| Shared Memory | no | yes | yes | |||||||||||||||||||||||||||||||||||||||||||||||||||||||||||||||||||||||||||||||||||||||||||||||||||||||||||||||||||||
| API | DirectX 12_1, OpenGL 4.5 | DirectX 12_1, OpenGL 4.4 | DirectX 12_1, OpenGL 4.4 | |||||||||||||||||||||||||||||||||||||||||||||||||||||||||||||||||||||||||||||||||||||||||||||||||||||||||||||||||||||
| Power Consumption | 25 Watt | |||||||||||||||||||||||||||||||||||||||||||||||||||||||||||||||||||||||||||||||||||||||||||||||||||||||||||||||||||||||
| technology | 14 nm | 14 nm | 14 nm | |||||||||||||||||||||||||||||||||||||||||||||||||||||||||||||||||||||||||||||||||||||||||||||||||||||||||||||||||||||
| Features | Vulkan, Multi Monitor | QuickSync | QuickSync | |||||||||||||||||||||||||||||||||||||||||||||||||||||||||||||||||||||||||||||||||||||||||||||||||||||||||||||||||||||
| Notebook Size | large | |||||||||||||||||||||||||||||||||||||||||||||||||||||||||||||||||||||||||||||||||||||||||||||||||||||||||||||||||||||||
| Date of Announcement | 27.05.2019 | 05.08.2015 | 01.10.2017 | |||||||||||||||||||||||||||||||||||||||||||||||||||||||||||||||||||||||||||||||||||||||||||||||||||||||||||||||||||||
| Codename | Kaby-Lake-H-GT2 | Coffee-Lake-GT2 |
|
| |||||||||||||||||||||||||||||||||||||||||
Benchmarks
3DM Vant. Perf. total + NVIDIA Quadro P620
specvp12 sw-03 + NVIDIA Quadro P620
Cinebench R15 OpenGL 64 Bit + NVIDIA Quadro P620
Average Benchmarks NVIDIA Quadro P620 → 0% n=0
Average Benchmarks Intel HD Graphics P630 → 0% n=0
* Smaller numbers mean a higher performance
1 This benchmark is not used for the average calculation
Game Benchmarks
The following benchmarks stem from our benchmarks of review laptops. The performance depends on the used graphics memory, clock rate, processor, system settings, drivers, and operating systems. So the results don't have to be representative for all laptops with this GPU. For detailed information on the benchmark results, click on the fps number.

FIFA 20
2019
Borderlands 3
2019
F1 2019
2019
Metro Exodus
2019
Apex Legends
2019

F1 2018
2018
X-Plane 11.11
2018

Fortnite
2018
Destiny 2
2017
Rocket League
2017Prey
2017
Overwatch
2016
Doom
2016

Dota 2 Reborn
2015
The Witcher 3
2015BioShock Infinite
2013
Guild Wars 2
2012Average Gaming NVIDIA Quadro P620 → 100%
Average Gaming 30-70 fps → 100%
| NVIDIA Quadro P620 | Intel HD Graphics P630 | Intel UHD Graphics P630 | |||||||||||||||||||
|---|---|---|---|---|---|---|---|---|---|---|---|---|---|---|---|---|---|---|---|---|---|
| low | med. | high | ultra | QHD | 4K | low | med. | high | ultra | QHD | 4K | low | med. | high | ultra | QHD | 4K | ||||
| FIFA 20 | 166 | 117.8 | 112 | 92.4 | |||||||||||||||||
| Borderlands 3 | 75.8 | 29.7 | 19.3 | 14.5 | |||||||||||||||||
| F1 2019 | 102 | 46 | 39 | 26 | |||||||||||||||||
| Metro Exodus | 46.6 | 21.4 | 15.5 | 12.9 | |||||||||||||||||
| Apex Legends | 88.4 | 35.2 | 29.1 | 26 | |||||||||||||||||
| Shadow of the Tomb Raider | 70 | 16 | 14 | 12 | |||||||||||||||||
| F1 2018 | 106 | 55 | 42 | 25 | |||||||||||||||||
| X-Plane 11.11 | 104 | 71.3 | 63.9 | ||||||||||||||||||
| Final Fantasy XV Benchmark | 52 | 26 | 18 | ||||||||||||||||||
| Fortnite | 183.6 | 113.2 | 41.9 | 29.3 | |||||||||||||||||
| Destiny 2 | 100.5 | 48.6 | 37.6 | 30.1 | |||||||||||||||||
| Middle-earth: Shadow of War | 96 | 37 | 27 | 20 | |||||||||||||||||
| Rocket League | 248.9 | 153.5 | 96.5 | ||||||||||||||||||
| Prey | 144.7 | 74.8 | 56.7 | ||||||||||||||||||
| Overwatch | 261.8 | 169 | 77 | ||||||||||||||||||
| Doom | 96.7 | 76.3 | 44.1 | ||||||||||||||||||
| Ashes of the Singularity | 50.6 | 29.2 | 25.4 | ||||||||||||||||||
| Rise of the Tomb Raider | 101.9 | 62.9 | 33.7 | 26.4 | |||||||||||||||||
| Dota 2 Reborn | 156 | 139 | 90.2 | 82.8 | |||||||||||||||||
| The Witcher 3 | 96 | 55 | 32 | 17 | |||||||||||||||||
| BioShock Infinite | 301.7 | 160.9 | 140 | 52.8 | |||||||||||||||||
| StarCraft II: Heart of the Swarm | 542 | 258.9 | 156.8 | 82.4 | |||||||||||||||||
| Guild Wars 2 | 149.9 | 73.1 | 28.4 | ||||||||||||||||||
| NVIDIA Quadro P620 | Intel HD Graphics P630 | Intel UHD Graphics P630 | |||||||||||||||||||
| low | med. | high | ultra | QHD | 4K | low | med. | high | ultra | QHD | 4K | low | med. | high | ultra | QHD | 4K | < 30 fps < 60 fps < 120 fps ≥ 120 fps | 3 11 9 | 5 6 6 5 | 7 8 6 2 | 11 2 3 | | | < 30 fps < 60 fps < 120 fps ≥ 120 fps | | | | | | | < 30 fps < 60 fps < 120 fps ≥ 120 fps | | | | | | |
For more games that might be playable and a list of all games and graphics cards visit our Gaming List