Notebookcheck Logo

PowerVR GE8320 vs Qualcomm Adreno 690 vs Qualcomm Adreno 660

PowerVR GE8320

► remove from comparison

The PowerVR GE8320 by Imagination Technologies is an integrated graphics card for mid-range ARM SoCs. It belongs to the Series8XE series of GPUs (GE8xx0) and supports OpenGL ES 3.2, OpenCL 1.2, Android NN HAL API and Vulkan 1.0.

Qualcomm Adreno 690

► remove from comparison Qualcomm Adreno 690

The Qualcomm Adreno 690 is an integrated graphics card in the Qualcomm Snapdragon 8cx Gen 3 SoC for Windows laptops. According to Qualcomm, the 690 is up to 60% faster than the previous generation. In our tests with the Lenovo ThinkPad X13s, the Adreno 690 was only on par with a low en Intel UHD Graphics iGPU and not well suited for 3D games.

The chip is manufactured in 5nm at Samsung (5LPE) and suited for fanless laptops.

Qualcomm Adreno 660

► remove from comparison Qualcomm Adreno 660

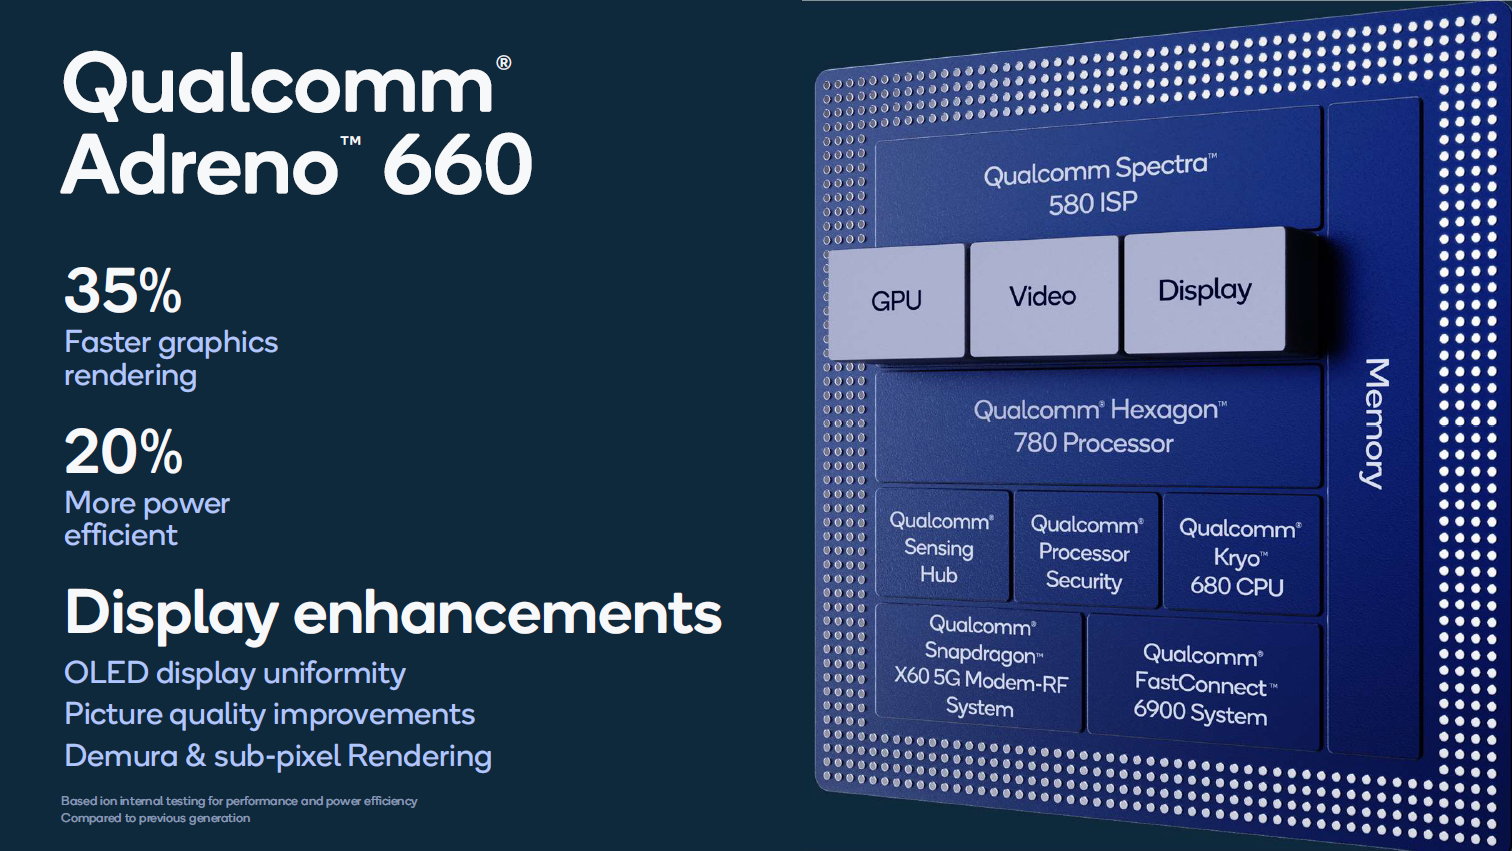
The Qualcomm Adreno 660 is a smartphone and tablet GPU that is integrated within the Qualcomm Snapdragon 888 SoC. The chip will be available from early 2020 and will be used mainly in high-end Android devices.

According to Qualcomm, the Adreno 660 GPU offers a 35% improved performance over the Adreno 650, its predecessor, which is integrated into the Snapdragon 865 SoC. Qualcomm also states that the energy efficiency improved by 20% which might be due to the new 5nm process at Samsung where the chip is produced.

The Adreno 650 supports Vulkan 1.1, DirectX 12, OpenGL ES 3.2, and OpenCL 2.0 FP. Furthermore, games and videos can use HDR10+ and Dolby Vision (with a supported display).

PowerVR GE8320Qualcomm Adreno 690Qualcomm Adreno 660
Adreno 600 Series
PowerVR GE8320 @ 0.4 - 0.65 GHz
PowerVR GE8300 @ 0.66 GHz
PowerVR GE8100 @ 0.57 GHz
Adreno 660
Adreno 650 @ 0.25 - 0.67 GHz
Adreno 690
Adreno 685
Adreno 680
Adreno 644
Adreno 643 @ 0.81 GHz
Adreno 642
Adreno 642L
Adreno 640
Adreno 630
Adreno 620
Adreno 619
Adreno 619L
Adreno 618
Adreno 616
Adreno 612
Adreno 610
Adreno 660
Adreno 650 @ 0.25 - 0.67 GHz
Adreno 690
Adreno 685
Adreno 680
Adreno 644
Adreno 643 @ 0.81 GHz
Adreno 642
Adreno 642L
Adreno 640
Adreno 630
Adreno 620
Adreno 619
Adreno 619L
Adreno 618
Adreno 616
Adreno 612
Adreno 610
ArchitecturePowerVR Series8XE
Core Speed400 - 650 (Boost) MHz
Shared Memorynoyesyes
APIDirectX 10, OpenGL 3.x, 4.x, OpenGL ES 3.0DirectX 12DirectX 12, OpenGL ES 3.2
technology20 nm5 nm7 nm
FeaturesOpenGL ES 3.2, Vulkan 1.1, OpenCL 1.2, Android NN HAL API SupportOpenGL ES 3.2, OpenCL 2.0, DirectX 12, Vulkan 1.1
Date of Announcement09.09.2014 06.12.2018 02.12.2020
Link to Manufacturer Pagewww.imgtec.com
Power Consumption7 Watt
CPU in PowerVR GE8320GPU Base SpeedGPU Boost / Turbo
Mediatek Helio G378 x 1800 MHz? MHz680 MHz
Mediatek Helio G358 x 2300 MHz? MHz680 MHz
Mediatek Helio G368 x 2200 MHz? MHz680 MHz
min. - max.? - 650 MHz? - 680 MHz
CPU in Adreno 690GPU Base SpeedGPU Boost / Turbo
Qualcomm Snapdragon 8cx Gen 38 x 2400 MHz, 7 W? MHz? MHz
CPU in Adreno 660GPU Base SpeedGPU Boost / Turbo
Qualcomm Snapdragon G3x Gen 18 x 1800 MHz, 5 W? MHz? MHz
Qualcomm Snapdragon 888 Plus 5G8 x 1800 MHz, 5 W? MHz? MHz
Qualcomm Snapdragon 888 5G8 x 1800 MHz, 5 W? MHz? MHz
Qualcomm Snapdragon 888 4G8 x 1800 MHz, 5 W? MHz? MHz
min. - max.? - 650 MHz? - 680 MHz

Benchmarks

Performance Rating - 3DMark 11 + Fire Strike + Time Spy - Adreno 690
1.3 pt (4%)
0.06787 -95%
0.1025 -92%
0.2337 -83%
Qualcomm Adreno 690
1.336
...
0.2337 -83%
max:
33.3 2393%
0%
100%
3DMark - 3DMark Time Spy Score
909 Points (3%)
3DMark - 3DMark Time Spy Graphics
811 Points (2%)
3DMark - 3DMark Ice Storm Unlimited Graphics
min: 6785     avg: 11520     median: 11994 (1%)     max: 13939 Points
200519 Points (23%)
3DMark - 3DMark Ice Storm Extreme Graphics
min: 6867     avg: 7128     median: 7128 (1%)     max: 7389 Points
3DMark - 3DMark Cloud Gate Score
min: 8602     avg: 9818     median: 9818 (10%)     max: 11034 Points
3DMark - 3DMark Cloud Gate Graphics
min: 13768     avg: 16708     median: 16707.5 (4%)     max: 19647 Points
3DMark - 3DMark Fire Strike Standard Score
min: 2758     avg: 2835     median: 2834.5 (5%)     max: 2911 Points
3DMark - 3DMark Fire Strike Standard Graphics
min: 2837     avg: 2933     median: 2932.5 (3%)     max: 3028 Points
3DMark - 3DMark Ice Storm Graphics
9534 Points (1%)
14652 Points (2%)
3DMark - 3DMark Sling Shot (ES 3.0) Unlimited
min: 494     avg: 806     median: 812 (4%)     max: 1214 Points
3DMark - 3DMark Sling Shot (ES 3.0) Unlimited Graphics
min: 445     avg: 750     median: 765 (2%)     max: 881 Points
3DMark - 3DMark Sling Shot Extreme (ES 3.1) Unlimited
min: 302     avg: 499.1     median: 493 (2%)     max: 1166 Points
min: 5094     avg: 8481     median: 8770 (44%)     max: 9839 Points
3DMark - 3DMark Sling Shot Extreme (ES 3.1) Unlimited Graphics
min: 253     avg: 424.8     median: 429 (1%)     max: 516 Points
min: 7930     avg: 11533     median: 11753 (35%)     max: 12914 Points
min: 3959     avg: 5588     median: 5761.5 (3%)     max: 5925 Points
3067 Points (4%)
min: 974     avg: 1423     median: 1498 (2%)     max: 1564 Points
3DMark 11 - 3DM11 Performance Score
min: 3063     avg: 3085     median: 3077 (4%)     max: 3115 Points
3DMark 11 - 3DM11 Performance GPU
min: 2898     avg: 2930     median: 2912 (3%)     max: 2979 Points
Cinebench R10 Cinebench R10 Shading (32bit) + Qualcomm Adreno 690
Cinebench R10 - Cinebench R10 Shading (32bit)
558 Points (0%)
Cinebench R15
Cinebench R15 OpenGL 64 Bit + Qualcomm Adreno 690
Cinebench R15 - Cinebench R15 OpenGL 64 Bit
min: 13.4     avg: 13.7     median: 13.7 (1%)     max: 14 fps
Cinebench R15 OpenGL Ref. Match 64 Bit + Qualcomm Adreno 690
Cinebench R15 - Cinebench R15 OpenGL Ref. Match 64 Bit
98 % (98%)
GFXBench - GFXBench 5.0 4K Aztec Ruins High Tier Offscreen
min: 0.6     avg: 0.6     median: 0.6 (0%)     max: 0.65 fps
min: 11     avg: 12.3     median: 13 (5%)     max: 13 fps
GFXBench - GFXBench 5.0 Aztec Ruins High Tier Offscreen
min: 0.85     avg: 1.4     median: 1.4 (0%)     max: 1.6 fps
min: 19     avg: 26.8     median: 27.5 (5%)     max: 32 fps
GFXBench - GFXBench 5.0 Aztec Ruins Normal Tier Offscreen
min: 2.3     avg: 3.9     median: 3.9 (0%)     max: 7.4 fps
min: 39     avg: 69.2     median: 71 (5%)     max: 87 fps
GFXBench - GFXBench Car Chase Offscreen
min: 1.8     avg: 3     median: 2.9 (0%)     max: 6.1 fps
GFXBench 3.1 - GFXBench Manhattan ES 3.1 Offscreen
min: 3.7     avg: 6.6     median: 6.7 (0%)     max: 8.3 fps
GFXBench 3.0 - GFXBench 3.0 Manhattan Offscreen
min: 6.3     avg: 10.4     median: 10.5 (1%)     max: 12 fps
GFXBench (DX / GLBenchmark) 2.7
GFXBench T-Rex HD Offscreen C24Z16 + PowerVR GE8320
GFXBench (DX / GLBenchmark) 2.7 - GFXBench T-Rex HD Offscreen C24Z16
min: 13     avg: 19.9     median: 20 (0%)     max: 23 fps
GFXBench T-Rex HD Offscreen C24Z16 + Qualcomm Adreno 660
Antutu v9 - AnTuTu v9 GPU
min: 15496     avg: 16406     median: 16655 (2%)     max: 17214 Points
Basemark GPU 1.2 - Basemark GPU 1.2 Vulkan Official Medium Offscreen 1080
0 fps (0%)
min: 107.62     avg: 108.5     median: 108.5 (1%)     max: 109.3 fps
Geekbench 6.2 - Geekbench 6.2 GPU OpenCL
0 Points (0%)
min: 4055     avg: 4338     median: 4337.5 (1%)     max: 4620 Points
Geekbench 6.2 - Geekbench 6.2 GPU Vulkan
0 Points (0%)
min: 4370     avg: 4532     median: 4532 (1%)     max: 4694 Points
PassMark PerformanceTest Mobile V1 - PerformanceTest Mobile V1 2D Graphics Tests
min: 2578     avg: 7793     median: 6525 (7%)     max: 13202 Points
53822 Points (54%)
PassMark PerformanceTest Mobile V1 - PerformanceTest Mobile V1 3D Graphics Tests
min: 575     avg: 2322     median: 2965 (5%)     max: 3666 Points
42266 Points (74%)
Power Consumption - Furmark Stress Test Power Consumption - external Monitor *
min: 17     avg: 19.7     median: 19.7 (3%)     max: 22.3 Watt
Power Consumption - The Witcher 3 Power Consumption - external Monitor *
15.8 Watt (2%)
Power Consumption - Witcher 3 Power Consumption *
16.4 Watt (4%)
Power Consumption - GFXBench Aztec Ruins Normal Tier Offscreen Power Consumption 150cd *
min: 1.84     avg: 2.3     median: 2.2 (1%)     max: 2.91 Watt

Average Benchmarks PowerVR GE8320 → 0% n=

Average Benchmarks Qualcomm Adreno 690 → 0% n=

Average Benchmarks Qualcomm Adreno 660 → 0% n=

- Range of benchmark values for this graphics card
- Average benchmark values for this graphics card
* Smaller numbers mean a higher performance
1 This benchmark is not used for the average calculation

Game Benchmarks

The following benchmarks stem from our benchmarks of review laptops. The performance depends on the used graphics memory, clock rate, processor, system settings, drivers, and operating systems. So the results don't have to be representative for all laptops with this GPU. For detailed information on the benchmark results, click on the fps number.

F1 22

F1 22

2022
low 1920x1080
Adreno 690:
26  fps
med. 1920x1080
Adreno 690:
22.5  fps
high 1920x1080
Adreno 690:
17  fps
ultra 1920x1080
Adreno 690:
12.6  fps
League of Legends: Wild Rift

League of Legends: Wild Rift

2020
low
100%
PowerVR GE8320:
42  fps
143%
Adreno 660:
60  fps
high
PowerVR GE8320:
0 (!)  fps
Adreno 660:
118 119.2 ~ 119 fps
ultra
PowerVR GE8320:
0 (!)  fps
Adreno 660:
60 60.2 ~ 60 fps
Call of Duty Mobile

Call of Duty Mobile

2020
low
100%
PowerVR GE8320:
48  fps
190%
Adreno 660:
91  fps
high
PowerVR GE8320:
0 (!)  fps
ultra
PowerVR GE8320:
0 (!)  fps
Adreno 660:
60  fps
Genshin Impact

Genshin Impact

2020
low
100%
PowerVR GE8320:
15  fps
395%
Adreno 660:
59.3  fps
med.
Adreno 660:
58.8  fps
ultra
Adreno 660:
55.6  fps
Armajet

Armajet

2020
high
100%
PowerVR GE8320:
24 30 33.5 ~ 29 fps
248%
Adreno 660:
30 30 56 78 120 120 ~ 72 fps
PUBG Mobile

PUBG Mobile

2018
low
100%
PowerVR GE8320:
22 24 24 25 25 25 25 25 25 25 25 ~ 25 fps
264%
Adreno 660:
59.3 60 60 60 60 60 60 60 90 91 ~ 66 fps
med.
100%
PowerVR GE8320:
22 23 24 24 25 25 25 25 25 25 25 ~ 24 fps
250%
Adreno 660:
60 60 60 60 60 60 60 60 ~ 60 fps
high
PowerVR GE8320:
0 (!) 0 (!) ~ 0 fps
Adreno 660:
30 30 30 59 60 60 60 60 60 60 60 60 60 60 60 ~ 54 fps
ultra
PowerVR GE8320:
0 (!)  fps
Adreno 660:
39.5 40 40 40 40 40 40 40 40 40 40 ~ 40 fps
Arena of Valor

Arena of Valor

2018
low
100%
PowerVR GE8320:
30 31 31 56 ~ 37 fps
ultra
100%
PowerVR GE8320:
29 30 31 43 ~ 33 fps
Shadow Fight 3

Shadow Fight 3

2018
low
100%
PowerVR GE8320:
47 58 ~ 53 fps
high
100%
PowerVR GE8320:
57  fps
low 1280x720
Adreno 690:
0 (!) 20.7 21.3 ~ 14 fps
med. 1920x1080
Adreno 690:
0 (!) 18 18.9 ~ 12 fps
high 1920x1080
Adreno 690:
0 (!) 16.1 16.3 ~ 11 fps
4K 3840x2160
Adreno 690:
0 (!)  fps
low 1280x720
Adreno 690:
19  fps
med. 1920x1080
Adreno 690:
12.3  fps
high 1920x1080
Adreno 690:
7.3  fps
low 1280x720
Adreno 690:
57.1 57.5 58.7 ~ 58 fps
med. 1366x768
Adreno 690:
54.5 54.5 55.2 ~ 55 fps
high 1920x1080
Adreno 690:
38.8 45.9 47 ~ 44 fps
ultra 1920x1080
Adreno 690:
29.4 40.2 40.7 ~ 37 fps
low 1024x768
Adreno 690:
0 (!) 35 38.6 ~ 25 fps
med. 1366x768
Adreno 690:
0 (!) 31.5 ~ 16 fps
high 1920x1080
Adreno 690:
0 (!) 19.1 ~ 10 fps
ultra 1920x1080
Adreno 690:
0 (!) 8.5 ~ 4 fps
4K 3840x2160
Adreno 690:
0 (!)  fps
GTA V

GTA V

2015
low 1024x768
Adreno 690:
29.9  fps
Dead Trigger 2

Dead Trigger 2

2013
high
100%
PowerVR GE8320:
30  fps
553%
Adreno 660:
166  fps
Asphalt 8: Airborne

Asphalt 8: Airborne

2013
low
100%
PowerVR GE8320:
28  fps
high
100%
PowerVR GE8320:
21 30 ~ 26 fps
Asphalt 9: Legends

Asphalt 9: Legends

2013
low
100%
PowerVR GE8320:
10 19 27 28 ~ 21 fps
286%
Adreno 660:
60  fps
high
100%
PowerVR GE8320:
12 22 24 ~ 19 fps
316%
Adreno 660:
59 60 60 ~ 60 fps
Real Racing 3

Real Racing 3

2013
high
100%
PowerVR GE8320:
24 24 26 ~ 25 fps
240%
Adreno 660:
60  fps
Temple Run 2

Temple Run 2

2013
high
100%
PowerVR GE8320:
44.5 59 ~ 52 fps

Average Gaming PowerVR GE8320 → 100%

Average Gaming 30-70 fps → 100%

Average Gaming Qualcomm Adreno 660 → 288%

Average Gaming 30-70 fps → 271%

Qualcomm Adreno 690lowmed.highultraQHD4K
F1 222622.51712.6
X-Plane 11.11141211
Final Fantasy XV Benchmark1912.37.29
Dota 2 Reborn58554437
The Witcher 32516104
GTA V29.9
< 30 fps
< 60 fps
< 120 fps
≥ 120 fps
5
1

4
1

4
1

2
1


PowerVR GE8320lowmed.highultraQHD4K
League of Legends: Wild Rift42
Call of Duty Mobile48
Genshin Impact15
Armajet29
PUBG Mobile25240
Arena of Valor3733
Shadow Fight 35357
Dead Trigger 230
Asphalt 8: Airborne2826
Asphalt 9: Legends2119
Real Racing 325
Temple Run 252
< 30 fps
< 60 fps
< 120 fps
≥ 120 fps
4
4

1


4
3


1


Qualcomm Adreno 660lowmed.highultraQHD4K
League of Legends: Wild Rift6011960
Call of Duty Mobile9160
Genshin Impact59.358.855.6
Armajet72
PUBG Mobile66605440
Dead Trigger 2166
Asphalt 9: Legends6060
Real Racing 360
< 30 fps
< 60 fps
< 120 fps
≥ 120 fps

1
4

1
1

1
4
1

2
2


For more games that might be playable and a list of all games and graphics cards visit our Gaming List

v1.27
log 17. 00:22:28

#0 checking url part for id 9411 +0s ... 0s

#1 checking url part for id 11411 +0s ... 0s

#2 checking url part for id 10603 +0s ... 0s

#3 not redirecting to Ajax server +0s ... 0s

#4 did not recreate cache, as it is less than 5 days old! Created at Sun, 16 Jun 2024 05:38:48 +0200 +0.001s ... 0.001s

#5 composed specs +0.124s ... 0.125s

#6 did output specs +0s ... 0.125s

#7 start showIntegratedCPUs +0s ... 0.125s

#8 getting avg benchmarks for device 9411 +0.04s ... 0.165s

#9 got single benchmarks 9411 +0.205s ... 0.371s

#10 getting avg benchmarks for device 11411 +0.02s ... 0.391s

#11 got single benchmarks 11411 +0.01s ... 0.401s

#12 getting avg benchmarks for device 10603 +0.002s ... 0.404s

#13 got single benchmarks 10603 +0.077s ... 0.48s

#14 got avg benchmarks for devices +0s ... 0.48s

#15 No cached benchmark found, getting uncached values +0.113s ... 0.593s

#16 No cached benchmark found, getting uncached values +0.009s ... 0.602s

#17 No cached benchmark found, getting uncached values +0.063s ... 0.665s

#18 No cached benchmark found, getting uncached values +0.004s ... 0.669s

#19 No cached benchmark found, getting uncached values +0.004s ... 0.673s

#20 min, max, avg, median took s +0.023s ... 0.696s

#21 before gaming benchmark output +0s ... 0.696s

#22 Got 212 rows for game benchmarks. +0.049s ... 0.745s

#23 composed SQL query for gamebenchmarks +0s ... 0.745s

#24 got data and put it in $dataArray +0.009s ... 0.754s

#25 benchmarks composed for output. +0.039s ... 0.793s

#26 calculated avg scores. +0s ... 0.793s

#27 return log +0.002s ... 0.795s

Please share our article, every link counts!
> Expert Reviews and News on Laptops, Smartphones and Tech Innovations > Benchmarks / Tech > Graphics Card Comparison - Head 2 Head
Redaktion, 2017-09- 8 (Update: 2023-07- 1)