Apple M3 Pro 14-Core GPU vs AMD Radeon RX 7900 GRE
Apple M3 Pro 14-Core GPU ► remove from comparison
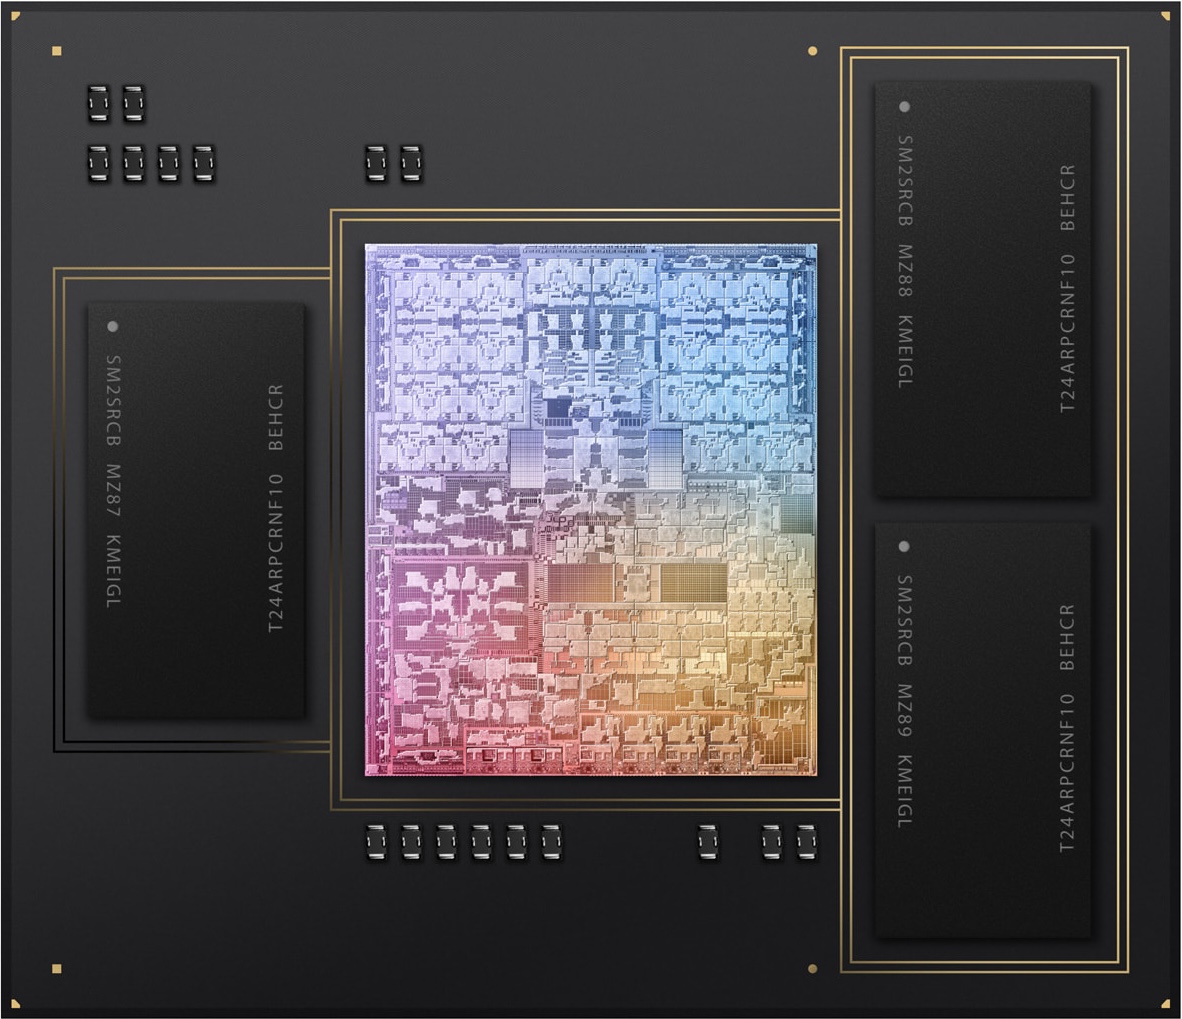
The Apple M3 Pro 14-Core GPU is a self-designed graphics card in the Apple M3 Pro (with 11 CPU cores) and offers fourteen of the eighteen cores available on the chip. The graphics card uses a new architecture and now offers dynamic caching, mesh shading and ray tracing acceleration.
The GPU can access up to 24 GB LPDDR5-6400 unified memory via a 192-bit memory bus (max 150 GBit/s). Thanks to dynamic caching, the GPU only reserves as much memory as is required.
The entire chip is manufactured in the current 3nm process (probably N3B) at TSMC.
AMD Radeon RX 7900 GRE ► remove from comparison
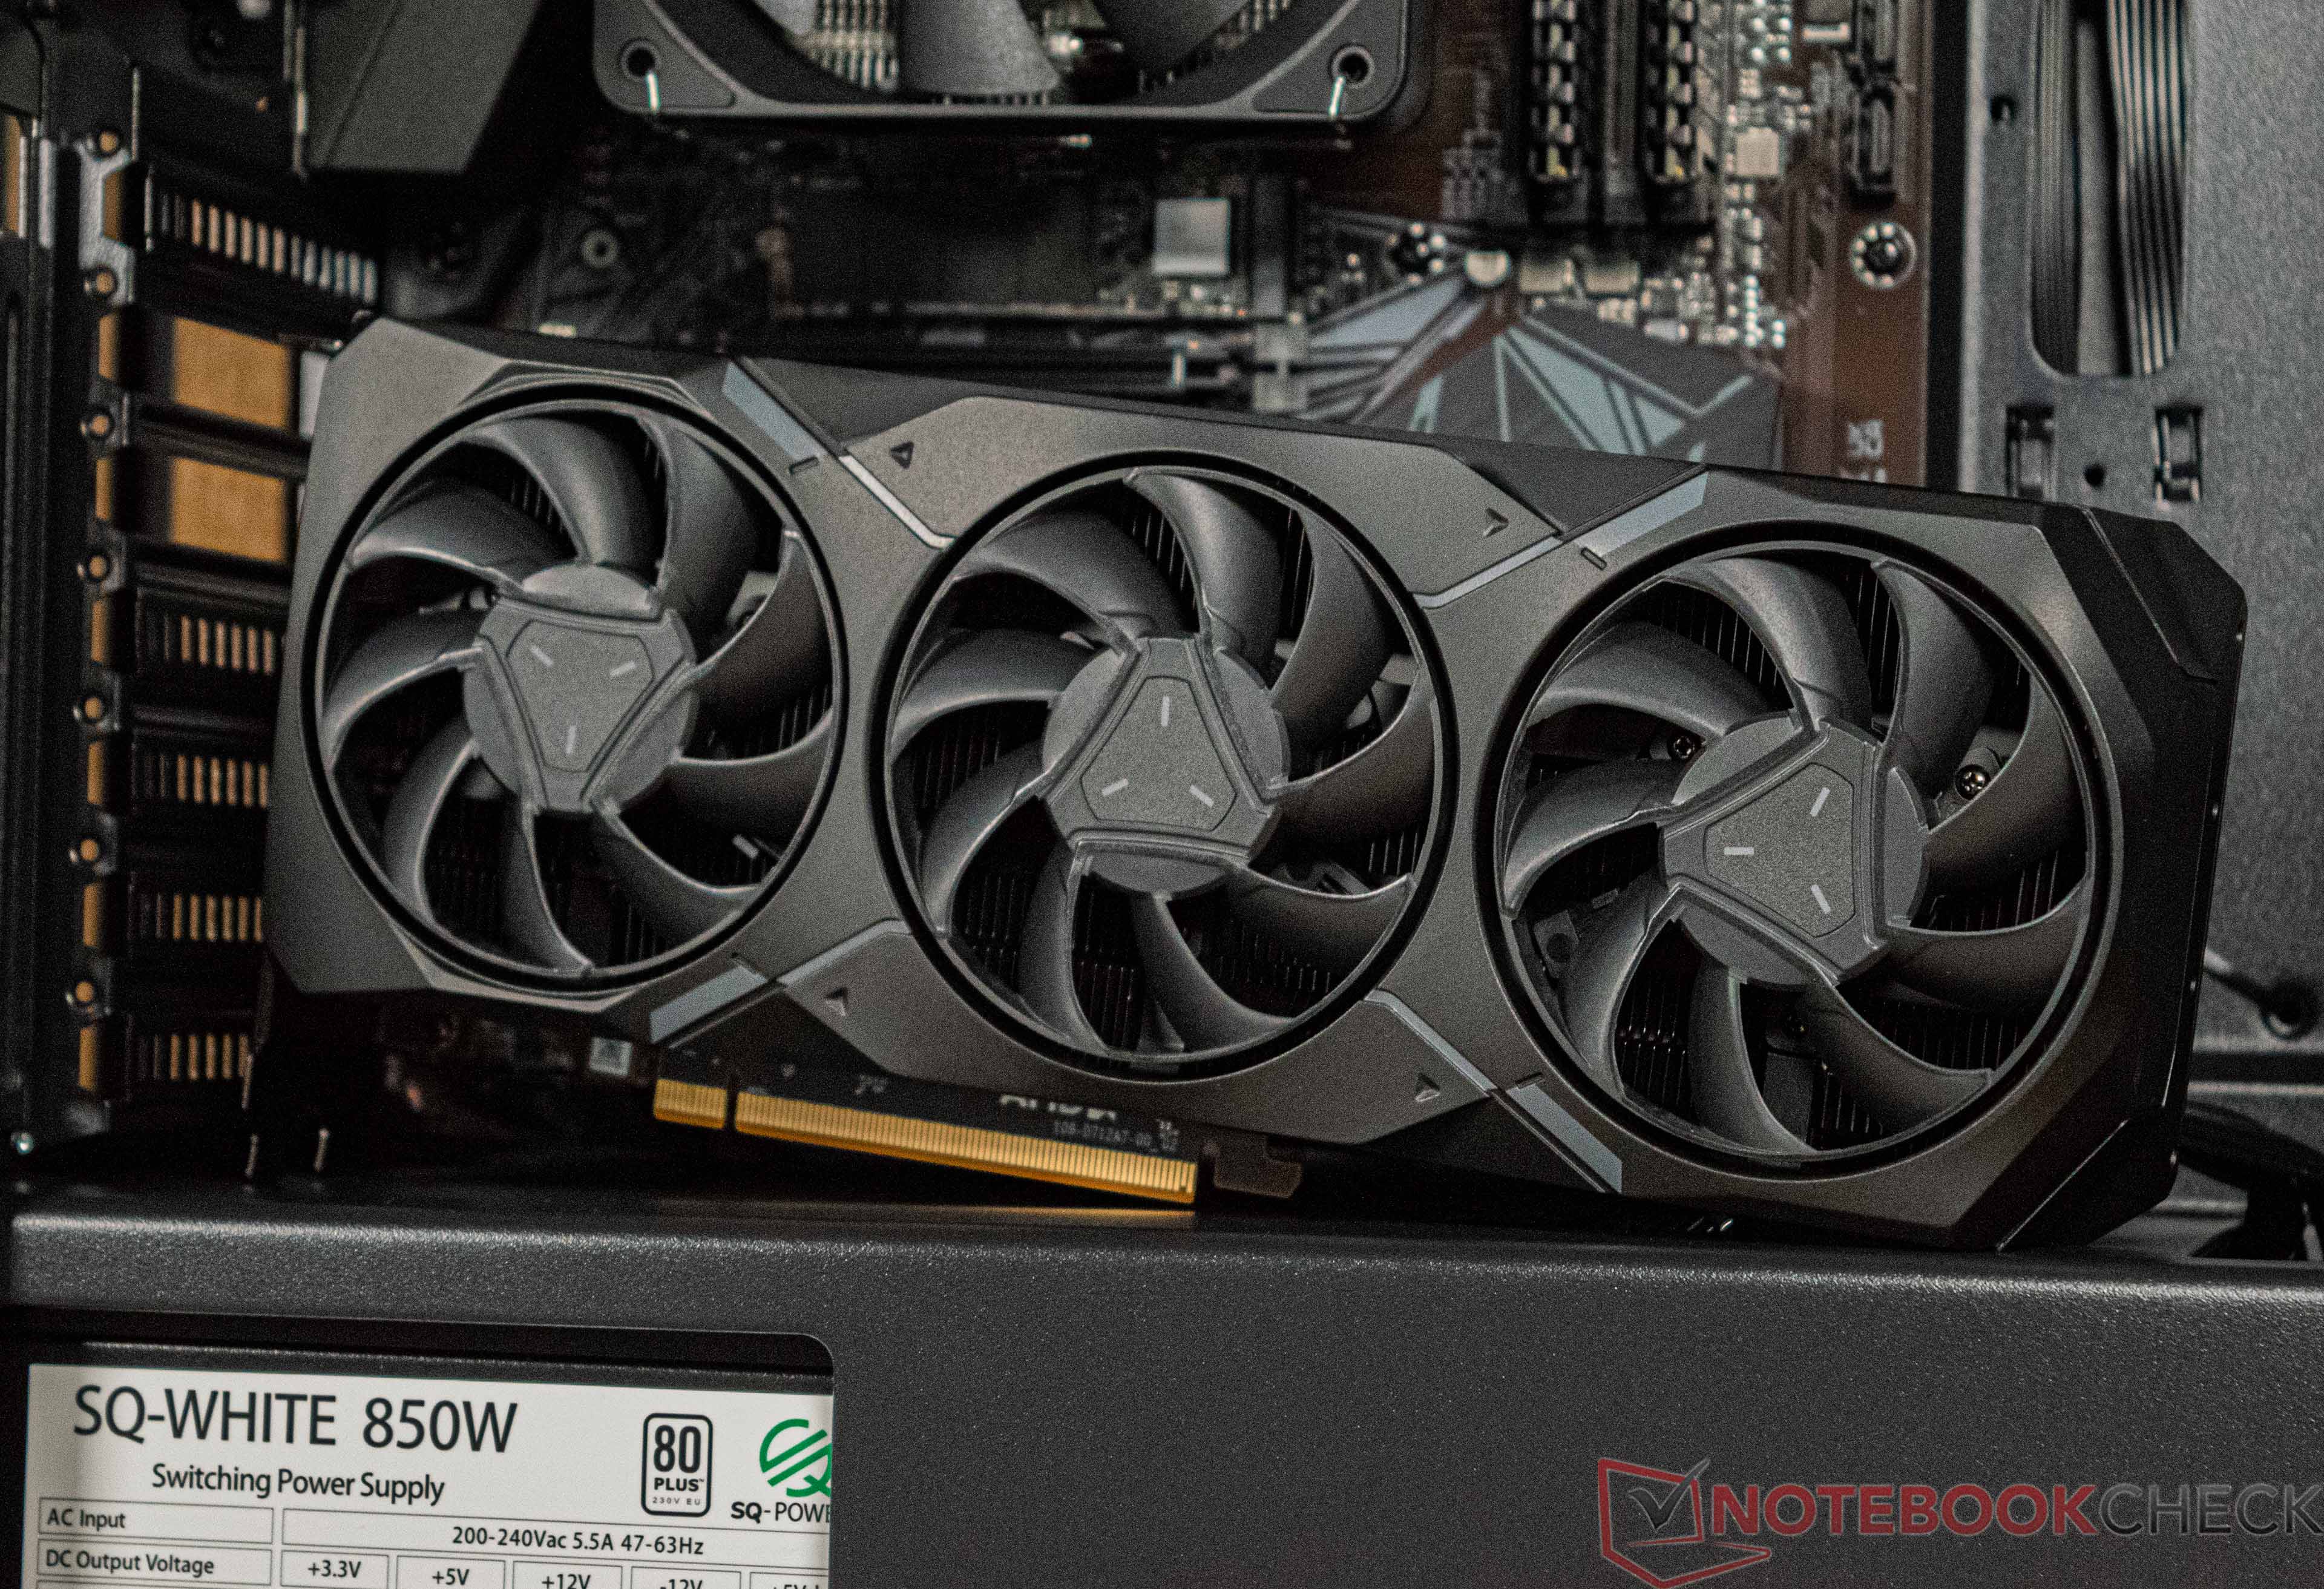
The AMD Radeon RX 7900 GRE is a high end OEM desktop graphics card based on the RDNA 3 architecture. It uses the Navi 31 Chip with consists out of a Graphics Compute Die (GCD) manufactured in 5nm and five (out of six) Memory Cache Dies (MCD chiplets) in 6nm. The 7900 offers 5,120 cores clocked at up to 2.25 GHz (max, 1.88 GHz game average), 64 MB Infinity Cache (L3 cache) and 16 GB GDDR6 graphics memory with a 256 Bit memory bus and 18 Gbps effective speed (leading to 576 GB/s bandwidth).
The average gaming performance without Raytracing is similar to a GeForce RTX 4070 Ti in games. Therefore, the RX 7900 GRE is best suited for QHD (for higher frame rates) up to 4K resolution and maximum detail settings of 2022 games. Raytracing performance is still a bit lower than with Nvidia cards, but a big step up from the previous generation.
The integrated video en- and decoders support AV1, H.264, and HEVC videos wit up to 8K resolution. The display ports are a big advantage of the new chip supporting DisplayPort 2.1 with UHBR13.5 for up to 54 Gbps bandwidth (up to 8K 165 Hz with DSC possible).
The power consumption is rated 260 Watt (TDP).
Apple M3 Pro 14-Core GPU AMD Radeon RX 7900 GRE Radeon RX 7000 Series Pipelines 14 - unified 5120 - unified Memory Type LPDDR5-6400 GDDR6 Shared Memory no no technology 5 nm 5 nm Notebook Size medium sized Date of Announcement 31.10.2023 27.07.2023 Codename Navi 31 Architecture RDNA 3 TMUs 320 ROPs 192 Raytracing Cores 80 Tensor / AI Cores 160 Core Speed 2245 (Boost) MHz Theoretical Performance 91.96 TFLOPS FP16, 45.98 TFLOPS FP32, 1.437 TFLOPS FP64 Cache L2: 6 MB, L3: 64 MB Memory Speed 18000 effective = 2250 MHz Memory Bus Width 256 Bit Max. Amount of Memory 16 GB Memory Bandwidth 576 GB/s API DirectX 12 Ultimate (12_2), Shader 6.7, OpenGL 4.6, OpenCL 2.2, Vulkan 1.3 Power Consumption 260 Watt Transistors 57.7 Billion Die Size 520 mm² PCIe 4.0 x16 Displays 4 Displays (max.), HDMI 2.1a, DisplayPort 2.1 UHBR13.5 Link to Manufacturer Page www.amd.com
CPU in M3 Pro 14-Core GPU GPU Base Speed GPU Boost / Turbo Apple M3 Pro 11-Core 11 x 2748 MHz, 27 W ? MHz ? MHz
Benchmarks Performance Rating - 3DMark 11 + Fire Strike + Time Spy - Radeon RX 7900 GRE
24.9 pt (75%)
...
...
max:
3DMark - 3DMark Time Spy Score
min: 17905 avg: 19037 median: 19036.5 (55%) max: 20168 Points
3DMark - 3DMark Time Spy Graphics
min: 20497 avg: 20659 median: 20658.5 (55%) max: 20820 Points
3DMark - 3DMark Ice Storm Unlimited Graphics
min: 560812 avg: 637522 median: 637522 (72%) max: 714232 Points
3DMark - 3DMark Ice Storm Extreme Graphics
min: 431805 avg: 523496 median: 523496 (67%) max: 615187 Points
3DMark - 3DMark Cloud Gate Score
min: 71793 avg: 78905 median: 78905 (84%) max: 86017 Points
3DMark - 3DMark Cloud Gate Graphics
min: 247050 avg: 247366 median: 247366 (65%) max: 247681 Points
3DMark - 3DMark Fire Strike Standard Score
min: 38476 avg: 42408 median: 42407.5 (75%) max: 46339 Points
3DMark - 3DMark Fire Strike Standard Graphics
min: 54400 avg: 54610 median: 54609.5 (62%) max: 54819 Points
3DMark - 3DMark Ice Storm Graphics
min: 446871 avg: 555420 median: 555420 (67%) max: 663969 Points
3DMark - 3DMark Wild Life Extreme Unlimited
12094 Points (14%)
3DMark - 3DMark Night Raid
min: 64416 avg: 75977 median: 75976.5 (72%) max: 87537 Points
3DMark - 3DMark Night Raid Graphics Score
min: 169156 avg: 190129 median: 190128 (73%) max: 211101 Points
3DMark 11 - 3DM11 Performance Score
min: 39261 avg: 45225 median: 45225 (63%) max: 51189 Points
3DMark 11 - 3DM11 Performance GPU
min: 66008 avg: 67134 median: 67134 (58%) max: 68260 Points
3DMark Vantage + AMD Radeon RX 7900 GRE 3DMark Vantage - 3DM Vant. Perf. total
min: 110273 avg: 122732 median: 122732 (36%) max: 135190 Points
3DM Vant. Perf. GPU no PhysX + AMD Radeon RX 7900 GRE 3DMark Vantage - 3DM Vant. Perf. GPU no PhysX
min: 128176 avg: 138530 median: 138530 (79%) max: 148884 Points
3DMark 05 - 3DMark 05 - Standard
min: 40210 avg: 61225 median: 61224.5 (67%) max: 82239 Points
3DMark 06 3DMark 06 - Standard 1280x1024 + AMD Radeon RX 7900 GRE
min: 51356 avg: 59003 median: 59002.5 (77%) max: 66649 Points
Unigine Valley 1.0 - Unigine Valley 1.0 DX
min: 195.7 avg: 206.4 median: 206.4 (68%) max: 217 fps
Blender - Blender 3.3 Classroom HIP *
29 Seconds (2%)
Blender - Blender 3.3 Classroom METAL *
73 Seconds (8%)
SPECviewperf 12 + AMD Radeon RX 7900 GRE SPECviewperf 12 - specvp12 sw-03
min: 278 avg: 298.5 median: 298.5 (74%) max: 319 fps
specvp12 snx-02 + AMD Radeon RX 7900 GRE SPECviewperf 12 - specvp12 snx-02
min: 335 avg: 338 median: 338 (50%) max: 341 fps
specvp12 showcase-01 + AMD Radeon RX 7900 GRE SPECviewperf 12 - specvp12 showcase-01
min: 220 avg: 221 median: 221 (48%) max: 222 fps
specvp12 mediacal-01 + AMD Radeon RX 7900 GRE SPECviewperf 12 - specvp12 mediacal-01
min: 213 avg: 219.5 median: 219.5 (56%) max: 226 fps
specvp12 maya-04 + AMD Radeon RX 7900 GRE SPECviewperf 12 - specvp12 maya-04
min: 273 avg: 298 median: 298 (81%) max: 323 fps
specvp12 energy-01 + AMD Radeon RX 7900 GRE SPECviewperf 12 - specvp12 energy-01
min: 39.3 avg: 39.8 median: 39.8 (36%) max: 40.3 fps
specvp12 creo-01 + AMD Radeon RX 7900 GRE SPECviewperf 12 - specvp12 creo-01
min: 134 avg: 144.5 median: 144.5 (58%) max: 155 fps
specvp12 catia-04 + AMD Radeon RX 7900 GRE SPECviewperf 12 - specvp12 catia-04
min: 401 avg: 424.5 median: 424.5 (70%) max: 448 fps
specvp12 3dsmax-05 + AMD Radeon RX 7900 GRE SPECviewperf 12 - specvp12 3dsmax-05
min: 414 avg: 429 median: 429 (75%) max: 444 fps
SPECviewperf 13 specvp13 sw-04 + AMD Radeon RX 7900 GRE SPECviewperf 13 - specvp13 sw-04
min: 248 avg: 267.5 median: 267.5 (72%) max: 287 fps
specvp13 snx-03 + AMD Radeon RX 7900 GRE SPECviewperf 13 - specvp13 snx-03
min: 600 avg: 609 median: 608.5 (68%) max: 617 fps
specvp13 showcase-02 + AMD Radeon RX 7900 GRE SPECviewperf 13 - specvp13 showcase-02
min: 218 avg: 219.5 median: 219.5 (48%) max: 221 fps
specvp13 medical-02 + AMD Radeon RX 7900 GRE SPECviewperf 13 - specvp13 medical-02
min: 349 avg: 360.5 median: 360.5 (75%) max: 372 fps
specvp13 maya-05 + AMD Radeon RX 7900 GRE SPECviewperf 13 - specvp13 maya-05
min: 535 avg: 558 median: 557.5 (63%) max: 580 fps
specvp13 energy-02 + AMD Radeon RX 7900 GRE SPECviewperf 13 - specvp13 energy-02
min: 147 avg: 148.5 median: 148.5 (48%) max: 150 fps
specvp13 creo-02 + AMD Radeon RX 7900 GRE SPECviewperf 13 - specvp13 creo-02
min: 448 avg: 459 median: 459 (67%) max: 470 fps
specvp13 catia-05 + AMD Radeon RX 7900 GRE SPECviewperf 13 - specvp13 catia-05
min: 590 avg: 626 median: 625.5 (70%) max: 661 fps
specvp13 3dsmax-06 + AMD Radeon RX 7900 GRE SPECviewperf 13 - specvp13 3dsmax-06
min: 412 avg: 425.5 median: 425.5 (74%) max: 439 fps
SPECviewperf 2020 specvp2020 solidworks-05 4k + AMD Radeon RX 7900 GRE SPECviewperf 2020 - specvp2020 solidworks-05 4k
193 fps (57%)
specvp2020 snx-04 4k + AMD Radeon RX 7900 GRE SPECviewperf 2020 - specvp2020 snx-04 4k
min: 395 avg: 398.5 median: 398.5 (41%) max: 402 fps
specvp2020 medical-03 4k + AMD Radeon RX 7900 GRE SPECviewperf 2020 - specvp2020 medical-03 4k
min: 71.1 avg: 73.6 median: 73.6 (70%) max: 76.1 fps
specvp2020 maya-06 4k + AMD Radeon RX 7900 GRE SPECviewperf 2020 - specvp2020 maya-06 4k
min: 339 avg: 342.5 median: 342.5 (56%) max: 346 fps
specvp2020 energy-03 4k + AMD Radeon RX 7900 GRE SPECviewperf 2020 - specvp2020 energy-03 4k
min: 86.4 avg: 109.7 median: 109.7 (24%) max: 133 fps
specvp2020 creo-03 4k + AMD Radeon RX 7900 GRE SPECviewperf 2020 - specvp2020 creo-03 4k
min: 147 avg: 153 median: 153 (73%) max: 159 fps
specvp2020 catia-06 4k + AMD Radeon RX 7900 GRE SPECviewperf 2020 - specvp2020 catia-06 4k
min: 102 avg: 104.5 median: 104.5 (68%) max: 107 fps
specvp2020 3dsmax-07 4k + AMD Radeon RX 7900 GRE SPECviewperf 2020 - specvp2020 3dsmax-07 4k
min: 129 avg: 131.5 median: 131.5 (55%) max: 134 fps
Cinebench R10 Cinebench R10 Shading (32bit) + AMD Radeon RX 7900 GRE Cinebench R10 - Cinebench R10 Shading (32bit)
min: 20581 avg: 23019 median: 23018.5 (16%) max: 25456 Points
Cinebench R15 + Apple M3 Pro 14-Core GPU Cinebench R15 - Cinebench R15 OpenGL 64 Bit
129.9 fps (8%)
Cinebench R15 OpenGL 64 Bit + AMD Radeon RX 7900 GRE
min: 292.02 avg: 356.9 median: 356.9 (21%) max: 421.87 fps
GPU TDP 24 W TDP 260 W 36% 100%
Cinebench R15 OpenGL Ref. Match 64 Bit + Apple M3 Pro 14-Core GPU Cinebench R15 - Cinebench R15 OpenGL Ref. Match 64 Bit
99.5 % (100%)
Cinebench R15 OpenGL Ref. Match 64 Bit + AMD Radeon RX 7900 GRE
97.9 % (98%)
GPU TDP 24 W TDP 260 W 100% 98%
GFXBench - GFXBench 5.0 4K Aztec Ruins High Tier Offscreen
79 fps (32%)
GFXBench - GFXBench 5.0 Aztec Ruins High Tier Offscreen
178.7 fps (32%)
GFXBench - GFXBench 5.0 Aztec Ruins Normal Tier Offscreen
481.9 fps (36%)
GFXBench - GFXBench Car Chase Offscreen
376.3 fps (42%)
GFXBench 3.1 - GFXBench Manhattan ES 3.1 Offscreen
565 fps (12%)
GFXBench 3.0 - GFXBench 3.0 Manhattan Offscreen
818 fps (48%)
GFXBench (DX / GLBenchmark) 2.7 + Apple M3 Pro 14-Core GPU GFXBench (DX / GLBenchmark) 2.7 - GFXBench T-Rex HD Offscreen C24Z16
1299 fps (10%)
Basemark GPU 1.2 - Basemark GPU 1.2 Vulkan Official Medium Offscreen 1080
min: 104.6 avg: 976 median: 975.8 (6%) max: 1847 fps
Basemark GPU 1.2 - Basemark GPU 1.2 Vulkan Official High Offscreen 2160
min: 3.64 avg: 89 median: 89 (20%) max: 174.3 fps
Geekbench 6.2 - Geekbench 6.2 GPU OpenCL
42798 Points (12%)
min: 150110 avg: 155982 median: 155982 (45%) max: 161854 Points
GPU TDP 24 W TDP 260 W 27% 100%
Geekbench 6.2 - Geekbench 6.2 GPU Vulkan
min: 152526 avg: 155936 median: 155936 (51%) max: 159345 Points
Geekbench 6.2 - Geekbench 6.2 GPU Metal
68043 Points (44%)
LuxMark v2.0 64Bit - LuxMark v2.0 Room GPU
min: 3784 avg: 3880 median: 3880 (18%) max: 3976 Samples/s
LuxMark v2.0 64Bit - LuxMark v2.0 Sala GPU
min: 10837 avg: 11051 median: 11051 (19%) max: 11265 Samples/s
ComputeMark v2.1 - ComputeMark v2.1 Result
min: 46784 avg: 47021 median: 47020.5 (51%) max: 47257 Points
Power Consumption - Furmark Stress Test Power Consumption - external Monitor *
min: 356 avg: 387 median: 387 (55%) max: 418 Watt
Power Consumption - The Witcher 3 Power Consumption - external Monitor *
32.8 Watt (5%)
min: 385 avg: 412.5 median: 412.5 (58%) max: 440 Watt
GPU TDP 24 W TDP 260 W 225% 100%
Power Consumption - Witcher 3 Power Consumption *
42.8 Watt (9%)
Power Consumption - Witcher 3 ultra Power Efficiency
0.9 fps per Watt (82%)
Power Consumption - Witcher 3 ultra Power Efficiency - external Monitor
min: 1.189 avg: 1.2 median: 1.2 (99%) max: 1.207 fps per Watt
min: 0.4777 avg: 0.5 median: 0.5 (42%) max: 0.538 fps per Watt
GPU TDP 24 W TDP 260 W 100% 43%
Emissions Witcher 3 Fan Noise + Apple M3 Pro 14-Core GPU Emissions - Witcher 3 Fan Noise
25.1 dB(A) (40%)
Average Benchmarks Apple M3 Pro 14-Core GPU → 100% n=3 Average Benchmarks AMD Radeon RX 7900 GRE → 246% n=3
- Range of benchmark values for this graphics card
- Average benchmark values for this graphics card
* Smaller numbers mean a higher performance
1 This benchmark is not used for the average calculation
Game Benchmarks The following benchmarks stem from our benchmarks of review laptops. The performance depends on the used graphics memory, clock rate, processor, system settings, drivers, and operating systems. So the results don't have to be representative for all laptops with this GPU. For detailed information on the benchmark results, click on the fps number.
100%
M3 Pro 14-Core GPU:
193 fps
100%
M3 Pro 14-Core GPU:
125 fps
100%
M3 Pro 14-Core GPU:
67 fps
100%
M3 Pro 14-Core GPU:
53 fps
100%
M3 Pro 14-Core GPU:
35 fps
Radeon RX 7900 GRE:
192.4 [X] AMD Ryzen 9 7950X 4.5GHz
Radeon RX 7900 GRE
min:
85.2 fps, P0.1:
141.2 fps, P1:
151.6 fps, max:
240 fps
193 [X] AMD Ryzen 7 5700X 3.4GHz
Radeon RX 7900 GRE
min:
82.9 fps, P0.1:
140 fps, P1:
149.2 fps, max:
247 fps
~ 193 fps
Radeon RX 7900 GRE:
189.5 [X] AMD Ryzen 9 7950X 4.5GHz
Radeon RX 7900 GRE
min:
91.3 fps, P0.1:
141.2 fps, P1:
154 fps, max:
232 fps
191.1 [X] AMD Ryzen 7 5700X 3.4GHz
Radeon RX 7900 GRE
min:
83.6 fps, P0.1:
136.5 fps, P1:
147.8 fps, max:
243 fps
~ 190 fps
Radeon RX 7900 GRE:
182.9 [X] AMD Ryzen 9 7950X 4.5GHz
Radeon RX 7900 GRE
min:
86.3 fps, P0.1:
138.4 fps, P1:
149.9 fps, max:
218 fps
184.8 [X] AMD Ryzen 7 5700X 3.4GHz
Radeon RX 7900 GRE
min:
84.7 fps, P0.1:
116.1 fps, P1:
133.9 fps, max:
232 fps
~ 184 fps
Radeon RX 7900 GRE:
178.4 [X] AMD Ryzen 9 7950X 4.5GHz
Radeon RX 7900 GRE
min:
84.6 fps, P0.1:
131.3 fps, P1:
142.8 fps, max:
221 fps
185.2 [X] AMD Ryzen 7 5700X 3.4GHz
Radeon RX 7900 GRE
min:
66.2 fps, P0.1:
123.6 fps, P1:
141.8 fps, max:
230 fps
~ 182 fps
Radeon RX 7900 GRE:
140.6 [X] AMD Ryzen 7 5700X 3.4GHz
Radeon RX 7900 GRE
min:
61.4 fps, P0.1:
108.3 fps, P1:
119.3 fps, max:
201 fps
142.3 [X] AMD Ryzen 9 7950X 4.5GHz
Radeon RX 7900 GRE
min:
57 fps, P0.1:
85.2 fps, P1:
120.9 fps, max:
198.8 fps
~ 141 fps
Radeon RX 7900 GRE:
76.6 [X] AMD Ryzen 7 5700X 3.4GHz
Radeon RX 7900 GRE
min:
58.9 fps, P0.1:
65.5 fps, P1:
67.3 fps, max:
106.8 fps
78.4 [X] AMD Ryzen 9 7950X 4.5GHz
Radeon RX 7900 GRE
min:
34.6 fps, P0.1:
64.2 fps, P1:
70.1 fps, max:
134.6 fps
~ 78 fps
Radeon RX 7900 GRE:
197 [X] AMD Ryzen 7 5700X 3.4GHz
Radeon RX 7900 GRE
min:
27.2 fps, P0.1:
55.3 fps, P1:
119.3 fps, max:
391 fps
235 [X] AMD Ryzen 9 7950X 4.5GHz
Radeon RX 7900 GRE
min:
91.4 fps, P0.1:
142.6 fps, P1:
179.4 fps, max:
355 fps
~ 216 fps
Radeon RX 7900 GRE:
177.2 [X] AMD Ryzen 7 5700X 3.4GHz
Radeon RX 7900 GRE
min:
52.5 fps, P0.1:
82.7 fps, P1:
116.2 fps, max:
287 fps
204 [X] AMD Ryzen 9 7950X 4.5GHz
Radeon RX 7900 GRE
min:
59.3 fps, P0.1:
130.2 fps, P1:
171 fps, max:
294 fps
~ 191 fps
100%
M3 Pro 14-Core GPU:
42 fps
398%
Radeon RX 7900 GRE:
158 [X] AMD Ryzen 7 5700X 3.4GHz
Radeon RX 7900 GRE
min:
66.6 fps, P0.1:
84.3 fps, P1:
109.6 fps, max:
232 fps
175.3 [X] AMD Ryzen 9 7950X 4.5GHz
Radeon RX 7900 GRE
min:
101.2 fps, P0.1:
127.5 fps, P1:
152 fps, max:
319 fps
~ 167 fps
100%
M3 Pro 14-Core GPU:
39 fps
423%
Radeon RX 7900 GRE:
159.8 [X] AMD Ryzen 7 5700X 3.4GHz
Radeon RX 7900 GRE
min:
32.4 fps, P0.1:
49.8 fps, P1:
99.7 fps, max:
249 fps
170.3 [X] AMD Ryzen 9 7950X 4.5GHz
Radeon RX 7900 GRE
min:
52 fps, P0.1:
135.2 fps, P1:
151.1 fps, max:
306 fps
~ 165 fps
Radeon RX 7900 GRE:
120.6 [X] AMD Ryzen 7 5700X 3.4GHz
Radeon RX 7900 GRE
min:
38.1 fps, P0.1:
62.5 fps, P1:
98.9 fps, max:
223 fps
124.5 [X] AMD Ryzen 9 7950X 4.5GHz
Radeon RX 7900 GRE
min:
93.5 fps, P0.1:
103 fps, P1:
110.3 fps, max:
168.4 fps
~ 123 fps
Radeon RX 7900 GRE:
65.8 [X] AMD Ryzen 7 5700X 3.4GHz
Radeon RX 7900 GRE
min:
37 fps, P0.1:
50.9 fps, P1:
58 fps, max:
84.2 fps
67.6 [X] AMD Ryzen 9 7950X 4.5GHz
Radeon RX 7900 GRE
min:
56.5 fps, P0.1:
58.5 fps, P1:
60.5 fps, max:
82.7 fps
~ 67 fps
Radeon RX 7900 GRE:
146.8 [X] AMD Ryzen 7 5700X 3.4GHz
Radeon RX 7900 GRE
min:
81.1 fps, P0.1:
98.7 fps, P1:
113.9 fps, max:
189.3 fps
175.3 [X] AMD Ryzen 9 7950X 4.5GHz
Radeon RX 7900 GRE
min:
145.1 fps, P0.1:
150.2 fps, P1:
156.1 fps, max:
202 fps
~ 161 fps
Radeon RX 7900 GRE:
134.9 [X] AMD Ryzen 7 5700X 3.4GHz
Radeon RX 7900 GRE
min:
72.7 fps, P0.1:
94.1 fps, P1:
107.7 fps, max:
168.5 fps
151.9 [X] AMD Ryzen 9 7950X 4.5GHz
Radeon RX 7900 GRE
min:
122.9 fps, P0.1:
129.6 fps, P1:
134.9 fps, max:
190.4 fps
~ 143 fps
Radeon RX 7900 GRE:
114.9 [X] AMD Ryzen 7 5700X 3.4GHz
Radeon RX 7900 GRE
min:
64.3 fps, P0.1:
69 fps, P1:
79.3 fps, max:
155 fps
127.6 [X] AMD Ryzen 9 7950X 4.5GHz
Radeon RX 7900 GRE
min:
95.5 fps, P0.1:
97.3 fps, P1:
105.5 fps, max:
161.6 fps
~ 121 fps
Radeon RX 7900 GRE:
100 [X] AMD Ryzen 7 5700X 3.4GHz
Radeon RX 7900 GRE
min:
51.4 fps, P0.1:
59.3 fps, P1:
67 fps, max:
151.2 fps
112.3 [X] AMD Ryzen 9 7950X 4.5GHz
Radeon RX 7900 GRE
min:
85.4 fps, P0.1:
86.6 fps, P1:
91.4 fps, max:
147.6 fps
~ 106 fps
Radeon RX 7900 GRE:
84.5 [X] AMD Ryzen 7 5700X 3.4GHz
Radeon RX 7900 GRE
min:
49.9 fps, P0.1:
56.8 fps, P1:
61.7 fps, max:
115 fps
91.5 [X] AMD Ryzen 9 7950X 4.5GHz
Radeon RX 7900 GRE
min:
70.4 fps, P0.1:
71.1 fps, P1:
74.5 fps, max:
118.2 fps
~ 88 fps
Radeon RX 7900 GRE:
57.6 [X] AMD Ryzen 7 5700X 3.4GHz
Radeon RX 7900 GRE
min:
39.5 fps, P0.1:
42.6 fps, P1:
44.1 fps, max:
80.6 fps
60.2 [X] AMD Ryzen 9 7950X 4.5GHz
Radeon RX 7900 GRE
min:
44.2 fps, P0.1:
44.3 fps, P1:
45.3 fps, max:
85.6 fps
~ 59 fps
Radeon RX 7900 GRE:
384 [X] 1016022
AMD Ryzen 7 5700X 3.4GHz
Radeon RX 7900 GRE
min:
261 fps, P1:
218 fps, max:
486 fps
523 [X] 1016022
AMD Ryzen 9 7950X 4.5GHz
Radeon RX 7900 GRE
min:
395 fps, P1:
327 fps, max:
642 fps
~ 454 fps
Radeon RX 7900 GRE:
399 [X] 1016022
AMD Ryzen 7 5700X 3.4GHz
Radeon RX 7900 GRE
min:
257 fps, P1:
221 fps, max:
476 fps
487 [X] 1016022
AMD Ryzen 9 7950X 4.5GHz
Radeon RX 7900 GRE
min:
384 fps, P1:
340 fps, max:
555 fps
~ 443 fps
Radeon RX 7900 GRE:
331 [X] 1016022
AMD Ryzen 7 5700X 3.4GHz
Radeon RX 7900 GRE
min:
234 fps, P1:
207 fps, max:
384 fps
367 [X] 1016022
AMD Ryzen 9 7950X 4.5GHz
Radeon RX 7900 GRE
min:
324 fps, P1:
276 fps, max:
411 fps
~ 349 fps
Radeon RX 7900 GRE:
93.3 [X] 1016022
AMD Ryzen 7 5700X 3.4GHz
Radeon RX 7900 GRE
min:
62 fps, P1:
62 fps, max:
114 fps
97.6 [X] 1016022
AMD Ryzen 9 7950X 4.5GHz
Radeon RX 7900 GRE
min:
67 fps, P1:
65 fps, max:
119 fps
~ 95 fps
Radeon RX 7900 GRE:
62.1 [X] 1016022
AMD Ryzen 7 5700X 3.4GHz
Radeon RX 7900 GRE
min:
40 fps, P1:
39 fps, max:
77 fps
64.1 [X] 1016022
AMD Ryzen 9 7950X 4.5GHz
Radeon RX 7900 GRE
min:
41 fps, P1:
40 fps, max:
79 fps
~ 63 fps
Radeon RX 7900 GRE:
31.6 [X] 1016022
AMD Ryzen 7 5700X 3.4GHz
Radeon RX 7900 GRE
min:
18 fps, P1:
19 fps, max:
38 fps
32.1 [X] 1016022
AMD Ryzen 9 7950X 4.5GHz
Radeon RX 7900 GRE
min:
19 fps, P1:
19 fps, max:
39 fps
~ 32 fps
Radeon RX 7900 GRE:
377 [X] AMD Ryzen 7 5700X 3.4GHz
Radeon RX 7900 GRE
min:
75.4 fps, P0.1:
165.5 fps, P1:
233 fps, max:
568 fps
382 [X] AMD Ryzen 9 7950X 4.5GHz
Radeon RX 7900 GRE
min:
172.1 fps, P0.1:
205 fps, P1:
288 fps, max:
705 fps
~ 380 fps
Radeon RX 7900 GRE:
344 [X] AMD Ryzen 7 5700X 3.4GHz
Radeon RX 7900 GRE
min:
29.4 fps, P0.1:
105.6 fps, P1:
212 fps, max:
512 fps
364 [X] AMD Ryzen 9 7950X 4.5GHz
Radeon RX 7900 GRE
min:
43.5 fps, P0.1:
204 fps, P1:
284 fps, max:
601 fps
~ 354 fps
Radeon RX 7900 GRE:
312 [X] AMD Ryzen 7 5700X 3.4GHz
Radeon RX 7900 GRE
min:
68.6 fps, P0.1:
119.4 fps, P1:
203 fps, max:
513 fps
330 [X] AMD Ryzen 9 7950X 4.5GHz
Radeon RX 7900 GRE
min:
43.8 fps, P0.1:
198.3 fps, P1:
256 fps, max:
573 fps
~ 321 fps
Radeon RX 7900 GRE:
273 [X] AMD Ryzen 7 5700X 3.4GHz
Radeon RX 7900 GRE
min:
35.9 fps, P0.1:
73.8 fps, P1:
179.3 fps, max:
459 fps
294 [X] AMD Ryzen 9 7950X 4.5GHz
Radeon RX 7900 GRE
min:
72.2 fps, P0.1:
174.3 fps, P1:
223 fps, max:
537 fps
~ 284 fps
Radeon RX 7900 GRE:
199 [X] AMD Ryzen 7 5700X 3.4GHz
Radeon RX 7900 GRE
min:
62.5 fps, P0.1:
109.8 fps, P1:
150.8 fps, max:
424 fps
205 [X] AMD Ryzen 9 7950X 4.5GHz
Radeon RX 7900 GRE
min:
126.3 fps, P0.1:
135 fps, P1:
161.6 fps, max:
390 fps
~ 202 fps
Radeon RX 7900 GRE:
97.3 [X] AMD Ryzen 7 5700X 3.4GHz
Radeon RX 7900 GRE
min:
43.5 fps, P0.1:
48.2 fps, P1:
80.8 fps, max:
341 fps
99.4 [X] AMD Ryzen 9 7950X 4.5GHz
Radeon RX 7900 GRE
min:
49.6 fps, P0.1:
76.4 fps, P1:
85.8 fps, max:
488 fps
~ 98 fps
Radeon RX 7900 GRE:
107.2 [X] AMD Ryzen 7 5700X 3.4GHz
Radeon RX 7900 GRE
min:
33.2 fps, P0.1:
49.9 fps, P1:
80.8 fps, max:
137.6 fps
155.5 [X] AMD Ryzen 9 7950X 4.5GHz
Radeon RX 7900 GRE
min:
28.5 fps, P0.1:
72.5 fps, P1:
127.5 fps, max:
193.5 fps
~ 131 fps
Radeon RX 7900 GRE:
102.9 [X] AMD Ryzen 7 5700X 3.4GHz
Radeon RX 7900 GRE
min:
38.7 fps, P0.1:
43.2 fps, P1:
70.1 fps, max:
130.9 fps
147.1 [X] AMD Ryzen 9 7950X 4.5GHz
Radeon RX 7900 GRE
min:
26.8 fps, P0.1:
57.4 fps, P1:
112.5 fps, max:
189.3 fps
~ 125 fps
Radeon RX 7900 GRE:
97.8 [X] AMD Ryzen 7 5700X 3.4GHz
Radeon RX 7900 GRE
min:
27.9 fps, P0.1:
43.9 fps, P1:
65.6 fps, max:
128.7 fps
136.1 [X] AMD Ryzen 9 7950X 4.5GHz
Radeon RX 7900 GRE
min:
30.3 fps, P0.1:
61.8 fps, P1:
100.9 fps, max:
172.1 fps
~ 117 fps
Radeon RX 7900 GRE:
97.7 [X] AMD Ryzen 7 5700X 3.4GHz
Radeon RX 7900 GRE
min:
25.8 fps, P0.1:
41.7 fps, P1:
69.4 fps, max:
125.1 fps
128.1 [X] AMD Ryzen 9 7950X 4.5GHz
Radeon RX 7900 GRE
min:
22.4 fps, P0.1:
47.5 fps, P1:
97.4 fps, max:
176.2 fps
~ 113 fps
Radeon RX 7900 GRE:
83.5 [X] AMD Ryzen 7 5700X 3.4GHz
Radeon RX 7900 GRE
min:
22.7 fps, P0.1:
37.2 fps, P1:
60.5 fps, max:
116.2 fps
85.5 [X] AMD Ryzen 9 7950X 4.5GHz
Radeon RX 7900 GRE
min:
23.2 fps, P0.1:
35.9 fps, P1:
65.1 fps, max:
165.3 fps
~ 85 fps
Radeon RX 7900 GRE:
39.9 [X] AMD Ryzen 7 5700X 3.4GHz
Radeon RX 7900 GRE
min:
22.8 fps, P0.1:
30.4 fps, P1:
31.6 fps, max:
109.7 fps
42.4 [X] AMD Ryzen 9 7950X 4.5GHz
Radeon RX 7900 GRE
min:
25.3 fps, P0.1:
27 fps, P1:
33.1 fps, max:
105.1 fps
~ 41 fps
Radeon RX 7900 GRE:
248 [X] AMD Ryzen 7 5700X 3.4GHz
Radeon RX 7900 GRE
min:
17 fps, P0.1:
113.1 fps, P1:
178.6 fps, max:
349 fps
377 [X] AMD Ryzen 9 7950X 4.5GHz
Radeon RX 7900 GRE
min:
19.5 fps, P0.1:
184.3 fps, P1:
278 fps, max:
534 fps
~ 313 fps
Radeon RX 7900 GRE:
239 [X] AMD Ryzen 7 5700X 3.4GHz
Radeon RX 7900 GRE
min:
15.1 fps, P0.1:
122.7 fps, P1:
167.7 fps, max:
350 fps
368 [X] AMD Ryzen 9 7950X 4.5GHz
Radeon RX 7900 GRE
min:
12 fps, P0.1:
29.6 fps, P1:
249 fps, max:
511 fps
~ 304 fps
Radeon RX 7900 GRE:
206 [X] AMD Ryzen 7 5700X 3.4GHz
Radeon RX 7900 GRE
min:
85.1 fps, P0.1:
115.5 fps, P1:
143.2 fps, max:
315 fps
298 [X] AMD Ryzen 9 7950X 4.5GHz
Radeon RX 7900 GRE
min:
120.3 fps, P0.1:
176 fps, P1:
206 fps, max:
438 fps
~ 252 fps
Radeon RX 7900 GRE:
172.2 [X] AMD Ryzen 7 5700X 3.4GHz
Radeon RX 7900 GRE
min:
12 fps, P0.1:
16.9 fps, P1:
101.5 fps, max:
297 fps
207 [X] AMD Ryzen 9 7950X 4.5GHz
Radeon RX 7900 GRE
min:
16.9 fps, P0.1:
22.8 fps, P1:
124.3 fps, max:
404 fps
~ 190 fps
Radeon RX 7900 GRE:
151.5 [X] AMD Ryzen 7 5700X 3.4GHz
Radeon RX 7900 GRE
min:
73.4 fps, P0.1:
84.5 fps, P1:
102.1 fps, max:
261 fps
155.1 [X] AMD Ryzen 9 7950X 4.5GHz
Radeon RX 7900 GRE
min:
81.8 fps, P0.1:
82.5 fps, P1:
86.7 fps, max:
404 fps
~ 153 fps
Radeon RX 7900 GRE:
84.9 [X] AMD Ryzen 7 5700X 3.4GHz
Radeon RX 7900 GRE
min:
43.6 fps, P0.1:
44.3 fps, P1:
49.4 fps, max:
226 fps
88.6 [X] AMD Ryzen 9 7950X 4.5GHz
Radeon RX 7900 GRE
min:
42.8 fps, P0.1:
43.9 fps, P1:
46 fps, max:
345 fps
~ 87 fps
Radeon RX 7900 GRE:
117.2 [X] AMD Ryzen 7 5700X 3.4GHz
Radeon RX 7900 GRE
min:
30.2 fps, P0.1:
54 fps, P1:
75.9 fps, max:
215 fps
171.9 [X] AMD Ryzen 9 7950X 4.5GHz
Radeon RX 7900 GRE
min:
50.6 fps, P0.1:
103.8 fps, P1:
119.3 fps, max:
260 fps
~ 145 fps
Radeon RX 7900 GRE:
108 [X] AMD Ryzen 7 5700X 3.4GHz
Radeon RX 7900 GRE
min:
39.7 fps, P0.1:
47.9 fps, P1:
68.4 fps, max:
184 fps
151.1 [X] AMD Ryzen 9 7950X 4.5GHz
Radeon RX 7900 GRE
min:
41.1 fps, P0.1:
97.3 fps, P1:
113.3 fps, max:
242 fps
~ 130 fps
Radeon RX 7900 GRE:
106 [X] AMD Ryzen 7 5700X 3.4GHz
Radeon RX 7900 GRE
min:
39.9 fps, P0.1:
48.6 fps, P1:
66.4 fps, max:
185.9 fps
143.3 [X] AMD Ryzen 9 7950X 4.5GHz
Radeon RX 7900 GRE
min:
36.6 fps, P0.1:
87.9 fps, P1:
107.8 fps, max:
218 fps
~ 125 fps
Radeon RX 7900 GRE:
102.9 [X] AMD Ryzen 7 5700X 3.4GHz
Radeon RX 7900 GRE
min:
19.2 fps, P0.1:
45.6 fps, P1:
69.5 fps, max:
168.8 fps
126.5 [X] AMD Ryzen 9 7950X 4.5GHz
Radeon RX 7900 GRE
min:
32.9 fps, P0.1:
77.5 fps, P1:
100.3 fps, max:
193.1 fps
~ 115 fps
Radeon RX 7900 GRE:
84.7 [X] AMD Ryzen 7 5700X 3.4GHz
Radeon RX 7900 GRE
min:
32.6 fps, P0.1:
49.8 fps, P1:
68.2 fps, max:
122.2 fps
88.9 [X] AMD Ryzen 9 7950X 4.5GHz
Radeon RX 7900 GRE
min:
47.9 fps, P0.1:
70.5 fps, P1:
73 fps, max:
122.7 fps
~ 87 fps
Radeon RX 7900 GRE:
43 [X] AMD Ryzen 7 5700X 3.4GHz
Radeon RX 7900 GRE
min:
34 fps, P0.1:
34.5 fps, P1:
35.8 fps, max:
57.6 fps
44.8 [X] AMD Ryzen 9 7950X 4.5GHz
Radeon RX 7900 GRE
min:
36 fps, P0.1:
36.2 fps, P1:
37 fps, max:
60.5 fps
~ 44 fps
Radeon RX 7900 GRE:
204 [X] AMD Ryzen 7 5700X 3.4GHz
Radeon RX 7900 GRE
min:
5.94 fps, P0.1:
61.2 fps, P1:
129.8 fps, max:
343 fps
264 [X] AMD Ryzen 9 7950X 4.5GHz
Radeon RX 7900 GRE
min:
4.59 fps, P0.1:
36.4 fps, P1:
201 fps, max:
381 fps
~ 234 fps
Radeon RX 7900 GRE:
200 [X] AMD Ryzen 7 5700X 3.4GHz
Radeon RX 7900 GRE
min:
17.1 fps, P0.1:
67.9 fps, P1:
142.5 fps, max:
268 fps
217 [X] AMD Ryzen 9 7950X 4.5GHz
Radeon RX 7900 GRE
min:
22.4 fps, P0.1:
95.5 fps, P1:
188.7 fps, max:
281 fps
~ 209 fps
Radeon RX 7900 GRE:
180.7 [X] AMD Ryzen 7 5700X 3.4GHz
Radeon RX 7900 GRE
min:
16.6 fps, P0.1:
63.4 fps, P1:
140.2 fps, max:
242 fps
190.8 [X] AMD Ryzen 9 7950X 4.5GHz
Radeon RX 7900 GRE
min:
23 fps, P0.1:
100.8 fps, P1:
167 fps, max:
279 fps
~ 186 fps
Radeon RX 7900 GRE:
110.2 [X] AMD Ryzen 7 5700X 3.4GHz
Radeon RX 7900 GRE
min:
14.1 fps, P0.1:
29.8 fps, P1:
55.7 fps, max:
154.7 fps
133.8 [X] AMD Ryzen 9 7950X 4.5GHz
Radeon RX 7900 GRE
min:
22 fps, P0.1:
47.9 fps, P1:
104.9 fps, max:
171.7 fps
~ 122 fps
Radeon RX 7900 GRE:
100.6 [X] AMD Ryzen 7 5700X 3.4GHz
Radeon RX 7900 GRE
min:
14.6 fps, P0.1:
32.1 fps, P1:
67.6 fps, max:
125.5 fps
109.2 [X] AMD Ryzen 9 7950X 4.5GHz
Radeon RX 7900 GRE
min:
23.3 fps, P0.1:
50.1 fps, P1:
86 fps, max:
139.2 fps
~ 105 fps
Radeon RX 7900 GRE:
62.4 [X] AMD Ryzen 7 5700X 3.4GHz
Radeon RX 7900 GRE
min:
15.3 fps, P0.1:
30 fps, P1:
51.1 fps, max:
87.1 fps
64.8 [X] AMD Ryzen 9 7950X 4.5GHz
Radeon RX 7900 GRE
min:
23.3 fps, P0.1:
35.8 fps, P1:
55.5 fps, max:
87.5 fps
~ 64 fps
Radeon RX 7900 GRE:
296.5 [X] AMD Ryzen 7 5700X 3.4GHz
Radeon RX 7900 GRE
352.2 [X] AMD Ryzen 9 7950X 4.5GHz
Radeon RX 7900 GRE
~ 324 fps
Radeon RX 7900 GRE:
261.4 [X] AMD Ryzen 7 5700X 3.4GHz
Radeon RX 7900 GRE
313.9 [X] AMD Ryzen 9 7950X 4.5GHz
Radeon RX 7900 GRE
~ 288 fps
Radeon RX 7900 GRE:
220.5 [X] AMD Ryzen 7 5700X 3.4GHz
Radeon RX 7900 GRE
260.7 [X] AMD Ryzen 9 7950X 4.5GHz
Radeon RX 7900 GRE
~ 241 fps
Radeon RX 7900 GRE:
220.4 [X] AMD Ryzen 7 5700X 3.4GHz
Radeon RX 7900 GRE
248.7 [X] AMD Ryzen 9 7950X 4.5GHz
Radeon RX 7900 GRE
~ 235 fps
Radeon RX 7900 GRE:
185.4 [X] AMD Ryzen 7 5700X 3.4GHz
Radeon RX 7900 GRE
193.4 [X] AMD Ryzen 9 7950X 4.5GHz
Radeon RX 7900 GRE
~ 189 fps
Radeon RX 7900 GRE:
103.2 [X] AMD Ryzen 9 7950X 4.5GHz
Radeon RX 7900 GRE
105.8 [X] AMD Ryzen 7 5700X 3.4GHz
Radeon RX 7900 GRE
~ 105 fps
Radeon RX 7900 GRE:
107.6 [X] AMD Ryzen 7 5700X 3.4GHz
Radeon RX 7900 GRE
min:
50.5 fps, P0.1:
75.6 fps, P1:
86 fps, max:
140.2 fps
126.5 [X] AMD Ryzen 9 7950X 4.5GHz
Radeon RX 7900 GRE
min:
68.9 fps, P0.1:
94.2 fps, P1:
103.3 fps, max:
173.8 fps
~ 117 fps
Radeon RX 7900 GRE:
101.4 [X] AMD Ryzen 7 5700X 3.4GHz
Radeon RX 7900 GRE
min:
39.2 fps, P0.1:
75.9 fps, P1:
82.4 fps, max:
129.6 fps
123.6 [X] AMD Ryzen 9 7950X 4.5GHz
Radeon RX 7900 GRE
min:
48.3 fps, P0.1:
96.8 fps, P1:
103.6 fps, max:
163 fps
~ 113 fps
Radeon RX 7900 GRE:
98.4 [X] AMD Ryzen 7 5700X 3.4GHz
Radeon RX 7900 GRE
min:
49 fps, P0.1:
70.5 fps, P1:
79.1 fps, max:
134.4 fps
121.8 [X] AMD Ryzen 9 7950X 4.5GHz
Radeon RX 7900 GRE
min:
70.3 fps, P0.1:
92.4 fps, P1:
98.8 fps, max:
166.1 fps
~ 110 fps
Radeon RX 7900 GRE:
96.6 [X] AMD Ryzen 7 5700X 3.4GHz
Radeon RX 7900 GRE
min:
32.5 fps, P0.1:
71.9 fps, P1:
77.6 fps, max:
129.3 fps
119.2 [X] AMD Ryzen 9 7950X 4.5GHz
Radeon RX 7900 GRE
min:
45.4 fps, P0.1:
90.6 fps, P1:
98.8 fps, max:
155.2 fps
~ 108 fps
Radeon RX 7900 GRE:
94.9 [X] AMD Ryzen 7 5700X 3.4GHz
Radeon RX 7900 GRE
min:
47.3 fps, P0.1:
71.3 fps, P1:
76.9 fps, max:
126.8 fps
117.8 [X] AMD Ryzen 9 7950X 4.5GHz
Radeon RX 7900 GRE
min:
87.7 fps, P0.1:
91.8 fps, P1:
96.8 fps, max:
159.1 fps
~ 106 fps
Radeon RX 7900 GRE:
75 [X] AMD Ryzen 7 5700X 3.4GHz
Radeon RX 7900 GRE
min:
52.6 fps, P0.1:
54.6 fps, P1:
59.5 fps, max:
109.7 fps
78.2 [X] AMD Ryzen 9 7950X 4.5GHz
Radeon RX 7900 GRE
min:
42.3 fps, P0.1:
59 fps, P1:
61.8 fps, max:
107.4 fps
~ 77 fps
Radeon RX 7900 GRE:
263 [X] AMD Ryzen 7 5700X 3.4GHz
Radeon RX 7900 GRE
min:
115 fps, P0.1:
164.1 fps, P1:
211 fps, max:
321 fps
342 [X] AMD Ryzen 9 7950X 4.5GHz
Radeon RX 7900 GRE
min:
208 fps, P0.1:
260 fps, P1:
292 fps, max:
430 fps
~ 303 fps
Radeon RX 7900 GRE:
211 [X] AMD Ryzen 7 5700X 3.4GHz
Radeon RX 7900 GRE
min:
107.9 fps, P0.1:
127.4 fps, P1:
160.5 fps, max:
266 fps
252 [X] AMD Ryzen 9 7950X 4.5GHz
Radeon RX 7900 GRE
min:
149.4 fps, P0.1:
196.7 fps, P1:
215 fps, max:
332 fps
~ 232 fps
Radeon RX 7900 GRE:
147 [X] AMD Ryzen 7 5700X 3.4GHz
Radeon RX 7900 GRE
min:
83.1 fps, P0.1:
120 fps, P1:
129.7 fps, max:
208 fps
152.2 [X] AMD Ryzen 9 7950X 4.5GHz
Radeon RX 7900 GRE
min:
84 fps, P0.1:
132.7 fps, P1:
137.1 fps, max:
248 fps
~ 150 fps
Radeon RX 7900 GRE:
113.9 [X] AMD Ryzen 7 5700X 3.4GHz
Radeon RX 7900 GRE
min:
54.3 fps, P0.1:
86.5 fps, P1:
102.7 fps, max:
178.1 fps
119 [X] AMD Ryzen 9 7950X 4.5GHz
Radeon RX 7900 GRE
min:
65.7 fps, P0.1:
98 fps, P1:
106.9 fps, max:
222 fps
~ 116 fps
Radeon RX 7900 GRE:
93.5 [X] AMD Ryzen 7 5700X 3.4GHz
Radeon RX 7900 GRE
min:
55.7 fps, P0.1:
79.2 fps, P1:
84.7 fps, max:
148 fps
96.3 [X] AMD Ryzen 9 7950X 4.5GHz
Radeon RX 7900 GRE
min:
68.2 fps, P0.1:
86 fps, P1:
88.1 fps, max:
139.4 fps
~ 95 fps
Radeon RX 7900 GRE:
57.4 [X] AMD Ryzen 7 5700X 3.4GHz
Radeon RX 7900 GRE
min:
47 fps, P0.1:
51.1 fps, P1:
52.8 fps, max:
70.7 fps
58.8 [X] AMD Ryzen 9 7950X 4.5GHz
Radeon RX 7900 GRE
min:
51.7 fps, P0.1:
53.4 fps, P1:
54.6 fps, max:
68.3 fps
~ 58 fps
Radeon RX 7900 GRE:
184 [X] AMD Ryzen 7 5700X 3.4GHz
Radeon RX 7900 GRE
208 [X] AMD Ryzen 9 7950X 4.5GHz
Radeon RX 7900 GRE
~ 196 fps
Radeon RX 7900 GRE:
177 [X] AMD Ryzen 7 5700X 3.4GHz
Radeon RX 7900 GRE
200 [X] AMD Ryzen 9 7950X 4.5GHz
Radeon RX 7900 GRE
~ 189 fps
Radeon RX 7900 GRE:
151 [X] AMD Ryzen 7 5700X 3.4GHz
Radeon RX 7900 GRE
177 [X] AMD Ryzen 9 7950X 4.5GHz
Radeon RX 7900 GRE
~ 164 fps
Radeon RX 7900 GRE:
142 [X] AMD Ryzen 7 5700X 3.4GHz
Radeon RX 7900 GRE
150 [X] AMD Ryzen 9 7950X 4.5GHz
Radeon RX 7900 GRE
~ 146 fps
Radeon RX 7900 GRE:
111 [X] AMD Ryzen 7 5700X 3.4GHz
Radeon RX 7900 GRE
115 [X] AMD Ryzen 9 7950X 4.5GHz
Radeon RX 7900 GRE
~ 113 fps
Radeon RX 7900 GRE:
64 [X] AMD Ryzen 7 5700X 3.4GHz
Radeon RX 7900 GRE
67 [X] AMD Ryzen 9 7950X 4.5GHz
Radeon RX 7900 GRE
~ 66 fps
Radeon RX 7900 GRE:
144.6 [X] AMD Ryzen 7 5700X 3.4GHz
Radeon RX 7900 GRE
min:
45.1 fps, P0.1:
76.5 fps, P1:
108 fps, max:
178.3 fps
214 [X] AMD Ryzen 9 7950X 4.5GHz
Radeon RX 7900 GRE
min:
67.9 fps, P0.1:
144.3 fps, P1:
178.5 fps, max:
257 fps
~ 179 fps
Radeon RX 7900 GRE:
125.1 [X] AMD Ryzen 7 5700X 3.4GHz
Radeon RX 7900 GRE
min:
45.7 fps, P0.1:
54.7 fps, P1:
83.3 fps, max:
155.3 fps
188.3 [X] AMD Ryzen 9 7950X 4.5GHz
Radeon RX 7900 GRE
min:
56.5 fps, P0.1:
89 fps, P1:
126.7 fps, max:
235 fps
~ 157 fps
Radeon RX 7900 GRE:
107.6 [X] AMD Ryzen 7 5700X 3.4GHz
Radeon RX 7900 GRE
min:
43.1 fps, P0.1:
54.5 fps, P1:
70.9 fps, max:
138.5 fps
154.9 [X] AMD Ryzen 9 7950X 4.5GHz
Radeon RX 7900 GRE
min:
52.7 fps, P0.1:
73.9 fps, P1:
116.1 fps, max:
199.3 fps
~ 131 fps
Radeon RX 7900 GRE:
100.5 [X] AMD Ryzen 7 5700X 3.4GHz
Radeon RX 7900 GRE
min:
28.4 fps, P0.1:
37.7 fps, P1:
53.3 fps, max:
131.5 fps
118.1 [X] AMD Ryzen 9 7950X 4.5GHz
Radeon RX 7900 GRE
min:
33.4 fps, P0.1:
56.2 fps, P1:
87.6 fps, max:
167.9 fps
~ 109 fps
Radeon RX 7900 GRE:
79.9 [X] AMD Ryzen 7 5700X 3.4GHz
Radeon RX 7900 GRE
min:
23.6 fps, P0.1:
33.8 fps, P1:
50.4 fps, max:
120 fps
91.2 [X] AMD Ryzen 9 7950X 4.5GHz
Radeon RX 7900 GRE
min:
30.3 fps, P0.1:
49.4 fps, P1:
72 fps, max:
175.4 fps
~ 86 fps
Radeon RX 7900 GRE:
47.8 [X] AMD Ryzen 7 5700X 3.4GHz
Radeon RX 7900 GRE
min:
19.7 fps, P0.1:
21.9 fps, P1:
37.4 fps, max:
104.1 fps
50.9 [X] AMD Ryzen 9 7950X 4.5GHz
Radeon RX 7900 GRE
min:
24.1 fps, P0.1:
31.2 fps, P1:
42.6 fps, max:
154.6 fps
~ 49 fps
Radeon RX 7900 GRE:
137.2 [X] AMD Ryzen 7 5700X 3.4GHz
Radeon RX 7900 GRE
min:
23.6 fps, P0.1:
63.4 fps, P1:
76.1 fps, max:
231 fps
170 [X] AMD Ryzen 9 7950X 4.5GHz
Radeon RX 7900 GRE
min:
38.4 fps, P0.1:
78.9 fps, P1:
104.9 fps, max:
908 fps
~ 154 fps
Radeon RX 7900 GRE:
136.8 [X] AMD Ryzen 7 5700X 3.4GHz
Radeon RX 7900 GRE
min:
22.3 fps, P0.1:
54.4 fps, P1:
82 fps, max:
222 fps
163.6 [X] AMD Ryzen 9 7950X 4.5GHz
Radeon RX 7900 GRE
min:
35.2 fps, P0.1:
68.9 fps, P1:
101.3 fps, max:
306 fps
~ 150 fps
Radeon RX 7900 GRE:
125.4 [X] AMD Ryzen 7 5700X 3.4GHz
Radeon RX 7900 GRE
min:
21.4 fps, P0.1:
38.4 fps, P1:
72.4 fps, max:
210 fps
142.4 [X] AMD Ryzen 9 7950X 4.5GHz
Radeon RX 7900 GRE
min:
39.2 fps, P0.1:
69.9 fps, P1:
91.9 fps, max:
281 fps
~ 134 fps
Radeon RX 7900 GRE:
126.3 [X] AMD Ryzen 7 5700X 3.4GHz
Radeon RX 7900 GRE
min:
21.5 fps, P0.1:
61 fps, P1:
72.7 fps, max:
209 fps
141.7 [X] AMD Ryzen 9 7950X 4.5GHz
Radeon RX 7900 GRE
min:
39.7 fps, P0.1:
60.5 fps, P1:
90.9 fps, max:
272 fps
~ 134 fps
Radeon RX 7900 GRE:
94.8 [X] AMD Ryzen 7 5700X 3.4GHz
Radeon RX 7900 GRE
min:
25.6 fps, P0.1:
43.2 fps, P1:
58.5 fps, max:
181.6 fps
98.6 [X] AMD Ryzen 9 7950X 4.5GHz
Radeon RX 7900 GRE
min:
35.5 fps, P0.1:
41.3 fps, P1:
70 fps, max:
220 fps
~ 97 fps
Radeon RX 7900 GRE:
48.8 [X] AMD Ryzen 7 5700X 3.4GHz
Radeon RX 7900 GRE
min:
16.6 fps, P0.1:
26 fps, P1:
38 fps, max:
110 fps
49.8 [X] AMD Ryzen 9 7950X 4.5GHz
Radeon RX 7900 GRE
min:
30.2 fps, P0.1:
32.3 fps, P1:
40.1 fps, max:
132.3 fps
~ 49 fps
Radeon RX 7900 GRE:
234.8 [X] AMD Ryzen 7 5700X 3.4GHz
Radeon RX 7900 GRE
323.4 [X] AMD Ryzen 9 7950X 4.5GHz
Radeon RX 7900 GRE
~ 279 fps
Radeon RX 7900 GRE:
194.5 [X] AMD Ryzen 7 5700X 3.4GHz
Radeon RX 7900 GRE
282 [X] AMD Ryzen 9 7950X 4.5GHz
Radeon RX 7900 GRE
~ 238 fps
Radeon RX 7900 GRE:
170.1 [X] AMD Ryzen 7 5700X 3.4GHz
Radeon RX 7900 GRE
257.4 [X] AMD Ryzen 9 7950X 4.5GHz
Radeon RX 7900 GRE
~ 214 fps
Radeon RX 7900 GRE:
161.1 [X] AMD Ryzen 7 5700X 3.4GHz
Radeon RX 7900 GRE
217.7 [X] AMD Ryzen 9 7950X 4.5GHz
Radeon RX 7900 GRE
~ 189 fps
Radeon RX 7900 GRE:
144.5 [X] AMD Ryzen 7 5700X 3.4GHz
Radeon RX 7900 GRE
155.6 [X] AMD Ryzen 9 7950X 4.5GHz
Radeon RX 7900 GRE
~ 150 fps
Radeon RX 7900 GRE:
72.3 [X] AMD Ryzen 7 5700X 3.4GHz
Radeon RX 7900 GRE
75.5 [X] AMD Ryzen 9 7950X 4.5GHz
Radeon RX 7900 GRE
~ 74 fps
Radeon RX 7900 GRE:
257 [X] AMD Ryzen 7 5700X 3.4GHz
Radeon RX 7900 GRE
min:
69.6 fps, P0.1:
121 fps, P1:
170.8 fps, max:
351 fps
389 [X] AMD Ryzen 9 7950X 4.5GHz
Radeon RX 7900 GRE
min:
90.4 fps, P0.1:
224 fps, P1:
288 fps, max:
534 fps
~ 323 fps
Radeon RX 7900 GRE:
233 [X] AMD Ryzen 7 5700X 3.4GHz
Radeon RX 7900 GRE
min:
65.8 fps, P0.1:
97.3 fps, P1:
141.3 fps, max:
332 fps
312 [X] AMD Ryzen 9 7950X 4.5GHz
Radeon RX 7900 GRE
min:
63.3 fps, P0.1:
154.8 fps, P1:
199.7 fps, max:
455 fps
~ 273 fps
Radeon RX 7900 GRE:
198.7 [X] AMD Ryzen 7 5700X 3.4GHz
Radeon RX 7900 GRE
min:
68.1 fps, P0.1:
94.4 fps, P1:
127.5 fps, max:
290 fps
230 [X] AMD Ryzen 9 7950X 4.5GHz
Radeon RX 7900 GRE
min:
75.6 fps, P0.1:
118.8 fps, P1:
149 fps, max:
387 fps
~ 214 fps
Radeon RX 7900 GRE:
171.4 [X] AMD Ryzen 7 5700X 3.4GHz
Radeon RX 7900 GRE
min:
67.4 fps, P0.1:
82.6 fps, P1:
112.2 fps, max:
256 fps
179.4 [X] AMD Ryzen 9 7950X 4.5GHz
Radeon RX 7900 GRE
min:
85.3 fps, P0.1:
105.5 fps, P1:
120.5 fps, max:
351 fps
~ 175 fps
Radeon RX 7900 GRE:
108.8 [X] AMD Ryzen 7 5700X 3.4GHz
Radeon RX 7900 GRE
min:
55.5 fps, P0.1:
64.8 fps, P1:
72.2 fps, max:
241 fps
112.2 [X] AMD Ryzen 9 7950X 4.5GHz
Radeon RX 7900 GRE
min:
45 fps, P0.1:
46.4 fps, P1:
53.9 fps, max:
348 fps
~ 111 fps
Radeon RX 7900 GRE:
49.2 [X] AMD Ryzen 7 5700X 3.4GHz
Radeon RX 7900 GRE
min:
23.1 fps, P0.1:
23.7 fps, P1:
27.7 fps, max:
220 fps
50.5 [X] AMD Ryzen 9 7950X 4.5GHz
Radeon RX 7900 GRE
min:
20.9 fps, P0.1:
21.5 fps, P1:
25.2 fps, max:
343 fps
~ 50 fps
Radeon RX 7900 GRE:
180.1 [X] AMD Ryzen 7 5700X 3.4GHz
Radeon RX 7900 GRE
251.7 [X] AMD Ryzen 9 7950X 4.5GHz
Radeon RX 7900 GRE
~ 216 fps
Radeon RX 7900 GRE:
168.2 [X] AMD Ryzen 7 5700X 3.4GHz
Radeon RX 7900 GRE
221 [X] AMD Ryzen 9 7950X 4.5GHz
Radeon RX 7900 GRE
~ 195 fps
Radeon RX 7900 GRE:
160.7 [X] AMD Ryzen 7 5700X 3.4GHz
Radeon RX 7900 GRE
196.8 [X] AMD Ryzen 9 7950X 4.5GHz
Radeon RX 7900 GRE
~ 179 fps
Radeon RX 7900 GRE:
125.8 [X] AMD Ryzen 7 5700X 3.4GHz
Radeon RX 7900 GRE
133 [X] AMD Ryzen 9 7950X 4.5GHz
Radeon RX 7900 GRE
~ 129 fps
Radeon RX 7900 GRE:
103.4 [X] AMD Ryzen 7 5700X 3.4GHz
Radeon RX 7900 GRE
107.5 [X] AMD Ryzen 9 7950X 4.5GHz
Radeon RX 7900 GRE
~ 105 fps
Radeon RX 7900 GRE:
68.7 [X] AMD Ryzen 7 5700X 3.4GHz
Radeon RX 7900 GRE
70.1 [X] AMD Ryzen 9 7950X 4.5GHz
Radeon RX 7900 GRE
~ 69 fps
Radeon RX 7900 GRE:
124.9 [X] AMD Ryzen 7 5700X 3.4GHz
Radeon RX 7900 GRE
min:
58.4 fps, P0.1:
64.6 fps, P1:
92.6 fps, max:
217 fps
174.9 [X] AMD Ryzen 9 7950X 4.5GHz
Radeon RX 7900 GRE
min:
87.1 fps, P0.1:
103.7 fps, P1:
133.1 fps, max:
256 fps
~ 150 fps
Radeon RX 7900 GRE:
121 [X] AMD Ryzen 7 5700X 3.4GHz
Radeon RX 7900 GRE
min:
59.7 fps, P0.1:
61.8 fps, P1:
90 fps, max:
223 fps
162.6 [X] AMD Ryzen 9 7950X 4.5GHz
Radeon RX 7900 GRE
min:
79 fps, P0.1:
86.5 fps, P1:
125.4 fps, max:
252 fps
~ 142 fps
Radeon RX 7900 GRE:
116.8 [X] AMD Ryzen 7 5700X 3.4GHz
Radeon RX 7900 GRE
min:
55.2 fps, P0.1:
64.6 fps, P1:
87.5 fps, max:
173.7 fps
160.1 [X] AMD Ryzen 9 7950X 4.5GHz
Radeon RX 7900 GRE
min:
81.1 fps, P0.1:
86.6 fps, P1:
126 fps, max:
245 fps
~ 138 fps
Radeon RX 7900 GRE:
116.4 [X] AMD Ryzen 7 5700X 3.4GHz
Radeon RX 7900 GRE
min:
56.5 fps, P0.1:
67.1 fps, P1:
78.6 fps, max:
193.4 fps
144.4 [X] AMD Ryzen 9 7950X 4.5GHz
Radeon RX 7900 GRE
min:
80 fps, P0.1:
88.2 fps, P1:
116.5 fps, max:
238 fps
~ 130 fps
Radeon RX 7900 GRE:
111.9 [X] AMD Ryzen 7 5700X 3.4GHz
Radeon RX 7900 GRE
min:
58.2 fps, P0.1:
61.2 fps, P1:
80.9 fps, max:
162 fps
122.7 [X] AMD Ryzen 9 7950X 4.5GHz
Radeon RX 7900 GRE
min:
80.8 fps, P0.1:
85.2 fps, P1:
100.5 fps, max:
235 fps
~ 117 fps
Radeon RX 7900 GRE:
72 [X] AMD Ryzen 7 5700X 3.4GHz
Radeon RX 7900 GRE
min:
55.6 fps, P0.1:
57.9 fps, P1:
62.1 fps, max:
167.7 fps
73.1 [X] AMD Ryzen 9 7950X 4.5GHz
Radeon RX 7900 GRE
min:
60.7 fps, P0.1:
61 fps, P1:
62.7 fps, max:
175.6 fps
~ 73 fps
Radeon RX 7900 GRE:
115.8 [X] AMD Ryzen 7 5700X 3.4GHz
Radeon RX 7900 GRE
min:
51.2 fps, P0.1:
82.9 fps, P1:
95.2 fps, max:
157.5 fps
134.7 [X] AMD Ryzen 9 7950X 4.5GHz
Radeon RX 7900 GRE
min:
40.3 fps, P0.1:
113.3 fps, P1:
120.6 fps, max:
166.9 fps
~ 125 fps
Radeon RX 7900 GRE:
111.7 [X] AMD Ryzen 7 5700X 3.4GHz
Radeon RX 7900 GRE
min:
41.6 fps, P0.1:
84.2 fps, P1:
93.6 fps, max:
141.7 fps
131.5 [X] AMD Ryzen 9 7950X 4.5GHz
Radeon RX 7900 GRE
min:
63.8 fps, P0.1:
94.6 fps, P1:
116.4 fps, max:
161.5 fps
~ 122 fps
Radeon RX 7900 GRE:
110.6 [X] AMD Ryzen 7 5700X 3.4GHz
Radeon RX 7900 GRE
min:
50.1 fps, P0.1:
83.5 fps, P1:
91 fps, max:
134.7 fps
122 [X] AMD Ryzen 9 7950X 4.5GHz
Radeon RX 7900 GRE
min:
40.9 fps, P0.1:
87.9 fps, P1:
108 fps, max:
152.7 fps
~ 116 fps
Radeon RX 7900 GRE:
107 [X] AMD Ryzen 7 5700X 3.4GHz
Radeon RX 7900 GRE
min:
48.5 fps, P0.1:
81.8 fps, P1:
88.9 fps, max:
126.6 fps
114.8 [X] AMD Ryzen 9 7950X 4.5GHz
Radeon RX 7900 GRE
min:
73.1 fps, P0.1:
95.6 fps, P1:
102.2 fps, max:
162 fps
~ 111 fps
Radeon RX 7900 GRE:
87 [X] AMD Ryzen 7 5700X 3.4GHz
Radeon RX 7900 GRE
min:
54.3 fps, P0.1:
76.5 fps, P1:
79.7 fps, max:
104 fps
92.8 [X] AMD Ryzen 9 7950X 4.5GHz
Radeon RX 7900 GRE
min:
61.1 fps, P0.1:
83.1 fps, P1:
84.9 fps, max:
112.7 fps
~ 90 fps
Radeon RX 7900 GRE:
53.9 [X] AMD Ryzen 7 5700X 3.4GHz
Radeon RX 7900 GRE
min:
34.6 fps, P0.1:
49.8 fps, P1:
50.9 fps, max:
101.9 fps
56.4 [X] AMD Ryzen 9 7950X 4.5GHz
Radeon RX 7900 GRE
min:
30.5 fps, P0.1:
50.8 fps, P1:
52.5 fps, max:
173.7 fps
~ 55 fps
Radeon RX 7900 GRE:
176.1 [X] AMD Ryzen 7 5700X 3.4GHz
Radeon RX 7900 GRE
min:
89.6 fps, P0.1:
100 fps, P1:
107.3 fps, max:
243 fps
202 [X] AMD Ryzen 9 7950X 4.5GHz
Radeon RX 7900 GRE
min:
82.8 fps, P0.1:
110.5 fps, P1:
142.5 fps, max:
329 fps
~ 189 fps
Radeon RX 7900 GRE:
144.9 [X] AMD Ryzen 7 5700X 3.4GHz
Radeon RX 7900 GRE
min:
62.8 fps, P0.1:
86.3 fps, P1:
95 fps, max:
218 fps
157.4 [X] AMD Ryzen 9 7950X 4.5GHz
Radeon RX 7900 GRE
min:
58.3 fps, P0.1:
101 fps, P1:
125.8 fps, max:
239 fps
~ 151 fps
Radeon RX 7900 GRE:
114.9 [X] AMD Ryzen 7 5700X 3.4GHz
Radeon RX 7900 GRE
min:
56 fps, P0.1:
82.7 fps, P1:
93.4 fps, max:
195.5 fps
120.6 [X] AMD Ryzen 9 7950X 4.5GHz
Radeon RX 7900 GRE
min:
46.6 fps, P0.1:
59.4 fps, P1:
100.6 fps, max:
233 fps
~ 118 fps
Radeon RX 7900 GRE:
87.7 [X] AMD Ryzen 7 5700X 3.4GHz
Radeon RX 7900 GRE
min:
59.3 fps, P0.1:
66.5 fps, P1:
72.4 fps, max:
147.2 fps
91.9 [X] AMD Ryzen 9 7950X 4.5GHz
Radeon RX 7900 GRE
min:
55.1 fps, P0.1:
70.7 fps, P1:
76.4 fps, max:
146.7 fps
~ 90 fps
Radeon RX 7900 GRE:
67.5 [X] AMD Ryzen 7 5700X 3.4GHz
Radeon RX 7900 GRE
min:
50.4 fps, P0.1:
55.2 fps, P1:
57.7 fps, max:
116.9 fps
70.3 [X] AMD Ryzen 9 7950X 4.5GHz
Radeon RX 7900 GRE
min:
50.2 fps, P0.1:
55.1 fps, P1:
60.4 fps, max:
112 fps
~ 69 fps
Radeon RX 7900 GRE:
38.1 [X] AMD Ryzen 7 5700X 3.4GHz
Radeon RX 7900 GRE
min:
32 fps, P0.1:
32.3 fps, P1:
33.4 fps, max:
46.6 fps
39.9 [X] AMD Ryzen 9 7950X 4.5GHz
Radeon RX 7900 GRE
min:
30.3 fps, P0.1:
33.5 fps, P1:
35.3 fps, max:
59.6 fps
~ 39 fps
Radeon RX 7900 GRE:
271 [X] AMD Ryzen 7 5700X 3.4GHz
Radeon RX 7900 GRE
min:
62.3 fps, P0.1:
125.9 fps, P1:
179 fps, max:
384 fps
293 [X] AMD Ryzen 9 7950X 4.5GHz
Radeon RX 7900 GRE
min:
78.7 fps, P0.1:
175.6 fps, P1:
233 fps, max:
461 fps
~ 282 fps
Radeon RX 7900 GRE:
207 [X] AMD Ryzen 7 5700X 3.4GHz
Radeon RX 7900 GRE
min:
51.4 fps, P0.1:
101.1 fps, P1:
136 fps, max:
298 fps
221 [X] AMD Ryzen 9 7950X 4.5GHz
Radeon RX 7900 GRE
min:
66.3 fps, P0.1:
146.5 fps, P1:
173 fps, max:
346 fps
~ 214 fps
Radeon RX 7900 GRE:
171.1 [X] AMD Ryzen 7 5700X 3.4GHz
Radeon RX 7900 GRE
min:
50.1 fps, P0.1:
75.1 fps, P1:
123.1 fps, max:
286 fps
179.8 [X] AMD Ryzen 9 7950X 4.5GHz
Radeon RX 7900 GRE
min:
62.4 fps, P0.1:
116.7 fps, P1:
136.5 fps, max:
311 fps
~ 175 fps
Radeon RX 7900 GRE:
138.1 [X] AMD Ryzen 7 5700X 3.4GHz
Radeon RX 7900 GRE
min:
47.8 fps, P0.1:
71.7 fps, P1:
108 fps, max:
257 fps
143.4 [X] AMD Ryzen 9 7950X 4.5GHz
Radeon RX 7900 GRE
min:
56.5 fps, P0.1:
84.9 fps, P1:
116.2 fps, max:
253 fps
~ 141 fps
Radeon RX 7900 GRE:
94.2 [X] AMD Ryzen 7 5700X 3.4GHz
Radeon RX 7900 GRE
min:
37 fps, P0.1:
49.2 fps, P1:
78.5 fps, max:
186.2 fps
97.6 [X] AMD Ryzen 9 7950X 4.5GHz
Radeon RX 7900 GRE
min:
48.1 fps, P0.1:
51.8 fps, P1:
83.4 fps, max:
149.1 fps
~ 96 fps
Radeon RX 7900 GRE:
50.1 [X] AMD Ryzen 7 5700X 3.4GHz
Radeon RX 7900 GRE
min:
22.6 fps, P0.1:
23.6 fps, P1:
41.8 fps, max:
70.7 fps
52.9 [X] AMD Ryzen 9 7950X 4.5GHz
Radeon RX 7900 GRE
min:
24.5 fps, P0.1:
25 fps, P1:
46.5 fps, max:
150.7 fps
~ 52 fps
Radeon RX 7900 GRE:
369 [X] 959964
AMD Ryzen 7 5700X 3.4GHz
Radeon RX 7900 GRE
min:
237 fps, P1:
203 fps, max:
467 fps
474 [X] 959964
AMD Ryzen 9 7950X 4.5GHz
Radeon RX 7900 GRE
min:
316 fps, P1:
267 fps, max:
606 fps
~ 422 fps
Radeon RX 7900 GRE:
394 [X] 959964
AMD Ryzen 7 5700X 3.4GHz
Radeon RX 7900 GRE
min:
245 fps, P1:
210 fps, max:
462 fps
479 [X] 959964
AMD Ryzen 9 7950X 4.5GHz
Radeon RX 7900 GRE
min:
288 fps, P1:
275 fps, max:
541 fps
~ 437 fps
Radeon RX 7900 GRE:
343 [X] 959964
AMD Ryzen 7 5700X 3.4GHz
Radeon RX 7900 GRE
min:
229 fps, P1:
189 fps, max:
427 fps
390 [X] 959964
AMD Ryzen 9 7950X 4.5GHz
Radeon RX 7900 GRE
min:
314 fps, P1:
250 fps, max:
456 fps
~ 367 fps
Radeon RX 7900 GRE:
110.1 [X] 959964
AMD Ryzen 7 5700X 3.4GHz
Radeon RX 7900 GRE
min:
82 fps, P1:
81 fps, max:
134 fps
111.5 [X] 959964
AMD Ryzen 9 7950X 4.5GHz
Radeon RX 7900 GRE
min:
82 fps, P1:
83 fps, max:
132 fps
~ 111 fps
Radeon RX 7900 GRE:
74.2 [X] 959964
AMD Ryzen 7 5700X 3.4GHz
Radeon RX 7900 GRE
min:
52 fps, P1:
53 fps, max:
91 fps
76.1 [X] 959964
AMD Ryzen 9 7950X 4.5GHz
Radeon RX 7900 GRE
min:
53 fps, P1:
55 fps, max:
94 fps
~ 75 fps
Radeon RX 7900 GRE:
38.1 [X] 959964
AMD Ryzen 7 5700X 3.4GHz
Radeon RX 7900 GRE
min:
26 fps, P1:
26 fps, max:
47 fps
38.7 [X] 959964
AMD Ryzen 9 7950X 4.5GHz
Radeon RX 7900 GRE
min:
26 fps, P1:
27 fps, max:
47 fps
~ 38 fps
Radeon RX 7900 GRE:
205 [X] AMD Ryzen 7 5700X 3.4GHz
Radeon RX 7900 GRE
min:
30.1 fps, P0.1:
89.2 fps, P1:
145.2 fps, max:
289 fps
290 [X] AMD Ryzen 9 7950X 4.5GHz
Radeon RX 7900 GRE
min:
54.6 fps, P0.1:
140.6 fps, P1:
210 fps, max:
395 fps
~ 248 fps
Radeon RX 7900 GRE:
196.4 [X] AMD Ryzen 7 5700X 3.4GHz
Radeon RX 7900 GRE
min:
44.4 fps, P0.1:
82.4 fps, P1:
135.5 fps, max:
289 fps
282 [X] AMD Ryzen 9 7950X 4.5GHz
Radeon RX 7900 GRE
min:
59 fps, P0.1:
125.9 fps, P1:
212 fps, max:
389 fps
~ 239 fps
Radeon RX 7900 GRE:
193.7 [X] AMD Ryzen 7 5700X 3.4GHz
Radeon RX 7900 GRE
min:
32.6 fps, P0.1:
84.5 fps, P1:
135.1 fps, max:
282 fps
278 [X] AMD Ryzen 9 7950X 4.5GHz
Radeon RX 7900 GRE
min:
43.6 fps, P0.1:
143.6 fps, P1:
206 fps, max:
383 fps
~ 236 fps
Radeon RX 7900 GRE:
188.8 [X] AMD Ryzen 7 5700X 3.4GHz
Radeon RX 7900 GRE
min:
33.4 fps, P0.1:
89 fps, P1:
132.9 fps, max:
273 fps
272 [X] AMD Ryzen 9 7950X 4.5GHz
Radeon RX 7900 GRE
min:
43 fps, P0.1:
139.3 fps, P1:
204 fps, max:
369 fps
~ 230 fps
Radeon RX 7900 GRE:
179.2 [X] AMD Ryzen 7 5700X 3.4GHz
Radeon RX 7900 GRE
min:
32.2 fps, P0.1:
82.4 fps, P1:
127.7 fps, max:
276 fps
194.7 [X] AMD Ryzen 9 7950X 4.5GHz
Radeon RX 7900 GRE
min:
34.6 fps, P0.1:
126 fps, P1:
135.3 fps, max:
382 fps
~ 187 fps
Radeon RX 7900 GRE:
84.2 [X] AMD Ryzen 7 5700X 3.4GHz
Radeon RX 7900 GRE
min:
36 fps, P0.1:
49 fps, P1:
50.5 fps, max:
248 fps
89.1 [X] AMD Ryzen 9 7950X 4.5GHz
Radeon RX 7900 GRE
min:
42.3 fps, P0.1:
50.4 fps, P1:
51.1 fps, max:
358 fps
~ 87 fps
Radeon RX 7900 GRE:
325 [X] AMD Ryzen 7 5700X 3.4GHz
Radeon RX 7900 GRE
443 [X] AMD Ryzen 9 7950X 4.5GHz
Radeon RX 7900 GRE
~ 384 fps
Radeon RX 7900 GRE:
251 [X] AMD Ryzen 7 5700X 3.4GHz
Radeon RX 7900 GRE
345 [X] AMD Ryzen 9 7950X 4.5GHz
Radeon RX 7900 GRE
~ 298 fps
Radeon RX 7900 GRE:
206 [X] AMD Ryzen 7 5700X 3.4GHz
Radeon RX 7900 GRE
218 [X] AMD Ryzen 9 7950X 4.5GHz
Radeon RX 7900 GRE
~ 212 fps
Radeon RX 7900 GRE:
162.2 [X] AMD Ryzen 7 5700X 3.4GHz
Radeon RX 7900 GRE
168.5 [X] AMD Ryzen 9 7950X 4.5GHz
Radeon RX 7900 GRE
~ 165 fps
Radeon RX 7900 GRE:
111.2 [X] AMD Ryzen 7 5700X 3.4GHz
Radeon RX 7900 GRE
114.8 [X] AMD Ryzen 9 7950X 4.5GHz
Radeon RX 7900 GRE
~ 113 fps
Radeon RX 7900 GRE:
58.6 [X] AMD Ryzen 7 5700X 3.4GHz
Radeon RX 7900 GRE
60.7 [X] AMD Ryzen 9 7950X 4.5GHz
Radeon RX 7900 GRE
~ 60 fps
Radeon RX 7900 GRE:
179.7 [X] 1.63
AMD Ryzen 7 5700X 3.4GHz
Radeon RX 7900 GRE
min:
71.9 fps, max:
291 fps
236 [X] 1.6
AMD Ryzen 9 7950X 4.5GHz
Radeon RX 7900 GRE
min:
79.5 fps, max:
340 fps
~ 208 fps
Radeon RX 7900 GRE:
169.4 [X] 1.63
AMD Ryzen 7 5700X 3.4GHz
Radeon RX 7900 GRE
min:
68.7 fps, max:
273 fps
197.8 [X] 1.6
AMD Ryzen 9 7950X 4.5GHz
Radeon RX 7900 GRE
min:
122.7 fps, max:
332 fps
~ 184 fps
Radeon RX 7900 GRE:
149.1 [X] 1.63
AMD Ryzen 7 5700X 3.4GHz
Radeon RX 7900 GRE
min:
67 fps, max:
237 fps
166.4 [X] 1.6
AMD Ryzen 9 7950X 4.5GHz
Radeon RX 7900 GRE
min:
113.9 fps, max:
256 fps
~ 158 fps
Radeon RX 7900 GRE:
141.2 [X] 1.63
AMD Ryzen 7 5700X 3.4GHz
Radeon RX 7900 GRE
min:
57.3 fps, max:
229 fps
155.3 [X] 1.6
AMD Ryzen 9 7950X 4.5GHz
Radeon RX 7900 GRE
min:
94.9 fps, max:
228 fps
~ 148 fps
Radeon RX 7900 GRE:
94.8 [X] 1.63
AMD Ryzen 7 5700X 3.4GHz
Radeon RX 7900 GRE
min:
65.3 fps, max:
143 fps
101.1 [X] 1.6
AMD Ryzen 9 7950X 4.5GHz
Radeon RX 7900 GRE
min:
69.2 fps, max:
146.6 fps
~ 98 fps
Radeon RX 7900 GRE:
43.8 [X] 1.63
AMD Ryzen 7 5700X 3.4GHz
Radeon RX 7900 GRE
min:
35.5 fps, max:
57.9 fps
46 [X] 1.6
AMD Ryzen 9 7950X 4.5GHz
Radeon RX 7900 GRE
min:
27.7 fps, max:
66 fps
~ 45 fps
Radeon RX 7900 GRE:
207 [X] 800660
AMD Ryzen 7 5700X 3.4GHz
Radeon RX 7900 GRE
min:
55.1 fps, max:
473 fps
278 [X] 800660
AMD Ryzen 9 7950X 4.5GHz
Radeon RX 7900 GRE
min:
96.7 fps, max:
649 fps
~ 243 fps
Radeon RX 7900 GRE:
181.1 [X] 800660
AMD Ryzen 7 5700X 3.4GHz
Radeon RX 7900 GRE
min:
47 fps, max:
419 fps
216 [X] 800660
AMD Ryzen 9 7950X 4.5GHz
Radeon RX 7900 GRE
min:
83.9 fps, max:
482 fps
~ 199 fps
Radeon RX 7900 GRE:
168.8 [X] 800660
AMD Ryzen 7 5700X 3.4GHz
Radeon RX 7900 GRE
min:
49.4 fps, max:
383 fps
241 [X] 800660
AMD Ryzen 9 7950X 4.5GHz
Radeon RX 7900 GRE
min:
100.6 fps, max:
540 fps
~ 205 fps
Radeon RX 7900 GRE:
159 [X] 800660
AMD Ryzen 7 5700X 3.4GHz
Radeon RX 7900 GRE
min:
59.4 fps, max:
336 fps
199.5 [X] 800660
AMD Ryzen 9 7950X 4.5GHz
Radeon RX 7900 GRE
min:
88 fps, max:
393 fps
~ 179 fps
Radeon RX 7900 GRE:
153.7 [X] 800660
AMD Ryzen 7 5700X 3.4GHz
Radeon RX 7900 GRE
min:
58.6 fps, max:
304 fps
185 [X] 800660
AMD Ryzen 9 7950X 4.5GHz
Radeon RX 7900 GRE
min:
85.1 fps, max:
412 fps
~ 169 fps
Radeon RX 7900 GRE:
126.4 [X] 800660
AMD Ryzen 7 5700X 3.4GHz
Radeon RX 7900 GRE
min:
62.7 fps, max:
275 fps
140.5 [X] 800660
AMD Ryzen 9 7950X 4.5GHz
Radeon RX 7900 GRE
min:
81.4 fps, max:
305 fps
~ 133 fps
Radeon RX 7900 GRE:
137.8 [X] AMD Ryzen 7 5700X 3.4GHz
Radeon RX 7900 GRE
min:
74.9 fps, P0.1:
91.7 fps, P1:
99.4 fps, max:
194 fps
221 [X] AMD Ryzen 9 7950X 4.5GHz
Radeon RX 7900 GRE
min:
129.4 fps, P0.1:
134.6 fps, P1:
146.8 fps, max:
372 fps
~ 179 fps
Radeon RX 7900 GRE:
135.3 [X] AMD Ryzen 7 5700X 3.4GHz
Radeon RX 7900 GRE
min:
85.3 fps, P0.1:
91.5 fps, P1:
99.6 fps, max:
197.4 fps
214 [X] AMD Ryzen 9 7950X 4.5GHz
Radeon RX 7900 GRE
min:
119.1 fps, P0.1:
137 fps, P1:
147.7 fps, max:
322 fps
~ 175 fps
Radeon RX 7900 GRE:
133.3 [X] AMD Ryzen 7 5700X 3.4GHz
Radeon RX 7900 GRE
min:
33.1 fps, P0.1:
71.4 fps, P1:
95.6 fps, max:
206 fps
180.3 [X] AMD Ryzen 9 7950X 4.5GHz
Radeon RX 7900 GRE
min:
58.7 fps, P0.1:
139 fps, P1:
156.4 fps, max:
444 fps
~ 157 fps
Radeon RX 7900 GRE:
124 [X] AMD Ryzen 7 5700X 3.4GHz
Radeon RX 7900 GRE
min:
36.8 fps, P0.1:
77.7 fps, P1:
89.3 fps, max:
222 fps
128.3 [X] AMD Ryzen 9 7950X 4.5GHz
Radeon RX 7900 GRE
min:
39.3 fps, P0.1:
101.2 fps, P1:
106.9 fps, max:
396 fps
~ 126 fps
Radeon RX 7900 GRE:
102.9 [X] AMD Ryzen 7 5700X 3.4GHz
Radeon RX 7900 GRE
min:
79 fps, P0.1:
81.5 fps, P1:
85.7 fps, max:
133.4 fps
104.2 [X] AMD Ryzen 9 7950X 4.5GHz
Radeon RX 7900 GRE
min:
36 fps, P0.1:
85.5 fps, P1:
89.6 fps, max:
379 fps
~ 104 fps
Radeon RX 7900 GRE:
66.5 [X] AMD Ryzen 7 5700X 3.4GHz
Radeon RX 7900 GRE
min:
41.3 fps, P0.1:
49.5 fps, P1:
58.8 fps, max:
156 fps
68.2 [X] AMD Ryzen 9 7950X 4.5GHz
Radeon RX 7900 GRE
min:
59.8 fps, P0.1:
60.3 fps, P1:
61.5 fps, max:
80 fps
~ 67 fps
Radeon RX 7900 GRE:
138 [X] AMD Ryzen 7 5700X 3.4GHz
Radeon RX 7900 GRE
218 [X] AMD Ryzen 9 7950X 4.5GHz
Radeon RX 7900 GRE
~ 178 fps
Radeon RX 7900 GRE:
137 [X] AMD Ryzen 7 5700X 3.4GHz
Radeon RX 7900 GRE
218 [X] AMD Ryzen 9 7950X 4.5GHz
Radeon RX 7900 GRE
~ 178 fps
Radeon RX 7900 GRE:
135 [X] AMD Ryzen 7 5700X 3.4GHz
Radeon RX 7900 GRE
218 [X] AMD Ryzen 9 7950X 4.5GHz
Radeon RX 7900 GRE
~ 177 fps
Radeon RX 7900 GRE:
134 [X] AMD Ryzen 7 5700X 3.4GHz
Radeon RX 7900 GRE
214 [X] AMD Ryzen 9 7950X 4.5GHz
Radeon RX 7900 GRE
~ 174 fps
Radeon RX 7900 GRE:
134 [X] AMD Ryzen 7 5700X 3.4GHz
Radeon RX 7900 GRE
178 [X] AMD Ryzen 9 7950X 4.5GHz
Radeon RX 7900 GRE
~ 156 fps
Radeon RX 7900 GRE:
97 [X] AMD Ryzen 7 5700X 3.4GHz
Radeon RX 7900 GRE
101 [X] AMD Ryzen 9 7950X 4.5GHz
Radeon RX 7900 GRE
~ 99 fps
Radeon RX 7900 GRE:
174.8 [X] AMD Ryzen 7 5700X 3.4GHz
Radeon RX 7900 GRE
min:
133 fps, max:
257 fps
238 [X] AMD Ryzen 9 7950X 4.5GHz
Radeon RX 7900 GRE
min:
188 fps, max:
328 fps
~ 206 fps
Radeon RX 7900 GRE:
152.9 [X] AMD Ryzen 7 5700X 3.4GHz
Radeon RX 7900 GRE
min:
114 fps, max:
209 fps
212 [X] AMD Ryzen 9 7950X 4.5GHz
Radeon RX 7900 GRE
min:
160 fps, max:
284 fps
~ 182 fps
Radeon RX 7900 GRE:
138.3 [X] AMD Ryzen 7 5700X 3.4GHz
Radeon RX 7900 GRE
min:
98 fps, max:
210 fps
195.3 [X] AMD Ryzen 9 7950X 4.5GHz
Radeon RX 7900 GRE
min:
143 fps, max:
256 fps
~ 167 fps
Radeon RX 7900 GRE:
128.7 [X] AMD Ryzen 7 5700X 3.4GHz
Radeon RX 7900 GRE
min:
88 fps, max:
206 fps
186.4 [X] AMD Ryzen 9 7950X 4.5GHz
Radeon RX 7900 GRE
min:
135 fps, max:
228 fps
~ 158 fps
Radeon RX 7900 GRE:
121.3 [X] AMD Ryzen 7 5700X 3.4GHz
Radeon RX 7900 GRE
min:
85 fps, max:
165 fps
151.5 [X] AMD Ryzen 9 7950X 4.5GHz
Radeon RX 7900 GRE
min:
132 fps, max:
170 fps
~ 136 fps
Radeon RX 7900 GRE:
85.7 [X] AMD Ryzen 7 5700X 3.4GHz
Radeon RX 7900 GRE
min:
78 fps, max:
96 fps
88.1 [X] AMD Ryzen 9 7950X 4.5GHz
Radeon RX 7900 GRE
min:
81 fps, max:
97 fps
~ 87 fps
Radeon RX 7900 GRE:
544 [X] 874931
AMD Ryzen 7 5700X 3.4GHz
Radeon RX 7900 GRE
min:
360 fps, P1:
330 fps, max:
615 fps
676 [X] 874931
AMD Ryzen 9 7950X 4.5GHz
Radeon RX 7900 GRE
min:
491 fps, P1:
408 fps, max:
764 fps
~ 610 fps
Radeon RX 7900 GRE:
504 [X] 874931
AMD Ryzen 7 5700X 3.4GHz
Radeon RX 7900 GRE
min:
318 fps, P1:
293 fps, max:
586 fps
630 [X] 874931
AMD Ryzen 9 7950X 4.5GHz
Radeon RX 7900 GRE
min:
462 fps, P1:
376 fps, max:
720 fps
~ 567 fps
Radeon RX 7900 GRE:
420 [X] 874931
AMD Ryzen 7 5700X 3.4GHz
Radeon RX 7900 GRE
min:
261 fps, P1:
229 fps, max:
507 fps
483 [X] 874931
AMD Ryzen 9 7950X 4.5GHz
Radeon RX 7900 GRE
min:
328 fps, P1:
276 fps, max:
555 fps
~ 452 fps
Radeon RX 7900 GRE:
200 [X] 874931
AMD Ryzen 7 5700X 3.4GHz
Radeon RX 7900 GRE
min:
167 fps, P1:
155 fps, max:
220 fps
209 [X] 874931
AMD Ryzen 9 7950X 4.5GHz
Radeon RX 7900 GRE
min:
171 fps, P1:
173 fps, max:
237 fps
~ 205 fps
Radeon RX 7900 GRE:
155.9 [X] 874931
AMD Ryzen 7 5700X 3.4GHz
Radeon RX 7900 GRE
min:
130 fps, P1:
132 fps, max:
174 fps
161.2 [X] 874931
AMD Ryzen 9 7950X 4.5GHz
Radeon RX 7900 GRE
min:
137 fps, P1:
136 fps, max:
180 fps
~ 159 fps
Radeon RX 7900 GRE:
91.8 [X] 874931
AMD Ryzen 7 5700X 3.4GHz
Radeon RX 7900 GRE
min:
79 fps, P1:
79 fps, max:
104 fps
93.8 [X] 874931
AMD Ryzen 9 7950X 4.5GHz
Radeon RX 7900 GRE
min:
81 fps, P1:
80 fps, max:
107 fps
~ 93 fps
Radeon RX 7900 GRE:
236 [X] AMD Ryzen 9 7950X 4.5GHz
Radeon RX 7900 GRE
min:
128.5 fps, P0.1:
169.1 fps, P1:
200 fps, max:
315 fps
fps
Radeon RX 7900 GRE:
235 [X] AMD Ryzen 9 7950X 4.5GHz
Radeon RX 7900 GRE
min:
101 fps, P0.1:
169.4 fps, P1:
203 fps, max:
300 fps
fps
Radeon RX 7900 GRE:
234 [X] AMD Ryzen 9 7950X 4.5GHz
Radeon RX 7900 GRE
min:
129.7 fps, P0.1:
168.4 fps, P1:
199.5 fps, max:
311 fps
fps
Radeon RX 7900 GRE:
233 [X] AMD Ryzen 9 7950X 4.5GHz
Radeon RX 7900 GRE
min:
137.2 fps, P0.1:
168.2 fps, P1:
196.7 fps, max:
314 fps
fps
Radeon RX 7900 GRE:
211 [X] AMD Ryzen 9 7950X 4.5GHz
Radeon RX 7900 GRE
min:
147.5 fps, P0.1:
164.4 fps, P1:
183.8 fps, max:
291 fps
fps
Radeon RX 7900 GRE:
118.1 [X] AMD Ryzen 9 7950X 4.5GHz
Radeon RX 7900 GRE
min:
87.6 fps, P0.1:
102.9 fps, P1:
108.6 fps, max:
160.2 fps
fps
Radeon RX 7900 GRE:
494 [X] 759689
AMD Ryzen 7 5700X 3.4GHz
Radeon RX 7900 GRE
min:
374 fps, max:
551 fps
562 [X] 759689
AMD Ryzen 9 7950X 4.5GHz
Radeon RX 7900 GRE
min:
447 fps, max:
622 fps
~ 528 fps
Radeon RX 7900 GRE:
414 [X] 759689
AMD Ryzen 7 5700X 3.4GHz
Radeon RX 7900 GRE
min:
294 fps, max:
496 fps
477 [X] 759689
AMD Ryzen 9 7950X 4.5GHz
Radeon RX 7900 GRE
min:
371 fps, max:
552 fps
~ 446 fps
Radeon RX 7900 GRE:
394 [X] 759689
AMD Ryzen 7 5700X 3.4GHz
Radeon RX 7900 GRE
min:
305 fps, max:
455 fps
439 [X] 759689
AMD Ryzen 9 7950X 4.5GHz
Radeon RX 7900 GRE
min:
367 fps, max:
505 fps
~ 417 fps
Radeon RX 7900 GRE:
287 [X] 759689
AMD Ryzen 7 5700X 3.4GHz
Radeon RX 7900 GRE
min:
216 fps, max:
358 fps
300 [X] 759689
AMD Ryzen 9 7950X 4.5GHz
Radeon RX 7900 GRE
min:
223 fps, max:
369 fps
~ 294 fps
Radeon RX 7900 GRE:
228 [X] 759689
AMD Ryzen 7 5700X 3.4GHz
Radeon RX 7900 GRE
min:
175 fps, max:
276 fps
233 [X] 759689
AMD Ryzen 9 7950X 4.5GHz
Radeon RX 7900 GRE
min:
179 fps, max:
279 fps
~ 231 fps
Radeon RX 7900 GRE:
139.4 [X] 759689
AMD Ryzen 7 5700X 3.4GHz
Radeon RX 7900 GRE
min:
113 fps, max:
167 fps
141.5 [X] 759689
AMD Ryzen 9 7950X 4.5GHz
Radeon RX 7900 GRE
min:
115 fps, max:
170 fps
~ 140 fps
Radeon RX 7900 GRE:
170.6 [X] AMD Ryzen 7 5700X 3.4GHz
Radeon RX 7900 GRE
247 [X] AMD Ryzen 9 7950X 4.5GHz
Radeon RX 7900 GRE
~ 209 fps
Radeon RX 7900 GRE:
147.8 [X] AMD Ryzen 7 5700X 3.4GHz
Radeon RX 7900 GRE
222 [X] AMD Ryzen 9 7950X 4.5GHz
Radeon RX 7900 GRE
~ 185 fps
Radeon RX 7900 GRE:
135.5 [X] AMD Ryzen 7 5700X 3.4GHz
Radeon RX 7900 GRE
185.4 [X] AMD Ryzen 9 7950X 4.5GHz
Radeon RX 7900 GRE
~ 160 fps
Radeon RX 7900 GRE:
123.4 [X] AMD Ryzen 7 5700X 3.4GHz
Radeon RX 7900 GRE
153.4 [X] AMD Ryzen 9 7950X 4.5GHz
Radeon RX 7900 GRE
~ 138 fps
Radeon RX 7900 GRE:
104.6 [X] AMD Ryzen 7 5700X 3.4GHz
Radeon RX 7900 GRE
115.5 [X] AMD Ryzen 9 7950X 4.5GHz
Radeon RX 7900 GRE
~ 110 fps
Radeon RX 7900 GRE:
61.7 [X] AMD Ryzen 7 5700X 3.4GHz
Radeon RX 7900 GRE
64.1 [X] AMD Ryzen 9 7950X 4.5GHz
Radeon RX 7900 GRE
~ 63 fps
Radeon RX 7900 GRE:
240 [X] AMD Ryzen 7 5700X 3.4GHz
Radeon RX 7900 GRE
min:
25.9 fps, P0.1:
117.2 fps, P1:
140.2 fps, max:
570 fps
240 [X] AMD Ryzen 9 7950X 4.5GHz
Radeon RX 7900 GRE
min:
32.5 fps, P0.1:
137.1 fps, P1:
155.1 fps, max:
592 fps
~ 240 fps
Radeon RX 7900 GRE:
239 [X] AMD Ryzen 7 5700X 3.4GHz
Radeon RX 7900 GRE
min:
41.6 fps, P0.1:
119.4 fps, P1:
138.9 fps, max:
546 fps
240 [X] AMD Ryzen 9 7950X 4.5GHz
Radeon RX 7900 GRE
min:
34.6 fps, P0.1:
130.5 fps, P1:
154.7 fps, max:
590 fps
~ 240 fps
Radeon RX 7900 GRE:
197.2 [X] AMD Ryzen 7 5700X 3.4GHz
Radeon RX 7900 GRE
min:
45.2 fps, P0.1:
116.7 fps, P1:
130.1 fps, max:
520 fps
202 [X] AMD Ryzen 9 7950X 4.5GHz
Radeon RX 7900 GRE
min:
59.3 fps, P0.1:
117.5 fps, P1:
129.8 fps, max:
585 fps
~ 200 fps
Radeon RX 7900 GRE:
126.9 [X] AMD Ryzen 7 5700X 3.4GHz
Radeon RX 7900 GRE
min:
51.7 fps, P0.1:
69.1 fps, P1:
74.3 fps, max:
433 fps
128.8 [X] AMD Ryzen 9 7950X 4.5GHz
Radeon RX 7900 GRE
min:
68.1 fps, P0.1:
71.5 fps, P1:
74.6 fps, max:
461 fps
~ 128 fps
Radeon RX 7900 GRE:
60.9 [X] AMD Ryzen 7 5700X 3.4GHz
Radeon RX 7900 GRE
min:
31.8 fps, P0.1:
32.1 fps, P1:
34.5 fps, max:
288 fps
62 [X] AMD Ryzen 9 7950X 4.5GHz
Radeon RX 7900 GRE
min:
32.3 fps, P0.1:
32.6 fps, P1:
34.5 fps, max:
373 fps
~ 61 fps
100%
M3 Pro 14-Core GPU:
75 fps
100%
M3 Pro 14-Core GPU:
49.5 fps
100%
M3 Pro 14-Core GPU:
35.9 fps
100%
M3 Pro 14-Core GPU:
22.5 fps
Radeon RX 7900 GRE:
145 [X] AMD Ryzen 7 5700X 3.4GHz
Radeon RX 7900 GRE
min:
95 fps, max:
224 fps
185 [X] AMD Ryzen 9 7950X 4.5GHz
Radeon RX 7900 GRE
min:
132 fps, max:
271 fps
~ 165 fps
Radeon RX 7900 GRE:
131 [X] AMD Ryzen 7 5700X 3.4GHz
Radeon RX 7900 GRE
min:
98 fps, max:
202 fps
166 [X] AMD Ryzen 9 7950X 4.5GHz
Radeon RX 7900 GRE
min:
132 fps, max:
252 fps
~ 149 fps
Radeon RX 7900 GRE:
126 [X] AMD Ryzen 7 5700X 3.4GHz
Radeon RX 7900 GRE
min:
95 fps, max:
192 fps
158 [X] AMD Ryzen 9 7950X 4.5GHz
Radeon RX 7900 GRE
min:
123 fps, max:
242 fps
~ 142 fps
Radeon RX 7900 GRE:
113 [X] AMD Ryzen 7 5700X 3.4GHz
Radeon RX 7900 GRE
min:
76 fps, max:
188 fps
143 [X] AMD Ryzen 9 7950X 4.5GHz
Radeon RX 7900 GRE
min:
98 fps, max:
236 fps
~ 128 fps
Radeon RX 7900 GRE:
113 [X] AMD Ryzen 7 5700X 3.4GHz
Radeon RX 7900 GRE
min:
77 fps, max:
187 fps
142 [X] AMD Ryzen 9 7950X 4.5GHz
Radeon RX 7900 GRE
min:
98 fps, max:
236 fps
~ 128 fps
Radeon RX 7900 GRE:
103 [X] AMD Ryzen 7 5700X 3.4GHz
Radeon RX 7900 GRE
min:
76 fps, max:
147 fps
115 [X] AMD Ryzen 9 7950X 4.5GHz
Radeon RX 7900 GRE
min:
96 fps, max:
150 fps
~ 109 fps
Radeon RX 7900 GRE:
228 [X] AMD Ryzen 7 5700X 3.4GHz
Radeon RX 7900 GRE
min:
134.17 fps, max:
478.24 fps
333 [X] AMD Ryzen 9 7950X 4.5GHz
Radeon RX 7900 GRE
min:
172.98 fps, max:
543.18 fps
~ 281 fps
Radeon RX 7900 GRE:
218 [X] AMD Ryzen 7 5700X 3.4GHz
Radeon RX 7900 GRE
min:
97.04 fps, max:
358.55 fps
241 [X] AMD Ryzen 9 7950X 4.5GHz
Radeon RX 7900 GRE
min:
113.37 fps, max:
375.66 fps
~ 230 fps
Radeon RX 7900 GRE:
169.2 [X] AMD Ryzen 7 5700X 3.4GHz
Radeon RX 7900 GRE
min:
81.65 fps, max:
267.31 fps
177.7 [X] AMD Ryzen 9 7950X 4.5GHz
Radeon RX 7900 GRE
min:
90.11 fps, max:
283.37 fps
~ 173 fps
Radeon RX 7900 GRE:
132.4 [X] AMD Ryzen 7 5700X 3.4GHz
Radeon RX 7900 GRE
min:
73.22 fps, max:
210.17 fps
137.3 [X] AMD Ryzen 9 7950X 4.5GHz
Radeon RX 7900 GRE
min:
75.98 fps, max:
216.31 fps
~ 135 fps
Radeon RX 7900 GRE:
109.3 [X] AMD Ryzen 7 5700X 3.4GHz
Radeon RX 7900 GRE
min:
63.76 fps, max:
164.83 fps
112 [X] AMD Ryzen 9 7950X 4.5GHz
Radeon RX 7900 GRE
min:
65.69 fps, max:
166.81 fps
~ 111 fps
Radeon RX 7900 GRE:
69.4 [X] AMD Ryzen 7 5700X 3.4GHz
Radeon RX 7900 GRE
min:
44.55 fps, max:
94.98 fps
71.6 [X] AMD Ryzen 9 7950X 4.5GHz
Radeon RX 7900 GRE
min:
46.26 fps, max:
96.7 fps
~ 71 fps
Radeon RX 7900 GRE:
237 [X] AMD Ryzen 7 5700X 3.4GHz
Radeon RX 7900 GRE
max:
436.9 fps
375 [X] AMD Ryzen 9 7950X 4.5GHz
Radeon RX 7900 GRE
max:
527.2 fps
~ 306 fps
100%
M3 Pro 14-Core GPU:
66 fps
374%
Radeon RX 7900 GRE:
206 [X] AMD Ryzen 7 5700X 3.4GHz
Radeon RX 7900 GRE
max:
339.4 fps
288 [X] AMD Ryzen 9 7950X 4.5GHz
Radeon RX 7900 GRE
max:
498.4 fps
~ 247 fps
100%
M3 Pro 14-Core GPU:
60 fps
398%
Radeon RX 7900 GRE:
205 [X] AMD Ryzen 7 5700X 3.4GHz
Radeon RX 7900 GRE
max:
323.4 fps
273 [X] AMD Ryzen 9 7950X 4.5GHz
Radeon RX 7900 GRE
max:
499.6 fps
~ 239 fps
100%
M3 Pro 14-Core GPU:
53 fps
409%
Radeon RX 7900 GRE:
192.9 [X] AMD Ryzen 7 5700X 3.4GHz
Radeon RX 7900 GRE
max:
326.2 fps
241 [X] AMD Ryzen 9 7950X 4.5GHz
Radeon RX 7900 GRE
max:
426.8 fps
~ 217 fps
100%
M3 Pro 14-Core GPU:
34 fps
482%
Radeon RX 7900 GRE:
158.3 [X] AMD Ryzen 7 5700X 3.4GHz
Radeon RX 7900 GRE
max:
286.4 fps
169.6 [X] AMD Ryzen 9 7950X 4.5GHz
Radeon RX 7900 GRE
max:
268.1 fps
~ 164 fps
Radeon RX 7900 GRE:
85 [X] AMD Ryzen 7 5700X 3.4GHz
Radeon RX 7900 GRE
max:
145.2 fps
88 [X] AMD Ryzen 9 7950X 4.5GHz
Radeon RX 7900 GRE
max:
123.1 fps
~ 87 fps
Radeon RX 7900 GRE:
664 [X] 1.47.22.14 D3D12
AMD Ryzen 7 5700X 3.4GHz
Radeon RX 7900 GRE
min:
75.8 fps, P1:
522 fps, max:
988 fps
755 [X] 1.47.22.14 D3D12
AMD Ryzen 9 7950X 4.5GHz
Radeon RX 7900 GRE
min:
403 fps, P1:
590 fps, max:
1031 fps
~ 710 fps
Radeon RX 7900 GRE:
475 [X] 1.47.22.14 D3D12
AMD Ryzen 7 5700X 3.4GHz
Radeon RX 7900 GRE
min:
197.3 fps, P1:
371 fps, max:
662 fps
498 [X] 1.47.22.14 D3D12
AMD Ryzen 9 7950X 4.5GHz
Radeon RX 7900 GRE
min:
240 fps, P1:
404 fps, max:
715 fps
~ 487 fps
Radeon RX 7900 GRE:
397 [X] 1.47.22.14 D3D12
AMD Ryzen 7 5700X 3.4GHz
Radeon RX 7900 GRE
min:
237 fps, P1:
260 fps, max:
606 fps
409 [X] 1.47.22.14 D3D12
AMD Ryzen 9 7950X 4.5GHz
Radeon RX 7900 GRE
min:
254 fps, P1:
269 fps, max:
660 fps
~ 403 fps
Radeon RX 7900 GRE:
345 [X] 1.47.22.14 D3D12
AMD Ryzen 7 5700X 3.4GHz
Radeon RX 7900 GRE
min:
218 fps, P1:
229 fps, max:
652 fps
361 [X] 1.47.22.14 D3D12
AMD Ryzen 9 7950X 4.5GHz
Radeon RX 7900 GRE
min:
197.7 fps, P1:
240 fps, max:
659 fps
~ 353 fps
Radeon RX 7900 GRE:
250 [X] 1.47.22.14 D3D12
AMD Ryzen 7 5700X 3.4GHz
Radeon RX 7900 GRE
min:
178.7 fps, P1:
184.5 fps, max:
439 fps
254 [X] 1.47.22.14 D3D12
AMD Ryzen 9 7950X 4.5GHz
Radeon RX 7900 GRE
min:
59.1 fps, P1:
188.4 fps, max:
496 fps
~ 252 fps
Radeon RX 7900 GRE:
130.2 [X] 1.47.22.14 D3D12
AMD Ryzen 7 5700X 3.4GHz
Radeon RX 7900 GRE
min:
108.1 fps, P1:
111 fps, max:
183.5 fps
132.1 [X] 1.47.22.14 D3D12
AMD Ryzen 9 7950X 4.5GHz
Radeon RX 7900 GRE
min:
52.8 fps, P1:
112.6 fps, max:
434 fps
~ 131 fps
Radeon RX 7900 GRE:
170 [X] AMD Ryzen 7 5700X 3.4GHz
Radeon RX 7900 GRE
min:
135 fps, max:
233 fps
222 [X] AMD Ryzen 9 7950X 4.5GHz
Radeon RX 7900 GRE
min:
173 fps, max:
300 fps
~ 196 fps
Radeon RX 7900 GRE:
152 [X] AMD Ryzen 7 5700X 3.4GHz
Radeon RX 7900 GRE
min:
118 fps, max:
204 fps
196 [X] AMD Ryzen 9 7950X 4.5GHz
Radeon RX 7900 GRE
min:
157 fps, max:
264 fps
~ 174 fps
Radeon RX 7900 GRE:
147 [X] AMD Ryzen 7 5700X 3.4GHz
Radeon RX 7900 GRE
min:
115 fps, max:
199 fps
188 [X] AMD Ryzen 9 7950X 4.5GHz
Radeon RX 7900 GRE
min:
146 fps, max:
255 fps
~ 168 fps
Radeon RX 7900 GRE:
136 [X] AMD Ryzen 7 5700X 3.4GHz
Radeon RX 7900 GRE
min:
105 fps, max:
181 fps
173 [X] AMD Ryzen 9 7950X 4.5GHz
Radeon RX 7900 GRE
min:
124 fps, max:
232 fps
~ 155 fps
Radeon RX 7900 GRE:
135 [X] AMD Ryzen 7 5700X 3.4GHz
Radeon RX 7900 GRE
min:
101 fps, max:
178 fps
173 [X] AMD Ryzen 9 7950X 4.5GHz
Radeon RX 7900 GRE
min:
131 fps, max:
234 fps
~ 154 fps
Radeon RX 7900 GRE:
106 [X] AMD Ryzen 7 5700X 3.4GHz
Radeon RX 7900 GRE
min:
92 fps, max:
128 fps
108 [X] AMD Ryzen 9 7950X 4.5GHz
Radeon RX 7900 GRE
min:
95 fps, max:
130 fps
~ 107 fps
Radeon RX 7900 GRE:
139.2 [X] AMD Ryzen 7 5700X 3.4GHz
Radeon RX 7900 GRE
180.2 [X] AMD Ryzen 9 7950X 4.5GHz
Radeon RX 7900 GRE
~ 160 fps
Radeon RX 7900 GRE:
115.1 [X] AMD Ryzen 7 5700X 3.4GHz
Radeon RX 7900 GRE
146 [X] AMD Ryzen 9 7950X 4.5GHz
Radeon RX 7900 GRE
~ 131 fps
Radeon RX 7900 GRE:
88.2 [X] AMD Ryzen 7 5700X 3.4GHz
Radeon RX 7900 GRE
112.7 [X] AMD Ryzen 9 7950X 4.5GHz
Radeon RX 7900 GRE
~ 100 fps
Radeon RX 7900 GRE:
68 [X] AMD Ryzen 7 5700X 3.4GHz
Radeon RX 7900 GRE
83.4 [X] AMD Ryzen 9 7950X 4.5GHz
Radeon RX 7900 GRE
~ 76 fps
Radeon RX 7900 GRE:
226 [X] 1.3
AMD Ryzen 7 5700X 3.4GHz
Radeon RX 7900 GRE
235 [X] 1.3
AMD Ryzen 9 7950X 4.5GHz
Radeon RX 7900 GRE
~ 231 fps
Radeon RX 7900 GRE:
225 [X] 1.3
AMD Ryzen 7 5700X 3.4GHz
Radeon RX 7900 GRE
237 [X] 1.3
AMD Ryzen 9 7950X 4.5GHz
Radeon RX 7900 GRE
~ 231 fps
Radeon RX 7900 GRE:
162.6 [X] 1.3
AMD Ryzen 7 5700X 3.4GHz
Radeon RX 7900 GRE
174.5 [X] 1.3
AMD Ryzen 9 7950X 4.5GHz
Radeon RX 7900 GRE
~ 169 fps
Radeon RX 7900 GRE:
126.3 [X] 1.3
AMD Ryzen 7 5700X 3.4GHz
Radeon RX 7900 GRE
133 [X] 1.3
AMD Ryzen 9 7950X 4.5GHz
Radeon RX 7900 GRE
~ 130 fps
Radeon RX 7900 GRE:
74.2 [X] 1.3
AMD Ryzen 7 5700X 3.4GHz
Radeon RX 7900 GRE
75.5 [X] 1.3
AMD Ryzen 9 7950X 4.5GHz
Radeon RX 7900 GRE
~ 75 fps
Radeon RX 7900 GRE:
214 [X] AMD Ryzen 7 5700X 3.4GHz
Radeon RX 7900 GRE
min:
180 fps, max:
-1 fps
297 [X] AMD Ryzen 9 7950X 4.5GHz
Radeon RX 7900 GRE
min:
233 fps, max:
-1 fps
~ 256 fps
Radeon RX 7900 GRE:
176.2 [X] AMD Ryzen 7 5700X 3.4GHz
Radeon RX 7900 GRE
min:
142.7 fps, max:
-1 fps
236 [X] AMD Ryzen 9 7950X 4.5GHz
Radeon RX 7900 GRE
min:
188.5 fps, max:
-1 fps
~ 206 fps
Radeon RX 7900 GRE:
184.9 [X] AMD Ryzen 7 5700X 3.4GHz
Radeon RX 7900 GRE
min:
147.5 fps, max:
-1 fps
218 [X] AMD Ryzen 9 7950X 4.5GHz
Radeon RX 7900 GRE
min:
188.2 fps, max:
-1 fps
~ 201 fps
Radeon RX 7900 GRE:
149.6 [X] AMD Ryzen 7 5700X 3.4GHz
Radeon RX 7900 GRE
min:
123 fps, max:
-1 fps
217 [X] AMD Ryzen 9 7950X 4.5GHz
Radeon RX 7900 GRE
min:
160.9 fps, max:
-1 fps
~ 183 fps
Radeon RX 7900 GRE:
136.8 [X] AMD Ryzen 7 5700X 3.4GHz
Radeon RX 7900 GRE
min:
118.2 fps, max:
-1 fps
154.4 [X] AMD Ryzen 9 7950X 4.5GHz
Radeon RX 7900 GRE
min:
131.9 fps, max:
-1 fps
~ 146 fps
Radeon RX 7900 GRE:
484.7 [X] AMD Ryzen 7 5700X 3.4GHz
Radeon RX 7900 GRE
794.3 [X] AMD Ryzen 9 7950X 4.5GHz
Radeon RX 7900 GRE
~ 640 fps
Radeon RX 7900 GRE:
398.3 [X] AMD Ryzen 7 5700X 3.4GHz
Radeon RX 7900 GRE
578 [X] AMD Ryzen 9 7950X 4.5GHz
Radeon RX 7900 GRE
~ 488 fps
Radeon RX 7900 GRE:
374.8 [X] AMD Ryzen 7 5700X 3.4GHz
Radeon RX 7900 GRE
390 [X] AMD Ryzen 9 7950X 4.5GHz
Radeon RX 7900 GRE
~ 382 fps
100%
M3 Pro 14-Core GPU:
39 fps
536%
Radeon RX 7900 GRE:
207.3 [X] AMD Ryzen 7 5700X 3.4GHz
Radeon RX 7900 GRE
210.2 [X] AMD Ryzen 9 7950X 4.5GHz
Radeon RX 7900 GRE
~ 209 fps
Radeon RX 7900 GRE:
153.9 [X] AMD Ryzen 7 5700X 3.4GHz
Radeon RX 7900 GRE
157.4 [X] AMD Ryzen 9 7950X 4.5GHz
Radeon RX 7900 GRE
~ 156 fps
Radeon RX 7900 GRE:
124.7 [X] AMD Ryzen 9 7950X 4.5GHz
Radeon RX 7900 GRE
124.8 [X] AMD Ryzen 7 5700X 3.4GHz
Radeon RX 7900 GRE
~ 125 fps
Radeon RX 7900 GRE:
186.7 [X] AMD Ryzen 7 5700X 3.4GHz
Radeon RX 7900 GRE
min:
2.9 fps, P1:
166.7 fps, max:
536 fps
187.9 [X] AMD Ryzen 9 7950X 4.5GHz
Radeon RX 7900 GRE
min:
9.11 fps, P1:
200 fps, max:
768 fps
~ 187 fps
Radeon RX 7900 GRE:
184.5 [X] AMD Ryzen 7 5700X 3.4GHz
Radeon RX 7900 GRE
min:
4.19 fps, P1:
166.7 fps, max:
422 fps
187.4 [X] AMD Ryzen 9 7950X 4.5GHz
Radeon RX 7900 GRE
min:
30 fps, P1:
200 fps, max:
552 fps
~ 186 fps
100%
M3 Pro 14-Core GPU:
79 fps
230%
Radeon RX 7900 GRE:
177.6 [X] AMD Ryzen 7 5700X 3.4GHz
Radeon RX 7900 GRE
min:
8.8 fps, P1:
100 fps, max:
450 fps
186.4 [X] AMD Ryzen 9 7950X 4.5GHz
Radeon RX 7900 GRE
min:
11.3 fps, P1:
142.9 fps, max:
585 fps
~ 182 fps
100%
M3 Pro 14-Core GPU:
50 fps
292%
Radeon RX 7900 GRE:
120.6 [X] AMD Ryzen 7 5700X 3.4GHz
Radeon RX 7900 GRE
min:
12.9 fps, P1:
71.4 fps, max:
210 fps
172.2 [X] AMD Ryzen 9 7950X 4.5GHz
Radeon RX 7900 GRE
min:
2.81 fps, P1:
111.1 fps, max:
426 fps
~ 146 fps
Radeon RX 7900 GRE:
116.4 [X] AMD Ryzen 7 5700X 3.4GHz
Radeon RX 7900 GRE
min:
6.38 fps, P1:
71.4 fps, max:
224 fps
142.7 [X] AMD Ryzen 9 7950X 4.5GHz
Radeon RX 7900 GRE
min:
17.1 fps, P1:
100 fps, max:
281 fps
~ 130 fps
Radeon RX 7900 GRE:
149 [X] AMD Ryzen 7 5700X 3.4GHz
Radeon RX 7900 GRE
min:
8.32 fps, P1:
100 fps, max:
364 fps
153.3 [X] AMD Ryzen 9 7950X 4.5GHz
Radeon RX 7900 GRE
min:
7.86 fps, P1:
111.1 fps, max:
457 fps
~ 151 fps
Average Gaming Apple M3 Pro 14-Core GPU → 100% Average Gaming 30-70 fps → 100%
Average Gaming AMD Radeon RX 7900 GRE → 394%  Deutsch
 English
 Español
 Français
 Italiano
 Nederlands
 Polski
 Português
 Русский
 Türkçe
 Svenska
 Chinese
 Magyar