

Intel HD Graphics (Skylake) vs NVIDIA Quadro RTX 4000 Max-Q
Intel HD Graphics (Skylake)
► remove from comparison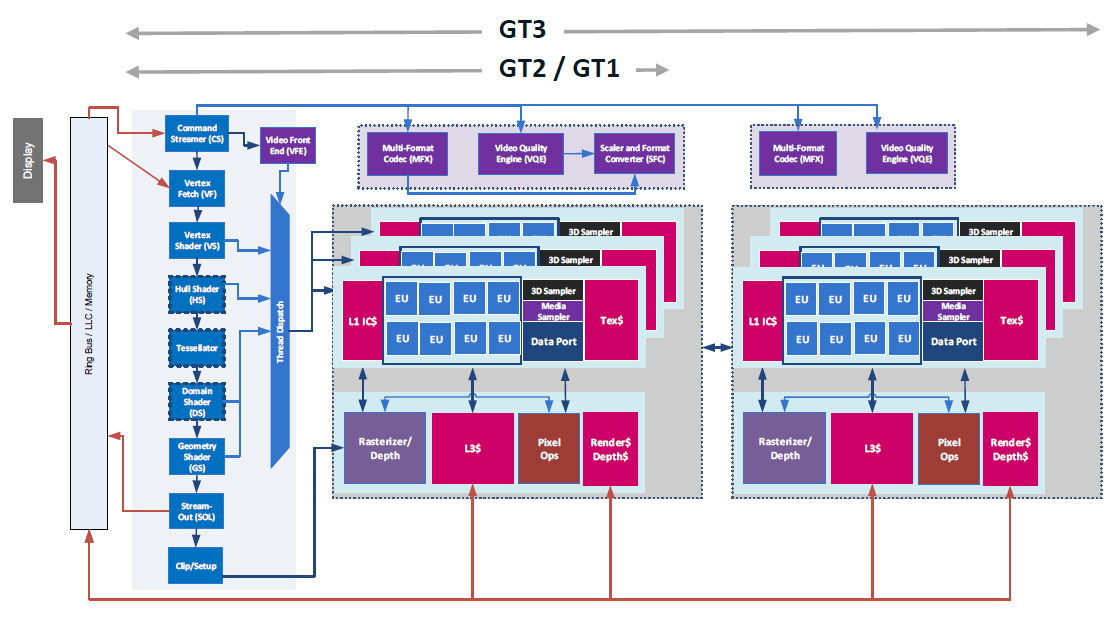
The Intel HD Graphics (Skylake) (GT1) is an integrated graphics unit, which can be found in low-end ULV (Ultra Low Voltage) processors of the Skylake generation. In most CPUs, this GPU was named Intel HD Graphics 510 or Intel HD Graphics 515 (see both pages for benchmarks and information).
This "GT1" version of the Skylake GPU offers 12 Execution Units (EUs) clocked at up to 800 MHz (depending on the CPU model). Due to its lack of dedicated graphics memory or eDRAM cache, the HD Graphics has to access the main memory (2x 64bit DDR3L-1600 / DDR4-2133).
Performance
Depending on various factors like memory configuration, the HD Graphics should perform similar to the older HD Graphics 4200 and will handle only some older and less demanding games in lowest settings.
Features
The revised video engine now decodes H.265/HEVC completely in hardware and thereby much more efficiently than before. Displays can be connected via DP 1.2 / eDP 1.3 (max. 3840 x 2160 @ 60 Hz), whereas HDMI is limited to the older version 1.4a (max. 3840 x 2160 @ 30 Hz). However, HDMI 2.0 can be added using a DisplayPort converter. Up to three displays can be controlled simultaneously.
Power Consumption
The HD Graphics (Skylake) can be found in mobile processors specified at 6 W TDP and is therefore suited for passively cooled 2-in-1 laptops and tablets.
NVIDIA Quadro RTX 4000 Max-Q
► remove from comparisonThe Nvidia Quadro RTX 4000 with Max-Q Design is a professional high-end graphics card for powerful laptops and mobile workstations. The Max-Q variants are lower clocked versions that are running more efficient and can be used in smaller chassis than the regular versions. It is based on the same TU104 chip as the consumer GeForce RTX 2080 (mobile) but offers fewer shaders (2,560) and is therefore positioned between the GeForce RTX 2080 (2,944) and 2070 (2,304). Currently we know of three different Max-Q variants with a power consumption (TGP) of 90, 85 and 80 Watt and different clock speeds.
| Model | Shader | TGP (W) | Base (MHz) | Boost (MHz) |
| Quadro RTX 4000 Desktop | 2304 | 160 | 1005 | 1545 |
| Quadro RTX 4000 Mobile | 2560 | 110 | 1350 | 1770 |
| Quadro RTX 4000 Max-Q | 2560 | 90 | 960 | 1485 |
| Quadro RTX 4000 Max-Q | 2560 | 85 | 900 | 1440 |
| Quadro RTX 4000 Max-Q | 2560 | 80 | 780 | 1380 |
| GeForce RTX 2070 Mobile | 2304 | 115? | 1215 | 1440 |
The Quadro GPUs offer certified drivers, which are optimized for stability and performance in professional applications (CAD, DCC, medical, prospection, and visualizing applications). The performance in these areas is therefore much better compared to corresponding consumer GPUs.
Features
NVIDIA manufacturers the TU104 chip on a 12 nm FinFET process and includes features like Deep Learning Super Sampling (DLSS) and Real-Time Ray Tracing (RTRT), which should combine to create more realistic lighting effects than older GPUs based on the company's Pascal architecture (if the games support it). The Quadro RTX 5000 is also DisplayPort 1.4 ready, while there is also support for HDMI 2.0b, HDR, Simultaneous Multi-Projection (SMP) and H.265 video en/decoding (PlayReady 3.0).
Performance
For professional applications, the Quadro RTX 4000 Max-Q should be only slightly above the mobile Quadro RTX 3000 (depending on the version). Compared to consumer cards, the mobile RTX 2070 will offer a similar performance (or slightly lower).
The still relatively high power consumption of the RTX4000 Max-Q makes the card most suited for big laptops although we should see thinner designs with the Max-Q variants.
| Intel HD Graphics (Skylake) | NVIDIA Quadro RTX 4000 Max-Q | |||||||||||||||||||||||||||||||||||||||||||||||||||||||||||||||||||||||||||||||||||||||||||||||||||||||||||||||||||||||||
| Quadro Turing Series |
|
| ||||||||||||||||||||||||||||||||||||||||||||||||||||||||||||||||||||||||||||||||||||||||||||||||||||||||||||||||||||||||
| Codename | Skylake GT1 | N19E-Q3 MAX-Q | ||||||||||||||||||||||||||||||||||||||||||||||||||||||||||||||||||||||||||||||||||||||||||||||||||||||||||||||||||||||||
| Architecture | Gen. 9 Skylake | Turing | ||||||||||||||||||||||||||||||||||||||||||||||||||||||||||||||||||||||||||||||||||||||||||||||||||||||||||||||||||||||||
| Pipelines | 12 - unified | 2560 - unified | ||||||||||||||||||||||||||||||||||||||||||||||||||||||||||||||||||||||||||||||||||||||||||||||||||||||||||||||||||||||||
| Core Speed | 300 - 800 (Boost) MHz | 780 - 960 - 1380 - 1485 (Boost) MHz | ||||||||||||||||||||||||||||||||||||||||||||||||||||||||||||||||||||||||||||||||||||||||||||||||||||||||||||||||||||||||
| Memory Bus Width | 64/128 Bit | 256 Bit | ||||||||||||||||||||||||||||||||||||||||||||||||||||||||||||||||||||||||||||||||||||||||||||||||||||||||||||||||||||||||
| Memory Type | DDR3L/LPDDR3 | GDDR6 | ||||||||||||||||||||||||||||||||||||||||||||||||||||||||||||||||||||||||||||||||||||||||||||||||||||||||||||||||||||||||
| Shared Memory | yes | no | ||||||||||||||||||||||||||||||||||||||||||||||||||||||||||||||||||||||||||||||||||||||||||||||||||||||||||||||||||||||||
| API | DirectX 12_1, OpenGL 4.4 | DirectX 12_1, OpenGL 4.6 | ||||||||||||||||||||||||||||||||||||||||||||||||||||||||||||||||||||||||||||||||||||||||||||||||||||||||||||||||||||||||
| technology | 14 nm | 12 nm | ||||||||||||||||||||||||||||||||||||||||||||||||||||||||||||||||||||||||||||||||||||||||||||||||||||||||||||||||||||||||
| Features | QuickSync | DLSS, Raytraycing, VR Ready, G-SYNC, Vulkan, Multi Monitor | ||||||||||||||||||||||||||||||||||||||||||||||||||||||||||||||||||||||||||||||||||||||||||||||||||||||||||||||||||||||||
| Date of Announcement | 01.09.2015 | 27.05.2019 | ||||||||||||||||||||||||||||||||||||||||||||||||||||||||||||||||||||||||||||||||||||||||||||||||||||||||||||||||||||||||
| Memory Speed | 14000 MHz | |||||||||||||||||||||||||||||||||||||||||||||||||||||||||||||||||||||||||||||||||||||||||||||||||||||||||||||||||||||||||
| Max. Amount of Memory | 8 GB | |||||||||||||||||||||||||||||||||||||||||||||||||||||||||||||||||||||||||||||||||||||||||||||||||||||||||||||||||||||||||
| Power Consumption | 80 - 90 Watt | |||||||||||||||||||||||||||||||||||||||||||||||||||||||||||||||||||||||||||||||||||||||||||||||||||||||||||||||||||||||||
| Transistors | 10.8 Billion | |||||||||||||||||||||||||||||||||||||||||||||||||||||||||||||||||||||||||||||||||||||||||||||||||||||||||||||||||||||||||
| Notebook Size | large |
Benchmarks
specvp12 sw-03 + NVIDIA Quadro RTX 4000 Max-Q
Cinebench R15 OpenGL 64 Bit + NVIDIA Quadro RTX 4000 Max-Q
Average Benchmarks NVIDIA Quadro RTX 4000 Max-Q → 0% n=0
* Smaller numbers mean a higher performance
1 This benchmark is not used for the average calculation
Game Benchmarks
The following benchmarks stem from our benchmarks of review laptops. The performance depends on the used graphics memory, clock rate, processor, system settings, drivers, and operating systems. So the results don't have to be representative for all laptops with this GPU. For detailed information on the benchmark results, click on the fps number.

X-Plane 11.11
2018
Dota 2 Reborn
2015
The Witcher 3
2015| Intel HD Graphics (Skylake) | NVIDIA Quadro RTX 4000 Max-Q | |||||||||||||
|---|---|---|---|---|---|---|---|---|---|---|---|---|---|---|
| low | med. | high | ultra | QHD | 4K | low | med. | high | ultra | QHD | 4K | |||
| X-Plane 11.11 | 93.3 | 78.8 | 66.2 | 45.3 | ||||||||||
| Final Fantasy XV Benchmark | 118 | 86.5 | 68.3 | 46.3 | 29.7 | |||||||||
| Dota 2 Reborn | 131 | 116 | 107 | 101 | 65 | |||||||||
| The Witcher 3 | 221 | 178 | 115 | 62.6 | 36 | |||||||||
| Intel HD Graphics (Skylake) | NVIDIA Quadro RTX 4000 Max-Q | |||||||||||||
| low | med. | high | ultra | QHD | 4K | low | med. | high | ultra | QHD | 4K | < 30 fps < 60 fps < 120 fps ≥ 120 fps | | | | | | | < 30 fps < 60 fps < 120 fps ≥ 120 fps | 2 2 | 3 1 | 4 | 2 | 1 | 1 2 1 |
For more games that might be playable and a list of all games and graphics cards visit our Gaming List