Notebookcheck Logo

NVIDIA GeForce GTX 750 Ti vs AMD Radeon Pro 450

NVIDIA GeForce GTX 750 Ti

► remove from comparison NVIDIA GeForce GTX 750 Ti

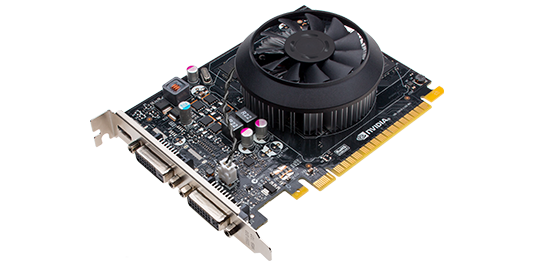
The NVIDIA GeForce GTX 750 Ti is a mid-range desktop graphics card that was announced early 2014. It is based on the first generation of the Maxwell architecture, namely the GM107 chip. Maxwell sets its focus on energy efficiency and was able to outperform the predecessor Kepler and AMD chips in similar performance regions. The GTX 750 Ti supports DirectX 11.2 but only feature level 11_0.

The GeForce GTX 750 Ti is comparable to the Nvidia Geforce GTX 860M for laptops that features the same chip with slightly slower clock rates and therefore also performance.

The 3D performance lies between the Radeon R7 260X and R7 265X from AMD or between the GTX 750 and GTX 660 from Nvidia. In our tests, the 750 Ti was not able to achieve playable framerates in demanding games and highest settings in 1920x1080 (see benchmarks below).

The power consumption as already mentioned is a strong suite for the GTX 750 Ti and it excels the e.g. slightly slower Radeon R7 260X by a great margin (gaming).

AMD Radeon Pro 450

► remove from comparison AMD Radeon Pro 450

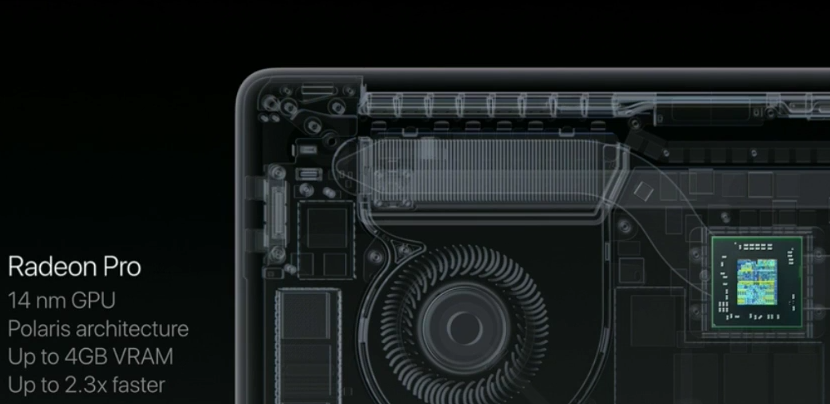
The AMD Radeon Pro 450 is mobile graphics card for laptops that can be found in the entry-level model of the Apple MacBook Pro Retina 15 Late 2016. It is based on the small Polaris 11 chip which is manufactured in 14 nm FinFET at Globalfoundries. Compared to the similar Radeon RX 460 (see for benchmarks), the Pro 450 features only 640 shaders (compared to the 896) and achieves a peak performance of 1 TFLOPS (versus the 2.2 of the RX 460). The Pro 455 is 30% faster with 1.3 TFLOPS and the Pro 460 86% faster (peak performance).

The graphics performance in our first tests (e.g. 3DMark 11) is slightly above a GeForce GTX 950M. A major drawback is the small VRAM size of only 2 GB GDDR5. Furthermore, Apple and AMD don't provide driver updates for Windows using Bootcamp. The only option is to use modified drivers from BootcampDrivers.com.

The features of the Radeon Pro 450 are identical to the faster RX 460 and all other Polaris chips. See more details on the Polaris architecture here. According to AMD the Pro 450 supports DisplayPort 1.2 (although the Polaris chips should support 1.4) and HDMI 2.0 via USB-C adapter.

The power envelope of the faster Radeon Pro 460 is rated at 35 Watt according to the AMD blog post. Due to the slower specs, the Radeon Pro 450 should use slightly less.

NVIDIA GeForce GTX 750 TiAMD Radeon Pro 450
Radeon RX 400M Series
GeForce GTX 780 Ti compare 2880 @ 0.88 - 0.93 GHz384 Bit @ 3500 MHz
GeForce GTX 760 compare 1152 @ 0.98 - 1.03 GHz256 Bit @ 3000 MHz
GeForce GTX 750 Ti 640 @ 1.02 - 1.09 GHz128 Bit @ 2700 MHz
Radeon RX 480 (Laptop) compare 2304 256 Bit
Radeon RX 490M compare
Radeon RX 460 (Laptop) compare 896 @ 1.18 GHz128 Bit @ 6000 MHz
Radeon Pro 460 compare 1024 @ 0.9 GHz128 Bit @ 5000 MHz
Radeon Pro 455 compare 768 @ 0.86 GHz128 Bit @ 5000 MHz
Radeon Pro 450 640 @ 0.8 GHz128 Bit @ 5080 MHz
CodenameGM107Polaris 11
ArchitectureMaxwellPolaris
Pipelines640 - unified640 - unified
Core Speed1020 - 1085 (Boost) MHz800 MHz
Memory Speed2700 MHz5080 MHz
Memory Bus Width128 Bit128 Bit
Memory TypeGDDR5GDDR5
Max. Amount of Memory2048 MB2048 MB
Shared Memorynono
APIDirectX 11.2, Shader 5.0, OpenGL 4.4DirectX 12, OpenGL Vulkan
Power Consumption60 Watt75 Watt
Transistors1.9 Billion3 Billion
technology28 nm14 nm
Features3D Vision, PhysX, CUDA, GPU Boost 2.0, GeForce Experience, Adaptive VSyncDisplayPort 1.3 HBR / 1.4 HDR Ready, HDMI 2.0, AMD FreeSync
Date of Announcement18.02.2014 27.10.2016
Link to Manufacturer Pagewww.nvidia.decreators.radeon.com
Notebook Sizelarge

Benchmarks

Performance Rating - 3DMark 11 + Fire Strike + Time Spy - GeForce GTX 750 Ti
1.6 pt (5%)
Restrict / Search: Model: Max. age: years
3DMark - 3DMark Time Spy Score
1074 Points (3%)
3DMark - 3DMark Time Spy Graphics
952 Points (2%)
3DMark - 3DMark Ice Storm Unlimited Graphics
200518 Points (20%)
3DMark - 3DMark Cloud Gate Score
17949 Points (17%)
14305 Points (14%)
3DMark - 3DMark Cloud Gate Graphics
31349 Points (8%)
21533 Points (5%)
3DMark - 3DMark Fire Strike Standard Score
4022 Points (6%)
3DMark - 3DMark Fire Strike Standard Graphics
4294 Points (4%)
3DMark - 3DMark Ice Storm Graphics
238977 Points (26%)
3DMark 11 - 3DM11 Performance Score
5741 Points (7%)
3DMark 11 - 3DM11 Performance GPU
5378 Points (4%)
3DMark Vantage
3DM Vant. Perf. total + NVIDIA GeForce GTX 750 Ti
3DMark Vantage - 3DM Vant. Perf. total
21608 Points (6%)
3DM Vant. Perf. total + AMD Radeon Pro 450
3DM Vant. Perf. GPU no PhysX + NVIDIA GeForce GTX 750 Ti
3DMark Vantage - 3DM Vant. Perf. GPU no PhysX
20401 Points (11%)
3DM Vant. Perf. GPU no PhysX + AMD Radeon Pro 450
3DMark 06 3DMark 06 - Standard 1280x1024 + AMD Radeon Pro 450
3DMark 06
24189 Points (32%)
Unigine Heaven 3.0 - Unigine Heaven 3.0 DX 11
54.3 fps (18%)
Unigine Heaven 2.1 - Heaven 2.1 high
75.2 fps (14%)
Cinebench R15
Cinebench R15 OpenGL 64 Bit + AMD Radeon Pro 450
Cinebench R15 - Cinebench R15 OpenGL 64 Bit
69.8 fps (4%)
Cinebench R15 OpenGL Ref. Match 64 Bit + AMD Radeon Pro 450
Cinebench R15 - Cinebench R15 OpenGL Ref. Match 64 Bit
99.5 % (100%)
LuxMark v2.0 64Bit - LuxMark v2.0 Room GPU
394 Samples/s (1%)
LuxMark v2.0 64Bit - LuxMark v2.0 Sala GPU
774 Samples/s (1%)
ComputeMark v2.1 - ComputeMark v2.1 Result
2589 Points (2%)
Power Consumption - The Witcher 3 Power Consumption - external Monitor *
44.5 Watt (6%)

Average Benchmarks NVIDIA GeForce GTX 750 Ti → 100% n=8

Average Benchmarks AMD Radeon Pro 450 → 75% n=8

- Range of benchmark values for this graphics card
red legend - Average benchmark values for this graphics card
* Smaller numbers mean a higher performance
1 This benchmark is not used for the average calculation

Game Benchmarks

The following benchmarks stem from our benchmarks of review laptops. The performance depends on the used graphics memory, clock rate, processor, system settings, drivers, and operating systems. So the results don't have to be representative for all laptops with this GPU. For detailed information on the benchmark results, click on the fps number.

low 1280x720
Radeon Pro 450:
38.9  fps
med. 1920x1080
Radeon Pro 450:
12  fps
F1 2017

F1 2017

2017
low 1280x720
Radeon Pro 450:
95  fps
med. 1920x1080
Radeon Pro 450:
41  fps
high 1920x1080
Radeon Pro 450:
33  fps
low 1280x720
Radeon Pro 450:
63.3  fps
high 1920x1080
Radeon Pro 450:
47.5  fps
4K 3840x2160
Radeon Pro 450:
19.3  fps
low 1280x720
Radeon Pro 450:
68.2  fps
med. 1920x1080
Radeon Pro 450:
26.5  fps
high 1920x1080
Radeon Pro 450:
16.4  fps
low 1280x720
Radeon Pro 450:
48.2  fps
med. 1920x1080
Radeon Pro 450:
21.3  fps
high 1920x1080
Radeon Pro 450:
18.5  fps
ultra 1920x1080
Radeon Pro 450:
8  fps
For Honor

For Honor

2017
low 1280x720
Radeon Pro 450:
82.3  fps
med. 1920x1080
Radeon Pro 450:
29.3  fps
high 1920x1080
Radeon Pro 450:
27.9  fps
ultra 1920x1080
Radeon Pro 450:
19.4  fps
low 1280x720
Radeon Pro 450:
47.4  fps
high 1920x1080
Radeon Pro 450:
17.6  fps
low 1280x720
Radeon Pro 450:
29.5  fps
low 1280x720
Radeon Pro 450:
58.7  fps
high 1920x1080
Radeon Pro 450:
36  fps
high 1920x1080
Radeon Pro 450:
63.4  fps
ultra 1920x1080
Radeon Pro 450:
24.7  fps
low 1280x720
Radeon Pro 450:
101  fps
high 1920x1080
Radeon Pro 450:
24.2  fps
ultra 1920x1080
Radeon Pro 450:
21.7  fps
low 1024x768
Radeon Pro 450:
61  fps
high 1920x1080
Radeon Pro 450:
25.8  fps
Mafia 3

Mafia 3

2016
low 1280x720
Radeon Pro 450:
28.3  fps
low 1280x720
Radeon Pro 450:
51.2  fps
high 1920x1080
Radeon Pro 450:
17.4 18.3 ~ 18 fps
ultra 1920x1080
Radeon Pro 450:
7.5  fps
Overwatch

Overwatch

2016
low 1280x720
Radeon Pro 450:
153  fps
high 1920x1080
Radeon Pro 450:
57  fps
ultra 1920x1080
Radeon Pro 450:
39.5  fps
Doom

Doom

2016
low 1280x720
Radeon Pro 450:
53.4  fps
high 1920x1080
Radeon Pro 450:
20.4  fps
low 1280x720
Radeon Pro 450:
77  fps
high 1920x1080
Radeon Pro 450:
21.6  fps
ultra 1920x1080
Radeon Pro 450:
15.8  fps
med. 1920x1080
Radeon Pro 450:
29  fps
high 1920x1080
Radeon Pro 450:
26  fps
ultra 1920x1080
Radeon Pro 450:
17  fps
XCOM 2

XCOM 2

2016
low 1280x720
Radeon Pro 450:
63.7  fps
med. 1920x1080
Radeon Pro 450:
24.2  fps
high 1920x1080
Radeon Pro 450:
15.5  fps
ultra 1920x1080
Radeon Pro 450:
5.6  fps
low 1024x768
Radeon Pro 450:
66.6  fps
high 1920x1080
Radeon Pro 450:
20.7 20.9 ~ 21 fps
high 1920x1080
Radeon Pro 450:
39.6  fps
ultra 1920x1080
Radeon Pro 450:
34.1  fps
Fallout 4

Fallout 4

2015
low 1280x720
Radeon Pro 450:
70  fps
high 1920x1080
Radeon Pro 450:
24.1  fps
Anno 2205

Anno 2205

2015
low 1024x768
Radeon Pro 450:
87  fps
high 1920x1080
Radeon Pro 450:
18.3  fps
ultra 1920x1080
Radeon Pro 450:
44.6  fps
ultra 1920x1080
Radeon Pro 450:
67.2  fps
low 1024x768
Radeon Pro 450:
40.9  fps
high 1920x1080
Radeon Pro 450:
20.3  fps
F1 2014

F1 2014

2014
low 1024x768
100%
GeForce GTX 750 Ti:
133  fps
med. 1366x768
100%
GeForce GTX 750 Ti:
130  fps
high 1920x1080
100%
GeForce GTX 750 Ti:
125  fps
ultra 1920x1080
100%
GeForce GTX 750 Ti:
98  fps
low 1024x768
100%
GeForce GTX 750 Ti:
65.4  fps
med. 1366x768
100%
GeForce GTX 750 Ti:
55  fps
high 1920x1080
100%
GeForce GTX 750 Ti:
31.6  fps
low 1024x768
100%
GeForce GTX 750 Ti:
77.4  fps
med. 1366x768
100%
GeForce GTX 750 Ti:
53.5  fps
high 1920x1080
100%
GeForce GTX 750 Ti:
25.7  fps
ultra 1920x1080
100%
GeForce GTX 750 Ti:
23.8  fps
low 1024x768
100%
GeForce GTX 750 Ti:
196.3  fps
med. 1366x768
100%
GeForce GTX 750 Ti:
129  fps
high 1920x1080
100%
GeForce GTX 750 Ti:
65  fps
ultra 1920x1080
100%
GeForce GTX 750 Ti:
46.2  fps
low 1280x720
100%
GeForce GTX 750 Ti:
126.4  fps
med. 1344x756
100%
GeForce GTX 750 Ti:
76.4  fps
high 1920x1080
100%
GeForce GTX 750 Ti:
43.4  fps
ultra 1920x1080
100%
GeForce GTX 750 Ti:
29.2  fps
Fifa 15

Fifa 15

2014
low 1280x720
100%
GeForce GTX 750 Ti:
253.2  fps
high 1366x768
100%
GeForce GTX 750 Ti:
178.1  fps
ultra 1920x1080
100%
GeForce GTX 750 Ti:
134.8  fps
Sims 4

Sims 4

2014
low 1024x768
100%
GeForce GTX 750 Ti:
172.5  fps
med. 1366x768
100%
GeForce GTX 750 Ti:
94.8  fps
high 1920x1080
100%
GeForce GTX 750 Ti:
71.9  fps
ultra 1920x1080
100%
GeForce GTX 750 Ti:
63  fps
low 1024x768
100%
GeForce GTX 750 Ti:
57  fps
med. 1366x768
100%
GeForce GTX 750 Ti:
67.2  fps
high 1920x1080
100%
GeForce GTX 750 Ti:
46  fps
ultra 1920x1080
100%
GeForce GTX 750 Ti:
37.4  fps
low 1024x768
100%
GeForce GTX 750 Ti:
262.4  fps
med. 1366x768
100%
GeForce GTX 750 Ti:
153.6  fps
high 1920x1080
100%
GeForce GTX 750 Ti:
100.1  fps
ultra 1920x1080
100%
GeForce GTX 750 Ti:
52.6  fps
low 1024x768
100%
GeForce GTX 750 Ti:
85.7  fps
med. 1366x768
100%
GeForce GTX 750 Ti:
72.4  fps
high 1920x1080
100%
GeForce GTX 750 Ti:
29.4  fps
low 1280x720
100%
GeForce GTX 750 Ti:
60  fps
med. 1280x720
100%
GeForce GTX 750 Ti:
60  fps
high 1920x1080
100%
GeForce GTX 750 Ti:
58.4  fps
low 1024x768
100%
GeForce GTX 750 Ti:
99.1  fps
med. 1366x768
100%
GeForce GTX 750 Ti:
97.1  fps
high 1366x768
100%
GeForce GTX 750 Ti:
85.1  fps
ultra 1920x1080
100%
GeForce GTX 750 Ti:
44  fps
Thief

Thief

2014
low 1024x768
100%
GeForce GTX 750 Ti:
91.9  fps
med. 1366x768
100%
GeForce GTX 750 Ti:
63.2  fps
high 1366x768
100%
GeForce GTX 750 Ti:
53.4  fps
ultra 1920x1080
100%
GeForce GTX 750 Ti:
27.6  fps
low 1024x768
100%
GeForce GTX 750 Ti:
150.7  fps
med. 1366x768
100%
GeForce GTX 750 Ti:
99.3  fps
high 1366x768
100%
GeForce GTX 750 Ti:
58.6  fps
ultra 1920x1080
100%
GeForce GTX 750 Ti:
34.6  fps
low 1024x768
100%
GeForce GTX 750 Ti:
162.3  fps
med. 1366x768
100%
GeForce GTX 750 Ti:
116.3  fps
high 1366x768
100%
GeForce GTX 750 Ti:
81.8  fps
ultra 1920x1080
100%
GeForce GTX 750 Ti:
33.3  fps
low 1280x720
100%
GeForce GTX 750 Ti:
99.6  fps
med. 1366x768
100%
GeForce GTX 750 Ti:
87.3  fps
high 1366x768
100%
GeForce GTX 750 Ti:
56.1  fps
ultra 1920x1080
100%
GeForce GTX 750 Ti:
34.3  fps
Dota 2

Dota 2

2013
low 1024x768
100%
GeForce GTX 750 Ti:
119.9  fps
med. 1366x768
100%
GeForce GTX 750 Ti:
119.6  fps
ultra 1920x1080
100%
GeForce GTX 750 Ti:
100.2  fps
GRID 2

GRID 2

2013
low 1024x768
100%
GeForce GTX 750 Ti:
191.9  fps
med. 1366x768
100%
GeForce GTX 750 Ti:
152.3  fps
high 1366x768
100%
GeForce GTX 750 Ti:
144  fps
ultra 1920x1080
100%
GeForce GTX 750 Ti:
54.1  fps
low 1024x768
100%
GeForce GTX 750 Ti:
123.6  fps
med. 1366x768
100%
GeForce GTX 750 Ti:
103  fps
high 1366x768
100%
GeForce GTX 750 Ti:
58.8  fps
ultra 1920x1080
100%
GeForce GTX 750 Ti:
30.9  fps
low 1280x720
100%
GeForce GTX 750 Ti:
233.3  fps
med. 1366x768
100%
GeForce GTX 750 Ti:
140  fps
high 1366x768
100%
GeForce GTX 750 Ti:
122.2  fps
ultra 1920x1080
100%
GeForce GTX 750 Ti:
46.7  fps
low 1024x768
100%
GeForce GTX 750 Ti:
347.4  fps
med. 1366x768
100%
GeForce GTX 750 Ti:
179.3  fps
high 1366x768
100%
GeForce GTX 750 Ti:
109.9  fps
ultra 1920x1080
100%
GeForce GTX 750 Ti:
49.5  fps
Crysis 3

Crysis 3

2013
low 1024x768
100%
GeForce GTX 750 Ti:
133.8  fps
med. 1366x768
100%
GeForce GTX 750 Ti:
81.9  fps
high 1366x768
100%
GeForce GTX 750 Ti:
54.3  fps
ultra 1920x1080
100%
GeForce GTX 750 Ti:
20.4  fps
Far Cry 3

Far Cry 3

2012
low 1024x768
100%
GeForce GTX 750 Ti:
132.6  fps
med. 1366x768
100%
GeForce GTX 750 Ti:
118.7  fps
high 1366x768
100%
GeForce GTX 750 Ti:
68.3  fps
ultra 1920x1080
100%
GeForce GTX 750 Ti:
24.8  fps
low 1024x768
100%
GeForce GTX 750 Ti:
95.4  fps
med. 1366x768
100%
GeForce GTX 750 Ti:
89.2  fps
high 1366x768
100%
GeForce GTX 750 Ti:
57.8  fps
ultra 1920x1080
100%
GeForce GTX 750 Ti:
27.1  fps
low 1024x768
100%
GeForce GTX 750 Ti:
124.4  fps
high 1366x768
100%
GeForce GTX 750 Ti:
66.8  fps
ultra 1920x1080
100%
GeForce GTX 750 Ti:
31.9  fps

Average Gaming NVIDIA GeForce GTX 750 Ti → 100%

Average Gaming 30-70 fps → 100%

NVIDIA GeForce GTX 750 TiAMD Radeon Pro 450
lowmed.highultraQHD4Klowmed.highultraQHD4K
Ark Survival Evolved38.912
F1 2017954133
Playerunknown's Battlegrounds (PUBG)63.3
Rocket League47.519.3
Mass Effect Andromeda68.226.516.4
Ghost Recon Wildlands48.221.318.58
For Honor82.329.327.919.4
Watch Dogs 247.417.6
Dishonored 229.5
Call of Duty Infinite Warfare58.736
Farming Simulator 1763.424.7
Battlefield 110124.221.7
Civilization 66125.8
Mafia 328.3
Deus Ex Mankind Divided51.2187.5
Overwatch1535739.5
Doom53.420.4
The Division7721.615.8
Far Cry Primal292617
XCOM 263.724.215.55.6
Rise of the Tomb Raider66.621
Rainbow Six Siege39.634.1
Fallout 47024.1
Anno 22058718.3
World of Warships44.6
Dota 2 Reborn67.2
The Witcher 340.920.3
NVIDIA GeForce GTX 750 TiAMD Radeon Pro 450
lowmed.highultraQHD4Klowmed.highultraQHD4K
< 30 fps
< 60 fps
< 120 fps
≥ 120 fps


< 30 fps
< 60 fps
< 120 fps
≥ 120 fps
2
7
11
1
6
1

15
5
1
8
3
1


1


For more games that might be playable and a list of all games and graphics cards visit our Gaming List

Add one or more devices and compare

In the following list you can select (and also search for) devices that should be added to the comparison. You can select more than one device.

restrict list:
v1.33
log 30. 22:25:42

#0 ran 0s before starting gpusingle class +0s ... 0s

#1 checking url part for id 5600 +0s ... 0s

#2 checking url part for id 7590 +0s ... 0s

#3 redirected to Ajax server, took 1753907142s time from redirect:0 +0s ... 0s

#4 did not recreate cache, as it is less than 5 days old! Created at Mon, 28 Jul 2025 05:18:01 +0200 +0s ... 0s

#5 composed specs +0.035s ... 0.035s

#6 did output specs +0s ... 0.035s

#7 start showIntegratedCPUs +0s ... 0.035s

#8 getting avg benchmarks for device 5600 +0.014s ... 0.048s

#9 got single benchmarks 5600 +0.003s ... 0.052s

#10 getting avg benchmarks for device 7590 +0s ... 0.052s

#11 got single benchmarks 7590 +0.005s ... 0.057s

#12 got avg benchmarks for devices +0s ... 0.057s

#13 min, max, avg, median took s +0.011s ... 0.068s

#14 before gaming benchmark output +0s ... 0.068s

#15 Got 158 rows for game benchmarks. +0.007s ... 0.075s

#16 composed SQL query for gamebenchmarks +0s ... 0.075s

#17 got data and put it in $dataArray +0.002s ... 0.077s

#18 benchmarks composed for output. +0.016s ... 0.093s

#19 calculated avg scores. +0s ... 0.093s

#20 return log +0.002s ... 0.095s

Please share our article, every link counts!
Mail Logo
> Expert Reviews and News on Laptops, Smartphones and Tech Innovations > Benchmarks / Tech > Graphics Card Comparison - Head 2 Head
Redaktion, 2017-09- 8 (Update: 2023-07- 1)