

NVIDIA GeForce 610M vs Intel HD Graphics (Broadwell)
NVIDIA GeForce 610M
► remove from comparisonThe NVIDIA GeForce 610M is an entry level dedicated laptop graphics card and based on the same GF119 chip like the Geforce GT 520M, GeForce GT 520MX and Geforce 710M. The clock rates can be up to 900MHz like the 520MX but also variants with lower clocks than the GT 520M can be found (e.g. Acer Aspire 5750G wat 672 MHz). Using DDR3, the 64 Bit memory bus may become a bottleneck for the graphics card.
Architecture
The GF119 offers 48 ALUs, 8 texture units and a 64 Bit memory interface for DDR3-VRAM. Therefore, it is similar to a half GF108 (GeForce GT 540M) but is manufactured with optimized transistors. As a difference the amount of raster-operation-processors (ROP) stayed the same at 4. The GF119 is the smallest chip of the Fermi generation and is used for low-end laptops.
Performance
As an entry level card, the (GT) 610M has to compete against the Intel HD Graphics 3000 and HD Graphics 4000. The performance depends on the chip clock speeds of the 610M and therefore ranges between the GeForce GT 520M and GT 520MX. Therefore demanding games like Crysis 2 or Mafia 2 run fluently only in the lowest detail and resolutions. Less demanding games like Fifa 11 or Sims 3 should be playable even in high detail settings.
Features
Like 500M series chips, the 610M supports Bitstream HD Audio (Blu-Ray) output via HDMI. That means the card is able to transfer Dolby True HD and DTS-HD bitstream-wise to a HiFi receiver without quality loss.
The 610M offers the PureVideo HD technology for video decoding. The included Video Processor 5 (VP5) supports feature set D and therefore the GPU is able to fully decode MPEG-1, MPEG-2, MPEG-4 Part 2 (MPEG-4 ASP - e.g., DivX or Xvid), VC-1/WMV9, and H.264 (VLD, IDCT, Motion Compensation, and Deblocking). Compared to the older VP4, the VP5 offers faster decodes at lower power, HD-to-SD transcodes and 4K x 4K resolution H.264 decode support.
Furthermore, the GPU is able to decode two 1080p streams simultaneously (e.g. for Blu-Ray Picture-in-Picture).
Through CUDA, OpenCL, and DirectCompute 2.1 support, the GeForce GT 610M can be of help in general calculations. For example, the stream processor can encode videos considerably faster than a fast CPU can. Furthermore, physics calculations can be theoretically done by the GPU using PhysX (e.g. supported by Mafia 2 or Metro 2033) but the performance will not be sufficient for this.
Intel HD Graphics (Broadwell)
► remove from comparison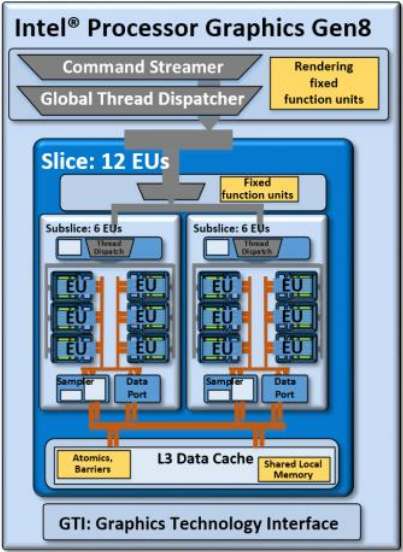
The Intel HD Graphics (Broadwell) (GT1) is an integrated Broadwell graphics card revealed in Q1 2015. It can be found in several low-end CPUs such as the Pentium 3805U or Celeron 3755U. The so-called GT1 GPU offers 12 EUs (Execution Units) and therefore somewhat more shader power than the previous HD Graphics (Haswell). The clock range may depend on the specific model it is built into.
Architecture and Features
Broadwell features a GPU based on the Intel Gen8 architecture, which has been optimized in various aspects compared to the previous Gen7.5 (Haswell). In case of the GT1 version, the shader arrays called "subslice" have been reorganized and now offer 6 Execution Units (EUs) each. Two subslices form a "slice" for a total of 12 EUs. Combined with other improvements such as larger L1 caches and an optimized frontend, the integrated GPU has become faster and more efficient than its predecessor.
The HD Graphics (Broadwell) represents the low-end version of the Broadwell GPU family and consists of one slice with 12 EUs. Beyond that, there is also a mid-range variant (GT2, 24 EUs) as well as higher-end models (GT3/GT3e + eDRAM, 48 EUs).
All Broadwell GPUs support OpenCL 2.0 and DirectX 12 (FL 11_1). The video engine can now decode H.265 using both fixed function hardware as well as available GPU shaders. Up to three displays can be connected via DP 1.2/eDP 1.3 (max. 3840 x 2160 @ 60 Hz) or HDMI 1.4a (max. 3840 x 2160 @ 24 Hz). HDMI 2.0, however, is not supported.
Performance
Even though the HD Graphics (Broadwell) is clocked a bit lower, the performance should be clearly above the HD Graphics (Haswell) and similar to the HD Graphics 4000. Nevertheless, only a few games as of 2014/2015 will run fluently at (very) low settings, e.g. Dota 2 or Sims 4.
Power Consumption
Utilizing a new 14 nm process, the HD Graphics (Broadwell) can be found in ULV models (15 W) as well as regular dual core CPUs (37 W, not yet presented). The TDP is flexible and can be further reduced, which has a significant impact on performance.
| NVIDIA GeForce 610M | Intel HD Graphics (Broadwell) | ||||||||||||||||||||||||||||||||||||||||||||||||||||||||||||||||||||||
| Codename | N13M-GE | Broadwell GT1 | |||||||||||||||||||||||||||||||||||||||||||||||||||||||||||||||||||||
| Architecture | Fermi | Gen. 8 Broadwell | |||||||||||||||||||||||||||||||||||||||||||||||||||||||||||||||||||||
| Pipelines | 48 - unified | 12 - unified | |||||||||||||||||||||||||||||||||||||||||||||||||||||||||||||||||||||
| Core Speed | 672 - 900 (Boost) MHz | 100 - 850 (Boost) MHz | |||||||||||||||||||||||||||||||||||||||||||||||||||||||||||||||||||||
| Shader Speed | 1344 - 1800 MHz | ||||||||||||||||||||||||||||||||||||||||||||||||||||||||||||||||||||||
| Memory Speed | 1800 MHz | ||||||||||||||||||||||||||||||||||||||||||||||||||||||||||||||||||||||
| Memory Bus Width | 64 Bit | 64/128 Bit | |||||||||||||||||||||||||||||||||||||||||||||||||||||||||||||||||||||
| Memory Type | DDR3 | ||||||||||||||||||||||||||||||||||||||||||||||||||||||||||||||||||||||
| Shared Memory | no | yes | |||||||||||||||||||||||||||||||||||||||||||||||||||||||||||||||||||||
| API | DirectX 11, Shader 5.0, OpenGL 4.0 | DirectX 12 (FL 11_1), OpenGL 4.3 | |||||||||||||||||||||||||||||||||||||||||||||||||||||||||||||||||||||
| Transistors | 585 Million | ||||||||||||||||||||||||||||||||||||||||||||||||||||||||||||||||||||||
| technology | 40 nm | 14 nm | |||||||||||||||||||||||||||||||||||||||||||||||||||||||||||||||||||||
| Date of Announcement | 06.12.2011 | 05.01.2015 | |||||||||||||||||||||||||||||||||||||||||||||||||||||||||||||||||||||
| HD Graphics Series |
| ||||||||||||||||||||||||||||||||||||||||||||||||||||||||||||||||||||||
| Features | QuickSync |
| |||||||||||||||||||||||||
Benchmarks
3DM Vant. Perf. total + NVIDIA GeForce 610M
Cinebench R15 OpenGL 64 Bit + Intel HD Graphics (Broadwell)
GFXBench T-Rex HD Offscreen C24Z16 + Intel HD Graphics (Broadwell)
Average Benchmarks NVIDIA GeForce 610M → 100% n=8
Average Benchmarks Intel HD Graphics (Broadwell) → 116% n=8
* Smaller numbers mean a higher performance
1 This benchmark is not used for the average calculation
Game Benchmarks
The following benchmarks stem from our benchmarks of review laptops. The performance depends on the used graphics memory, clock rate, processor, system settings, drivers, and operating systems. So the results don't have to be representative for all laptops with this GPU. For detailed information on the benchmark results, click on the fps number.


FIFA 16
2015
World of Warships
2015
Dirt Rally
2015
Battlefield Hardline
2015
F1 2014
2014
Sims 4
2014
GRID: Autosport
2014
Metro: Last Light
2013BioShock Infinite
2013
Tomb Raider
2013
Hitman: Absolution
2012Counter-Strike: GO
2012
Diablo III
2012
Star Wars: The Old Republic
2011
Anno 2070
2011

Battlefield 3
2011
Fifa 12
2011
F1 2011
2011

Dirt 3
2011
Crysis 2
2011

Mafia 2
2010
StarCraft 2
2010
Metro 2033
2010
Sims 3
2009
World of Warcraft
2005Average Gaming NVIDIA GeForce 610M → 100%
Average Gaming 30-70 fps → 100%
| NVIDIA GeForce 610M | Intel HD Graphics (Broadwell) | |||||||||||||
|---|---|---|---|---|---|---|---|---|---|---|---|---|---|---|
| low | med. | high | ultra | QHD | 4K | low | med. | high | ultra | QHD | 4K | |||
| Star Wars Battlefront | 15.3 | 8.5 | ||||||||||||
| FIFA 16 | 38.1 | 20.6 | ||||||||||||
| World of Warships | 29 | 20.8 | ||||||||||||
| Dirt Rally | 50 | 13.5 | ||||||||||||
| Battlefield Hardline | 23.9 | 16.4 | ||||||||||||
| Dragon Age: Inquisition | 13.9 | 9.4 | ||||||||||||
| F1 2014 | 34 | 24 | ||||||||||||
| Sims 4 | 113.6 | 26.3 | ||||||||||||
| GRID: Autosport | 57.6 | 22.6 | ||||||||||||
| Metro: Last Light | 13.7 | 10.7 | 7 | |||||||||||
| BioShock Infinite | 25.3 | 14.1 | 11.7 | |||||||||||
| Tomb Raider | 34.7 | 17.7 | 11.7 | |||||||||||
| Hitman: Absolution | 15.6 | 11.4 | 5.3 | |||||||||||
| Counter-Strike: GO | 43.7 | 31.5 | 23.9 | |||||||||||
| Diablo III | 38.4 | 24.9 | 19.7 | |||||||||||
| NVIDIA GeForce 610M | Intel HD Graphics (Broadwell) | |||||||||||||
| low | med. | high | ultra | QHD | 4K | low | med. | high | ultra | QHD | 4K | < 30 fps < 60 fps < 120 fps ≥ 120 fps | | | | | | | < 30 fps < 60 fps < 120 fps ≥ 120 fps | 7 7 1 | 13 1 | 7 | | | |
For more games that might be playable and a list of all games and graphics cards visit our Gaming List