Microsoft Surface Laptop 3 15-inch Core i7 Review: Better with Ice Lake
The 15-inch Microsoft Surface Laptop 3 consists of four major SKUs in the following order from least expensive to most expensive: the Ryzen 5 3580U, Core i5-1035G7, Ryzen 7 3780U, and the Core i7-1065G7. We recently checked out the AMD Ryzen 5 configuration to see what the Surface Laptop can offer at its base level. Today, we'll be checking out the Intel Core i7 SKU to see what the Surface Laptop can do when at its supposed best.
We recommend checking out our existing review on the Surface Laptop 3 Ryzen 5 SKU to learn more about the chassis, keyboard, display, and other external features as these characteristics are identical between the Intel and AMD models. This review will instead focus on any internal differences between the Intel Core i7 and AMD Ryzen 5 SKUs including temperature, power consumption, battery life and of course, performance. Comparing our Core i7 SKU with the Ryzen 7 SKU would have made for more interesting results, but that will have to wait until a future date when we can get our hands on a Ryzen 7 unit.
More Microsoft reviews:
Rating | Date | Model | Weight | Height | Size | Resolution | Price |
|---|---|---|---|---|---|---|---|
| 83.9 % v7 (old) | 12 / 2019 | Microsoft Surface Laptop 3 15 i7-1065G7 i7-1065G7, Iris Plus Graphics G7 (Ice Lake 64 EU) | 1.5 kg | 14.7 mm | 15.00" | 2496x1664 | |
| 86.3 % v7 (old) | 09 / 2019 | Dell XPS 15 7590 i5 iGPU FHD i5-9300H, UHD Graphics 630 | 1.9 kg | 17 mm | 15.60" | 1920x1080 | |
| 86 % v7 (old) | 12 / 2019 | Lenovo Yoga C940-15IRH i7-9750H, GeForce GTX 1650 Max-Q | 2 kg | 19.7 mm | 15.60" | 1920x1080 | |
| 83.9 % v7 (old) | 03 / 2019 | HP Spectre x360 15-df0126ng i7-8750H, GeForce GTX 1050 Ti Max-Q | 2.2 kg | 19.3 mm | 15.60" | 3840x2160 | |
| 89.7 % v7 (old) | 12 / 2019 | Apple MacBook Pro 16 2019 i9 5500M i9-9880H, Radeon Pro 5500M | 2 kg | 16.2 mm | 16.00" | 3072x1920 |
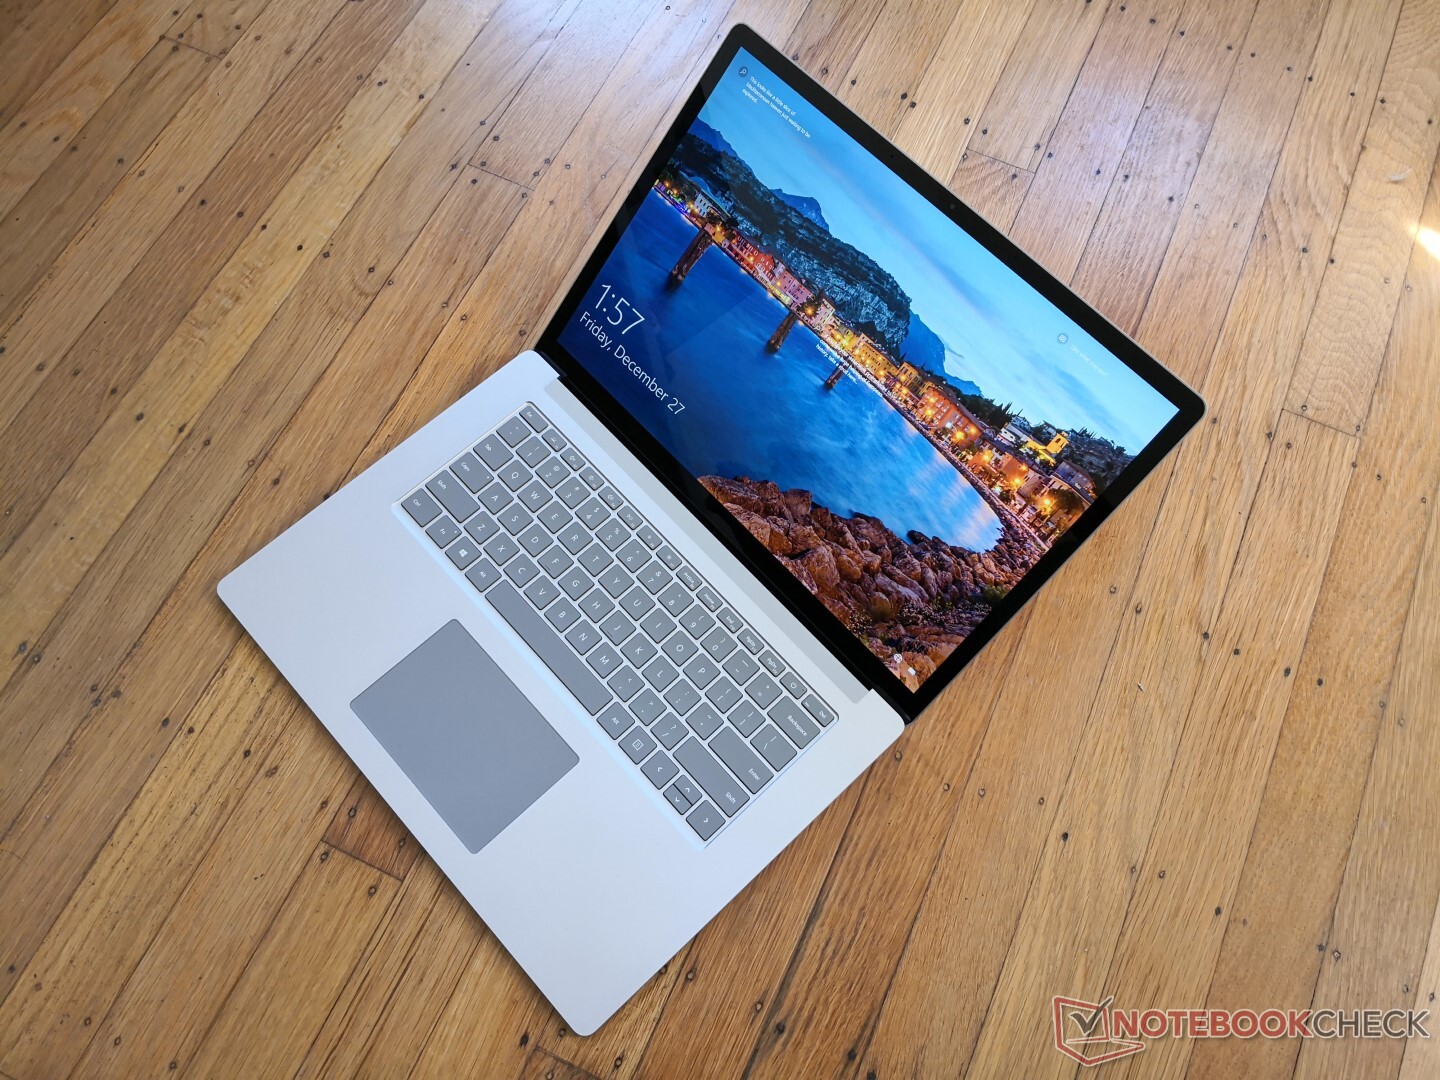
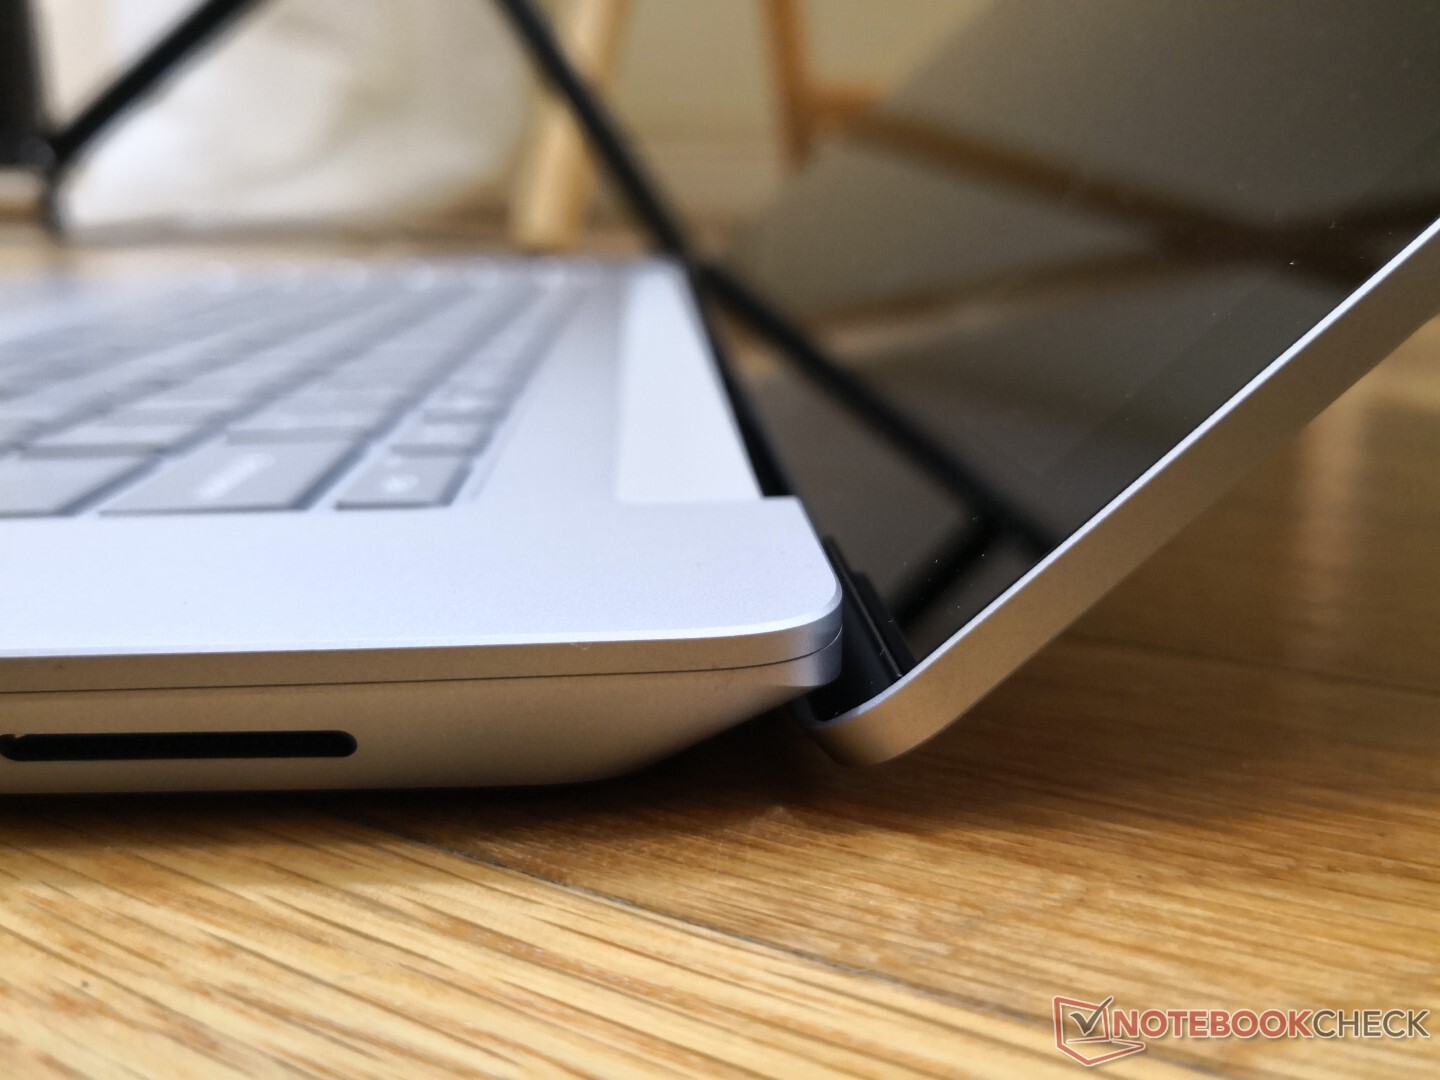
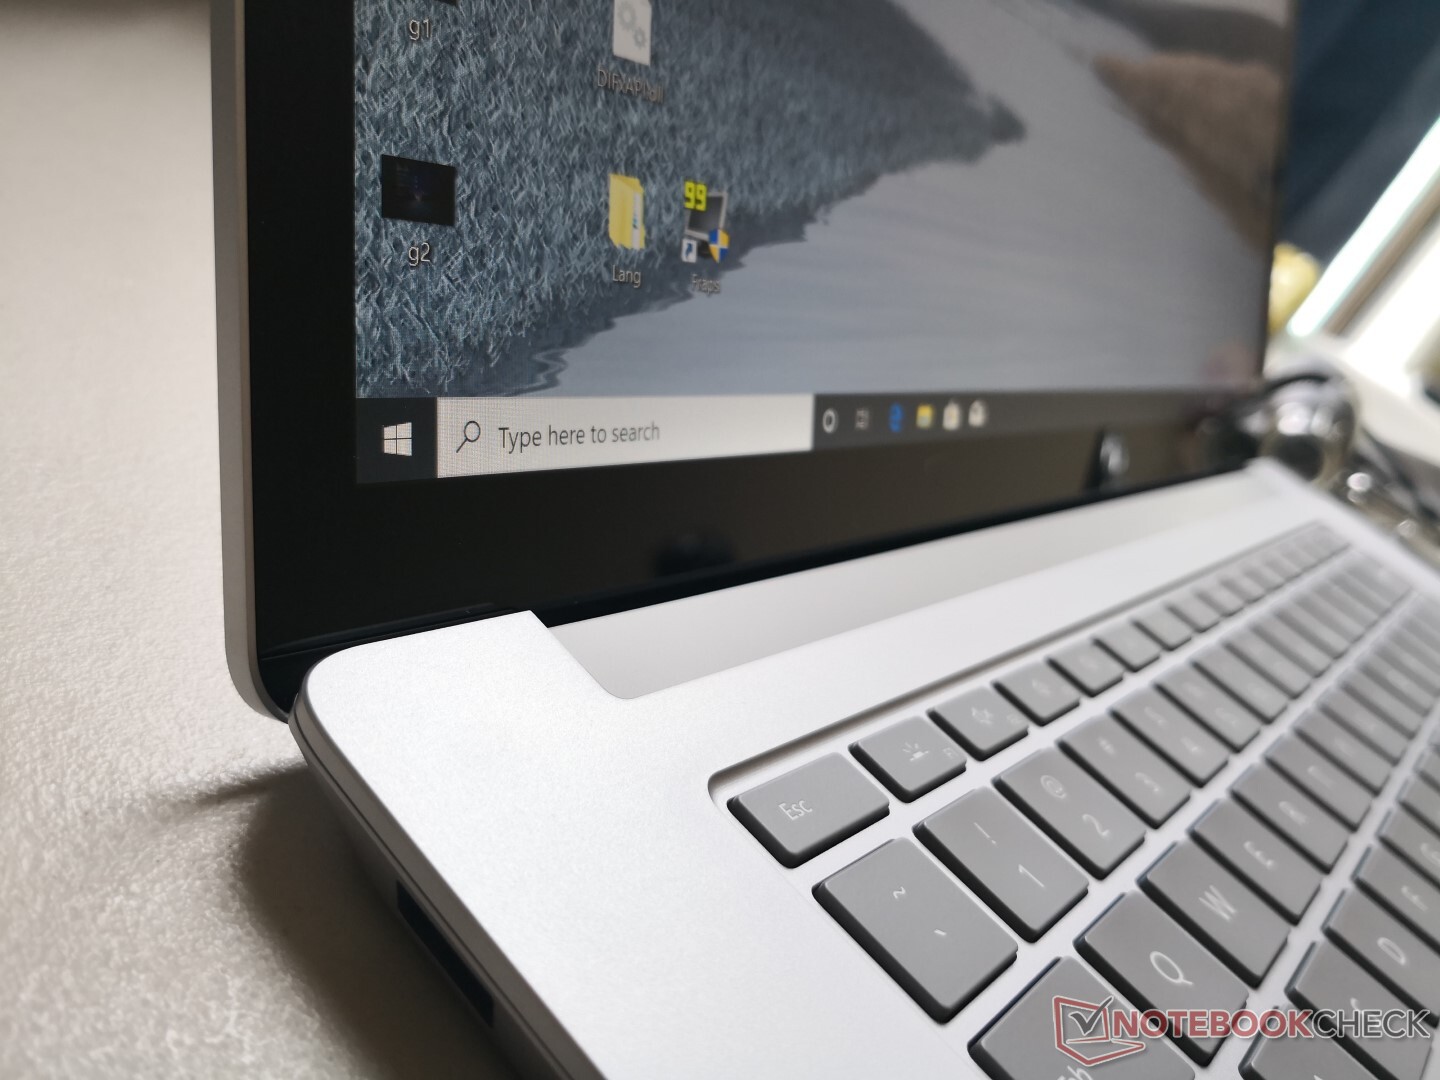
Case
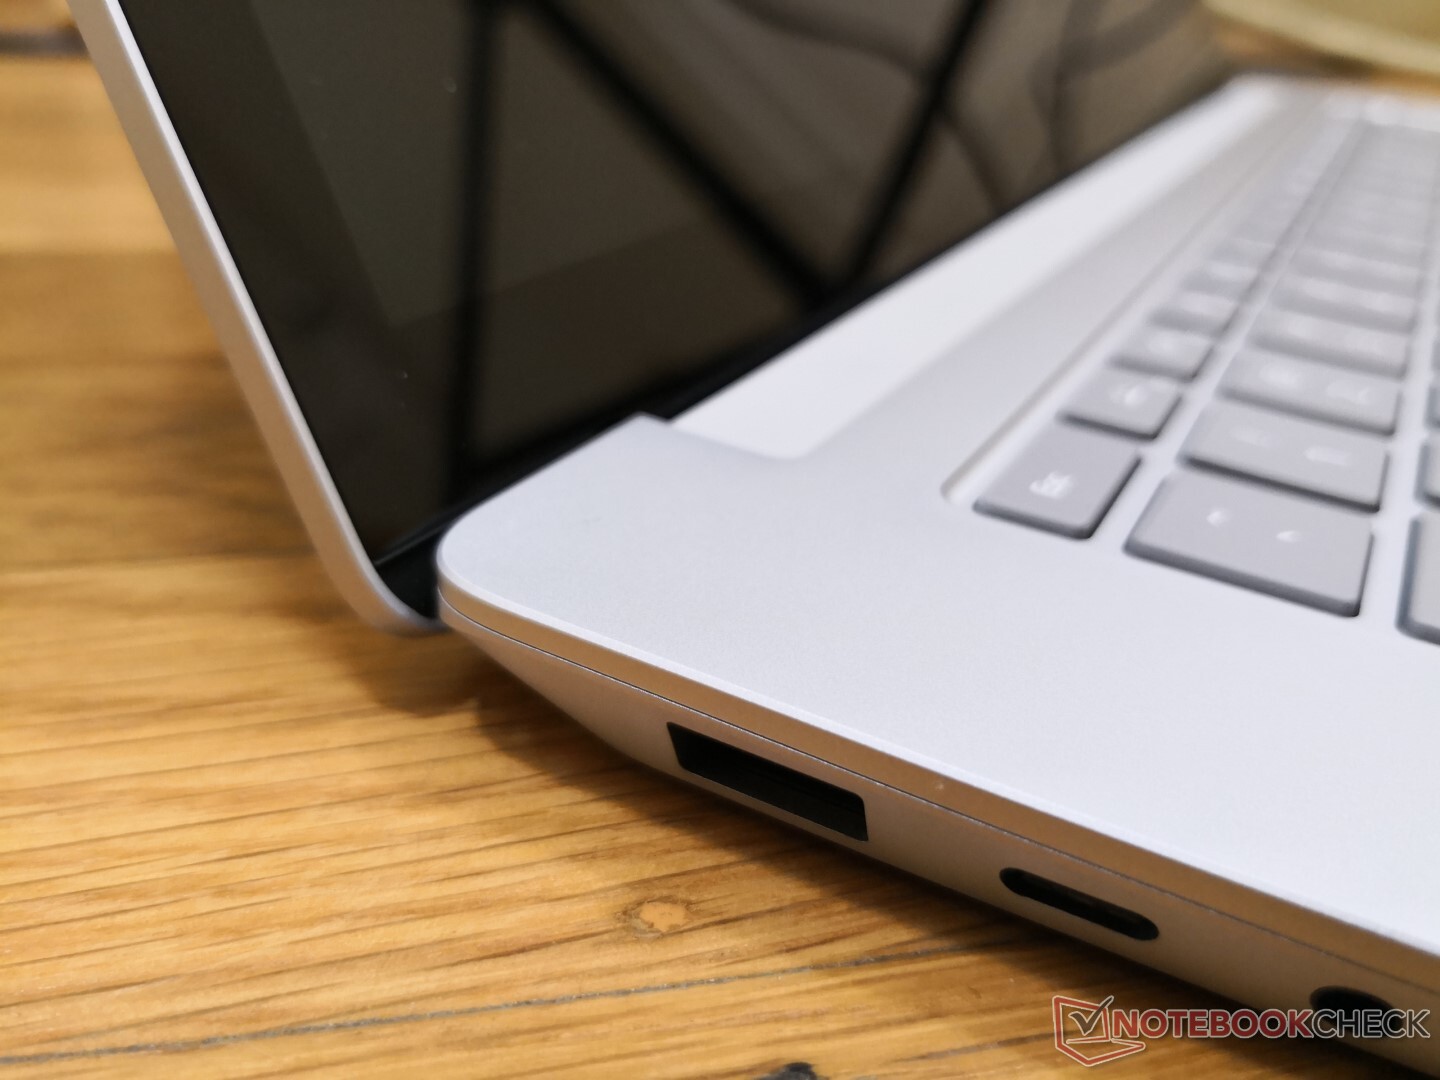

Connectivity
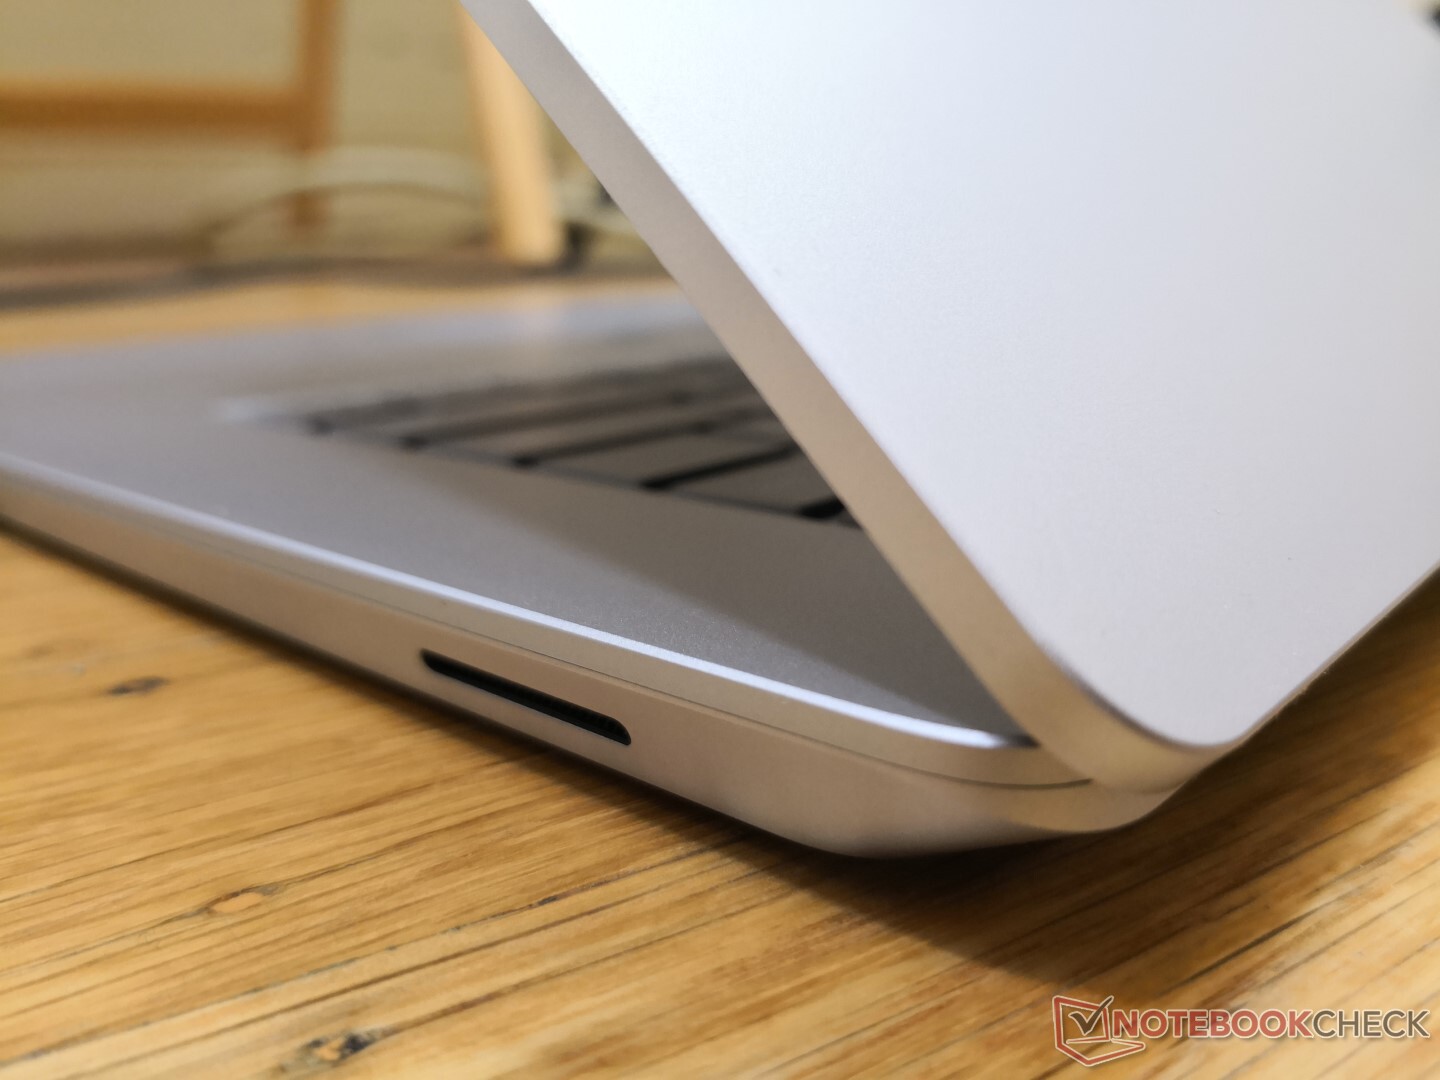
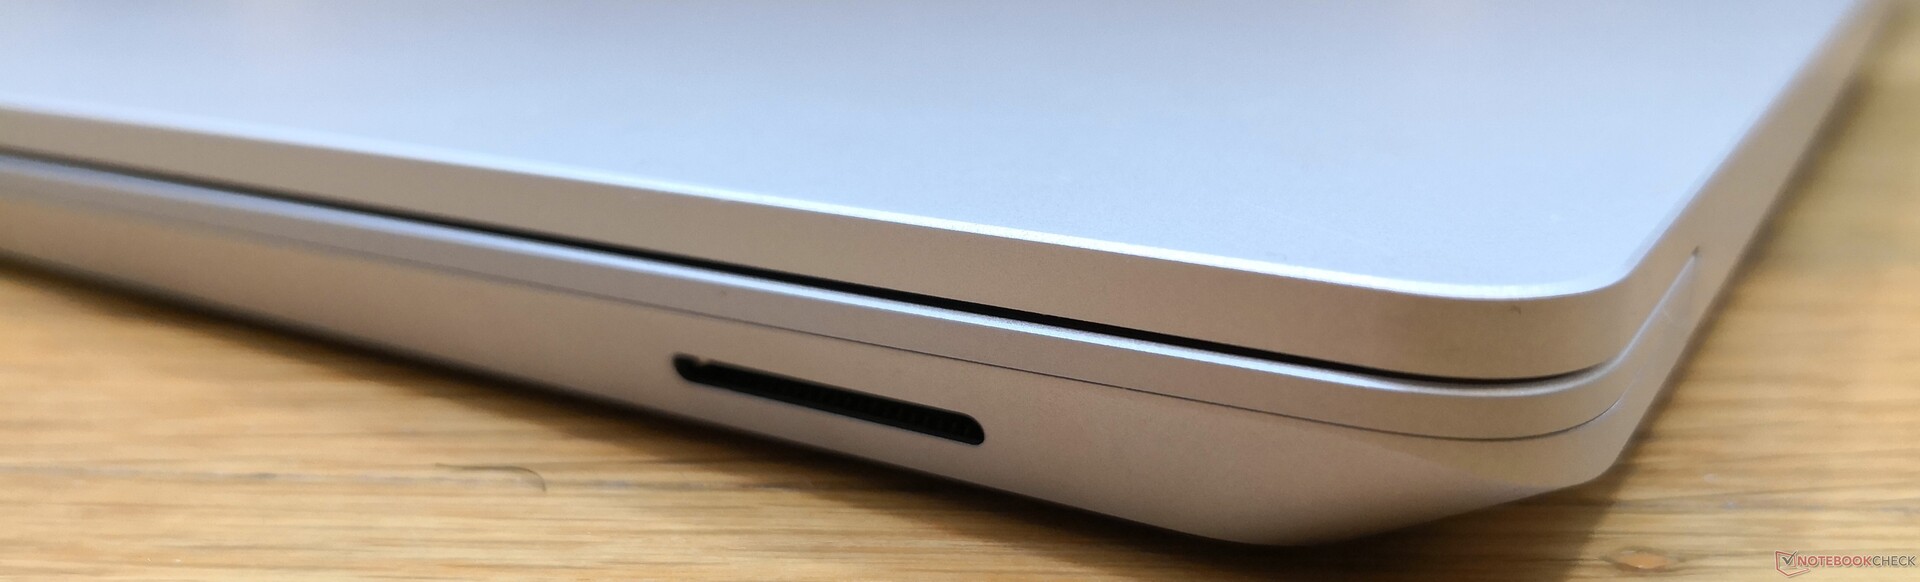
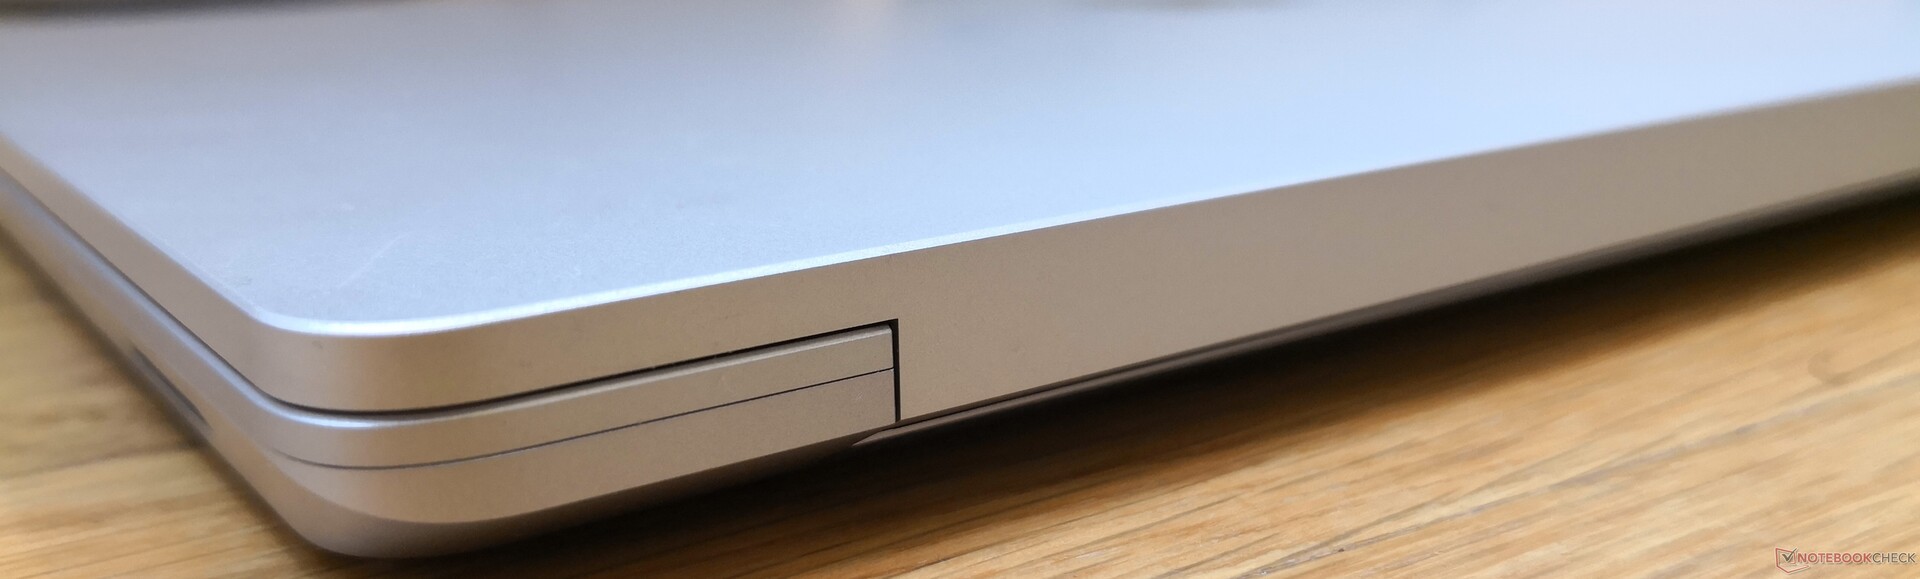
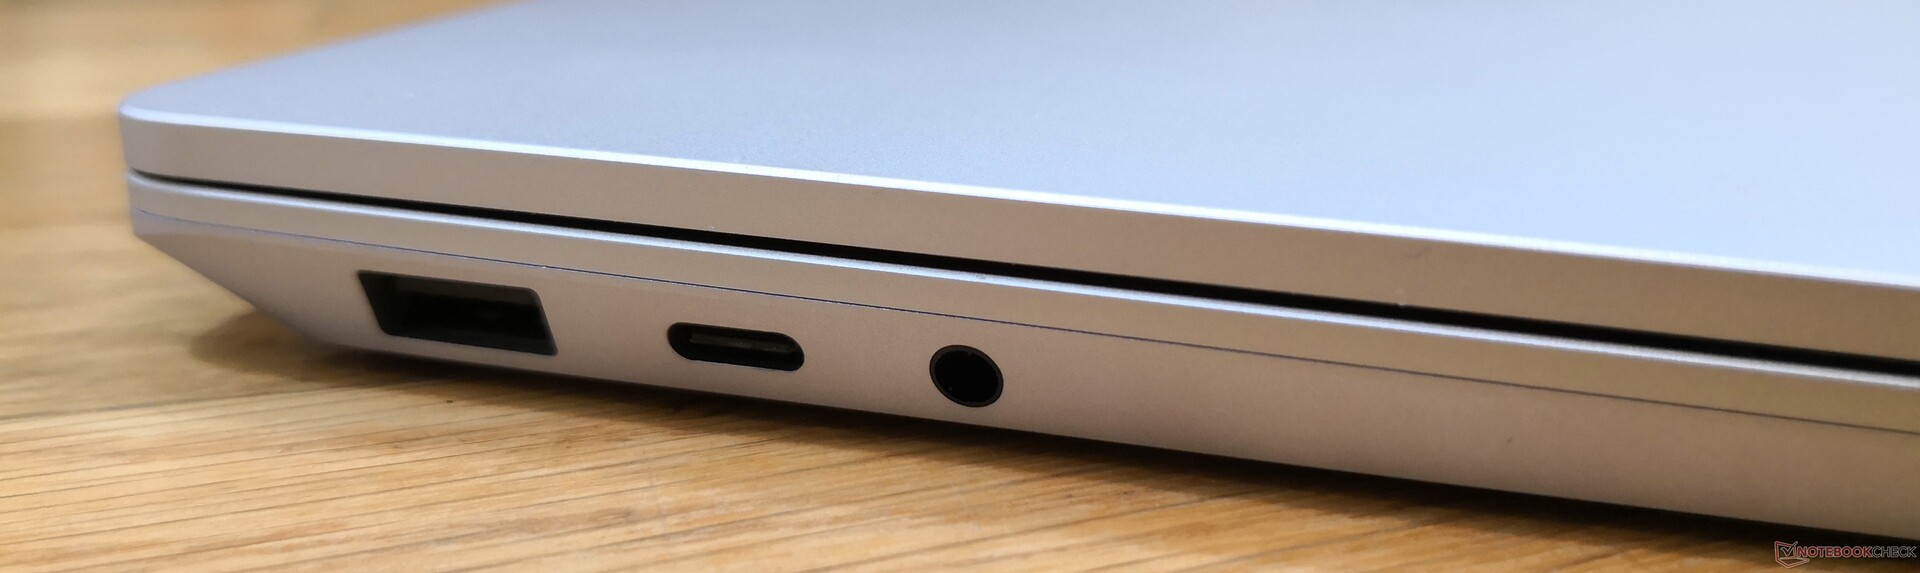
Port options are limited for a 15-inch laptop. The smaller Huawei MateBook X Pro, for example, comes with dual USB Type-C ports, Thunderbolt 3, and a USB Type-A port whereas the Microsoft laptop offers just one USB Type-C port with no Thunderbolt compatibility. An SD reader would have been appreciated especially for content creators and users on-the-go. You'll have to purchase the expensive Surface Dock if you want to exploit the docking capabilities of the Surface Laptop 3 to its fullest.
Communication
Intel SKUs come standard with the Intel AX201 for Wi-Fi 6 (802.11ax) connectivity whereas the AMD SKUs come with the slower Atheros/Qualcomm QCA6174 for Wi-Fi 5 connectivity only. The former can offer over two times the transfer rates of the latter should you happen to be one of the few users with a brand new Wi-Fi 6 router. Otherwise, WLAN performance won't feel any different during day-to-day loads as the main reason for owning a Wi-Fi 6 laptop right now is mostly for future-proofing. Note that the AX201 is functionally identical to the AX200 save for some hardware changes under the hood.
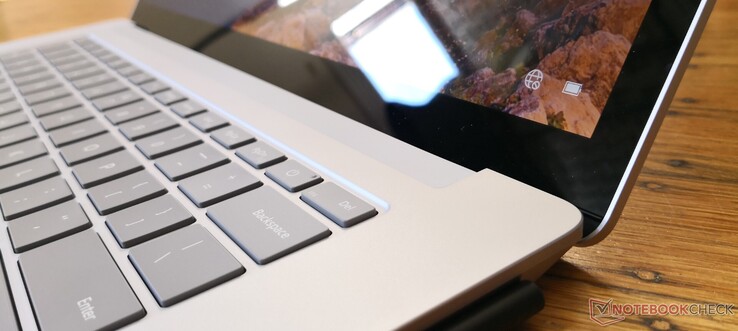
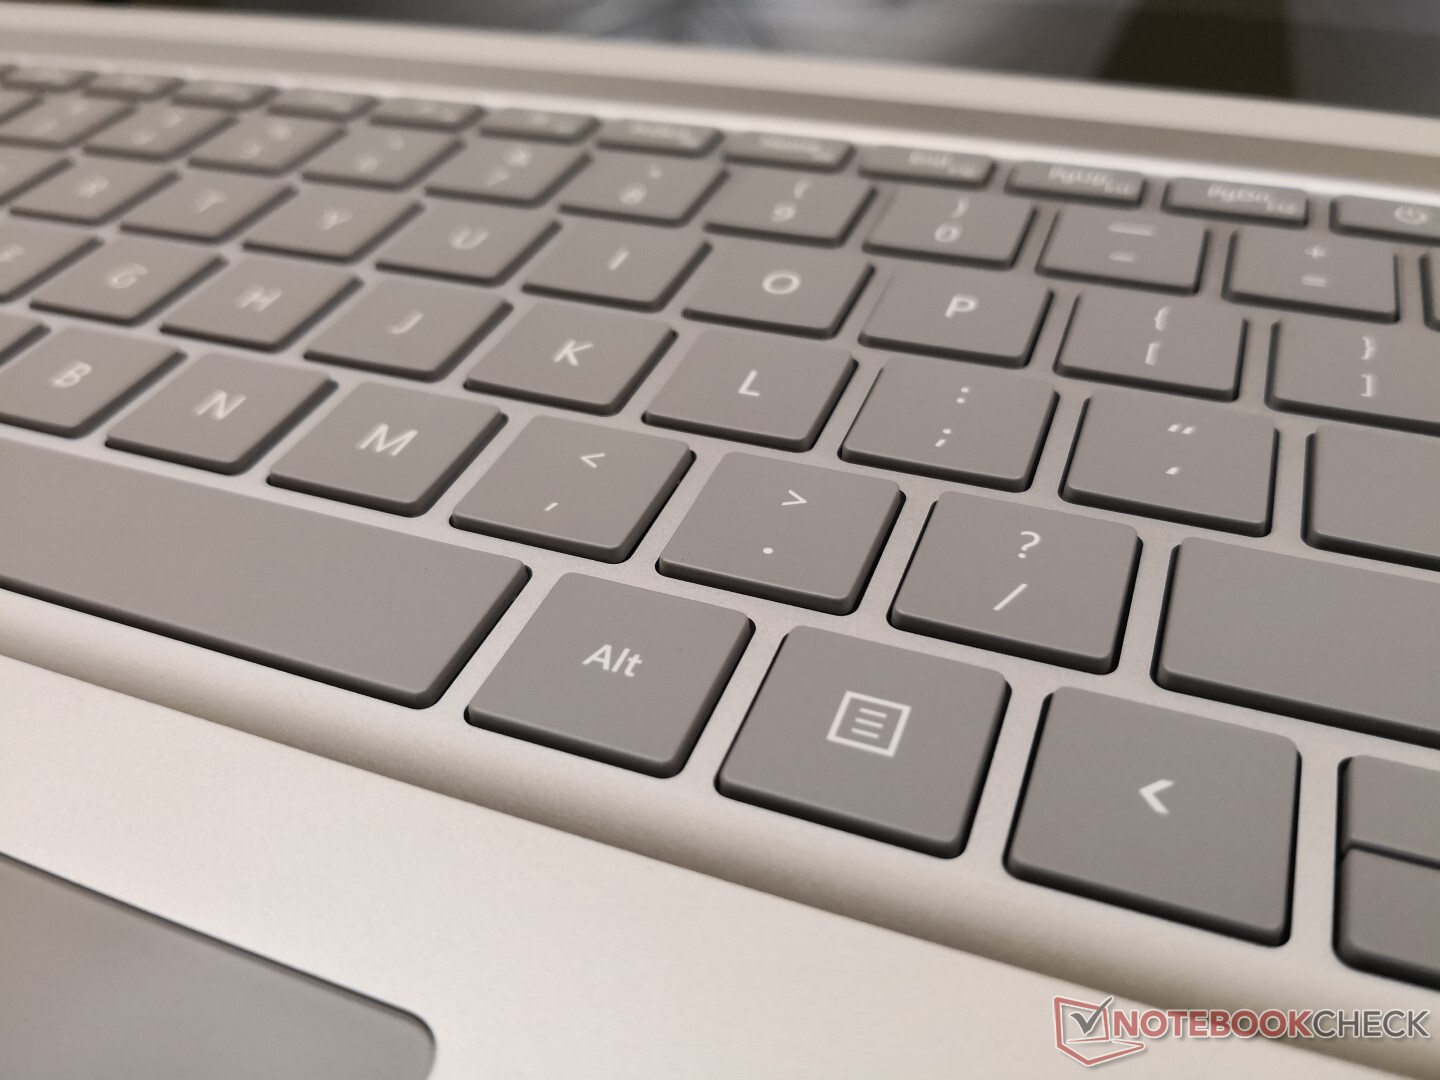
Input Devices
Keyboard and Touchpad
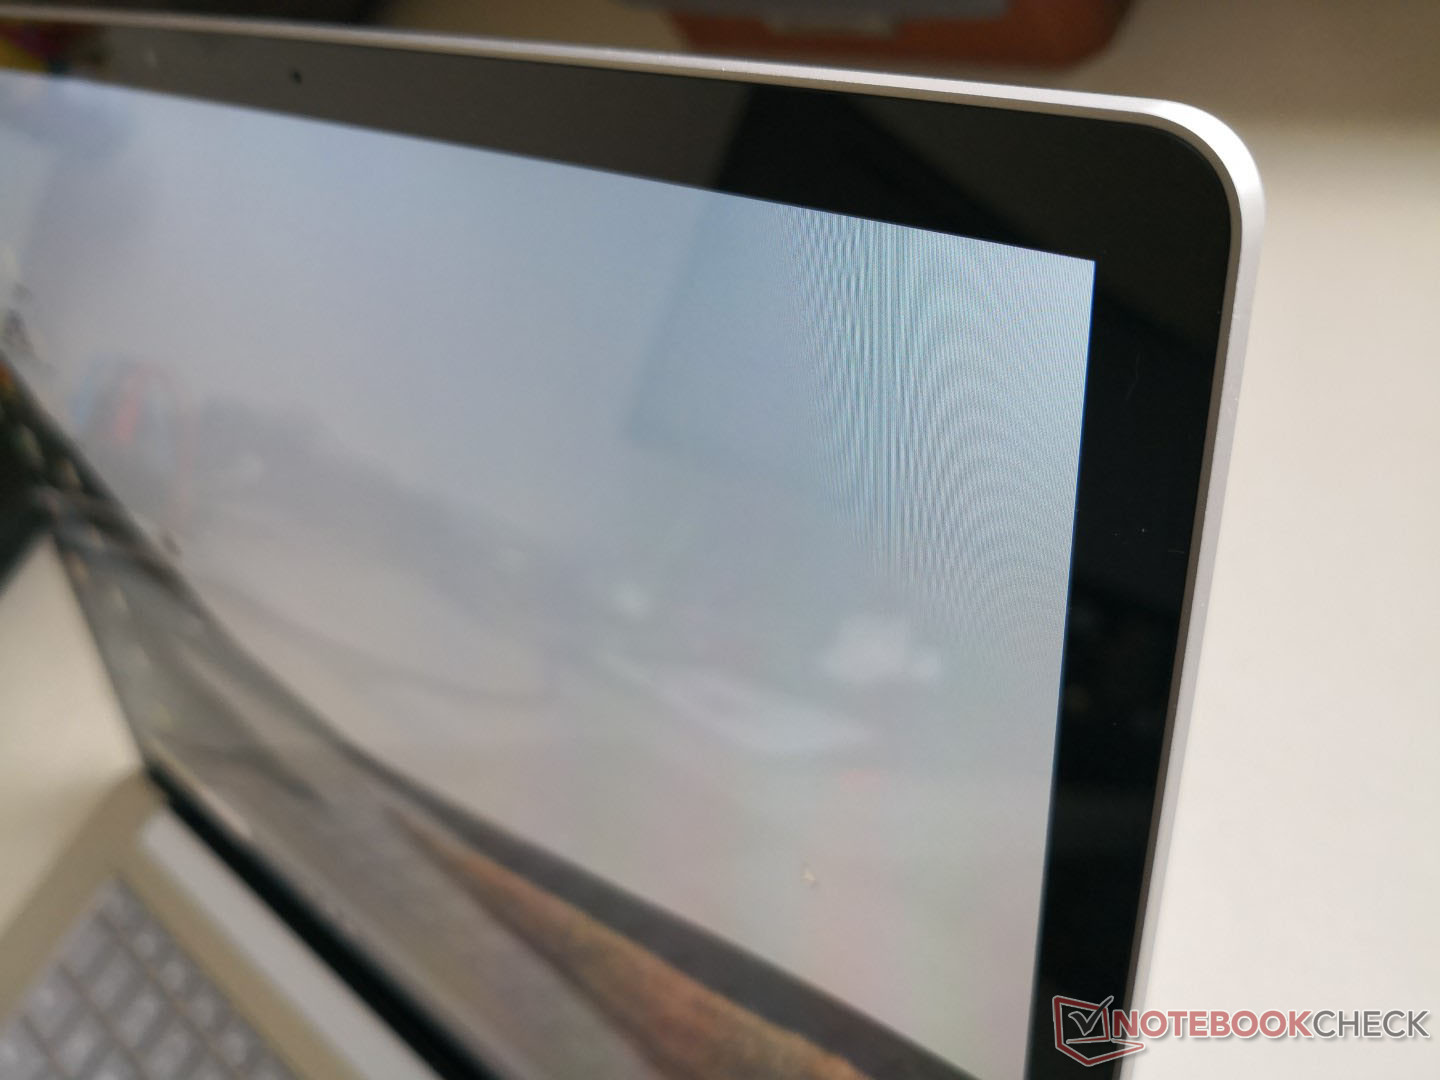
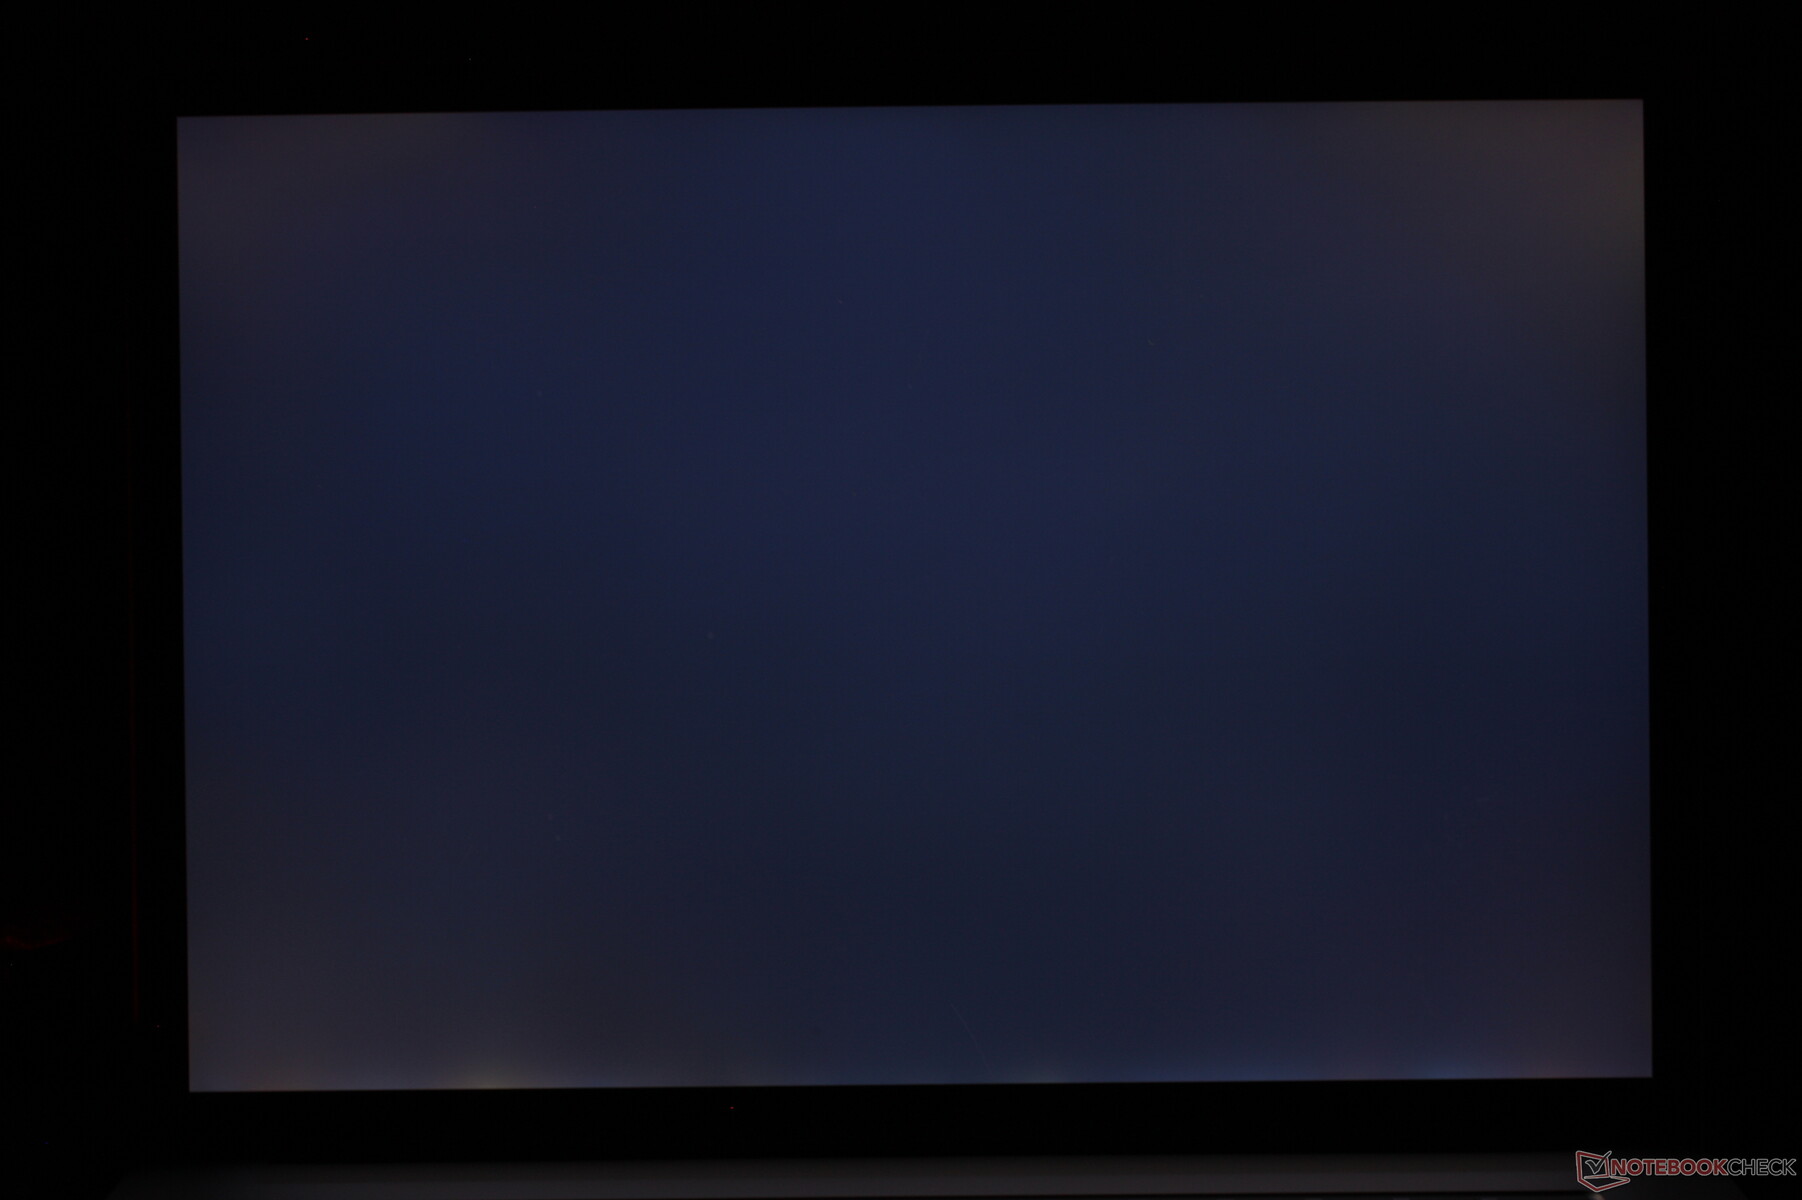
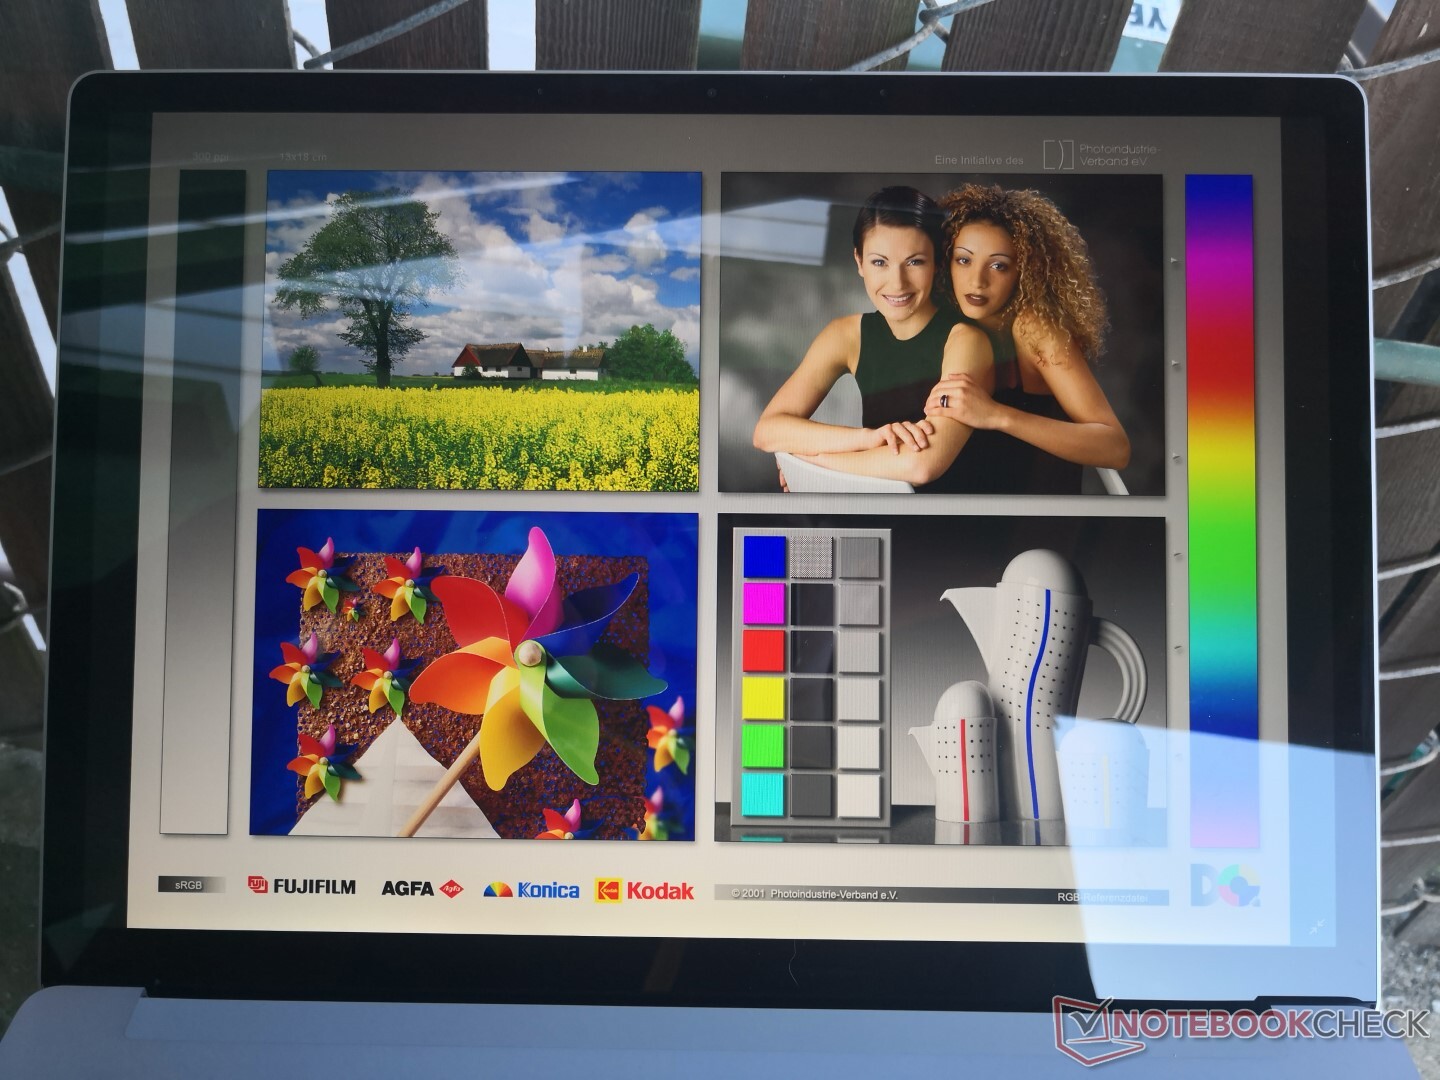
Display
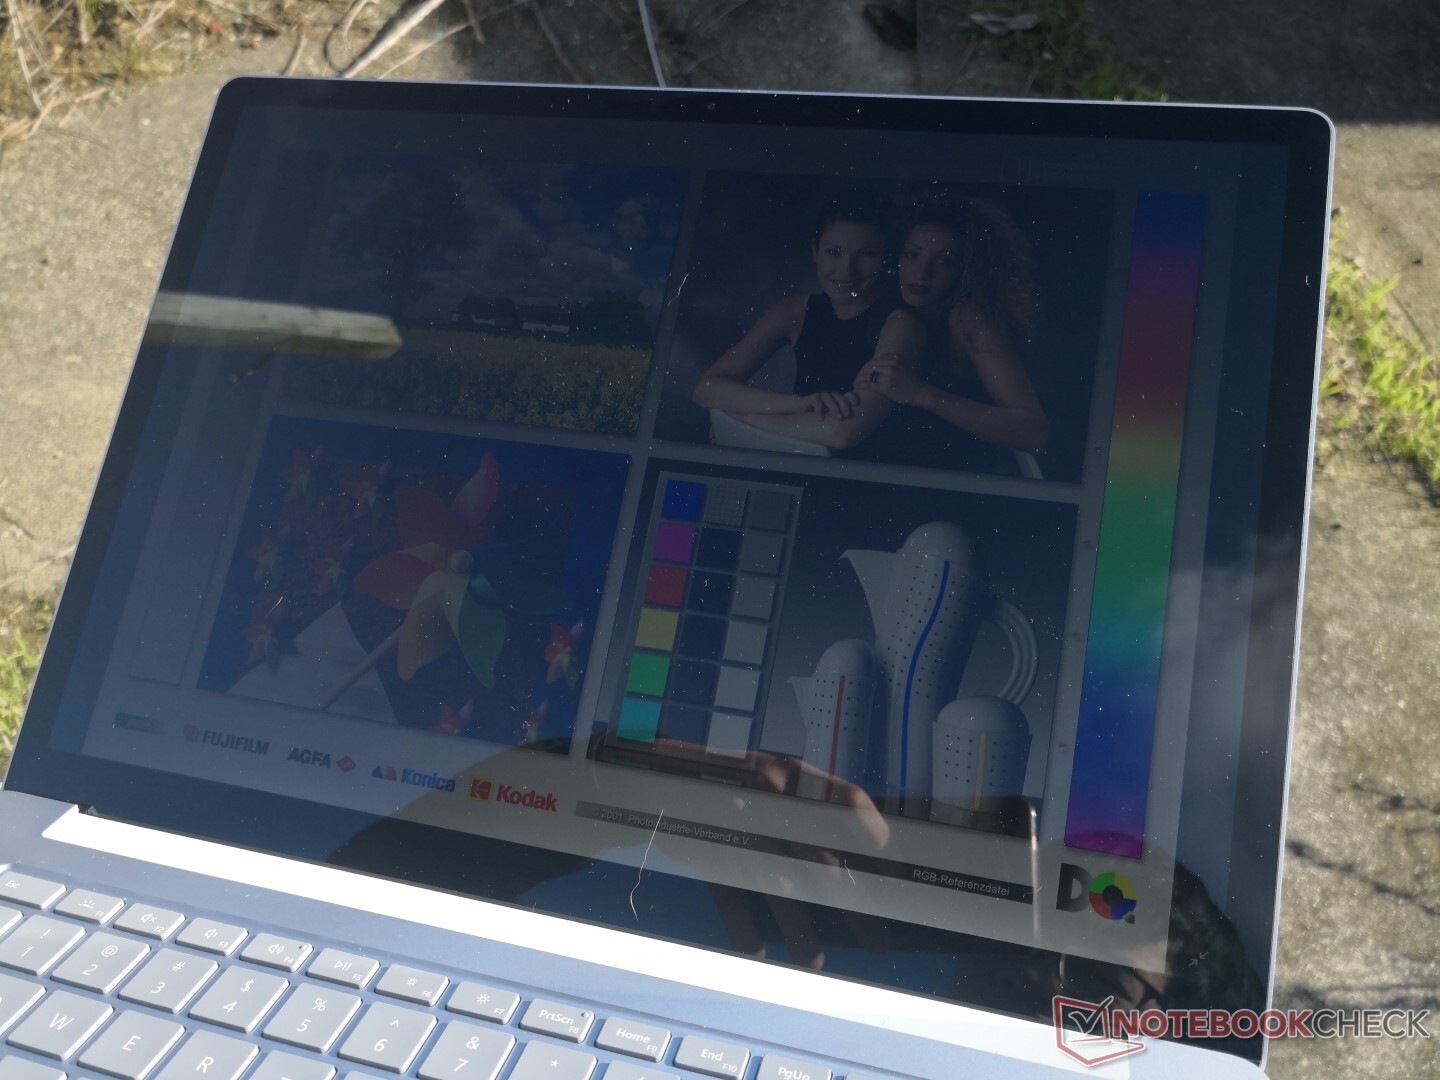
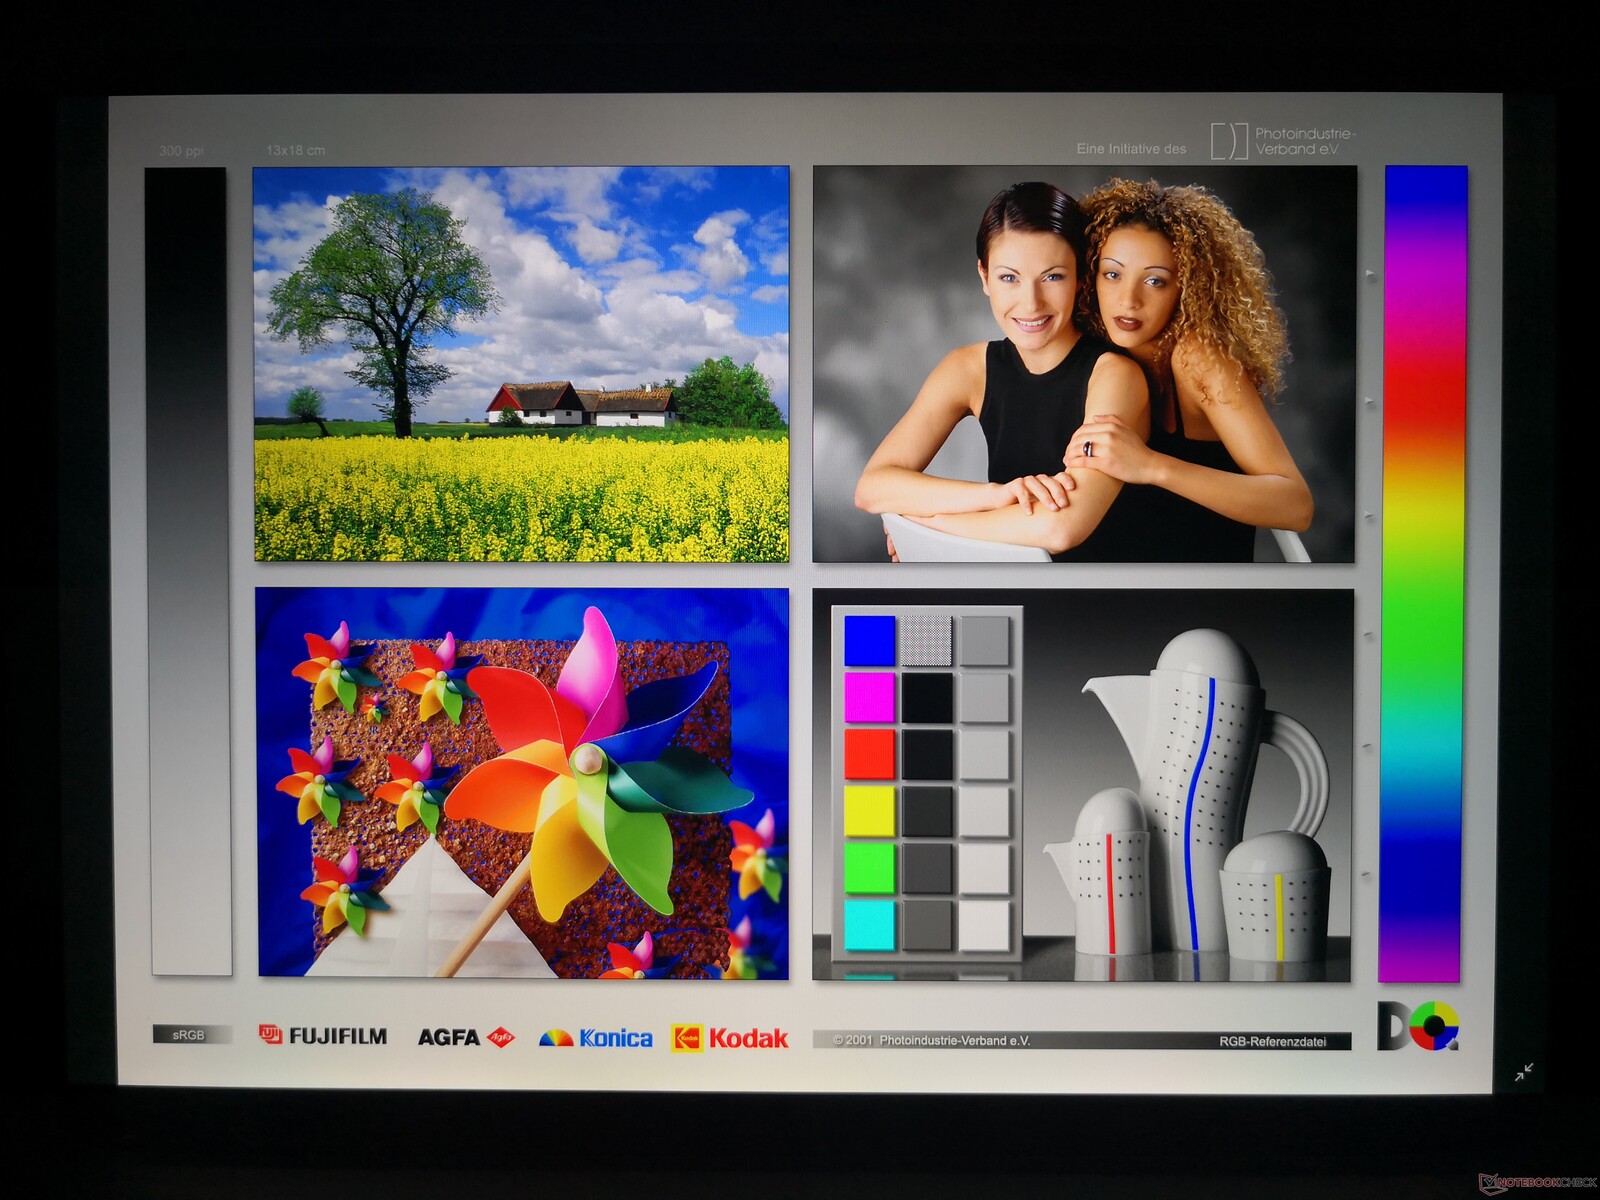
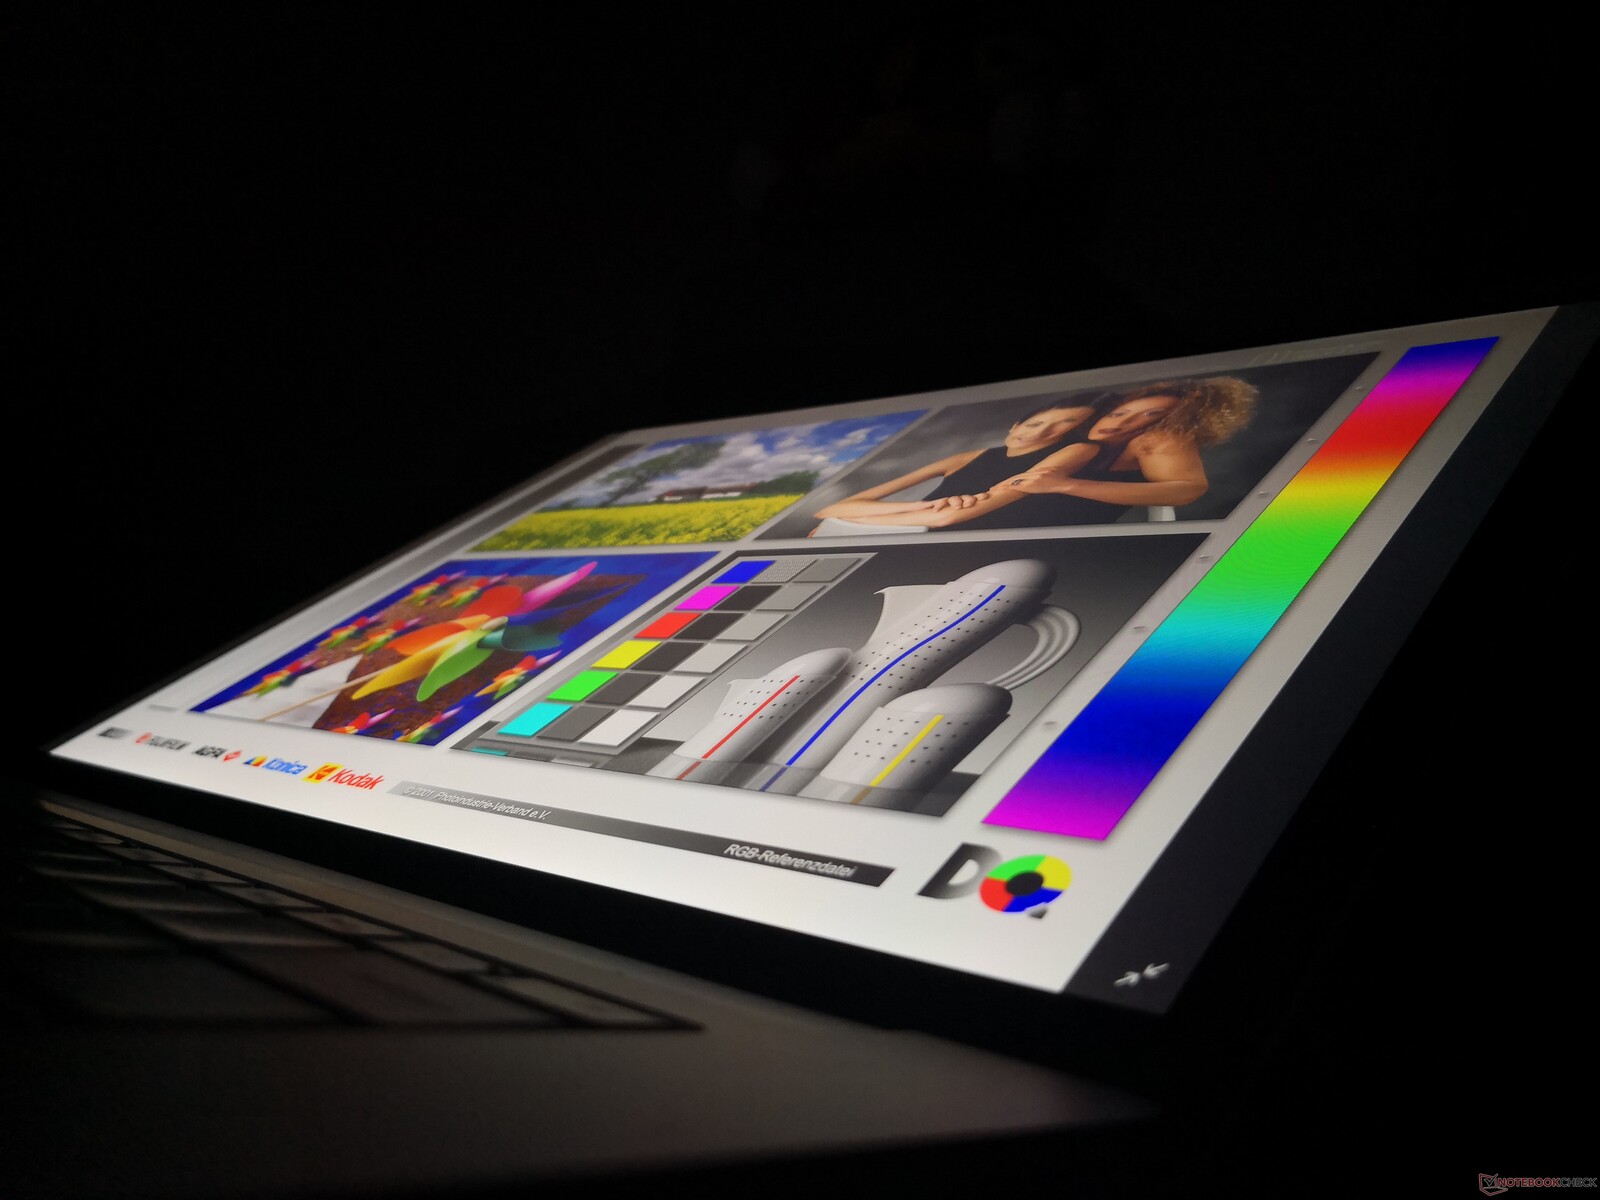
Microsoft utilizes the same Sharp LQ150P1JX51 IPS panel across all of its Surface Laptop 3 SKUs. Our independent measurements show that key display characteristics are identical between the Intel and AMD options including brightness, contrast, colors, response times, and even their pulse-width modulation frequency. The competing Apple MacBook Pro 16 and Dell XPS 15 have brighter displays for better outdoor visibility.

| |||||||||||||||||||||||||
Brightness Distribution: 78 %
Center on Battery: 412.4 cd/m²
Contrast: 1178:1 (Black: 0.35 cd/m²)
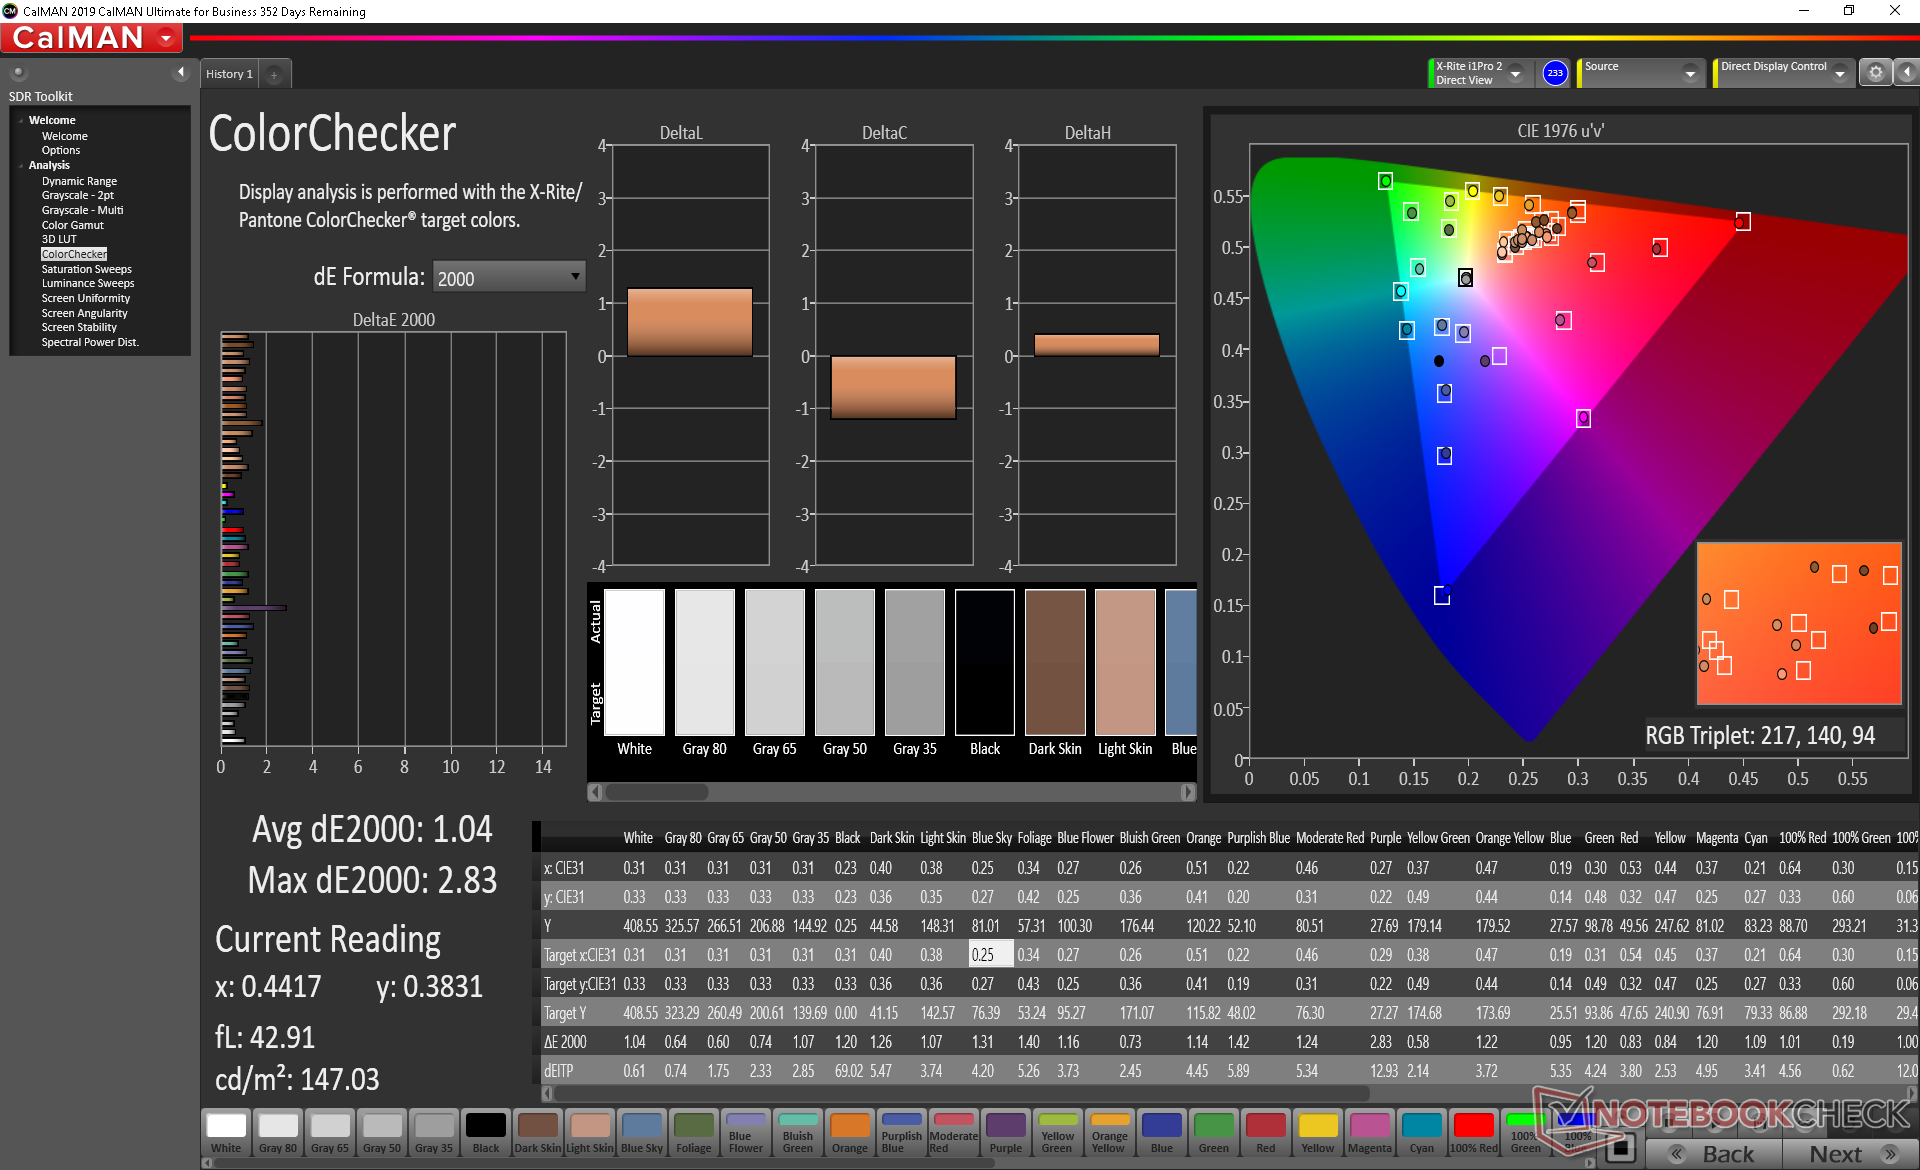
ΔE ColorChecker Calman: 1.04 | ∀{0.5-29.43 Ø4.72}
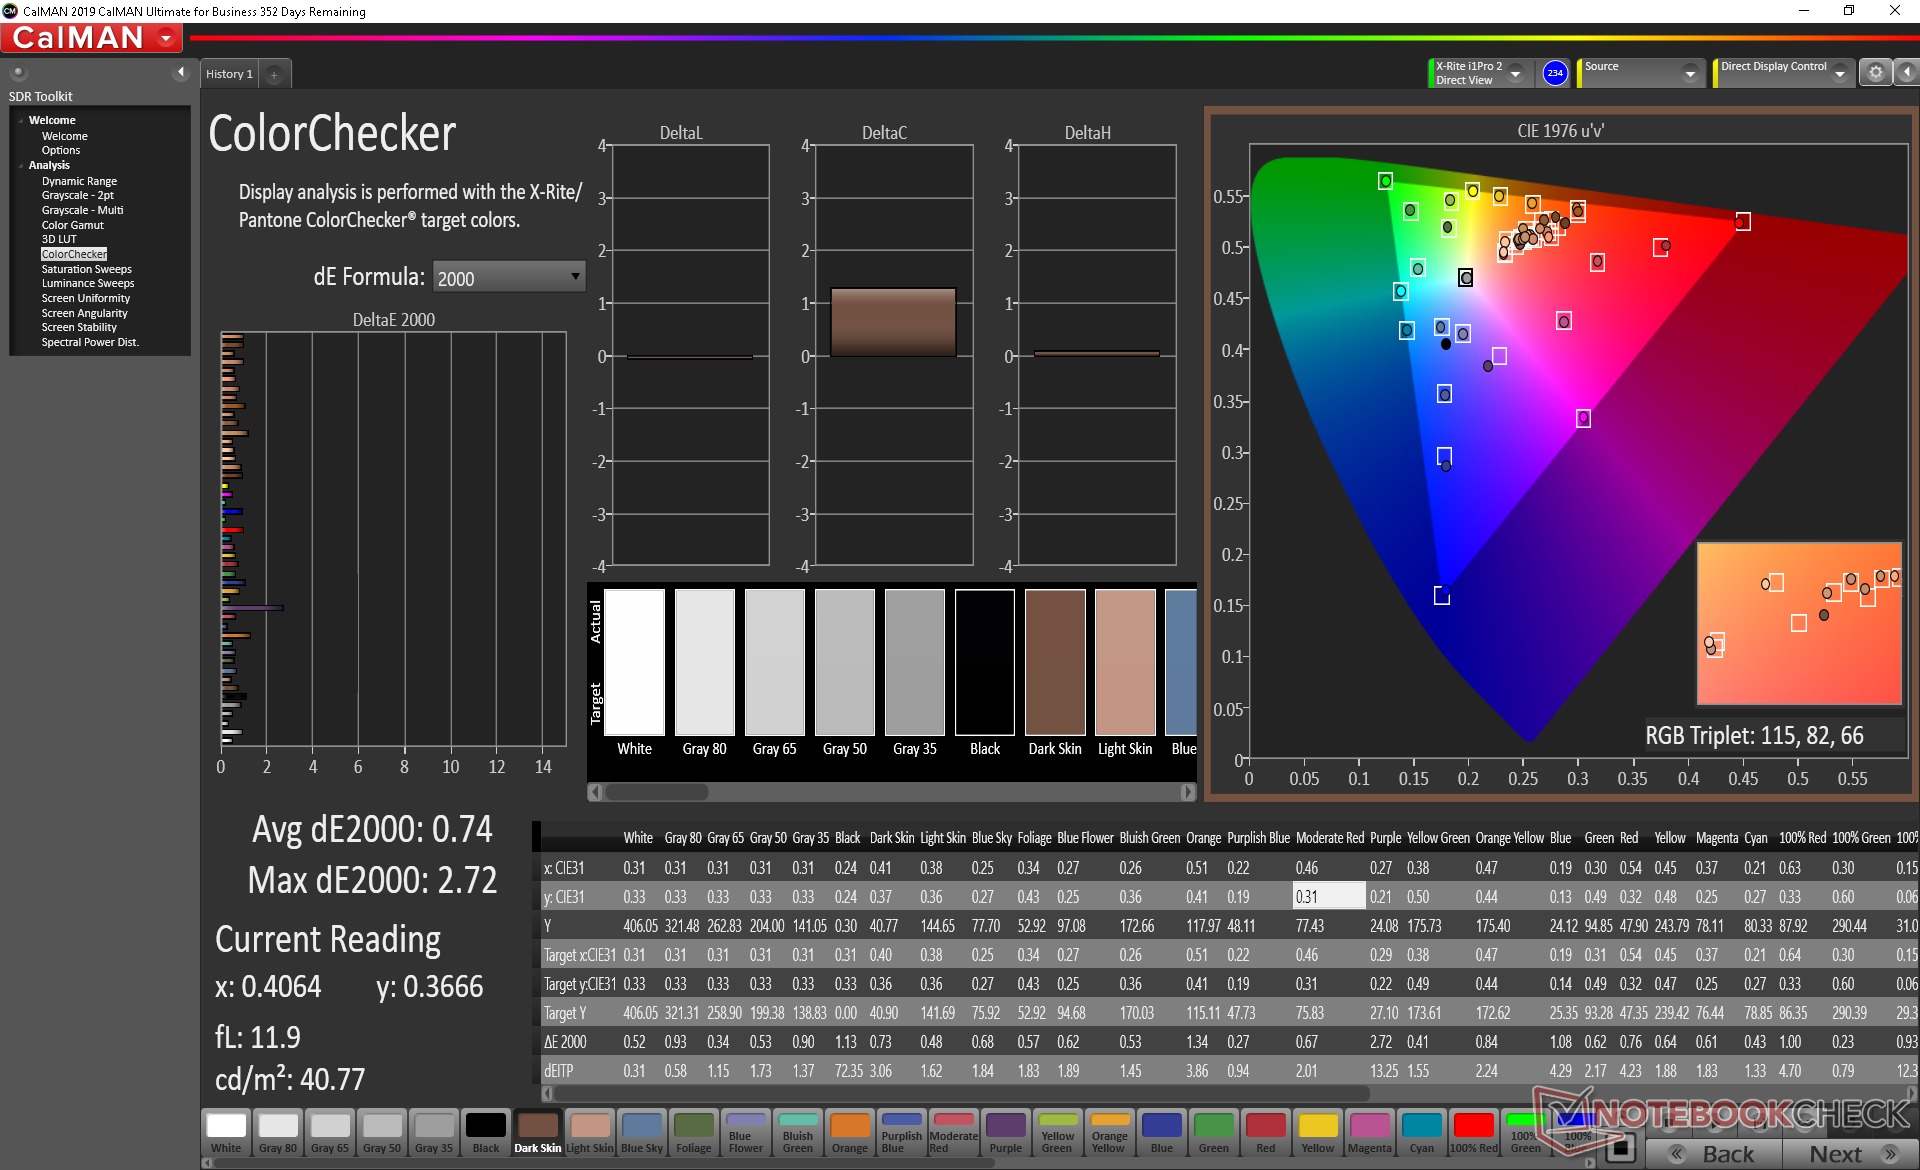
calibrated: 0.74
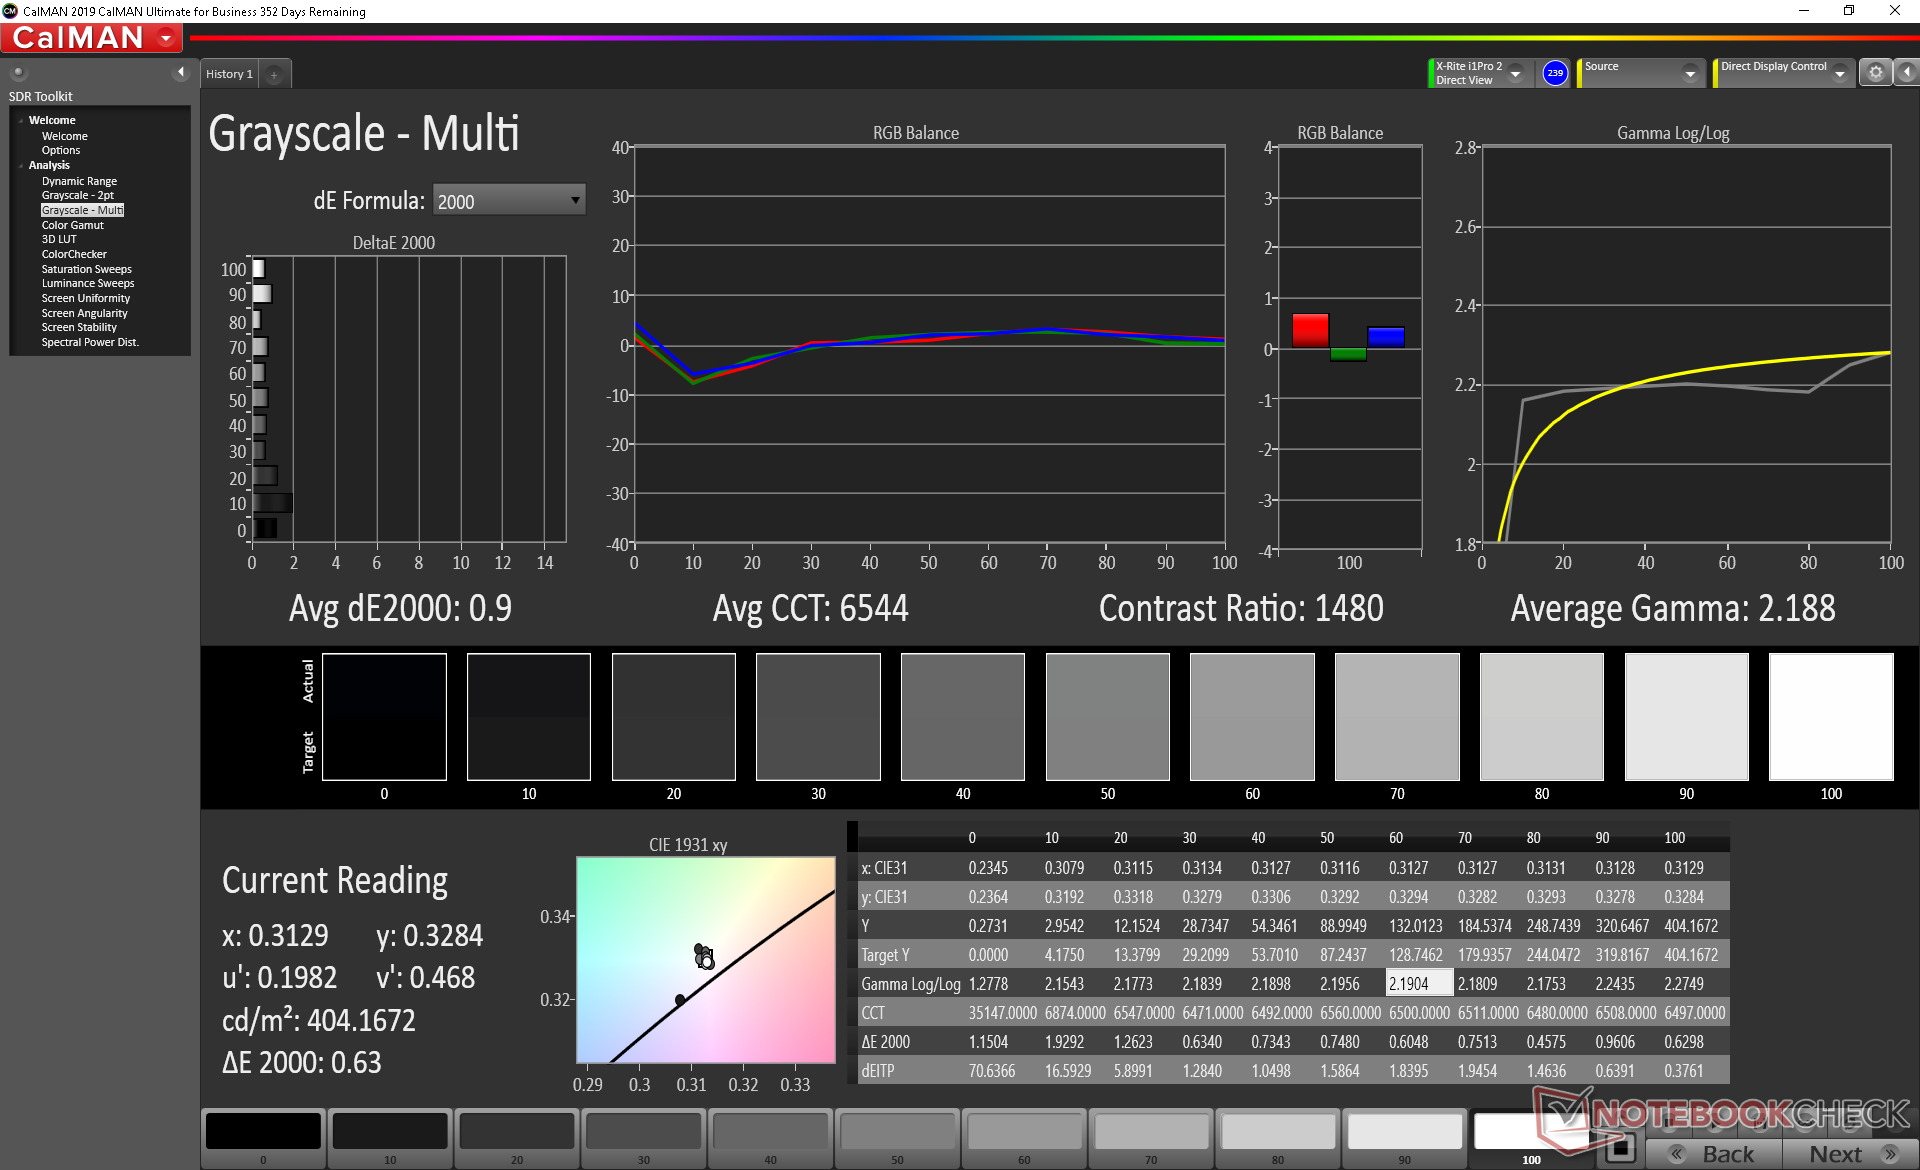
ΔE Greyscale Calman: 1.3 | ∀{0.09-98 Ø4.97}
98.4% sRGB (Argyll 1.6.3 3D)
62.4% AdobeRGB 1998 (Argyll 1.6.3 3D)
67.8% AdobeRGB 1998 (Argyll 3D)
98.4% sRGB (Argyll 3D)
65.6% Display P3 (Argyll 3D)
Gamma: 2.07
CCT: 6634 K
| Microsoft Surface Laptop 3 15 i7-1065G7 Sharp LQ150P1JX51, IPS, 15", 2496x1664 | Apple MacBook Pro 16 2019 i9 5500M APPA044, IPS, 16", 3072x1920 | Dell XPS 15 7590 i5 iGPU FHD LQ156M1, IPS, 15.6", 1920x1080 | Asus ZenBook 15 UX534FT-DB77 BOE NV156FHM-N63, IPS, 15.6", 1920x1080 | MSI Prestige 15 A10SC Sharp LQ156D1JW42, IPS, 15.6", 3840x2160 | Microsoft Surface Laptop 3 15 Ryzen 5 3580U Sharp LQ150P1JX51, IPS, 15", 2496x1664 | |
|---|---|---|---|---|---|---|
| Display | 1% | -5% | 22% | -1% | ||
| Display P3 Coverage (%) | 65.6 | 66.5 1% | 66.6 2% | 82 25% | 66.9 2% | |
| sRGB Coverage (%) | 98.4 | 98 0% | 87.7 -11% | 98.3 0% | 99.3 1% | |
| AdobeRGB 1998 Coverage (%) | 67.8 | 68.4 1% | 64.1 -5% | 96.2 42% | 63.7 -6% | |
| Response Times | 7% | 11% | 20% | -8% | 10% | |
| Response Time Grey 50% / Grey 80% * (ms) | 56 ? | 52.4 ? 6% | 52.8 ? 6% | 41.2 ? 26% | 60 ? -7% | 47.2 ? 16% |
| Response Time Black / White * (ms) | 38 ? | 34.9 ? 8% | 32 ? 16% | 33.2 ? 13% | 41.2 ? -8% | 36.8 ? 3% |
| PWM Frequency (Hz) | 21370 ? | 131700 | 1020 ? | 26040 ? | 21370 ? | |
| Screen | -14% | -34% | -132% | -65% | -31% | |
| Brightness middle (cd/m²) | 412.4 | 519 26% | 588 43% | 312.6 -24% | 464.5 13% | 416.9 1% |
| Brightness (cd/m²) | 374 | 477 28% | 555 48% | 290 -22% | 451 21% | 389 4% |
| Brightness Distribution (%) | 78 | 86 10% | 89 14% | 85 9% | 92 18% | 86 10% |
| Black Level * (cd/m²) | 0.35 | 0.39 -11% | 0.4 -14% | 0.31 11% | 0.5 -43% | 0.4 -14% |
| Contrast (:1) | 1178 | 1331 13% | 1470 25% | 1008 -14% | 929 -21% | 1042 -12% |
| Colorchecker dE 2000 * | 1.04 | 2.28 -119% | 2.5 -140% | 5.78 -456% | 3.36 -223% | 2.75 -164% |
| Colorchecker dE 2000 max. * | 2.83 | 6.54 -131% | 6.3 -123% | 8.86 -213% | 7.06 -149% | 6.64 -135% |
| Colorchecker dE 2000 calibrated * | 0.74 | 0.86 -16% | 0.6 19% | 3.78 -411% | 3.42 -362% | 0.71 4% |
| Greyscale dE 2000 * | 1.3 | 0.9 31% | 4.5 -246% | 5.4 -315% | 1.3 -0% | 1.8 -38% |
| Gamma | 2.07 106% | 2145 0% | 2.2 100% | 2.21 100% | 2.14 103% | 2.09 105% |
| CCT | 6634 98% | 6572 99% | 6836 95% | 7864 83% | 6596 99% | 6646 98% |
| Color Space (Percent of AdobeRGB 1998) (%) | 62.4 | 78 25% | 63.2 1% | 57.1 -8% | 84.8 36% | 63.4 2% |
| Color Space (Percent of sRGB) (%) | 98.4 | 98 0% | 87.4 -11% | 98.3 0% | 99.4 1% | |
| Total Average (Program / Settings) | -4% /
-11% | -7% /
-22% | -39% /
-89% | -17% /
-41% | -7% /
-20% |
* ... smaller is better
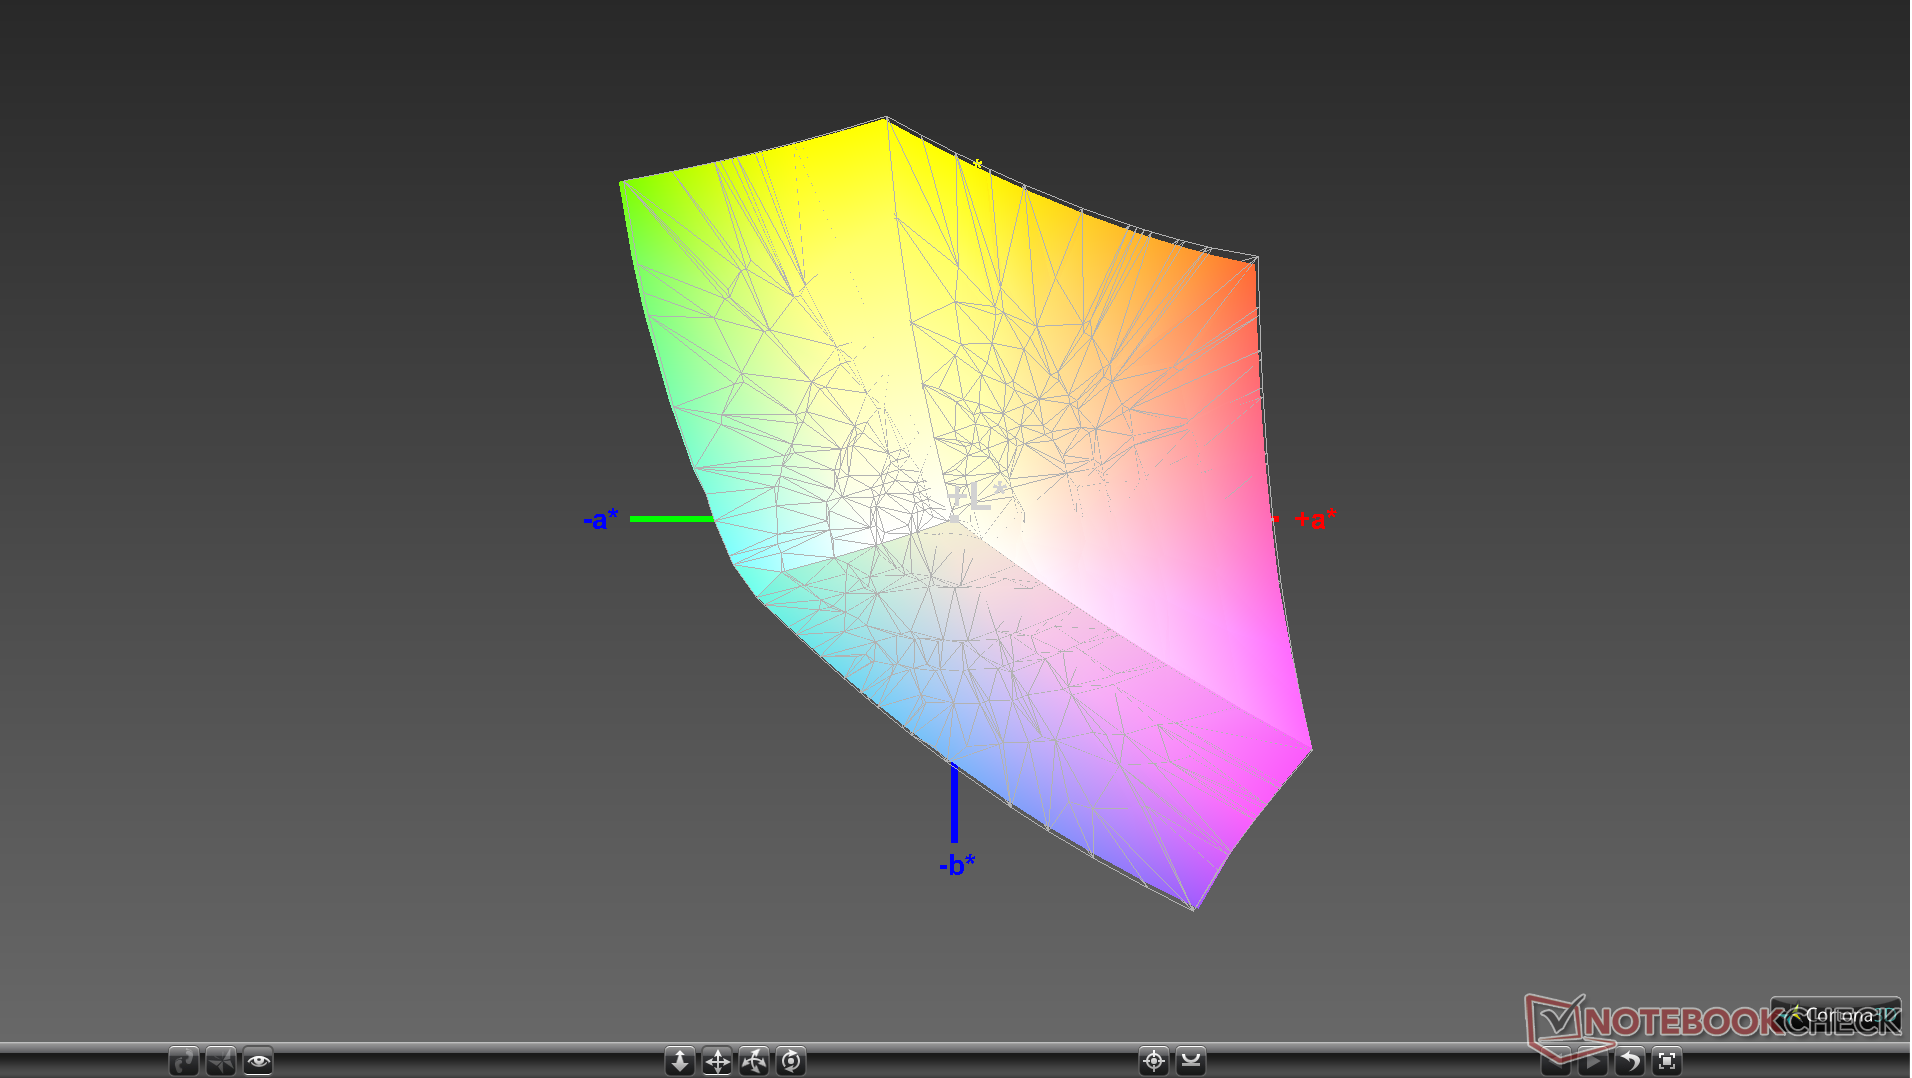
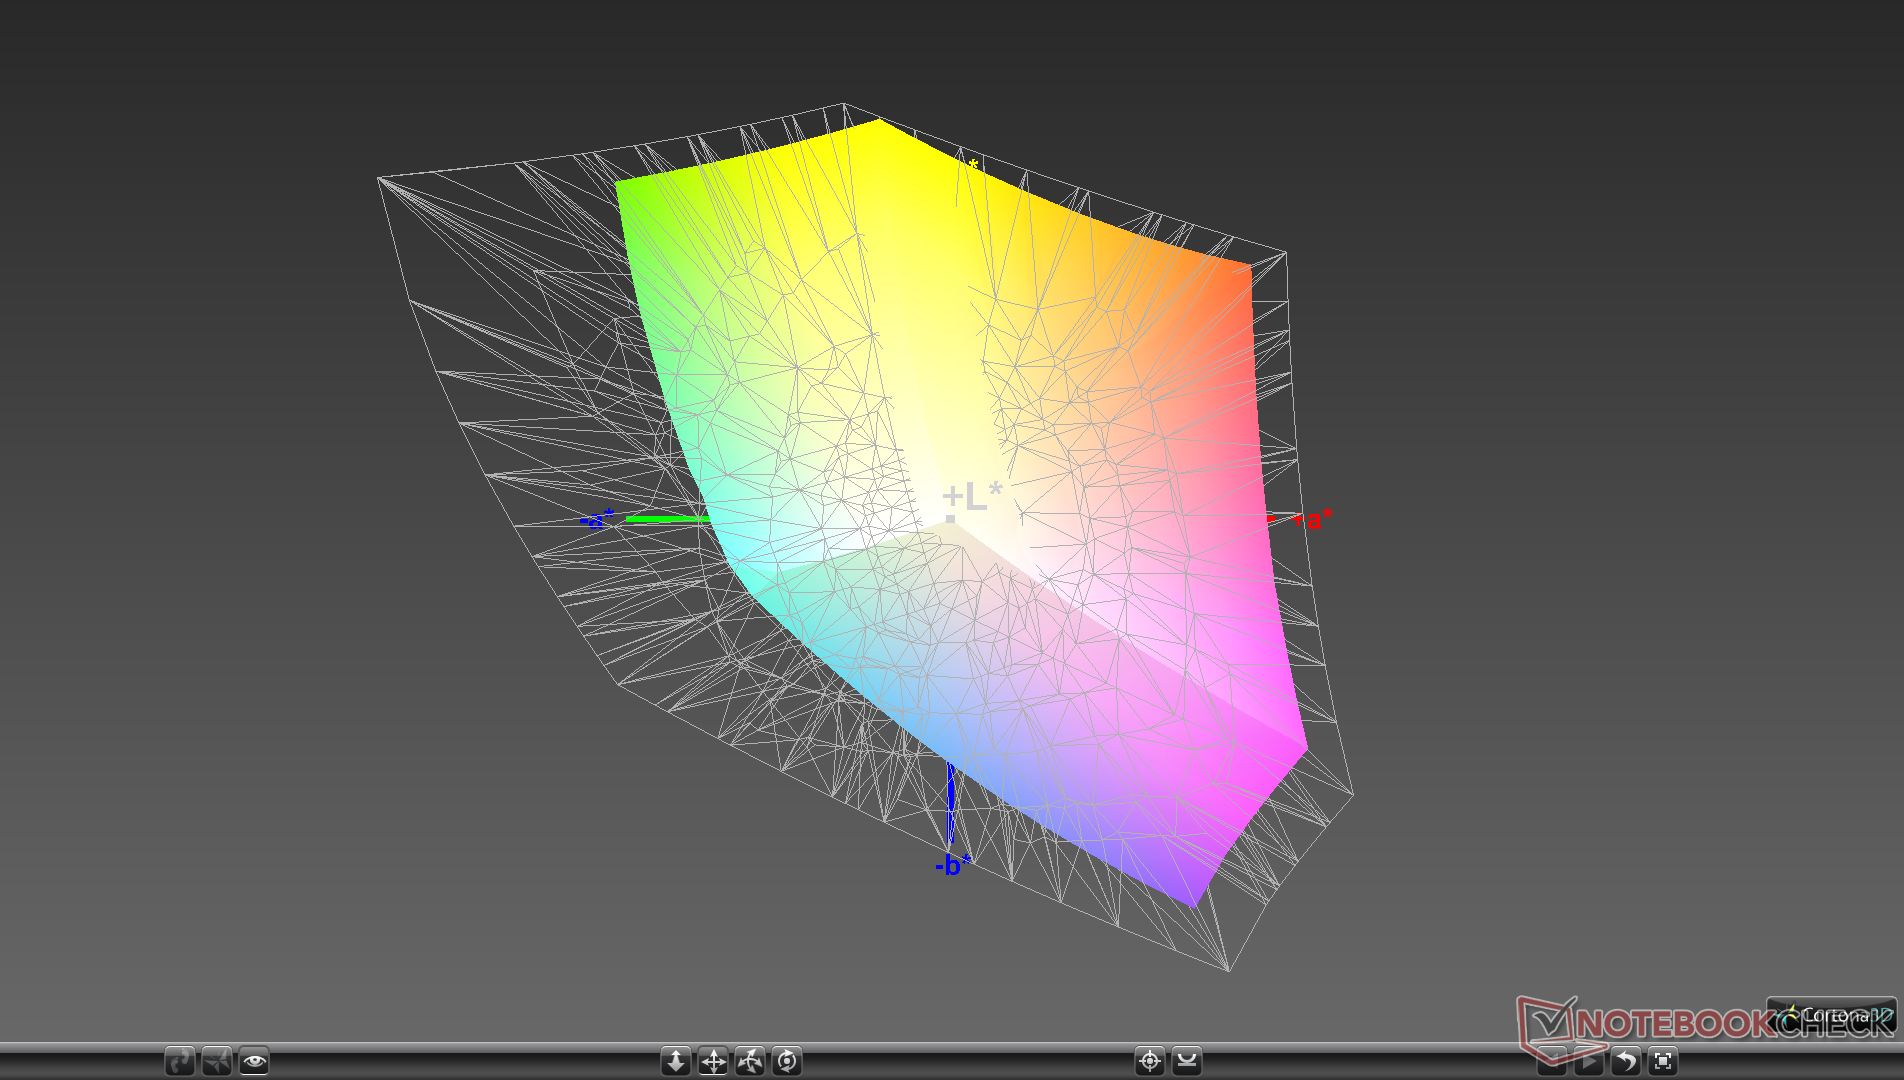
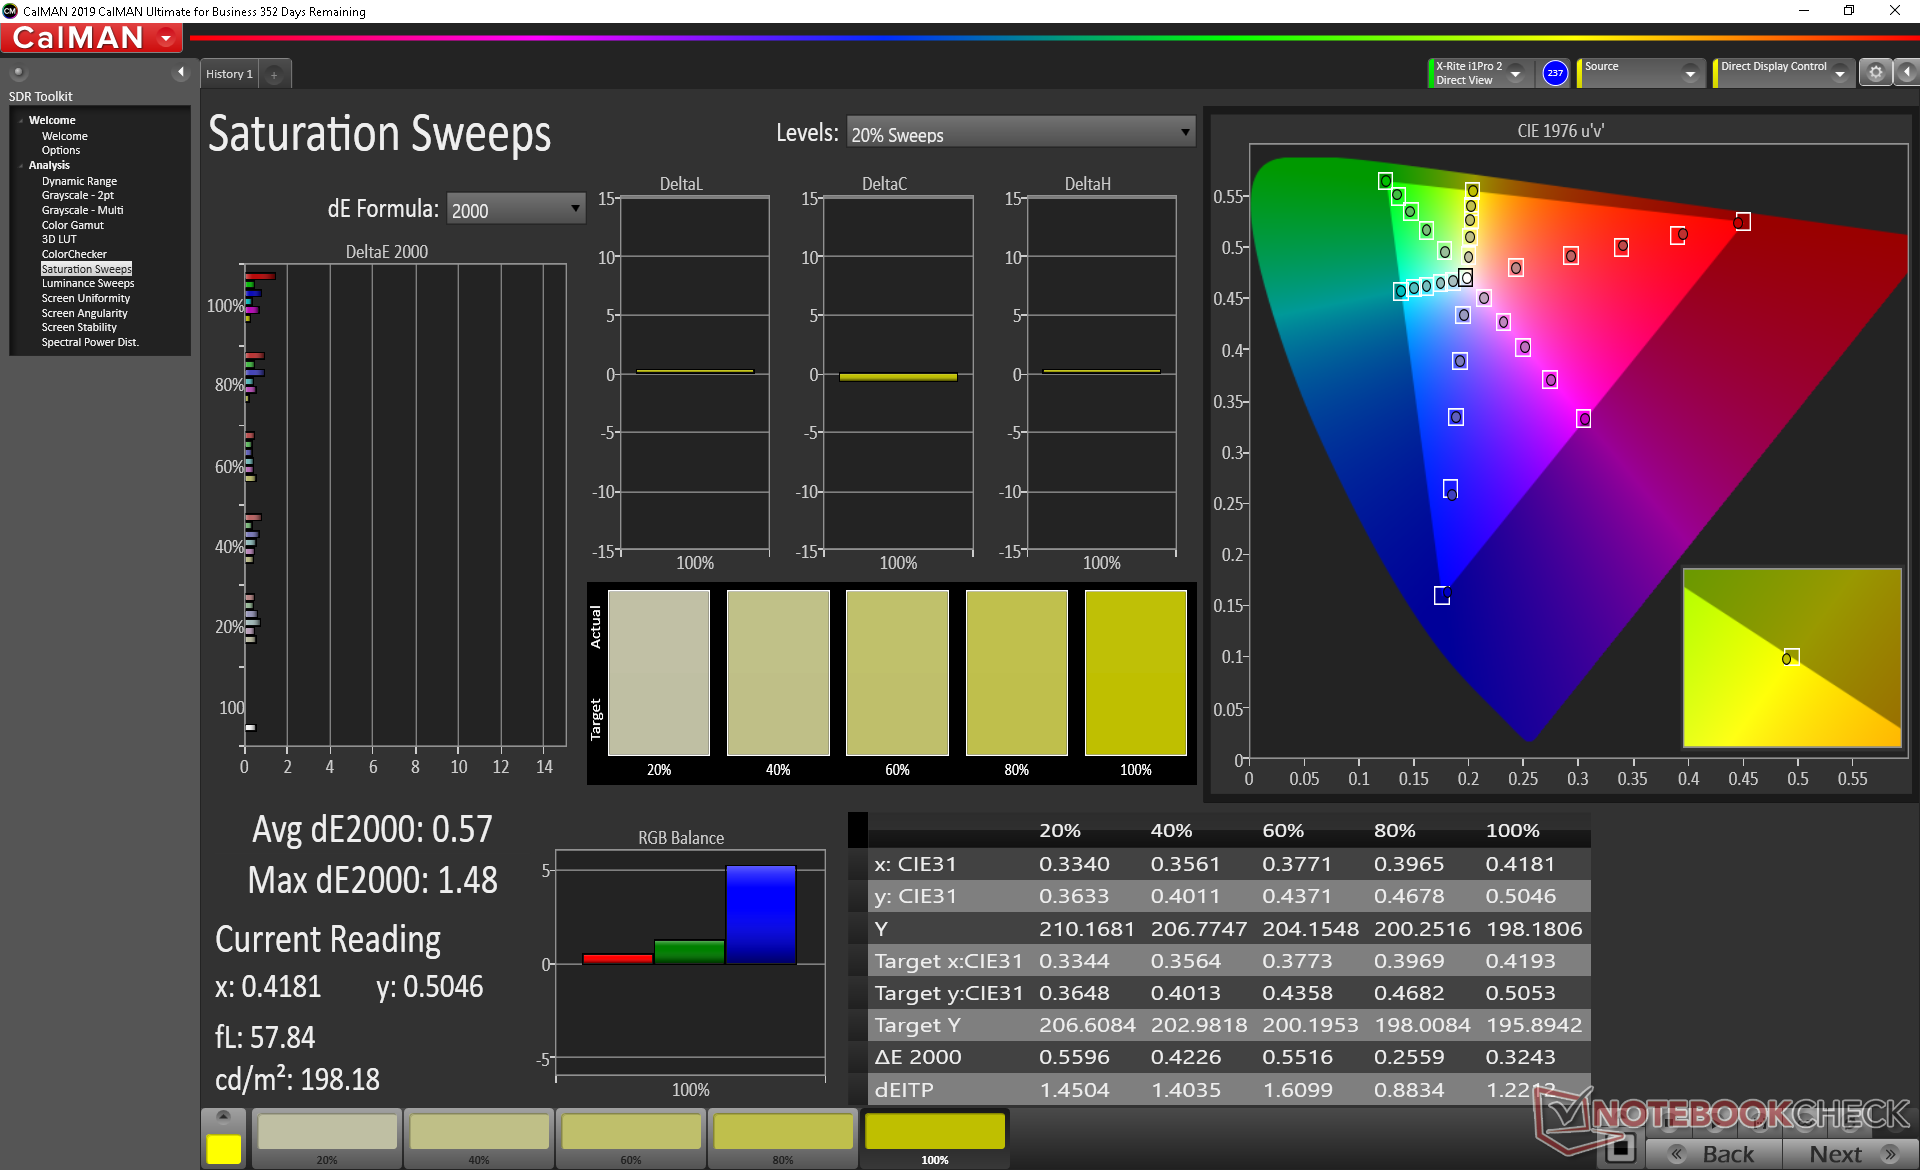
Color space encompasses sRGB and approximately 62 percent of the AdobeRGB standard. Full AdobeRGB coverage is not available unlike on the XPS 15, Asus ZenBook Pro 15, or MSI Prestige 15.
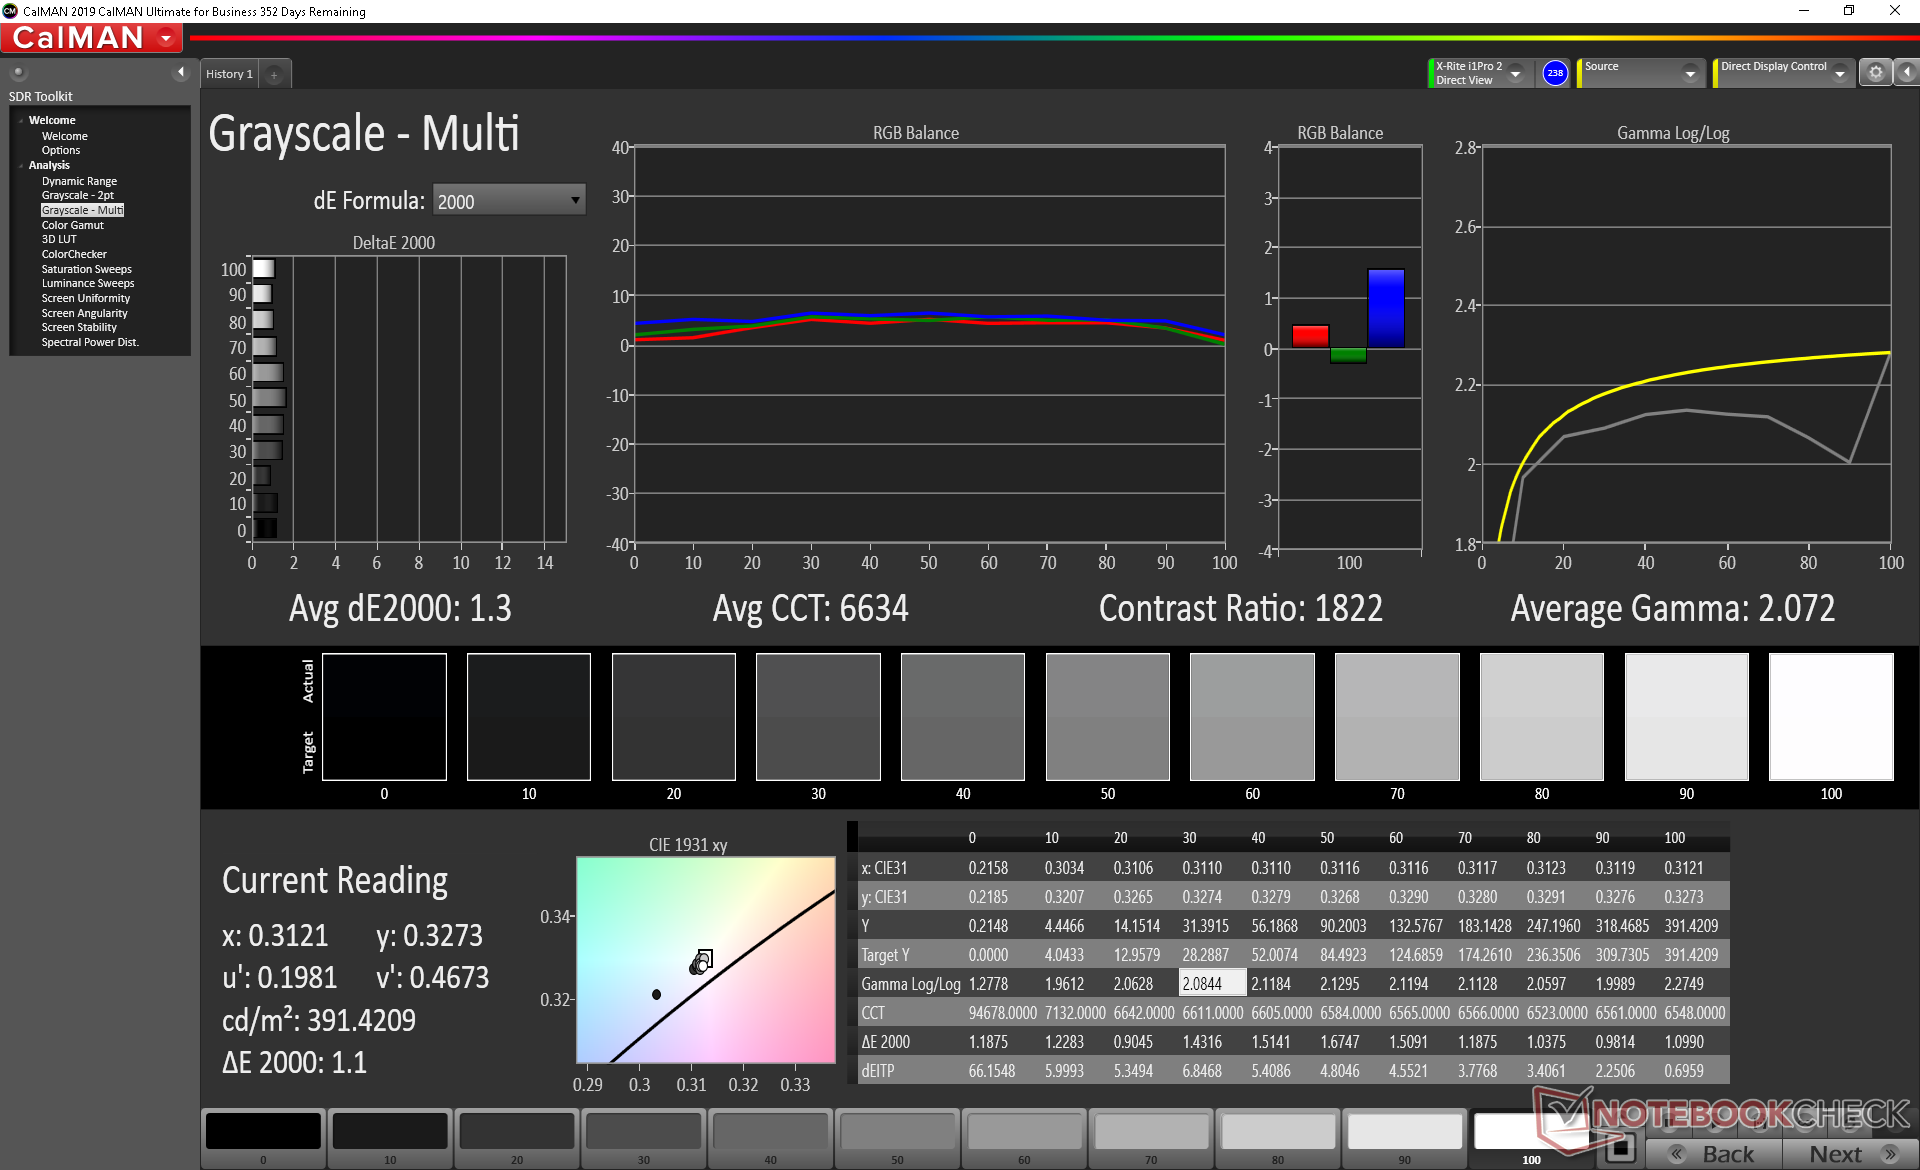
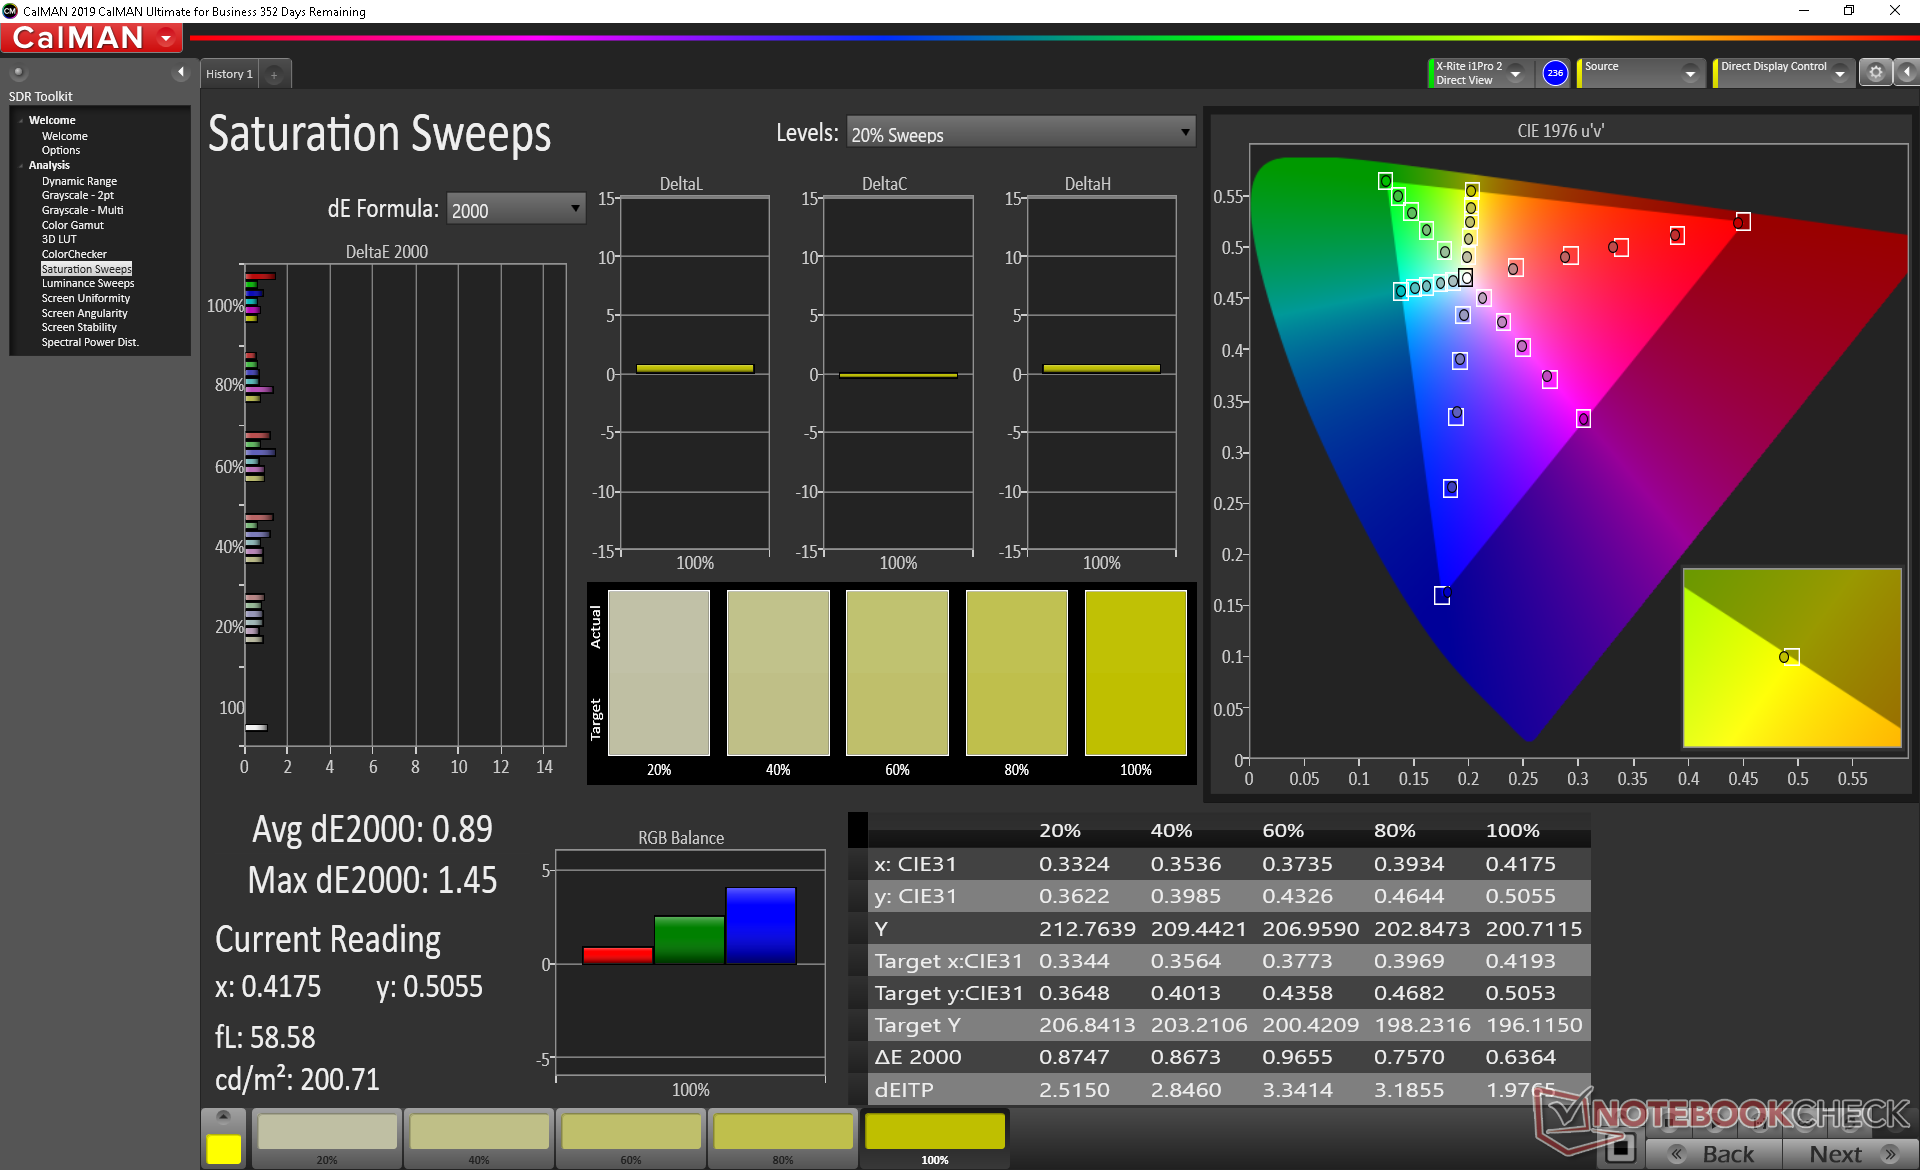
Our Intel unit comes better calibrated out of the box when compared to our Ryzen unit. Intel says no post-calibration was performed on our test to suggest that certain Surface Laptop 3 SKUs may come better calibrated than others. Average grayscale and color DeltaE values are already low at just 1.3 and 0.89, respectively. Calibrating the display even further ourselves improves these values just marginally.
Display Response Times
| ↔ Response Time Black to White | ||
|---|---|---|
| 38 ms ... rise ↗ and fall ↘ combined | ↗ 21.2 ms rise | 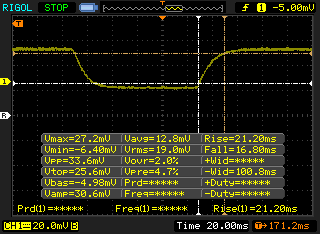 |
| ↘ 16.8 ms fall | ||
| The screen shows slow response rates in our tests and will be unsatisfactory for gamers. In comparison, all tested devices range from 0.1 (minimum) to 240 (maximum) ms. » 96 % of all devices are better. This means that the measured response time is worse than the average of all tested devices (19.8 ms). | ||
| ↔ Response Time 50% Grey to 80% Grey | ||
| 56 ms ... rise ↗ and fall ↘ combined | ↗ 27.6 ms rise | 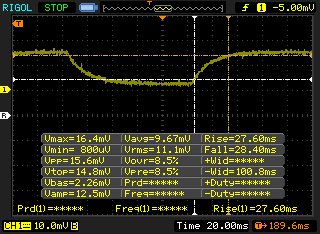 |
| ↘ 28.4 ms fall | ||
| The screen shows slow response rates in our tests and will be unsatisfactory for gamers. In comparison, all tested devices range from 0.165 (minimum) to 636 (maximum) ms. » 93 % of all devices are better. This means that the measured response time is worse than the average of all tested devices (31 ms). | ||
Screen Flickering / PWM (Pulse-Width Modulation)
| Screen flickering / PWM detected | 21370 Hz | ≤ 51 % brightness setting | 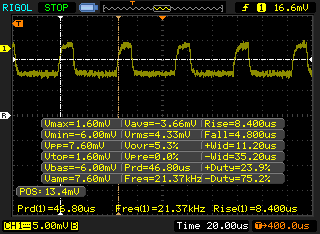 |
The display backlight flickers at 21370 Hz (worst case, e.g., utilizing PWM) Flickering detected at a brightness setting of 51 % and below. There should be no flickering or PWM above this brightness setting. The frequency of 21370 Hz is quite high, so most users sensitive to PWM should not notice any flickering. In comparison: 52 % of all tested devices do not use PWM to dim the display. If PWM was detected, an average of 7763 (minimum: 5 - maximum: 343500) Hz was measured. | |||


Performance
The Core i7-1065G7 SKU is marketed as Microsoft's fastest Surface Laptop 3 configuration. It competes directly with the AMD Ryzen 7 3780U in the same way that the Core i5-1035G7 SKU competes with the Ryzen 5 3580U. Keep in mind that this same Intel Ice Lake CPU can also be found on the latest Surface Pro 7. Even if you don't game, the extra graphics horsepower from the integrated Iris Plus G7 should prove useful for graphics editors, accelerating video encoding or decoding, and external monitor support at higher resolutions.
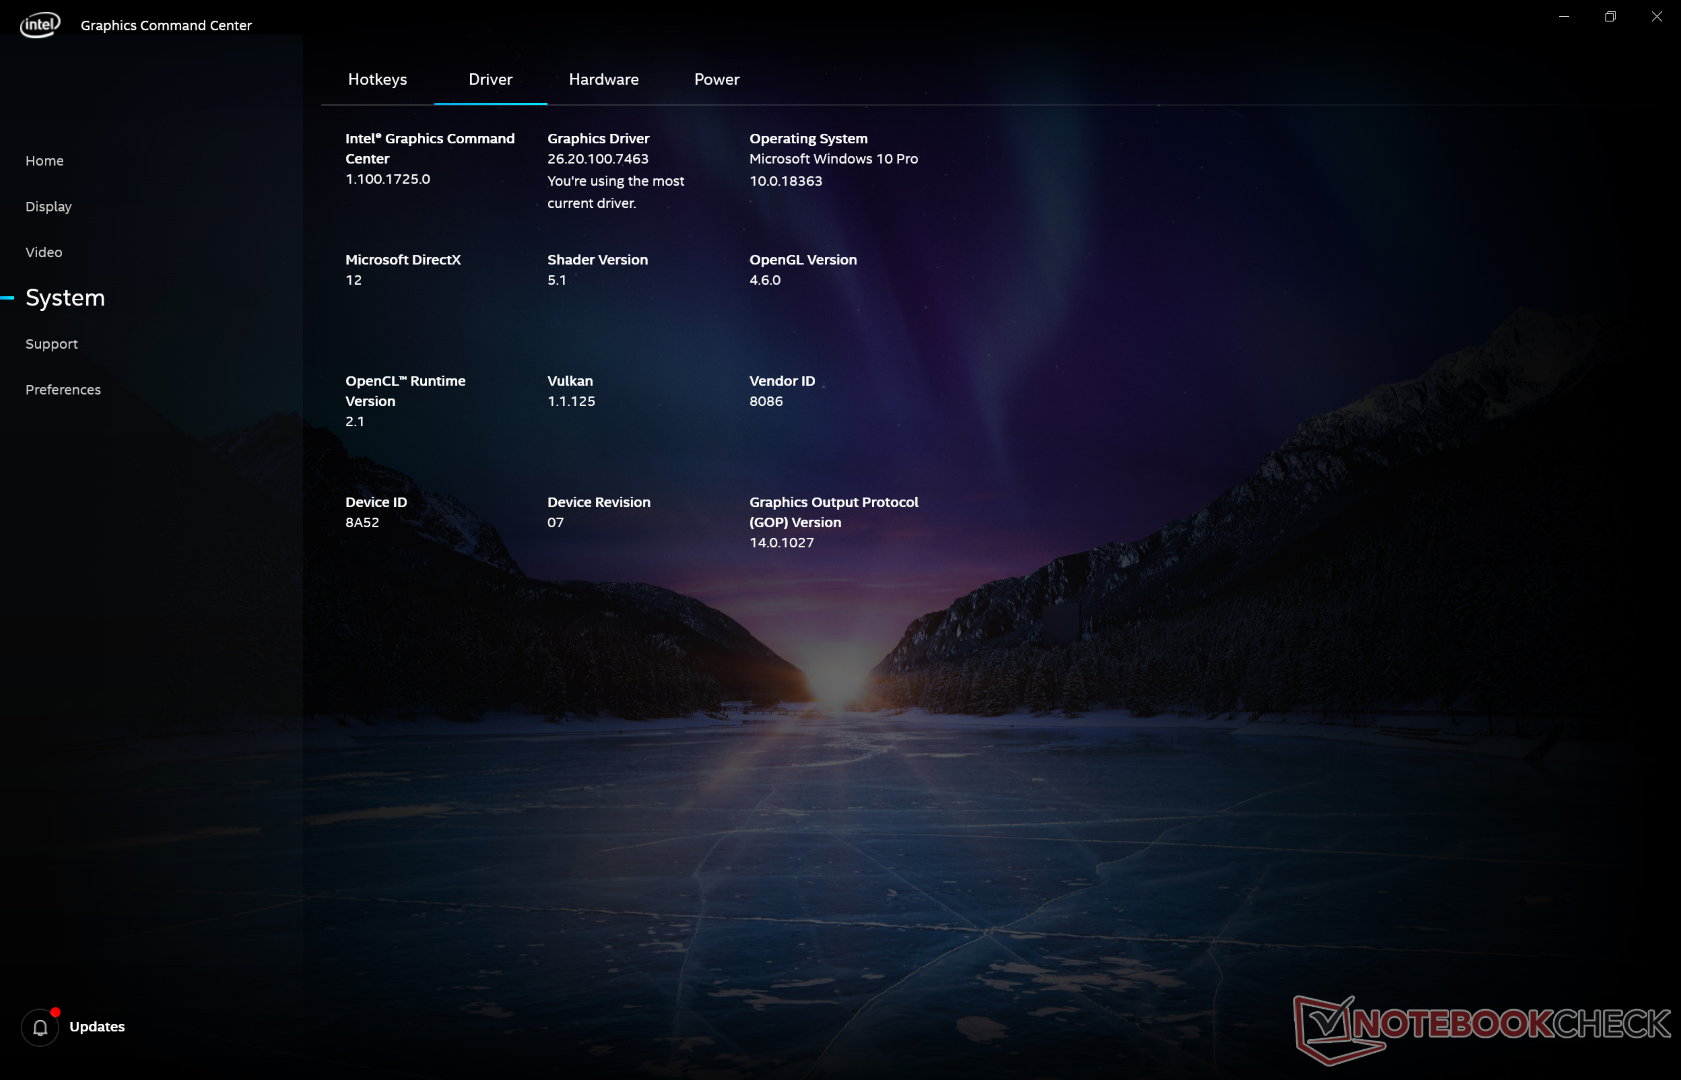
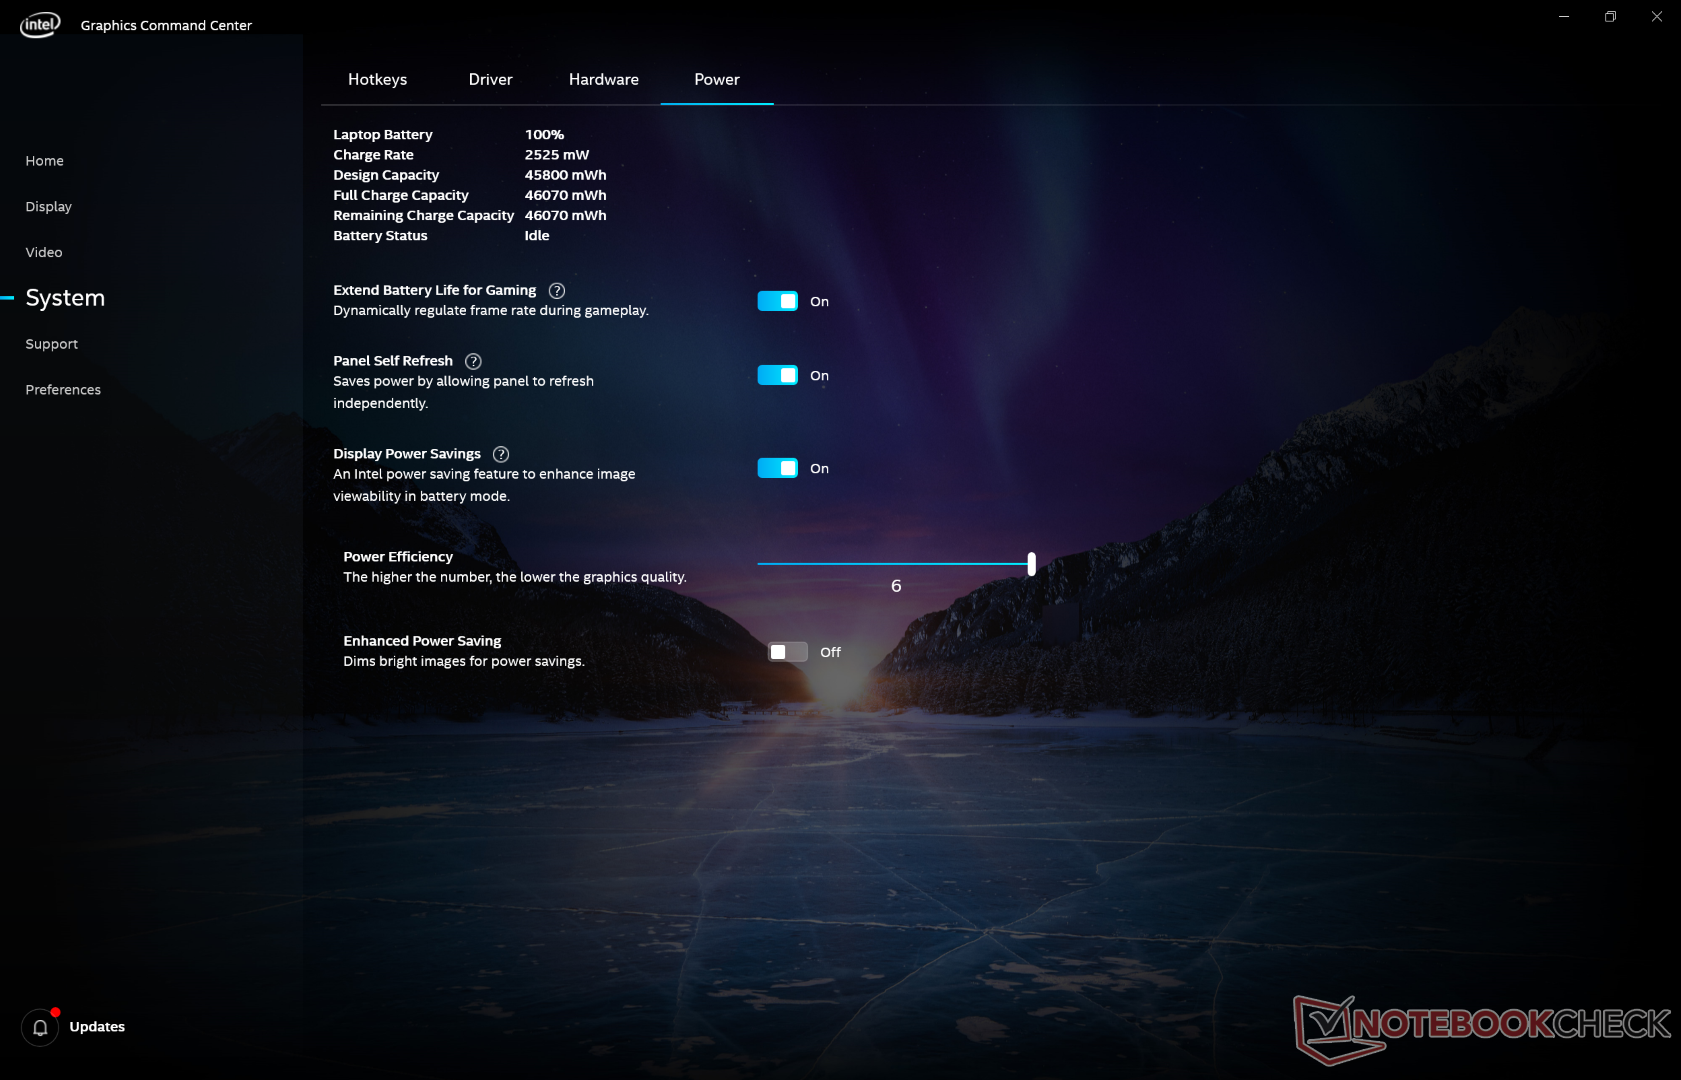
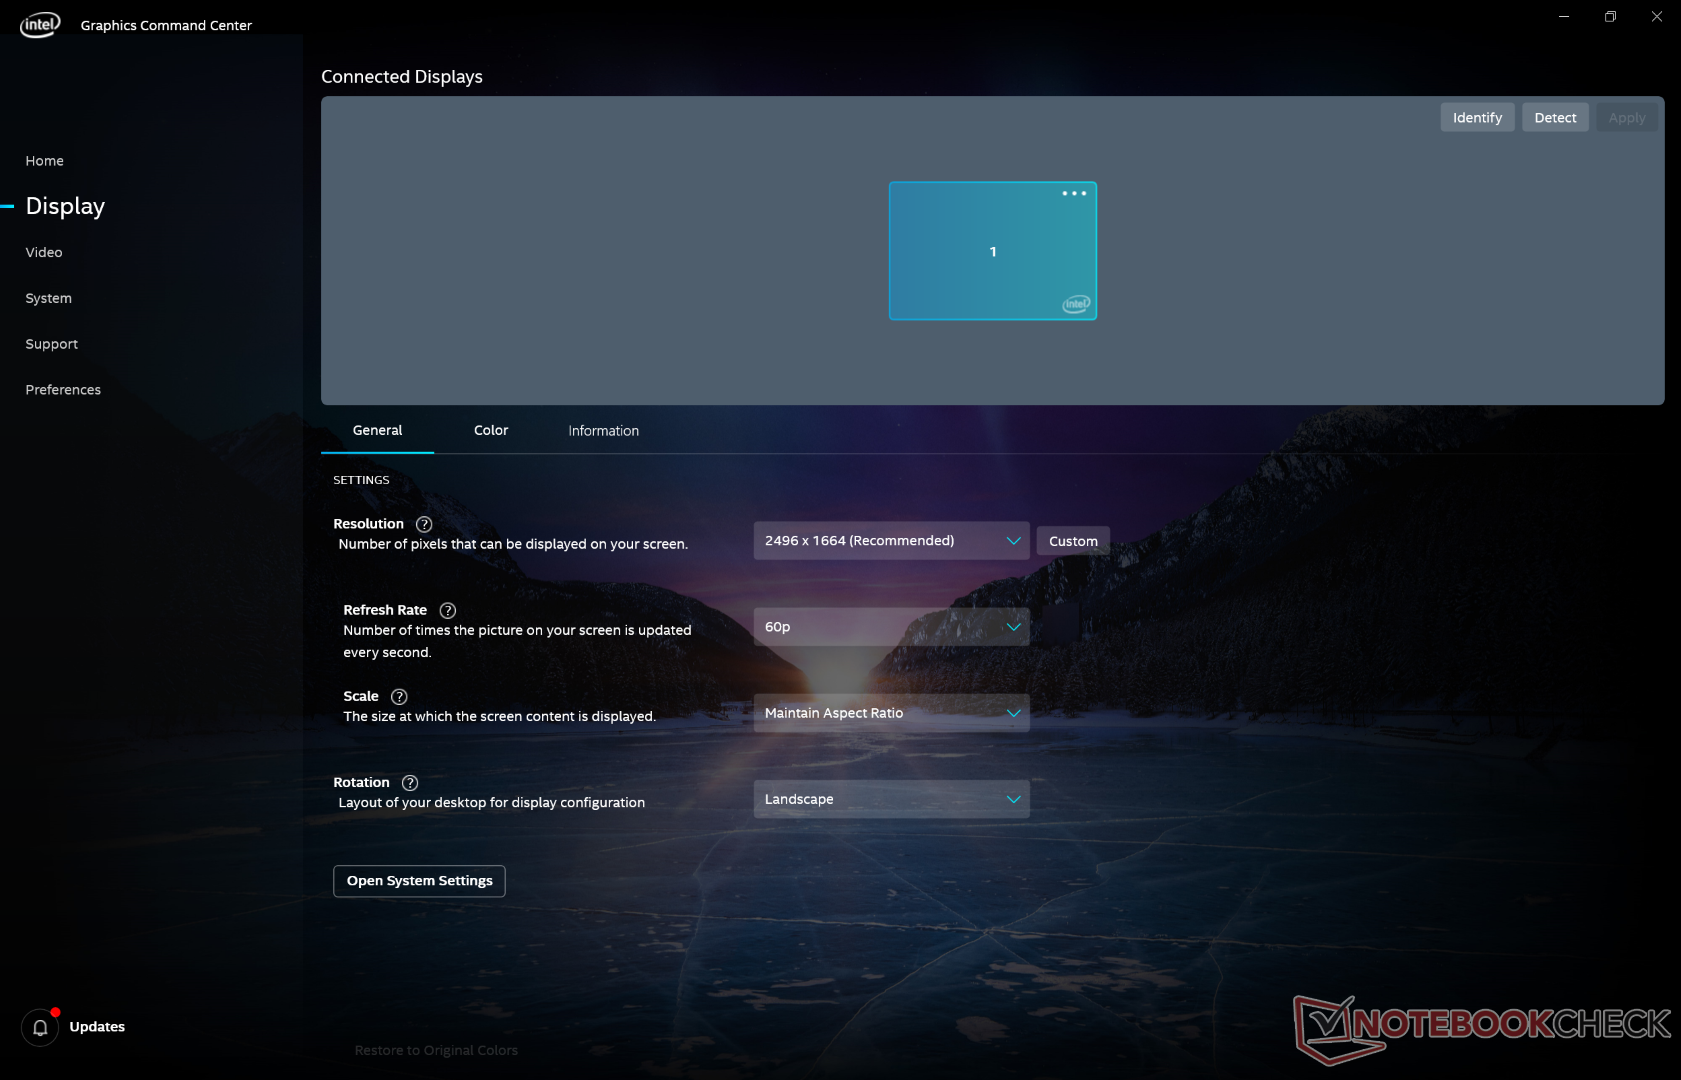
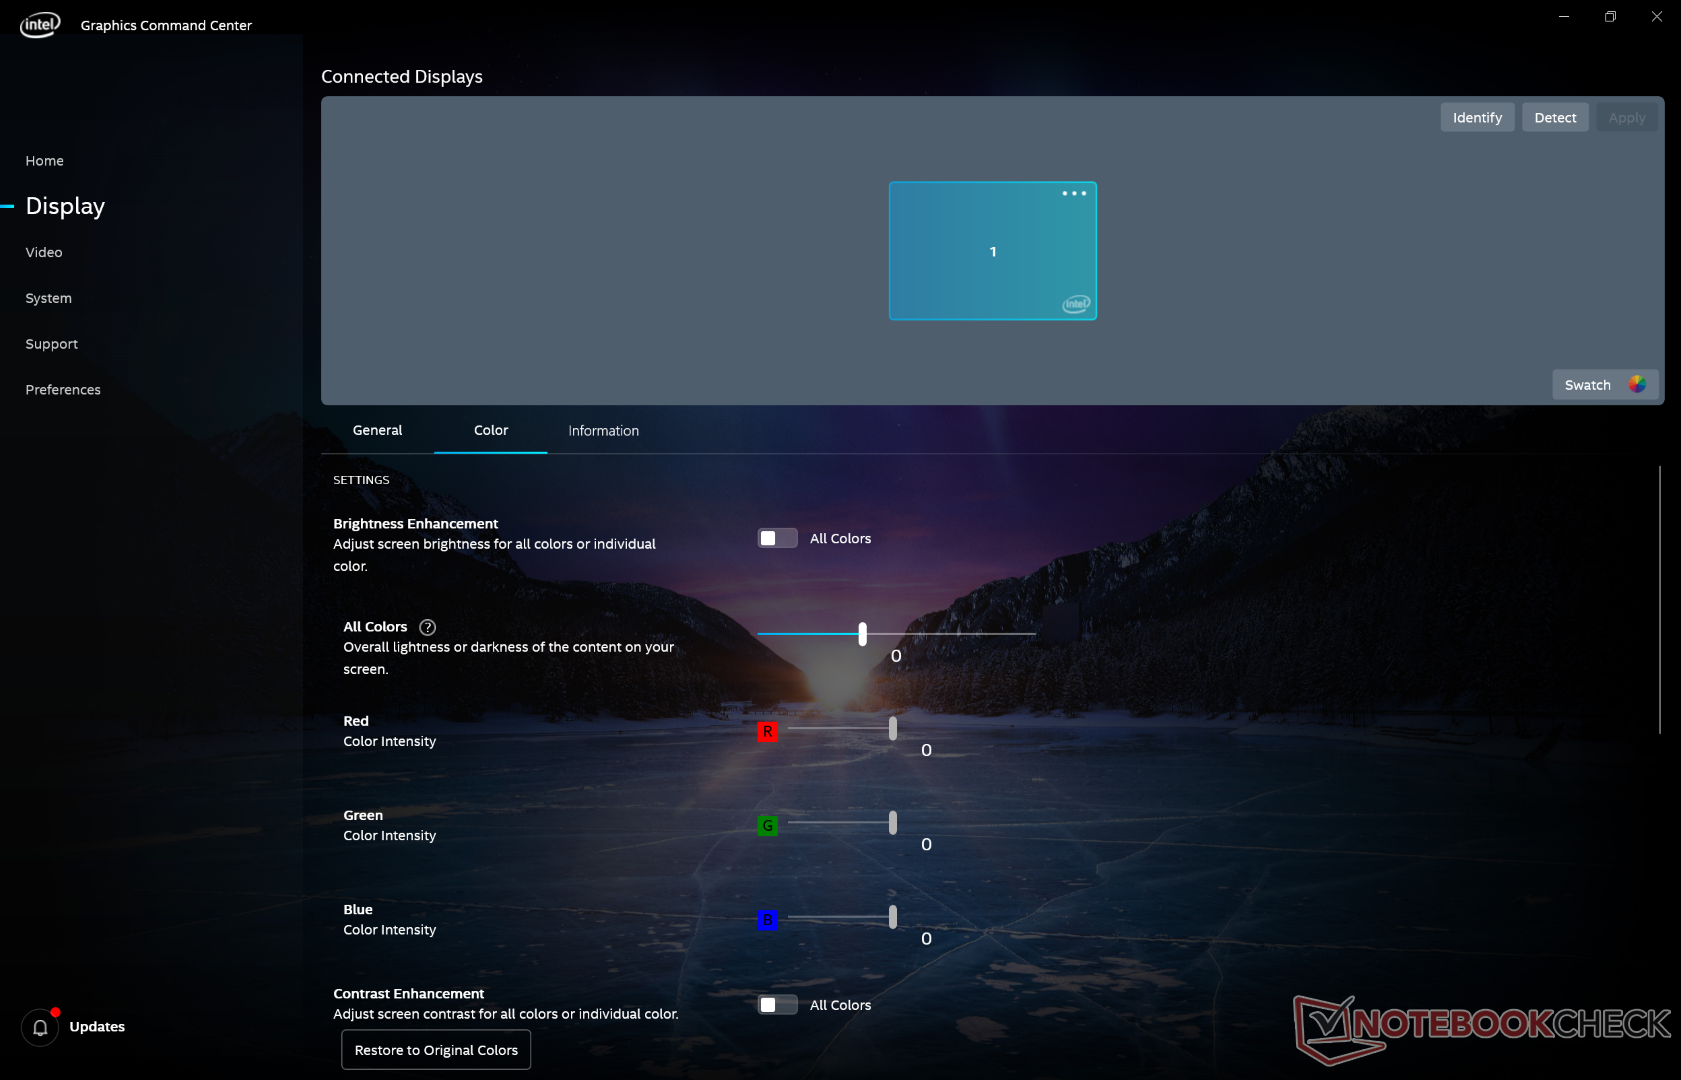
Our unit ships with the Intel Command Center software pre-installed to replace the older Intel Graphics Control Center. The new application offers more visual settings with a revised UI. Future laptops powered by Intel graphics are expected to ship with Command Center as well.
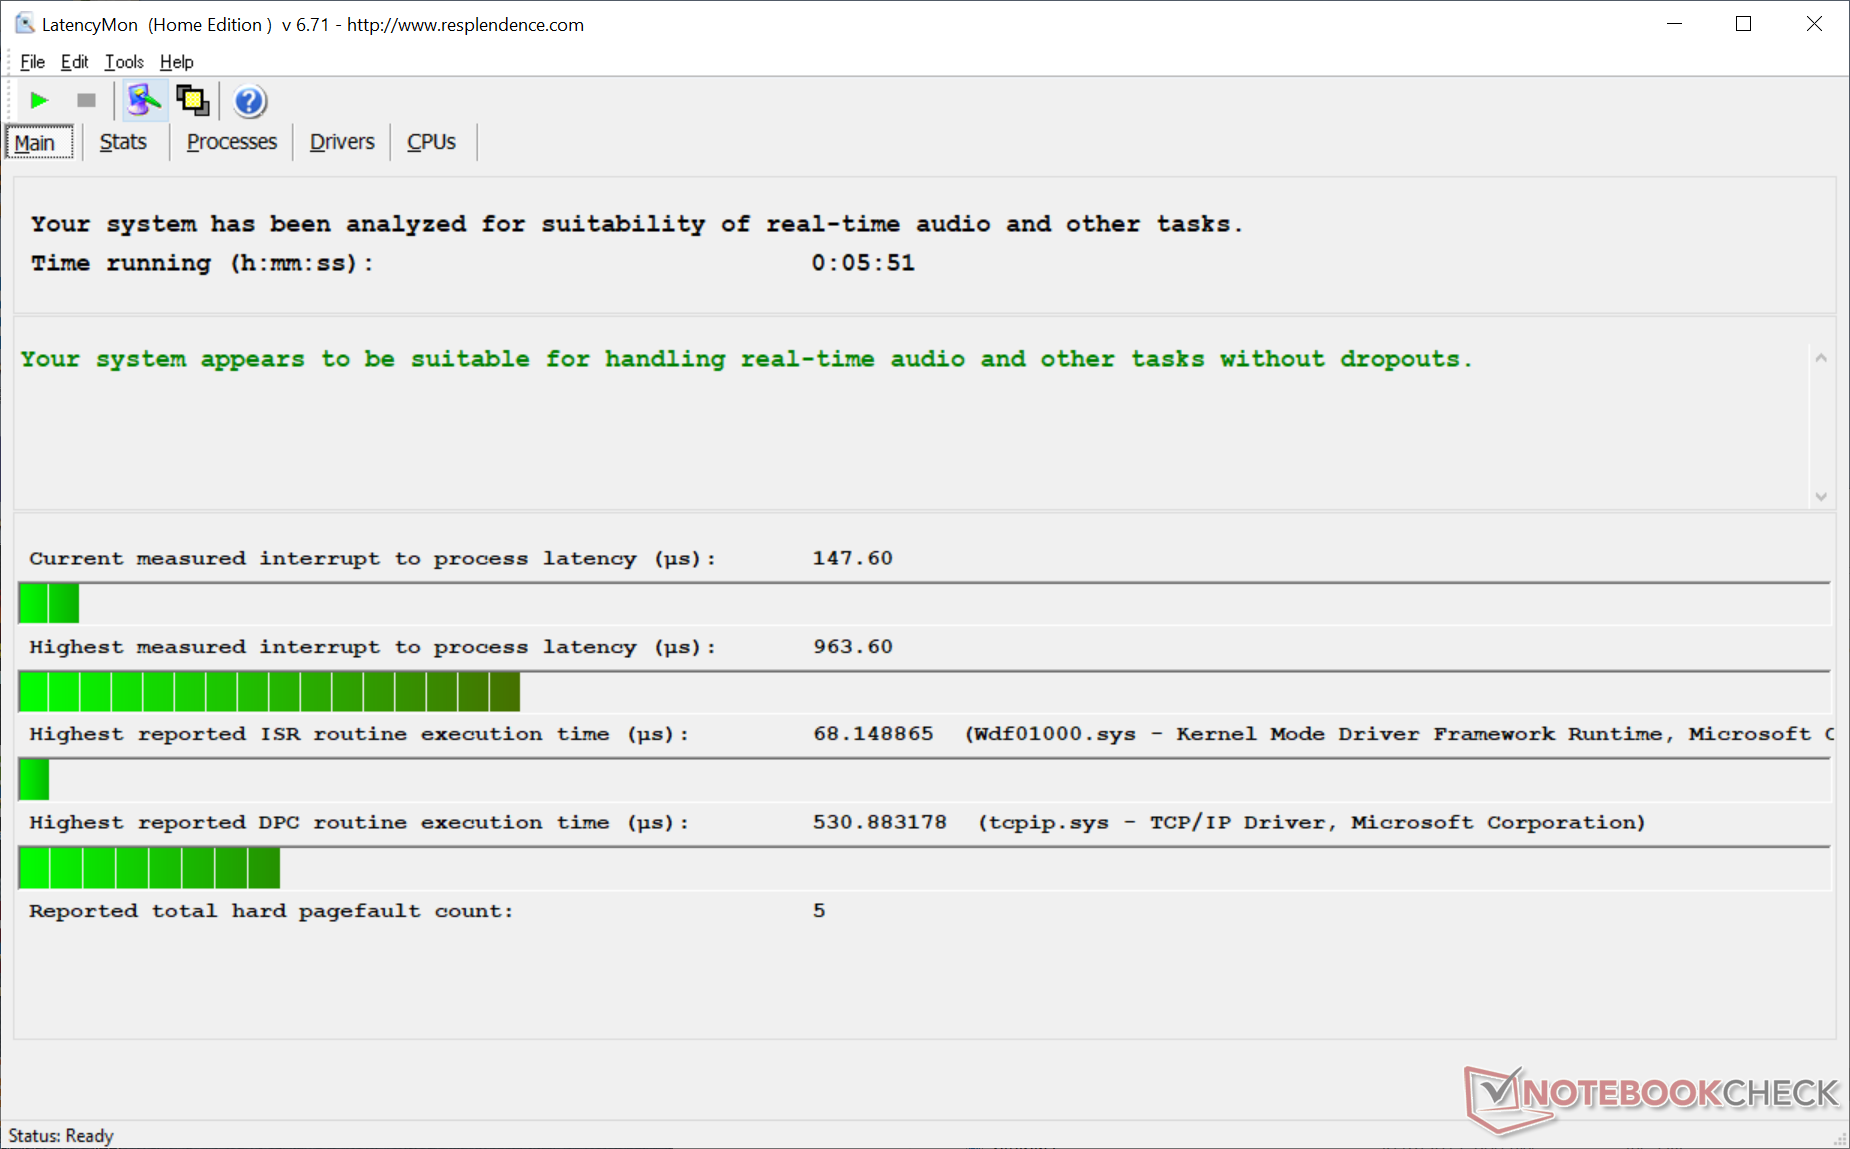
LatencyMon shows no recurring DPC latency issues regardless of Wi-Fi in contrast to what we observed on our Ryzen unit.
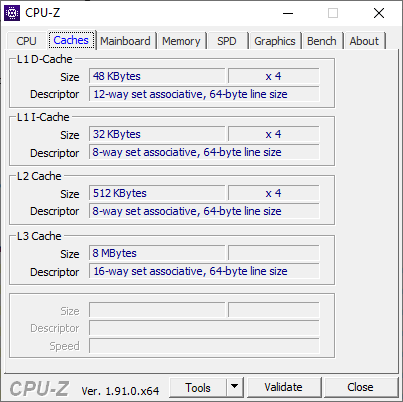
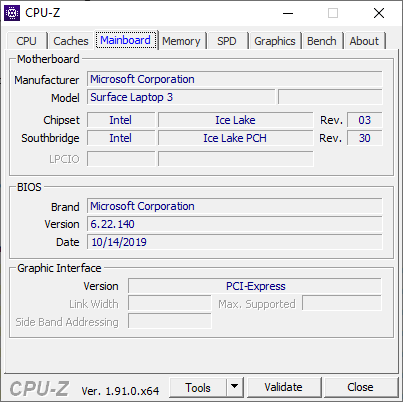
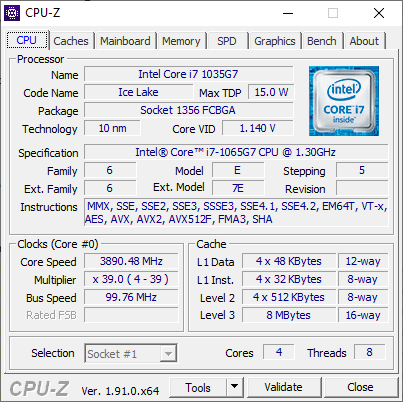
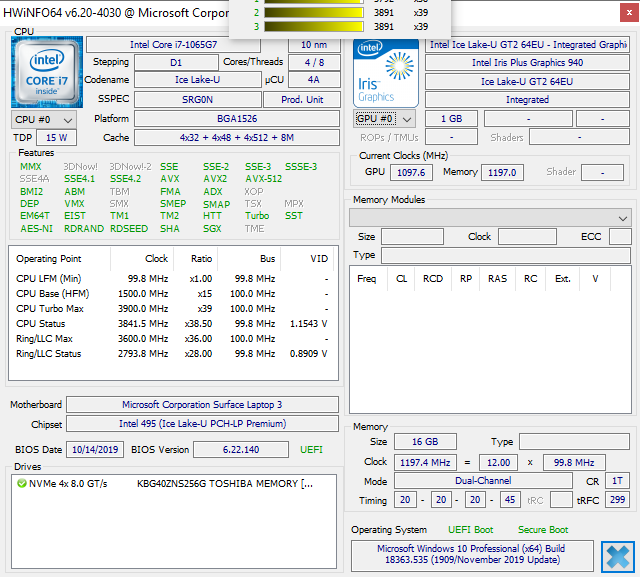
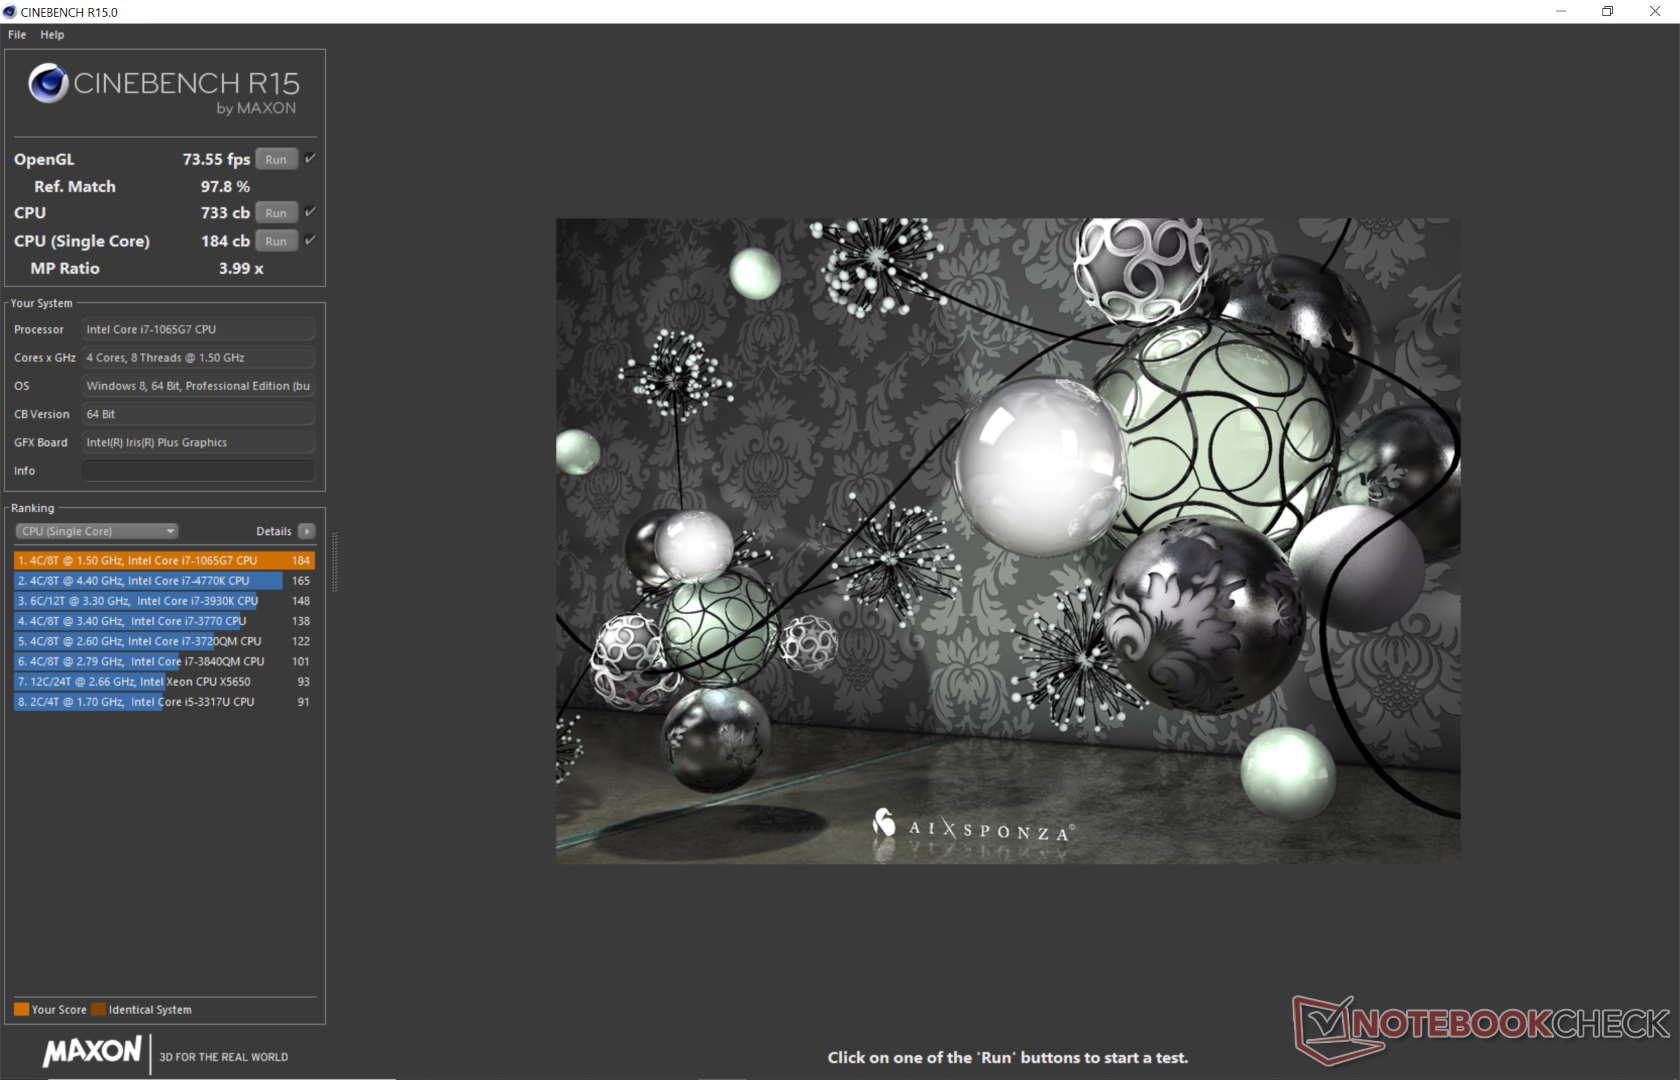
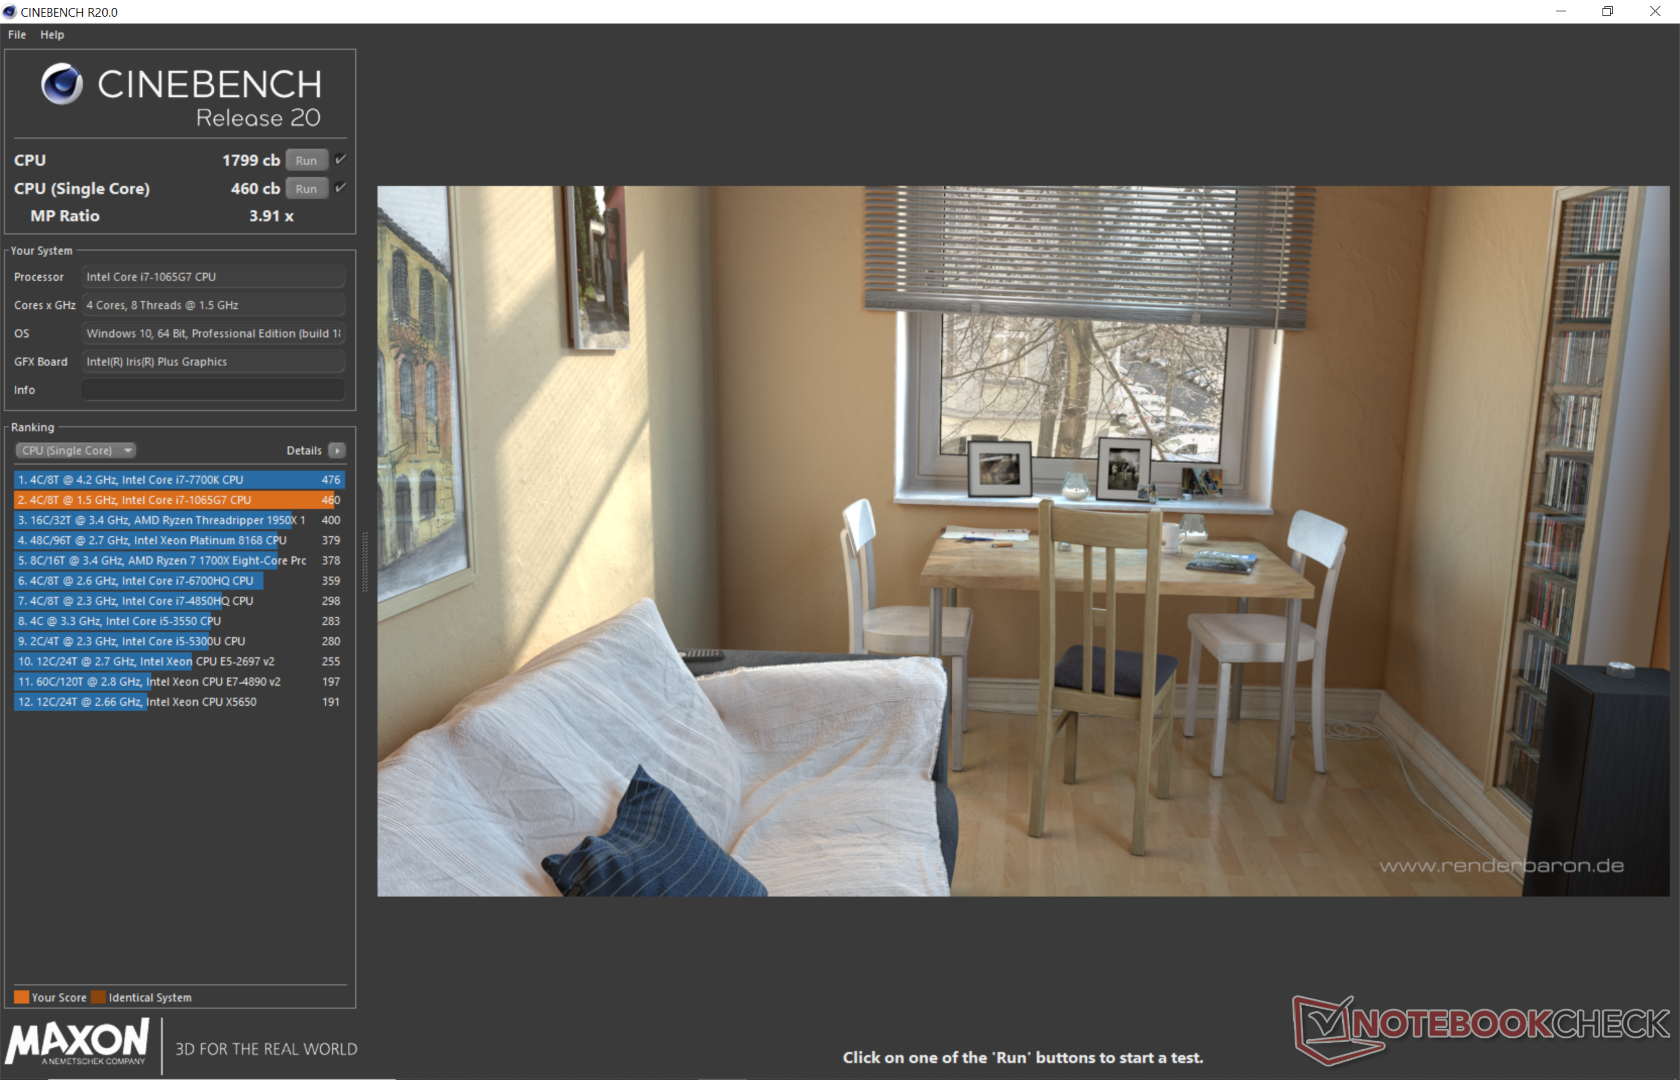
Processor
As our 9th Core i7-1065G7 entry in our database, we're starting to see what the processor is capable of. Microsoft's implementation of the 25 W CPU appears to be better than most as its multi-thread CineBench score is 11 percent faster than the average i7-1065G7. Raw performance is thus 16 percent higher than the Ryzen 5 3580U and within just a few percentage points of the Core i5-9300H.
Performance sustainability is better than expected which explains the higher-than-average CPU benchmark scores. When running CineBench R15 Multi-Thread in a loop, for example, performance drop by just 6 to 7 percent over time compared to 17 percent on the similarly equipped Lenovo Yoga C940. Performance is also steadier when under such stressful conditions as shown by our graph below.
Another advantage over AMD is hardware-based AI acceleration. The problem is that most applications and even Windows itself have yet to exploit the emerging technology meaning that your day-to-day workloads will likely not benefit from the AI capabilities of Ice Lake, if at all.
See our dedicated page on the Core i7-1065G7 for more technical information and benchmark comparisons.
System Performance
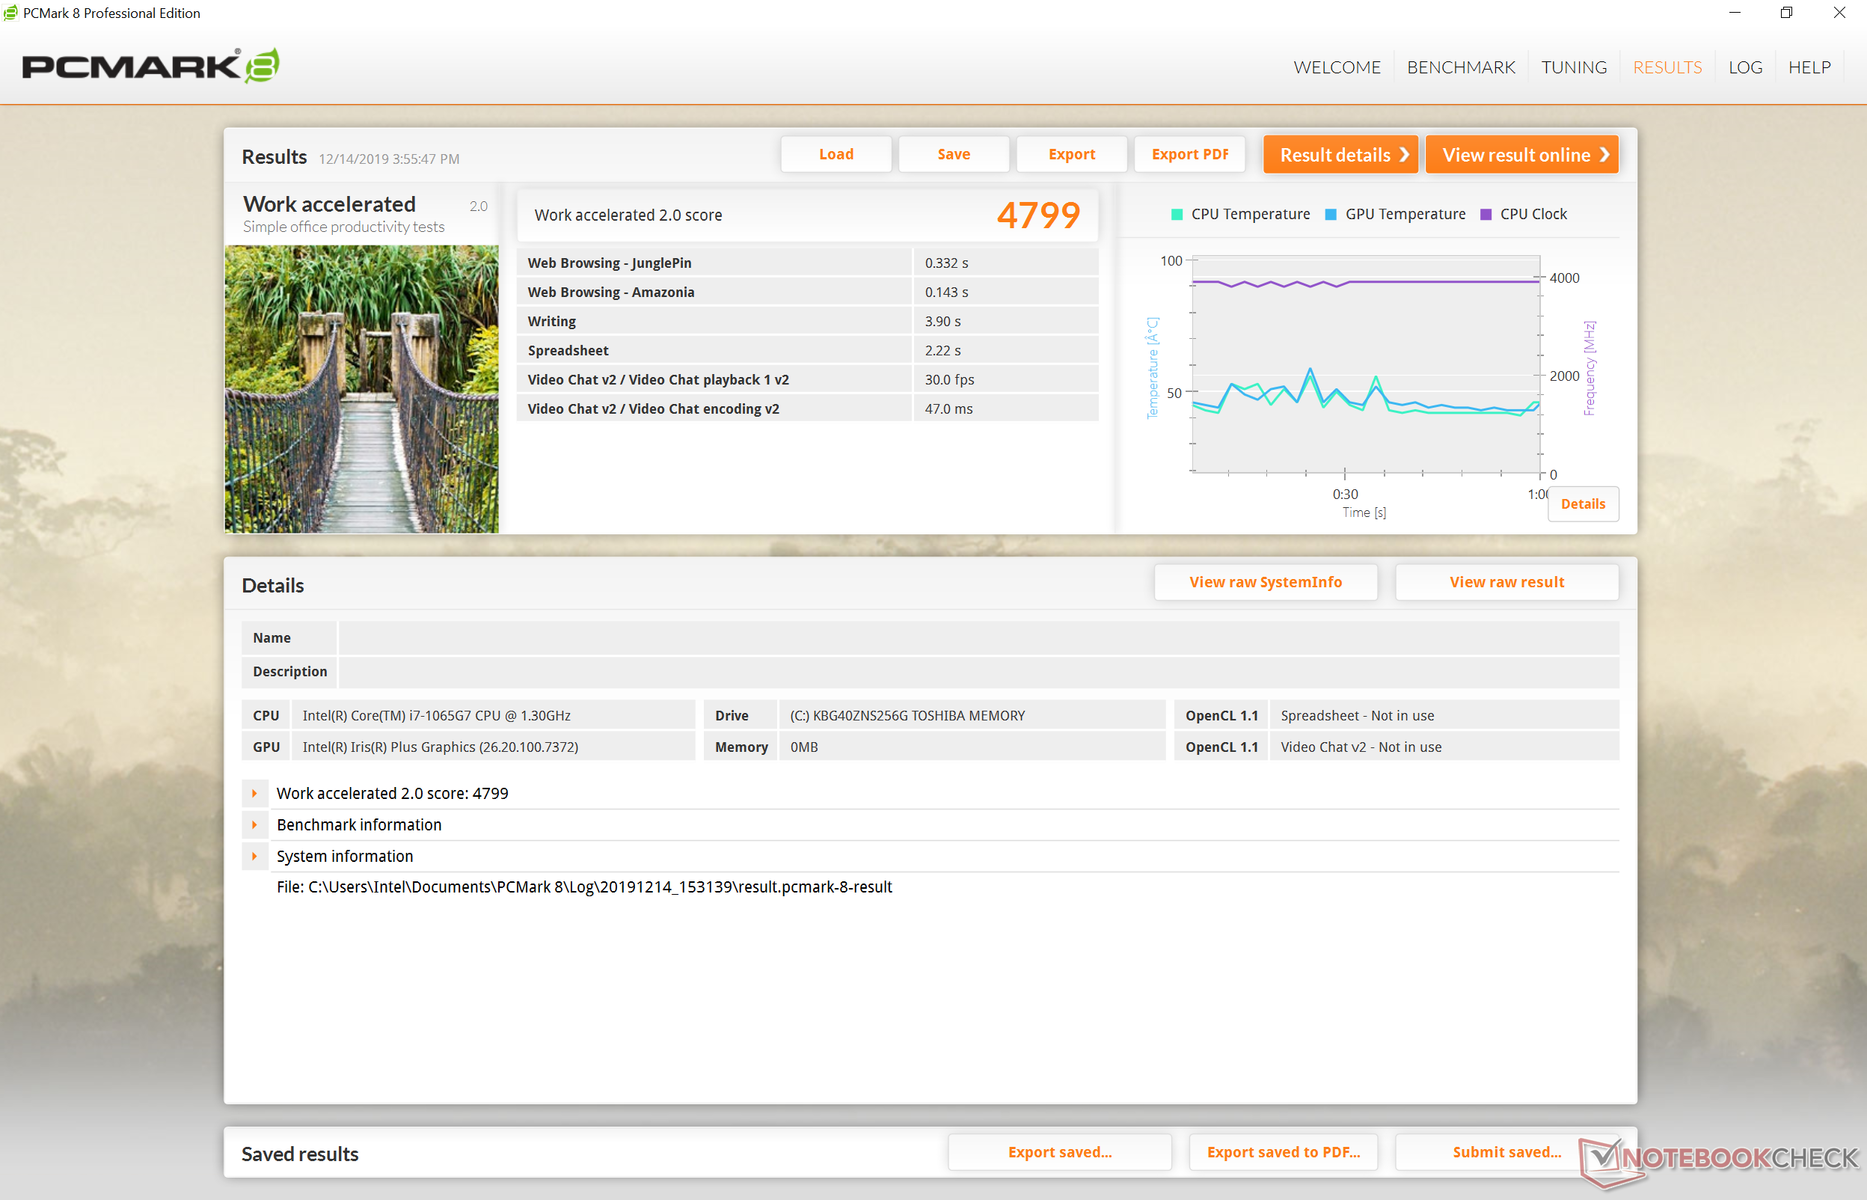
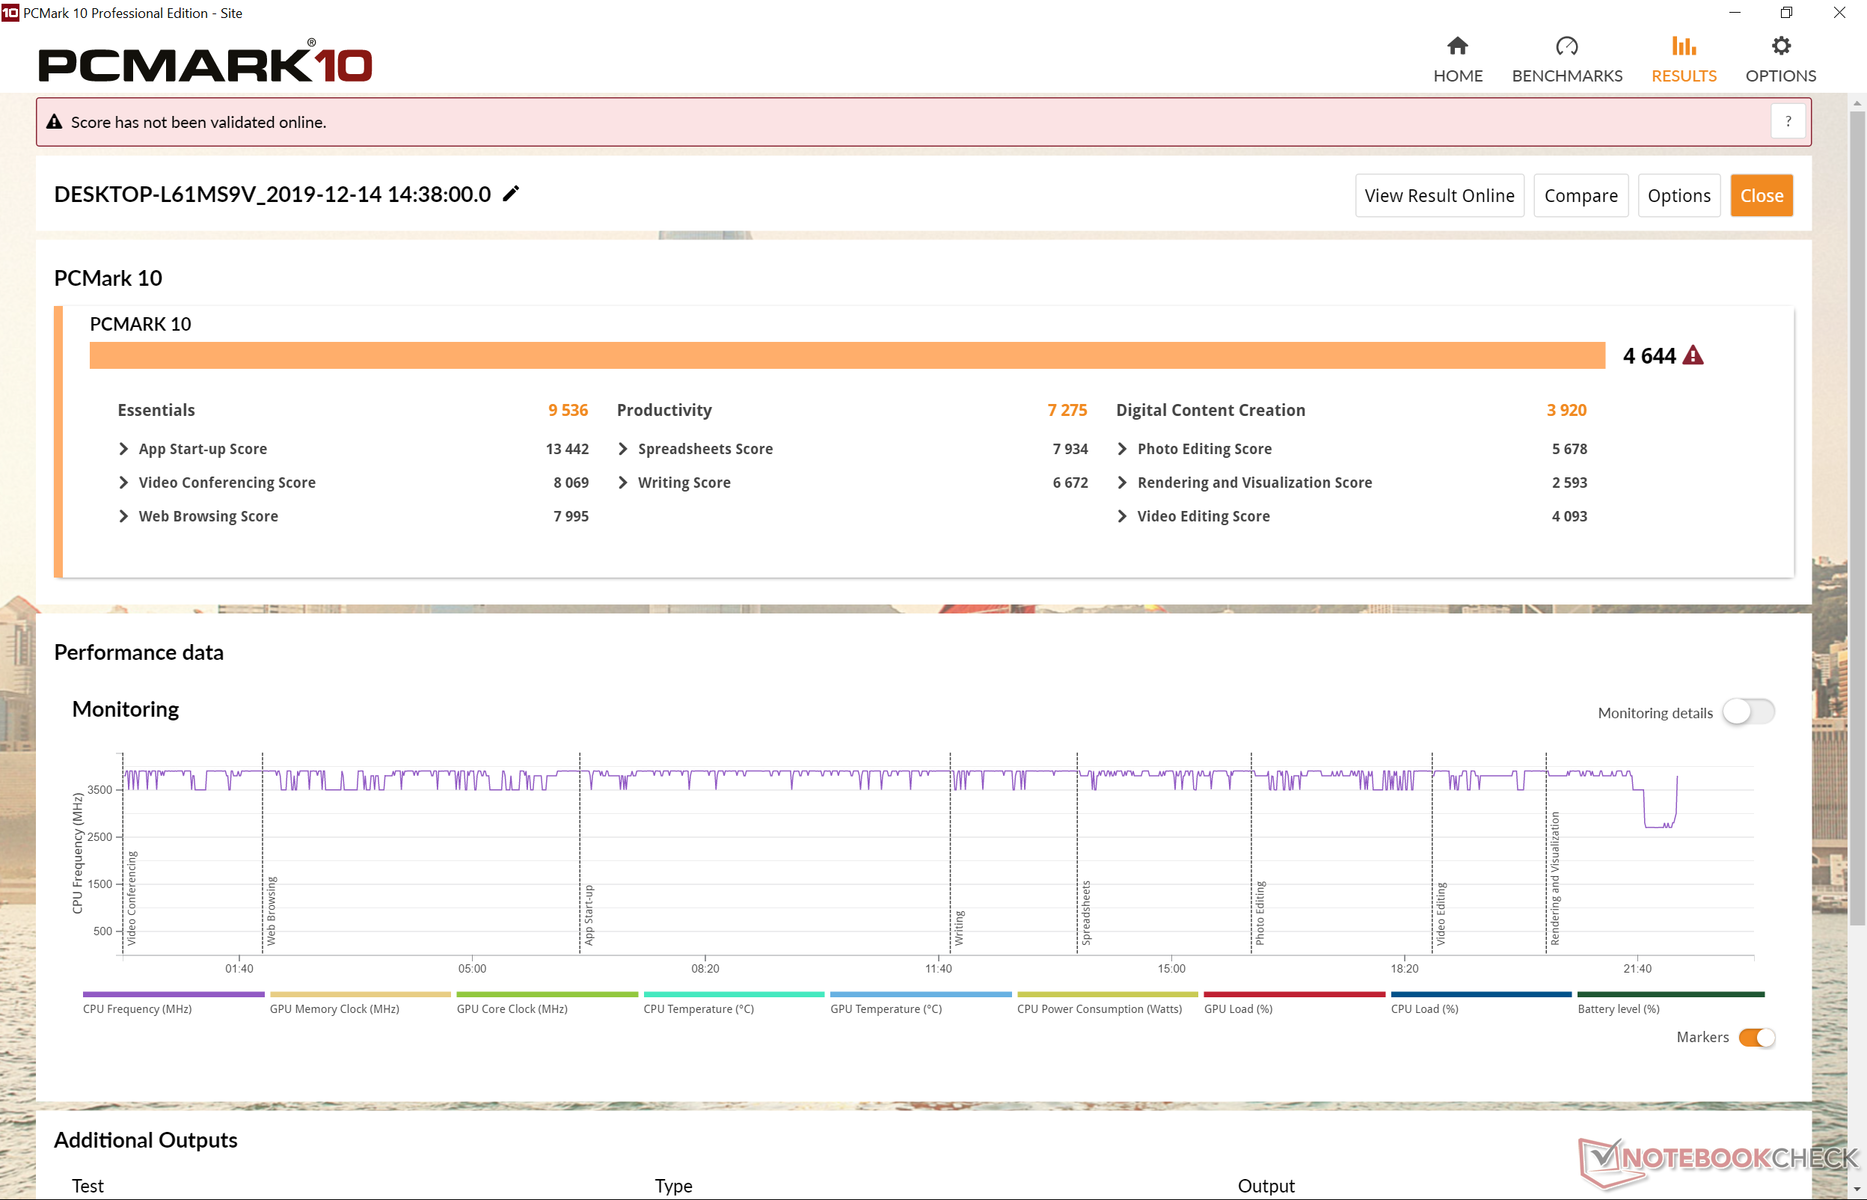
PCMark scores are 4 percent to 21 percent higher than the Ryzen 5 SKU depending on the benchmark. Its Digital Creation score, for example, is merely 4 percent higher than the AMD to suggest that the real-world performance difference between Iris Plus and the Vega 8/9/10/11 series isn't as wide as Intel would like you to believe. Intel has its biggest advantage in the PCMark Essentials benchmark which tests how fast and smoothly the system can multi-task between web browsing and launching applications. The Intel chipset is likely better optimized for such day-to-day applications.
We experienced no software or hardware issues during our time with the test unit.
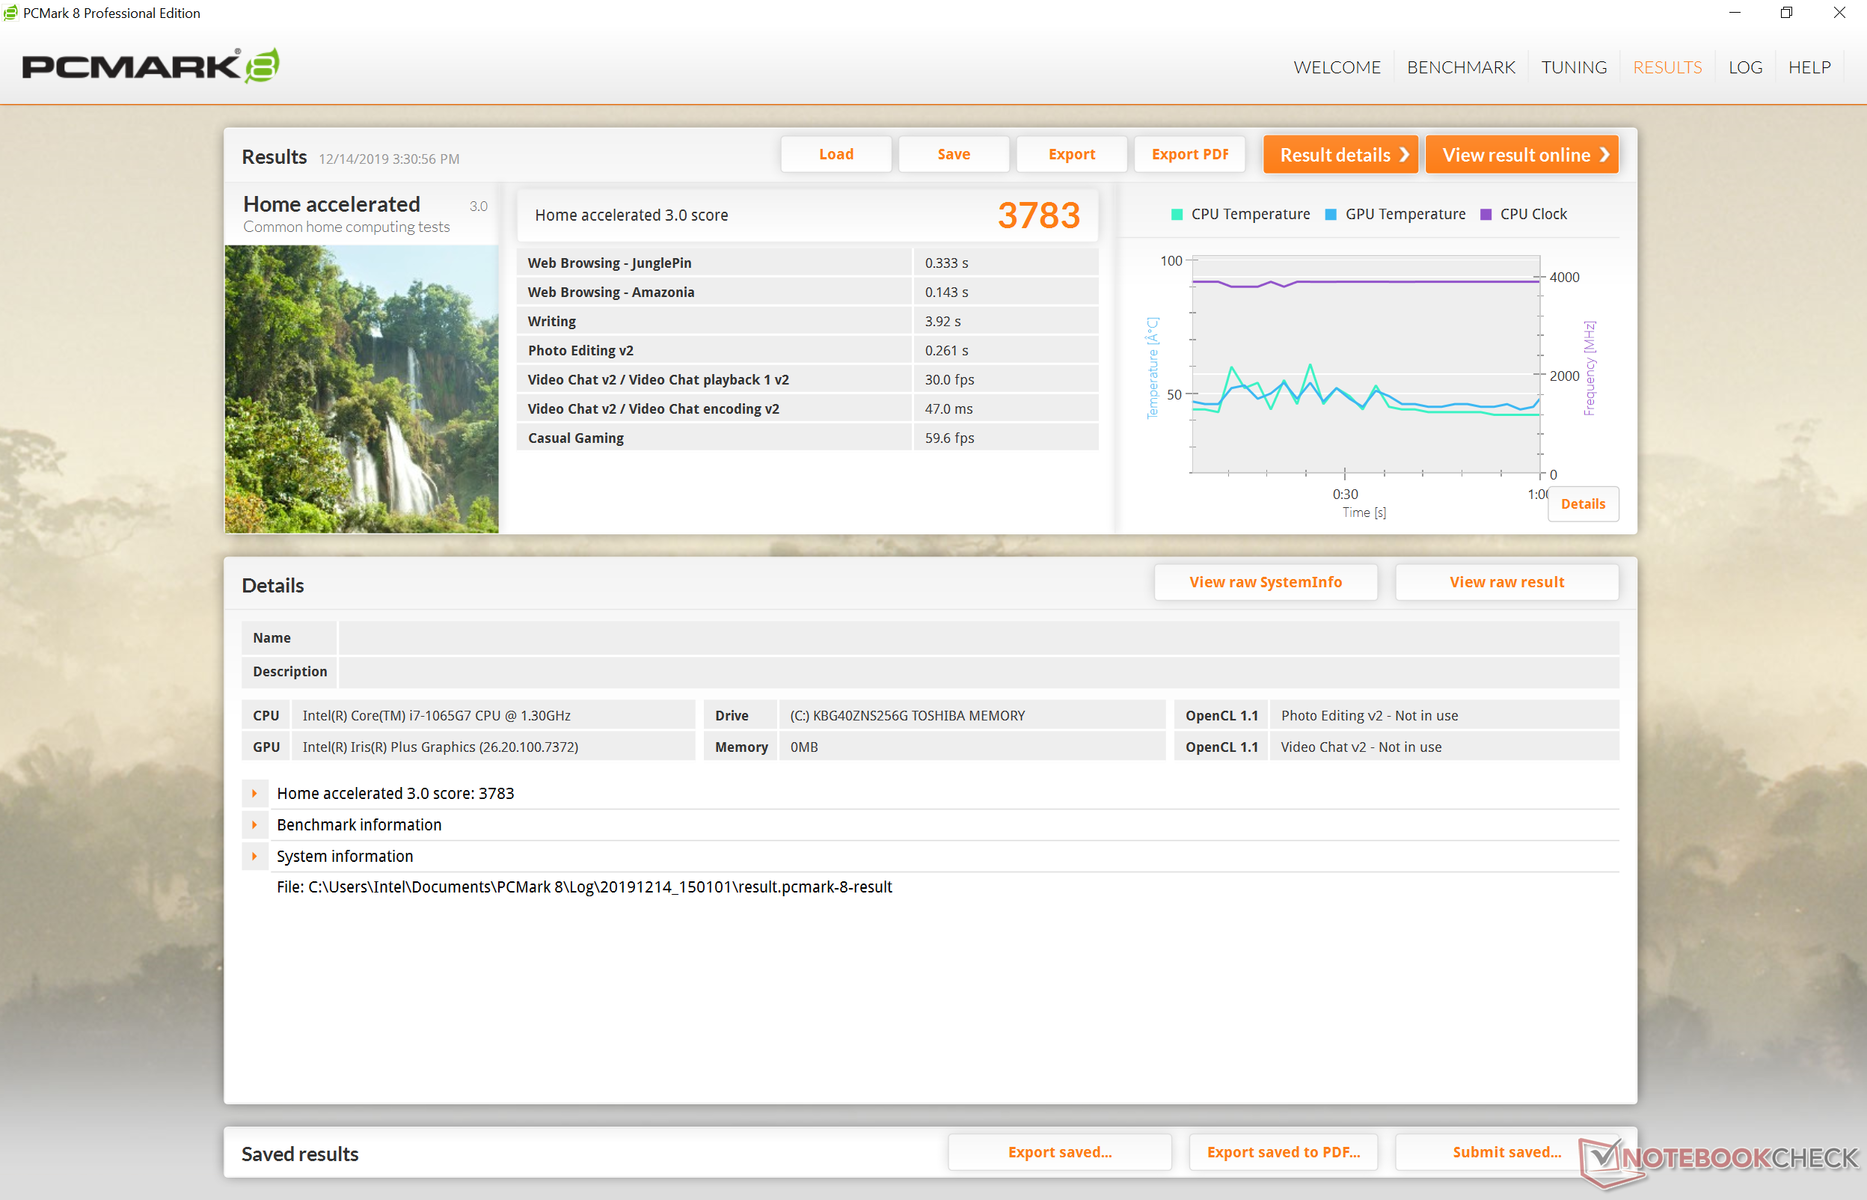
| PCMark 8 Home Score Accelerated v2 | 3783 points | |
| PCMark 8 Work Score Accelerated v2 | 4799 points | |
| PCMark 10 Score | 4644 points | |
Help | ||
Storage Devices
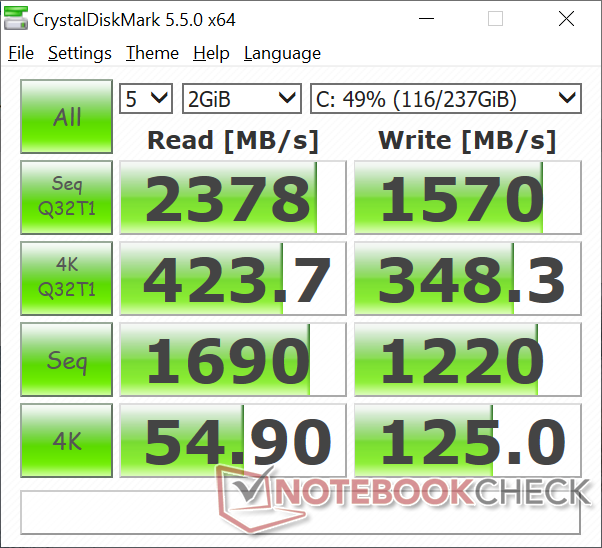
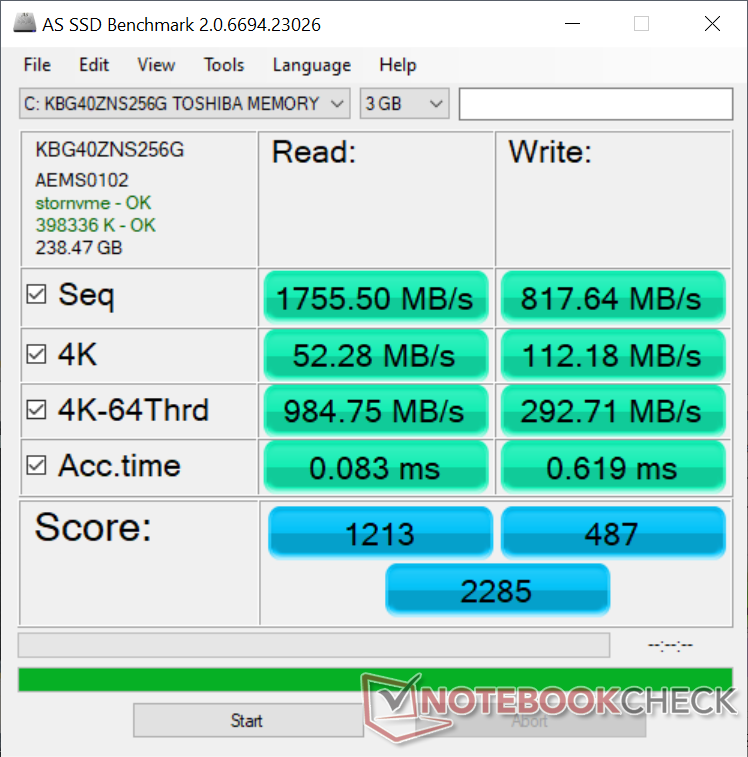
Interestingly, our Intel SKU comes with a 256 GB Toshiba KBG40ZNS256G NVMe SSD in contrast to the 256 GB SK Hynix BC501 in our Ryzen 5 SKU to suggest that Microsoft is sourcing multiple suppliers for its Surface Laptop 3 series. It's therefore a gamble as to which SSD you will actually end up purchasing.
The Toshiba drive outperforms the SK Hynix drive. AS SSD shows sequential read and write rates of 1755 MB/s and 818 MB/s, respectively, compared to 1122 MB/s and 514 MB/s on our Ryzen 5 SKU. Though an improvement, transfer rates are merely average when compared to the Apple SSD or Lite-On SSD as found on the Apple MacBook Pro 16 or Razer Blade Stealth. It's disappointing to see Microsoft cut corners here on its premier laptop series.
See our table of HDDs and SSDs for more benchmark comparisons.
| Microsoft Surface Laptop 3 15 i7-1065G7 Toshiba KBG40ZNS256G NVMe | Apple MacBook Pro 16 2019 i9 5500M Apple SSD AP1024 7171 | Asus ZenBook 15 UX534FT-DB77 Samsung SSD PM981 MZVLB1T0HALR | MSI Prestige 15 A10SC Samsung SSD PM981 MZVLB1T0HALR | Microsoft Surface Laptop 3 15 Ryzen 5 3580U SK hynix BC501 HFM256GDGTNG | Razer Blade Stealth 13, Core i7-1065G7 Lite-On CA3-8D512 | |
|---|---|---|---|---|---|---|
| AS SSD | 82% | 66% | 85% | -21% | 13% | |
| Seq Read (MB/s) | 1756 | 2531 44% | 1887 7% | 1274 -27% | 1122 -36% | 2666 52% |
| Seq Write (MB/s) | 818 | 2289 180% | 1432 75% | 1395 71% | 514 -37% | 1497 83% |
| 4K Read (MB/s) | 52.3 | 15.85 -70% | 52.3 0% | 50.3 -4% | 34.98 -33% | 53.7 3% |
| 4K Write (MB/s) | 112.2 | 39.88 -64% | 146 30% | 119.8 7% | 96.8 -14% | 133.7 19% |
| 4K-64 Read (MB/s) | 985 | 1267 29% | 969 -2% | 1599 62% | 492 -50% | 652 -34% |
| 4K-64 Write (MB/s) | 292.7 | 1749 498% | 1375 370% | 1455 397% | 339.9 16% | 272 -7% |
| Access Time Read * (ms) | 0.083 | 0.122 -47% | 0.034 59% | 0.044 47% | 0.056 33% | 0.075 10% |
| Access Time Write * (ms) | 0.619 | 0.095 85% | 0.075 88% | 0.092 85% | 0.11 82% | 0.032 95% |
| Score Read (Points) | 1213 | 1536 27% | 1210 0% | 1777 46% | 639 -47% | 972 -20% |
| Score Write (Points) | 487 | 2018 314% | 1664 242% | 1714 252% | 488 0% | 555 14% |
| Score Total (Points) | 2285 | 4317 89% | 3483 52% | 4411 93% | 1434 -37% | 1982 -13% |
| Copy ISO MB/s (MB/s) | 1192 | 1995 67% | 1375 15% | 2830 137% | 828 -31% | 1495 25% |
| Copy Program MB/s (MB/s) | 604 | 584 -3% | 468 -23% | 609 1% | 200.5 -67% | 458.4 -24% |
| Copy Game MB/s (MB/s) | 1136 | 1135 0% | 1287 13% | 1424 25% | 387.4 -66% | 964 -15% |
* ... smaller is better

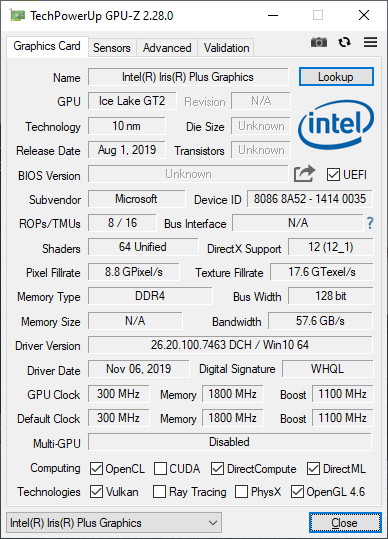
GPU Performance
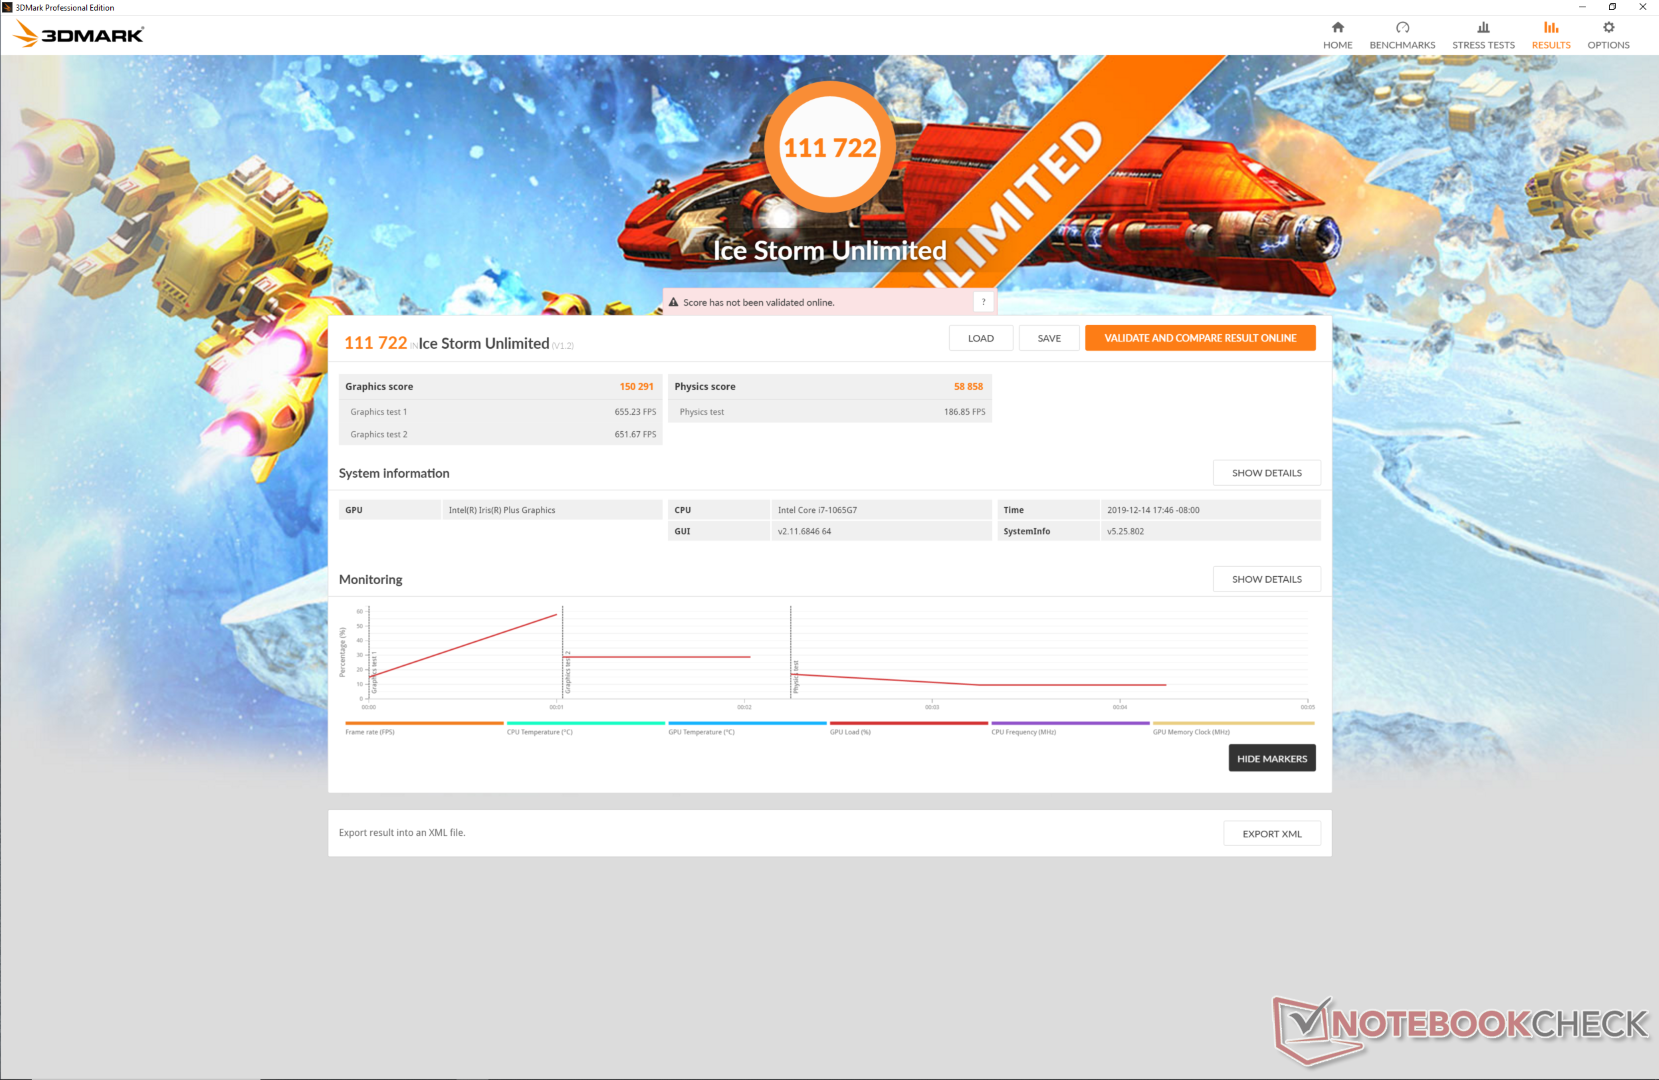
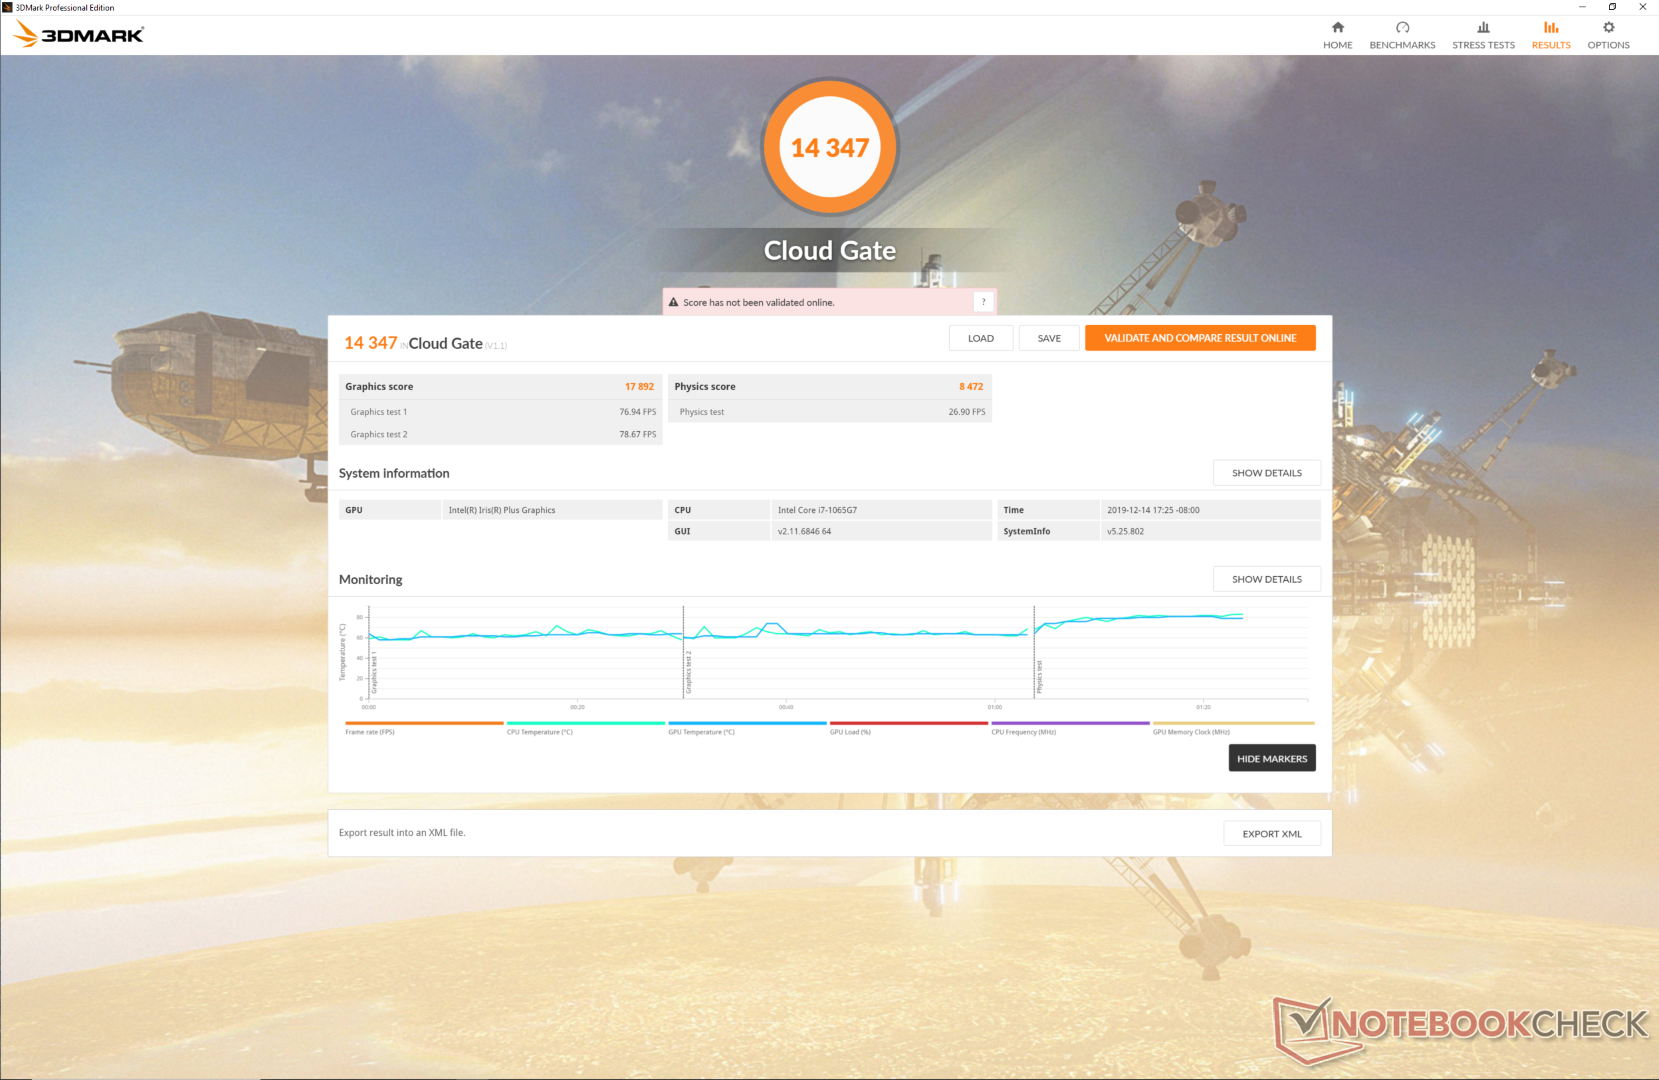
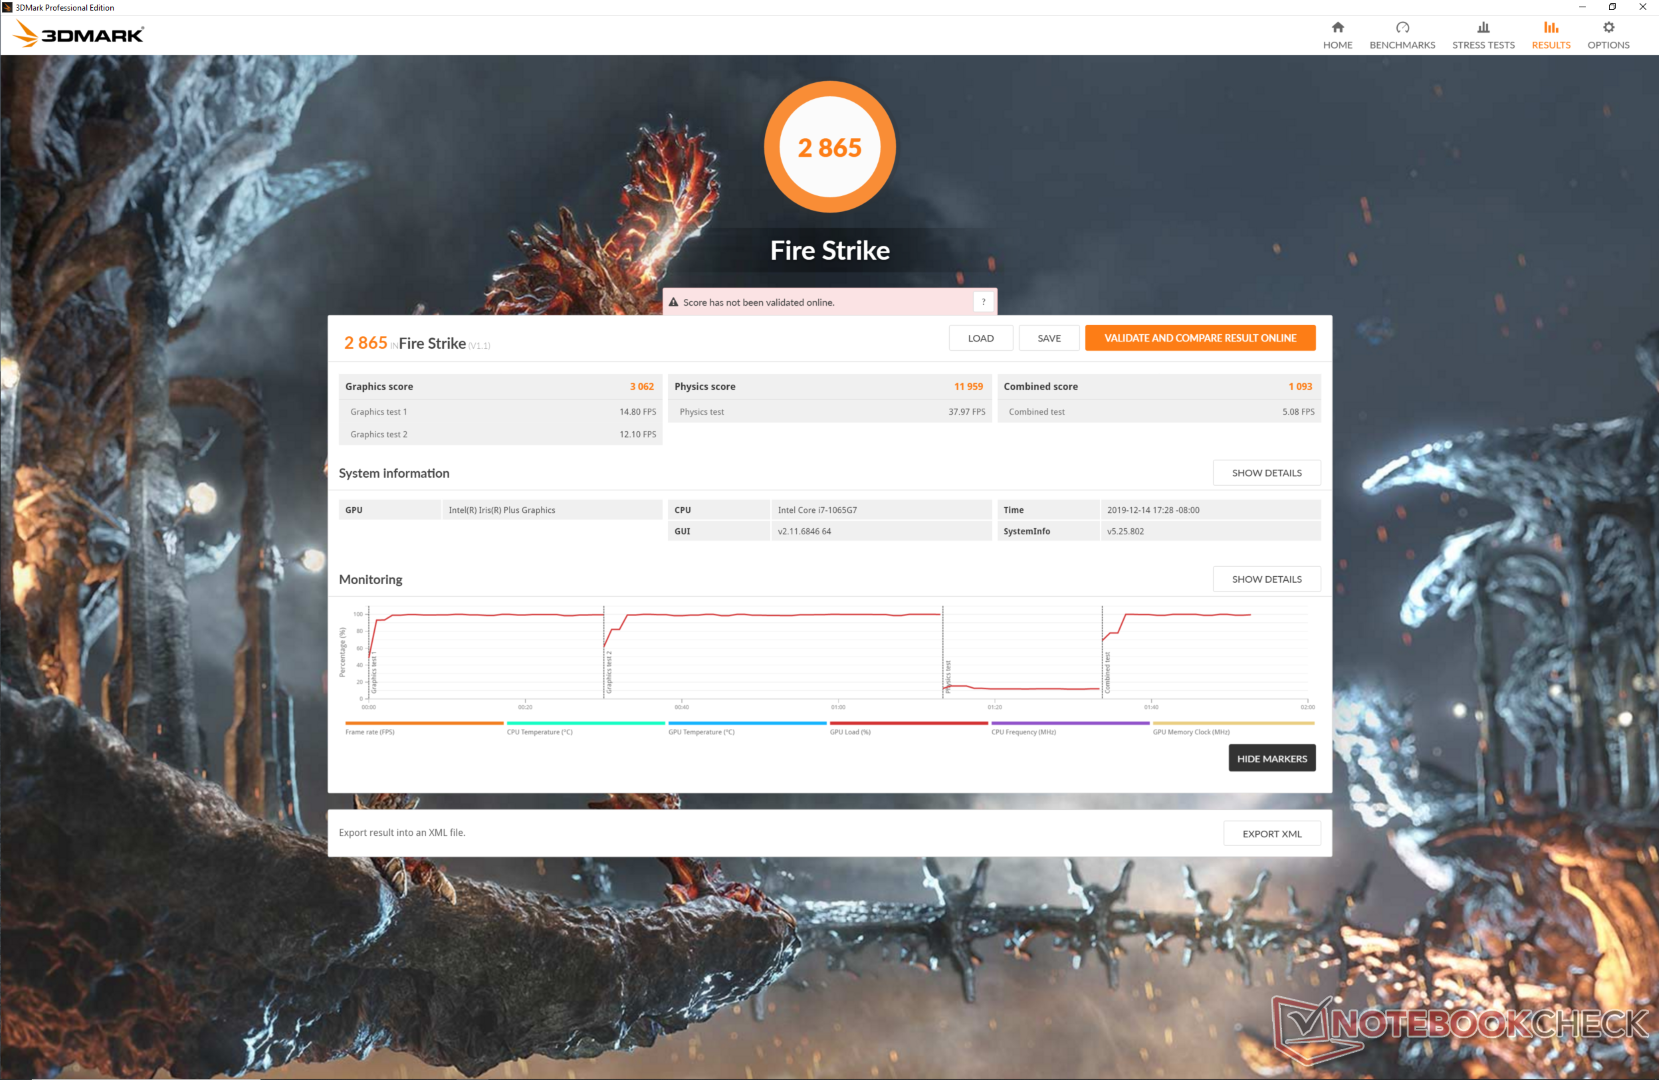
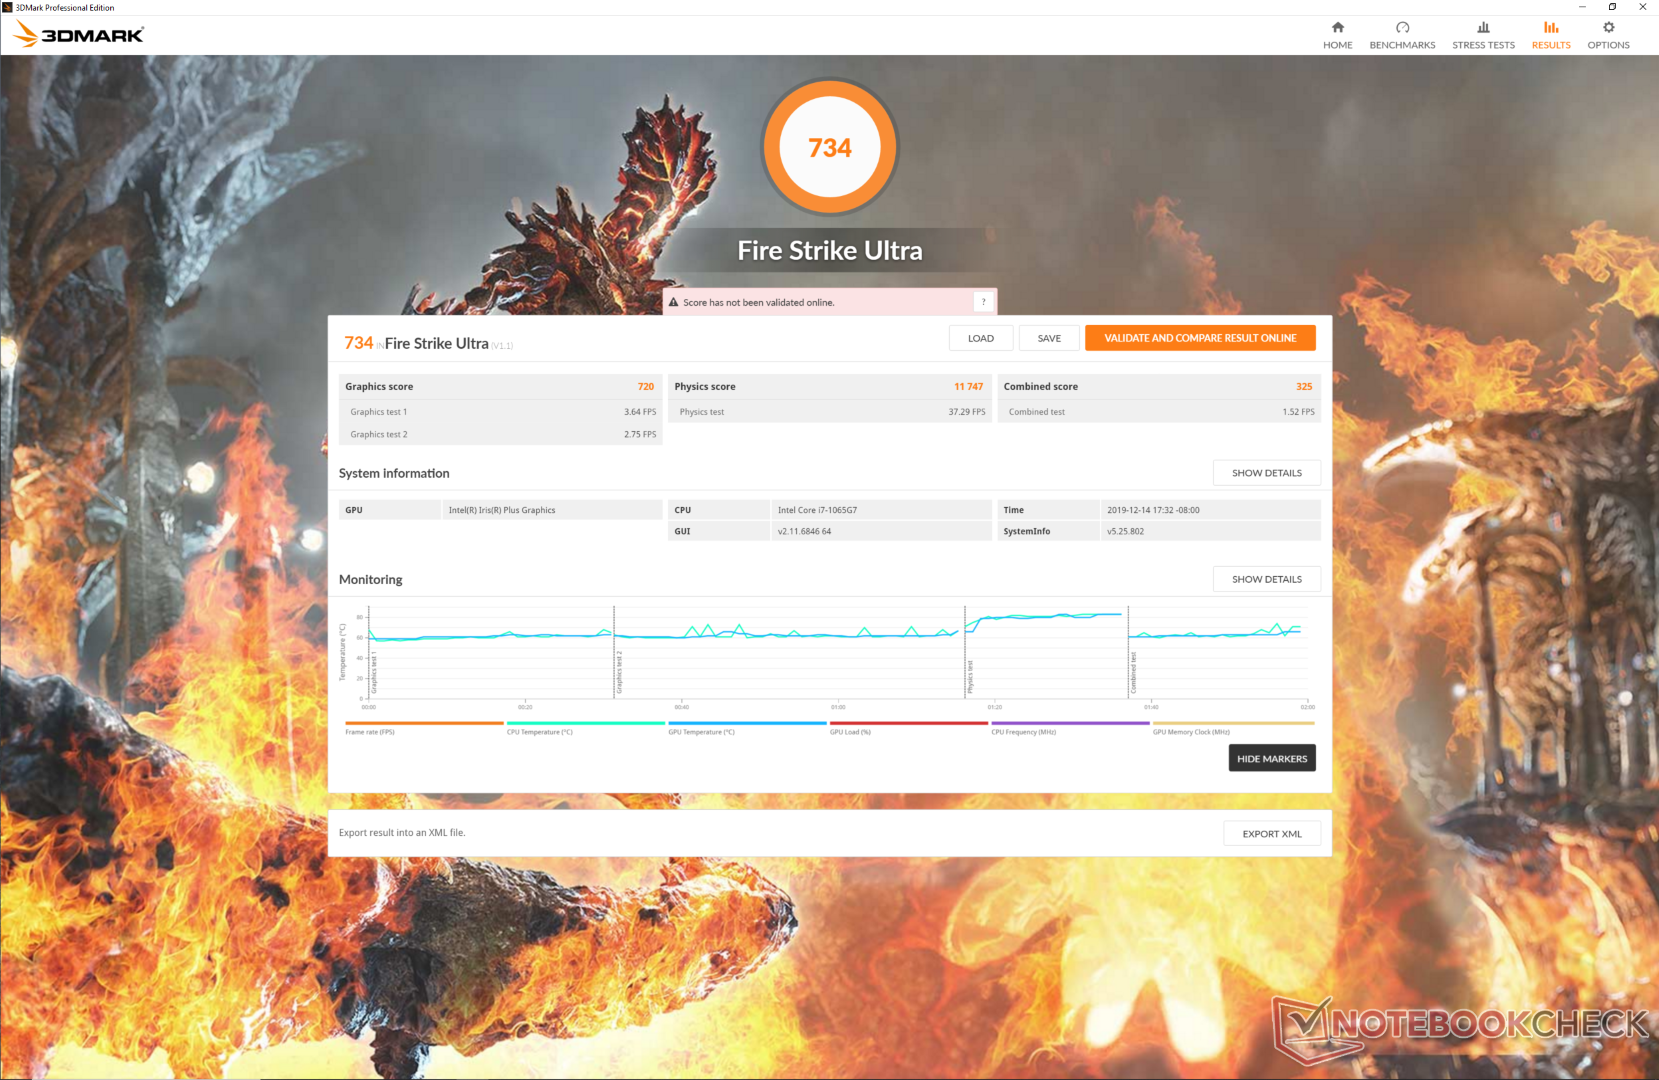
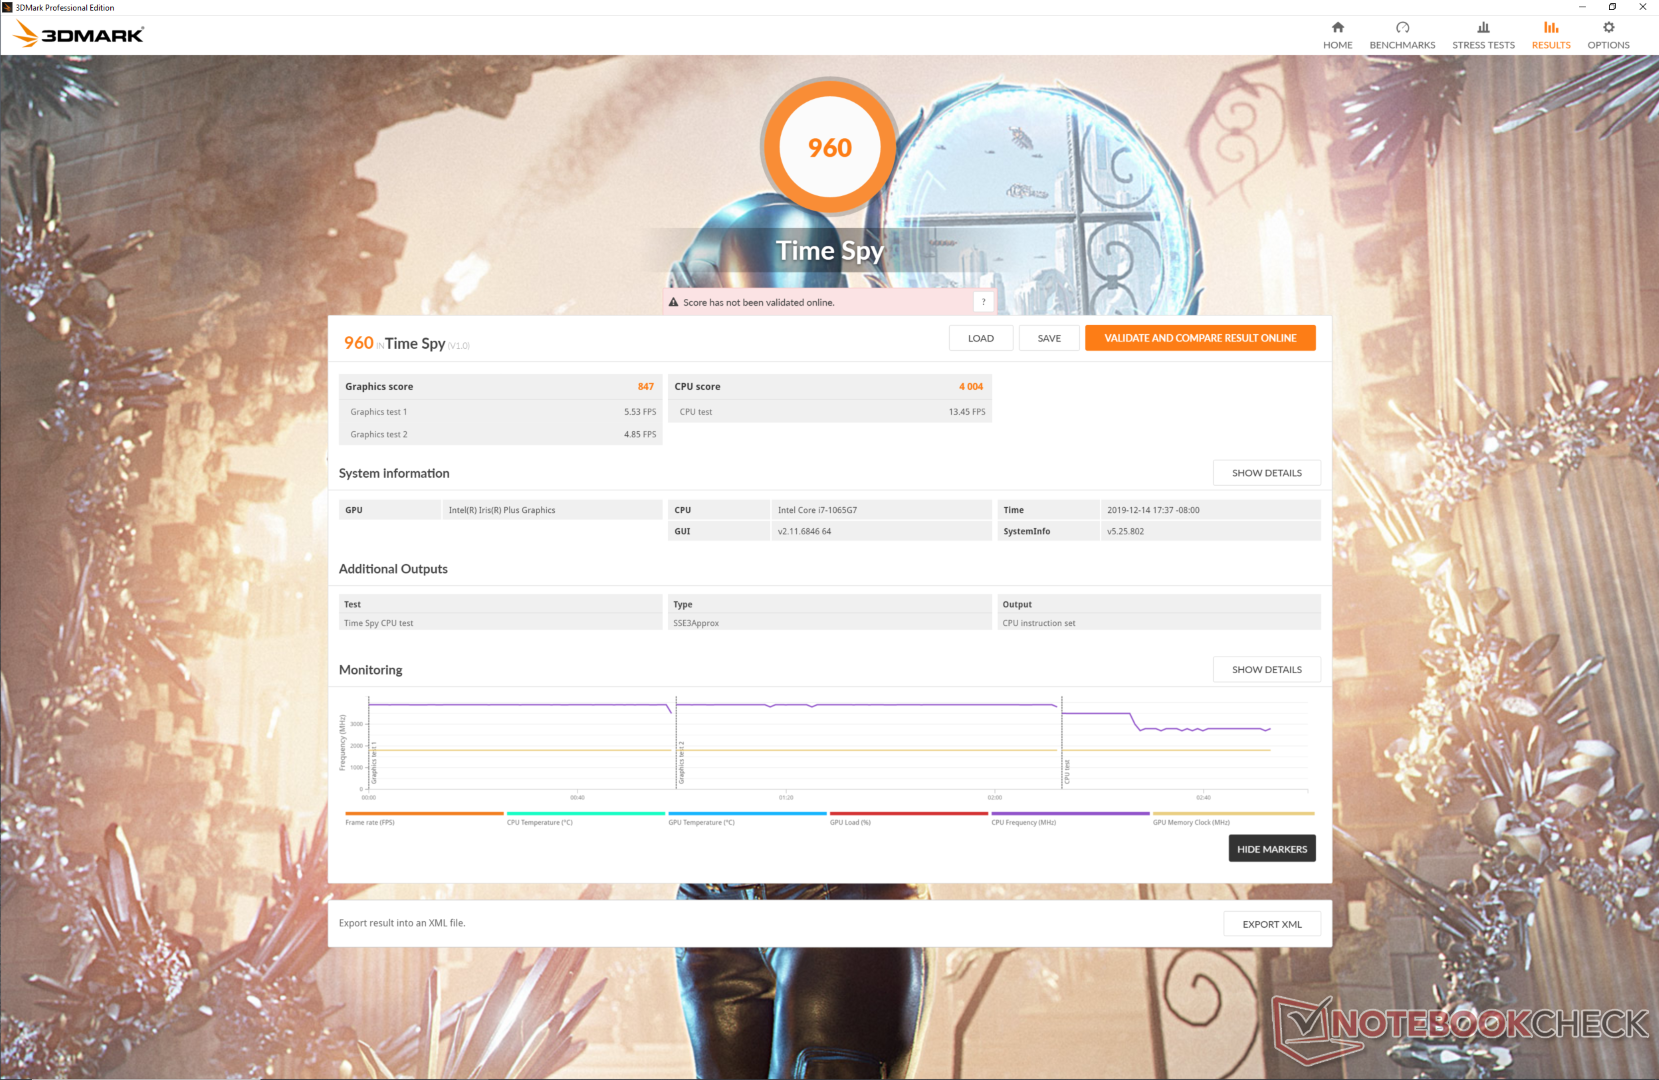
3DMark scores show the integrated Iris Plus GPU to be on par with the RX Vega 9 in the Ryzen 5 3580U at worst or about 15 percent faster at best. In real-world gaming scenarios, however, the Intel GPU has the potential to be much faster. Rocket League and F1 2019, for example, can each run up to 40 percent faster than the RX Vega 9 while other games like Overwatch and Shadow of the Tomb Raider are neck-to-neck between the Intel and AMD SKUs. If you plan on playing popular titles like Fortnite or Rocket League, then you may want to consider the Intel Iris Plus options to maximize performance. 3DMark continues to be a poor indicator of real-world gaming performance for the Intel Iris Plus and AMD RX Vega series of integrated GPUs.
Additional gaming benchmarks and comparisons can be found on our Iris Plus G7 page here.
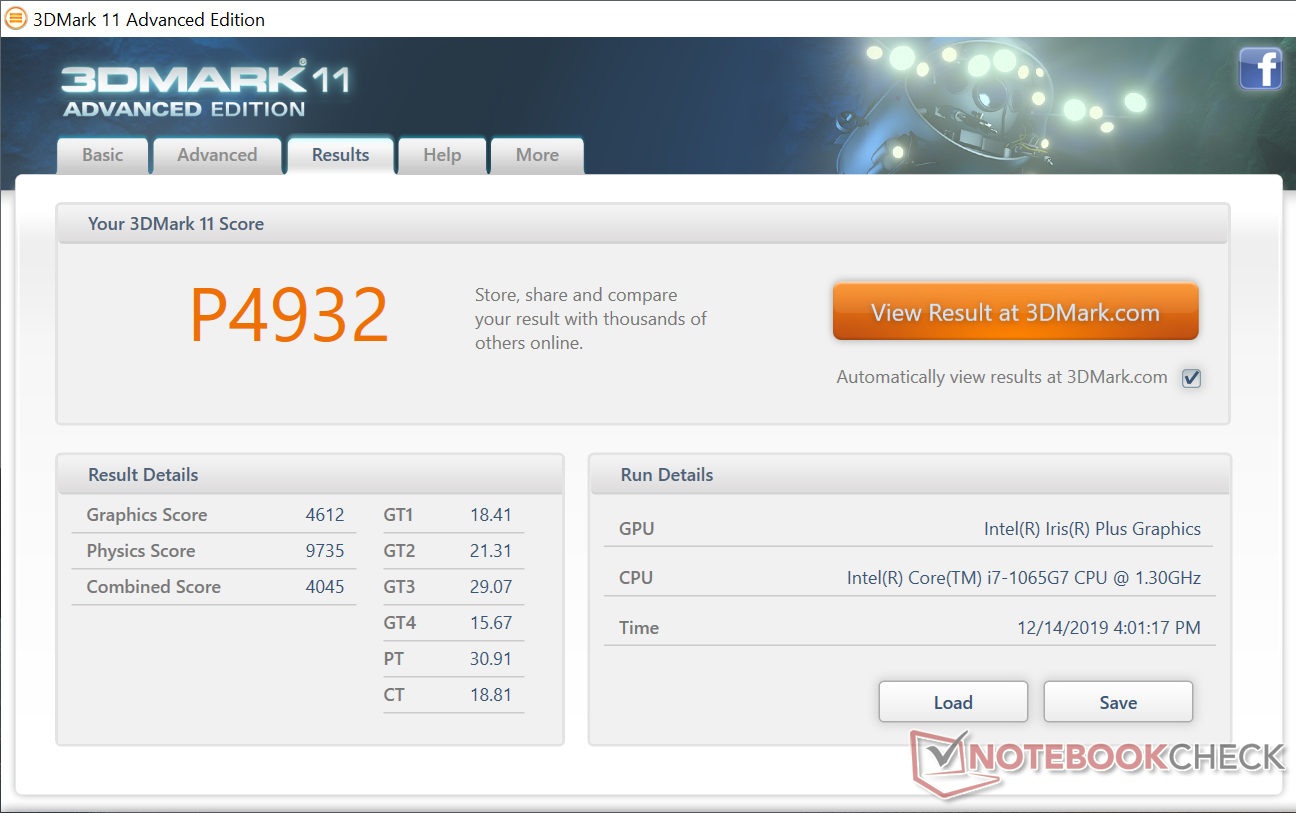
| 3DMark 11 Performance | 4932 points | |
| 3DMark Ice Storm Standard Score | 67987 points | |
| 3DMark Cloud Gate Standard Score | 14347 points | |
| 3DMark Fire Strike Score | 2865 points | |
| 3DMark Time Spy Score | 960 points | |
Help | ||
| F1 2019 | |
| 1280x720 Ultra Low Preset | |
| Microsoft Surface Laptop 3 15 i7-1065G7 | |
| Microsoft Surface Laptop 3 15 Ryzen 5 3580U | |
| Average Intel Iris Plus Graphics G7 (Ice Lake 64 EU) (35 - 63, n=5) | |
| 1920x1080 Medium Preset AA:T AF:16x | |
| Microsoft Surface Laptop 3 15 i7-1065G7 | |
| Average Intel Iris Plus Graphics G7 (Ice Lake 64 EU) (22 - 31, n=5) | |
| Microsoft Surface Laptop 3 15 Ryzen 5 3580U | |
| 1920x1080 High Preset AA:T AF:16x | |
| Microsoft Surface Laptop 3 15 i7-1065G7 | |
| Average Intel Iris Plus Graphics G7 (Ice Lake 64 EU) (19 - 27, n=4) | |
| Microsoft Surface Laptop 3 15 Ryzen 5 3580U | |
| 1920x1080 Ultra High Preset AA:T AF:16x | |
| Microsoft Surface Laptop 3 15 i7-1065G7 | |
| Average Intel Iris Plus Graphics G7 (Ice Lake 64 EU) (12 - 21, n=4) | |
| Microsoft Surface Laptop 3 15 Ryzen 5 3580U | |
| Borderlands 3 | |
| 1280x720 Very Low Overall Quality (DX11) | |
| Microsoft Surface Laptop 3 15 i7-1065G7 | |
| Average Intel Iris Plus Graphics G7 (Ice Lake 64 EU) (26.7 - 37, n=4) | |
| Microsoft Surface Laptop 3 15 Ryzen 5 3580U | |
| 1920x1080 Medium Overall Quality (DX11) | |
| Microsoft Surface Laptop 3 15 i7-1065G7 | |
| Average Intel Iris Plus Graphics G7 (Ice Lake 64 EU) (11.7 - 16, n=3) | |
| Microsoft Surface Laptop 3 15 Ryzen 5 3580U | |
| 1920x1080 High Overall Quality (DX11) | |
| Microsoft Surface Laptop 3 15 i7-1065G7 | |
| Average Intel Iris Plus Graphics G7 (Ice Lake 64 EU) (7.73 - 10, n=3) | |
| Microsoft Surface Laptop 3 15 Ryzen 5 3580U | |
| low | med. | high | ultra | |
|---|---|---|---|---|
| StarCraft II: Heart of the Swarm (2013) | 358.2 | 100.9 | 64.8 | |
| BioShock Infinite (2013) | 109.6 | 73 | 61.5 | 22.6 |
| The Witcher 3 (2015) | 56.4 | 36.8 | 20.1 | 10 |
| Overwatch (2016) | 90 | 64 | 32.9 | 19.7 |
| Rocket League (2017) | 96.1 | 61 | 42.8 | |
| Shadow of the Tomb Raider (2018) | 31 | |||
| F1 2019 (2019) | 63 | 31 | 27 | 17 |
| Borderlands 3 (2019) | 37 | 16 | 10 |
Emissions
System Noise
We had anticipated some differences in fan noise between the Intel and AMD SKUs, but that is not the case. Our microphone measurements when running 3DMark 06, Witcher 3, or Prime95 all resulted in essentially the same results as our AMD configuration last month. The Surface Laptop 3 is mostly inaudible during low to medium loads with fan noise picking up noticeably only when running higher loads like gaming for extended periods.
Our test unit exhibits slight coil whine when placing an ear near the keyboard keys. The electronic noise is minor enough to not be an issue.
| Microsoft Surface Laptop 3 15 i7-1065G7 Iris Plus Graphics G7 (Ice Lake 64 EU), i7-1065G7, Toshiba KBG40ZNS256G NVMe | Apple MacBook Pro 16 2019 i9 5500M Radeon Pro 5500M, i9-9880H, Apple SSD AP1024 7171 | Dell XPS 15 7590 i5 iGPU FHD UHD Graphics 630, i5-9300H, Toshiba XG6 KXG60ZNV512G | Asus ZenBook 15 UX534FT-DB77 GeForce GTX 1650 Max-Q, i7-8565U, Samsung SSD PM981 MZVLB1T0HALR | Razer Blade Stealth i7-8565U GeForce MX150, i7-8565U, Lite-On CA3-8D256-Q11 | Microsoft Surface Laptop 3 15 Ryzen 5 3580U Vega 9, R5 3580U, SK hynix BC501 HFM256GDGTNG | |
|---|---|---|---|---|---|---|
| Noise | -13% | -2% | -2% | -8% | 2% | |
| off / environment * (dB) | 28.5 | 29.8 -5% | 29.3 -3% | 28.4 -0% | 28.4 -0% | 28 2% |
| Idle Minimum * (dB) | 28.5 | 29.9 -5% | 29.3 -3% | 28.4 -0% | 28.5 -0% | 28 2% |
| Idle Average * (dB) | 28.5 | 29.9 -5% | 29.3 -3% | 28.4 -0% | 29 -2% | 28 2% |
| Idle Maximum * (dB) | 28.7 | 29.9 -4% | 29.8 -4% | 28.4 1% | 29.1 -1% | 28 2% |
| Load Average * (dB) | 30 | 43 -43% | 32.4 -8% | 33.9 -13% | 42.8 -43% | 29.2 3% |
| Witcher 3 ultra * (dB) | 39.2 | 45.4 -16% | 39.8 -2% | 41.4 -6% | 39 1% | |
| Load Maximum * (dB) | 41.2 | 46.1 -12% | 37.2 10% | 40.2 2% | 41.6 -1% | 41.4 -0% |
* ... smaller is better
Noise level
| Idle |
| 28.5 / 28.5 / 28.7 dB(A) |
| Load |
| 30 / 41.2 dB(A) |
 | ||
30 dB silent 40 dB(A) audible 50 dB(A) loud |
||
min: | ||
Temperature
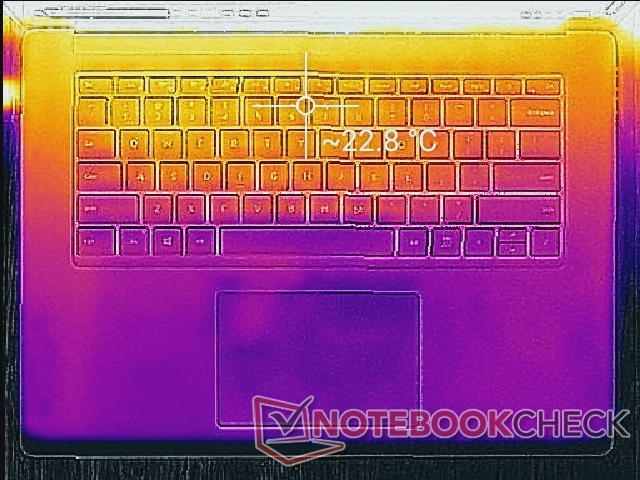
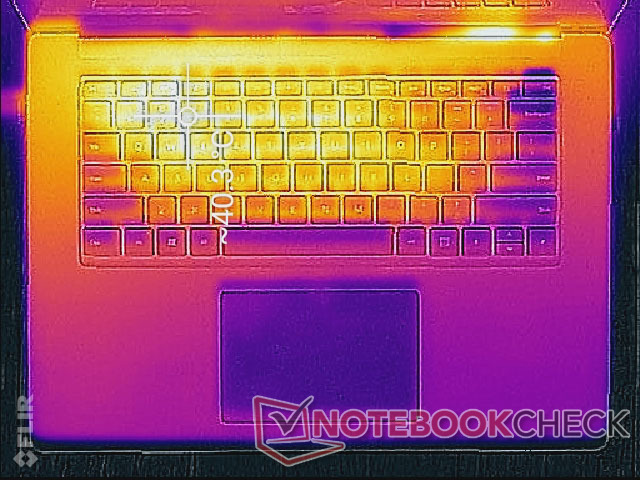
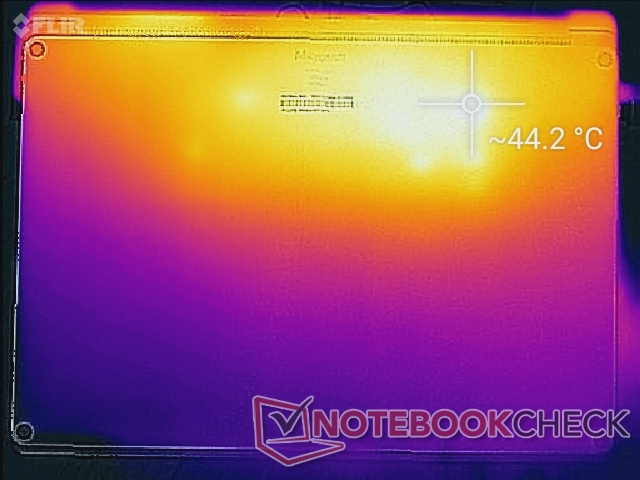
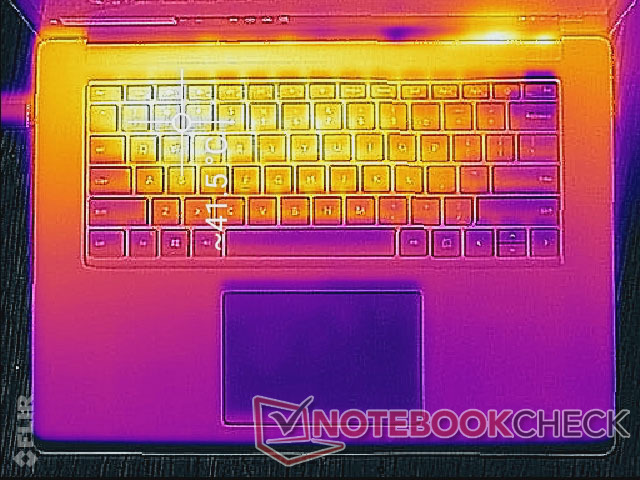
There are no major differences in surface temperature development between the Intel and AMD SKUs in spite of any performance differences. Running both Prime95 and FurMark simultaneously results in hot spots of 41 C to 46 C on the Intel compared to 42 C to 50 C on the AMD. Be prepared for very warm WASD keys when gaming or running high loads in contrast to most gaming laptops.
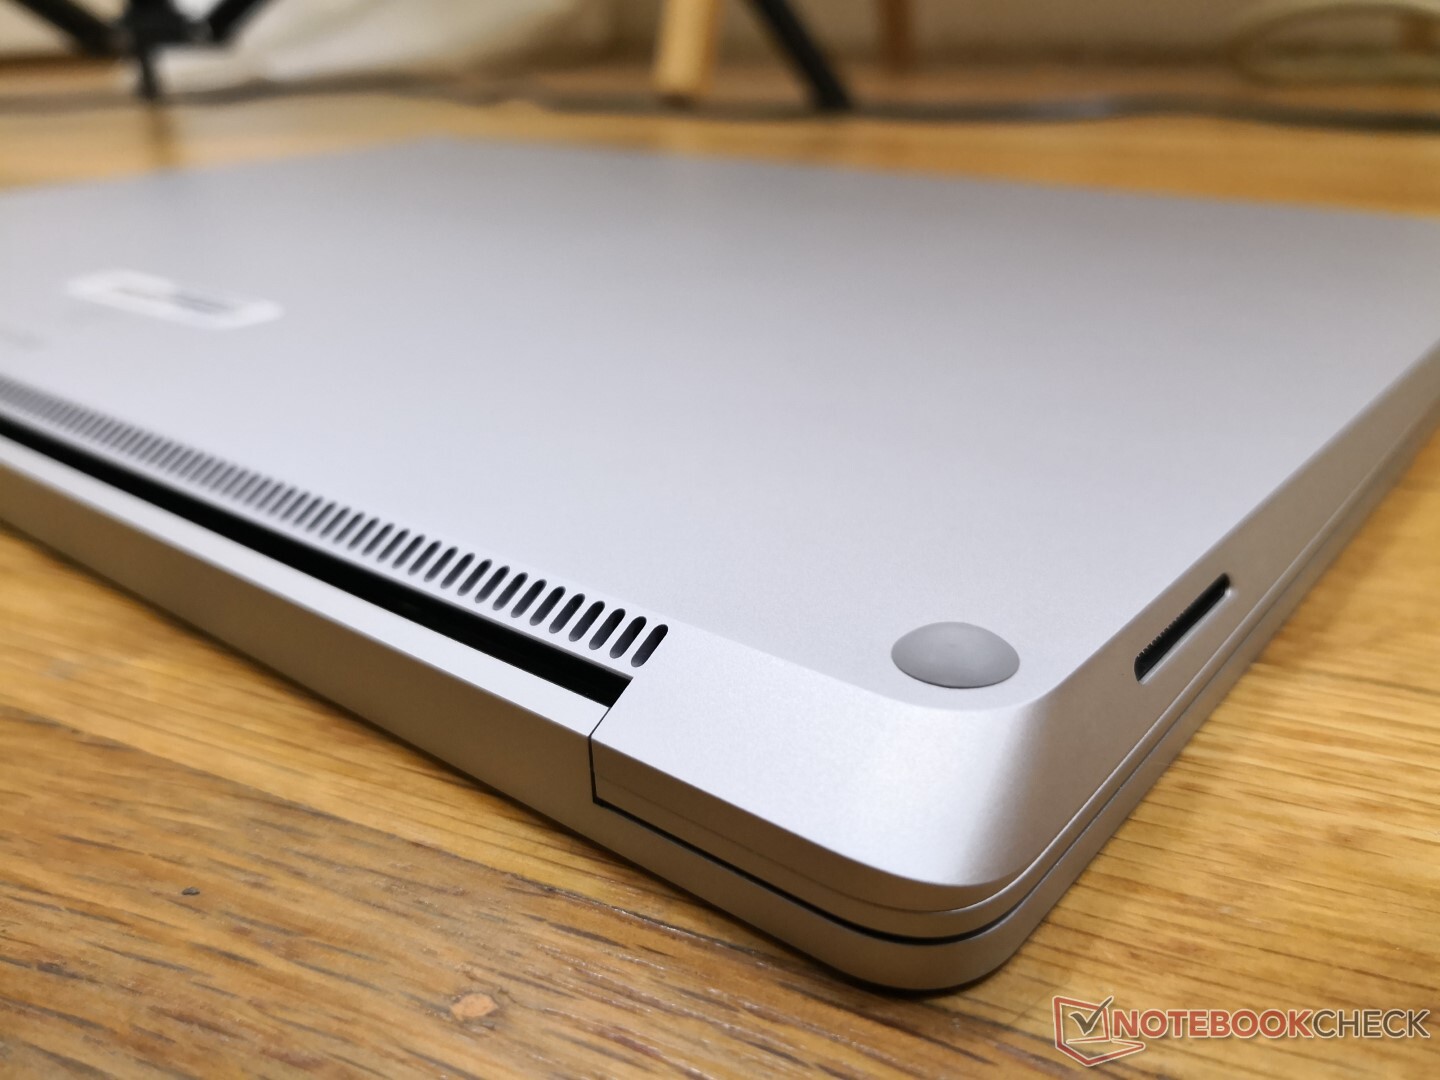
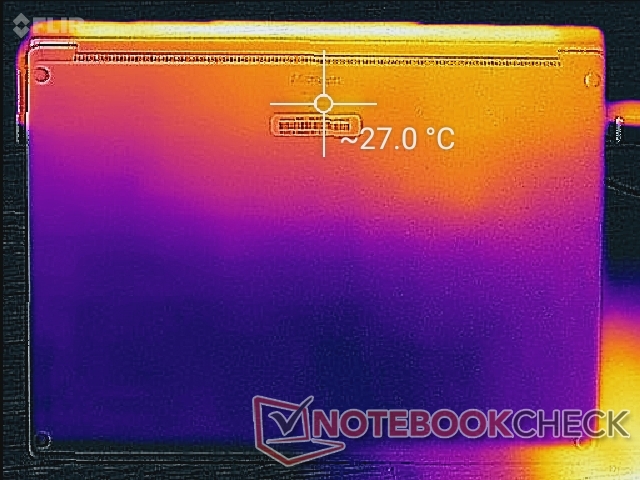
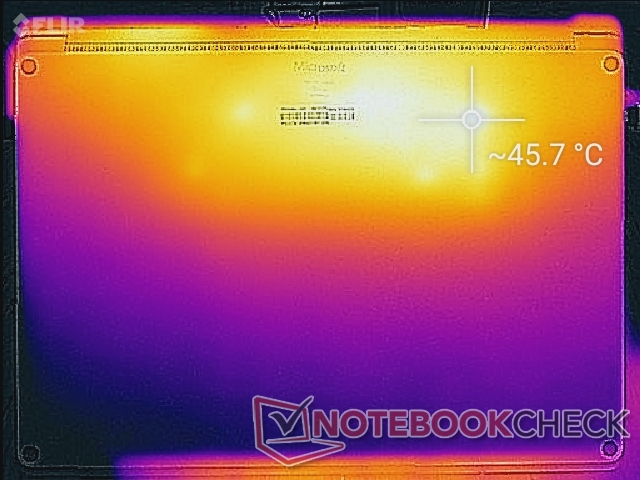
The lack of any ventilation grilles on the bottom panel means you can use the laptop on your lap without blocking airflow. On the other hand, the back half of the laptop will be warmer than usual.
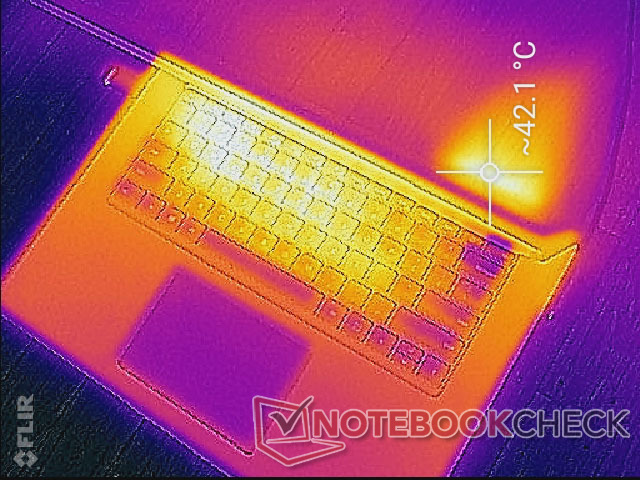

(±) The maximum temperature on the upper side is 41.8 °C / 107 F, compared to the average of 34.3 °C / 94 F, ranging from 21.2 to 62.5 °C for the class Office.
(-) The bottom heats up to a maximum of 45.6 °C / 114 F, compared to the average of 36.8 °C / 98 F
(+) In idle usage, the average temperature for the upper side is 21.6 °C / 71 F, compared to the device average of 29.5 °C / 85 F.
(±) Playing The Witcher 3, the average temperature for the upper side is 32.2 °C / 90 F, compared to the device average of 29.5 °C / 85 F.
(+) The palmrests and touchpad are cooler than skin temperature with a maximum of 29 °C / 84.2 F and are therefore cool to the touch.
(±) The average temperature of the palmrest area of similar devices was 27.5 °C / 81.5 F (-1.5 °C / -2.7 F).
Stress Test
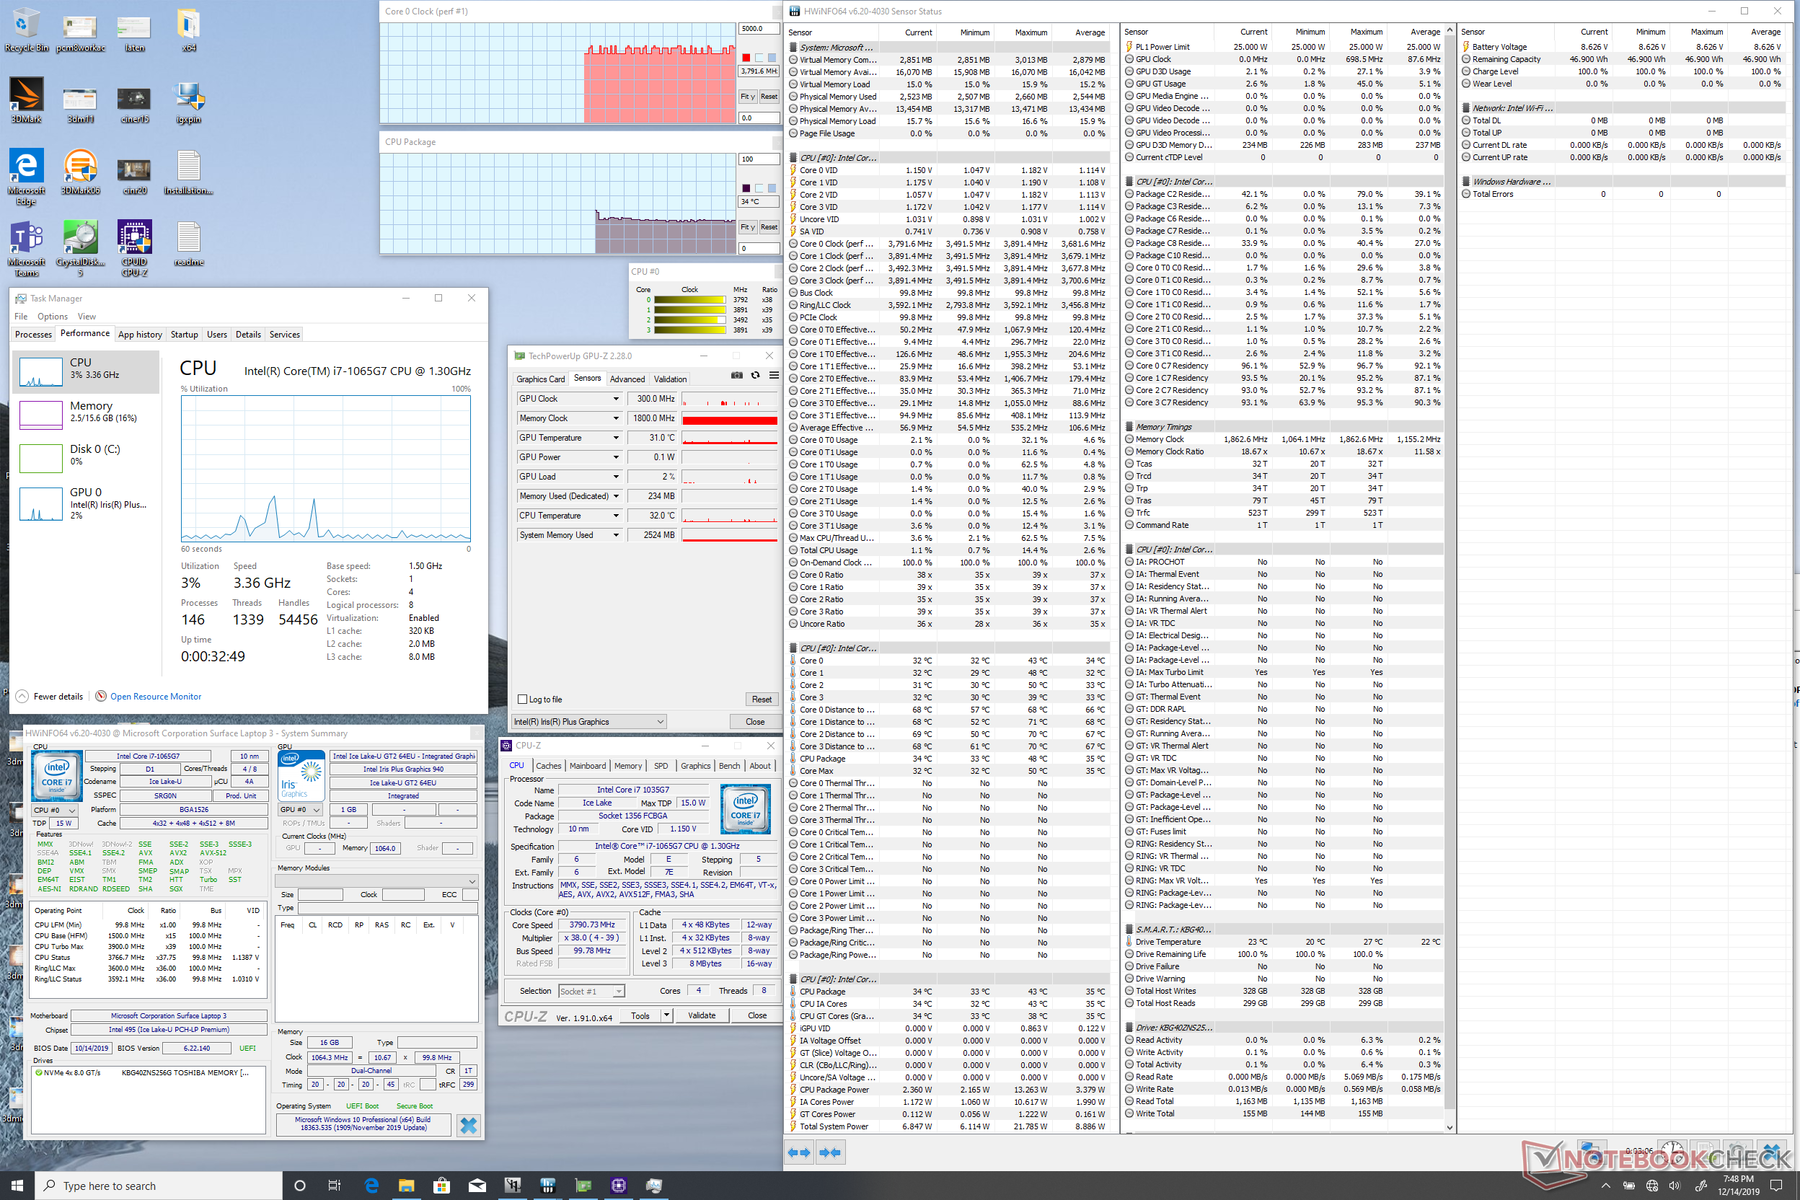
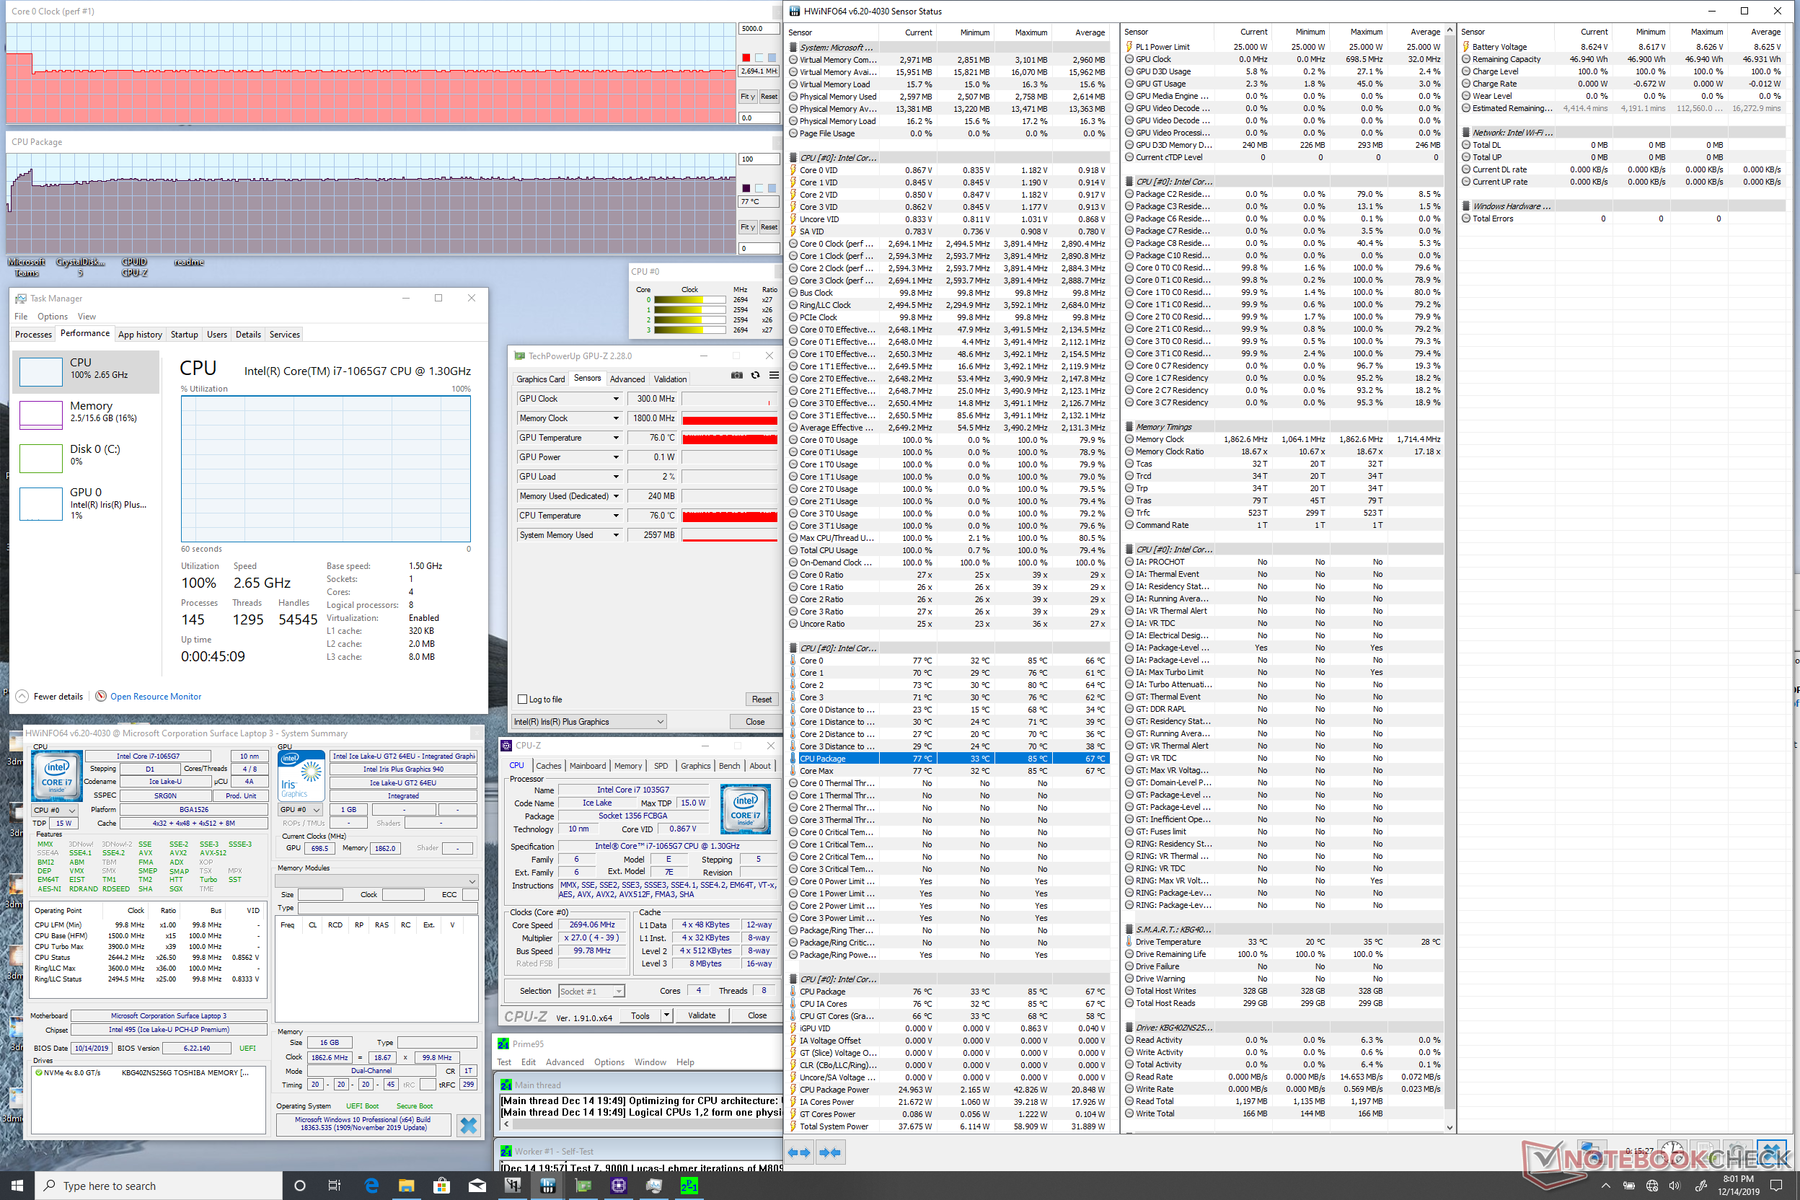
We stress the system with synthetic loads to identify for any potential throttling or stability issues. When running Prime95, CPU clock rates can be observed running at 3.5 GHz for the first 20 seconds or so until hitting a core temperature ceiling of 85 C. Thereafter, clock rates drop to the 2.6 - 2.7 GHz range to maintain a cooler core temperature of 75 C. Both clock rates (2.7 GHz vs. 2.4 GHz) and core temperature (77 C vs. 66 C Tctl/Tdie) stabilize at higher values on the Core i7 when compared to the Ryzen 5 3580U SKU. Keep in mind that HWiNFO reports core temperatures differently between Intel and AMD CPUs and so these temperature differences may not be directly comparable here.
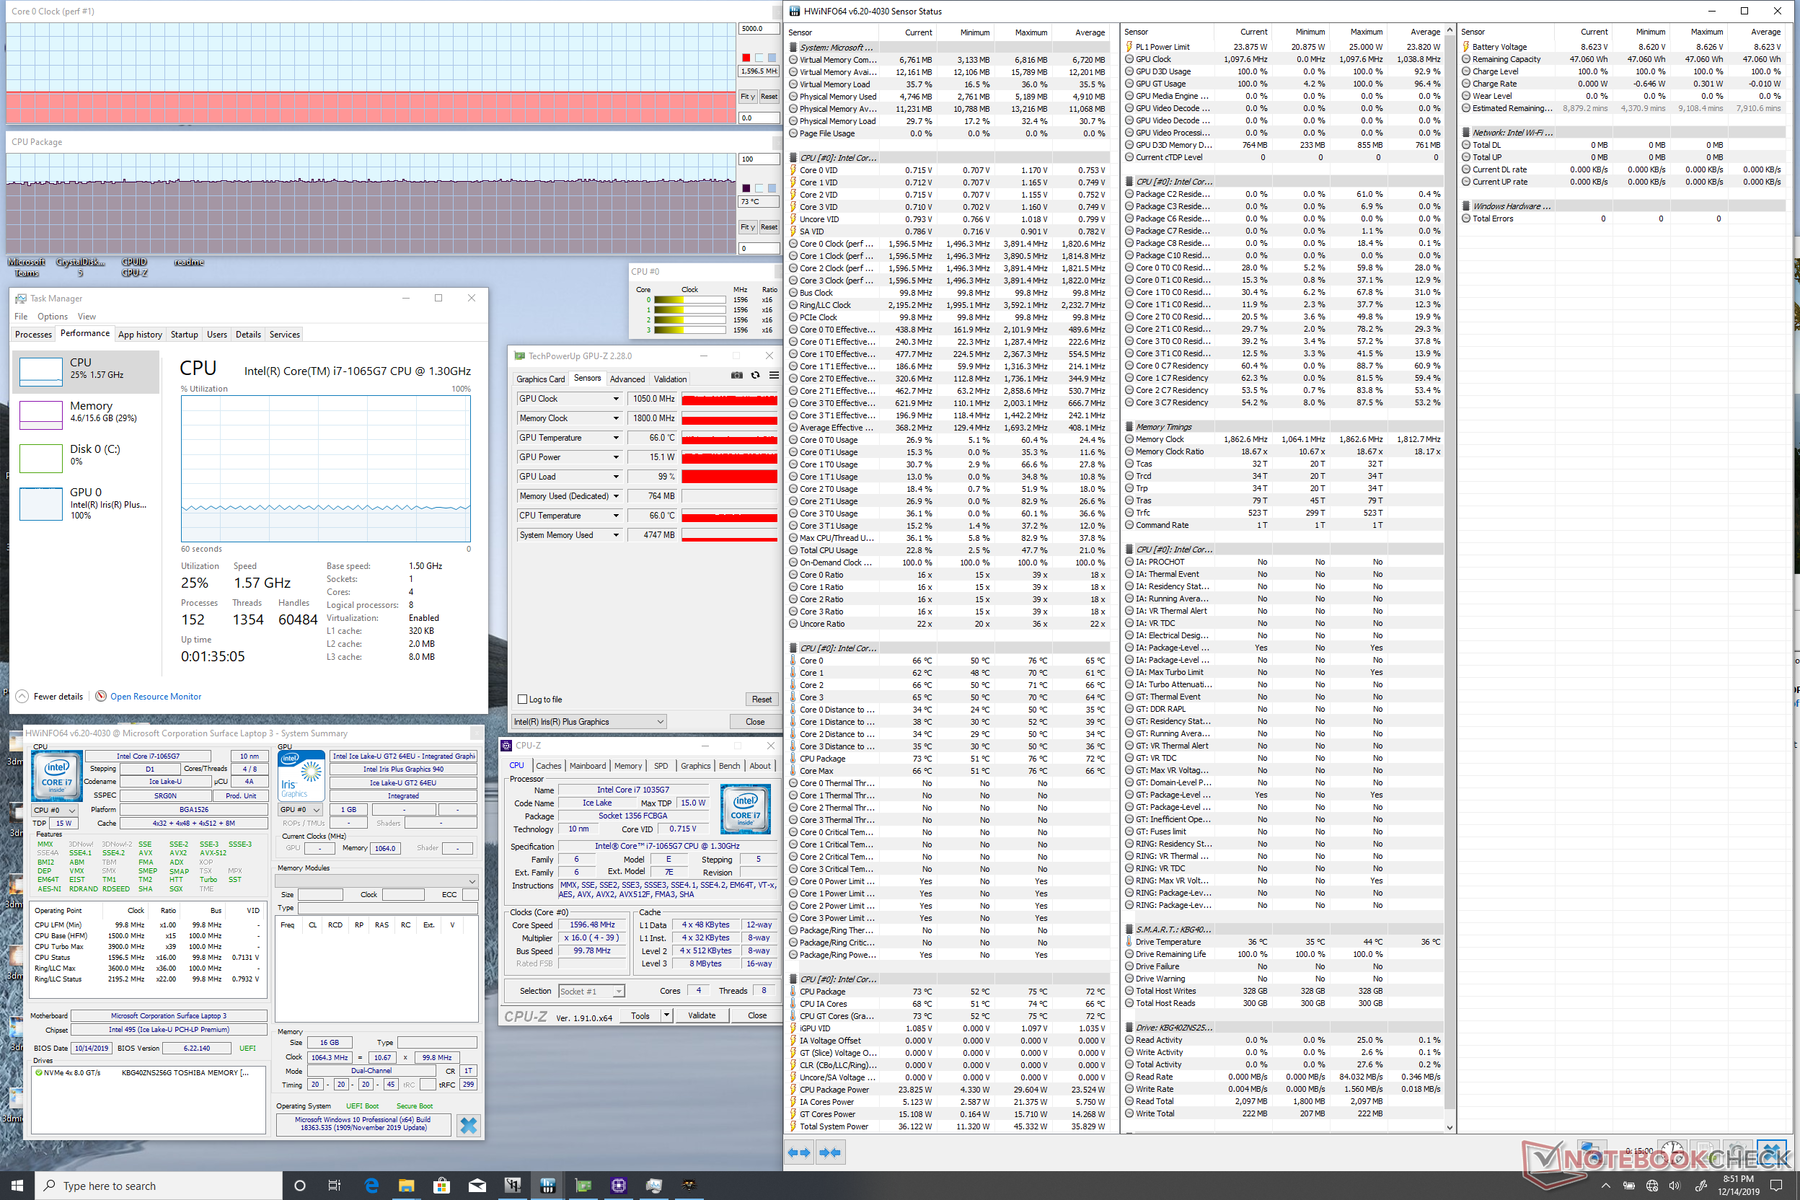
Running Witcher 3 is more representative of demanding real-world loads. Both GPU clock rates and core temperature are again higher on our Intel SKU when compared to the Ryzen 5 SKU (1050 MHz vs. 800 MHz and 73 C vs. 58 C) according to GPU-Z.
Running on battery power will not limit performance meaning users can get full system performance if away from an AC outlet. A Fire Strike run on batteries returns Physics and Graphics scores of 12008 and 3060 points, respectively, compared to 11959 and 3062 points when on mains.
| CPU Clock (GHz) | GPU Clock (MHz) | Average CPU Temperature (°C) | |
| System Idle | -- | -- | 34 |
| Prime95 Stress | 2.6 - 2.7 | -- | 77 |
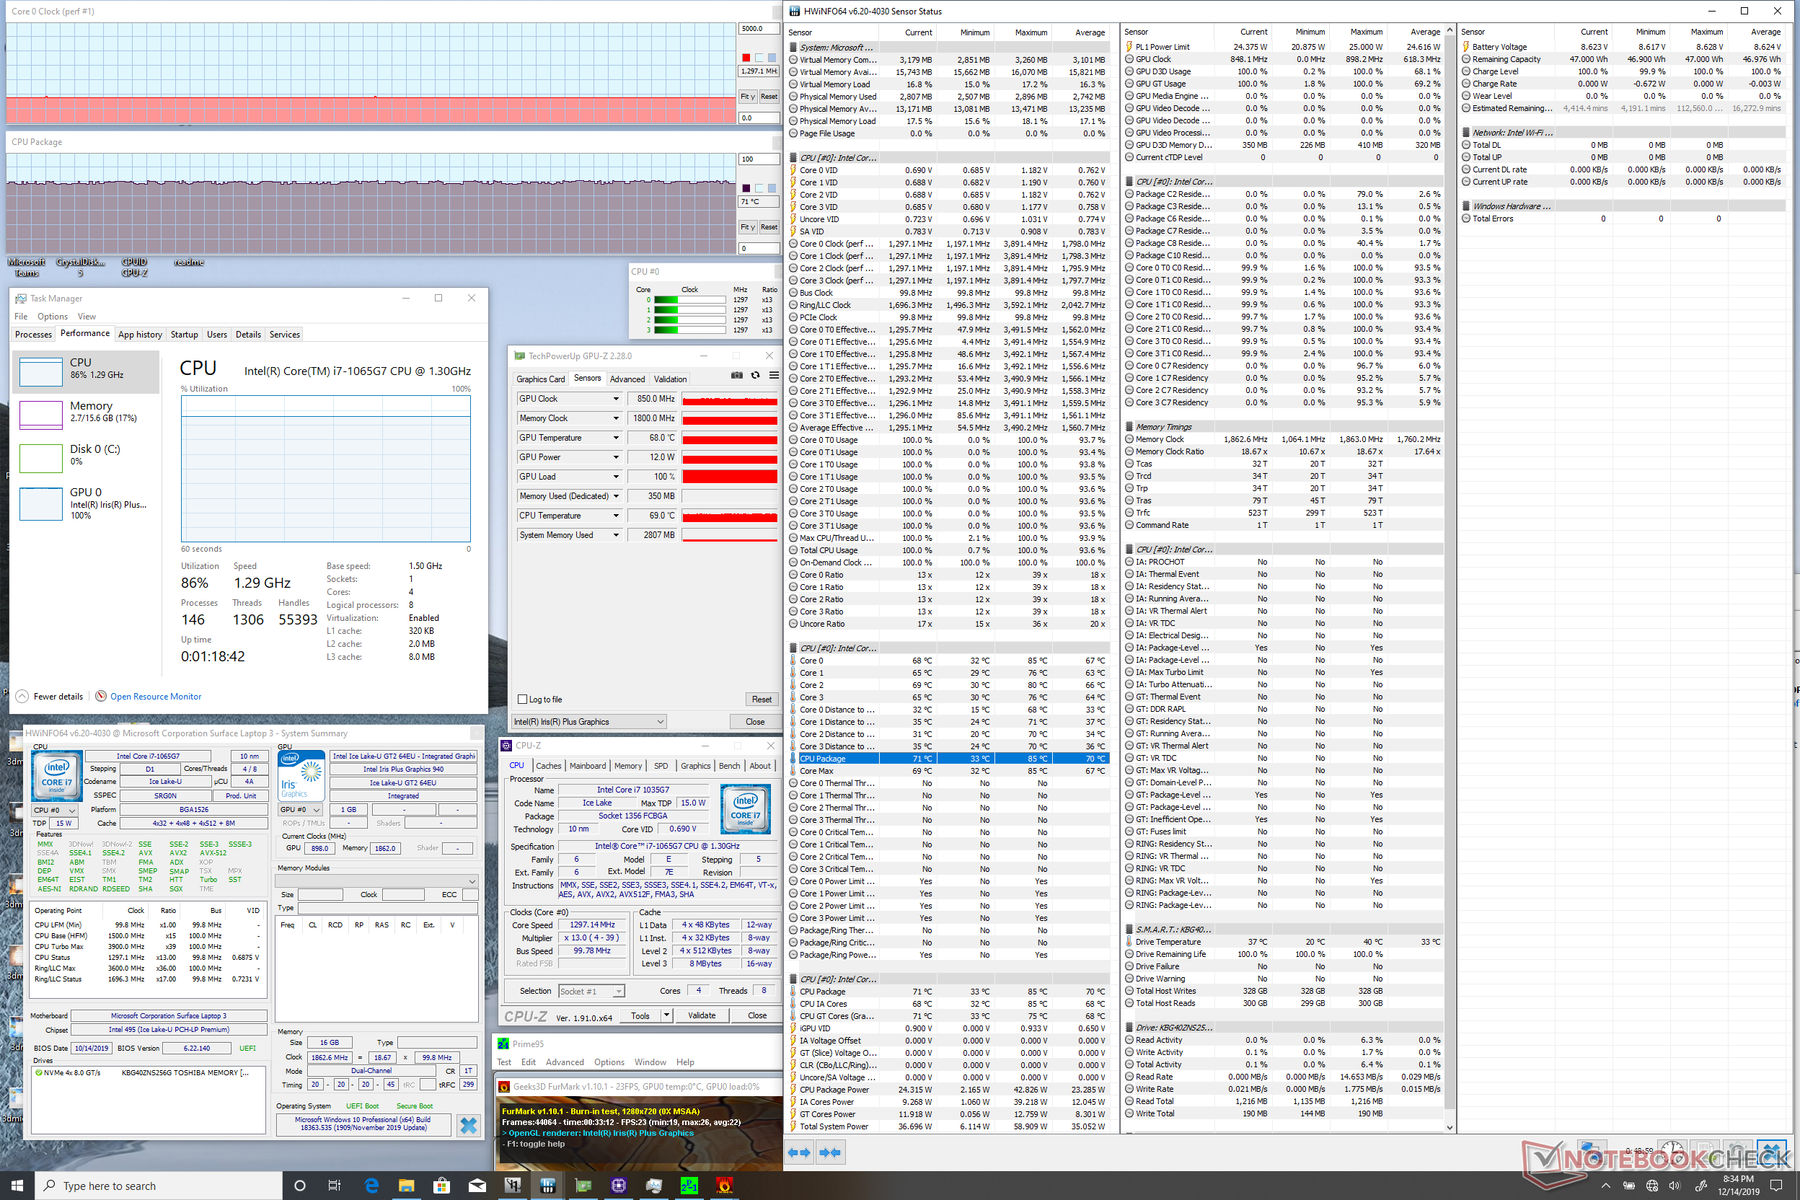
| Prime95 + FurMark Stress | 1.3 | 850 | 71 |
| Witcher 3 Stress | 1.6 | 1050 | 73 |
Speakers

Microsoft Surface Laptop 3 15 i7-1065G7 audio analysis
(±) | speaker loudness is average but good (80.5 dB)
Bass 100 - 315 Hz
(±) | reduced bass - on average 5.3% lower than median
(±) | linearity of bass is average (10.3% delta to prev. frequency)
Mids 400 - 2000 Hz
(+) | balanced mids - only 2.7% away from median
(+) | mids are linear (6.7% delta to prev. frequency)
Highs 2 - 16 kHz
(+) | balanced highs - only 2.7% away from median
(±) | linearity of highs is average (8.5% delta to prev. frequency)
Overall 100 - 16.000 Hz
(+) | overall sound is linear (11.7% difference to median)
Compared to same class
» 3% of all tested devices in this class were better, 2% similar, 95% worse
» The best had a delta of 7%, average was 21%, worst was 53%
Compared to all devices tested
» 8% of all tested devices were better, 3% similar, 89% worse
» The best had a delta of 4%, average was 24%, worst was 134%
Apple MacBook 12 (Early 2016) 1.1 GHz audio analysis
(+) | speakers can play relatively loud (83.6 dB)
Bass 100 - 315 Hz
(±) | reduced bass - on average 11.3% lower than median
(±) | linearity of bass is average (14.2% delta to prev. frequency)
Mids 400 - 2000 Hz
(+) | balanced mids - only 2.4% away from median
(+) | mids are linear (5.5% delta to prev. frequency)
Highs 2 - 16 kHz
(+) | balanced highs - only 2% away from median
(+) | highs are linear (4.5% delta to prev. frequency)
Overall 100 - 16.000 Hz
(+) | overall sound is linear (10.2% difference to median)
Compared to same class
» 7% of all tested devices in this class were better, 2% similar, 91% worse
» The best had a delta of 5%, average was 18%, worst was 53%
Compared to all devices tested
» 5% of all tested devices were better, 1% similar, 94% worse
» The best had a delta of 4%, average was 24%, worst was 134%
Energy Management
Power Consumption
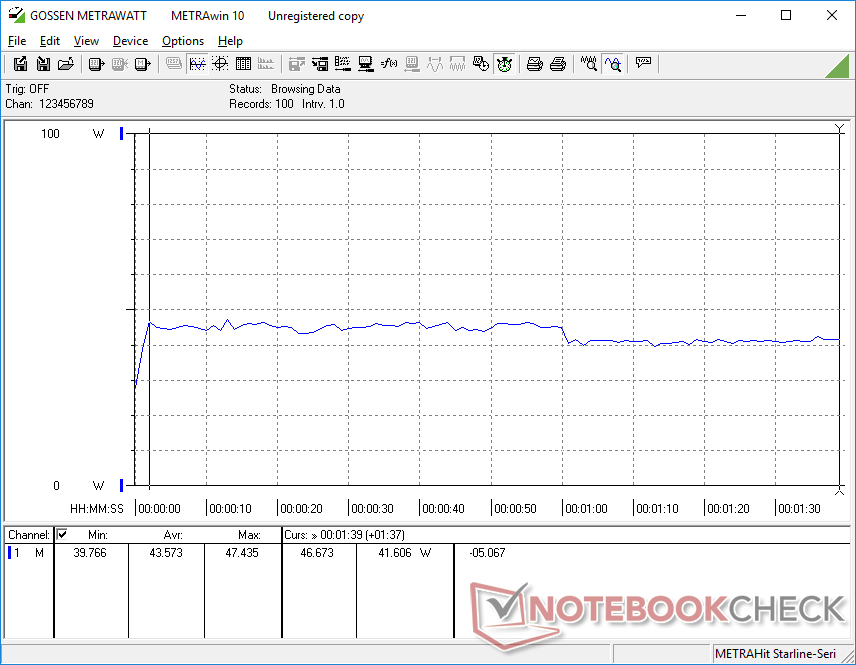
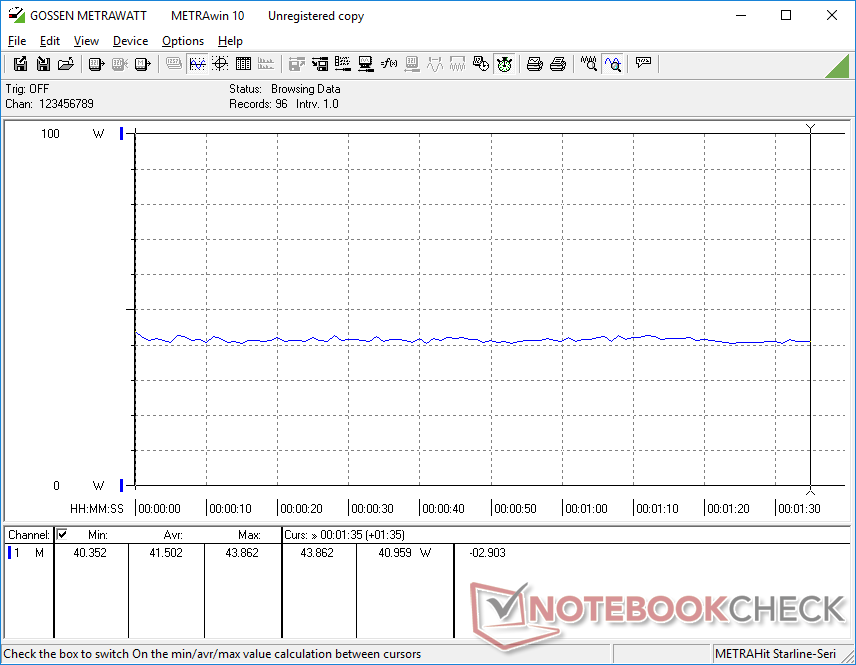
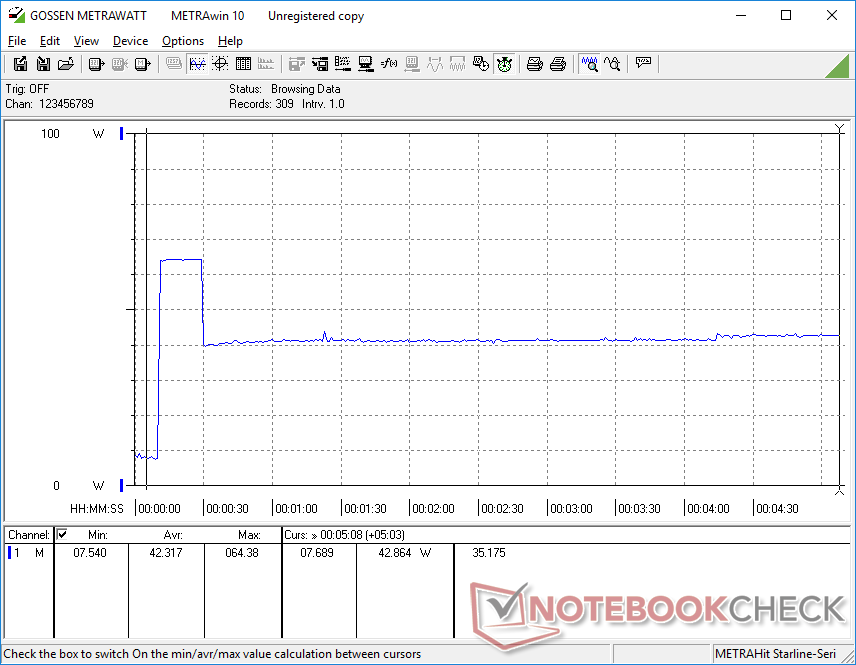
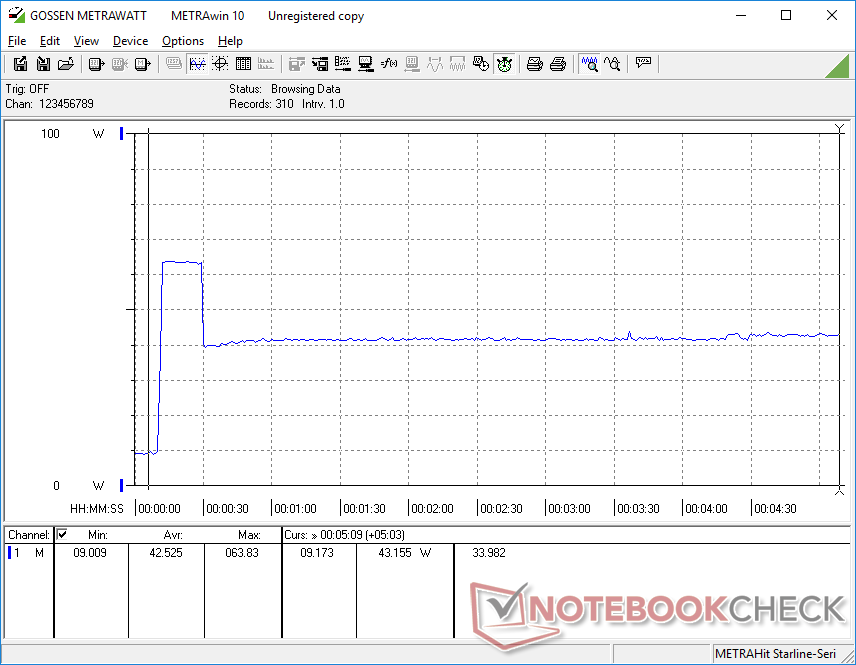
Idling on desktop demands between 4 W and 8 W compared to 3 W and 7 W on our Ryzen 5 SKU. However, we suspect that differences in background activity are likely responsible for the discrepancy especially at these low rates. The more interesting power consumption numbers come in when gaming as the Intel laptop consumes just under 42 W on average compared to 45 W on the Ryzen 5 SKU even though the Intel laptop offers better gaming performance all-around. In other words, Intel has the superior performance-per-Watt over AMD.
We're able to record a maximum draw of 64.4 W from the small (~9 x 5 x 2.5 cm) 65 W AC adapter when running Prime95 and FurMark loads. However, this only lasts for about 20 seconds before consumption drops and stabilizes at 43 W due to thermal reasons.
| Off / Standby | |
| Idle | |
| Load |
|
Key:
min: | |
| Microsoft Surface Laptop 3 15 i7-1065G7 i7-1065G7, Iris Plus Graphics G7 (Ice Lake 64 EU), Toshiba KBG40ZNS256G NVMe, IPS, 2496x1664, 15" | Dell XPS 15 7590 i5 iGPU FHD i5-9300H, UHD Graphics 630, Toshiba XG6 KXG60ZNV512G, IPS, 1920x1080, 15.6" | Asus ZenBook 15 UX534FT-DB77 i7-8565U, GeForce GTX 1650 Max-Q, Samsung SSD PM981 MZVLB1T0HALR, IPS, 1920x1080, 15.6" | MSI Prestige 15 A10SC i7-10710U, GeForce GTX 1650 Max-Q, Samsung SSD PM981 MZVLB1T0HALR, IPS, 3840x2160, 15.6" | Razer Blade Stealth i7-8565U i7-8565U, GeForce MX150, Lite-On CA3-8D256-Q11, IPS, 1920x1080, 13.3" | Microsoft Surface Laptop 3 15 Ryzen 5 3580U R5 3580U, Vega 9, SK hynix BC501 HFM256GDGTNG, IPS, 2496x1664, 15" | |
|---|---|---|---|---|---|---|
| Power Consumption | -17% | -74% | -68% | -28% | 10% | |
| Idle Minimum * (Watt) | 4.4 | 3.79 14% | 5 -14% | 6.1 -39% | 6.7 -52% | 3.3 25% |
| Idle Average * (Watt) | 8.3 | 6.9 17% | 13.2 -59% | 13.2 -59% | 8.6 -4% | 7.1 14% |
| Idle Maximum * (Watt) | 8.6 | 9.2 -7% | 24 -179% | 19.2 -123% | 9.4 -9% | 7.2 16% |
| Load Average * (Watt) | 43.6 | 62 -42% | 70 -61% | 75 -72% | 64.1 -47% | 44.8 -3% |
| Witcher 3 ultra * (Watt) | 41.5 | 63.3 -53% | 74 -78% | 63.7 -53% | 45.1 -9% | |
| Load Maximum * (Watt) | 64.4 | 108 -68% | 114 -77% | 89.7 -39% | 64.1 -0% | 53 18% |
* ... smaller is better
Battery Life
Battery capacity is small for a 15-inch laptop at just 45 Wh. Even the Huawei MateBook X Pro, for example, comes with a higher capacity 57 Wh battery. Runtimes are still respectable at just over 8 hours of real-world WLAN use to be almost an hour shorter than the slower Ryzen 5 SKU.
A noteworthy find is that idling on desktop at the lowest possible settings and brightness level will last about 35 hours before needing to recharge. While an unrealistic scenario, it shows that users can stretch out the battery for longer than usual if needed.
Recharging from empty to full capacity takes about 2 hours. Recharging via USB Type-C with our 130 W Dell or 65 W Lenovo AC adapters also works.
| Microsoft Surface Laptop 3 15 i7-1065G7 i7-1065G7, Iris Plus Graphics G7 (Ice Lake 64 EU), 45 Wh | Apple MacBook Pro 16 2019 i9 5500M i9-9880H, Radeon Pro 5500M, 99.8 Wh | Dell XPS 15 7590 i5 iGPU FHD i5-9300H, UHD Graphics 630, 97 Wh | Lenovo Yoga C940-15IRH i7-9750H, GeForce GTX 1650 Max-Q, 69 Wh | HP Spectre x360 15-df0126ng i7-8750H, GeForce GTX 1050 Ti Max-Q, 84 Wh | Asus ZenBook 15 UX534FT-DB77 i7-8565U, GeForce GTX 1650 Max-Q, 71 Wh | MSI Prestige 15 A10SC i7-10710U, GeForce GTX 1650 Max-Q, 82 Wh | Microsoft Surface Laptop 3 15 Ryzen 5 3580U R5 3580U, Vega 9, 45 Wh | |
|---|---|---|---|---|---|---|---|---|
| Battery runtime | -1% | 31% | -26% | -6% | 5% | -14% | -16% | |
| Reader / Idle (h) | 35 | 18.2 -48% | 18.8 -46% | 21.5 -39% | 19.1 -45% | 18.7 -47% | ||
| WiFi v1.3 (h) | 8.2 | 12 46% | 14.1 72% | 9.7 18% | 8.8 7% | 8.4 2% | 7.6 -7% | 9.1 11% |
| Load (h) | 1.9 | 1 -47% | 1.7 -11% | 1 -47% | 2.3 21% | 2.9 53% | 2.1 11% | 1.7 -11% |
| Witcher 3 ultra (h) | 0.9 |
Pros
Cons
Verdict
The main advantages of our Core i7 SKU versus the Ryzen 5 SKU include Wi-Fi 6 compatibility, faster storage performance, faster CPU performance, integrated AI acceleration, faster gaming performance, and higher performance-per-Watt. Other aspects like the display, WLAN battery life, surface temperature, and fan noise are either the same between them or nearly identical.
While it's unsurprising that our Core i7 SKU is able to outperform our cheaper Ryzen 5 SKU, it's the margin that we're more interested in. Raw CPU performance, for example, isn't all that much faster meaning you shouldn't be choosing Intel over AMD based purely on processor horsepower. Gaming performance is also largely inconsistent with some games running better on Intel and others being neck-to-neck. Meanwhile, AI acceleration continues to be a novelty for most office users as of this writing since it has no direct influence on common day-to-day tasks. Intel can really leverage its advantages over AMD in the field of AI, but that won't mean very much to consumers if applications aren't optimized to exploit AI acceleration in the first place.
In short, the day-to-day performance differences between the Surface Laptop 3 Core i7 and Ryzen 5 SKUs are smaller than anticipated especially when you consider the price premium that Microsoft is charging for its Intel SKUs. If you're a power user who wants the best that the Surface Laptop can offer, then the Intel options are a no-brainer. Otherwise, you'd be hard-pressed to tell the difference between an Intel and AMD Surface Laptop 3 if your workload primarily consists of word processing, web browsing, or video streaming.
Microsoft Surface Laptop 3 15 i7-1065G7
- 02/23/2020 v7 (old)
Allen Ngo
Price comparison
