

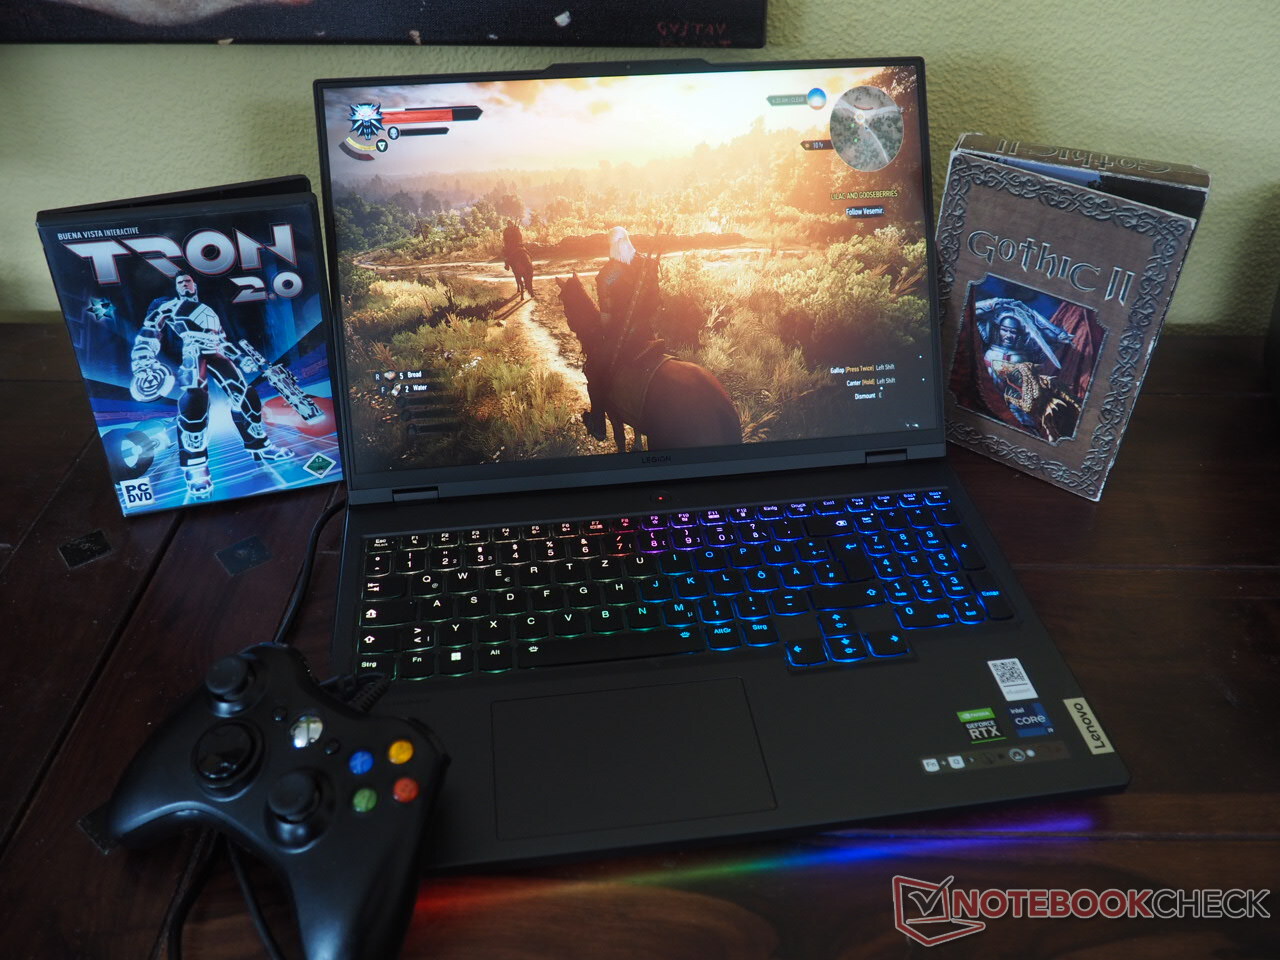
Lenovo Legion Pro 7 16IRX8H Review: High-end RTX 4080 performance powerhouse

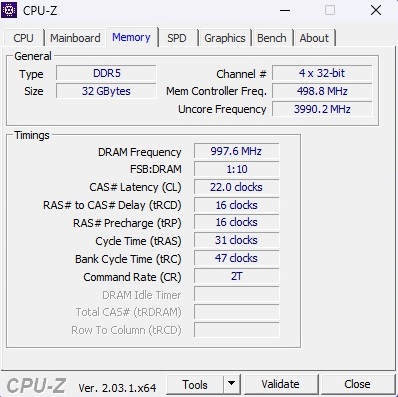
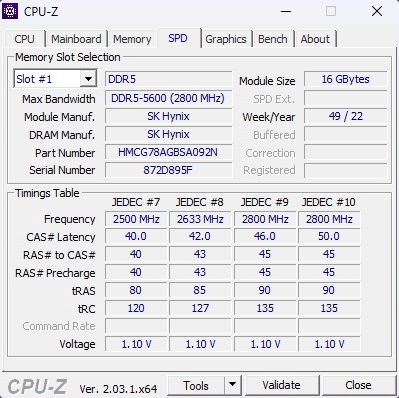
With a retail price close to €4,000, the Lenovo Legion Pro 7 16IRX8H, which we now have for review, cannot really be considered a bargain. However, this price offers you a Core i9-13900HX, 32 GB of DDR5-5600-RAM (2x 16 GB), and a 1 TB PCIe Gen 4x4 NVMe M.2 2280 SSD.
The Nvidia GeForce RTX 4080 Laptop GPU with 12 GB GDDR6 VRAM takes care of demanding graphics tasks. The matte IPS display in a 16:10 format with a resolution of 2560 x 1600 pixels is rated to achieve 100% sRGB and 500 nits of peak brightness. Lenovo has equipped the 240 Hz panel with support for Nvidia G-Sync in addition to AMD FreeSync, which is a good thing.
Windows 11 Home comes installed as the operating system of choice.
The Lenovo Legion 7 Pro's primary competition so far is the Razer Blade 16 Early 2023, although it is also interesting to see how the laptop fares is comparison to the previous generation. Therefore, we also include Legion 7 SKUs featuring the following combinations: Core i9-12900HX and RTX 3080 Ti, Ryzen 9 5900HX and RTX 3080, and the Ryzen 9 6900HX and RX 6850M XT.
Potential competitors in comparison
Rating | Date | Model | Weight | Height | Size | Resolution | Price |
|---|---|---|---|---|---|---|---|
| 89.4 % v7 (old) | 02 / 2023 | Lenovo Legion Pro 7 16IRX8H i9-13900HX, NVIDIA GeForce RTX 4080 Laptop GPU | 2.7 kg | 26 mm | 16.00" | 2560x1600 | |
| 91.2 % v7 (old) | 02 / 2023 | Razer Blade 16 Early 2023 i9-13950HX, NVIDIA GeForce RTX 4080 Laptop GPU | 2.4 kg | 21.99 mm | 16.00" | 2560x1600 | |
| 88.9 % v7 (old) | 09 / 2022 | Lenovo Legion 7 16IAX7-82TD004SGE i9-12900HX, GeForce RTX 3080 Ti Laptop GPU | 2.6 kg | 20 mm | 16.00" | 2560x1600 | |
| 88.1 % v7 (old) | 06 / 2021 | Lenovo Legion 7 16ACHg6 R9 5900HX, GeForce RTX 3080 Laptop GPU | 2.5 kg | 23.5 mm | 16.00" | 2560x1600 | |
| 90.8 % v7 (old) | 09 / 2022 | Lenovo Legion 7 16ARHA7 R9 6900HX, Radeon RX 6850M XT | 2.6 kg | 19.4 mm | 16.00" | 2560x1600 |
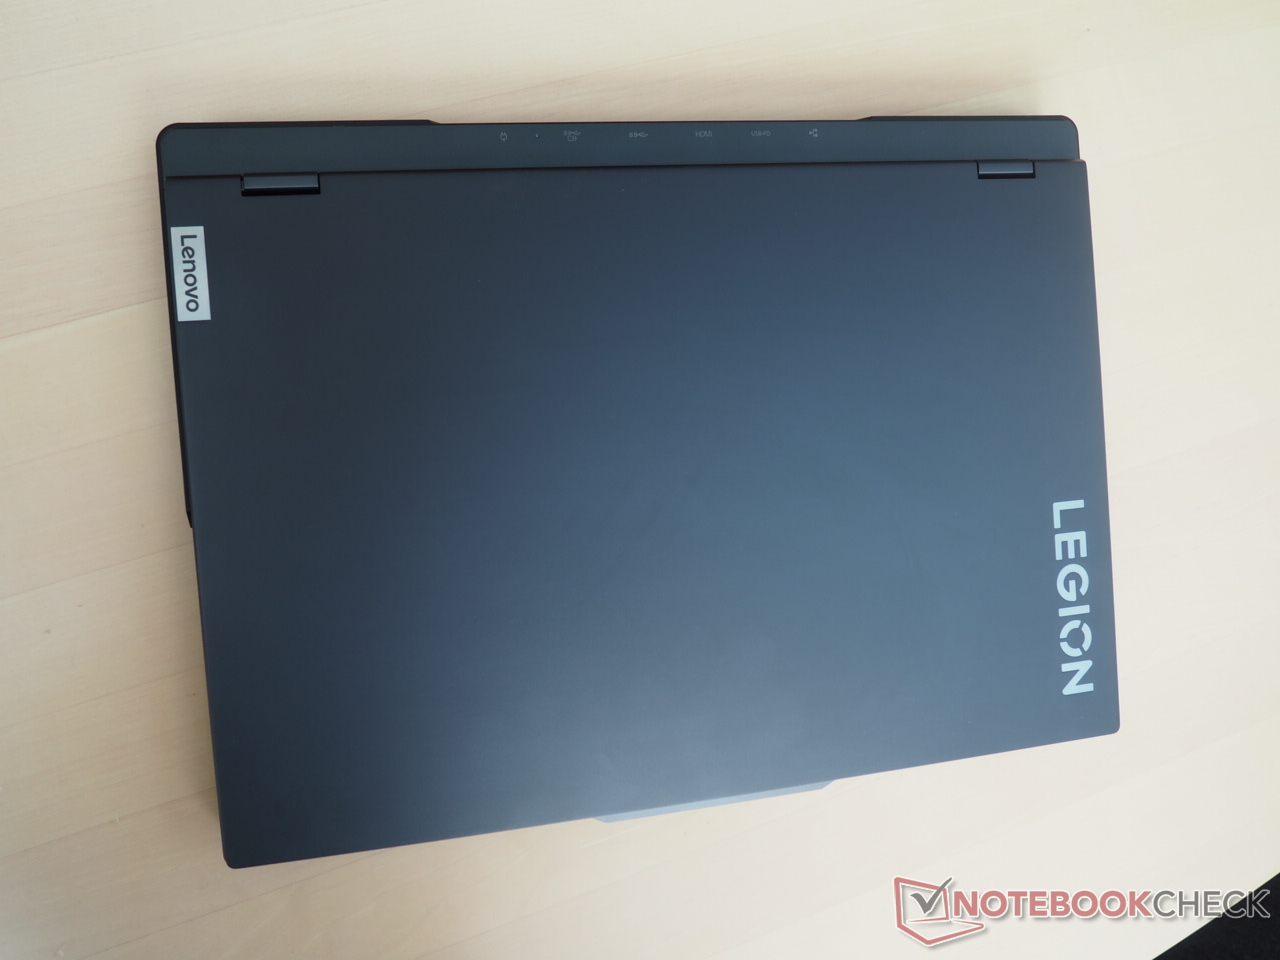
Case: Not very different from its predecessor
The chassis design is quite similar to that of its predecessor, the Legion 7 16ARHA7 with some slight changes such as the redesigned side and rear vents. Even with these changes, the chassis design remains good. The stability and strength of the hinges, which can open to a full 180°, is also above average for the class.
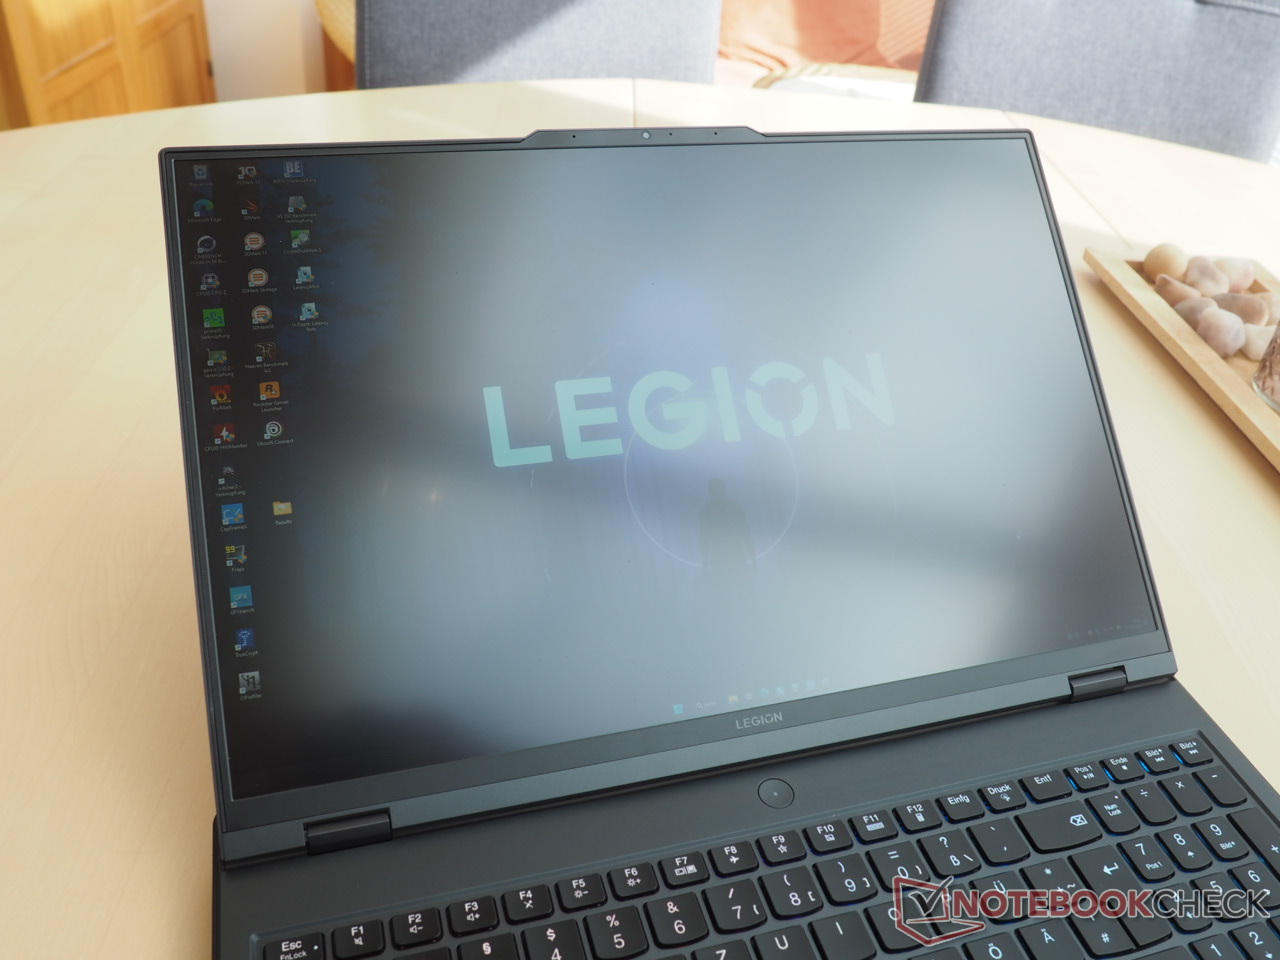
The overall quality of feels great. The metal lid, in particular, looks classy thought it can quickly become a fingerprint magnet. The look is mostly unobtrusive when switched off save for the Legion marking on the lid.
During operation, however, the Legion 7 Pro can be immediately recognized as a gaming laptop owing to the RGB-illuminated keyboard and the LED strip at the front.
At about 2.7 kg, the 16-inch Legion 7 Pro tends to be one of the heavier laptops in its category (the Razer Blade 16 weighs 300 g less). Similarly, the 2.6 cm height is about 4 mm more than the Blade 16, which should theoretically help with better cooling.
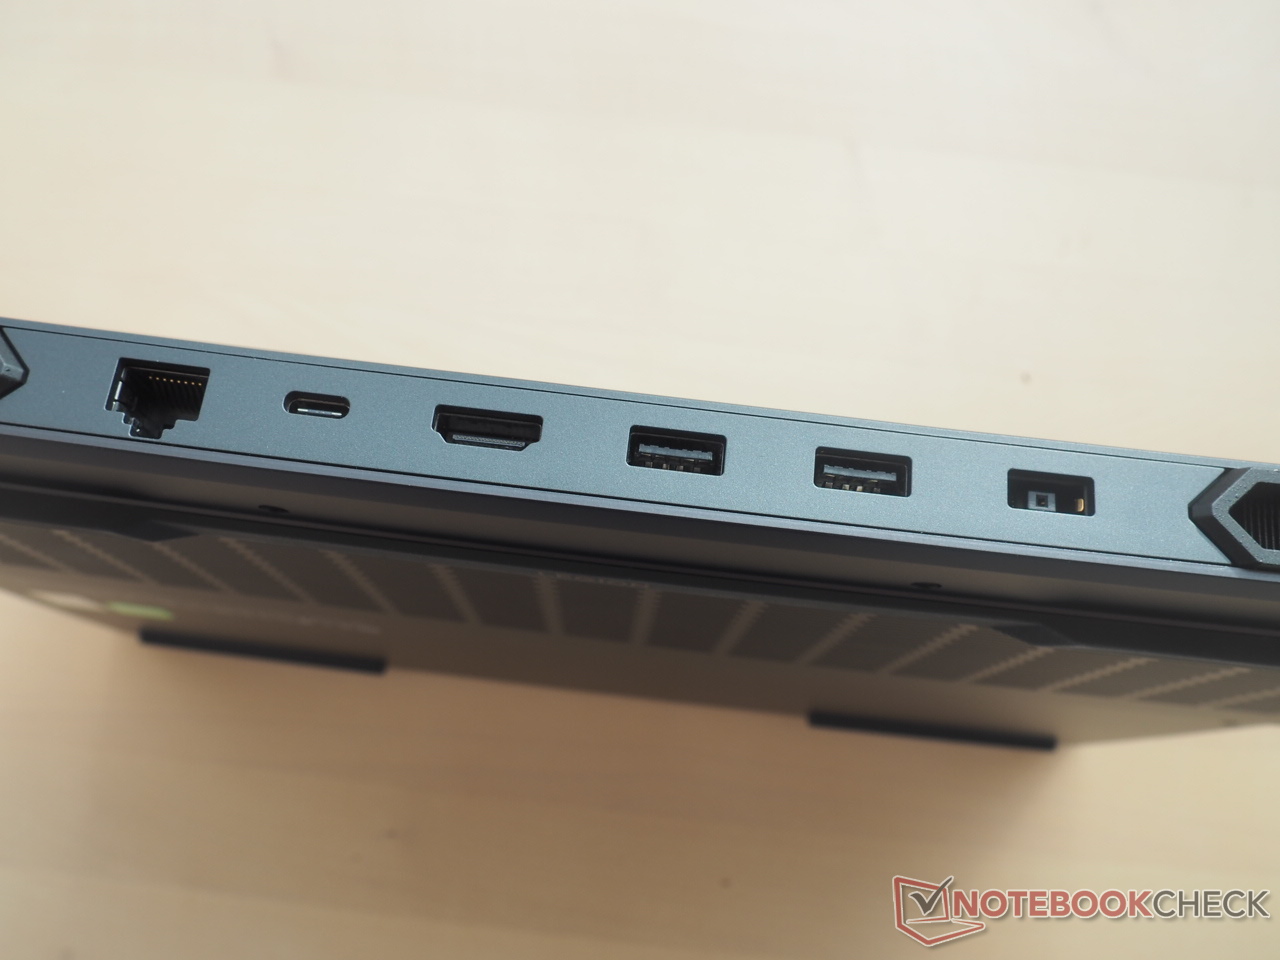
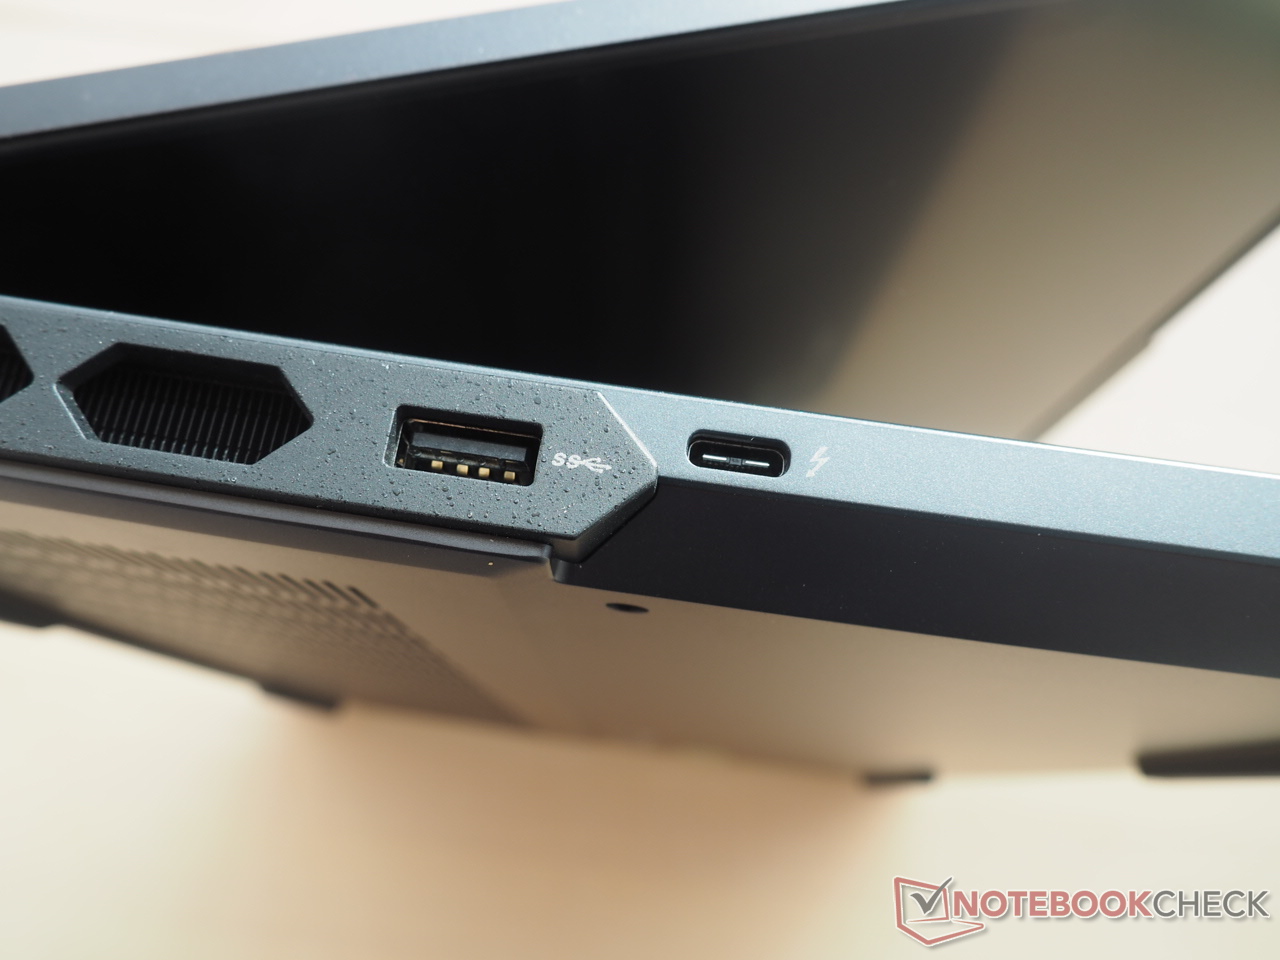
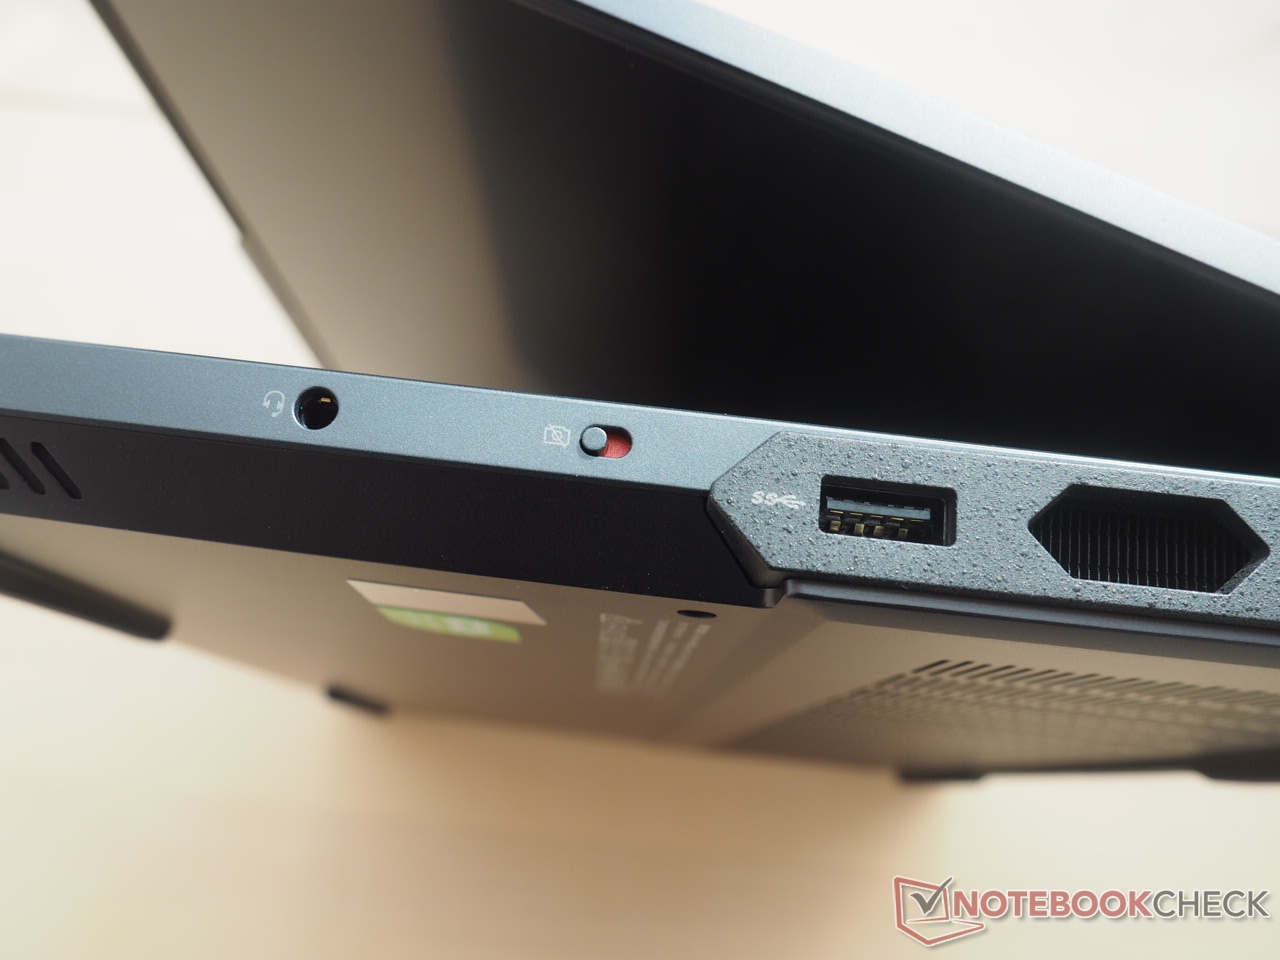
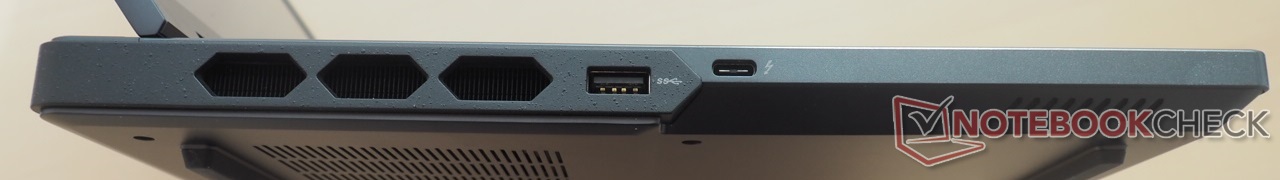
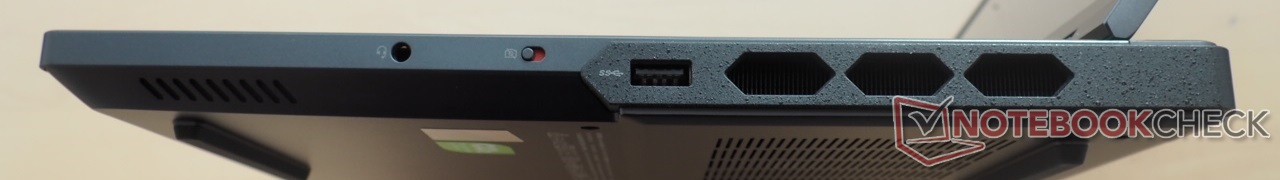
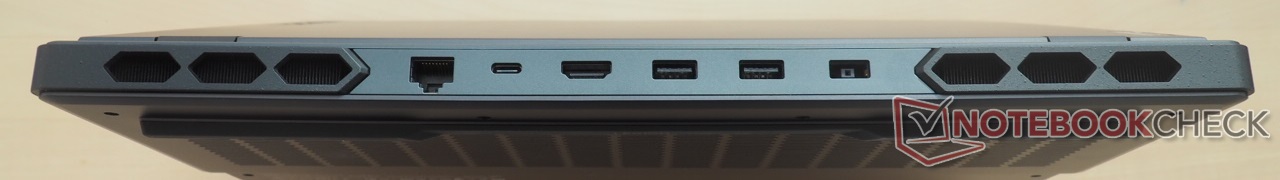
Connectivity: A bevy of USB ports
Ports
The Legion 7 Pro impresses with its abundance of ports. A total of six USB ports are available (2x Type-C, 4x Type-A), which is not the case often even in high-end gaming laptops. Three external displays can be connected thanks to the HDMI 2.1-out and DisplayPort-out support on the two USB Type-C ports. Also impressive is the 140 W power delivery via USB Type-C.
An RJ-45 port, and an audio jack complete the port selection. Presence of a physical webcam shutter switch on the right side is a plus. The only downside in the Legion 7 Pro is the absence of a card reader.
Since the majority of the ports are located towards the rear of the device, both left and right handers will get their money's worth when using a wired gaming mouse.
Communication
We did not find any discrepancies in Wi-Fi performance. The Legion Pro 7 achieved a throughput of 1,600 Mb/s at a distance of 1 m from our Asus ROG Rapture GT-AXE11000 reference router, which corresponds to very good transmission and reception. The Razer Blade 16 settles for a few 100 Mbps lesser throughput.
Webcam
The quality of the webcam is somewhat above average. The 2 MP camera offers decent image sharpness and passable color accuracy, which is acceptable for a notebook (the standards here are very poor, unfortunately).


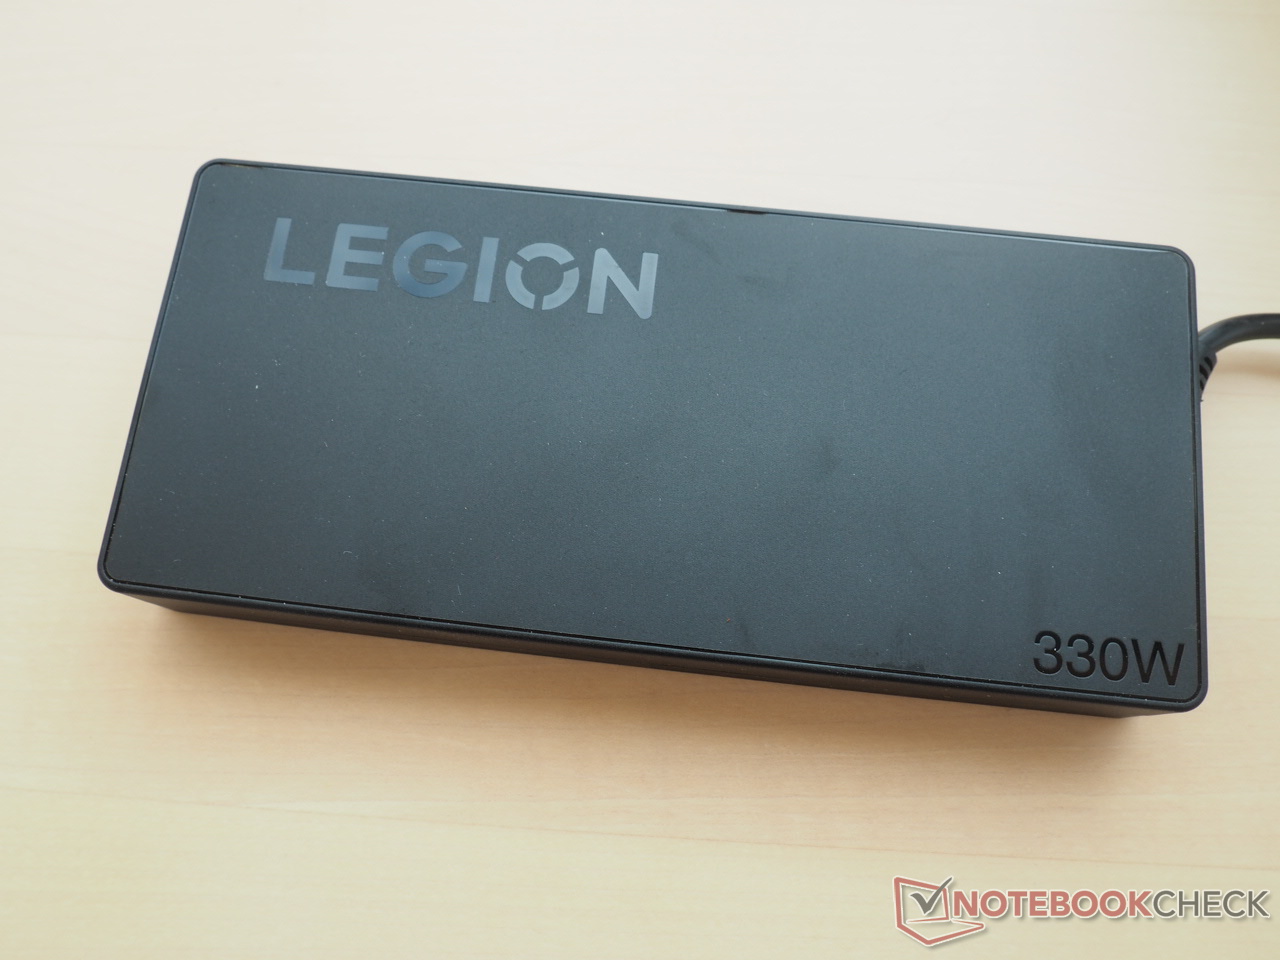
Accessories
The scope of delivery includes a massive 800 g power supply that measures 18.5 x 8 x 2.5 cm, which is on expected lines for a 330 W model. A few information booklets come as standard.
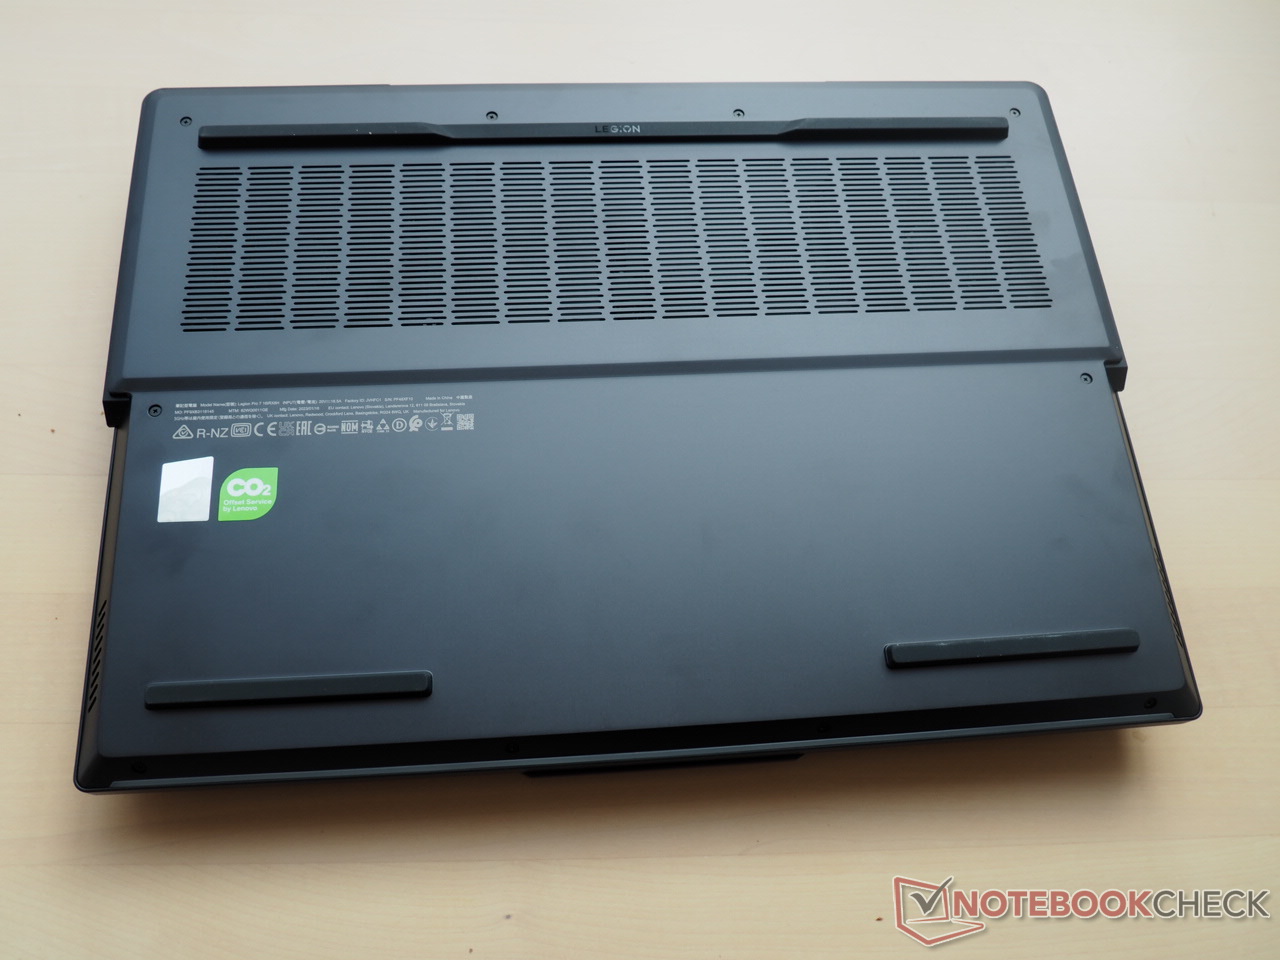
Maintenance
Lenovo could have made disassembling the Legion 7 Pro more customer friendly. Even after removing all the housing screws, the base plate is so tight (especially in the rear) that there's a fear of damaging the chassis if too much force is applied.
Due to this reason, and the fact that this a retail sample from the shop, we did not attempt opening the laptop for safety.
Warranty
According to the manufacturer's information in Germany, the Legion 7 Pro's warranty can be extended to over three years with Premium Care.
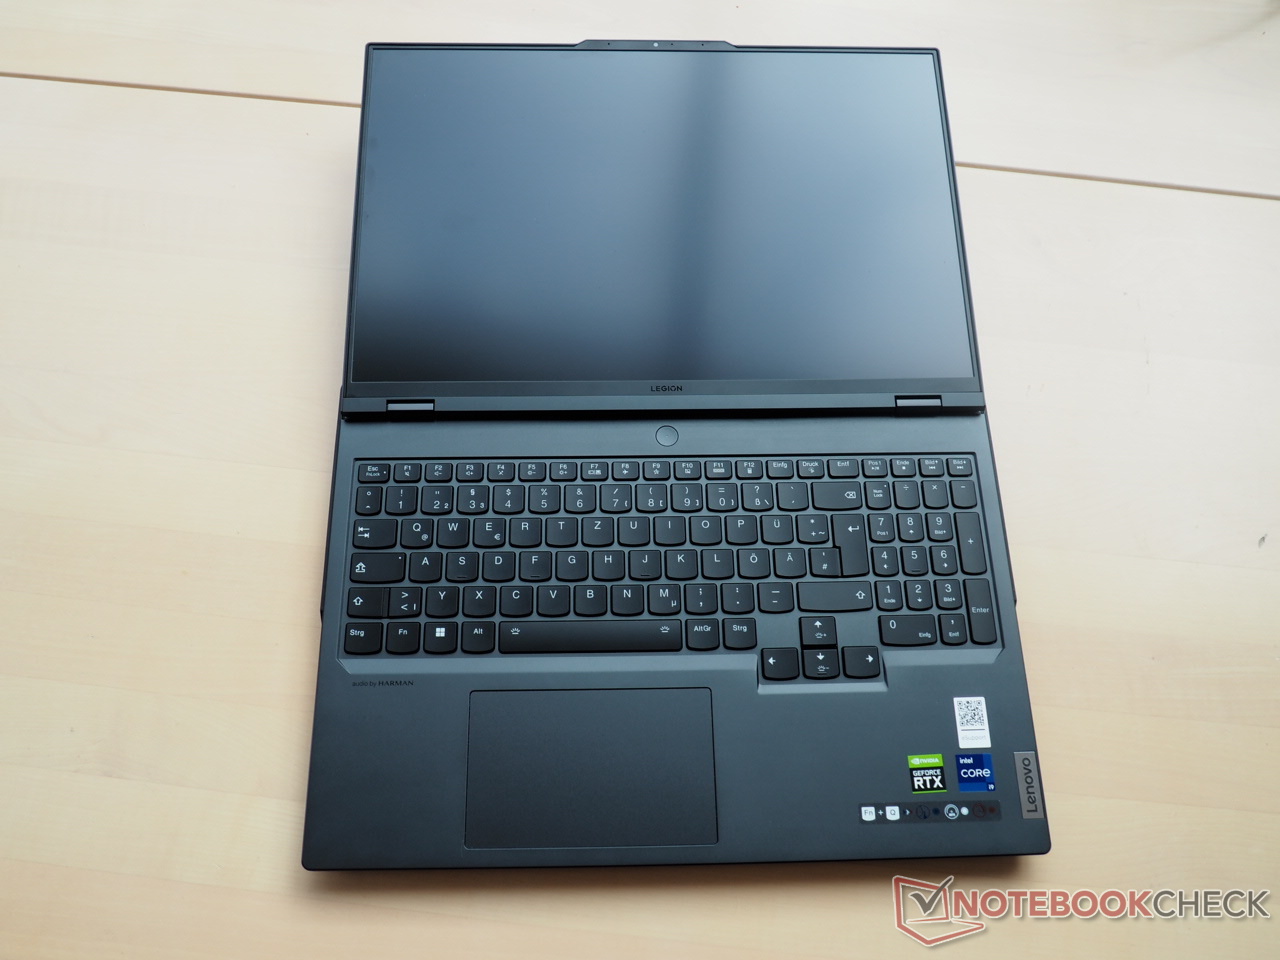
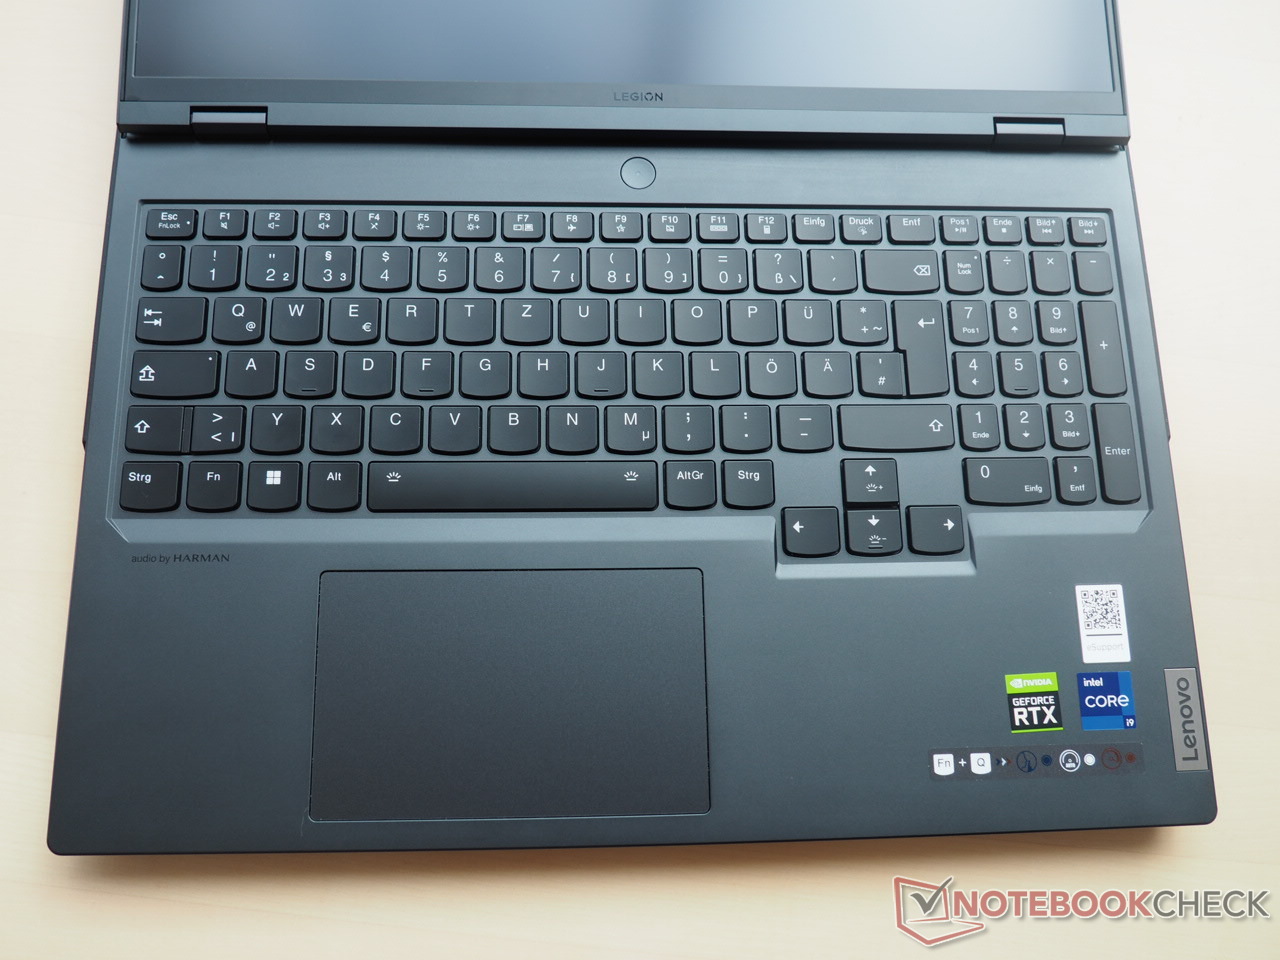
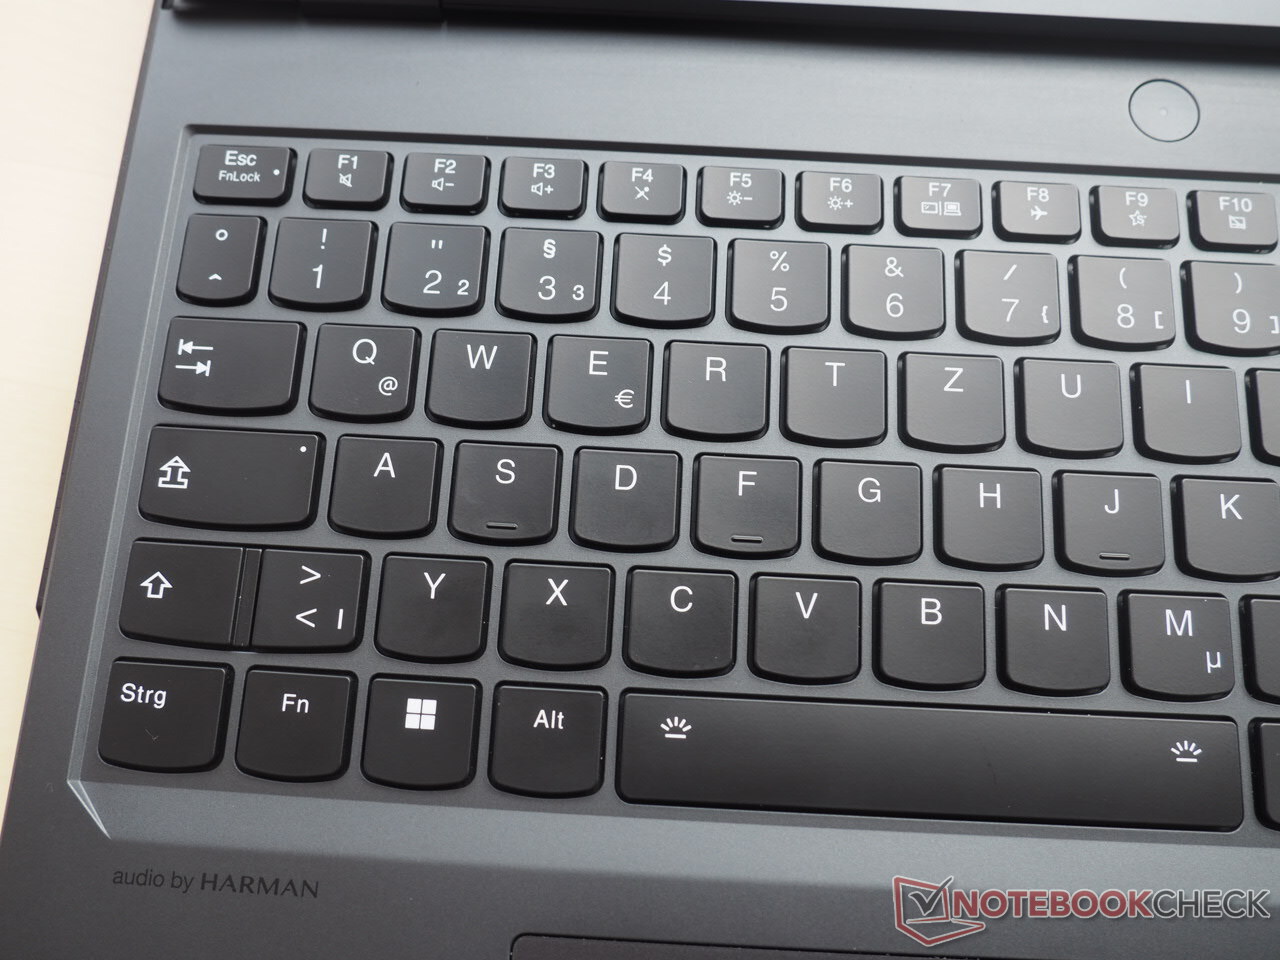
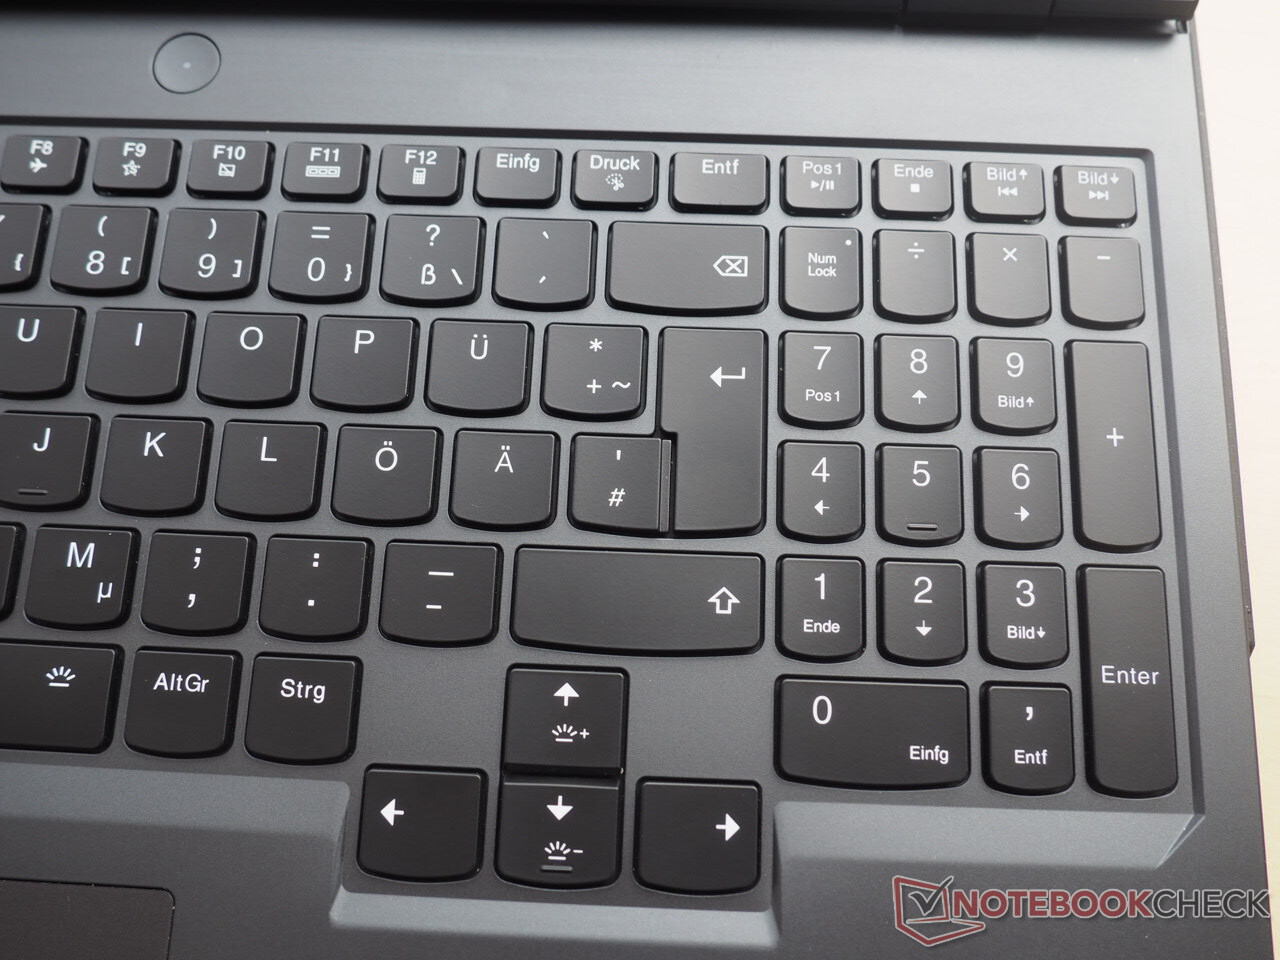
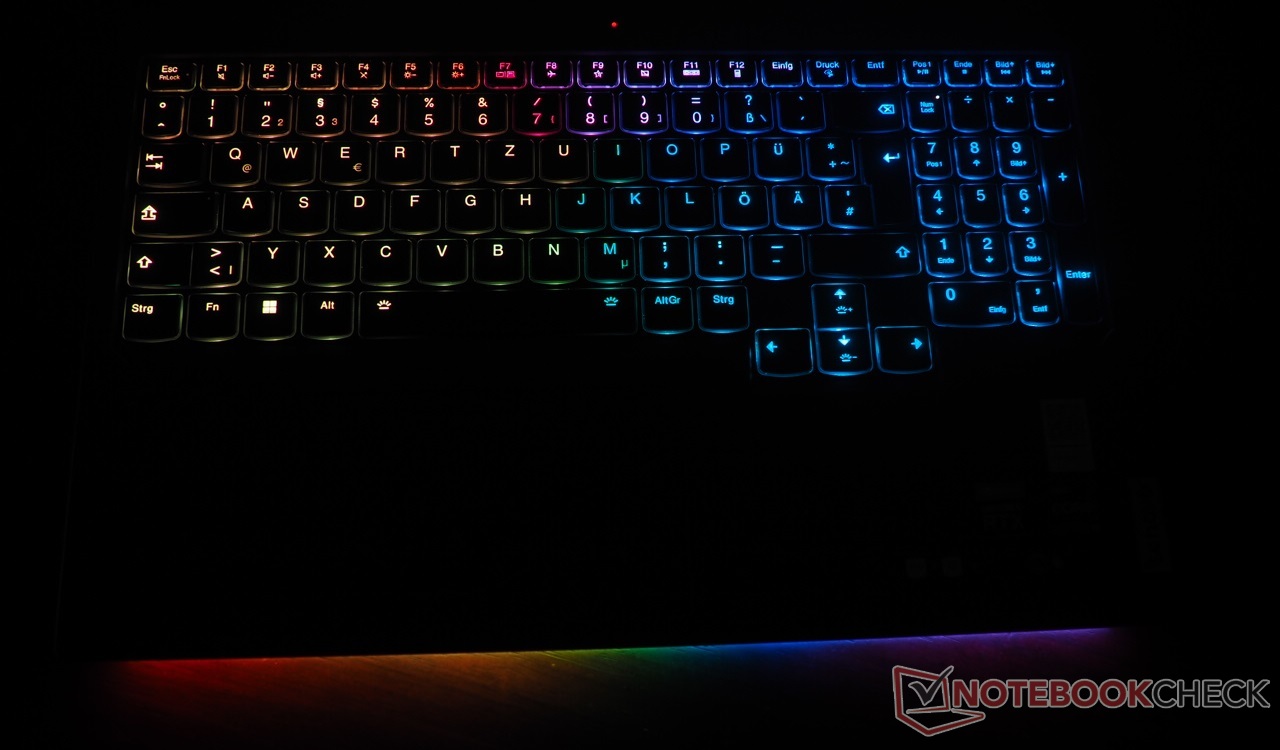
Input devices: Not much room for complaint
Keyboard
The keyboard offers little room for complaint. The typical Lenovo-style keys with curved lower edges ensures a pleasant typing experience after some familiarization. Actuation and pressure point are quite good, though not exactly near the level of a mechanical keyboard.
The keyboard layout feels convincing in our opinion. Those who rely on arrow keys a lot can look forward to decent dimensioning. A full-fledged numpad is also available. The clear key labeling means that you can turn off the backlight during the day. Otherwise, the backlight offers a useful intensity and several adjustment modes.
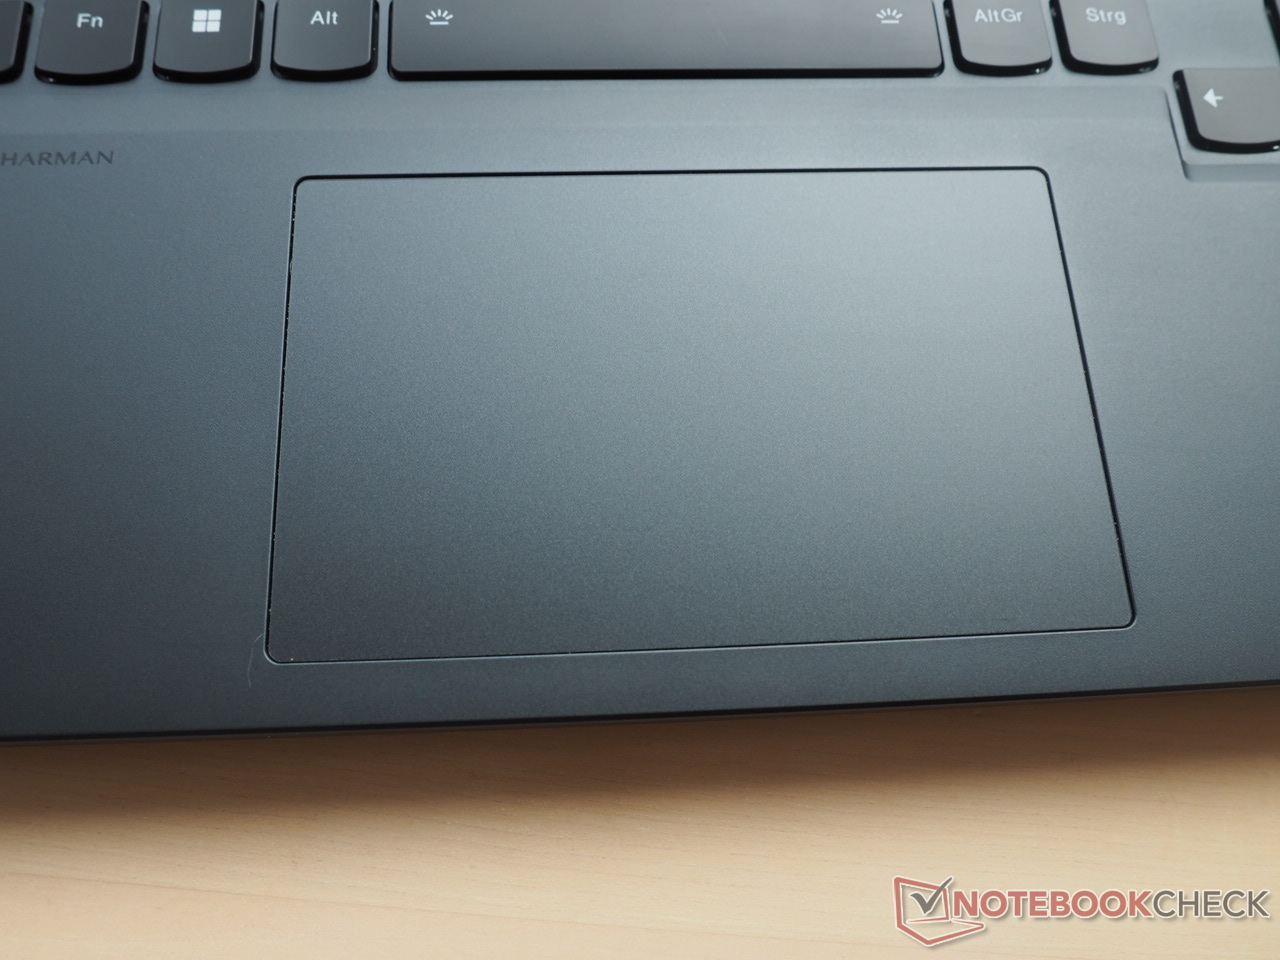
Touchpad
The 12 x 7.5 cm smooth touchpad feels sufficient for a 16-inch device and is placed relatively far to the left. We did not find any issues with precision and gliding properties, which lends to a smooth operation.
The click areas near the bottom are very stable and can be easily triggered but sound quite loud and rickety.
Display: 240 Hz panel with high brightness levels and no PWM
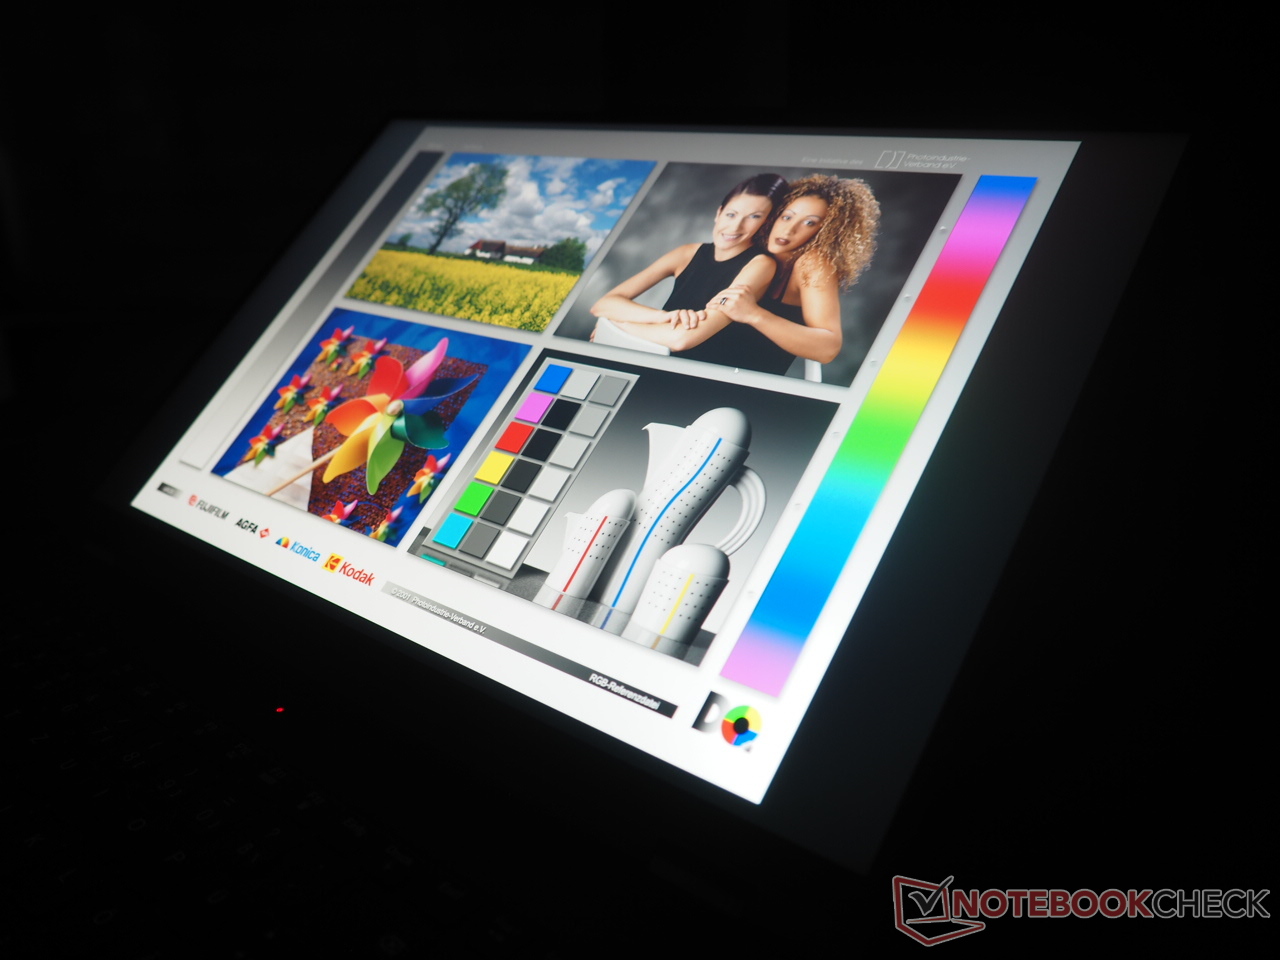
The Legion 7 Pro's 240 Hz WQXGA panel offers a high average luminosity of 469 cd/m2, which should augur well for outdoor viewing. The competition also offers similar brightness levels, however.
| |||||||||||||||||||||||||
Brightness Distribution: 86 %
Center on Battery: 511 cd/m²
Contrast: 1278:1 (Black: 0.4 cd/m²)
ΔE ColorChecker Calman: 0.95 | ∀{0.5-29.43 Ø4.83}
calibrated: 0.91
ΔE Greyscale Calman: 0.6 | ∀{0.09-98 Ø5.1}
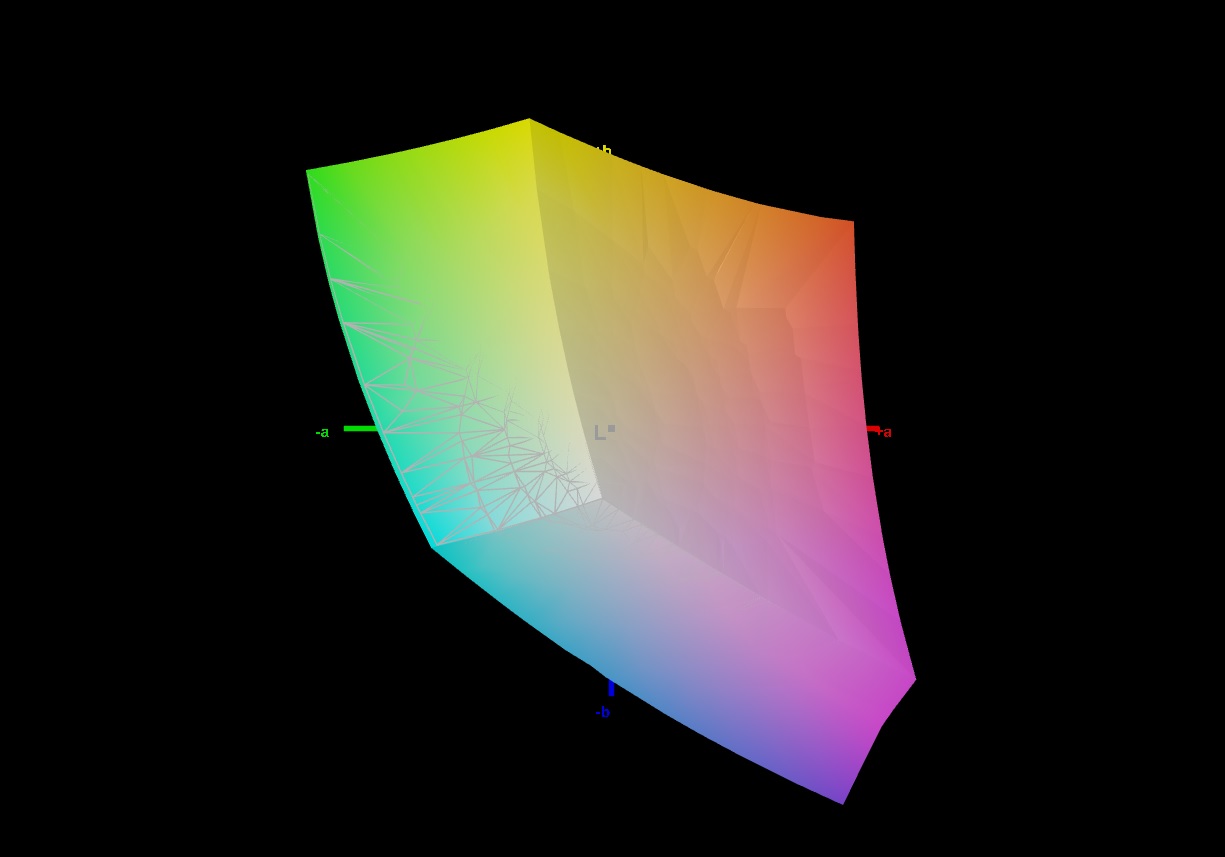
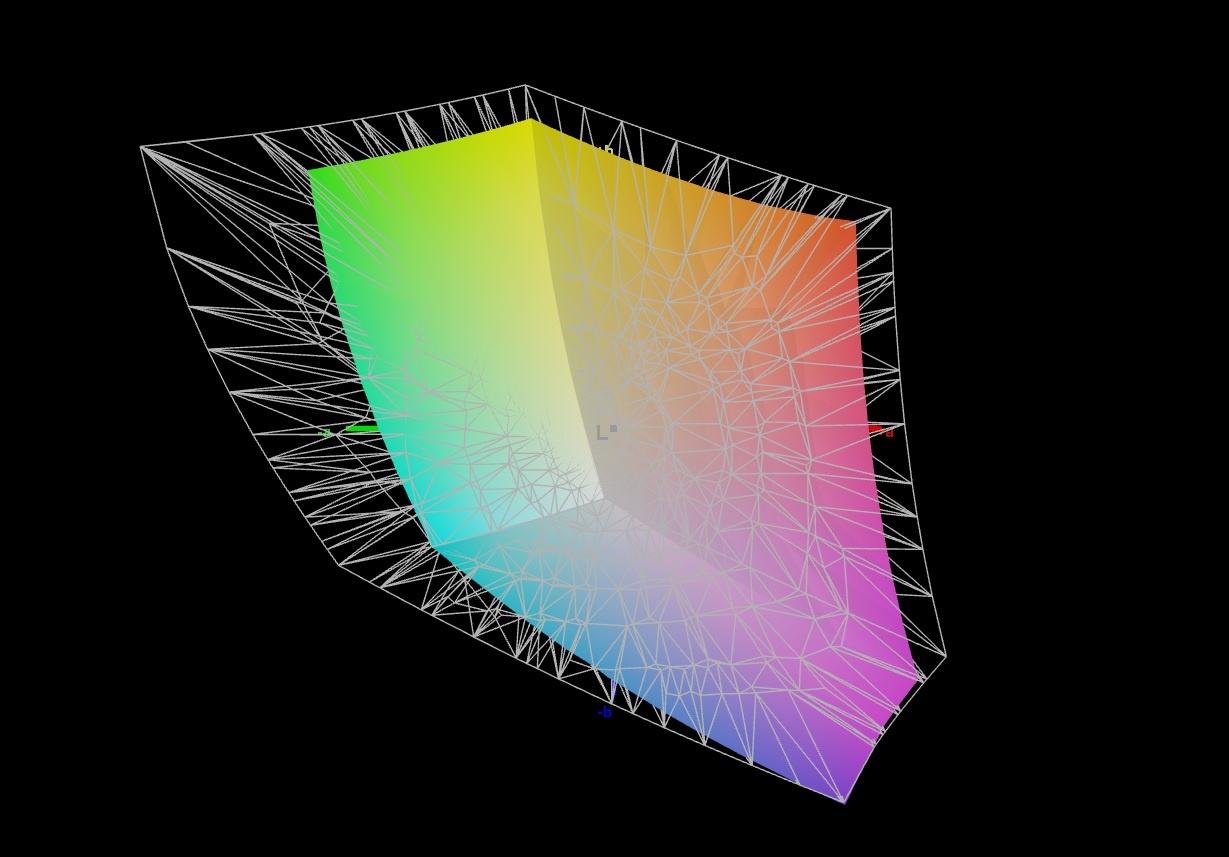
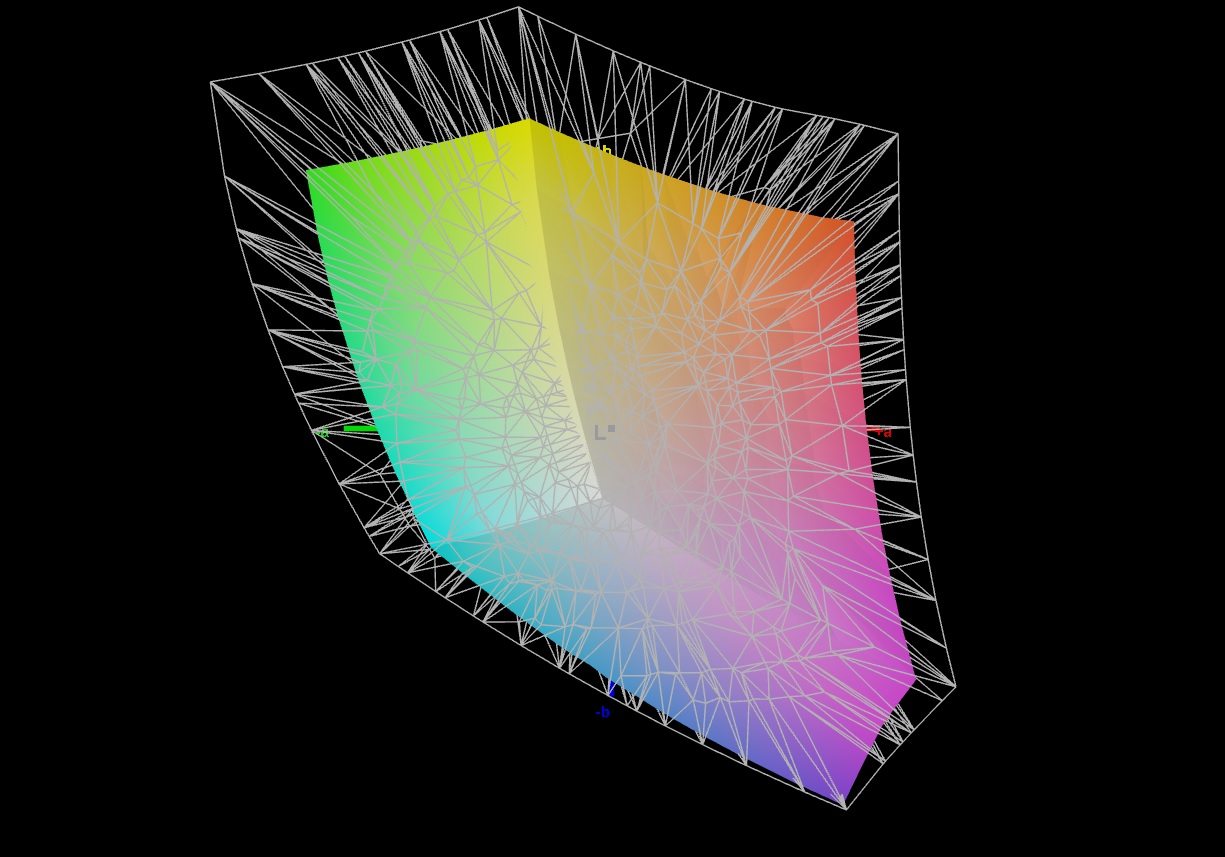
71.2% AdobeRGB 1998 (Argyll 3D)
99.7% sRGB (Argyll 3D)
69.1% Display P3 (Argyll 3D)
Gamma: 2.176
CCT: 6545 K
| Lenovo Legion Pro 7 16IRX8H MNG007DA2-3 (CSO1628), IPS, 2560x1600, 16" | Razer Blade 16 Early 2023 CSOT T3 MNG007DA4-1, IPS, 2560x1600, 16" | Lenovo Legion 7 16IAX7-82TD004SGE NE160QDM-NY1, IPS, 2560x1600, 16" | Lenovo Legion 7 16ACHg6 CSOT T3 MNG007DA1-1, IPS, 2560x1600, 16" | Lenovo Legion 7 16ARHA7 BOE CQ NE160QDM-NY1, IPS, 2560x1600, 16" | |
|---|---|---|---|---|---|
| Display | 23% | -1% | 1% | -7% | |
| Display P3 Coverage | 69.1 | 98.5 43% | 69.3 0% | 70.3 2% | 63.7 -8% |
| sRGB Coverage | 99.7 | 100 0% | 98.2 -2% | 99.4 0% | 95.3 -4% |
| AdobeRGB 1998 Coverage | 71.2 | 89.7 26% | 70.8 -1% | 72.7 2% | 65.7 -8% |
| Response Times | -29% | 2% | -11% | -19% | |
| Response Time Grey 50% / Grey 80% * | 12.3 ? | 6.6 ? 46% | 12.6 ? -2% | 14 ? -14% | 9.2 ? 25% |
| Response Time Black / White * | 5.9 ? | 12 ? -103% | 5.6 ? 5% | 6.4 ? -8% | 9.6 ? -63% |
| PWM Frequency | |||||
| Screen | -90% | -87% | -27% | -74% | |
| Brightness middle | 511 | 456.8 -11% | 547 7% | 489 -4% | 478.8 -6% |
| Brightness | 469 | 437 -7% | 523 12% | 469 0% | 477 2% |
| Brightness Distribution | 86 | 83 -3% | 88 2% | 92 7% | 90 5% |
| Black Level * | 0.4 | 0.35 12% | 0.44 -10% | 0.38 5% | 0.43 -8% |
| Contrast | 1278 | 1305 2% | 1243 -3% | 1287 1% | 1113 -13% |
| Colorchecker dE 2000 * | 0.95 | 3.7 -289% | 2.1 -121% | 1.45 -53% | 2.24 -136% |
| Colorchecker dE 2000 max. * | 2.07 | 6.42 -210% | 7 -238% | 2.16 -4% | 4.49 -117% |
| Colorchecker dE 2000 calibrated * | 0.91 | 0.66 27% | 0.9 1% | 1.16 -27% | 1.89 -108% |
| Greyscale dE 2000 * | 0.6 | 2.6 -333% | 3.2 -433% | 1.6 -167% | 2.3 -283% |
| Gamma | 2.176 101% | 2.3 96% | 2.23 99% | 2.197 100% | 2.25 98% |
| CCT | 6545 99% | 6108 106% | 6979 93% | 6377 102% | 6955 93% |
| Color Space (Percent of AdobeRGB 1998) | 73 | ||||
| Color Space (Percent of sRGB) | 94 | ||||
| Total Average (Program / Settings) | -32% /
-57% | -29% /
-56% | -12% /
-19% | -33% /
-52% |
* ... smaller is better
The 1,278:1 contrast ratio is on similar lines as the Blade 16. However, the Razer flagship offers a higher color gamut coverage. The Legion Pro 7 can manage 100% sRGB but falls short when it comes to Adobe RGB and Display P3 coverage.
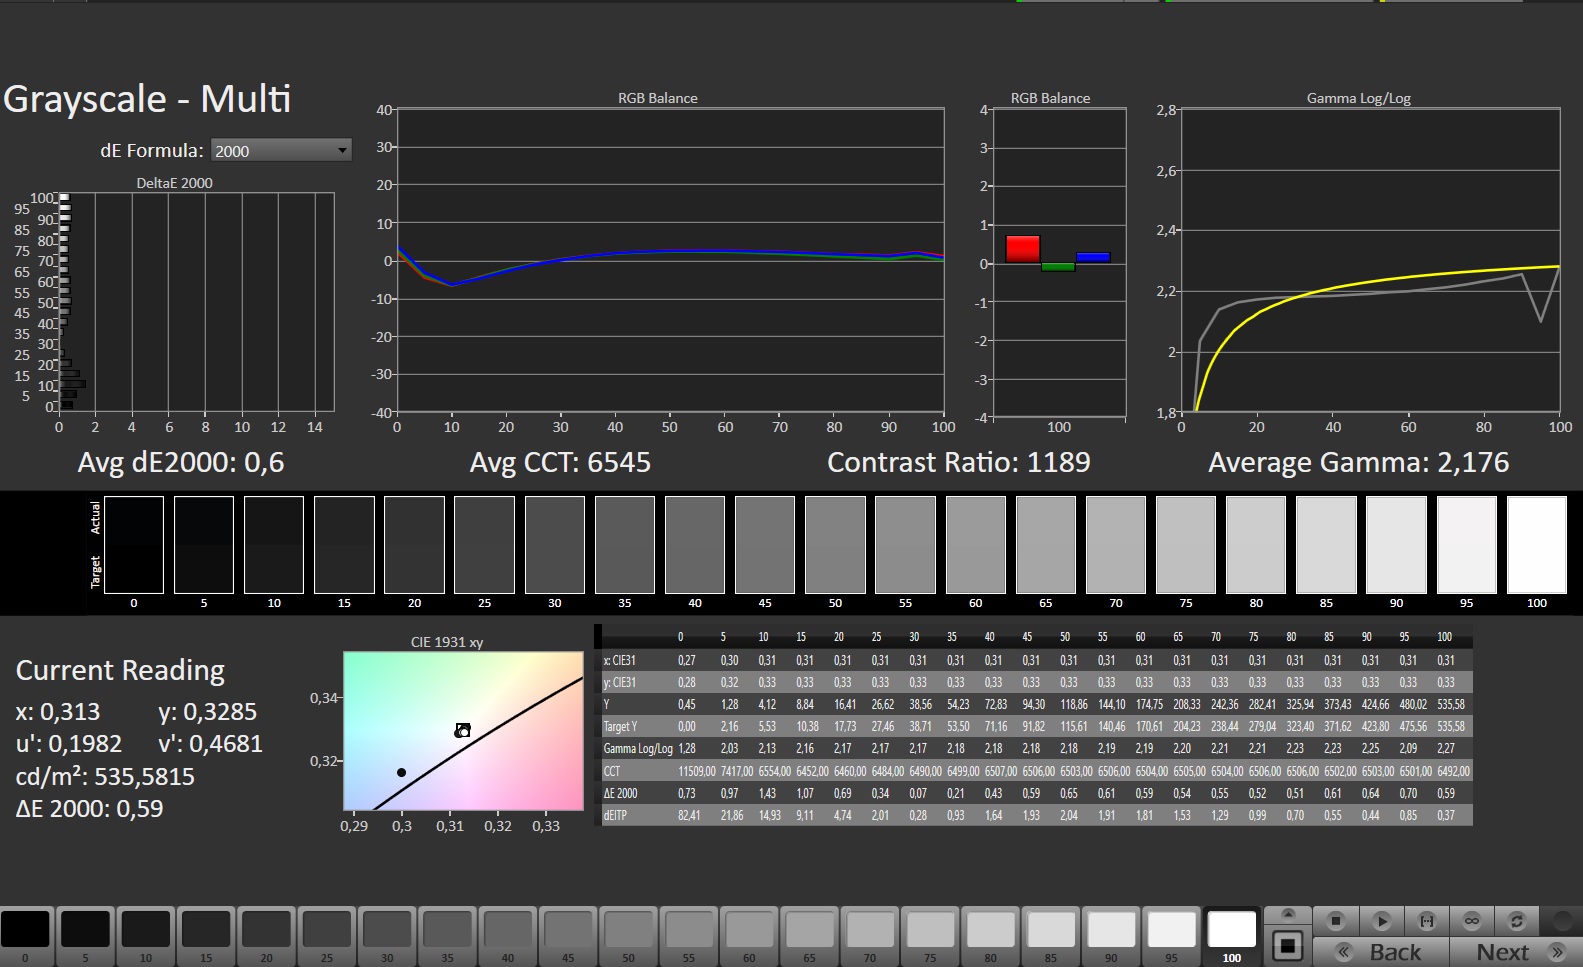
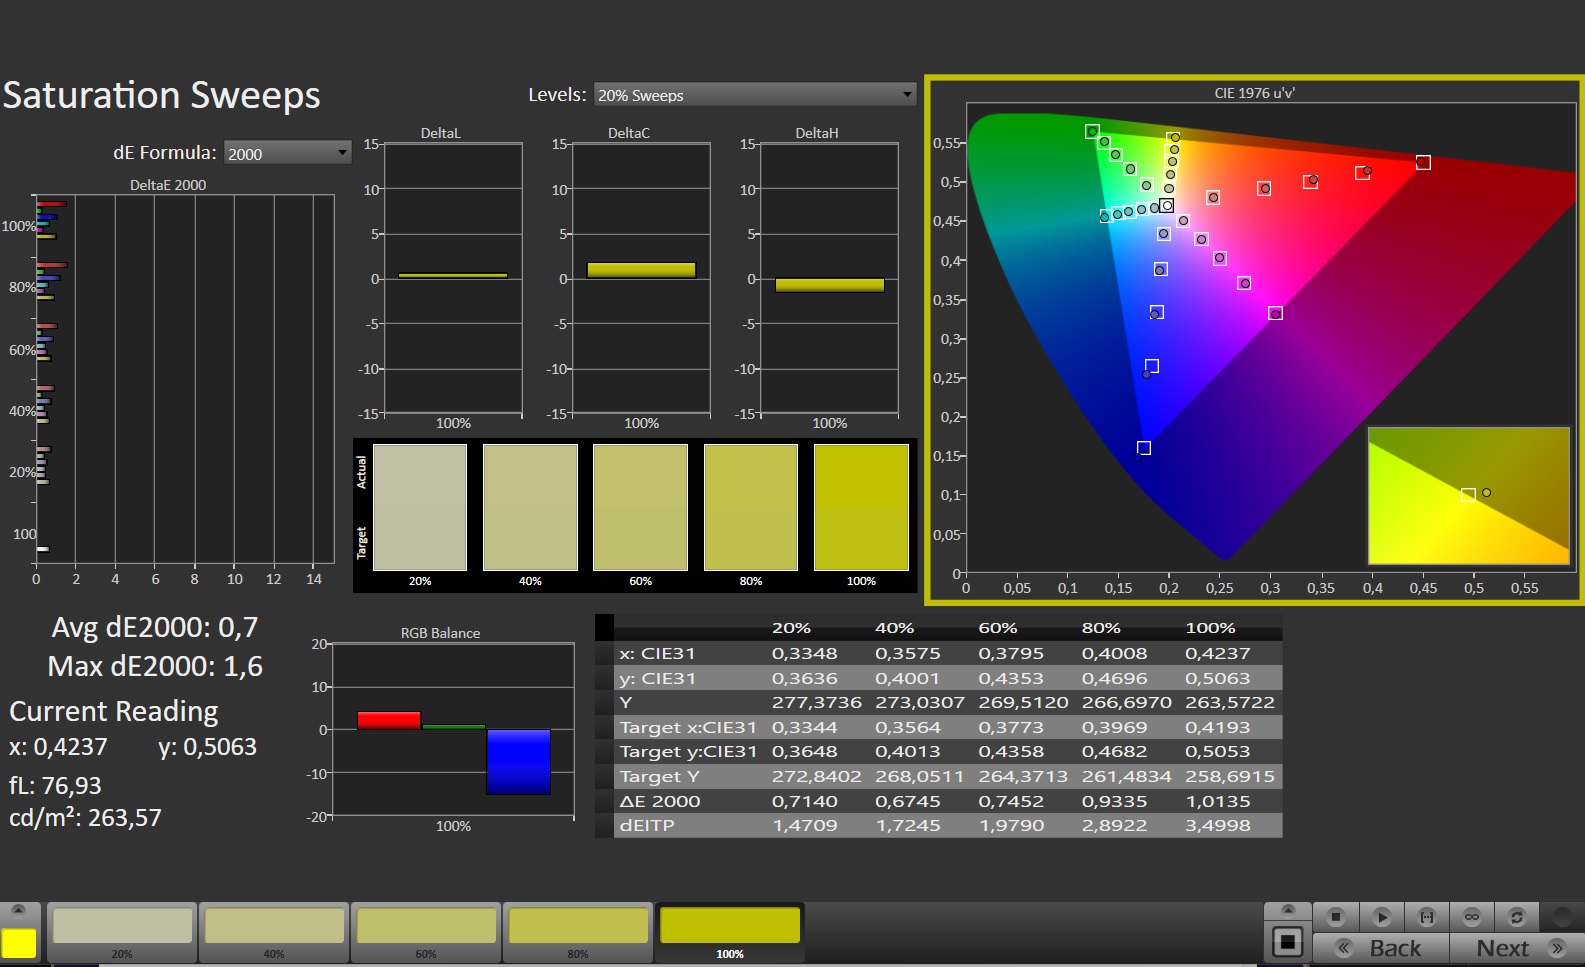

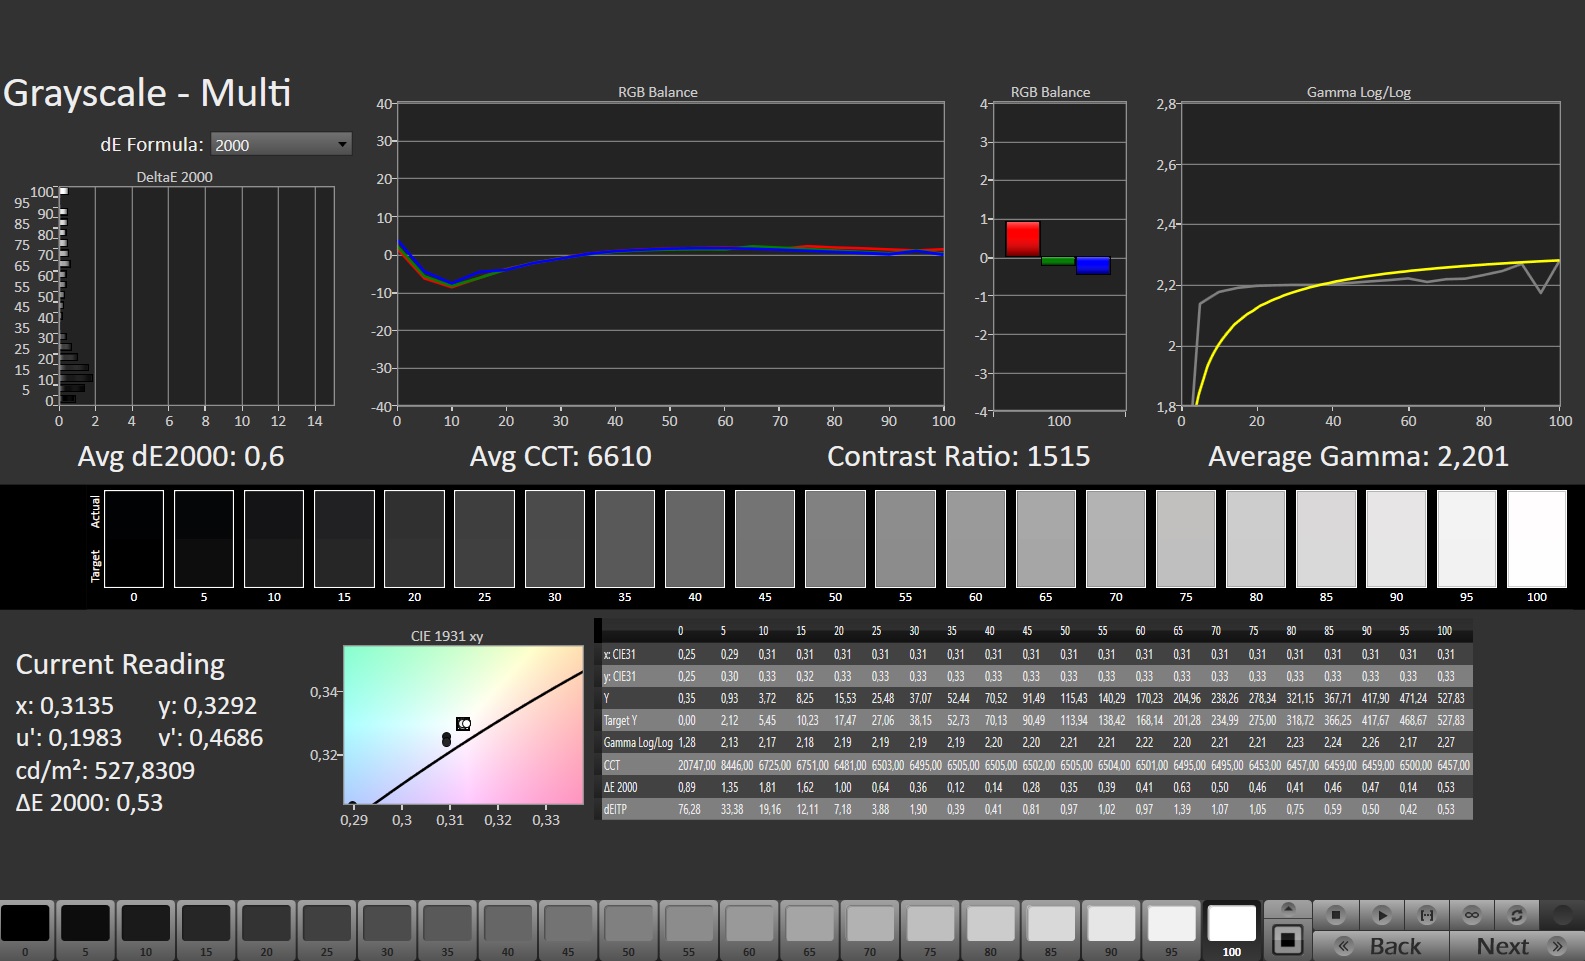
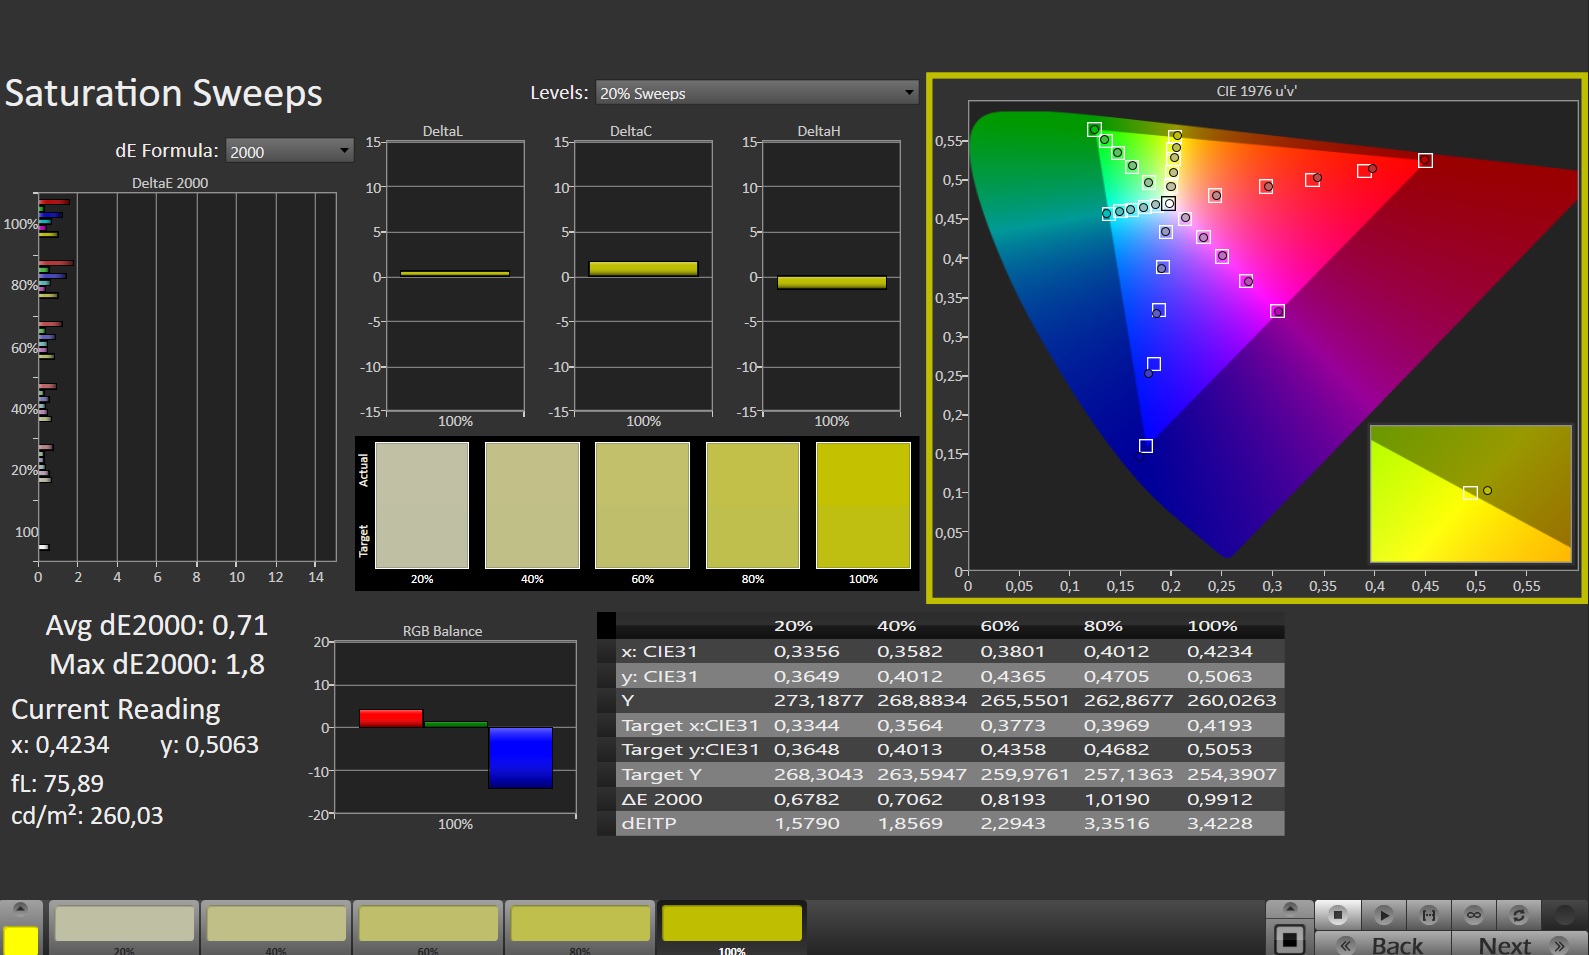
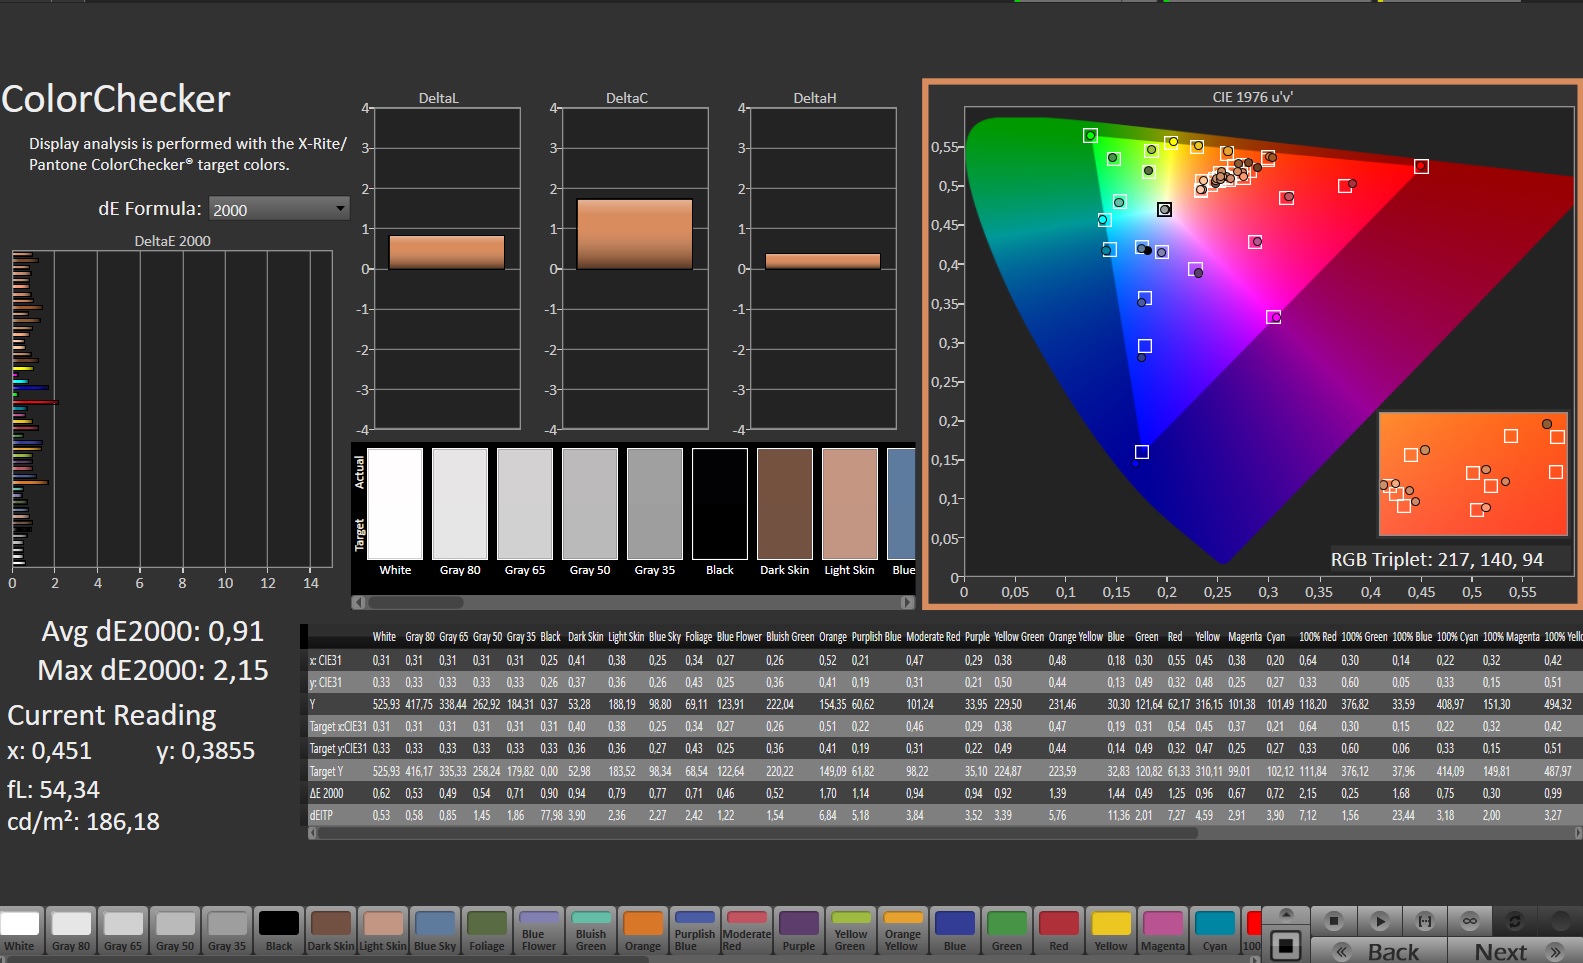
That being said, the Legion Pro 7 offers excellent color accuracy out-of-the-box thanks to X-Rite Pantone calibration.
The response times (~6 ms black to white) are on expected lines. The viewing angle stability usually depends on the IPS level, it seems to be relatively good from oblique positions.
Display Response Times
| ↔ Response Time Black to White | ||
|---|---|---|
| 5.9 ms ... rise ↗ and fall ↘ combined | ↗ 2.2 ms rise | 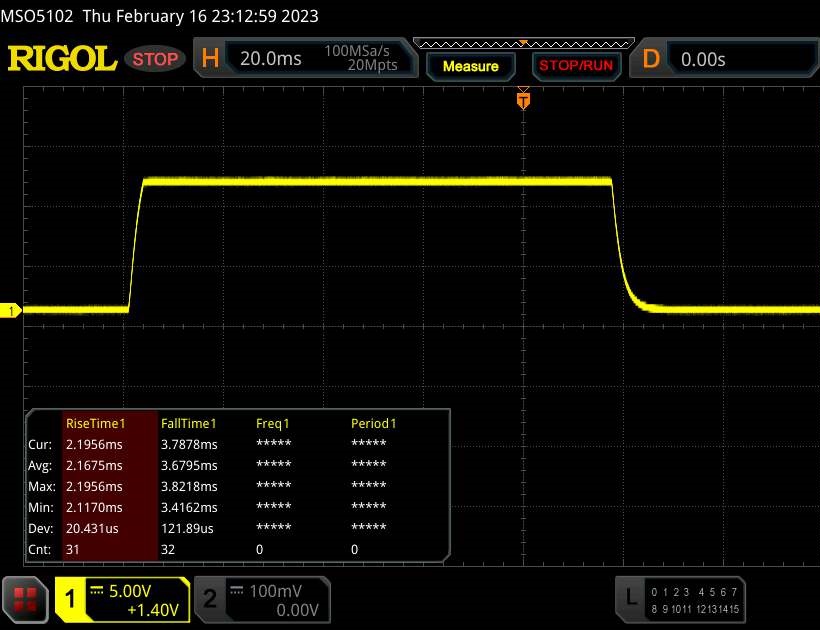 |
| ↘ 3.7 ms fall | ||
| The screen shows very fast response rates in our tests and should be very well suited for fast-paced gaming. In comparison, all tested devices range from 0.1 (minimum) to 240 (maximum) ms. » 16 % of all devices are better. This means that the measured response time is better than the average of all tested devices (20.5 ms). | ||
| ↔ Response Time 50% Grey to 80% Grey | ||
| 12.3 ms ... rise ↗ and fall ↘ combined | ↗ 5.7 ms rise | 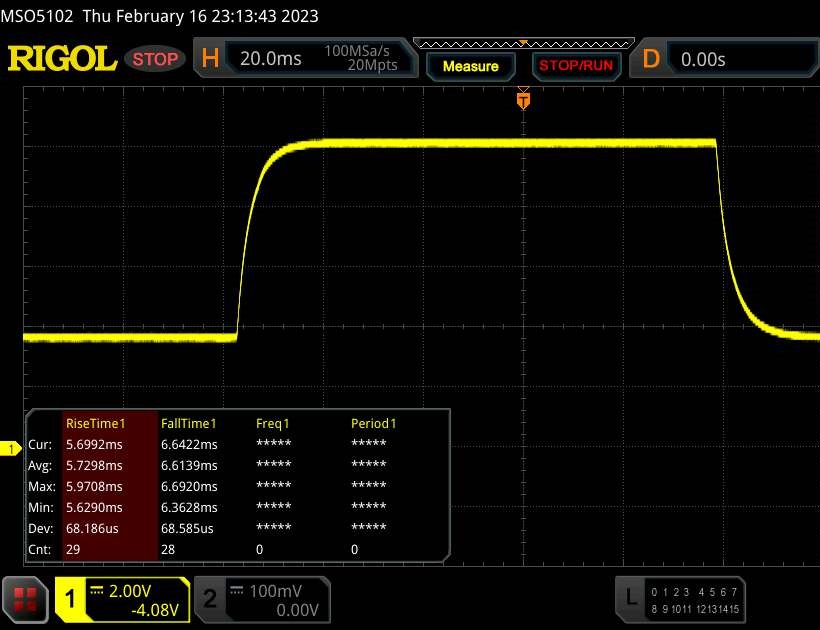 |
| ↘ 6.6 ms fall | ||
| The screen shows good response rates in our tests, but may be too slow for competitive gamers. In comparison, all tested devices range from 0.165 (minimum) to 636 (maximum) ms. » 24 % of all devices are better. This means that the measured response time is better than the average of all tested devices (32.1 ms). | ||
Screen Flickering / PWM (Pulse-Width Modulation)
| Screen flickering / PWM not detected |  | ||
In comparison: 53 % of all tested devices do not use PWM to dim the display. If PWM was detected, an average of 8327 (minimum: 5 - maximum: 343500) Hz was measured. | |||
Performance: Core i9-13900HX and RTX 4080 top the charts
The present configuration puts the Lenovo Legion Pro 7 in the absolute high-end category, which means that you will have to cough up the pennies accordingly (we consider the current price level to be excessive, nevertheless).
In any case, this configuration offers enough power to sail through all kinds of workloads for years to come.
Test conditions
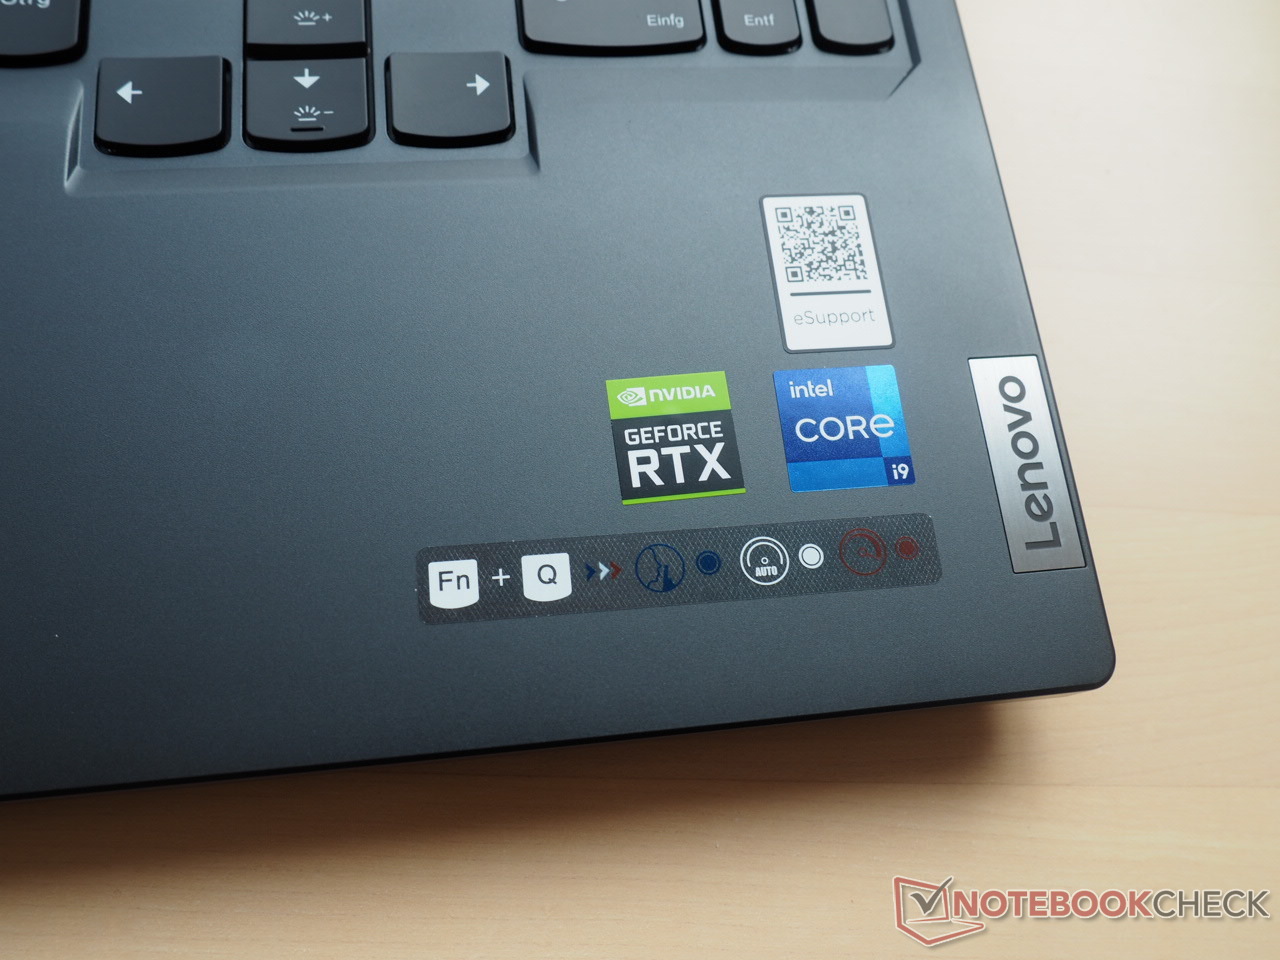
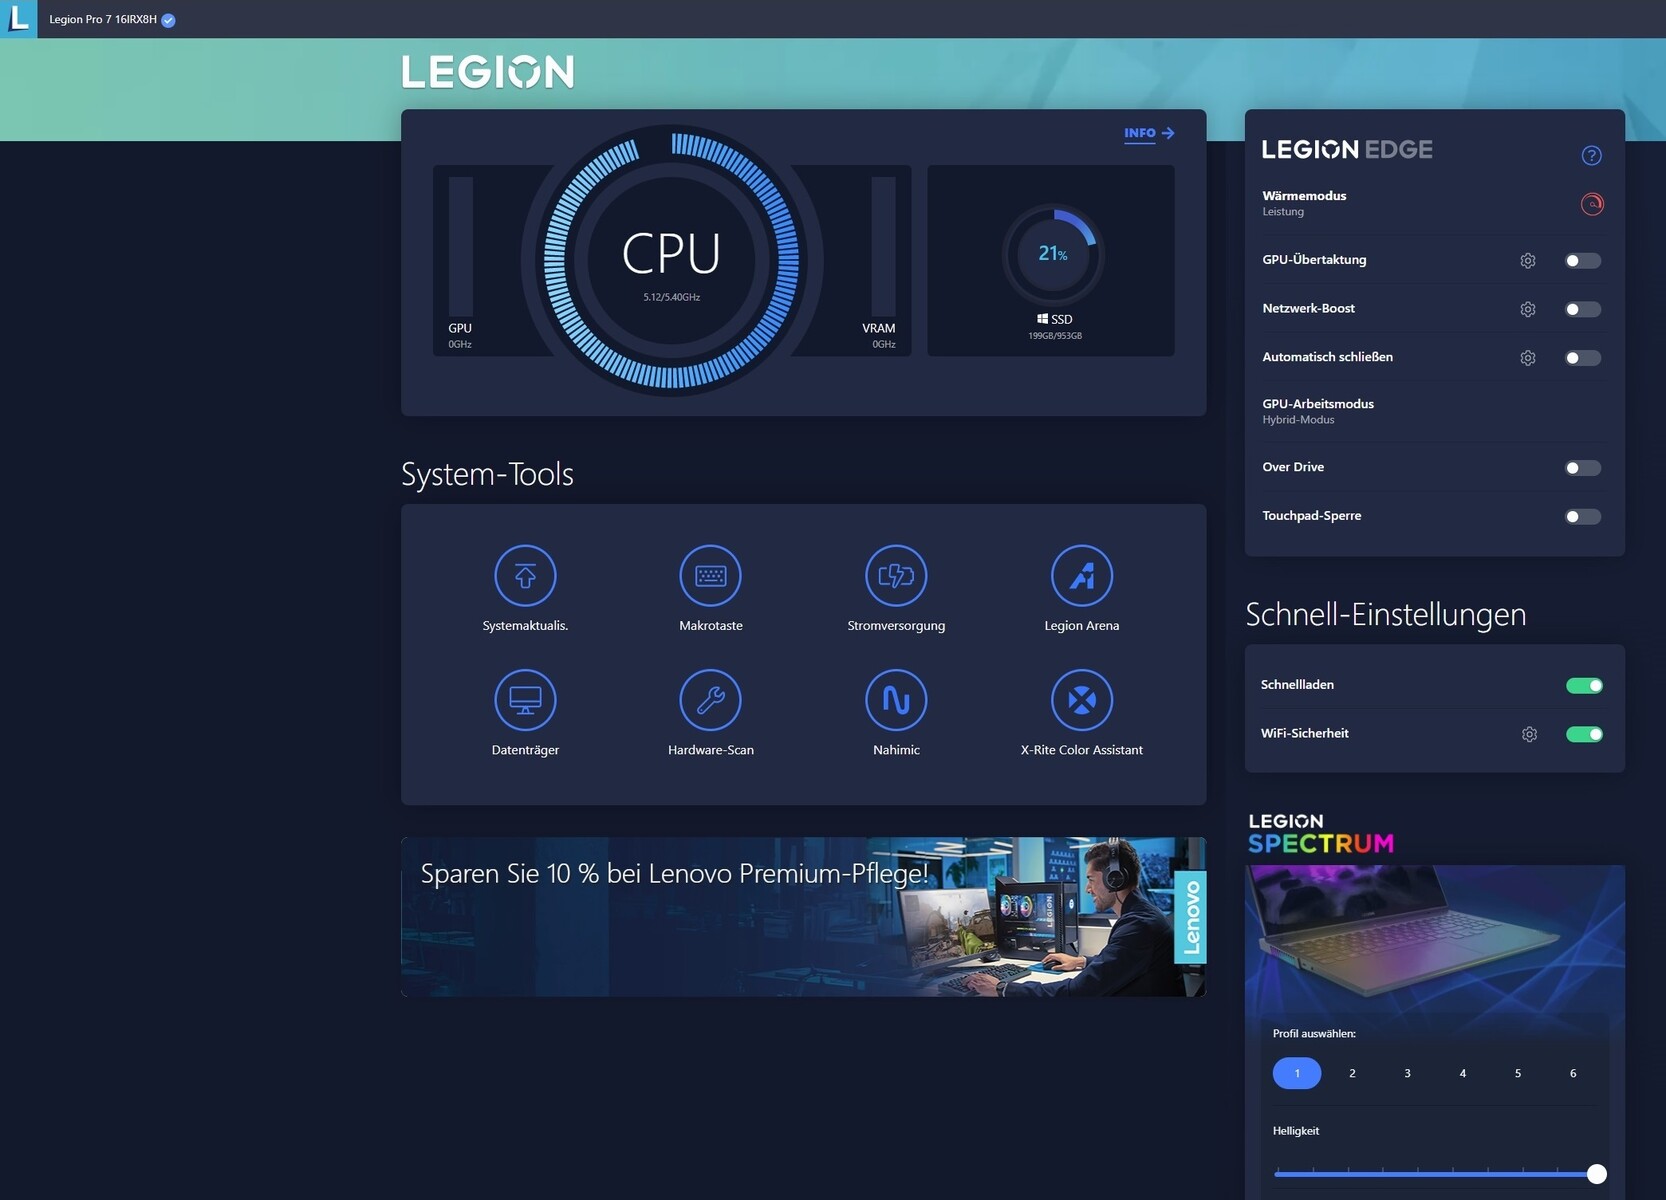
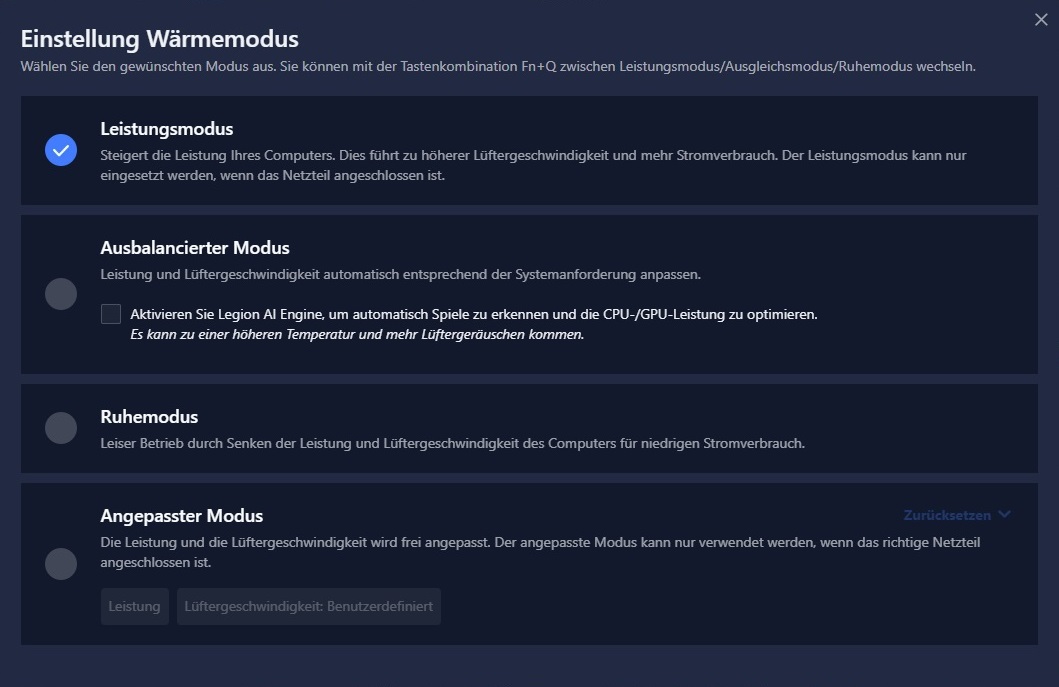
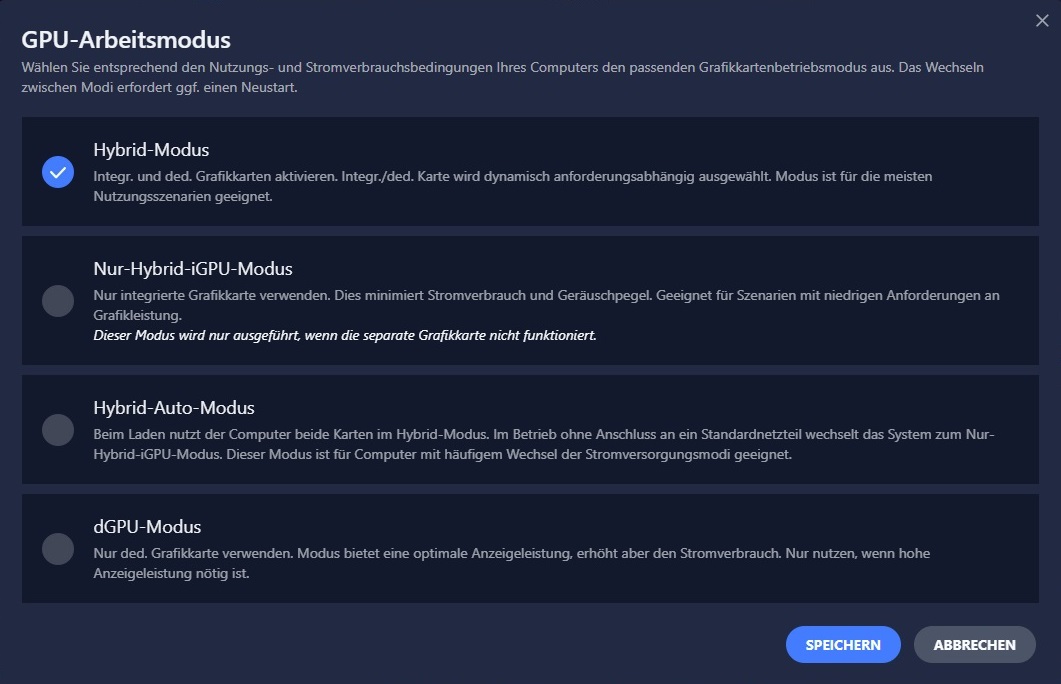
The Lenovo Vantage app comes preinstalled within which you can choose from several performance and GPU operating modes. You can also change performance modes via the shortcut Fn + Q.
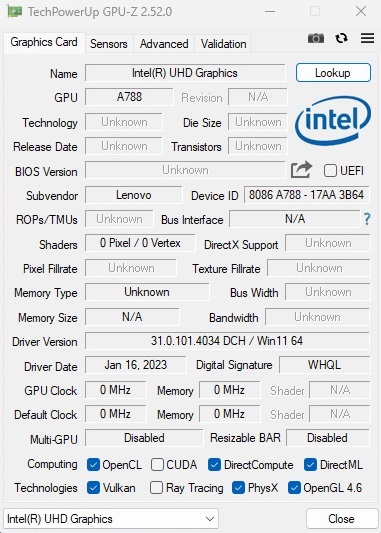
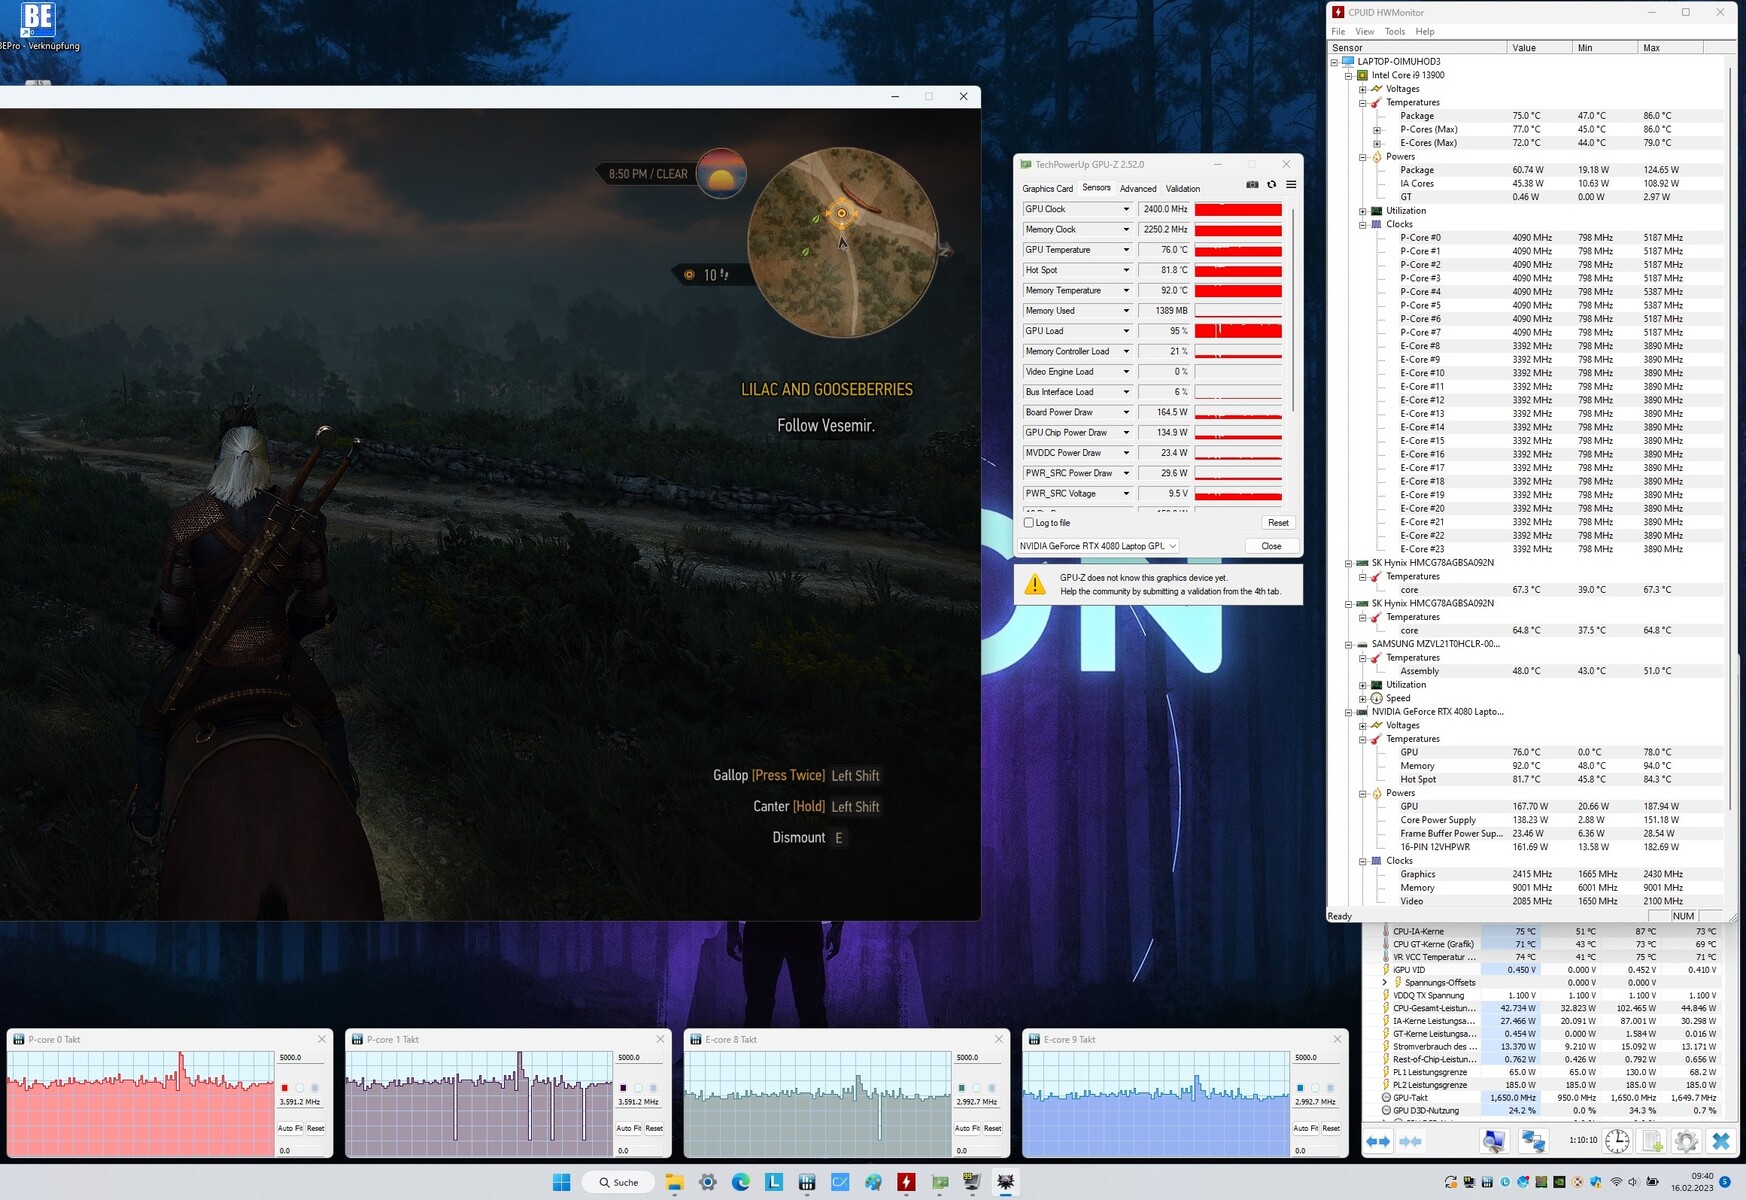
We used the Performance mode for all our measurements together with active graphics switching that dynamically switches between the iGPU and the dGPU. A pure dGPU mode is also available (check screenshots below).
The table below illustrates the effect of different performance modes on the PL1/PL2 values and fan noise.
| Silent | Balanced | Performance | |
| CPU PL1 (HWiNFO) | 55 W | 75 W | 130 W |
| CPU PL2 (HWiNFO) | 65 W | 119 W | 185 W |
| Noise (The Witcher 3) | 39 dB(A) | 43 - 46 dB(A) | 49 - 55 dB(A) |
| Performance (The Witcher 3) | 40 fps (Locked) | 150 fps | 180 fps |
Processor
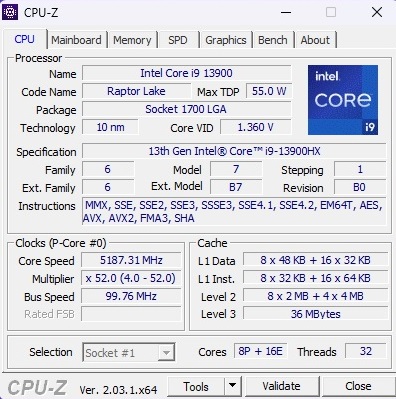
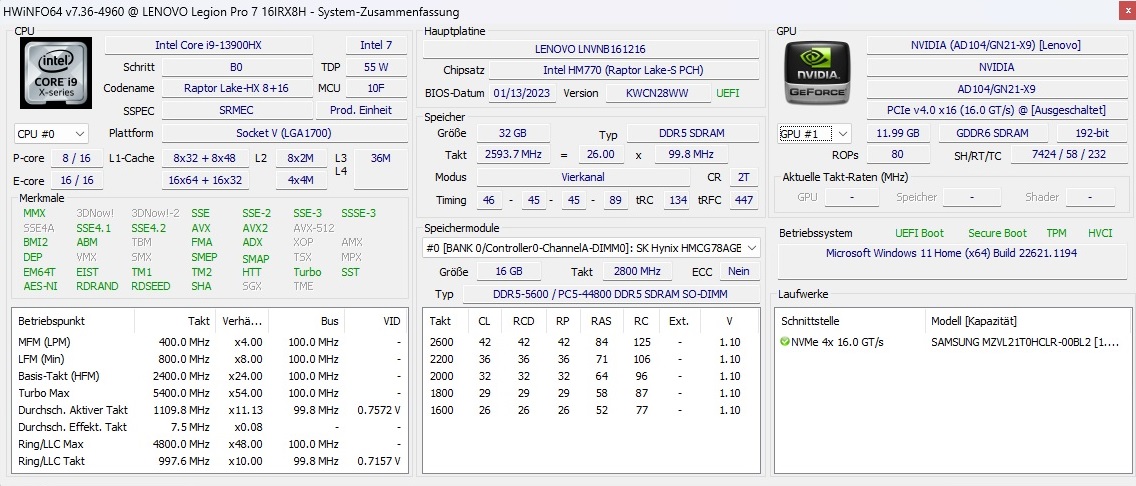
The Intel Core i9-13900HX is a performance monster. The 10 nm part offers eight performance cores with 2.2 GHz to 5.4 GHz clocks and hyperthreading support along with 16 efficiency cores clocked at 1.6 GHz to 3.9 GHz without hyperthreading, resulting in a total of 32 threads in parallel.
The lush 36 MB L3 cache and 55 W TDP further reaffirm that the Core i9-13900HX is a powerful chip.
Cinebench R15 Multi Dauertest
* ... smaller is better
AIDA64: FP32 Ray-Trace | FPU Julia | CPU SHA3 | CPU Queen | FPU SinJulia | FPU Mandel | CPU AES | CPU ZLib | FP64 Ray-Trace | CPU PhotoWorxx
| Performance Rating | |
| Lenovo Legion Pro 7 16IRX8H | |
| Razer Blade 16 Early 2023 | |
| Average Intel Core i9-13900HX | |
| Average of class Gaming | |
| Lenovo Legion 7 16ARHA7 | |
| Lenovo Legion 7 16ACHg6 | |
| Lenovo Legion 7 16IAX7-82TD004SGE | |
| AIDA64 / FP32 Ray-Trace | |
| Average of class Gaming (7192 - 85542, n=143, last 2 years) | |
| Lenovo Legion Pro 7 16IRX8H | |
| Razer Blade 16 Early 2023 | |
| Average Intel Core i9-13900HX (17589 - 27615, n=21) | |
| Lenovo Legion 7 16ARHA7 | |
| Lenovo Legion 7 16ACHg6 | |
| Lenovo Legion 7 16IAX7-82TD004SGE | |
| AIDA64 / FPU Julia | |
| Lenovo Legion Pro 7 16IRX8H | |
| Razer Blade 16 Early 2023 | |
| Average of class Gaming (35040 - 252486, n=143, last 2 years) | |
| Average Intel Core i9-13900HX (88686 - 137015, n=21) | |
| Lenovo Legion 7 16ARHA7 | |
| Lenovo Legion 7 16ACHg6 | |
| Lenovo Legion 7 16IAX7-82TD004SGE | |
| AIDA64 / CPU SHA3 | |
| Lenovo Legion Pro 7 16IRX8H | |
| Razer Blade 16 Early 2023 | |
| Average Intel Core i9-13900HX (4362 - 7029, n=21) | |
| Average of class Gaming (1728 - 10389, n=143, last 2 years) | |
| Lenovo Legion 7 16IAX7-82TD004SGE | |
| Lenovo Legion 7 16ARHA7 | |
| Lenovo Legion 7 16ACHg6 | |
| AIDA64 / CPU Queen | |
| Lenovo Legion Pro 7 16IRX8H | |
| Average Intel Core i9-13900HX (125644 - 141385, n=21) | |
| Razer Blade 16 Early 2023 | |
| Average of class Gaming (50699 - 200651, n=143, last 2 years) | |
| Lenovo Legion 7 16ARHA7 | |
| Lenovo Legion 7 16ACHg6 | |
| Lenovo Legion 7 16IAX7-82TD004SGE | |
| AIDA64 / FPU SinJulia | |
| Razer Blade 16 Early 2023 | |
| Lenovo Legion Pro 7 16IRX8H | |
| Average Intel Core i9-13900HX (12334 - 17179, n=21) | |
| Average of class Gaming (5020 - 33636, n=143, last 2 years) | |
| Lenovo Legion 7 16IAX7-82TD004SGE | |
| Lenovo Legion 7 16ARHA7 | |
| Lenovo Legion 7 16ACHg6 | |
| AIDA64 / FPU Mandel | |
| Lenovo Legion Pro 7 16IRX8H | |
| Average of class Gaming (17585 - 134044, n=143, last 2 years) | |
| Razer Blade 16 Early 2023 | |
| Average Intel Core i9-13900HX (43850 - 69202, n=21) | |
| Lenovo Legion 7 16ARHA7 | |
| Lenovo Legion 7 16ACHg6 | |
| Lenovo Legion 7 16IAX7-82TD004SGE | |
| AIDA64 / CPU AES | |
| Lenovo Legion 7 16ARHA7 | |
| Average Intel Core i9-13900HX (89413 - 237881, n=21) | |
| Lenovo Legion 7 16ACHg6 | |
| Lenovo Legion Pro 7 16IRX8H | |
| Razer Blade 16 Early 2023 | |
| Lenovo Legion 7 16IAX7-82TD004SGE | |
| Average of class Gaming (19065 - 328679, n=143, last 2 years) | |
| AIDA64 / CPU ZLib | |
| Lenovo Legion Pro 7 16IRX8H | |
| Razer Blade 16 Early 2023 | |
| Average Intel Core i9-13900HX (1284 - 1958, n=21) | |
| Average of class Gaming (373 - 2531, n=143, last 2 years) | |
| Lenovo Legion 7 16IAX7-82TD004SGE | |
| Lenovo Legion 7 16ARHA7 | |
| Lenovo Legion 7 16ACHg6 | |
| AIDA64 / FP64 Ray-Trace | |
| Lenovo Legion Pro 7 16IRX8H | |
| Average of class Gaming (3856 - 45446, n=143, last 2 years) | |
| Razer Blade 16 Early 2023 | |
| Average Intel Core i9-13900HX (9481 - 15279, n=21) | |
| Lenovo Legion 7 16ARHA7 | |
| Lenovo Legion 7 16ACHg6 | |
| Lenovo Legion 7 16IAX7-82TD004SGE | |
| AIDA64 / CPU PhotoWorxx | |
| Razer Blade 16 Early 2023 | |
| Lenovo Legion Pro 7 16IRX8H | |
| Average Intel Core i9-13900HX (42994 - 51994, n=21) | |
| Average of class Gaming (10805 - 62916, n=143, last 2 years) | |
| Lenovo Legion 7 16IAX7-82TD004SGE | |
| Lenovo Legion 7 16ARHA7 | |
| Lenovo Legion 7 16ACHg6 | |
System Performance
Overall system performance is neck-and-neck with that of the Blade 16. The Legion Pro 7 scores 7,830 points in PCMark 10, which is an excellent result that is 11% above the class average.
CrossMark: Overall | Productivity | Creativity | Responsiveness
| PCMark 10 / Score | |
| Lenovo Legion 7 16IAX7-82TD004SGE | |
| Average of class Gaming (5776 - 9852, n=130, last 2 years) | |
| Average Intel Core i9-13900HX, NVIDIA GeForce RTX 4080 Laptop GPU (7609 - 8549, n=3) | |
| Razer Blade 16 Early 2023 | |
| Lenovo Legion Pro 7 16IRX8H | |
| Lenovo Legion 7 16ARHA7 | |
| Lenovo Legion 7 16ACHg6 | |
| PCMark 10 / Essentials | |
| Lenovo Legion Pro 7 16IRX8H | |
| Average Intel Core i9-13900HX, NVIDIA GeForce RTX 4080 Laptop GPU (10982 - 11824, n=3) | |
| Lenovo Legion 7 16IAX7-82TD004SGE | |
| Razer Blade 16 Early 2023 | |
| Average of class Gaming (9057 - 12600, n=130, last 2 years) | |
| Lenovo Legion 7 16ARHA7 | |
| Lenovo Legion 7 16ACHg6 | |
| PCMark 10 / Productivity | |
| Lenovo Legion 7 16IAX7-82TD004SGE | |
| Lenovo Legion Pro 7 16IRX8H | |
| Average Intel Core i9-13900HX, NVIDIA GeForce RTX 4080 Laptop GPU (9976 - 10788, n=3) | |
| Average of class Gaming (6662 - 14612, n=130, last 2 years) | |
| Lenovo Legion 7 16ACHg6 | |
| Lenovo Legion 7 16ARHA7 | |
| Razer Blade 16 Early 2023 | |
| PCMark 10 / Digital Content Creation | |
| Razer Blade 16 Early 2023 | |
| Lenovo Legion 7 16IAX7-82TD004SGE | |
| Average of class Gaming (7440 - 19351, n=130, last 2 years) | |
| Average Intel Core i9-13900HX, NVIDIA GeForce RTX 4080 Laptop GPU (10135 - 14720, n=3) | |
| Lenovo Legion 7 16ARHA7 | |
| Lenovo Legion 7 16ACHg6 | |
| Lenovo Legion Pro 7 16IRX8H | |
| CrossMark / Overall | |
| Lenovo Legion 7 16IAX7-82TD004SGE | |
| Average Intel Core i9-13900HX, NVIDIA GeForce RTX 4080 Laptop GPU (1991 - 2194, n=2) | |
| Average of class Gaming (1247 - 2344, n=112, last 2 years) | |
| Lenovo Legion 7 16ARHA7 | |
| Razer Blade 16 Early 2023 | |
| CrossMark / Productivity | |
| Lenovo Legion 7 16IAX7-82TD004SGE | |
| Average Intel Core i9-13900HX, NVIDIA GeForce RTX 4080 Laptop GPU (1828 - 2059, n=2) | |
| Average of class Gaming (1299 - 2211, n=112, last 2 years) | |
| Lenovo Legion 7 16ARHA7 | |
| Razer Blade 16 Early 2023 | |
| CrossMark / Creativity | |
| Average Intel Core i9-13900HX, NVIDIA GeForce RTX 4080 Laptop GPU (2239 - 2411, n=2) | |
| Lenovo Legion 7 16IAX7-82TD004SGE | |
| Average of class Gaming (1275 - 2729, n=112, last 2 years) | |
| Razer Blade 16 Early 2023 | |
| Lenovo Legion 7 16ARHA7 | |
| CrossMark / Responsiveness | |
| Lenovo Legion 7 16IAX7-82TD004SGE | |
| Average Intel Core i9-13900HX, NVIDIA GeForce RTX 4080 Laptop GPU (1808 - 1998, n=2) | |
| Average of class Gaming (1030 - 2330, n=112, last 2 years) | |
| Razer Blade 16 Early 2023 | |
| Lenovo Legion 7 16ARHA7 | |
| PCMark 10 Score | 7830 points | |
Help | ||
| AIDA64 / Memory Copy | |
| Lenovo Legion Pro 7 16IRX8H | |
| Razer Blade 16 Early 2023 | |
| Average Intel Core i9-13900HX (67716 - 78835, n=21) | |
| Average of class Gaming (21750 - 97515, n=143, last 2 years) | |
| Lenovo Legion 7 16IAX7-82TD004SGE | |
| Lenovo Legion 7 16ARHA7 | |
| Lenovo Legion 7 16ACHg6 | |
| AIDA64 / Memory Read | |
| Lenovo Legion Pro 7 16IRX8H | |
| Razer Blade 16 Early 2023 | |
| Average Intel Core i9-13900HX (73998 - 88462, n=21) | |
| Average of class Gaming (22956 - 104349, n=143, last 2 years) | |
| Lenovo Legion 7 16IAX7-82TD004SGE | |
| Lenovo Legion 7 16ARHA7 | |
| Lenovo Legion 7 16ACHg6 | |
| AIDA64 / Memory Write | |
| Razer Blade 16 Early 2023 | |
| Average Intel Core i9-13900HX (65472 - 77045, n=21) | |
| Average of class Gaming (22297 - 133486, n=143, last 2 years) | |
| Lenovo Legion Pro 7 16IRX8H | |
| Lenovo Legion 7 16IAX7-82TD004SGE | |
| Lenovo Legion 7 16ARHA7 | |
| Lenovo Legion 7 16ACHg6 | |
| AIDA64 / Memory Latency | |
| Average of class Gaming (59.5 - 259, n=143, last 2 years) | |
| Razer Blade 16 Early 2023 | |
| Average Intel Core i9-13900HX (80.4 - 91.1, n=21) | |
| Lenovo Legion 7 16IAX7-82TD004SGE | |
| Lenovo Legion 7 16ARHA7 | |
| Lenovo Legion Pro 7 16IRX8H | |
| Lenovo Legion 7 16ACHg6 | |
* ... smaller is better
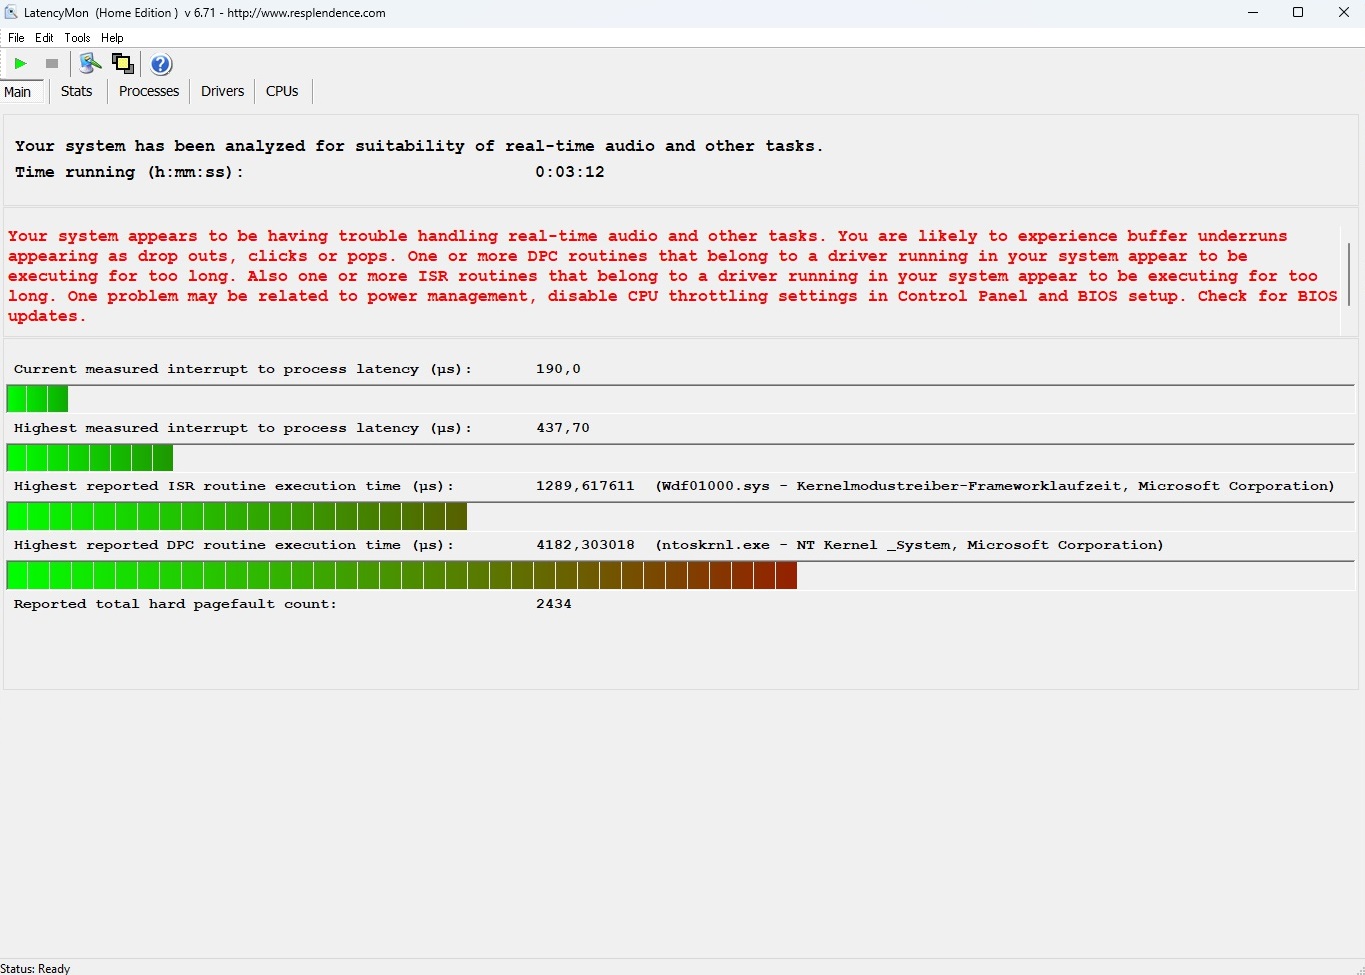
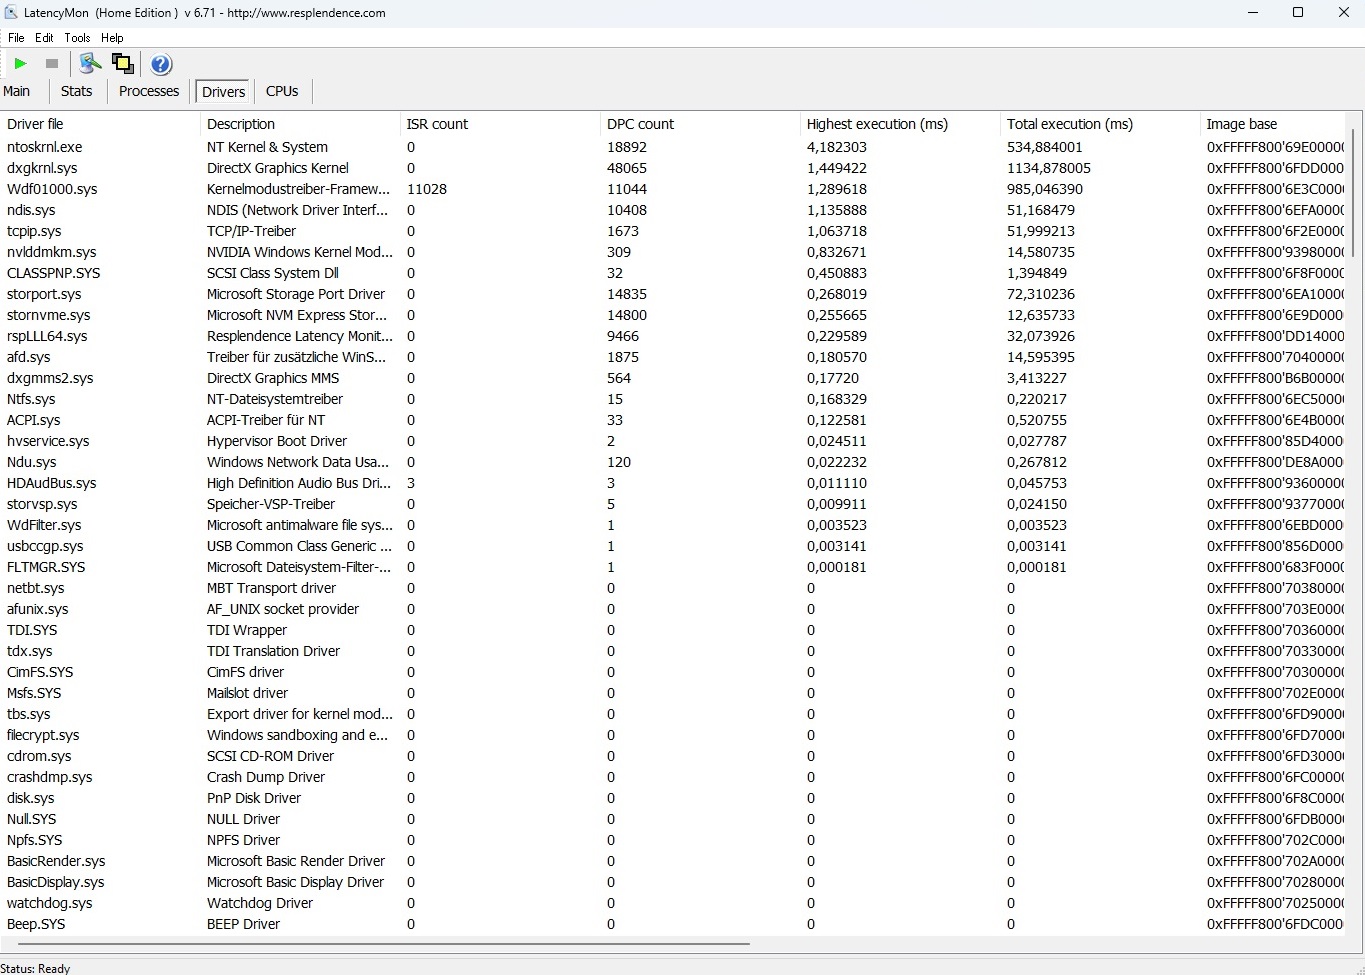
DPC Latency
The DPC Latency proves to be once again problematic, though this could only be relevant to a small subset of users. According to LatencyMon, the Legion Pro 7 is not ideal for real-time audio editing without further fine tuning.
| DPC Latencies / LatencyMon - interrupt to process latency (max), Web, Youtube, Prime95 | |
| Razer Blade 16 Early 2023 | |
| Lenovo Legion 7 16ARHA7 | |
| Lenovo Legion 7 16IAX7-82TD004SGE | |
| Lenovo Legion 7 16ACHg6 | |
| Lenovo Legion Pro 7 16IRX8H | |
* ... smaller is better
Storage Devices
The Legion Pro 7 scores well in the storage department. Our test model uses a fast Samsung PM9A1 1 TB NVMe SSD, which puts up a good show in our benchmarks. The drive achieves a sequential read speed of about 5,400 MB/s and sequential writes more than 4,000 MB/s.
However, our DiskSpd loop test proves strong performance fluctuations under continuous load. The competition does not seem to be affected by such heavy throttling.

* ... smaller is better
Disk Throttling: DiskSpd Read Loop, Queue Depth 8
GPU Performance
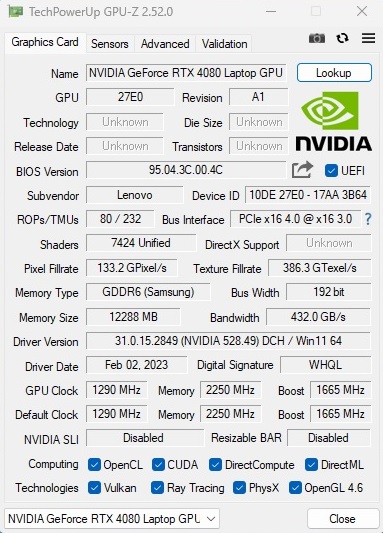
With a maximum TGP of 175 W including Dynamic Boost, the RTX 4080 Laptop GPU is probably the most exciting component in the Legion Pro 7 from a gamer's perspective. The specifications of this 4 nm part from Nvidia's Ada generation are impressive on paper.
A total of 7,424 CUDA cores promise excellent performance. However, 12 GB of GDDR6 VRAM on 192-bit memory interface does not inspire much in 2023 — 16 GB of VRAM would have been more apt considering the requirements of today's games and the high asking price. More information and performance analysis can be found in our dedicated Nvidia Ada RTX 40 GPU review analysis.
Despite not having particularly abundant VRAM, the RTX 4080 Laptop GPU wipes the floor with the AMD competition and its predecessors. Taking all 3DMark scores together, the RTX 4080 Laptop GPU is over 30% faster than the RTX 3080 Ti Laptop GPU and the RX 6850M XT from the previous generation Legions, which also operated at a high TGP.
| 3DMark 06 Standard Score | 59578 points | |
| 3DMark Vantage P Result | 111294 points | |
| 3DMark 11 Performance | 44468 points | |
| 3DMark Ice Storm Standard Score | 208555 points | |
| 3DMark Cloud Gate Standard Score | 66531 points | |
| 3DMark Fire Strike Score | 34434 points | |
| 3DMark Time Spy Score | 17928 points | |
Help | ||
* ... smaller is better
Gaming Performance
In gaming, the RTX 4080 Laptop GPU has an even higher advantage as seen in the cumulative performance rating, especially against the RTX 3080 Laptop GPU and the RX 6850M XT. The CPU does have an influence on the framerates at 1080p resolutions, though.
A more meaningful comparison is seen when raytracing is activated and at QHD and 4K resolutions. We chose modern titles such as Spider-Man Miles Morales, Resident Evil Village, and Guardians of the Galaxy to illustrate the RTX 4080 Laptop GPU's prowess at higher resolutions and settings.
On an average, the RTX 4080 Laptop GPU is about a third faster than a 175 RTX 3080 Ti Laptop GPU and about 60% faster than a 165 W RTX 3080 Laptop GPU in these tests.
Detailed performance comparisons are available in our extensive gaming benchmarks list.
| Performance Rating - Percent | |
| Razer Blade 16 Early 2023 | |
| Lenovo Legion Pro 7 16IRX8H | |
| Average of class Gaming | |
| Lenovo Legion 7 16IAX7-82TD004SGE | |
| Lenovo Legion 7 16ACHg6 | |
| Lenovo Legion 7 16ARHA7 | |
| The Witcher 3 - 1920x1080 Ultra Graphics & Postprocessing (HBAO+) | |
| Lenovo Legion Pro 7 16IRX8H | |
| Razer Blade 16 Early 2023 | |
| Average of class Gaming (18.4 - 224, n=82, last 2 years) | |
| Lenovo Legion 7 16ARHA7 | |
| Lenovo Legion 7 16IAX7-82TD004SGE | |
| Lenovo Legion 7 16ACHg6 | |
| GTA V - 1920x1080 Highest Settings possible AA:4xMSAA + FX AF:16x | |
| Lenovo Legion Pro 7 16IRX8H | |
| Razer Blade 16 Early 2023 | |
| Average of class Gaming (12.1 - 186.9, n=126, last 2 years) | |
| Lenovo Legion 7 16IAX7-82TD004SGE | |
| Lenovo Legion 7 16ACHg6 | |
| Lenovo Legion 7 16ARHA7 | |
| Final Fantasy XV Benchmark - 1920x1080 High Quality | |
| Lenovo Legion Pro 7 16IRX8H | |
| Razer Blade 16 Early 2023 | |
| Average of class Gaming (19.2 - 215, n=141, last 2 years) | |
| Lenovo Legion 7 16IAX7-82TD004SGE | |
| Lenovo Legion 7 16ARHA7 | |
| Lenovo Legion 7 16ACHg6 | |
| Strange Brigade - 1920x1080 ultra AA:ultra AF:16 | |
| Razer Blade 16 Early 2023 | |
| Lenovo Legion Pro 7 16IRX8H | |
| Average of class Gaming (38.9 - 456, n=131, last 2 years) | |
| Lenovo Legion 7 16ARHA7 | |
| Lenovo Legion 7 16ACHg6 | |
| Lenovo Legion 7 16IAX7-82TD004SGE | |
| Dota 2 Reborn - 1920x1080 ultra (3/3) best looking | |
| Razer Blade 16 Early 2023 | |
| Lenovo Legion Pro 7 16IRX8H | |
| Lenovo Legion 7 16IAX7-82TD004SGE | |
| Average of class Gaming (65.1 - 248, n=144, last 2 years) | |
| Lenovo Legion 7 16ACHg6 | |
| Lenovo Legion 7 16ARHA7 | |
| X-Plane 11.11 - 1920x1080 high (fps_test=3) | |
| Razer Blade 16 Early 2023 | |
| Lenovo Legion Pro 7 16IRX8H | |
| Lenovo Legion 7 16IAX7-82TD004SGE | |
| Average of class Gaming (33.4 - 166.2, n=146, last 2 years) | |
| Lenovo Legion 7 16ACHg6 | |
| Lenovo Legion 7 16ARHA7 | |
| Spider-Man Miles Morales | |
| 1920x0180 Very High Preset + Ray-Tracing AA:T | |
| Lenovo Legion Pro 7 16IRX8H | |
| Average NVIDIA GeForce RTX 4080 Laptop GPU (n=1) | |
| MSI Raider GE76 12UHS @175 W TGP | |
| XMG Neo 15 @165 W TGP | |
| Average of class Gaming (19.1 - 54.9, n=2, last 2 years) | |
| 2560x1440 Very High Preset AA:T | |
| Lenovo Legion Pro 7 16IRX8H | |
| Average NVIDIA GeForce RTX 4080 Laptop GPU (n=1) | |
| MSI Raider GE76 12UHS @175 W TGP | |
| Average of class Gaming (n=1last 2 years) | |
| XMG Neo 15 @165 W TGP | |
| 3840x2160 Very High Preset AA:T | |
| Lenovo Legion Pro 7 16IRX8H | |
| Average NVIDIA GeForce RTX 4080 Laptop GPU (n=1) | |
| MSI Raider GE76 12UHS @175 W TGP | |
| XMG Neo 15 @165 W TGP | |
| Resident Evil Village | |
| 1920x1080 Ray Tracing Preset | |
| Lenovo Legion Pro 7 16IRX8H | |
| Average NVIDIA GeForce RTX 4080 Laptop GPU (n=1) | |
| MSI GE76 Raider | |
| Lenovo Legion 7 16ACHg6 | |
| 2560x1440 Max Preset | |
| Lenovo Legion Pro 7 16IRX8H | |
| Average NVIDIA GeForce RTX 4080 Laptop GPU (n=1) | |
| MSI GE76 Raider | |
| Lenovo Legion 7 16ACHg6 | |
| 3840x2160 Max Preset | |
| Lenovo Legion Pro 7 16IRX8H | |
| Average NVIDIA GeForce RTX 4080 Laptop GPU (n=1) | |
| MSI GE76 Raider | |
| Guardians of the Galaxy | |
| 1920x1080 Ultra Preset + Ultra Ray-Tracing | |
| Lenovo Legion Pro 7 16IRX8H | |
| Average NVIDIA GeForce RTX 4080 Laptop GPU (n=1) | |
| MSI GE76 Raider | |
| XMG Neo 15 @165 W TGP | |
| 2560x1440 Ultra Preset | |
| Lenovo Legion Pro 7 16IRX8H | |
| Average NVIDIA GeForce RTX 4080 Laptop GPU (n=1) | |
| MSI GE76 Raider | |
| XMG Neo 15 @165 W TGP | |
| Lenovo Legion 7 16ARHA7 | |
| Average of class Gaming (n=1last 2 years) | |
| 3840x2160 Ultra Preset | |
| Lenovo Legion Pro 7 16IRX8H | |
| Average NVIDIA GeForce RTX 4080 Laptop GPU (n=1) | |
| MSI GE76 Raider | |
| XMG Neo 15 @165 W TGP | |
Unlike the SSD and, to a lesser extent, the CPU, the GPU remains relatively stable over a long period of time. We see no drastic frame rate drops or inconsistencies in the 60-minute stress with The Witcher 3 at 1080p Ultra.
The Witcher 3 FPS Chart
| low | med. | high | ultra | QHD | 4K | |
|---|---|---|---|---|---|---|
| GTA V (2015) | 187.6 | 185.1 | 145.5 | |||
| The Witcher 3 (2015) | 509 | 325 | 178 | |||
| Dota 2 Reborn (2015) | 206 | 194.4 | 179 | |||
| Final Fantasy XV Benchmark (2018) | 192.1 | 162.4 | ||||
| X-Plane 11.11 (2018) | 167.9 | 131.8 | ||||
| Far Cry 5 (2018) | 179 | 158 | 156 | |||
| Strange Brigade (2018) | 392 | 351 | 318 | |||
| Outriders (2021) | 157.7 | 151.1 | 149.9 | 130.5 | 72.3 | |
| Resident Evil Village (2021) | 239 | 239 | 239 | 193.7 | 100.5 | |
| Days Gone (2021) | 243 | 215 | 171.3 | 125.1 | 70.9 | |
| Deathloop (2021) | 130.5 | 129.4 | 123.5 | 112.8 | 60.7 | |
| Back 4 Blood (2021) | 345 | 295 | 276 | 188.4 | 112 | |
| Guardians of the Galaxy (2021) | 165 | 165 | 163 | 146 | 96 | |
| Riders Republic (2021) | 172 | 169 | 168 | 133 | 76 | |
| Farming Simulator 22 (2021) | 263 | 217 | 194.4 | 191.6 | 145.2 | |
| Halo Infinite (2021) | 239 | 209 | 197.5 | 150.7 | 88.6 | |
| God of War (2022) | 160.6 | 137.7 | 101.4 | 86.7 | 60 | |
| Rainbow Six Extraction (2022) | 278 | 272 | 221 | 172 | 88 | |
| Elden Ring (2022) | 59.9 | 59.8 | 59.8 | 59.6 | 59.3 | |
| Elex 2 (2022) | 118.7 | 118.7 | 118.5 | 114.5 | 63 | |
| Vampire Bloodhunt (2022) | 266 | 239 | 221 | 195.5 | 124.6 | |
| F1 22 (2022) | 247 | 222 | 101 | 72 | 38 | |
| The Quarry (2022) | 206 | 174.1 | 142 | 102.5 | 48.7 | |
| A Plague Tale Requiem (2022) | 110.9 | 97.7 | 86 | 63.4 | 36.1 | |
| Uncharted Legacy of Thieves Collection (2022) | 102.3 | 100.3 | 99.5 | 86.5 | 54.1 | |
| Call of Duty Modern Warfare 2 2022 (2022) | 182 | 149 | 140 | 104 | 67 | |
| Spider-Man Miles Morales (2022) | 115.2 | 103.3 | 101.3 | 94.8 | 68.5 | |
| Need for Speed Unbound (2022) | 101.2 | 94.7 | 83 | 79.7 | 63.6 | |
| High On Life (2023) | 214 | 162.8 | 148.4 | 100.6 | 42.6 | |
| The Witcher 3 v4 (2023) | 161.4 | 144 | 125.3 | 81.1 | 42.8 | |
| Dead Space Remake (2023) | 121.5 | 113.3 | 109.3 | 81.8 | 41.3 |
Emissions: Higher temp and noise emissions compared to the Blade 16
System Noise
Not surprisingly, the high-end components on offer have high heat emissions and consequently, high noise. While the Legion Pro 7 is still reasonably quiet in idle with an average sound pressure level (SPL) of 28 dB(A), things get disturbingly loud without a headset while gaming in Performance mode with the SPL ranging from 49 to 55 dB(A).
The Balanced mode, which does not cause much of a performance deficit, results in a more bearable 43 to 46 db(A) SPL. The Razer Blade 16 comparatively remains quieter in all test conditions despite its lower height and weight.
Noise Level
| Idle |
| 26 / 28 / 34 dB(A) |
| Load |
| 47 / 56 dB(A) |
 | ||
30 dB silent 40 dB(A) audible 50 dB(A) loud |
||
min: | ||
| Lenovo Legion Pro 7 16IRX8H i9-13900HX, NVIDIA GeForce RTX 4080 Laptop GPU | Razer Blade 16 Early 2023 i9-13950HX, NVIDIA GeForce RTX 4080 Laptop GPU | Lenovo Legion 7 16IAX7-82TD004SGE i9-12900HX, GeForce RTX 3080 Ti Laptop GPU | Lenovo Legion 7 16ACHg6 R9 5900HX, GeForce RTX 3080 Laptop GPU | Lenovo Legion 7 16ARHA7 R9 6900HX, Radeon RX 6850M XT | |
|---|---|---|---|---|---|
| Noise | 14% | 3% | 3% | 16% | |
| off / environment * | 24 | 23 4% | 24.5 -2% | 26 -8% | 22.8 5% |
| Idle Minimum * | 26 | 23 12% | 24.5 6% | 26 -0% | 23 12% |
| Idle Average * | 28 | 23 18% | 30 -7% | 30 -7% | 23 18% |
| Idle Maximum * | 34 | 23.6 31% | 32.5 4% | 35 -3% | 23 32% |
| Load Average * | 47 | 39 17% | 43.9 7% | 40 15% | 26.8 43% |
| Witcher 3 ultra * | 55 | 51.6 6% | 48.8 11% | 46 16% | 54.3 1% |
| Load Maximum * | 56 | 51.3 8% | 54.2 3% | 50 11% | 54.2 3% |
* ... smaller is better
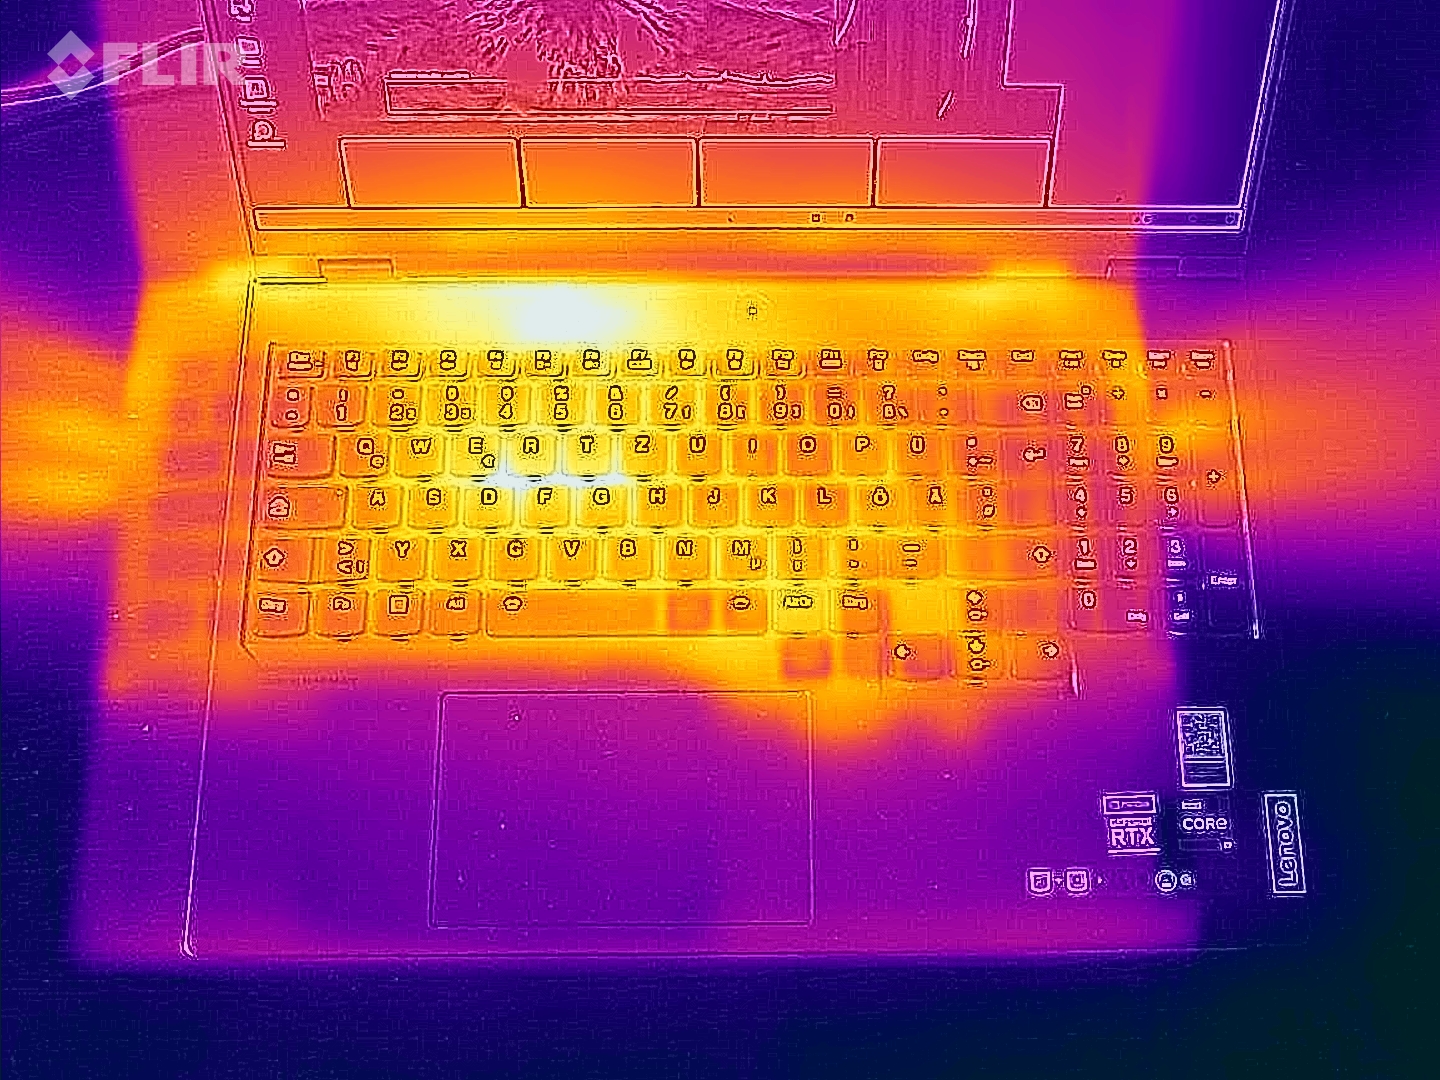
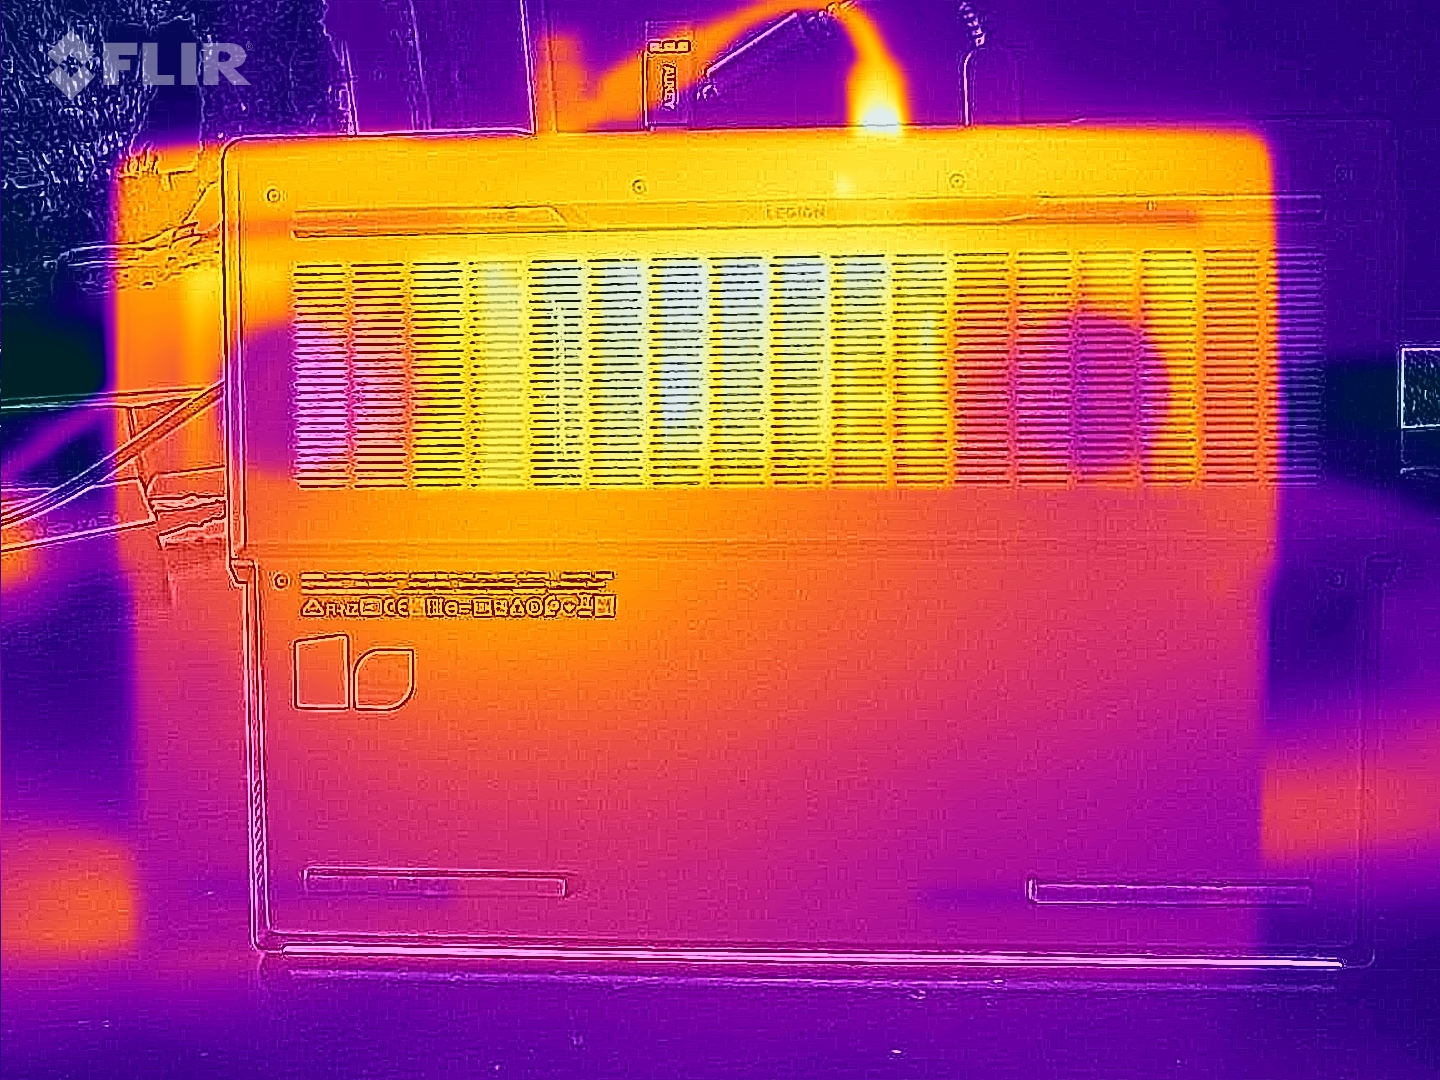
Temparature
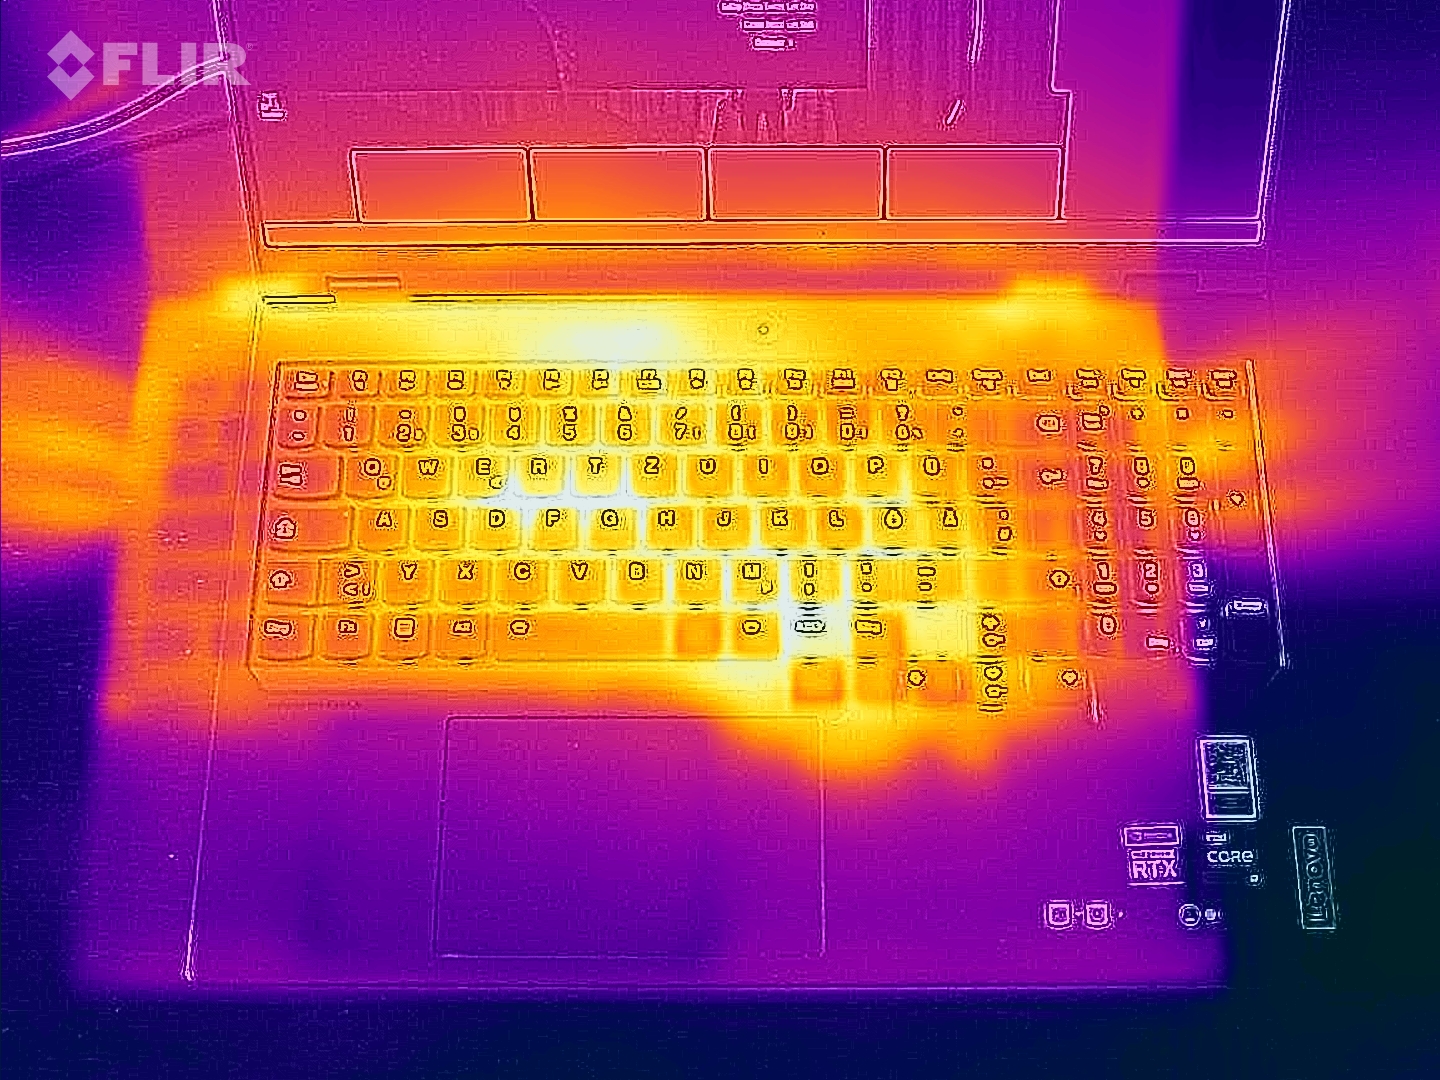
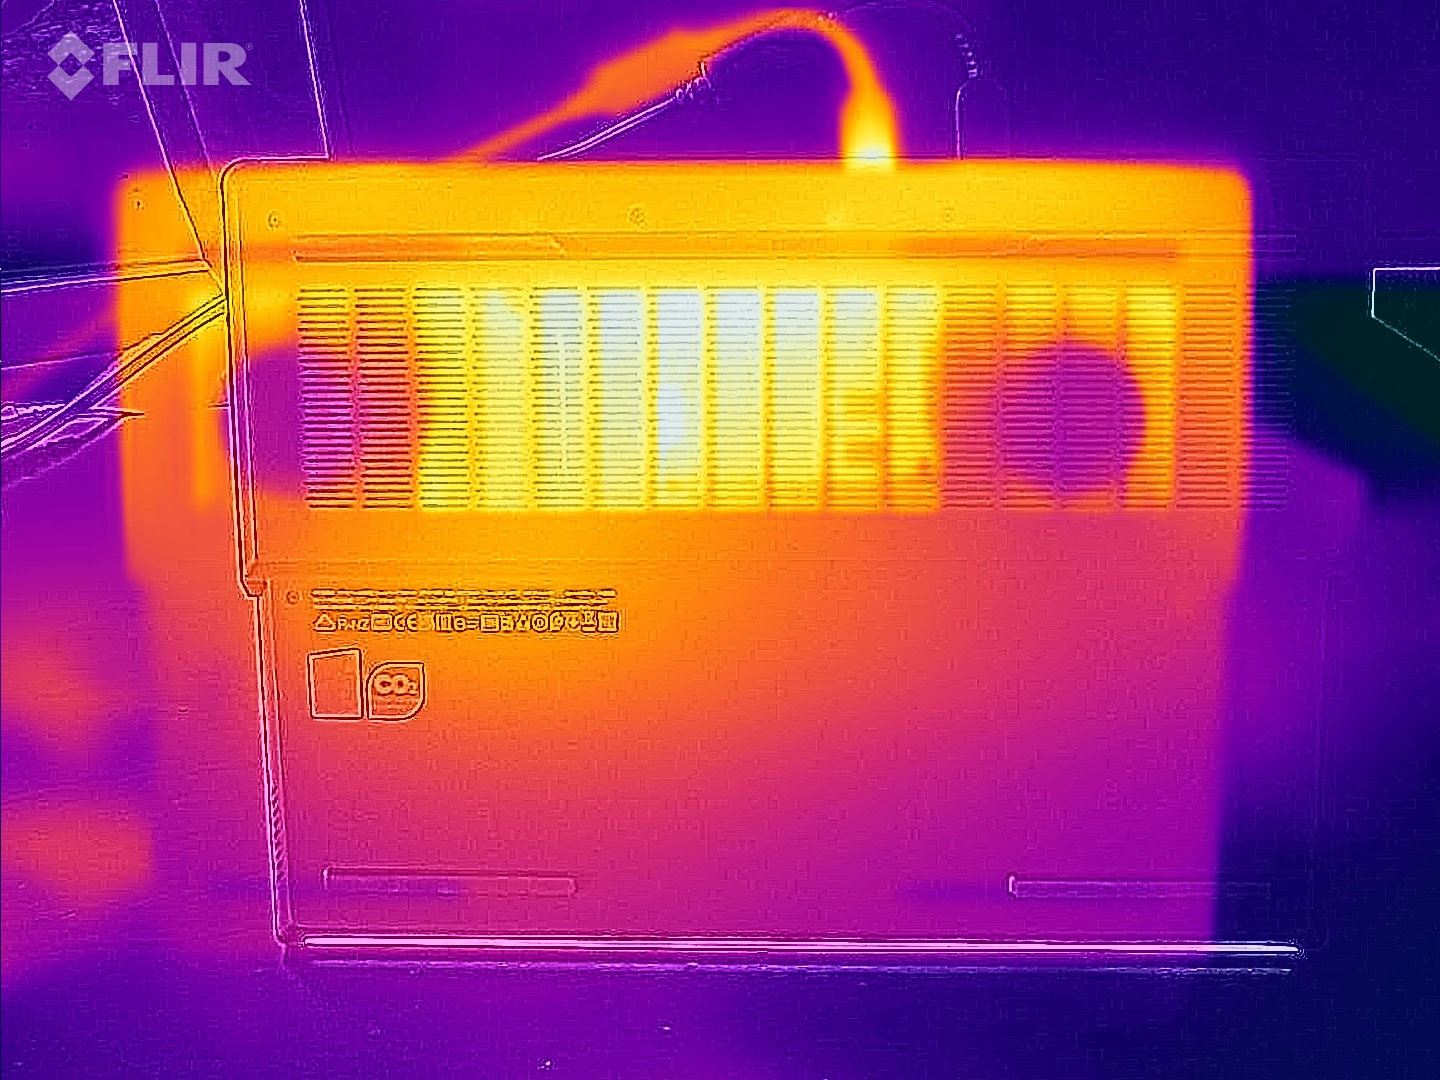
While stressing with The Witcher 3 at 1080p Ultra, the underside of the Legion Pro 7 crosses the 50 °C in some places, which means this is not suitable for gaming on the lap. In idle, the top warms up to 40 °C, which is relatively high.
Even when it comes to heat emissions, the Razer Blade 16 seems to be performing better than the Legion Pro 7.
(-) The maximum temperature on the upper side is 48 °C / 118 F, compared to the average of 40.5 °C / 105 F, ranging from 21.2 to 68.8 °C for the class Gaming.
(-) The bottom heats up to a maximum of 49 °C / 120 F, compared to the average of 43.3 °C / 110 F
(±) In idle usage, the average temperature for the upper side is 32.7 °C / 91 F, compared to the device average of 33.9 °C / 93 F.
(-) Playing The Witcher 3, the average temperature for the upper side is 43.3 °C / 110 F, compared to the device average of 33.9 °C / 93 F.
(-) The palmrests and touchpad can get very hot to the touch with a maximum of 42 °C / 107.6 F.
(-) The average temperature of the palmrest area of similar devices was 28.9 °C / 84 F (-13.1 °C / -23.6 F).
| Lenovo Legion Pro 7 16IRX8H i9-13900HX, NVIDIA GeForce RTX 4080 Laptop GPU | Razer Blade 16 Early 2023 i9-13950HX, NVIDIA GeForce RTX 4080 Laptop GPU | Lenovo Legion 7 16IAX7-82TD004SGE i9-12900HX, GeForce RTX 3080 Ti Laptop GPU | Lenovo Legion 7 16ACHg6 R9 5900HX, GeForce RTX 3080 Laptop GPU | Lenovo Legion 7 16ARHA7 R9 6900HX, Radeon RX 6850M XT | |
|---|---|---|---|---|---|
| Heat | 16% | -5% | -5% | 13% | |
| Maximum Upper Side * | 48 | 40 17% | 44.4 7% | 51 -6% | 37.2 22% |
| Maximum Bottom * | 49 | 37.6 23% | 60.8 -24% | 52 -6% | 43 12% |
| Idle Upper Side * | 40 | 32.4 19% | 33.8 15% | 37 7% | 34 15% |
| Idle Bottom * | 33 | 31.4 5% | 38.8 -18% | 38 -15% | 32.8 1% |
* ... smaller is better
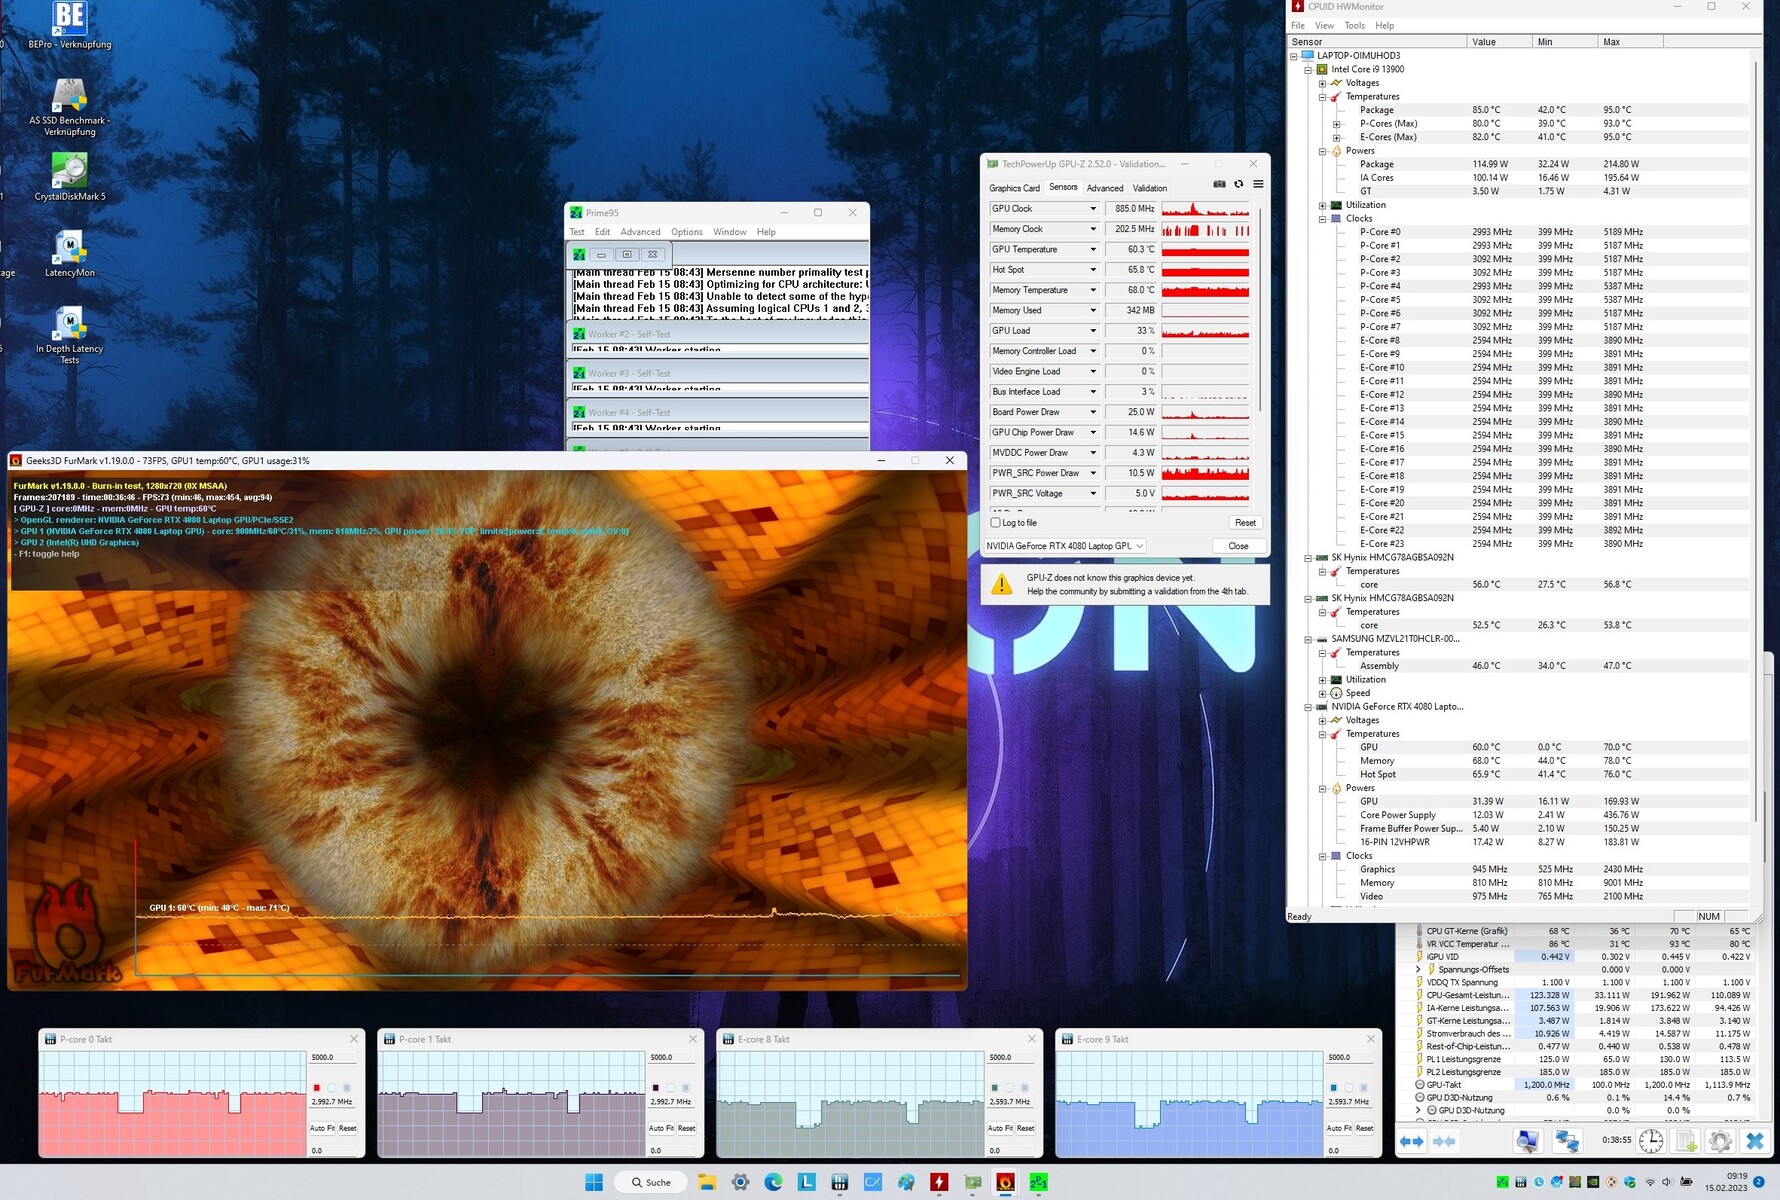
Stress test
A combined stress test with FurMark and Prime95 is not very helpful as the GPU shows throttling. During The Witcher 3 stress, the CPU and GPU heat up to an average of 75 °C, which is not problematic.
Speakers
A highlight of the Legion Pro 7 is Lenovo's collaboration with Harman that results in good-sounding speakers. Our audio analysis does not show any glaring weaknesses in any frequency range, which is a rarity in notebooks — the Blade 16 has to make do with weaker bass, for example.
External speakers or a headset are not absolutely necessary given the high maximum volume level of 82 dB(A).
Lenovo Legion Pro 7 16IRX8H audio analysis
(+) | speakers can play relatively loud (82 dB)
Bass 100 - 315 Hz
(±) | reduced bass - on average 8.9% lower than median
(+) | bass is linear (6.4% delta to prev. frequency)
Mids 400 - 2000 Hz
(+) | balanced mids - only 2.8% away from median
(+) | mids are linear (4.2% delta to prev. frequency)
Highs 2 - 16 kHz
(+) | balanced highs - only 2.5% away from median
(+) | highs are linear (6% delta to prev. frequency)
Overall 100 - 16.000 Hz
(+) | overall sound is linear (9.4% difference to median)
Compared to same class
» 3% of all tested devices in this class were better, 2% similar, 95% worse
» The best had a delta of 6%, average was 18%, worst was 132%
Compared to all devices tested
» 3% of all tested devices were better, 1% similar, 96% worse
» The best had a delta of 4%, average was 24%, worst was 134%
Razer Blade 16 Early 2023 audio analysis
(+) | speakers can play relatively loud (88.2 dB)
Bass 100 - 315 Hz
(-) | nearly no bass - on average 16.4% lower than median
(±) | linearity of bass is average (10.8% delta to prev. frequency)
Mids 400 - 2000 Hz
(+) | balanced mids - only 2.5% away from median
(+) | mids are linear (2.4% delta to prev. frequency)
Highs 2 - 16 kHz
(+) | balanced highs - only 4.9% away from median
(±) | linearity of highs is average (7.9% delta to prev. frequency)
Overall 100 - 16.000 Hz
(+) | overall sound is linear (12.6% difference to median)
Compared to same class
» 15% of all tested devices in this class were better, 3% similar, 81% worse
» The best had a delta of 6%, average was 18%, worst was 132%
Compared to all devices tested
» 10% of all tested devices were better, 2% similar, 87% worse
» The best had a delta of 4%, average was 24%, worst was 134%
Energy management: High consumption even in idle
Power consumption
As is the case with high-end gaming laptops, the Legion Pro 7 has a high power requirement despite graphics switching even in idle mode. With 18 to 32 W (including short load peaks) consumption in idle, the Legion Pro 7 is nearly 20% above the class average.
We record a consumption of 130 W from the wall under average load (3DMark06) and 320 W under maximum stress. During gaming, you can expect the consumption to hit about 260 W, which is slightly more than that of the Blade 16 (242 W).
| Off / Standby | |
| Idle | |
| Load |
|
Key:
min: | |
| Lenovo Legion Pro 7 16IRX8H i9-13900HX, NVIDIA GeForce RTX 4080 Laptop GPU | Razer Blade 16 Early 2023 i9-13950HX, NVIDIA GeForce RTX 4080 Laptop GPU | Lenovo Legion 7 16IAX7-82TD004SGE i9-12900HX, GeForce RTX 3080 Ti Laptop GPU | Lenovo Legion 7 16ACHg6 R9 5900HX, GeForce RTX 3080 Laptop GPU | Lenovo Legion 7 16ARHA7 R9 6900HX, Radeon RX 6850M XT | Average of class Gaming | |
|---|---|---|---|---|---|---|
| Power Consumption | -1% | 1% | -14% | 21% | 18% | |
| Idle Minimum * | 18 | 15.2 16% | 19.2 -7% | 31 -72% | 9.9 45% | 14.2 ? 21% |
| Idle Average * | 24 | 22.8 5% | 25.1 -5% | 33 -38% | 22 8% | 20.2 ? 16% |
| Idle Maximum * | 32 | 49.8 -56% | 27.1 15% | 46 -44% | 23.1 28% | 27.2 ? 15% |
| Load Average * | 130 | 121.2 7% | 132 -2% | 110 15% | 94.4 27% | 107.7 ? 17% |
| Witcher 3 ultra * | 260 | 242 7% | 253 3% | 180 31% | 249 4% | |
| Load Maximum * | 320 | 273.7 14% | 308.9 3% | 235 27% | 276 14% | 260 ? 19% |
* ... smaller is better
Power consumption: The Witcher 3 / Stress test
Power consumption: External Monitor
Battery life
Lenovo equips the Legion Pro 7 with a powerful 99 WHr battery, which can only be somewhat useful due to the suboptimal energy management. Up to 6.5 hours of run time is possible in idle with no other task running and at minimum brightness. This is a modest result compared to the Blade 16's 9.5 hours.
In everyday use, such as internet surfing over Wi-Fi at a reduced brightness of 150 nits, we could manage to get 5 hours of run time.
| Lenovo Legion Pro 7 16IRX8H i9-13900HX, NVIDIA GeForce RTX 4080 Laptop GPU, 99.9 Wh | Razer Blade 16 Early 2023 i9-13950HX, NVIDIA GeForce RTX 4080 Laptop GPU, 95.2 Wh | Lenovo Legion 7 16IAX7-82TD004SGE i9-12900HX, GeForce RTX 3080 Ti Laptop GPU, 99 Wh | Lenovo Legion 7 16ACHg6 R9 5900HX, GeForce RTX 3080 Laptop GPU, 80 Wh | Lenovo Legion 7 16ARHA7 R9 6900HX, Radeon RX 6850M XT, 99 Wh | Average of class Gaming | |
|---|---|---|---|---|---|---|
| Battery Runtime | 8% | -40% | 13% | 3% | 15% | |
| Reader / Idle | 385 | 533 38% | 494 28% | 293 -24% | 570 ? 48% | |
| WiFi v1.3 | 303 | 365 20% | 267 -12% | 410 35% | 436 44% | 387 ? 28% |
| Load | 124 | 81 -35% | 40 -68% | 93 -25% | 110 -11% | 85.8 ? -31% |
| H.264 | 306 | 406 | 457 ? | |||
| Witcher 3 ultra | 55 | 69.5 ? |
Pros
Cons
Verdict: An impressive gaming powerhouse
Passionate gamers who want to play demanding modern titles with maximum details and don't mind spending the moolah will find the Lenovo Legion 7 Pro 16IRX8H to be the right choice.
The combination of a Core i9-13900HX and GeForce RTX 4080 offers an impressive level of performance that can easily yield 40 or even 60 fps in most modern games at 4K Ultra
The bright, sharp, and color-accurate 16:10 QHD 240 Hz display makes for an immersive viewing experience. The hardware is housed in a stylish chassis that feels premium and scores well in terms of workmanship and stability. Other aspects such as sound quality, input devices, and connectivity also seem to be near-perfect.
However, prospective buyers of the Lenovo Legion 7 Pro 16IRX8H will have to keep in mind the high emissions. The 16-inch laptop gets quite warm under load unless the Silent profile is selected — we find the Balanced profile to be the best compromise between performance and emissions for everyday use. We would have also liked to see longer run times with from the 99 WHr battery.
One of the top competitors for the new Lenovo Legion 7 Pro is the Razer Blade 16, which actually is quieter and cooler while offering similar levels of performance. Additionally, the Blade 16 is somewhat ligther and thinner as well in comparison.
That being said, the Lenovo Legion 7 Pro 16IRX8H impresses overall, and appropriately deserves our "Very Good" rating.
Pricing and availability
The tested Lenovo Legion Pro 7 16IRX8H is available at campuspoint.de for €3,599. (RRP: €3,999).
Lenovo Legion Pro 7 16IRX8H
- 02/21/2023 v7 (old)
Florian Glaser
More articles related to this device
Lenovo Legion Pro 7 16IRX8H (Legion Pro 7 Series)Related Articles


Transparency
The selection of devices to be reviewed is made by our editorial team. The test sample was provided to the author as a loan by the manufacturer or retailer for the purpose of this review. The lender had no influence on this review, nor did the manufacturer receive a copy of this review before publication. There was no obligation to publish this review. We never accept compensation or payment in return for our reviews. As an independent media company, Notebookcheck is not subjected to the authority of manufacturers, retailers or publishers.
This is how Notebookcheck is testing
Every year, Notebookcheck independently reviews hundreds of laptops and smartphones using standardized procedures to ensure that all results are comparable. We have continuously developed our test methods for around 20 years and set industry standards in the process. In our test labs, high-quality measuring equipment is utilized by experienced technicians and editors. These tests involve a multi-stage validation process. Our complex rating system is based on hundreds of well-founded measurements and benchmarks, which maintains objectivity. Further information on our test methods can be found here.
Price comparison

