

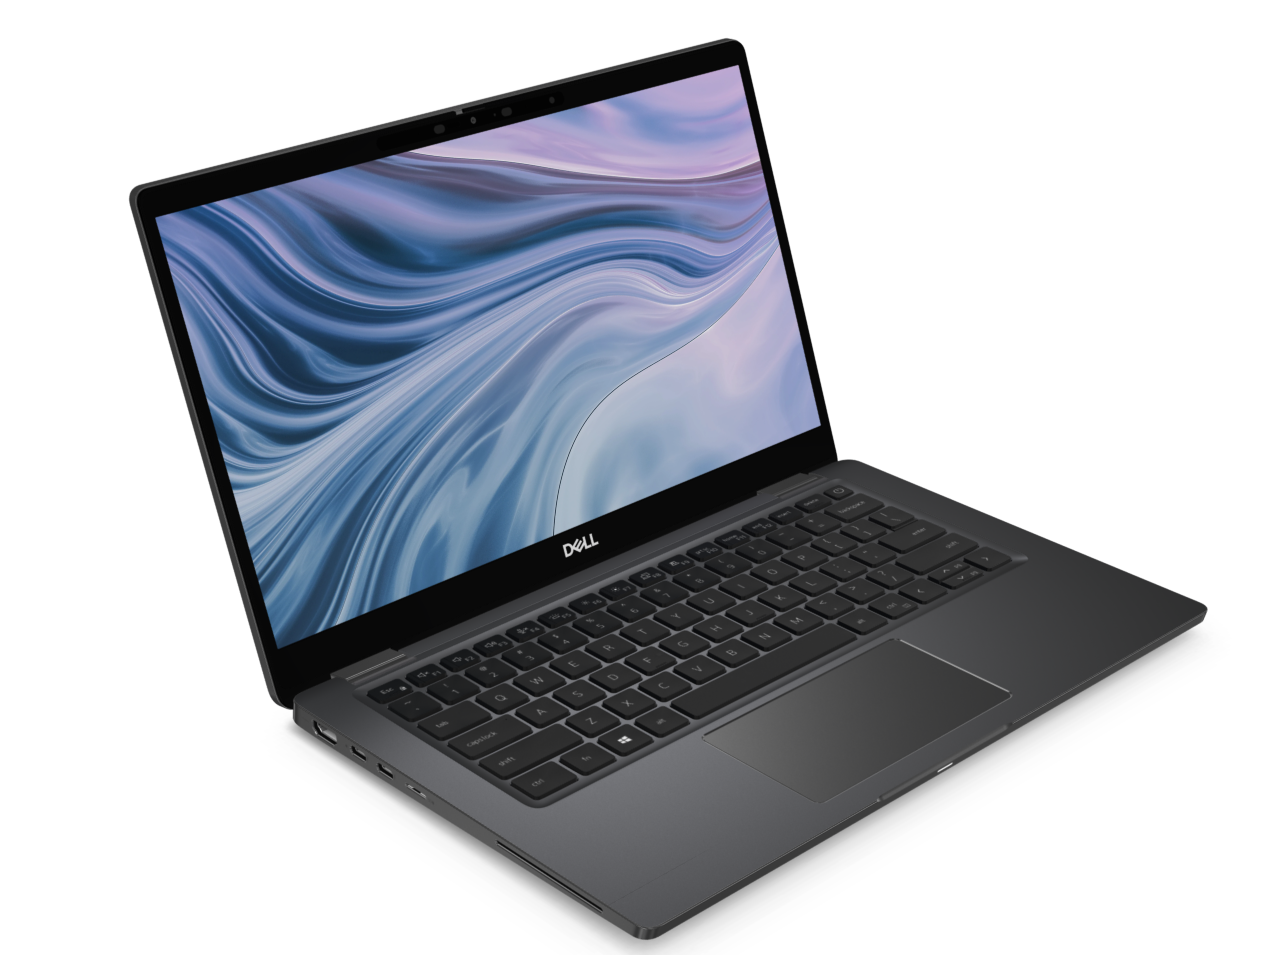
Dell Latitude 7310 Core i7 Laptop Review: Better Looks, Same Performance
The Dell Latitude 7310 succeeds last year's Latitude 7300 by revamping the entire chassis for a newer and sleeker look. It's essentially the 13.3-inch version of the 14-inch Latitude 7410 as these two systems share similar features and internal hardware.
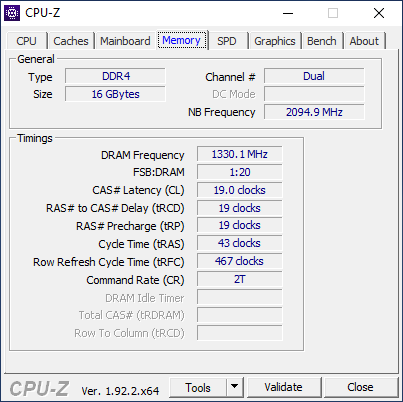
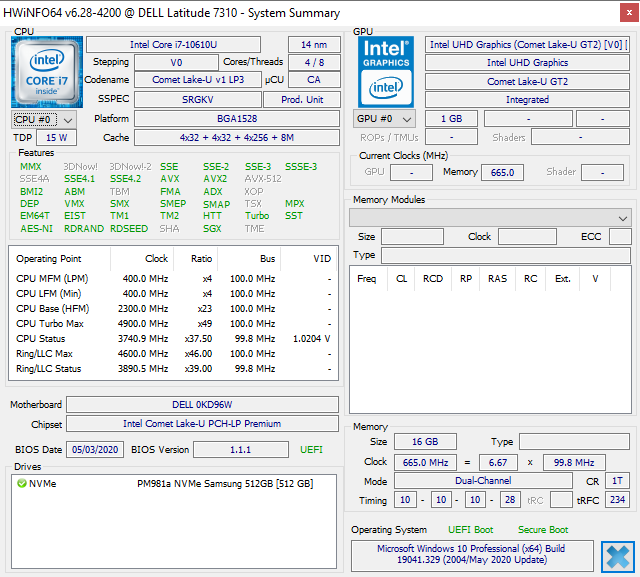
Current SKUs range from the 10th gen Comet Lake-U Core i5-10210U CPU with 8 GB RAM, 128 GB SSD, and 768p display for $1500 USD up to the Core i7-10610U with 32 GB RAM, 1 TB SSD, and 1080p display for over $3000 USD. The system also comes in a convertible variant called the Latitude 7310 2-in-1. The unit we have in review is a higher-end clamshell configuration with the Core i7-10610U, 16 GB of RAM, 512 GB SSD and 1080p display for approximately $2300 USD.
Competitors to the Latitude 7310 include other high-end business subnotebooks like the Lenovo ThinkPad X390/X395, HP EliteBook 735, Dynabook Portege X30L-G, or the consumer-hybrid Surface Laptop 3 or ThinkBook series.
More Dell reviews:
Rating | Date | Model | Weight | Height | Size | Resolution | Price |
|---|---|---|---|---|---|---|---|
| 89.4 % v7 (old) | 07 / 2020 | Dell Latitude 7310 i7-10610U, UHD Graphics 620 | 1.2 kg | 18.3 mm | 13.30" | 1920x1080 | |
| 88.8 % v7 (old) | 10 / 2019 | Lenovo ThinkPad X395 R3 PRO 3300U, Vega 6 | 1.3 kg | 16.9 mm | 13.30" | 1920x1080 | |
| 86 % v7 (old) | 06 / 2020 | HP EliteBook 735 G6 7KN29EA R5 PRO 3500U, Vega 8 | 1.5 kg | 17.7 mm | 13.30" | 1920x1080 | |
| 92.1 % v7 (old) | 06 / 2020 | Apple MacBook Pro 13 2020 2GHz i5 10th-Gen i5-1038NG7, Iris Plus Graphics G7 (Ice Lake 64 EU) | 1.4 kg | 15.6 mm | 13.30" | 2560x1600 | |
| 82.6 % v7 (old) | 07 / 2020 | HP ProBook 455 G7-175W8EA R7 4700U, Vega 7 | 1.8 kg | 19 mm | 15.60" | 1920x1080 |
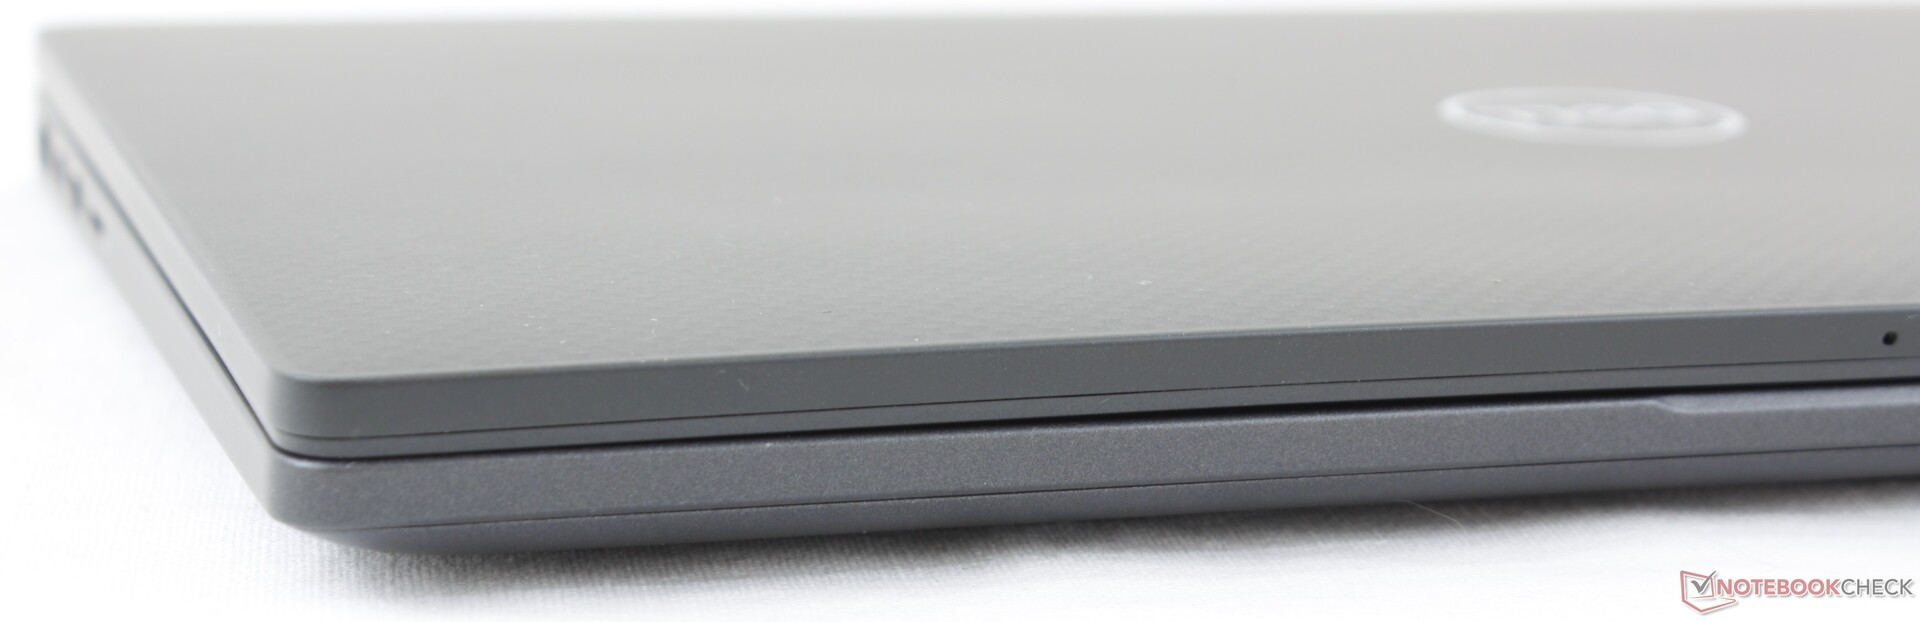
Case
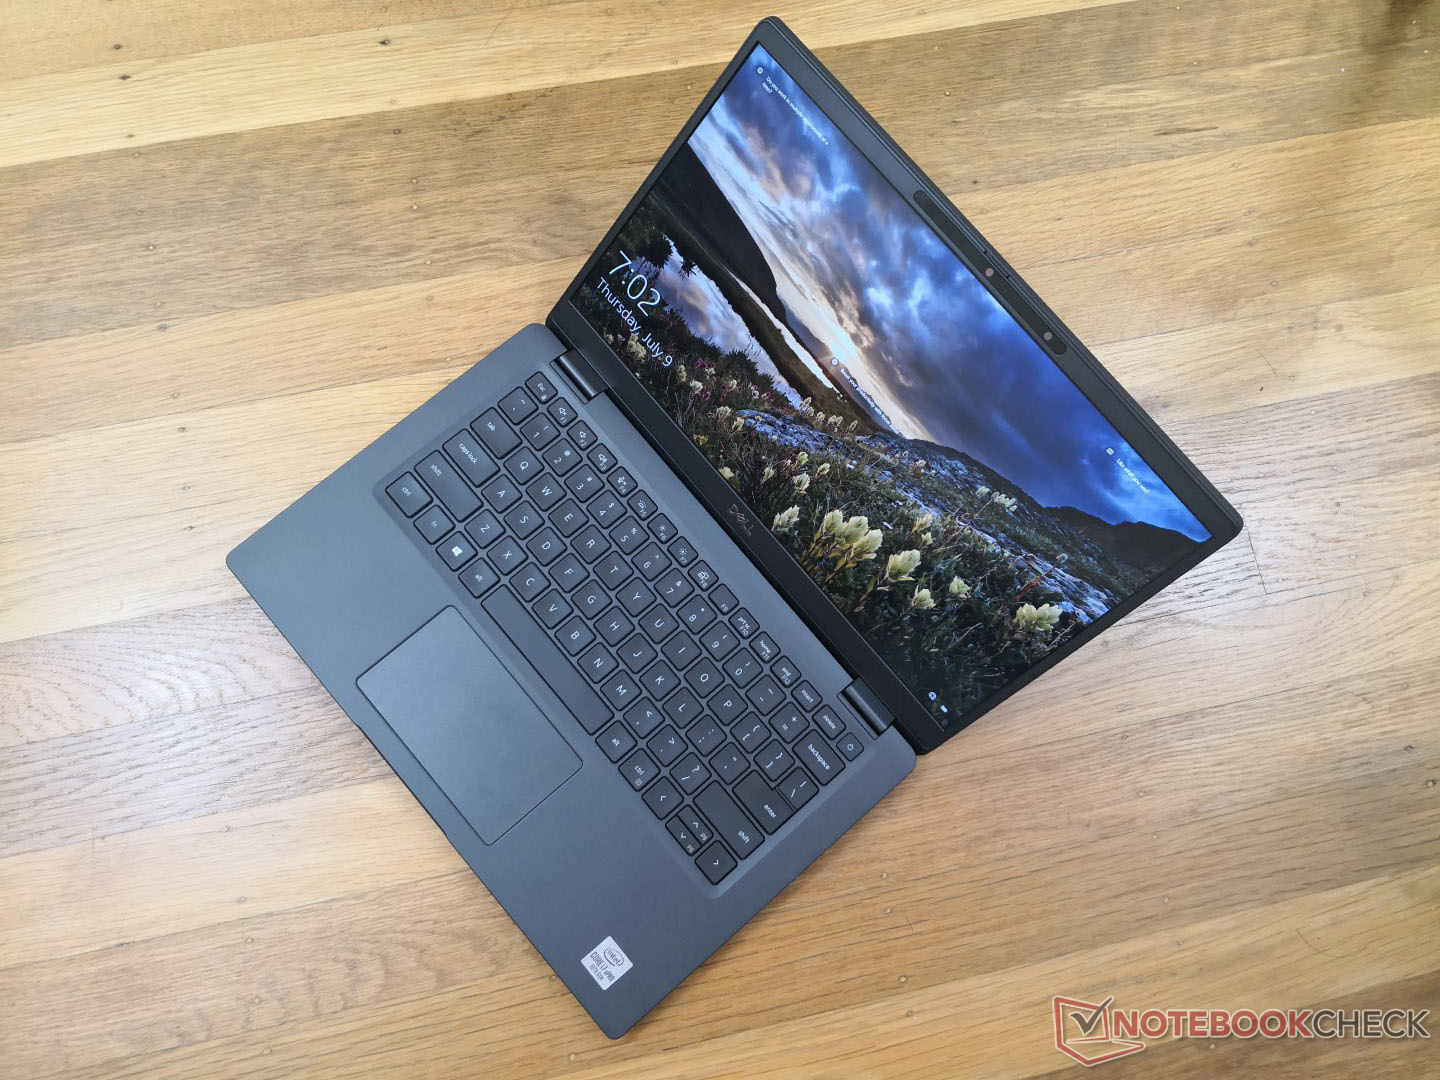
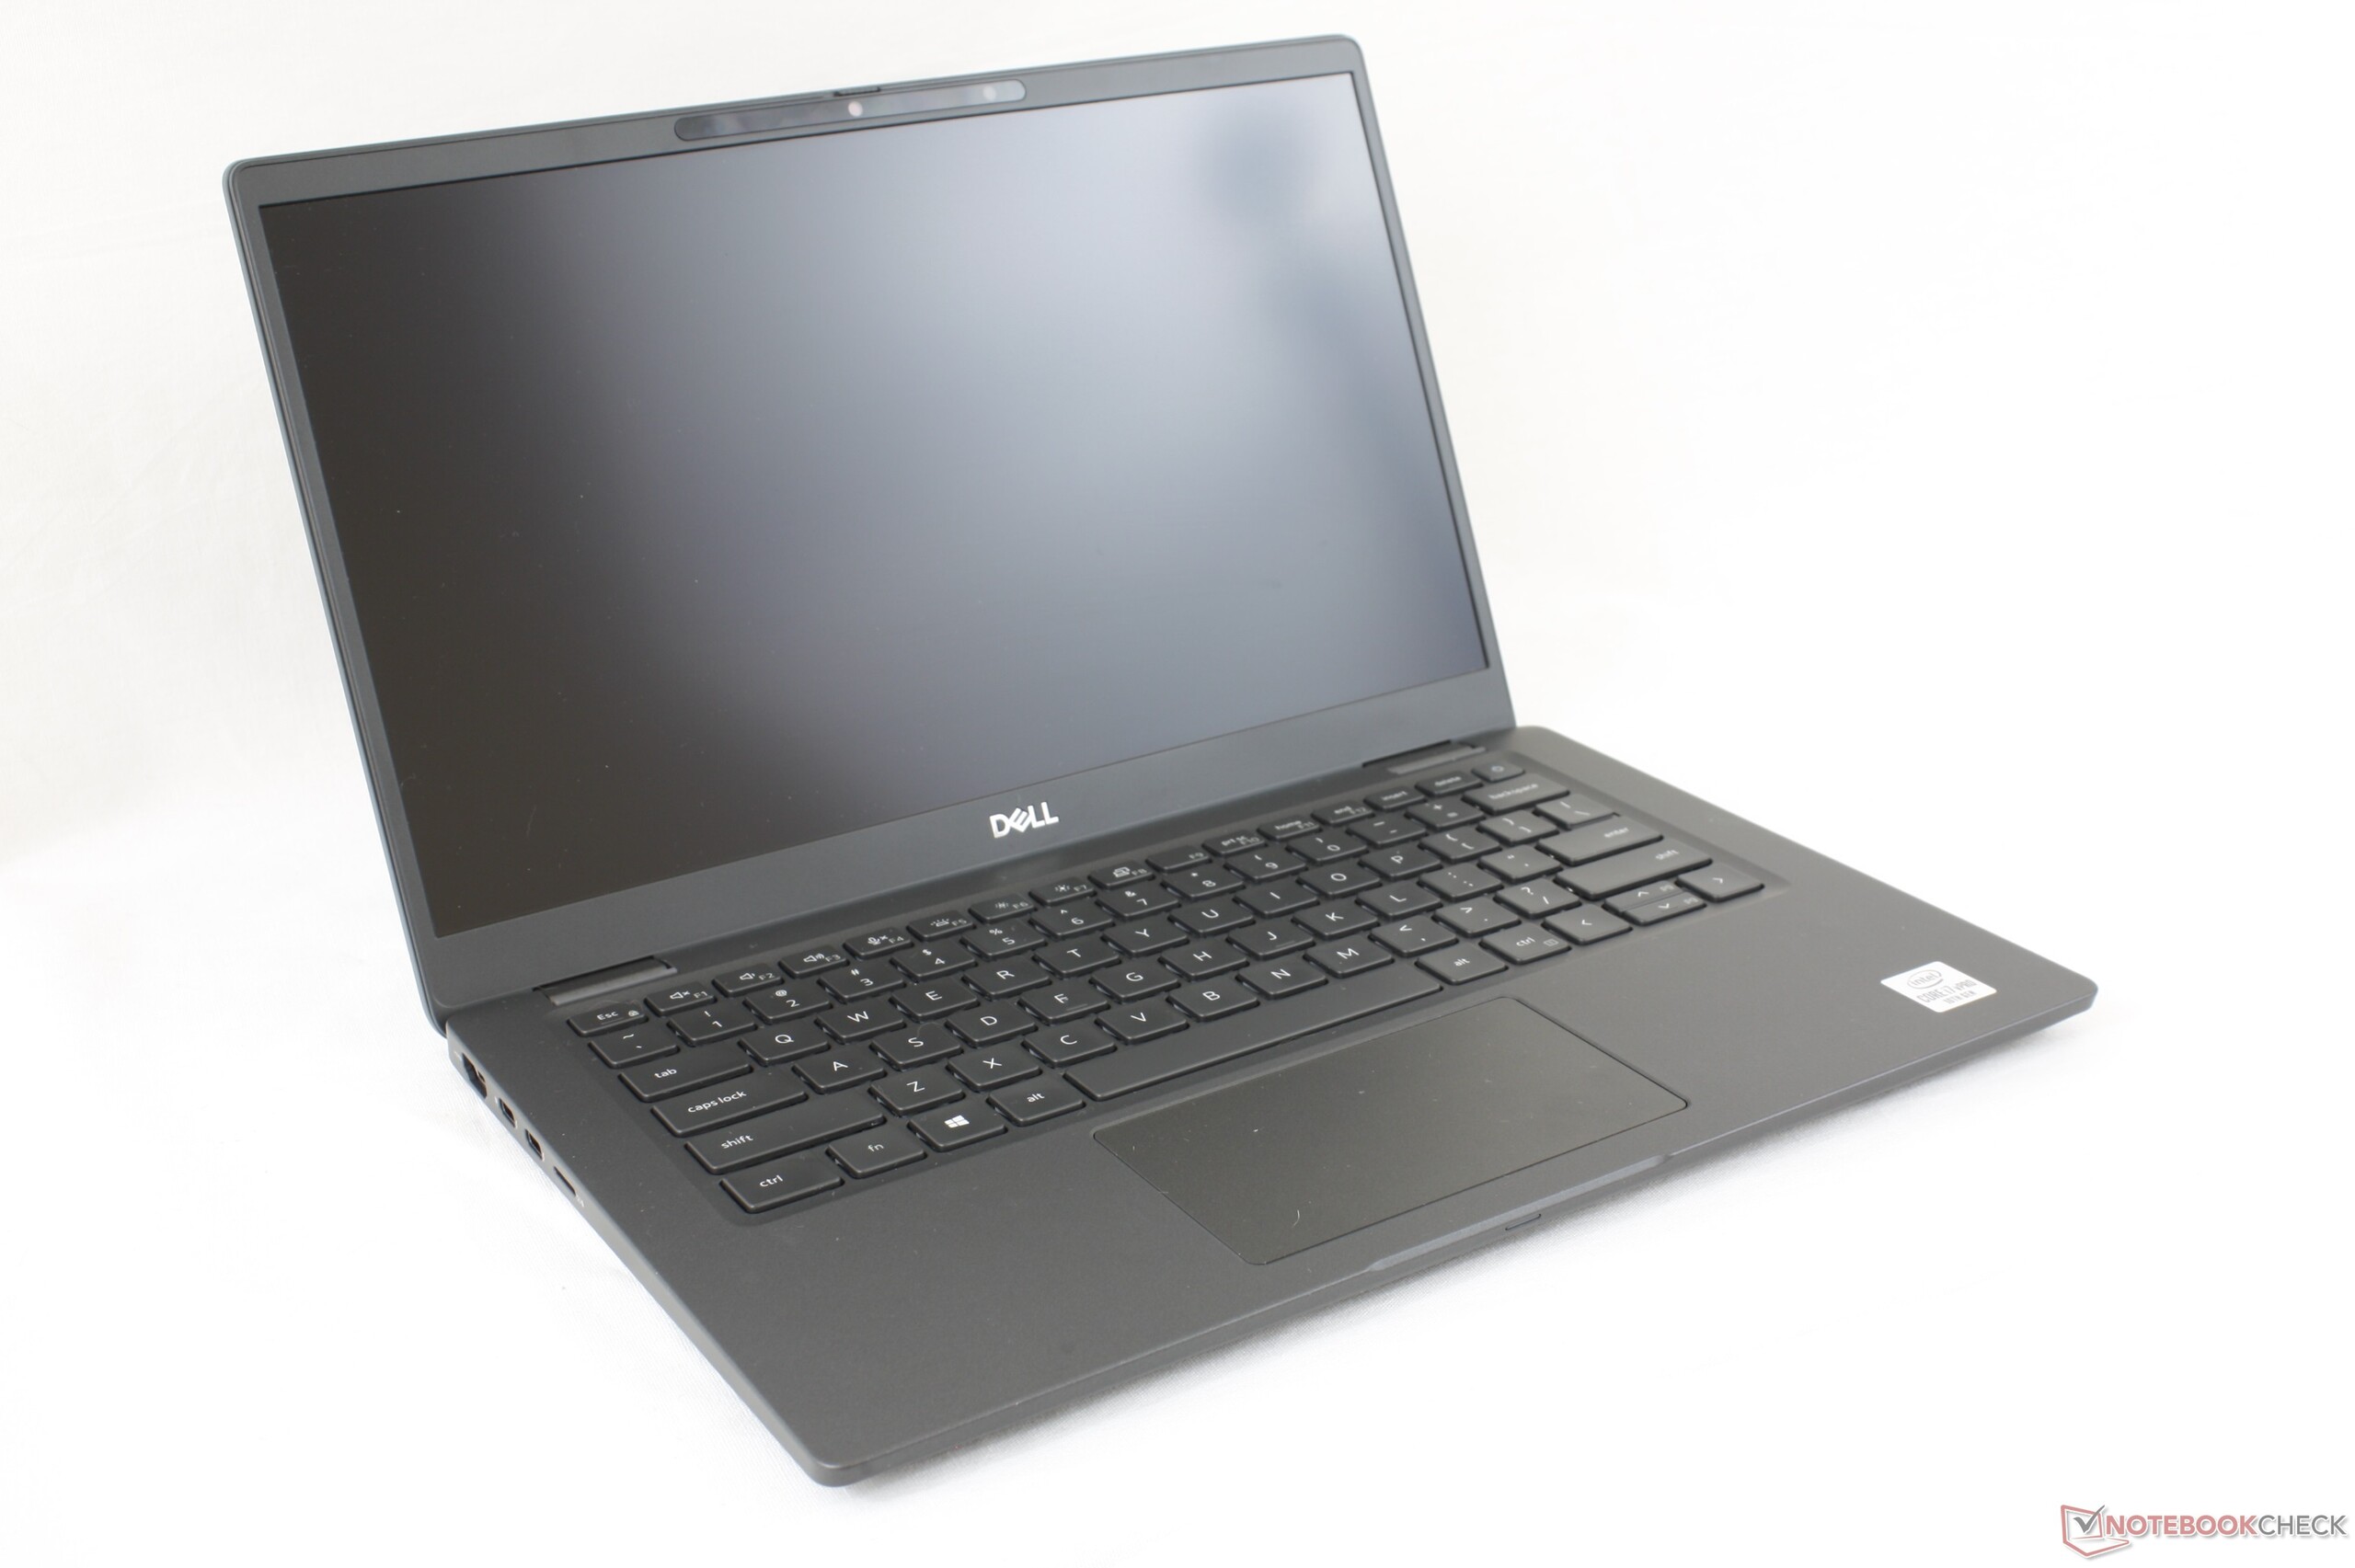
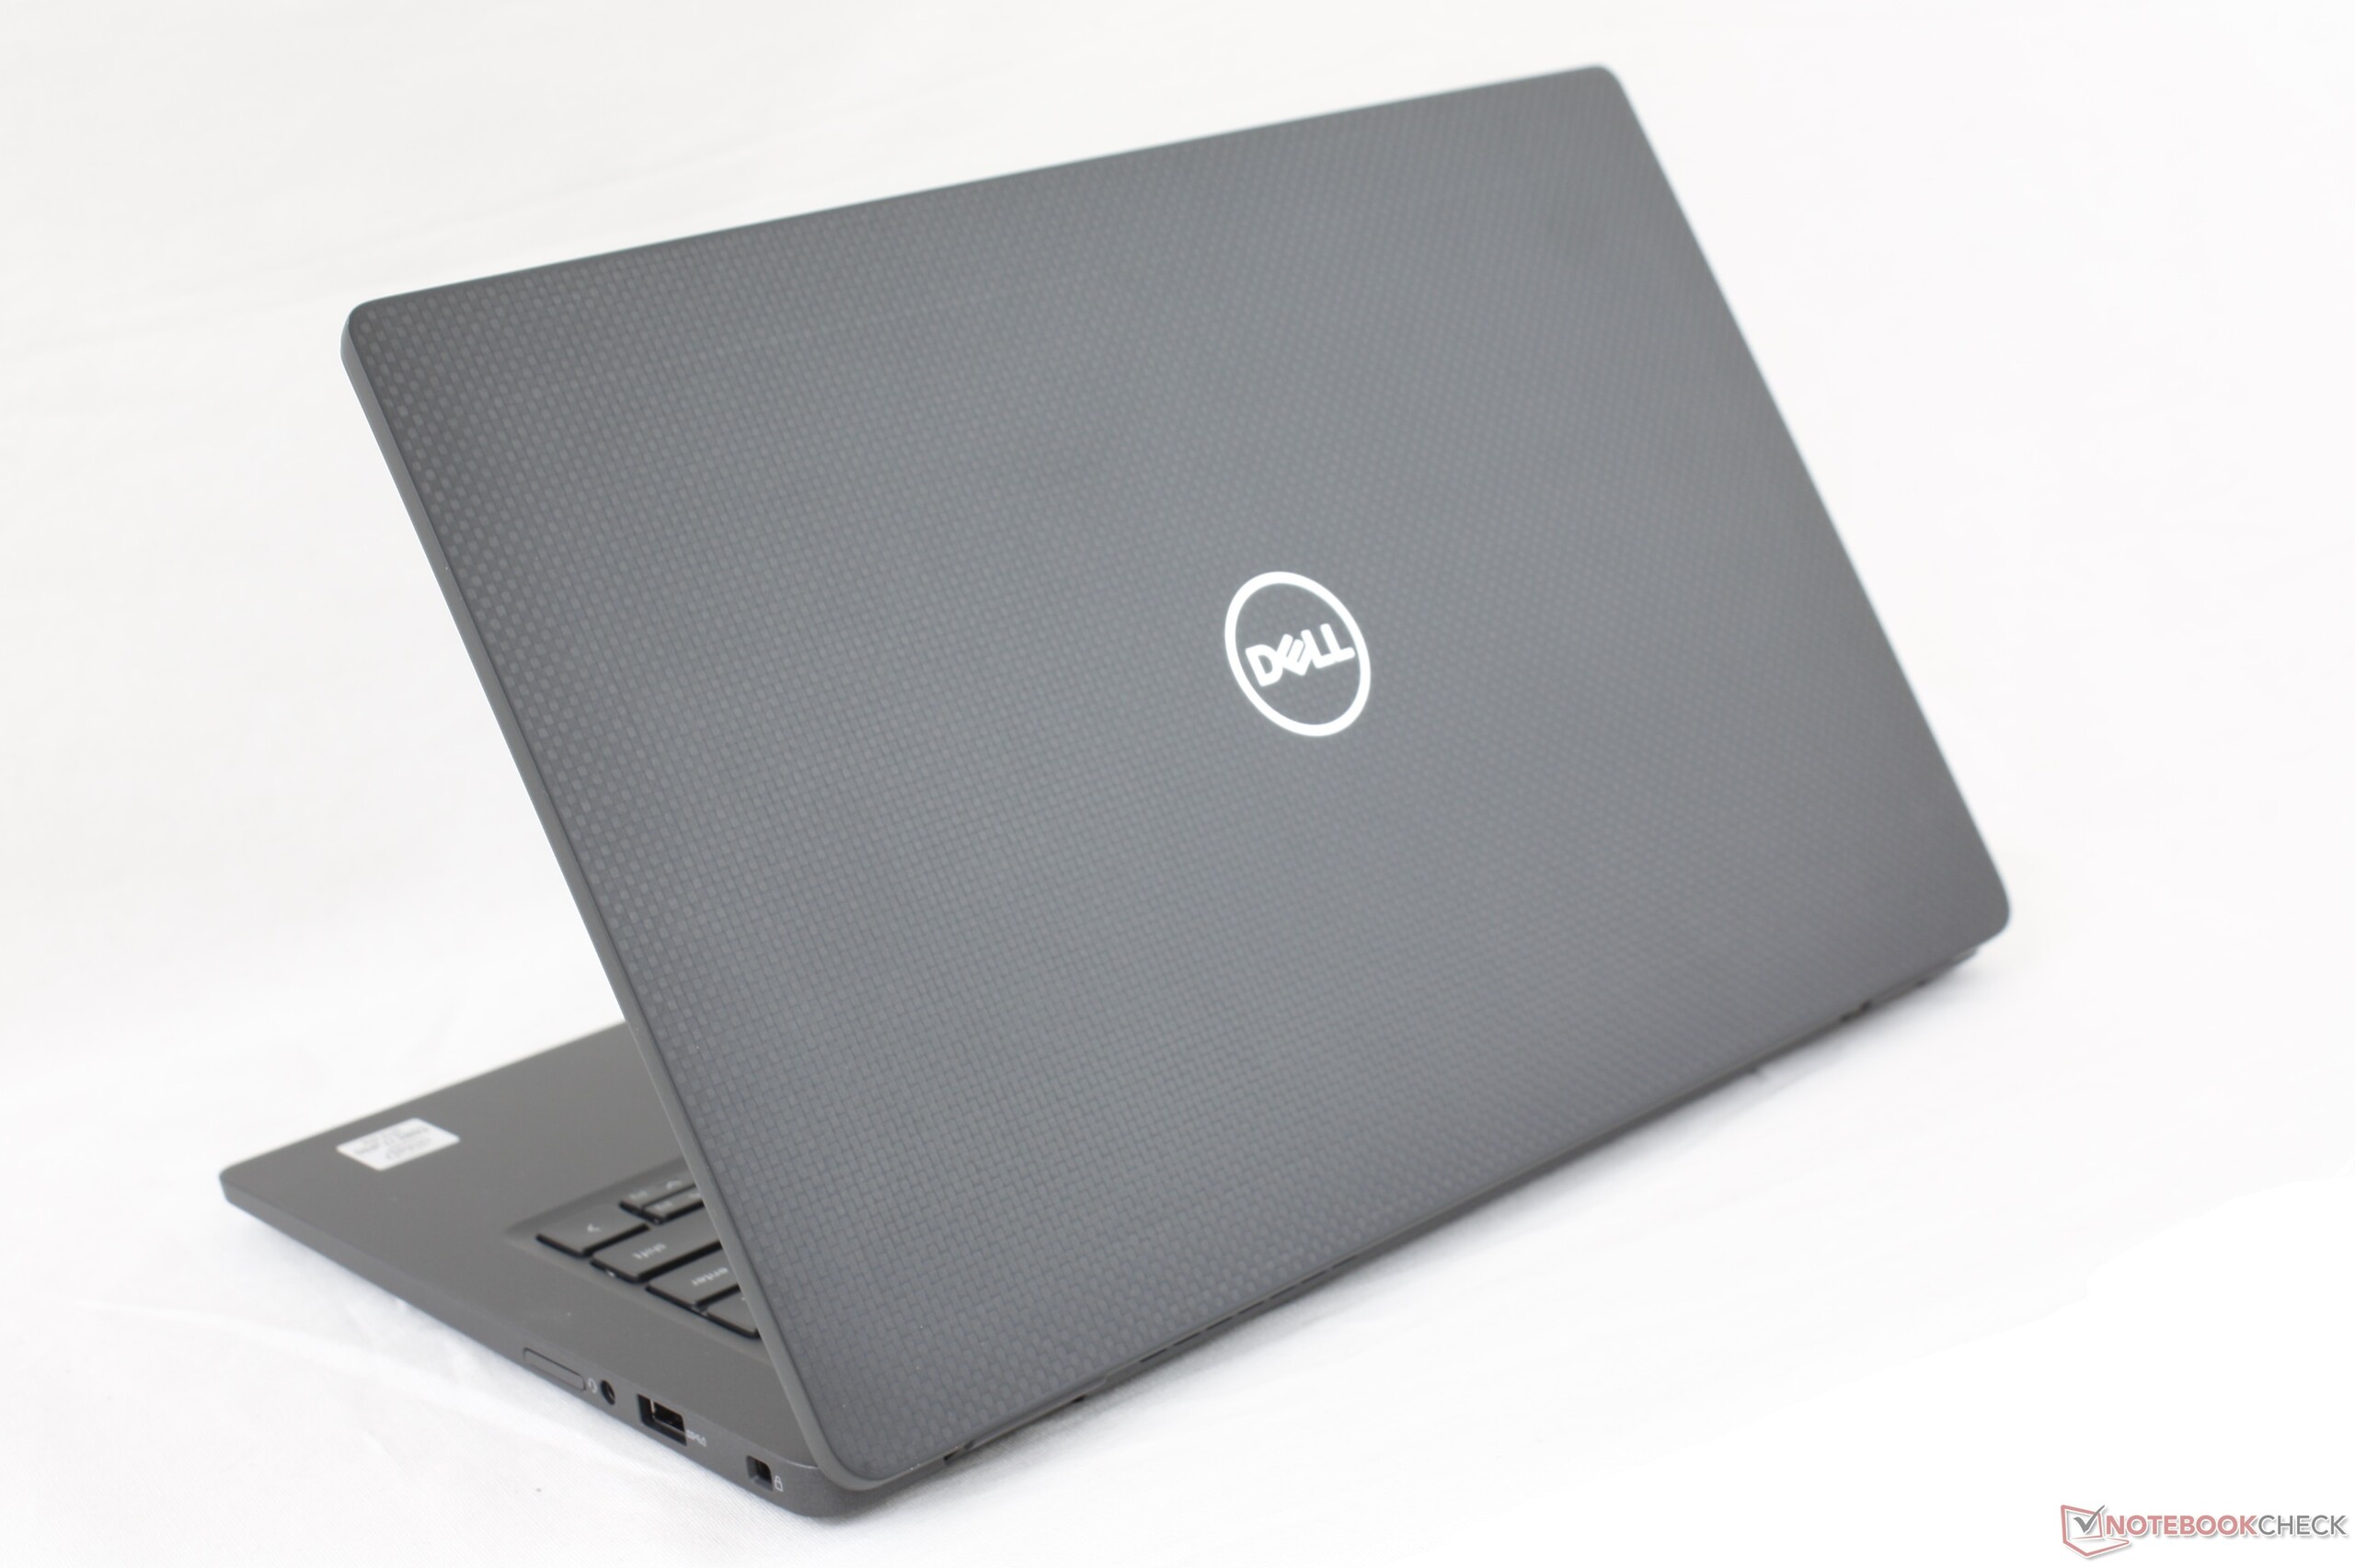
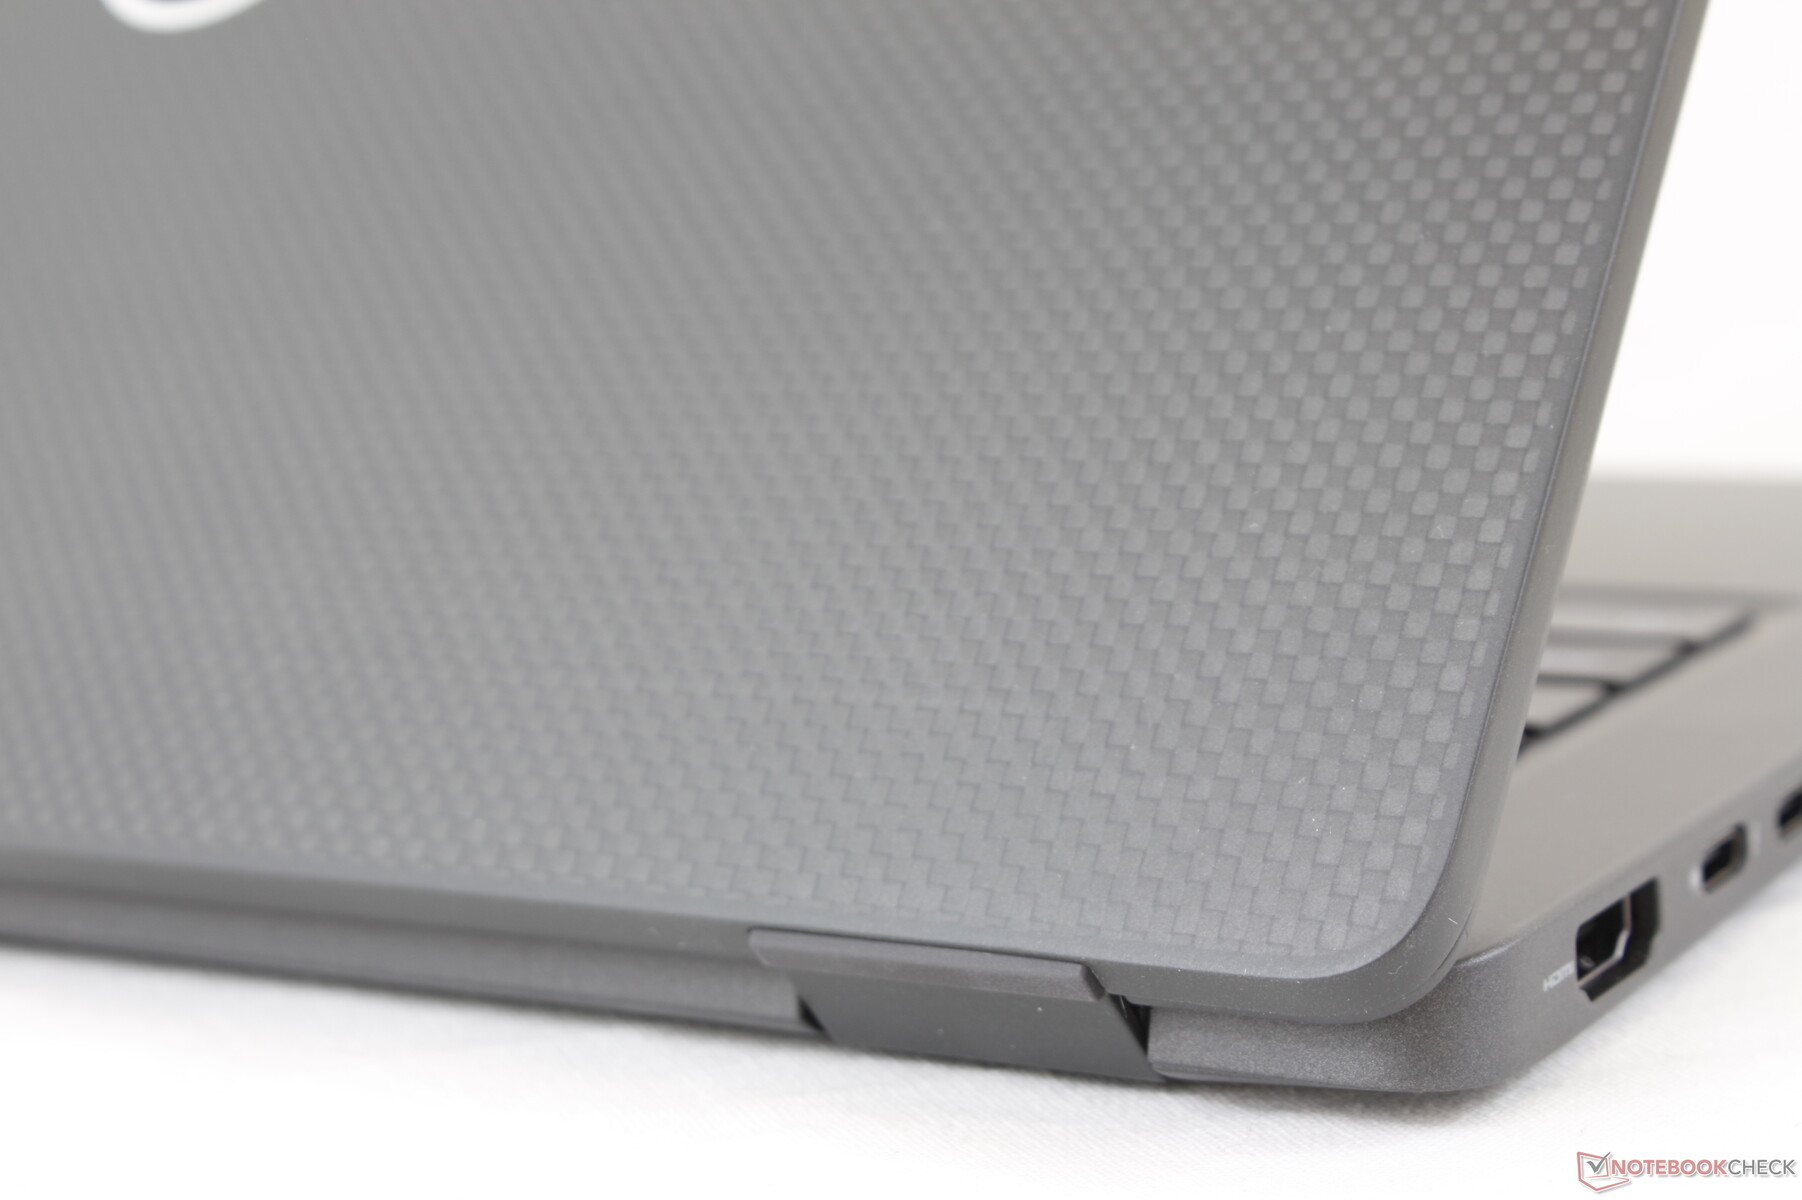
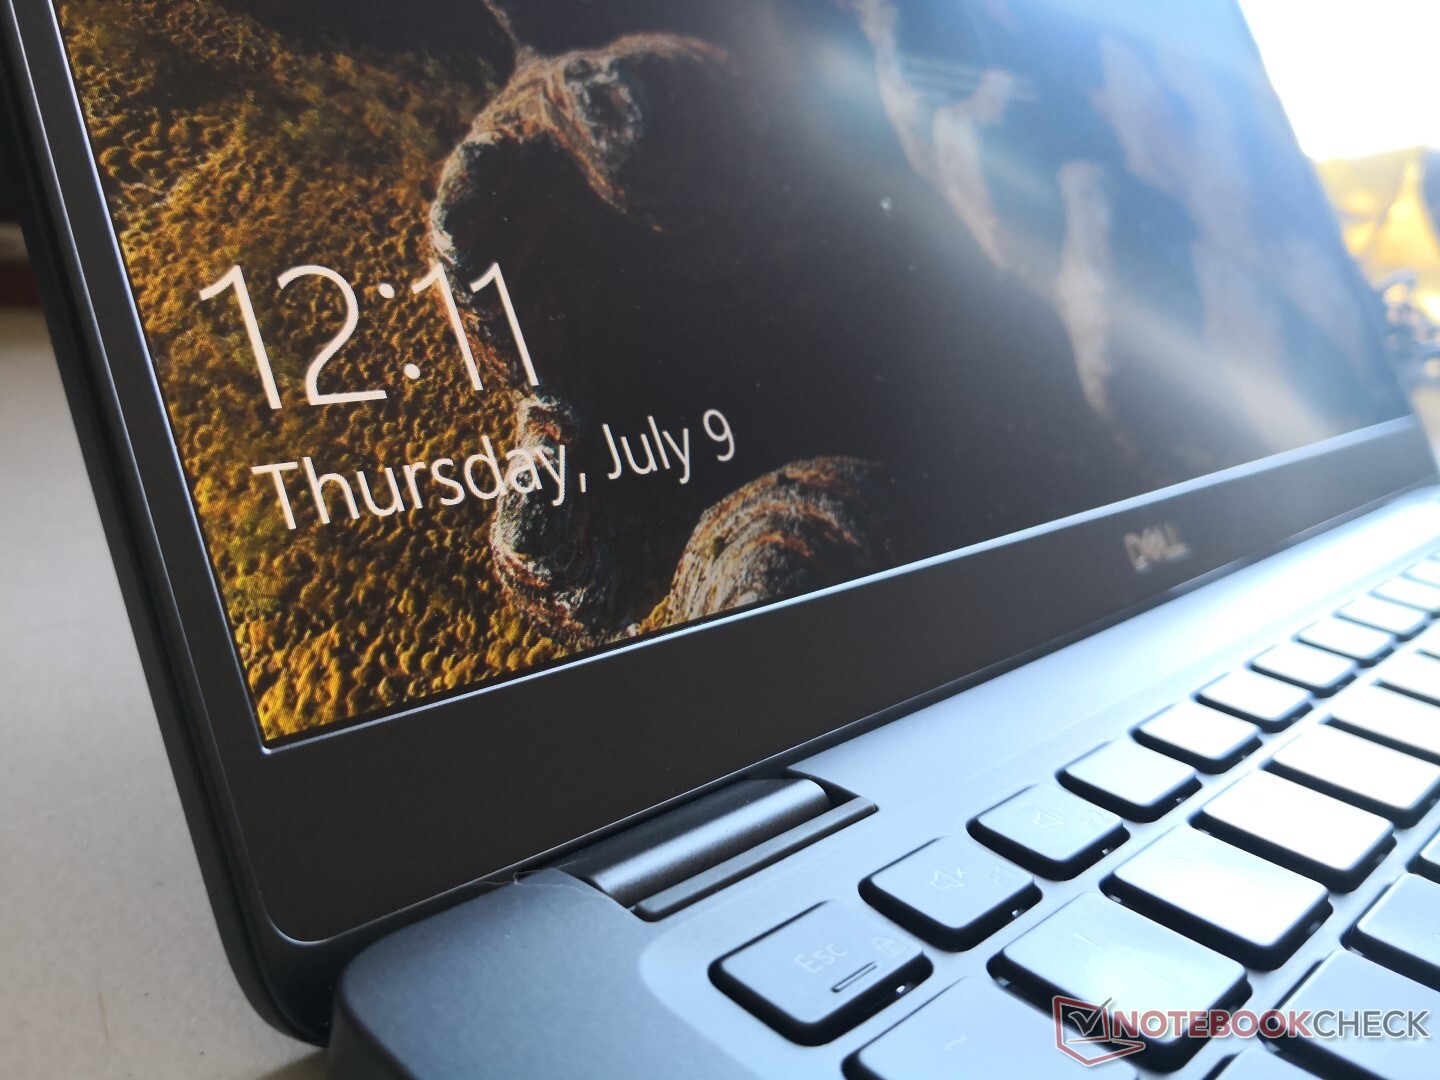
In contrast to the flashy and eye-catching look of the XPS 13, the Latitude 7310 is much more inconspicuous to fit traditional conference rooms and professional environments. The carbon fiber chassis and soft texture feel similar to the carbon fiber palm rests as found on certain XPS 13 or XPS 15 models while still feeling strong and comparable to a modern ThinkPad T series laptop. Unlike on older Latitude laptops like the E7440, however, there is no inner metal skeleton and so the system will flex slightly to twisting or depressions.
An aluminum alloy option is available much like on the Latitude 7410. It won't flex as much as our carbon fiber configuration by design, but it's mostly down to user preference.
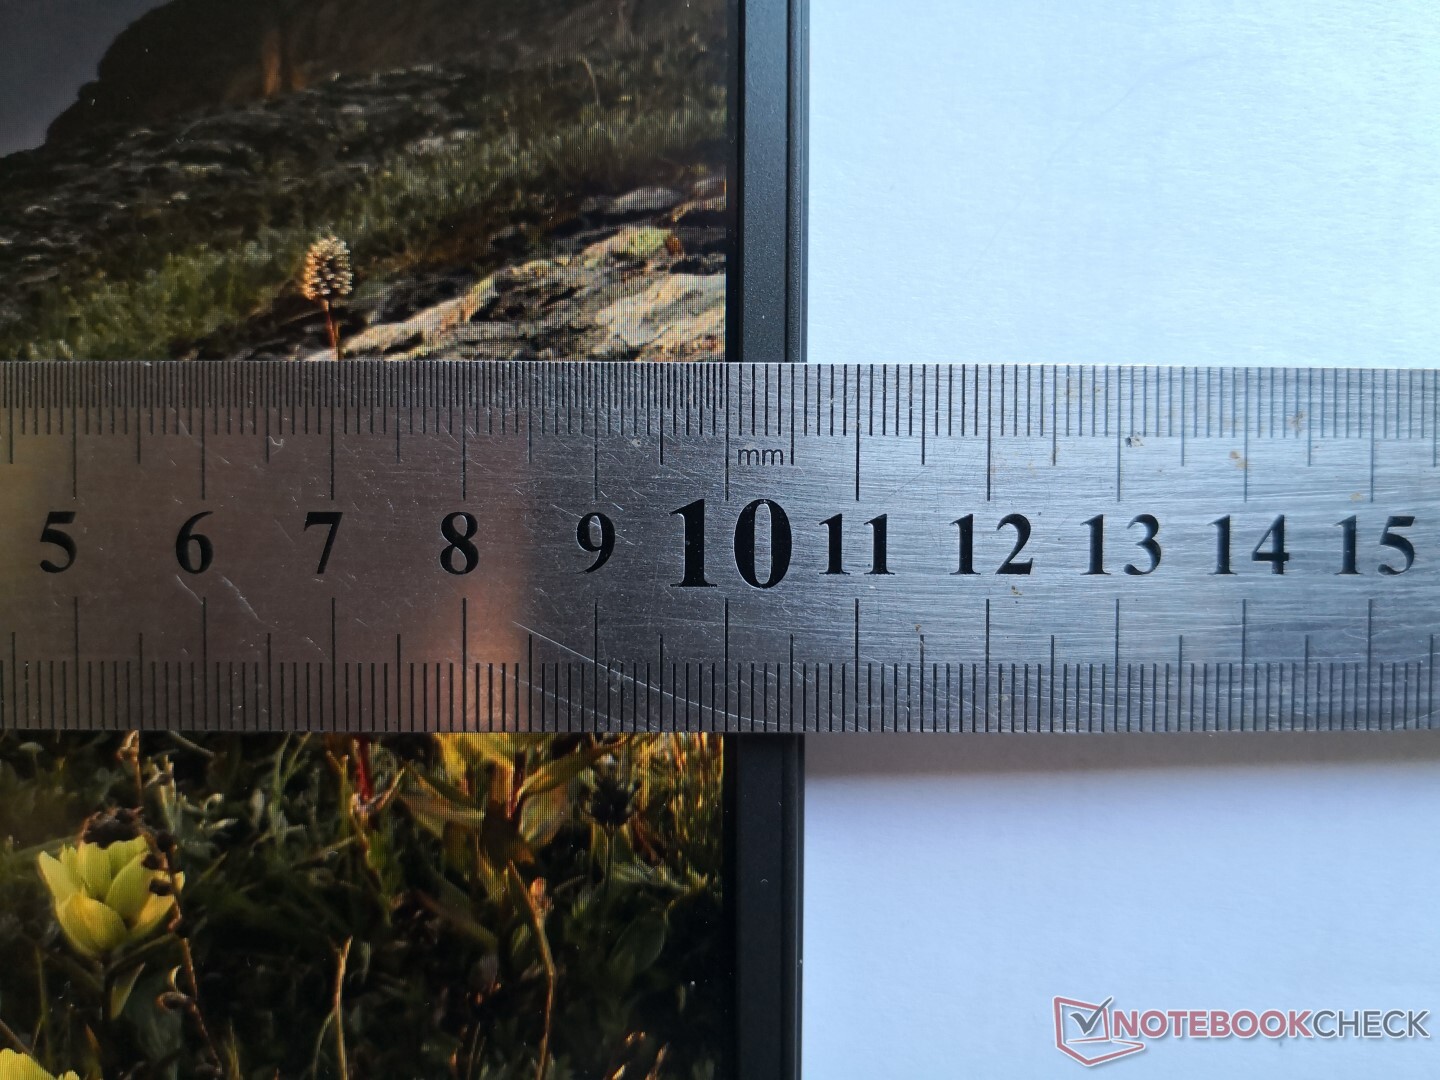
Though the system is a tad bit shorter than its predecessor, the most noticeable difference is its lighter weight by almost 200 g to be just as light as the thinner XPS 13 9300. This is in contrast to the Latitude 7410 which we found to be slightly heavier than many other 14-inch subnotebooks. The "ultimate" super-light business laptop in this size class continues to be the Toshiba Portege X30L.
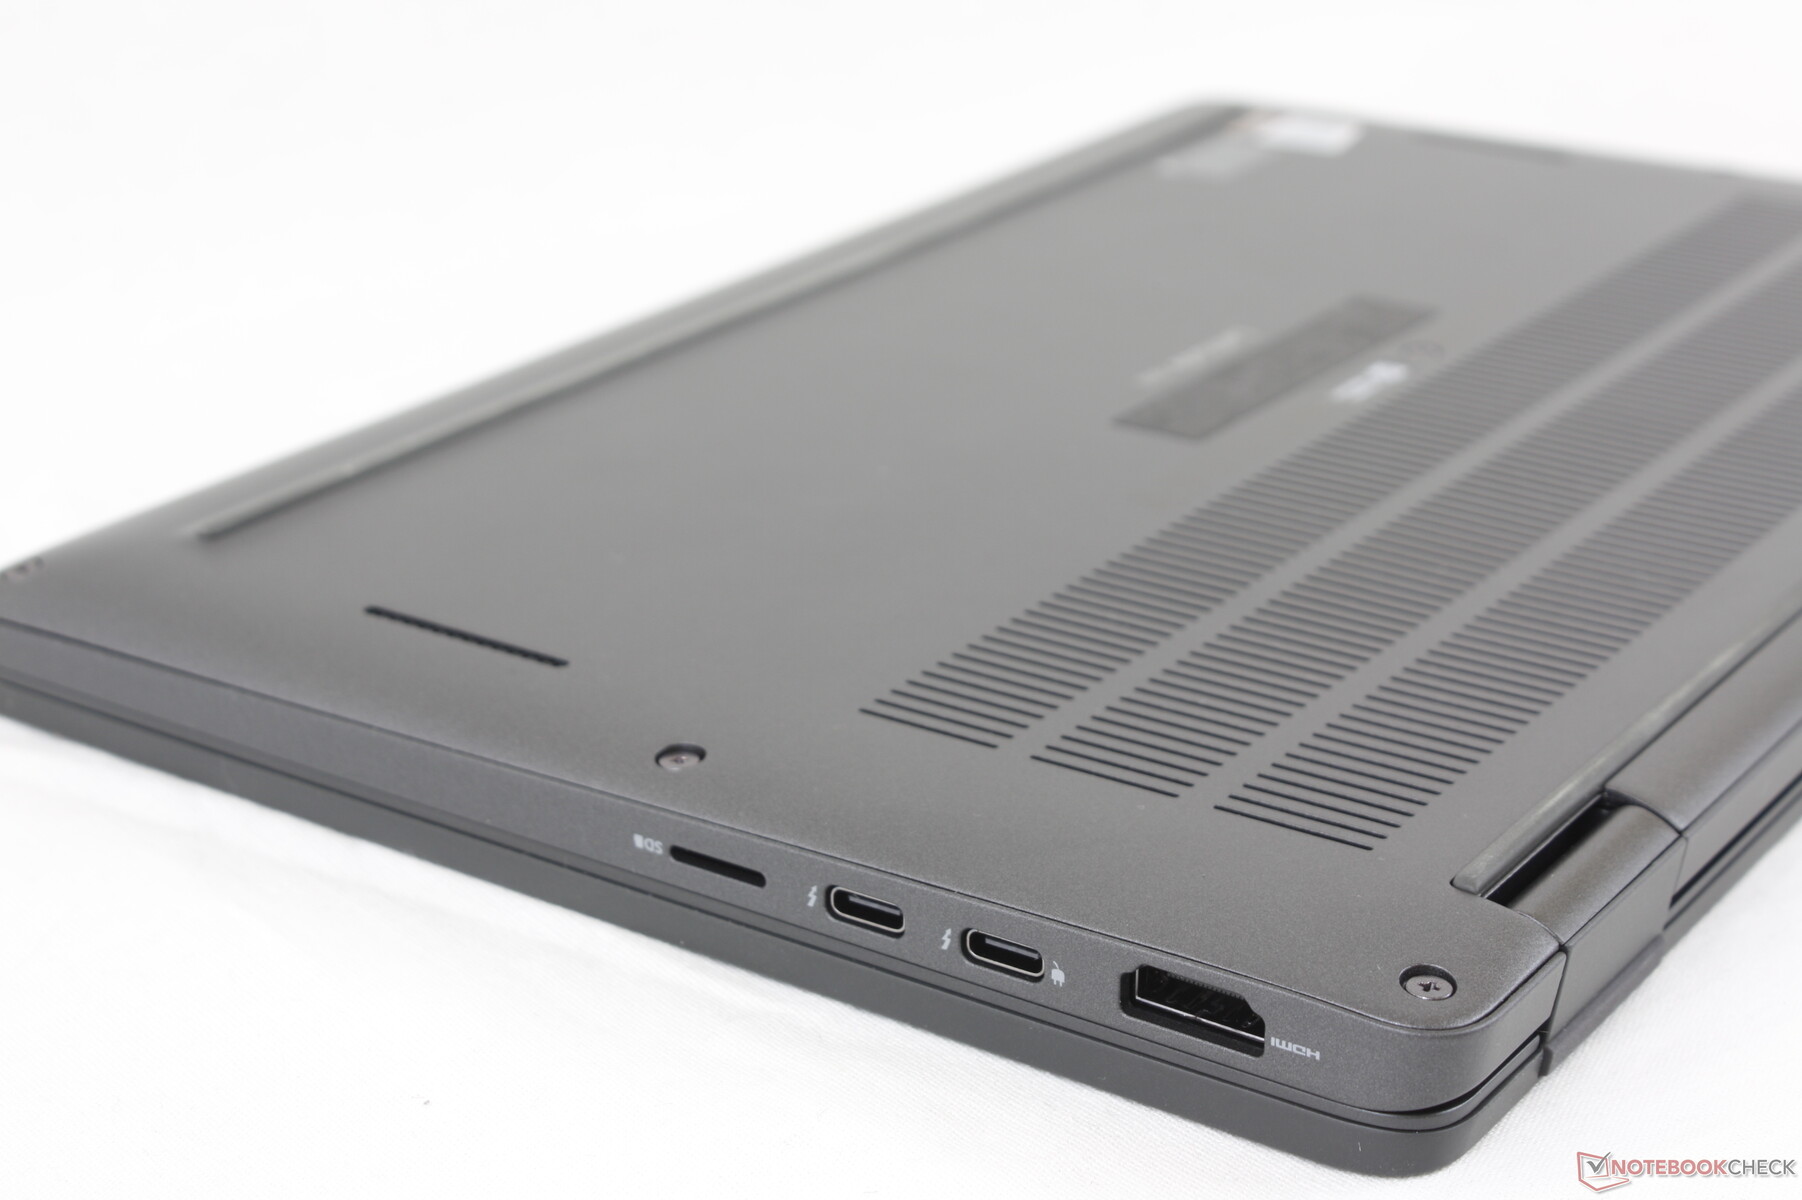
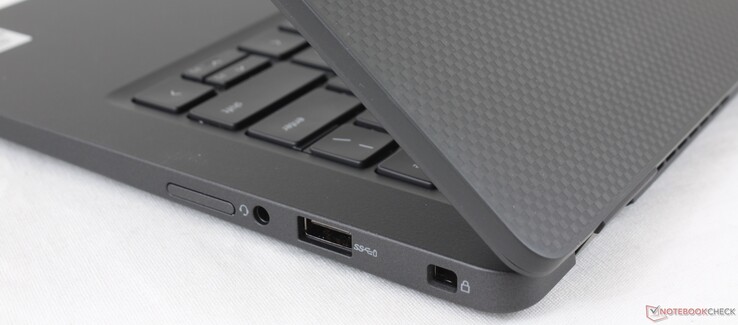
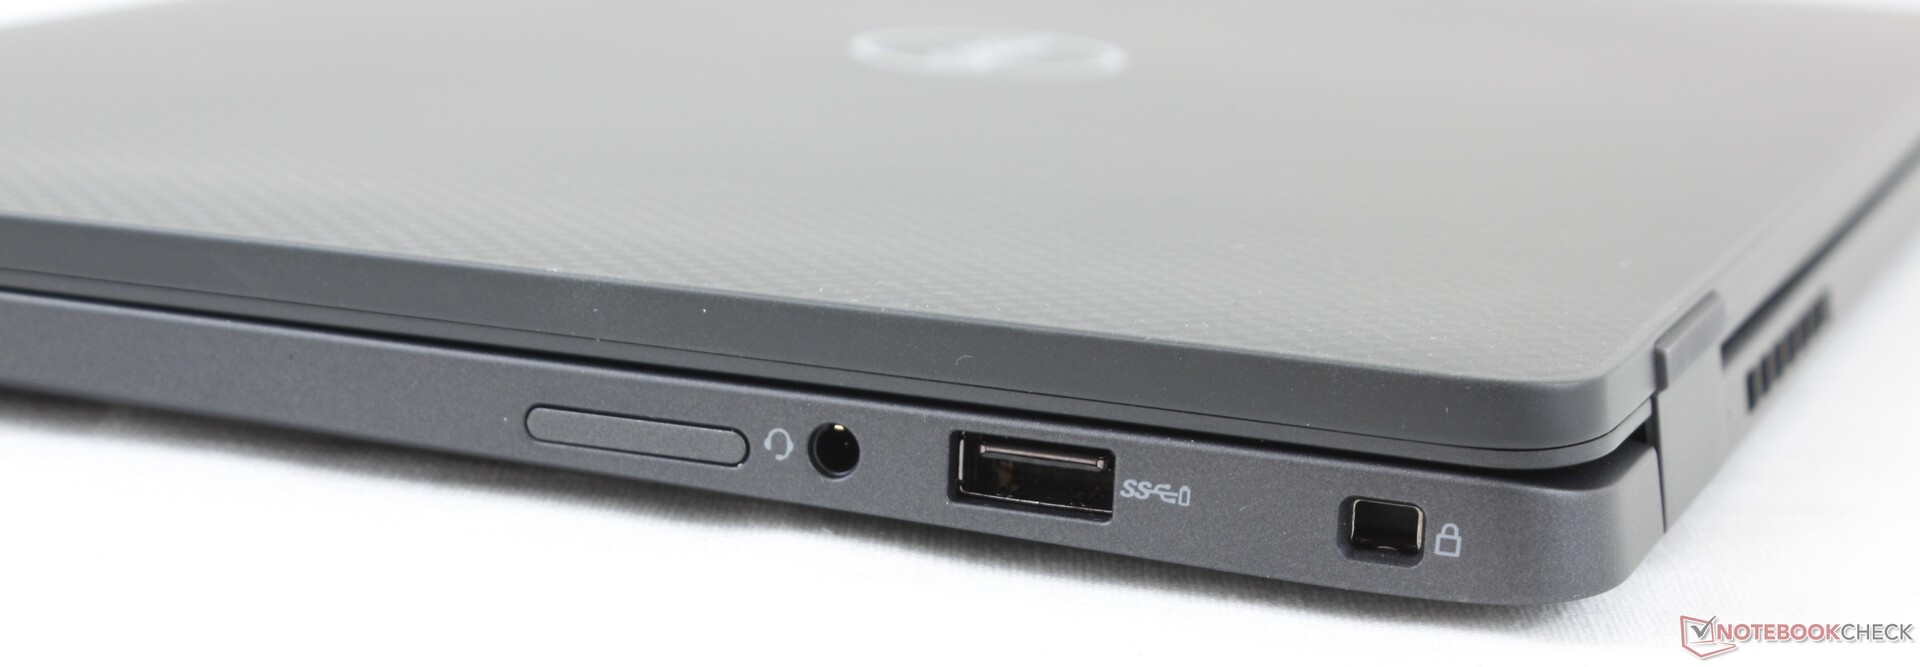
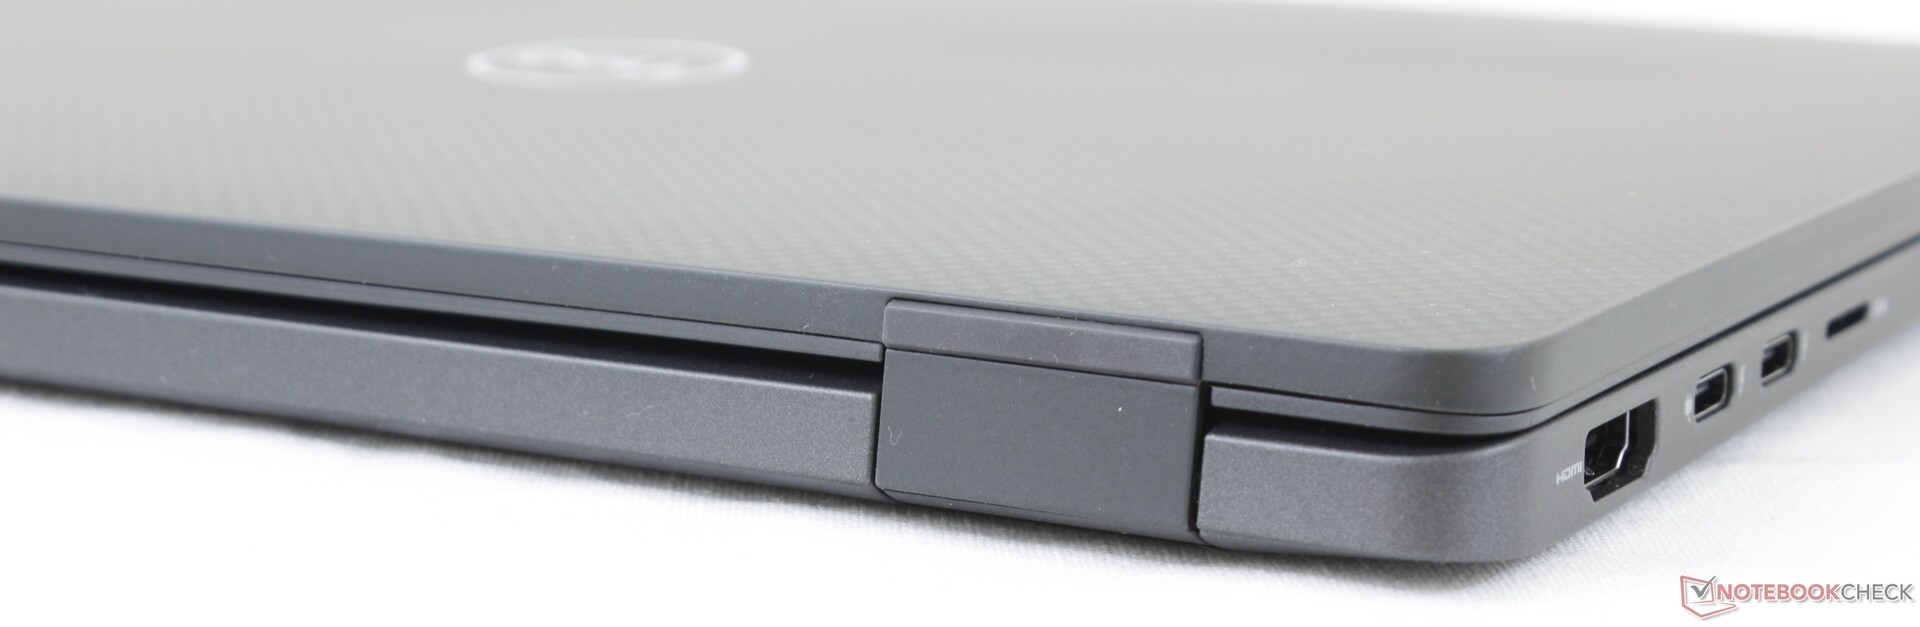
Connectivity
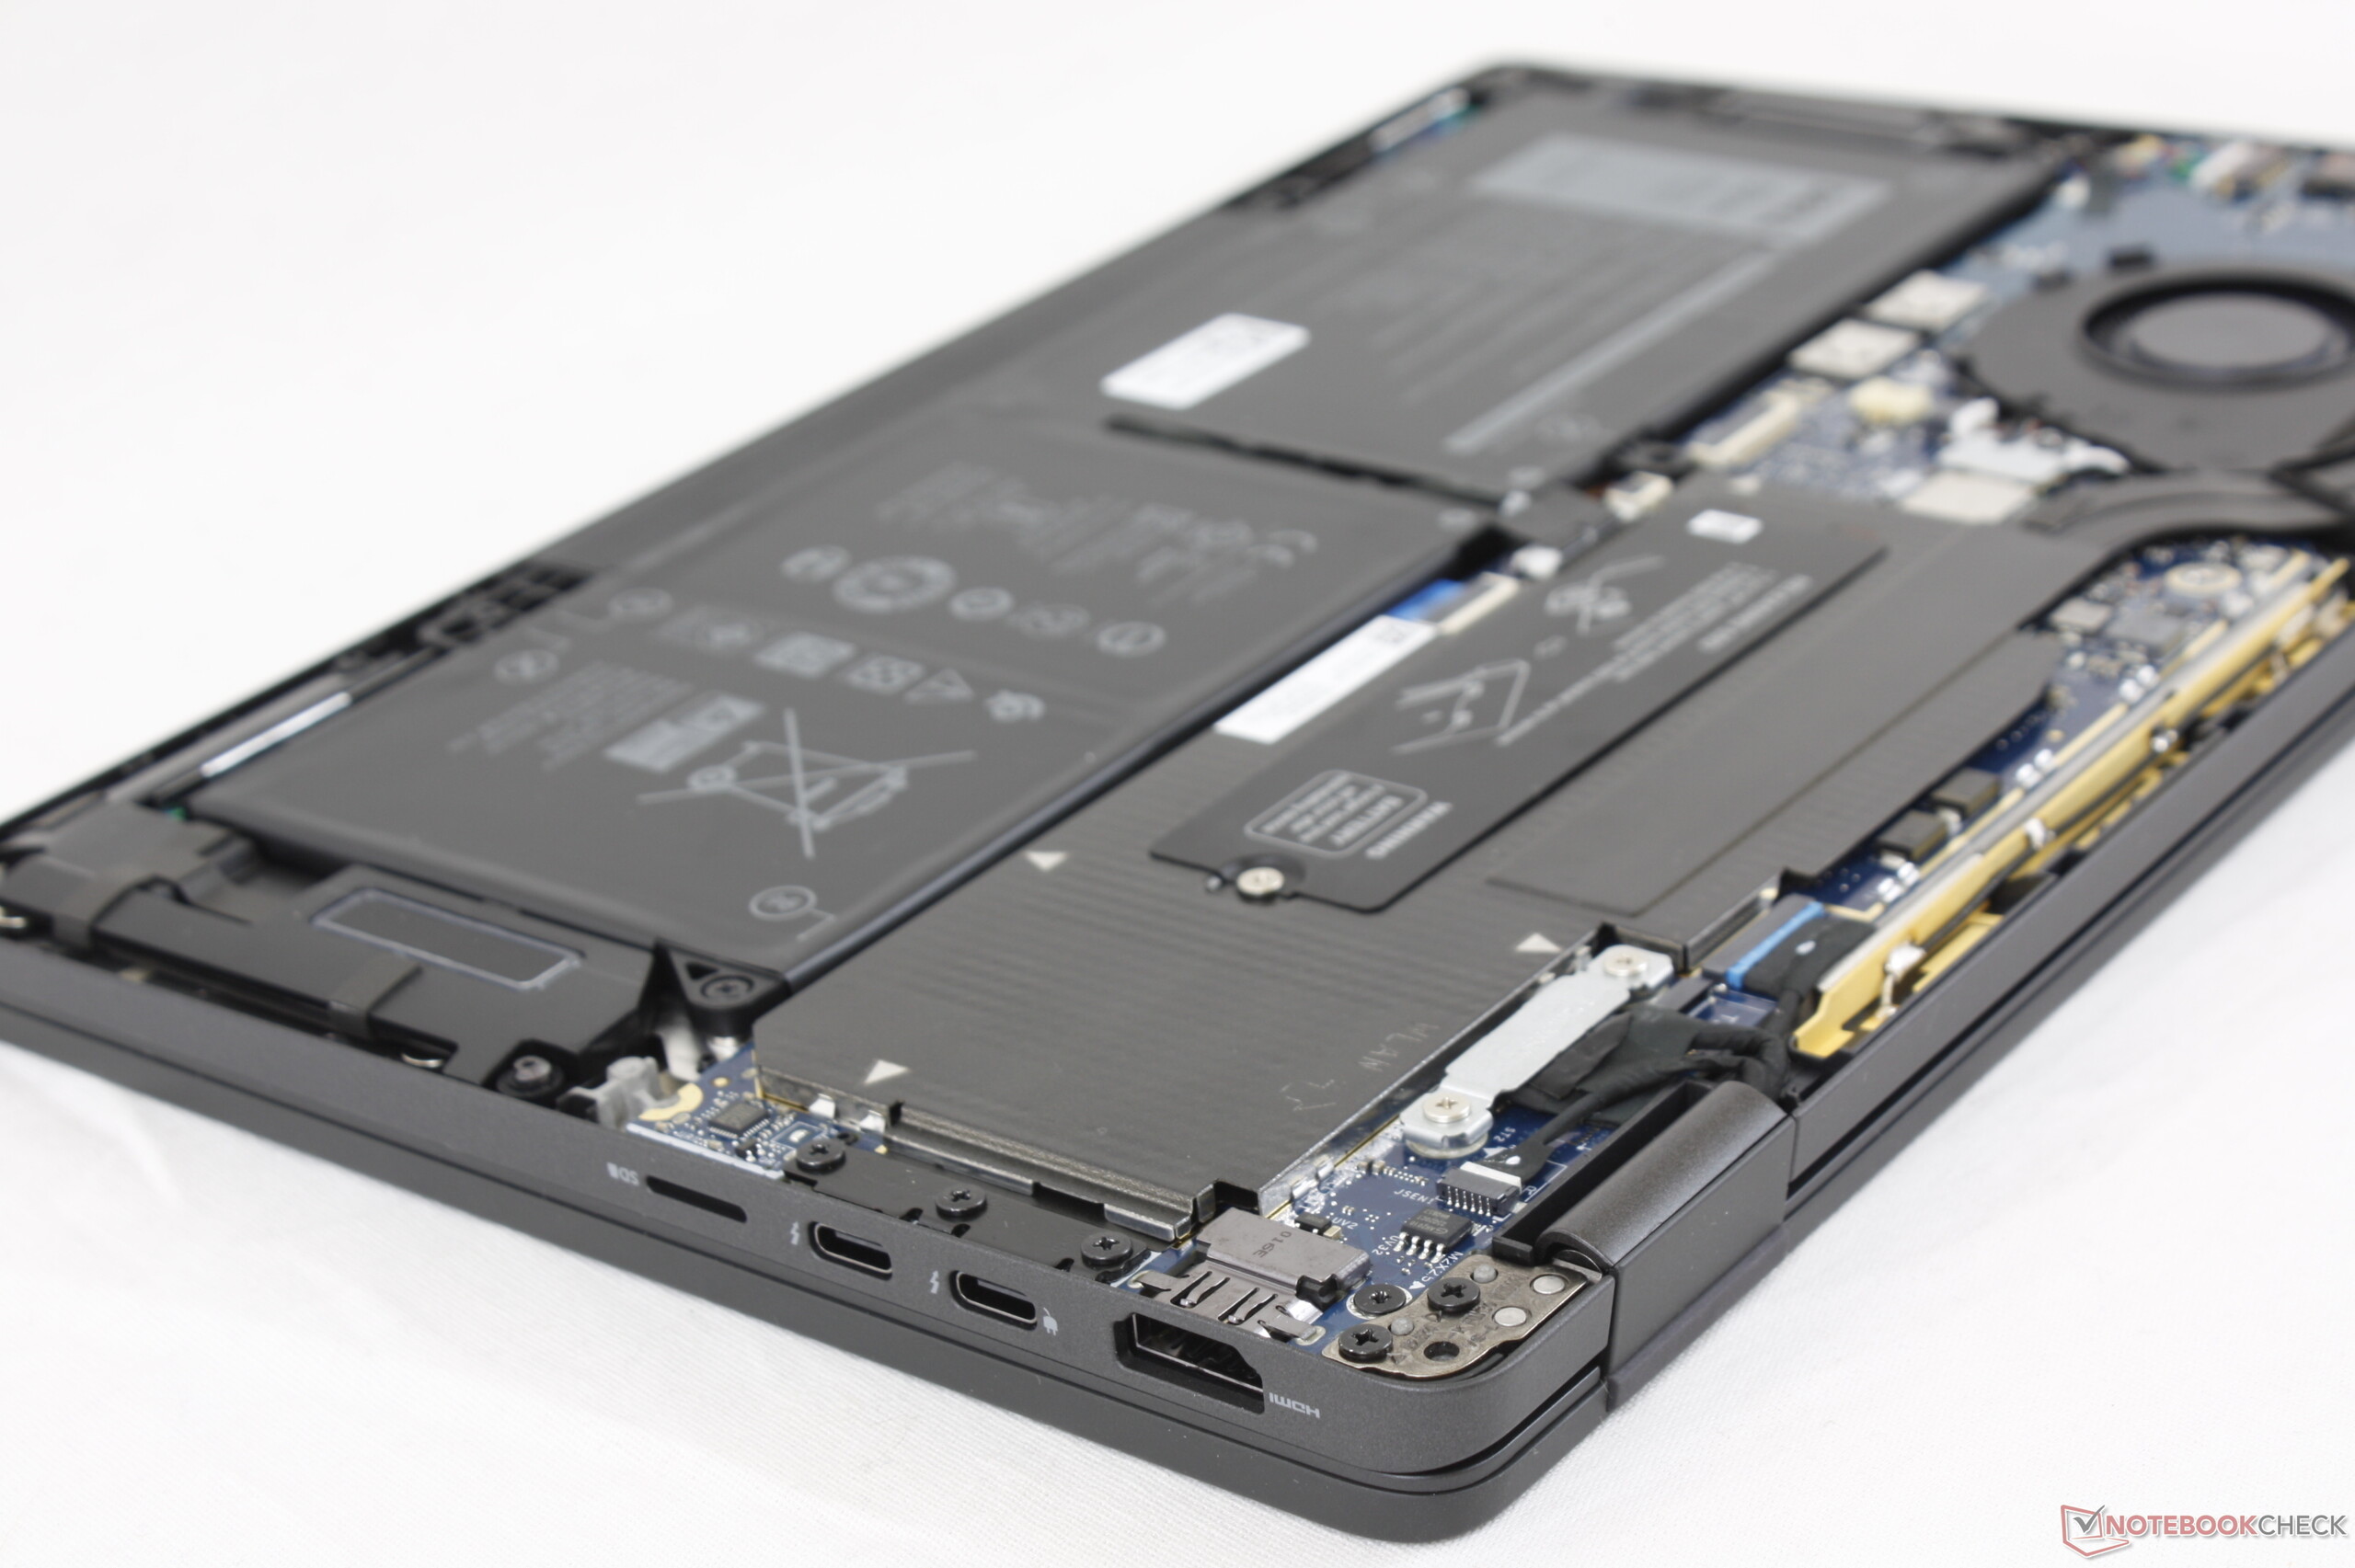
Port options and positioning are identical to the Latitude 7410 sans one USB Type-A port. Most notably, Dell has dropped the proprietary barrel AC adapter port in favor of a second Thunderbolt 3 port for both charging and docking stations.
The uSIM and Smart Card readers remain optional.
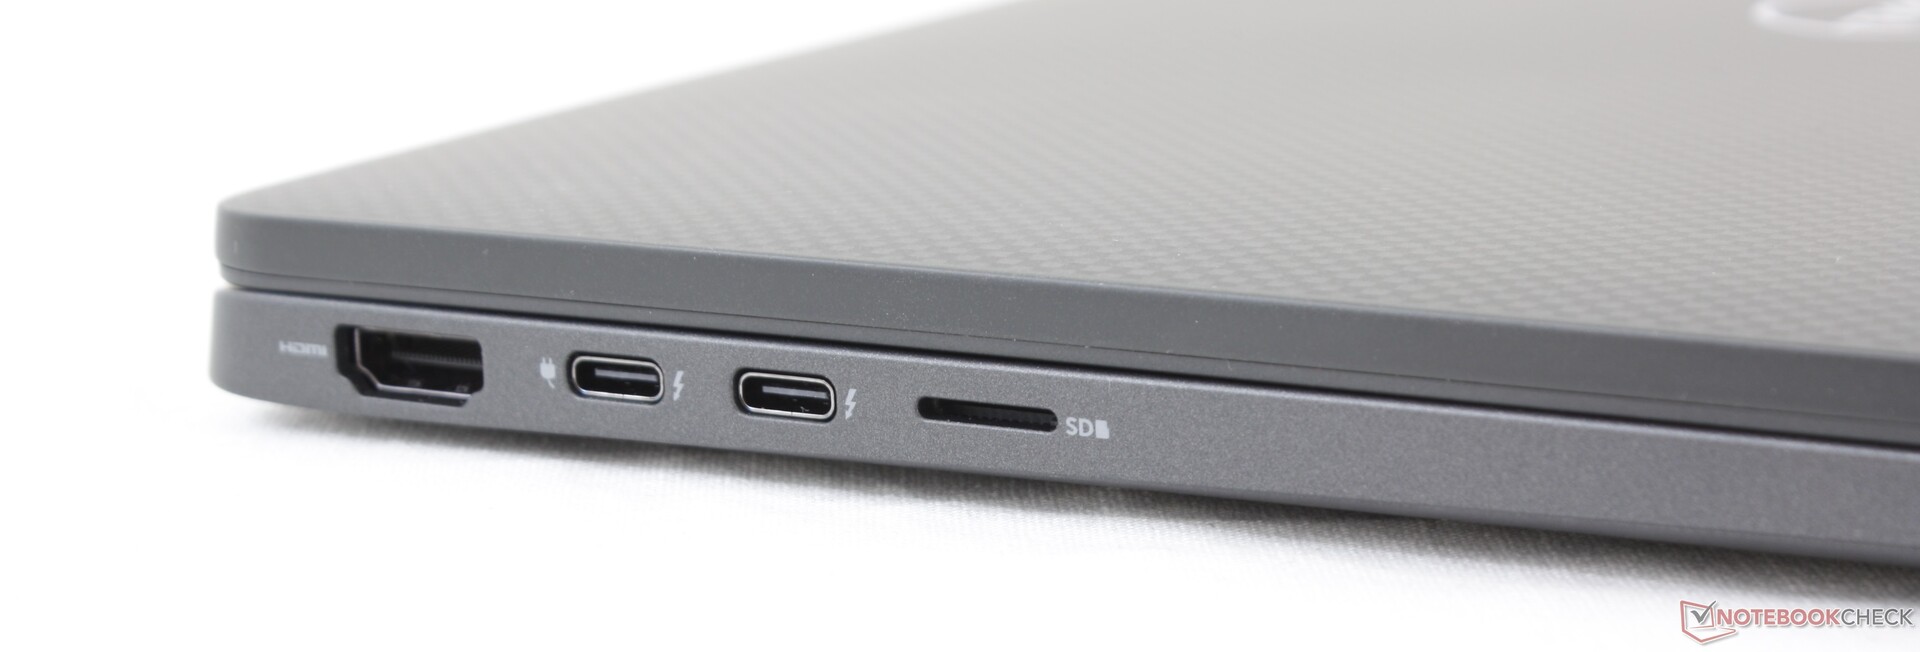
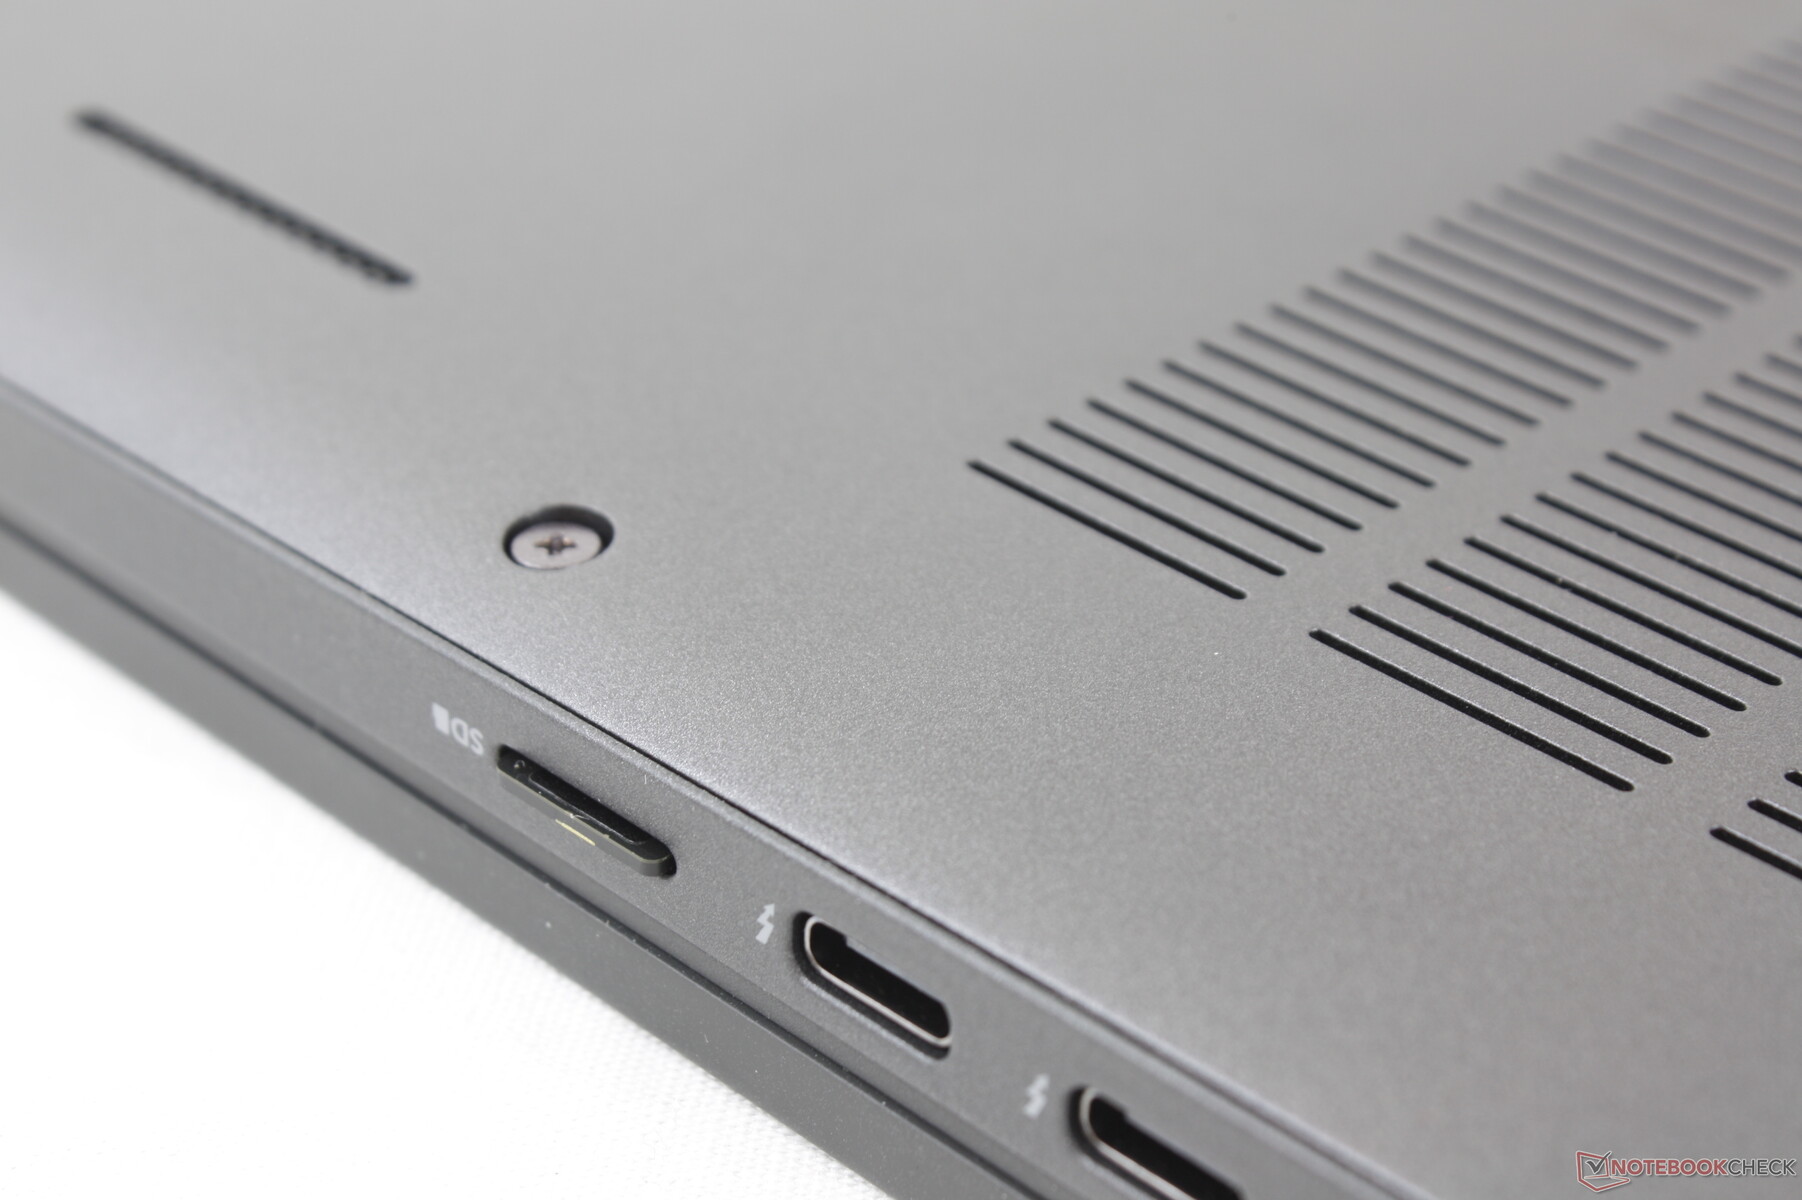
SD Card Reader
Transfer rates from the spring-loaded MicroSD card reader continue to be some of the fastest on any business subnotebook. Moving 1 GB of images from our UHS-II test card to desktop takes only 6 seconds compared to 16 seconds on the ThinkPad X395.
| SD Card Reader | |
| average JPG Copy Test (av. of 3 runs) | |
| Dell Latitude 7300-P99G (Toshiba Exceria Pro M501 microSDXC 64GB) | |
| Dell Latitude 7310 (Toshiba Exceria Pro M501 64 GB UHS-II) | |
| Lenovo ThinkPad X395 | |
| Asus ZenBook S13 UX392FN (Toshiba Exceria Pro M501 64 GB UHS-II) | |
| maximum AS SSD Seq Read Test (1GB) | |
| Dell Latitude 7310 (Toshiba Exceria Pro M501 64 GB UHS-II) | |
| Dell Latitude 7300-P99G (Toshiba Exceria Pro M501 microSDXC 64GB) | |
| Lenovo ThinkPad X395 | |
| Asus ZenBook S13 UX392FN (Toshiba Exceria Pro M501 64 GB UHS-II) | |
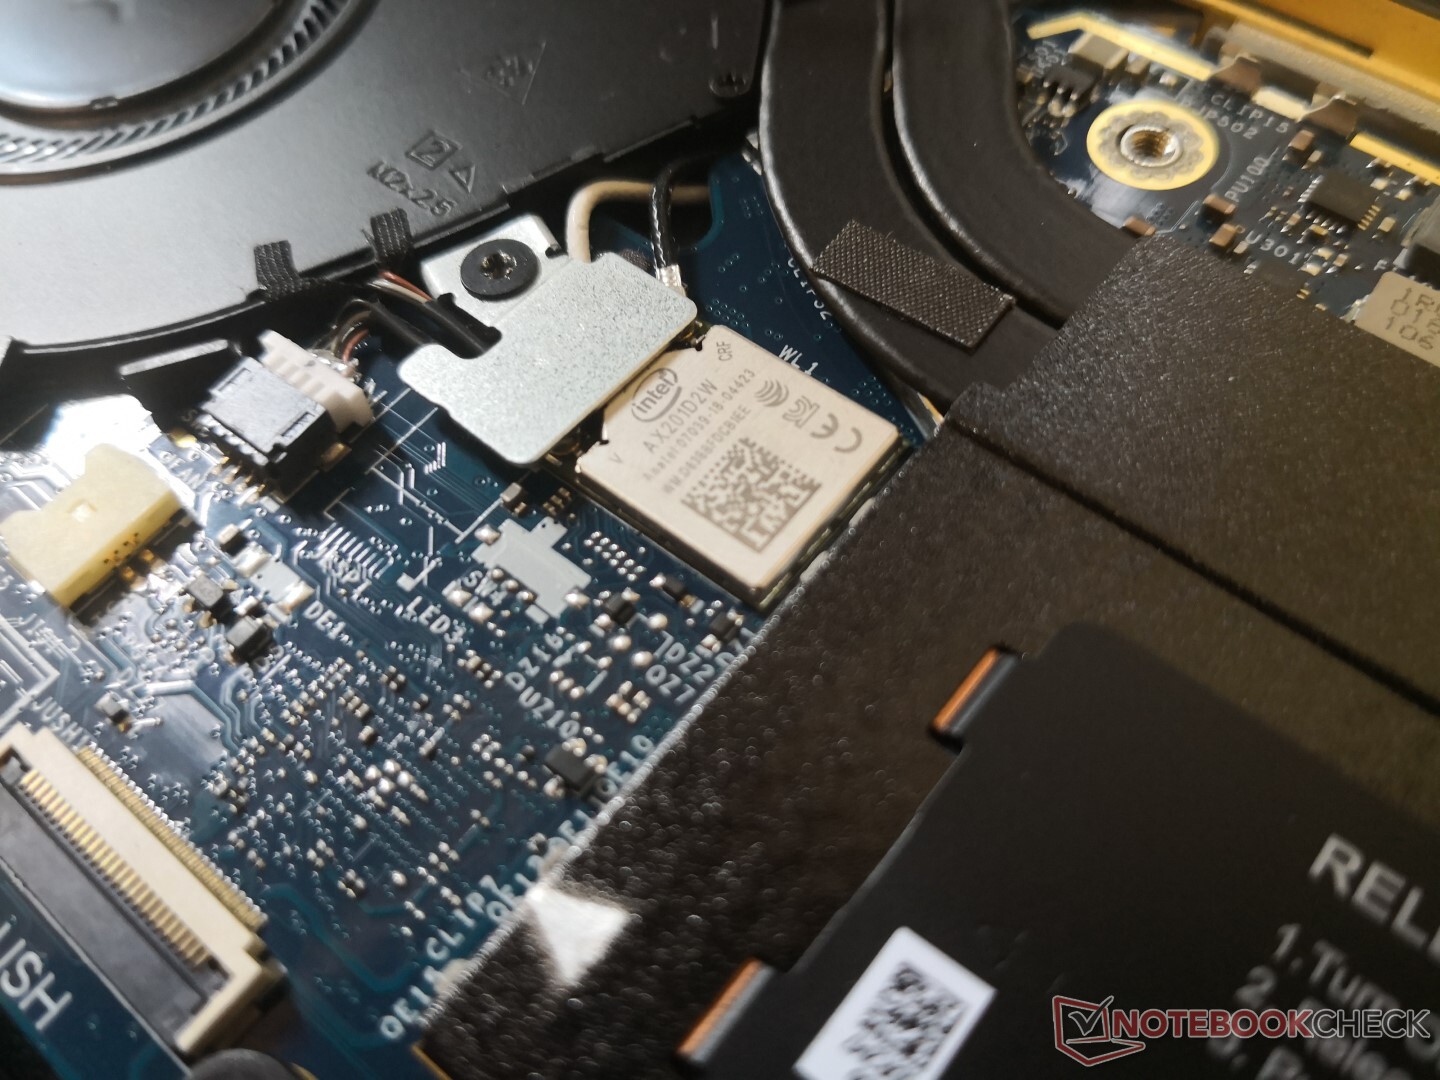
Communication
Users can configure between the Intel 9560 or AX201 for Wi-Fi 5 or Wi-Fi 6 connectivity, respectively. Choose carefully because the WLAN module is not user-upgradeable. We experienced no connectivity issues when paired with our Netgear RAX200 test router.
| Networking | |
| iperf3 transmit AX12 | |
| Asus Zephyrus G14 GA401IV | |
| Dell Latitude 7310 | |
| Dell XPS 13 9300 4K UHD | |
| Dell Latitude 7410 | |
| iperf3 receive AX12 | |
| Dell XPS 13 9300 4K UHD | |
| Asus Zephyrus G14 GA401IV | |
| Dell Latitude 7410 | |
| Dell Latitude 7310 | |
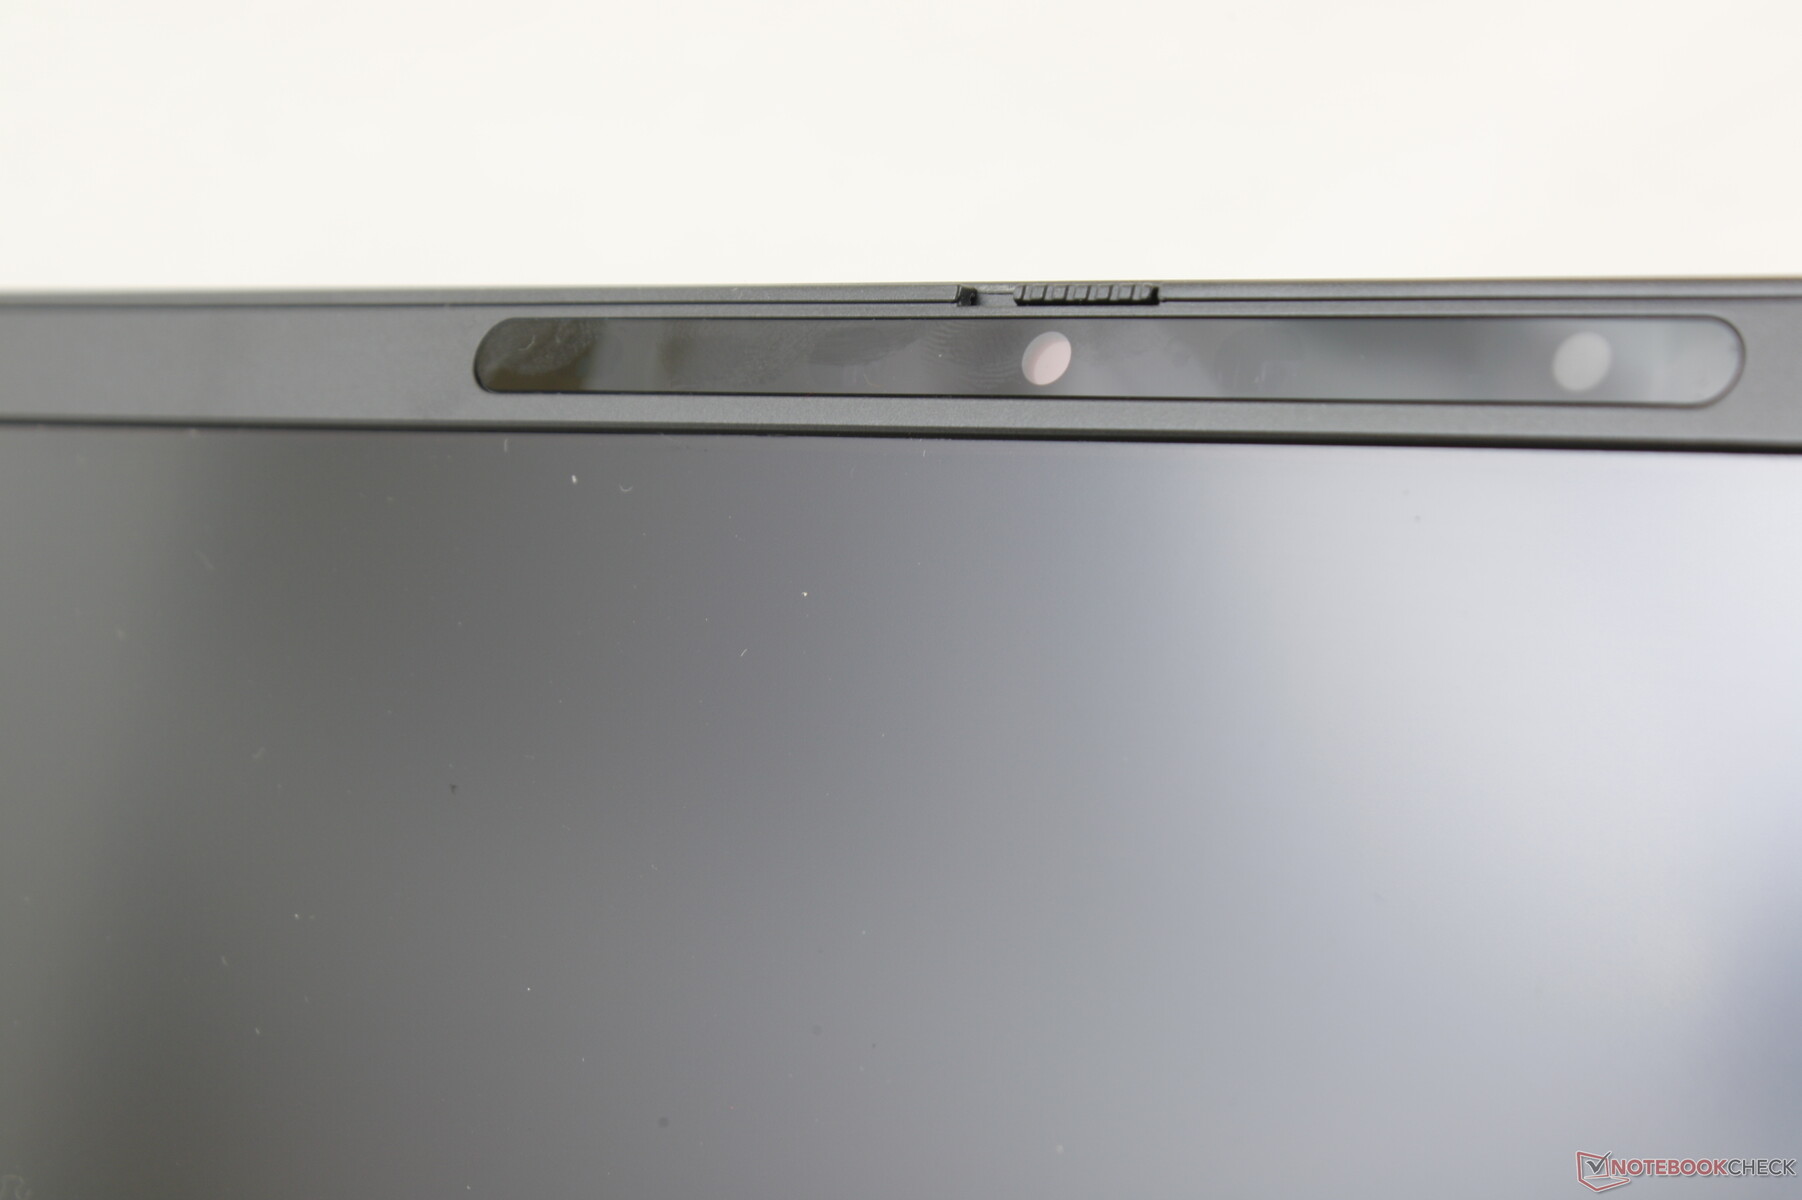
Webcam


Security
The same security features on the Latitude 7410 are also available on the Latitude 7310 including vPro, webcam shutter, fingerprint reader, IR camera, Dell Mobile Connect, and Dell's special proximity sensor for complete hands-free log in. Many of these are optional.
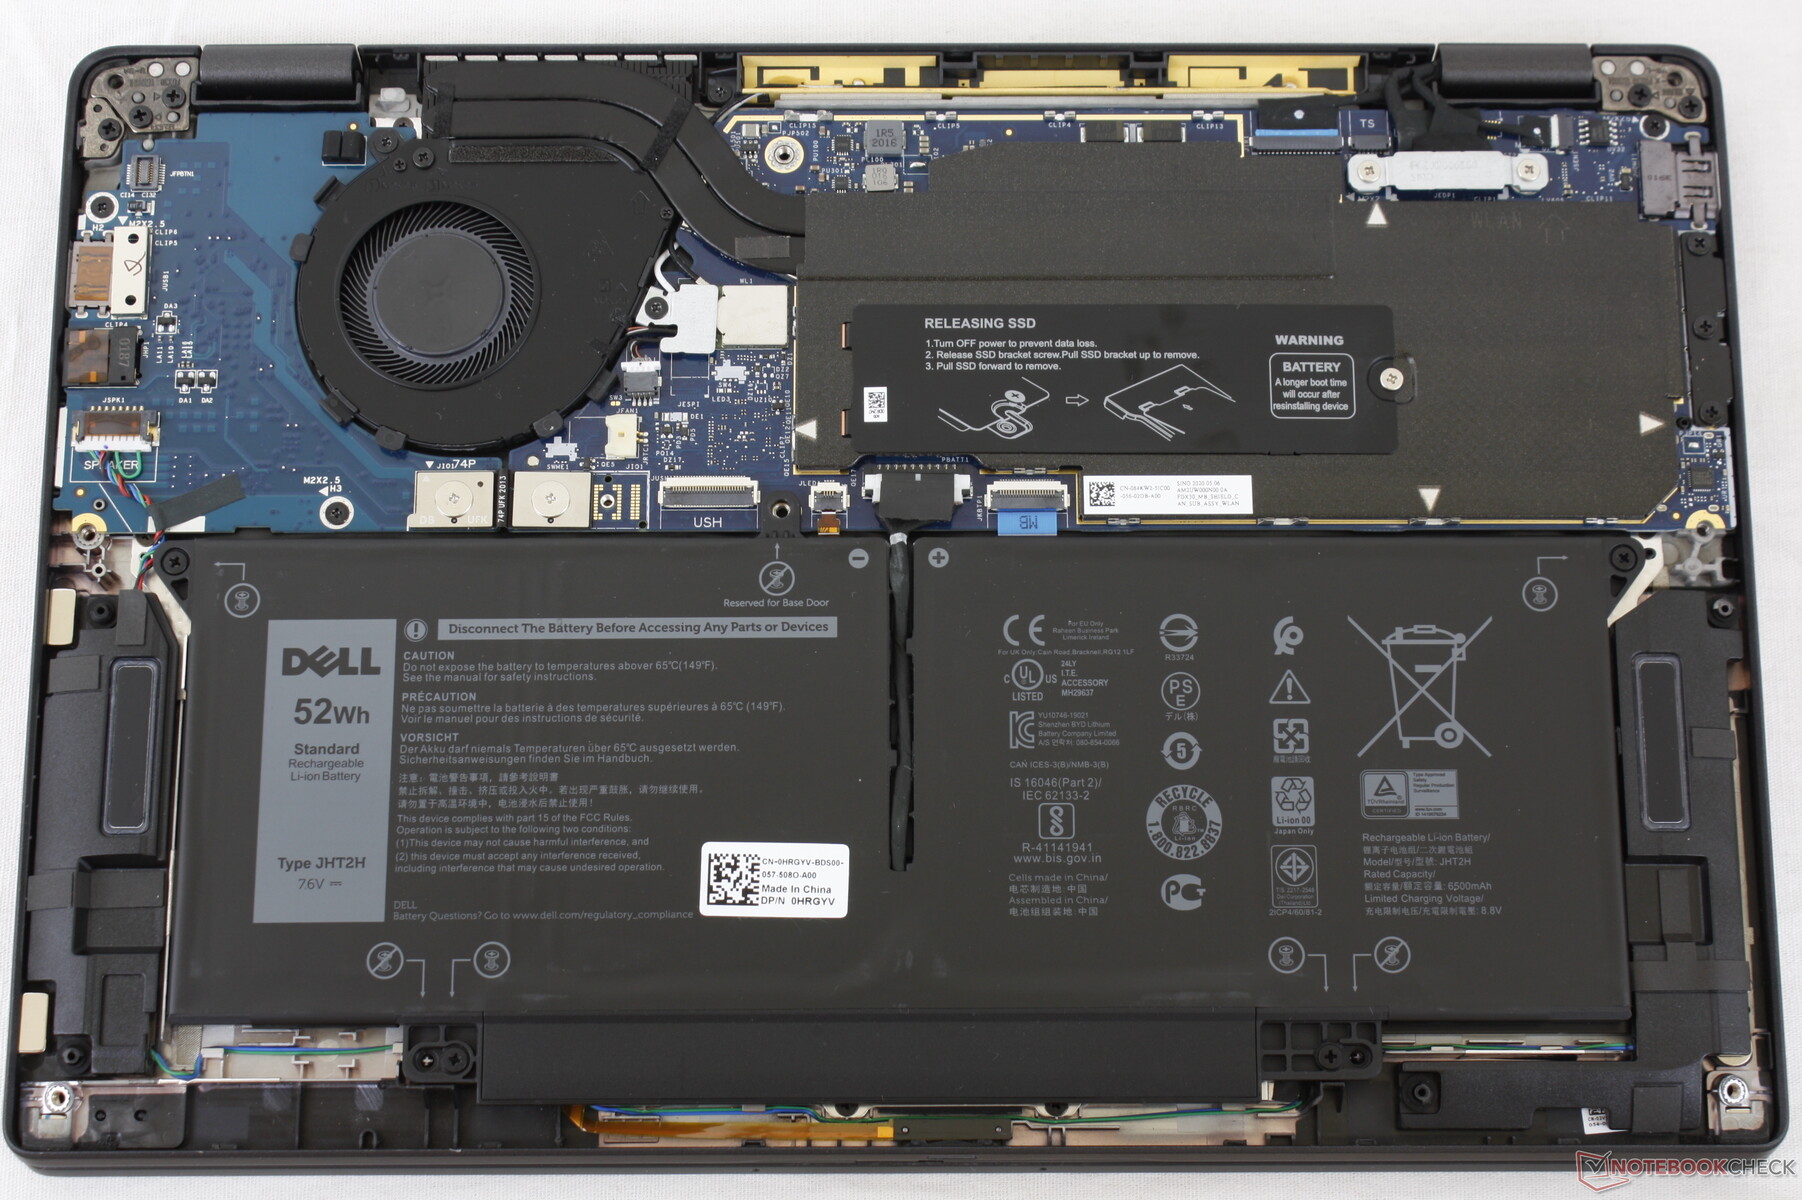
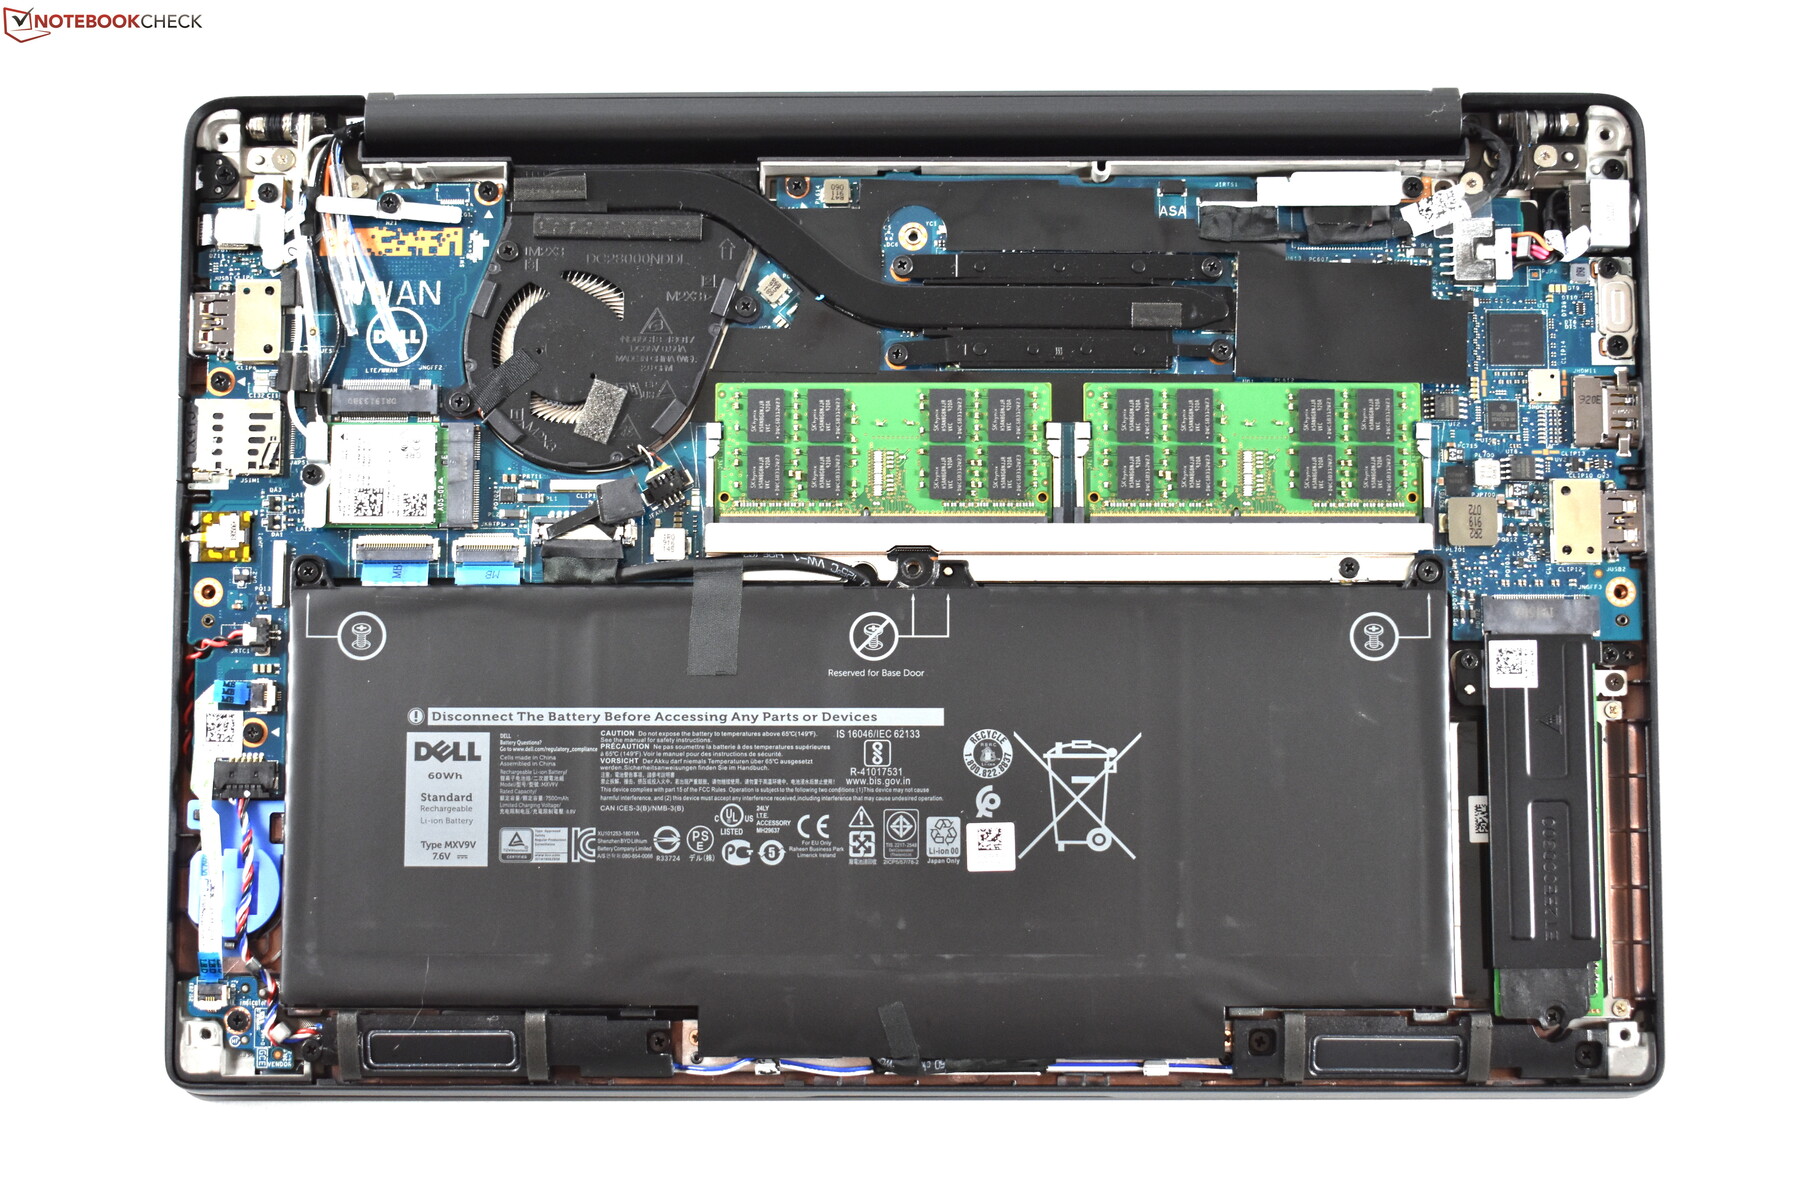
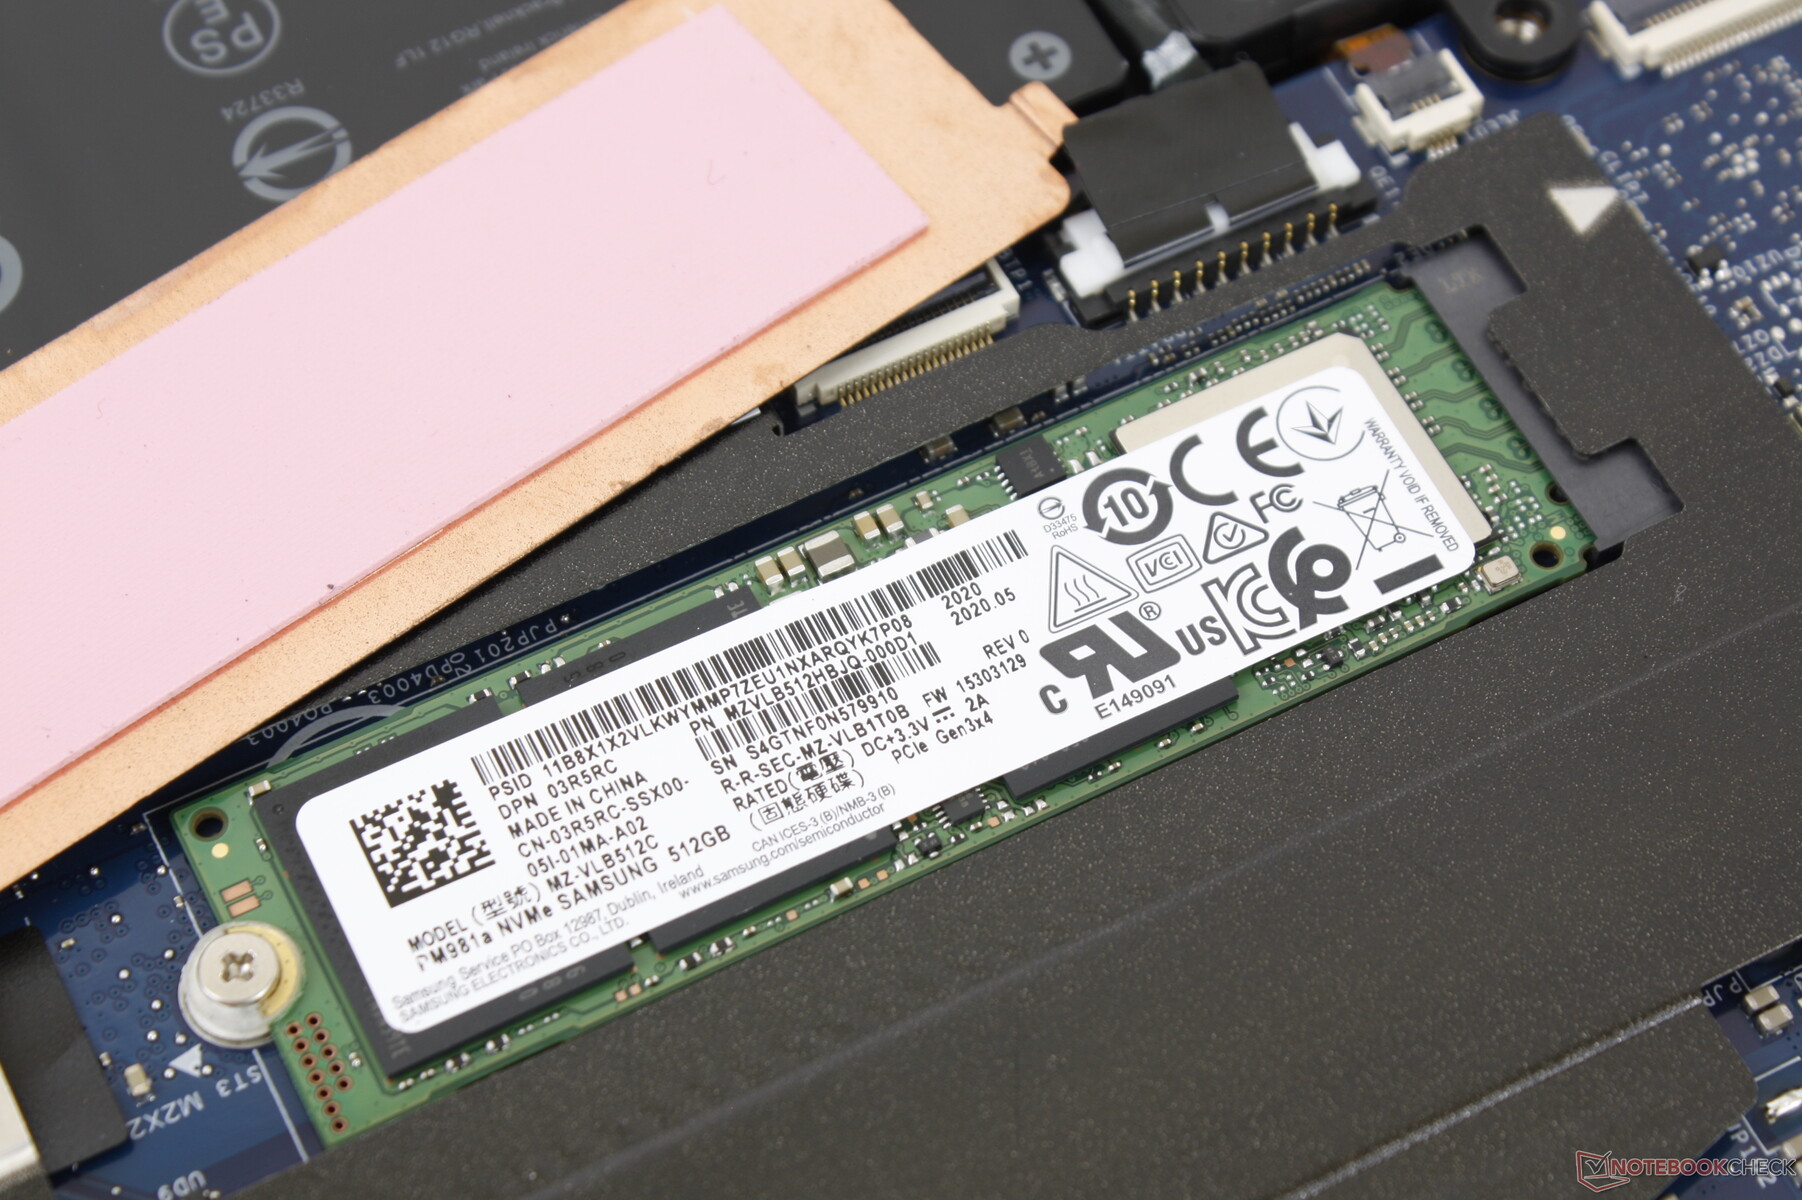
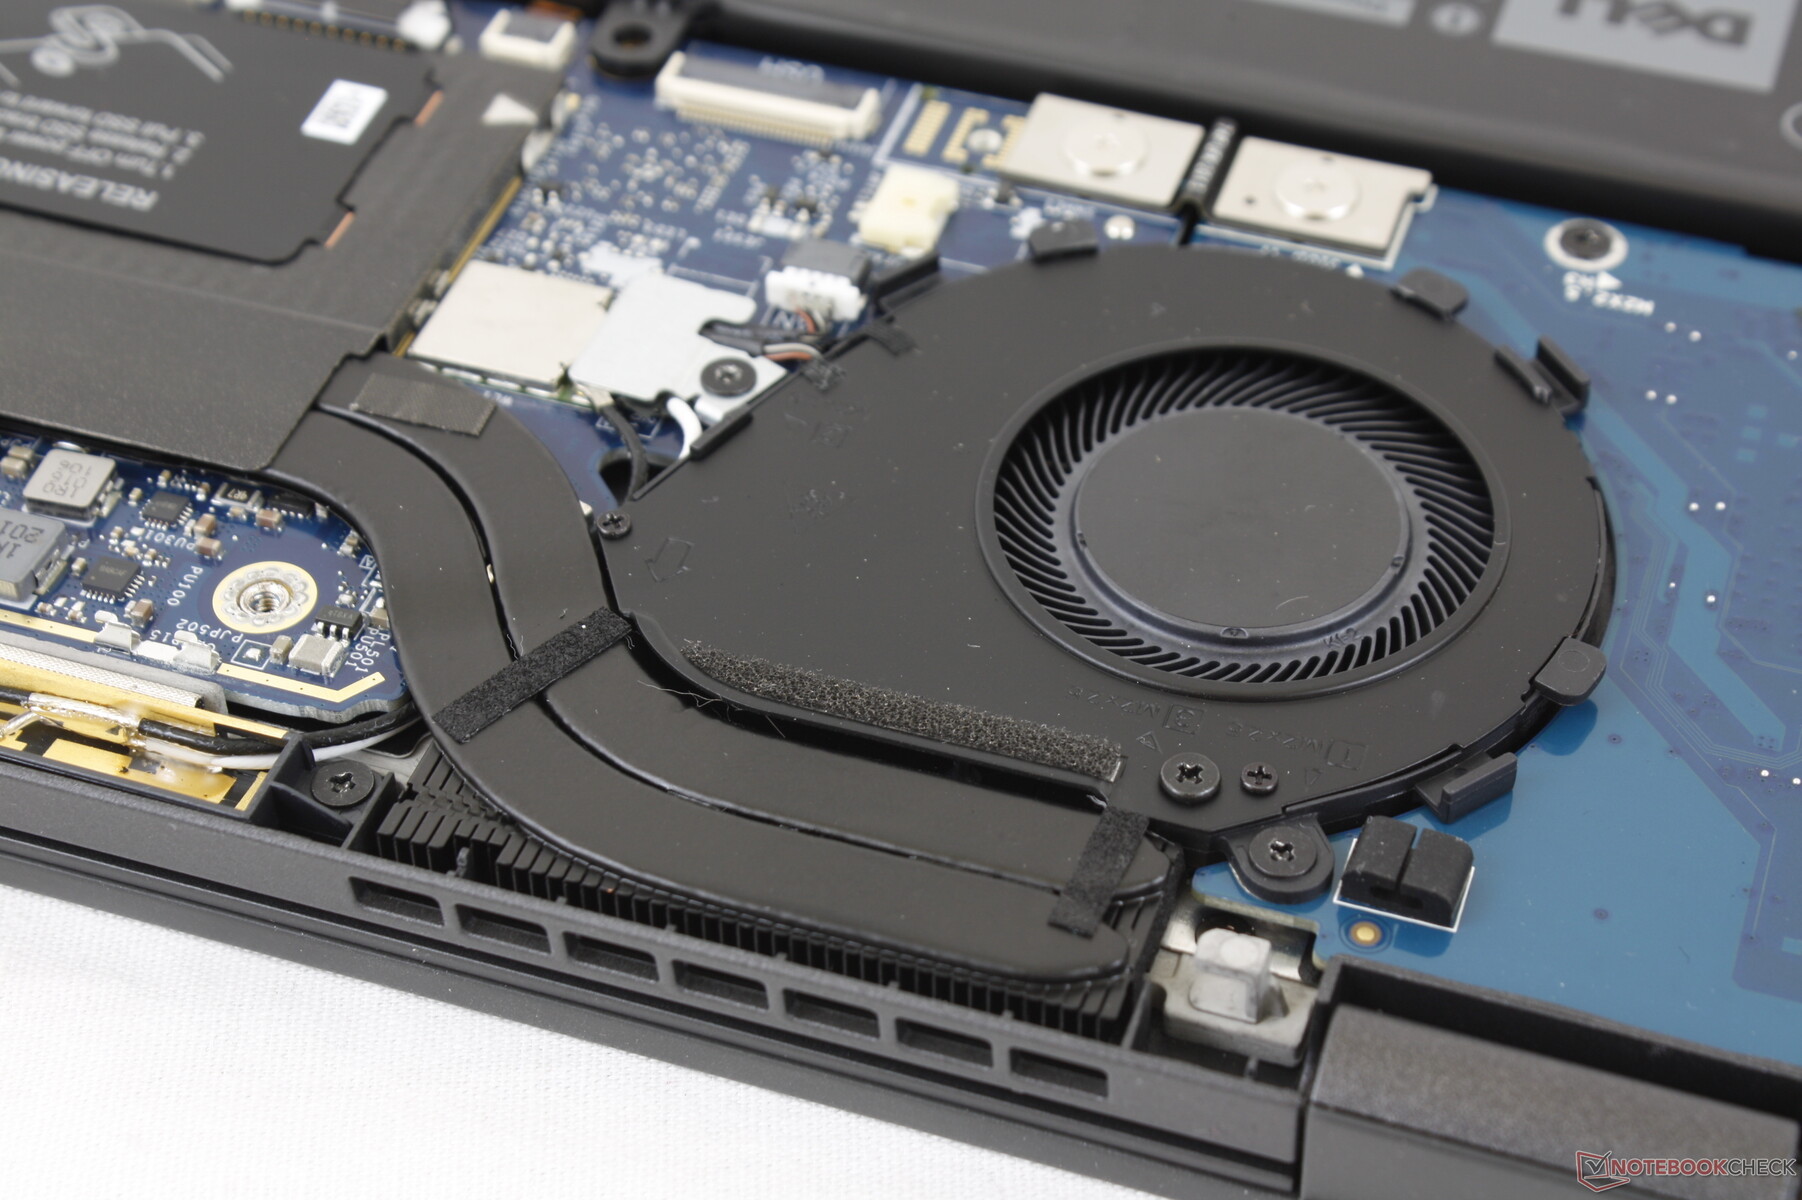
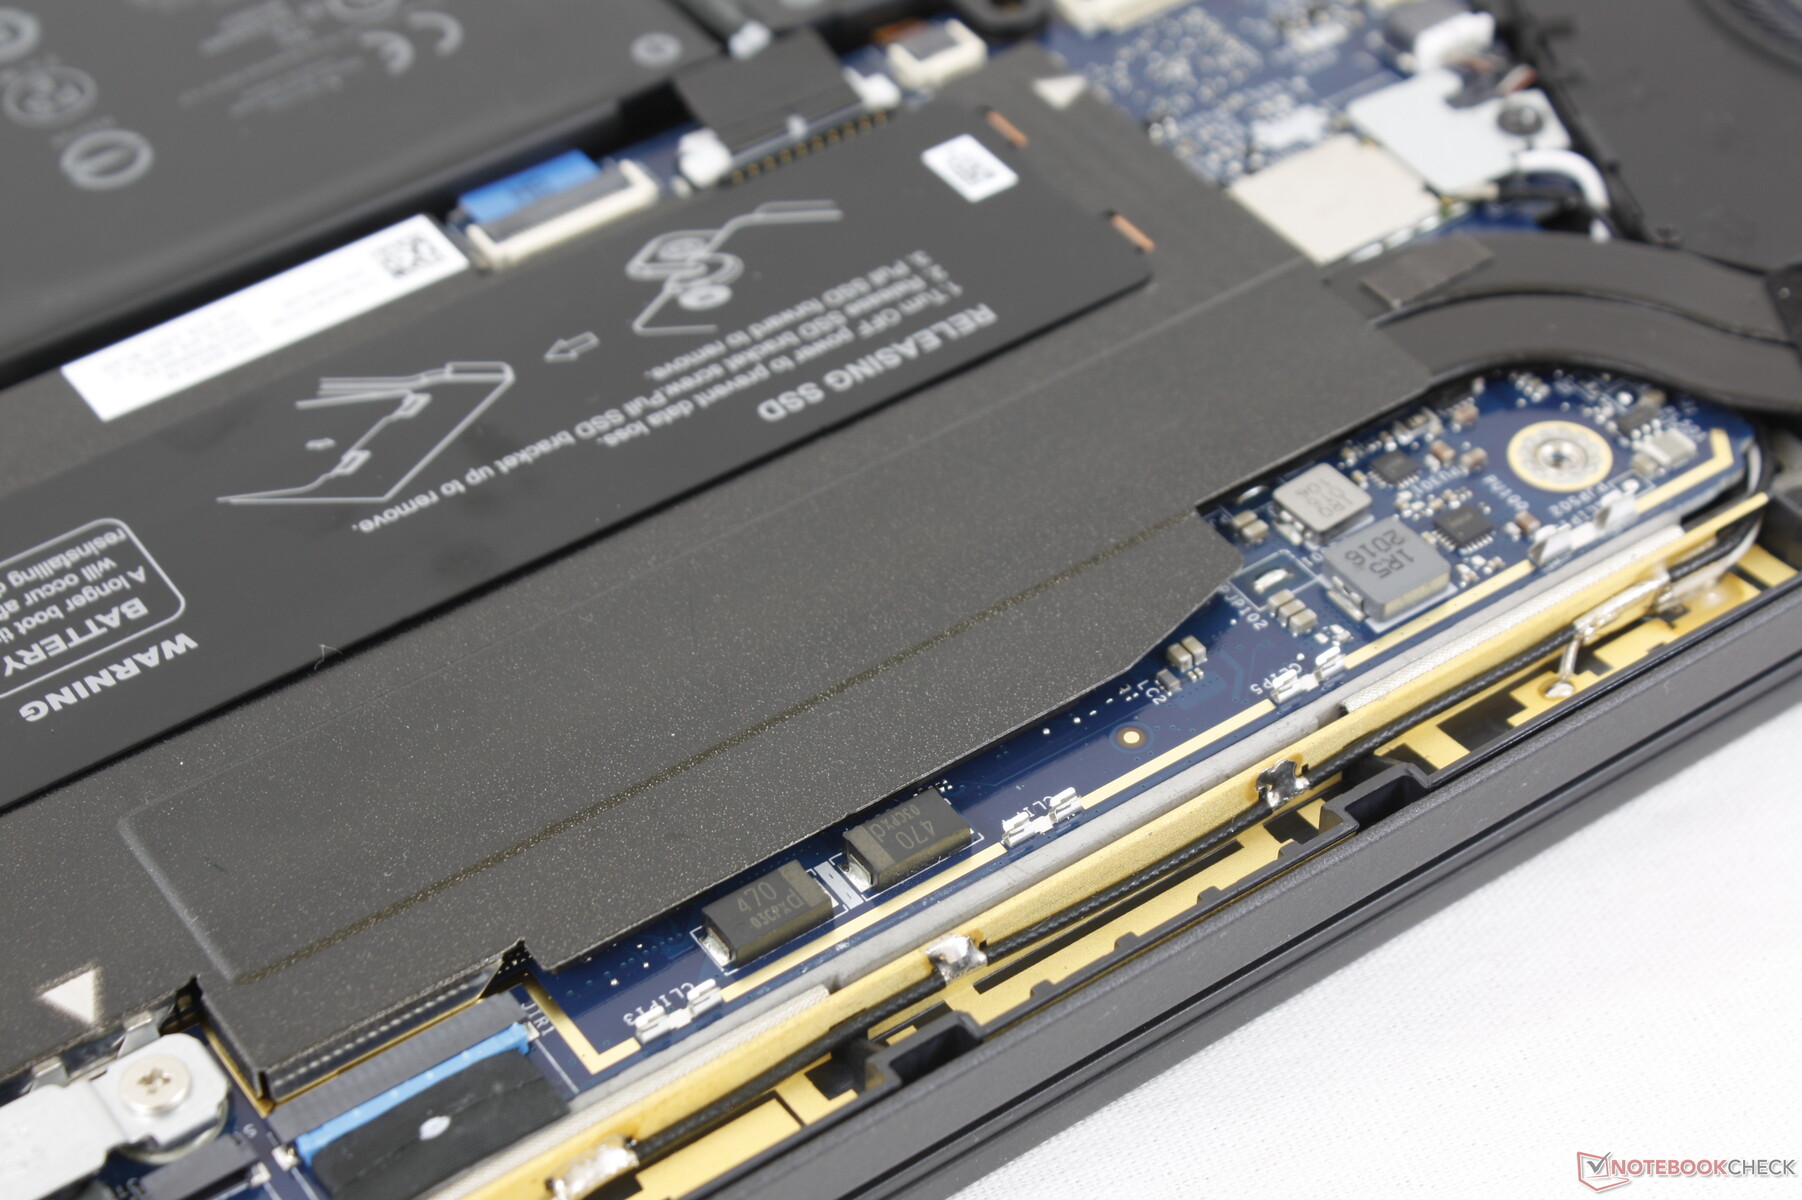
Maintenance
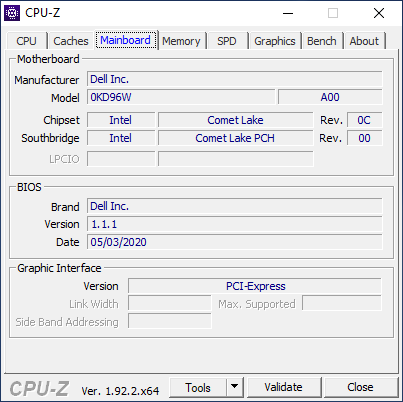
The bottom panel is secured by eight Philips screws for easy serviceability. There is not much to actually upgrade, however, as both RAM and WLAN are soldered which is a departure from the Latitude 7300. Note that the motherboard has a lot in common with the 14-inch Latitude 7410.
Accessories and Warranty
There are no extras in the box other than the AC adapter and usual paperwork. However, the dual Thunderbolt 3 ports allow for a wide array of docking stations, monitors, and other work-from-home extras like the Dell UltraSharp series.
A three-year limited warranty comes standard with options to extend up to five years.
Input Devices
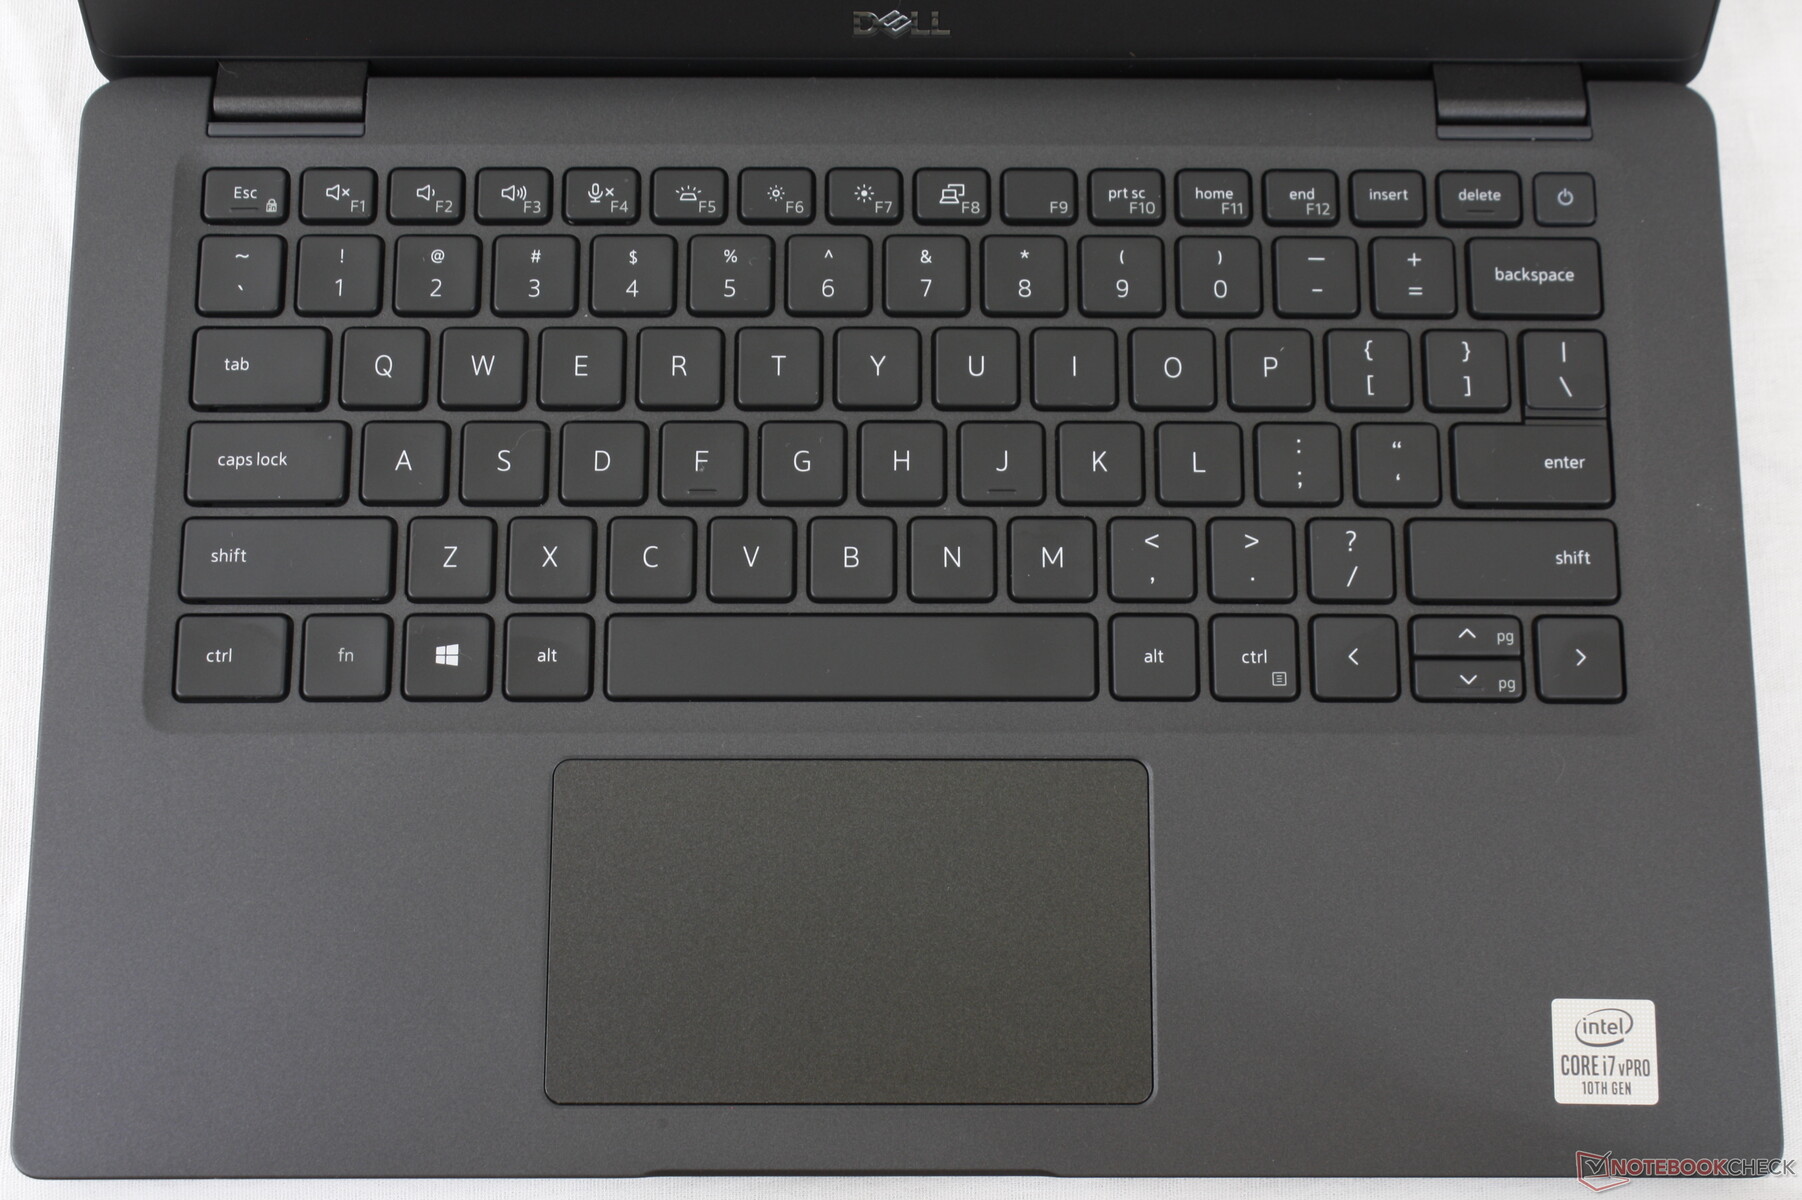
Keyboard
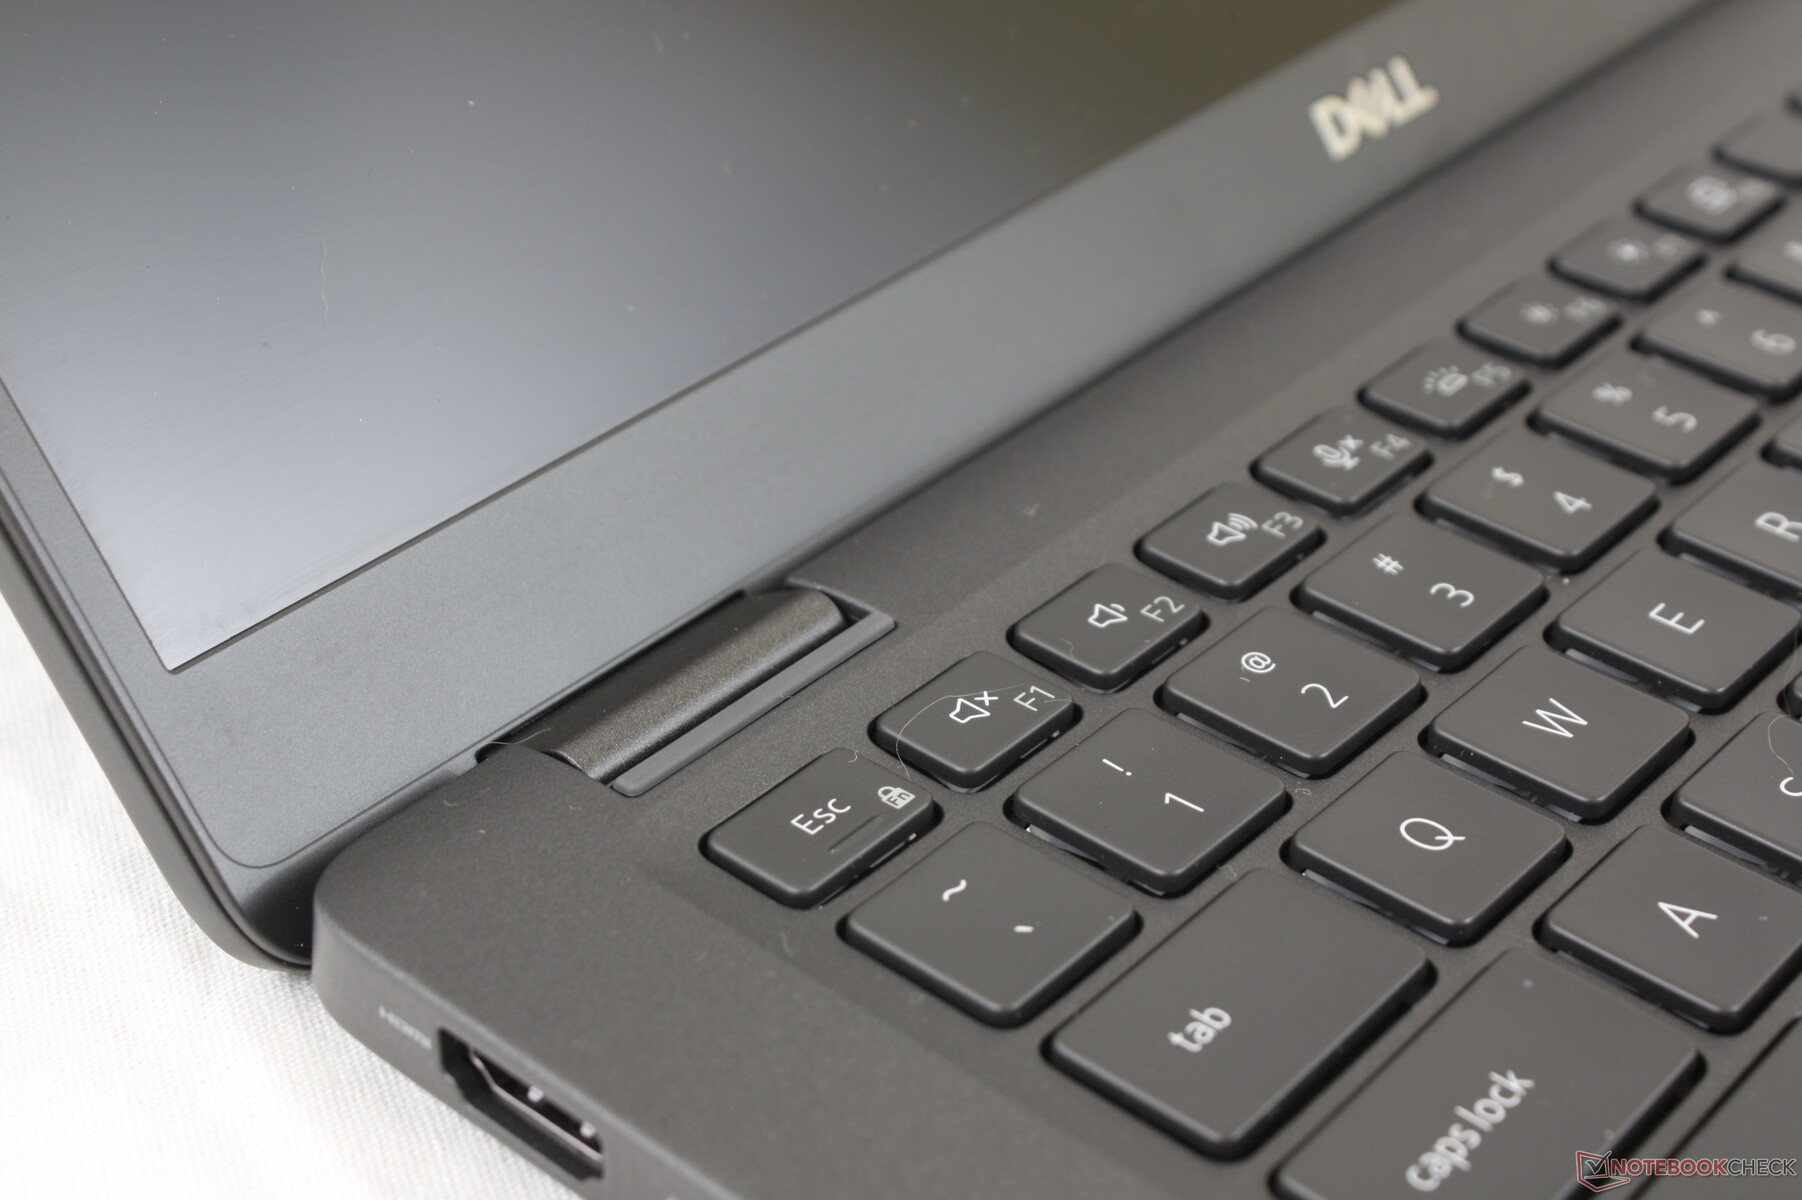
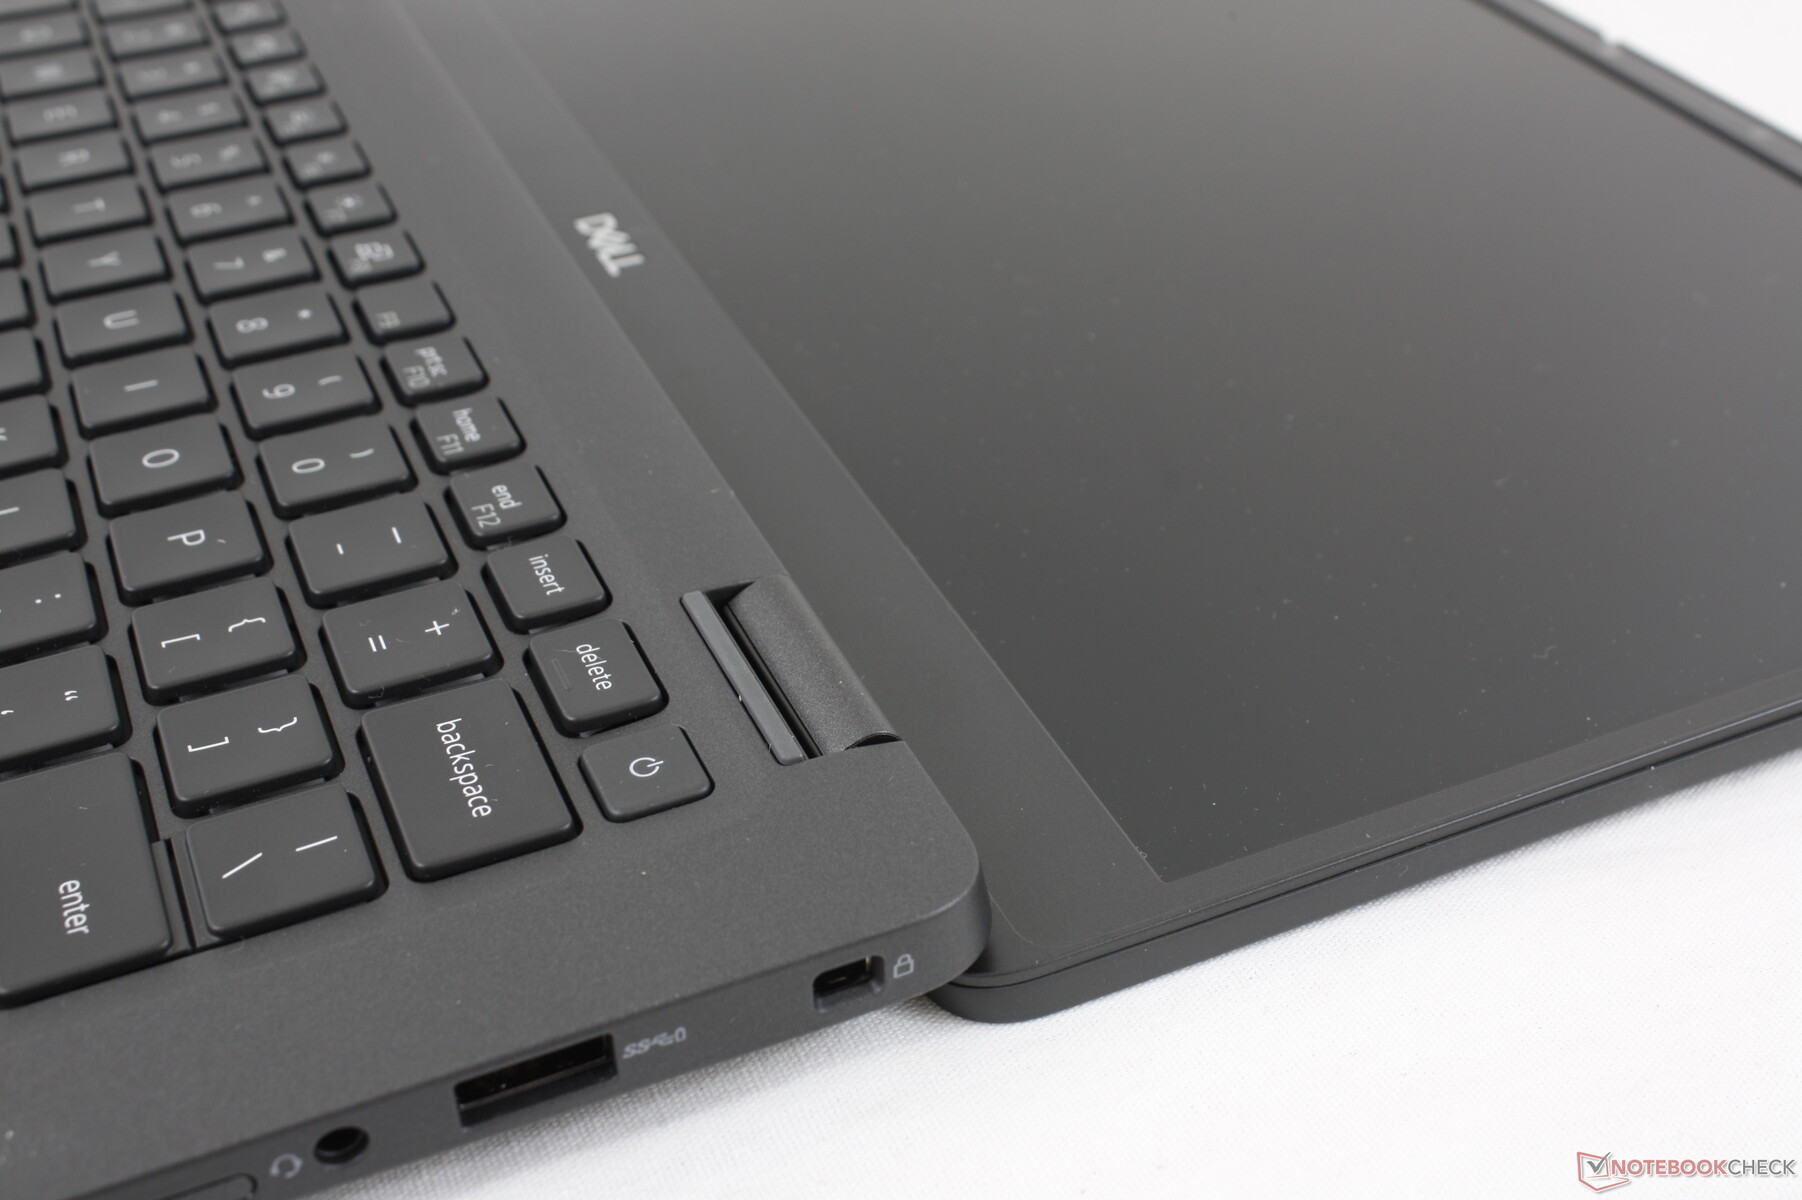
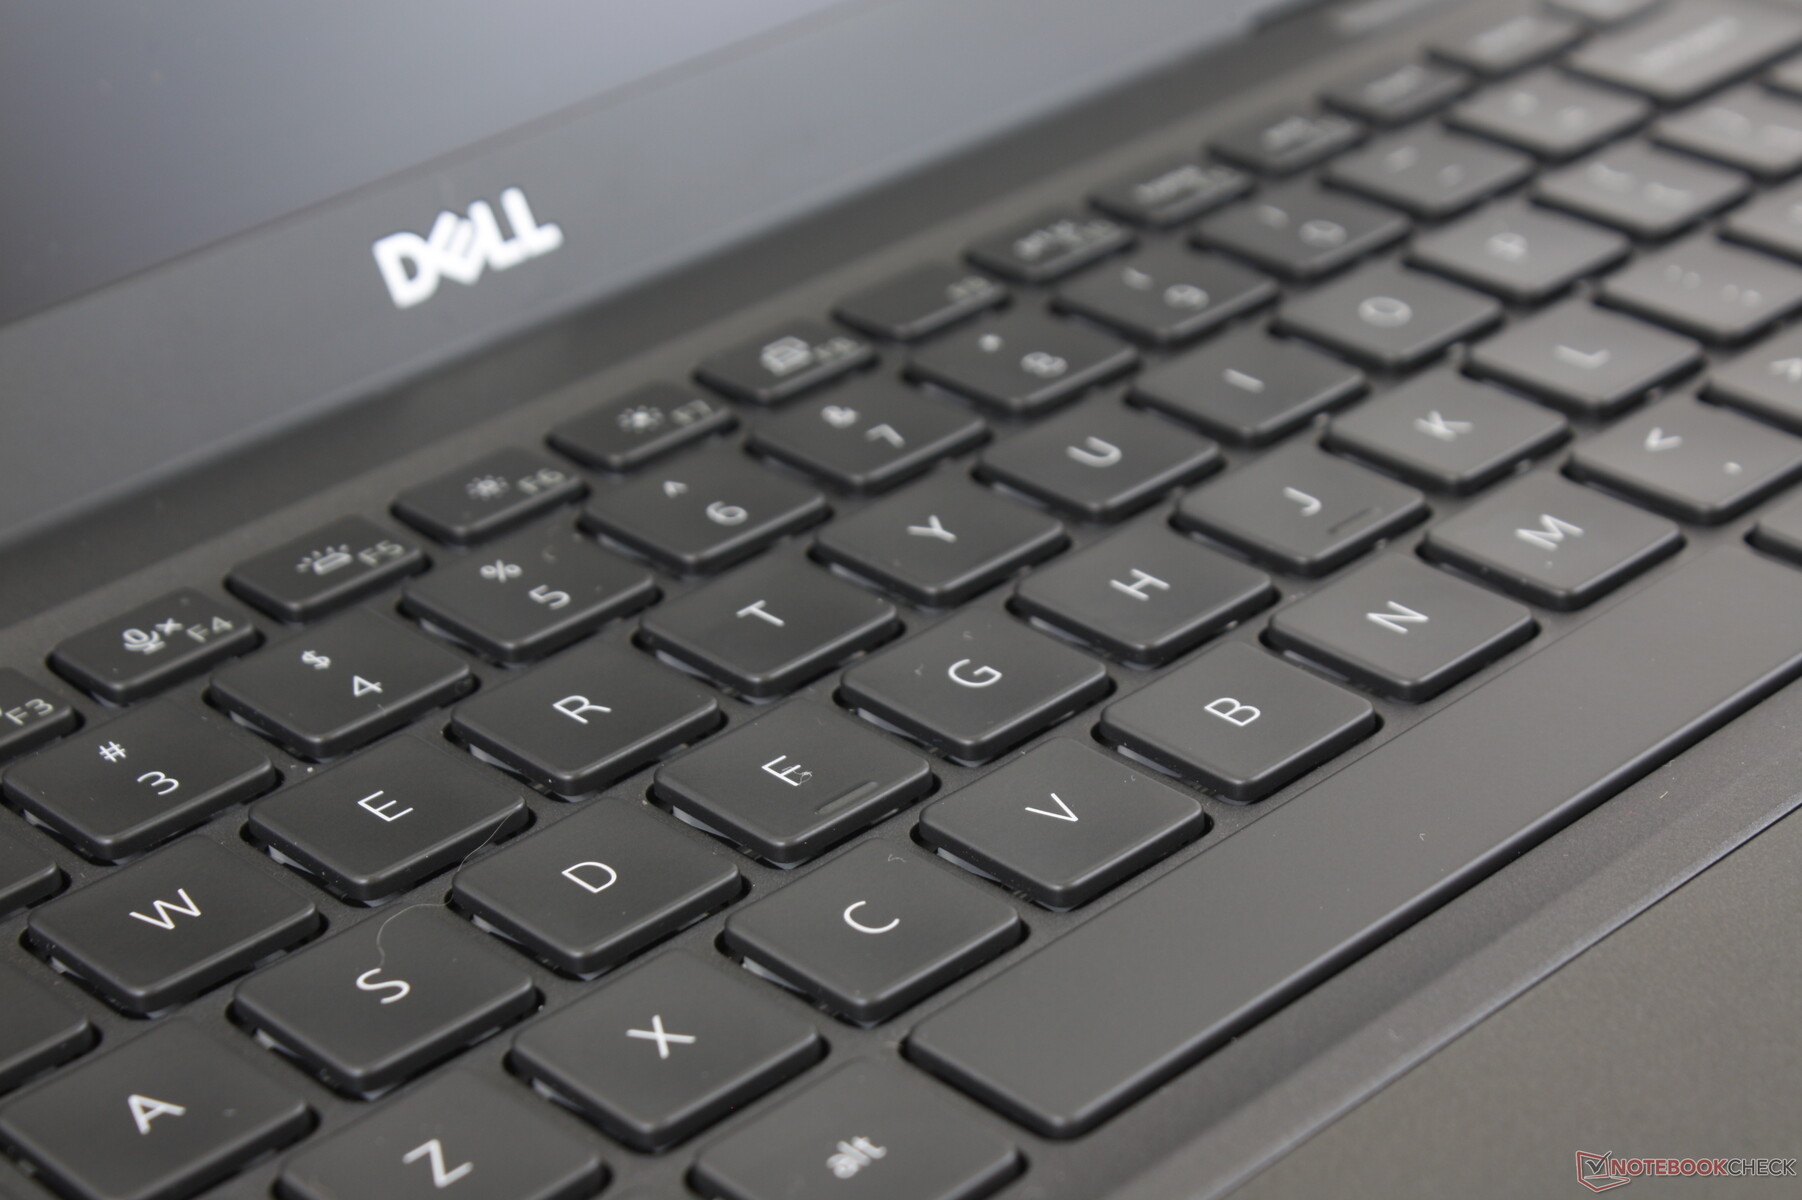
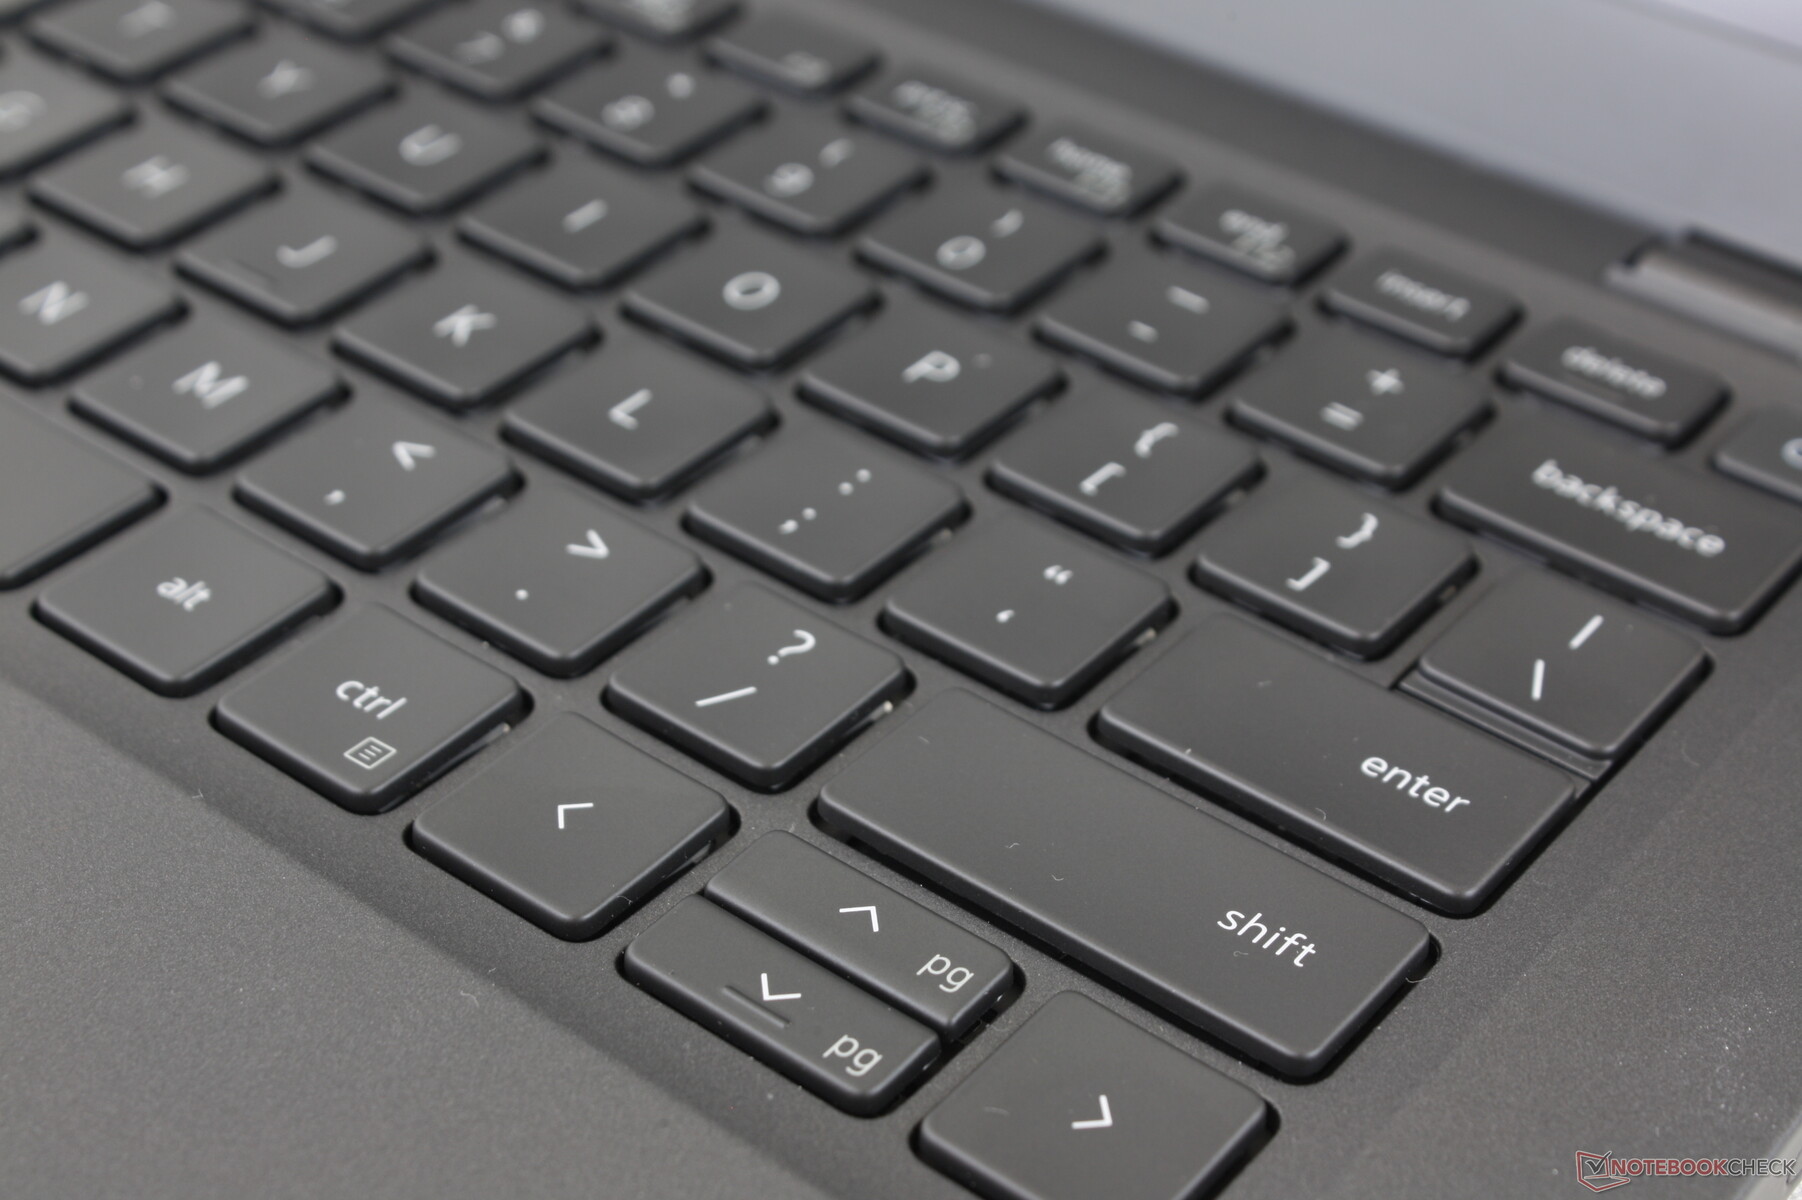
Keyboard layout and feedback are identical to the Latitude 7410 since the Latitude 7310 uses the same design. Typing feels essentially the same as on the Latitude 7300 with deeper key travel than the XPS 13 but with slightly spongier feedback than the HP Spectre 13. We find it more comfortable than the XPS 13 for typing as the keys are not as shallow. The main QWERTY keys are relatively quiet when pressed while the Space and Enter keys are noticeably louder.
A two-level keyboard backlight comes standard and all key symbols are illuminated save for the Power button on the top right.
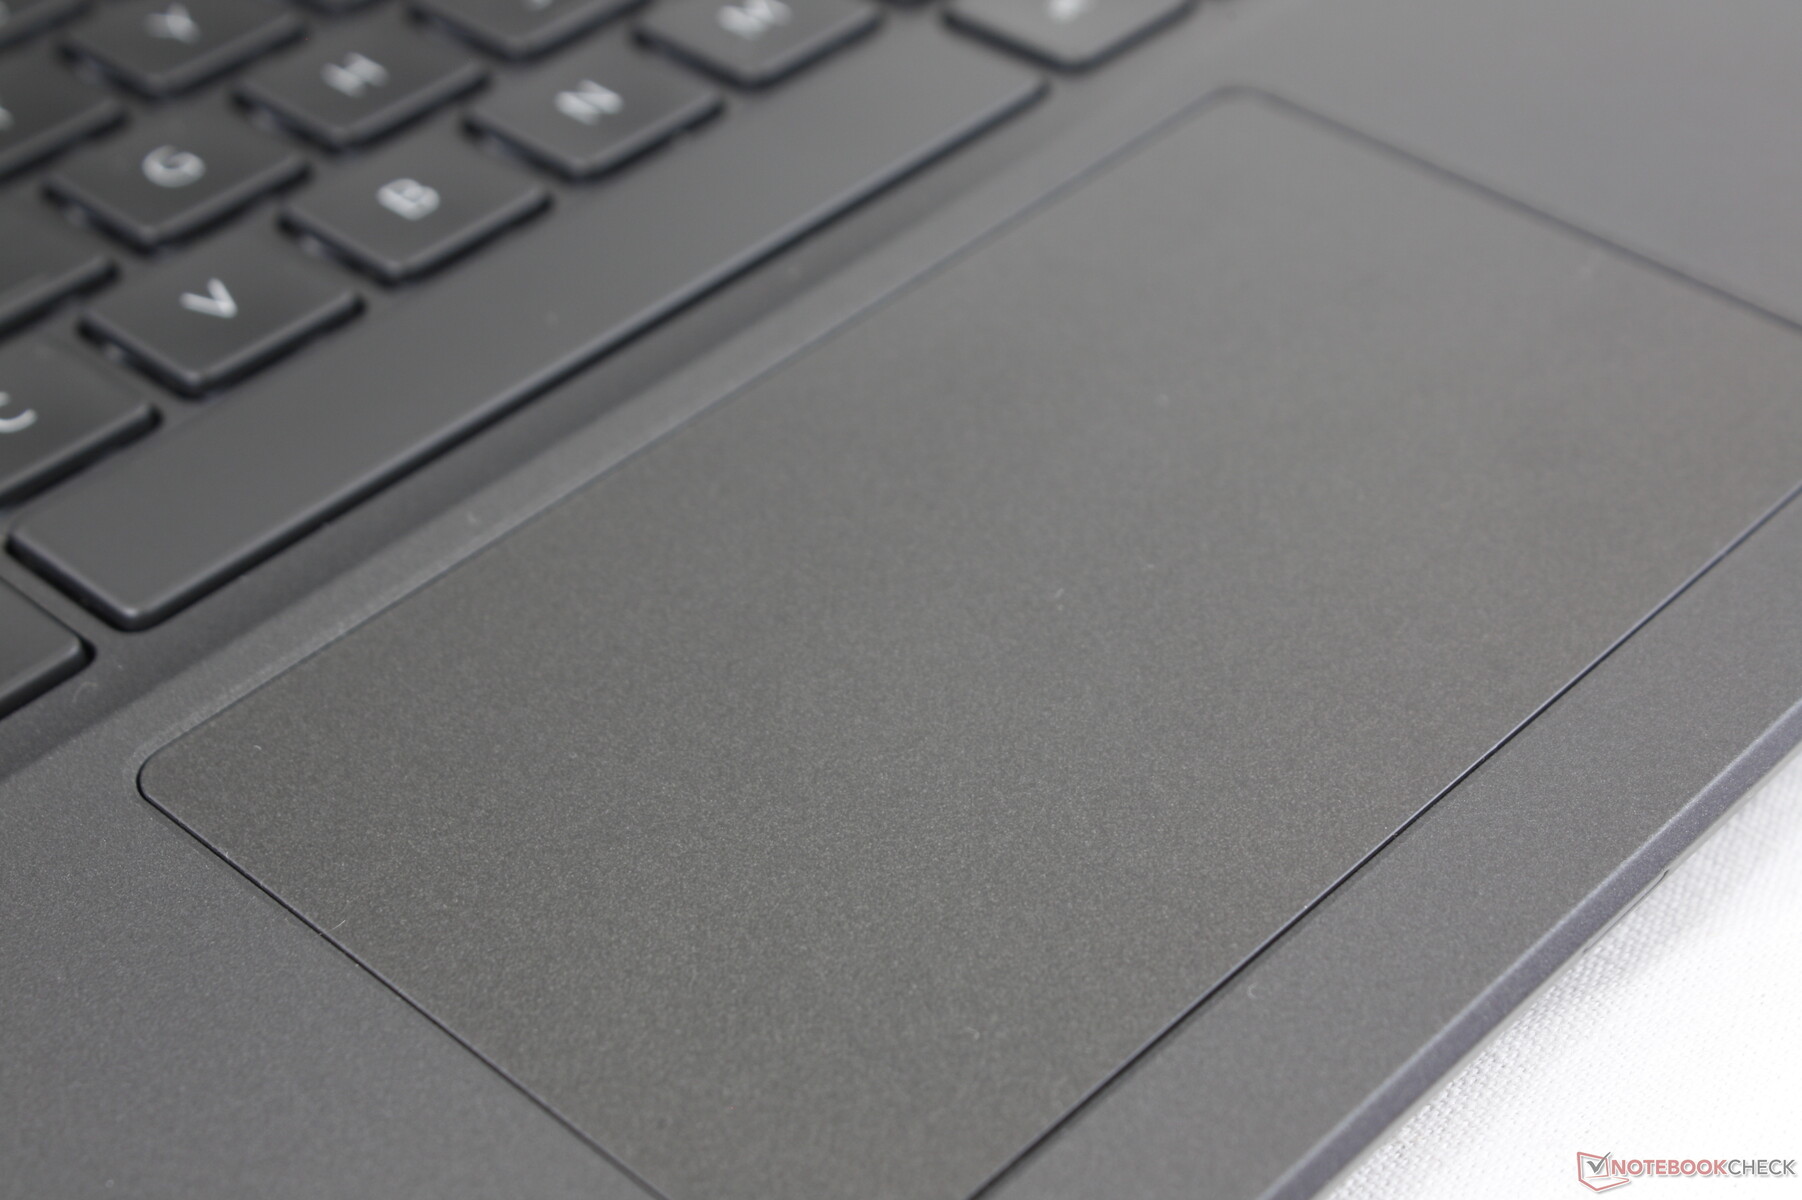
Touchpad
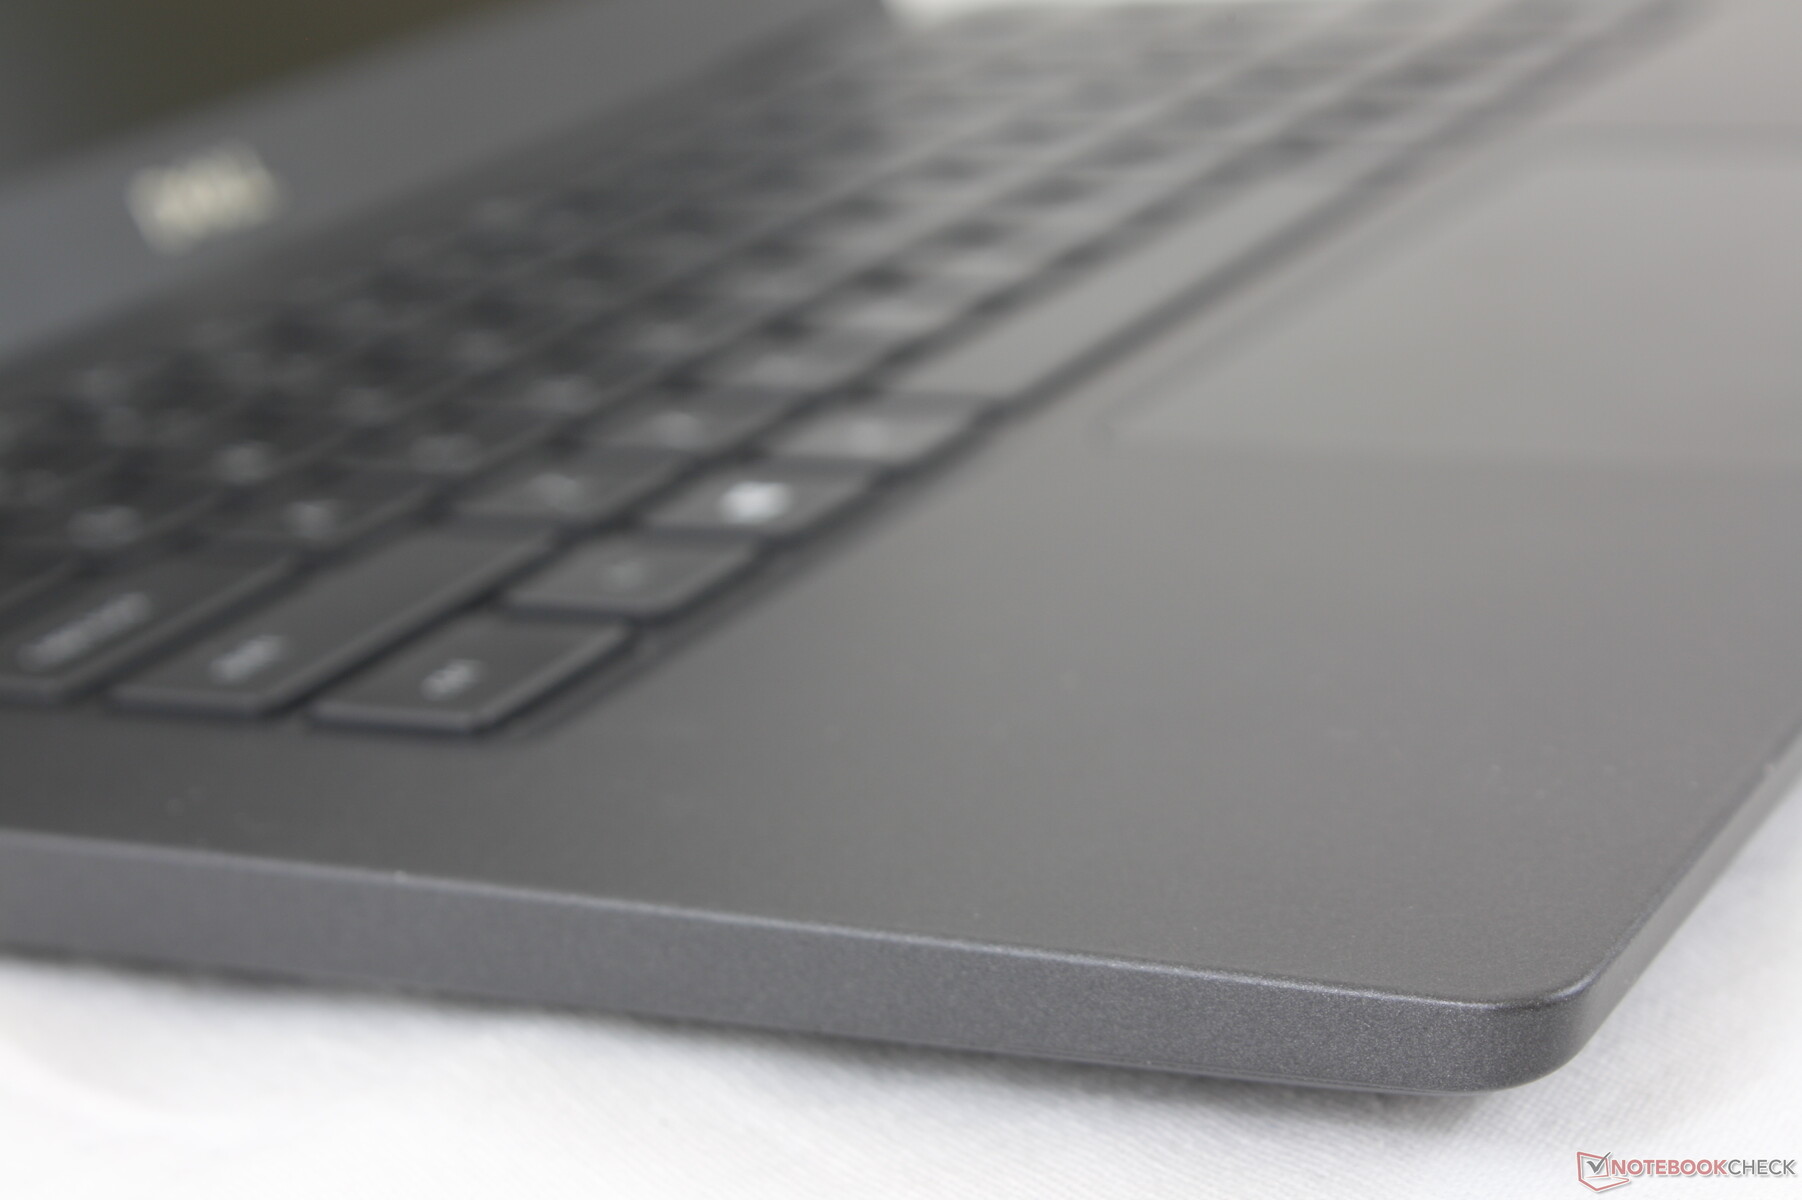
Much like the jump from the Latitude 7400 to the 7410, the Latitude 7310 omits the dedicated mouse buttons on the 7300 in favor of a larger clickpad (10.5 x 6.1 cm vs. 10 x 5 cm). The result makes scrolling easier and not as confined at the cost of precision and more difficult dragging-and-dropping. This is worsened by the fact that the new clickpad keys are spongy with soft and unsatisfying feedback when pressed. We prefer the older Latitude 7300 touchpad for this reason.
On the bright side, the clickpad surface is smooth and almost texture-less with very little sticking. Clicking is also quieter than on most other laptops, but this is likely due to the soft feedback mentioned above.
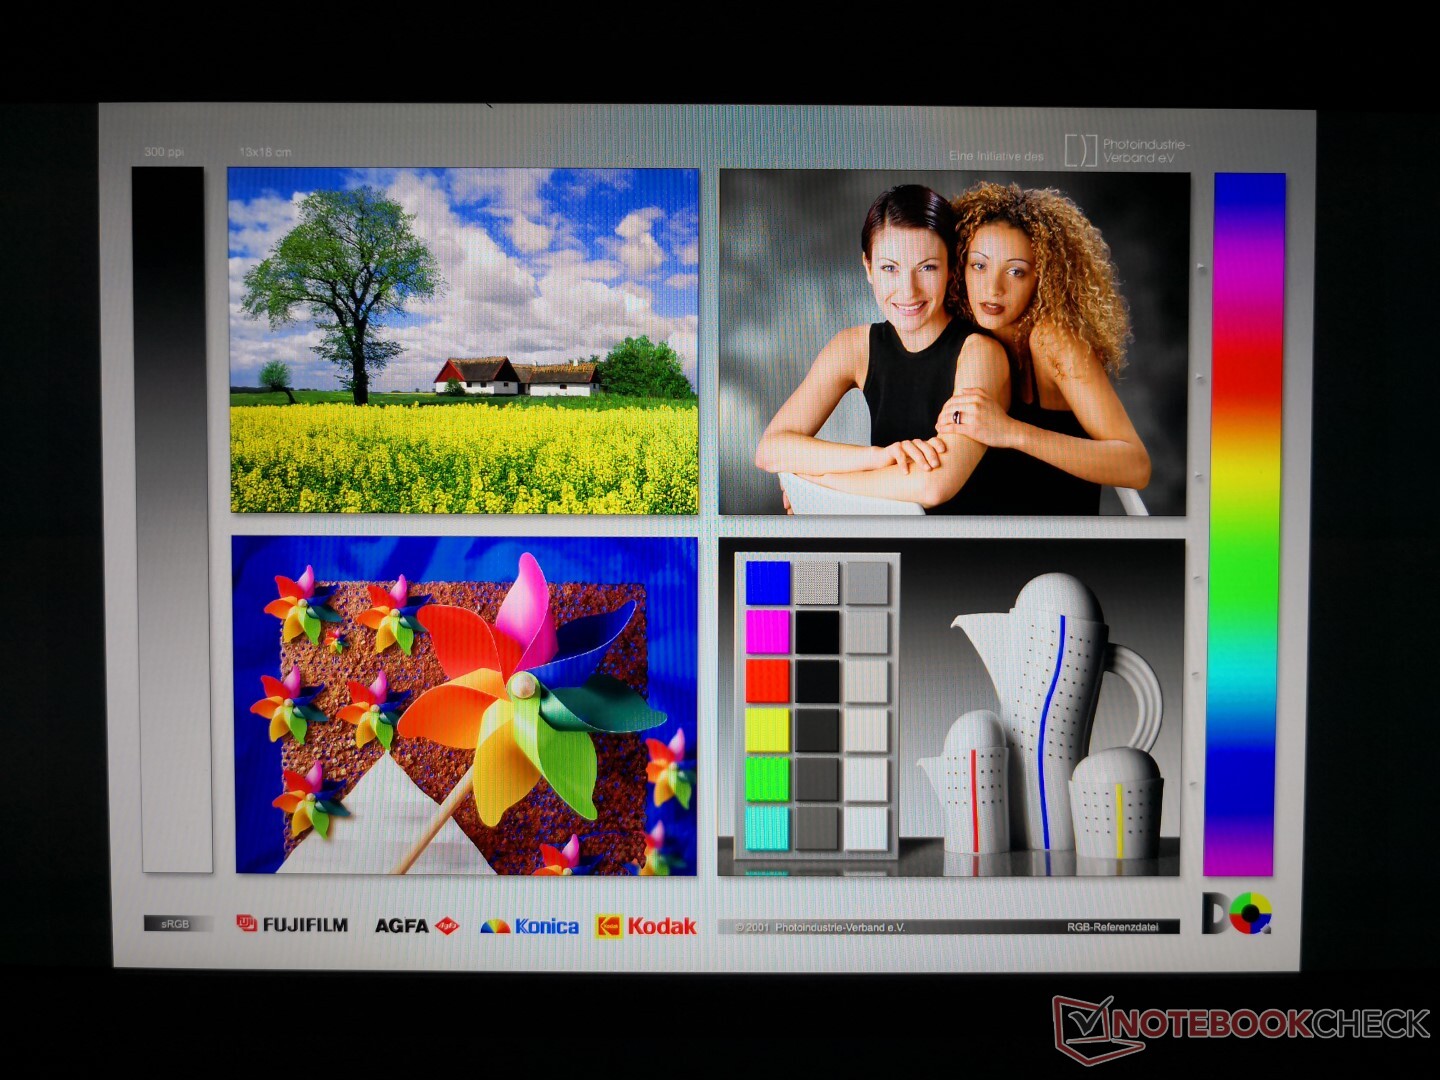
Display
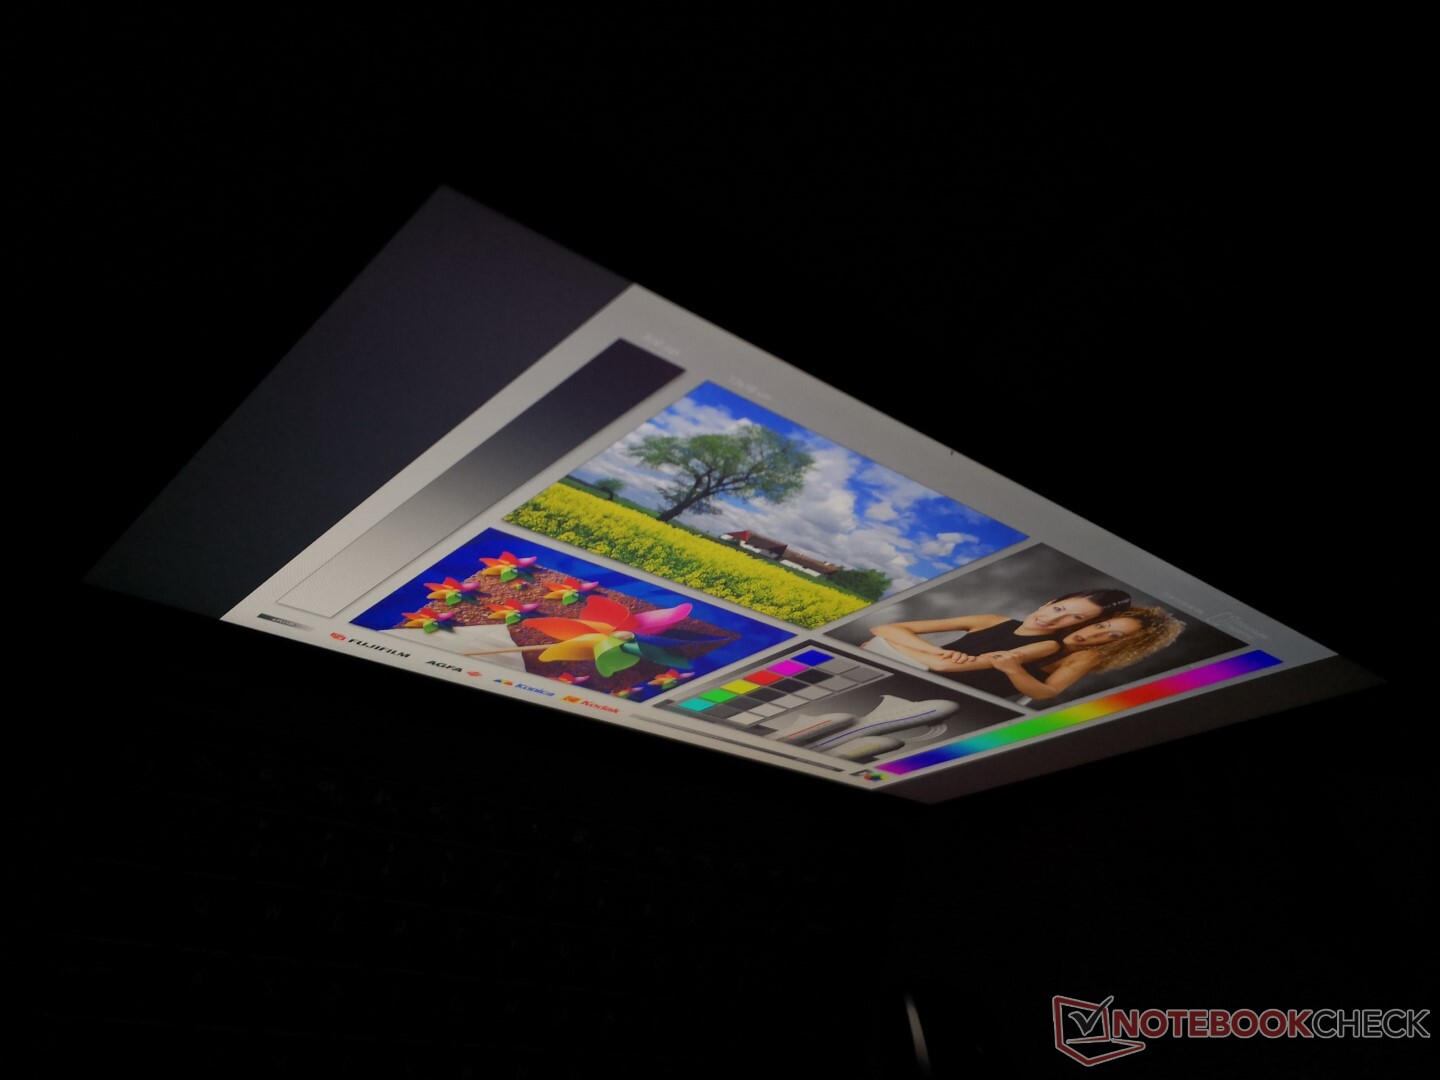
Our Latitude 7310 comes with the same AU Optronics B133HAN 1080p IPS panel as found on the 2018 Latitude 7390. Thus, both of these systems share similar display characteristics despite their two-year gap. Contrast and colors remain excellent with average brightness and response times for the category.
The low blue light panel option on the Latitude 7410 is not available here on the Latitude 7310 series.

| |||||||||||||||||||||||||
Brightness Distribution: 89 %
Center on Battery: 332.7 cd/m²
Contrast: 1331:1 (Black: 0.25 cd/m²)
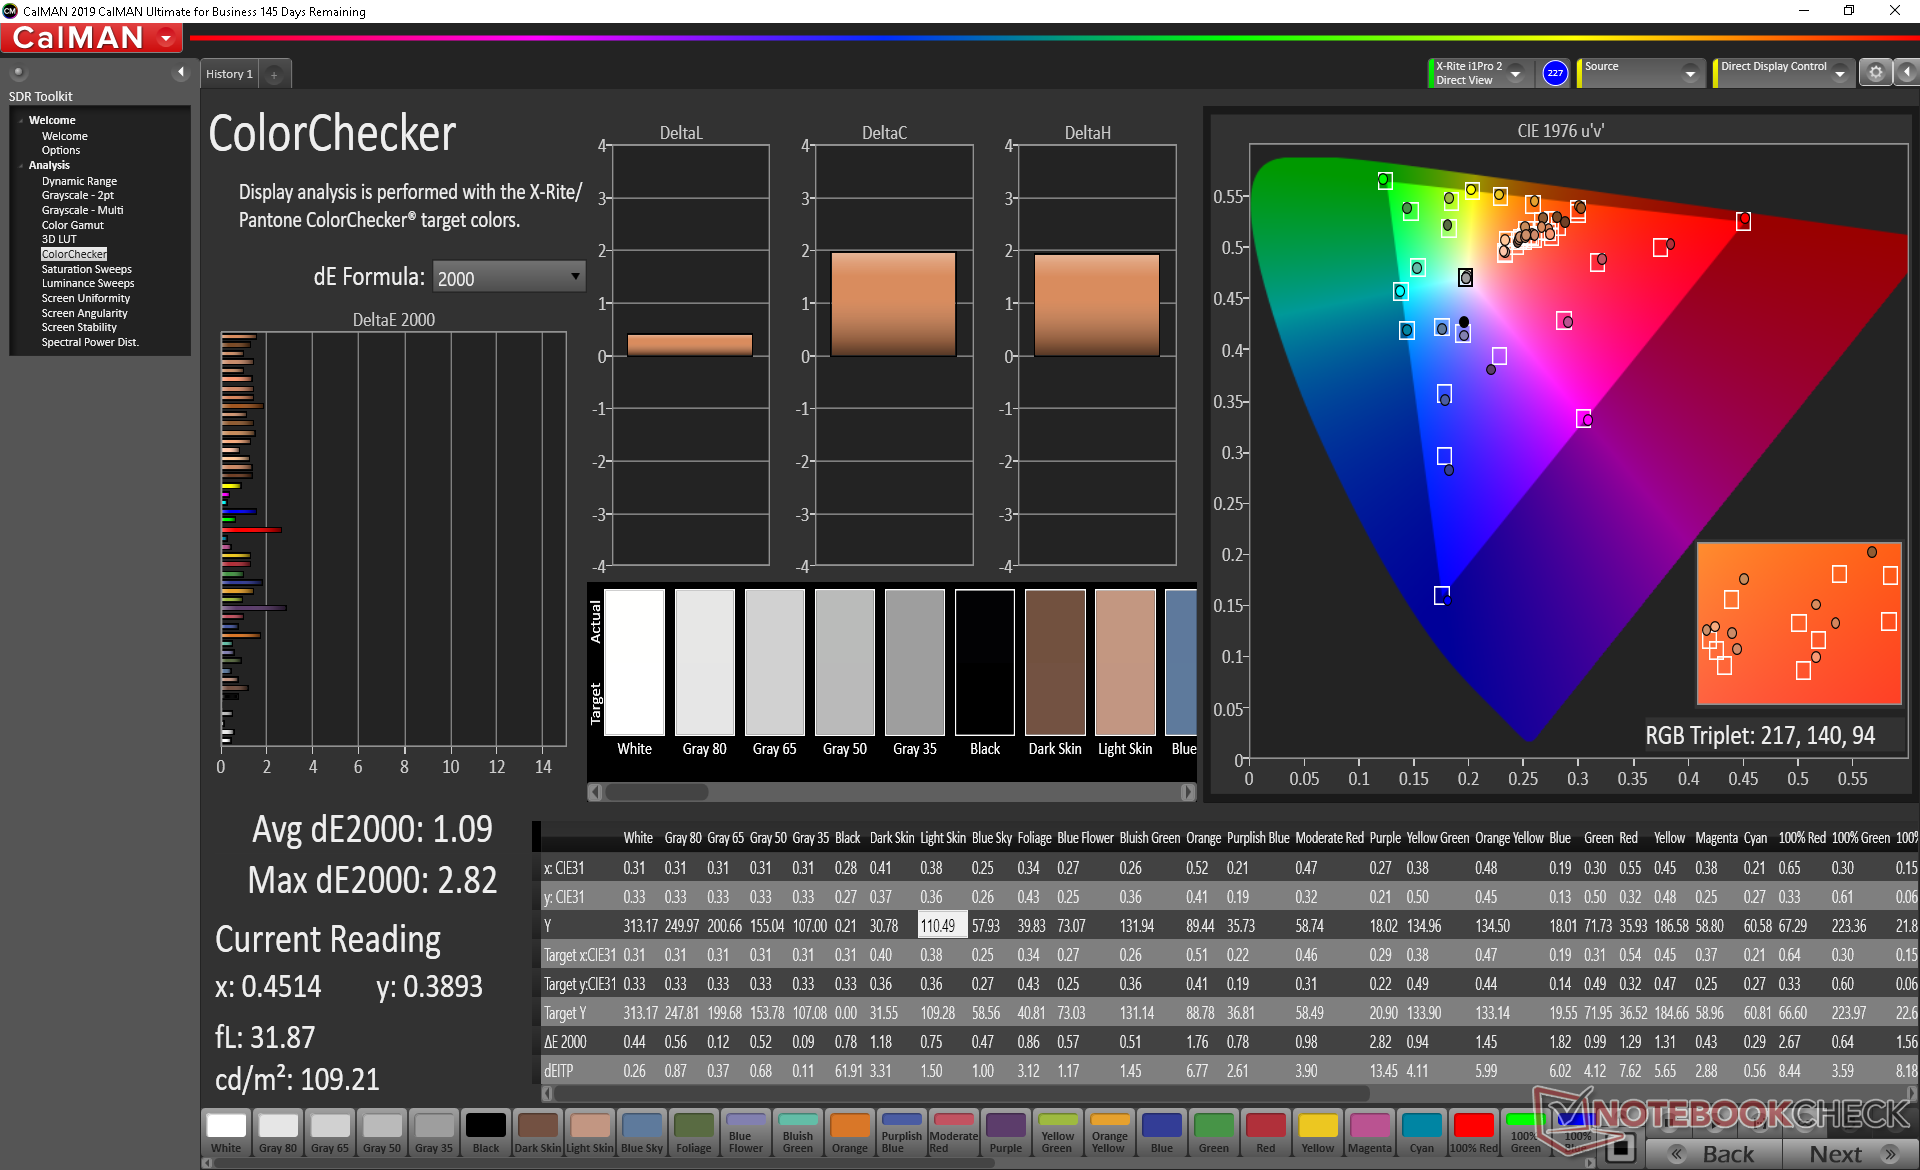
ΔE ColorChecker Calman: 2.15 | ∀{0.5-29.43 Ø4.78}
calibrated: 1.09
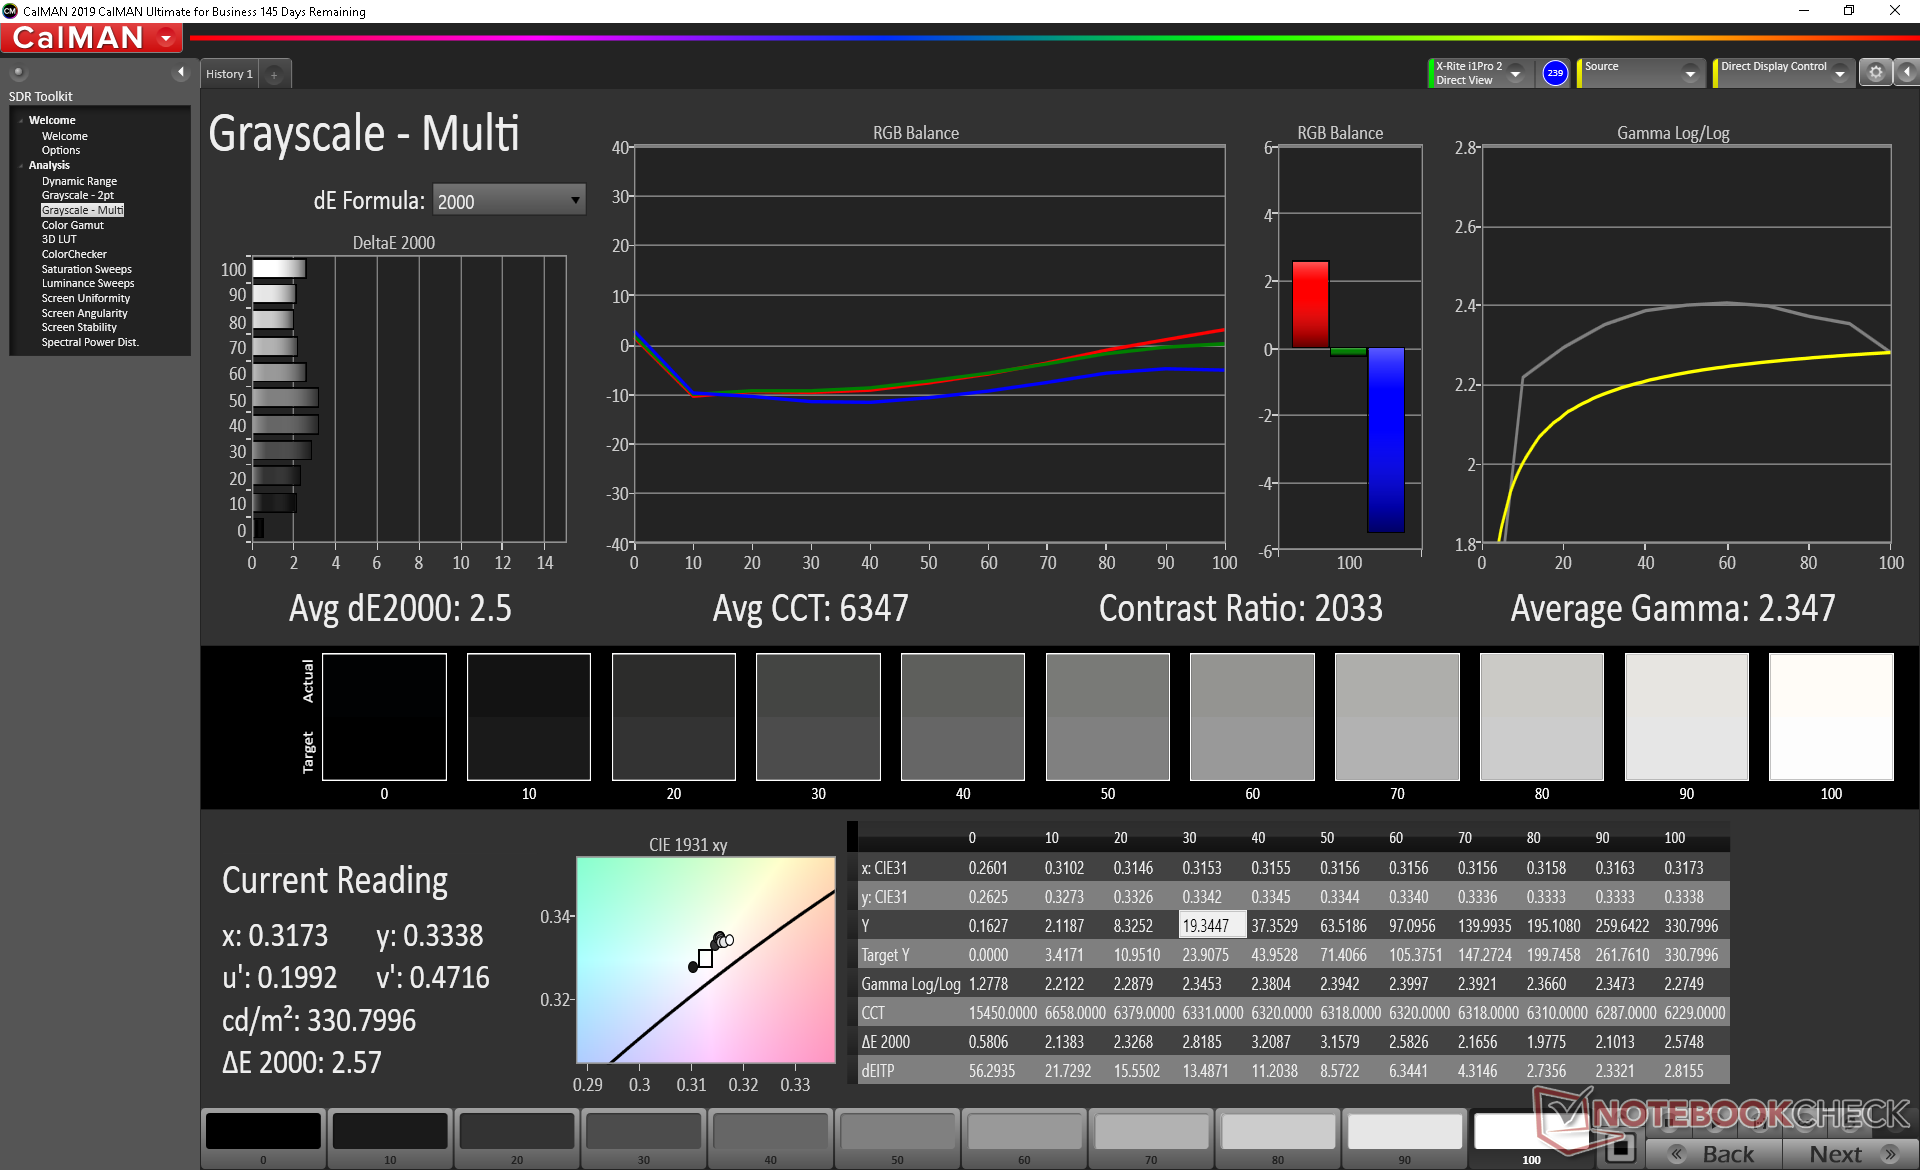
ΔE Greyscale Calman: 2.5 | ∀{0.09-98 Ø5}
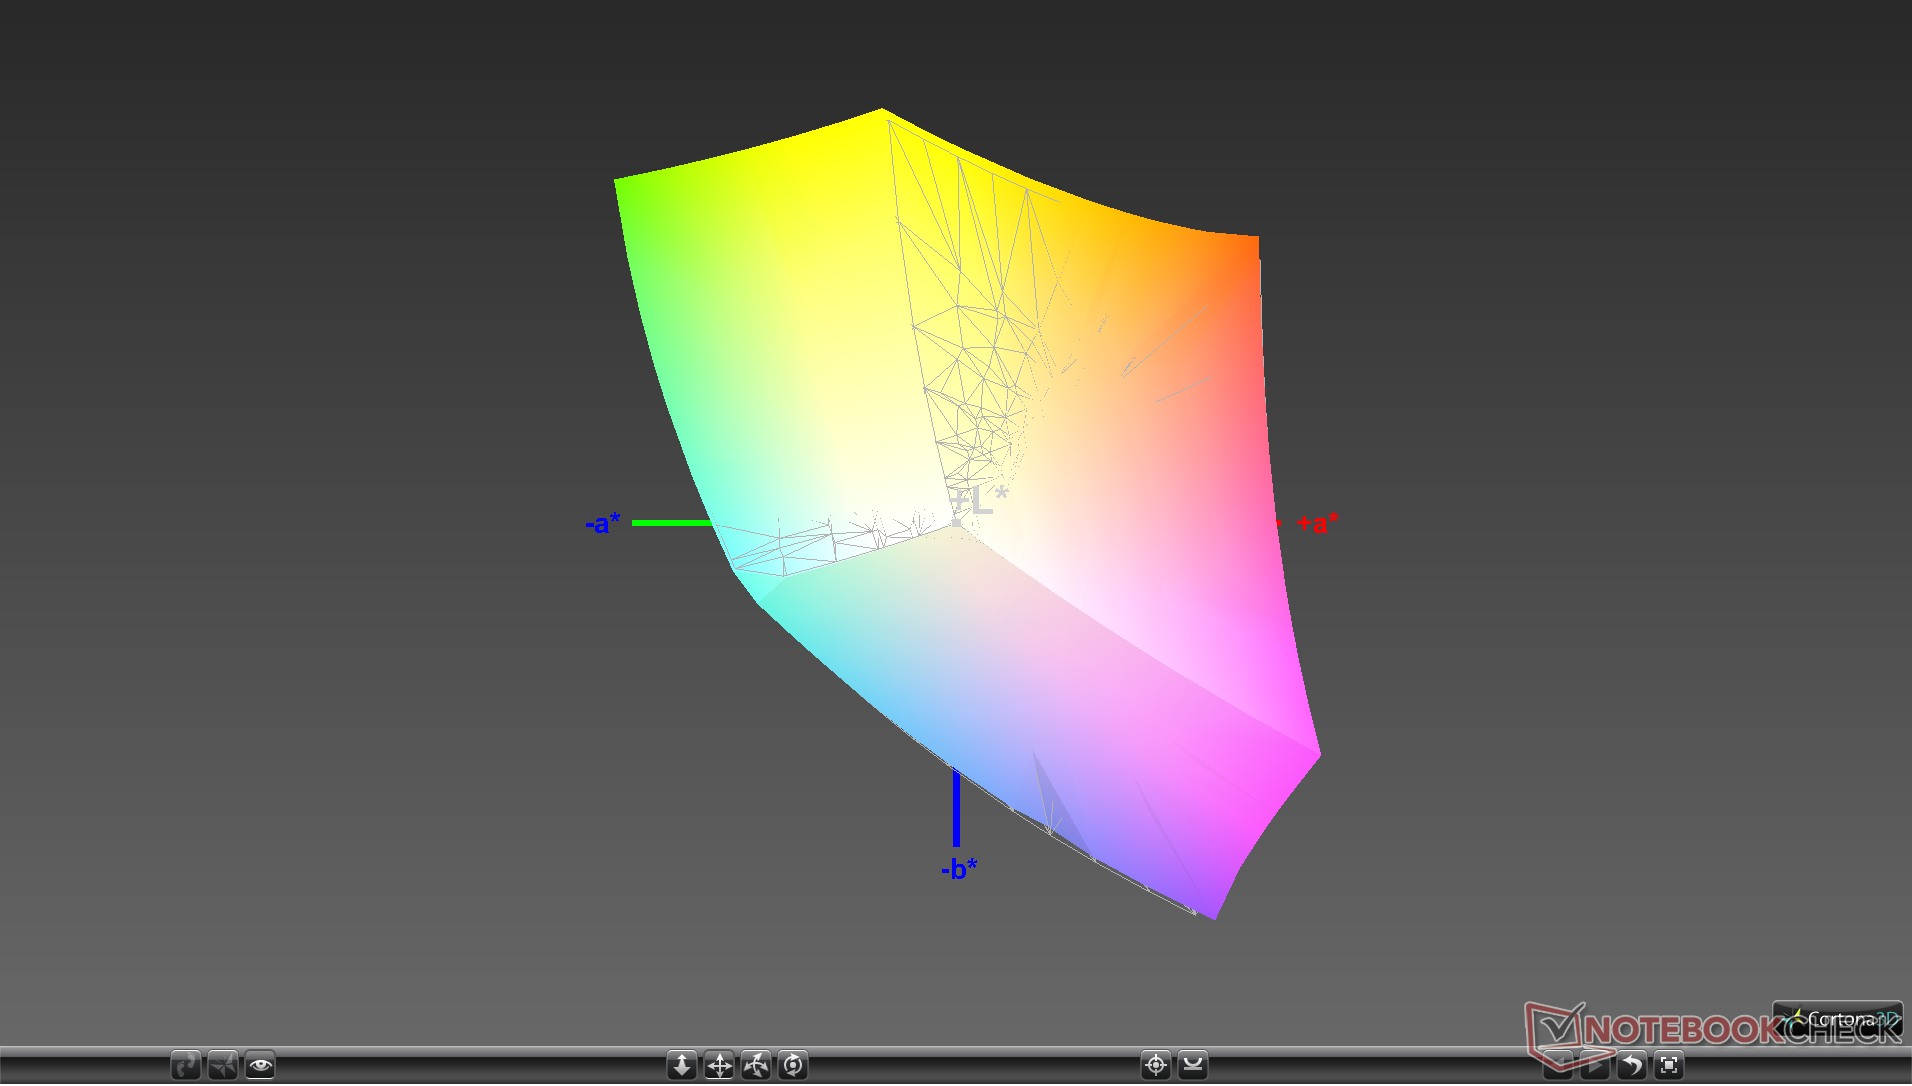
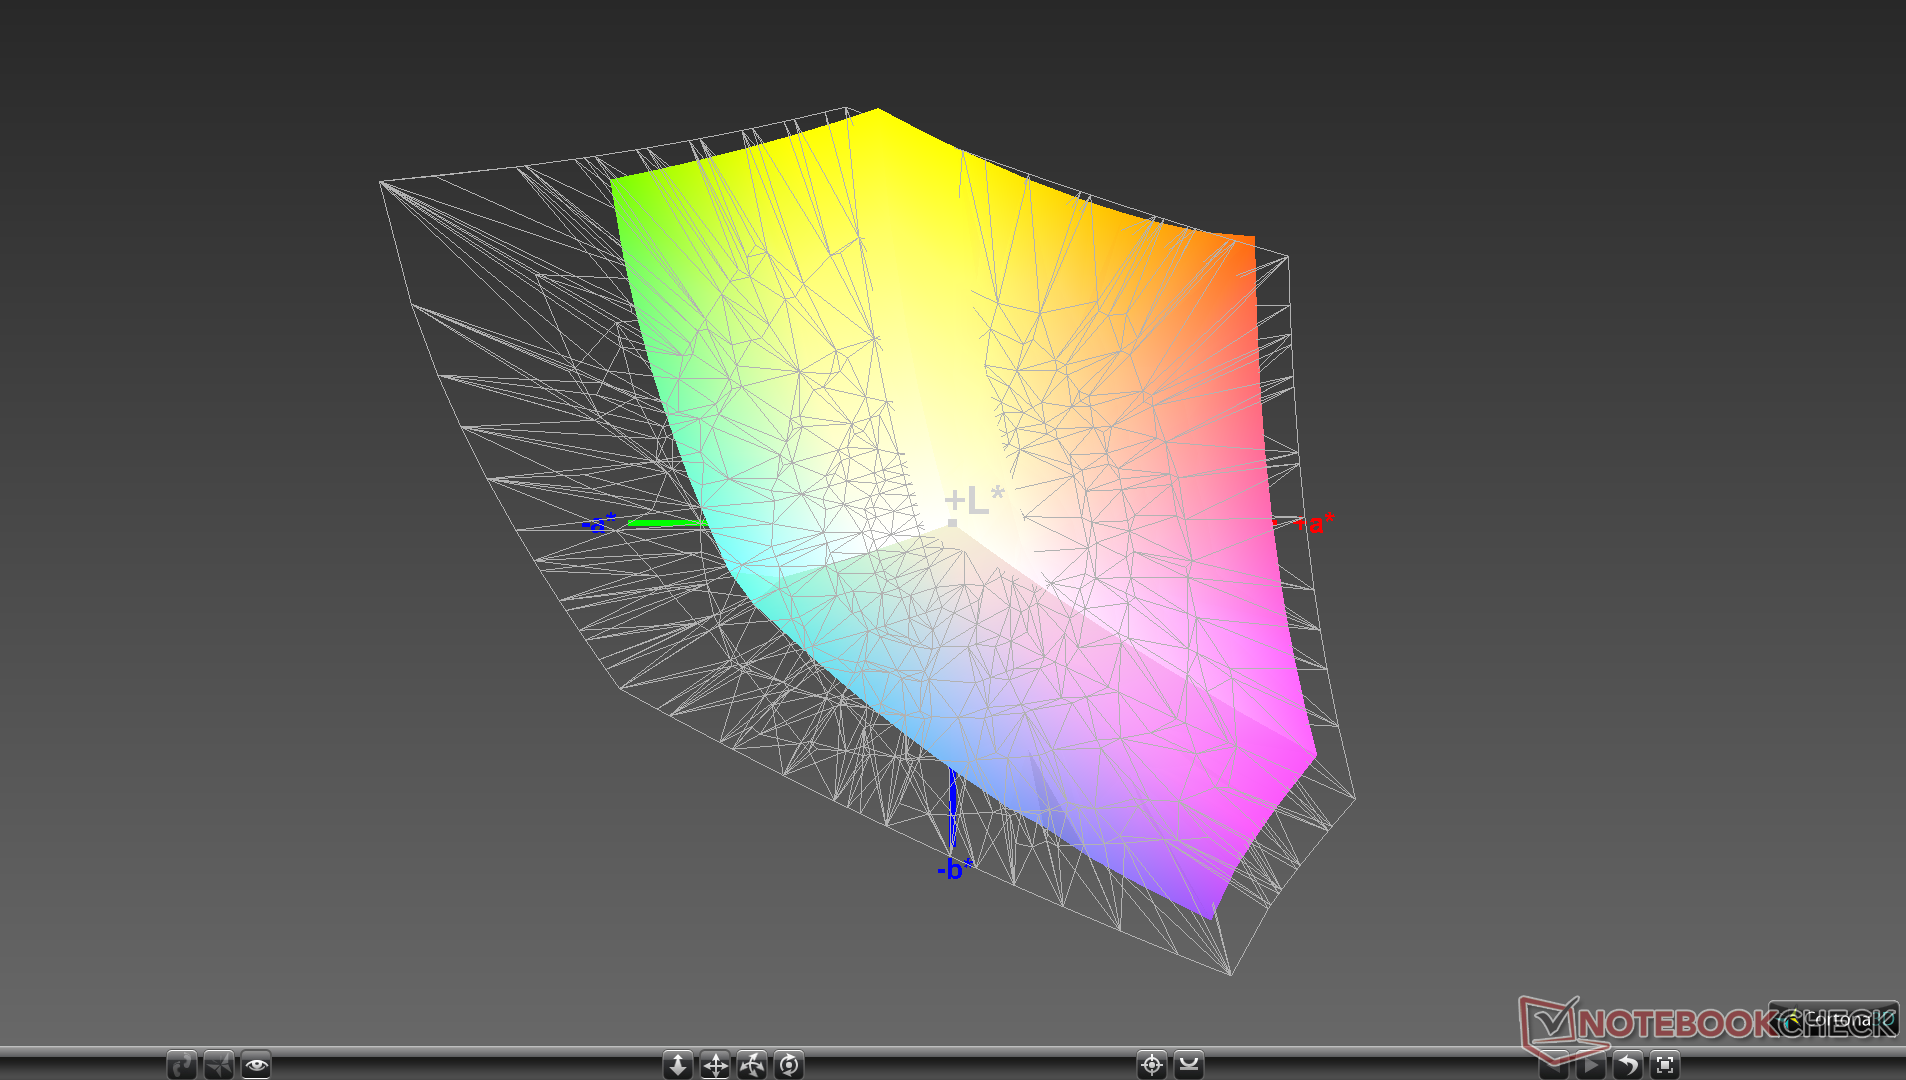
99.4% sRGB (Argyll 1.6.3 3D)
64.1% AdobeRGB 1998 (Argyll 1.6.3 3D)
72.4% AdobeRGB 1998 (Argyll 3D)
99.3% sRGB (Argyll 3D)
71.8% Display P3 (Argyll 3D)
Gamma: 2.3
CCT: 6347 K
| Dell Latitude 7310 AU Optronics B133HAN, IPS, 13.3", 1920x1080 | Dell Latitude 7300-P99G B133HAK, IPS LED, 13.3", 1920x1080 | Asus ZenBook S13 UX392FN Tianma XM, IPS, 13.9", 1920x1080 | Lenovo ThinkPad X395 LP133WF7-SPB1, IPS, 13.3", 1920x1080 | HP EliteBook 735 G6 7KN29EA CMN139E, IPS LED, 13.3", 1920x1080 | Apple MacBook Pro 13 2020 2GHz i5 10th-Gen APPA03D, IPS, 13.3", 2560x1600 | |
|---|---|---|---|---|---|---|
| Display | -9% | -5% | -8% | -40% | 19% | |
| Display P3 Coverage (%) | 71.8 | 64.6 -10% | 67.5 -6% | 64.1 -11% | 41.53 -42% | 98.8 38% |
| sRGB Coverage (%) | 99.3 | 91.5 -8% | 95.8 -4% | 95.2 -4% | 61.7 -38% | 99.9 1% |
| AdobeRGB 1998 Coverage (%) | 72.4 | 65.5 -10% | 69 -5% | 65.8 -9% | 43 -41% | 86.4 19% |
| Response Times | 5% | -1% | -23% | 8% | -13% | |
| Response Time Grey 50% / Grey 80% * (ms) | 40.8 ? | 39 ? 4% | 47.2 ? -16% | 55 ? -35% | 38 ? 7% | 46 ? -13% |
| Response Time Black / White * (ms) | 28.8 ? | 27 ? 6% | 24.8 ? 14% | 32 ? -11% | 26.4 ? 8% | 32.4 ? -13% |
| PWM Frequency (Hz) | 26040 | 113600 ? | ||||
| Screen | -66% | -0% | -9% | -114% | 17% | |
| Brightness middle (cd/m²) | 332.7 | 341 2% | 466 40% | 356 7% | 294 -12% | 512 54% |
| Brightness (cd/m²) | 329 | 306 -7% | 462 40% | 336 2% | 277 -16% | 491 49% |
| Brightness Distribution (%) | 89 | 79 -11% | 90 1% | 88 -1% | 87 -2% | 91 2% |
| Black Level * (cd/m²) | 0.25 | 0.31 -24% | 0.33 -32% | 0.16 36% | 0.18 28% | 0.32 -28% |
| Contrast (:1) | 1331 | 1100 -17% | 1412 6% | 2225 67% | 1633 23% | 1600 20% |
| Colorchecker dE 2000 * | 2.15 | 6.43 -199% | 1.93 10% | 3.6 -67% | 6.8 -216% | 1.7 21% |
| Colorchecker dE 2000 max. * | 3.89 | 10.33 -166% | 4.26 -10% | 5.5 -41% | 23.8 -512% | 3.4 13% |
| Colorchecker dE 2000 calibrated * | 1.09 | 2.36 -117% | 1.99 -83% | 1.11 -2% | 4.8 -340% | 1 8% |
| Greyscale dE 2000 * | 2.5 | 6.9 -176% | 1.7 32% | 4.7 -88% | 5.9 -136% | 1.9 24% |
| Gamma | 2.3 96% | 2.23 99% | 2.15 102% | 2.92 75% | 1.96 112% | 2.19 100% |
| CCT | 6347 102% | 8338 78% | 6382 102% | 6222 104% | 6979 93% | 6817 95% |
| Color Space (Percent of AdobeRGB 1998) (%) | 64.1 | 59 -8% | 62.2 -3% | 61 -5% | 39.6 -38% | 77.4 21% |
| Color Space (Percent of sRGB) (%) | 99.4 | 91 -8% | 95.7 -4% | 96 -3% | 61.5 -38% | 99.9 1% |
| Total Average (Program / Settings) | -23% /
-47% | -2% /
-1% | -13% /
-10% | -49% /
-85% | 8% /
14% |
* ... smaller is better
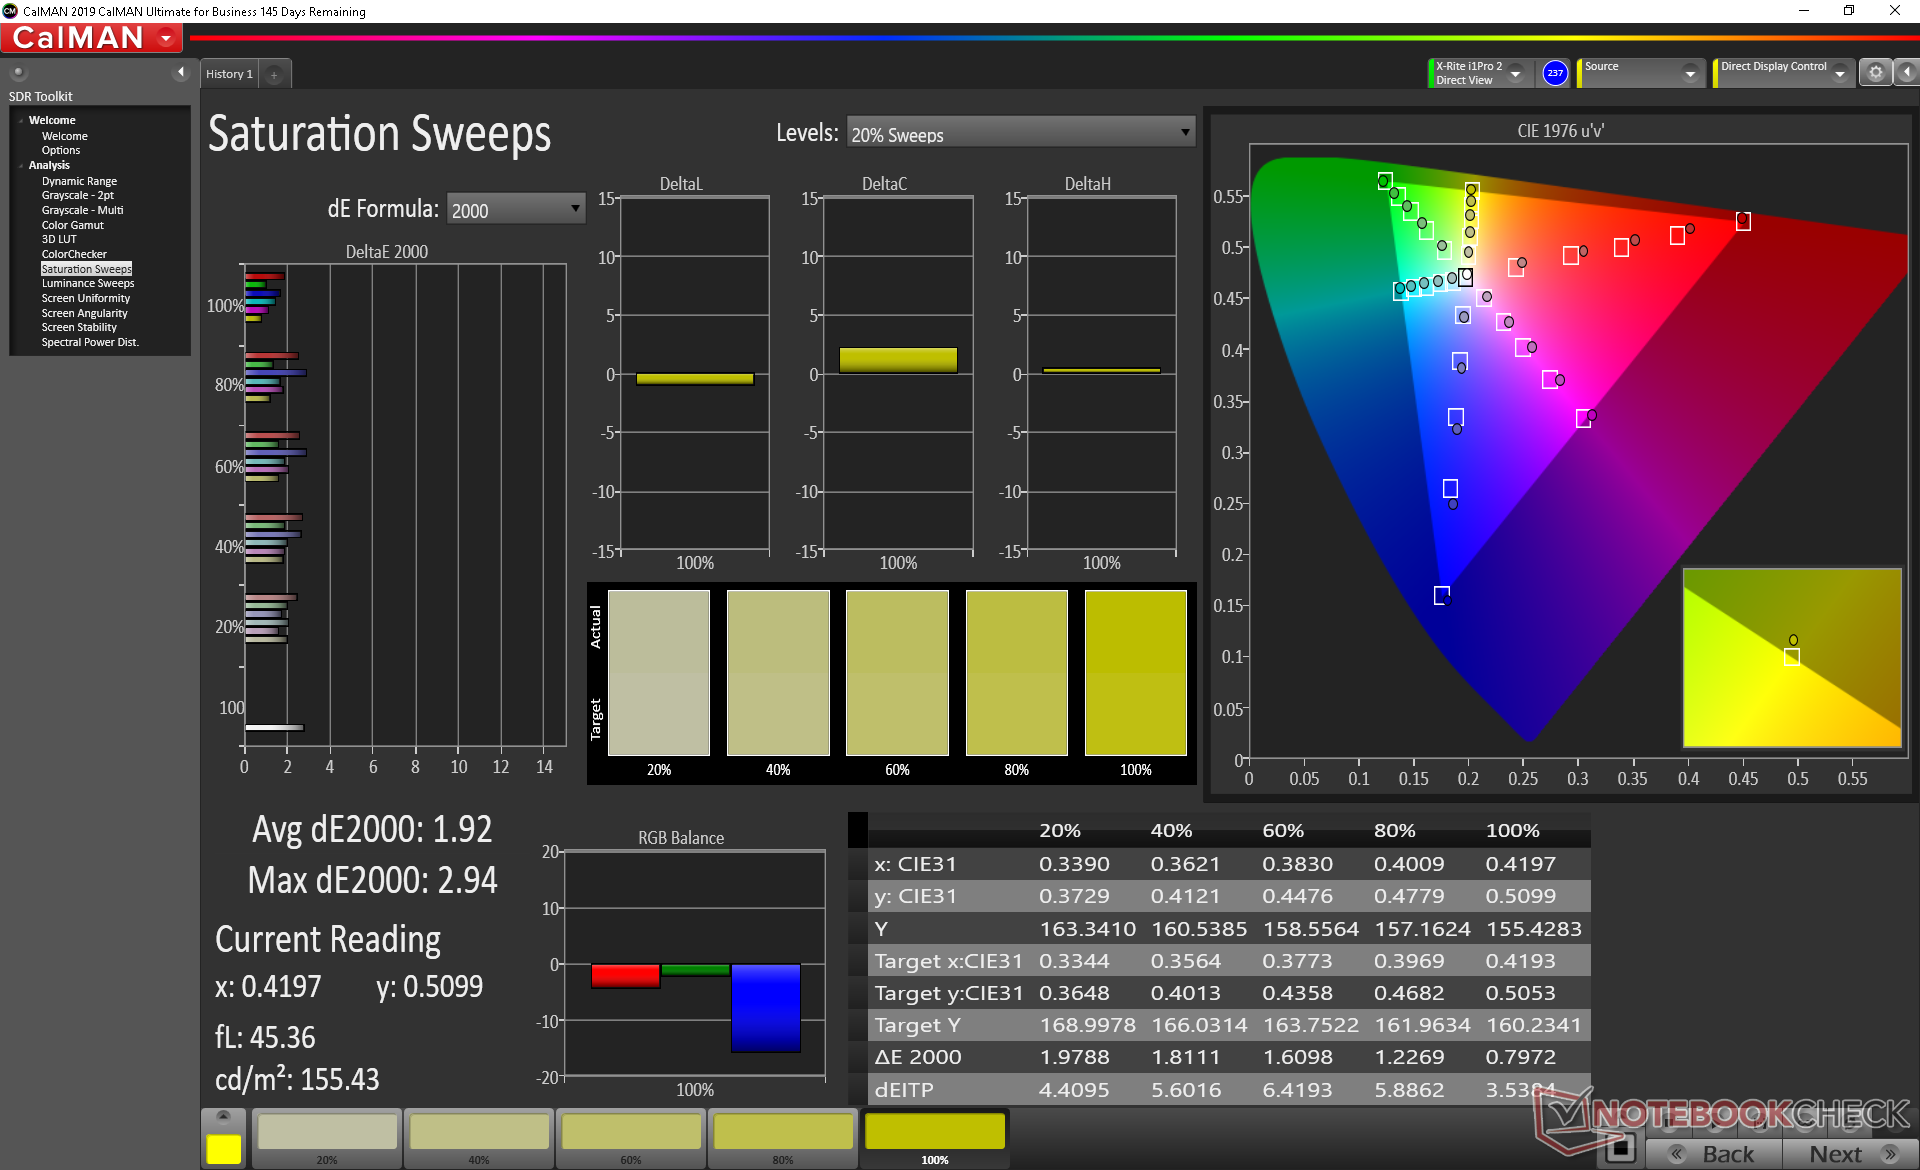
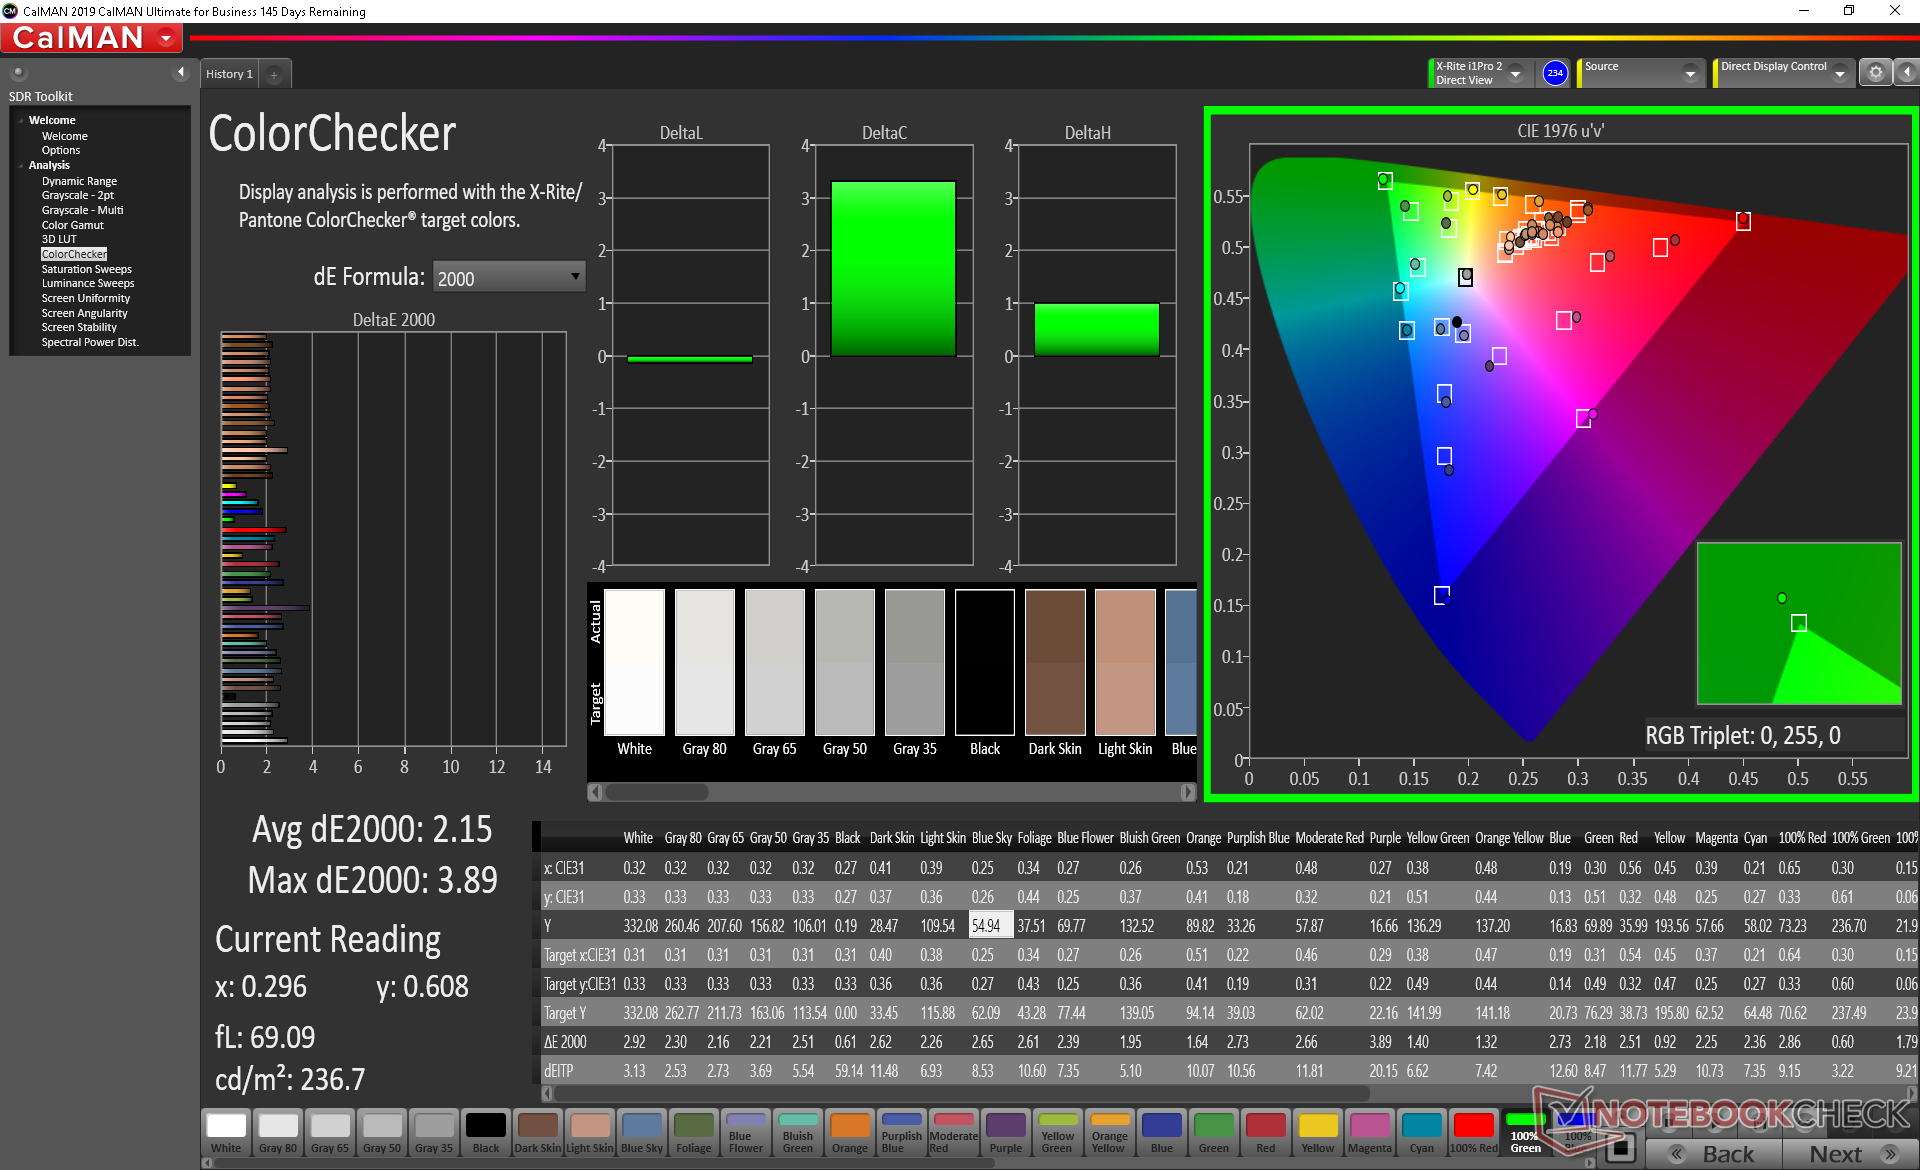
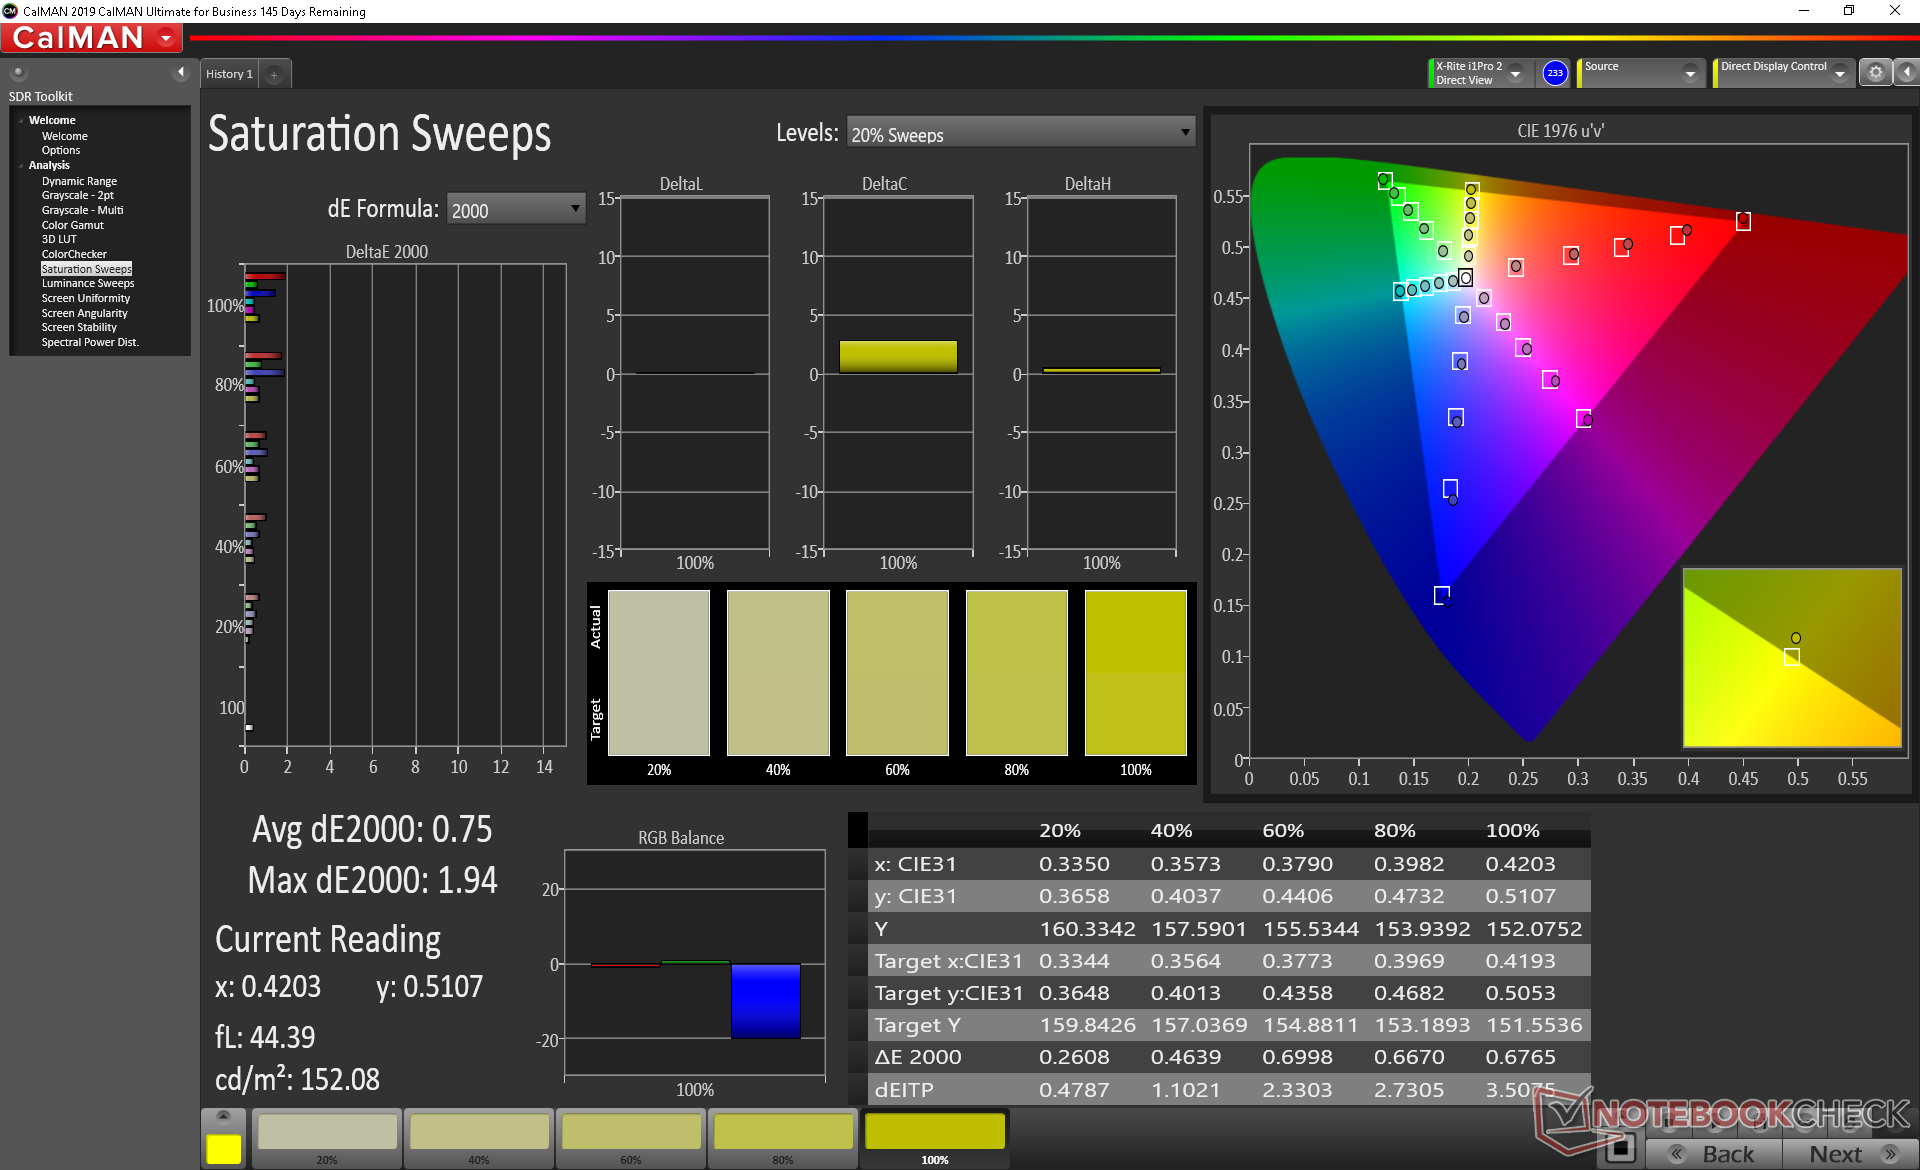
Color space covers sRGB entirely and about 64 percent of AdobeRGB to be in line with most other mid-range to high-end Ultrabooks. Fore an even wider range of colors, look towards the XPS 15 or Precision series instead.
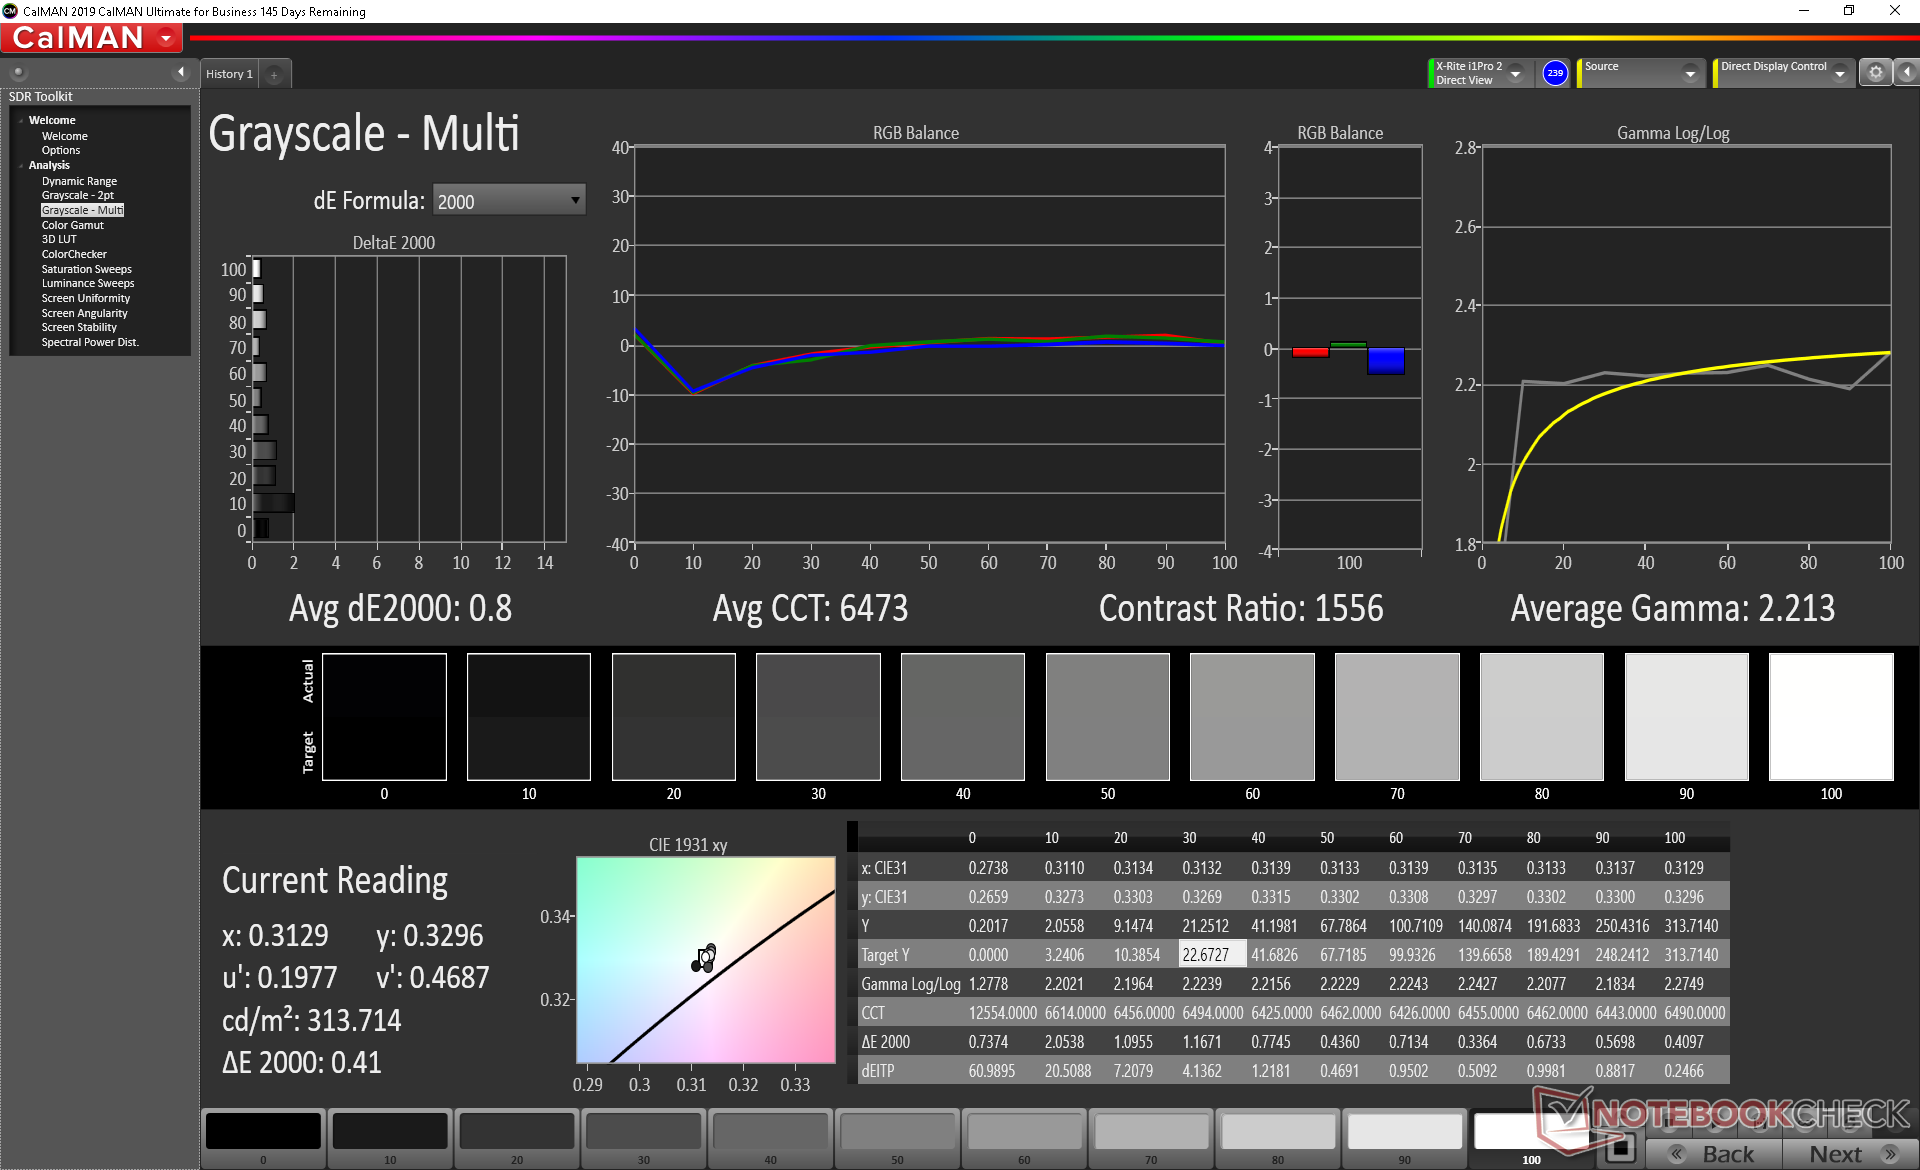
The display is well calibrated out of the box with average grayscale and color deltaE values of just 2.5 and 2.15, respectively. Calibrating the panel even further would improve these values just marginally.
Display Response Times
| ↔ Response Time Black to White | ||
|---|---|---|
| 28.8 ms ... rise ↗ and fall ↘ combined | ↗ 14.8 ms rise | 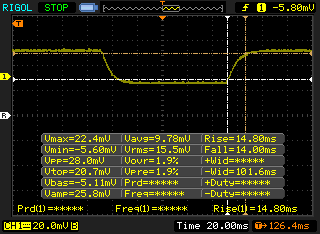 |
| ↘ 14 ms fall | ||
| The screen shows relatively slow response rates in our tests and may be too slow for gamers. In comparison, all tested devices range from 0.1 (minimum) to 240 (maximum) ms. » 75 % of all devices are better. This means that the measured response time is worse than the average of all tested devices (20.2 ms). | ||
| ↔ Response Time 50% Grey to 80% Grey | ||
| 40.8 ms ... rise ↗ and fall ↘ combined | ↗ 22.4 ms rise | 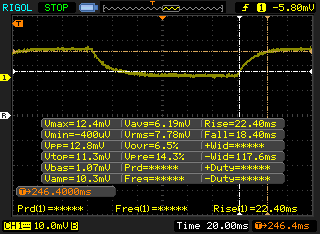 |
| ↘ 18.4 ms fall | ||
| The screen shows slow response rates in our tests and will be unsatisfactory for gamers. In comparison, all tested devices range from 0.165 (minimum) to 636 (maximum) ms. » 63 % of all devices are better. This means that the measured response time is worse than the average of all tested devices (31.6 ms). | ||
Screen Flickering / PWM (Pulse-Width Modulation)
| Screen flickering / PWM not detected | 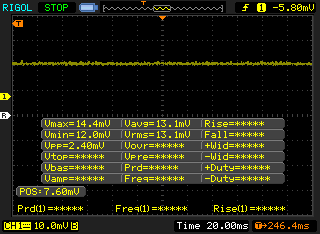 | ||
In comparison: 53 % of all tested devices do not use PWM to dim the display. If PWM was detected, an average of 8111 (minimum: 5 - maximum: 343500) Hz was measured. | |||
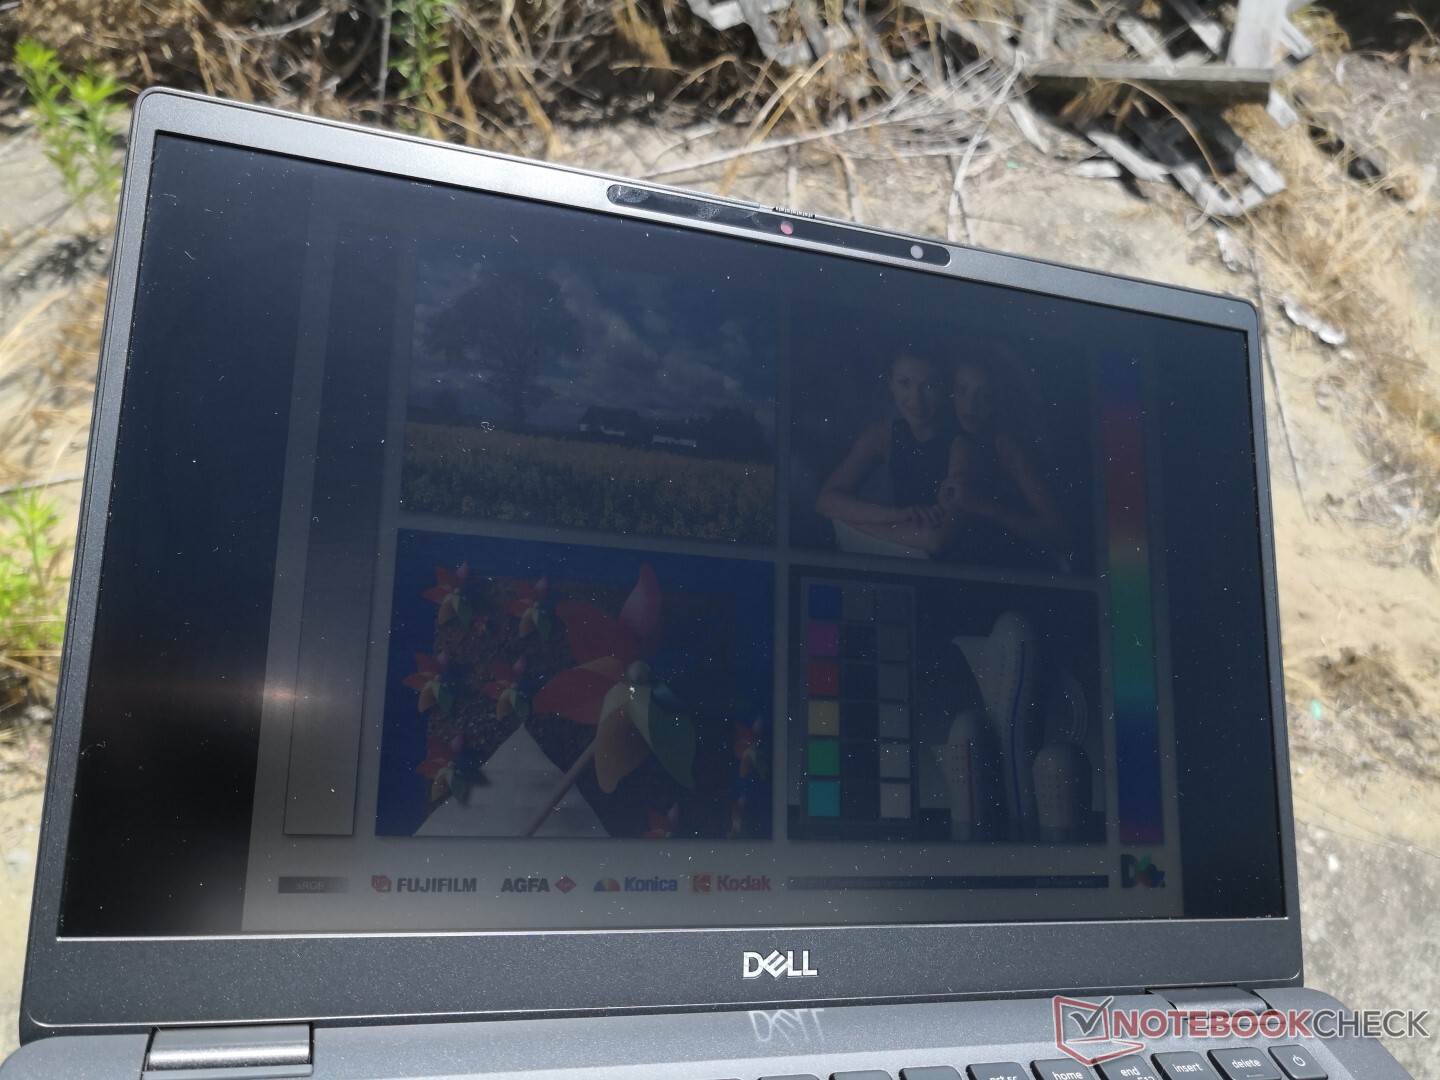
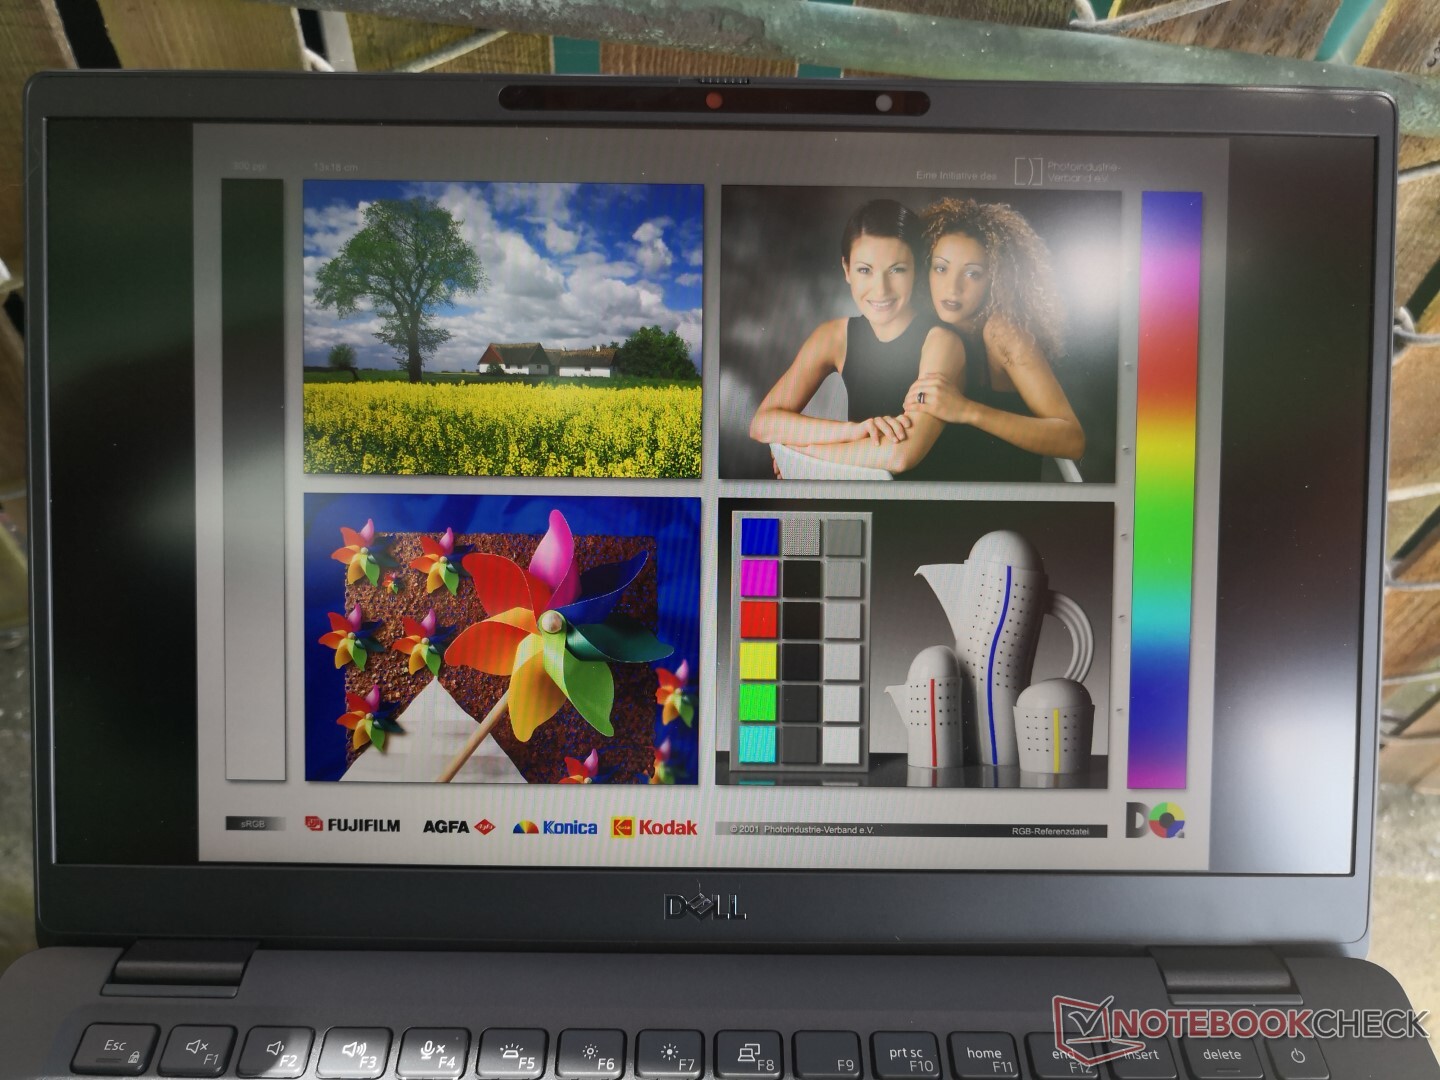
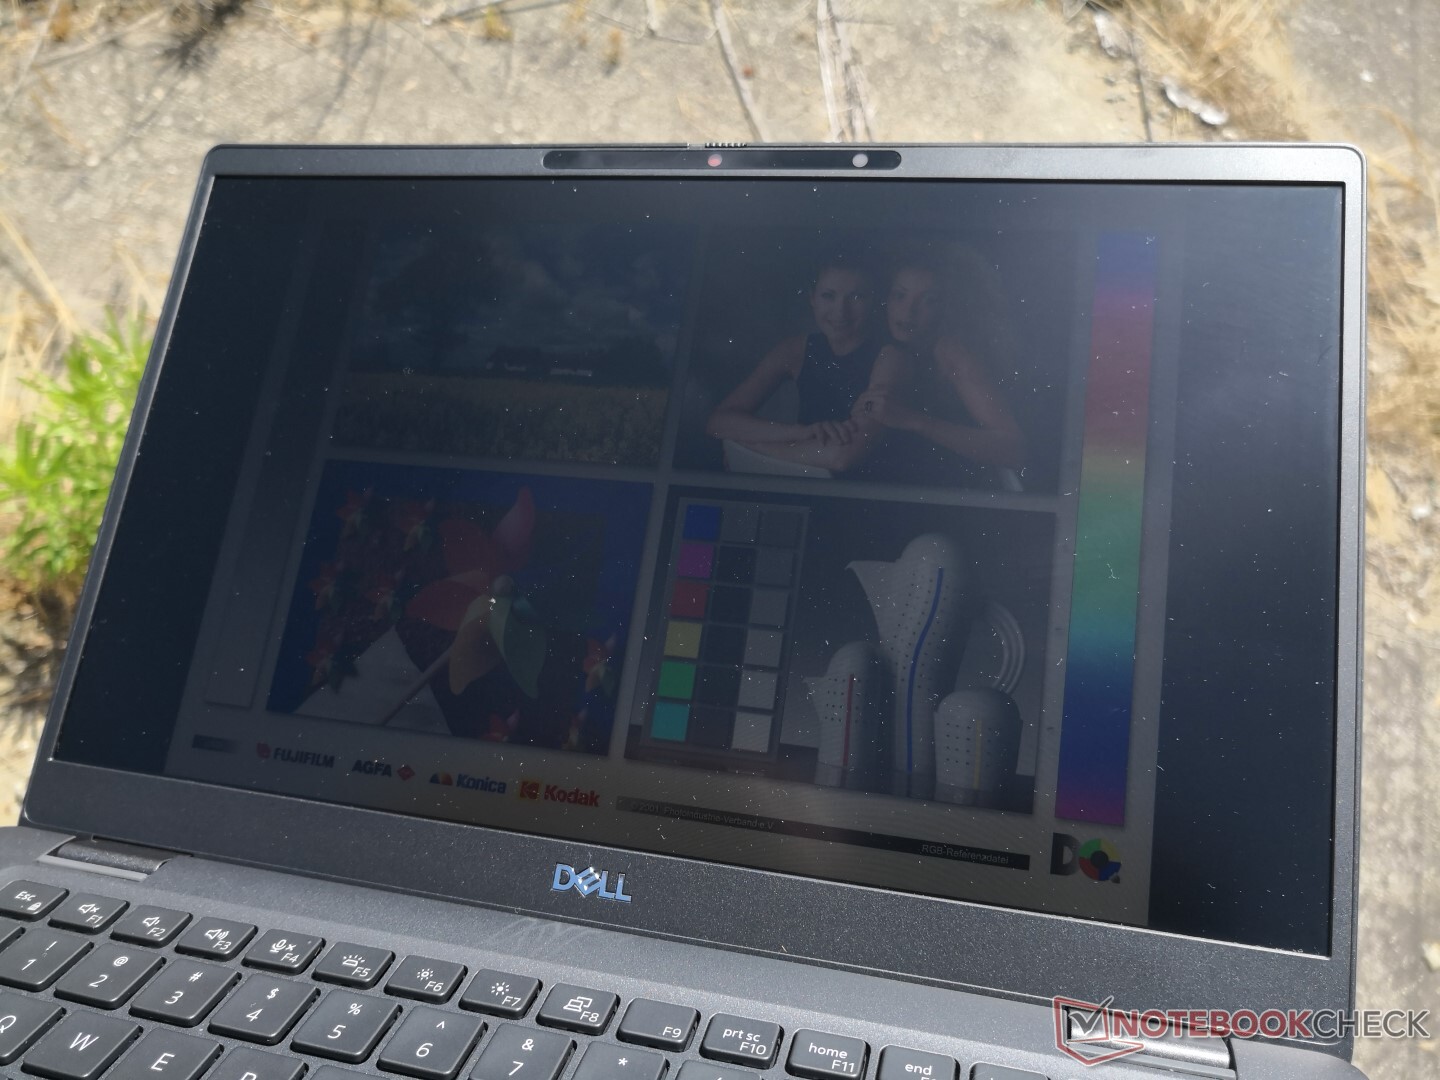
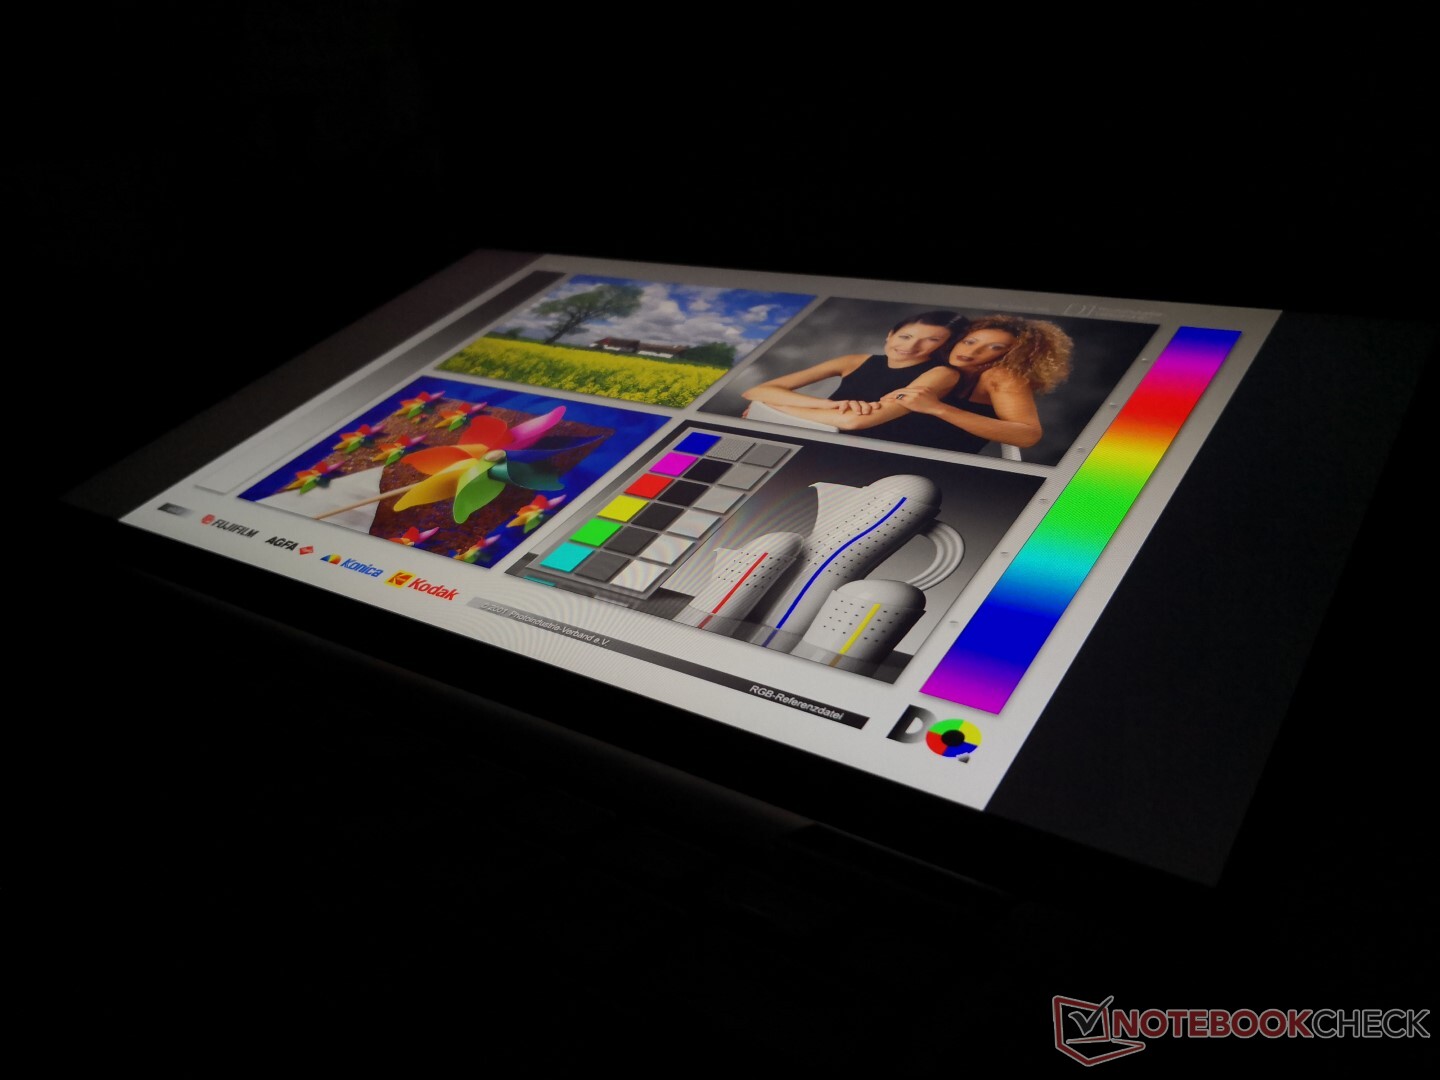
Outdoor visibility is not as good as most other subnotebooks in this price range. At only about 330 nits, the display is dimmer than the XPS 13 or MacBook Pro 13 where >500 nit options are available. The HP EliteBook 1030, for example, has a 1000-nit option and it's too bad that the Latitude 7310 doesn't have anything close especially since it's so light and portable.
Performance
The same quad-core Core i5-10210U, i5-10310U, and i7-10610U CPU options are available here much like on the Latitude 7410. Unfortunately, this also means that there are no AMD or Nvidia options on the table. We've already proven that most Comet Lake-U CPUs outside of the hexa-core Core i7-10710U perform just marginally faster than the last generation Whiskey Lake-U series.
We had set our system to Dell Ultra Performance mode prior to running the benchmarks below for the best possible scores.
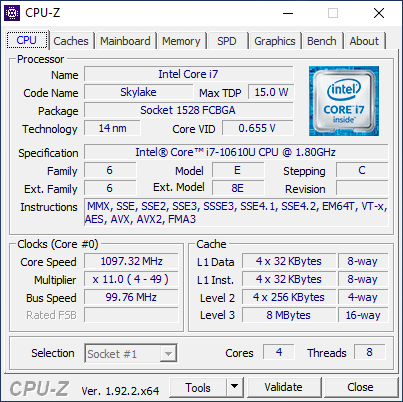
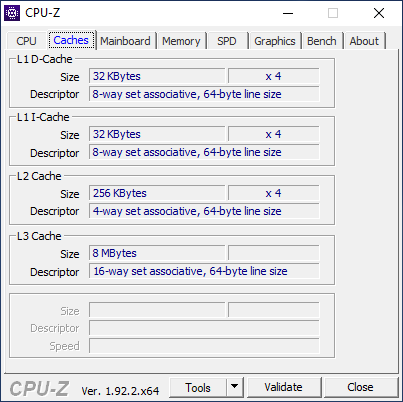
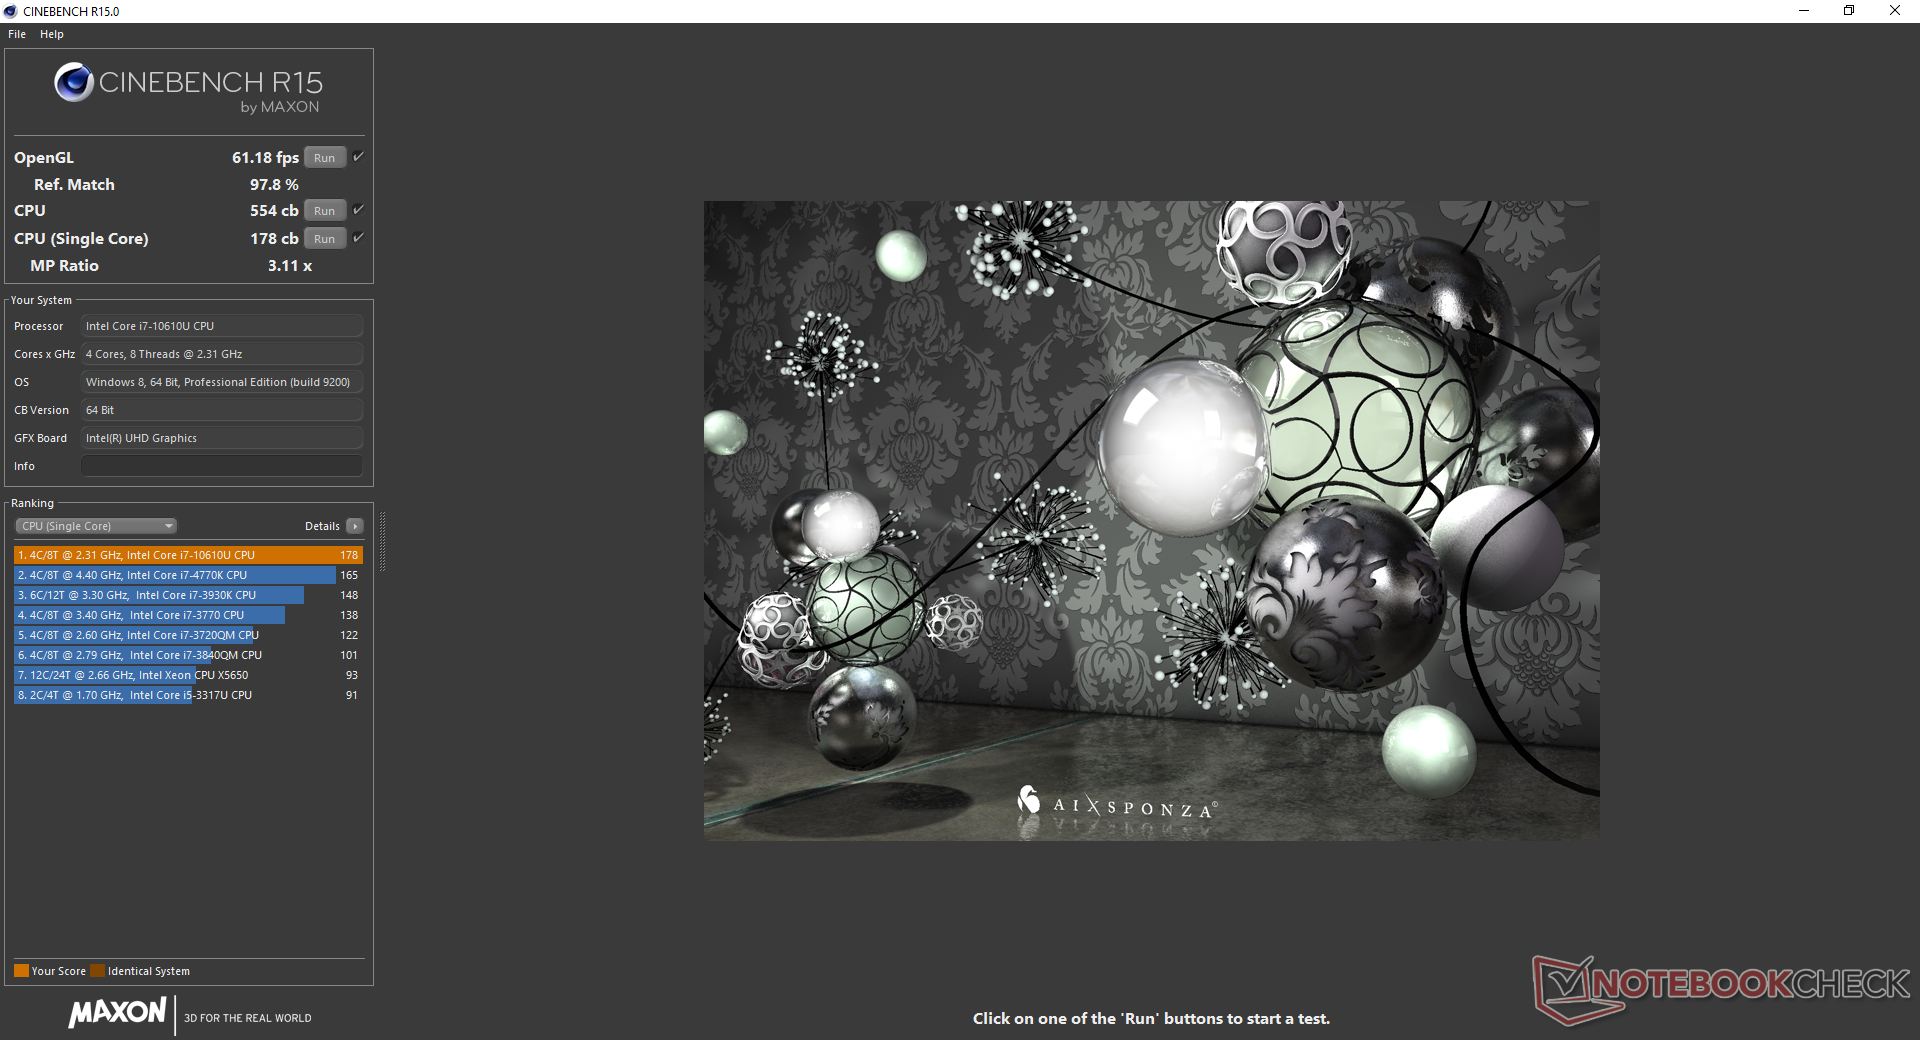
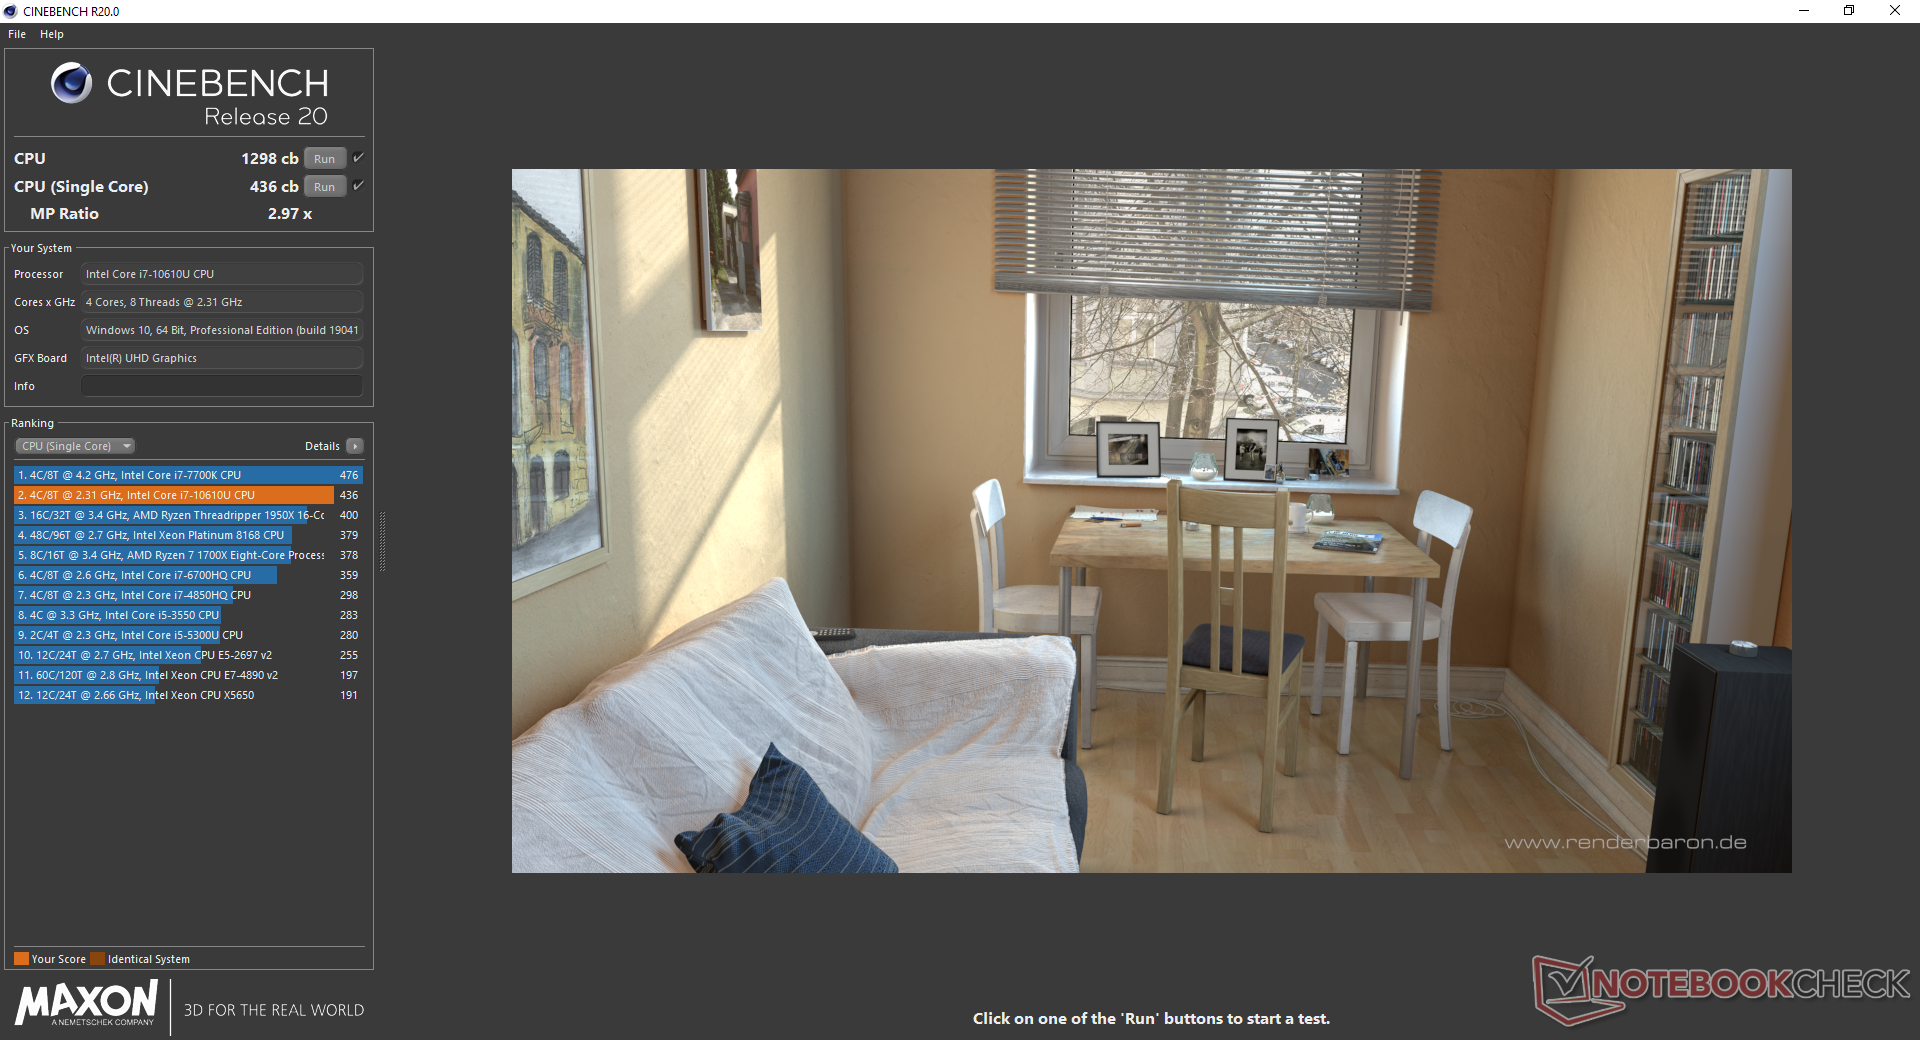
Processor
CPU performance is essentially identical to what we recorded on the larger Latitude 7410 meaning that processor performance isn't any slower despite our smaller 13.3-inch form factor. Raw performance is still disappointing overall as the Core i7-10610U is barely any faster than the less expensive Core i5-10210U or even last year's Core i7-8665U. The main difference between the Core i7-10610U and Core i7-10510U is down to vPro support rather than performance.
See our dedicated page on the Core i7-10610U for more technical information and benchmarks.
Cinebench R15: CPU Multi 64Bit | CPU Single 64Bit
Blender: v2.79 BMW27 CPU
7-Zip 18.03: 7z b 4 -mmt1 | 7z b 4
Geekbench 5.5: Single-Core | Multi-Core
HWBOT x265 Benchmark v2.2: 4k Preset
LibreOffice : 20 Documents To PDF
R Benchmark 2.5: Overall mean
| Cinebench R15 / CPU Multi 64Bit | |
| Dell XPS 13 7390 Core i7-10710U | |
| HP ProBook 455 G7-175W8EA | |
| HP Envy x360 13-ay0010nr | |
| Dell XPS 13 9300 4K UHD | |
| Lenovo ThinkPad X1 Carbon 2020-20UAS04T00 | |
| Dell Latitude 7300-P99G | |
| Dell XPS 13 9300 i5 FHD | |
| Dell XPS 13 9300 i5 FHD | |
| Average Intel Core i7-10610U (548 - 738, n=6) | |
| Acer Swift 3 SF314-42-R27B | |
| Dell Latitude 7310 | |
| HP EliteBook x360 830 G6 | |
| Lenovo ThinkPad L13 Yoga 20R6S00800 | |
| Dell XPS 13 7390 2-in-1 Core i3 | |
| Lenovo ThinkPad 13 20J1005TPB | |
| Cinebench R15 / CPU Single 64Bit | |
| Dell Latitude 7300-P99G | |
| Lenovo ThinkPad X1 Carbon 2020-20UAS04T00 | |
| Dell XPS 13 9300 4K UHD | |
| HP ProBook 455 G7-175W8EA | |
| Dell XPS 13 7390 Core i7-10710U | |
| Dell Latitude 7310 | |
| Average Intel Core i7-10610U (133 - 200, n=6) | |
| HP Envy x360 13-ay0010nr | |
| Dell XPS 13 9300 i5 FHD | |
| Acer Swift 3 SF314-42-R27B | |
| Lenovo ThinkPad L13 Yoga 20R6S00800 | |
| HP EliteBook x360 830 G6 | |
| Dell XPS 13 7390 2-in-1 Core i3 | |
| Lenovo ThinkPad 13 20J1005TPB | |
| Geekbench 5.5 / Single-Core | |
| Dell XPS 13 9300 4K UHD | |
| Dell Latitude 7310 | |
| Dell XPS 13 9300 i5 FHD | |
| Average Intel Core i7-10610U (1155 - 1261, n=6) | |
| Lenovo ThinkPad X1 Carbon 2020-20UAS04T00 | |
| HP ProBook 455 G7-175W8EA | |
| Lenovo ThinkPad L13 Yoga 20R6S00800 | |
| HP Envy x360 13-ay0010nr | |
| Acer Swift 3 SF314-42-R27B | |
| Geekbench 5.5 / Multi-Core | |
| Dell XPS 13 9300 4K UHD | |
| HP ProBook 455 G7-175W8EA | |
| HP Envy x360 13-ay0010nr | |
| Dell XPS 13 9300 i5 FHD | |
| Lenovo ThinkPad L13 Yoga 20R6S00800 | |
| Average Intel Core i7-10610U (3731 - 4622, n=6) | |
| Lenovo ThinkPad X1 Carbon 2020-20UAS04T00 | |
| Dell Latitude 7310 | |
| Acer Swift 3 SF314-42-R27B | |
| LibreOffice / 20 Documents To PDF | |
| HP ProBook 455 G7-175W8EA | |
| Dell XPS 13 9300 4K UHD | |
| Average Intel Core i7-10610U (56.1 - 106, n=6) | |
| Acer Swift 3 SF314-42-R27B | |
| HP Envy x360 13-ay0010nr | |
| Dell Latitude 7310 | |
| Lenovo ThinkPad X1 Carbon 2020-20UAS04T00 | |
| R Benchmark 2.5 / Overall mean | |
| Dell XPS 13 9300 i5 FHD | |
| Average Intel Core i7-10610U (0.637 - 0.855, n=6) | |
| Lenovo ThinkPad L13 Yoga 20R6S00800 | |
| Acer Swift 3 SF314-42-R27B | |
| Dell XPS 13 9300 4K UHD | |
| Lenovo ThinkPad X1 Carbon 2020-20UAS04T00 | |
| Dell Latitude 7310 | |
| HP ProBook 455 G7-175W8EA | |
| HP Envy x360 13-ay0010nr | |
Cinebench R15: CPU Multi 64Bit | CPU Single 64Bit
Blender: v2.79 BMW27 CPU
7-Zip 18.03: 7z b 4 -mmt1 | 7z b 4
Geekbench 5.5: Single-Core | Multi-Core
HWBOT x265 Benchmark v2.2: 4k Preset
LibreOffice : 20 Documents To PDF
R Benchmark 2.5: Overall mean
* ... smaller is better
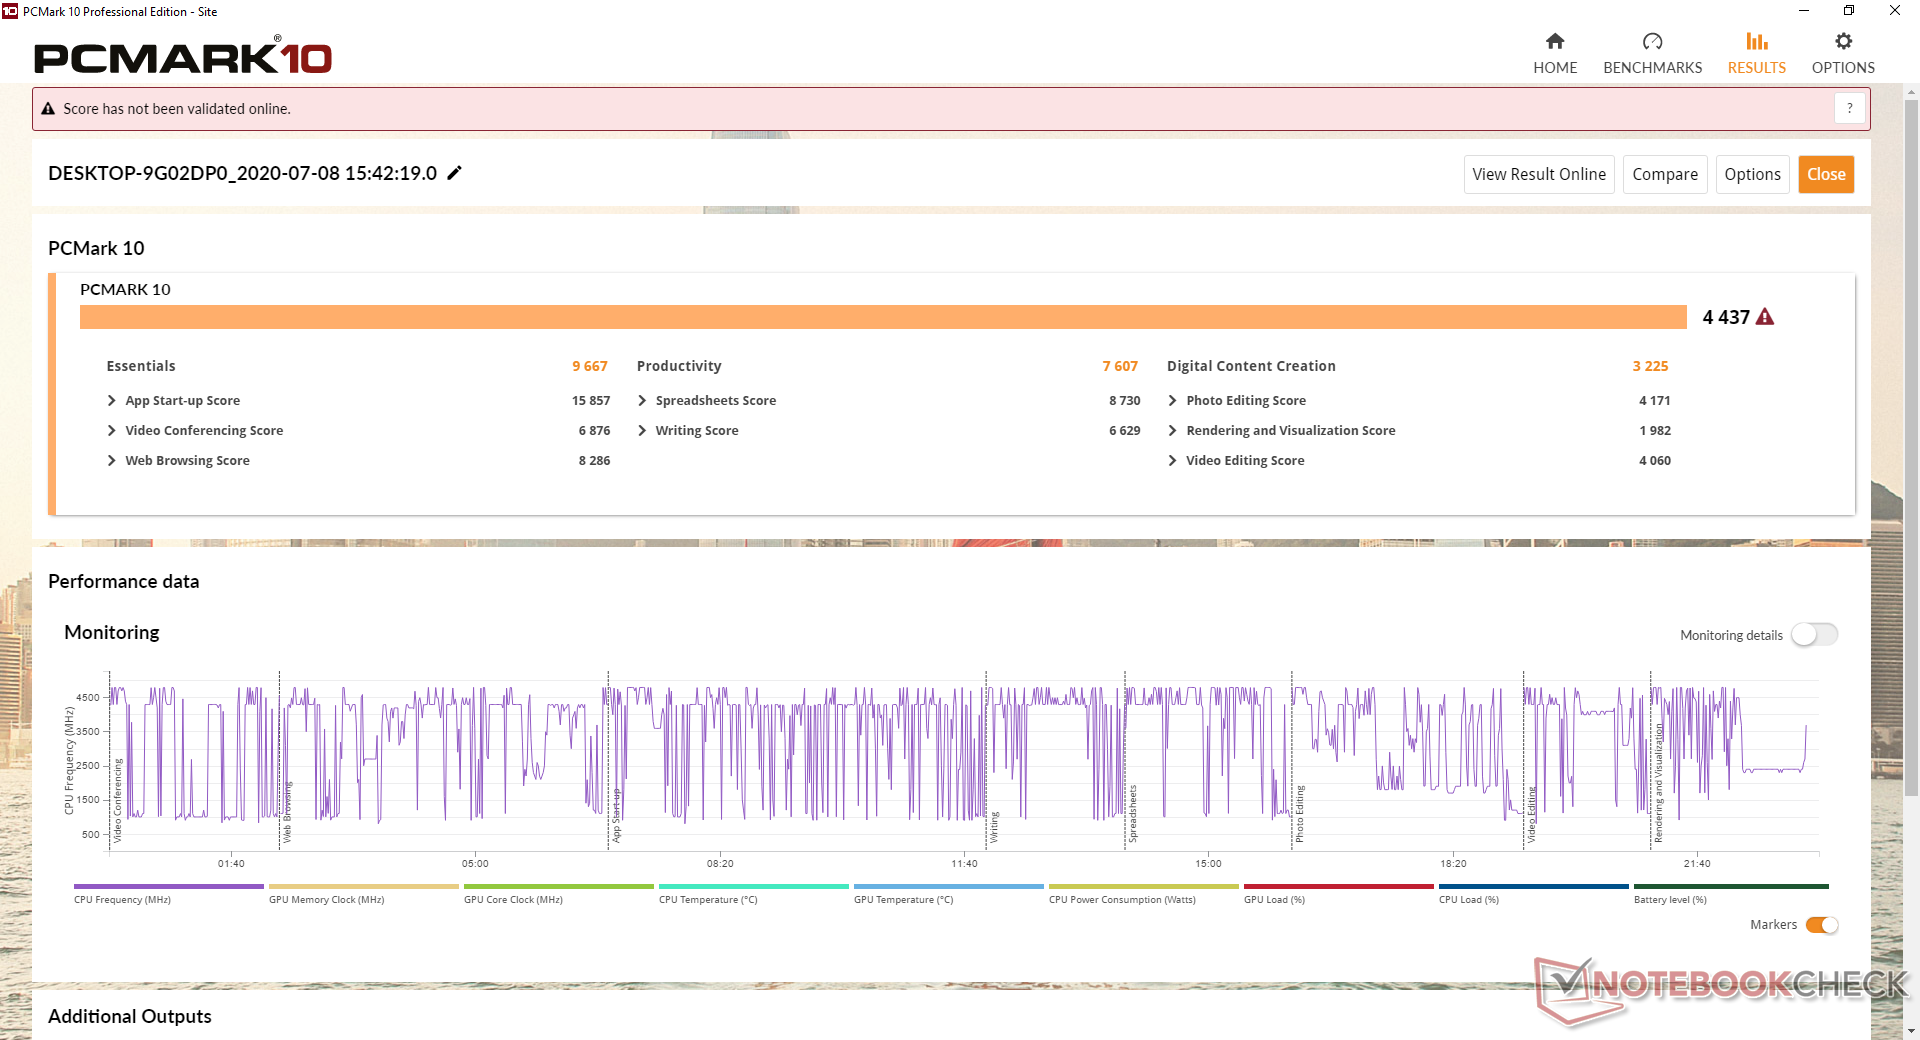
System Performance
PCMark results are consistently higher than many other ULV 13.3-inch business laptops to be almost identical to what we recorded on the larger Latitude 7410. Even so, the difference between the Latitude 7310 and last year's Latitude 7300 is within just a few percentage points.
We didn't experience any software issues during our time with the unit, but we recommend becoming familiar with the pre-installed Dell Optimizer, Update, Power Manager, and Digital Delivery applications as their settings directly impact system performance and behavior. The unique proximity sensor, for example, can only be toggled via Optimizer.
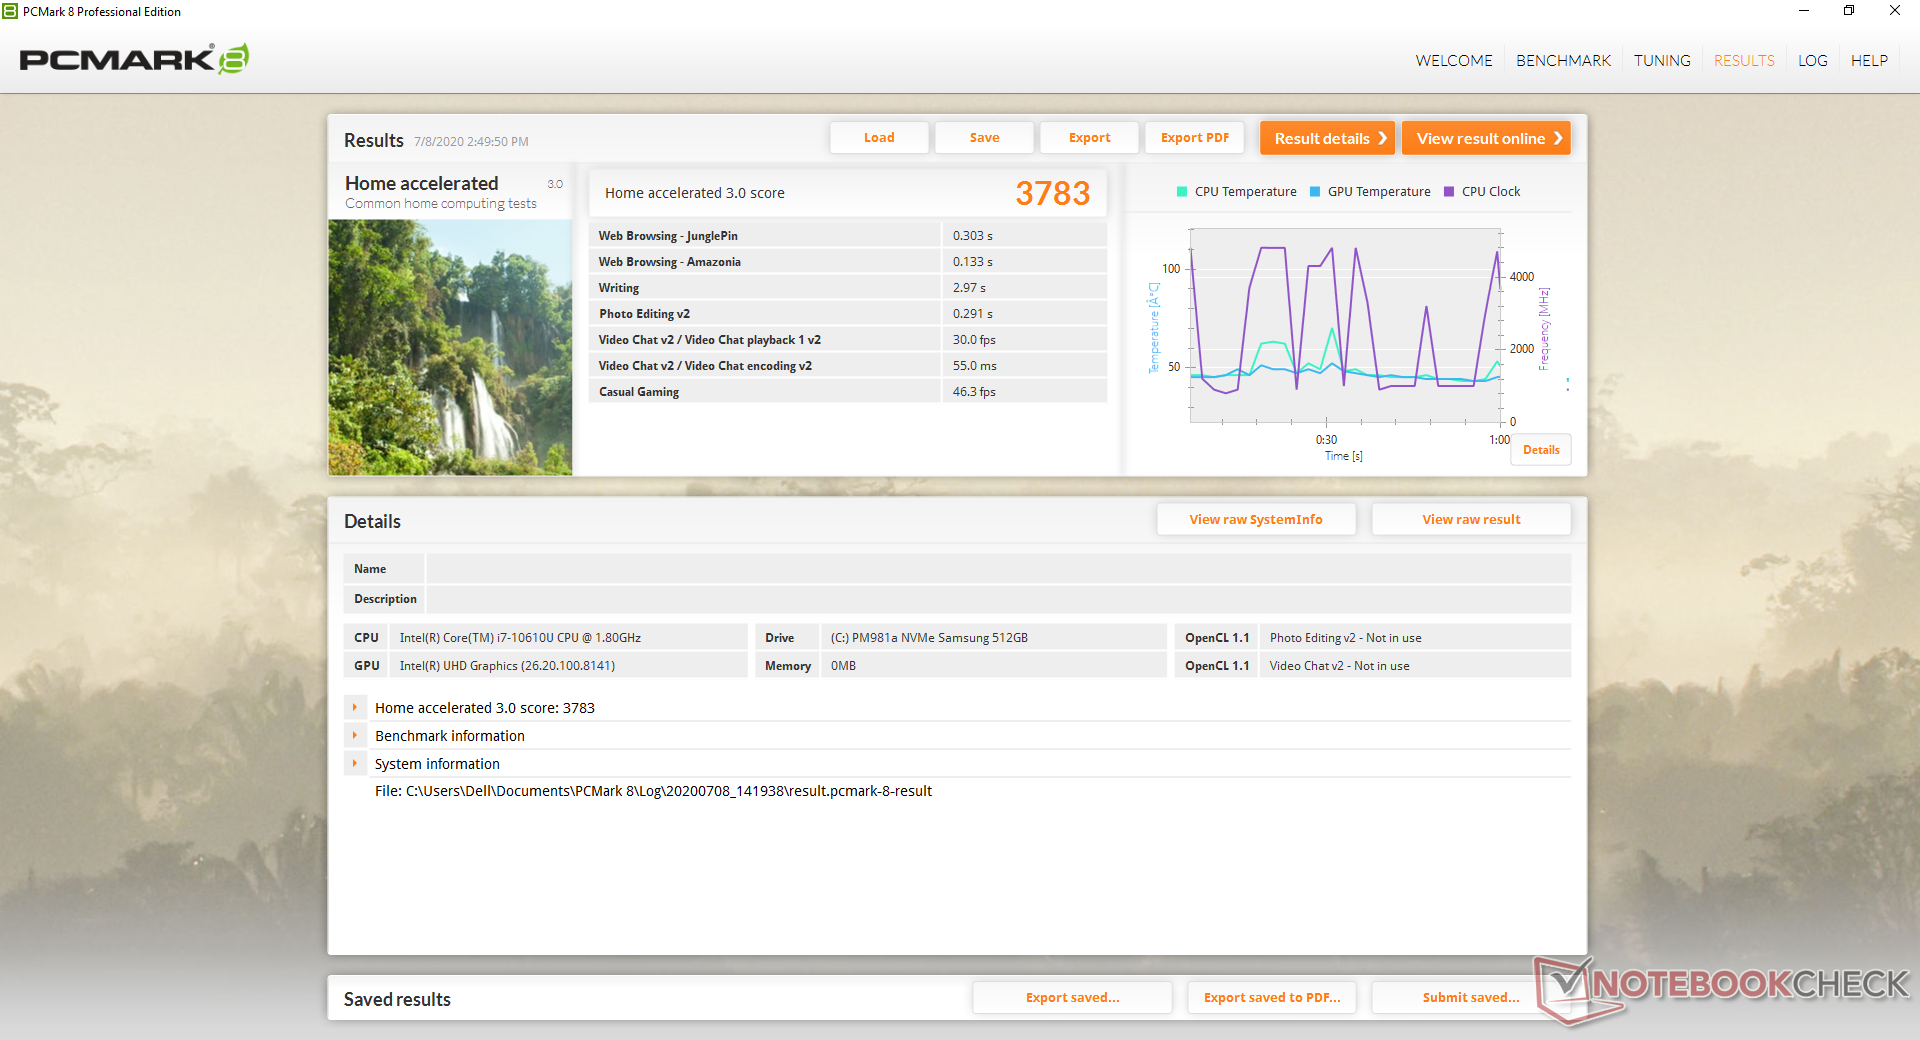
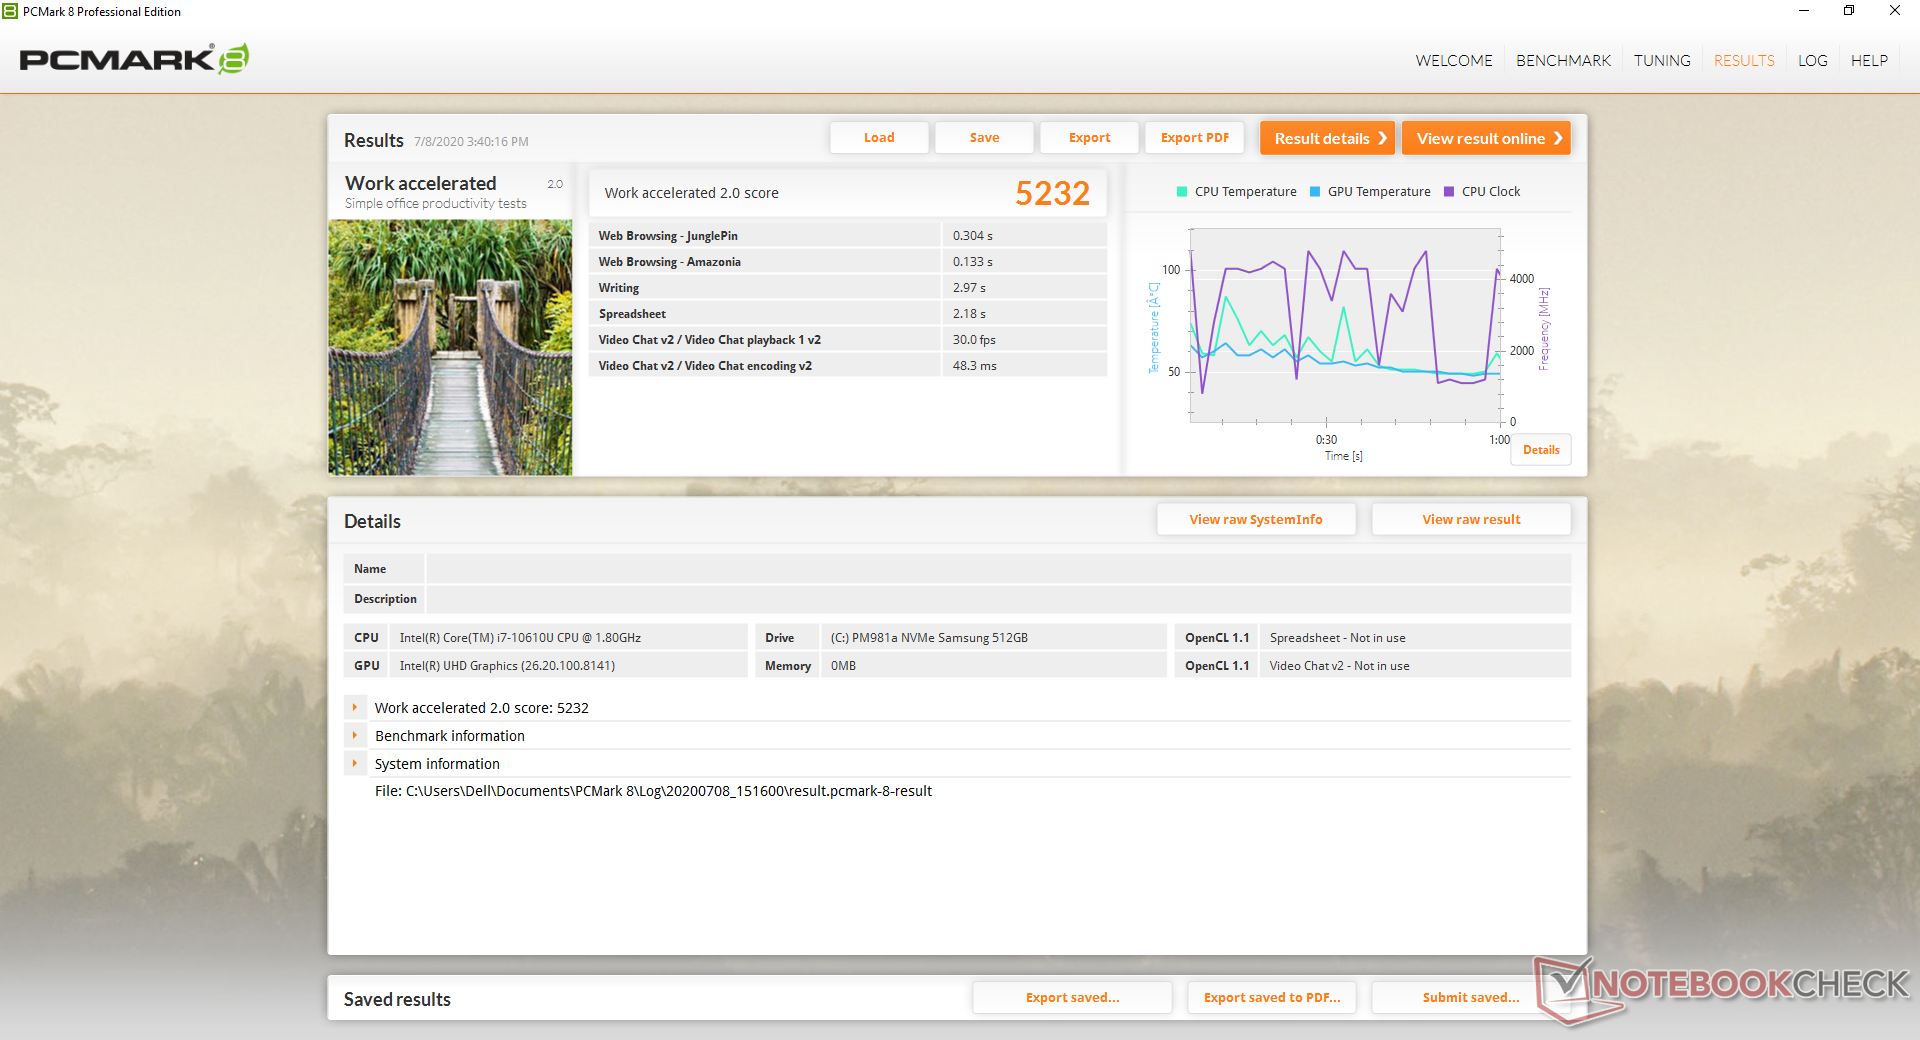
| PCMark 8 Home Score Accelerated v2 | 3783 points | |
| PCMark 8 Work Score Accelerated v2 | 5232 points | |
| PCMark 10 Score | 4437 points | |
Help | ||
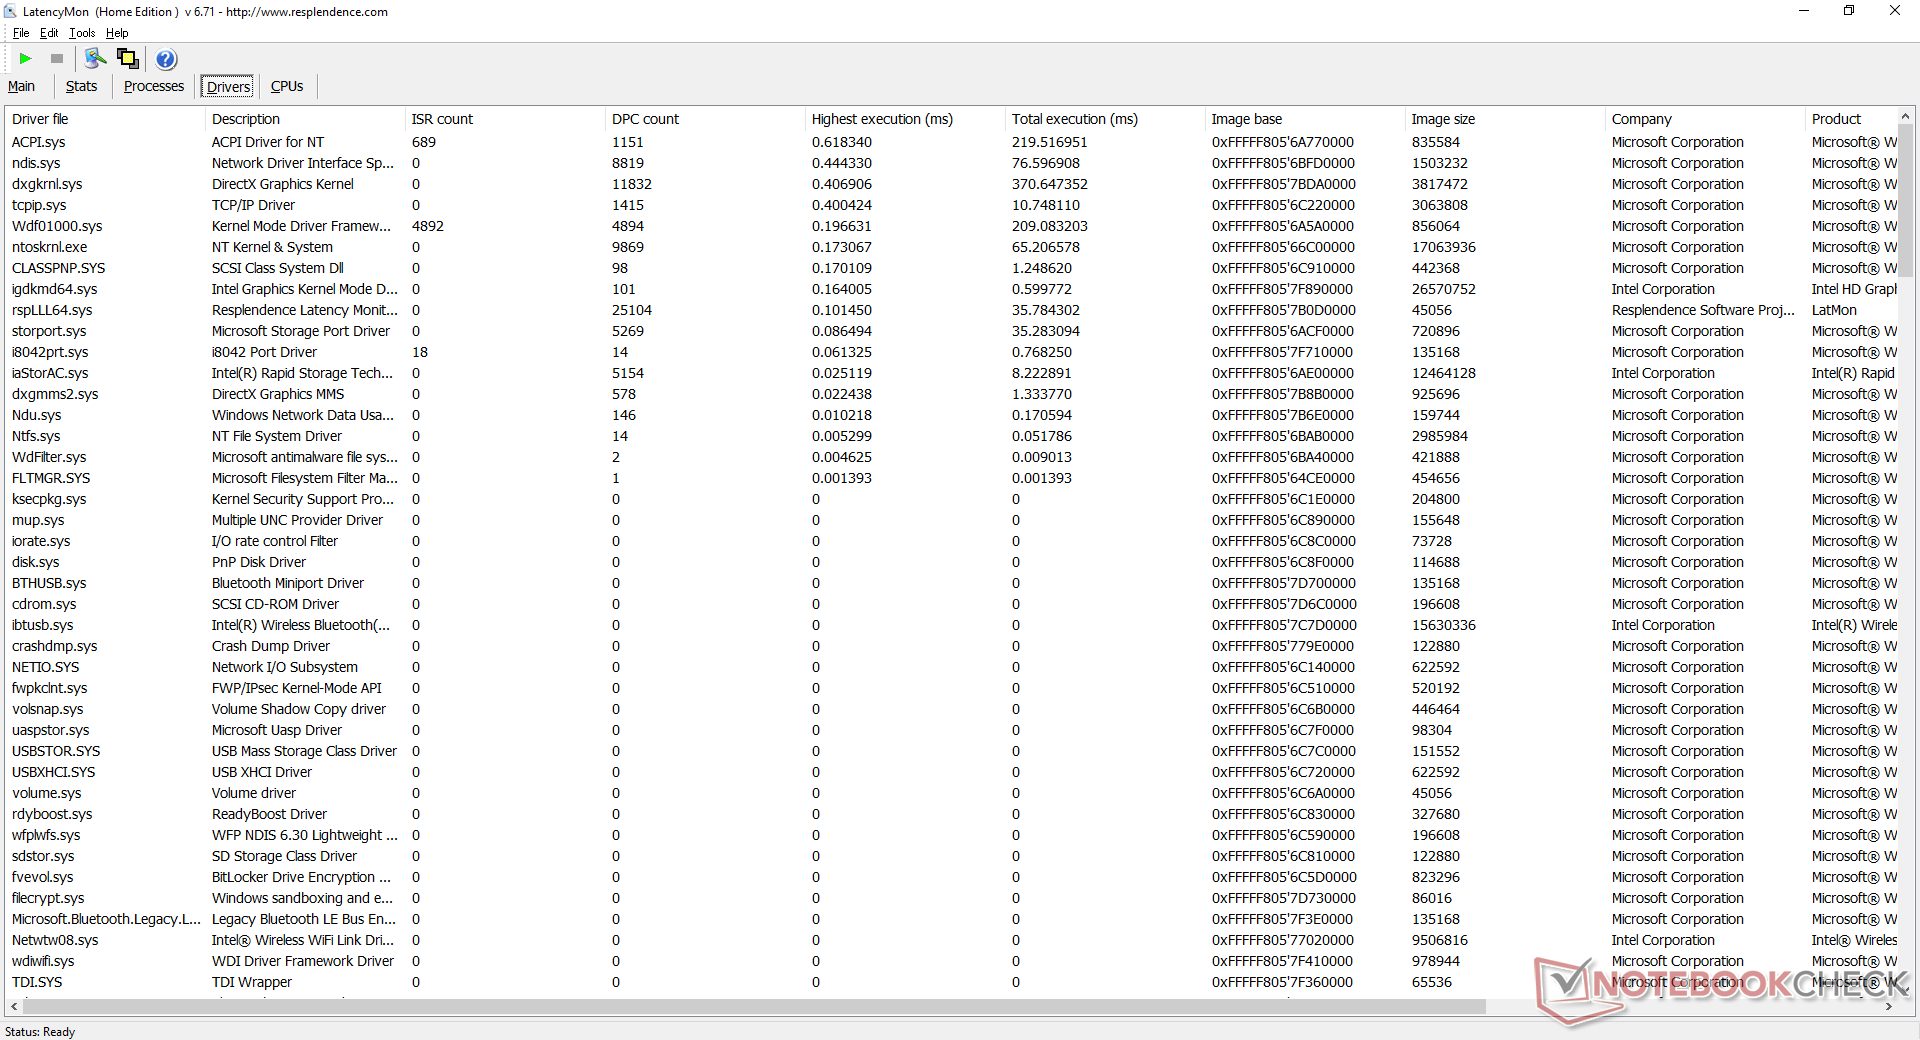
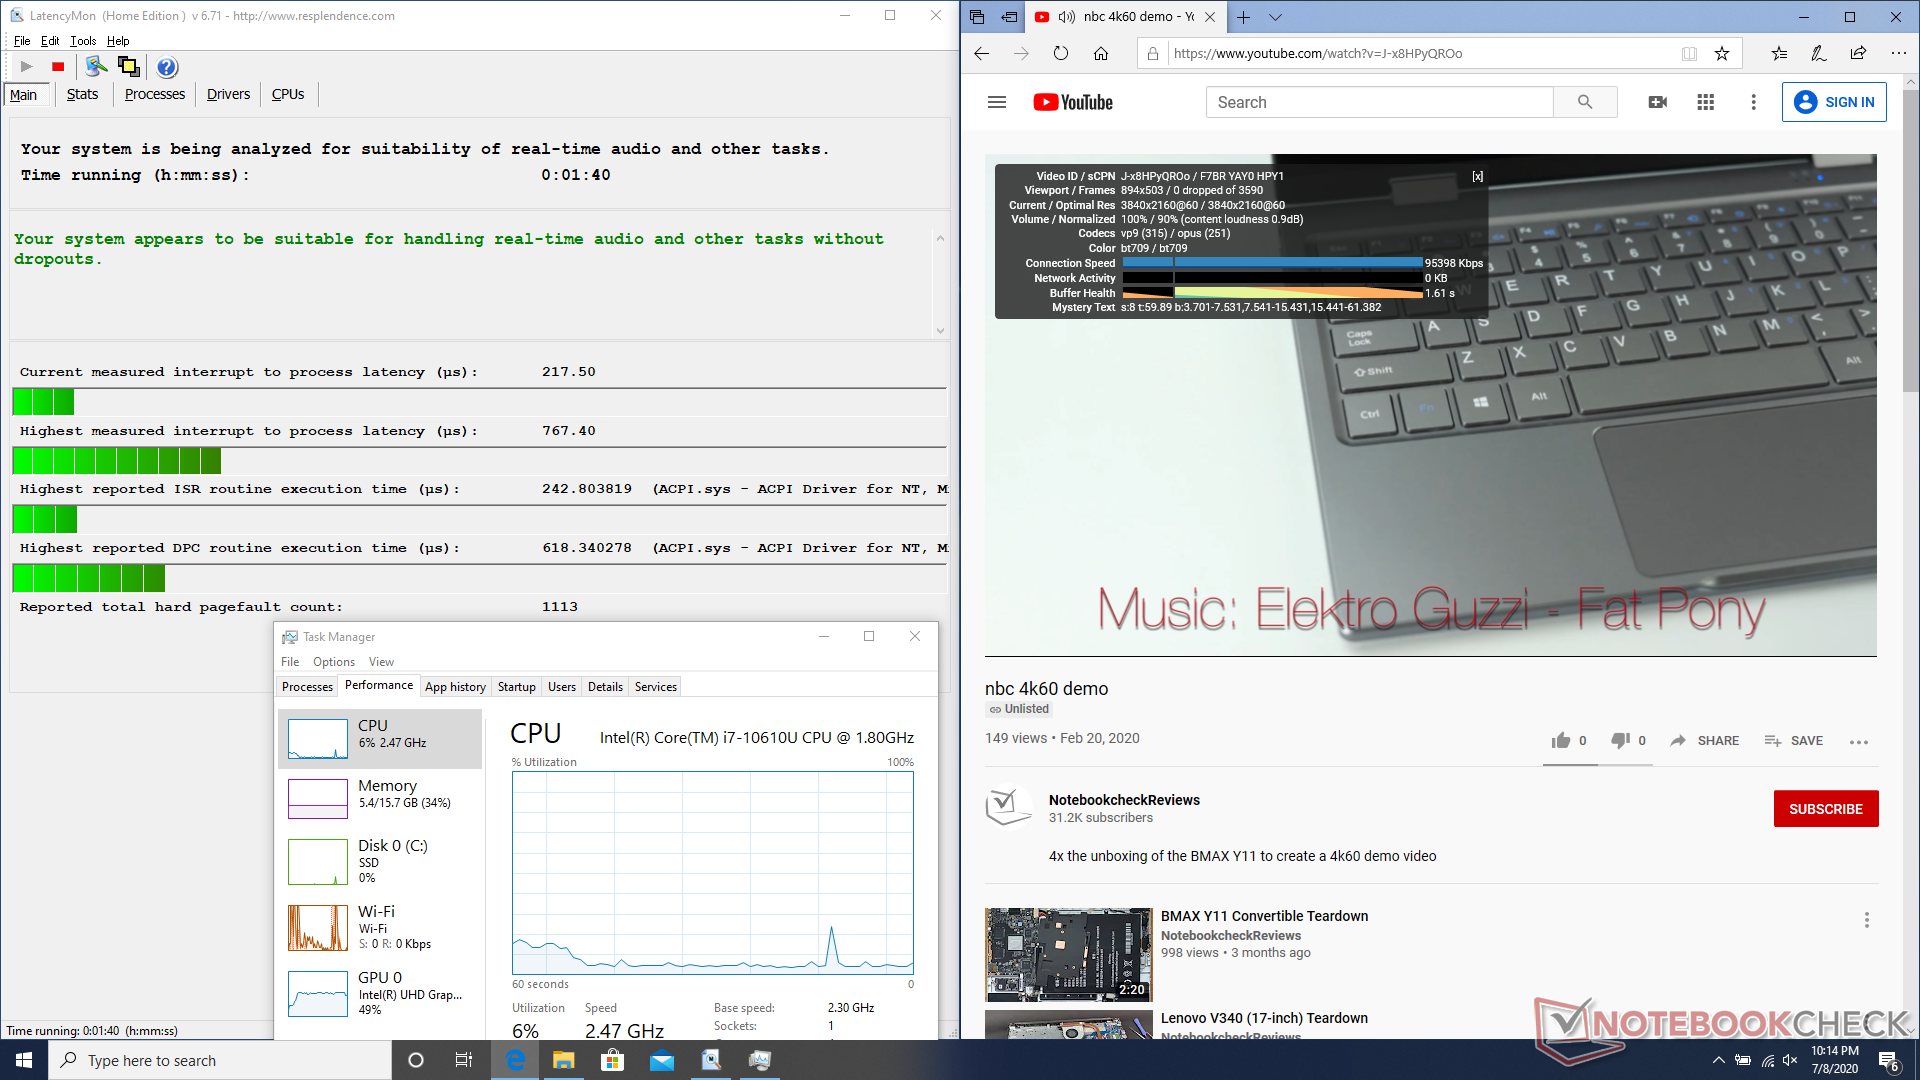
DPC Latency
LatencyMon shows no DPC latency issues when opening multiple browser tabs on our homepage. 4K video playback on YouTube is also smooth with no dropped frames reported.
| DPC Latencies / LatencyMon - interrupt to process latency (max), Web, Youtube, Prime95 | |
| Dell XPS 13 9300 4K UHD | |
| HP EliteBook 735 G6 7KN29EA | |
| Dell XPS 13 9300 i5 FHD | |
| HP Envy x360 13-ay0010nr | |
| HP ProBook 455 G7-175W8EA | |
| Acer Swift 3 SF314-42-R27B | |
| Dell Latitude 7410 | |
| Dell Latitude 7310 | |
* ... smaller is better
Storage Devices
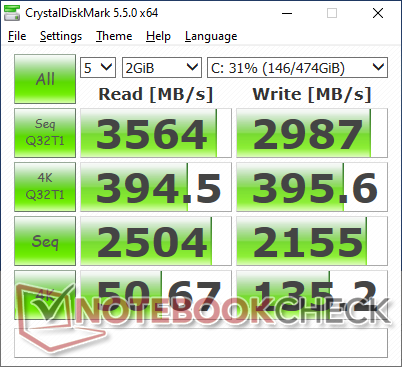
Whereas our 2019 Latitude 7300 came with a fast 512 GB Samsung PM981 NVMe SSD, our Latitude 7310 comes with an even faster 512 GB Samsung PM981a for higher theoretical sequential read (3500 MB/s vs. 3000 MB/s) and write rates (2900 MB/s vs. 1800 MB/s). In practice, however, you're not likely going to notice any real-world performance advantages between a Samsung PM981 or PM981a when running light loads that this particular office laptop is designed for.
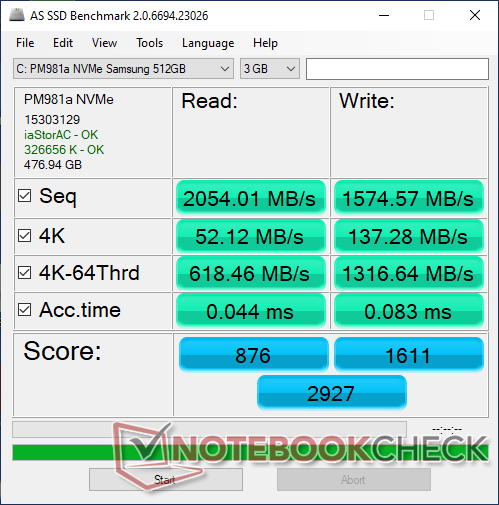
| Dell Latitude 7310 Samsung SSD PM981a MZVLB512HBJQ | Dell Latitude 7300-P99G Samsung SSD PM981 MZVLB512HAJQ | Asus ZenBook S13 UX392FN WDC PC SN520 SDAPNUW-512G | HP EliteBook 735 G6 7KN29EA WDC PC SN520 SDAPNUW-256G | Apple MacBook Pro 13 2020 2GHz i5 10th-Gen Apple SSD SM0512F | |
|---|---|---|---|---|---|
| AS SSD | 21% | -4% | -53% | -70% | |
| Seq Read (MB/s) | 2054 | 2749 34% | 1224 -40% | 1499 -27% | 1300 -37% |
| Seq Write (MB/s) | 1575 | 1367 -13% | 907 -42% | 1172 -26% | 1518 -4% |
| 4K Read (MB/s) | 52.1 | 49.94 -4% | 41.46 -20% | 35.42 -32% | 14.09 -73% |
| 4K Write (MB/s) | 137.3 | 137.6 0% | 126.2 -8% | 77.2 -44% | 24.25 -82% |
| 4K-64 Read (MB/s) | 618 | 987 60% | 1021 65% | 463.6 -25% | 725 17% |
| 4K-64 Write (MB/s) | 1317 | 1465 11% | 1251 -5% | 413.3 -69% | 169.6 -87% |
| Access Time Read * (ms) | 0.044 | 0.042 5% | 0.053 -20% | 0.133 -202% | 0.172 -291% |
| Access Time Write * (ms) | 0.083 | 0.029 65% | 0.027 67% | 0.049 41% | 0.155 -87% |
| Score Read (Points) | 876 | 1312 50% | 1185 35% | 649 -26% | 869 -1% |
| Score Write (Points) | 1611 | 1739 8% | 1468 -9% | 608 -62% | 346 -79% |
| Score Total (Points) | 2927 | 3662 25% | 3250 11% | 1582 -46% | 1667 -43% |
| Copy ISO MB/s (MB/s) | 2297 | 2761 20% | 1404 -39% | 1249 -46% | |
| Copy Program MB/s (MB/s) | 540 | 622 15% | 402.4 -25% | 53.5 -90% | |
| Copy Game MB/s (MB/s) | 1288 | 1584 23% | 902 -30% | 201.3 -84% | |
| CrystalDiskMark 5.2 / 6 | 2% | -14% | -41% | -38% | |
| Write 4K (MB/s) | 135.2 | 141.1 4% | 149.2 10% | 116 -14% | 28.16 -79% |
| Read 4K (MB/s) | 50.7 | 46.37 -9% | 47.18 -7% | 39.81 -21% | 17.5 -65% |
| Write Seq (MB/s) | 2155 | 1994 -7% | 750 -65% | 1300 -40% | 1195 -45% |
| Read Seq (MB/s) | 2504 | 2275 -9% | 1137 -55% | 803 -68% | 1470 -41% |
| Write 4K Q32T1 (MB/s) | 395.6 | 493.3 25% | 749 89% | 187.6 -53% | 205 -48% |
| Read 4K Q32T1 (MB/s) | 394.5 | 429 9% | 478.7 21% | 305.9 -22% | 692 75% |
| Write Seq Q32T1 (MB/s) | 2987 | 2992 0% | 1453 -51% | 1299 -57% | 1475 -51% |
| Read Seq Q32T1 (MB/s) | 3564 | 3562 0% | 1713 -52% | 1741 -51% | 1920 -46% |
| Write 4K Q8T8 (MB/s) | 409.1 | ||||
| Read 4K Q8T8 (MB/s) | 1137 | ||||
| Total Average (Program / Settings) | 12% /
14% | -9% /
-8% | -47% /
-48% | -54% /
-56% |
* ... smaller is better

Disk Throttling: DiskSpd Read Loop, Queue Depth 8
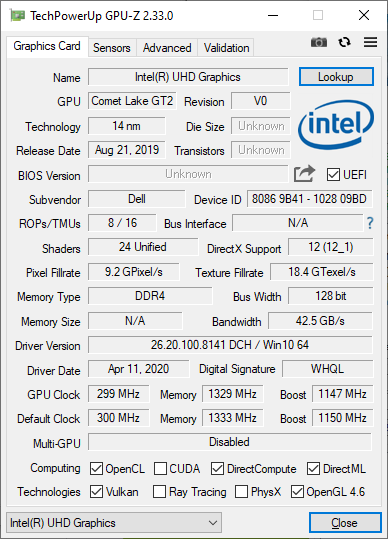
GPU Performance
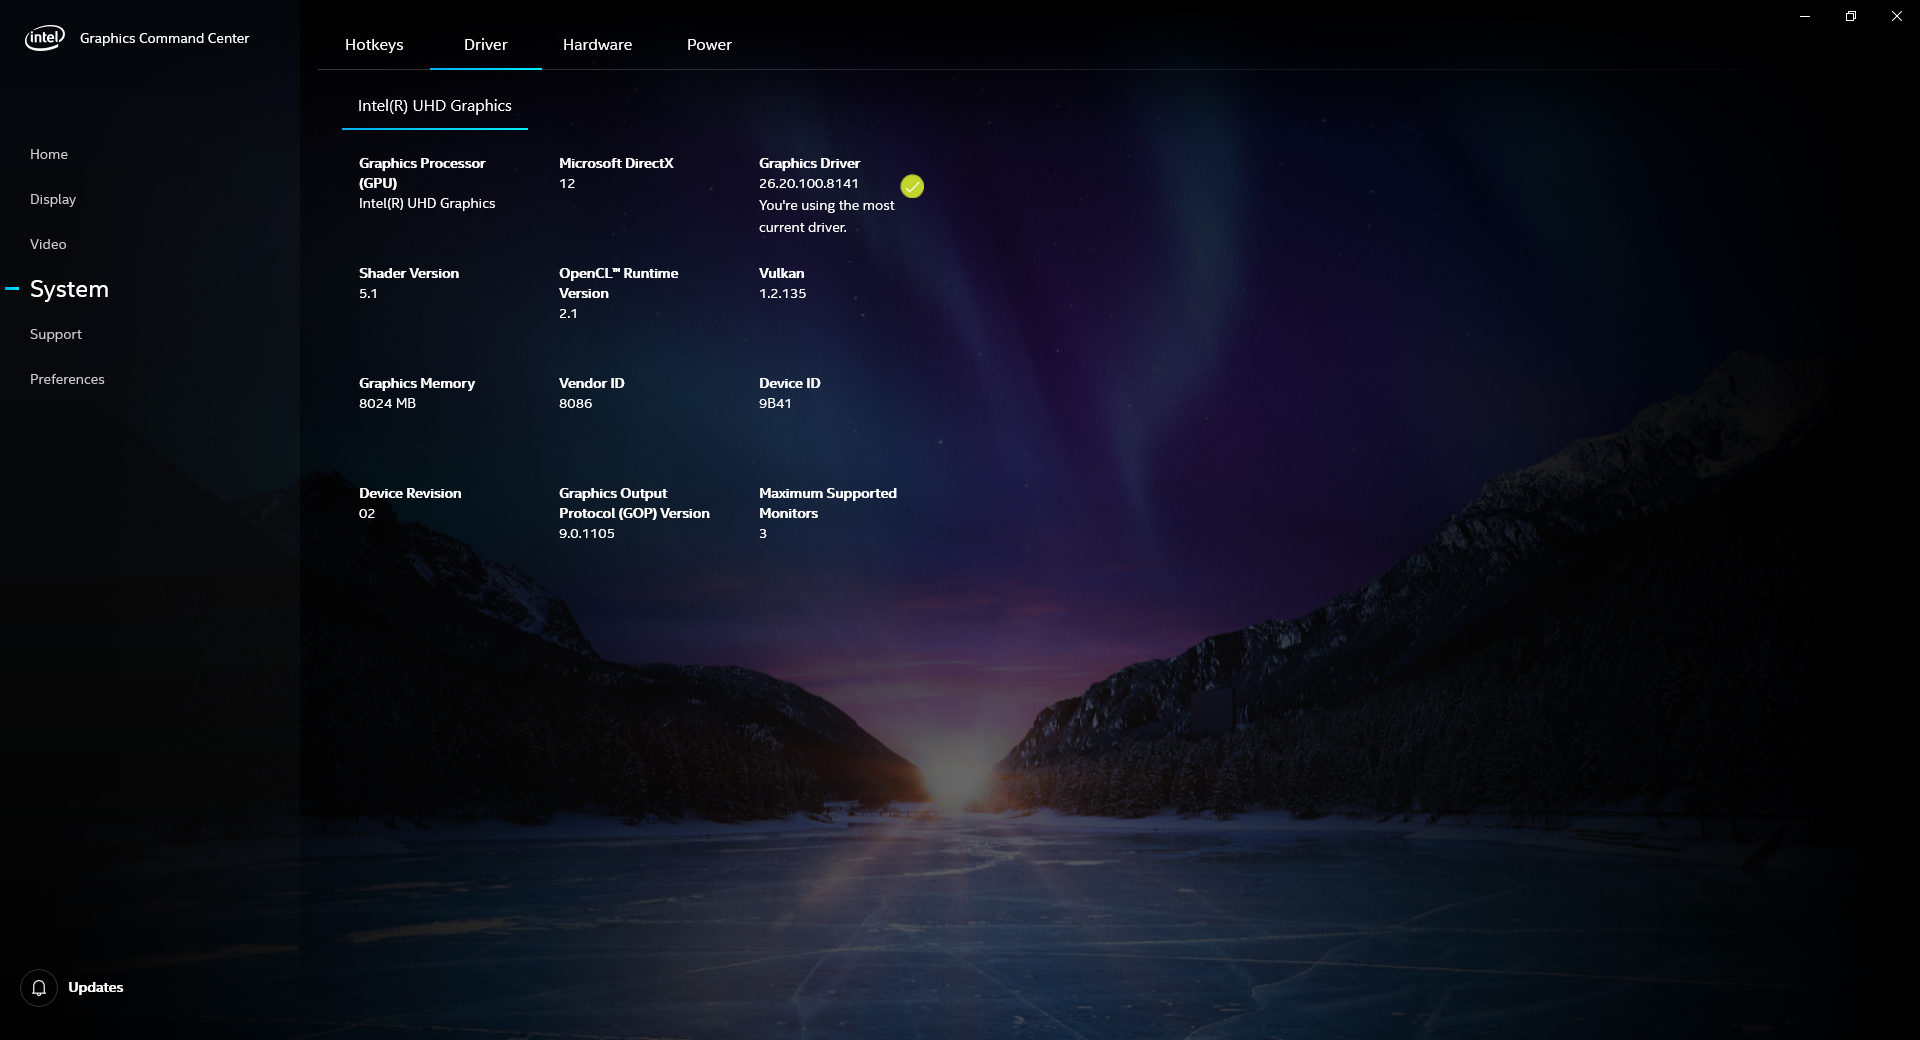
The integrated UHD Graphics 620 is nothing special as it's the same GPU we've been seeing for years. Its meager performance shouldn't be an issue for the target audience where workloads are less likely to be heavy on graphics, but it's also a shame that there are no Iris, GeForce MX, or RX Vega options which would have boosted GPU performance significantly. Lenovo, for example, recently launched a handful of faster ThinkPad systems all sporting AMD's latest processors with vPro-like features.
See our dedicated page on the UHD Graphics 620 for more technical information and benchmarks.
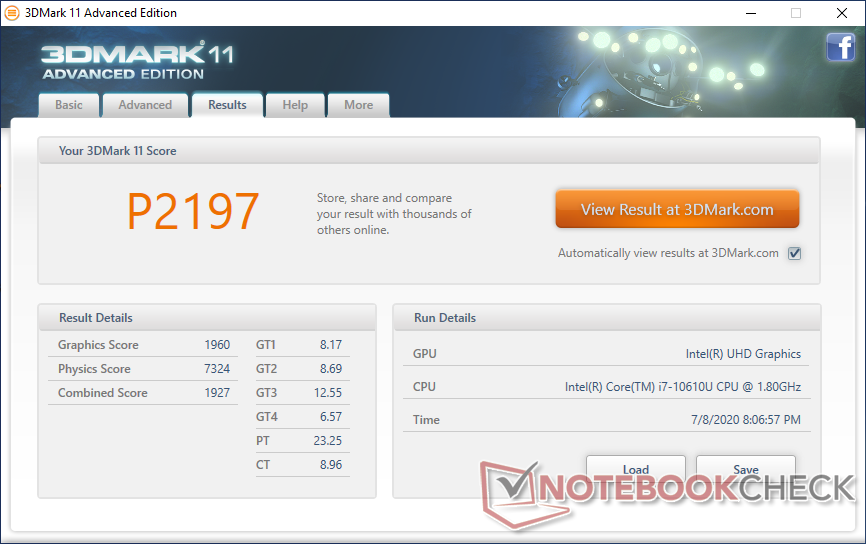
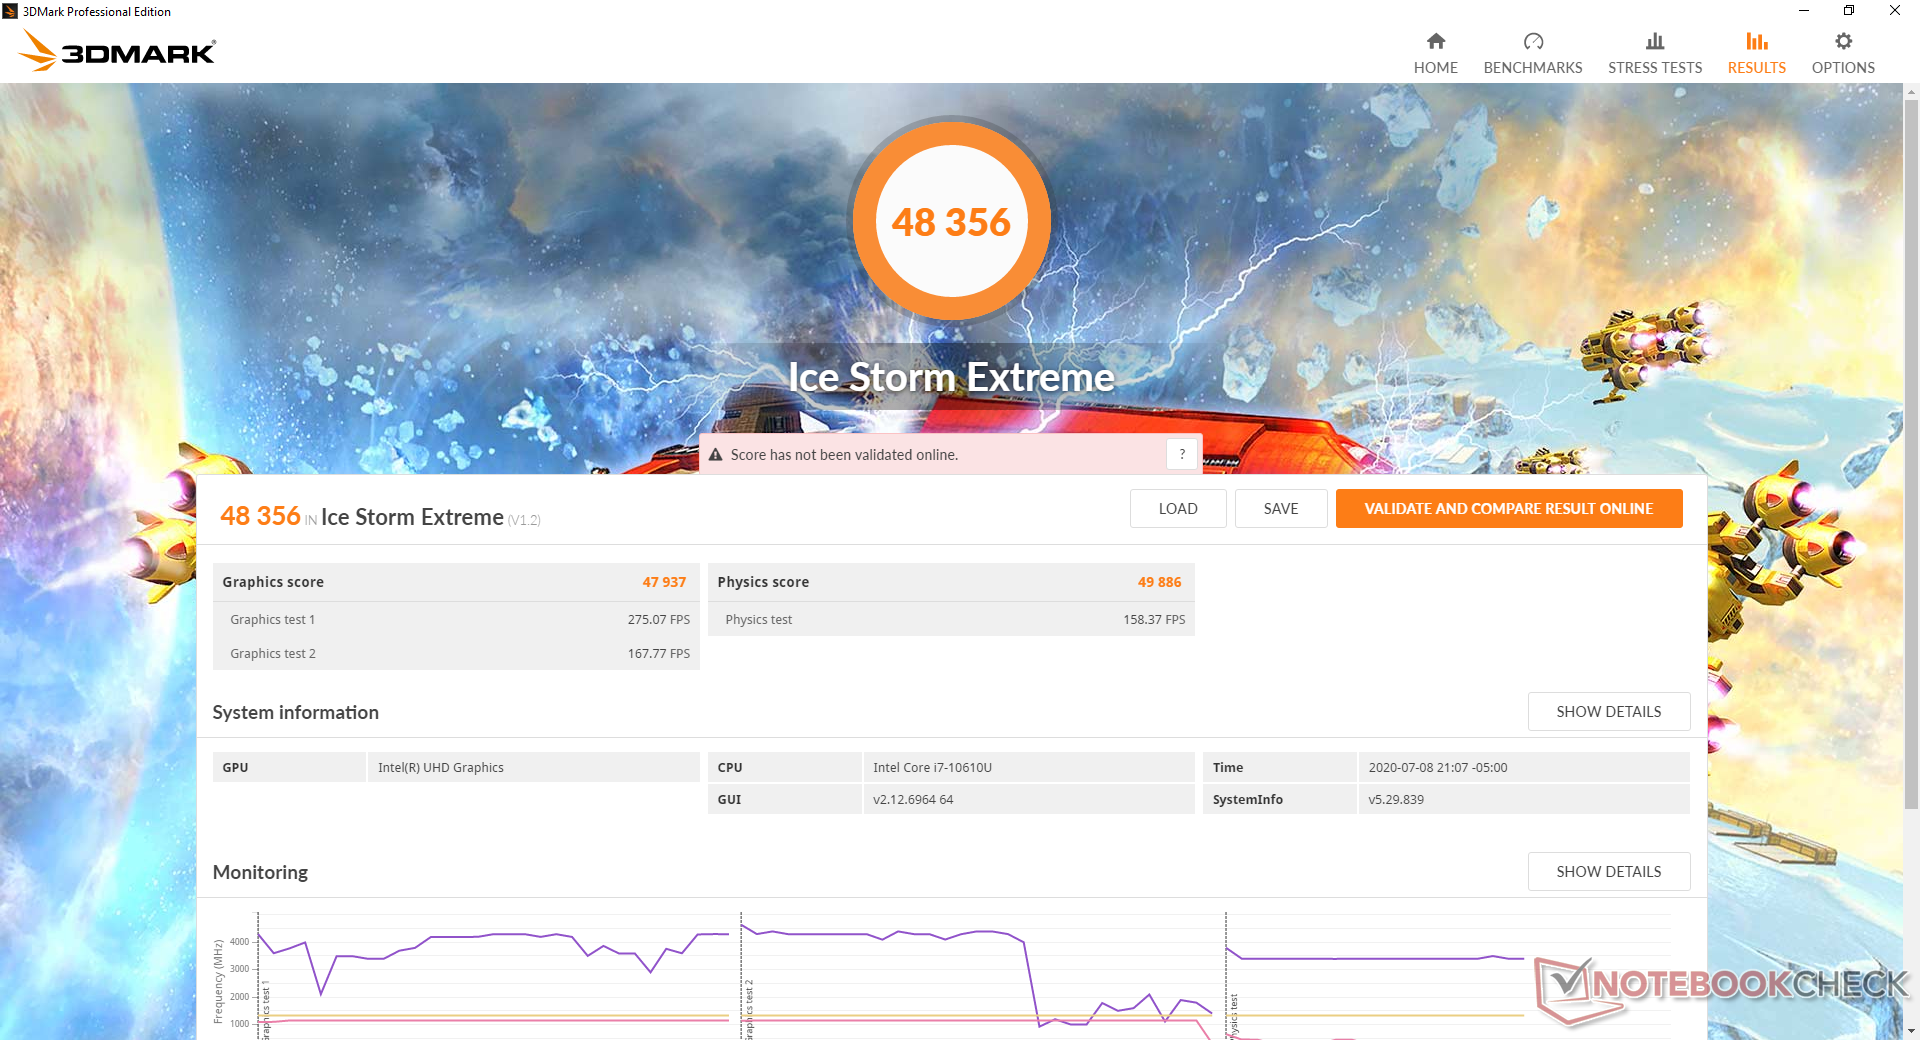
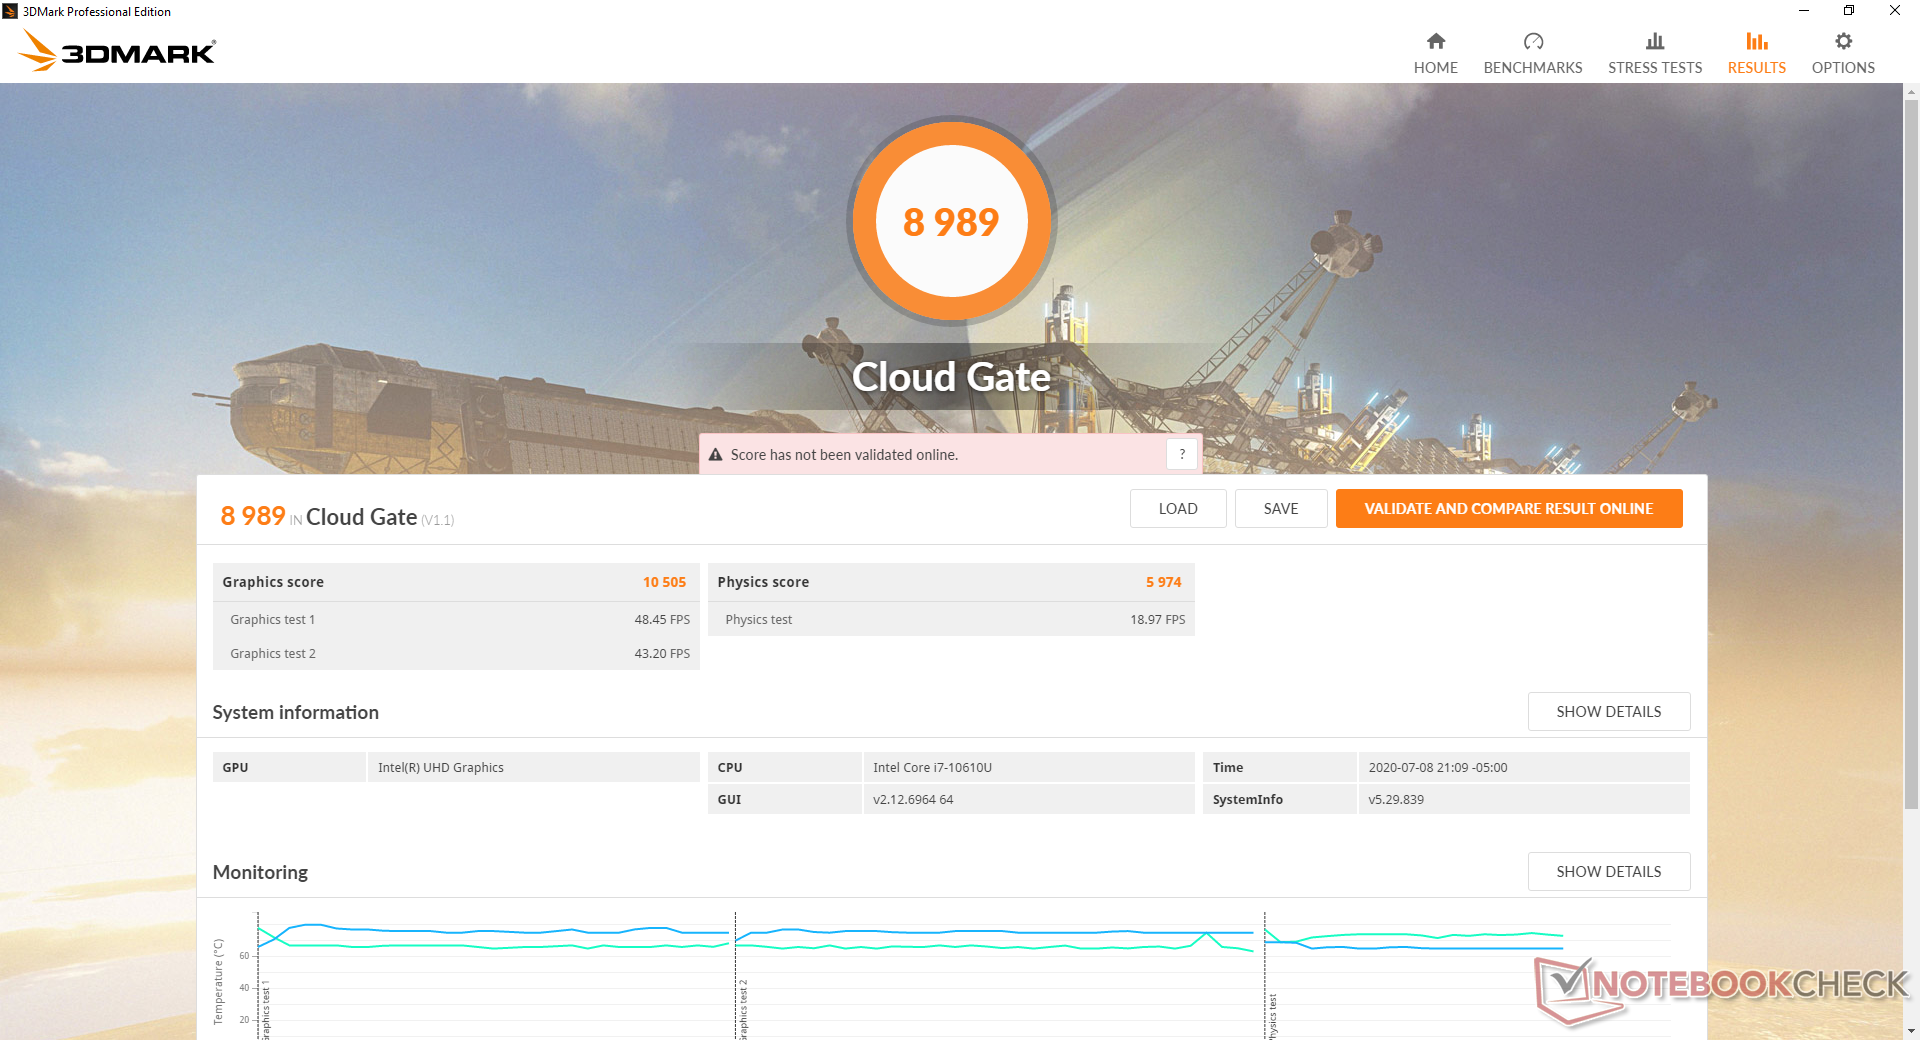
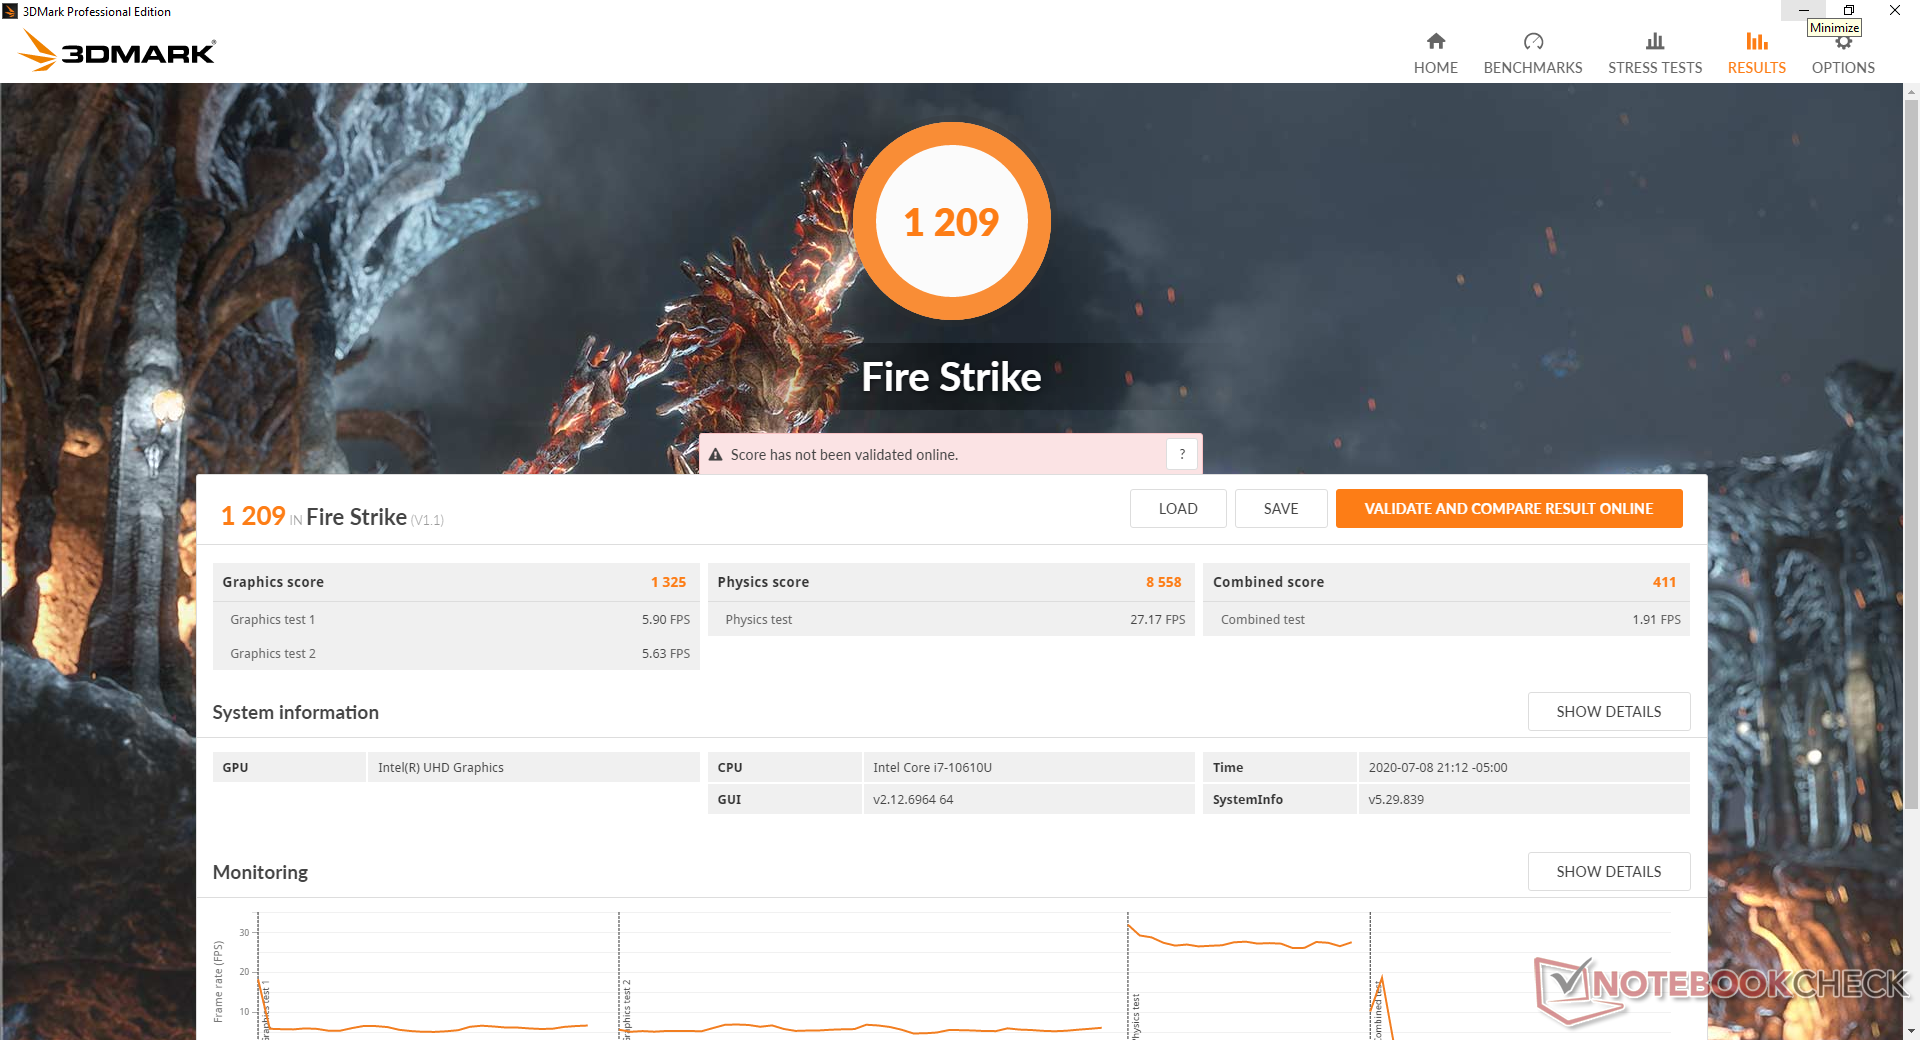
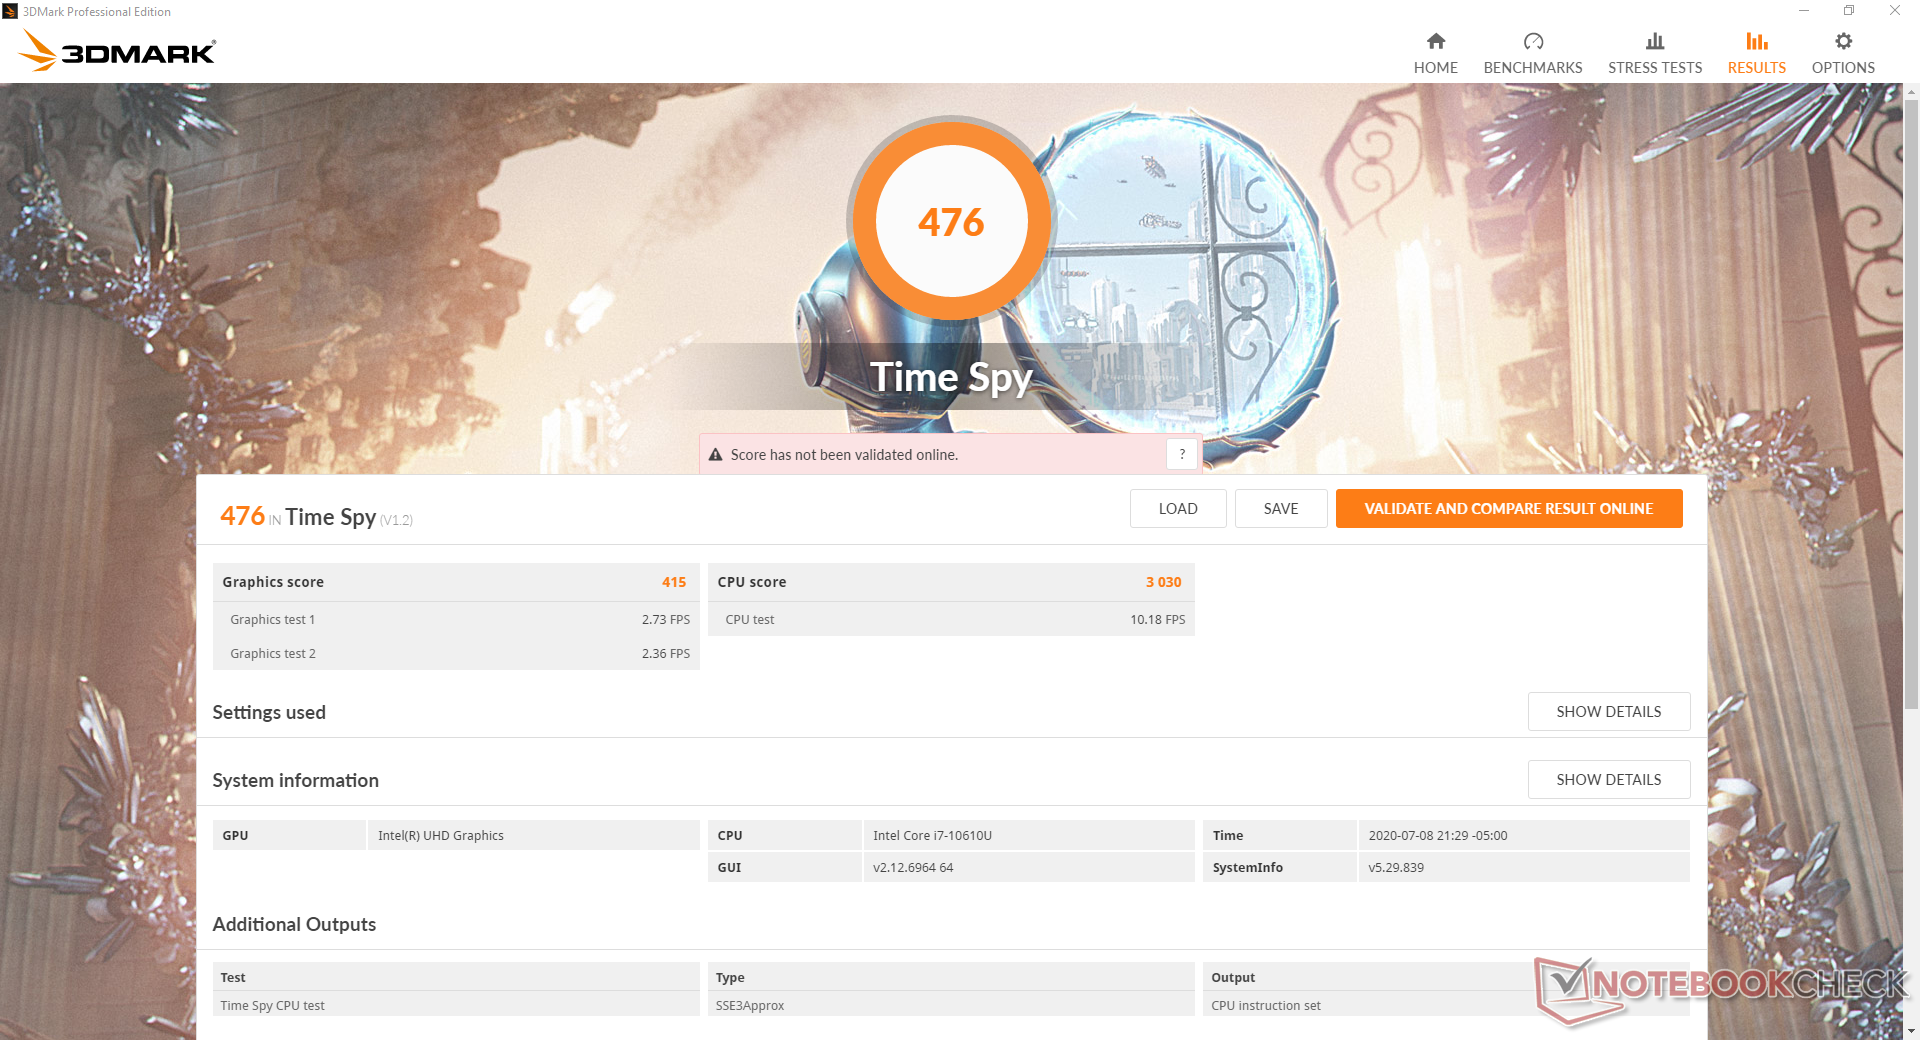
| 3DMark 11 Performance | 2197 points | |
| 3DMark Cloud Gate Standard Score | 8989 points | |
| 3DMark Fire Strike Score | 1209 points | |
| 3DMark Time Spy Score | 476 points | |
Help | ||
| low | med. | high | ultra | |
|---|---|---|---|---|
| The Witcher 3 (2015) | 20.7 | 10.9 | ||
| Dota 2 Reborn (2015) | 84.5 | 49.3 | 22.8 | 20.3 |
| X-Plane 11.11 (2018) | 13.2 | 10.7 | 11.2 |
Emissions
System Noise
With nothing more than a 15 W CPU to cool, the internal fan should be silent or at least quiet most of the time and that is exactly what we are getting here. Even when running our 90-second 3DMark 06 benchmark, for example, fan noise would rise to just 30 dB(A) against a background of 29 dB(A) to be essentially inaudible in a typical office or classroom environment.
We're able to record a maximum fan noise of 41.3 dB(A) only after running Prime95 for several minutes similar to what we observed on the Latitude 7410. Otherwise, fan noise will rarely go beyond 35 dB(A) unless if you intend to run intensive tasks for long periods.
| Dell Latitude 7310 UHD Graphics 620, i7-10610U, Samsung SSD PM981a MZVLB512HBJQ | Dell Latitude 7300-P99G UHD Graphics 620, i7-8665U, Samsung SSD PM981 MZVLB512HAJQ | Asus ZenBook S13 UX392FN GeForce MX150, i7-8565U, WDC PC SN520 SDAPNUW-512G | Lenovo ThinkPad X395 Vega 6, R3 PRO 3300U, Samsung SSD PM981a MZVLB256HBHQ | HP EliteBook 735 G6 7KN29EA Vega 8, R5 PRO 3500U, WDC PC SN520 SDAPNUW-256G | Apple MacBook Pro 13 2020 2GHz i5 10th-Gen Iris Plus Graphics G7 (Ice Lake 64 EU), i5-1038NG7, Apple SSD SM0512F | |
|---|---|---|---|---|---|---|
| Noise | -2% | -5% | -2% | -1% | -4% | |
| off / environment * (dB) | 29 | 30 -3% | 28.1 3% | 30.2 -4% | 29.6 -2% | 29.6 -2% |
| Idle Minimum * (dB) | 29 | 30 -3% | 28.1 3% | 30.2 -4% | 29.6 -2% | 29.6 -2% |
| Idle Average * (dB) | 29 | 30 -3% | 28.1 3% | 30.2 -4% | 29.6 -2% | 29.6 -2% |
| Idle Maximum * (dB) | 29 | 30 -3% | 29 -0% | 30.2 -4% | 30.9 -7% | 29.6 -2% |
| Load Average * (dB) | 30.1 | 35 -16% | 41.1 -37% | 34.3 -14% | 33.9 -13% | 34.4 -14% |
| Load Maximum * (dB) | 41.3 | 35 15% | 41.1 -0% | 34.3 17% | 33.9 18% | 42.1 -2% |
| Witcher 3 ultra * (dB) | 41.1 | 36.1 |
* ... smaller is better
Noise level
| Idle |
| 29 / 29 / 29 dB(A) |
| Load |
| 30.1 / 41.3 dB(A) |
 | ||
30 dB silent 40 dB(A) audible 50 dB(A) loud |
||
min: | ||
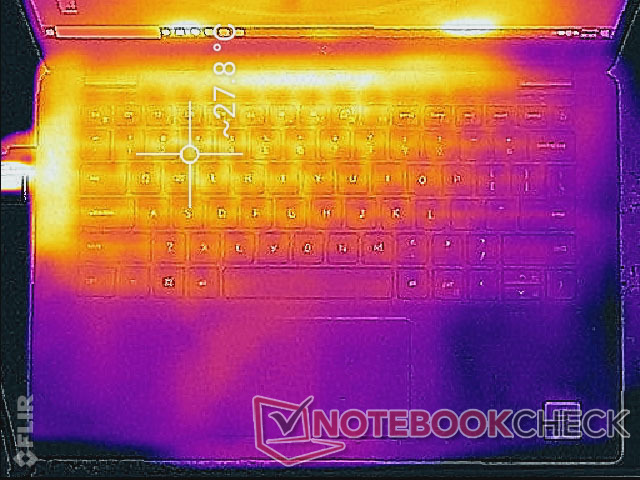
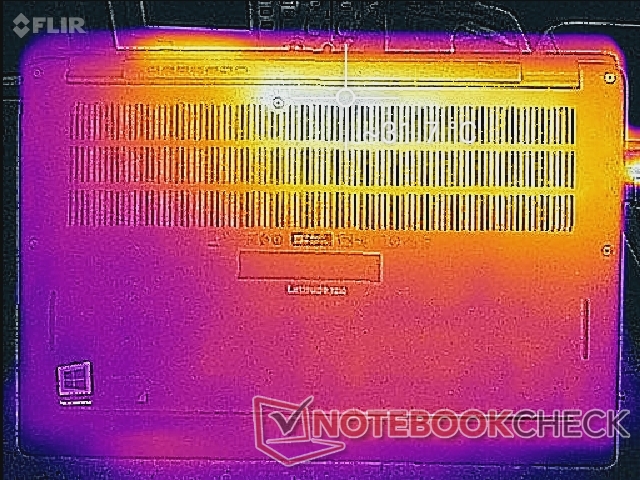
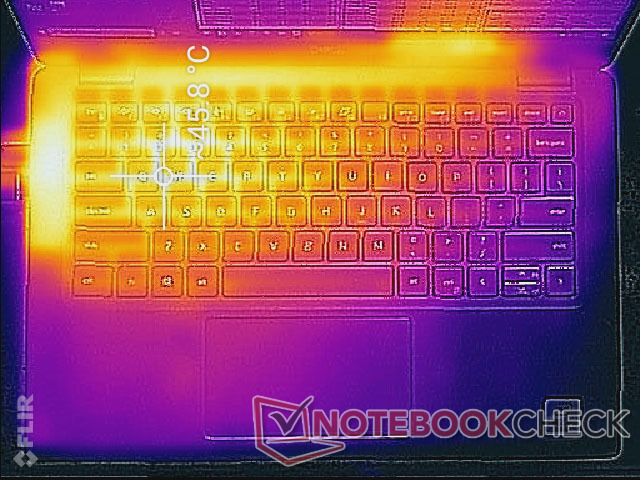
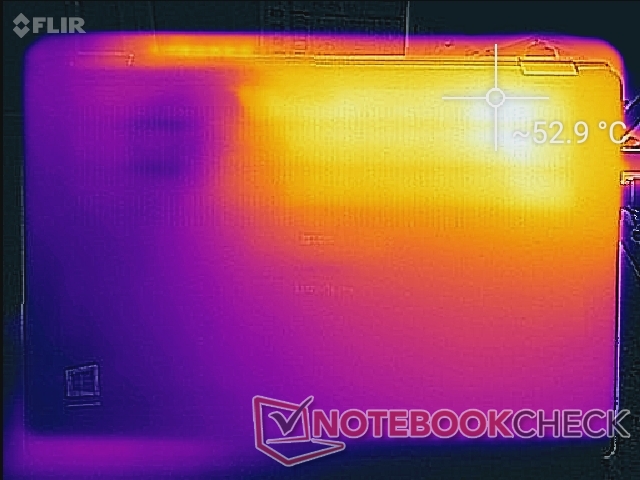
Temperature
Surface temperatures are warmer on the left half of the laptop than the right as shown by the temperature maps below. When under Prime95+FurMark stress, hot spots can become as warm as 45 C to 53 C on the top and bottom, respectively. Typing on the left half of the keyboard can feel uncomfortable if the system is under high processing loads as a result.
The temperature gradient is different from last year's Latitude 7300 where hot spots can be as warm as 62 C near the top center of the keyboard instead.
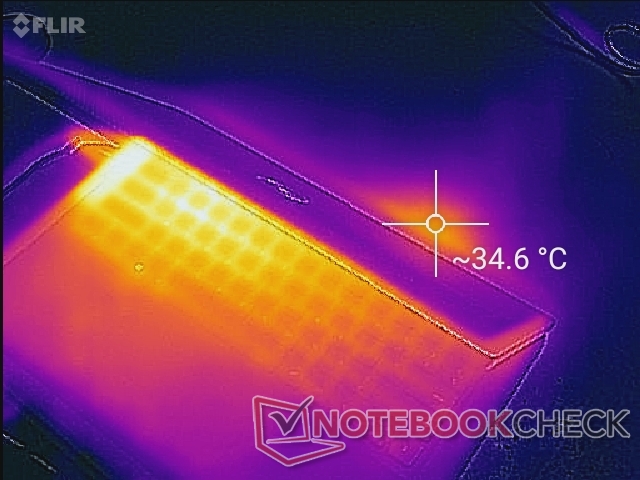
(-) The maximum temperature on the upper side is 45.2 °C / 113 F, compared to the average of 34.3 °C / 94 F, ranging from 21.2 to 62.5 °C for the class Office.
(-) The bottom heats up to a maximum of 52.8 °C / 127 F, compared to the average of 36.8 °C / 98 F
(+) In idle usage, the average temperature for the upper side is 26.3 °C / 79 F, compared to the device average of 29.5 °C / 85 F.
(+) The palmrests and touchpad are cooler than skin temperature with a maximum of 27.2 °C / 81 F and are therefore cool to the touch.
(±) The average temperature of the palmrest area of similar devices was 27.6 °C / 81.7 F (+0.4 °C / 0.7 F).
Stress Test
We stress the system with synthetic loads to identify for any potential throttling issues. When running Prime95, CPU clock rates would spike to 4.1 GHz for about 10 seconds before hitting a core temperature of 95 C. Clock rates would then quickly decline and stabilize at 2.4 GHz for a more tolerable core temperature of 69 C. Processor performance would throttle further down to 1.1 GHz if both the CPU and GPU are at 100 percent utilization. Perhaps unsurprisingly, these results are essentially the same as what we observed on the Latitude 7410 which comes with the same Core i7-10610U CPU.
Running on batteries will not limit performance. A 3DMark 11 test on battery power returns almost the same scores as when the system is connected to mains.
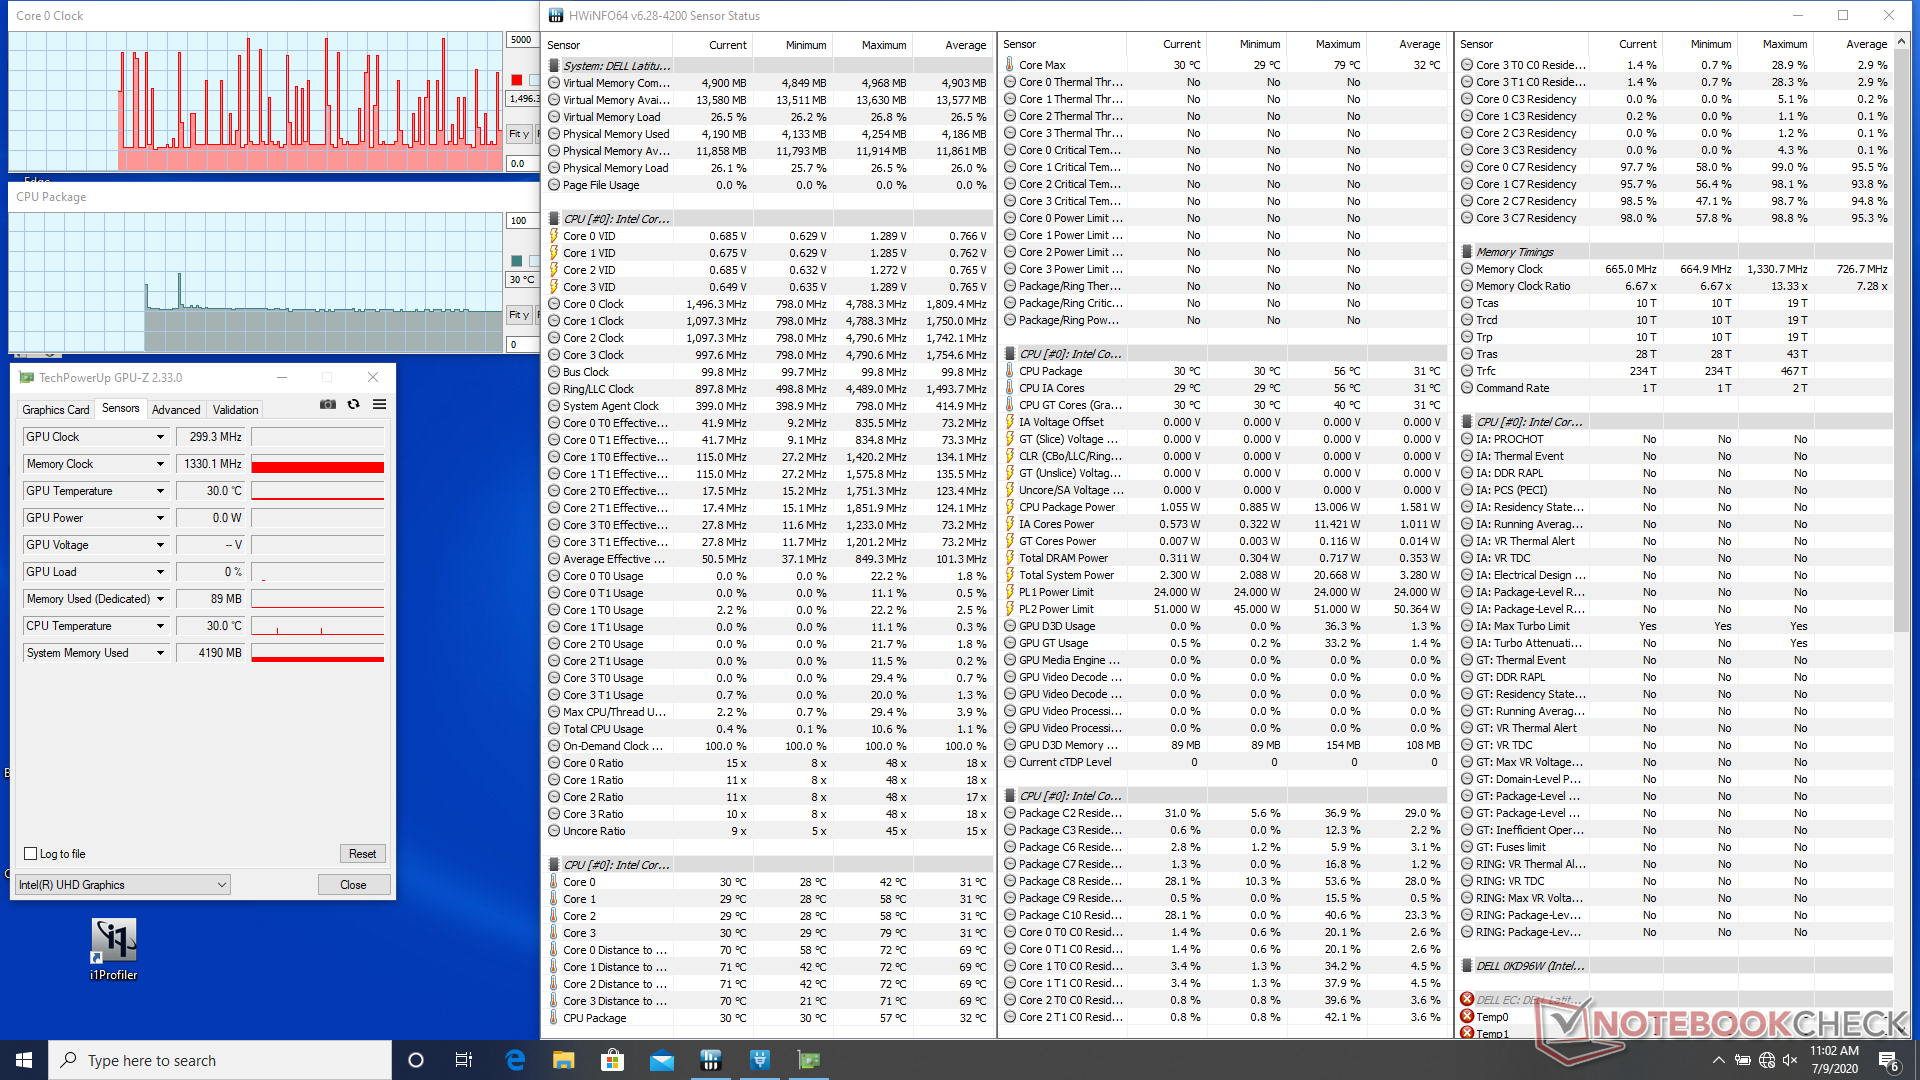
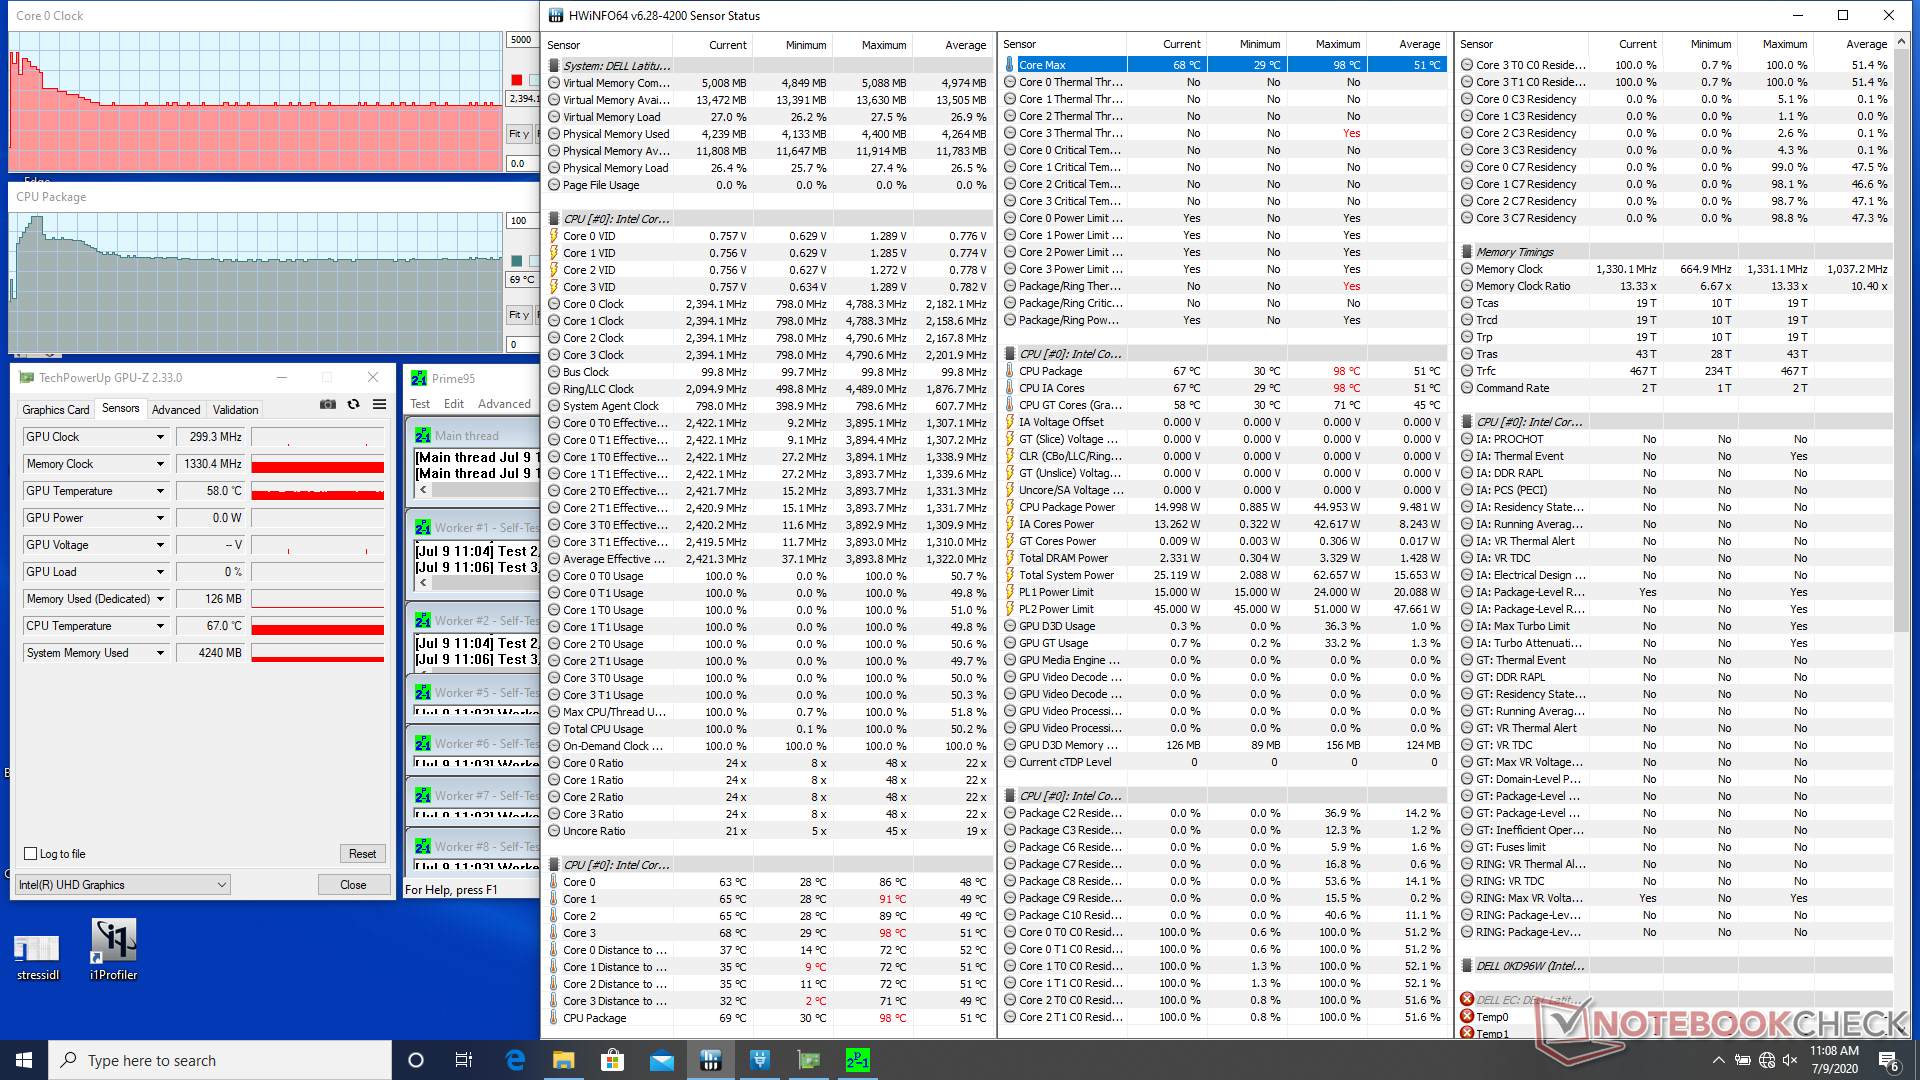
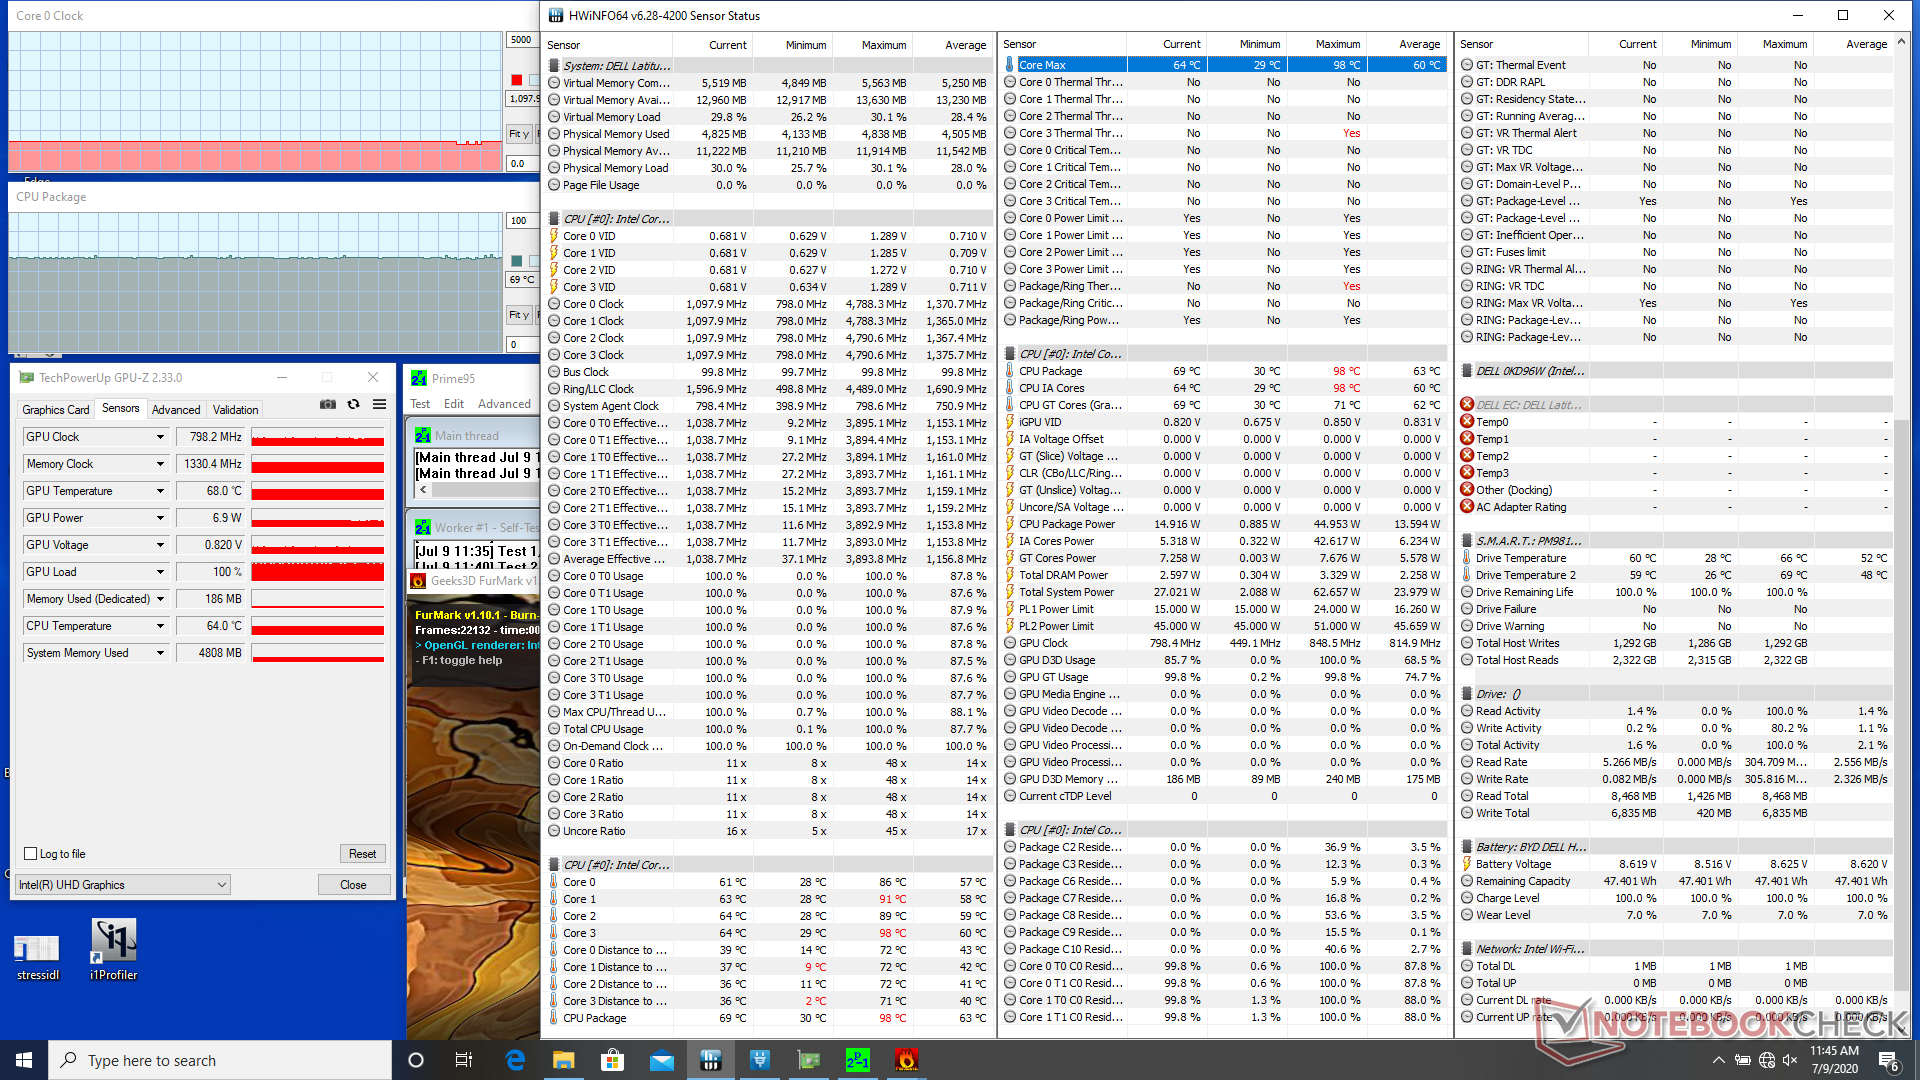
| CPU Clock (GHz) | GPU Clock (MHz) | Average CPU Temperature (°C) | |
| System Idle | -- | -- | 30 |
| Prime95 Stress | 2.4 | -- | 69 |
| Prime95 + FurMark Stress | 1.1 | 798 | 69 |
Speakers


Dell Latitude 7310 audio analysis
(+) | speakers can play relatively loud (84 dB)
Bass 100 - 315 Hz
(-) | nearly no bass - on average 16.2% lower than median
(±) | linearity of bass is average (11.5% delta to prev. frequency)
Mids 400 - 2000 Hz
(+) | balanced mids - only 2.8% away from median
(+) | mids are linear (4.4% delta to prev. frequency)
Highs 2 - 16 kHz
(+) | balanced highs - only 2.5% away from median
(+) | highs are linear (4% delta to prev. frequency)
Overall 100 - 16.000 Hz
(+) | overall sound is linear (12.4% difference to median)
Compared to same class
» 5% of all tested devices in this class were better, 1% similar, 94% worse
» The best had a delta of 7%, average was 21%, worst was 53%
Compared to all devices tested
» 10% of all tested devices were better, 2% similar, 88% worse
» The best had a delta of 4%, average was 24%, worst was 134%
Apple MacBook 12 (Early 2016) 1.1 GHz audio analysis
(+) | speakers can play relatively loud (83.6 dB)
Bass 100 - 315 Hz
(±) | reduced bass - on average 11.3% lower than median
(±) | linearity of bass is average (14.2% delta to prev. frequency)
Mids 400 - 2000 Hz
(+) | balanced mids - only 2.4% away from median
(+) | mids are linear (5.5% delta to prev. frequency)
Highs 2 - 16 kHz
(+) | balanced highs - only 2% away from median
(+) | highs are linear (4.5% delta to prev. frequency)
Overall 100 - 16.000 Hz
(+) | overall sound is linear (10.2% difference to median)
Compared to same class
» 7% of all tested devices in this class were better, 2% similar, 91% worse
» The best had a delta of 5%, average was 18%, worst was 53%
Compared to all devices tested
» 4% of all tested devices were better, 1% similar, 94% worse
» The best had a delta of 4%, average was 24%, worst was 134%
Energy Management
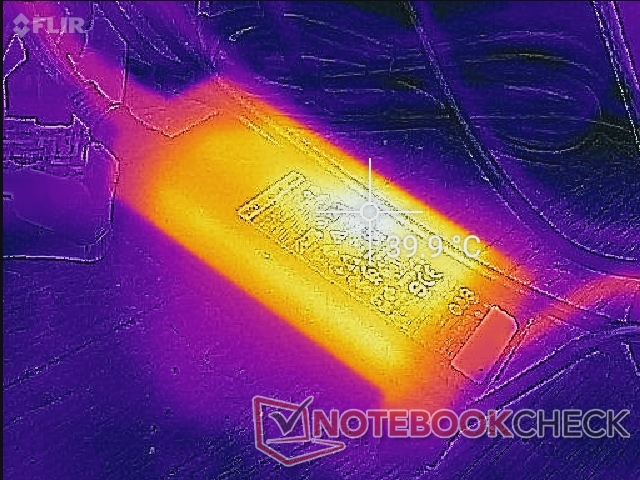
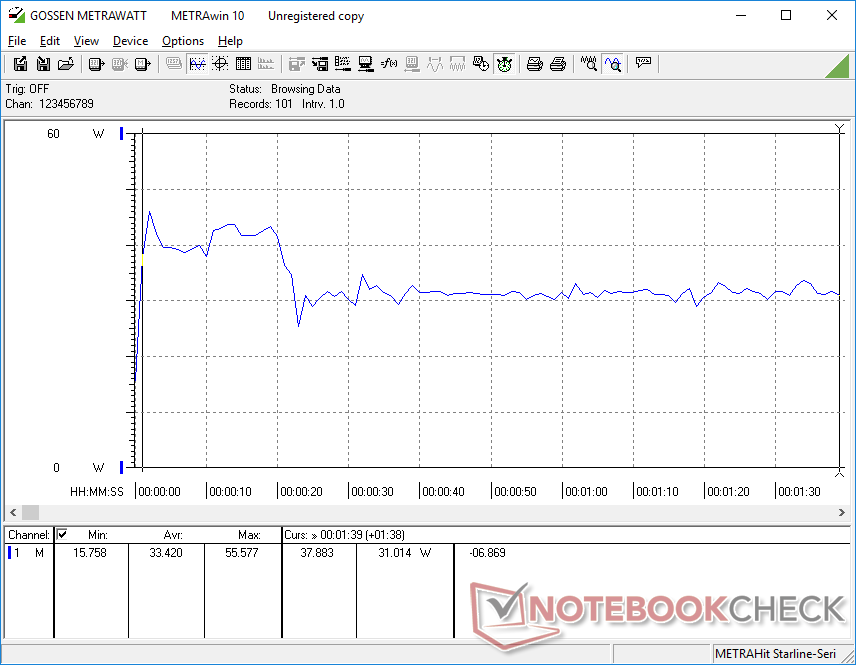
Power Consumption
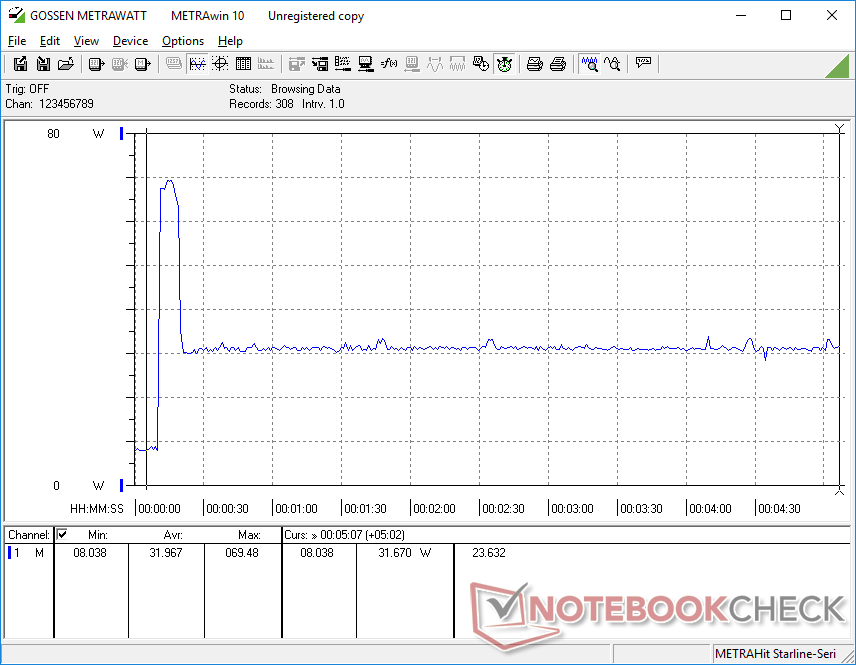
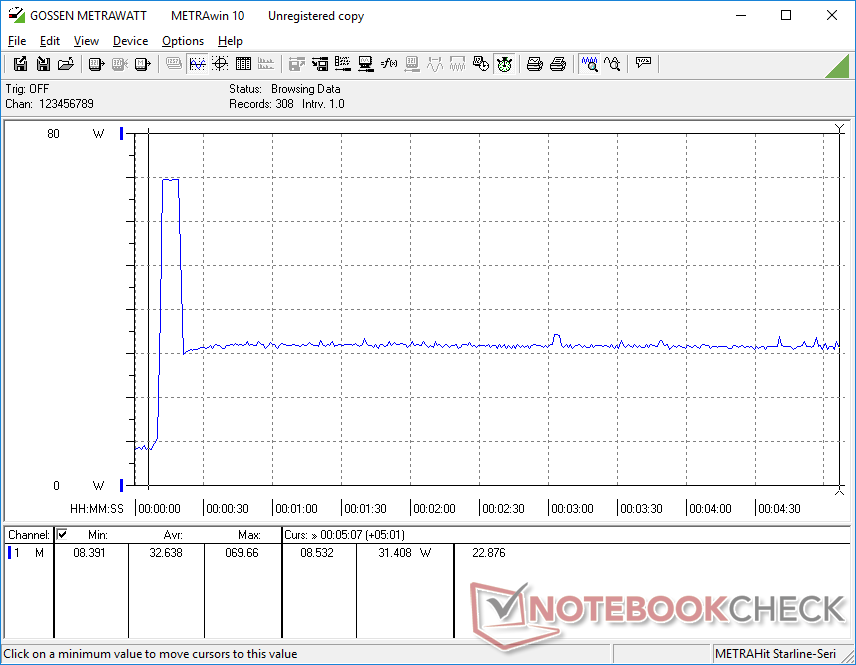
Idling on desktop consumes between 2 W and 5 W even when set to the maximum brightness setting to be more efficient than most other 13.3-inch laptops. The low consumption can be partly attributed to the low-power backlight.
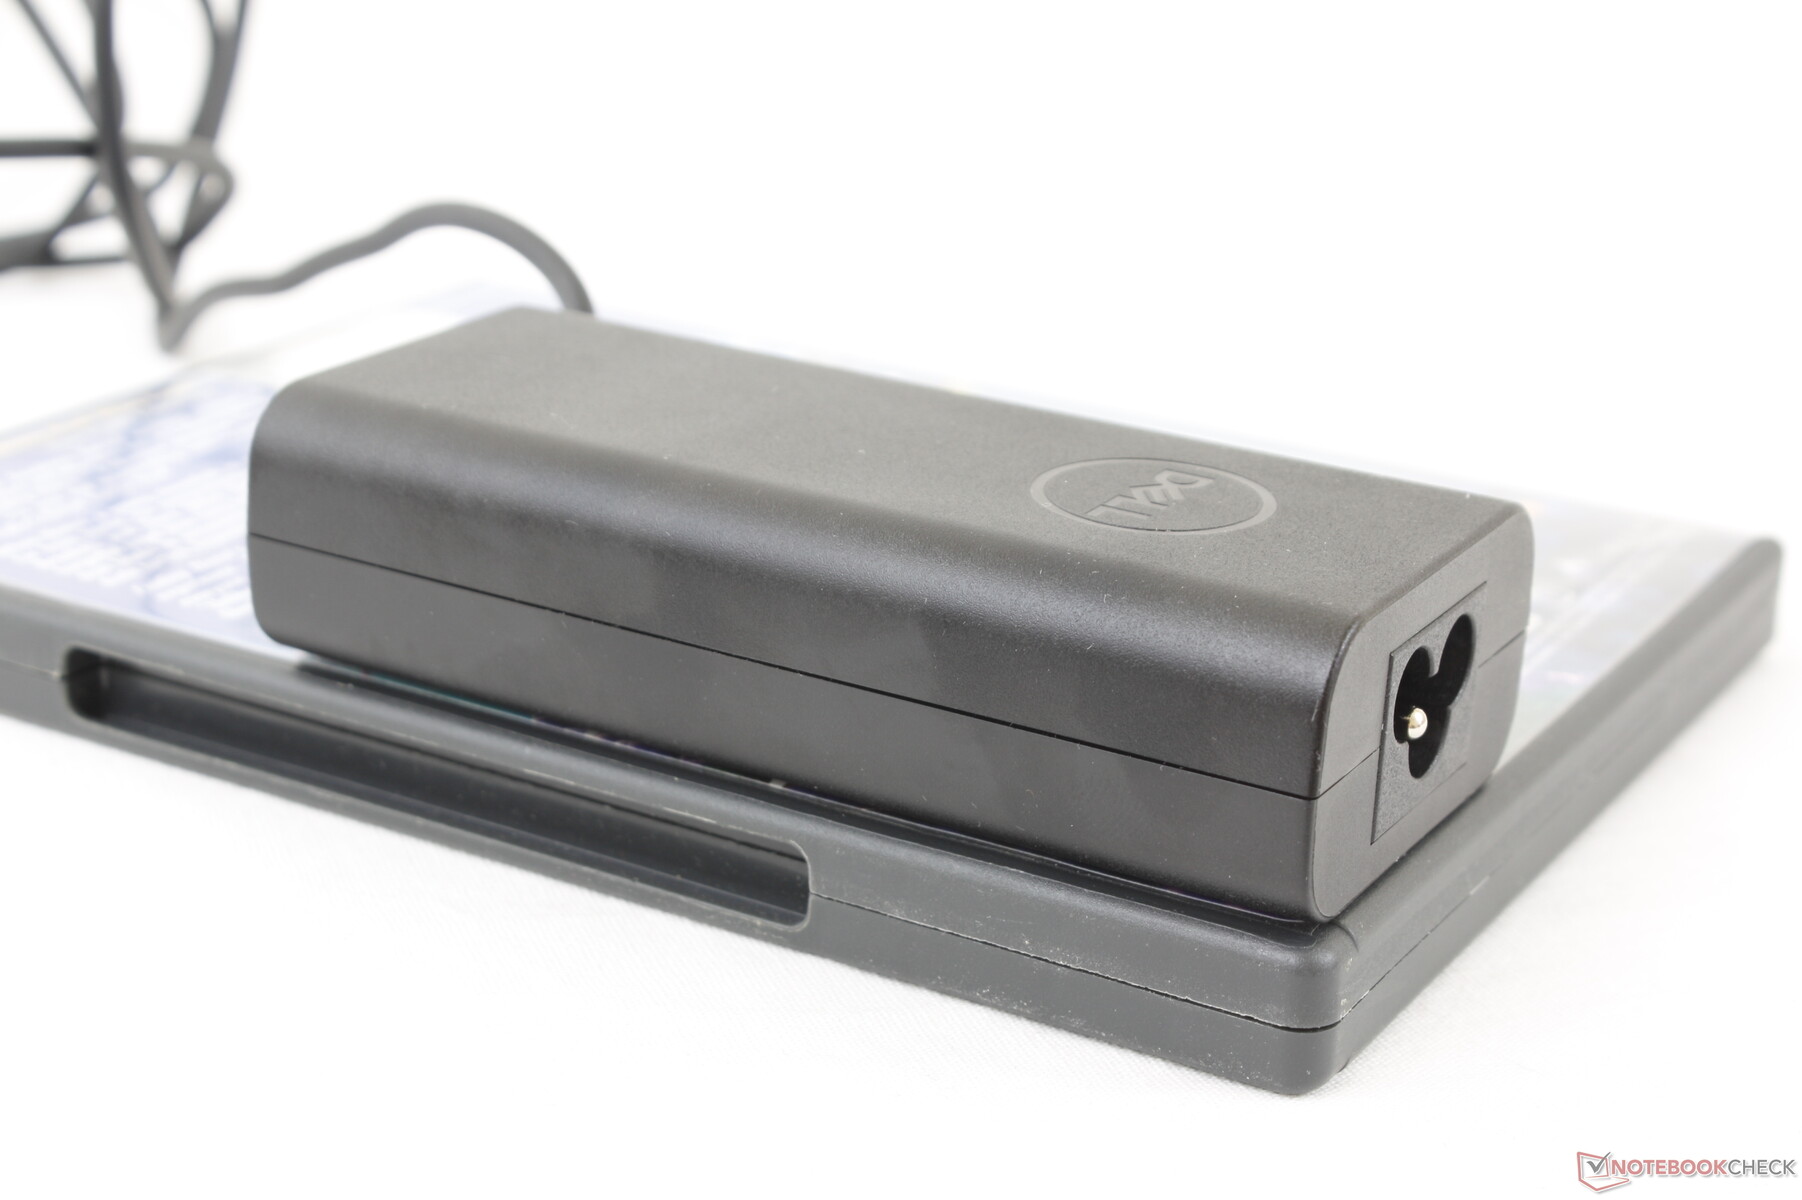
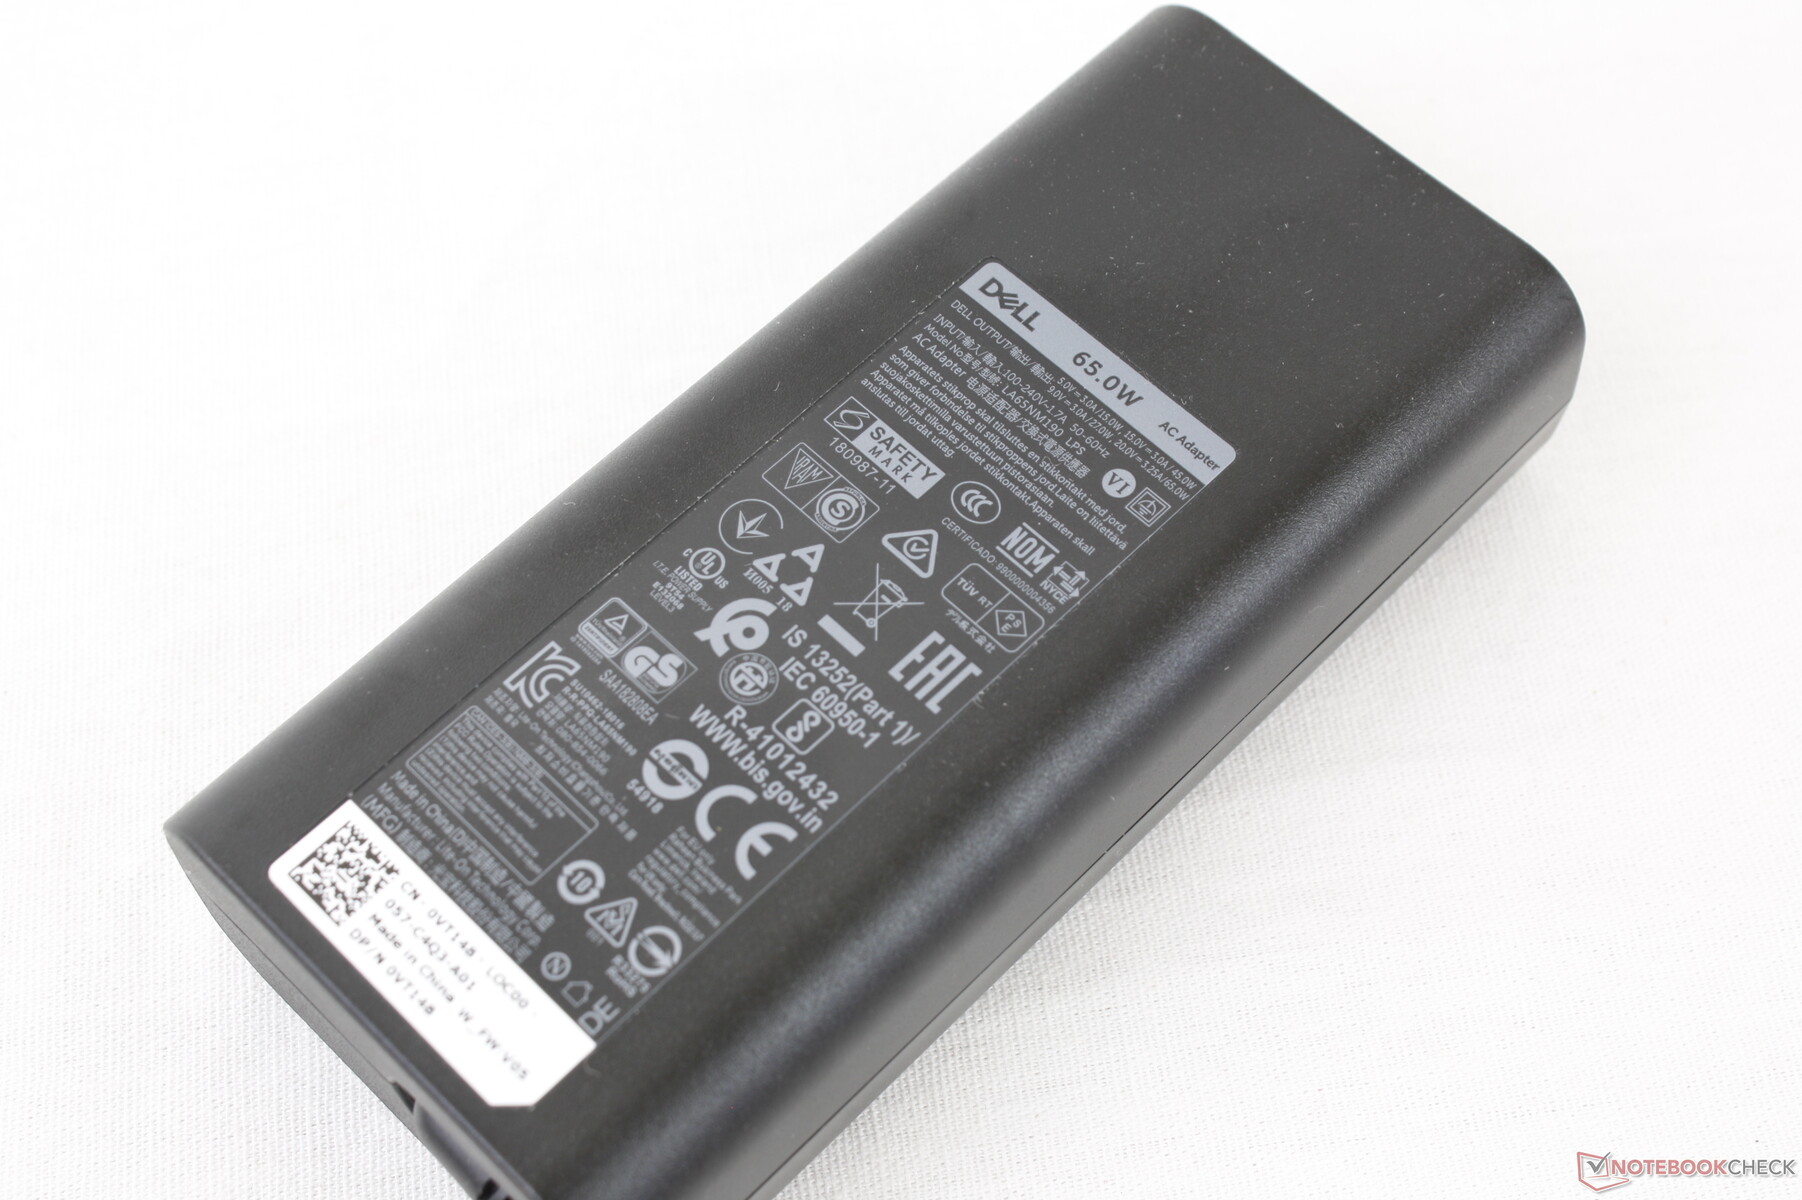
When running higher loads, power consumption becomes more in line with the competition including the Ryzen-powered ThinkPad X395 or HP EliteBook 735 G6 which are each able to offer both faster graphics performance than our Dell. We're able to record a maximum consumption of 69.7 W from the small-medium (~11.2 x 5.2 x 2.8 cm) 65 W AC adapter when running Prime95 and FurMark simultaneously, but this rate is only temporary as shown by our graphs below due to thermal limitations. Power consumption behavior matches our Stress Test clock rate observations above.
| Off / Standby | |
| Idle | |
| Load |
|
Key:
min: | |
| Dell Latitude 7310 i7-10610U, UHD Graphics 620, Samsung SSD PM981a MZVLB512HBJQ, IPS, 1920x1080, 13.3" | Dell Latitude 7300-P99G i7-8665U, UHD Graphics 620, Samsung SSD PM981 MZVLB512HAJQ, IPS LED, 1920x1080, 13.3" | Asus ZenBook S13 UX392FN i7-8565U, GeForce MX150, WDC PC SN520 SDAPNUW-512G, IPS, 1920x1080, 13.9" | Lenovo ThinkPad X395 R3 PRO 3300U, Vega 6, Samsung SSD PM981a MZVLB256HBHQ, IPS, 1920x1080, 13.3" | HP EliteBook 735 G6 7KN29EA R5 PRO 3500U, Vega 8, WDC PC SN520 SDAPNUW-256G, IPS LED, 1920x1080, 13.3" | Apple MacBook Pro 13 2020 2GHz i5 10th-Gen i5-1038NG7, Iris Plus Graphics G7 (Ice Lake 64 EU), Apple SSD SM0512F, IPS, 2560x1600, 13.3" | |
|---|---|---|---|---|---|---|
| Power Consumption | -26% | -46% | -29% | -53% | -60% | |
| Idle Minimum * (Watt) | 2.7 | 2.5 7% | 3.4 -26% | 4 -48% | 5.6 -107% | 3.8 -41% |
| Idle Average * (Watt) | 4.4 | 6.6 -50% | 6.3 -43% | 6.3 -43% | 8.1 -84% | 8.6 -95% |
| Idle Maximum * (Watt) | 4.8 | 8.7 -81% | 10.4 -117% | 9.3 -94% | 9.6 -100% | 10.3 -115% |
| Load Average * (Watt) | 33.4 | 35.4 -6% | 51 -53% | 34 -2% | 34.3 -3% | 52.1 -56% |
| Load Maximum * (Watt) | 69.7 | 68.1 2% | 62.7 10% | 42 40% | 48.6 30% | 65.2 6% |
| Witcher 3 ultra * (Watt) | 39 | 48.2 |
* ... smaller is better
Battery Life
Battery options include 3-cell 39 Wh or 4-cell 52 Wh with the latter being slightly heavier for longer battery life. The large 60 Wh battery on last year's Latitude 7300 is no longer an option, but battery life thankfully hasn't suffered as we're able to record over 12 hours of real-world WLAN use on our 52 Wh configuration despite the smaller battery. Runtimes on the 39 Wh option will drop by about a quarter to 9 hours.
Recharging from empty to full capacity takes two full hours.
| Dell Latitude 7310 i7-10610U, UHD Graphics 620, 52 Wh | Dell Latitude 7300-P99G i7-8665U, UHD Graphics 620, 60 Wh | Asus ZenBook S13 UX392FN i7-8565U, GeForce MX150, 50 Wh | Lenovo ThinkPad X395 R3 PRO 3300U, Vega 6, 48 Wh | HP EliteBook 735 G6 7KN29EA R5 PRO 3500U, Vega 8, 50 Wh | Apple MacBook Pro 13 2020 2GHz i5 10th-Gen i5-1038NG7, Iris Plus Graphics G7 (Ice Lake 64 EU), 58 Wh | |
|---|---|---|---|---|---|---|
| Battery runtime | -4% | -21% | 16% | -35% | -4% | |
| Reader / Idle (h) | 37.4 | 28.5 -24% | 18.4 -51% | |||
| WiFi v1.3 (h) | 12.6 | 10.8 -14% | 8.4 -33% | 10.9 -13% | 8.2 -35% | 12.1 -4% |
| Load (h) | 1.8 | 1.9 6% | 1.7 -6% | 3.8 111% |
Pros
Cons
Verdict
As if last year's Latitude 7300 wasn't compact enough, the Latitude 7310 is now even smaller, lighter, and more discreet to fit in just about any office or work environment. Aside from the spongy clickpad, there's not much to dislike about Dell's latest high-end subnotebook.
What bothers us more is the lack of certain features. The TrackPoint and dedicated mouse keys come to mind which would have absolutely made clicking and cursor control easier and more accurate. Users who prefer having tactile mouse buttons and upgradeable RAM and WLAN will still have strong reasons to prefer the Latitude 7300 over the 7310. Additionally, a brighter 500-nit or greater display option would have made the laptop an even better outdoor or travel companion.
The lack of better processor options outside of the quad-core Comet Lake-U is also becoming more obvious. Although the laptop isn't targeting high-performance users, competitors are beginning to offer much faster AMD Ryzen CPUs under the same or similar power envelope for superior performance-per-Watt. The fact that the Latitude 7300 can perform almost identically to the Latitude 7310 doesn't help it, either.
The Latitude 7310 is a more refined version of the Latitude 7300. It drops a couple of features along the way, but the sleeker and more portable design may be worth it for travelers or business users constantly on the move.
Dell Latitude 7310
- 07/13/2020 v7 (old)
Allen Ngo
Price comparison
