Notebookcheck Logo

AMD Ryzen 7 3700X vs AMD Ryzen 5 5600X vs AMD Ryzen 7 5800X

AMD Ryzen 7 3700X

► remove from comparison AMD R7 3700X

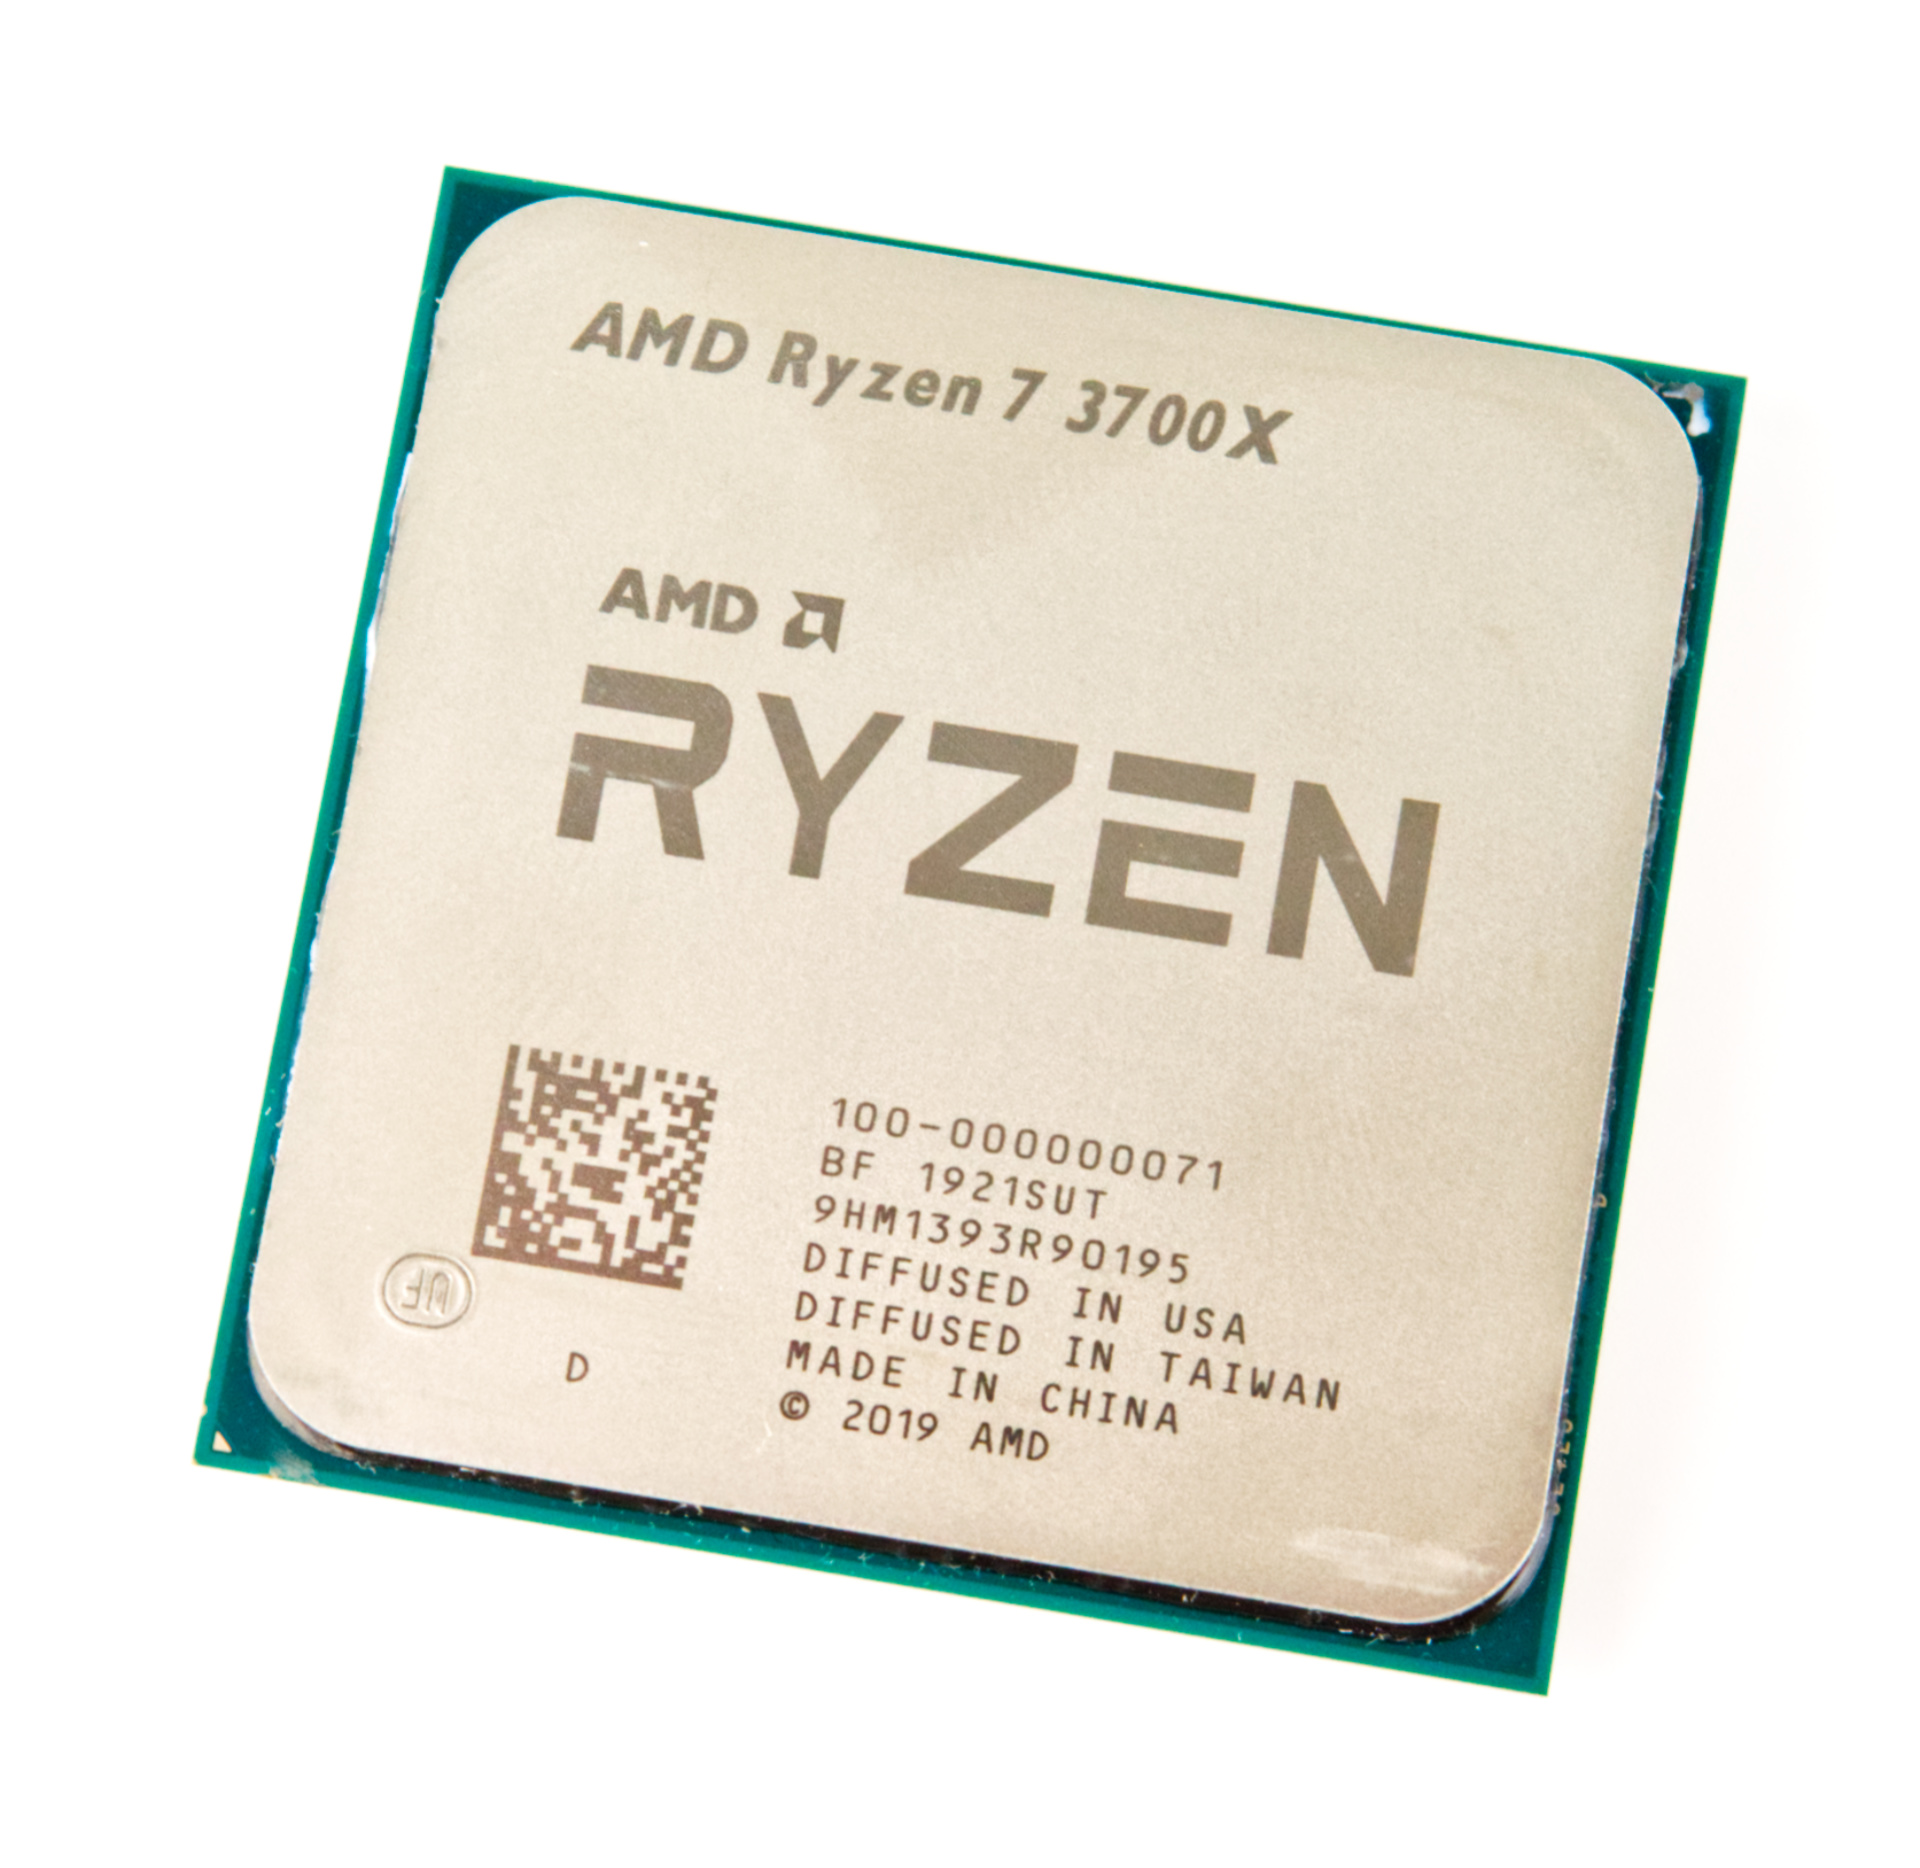
Der AMD Ryzen 7 3700X ist ein Desktop-Prozessor mit 8-Kernen und Hyperthreading (SMT), weshalb dieser 16 Threads gleichzeitig verarbeiten kann. Mit dem Launch am 07.07.2019 ist er nach dem Ryzen 7 3800X der zweitschnellste Ryzen 7 Prozessor und mit 65 Watt TDP deutlich sparsamer als das schnellste Ryzen 7 Modell.

Der Ryzen 7 3700X taktet mit 3,6 GHz Basistakt und kann per Turbo auf bis zu 4,4 GHz takten. Bei Last aller 8 Kerne erreicht der Ryzen 7 3700X maximal 4,1 GHz. Dank des Precision Boost 2 kann der Takt auf einem höheren Level gehalten werden, wie wir es schon von Zen+ her kennen.

Die Leistung des AMD Ryzen 7 3700X ist durchweg bei allen Anwendungen hervorragend. Vor allem bei Multi-Thread-Anwendungen kann hier der native 8-Kerner seine Stärken ausspielen und trotz der geringen TDP ist der Intel Core i9-9900K in Reichweite. Die beiden CCX-Cluster bestehend aus jeweils 4 CPU-Kernen befinden sich in einem CCD (je 4 Kerne mit eigenem 16 MByte L3 Cache). Dieser ist genau 74 mm² groß und wird im neuen 7 nm Verfahren bei TSMC gefertigt. Der I/O-Die ist separiert und kommt im mit der älteren 12 nm Strukturbreite daher, welcher weiterhin von Gobalfoundries gefertigt. 

Bei Spielen kann der AMD Ryzen 7 3700X dank der verbesserten IPC überzeugen. In Spielen erreicht der Ryzen 7 3700X etwa die Leistung eines Intel Core i7-8700K. Geschlagen geben muss sich der Ryzen momentan allerdings trotzdem, denn in den meisten Spielen bietet der Coffee-Lake-Prozessor etwas mehr Leistung. Zukünftige Unterstützung von mehr Kernen können das Blatt schnell wenden. 

AMD Ryzen 5 5600X

► remove from comparison AMD R5 5600X

The AMD Ryzen 5 5600X is a desktop processor with 6 SMT-enabled (12 threads) and based on the Zen 3 architecture. Launched in November 2020, it is the fastest 6-core Ryzen desktop processor. With a TDP of 65 watts, the Ryzen 5 5600X is the least energy-hungry model in the Zen 3 family to date.

The Ryzen 5 5600X is clocked at 3.7 GHz base clock and can be clocked up to 4.6 GHz with Precision Boost 2.

Performance

The average 5600X in our database is in the same league as the Ryzen 9 4900H and the Ryzen 7 6800HS, as far as multi-thread benchmark scores are concerned. While this isn't the fastest CPU money can buy, it still rips through most workloads with ease, as of mid 2022. Find out more in our full review.

Power consumption

This Ryzen 5 series chip has a default TDP (also known as the long-term power limit) of 65 W to be in line with most desktop processors.

The R5 5600X is built with TSMC's 7 nm process for average, as of early 2023, energy efficiency.

AMD Ryzen 7 5800X

► remove from comparison AMD R7 5800X

The AMD Ryzen 7 5800X is an 8-core desktop processor with Simultaneous Multithreading (SMT), which allows it to process 16 threads simultaneously. With its launch on 08.10.2020, it is the fastest 8-core processor from AMD. The second fastest 8-core processor will be the AMD Ryzen 7 3800XT, followed by the more economical AMD Ryzen 7 3700X, also with 8 cores and 16 threads.

The Ryzen 7 5800X clocks with a base clock of 3.8 GHz and reaches up to 4.7 GHz on one core in turbo mode. When all 8 cores are utilized, the AMD Ryzen 7 5800X, like the AMD Ryzen 9 5900X, achieves up to 4.5 GHz.

At first glance, the internal structure of the processor has not changed fundamentally. The CCX structure has changed somewhat compared to Zen2, because now a CCX consists of up to 8-CPU cores. So each individual core can access the complete L3 cache (32 MByte). Furthermore the CCX modules are connected to each other via the same I/O die, which we already know from Zen2. According to AMD, the Infinity-Fabric should now reach clock rates of up to 2Ghz, which in turn allows a RAM clock of 4.000 MHz without performance loss.

Performance

The average 5800X in our database is in the same league as the Core i9-10900K and also the Core i7-12700F, as far as multi-thread benchmark scores are concerned.

In games, AMD's Ryzen 7 5800X can convince with its significantly improved IPC and even put Intel in its place. With the AMD Ryzen 7 5800X, gamers are well prepared for the future as simultaneous streaming is no problem with the new Ryzen 7 5800X. Semi-professional content creators, who need even more power, can choose a Ryzen 9 5900X or the Ryzen 9 5950X on the shelf.

Power consumption

The Ryzen 7 has a default TDP (also known as the long-term power limit) of 105 W. This applies as long as the CPU runs at stock clock speeds.

Ryzen 7 5800X is built with TSMC's 7 nm process; as rumors have it, the I/O die is manufactured separately on the 12 nm Global Foundries process.

ModelAMD Ryzen 7 3700XAMD Ryzen 5 5600XAMD Ryzen 7 5800X
SeriesAMD Matisse (Ryzen 3000 Desktop)AMD Vermeer (Ryzen 5000)AMD Vermeer (Ryzen 5000)
CodenameMatisse (Zen 2)Vermeer (Zen 3)Vermeer (Zen 3)
Series: Vermeer (Ryzen 5000) Vermeer (Zen 3)
AMD Ryzen 9 3950X3.5 - 4.7 GHz16 / 32 cores64 MB L3
AMD Ryzen 9 3900X3.8 - 4.6 GHz12 / 24 cores64 MB L3
AMD Ryzen 9 39003.1 - 4.3 GHz12 / 24 cores64 MB L3
AMD Ryzen 7 3800XT3.9 - 4.7 GHz8 / 16 cores32 MB L3
AMD Ryzen 7 3700X « 3.6 - 4.4 GHz8 / 16 cores32 MB L3
AMD Ryzen 3 3300X3.8 - 4.3 GHz4 / 8 cores16 MB L3
AMD Ryzen 3 31003.6 - 3.9 GHz4 / 8 cores16 MB L3
AMD Ryzen 9 5950X3.4 - 4.9 GHz16 / 32 cores64 MB L3
AMD Ryzen 7 5800X3.8 - 4.7 GHz8 / 16 cores32 MB L3
AMD Ryzen 7 5700X3.4 - 4.6 GHz8 / 16 cores32 MB L3
AMD Ryzen 5 5600X « 3.7 - 4.6 GHz6 / 12 cores32 MB L3
AMD Ryzen 9 5950X3.4 - 4.9 GHz16 / 32 cores64 MB L3
AMD Ryzen 7 5800X « 3.8 - 4.7 GHz8 / 16 cores32 MB L3
AMD Ryzen 7 5700X3.4 - 4.6 GHz8 / 16 cores32 MB L3
AMD Ryzen 5 5600X3.7 - 4.6 GHz6 / 12 cores32 MB L3
Clock3600 - 4400 MHz3700 - 4600 MHz3800 - 4700 MHz
L1 Cache512 KB384 KB512 KB
L2 Cache4 MB3 MB4 MB
L3 Cache32 MB32 MB32 MB
Cores / Threads8 / 166 / 128 / 16
TDP65 Watt65 Watt105 Watt
Technology7 nm7 nm7 nm
max. Temp.95 °C95 °C90 °C
SocketAM4 (LGA1331)AM4AM4 (LGA1331)
FeaturesDDR4-3200 RAM, PCIe 4, MMX, SSE, SSE2, SSE3, SSSE3, SSE4A, SSE4.1, SSE4.2, AVX, AVX2, BMI2, ABM, FMA, ADX, SMEP, SMAP, SMT, CPB, AES-NI, RDRAND, RDSEED, SHA, SMEDDR4-3200 RAM, PCIe 4, MMX (+), SSE, SSE2, SSE3, SSSE3, SSE4.1, SSE4.2, SSE4A, AES, AVX, AVX2, FMA3, SHADDR4-3200 RAM, PCIe 4, MMX (+), SSE, SSE2, SSE3, SSSE3, SSE4.1, SSE4.2, SSE4A, AES, AVX, AVX2, FMA3, SHA
Architecturex86x86x86
$329 U.S.$299 U.S.$449 U.S.
Announced
Manufacturerwww.amd.comwww.amd.comwww.amd.com
Die Size2 x 80.7 sq. mm; I/O = 125 mm2

Benchmarks

Performance Rating - CB R15 + R20 + 7-Zip + X265 + Blender + 3DM11 CPU - R7 3700X
37.6 pt (52%)
Performance Rating - CB R15 + R20 + 7-Zip + X265 + Blender + 3DM11 CPU - R5 5600X
41.9 pt (58%)
Performance Rating - CB R15 + R20 + 7-Zip + X265 + Blender + 3DM11 CPU - R7 5800X
44.8 pt (62%)
Cinebench R23 - Cinebench R23 Multi Core
11838 Points (11%)
min: 15241     avg: 15476     median: 15476 (14%)     max: 15711 Points
Cinebench R23 - Cinebench R23 Single Core
1541 Points (66%)
min: 1554     avg: 1575     median: 1574.5 (67%)     max: 1595 Points
Cinebench R20 - Cinebench R20 CPU (Single Core)
506 Points (56%)
601 Points (67%)
min: 624     avg: 625     median: 624.5 (69%)     max: 625 Points
Cinebench R20 - Cinebench R20 CPU (Multi Core)
4782 Points (12%)
4567 Points (11%)
min: 6068     avg: 6075     median: 6074.5 (15%)     max: 6081 Points
Cinebench R15 - Cinebench R15 CPU Multi 64 Bit
2092 Points (13%)
1968 Points (12%)
min: 2601     avg: 2609     median: 2608.5 (16%)     max: 2616 Points
Cinebench R15 - Cinebench R15 CPU Single 64 Bit
204 Points (61%)
254 Points (77%)
min: 265     avg: 265.5     median: 265.5 (80%)     max: 266 Points
Cinebench R11.5 - Cinebench R11.5 CPU Multi 64 Bit
23.2 Points (30%)
21.8 Points (28%)
29.3 Points (38%)
Cinebench R11.5 - Cinebench R11.5 CPU Single 64 Bit
2.3 Points (57%)
3 Points (73%)
3.1 Points (77%)
Cinebench R10 - Cinebench R10 Rend. Single (32bit)
5839 Points (35%)
6462 Points (39%)
6835 Points (41%)
Cinebench R10 - Cinebench R10 Rend. Multi (32bit)
40439 Points (29%)
39331 Points (28%)
45548 Points (33%)
Cinebench R10 - Cinebench R10 Rend. Multi (64bit)
66813 Points (46%)
69545 Points (48%)
83426 Points (58%)
Cinebench R10 - Cinebench R10 Rend. Single (64bit)
10189 Points (12%)
12563 Points (15%)
13039 Points (16%)
wPrime 2.10 - wPrime 2.0 1024m *
86.7 s (1%)
113.9 s (1%)
86.1 s (1%)
wPrime 2.10 - wPrime 2.0 32m *
3.7 s (1%)
3.9 s (1%)
3 s (1%)
WinRAR - WinRAR 4.0
7503 Points (12%)
13282 Points (21%)
15604 Points (25%)
7-Zip 18.03 - 7-Zip 18.03 Multli Thread 4 runs
57307 MIPS (33%)
56607 MIPS (32%)
min: 69921     avg: 72114     median: 72113.5 (41%)     max: 74306 MIPS
7-Zip 18.03 - 7-Zip 18.03 Single Thread 4 runs
5333 MIPS (64%)
6594 MIPS (79%)
min: 6843     avg: 6907     median: 6906.5 (83%)     max: 6970 MIPS
X264 HD Benchmark 4.0 - x264 Pass 2
115 fps (40%)
117 fps (41%)
152 fps (53%)
X264 HD Benchmark 4.0 - x264 Pass 1
269.5 fps (62%)
320 fps (74%)
339 fps (78%)
HWBOT x265 Benchmark v2.2 - HWBOT x265 4k Preset
15.4 fps (27%)
15.7 fps (28%)
min: 19.8     avg: 20.3     median: 20.3 (36%)     max: 20.8 fps
TrueCrypt - TrueCrypt Serpent
1.1 GB/s (0%)
0.9 GB/s (0%)
1.3 GB/s (0%)
TrueCrypt - TrueCrypt Twofish
2 GB/s (34%)
1.5 GB/s (26%)
2 GB/s (34%)
TrueCrypt - TrueCrypt AES
11.4 GB/s (30%)
10.7 GB/s (28%)
15 GB/s (39%)
Blender - Blender 3.3 Classroom CPU *
min: 331     avg: 336     median: 336 (4%)     max: 341 Seconds
Blender - Blender 2.79 BMW27 CPU *
181.4 Seconds (1%)
260.2 Seconds (2%)
min: 196.8     avg: 196.9     median: 196.9 (1%)     max: 197 Seconds
R Benchmark 2.5 - R Benchmark 2.5 *
0.5 sec (10%)
min: 0.4509     avg: 0.5     median: 0.5 (10%)     max: 0.4545 sec
3DMark 06 - CPU - 3DMark 06 - CPU
min: 13739     avg: 13815     median: 13814.5 (29%)     max: 13890 Points
14576 Points (31%)
15873 Points (34%)
Super Pi mod 1.5 XS 1M - Super Pi mod 1.5 XS 1M *
9.4 s (2%)
8.1 s (2%)
7.3 s (2%)
Super Pi mod 1.5 XS 2M - Super Pi mod 1.5 XS 2M *
20.5 s (1%)
17.5 s (1%)
15.8 s (1%)
Super Pi Mod 1.5 XS 32M - Super Pi mod 1.5 XS 32M *
531 s (2%)
400.9 s (2%)
365.8 s (2%)
3DMark Vantage - 3DM Vant. Perf. CPU no Physx
min: 68137     avg: 68140     median: 68139.5 (60%)     max: 68142 Points
66603 Points (58%)
86050 Points (75%)
3DMark 11 - 3DM11 Performance Physics
min: 18222     avg: 18284     median: 18283.5 (49%)     max: 18345 Points
19649 Points (53%)
min: 23381     avg: 23704     median: 23703.5 (64%)     max: 24026 Points
3DMark - 3DMark Ice Storm Physics
min: 79765     avg: 80527     median: 80526.5 (65%)     max: 81288 Points
88825 Points (72%)
94127 Points (76%)
3DMark - 3DMark Ice Storm Extreme Physics
min: 79983     avg: 80252     median: 80252 (65%)     max: 80521 Points
88777 Points (72%)
94179 Points (76%)
3DMark - 3DMark Ice Storm Unlimited Physics
min: 83056     avg: 83138     median: 83137.5 (70%)     max: 83219 Points
91500 Points (77%)
96702 Points (81%)
3DMark - 3DMark Cloud Gate Physics
min: 15953     avg: 16379     median: 16378.5 (41%)     max: 16804 Points
16447 Points (42%)
22992 Points (58%)
3DMark - 3DMark Fire Strike Standard Physics
min: 23423     avg: 23951     median: 23951 (43%)     max: 24479 Points
25990 Points (46%)
min: 29163     avg: 30051     median: 30050.5 (54%)     max: 30938 Points
3DMark - 3DMark Time Spy CPU
min: 9909     avg: 9944     median: 9943.5 (42%)     max: 9978 Points
8911 Points (38%)
min: 11599     avg: 11652     median: 11652 (49%)     max: 11705 Points
Geekbench 5.5 - Geekbench 5.1 - 5.4 64 Bit Single-Core
1304 Points (55%)
1657 Points (70%)
min: 1665     avg: 1683     median: 1683 (71%)     max: 1701 Points
Geekbench 5.5 - Geekbench 5.1 - 5.4 64 Bit Multi-Core
8960 Points (16%)
8980 Points (16%)
min: 10093     avg: 10724     median: 10723.5 (19%)     max: 11354 Points
Geekbench 5.0 - Geekbench 5.0 64 Bit Single-Core
1587 Points (7%)
1673 Points (7%)
Geekbench 5.0 - Geekbench 5.0 64 Bit Multi-Core
8926 Points (28%)
11246 Points (35%)
Geekbench 4.4 - Geekbench 4.1 - 4.4 64 Bit Single-Core
5799 Points (58%)
6953 Points (69%)
7333 Points (73%)
Geekbench 4.4 - Geekbench 4.1 - 4.4 64 Bit Multi-Core
34757 Points (38%)
35617 Points (39%)
44131 Points (48%)
Mozilla Kraken 1.1 - Kraken 1.1 Total Score *
578 ms (1%)
min: 558     avg: 576     median: 575.5 (1%)     max: 593 ms
WebXPRT 4 - WebXPRT 4 Score
245 Points (70%)
WebXPRT 3 - WebXPRT 3 Score
286 Points (60%)
min: 296     avg: 301.5     median: 301.5 (63%)     max: 307 Points
CrossMark - CrossMark Overall
1489 Points (57%)
1541 Points (59%)
Power Consumption - Prime95 Power Consumption - external Monitor *
170.3 Watt (29%)
175.8 Watt (30%)
242.3 Watt (42%)
Power Consumption - Cinebench R15 Multi Power Consumption - external Monitor *
171.6 Watt (31%)
170.1 Watt (31%)
220.7 Watt (40%)
Power Consumption - Cinebench R15 Multi Power Efficiency - external Monitor
12.2 Points per Watt (9%)
11.6 Points per Watt (9%)
11.9 Points per Watt (9%)

Average Benchmarks AMD Ryzen 7 3700X → 100% n=38

Average Benchmarks AMD Ryzen 5 5600X → 107% n=38

Average Benchmarks AMD Ryzen 7 5800X → 123% n=38

- Range of benchmark values for this graphics card
- Average benchmark values for this graphics card
* Smaller numbers mean a higher performance
1 This benchmark is not used for the average calculation

v1.26
log 20. 15:40:43

#0 checking url part for id 11443 +0s ... 0s

#1 checking url part for id 12785 +0s ... 0s

#2 checking url part for id 12783 +0s ... 0s

#3 not redirecting to Ajax server +0s ... 0s

#4 did not recreate cache, as it is less than 5 days old! Created at Sun, 19 May 2024 05:35:32 +0200 +0.001s ... 0.001s

#5 composed specs +0.028s ... 0.029s

#6 did output specs +0s ... 0.03s

#7 getting avg benchmarks for device 11443 +0.016s ... 0.045s

#8 got single benchmarks 11443 +0.012s ... 0.057s

#9 getting avg benchmarks for device 12785 +0.015s ... 0.072s

#10 got single benchmarks 12785 +0.007s ... 0.08s

#11 getting avg benchmarks for device 12783 +0.018s ... 0.098s

#12 got single benchmarks 12783 +0.013s ... 0.111s

#13 got avg benchmarks for devices +0s ... 0.111s

#14 min, max, avg, median took s +0.443s ... 0.554s

#15 return log +0s ... 0.554s

Please share our article, every link counts!
> Expert Reviews and News on Laptops, Smartphones and Tech Innovations > Benchmarks / Tech > Processor Comparison - Head 2 Head
Redaktion, 2017-09- 8 (Update: 2023-07- 1)