Nvidia GeForce RTX 4080 Founders Edition Review: 4K performance and efficiency champ that deserves sub-US$1,000 pricing
")
Nvidia's GeForce RTX 4080 launch started off on a somewhat controversial note, with the company originally having announced two RTX 4080 GPUs — the RTX 4080 12 GB and the RTX 4080 16 GB — alongside the RTX 4090.
Although Nvidia justified the presence of an RTX 4080 12 GB, the press and public weren't too welcoming of branding a supposedly RTX 4070-class card as a “4080”. Nvidia eventually “unlaunched” the RTX 4080 12 GB, and here we are with the 16 GB variant as the flagship mainstream gaming GPU of the Ada generation.
In Ampere, Nvidia used the same GA102 GPU with varying CUDA core configurations across the RTX 3090 and RTX 3080 lineup, including the Ti versions. With the RTX 4080, Nvidia isn't just re-using a cut-down AD102 die, but has actually created the AD103 die de novo.
The AD103 die is quite different from AD102, and this can be seen in the die shot as well as the design and layout of the PCB and configuration of the memory modules.
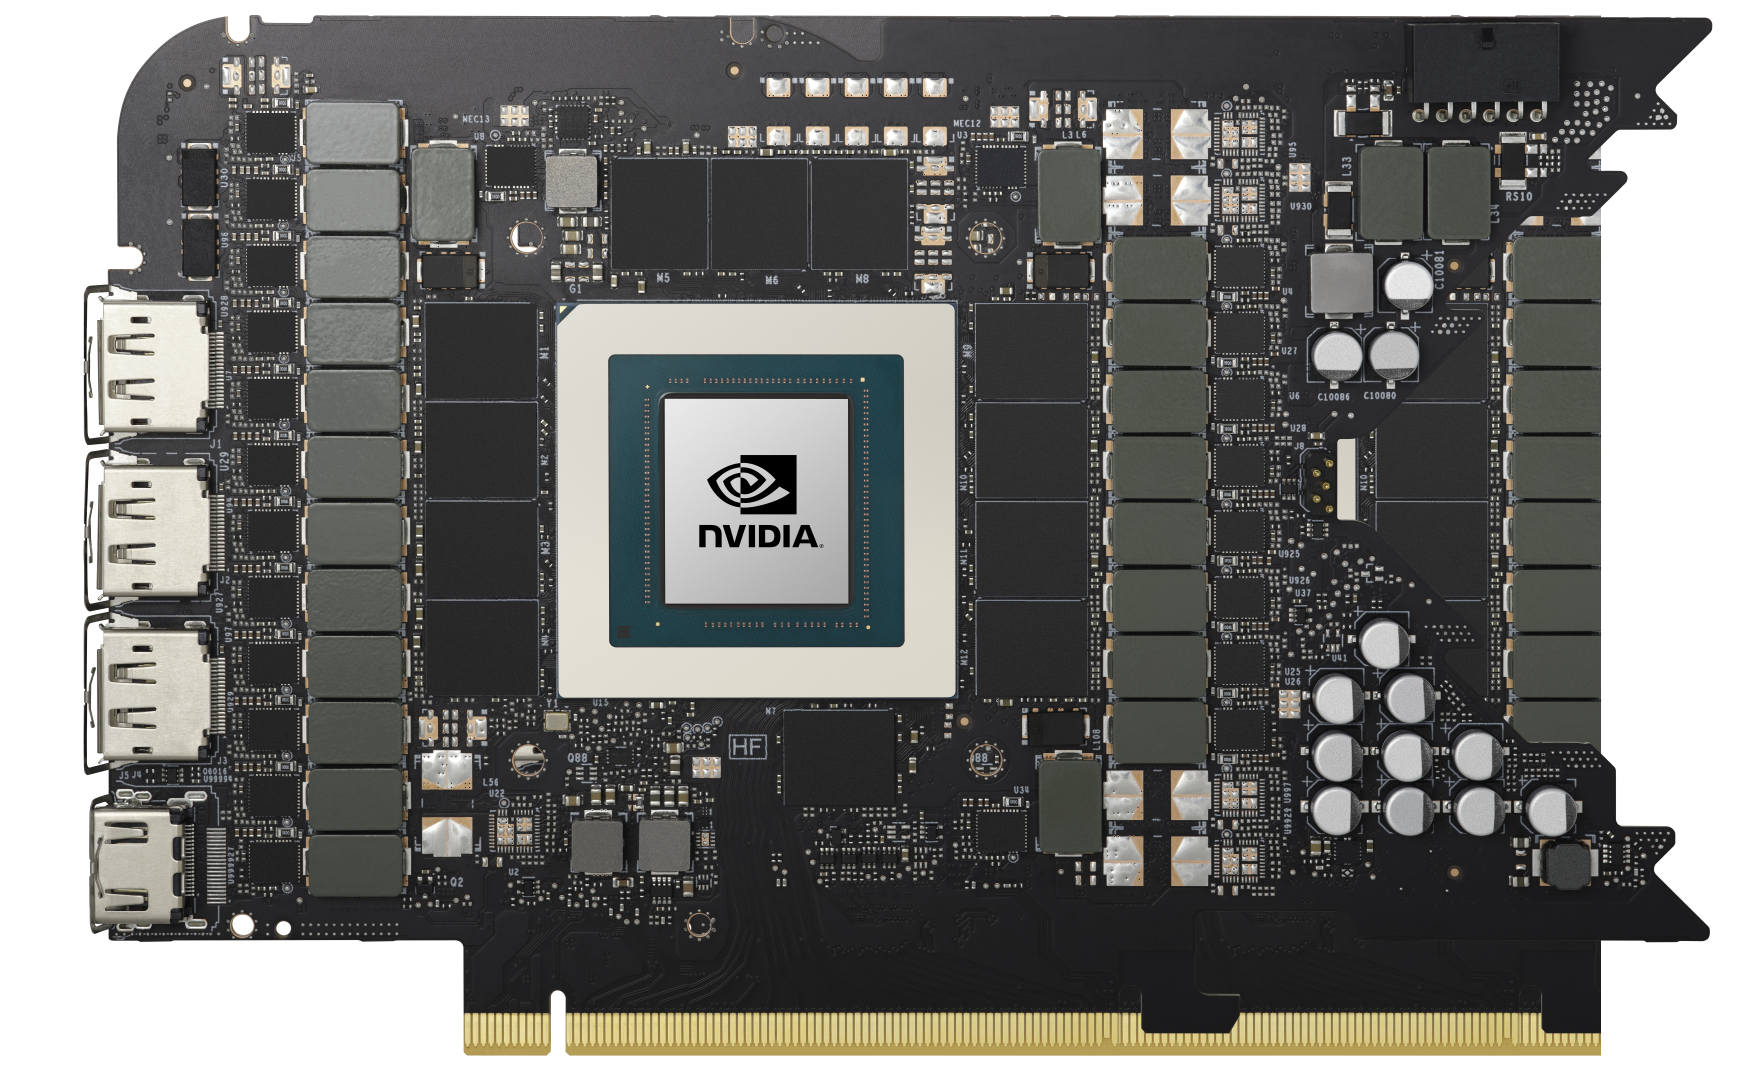
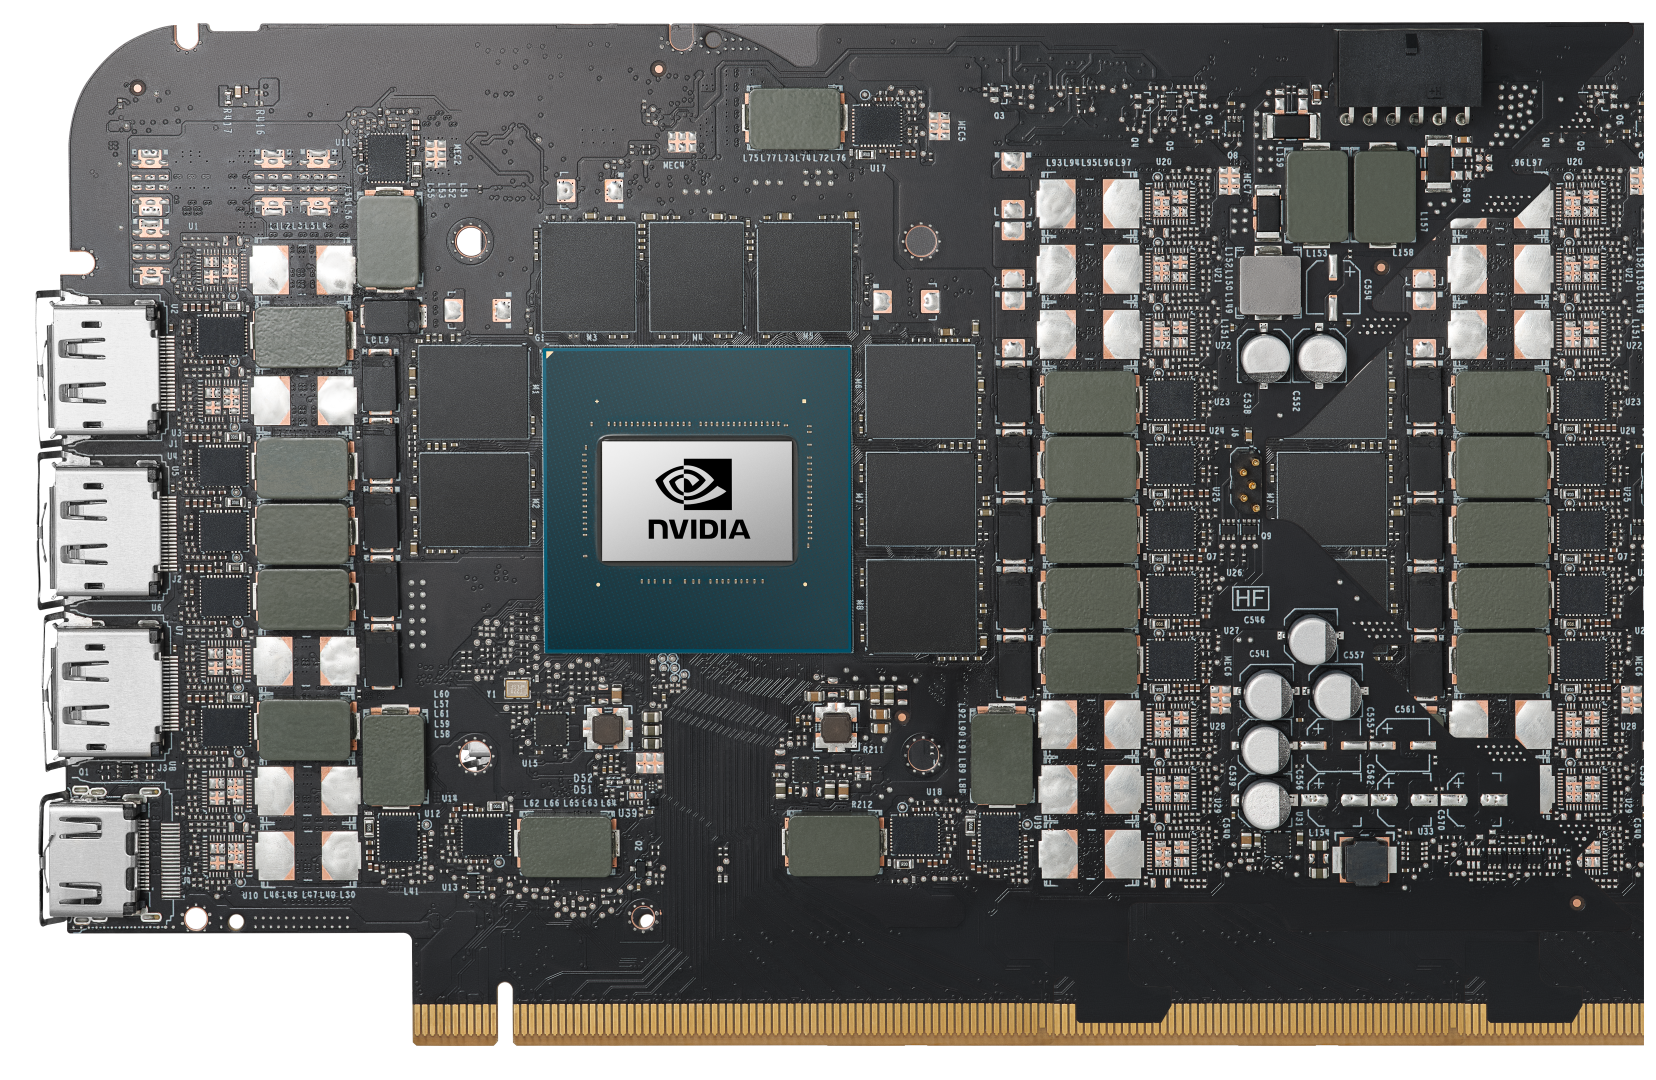
The RTX 4080 is already priced above US$1,000, which leads one to wonder why Nvidia didn't simply use a nerfed AD102 with a few more CUDA cores. A likely explanation is that Nvidia didn't have plans to make as many AD102 dies in the first place, given that Titan-class cards are still a niche market.
The AD102 in the RTX 4090 is already 11% deficient in SM count compared to the full AD102 GPU. So, it probably makes better sense to just have a new die made in high volumes targeted at the gaming crowd, instead of just binning down flagship chips.
In this review, we put the Nvidia GeForce RTX 4080 Founders Edition through its paces and see if the performance uplift on offer really justifies the US$1,200 ask.
Comparison of the RTX 4080 with other Nvidia GPUs
| Specification | RTX 4080 FE | RTX 4090 FE | RTX 3090 Ti FE | RTX 3090 FE | RTX 3080 Ti FE | RTX 3080 FE | RTX 3070 FE | Titan RTX | Titan X Pascal |
| Chip | AD103 | AD102 | GA102 | GA102 | GA102 | GA102 | GA104 | TU102 | GP102 |
| FinFET Process | Custom 4N | Custom 4N | 8 nm | 8 nm | 8 nm | 8 nm | 8 nm | 12 nm | 16 nm |
| CUDA Cores | 9,728 | 16,384 | 10,752 | 10,496 | 10,240 | 8,704 | 5,888 | 4,608 | 3,584 |
| Texture Units | 304 | 512 | 336 | 328 | 320 | 272 | 184 | 288 | 224 |
| Tensor Cores | 304 4th Gen. | 512 4th Gen. | 336 3rd Gen. | 328 3rd Gen. | 320 3rd Gen. | 272 3rd Gen. | 184 3rd Gen. | 576 2nd Gen. | — |
| RT Cores | 76 3rd Gen. | 128 3rd Gen. | 84 2nd Gen. | 82 2nd Gen. | 80 2nd Gen. | 68 2nd Gen. | 46 2nd Gen. | 72 | — |
| GPU Base Clock | 2,205 MHz | 2,235 MHz | 1,560 MHz | 1,395 MHz | 1,365 MHz | 1,440 MHz | 1,500 MHz | 1,350 MHz | 1,417 MHz |
| GPU Boost Clock | 2,505 MHz | 2,520 MHz | 1,860 MHz | 1,695 MHz | 1,665 MHz | 1,710 MHz | 1,750 MHz | 1,770 MHz | 1,531 MHz |
| Memory Bus | 256-bit | 384-bit | 384-bit | 384-bit | 384-bit | 320-bit | 256-bit | 384-bit | 384-bit |
| Memory Bandwidth | 716.8 GB/s | 1,008 GB/s | 1,008 GB/s | 936 GB/s | 912 GB/s | 760 GB/s | 448 GB/s | 672 GB/s | 480.4 GB/s |
| Video Memory | 16 GB GDDR6X | 24 GB GDDR6X | 24 GB GDDR6X | 24 GB GDDR6X | 12 GB GDDR6X | 10 GB GDDR6X | 8 GB GDDR6 | 24 GB GDDR6 | 12 GB GDDR5X |
| Power Consumption | 320 W | 450 W | 450 W | 350 W | 350 W | 320 W | 220 W | 280 W | 250 W |
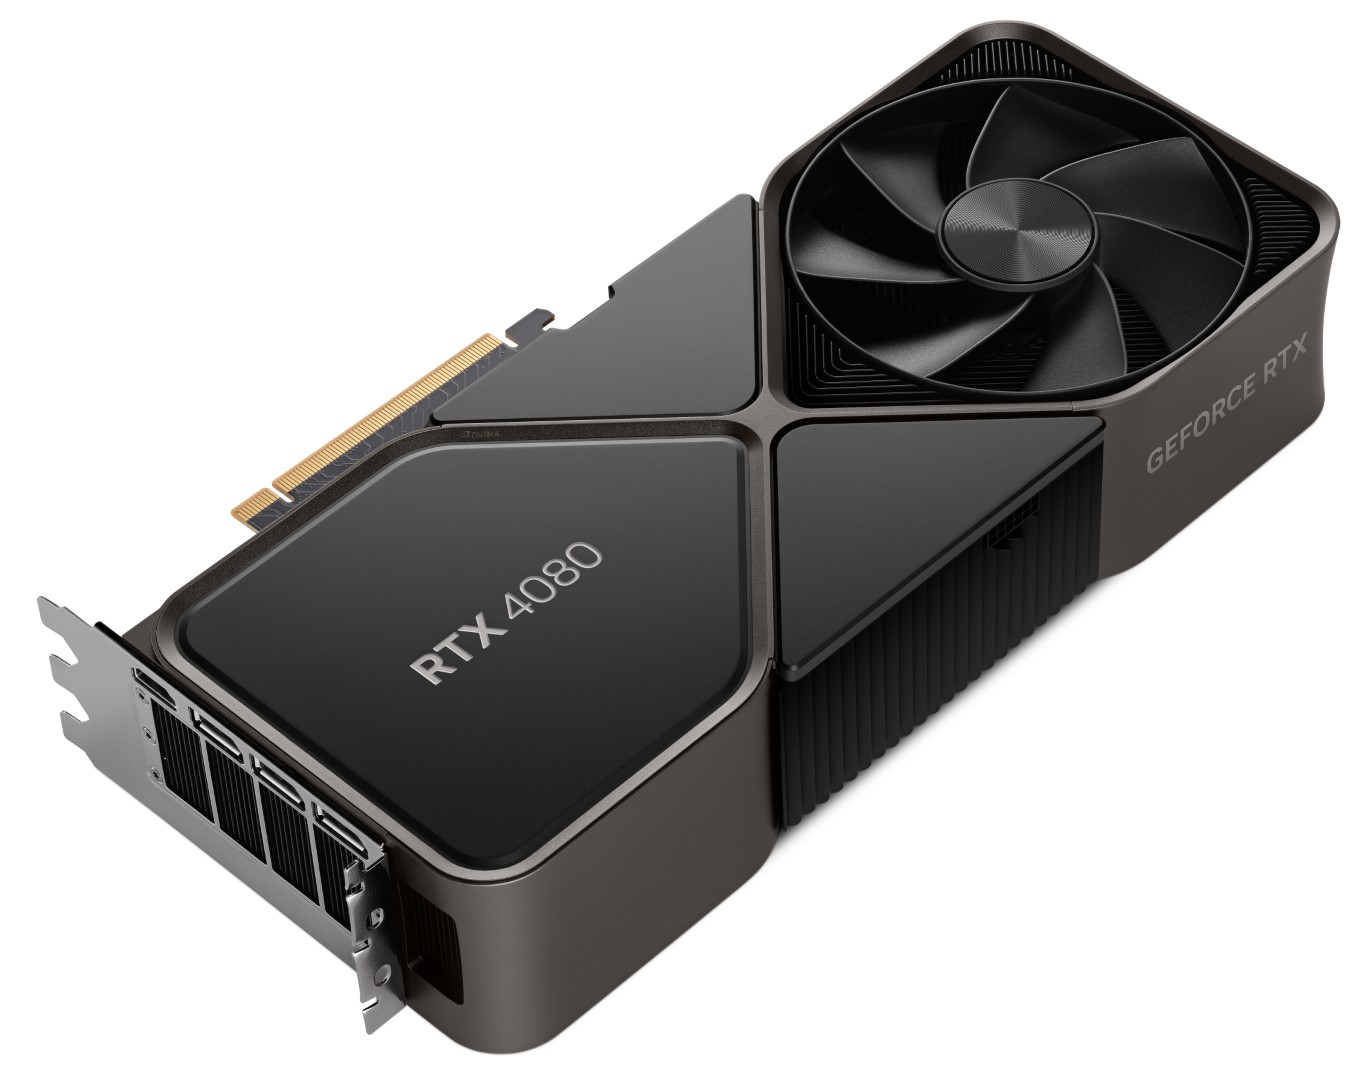
A closer look at the Nvidia GeForce RTX 4080 Founders Edition
At first glance, the RTX 4080 seems to have cut corners when compared to the RTX 3080 Ti's specifications. The Ada mainstream gaming flagship GPU has lower CUDA, Tensor, and RT core counts along with a cut-down memory bus and bandwidth. What Nvidia apparently cuts in numbers makes up in other aspects of the architecture.
For one, the AD103 in the RTX 4080 crams 45.9 billion transistors in a relatively smaller 379 mm2 die area compared to the 28.3 billion in the RTX 3080 Ti's 628 mm2 GA102 die. The fourth gen Tensor cores are now capable of outputting 780 TFLOPs with Sparsity, compared to the 273 TFLOPs with Sparsity of the RTX 3080 Ti. RT TFLOPs have also gone up to 113 in the RTX 4080 compared to 66.6 in the RTX 3080 Ti.
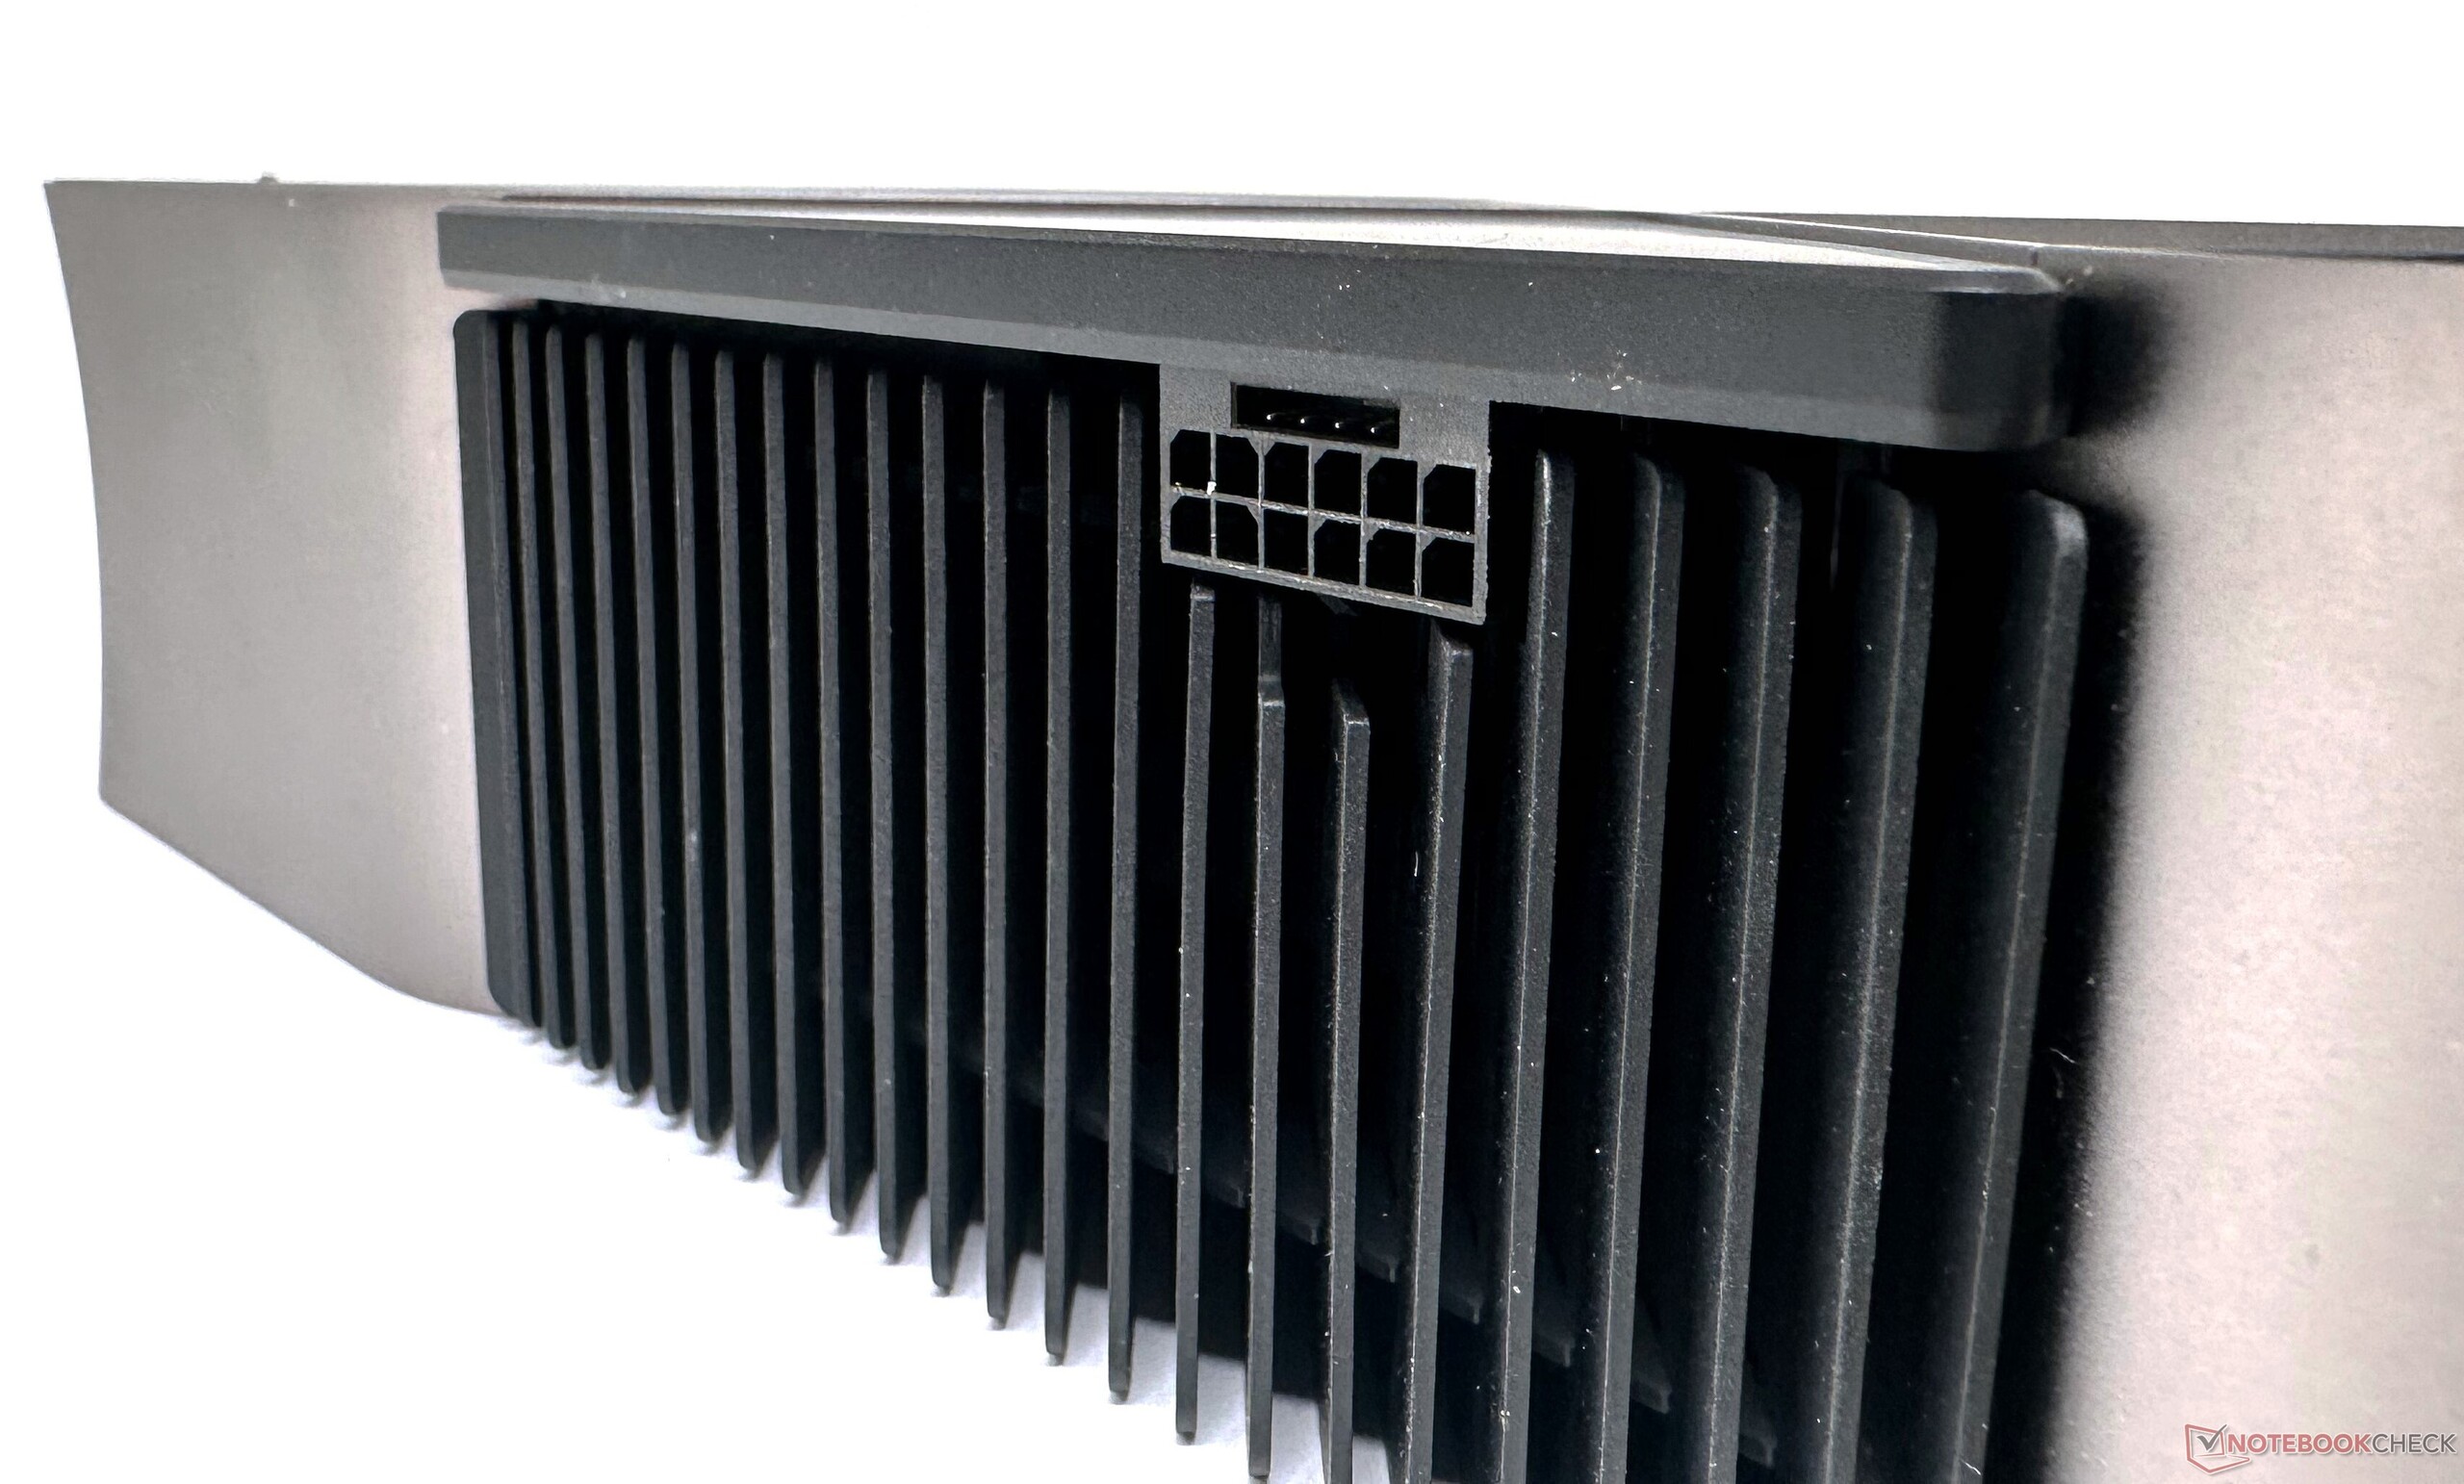
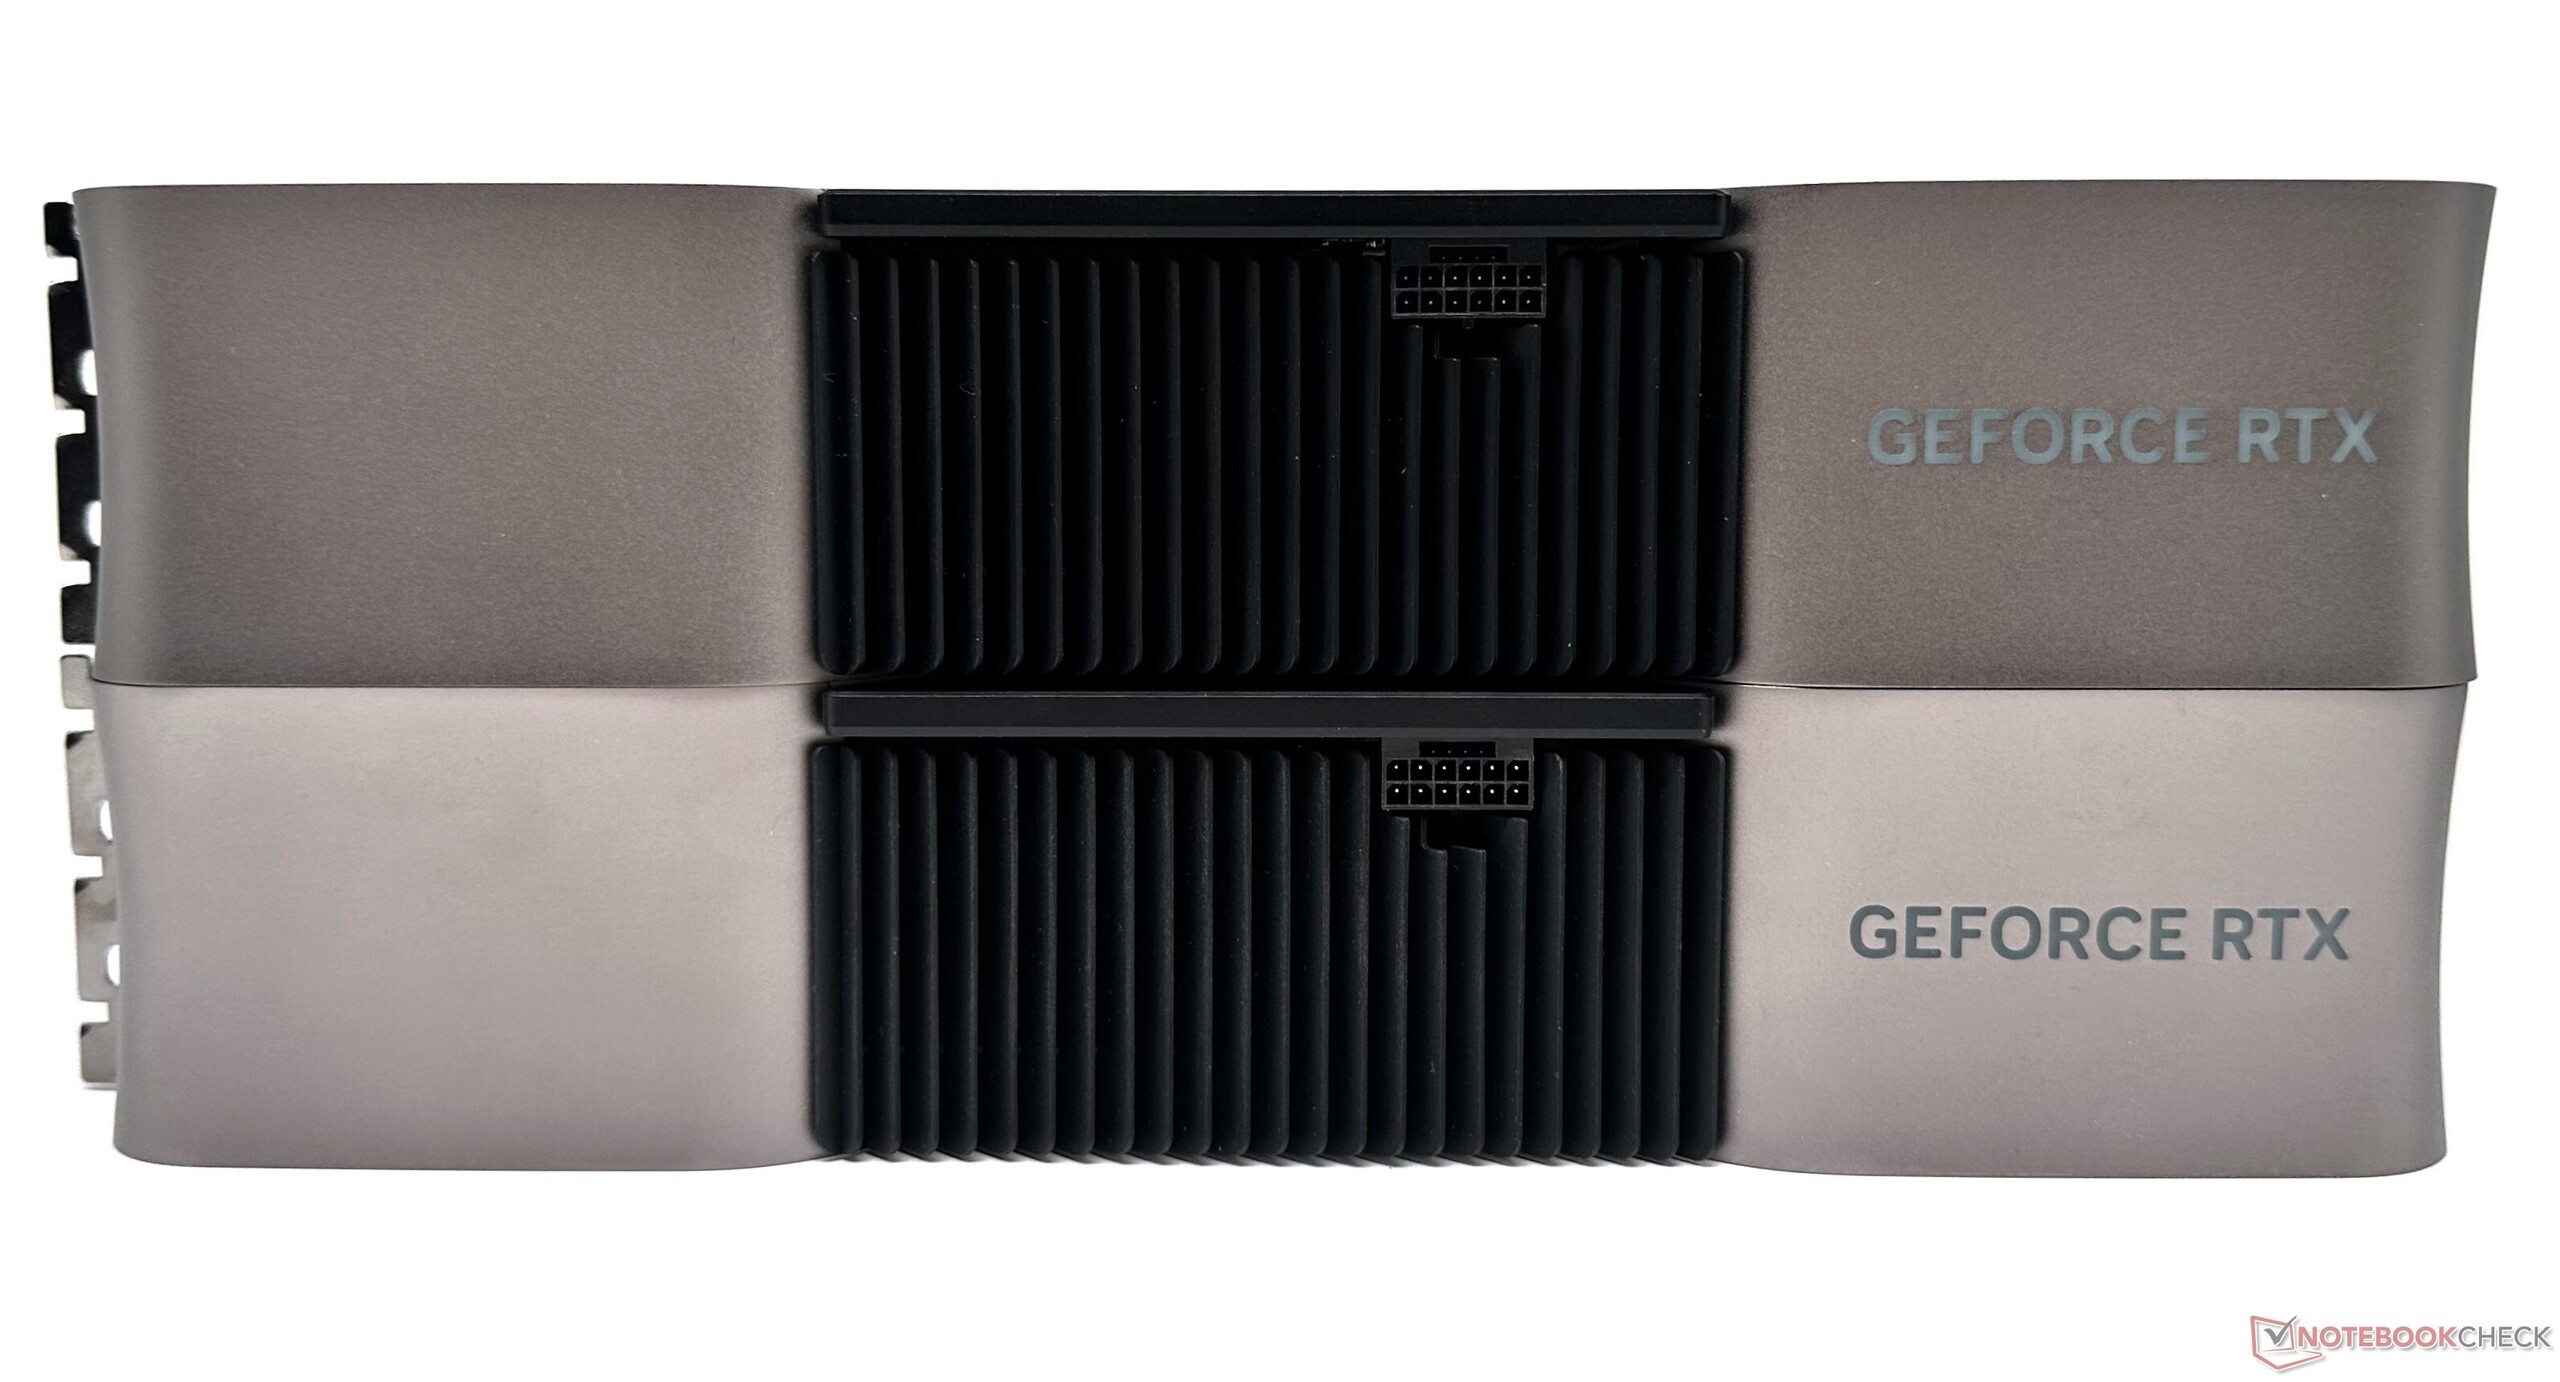
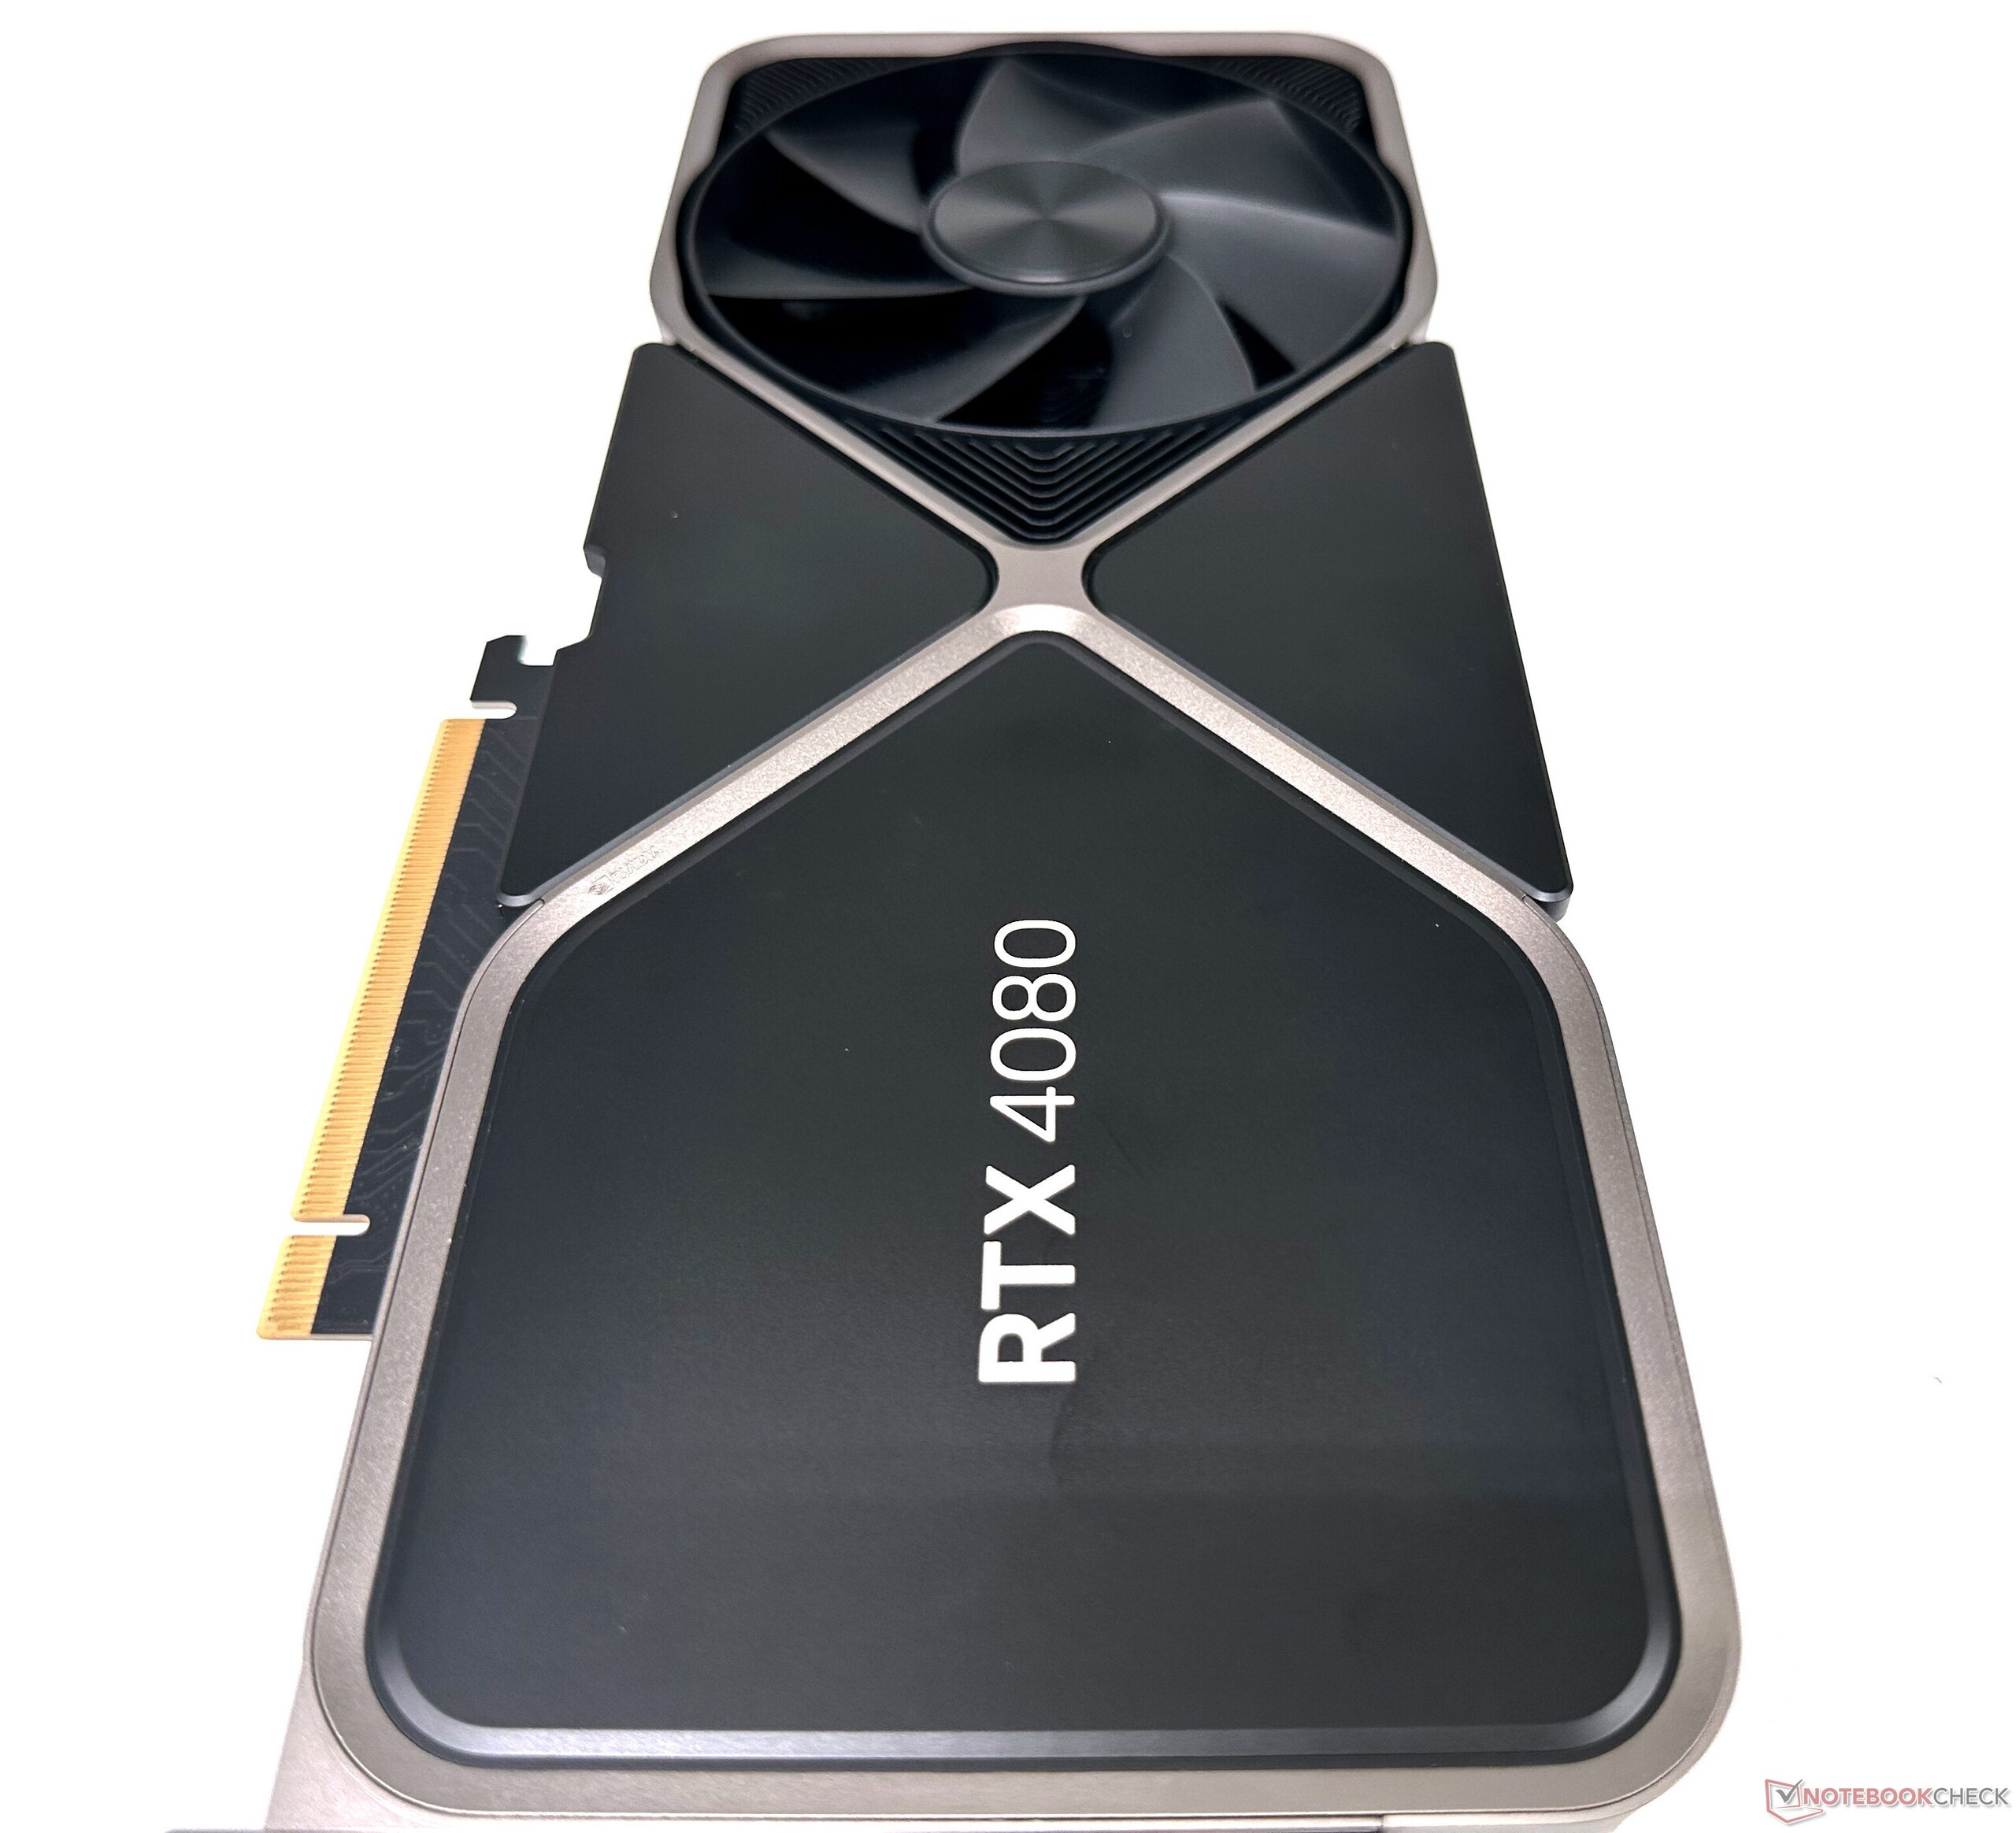
The Nvidia GeForce RTX 4080 Founders Edition is pretty much identical to the RTX 4090 Founders Edition in terms of dimensions and build quality. Therefore, we refer you to our review RTX 4090 FE for more information on the design and connectivity options.
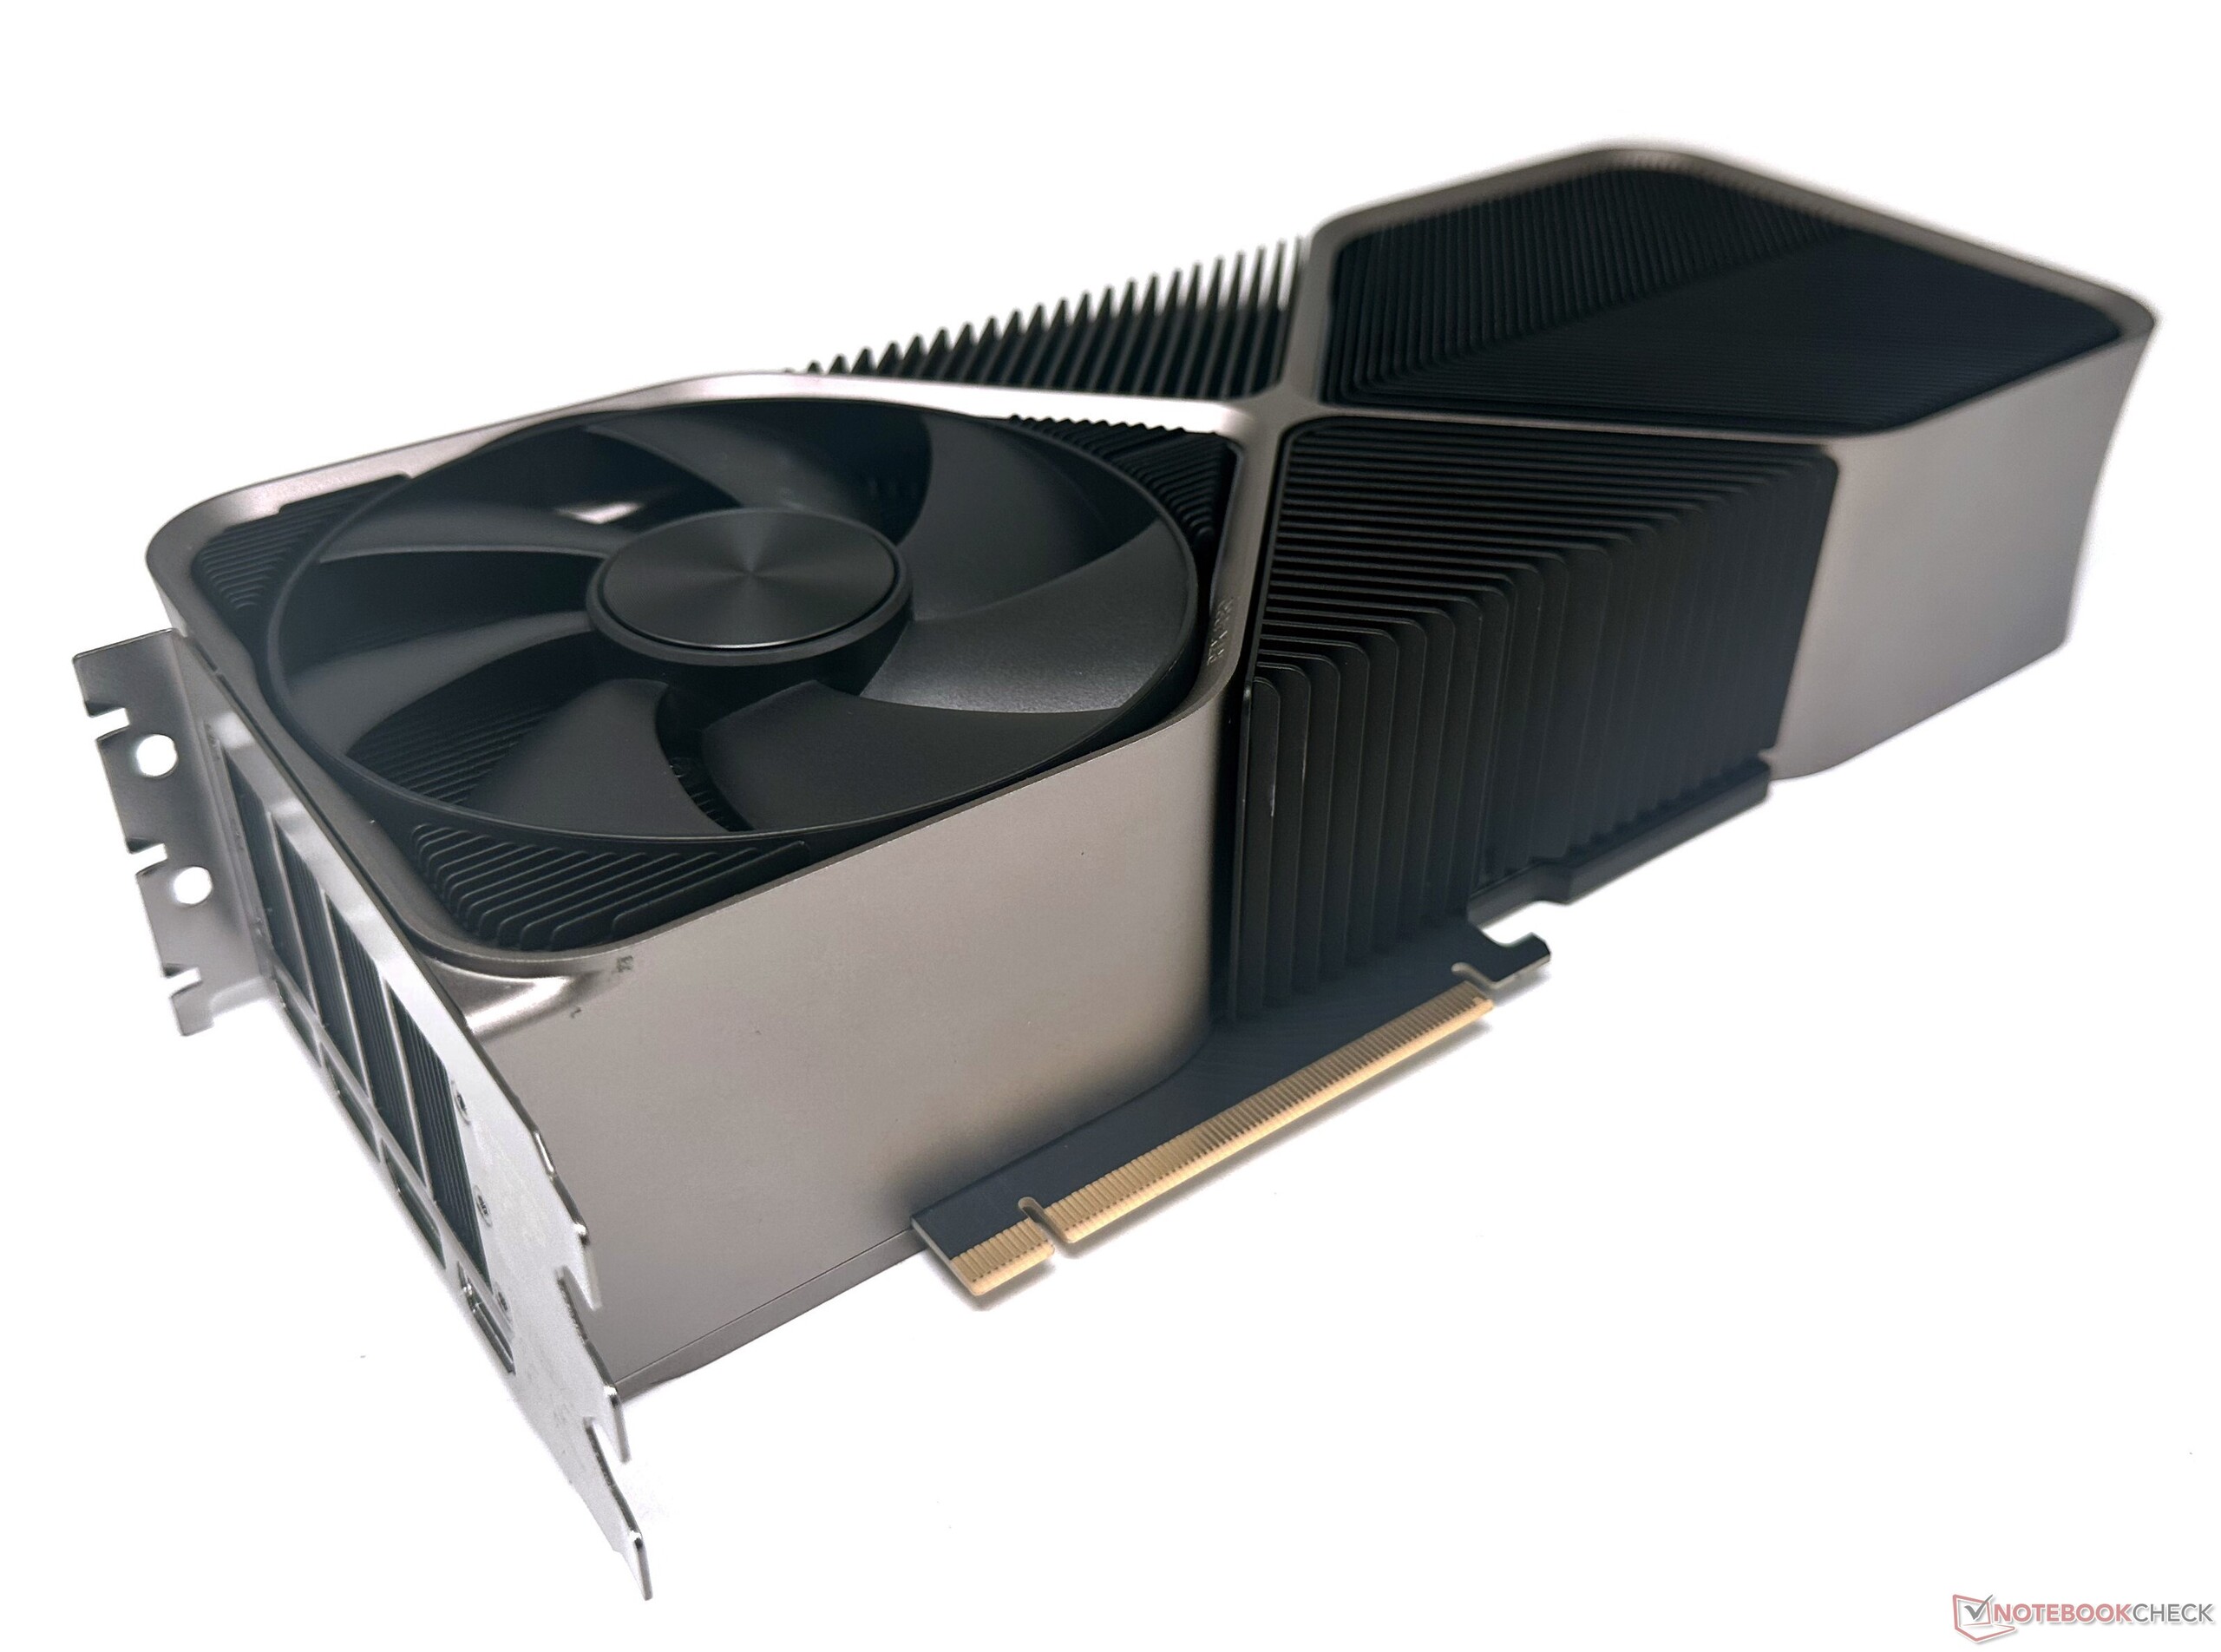
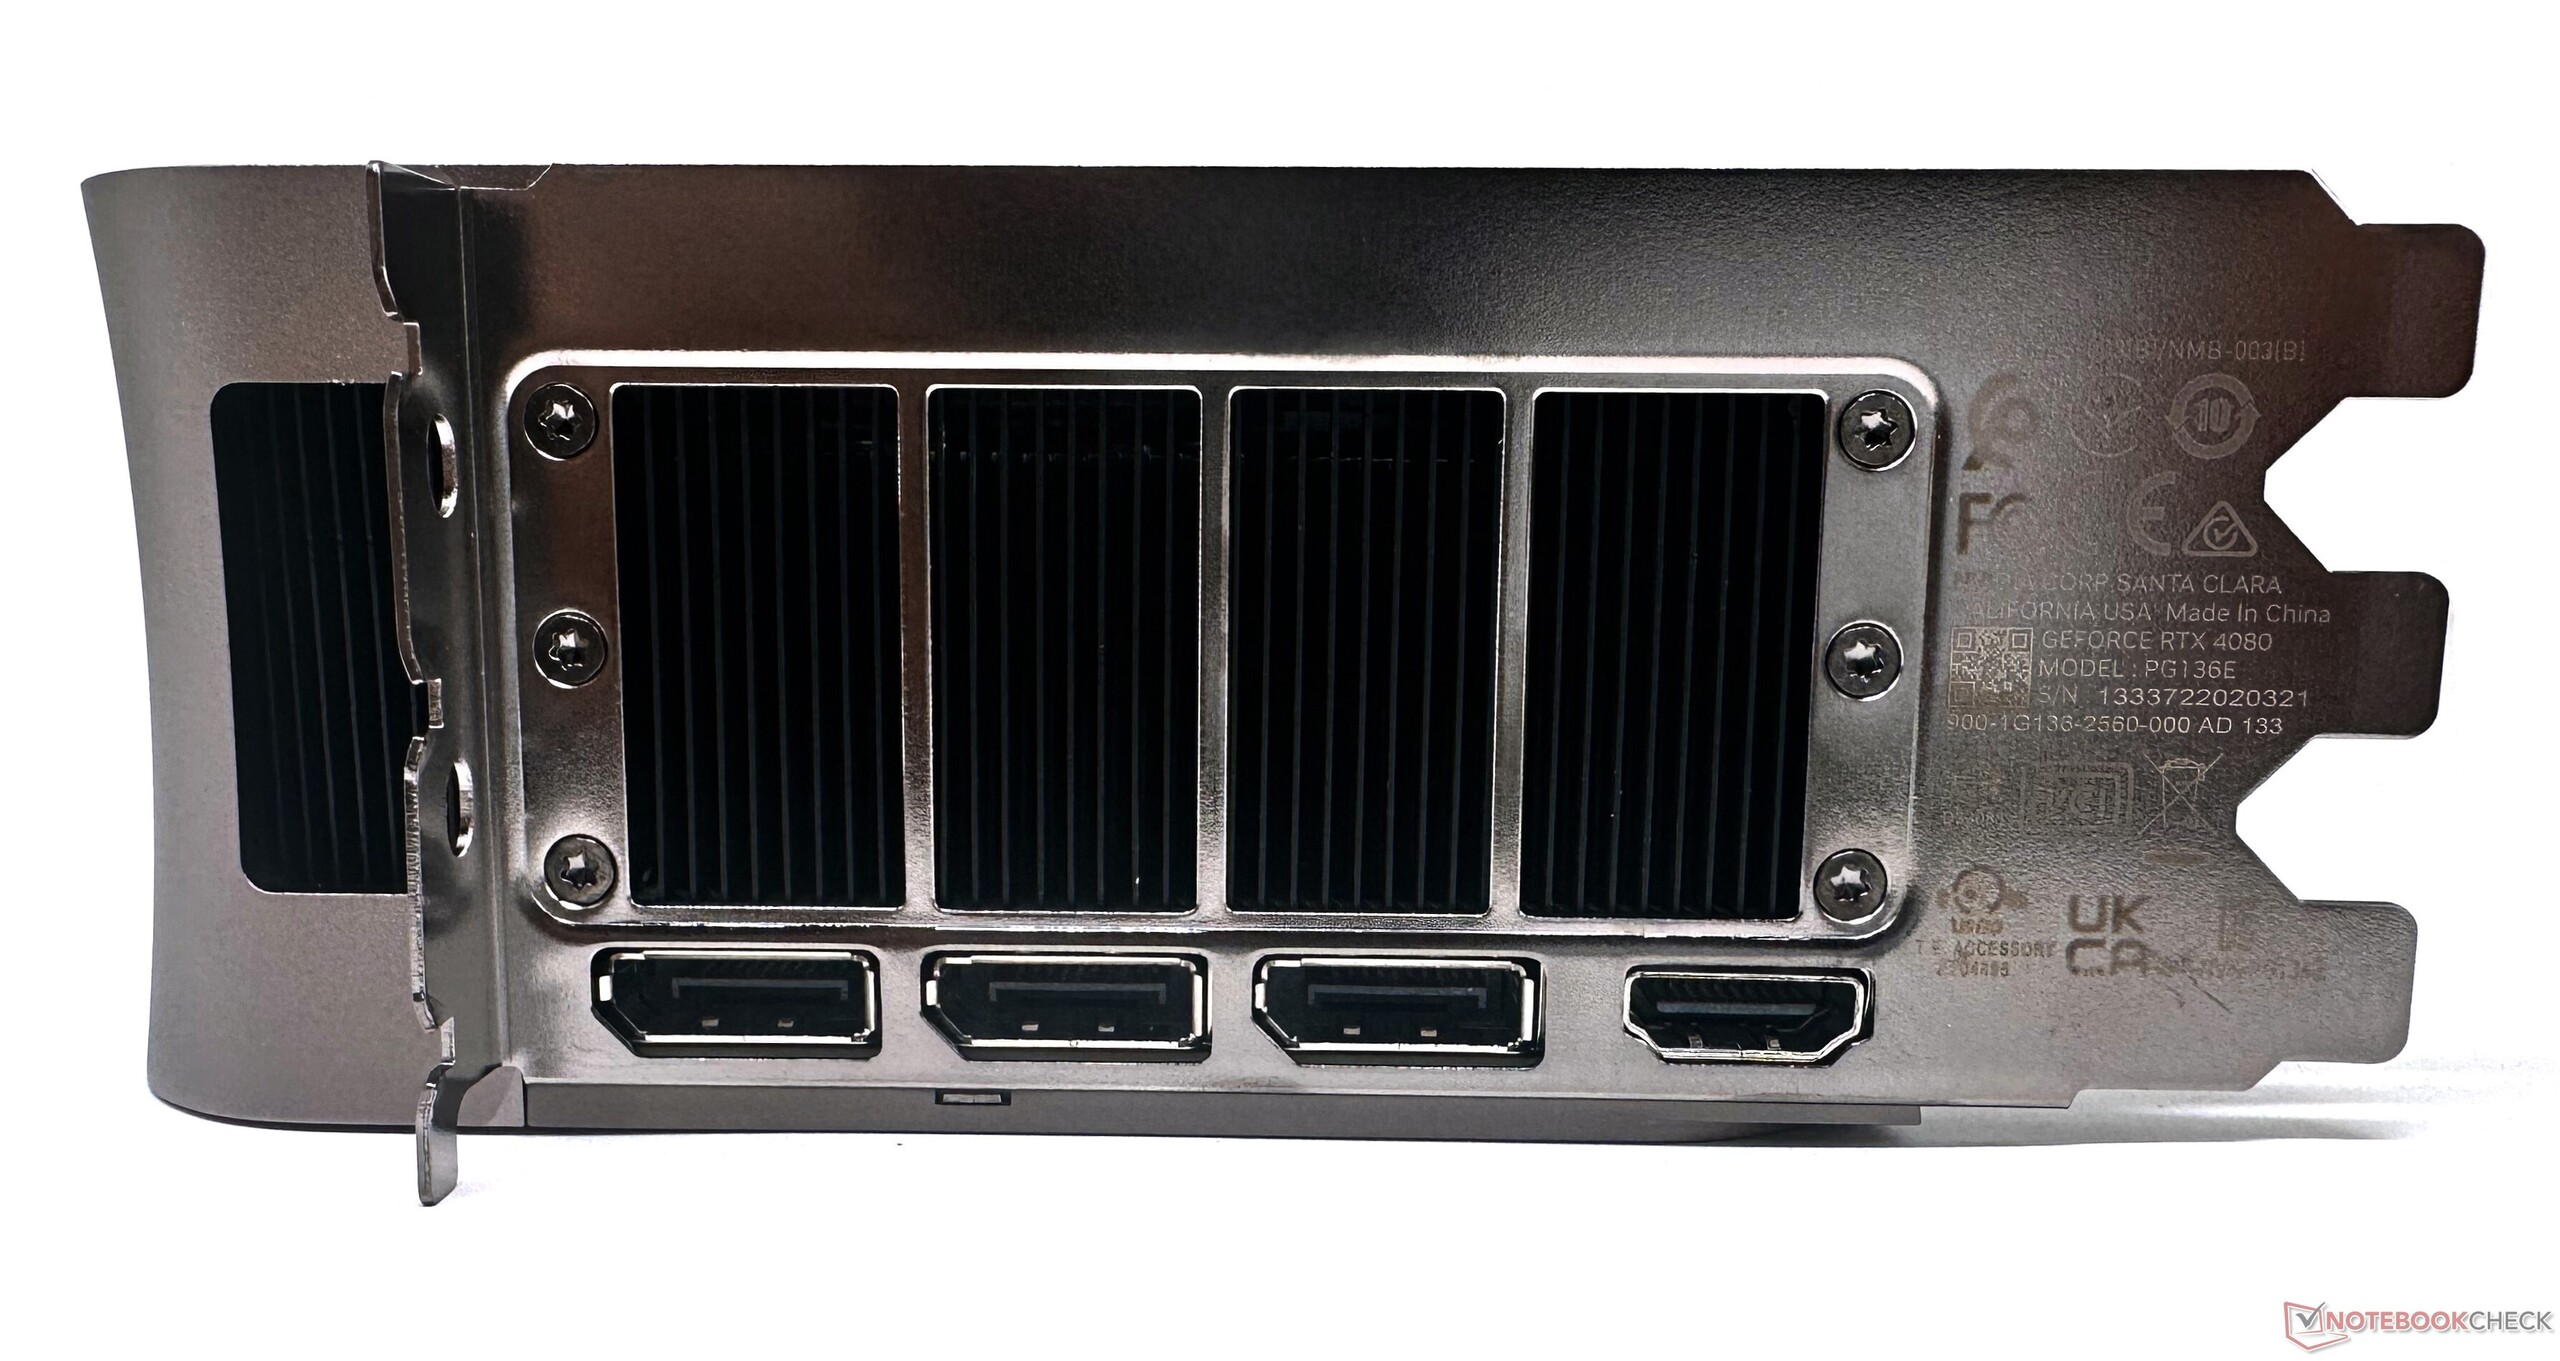


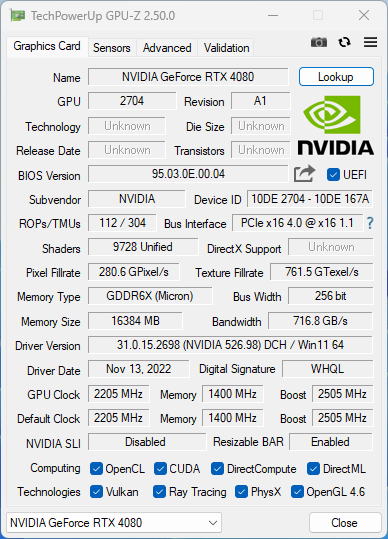
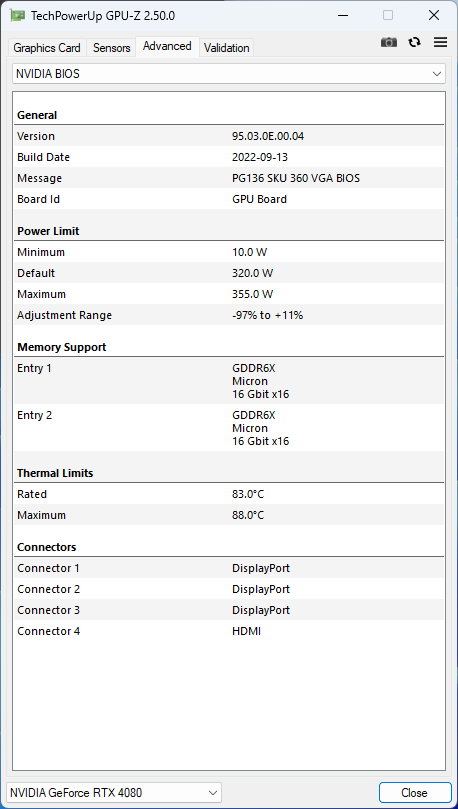
The RTX 4080 FE has a boost clock of 2,505 MHz and runs at a 320 W TGP. Unlike the RTX 4090 FE, overclocking potential is limited in this card, with only about 10% additional power target headroom for a maximum TGP of 355 W.
The test bench: RTX 4080 FE gets paired with Intel Raptor Lake flagship
The test system is identical to what we've used for our review of the RTX 4090 FE. This includes the following components:
- Cooler MasterFrame 700 test bench
- Intel Core i9-13900K
- Gigabyte Z790 Aorus Master motherboard
- Gigabyte Aorus Gen 4 2 TB NVMe SSD for benchmarks and games
- 2x 16 GB Kingston Fury Renegade DDR5-6400 RAM at DDR5-6000 speeds with timings 32-38-38-80 at 1.35 V
- Gigabyte M28U 4K 144 Hz monitor
- Cooler Master MasterLiquid ML360L V2 ARGB AIO cooler
- Cooler Master MVE Gold 1250 V2 fully modular PSU
A fresh installation of Windows 11 22H2 with the latest patches was used together with Game Ready driver version 526.72.
We would like to thank Cooler Master for supplying the test bench, AIO, and PSU, Gigabyte for the Core i9-13900K, Z790 motherboard, M28U monitor, and NVMe SSD, and Kingston for the memory. Due to some reasons, we had to change to a new DDR5-6400 memory kit. We used a DDR5-6000 XMP profile to match our previous RTX 4090 FE test system as much as possible.
Synthetic benchmarks: Significant leads over the RTX 3090 Ti and RX 6950 XT
The RTX 4080 offers a fairly significant 23% cumulative performance uplift over the RTX 3090 Ti in synthetic benchmarks, whilst putting up a similar show against the RX 6950 XT. This delta increases to 58% when compared with the RTX 3080 average. 3DMark Fire Strike Graphics is the only test where we see the RX 6950 XT to have a slight edge over the RTX 4080.
Unigine benchmarks see Nvidia GPUs leading handsomely throughout. The RTX 4080 FE is able to outperform the AMD Radeon RX 6800 XT by more than 60% in most Unigine tests.
When compared to the RX 6900 XT, the RTX 4080 shows a very impressive 76% uplift in the Heaven 4.0 OpenGL and greater than 50% gains in Unigine Superposition.
| 3DMark 11 Performance | 60209 points | |
| 3DMark Ice Storm Standard Score | 296469 points | |
| 3DMark Cloud Gate Standard Score | 86459 points | |
| 3DMark Fire Strike Score | 44563 points | |
| 3DMark Fire Strike Extreme Score | 31266 points | |
| 3DMark Time Spy Score | 26494 points | |
Help | ||
Compute benchmarks: Substantial gains over Ampere and RDNA 2
The RTX 4080 features 40% less CUDA cores compared to the RTX 4090, but the performance deficit generally lies in the 20% mark in most cases. V-Ray 5 CUDA and RTX tests see the RTX 4080 trailing behind the RTX 4090 by 27% and 29%, respectively. Nevertheless, we still see greater than 40% benefits when compared to the RTX 3090 Ti, which is impressive.
We see 70% leads when compared to the RTX 3080 Ti in V-Ray 4.1 GPU and LuxMark Room GPU tests. However, AMD cards dominate as usual in LuxMark Sala.
We notice that Blender 3.3 CUDA scores are way off the mark, similar to what we had observed previously with the RTX 4090, which doesn't make sense. This could be a driver optimization issue, so we have asked Nvidia for a clarification and will keep you posted once we hear from them.
* ... smaller is better
Professional applications: Decent for a gaming-focused card
The RTX 4080 is squarely aimed at gamers — there's no option to enable ECC memory — but performance in pro apps is not entirely abysmal. The AD102-based RTX 4090 leads by 17% in SPECviewperf 12 and 13 and by 27% in SPECviewperf 2020 v1, which is on expected lines given the AD103 GPU's architectural constraints.
Unsurprisingly, the RTX A6000 gets a huge 148% lead thanks to driver optimizations. Even the laptop versions of the Quadro RTX 5000 and RTX A5000 show significant gains in SPECviewperf tests overall.
For those who aren't looking at a Titan-class card like the RTX 4090, the RTX 4080 is still amenable for workflows such as 3Ds Max.
| Nvidia GeForce RTX 4080 FE i9-13900K | NVIDIA GeForce RTX 4090 i9-13900K | NVIDIA GeForce RTX 3090 Ti R7 5800X3D | AMD Radeon RX 6950 XT R9 5900X | AMD Radeon RX 6900 XT R9 5950X | AMD Radeon RX 6800 XT R9 5950X | NVIDIA GeForce RTX 3090 i9-13900K | 4x NVIDIA RTX A6000 TR Pro 3975WX | NVIDIA RTX A6000 TR Pro 3975WX | Average NVIDIA GeForce RTX 3090 | Average NVIDIA GeForce RTX 3080 | Average NVIDIA GeForce RTX 3080 Ti | Average NVIDIA Titan RTX | Average NVIDIA RTX A5000 Laptop GPU | Average NVIDIA Quadro RTX 5000 (Laptop) | Average of class Desktop | |
|---|---|---|---|---|---|---|---|---|---|---|---|---|---|---|---|---|
| SPECviewperf 12 | 17% | -36% | -9% | -5% | -17% | -26% | 133% | 148% | -30% | -51% | -26% | 96% | 48% | 45% | 35% | |
| 1900x1060 Solidworks (sw-03) (fps) | 127 | 119 -6% | 85.7 -33% | 157 24% | 167 31% | 150 18% | 106 -17% | 208 64% | 225 77% | 95.9 ? -24% | 68.6 ? -46% | 103.7 ? -18% | 164.8 ? 30% | 168.2 ? 32% | 156.7 ? 23% | 138.5 ? 9% |
| 1900x1060 Siemens NX (snx-02) (fps) | 23.4 | 28.8 23% | 15.6 -33% | 49.4 111% | 47.7 104% | 45.07 93% | 17.1 -27% | 333 1323% | 351 1400% | 16.3 ? -30% | 13.1 ? -44% | 16.7 ? -29% | 264 ? 1028% | 167.3 ? 615% | 184 ? 686% | 98.6 ? 321% |
| 1900x1060 Showcase (showcase-01) (fps) | 304 | 410 35% | 265 -13% | 308 1% | 241 -21% | 223 -27% | 263 -13% | 237 -22% | 255 -16% | 257 ? -15% | 190 ? -37% | 256 ? -16% | 193.8 ? -36% | 110.3 ? -64% | 104.3 ? -66% | 306 ? 1% |
| 1900x1060 Medical (medical-01) (fps) | 227 | 288 27% | 87.1 -62% | 58.3 -74% | 88.4 -61% | 77.3 -66% | 90 -60% | 156 -31% | 159 -30% | 97.5 ? -57% | 43.9 ? -81% | 124.8 ? -45% | 94.6 ? -58% | 69.8 ? -69% | 109.3 ? -52% | 180.3 ? -21% |
| 1900x1060 Maya (maya-04) (fps) | 310 | 324 5% | 197 -36% | 90.7 -71% | 151 -51% | 118 -62% | 306 -1% | 147 -53% | 144 -54% | 270 ? -13% | 165.3 ? -47% | 294 ? -5% | 184 ? -41% | 113.8 ? -63% | 121.4 ? -61% | 271 ? -13% |
| 1900x1060 Energy (energy-01) (fps) | 57.5 | 82.6 44% | 27.6 -52% | 23 -60% | 30.8 -46% | 28.39 -51% | 26 -55% | 39.3 -32% | 39.8 -31% | 25.3 ? -56% | 17.4 ? -70% | 26.7 ? -54% | 28.7 ? -50% | 16.9 ? -71% | 26 ? -55% | 59.7 ? 4% |
| 1900x1060 Creo (creo-01) (fps) | 118 | 122 3% | 76.4 -35% | 115 -3% | 127 8% | 119 1% | 101 -14% | 127 8% | 136 15% | 90.2 ? -24% | 69.9 ? -41% | 96.3 ? -18% | 153.8 ? 30% | 151.3 ? 28% | 144.4 ? 22% | 114.1 ? -3% |
| 1900x1060 Catia (catia-04) (fps) | 229 | 274 20% | 150 -34% | 199 -13% | 292 28% | 238 4% | 177 -23% | 208 -9% | 229 0% | 162.5 ? -29% | 121.1 ? -47% | 172 ? -25% | 239 ? 4% | 177.3 ? -23% | 159 ? -31% | 277 ? 21% |
| 1900x1060 3ds Max (3dsmax-05) (fps) | 477 | 473 -1% | 371 -22% | 484 1% | 318 -33% | 167 -65% | 369 -23% | 245 -49% | 336 -30% | 361 ? -24% | 276 ? -42% | 373 ? -22% | 284 ? -40% | 193.9 ? -59% | 450 ? -6% | |
| SPECviewperf 13 | 17% | -30% | 5% | -2% | -10% | -26% | 139% | 153% | -31% | -44% | -27% | 89% | 30% | 29% | 41% | |
| Solidworks (sw-04) (fps) | 183 | 190 4% | 118 -36% | 210 15% | 214 17% | 193 5% | 154 -16% | 191 4% | 192 5% | 136.6 ? -25% | 94.5 ? -48% | 150.7 ? -18% | 169.6 ? -7% | 151.3 ? -17% | 144.1 ? -21% | 179 ? -2% |
| Siemens NX (snx-03) (fps) | 42.1 | 51.4 22% | 28 -33% | 89.7 113% | 85.8 104% | 81.4 93% | 30.7 -27% | 604 1335% | 638 1415% | 28.5 ? -32% | 23.7 ? -44% | 30.1 ? -29% | 477 ? 1033% | 298 ? 608% | 307 ? 629% | 178.2 ? 323% |
| Showcase (showcase-02) (fps) | 305 | 412 35% | 265 -13% | 312 2% | 241 -21% | 232 -24% | 262 -14% | 239 -22% | 255 -16% | 247 ? -19% | 204 ? -33% | 257 ? -16% | 192.8 ? -37% | 117.9 ? -61% | 104.7 ? -66% | 305 ? 0% |
| Medical (medical-02) (fps) | 148 | 182 23% | 113 -24% | 157 6% | 148 0% | 130 -12% | 107 -28% | 180 22% | 184 24% | 100.3 ? -32% | 95.4 ? -36% | 106.3 ? -28% | 90.1 ? -39% | 114.3 ? -23% | 116.1 ? -22% | 224 ? 51% |
| Maya (maya-05) (fps) | 726 | 838 15% | 493 -32% | 372 -49% | 395 -46% | 348 -52% | 580 -20% | 405 -44% | 415 -43% | 525 ? -28% | 400 ? -45% | 574 ? -21% | 425 ? -41% | 235 ? -68% | 235 ? -68% | 611 ? -16% |
| Energy (energy-02) (fps) | 91.7 | 119 30% | 48.4 -47% | 60.3 -34% | 60.6 -34% | 58.4 -36% | 45.1 -51% | 128 40% | 132 44% | 42.9 ? -53% | 37 ? -60% | 41.4 ? -55% | 52.7 ? -43% | 63.8 ? -30% | 51.7 ? -44% | 102.2 ? 11% |
| Creo (creo-02) (fps) | 544 | 580 7% | 353 -35% | 323 -41% | 292 -46% | 276 -49% | 397 -27% | 292 -46% | 366 -33% | 369 ? -32% | 288 ? -47% | 398 ? -27% | 344 ? -37% | 233 ? -57% | 231 ? -58% | 491 ? -10% |
| Catia (catia-05) (fps) | 333 | 406 22% | 230 -31% | 450 35% | 468 41% | 412 24% | 252 -24% | 359 8% | 371 11% | 234 ? -30% | 190.2 ? -43% | 251 ? -25% | 374 ? 12% | 262 ? -21% | 239 ? -28% | 410 ? 23% |
| 3ds Max (3dsmax-06) (fps) | 478 | 474 -1% | 373 -22% | 483 1% | 317 -34% | 284 -41% | 369 -23% | 247 -48% | 338 -29% | 347 ? -27% | 266 ? -44% | 372 ? -22% | 283 ? -41% | 196 ? -59% | 187.5 ? -61% | 443 ? -7% |
| SPECviewperf 2020 | 27% | -24% | 2% | -11% | -7% | -2% | 102% | 163% | -17% | -31% | -13% | 110% | 23% | 44% | ||
| 3840x2160 Solidworks (solidworks-05) (fps) | 226 | 305 35% | 197 -13% | 125 -45% | 112 -50% | 108 -52% | 192 -15% | 141 -38% | 169 -25% | 178 ? -21% | 158 ? -30% | 184 ? -19% | 171.2 ? -24% | 82.6 ? -63% | 372 ? 65% | |
| 3840x2160 Siemens NX (snx-04) (fps) | 34.1 | 44 29% | 23.7 -30% | 88.6 160% | 85 149% | 81.7 140% | 25.6 -25% | 367 976% | 481 1311% | 24 ? -30% | 19.8 ? -42% | 25.2 ? -26% | 372 ? 991% | 152.3 ? 347% | 86.2 ? 153% | |
| 3840x2160 Medical (medical-03) (fps) | 28.3 | 39.3 39% | 22.2 -22% | 34.4 22% | 30.4 7% | 27.84 -2% | 20.3 -28% | 32.1 13% | 37.9 34% | 19.9 ? -30% | 18.5 ? -35% | 21.8 ? -23% | 18.6 ? -34% | 22.8 ? -19% | 44.1 ? 56% | |
| 3840x2160 Maya (maya-06) (fps) | 426 | 508 19% | 353 -17% | 296 -31% | 266 -38% | 224 -47% | 356 -16% | 262 -38% | 329 -23% | 341 ? -20% | 293 ? -31% | 356 ? -16% | 278 ? -35% | 127.7 ? -70% | 441 ? 4% | |
| 3840x2160 Energy (energy-03) (fps) | 45.6 | 65.3 43% | 31.6 -31% | 47.6 4% | 32.6 -29% | 60.8 33% | 101 121% | 46.1 1% | 63 38% | 62.4 ? 37% | 51.7 ? 13% | 64.3 ? 41% | 50.1 ? 10% | 87.1 ? 91% | 87.2 ? 91% | |
| 3840x2160 Creo (creo-03) (fps) | 136 | 142 4% | 84.5 -38% | 73.1 -46% | 65.4 -52% | 65 -52% | 118 -13% | 75.6 -44% | 111 -18% | 107.7 ? -21% | 77.6 ? -43% | 113 ? -17% | 127.5 ? -6% | 93.3 ? -31% | 117.5 ? -14% | |
| 3840x2160 CATIA (catia-06) (fps) | 76.5 | 95.6 25% | 58.6 -23% | 53 -31% | 44.6 -42% | 42.4 -45% | 60.4 -21% | 67.5 -12% | 82.4 8% | 57 ? -25% | 50 ? -35% | 59.6 ? -22% | 83.8 ? 10% | 58.4 ? -24% | 76.6 ? 0% | |
| 3840x2160 3ds Max (3dsmax-07) (fps) | 172 | 213 24% | 145 -16% | 144 -16% | 121 -30% | 114 -34% | 143 -17% | 95.7 -44% | 137 -20% | 134.7 ? -22% | 100 ? -42% | 139.3 ? -19% | 119.4 ? -31% | 83.9 ? -51% | 167.9 ? -2% | |
| Total Average (Program / Settings) | 20% /
20% | -30% /
-30% | -1% /
-1% | -6% /
-6% | -11% /
-12% | -18% /
-18% | 125% /
125% | 155% /
154% | -26% /
-26% | -42% /
-42% | -22% /
-22% | 98% /
98% | 34% /
33% | 37% /
37% | 40% /
40% |
Gaming benchmarks: Native 4K Ultra 100 fps in most titles
Gaming performance is what counts the most with mainstream cards like the RTX 4080 and below. Overall, we see that the RTX 4080 FE is about 14% deficient in gaming when compared to the RTX 4090 FE.
On the other hand, the RTX 4080 FE sees 20%, 37%, 41%, and 57% gains compared to the RTX 3090 Ti, RX 6950 XT, RTX 3080 Ti average, and RX 6900 XT, respectively in the tested titles.
Gaming at 4K Ultra in modern titles is a cinch with this card, without any need for upscaling. A vast majority of titles are playable at 100+ fps at 4K Ultra, with the more demanding ones requiring some slight tuning if required.
Another way to achieve even higher fps at 4K Ultra settings is to make use of Nvidia DLSS or equivalent, including the fancy new DLSS 3 frame generation tech in supported games.
The benefits in upgrading to an RTX 4080 are best seen at 4K. The RTX 40 series cards seem to have a penchant for getting bottlenecked easily, even with the latest flagship gaming CPUs from AMD and Intel. Therefore, this card is probably overkill if you primarily game at FHD or QHD resolutions.
| The Witcher 3 | |
| 3840x2160 High Graphics & Postprocessing (Nvidia HairWorks Off) | |
| NVIDIA GeForce RTX 4090 | |
| Average of class Desktop (41.7 - 388, n=44, last 2 years) | |
| Nvidia GeForce RTX 4080 FE | |
| NVIDIA GeForce RTX 3090 Ti | |
| Average NVIDIA GeForce RTX 3080 Ti (149 - 156.8, n=4) | |
| Average NVIDIA GeForce RTX 3090 (128 - 160.2, n=14) | |
| AMD Radeon RX 6950 XT | |
| AMD Radeon RX 6900 XT | |
| Average NVIDIA GeForce RTX 3080 (114 - 115, n=2) | |
| AMD Radeon RX 6800 XT | |
| Average NVIDIA Titan RTX (94 - 107.1, n=28) | |
| 1920x1080 Ultra Graphics & Postprocessing (HBAO+) | |
| NVIDIA GeForce RTX 4090 | |
| Nvidia GeForce RTX 4080 FE | |
| Average of class Desktop (7.8 - 369, n=48, last 2 years) | |
| AMD Radeon RX 6950 XT | |
| NVIDIA GeForce RTX 3090 Ti (110% PT) | |
| NVIDIA GeForce RTX 3090 Ti (100% PT) | |
| Average NVIDIA GeForce RTX 3090 (160 - 192.6, n=18) | |
| Average NVIDIA GeForce RTX 3080 Ti (174 - 184.6, n=4) | |
| AMD Radeon RX 6900 XT | |
| AMD Radeon RX 6800 XT | |
| Average NVIDIA GeForce RTX 3080 (145 - 152, n=2) | |
| Average NVIDIA Titan RTX (124 - 150, n=28) | |
Ray tracing performance
As noted in our RTX 4090 FE review, Nvidia is introducing new ray tracing pipelines with the Ada architecture. However, these benefits are not always apparent. Though the RTX 4080 has nearly 41% fewer RT cores compared to its bigger cousin, we see that native ray tracing performance at 1080p is not greatly impacted in titles such as Metro Exodus (non-Enhanced Edition), Watch Dogs: Legion, and Far Cry 6.
However, the delta with the RTX 4090 FE starts to widen with games such as Control (-12%), Ghostwire: Tokyo (-14%) Dying Light 2 (-24%), and Cyberpunk 2077 1.5 4K (-28%).
That being said, we still see notable gains of up to 49% when compared to the RTX 3080 Ti and up to 38% against the RTX 3090 Ti.
Further gains may be seen with DLSS 3 and when developers add support for Ada's Shader Execution Reordering (SER) scheduling for efficient processing of secondary rays in the scene.
| Control - 1920x1080 High Quality Preset & High Ray Tracing Preset (DX12) | |
| NVIDIA GeForce RTX 4090 | |
| Average of class Desktop (163.1 - 170.5, n=2, last 2 years) | |
| Nvidia GeForce RTX 4080 FE | |
| NVIDIA GeForce RTX 3090 Ti | |
| Average NVIDIA GeForce RTX 3080 Ti (111 - 120.6, n=3) | |
| Average NVIDIA GeForce RTX 3090 (91.4 - 122.6, n=5) | |
| Average NVIDIA GeForce RTX 3080 (98.1 - 103, n=2) | |
| AMD Radeon RX 6950 XT | |
| Average NVIDIA Titan RTX (63 - 120, n=3) | |
| AMD Radeon RX 6900 XT (SAM ENABLED) | |
| AMD Radeon RX 6900 XT | |
| AMD Radeon RX 6800 XT | |
| Watch Dogs Legion - 1920x1080 Ultra Preset + Ultra Ray Tracing (DX12) | |
| NVIDIA GeForce RTX 4090 | |
| Nvidia GeForce RTX 4080 FE | |
| NVIDIA GeForce RTX 3090 Ti | |
| Average NVIDIA GeForce RTX 3090 (75.7 - 110, n=3) | |
| Average NVIDIA GeForce RTX 3080 Ti (n=1) | |
| AMD Radeon RX 6800 XT | |
| Average NVIDIA GeForce RTX 3080 (70.9 - 71.3, n=2) | |
| AMD Radeon RX 6950 XT | |
| AMD Radeon RX 6900 XT | |
| AMD Radeon RX 6900 XT (SAM ENABLED) | |
| Average NVIDIA Titan RTX (n=1) | |
| Far Cry 6 - 1920x1080 Ultra Graphics Quality + HD Textures + DXR AA:T | |
| Average of class Desktop (62.2 - 207, n=12, last 2 years) | |
| Nvidia GeForce RTX 4080 FE | |
| NVIDIA GeForce RTX 4090 | |
| NVIDIA GeForce RTX 3090 Ti | |
| Average NVIDIA GeForce RTX 3080 Ti (112 - 128.6, n=2) | |
| Average NVIDIA GeForce RTX 3090 (76 - 138.2, n=8) | |
| Average NVIDIA Titan RTX (97 - 109.3, n=2) | |
| AMD Radeon RX 6950 XT | |
| Average NVIDIA GeForce RTX 3080 (n=1) | |
| Dying Light 2 - 1920x1080 High Quality Raytracing | |
| NVIDIA GeForce RTX 4090 | |
| Nvidia GeForce RTX 4080 FE | |
| Average NVIDIA GeForce RTX 3090 (67.9 - 109.9, n=3) | |
| Average NVIDIA GeForce RTX 3080 Ti (n=1) | |
| Average NVIDIA Titan RTX (n=1) | |
| NVIDIA GeForce RTX 3090 Ti | |
| Average NVIDIA GeForce RTX 3080 (n=1) | |
| Cyberpunk 2077 1.6 | |
| 3840x2160 Ray Tracing Ultra Preset (DLSS off) | |
| NVIDIA GeForce RTX 4090 (1.6) | |
| Nvidia GeForce RTX 4080 FE (1.6) | |
| NVIDIA GeForce RTX 3090 Ti (1.52) | |
| Average NVIDIA GeForce RTX 3090 (19.8 - 22.1, n=6) | |
| Average NVIDIA GeForce RTX 3080 Ti (n=1) | |
| Average NVIDIA Titan RTX (n=1) | |
| Average NVIDIA GeForce RTX 3080 (n=1) | |
| 1920x1080 Ray Tracing Ultra Preset (DLSS off) | |
| NVIDIA GeForce RTX 4090 (1.6) | |
| Nvidia GeForce RTX 4080 FE (1.6) | |
| NVIDIA GeForce RTX 3090 Ti (1.52) | |
| Average NVIDIA GeForce RTX 3080 Ti (n=1) | |
| Average NVIDIA GeForce RTX 3090 (61.3 - 70.4, n=6) | |
| Average NVIDIA GeForce RTX 3080 (n=1) | |
| Average NVIDIA Titan RTX (n=1) | |
| Ghostwire Tokyo - 1920x1080 Highest Settings + Maximum Ray Tracing | |
| Average of class Desktop (n=1last 2 years) | |
| NVIDIA GeForce RTX 4090 | |
| Nvidia GeForce RTX 4080 FE | |
| NVIDIA GeForce RTX 3090 Ti | |
| Average NVIDIA GeForce RTX 3080 Ti (n=1) | |
| Average NVIDIA GeForce RTX 3090 (106 - 122, n=4) | |
| Average NVIDIA GeForce RTX 3080 (n=1) | |
| Average NVIDIA Titan RTX (74.5 - 79, n=2) | |
| low | med. | high | ultra | QHD | 4K | |
|---|---|---|---|---|---|---|
| GTA V (2015) | 187.9 | 187.8 | 187.5 | 172.4 | 167.9 | 186.1 |
| The Witcher 3 (2015) | 790 | 694 | 545 | 254 | 204 | |
| Dota 2 Reborn (2015) | 296.1 | 259.8 | 251 | 238.3 | 232.6 | |
| Final Fantasy XV Benchmark (2018) | 236 | 234 | 224 | 198.4 | 115.4 | |
| X-Plane 11.11 (2018) | 251 | 221 | 166.3 | 140.5 | ||
| Far Cry 5 (2018) | 259 | 237 | 232 | 219 | 217 | 140 |
| Shadow of the Tomb Raider (2018) | 332 | 319 | 314 | 303 | 248 | 134 |
| Metro Exodus (2019) | 277 | 245 | 208 | 180 | 155.1 | 105.7 |
| Total War: Three Kingdoms (2019) | 634 | 422 | 321 | 235 | 152 | 74.3 |
| Control (2019) | 237 | 237 | 233 | 164.2 | 82.6 | |
| Borderlands 3 (2019) | 256 | 227 | 211 | 199.4 | 170.5 | 95.7 |
| Doom Eternal (2020) | 874 | 751 | 633 | 575 | 485 | 245 |
| Mafia Definitive Edition (2020) | 309 | 273 | 260 | 214 | 115.6 | |
| Watch Dogs Legion (2020) | 187 | 191.3 | 173.4 | 163.5 | 142.4 | 86.8 |
| Assassin´s Creed Valhalla (2020) | 310 | 262 | 217 | 189 | 153 | 100 |
| F1 2021 (2021) | 702 | 650 | 563 | 281 | 242 | 143.5 |
| Far Cry 6 (2021) | 238 | 224 | 203 | 181 | 177 | 109 |
| Call of Duty Vanguard (2021) | 178.6 | 264 | 276 | 251 | 190.7 | 118.9 |
| Forza Horizon 5 (2021) | 324 | 255 | 240 | 175 | 161 | 122 |
| Rainbow Six Extraction (2022) | 542 | 464 | 403 | 393 | 246 | 148 |
| Dying Light 2 (2022) | 307 | 255 | 215 | 153.5 | 77.5 | |
| Cyberpunk 2077 1.6 (2022) | 246 | 248 | 218 | 197.4 | 130.4 | 63.5 |
| Ghostwire Tokyo (2022) | 347 | 332 | 335 | 335 | 274 | 123.7 |
| F1 22 (2022) | 427 | 431 | 370 | 172.9 | 114.4 | 58.9 |
| Call of Duty Modern Warfare 2 2022 (2022) | 291 | 271 | 219 | 217 | 160 | 100 |
Emissions: Excellent thermal and noise characteristics
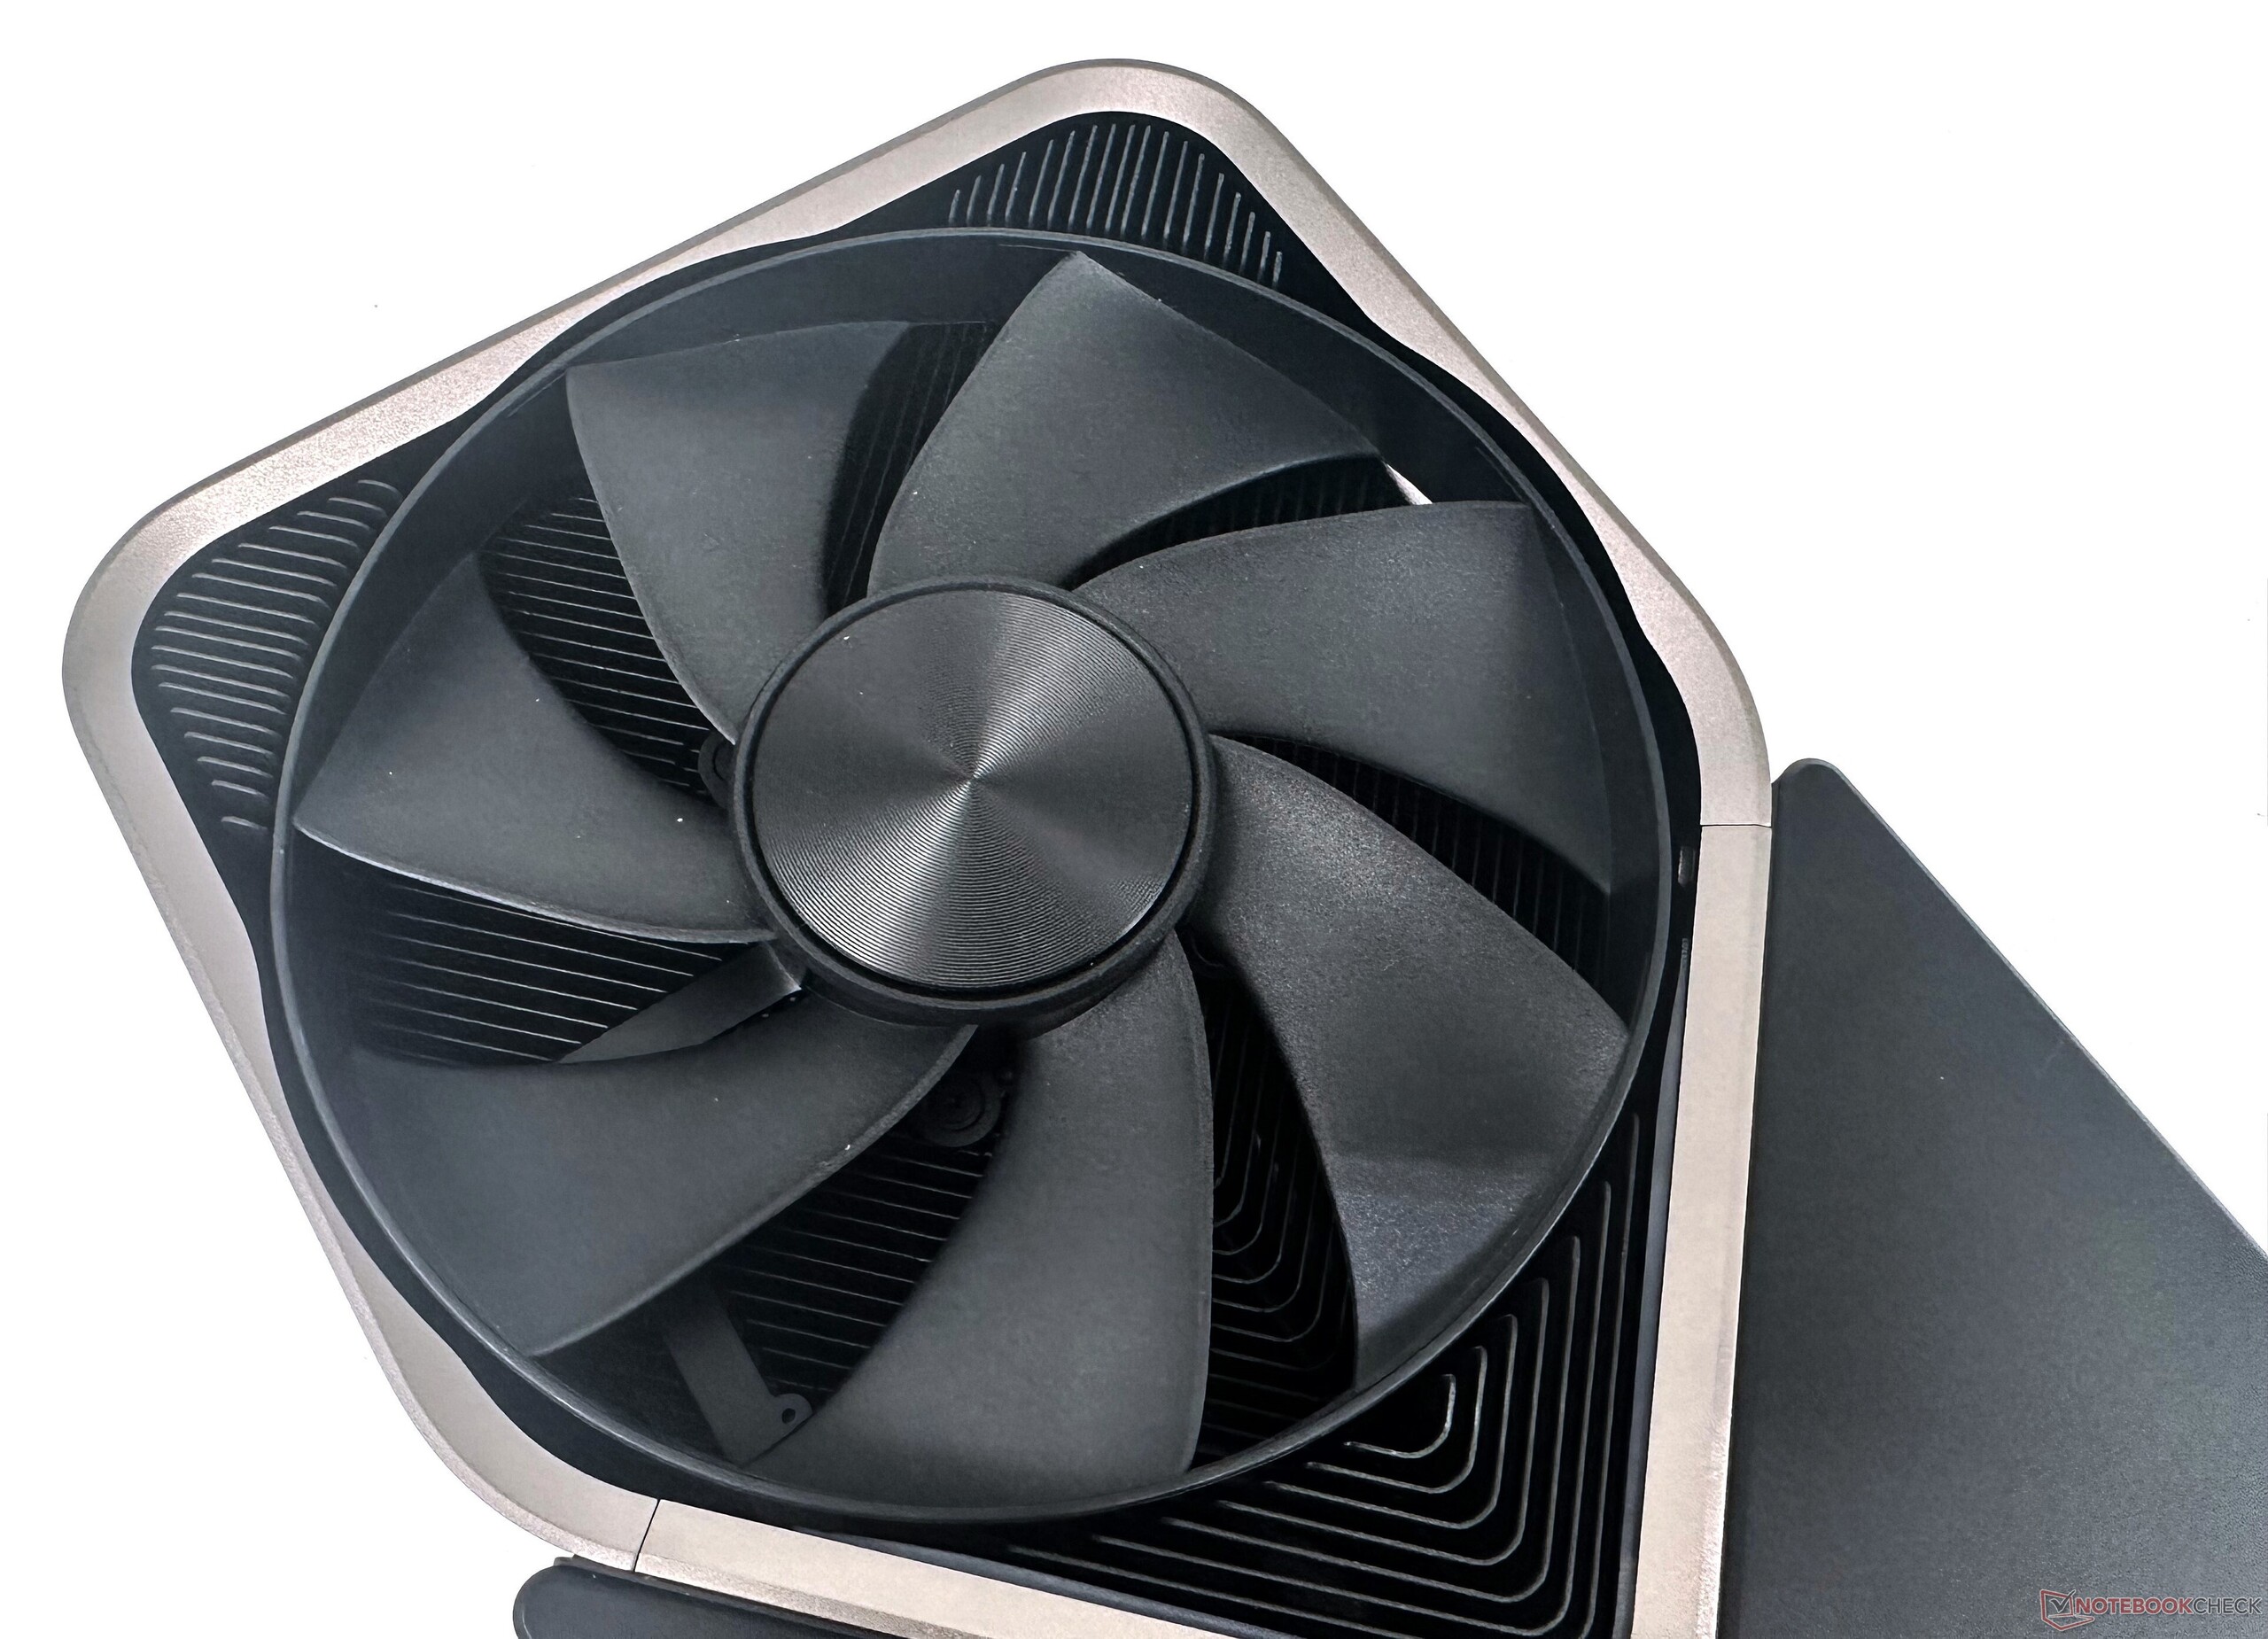
The RTX 4080 FE employs the same cooler design as we had seen before with the RTX 4090 FE, which translates to vastly improved thermals and greatly reduced noise levels. However, the overclocking potential with this card is significantly lower than its Titan-class cousin.
You can increase the power limit by a maximum of 10%, which allows the card to run at a 355 W TGP. Further, we could manage +200 MHz on the core clock and +1,750 MHz on the memory before the card started to artifact in Heaven 4.0. These settings seemed stable in FurMark's 1080p test as well. Any higher value would instantly crash the driver.
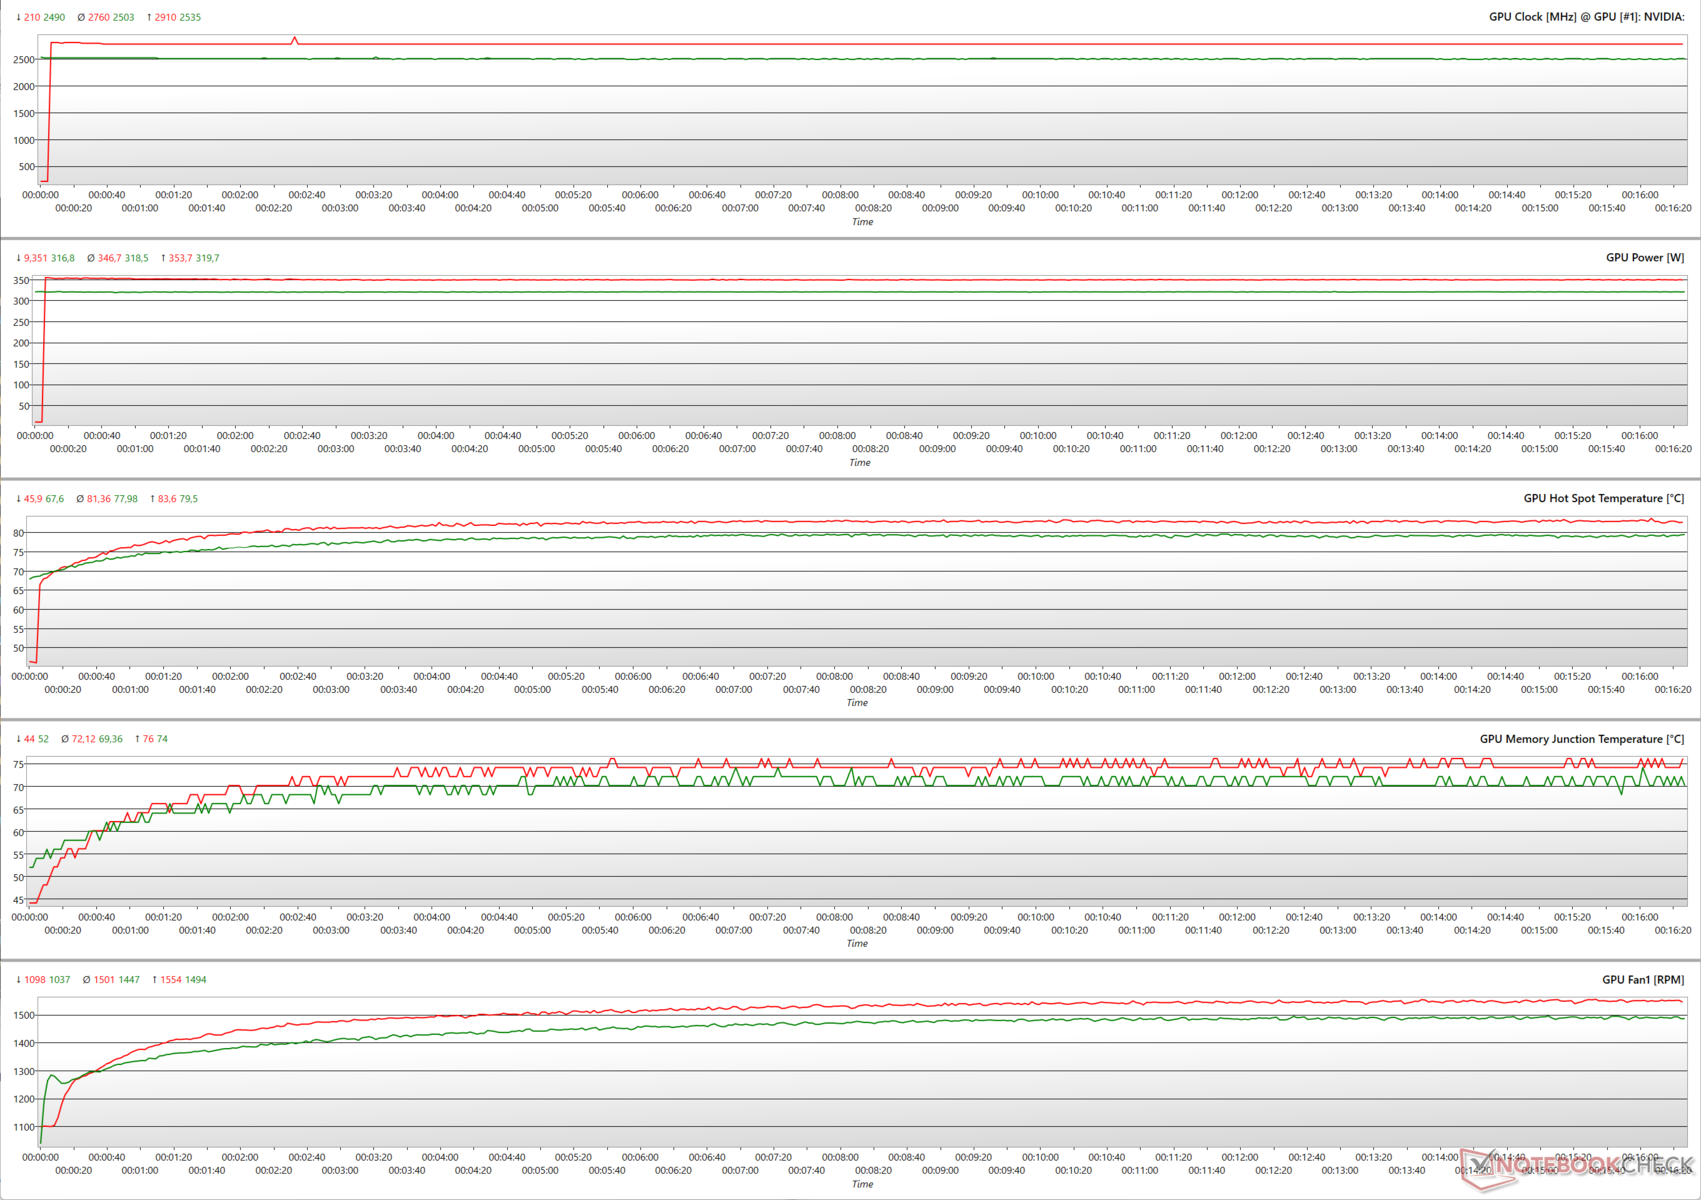
Stress tests
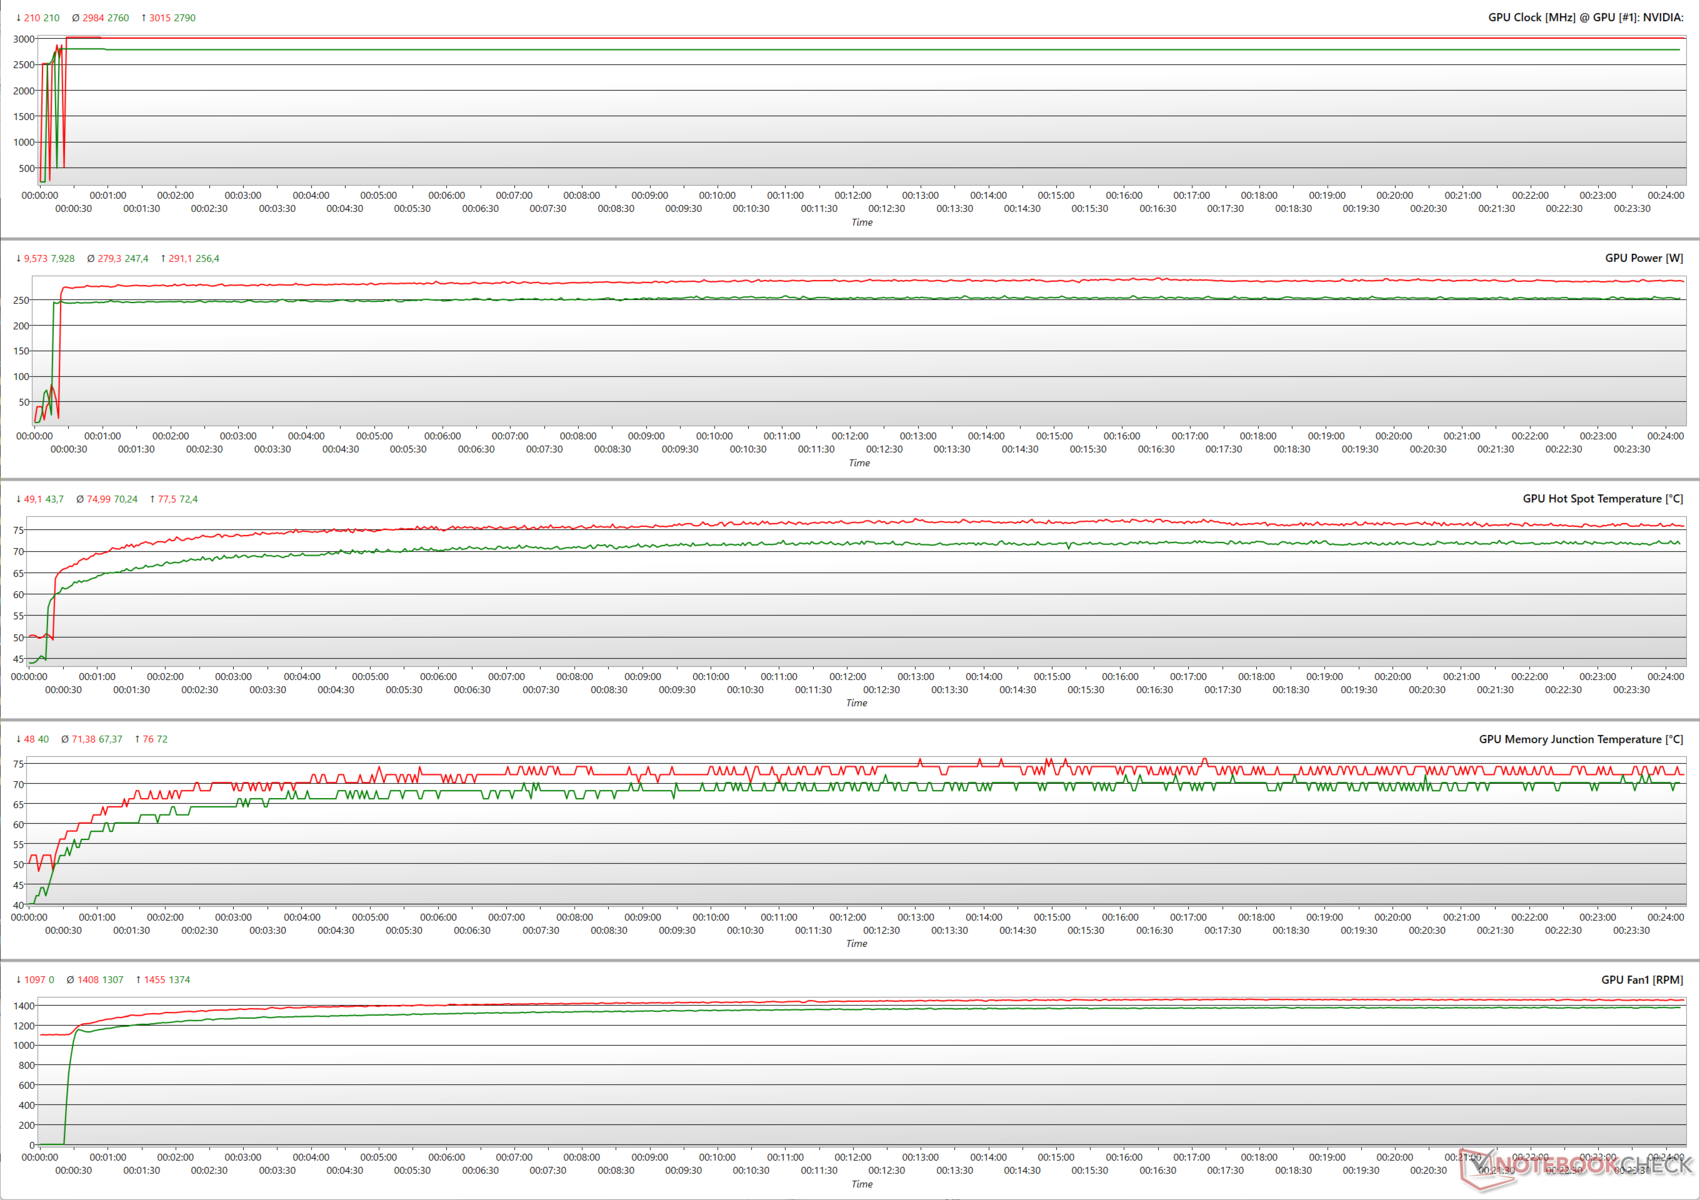
At a 100% power target (PT), FurMark stress at 1280x720 with AA off shows well-sustained clocks at 2,503 MHz average at 320 W TGP. Increasing the PT to 110% allows the RTX 4080 to rev up to a maximum of 2,910 MHz at a 354 W TGP, resulting in a maximum hotspot temperature of 83.6 °C.
During The Witcher 3 stress at 1080p Ultra, we find the clocks boosting up to a 2,790 MHz maximum in the default setting. Increasing the PT to 110% helps the RTX 4080 finally cross the 3 GHz mark with a 3,015 MHz maximum boost.
Unlike what we had seen during FurMark stress, the RTX 4080 is able to hit the 3 GHz mark at a lower 291 W TGP with a maximum hotspot temperature of 77.5 °C despite an increased power target. This is because Ada is much more power-efficient than Ampere and can offer increased boosts at the same power limits.
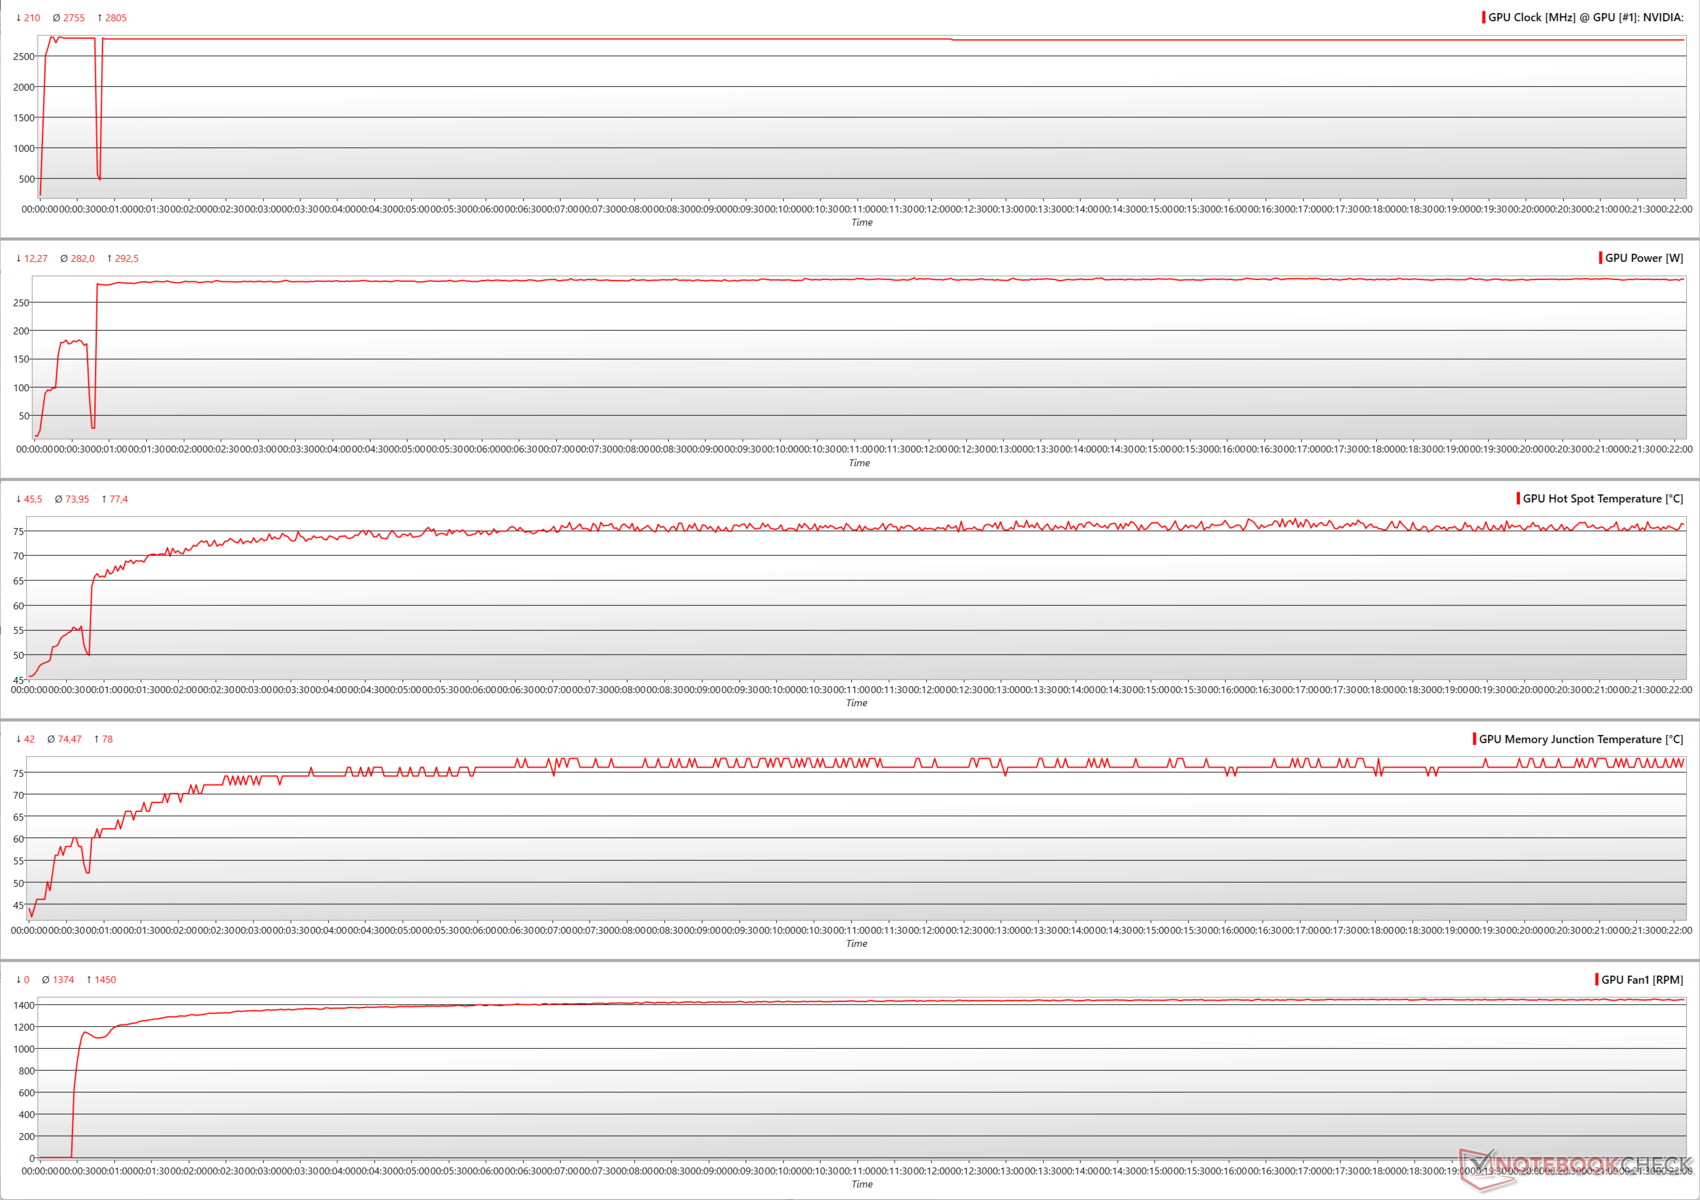
Running The Witcher 3 at 4K Ultra in the default settings shows the RTX 4080 FE hitting a maximum clock of 2,805 MHz, with other readings similar to what we had seen during the 1080p Ultra run of the test.
The Witcher 3 FPS Chart
The RTX 4080 FE's excellent cooling system helps it offer a well-sustained performance for the most part. We did notice a slight 3% dip in frame rates at 1080p Ultra, but the card managed to regain its mojo back within a short time. By contrast, 4K Ultra stress showed highly consistent frames with virtually no dips or sudden spikes.
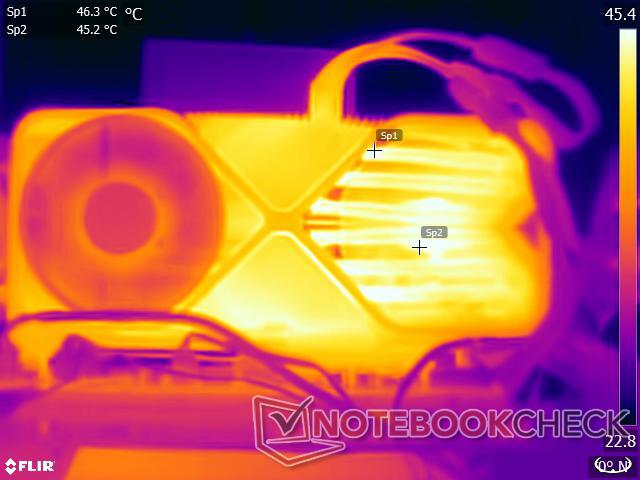
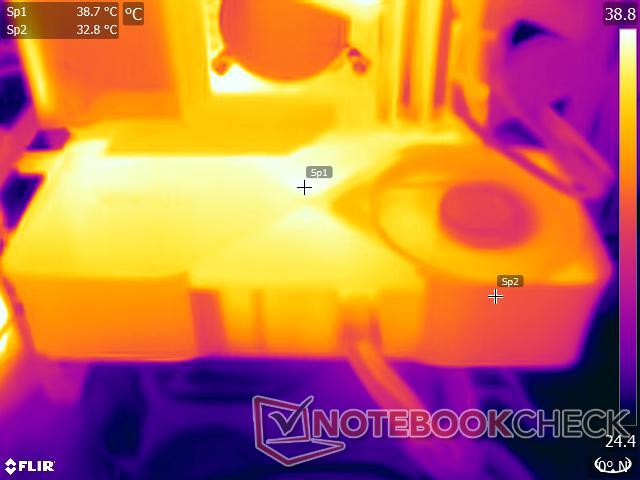
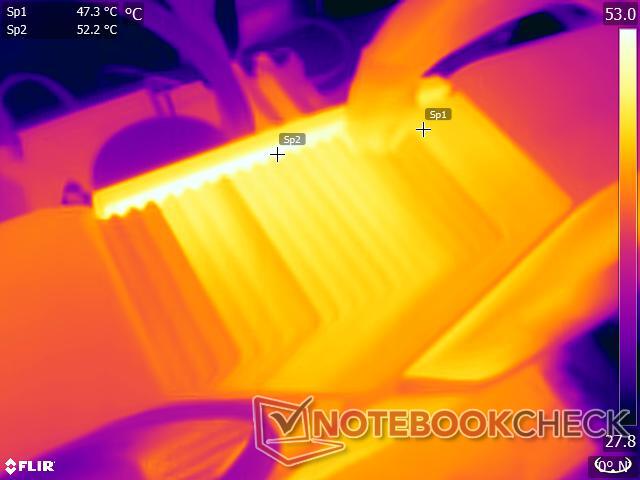
Surface temperatures
Strapping the 4090 FE's cooling block onto the RTX 4080 — which runs at a significantly lower TGP — lends itself to excellent heat dissipation and cool operating temperatures.
We recorded surface temperatures up to 46.3 °C on the front side of the card, with the maximum temperature touching just 52.2 °C at the top during stress testing in an ambient temperature of about 23 °C.
The area near the power connector was slightly warmer at 47.3 °C, but there were no concerns of the heat damaging the connector or the adapter in any way.
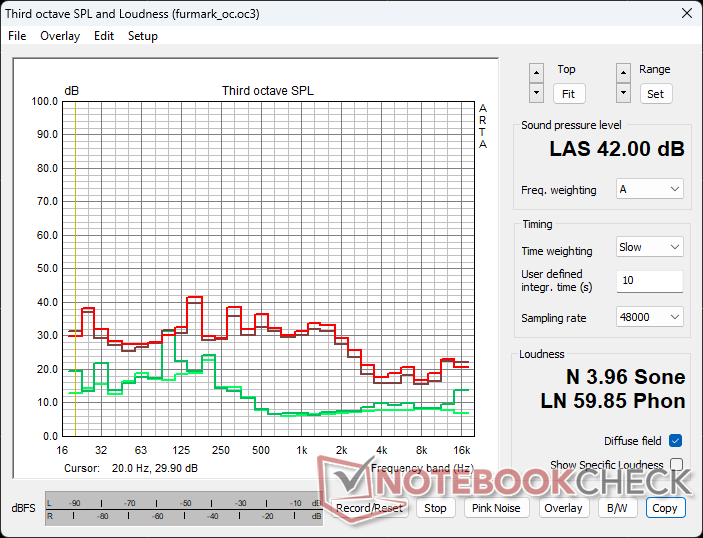
Noise levels
The RTX 4080 FE completely turns off the fans during idling or light loads such as 4K decode. Fan noise levels were measured at a fixed 20 cm distance from the test bench with all case fans turned off save for the Cooler Master AIO pump. We measured 20.65 dB(A) and 22.10 db(A) as the ambient and noise levels, respectively.
At the default 100% PT, the sound pressure level (SPL) during FurMark stress is a reasonable 40.20 db(A) with the fans spinning at average speeds of about 1,497 RPM or 46%. Average fan speeds increase to 48% or 1,502 RPM when overclocked, resulting in a slightly higher 42 db(A) SPL.
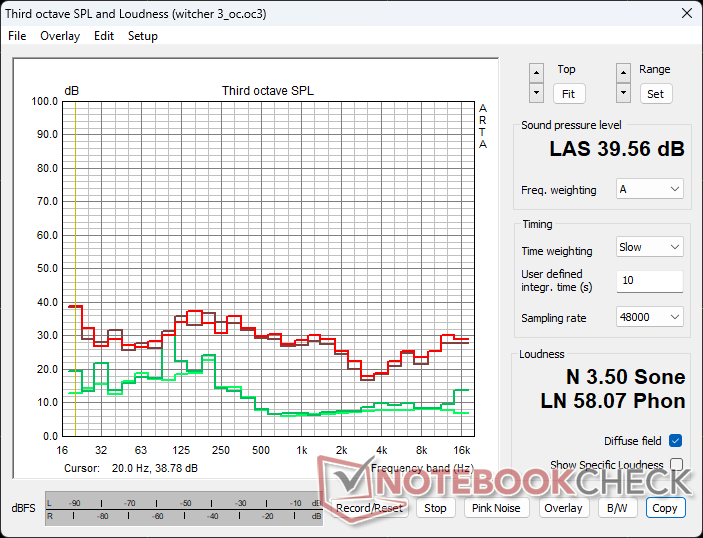
Running The Witcher 3 at 1080p Ultra at 100% PT sees average fan speeds hover around the 40% mark or 1,307 RPM. This results in a very tolerable fan noise of 38.56 db(A) SPL. At 110% PT, we notice that the average fan speeds increase to 44% or 1,409 RPM that corresponds to a slightly higher SPL at 39.56 db(A).
The RTX 4080 FE thus greatly benefits from utilizing the RTX 4090's cooling prowess, resulting in endurable noise levels even when overclocked.
Power consumption: The most energy-efficient Ada yet
The RTX 4080 FE comes across as a very frugal power sipper for the performance on offer. Compared to the RTX 4090 FE's 100% power target, the RTX 4080 FE consumes 16% lesser power in The Witcher 3 at 1080p Ultra at default power limits.
The AD103-based card is also 29% and 25% more economical when compared to the Radeon RX 6950 XT and RTX 3090 Ti, respectively.
FurMark 1.19 also sees the RTX 4080 FE coming across as forgiving on your energy bills, with 23% and 28% lesser power requirements than the RTX 4090 FE and RTX 3090 Ti, respectively.
Power Consumption: External Monitor
* ... smaller is better
Pros
Cons
Verdict: Enticing performance gains let down by poor pricing
So far, we've seen the might of Nvidia's Ada architecture with the GeForce RTX 4090 with room to spare for a future Ti upgrade. Now, it is the turn of the RTX 4080 Founders Edition to showcase Ada for the larger gaming crowd. Nvidia chose to go for a new AD103 silicon instead of cutting down on AD102. This potentially positions the company better to take on AMD's upcoming RDNA 3-based Navi 31 cards.
Nvidia is pitching the RTX 4080 as a generational upgrade over the GeForce RTX 3080 Ti at the same US$1,199.99 MSRP. The RTX 4080 seems to have lower specs than the RTX 3080 Ti at first glance. However, improved manufacturing processes, higher transistor counts, faster clocks, and newer generation Tensor and RT cores all work in the new GPU's favor. This, coupled with Nvidia's new raster and RT processing pipelines, seem to give Nvidia's latest mainstream gaming GPU a shot in the arm in terms of performance.
The Nvidia GeForce RTX 4080 Founders Edition is a true generational upgrade over Ampere, with significant performance improvements, excellent thermals, and low power consumption. However, the current US$1,200 pricing deters mass adoption.”
The RTX 4080 FE puts up a good show in synthetic, compute, and gaming benchmarks, though you will have to ensure that the system is not bottlenecked in any manner to get the maximum out of this card. Although Nvidia is pitching this as an RTX 3080 Ti successor, there is enough performance to leave both the RTX 3090 Ti and AMD Radeon RX 6950 XT well behind.
The card also leverages the same cooling system as that of the RTX 4090 FE. This results in excellent thermal and noise characteristics, which AiB cards may not always match. The RTX 4080's 12VHPWR connector has been largely uneventful as well.
However, not all is well with the RTX 4080 FE. The main dissuasion from wholeheartedly recommending this card is the current US$1,200 MSRP. This is a card that should have ideally launched for less than US$1,000. Perhaps, matching the RTX 3080 12 GB's US$799 MSRP, or even a US$899 tag, would have made it a venerable price-performance powerhouse.
The AMD Radeon RX 7900 XTX is all set to become available for US$999 MSRP in the coming weeks, and Team Red considers the RTX 4080 as Navi 31's primary competition. The AMD camp also offers added niceties such as higher VRAM capacities, faster memory bus, and even DisplayPort 2.1 ports.
With the crypto mining craze not yet known to affect the pricing of this GPU generation, gamers looking to upgrade are in a quagmire. On the one hand, splurging US$1,200 on the RTX 4080 FE or even higher for partner cards does not make much economic sense while on the other, the RTX 4090 is either sold out or selling at inflated prices. Also, it is not hard to guess that Nvidia will eventually offer an RTX 4080 Ti down the line.
Consequentially, retailers now seem to have an excess of RTX 4080 stock, while the RTX 4090 is hard to come by. Nvidia can be expected to cut prices depending on how the competition performs, so it helps to see what the AMD camp has to offer as well.
The RTX 4080 performs wonderfully well, no doubt, but we recommend waiting a bit before spending your hard-earned dough on this card.
Price and Availability
The Nvidia GeForce RTX 4080 Founders Edition is available for US$1,199.99 from retailers such as Best Buy, but stocks appear sold out at the time of writing. Partner cards are currently selling at prices that are close to the MSRP of the RTX 4090 Founders Edition.
In India, the RTX 4080 Founders Edition retails at ₹1,16,000 MSRP. RP Tech is the sole distributor of the RTX 4080 Founders Edition in India and has the card listed for ₹1,19,000. Predictably, the cards are out of stock and requires prospective buyers to join a waitlist.
Price comparison
