RTX 4080 review roundup suggests 33% faster 4K performance, 39% better perf/W, and 23% worse perf/price for the GPU vs RTX 3080 ↺
Nvidia put the RTX 4080 on sale on November 16, one day after reviews for the card went live. Just like it did with the RTX 4090 launch reviews, 3DCenter has published an RTX 4080 launch review roundup. The report includes a performance overlook for the GPU, power consumption figures, and price/performance ratio compared to other boards.
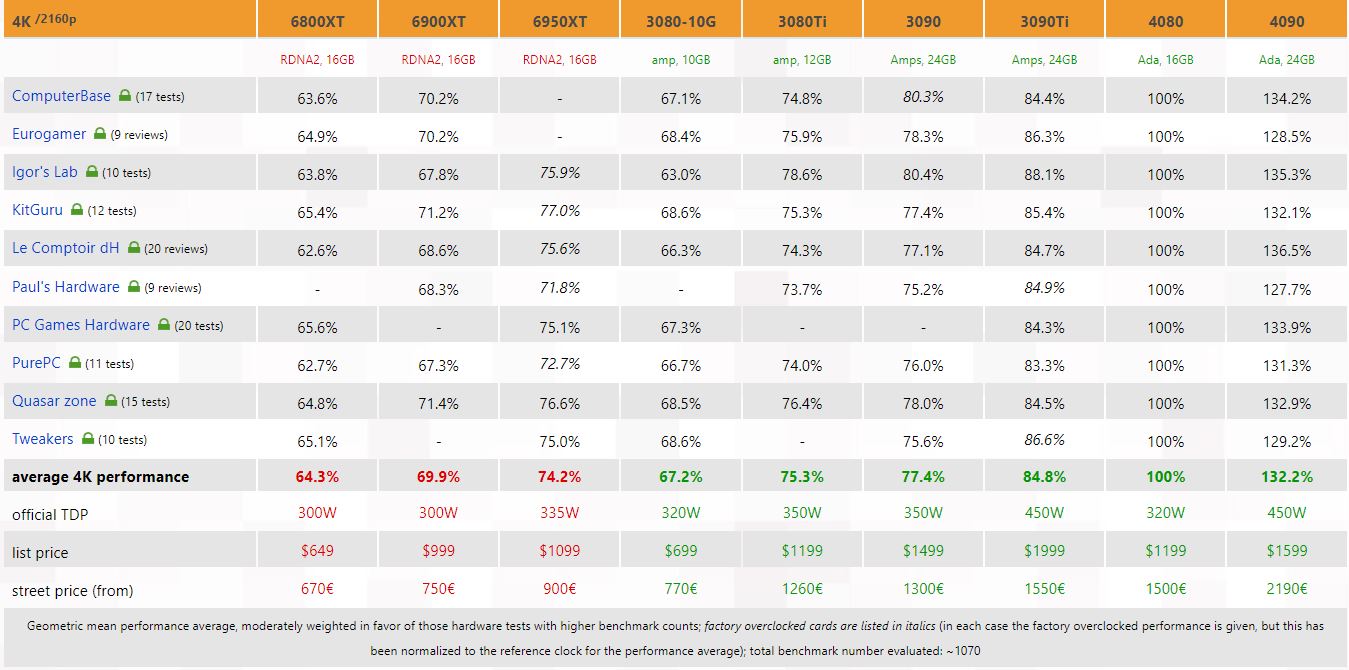
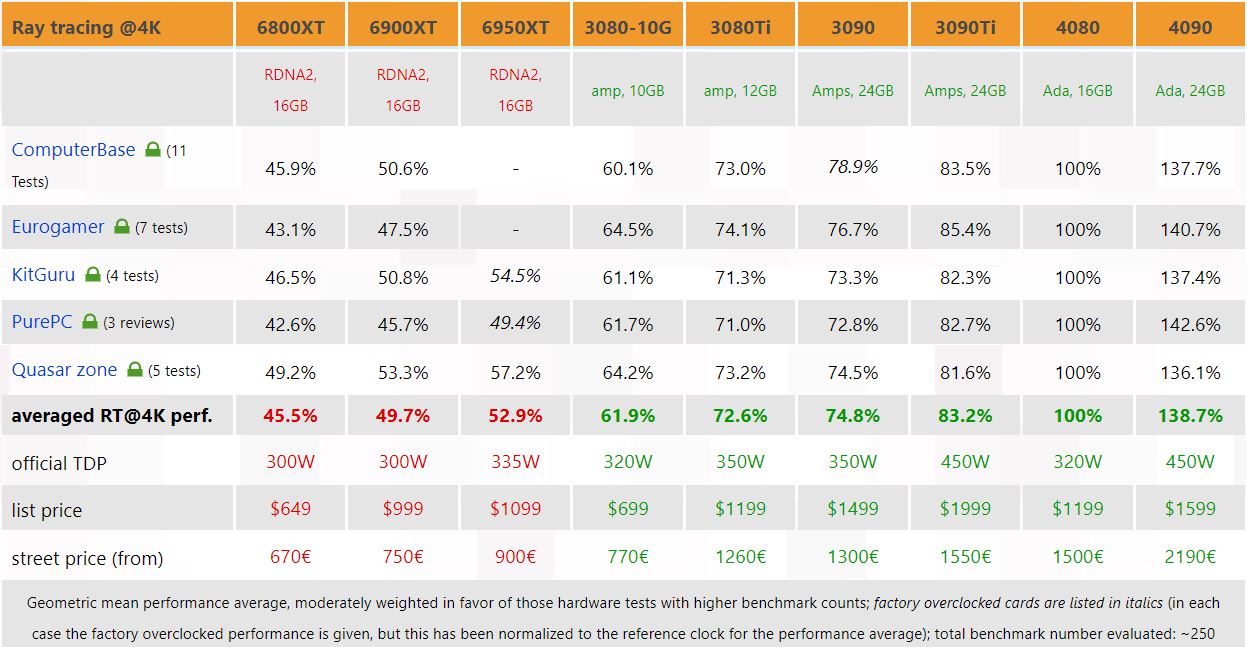
RTX 4080 4K rasterization and raytracing performance
Right off the bat, we can see from 3DCenter’s report that the RTX 4090 is, on average, 32.3% better than the RTX 4080 at 4K in rasterization. Considering the RTX 4080 has 68% fewer CUDA cores than the flagship Lovelace cards, a difference of only 32.3% is good news for the board.
Compared to the RTX 3090 Ti and the RTX 3090, the RTX 4080 is faster by an average of 15% and 23% respectively. RTX 4080’s lead over Ampere cards extends to 25% and 33% when pitted against the RTX 3080 Ti and the RTX 3080 respectively. Although, the RTX 4080's 25% average 4K performance uplift over the RTX 3080 Ti is respectable, we found an even bigger delta between the two GPUs in our review of the RTX 4080.
Finally, the RTX 4080 handily beats AMD’s strongest RDNA 2 cards. Team Green’s board is 26% ahead of the RX 6950 XT, 30% faster than the RX 6900 XT, and 36% ahead of the RX 6800 XT.
Moving on to raytracing at 4K, the RTX 4090 proves to be 39% better on average than the RTX 4090. However, the board comfortably trumps all previous Ampere and RDNA 2 GPUs in this regard.
For instance, the RTX 4080 vs RTX 3090 Ti raytracing comparison results in a 17% lead for the Lovelace board. The number shoots up to 25% when we measure the card against the RTX 3090. It is also no surprise that the RTX 4080 is significantly speedier in raytracing than the Radeon RX 6950 XT and the RX 6900 XT as it commands a 47% and 50% lead over the respective AMD boards.
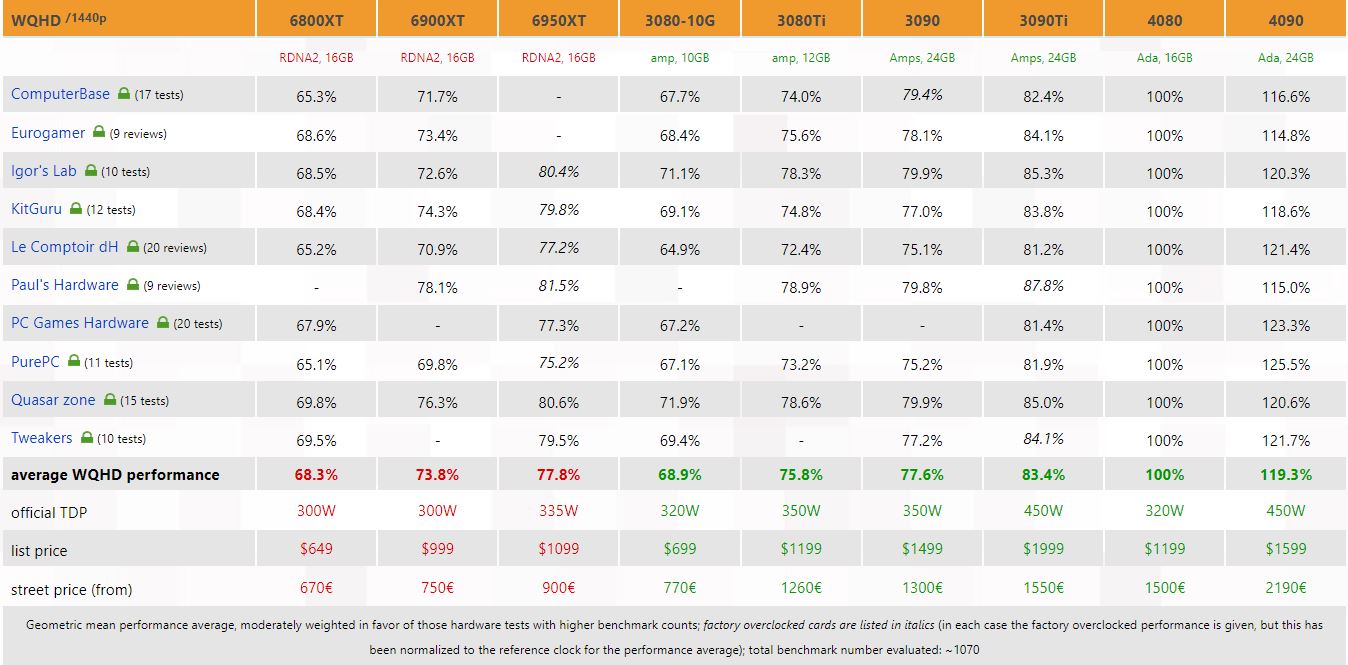
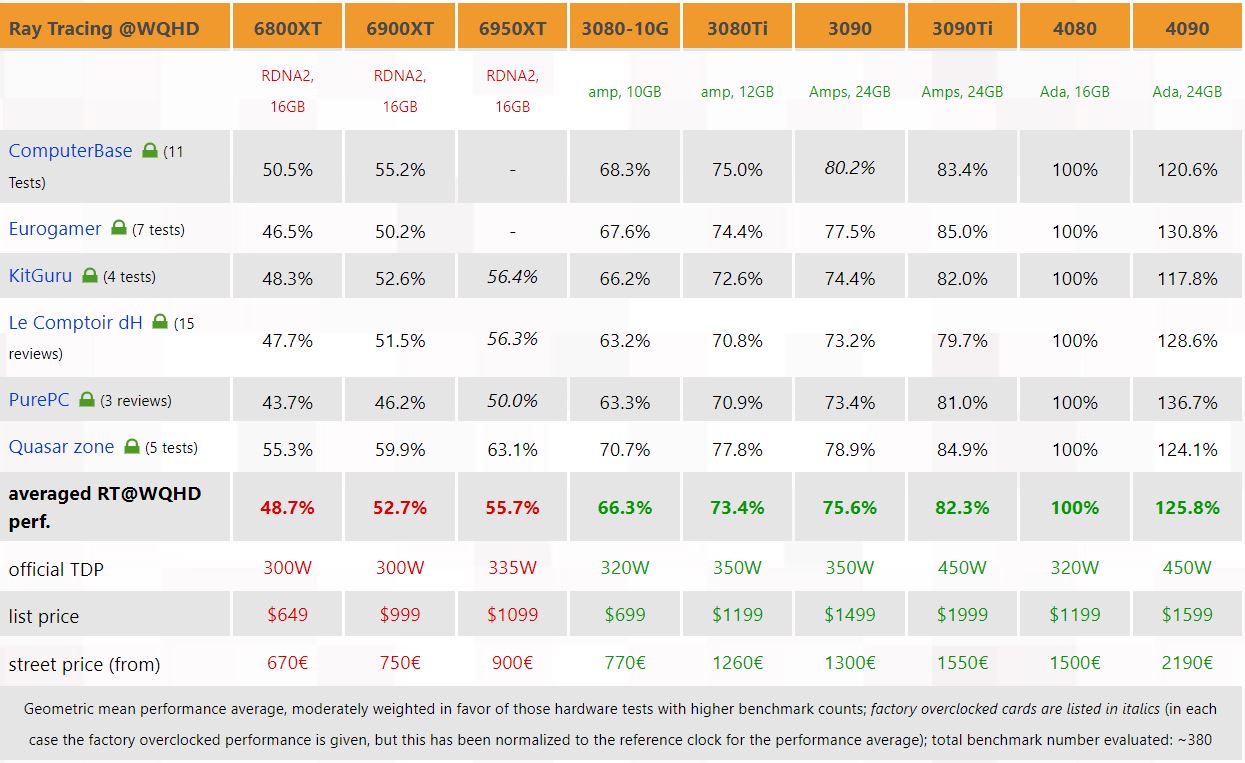
RTX 4080 WQHD rasterization and raytracing performance
While the RTX 4080 is also quite good at WQHD (1440p), the performance delta between the GPU and offerings from Nvidia and AMD shrinks a bit. For instance, where the RTX 4090 was 32.3% faster than the RTX 4080 at 4K, the difference shrinks to only 19% and reasonably so. As we lower the resolution, games become more and more CPU bound.
Moving on to the average WQHD rasterization performance of the RTX 3090 Ti and the RTX 3090, The RTX 4080 comes out to be 17% and 22% ahead of the Ampere boards respectively. When we compare the RTX 4080 to the RX 6950 XT and the RX 6900 XT, Nvidia’s champion proves to be 22% speedier than the RX 6950 XT and 26% more performant than the RX 6900 XT.
Similar to rasterization, raytracing figures at WQHD also take a hit. RTX 4090’s raytracing lead over the RTX 4080 clocks in at 26%, a marked departure from the 39% lead that the former enjoyed at 4K. The RTX 4080 performance bump over the RTX 3090 Ti and the RTX 3090 also sees a marginal reduction with the card now 18% and 24% ahead of the respective Ampere boards.
Finally, the RX 6950 XT and the RX 6900 XT manage to close the RT gap a bit at WQHD with an average delta of 44% and 47% respectively.
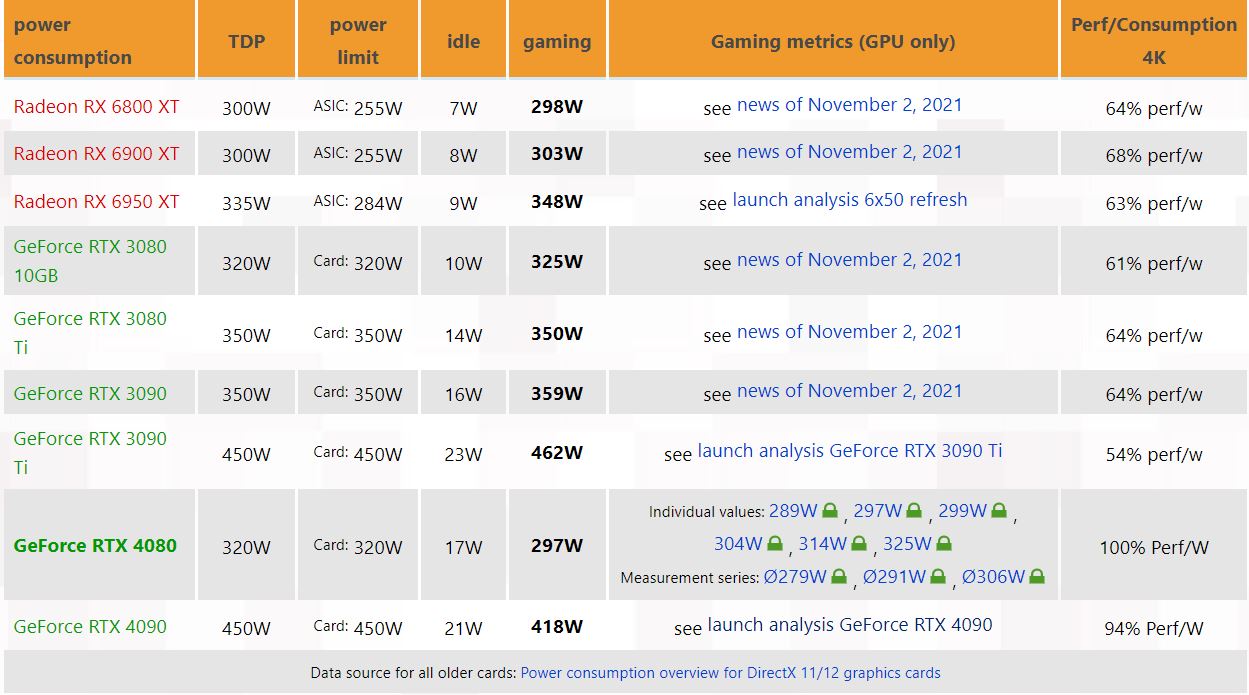
RTX 4080 power consumption
While Nvidia’s RTX 30 series GPUs have a reputation for using considerably more power than their AMD counterparts, the RTX 4080 reportedly improves upon the power consumption of its predecessors by a significant margin. For instance, where the RTX 3080 appears to consume 325 W according to 3DCenter’s report, the RTX 4080 only uses about 297 W in 4K gaming workloads. Remember that the rated TDP of the RTX 4080 is 320 W. In other words, the board is using considerably less power than what it was rated for resulting in astonishing performance/watt figures.
At 4K, the RTX 4080 has an excellent 46% better perf/W than the RTX 3090 Ti (462W consumption). The number decreases to a still worthy 36% vs the RTX 3090 which consumes 359 W on average. Compared to the RDNA 2 RX 6950 XT, RX 6900 XT, and RX 6800 XT with power usages of 348 W, 303 W, and 298 W respectively, the RTX 4080 provides a 37%, 32%, and 36% improvement in perf/W to corresponding AMD boards.
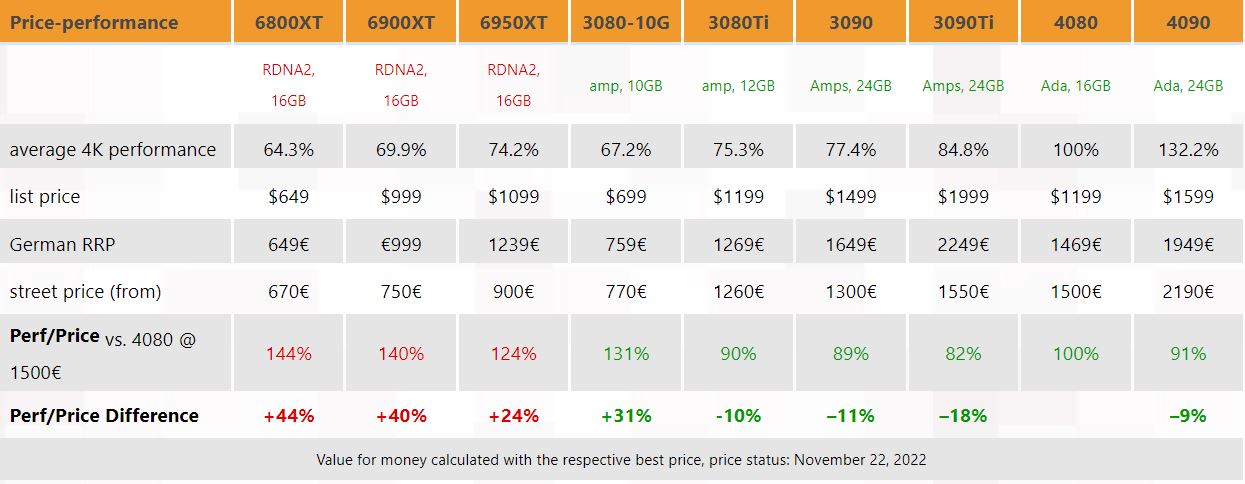
RTX 4080 perf/price ratio
Per 3DCenter, the perf/price ratio is where the RTX 4080 starts to seem like a bad deal. Based on the €1,500 German street pricing of the RTX 4080, the GPU has only 9% better perf/price vs the RTX 4090. This is primarily because of the RTX 4090’s high price tag. Things appear to fall apart for the Lovelace board when compared to its direct predecessor, the RTX 3080.
The RTX 3080 offers better perf/price than the RTX 4080 by being 31% more economical even though the Ampere GPU is 48% slower at 4K on average. So, the RTX 4080 doesn’t seem like an upgrade at all if we consider the card based purely on its launch pricing vs the card it is replacing.
Buy the ZOTAC Gaming GeForce RTX 3080 Trinity OC LHR on Amazon
Source(s)
3DCenter, Teaser image: 3DCenter, Nvidia (edited)
