MSI GE72 7RE Apache Pro Notebook Review
The GE62 or the GE72 are the right choice for price-conscious buyers who definitely do not want to spend more than 2,000 Euros on a gaming notebook. We were among the first editorial offices which have taken a look at the current generation.
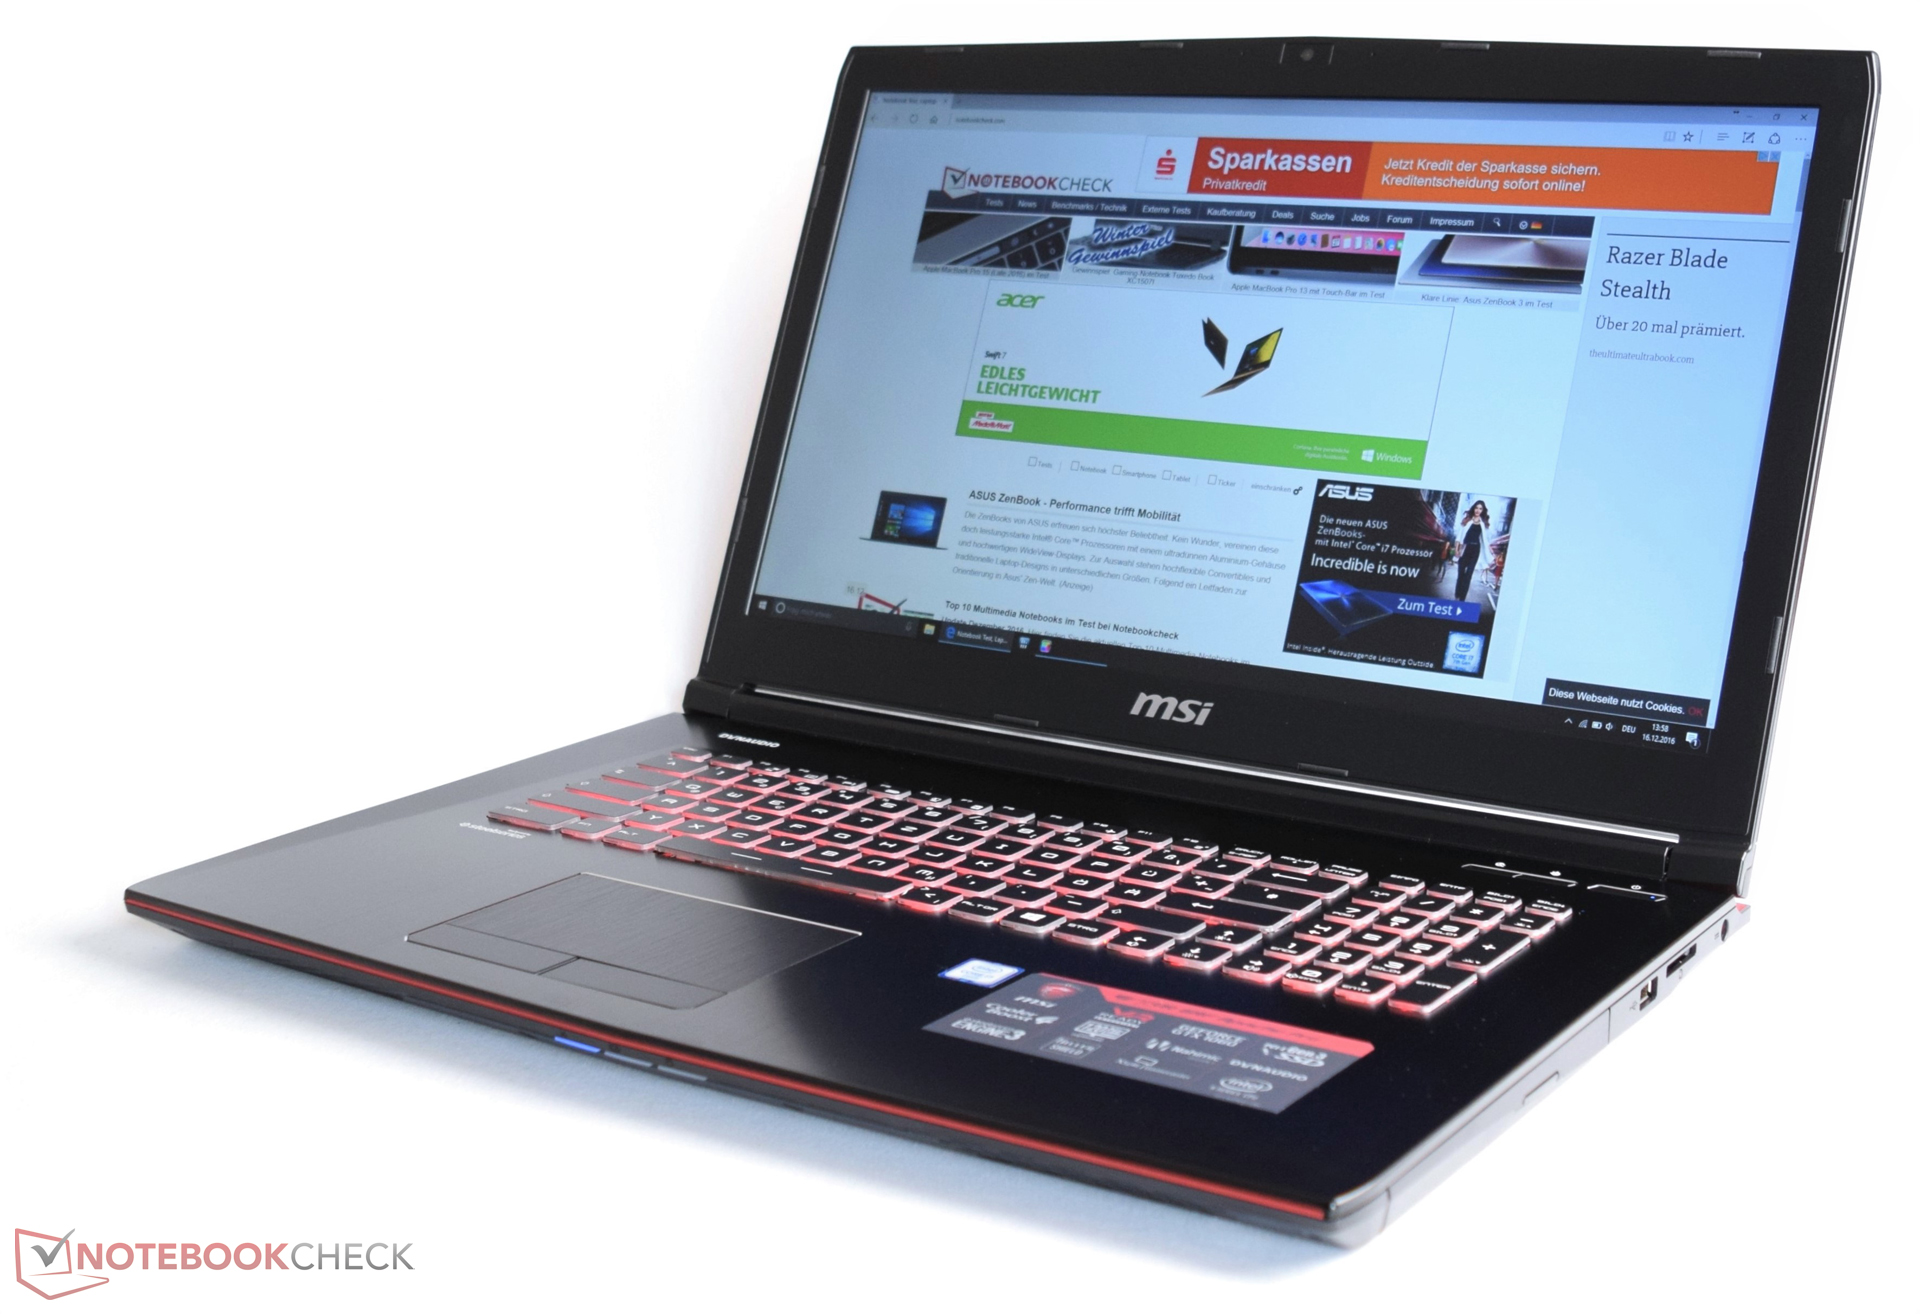
We started with the 17-inch model for about 1550 Euros in the GE72 7RE-046 variant, which can almost be considered a bargain when compared to other high-end laptops. Well, the GTX 1050 Ti is significantly slower than a GTX 1070 or GTX 1080, but will you ever need that much power in the Full HD range? We will answer this question in the course of this article.
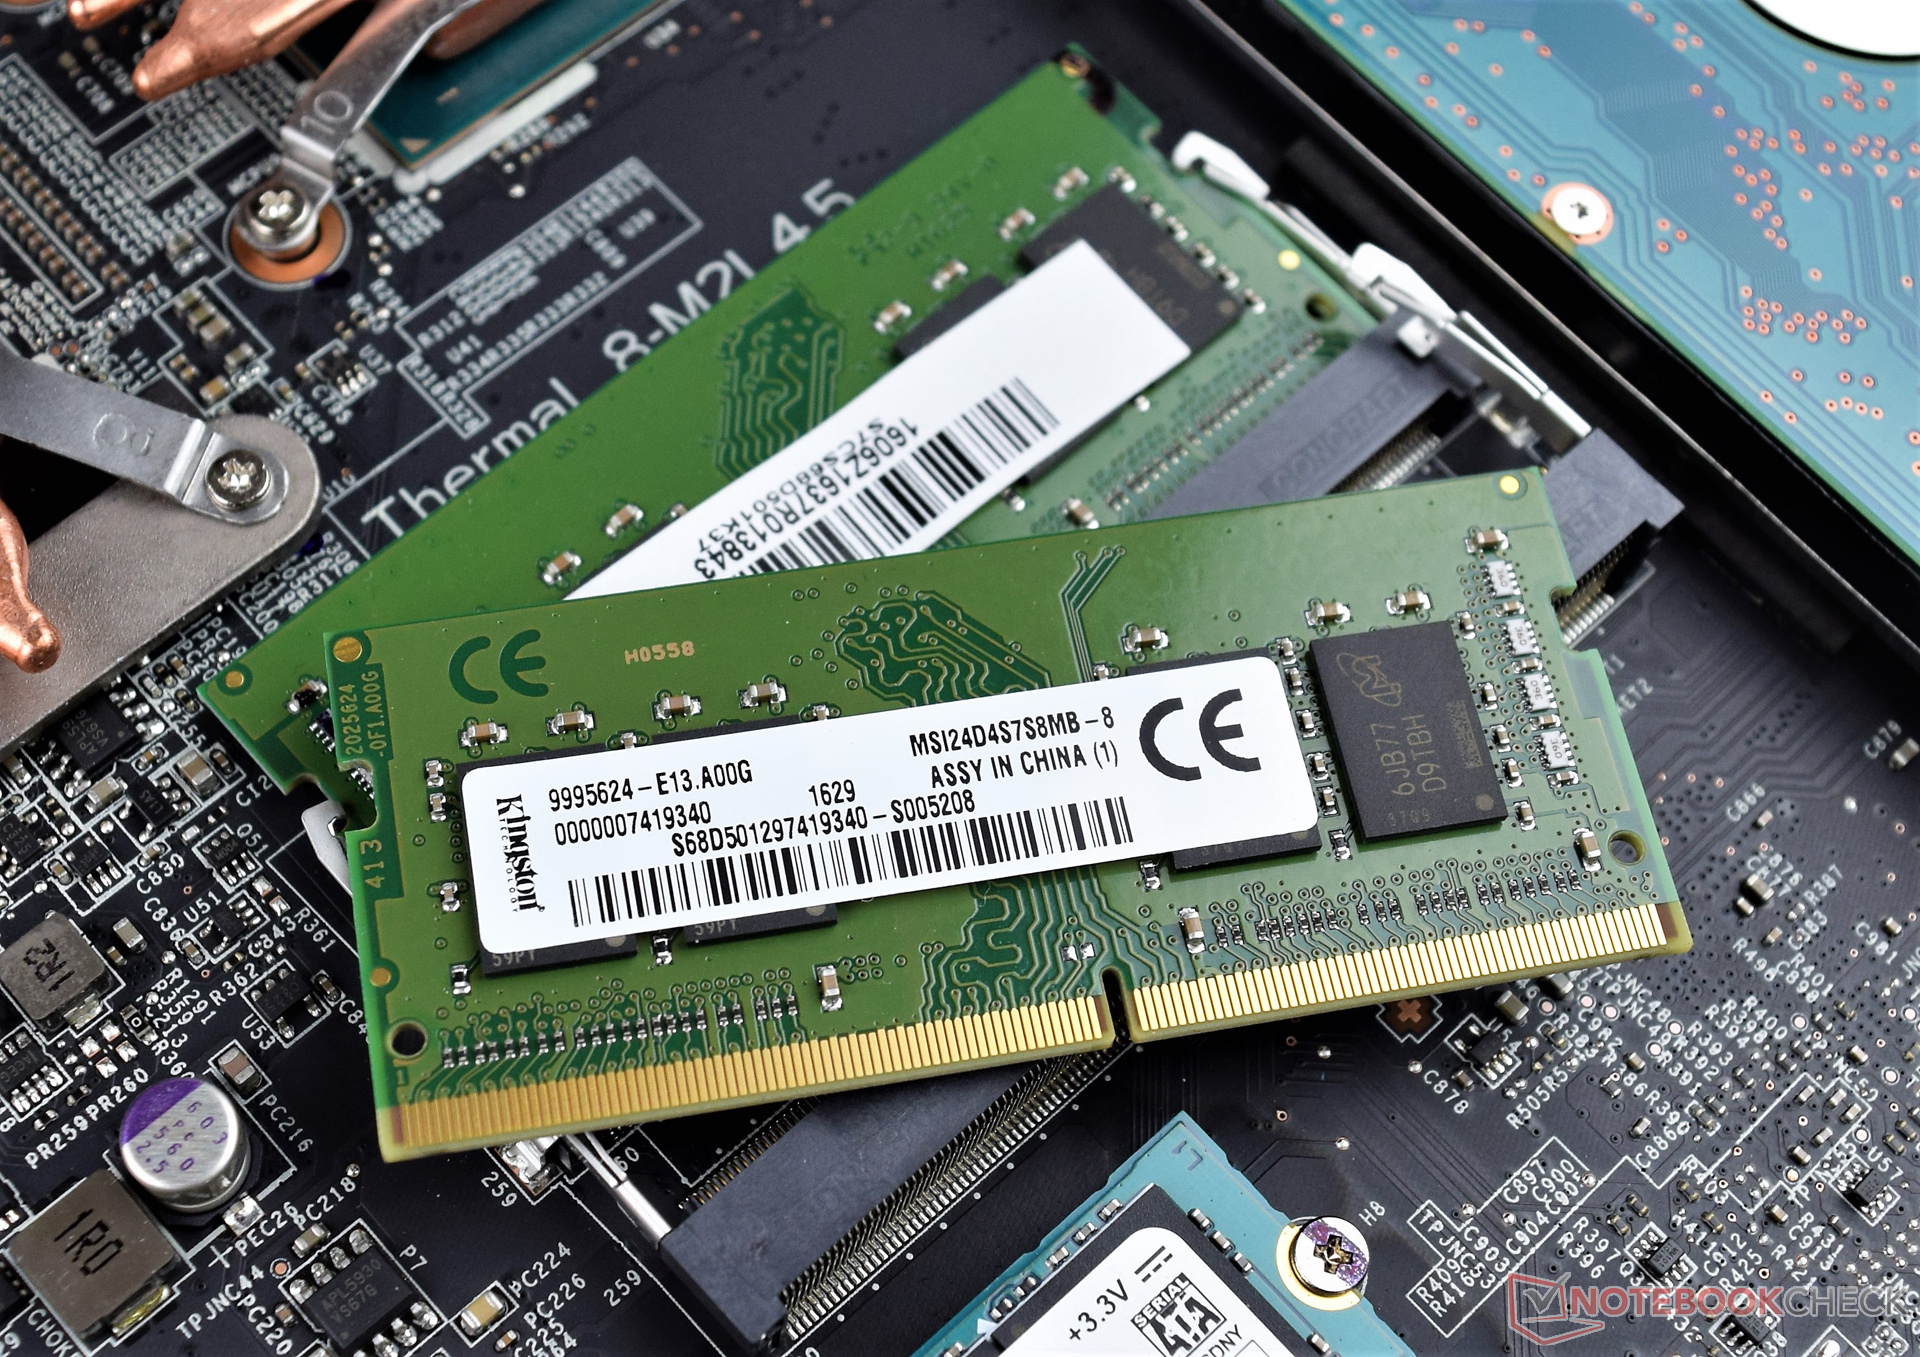
Apart from the GPU, the GE72 7RE-046 delivers almost everything gaming enthusiasts desire when buying a new model. 16 GB of DDR4 RAM and a combination of 256 GB SSD and 1 TB HDD should be sufficient for the coming 1-3 years. In our opinion, the display is particularly exciting. A 120-Hz model cannot even be taken for granted in significantly more expensive gaming bolides.
Due to its moderate weight of 2.98 kg, the GE72 belongs to the lighter 17-inch notebooks. In our opinion, the HP Omen 17, the Asus GL702VM, and the company's own MSI GS73VR 6RF belong to the main competitors. Most of them cost less than the initially mentioned 2000 Euros and use a GTX 1060 (apart from the HP). The Aorus X7 v6 with GTX 1070, which we also use for comparisons throughout the review, is significantly more expensive.
Changes
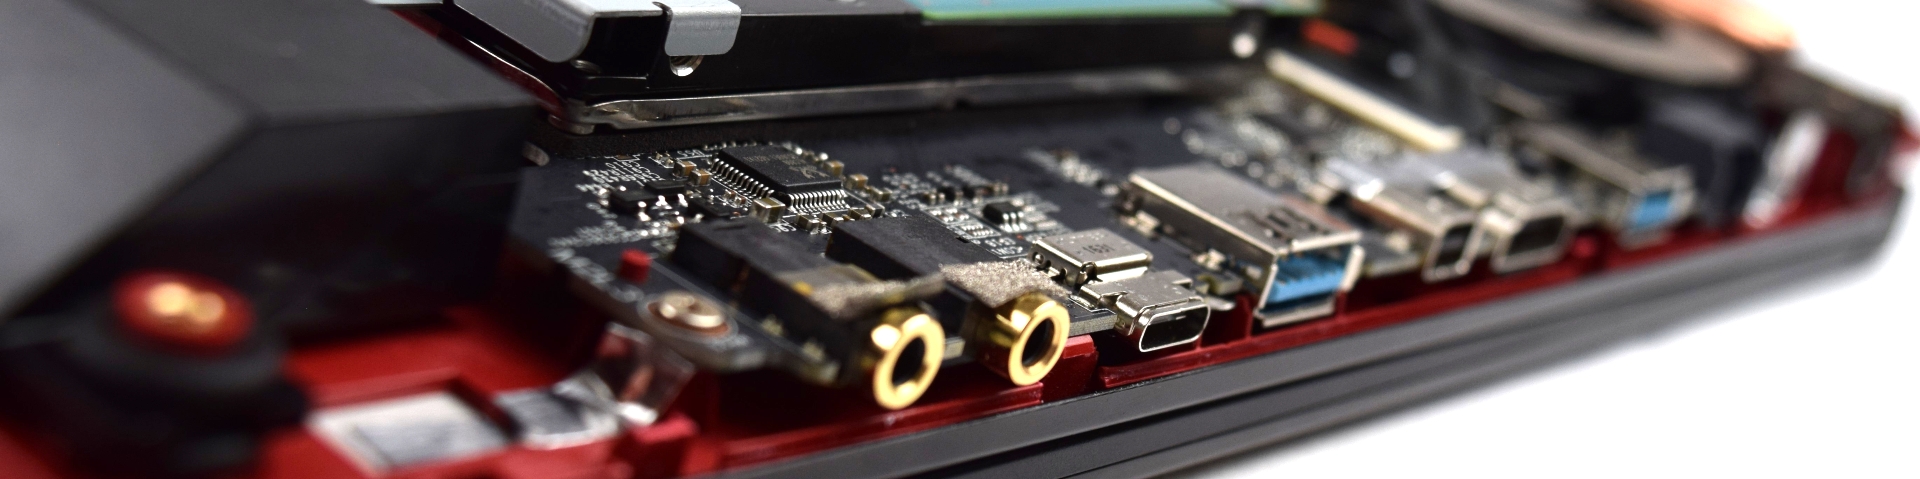
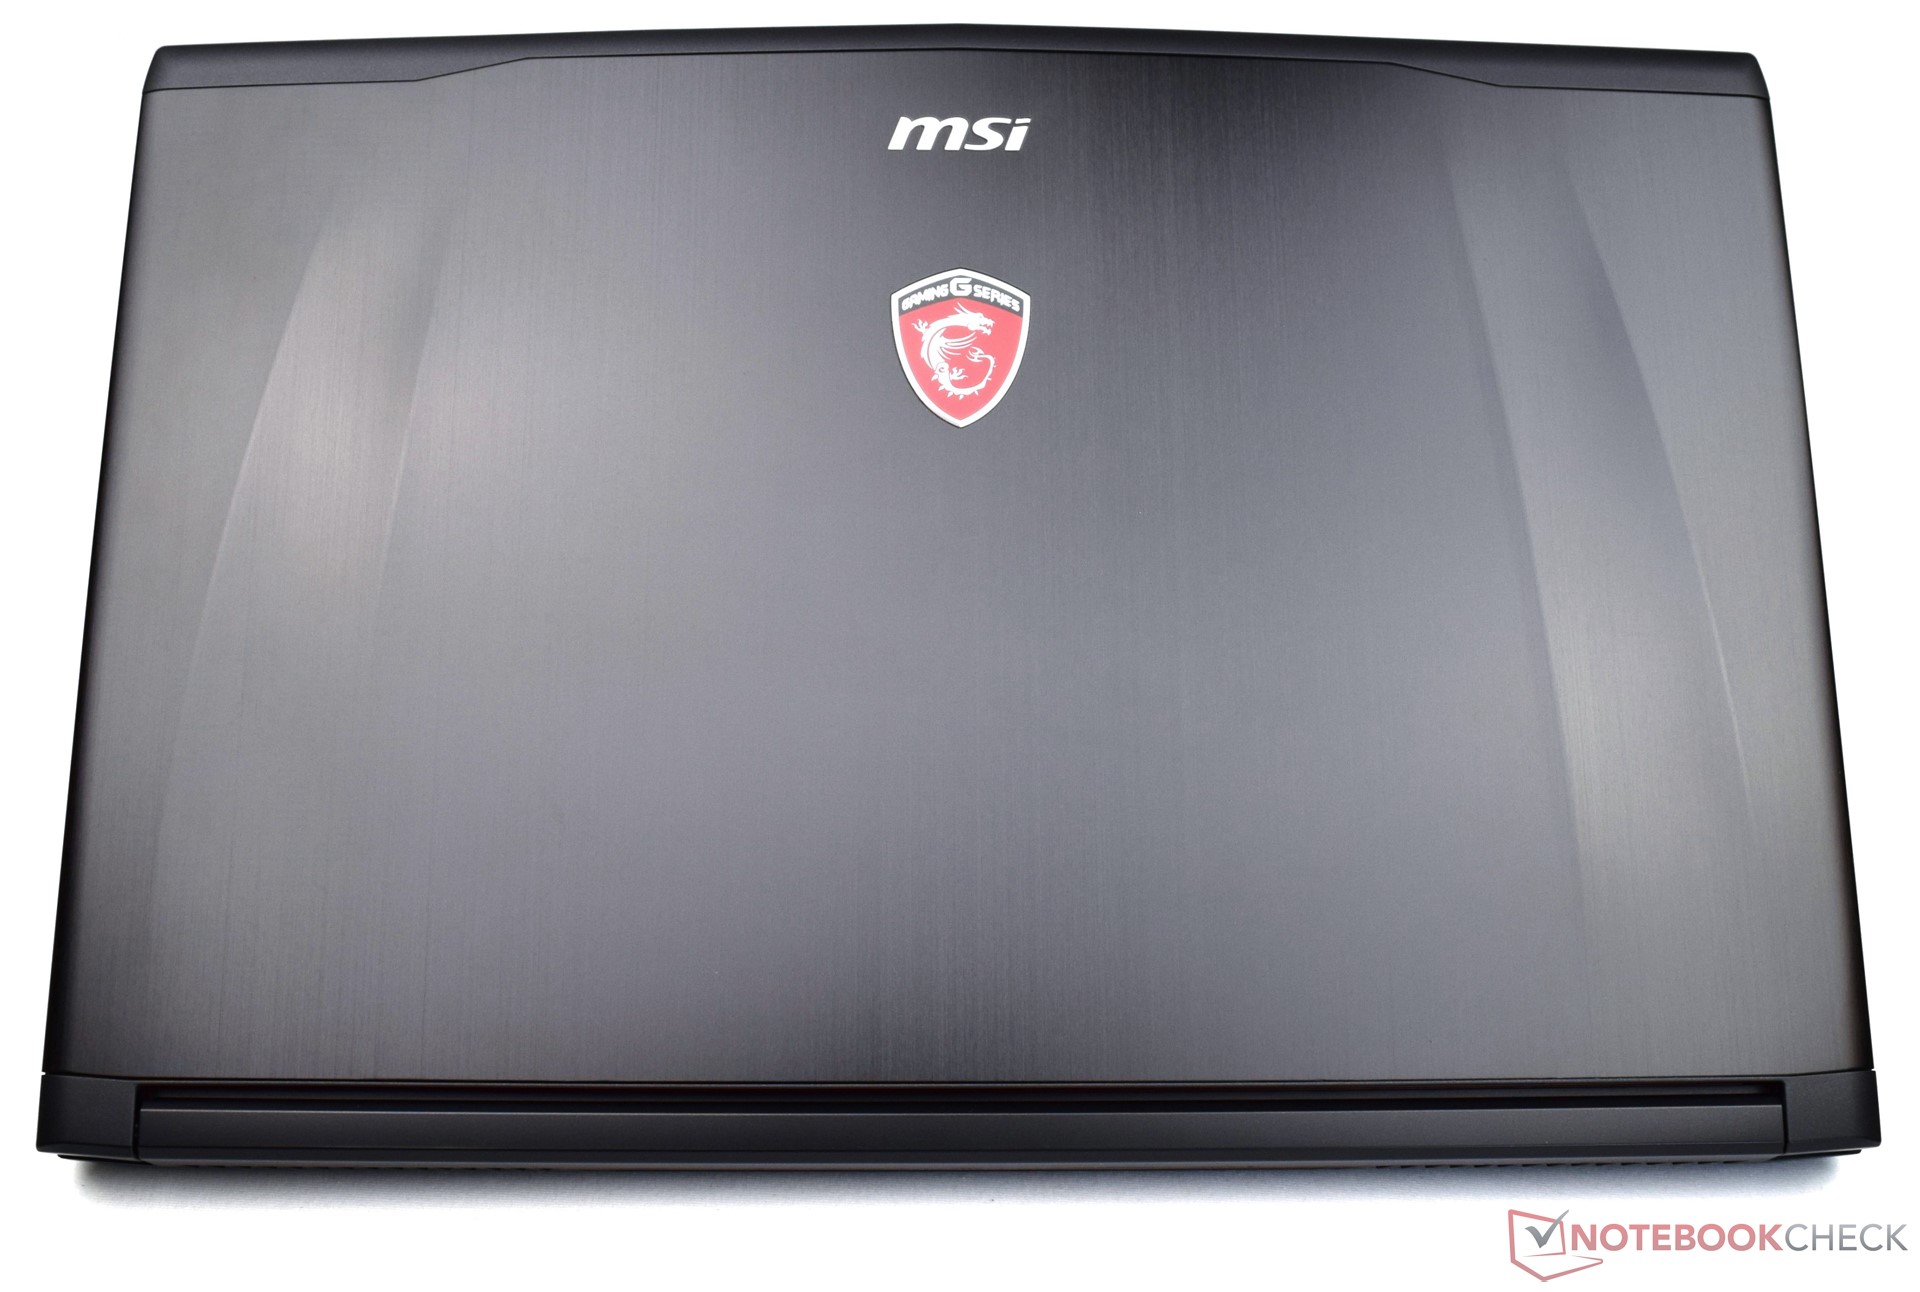
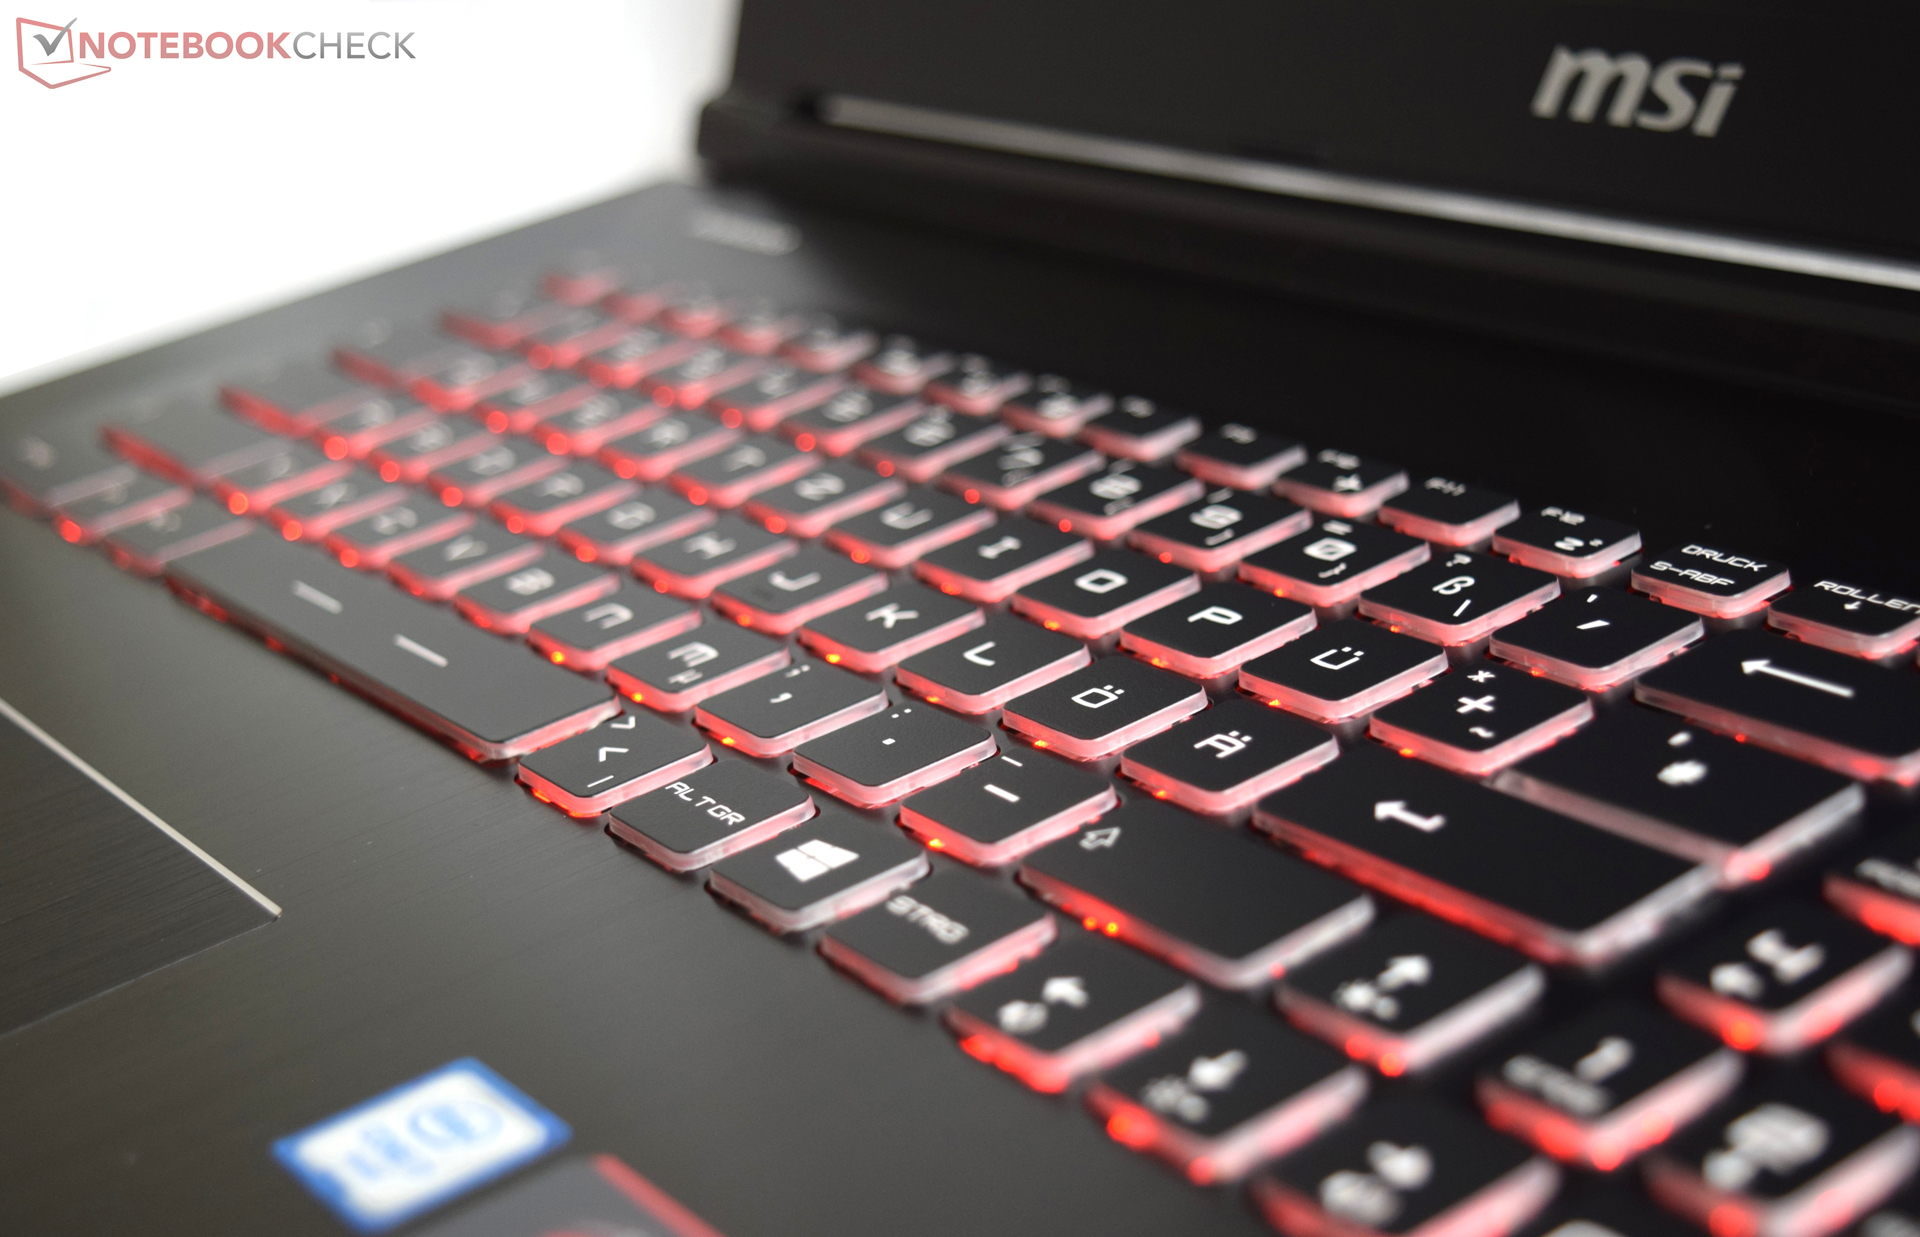
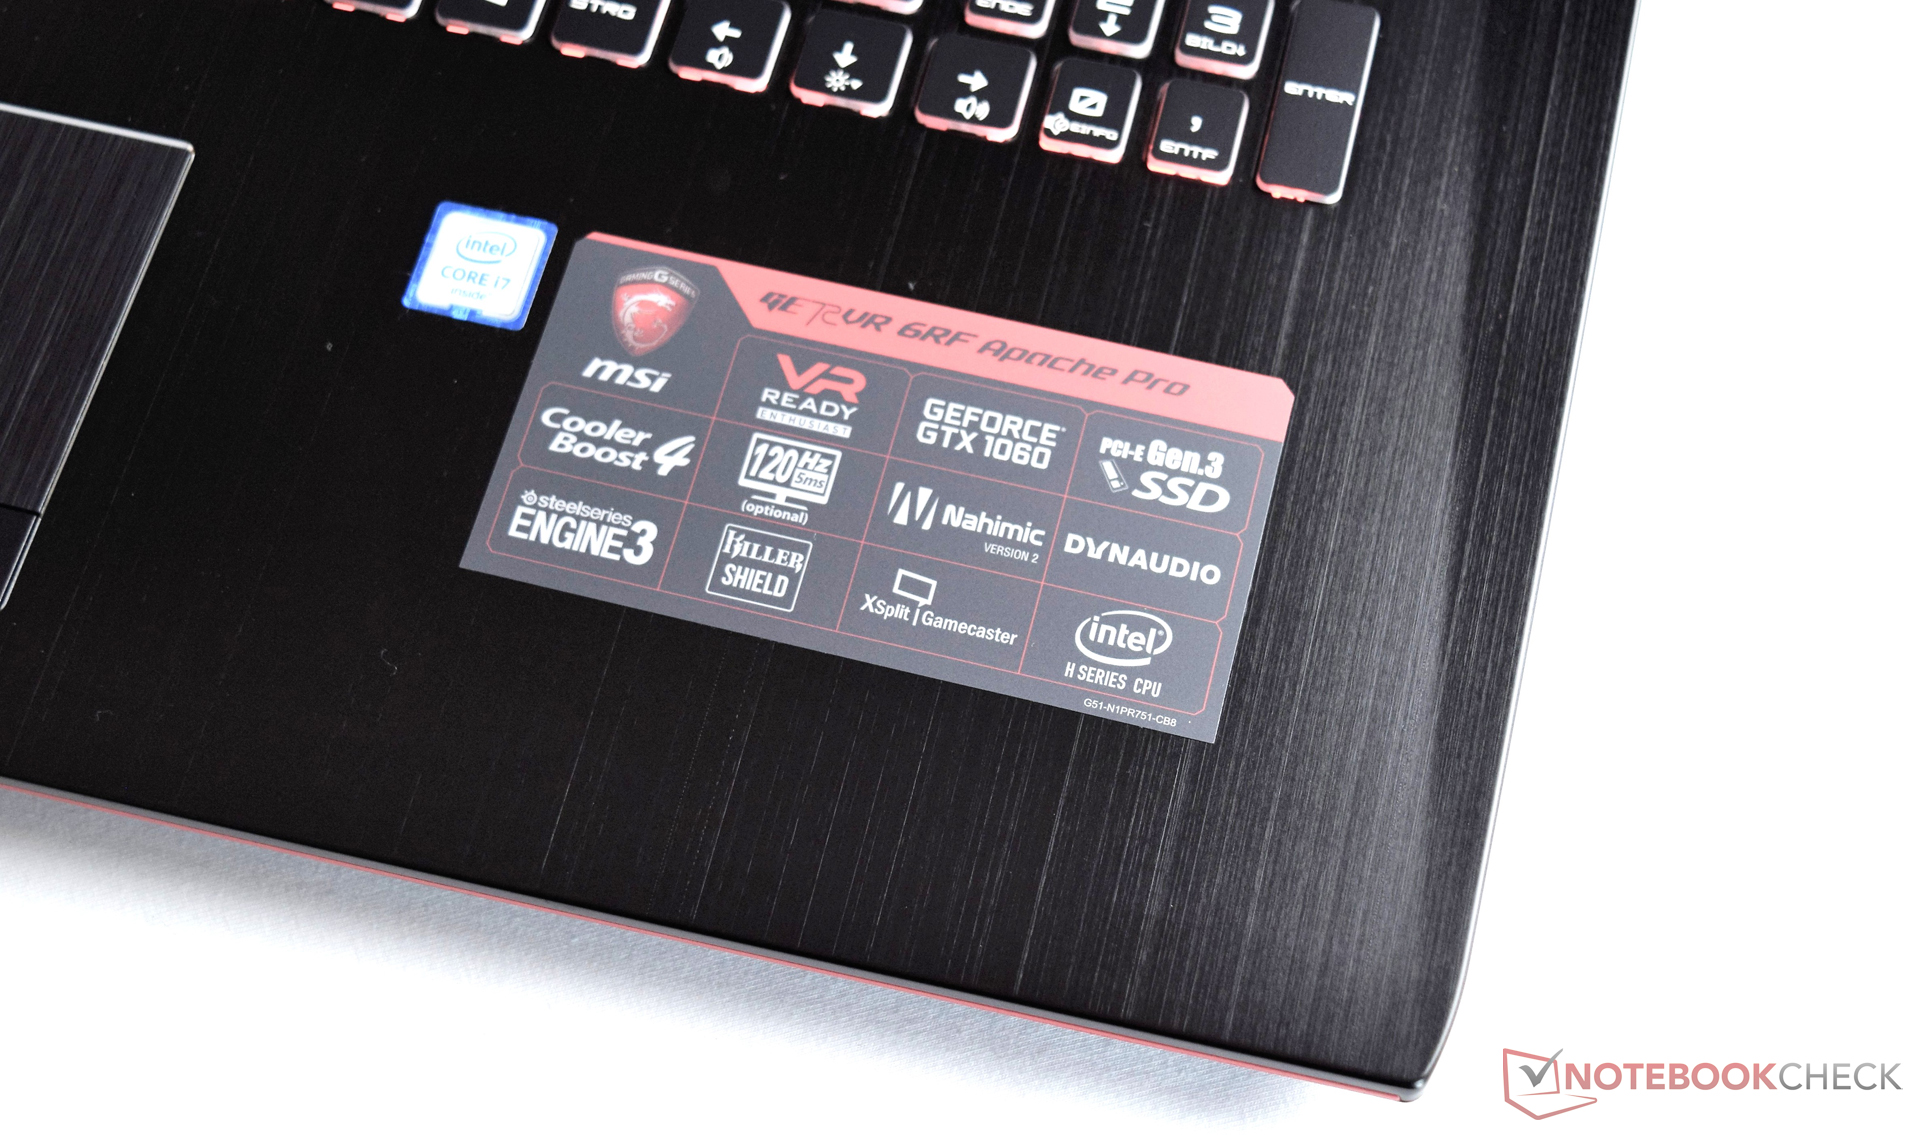
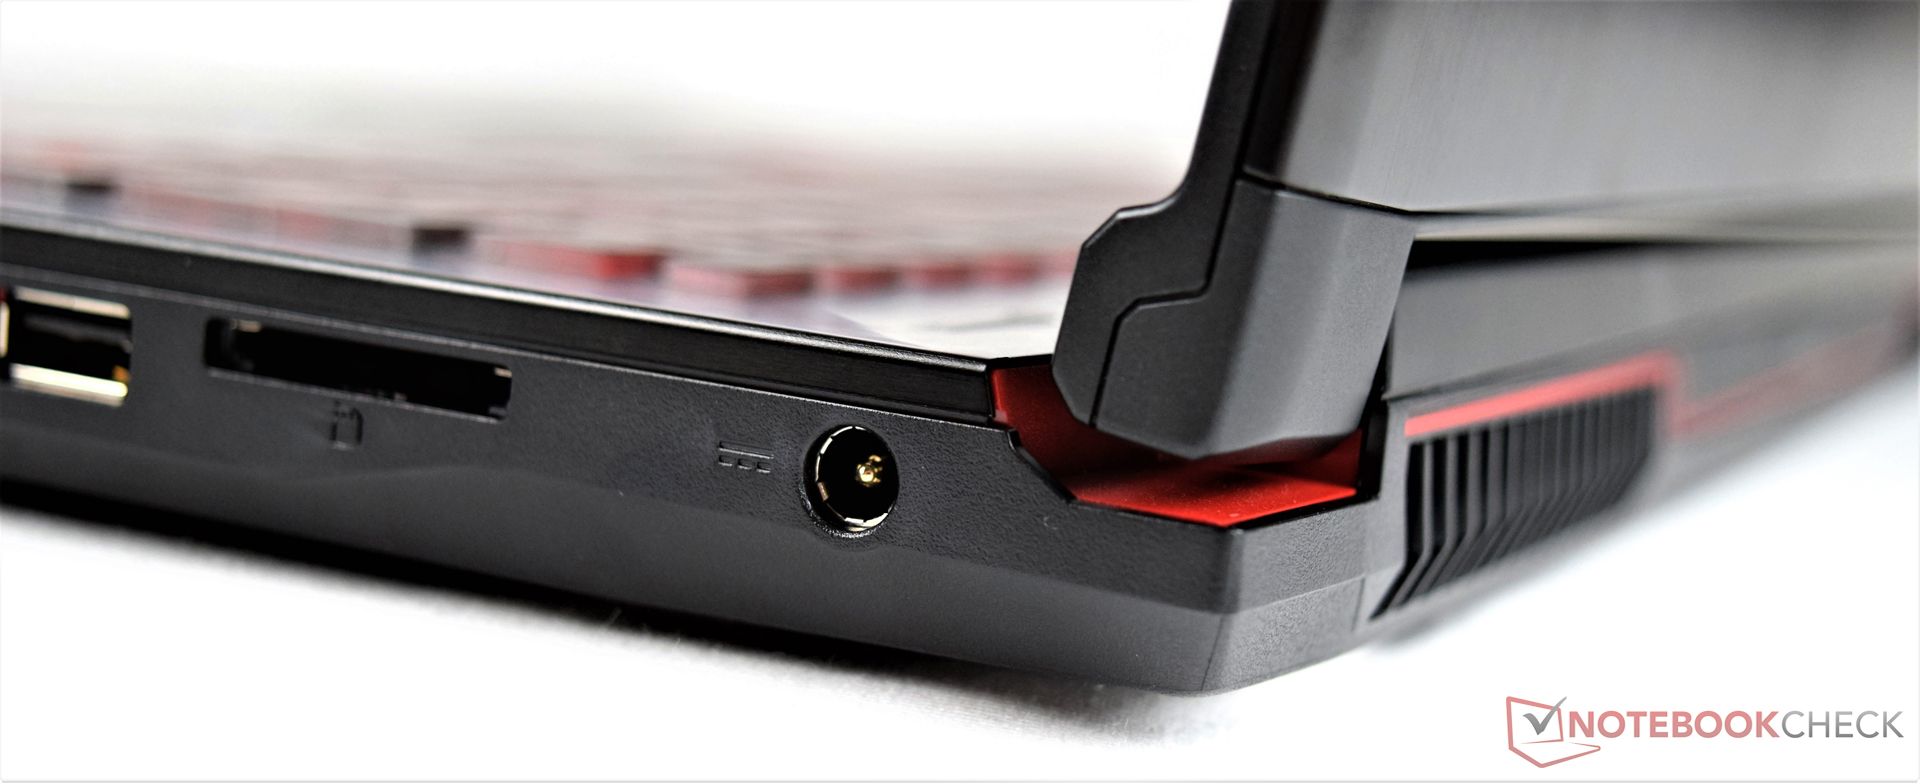
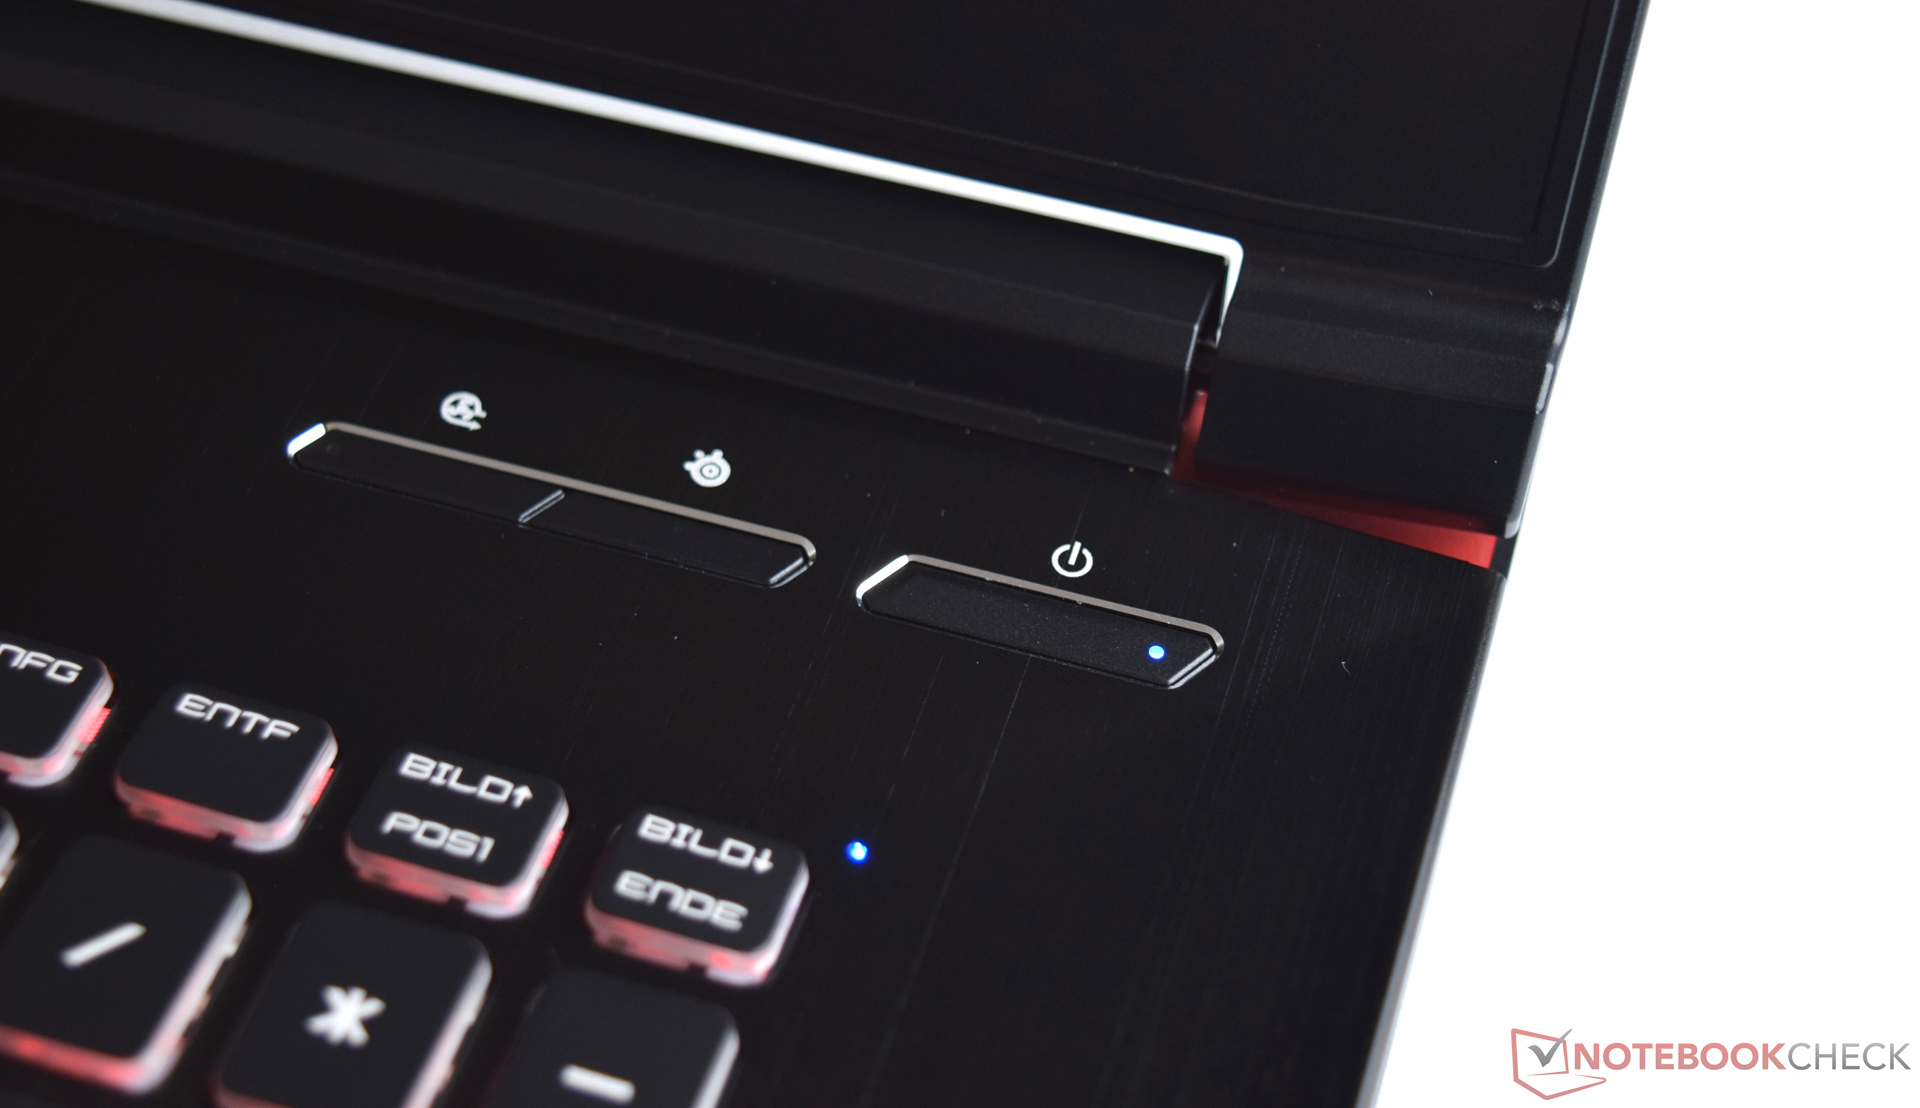
Changes are hard to find on the outside. The chassis did not change at all; expect for the stickers. Thus, we omit evaluating chassis, connectivity, and input devices and focus on the upgrades under the hood. Information about the missing aspects can be found in the recently reviewed GE72VR 6RF predecessor.
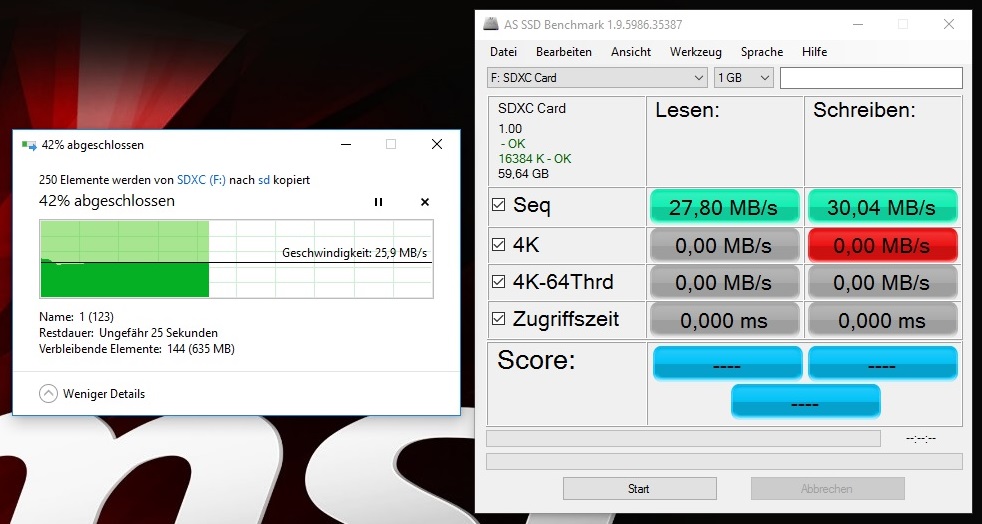
Btw., you should not expect too much from the card reader and the Wi-Fi module. While the first only runs at USB 2.0 speed, the Intel Wireless-AC 3168 partly performs significantly worse than the Wireless-AC 7265 (HP Omen 17) and the Killer Wireless-n/a/ac 1535 (Aorus X7 v6). This is not surprising since the AC 3168 only achieves a maximum of 433 Mbit/s according to Intel's homepage.
| SD Card Reader | |
| average JPG Copy Test (av. of 3 runs) | |
| Aorus X7 v6 | |
| HP Omen 17-w110ng | |
| Asus GL702VM-GC102D | |
| MSI GE72 7RE-046 | |
| MSI GS73VR 6RF | |
| maximum AS SSD Seq Read Test (1GB) | |
| HP Omen 17-w110ng | |
| Aorus X7 v6 | |
| Asus GL702VM-GC102D | |
| MSI GE72 7RE-046 | |
| MSI GS73VR 6RF | |
| Networking | |
| iperf3 transmit AX12 | |
| Aorus X7 v6 | |
| HP Omen 17-w110ng | |
| MSI GE72 7RE-046 | |
| iperf3 receive AX12 | |
| HP Omen 17-w110ng | |
| Aorus X7 v6 | |
| MSI GE72 7RE-046 | |
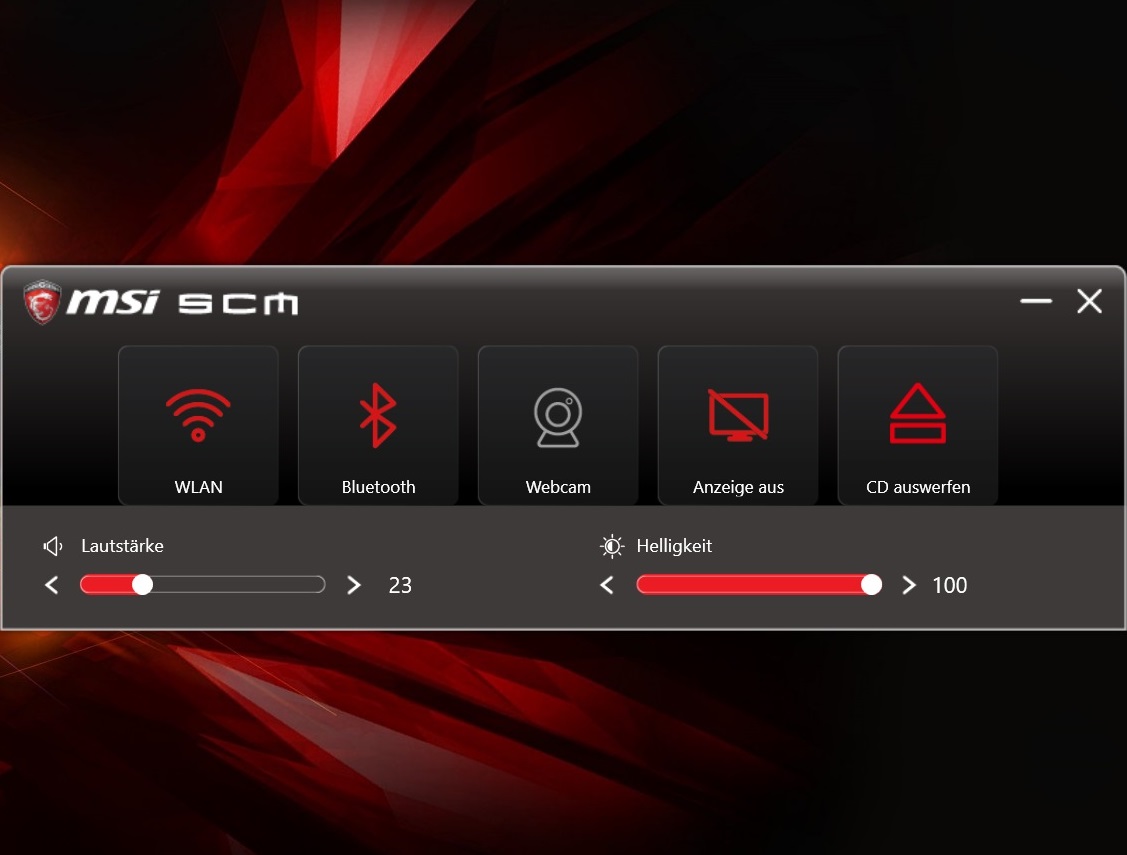
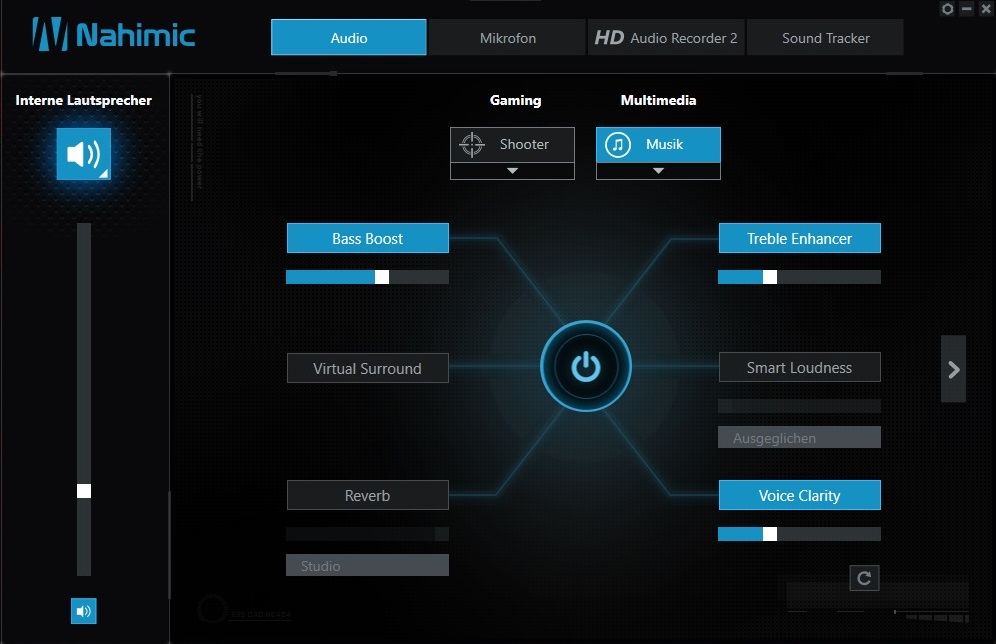
Software
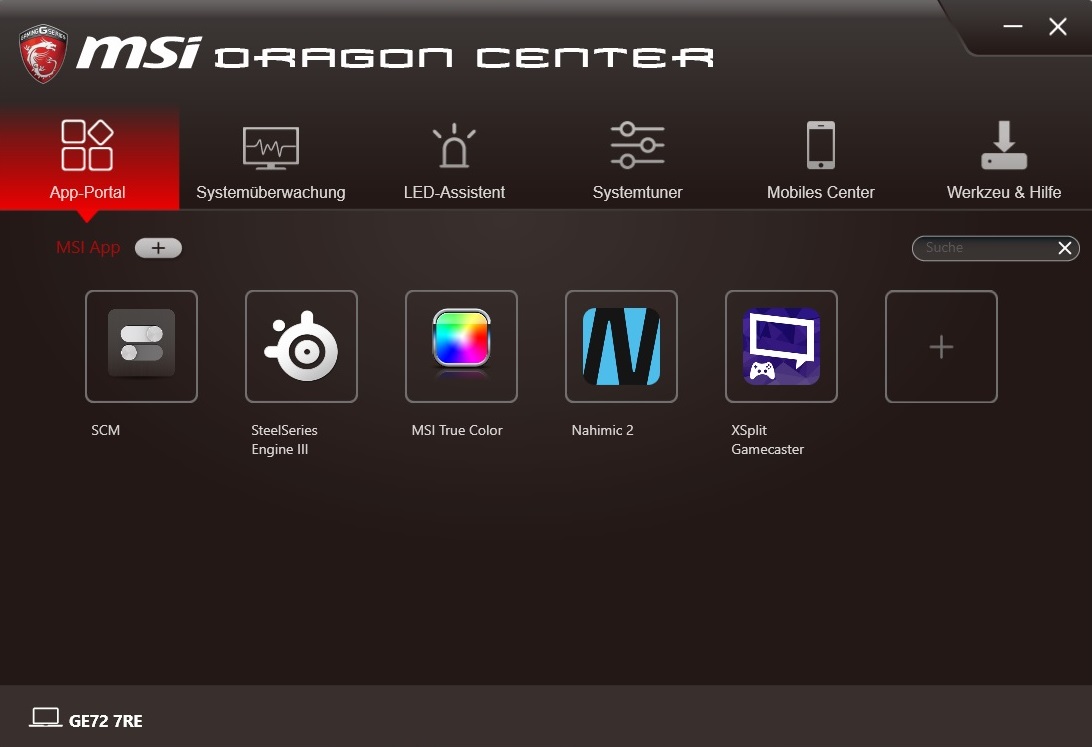
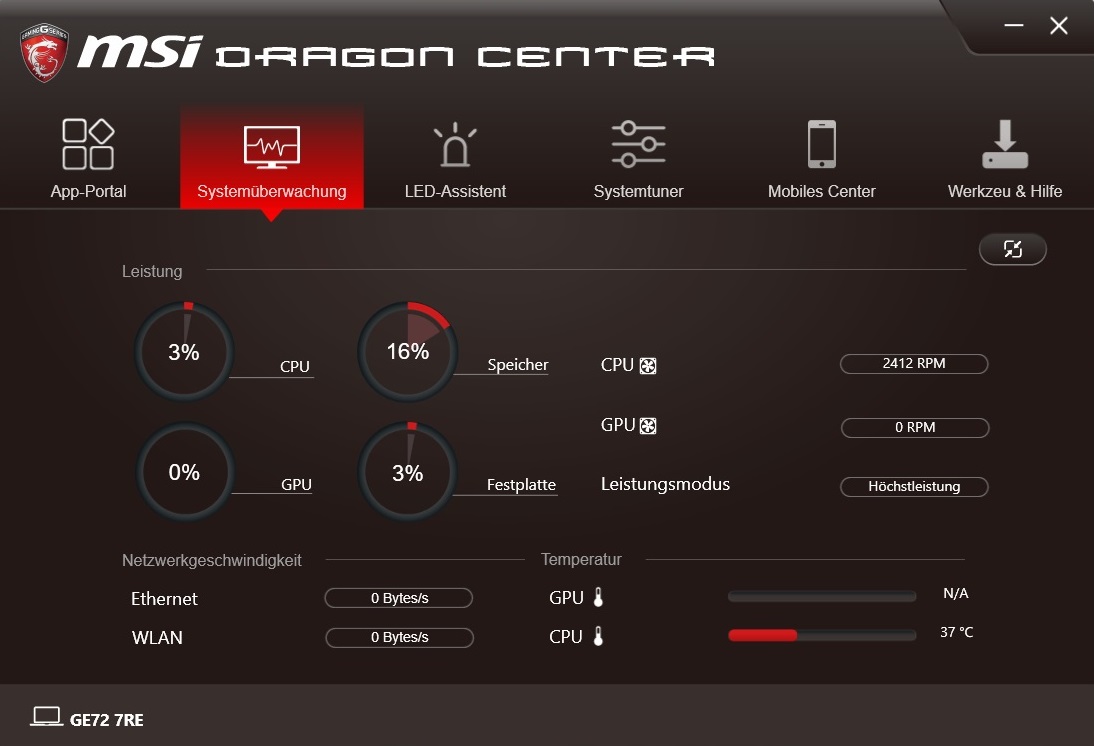
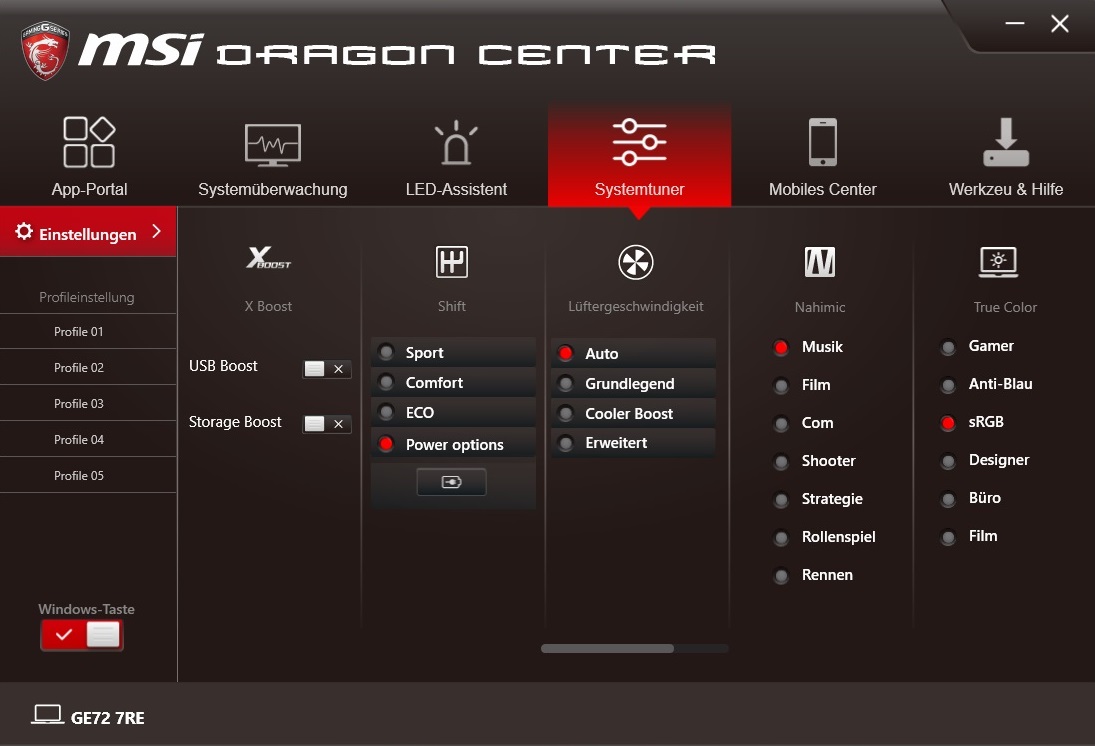
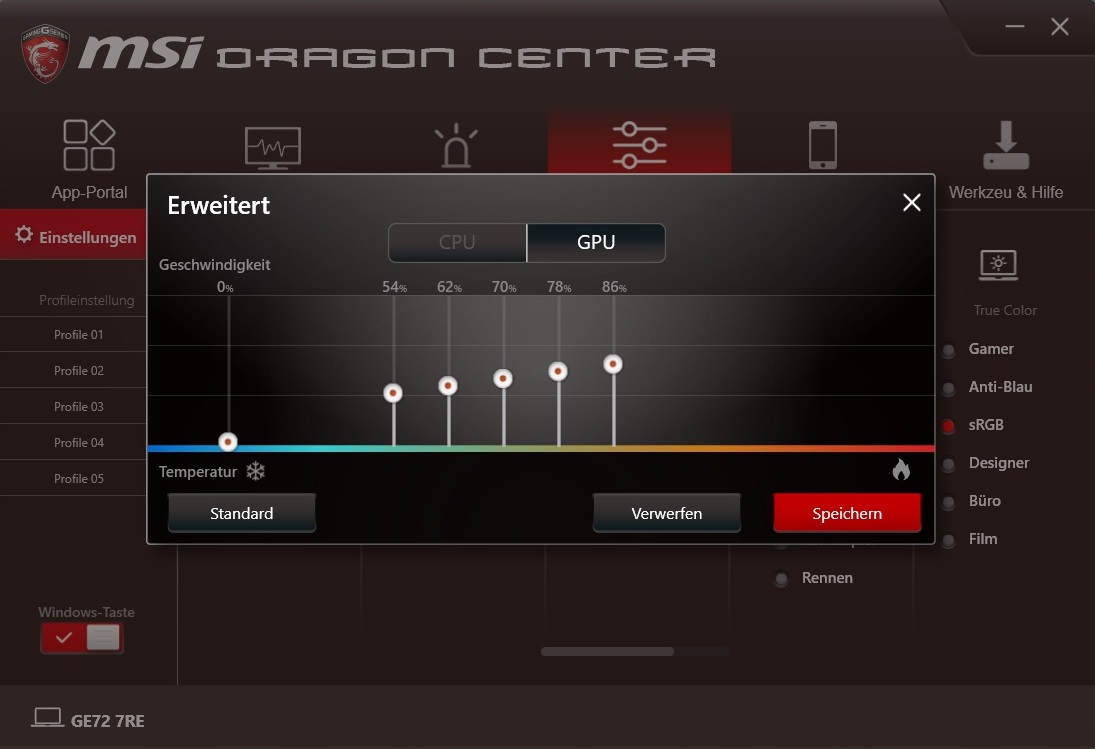
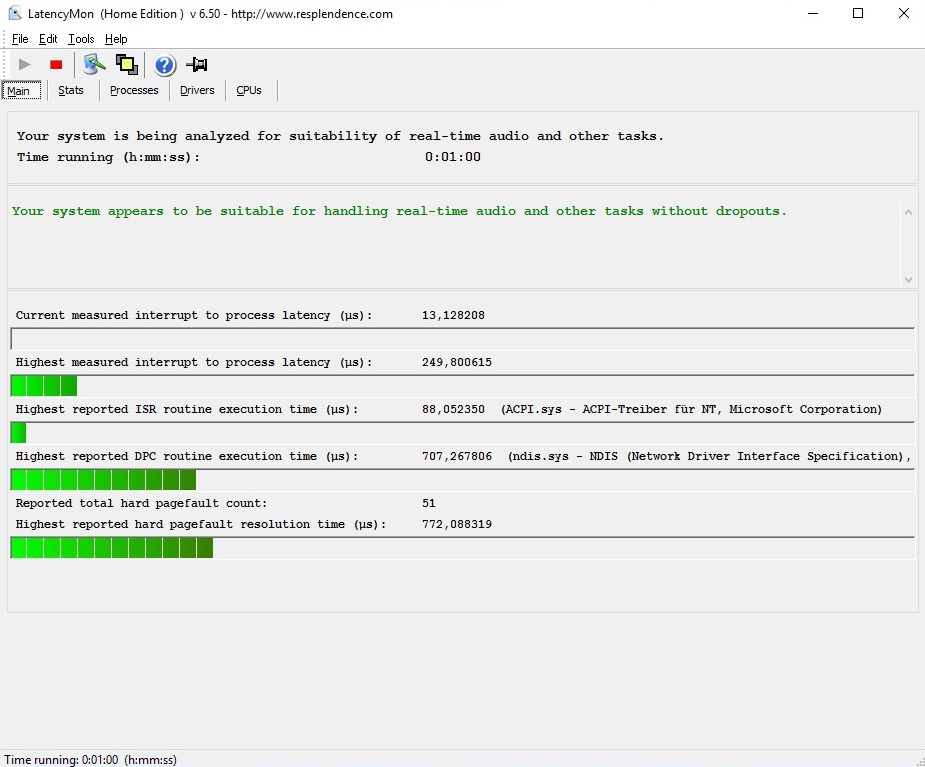
In the realm of software, we had to struggle with several problems (see also the GT73VR 7RF review, which was done at the same time). Even with the Shift mode of the Dragon Center set to »Power Options« (controls the clock rates according to the Windows power plan and not via MSI tool), the CPU always got stuck at its multi core level of 3.4 GHz and never reached its maximum single core turbo (3.8 GHz). At least the Core i7-7700HQ clocks perfectly down in the »ECO« and »Power Saver« modes for our idle measurements.
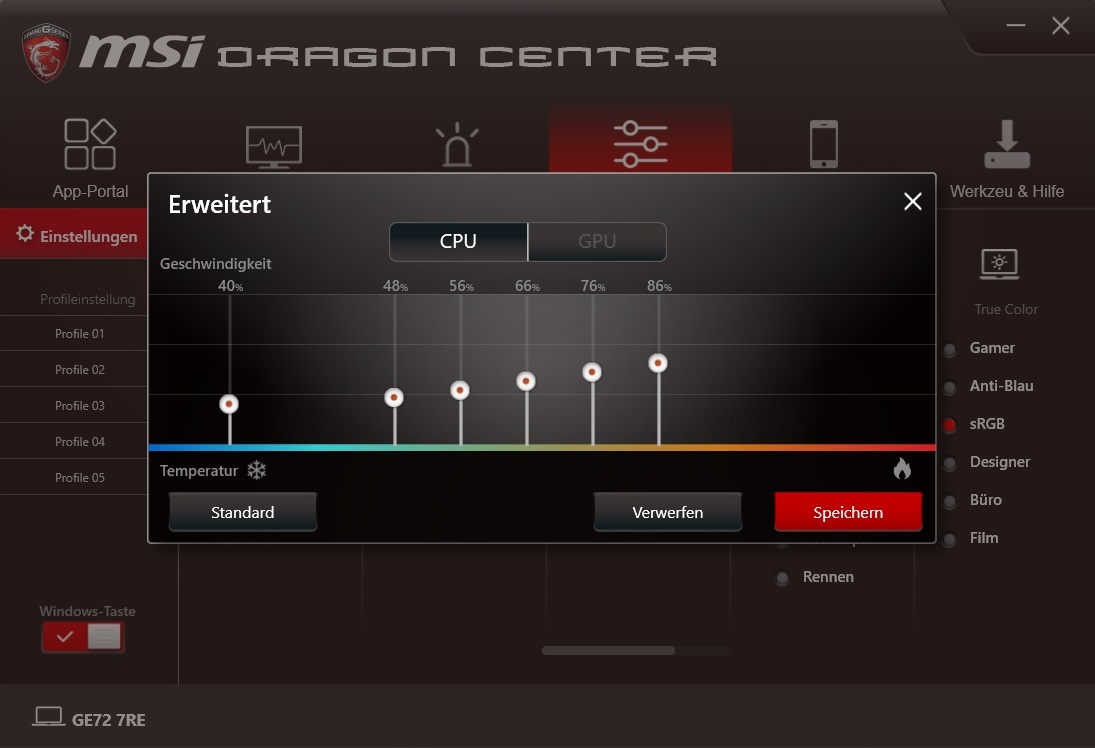
What is more important is that the CPU tended to throttling in several 3D applications. However, we cannot tell the latter for sure, since the benchmark results are normal and even the stress test with the Furmark and Prime95 tools ran without throttling. It should be possible to fix both »bugs« with a new BIOS or EC and/or an update of the Dragon Center (at least this was possible in the past).

Display
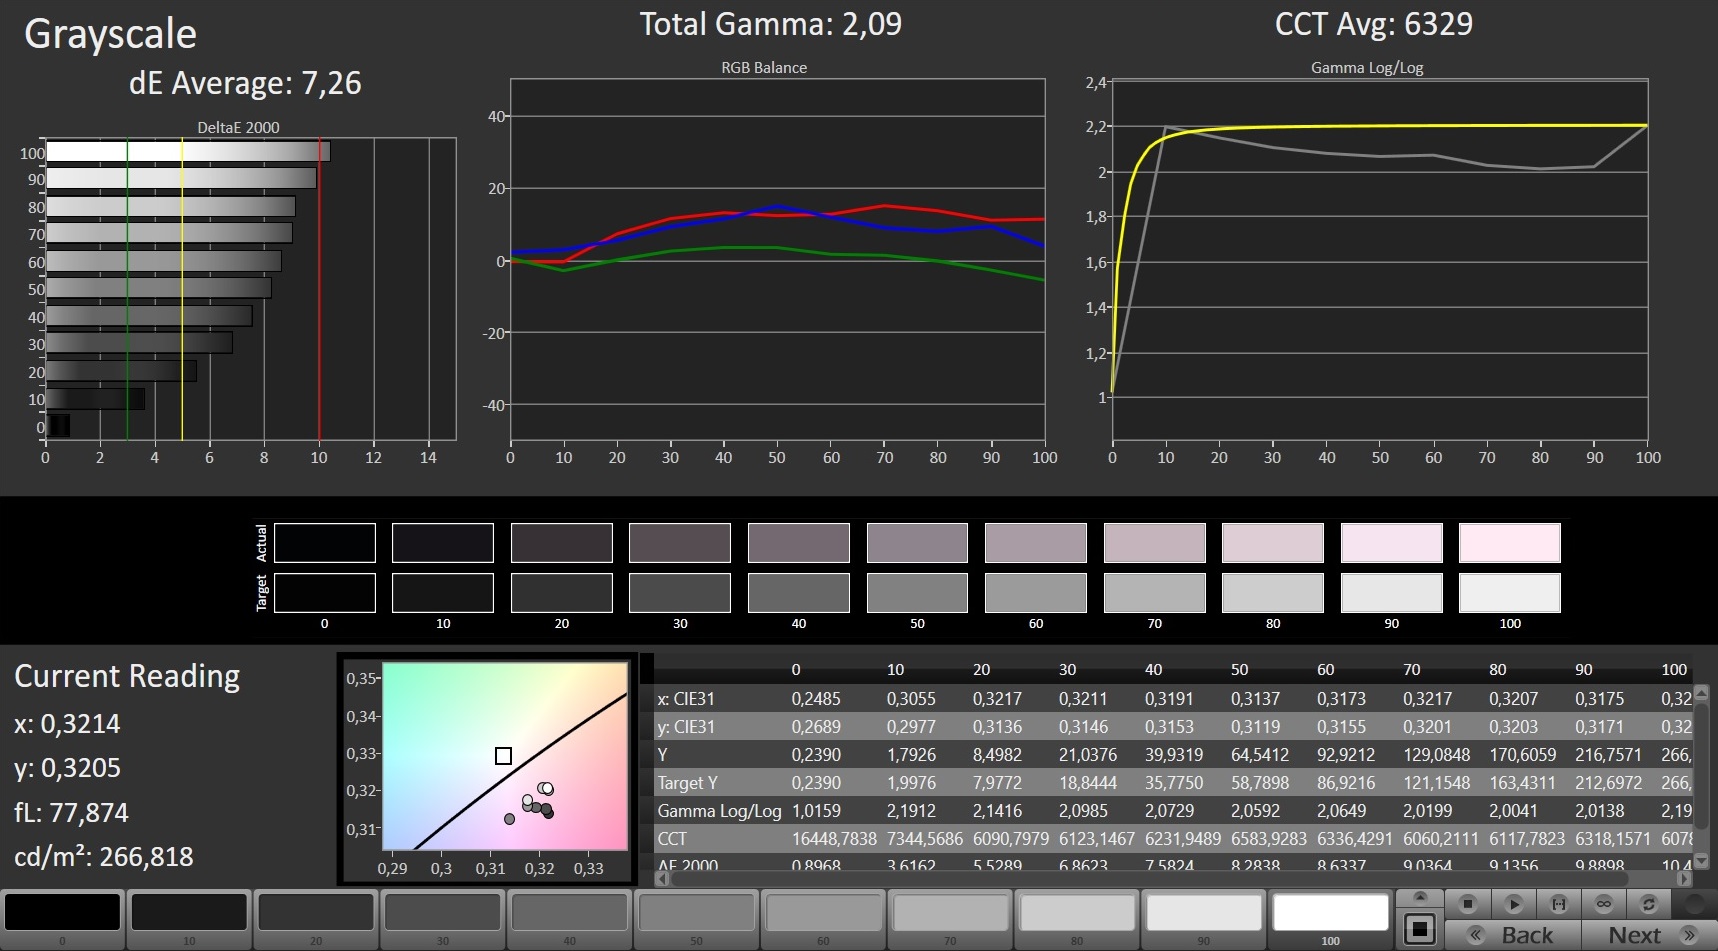
The used Full HD panel N173HHE-G32 is absolutely great for gamers. 120 Hz ensure for a immensely »smooth« and pleasant image given that the frame rate is high enough. Thanks to high contrast (about 1.050:1) and decent black value (0.24 cd/m²) dark scenes look great.
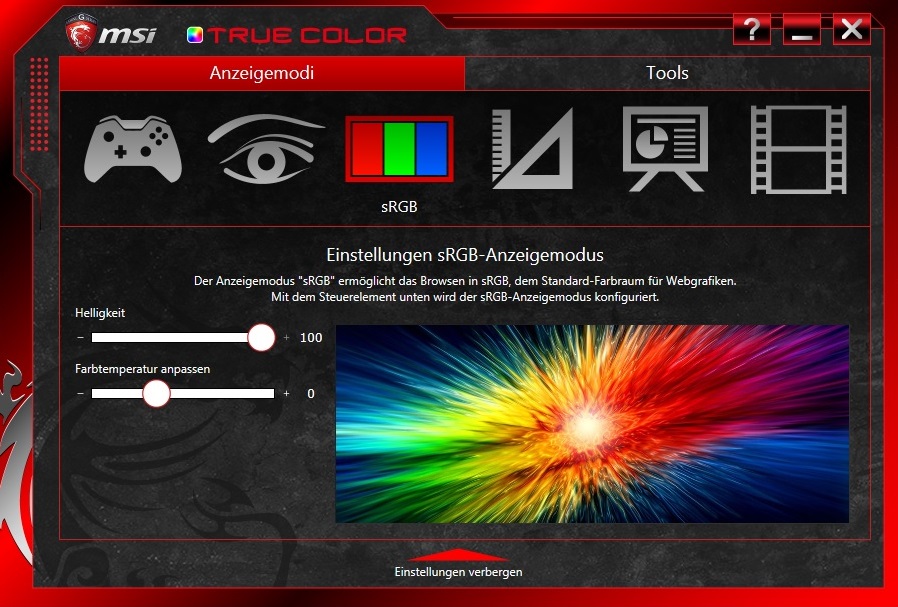
Because of the MSI software True-Color, which optimizes the image via pre-set scenarios and adjusts many settings, the brightness is lower than in other notebooks with the same display. While an average of 230 cd/m² is sufficient for indoor use, you will quickly wish for a higher brightness outdoors. At least, the display surface is matte. Hence, the display does hardly reflect.
| |||||||||||||||||||||||||
Brightness Distribution: 86 %
Center on Battery: 253 cd/m²
Contrast: 1054:1 (Black: 0.24 cd/m²)
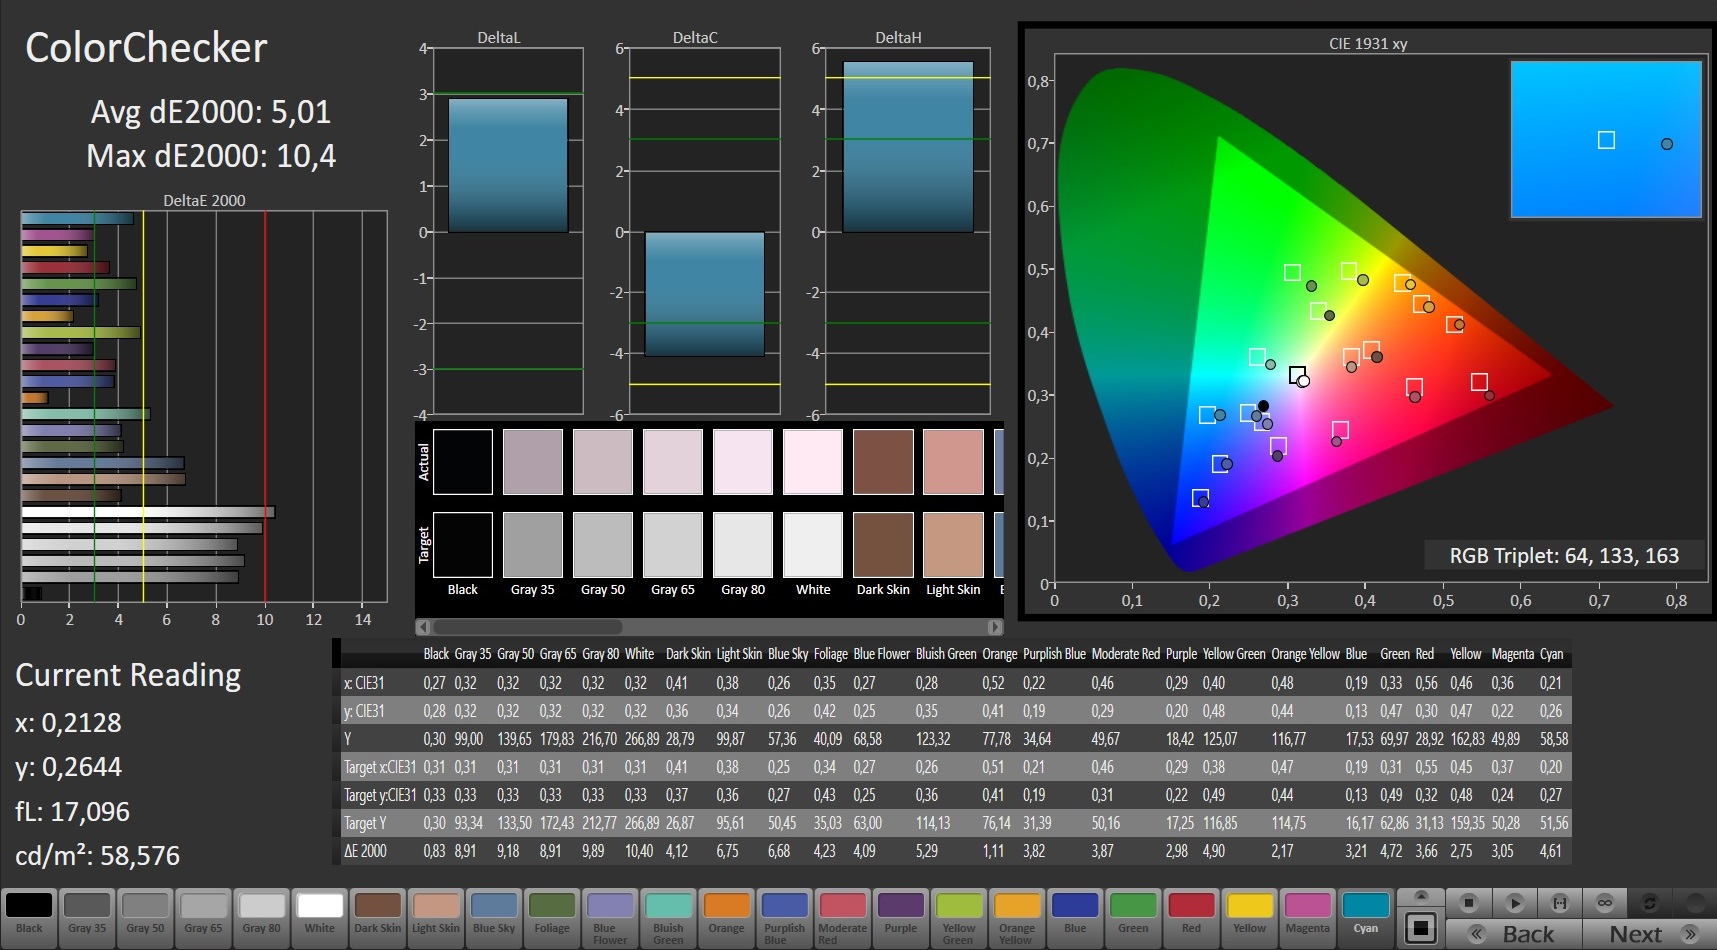
ΔE ColorChecker Calman: 5.01 | ∀{0.5-29.43 Ø4.71}
ΔE Greyscale Calman: 7.26 | ∀{0.09-98 Ø4.96}
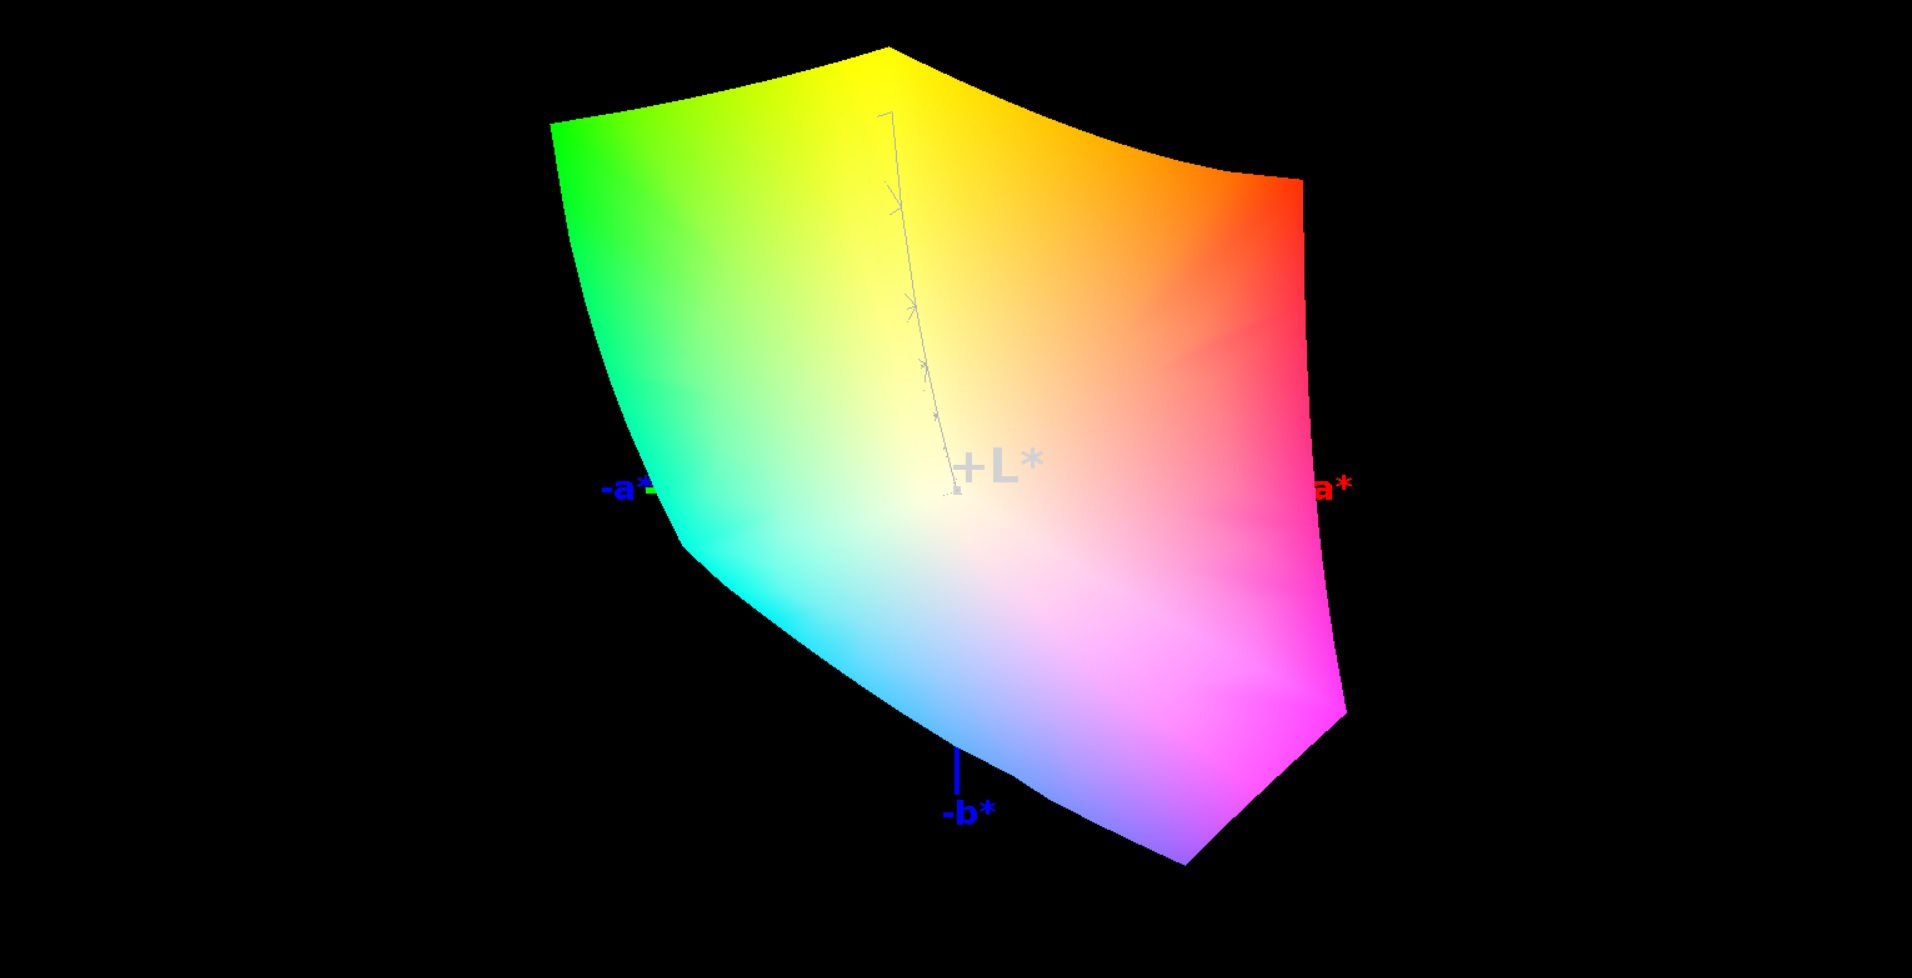
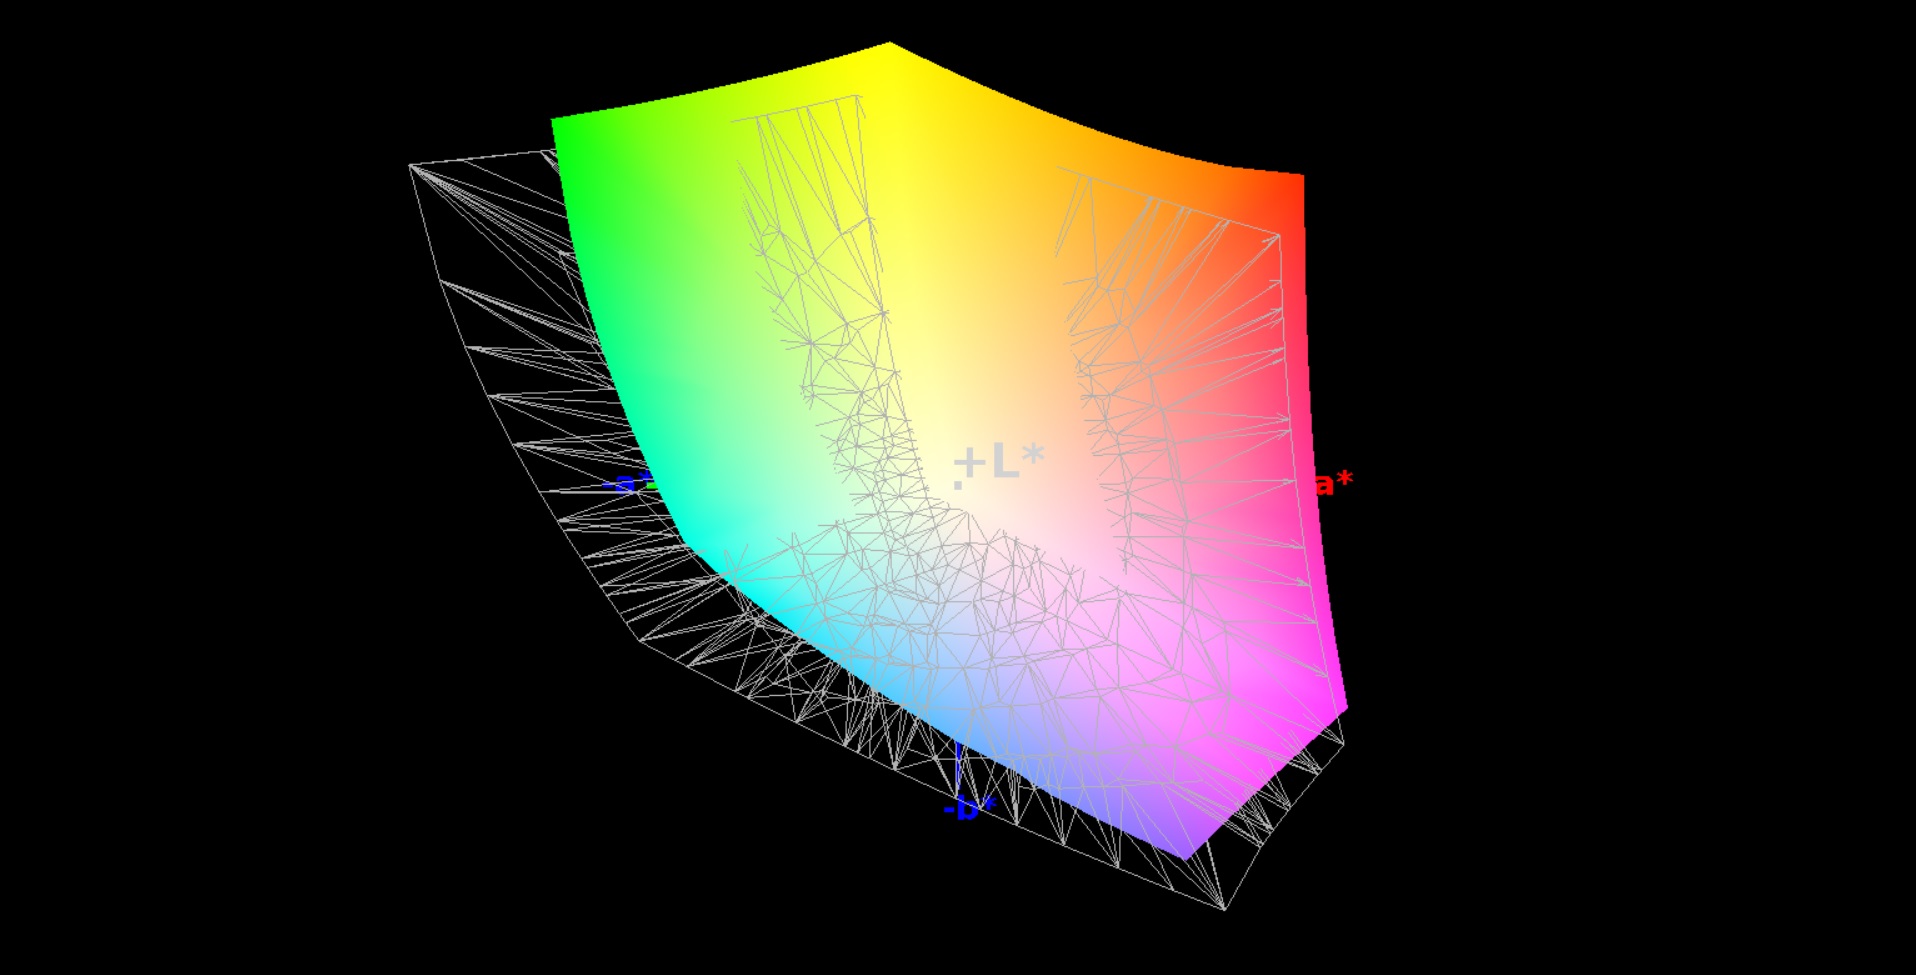
100% sRGB (Argyll 1.6.3 3D)
76% AdobeRGB 1998 (Argyll 1.6.3 3D)
85.2% AdobeRGB 1998 (Argyll 3D)
99.9% sRGB (Argyll 3D)
90.7% Display P3 (Argyll 3D)
Gamma: 2.09
CCT: 6329 K
| MSI GE72 7RE-046 N173HHE-G32 (CMN1747), 1920x1080 | Aorus X7 v6 B173QTN01.0 (AUO1096), 2560x1440 | HP Omen 17-w110ng LG Philips LGD046E, 1920x1080 | MSI GS73VR 6RF 1920x1080 | Asus GL702VM-GC102D LG Philips LP173WF4-SPF3, 1920x1080 | |
|---|---|---|---|---|---|
| Display | -26% | -24% | -1% | -24% | |
| Display P3 Coverage (%) | 90.7 | 60.9 -33% | 66.6 -27% | 90 -1% | 65.1 -28% |
| sRGB Coverage (%) | 99.9 | 84.2 -16% | 84.1 -16% | 99.9 0% | 83.5 -16% |
| AdobeRGB 1998 Coverage (%) | 85.2 | 61.2 -28% | 61.5 -28% | 83.6 -2% | 61.1 -28% |
| Response Times | -13% | -102% | -6% | -99% | |
| Response Time Grey 50% / Grey 80% * (ms) | 27 ? | 31 ? -15% | 37 ? -37% | 28 ? -4% | 38 ? -41% |
| Response Time Black / White * (ms) | 9 ? | 10 ? -11% | 24 ? -167% | 9.6 ? -7% | 23 ? -156% |
| PWM Frequency (Hz) | |||||
| Screen | -18% | 10% | 20% | -16% | |
| Brightness middle (cd/m²) | 253 | 343 36% | 362 43% | 337.2 33% | 326 29% |
| Brightness (cd/m²) | 230 | 312 36% | 342 49% | 315 37% | 312 36% |
| Brightness Distribution (%) | 86 | 80 -7% | 87 1% | 86 0% | 91 6% |
| Black Level * (cd/m²) | 0.24 | 0.5 -108% | 0.31 -29% | 0.308 -28% | 0.5 -108% |
| Contrast (:1) | 1054 | 686 -35% | 1168 11% | 1095 4% | 652 -38% |
| Colorchecker dE 2000 * | 5.01 | 7.33 -46% | 4.5 10% | 2.96 41% | 6.3 -26% |
| Colorchecker dE 2000 max. * | 10.4 | 10.79 -4% | 9.31 10% | 5.45 48% | 11.69 -12% |
| Greyscale dE 2000 * | 7.26 | 7.6 -5% | 3.48 52% | 2.57 65% | 7.37 -2% |
| Gamma | 2.09 105% | 2.19 100% | 2.23 99% | 2.25 98% | 2.37 93% |
| CCT | 6329 103% | 9024 72% | 6144 106% | 7114 91% | 7116 91% |
| Color Space (Percent of AdobeRGB 1998) (%) | 76 | 55 -28% | 55 -28% | 74.3 -2% | 55 -28% |
| Color Space (Percent of sRGB) (%) | 100 | 84 -16% | 84 -16% | 100 0% | 83 -17% |
| Total Average (Program / Settings) | -19% /
-19% | -39% /
-11% | 4% /
12% | -46% /
-29% |
* ... smaller is better
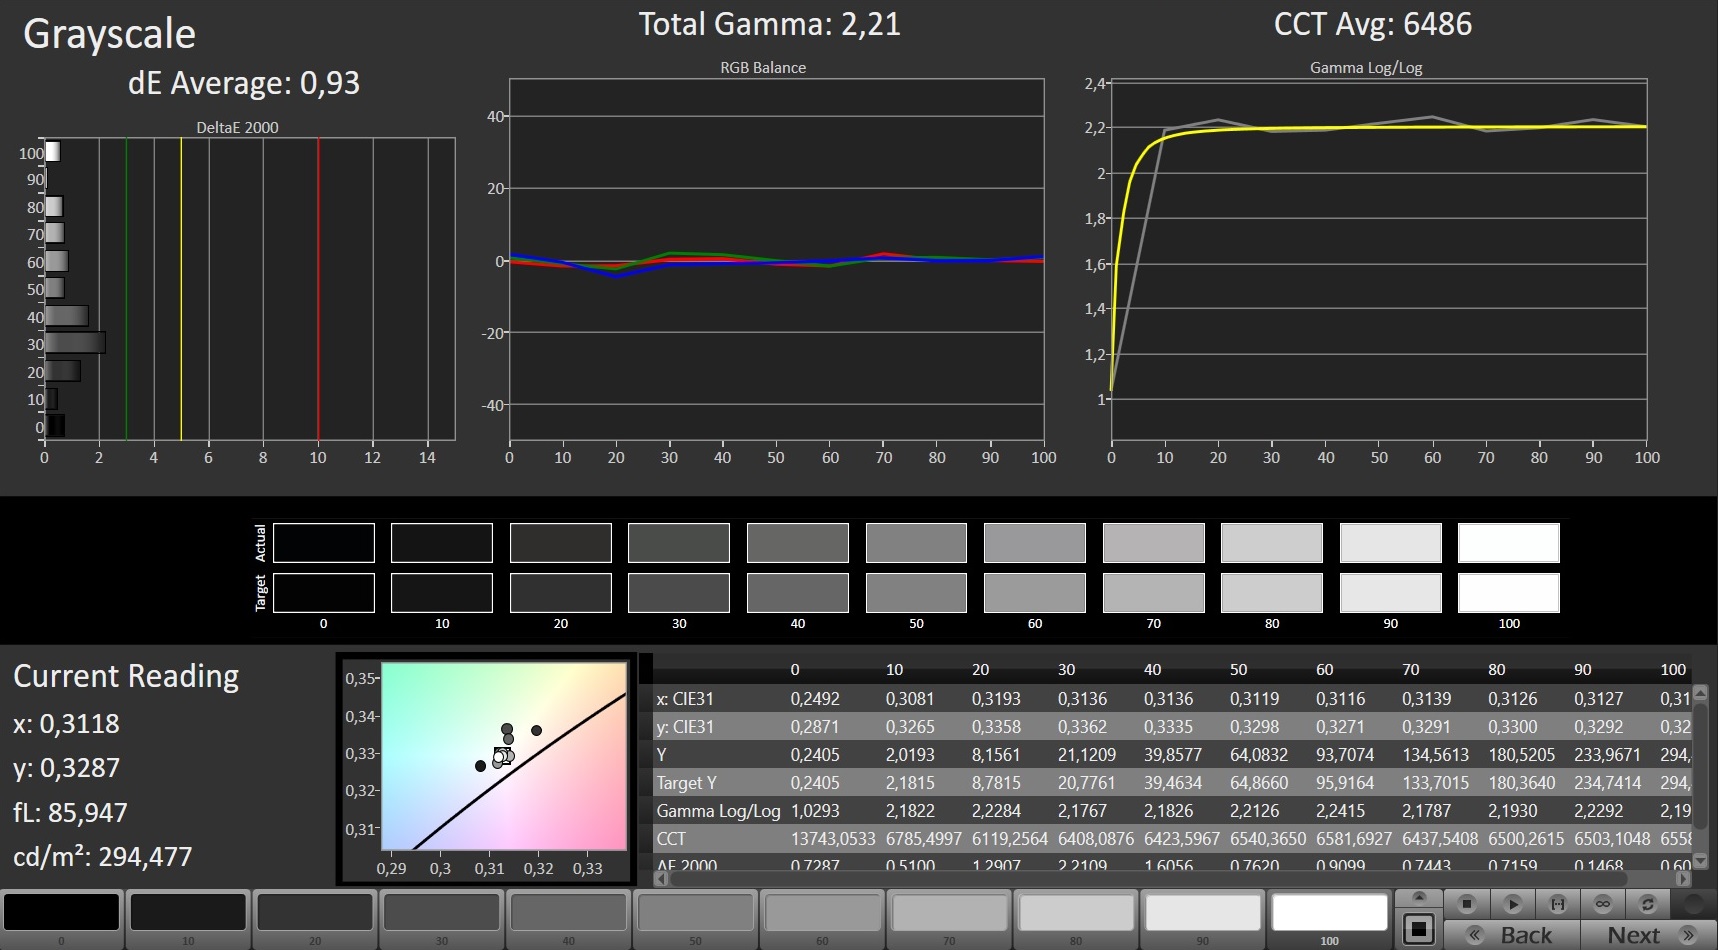
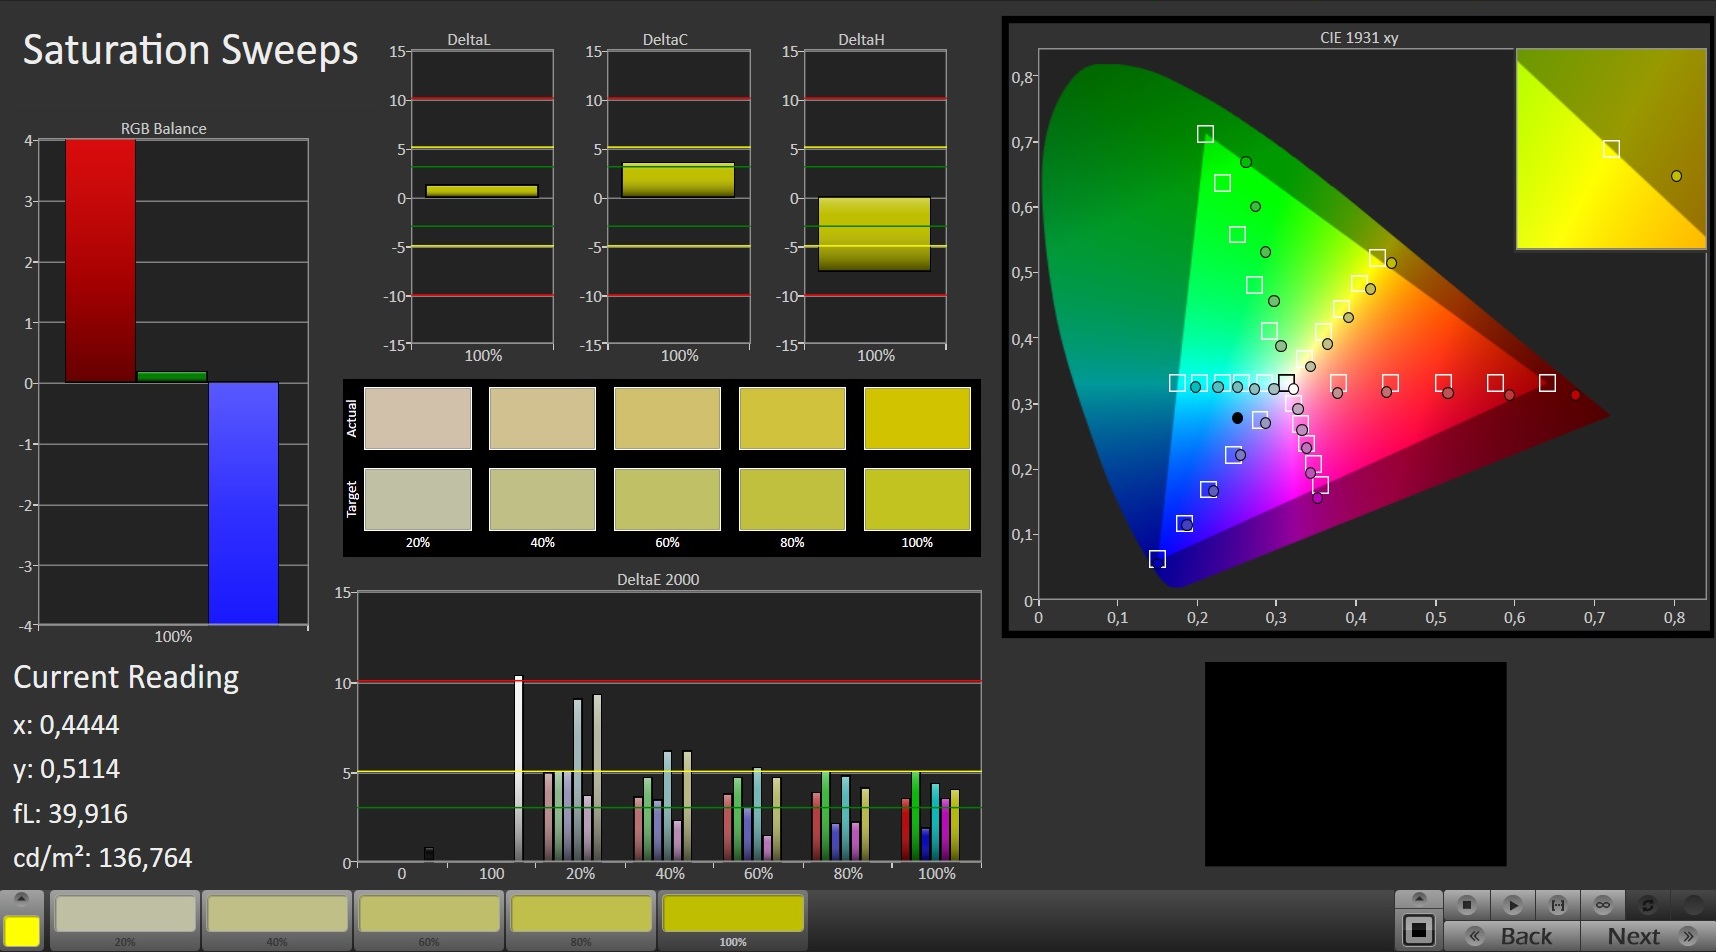
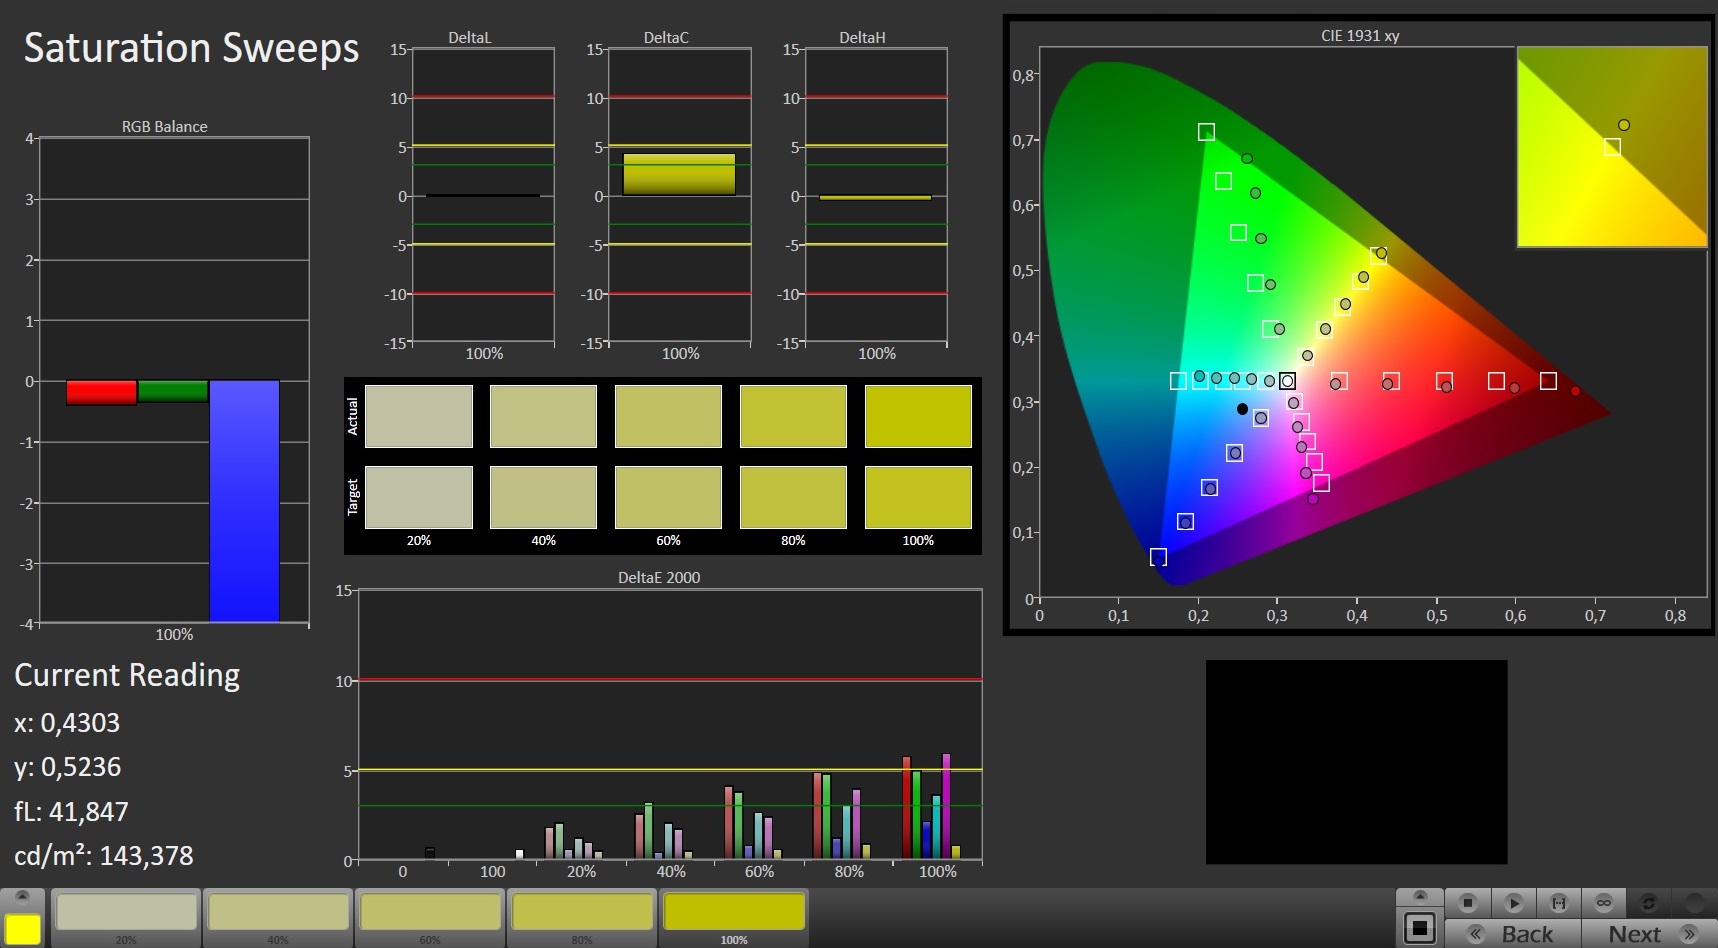
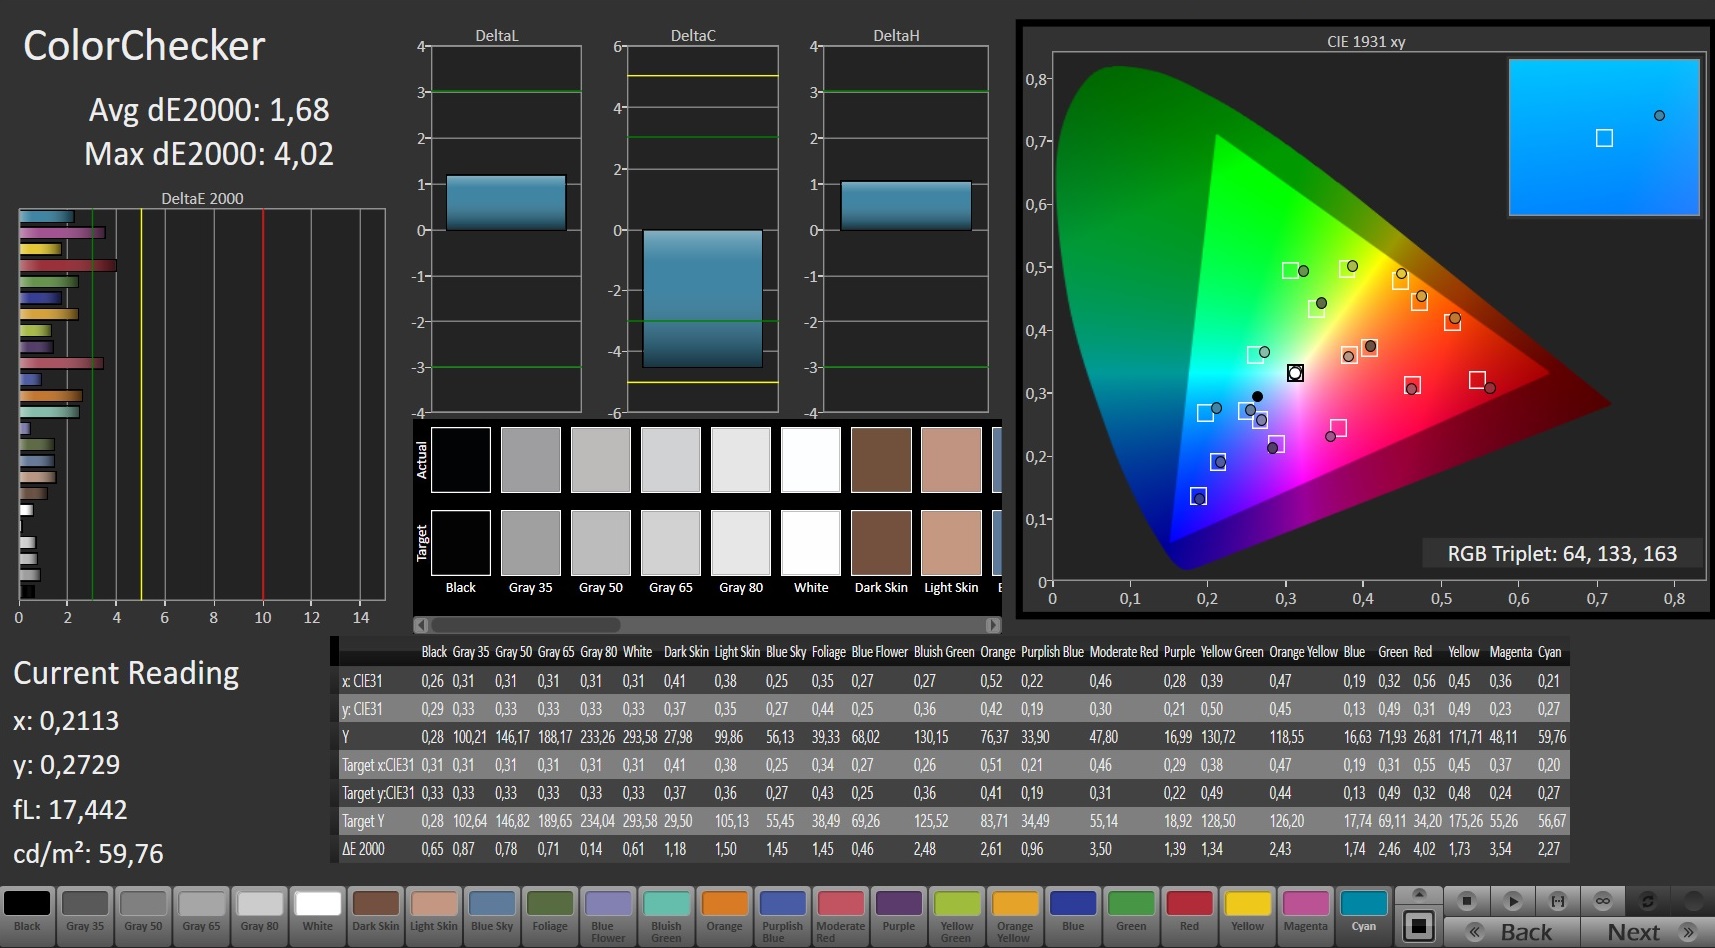
After calibration, the GE72 7RE is an option for professional users. Apart from the gray scales, the DeltaE shift of the colors can also be reduced to below 3. 100 % sRGB and 76 % AdobeRGB coverage are also pros for photo and video experts.
Meanwhile, gamers will mainly appreciate the low response time. We hardly ever measure only 9 ms when changing from black to white and 27 ms when switching from gray to gray in notebooks. Cuts have to be accepted in the realm of viewing angles. Since the N173HHE-G32 is a TN-type, it cannot keep up with IPS models in this aspect. Subjectively, the brightness distribution was quite constant. Heavy screen bleeding should not be an issue.
Display Response Times
| ↔ Response Time Black to White | ||
|---|---|---|
| 9 ms ... rise ↗ and fall ↘ combined | ↗ 6 ms rise | 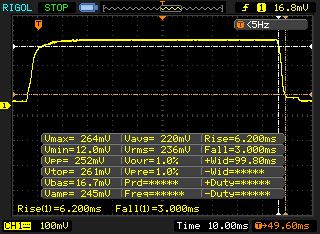 |
| ↘ 3 ms fall | ||
| The screen shows fast response rates in our tests and should be suited for gaming. In comparison, all tested devices range from 0.1 (minimum) to 240 (maximum) ms. » 25 % of all devices are better. This means that the measured response time is better than the average of all tested devices (19.8 ms). | ||
| ↔ Response Time 50% Grey to 80% Grey | ||
| 27 ms ... rise ↗ and fall ↘ combined | ↗ 13 ms rise | 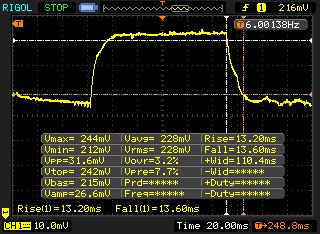 |
| ↘ 14 ms fall | ||
| The screen shows relatively slow response rates in our tests and may be too slow for gamers. In comparison, all tested devices range from 0.165 (minimum) to 636 (maximum) ms. » 37 % of all devices are better. This means that the measured response time is better than the average of all tested devices (30.9 ms). | ||
Screen Flickering / PWM (Pulse-Width Modulation)
| Screen flickering / PWM not detected | 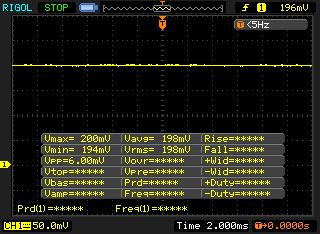 | ||
In comparison: 52 % of all tested devices do not use PWM to dim the display. If PWM was detected, an average of 7748 (minimum: 5 - maximum: 343500) Hz was measured. | |||
Performance
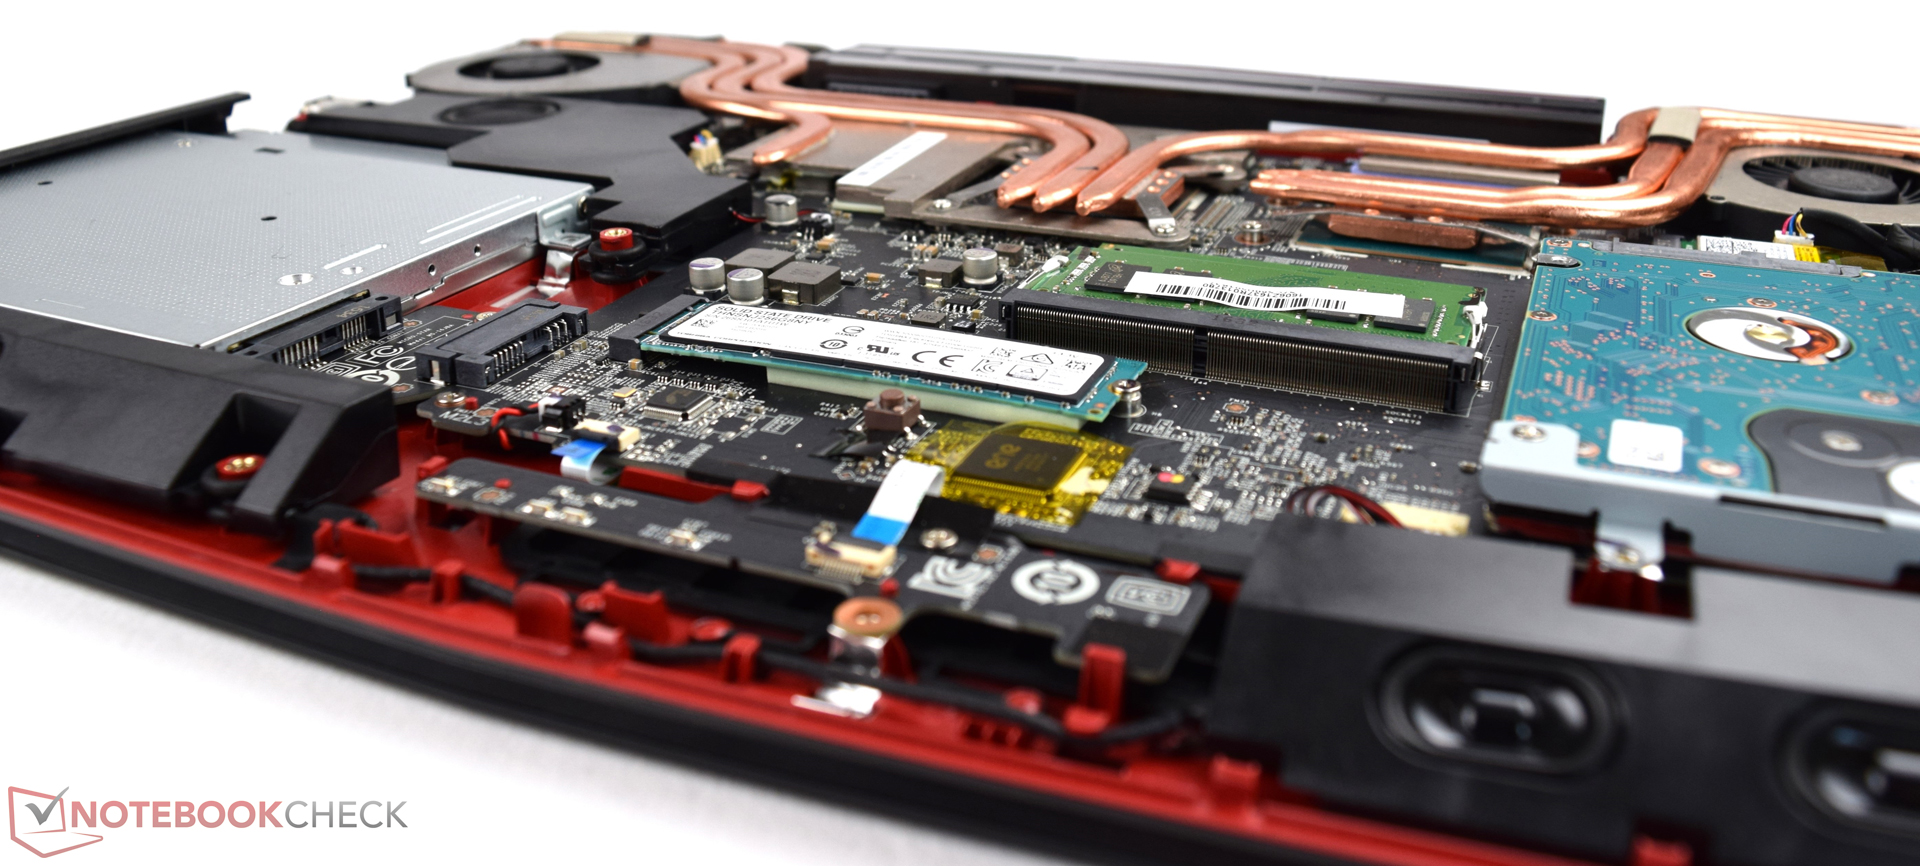
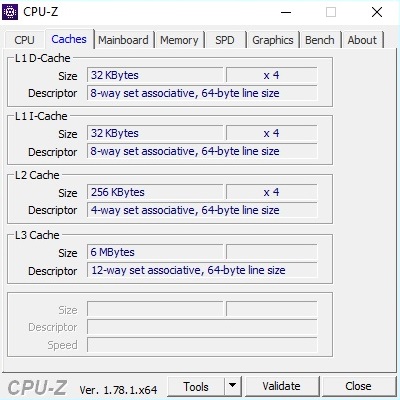
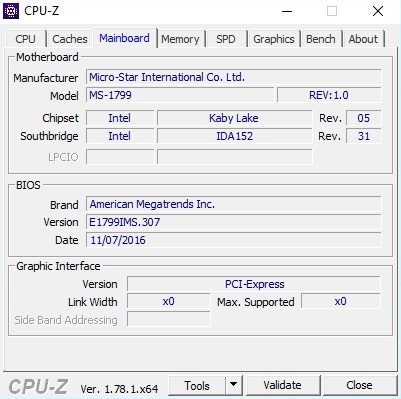
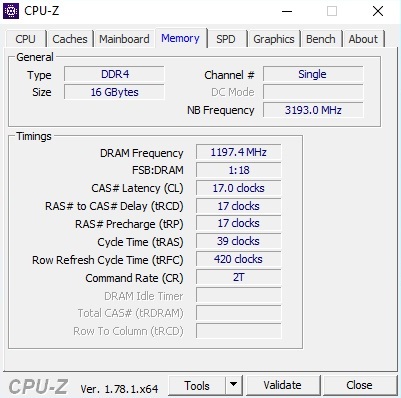
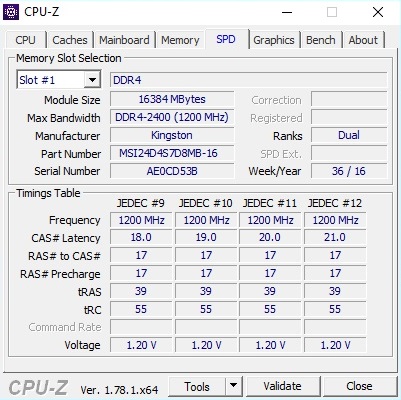
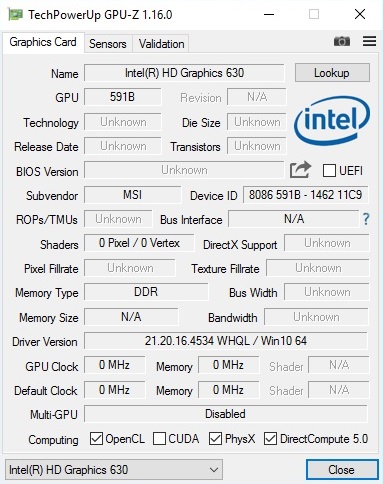
Before analyzing the performance, several screenshots depict the most important components.
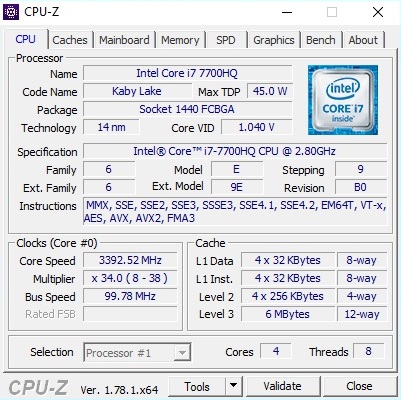
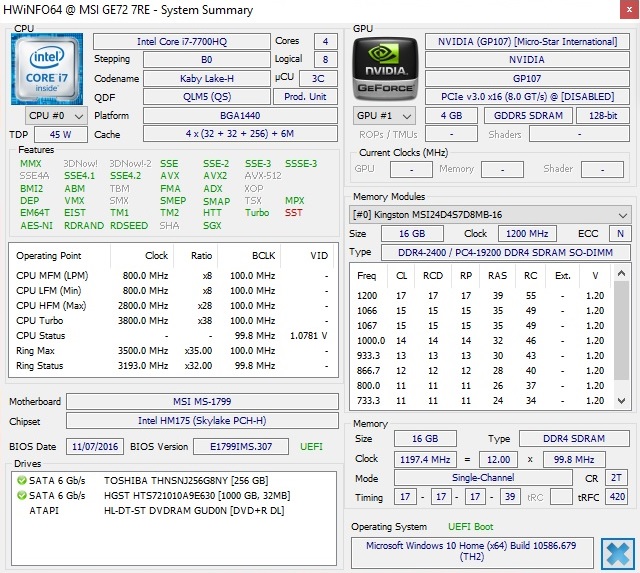
Processor
The Kaby Lake Core i7-7700HQ processor replaces the extremely successful Skylake quad-core Core i7-6700HQ. As the review of the GT73VR 7RF has already shown, the new architecture with the same clock rate only brings slightly better performance. This is not surprising, since lithography (14 nm) as well as TDP (45 Watt) remained the same.
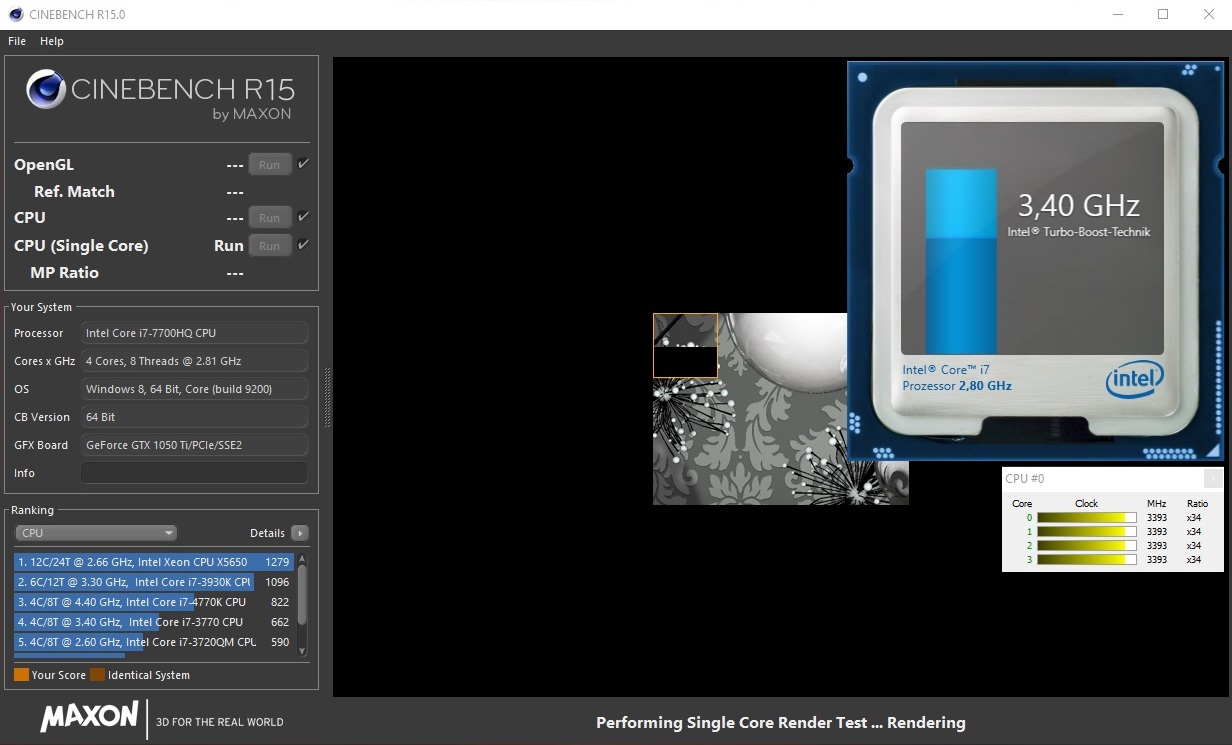
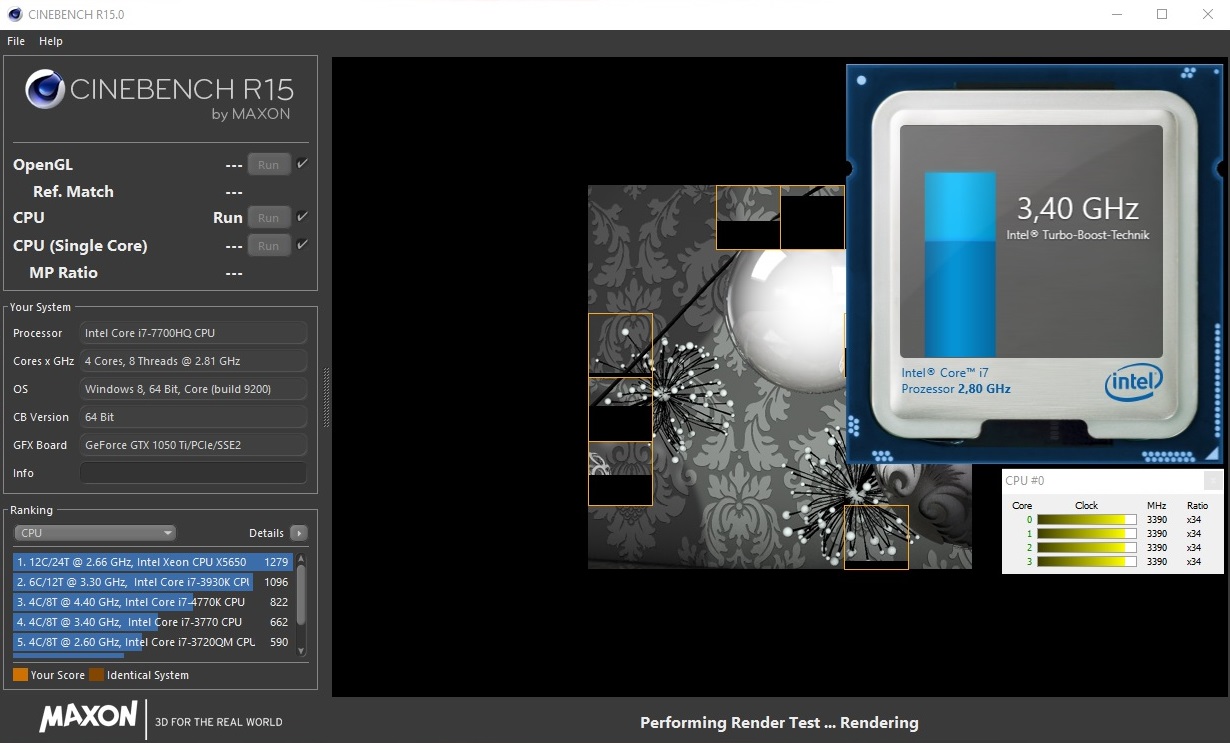
However, you'll get a bigger performance gain if you leave both CPUs at their standard settings. The Multi Core tests of Cinebench R15 and R11.5 are the best examples. The Core i7-7700HQ performs just under 10 % better than 6700HQ notebooks. However, you will hardly notice any difference if at all during everyday use, especially in 3D applications such as games. Hence, you can safely buy a cheap Skylake notebook if you find such.
| Cinebench R15 | |
| CPU Single 64Bit | |
| Aorus X7 v6 | |
| HP Omen 17-w110ng | |
| MSI GE72 7RE-046 | |
| MSI GS73VR 6RF | |
| Asus GL702VM-GC102D | |
| CPU Multi 64Bit | |
| Aorus X7 v6 | |
| MSI GE72 7RE-046 | |
| HP Omen 17-w110ng | |
| Asus GL702VM-GC102D | |
| MSI GS73VR 6RF | |
| Cinebench R11.5 | |
| CPU Single 64Bit | |
| Aorus X7 v6 | |
| HP Omen 17-w110ng | |
| MSI GE72 7RE-046 | |
| MSI GS73VR 6RF | |
| Asus GL702VM-GC102D | |
| CPU Multi 64Bit | |
| Aorus X7 v6 | |
| MSI GE72 7RE-046 | |
| HP Omen 17-w110ng | |
| Asus GL702VM-GC102D | |
| MSI GS73VR 6RF | |
System Performance
As expected, the GE72 7RE performs quite well in the system tests. With 5,810 points, the 17-inch laptop ranks in between the HP Omen 17 and the Aorus X7 v6 in PCMark 7. Our Asus GL702VM, which has to make do with an HDD and only achieves 4,114 points (-29 %), makes apparent, that an SSD as Windows drive is almost obligatory these days.
| PCMark 7 Score | 5810 points | |
Help | ||
| PCMark 7 - Score | |
| Aorus X7 v6 | |
| MSI GE72 7RE-046 | |
| HP Omen 17-w110ng | |
| Asus GL702VM-GC102D | |
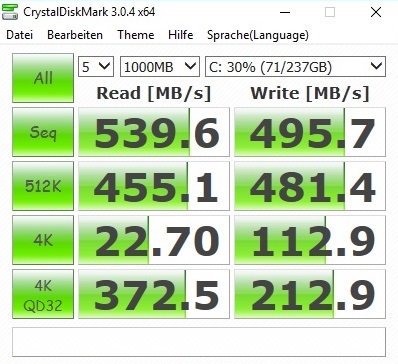
Storage Device
While expensive gaming notebooks mostly use SSDs based on PCIe or NVMe, the GE72 7RE »only« comes with a classical SATA III model from Toshiba (256 GB), which is limited to 500-550 MB/s as usual. Since performance with small files is most important in practice, the operating system is still very responsive and opens applications and games significantly faster than from an HDD.

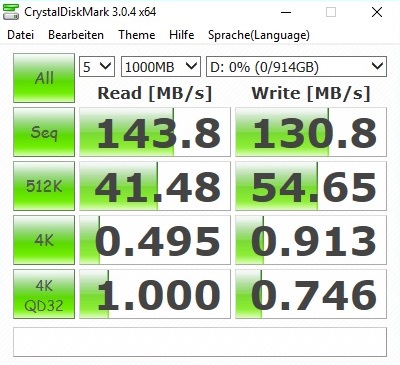

Speaking of the HDD: An HGST Travelstar 7K1000 is used as secondary storage. It runs at 7,200 rpm and features a capacity of 1 TB.
| MSI GE72 7RE-046 Toshiba HG6 THNSNJ256G8NY | Aorus X7 v6 Toshiba NVMe THNSN5512GPU7 | HP Omen 17-w110ng Samsung PM951 NVMe MZVLV256 | MSI GS73VR 6RF SanDisk SD8SN8U1T001122 | Asus GL702VM-GC102D HGST Travelstar 7K1000 HTS721010A9E630 | |
|---|---|---|---|---|---|
| CrystalDiskMark 3.0 | 124% | 49% | -37% | -86% | |
| Read Seq (MB/s) | 540 | 1499 178% | 1156 114% | 334.3 -38% | 134.6 -75% |
| Write Seq (MB/s) | 495.7 | 1411 185% | 294.9 -41% | 319 -36% | 130.6 -74% |
| Read 4k (MB/s) | 22.7 | 44.33 95% | 42.7 88% | 20.3 -11% | 0.602 -97% |
| Write 4k (MB/s) | 112.9 | 155.5 38% | 153.3 36% | 42.51 -62% | 1.146 -99% |

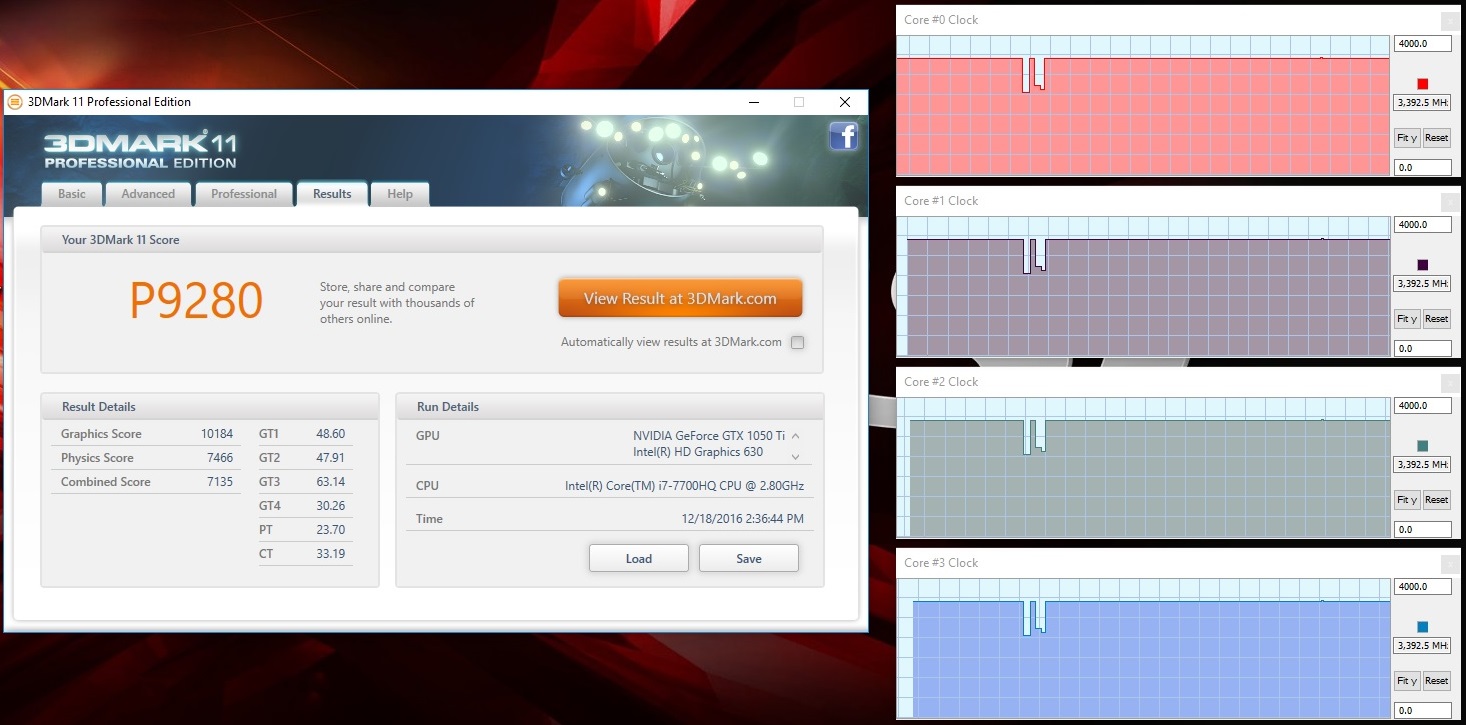
Graphic Card
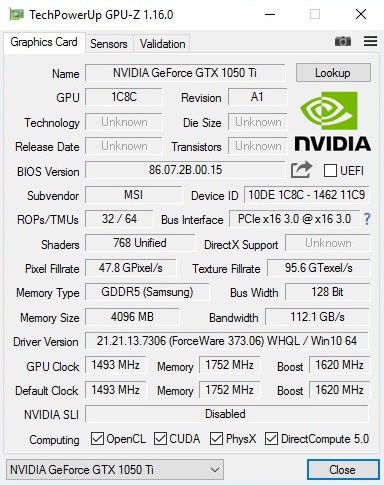
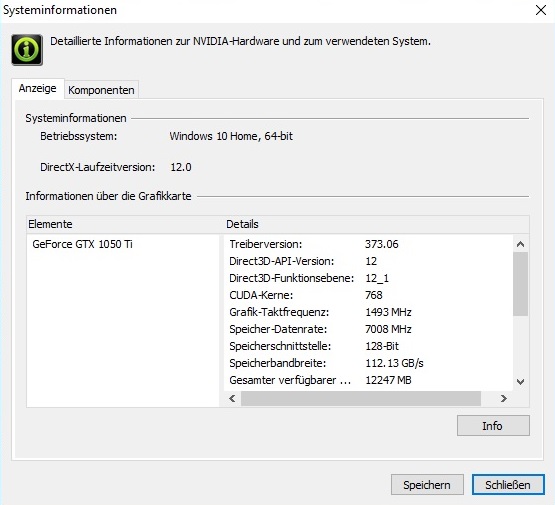
Let's finally turn to the decisive factor for gamers: the graphic card. In contrast to the desktop counterpart, which has already been on the market for a few weeks, the mobile variant of the GeForce GTX 1050 Ti took a longer time to launch. Laptop enthusiasts who always consider the price performance ratio can find out themselves whether it was worth waiting for it.
It already gets obvious when checking the specifications that the DirectX-12 chip rather belongs to the mid-range than to the high-end range. With Mit 768 vs. 1280 shaders, the GTX 1050 Ti falls significantly behind the manufacturers' favorite, the GTX 1060. In order to cut costs, memory interface (128 vs. 192 bit) and VRAM capacity (4 vs. 6 GB GDDR5) are also smaller. The clock rate difference is smaller. For example the GTX 1050 Ti works at 1,493 vs. 1,506 MHz (core) and 3,500 vs. 4000 MHz (memory).
| 3DMark Vantage P Result | 30690 points | |
| 3DMark 11 Performance | 9269 points | |
| 3DMark Ice Storm Standard Score | 69304 points | |
| 3DMark Cloud Gate Standard Score | 20933 points | |
| 3DMark Fire Strike Score | 6959 points | |
Help | ||
Especially the VRAM capacity might become a problem in the future. In the meanwhile, many games require more than 4 GB for maximum details. (e.g. Call of Duty Infinite Warfare, Watch Dogs 2 & Deus Ex Mankind Divided), whereas the GTX 1050 Ti can also get too slow due to other reasons - depending on the game. We unconditionally recommend the Pascal chip in the price range of about 1.500 Euros - not least because of the better energy efficiency compared to the Maxwell predecessor.
According to the synthetic benchmarks and our gaming tests, the GTX 1050 Ti is about on par with the GTX 970M (with small advantage for the newcomer). However, the GE72 7RE cannot keep up with GTX 1060 models. In the Fire Strike test of the current 3DMark it is about 30 % slower and it performs about 50 % worse than the GTX 1070.
| 3DMark | |
| 1920x1080 Fire Strike Graphics | |
| Aorus X7 v6 | |
| HP Omen 17-w110ng | |
| MSI GS73VR 6RF | |
| Asus GL702VM-GC102D | |
| MSI GE72 7RE-046 | |
| 1280x720 Sky Diver Graphics | |
| Aorus X7 v6 | |
| HP Omen 17-w110ng | |
| Asus GL702VM-GC102D | |
| MSI GE72 7RE-046 | |
| 3DMark 11 - 1280x720 Performance GPU | |
| Aorus X7 v6 | |
| HP Omen 17-w110ng | |
| MSI GS73VR 6RF | |
| Asus GL702VM-GC102D | |
| MSI GE72 7RE-046 | |
| Unigine Heaven 4.0 - Extreme Preset DX11 | |
| Aorus X7 v6 | |
| HP Omen 17-w110ng | |
| MSI GE72 7RE-046 | |
Gaming Performance
Those you can do without highest graphics settings if necessary will get a decent graphic card for Full HD gaming in the GeForce GTX 1050 Ti. From 29 tested games, only the apparently very poorly optimized Mafia 3 refused to run smoothly in the preset high. Otherwise, the system mostly leveled off at above 40 fps.
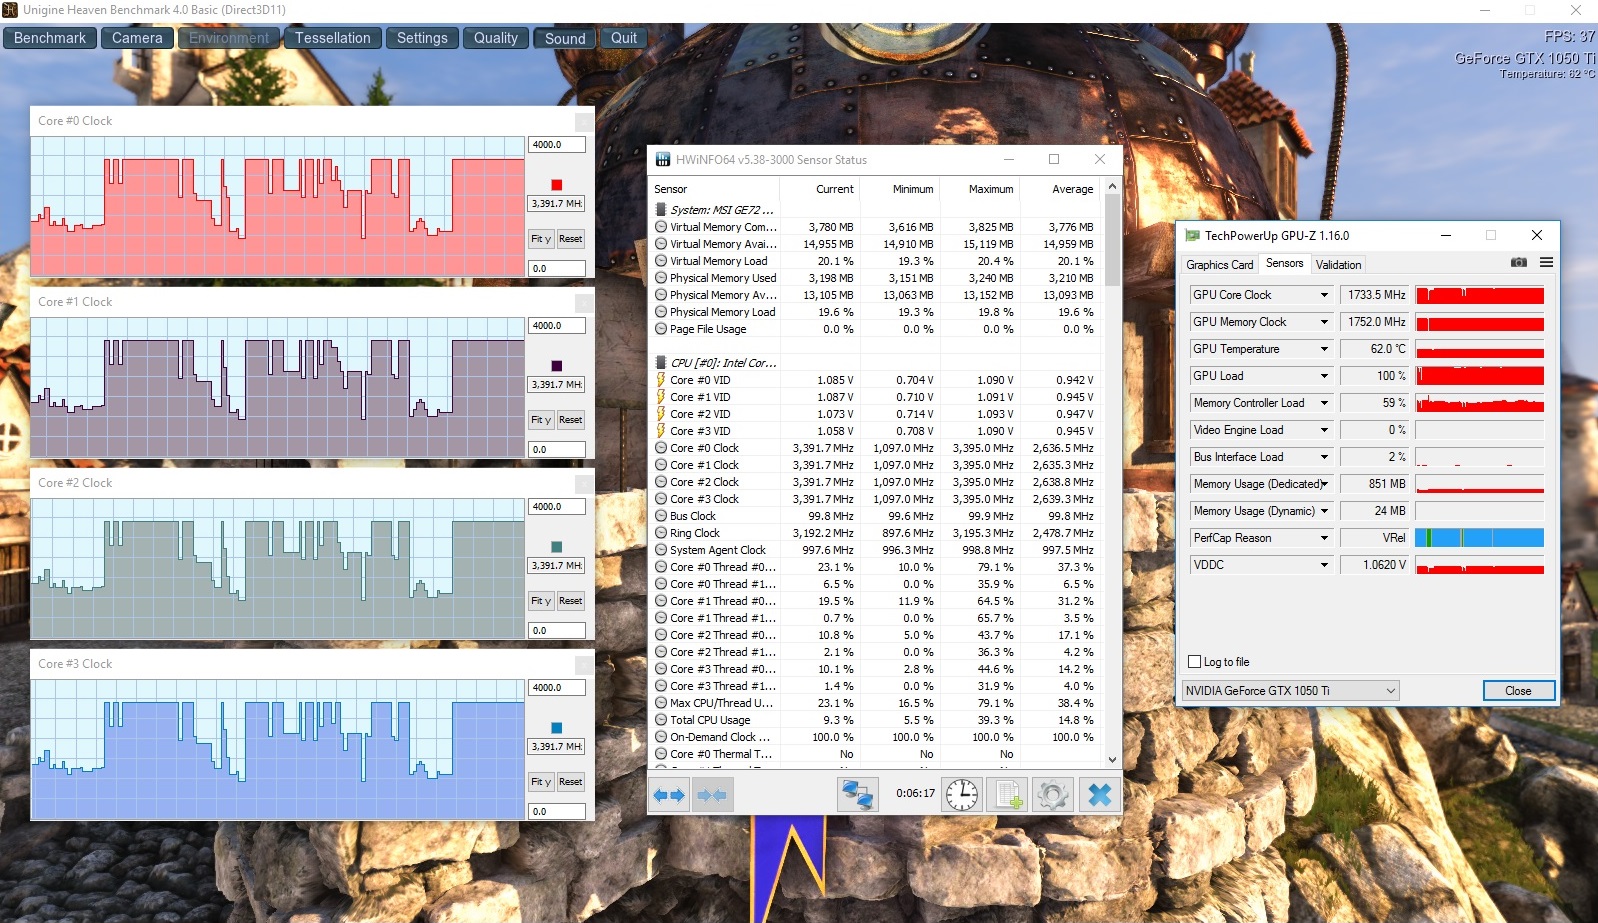
Since Battlefield 1 refused running with the pre-installed driver (ForceWare 373.06), we used the brand new ForceWare 376.33 for running the world war shooter. Apart from this, the standard driver worked well. We neither observed crashes nor graphic errors. An average GPU clock of 1,700 MHz was recorded in 3D mode. The maximum clock was 1,785 MHz.
| Battlefield 1 | |
| 1920x1080 Ultra Preset AA:T | |
| Aorus X7 v6 | |
| HP Omen 17-w110ng | |
| Asus GL702VM-GC102D | |
| MSI GE72 7RE-046 | |
| 1920x1080 High Preset AA:T | |
| Aorus X7 v6 | |
| HP Omen 17-w110ng | |
| Asus GL702VM-GC102D | |
| MSI GE72 7RE-046 | |
| low | med. | high | ultra | QHD | 4K | |
|---|---|---|---|---|---|---|
| Dirt Rally (2015) | 93.4 | 65.7 | 57.8 | |||
| The Witcher 3 (2015) | 48.7 | 26.9 | 17.6 | |||
| Batman: Arkham Knight (2015) | 60 | 41 | 19 | |||
| Mad Max (2015) | 89.7 | 82.7 | 28.6 | |||
| Anno 2205 (2015) | 63.7 | 20.6 | 24 | |||
| Fallout 4 (2015) | 56 | 46.2 | 18.5 | |||
| Star Wars Battlefront (2015) | 72.4 | 62.7 | 22.4 | |||
| Assassin's Creed Syndicate (2015) | 47.8 | 23.5 | 17.1 | |||
| Rainbow Six Siege (2015) | 92.2 | 74.4 | 28.4 | |||
| Just Cause 3 (2015) | 58.9 | 52.7 | 22.1 | |||
| Rise of the Tomb Raider (2016) | 47.4 | 39.7 | 17.6 | |||
| XCOM 2 (2016) | 37.7 | 19 | 10.3 | |||
| Far Cry Primal (2016) | 53 | 40 | 17 | |||
| The Division (2016) | 45 | 34.9 | 16.6 | |||
| Hitman 2016 (2016) | 38.4 | 36.6 | 16.3 | |||
| Need for Speed 2016 (2016) | 60.4 | 46.4 | 21.3 | |||
| Doom (2016) | 68.3 | 63.8 | 21.2 | |||
| Overwatch (2016) | 118 | 71 | 38.3 | |||
| Mirror's Edge Catalyst (2016) | 50.3 | 45.1 | 16.2 | |||
| No Man's Sky (2016) | 44.6 | 22 | 18.1 | |||
| Deus Ex Mankind Divided (2016) | 38.3 | 19.7 | 12.3 | |||
| FIFA 17 (2016) | 130 | 128 | 66.1 | |||
| Mafia 3 (2016) | 28.7 | 9.8 | ||||
| Battlefield 1 (2016) | 56.7 | 50.8 | 19.8 | |||
| Farming Simulator 17 (2016) | 130 | 117 | 59.7 | |||
| Titanfall 2 (2016) | 62 | 56.2 | 18.7 | |||
| Call of Duty Infinite Warfare (2016) | 67.4 | 58.8 | 27.4 | |||
| Dishonored 2 (2016) | 48.7 | 39.6 | 18.2 | |||
| Watch Dogs 2 (2016) | 42.4 | 26.6 | 14.4 | |||
| Resident Evil 7 (2017) | 64.5 | 24.3 | ||||
| For Honor (2017) | 66 () | 62 () | 45 () | |||
| Ghost Recon Wildlands (2017) | 106 | 46.1 | 40.3 | 9.8 | ||
| Mass Effect Andromeda (2017) | 105 | 50.2 | 27.9 | 23 | ||
| Warhammer 40.000: Dawn of War III (2017) | 112 | 46.6 | 29.8 | 25.8 | 0 | |
| Rocket League (2017) | 158 | 61 | ||||
| Dirt 4 (2017) | 74.2 | 39.2 | ||||
| Team Fortress 2 (2017) | 105 | 74.4 | ||||
| Playerunknown's Battlegrounds (PUBG) (2017) | 54.1 | 45.2 | ||||
| F1 2017 (2017) | 66 | 40 | 16 | |||
| Ark Survival Evolved (2017) | 89 | 31.6 | 21.8 | |||
| FIFA 18 (2017) | 149 | 62.3 | ||||
| Middle-earth: Shadow of War (2017) | 121 | 62 | 43 | 29 | 12 | |
| The Evil Within 2 (2017) | 61.8 | 36.1 | 32.9 | 31 | 2 | |
| ELEX (2017) | 102 | 52.2 | 41.9 | 31 | 19.6 | 6.6 |
| Destiny 2 (2017) | 116 | 65.5 | 62.1 | 51.1 | 26.1 | 17.8 |
| Assassin´s Creed Origins (2017) | 77 | 45 | 38 | 28 | 20 | 4 |
| Call of Duty WWII (2017) | 191 | 129 | 67.8 | 42.4 | 30.8 | 18.9 |
| Need for Speed Payback (2017) | 115 | 66 | 54.7 | 50.9 | 30.3 | 9.7 |
| Star Wars Battlefront 2 (2017) | 135 | 75 | 65 | 43 | 19.5 | 5.7 |
| Fortnite (2018) | 61 | 45.1 | 28.8 | 8.8 | ||
| Final Fantasy XV Benchmark (2018) | 74 | 37.1 | 23.4 | |||
| Kingdom Come: Deliverance (2018) | 107 | 49.5 | 40.5 | 28 | 16.9 | 6 |
| X-Plane 11.11 (2018) | 77.3 | 69.9 | 61.2 | 45.3 | ||
| Far Cry 5 (2018) | 95 | 47 | 43 | 39 | 25 | 12 |
| The Crew 2 (2018) | 51 | 44.1 | ||||
| Monster Hunter World (2018) | 93 | 41.2 | 35.5 | 27.9 | ||
| F1 2018 (2018) | 146 | 81 | 62 | 37 | 28 | 15 |
| Shadow of the Tomb Raider (2018) | 97 | 38 | 31 | 25 | 17 | 8 |
| FIFA 19 (2018) | 192 | 169 | 157 | 150 | 51.3 | |
| Forza Horizon 4 (2018) | 122 | 62 | 55 | 40 | ||
| Assassin´s Creed Odyssey (2018) | 77 | 41 | 31 | 17 | ||
| Call of Duty Black Ops 4 (2018) | 35.5 | 10.2 | ||||
| Hitman 2 (2018) | 55.6 | 39 | 29.7 | 23.6 | ||
| Fallout 76 (2018) | 48.4 | 45.3 |
Emissions
System Noise
The system noise is more or less on par with the other 17-inch notebooks in our comparison group. While the GE72 7RE is audible in idle mode with 34-36 dB, this is not yet disturbing (the left fan appears to run all the time).
The cooling system first attracts attention under load, even though 38 and 43 dB during 3DMark 06 (average: 41 dB) and a maximum of 49 dB during the stress test are not utterly loud. Apart from the HP Omen 17 and the MSI GS73VR, also the Aorus X7 v6 is louder. However, these laptops come with a more powerful graphic chip.
Noise level
| Idle |
| 34 / 35 / 36 dB(A) |
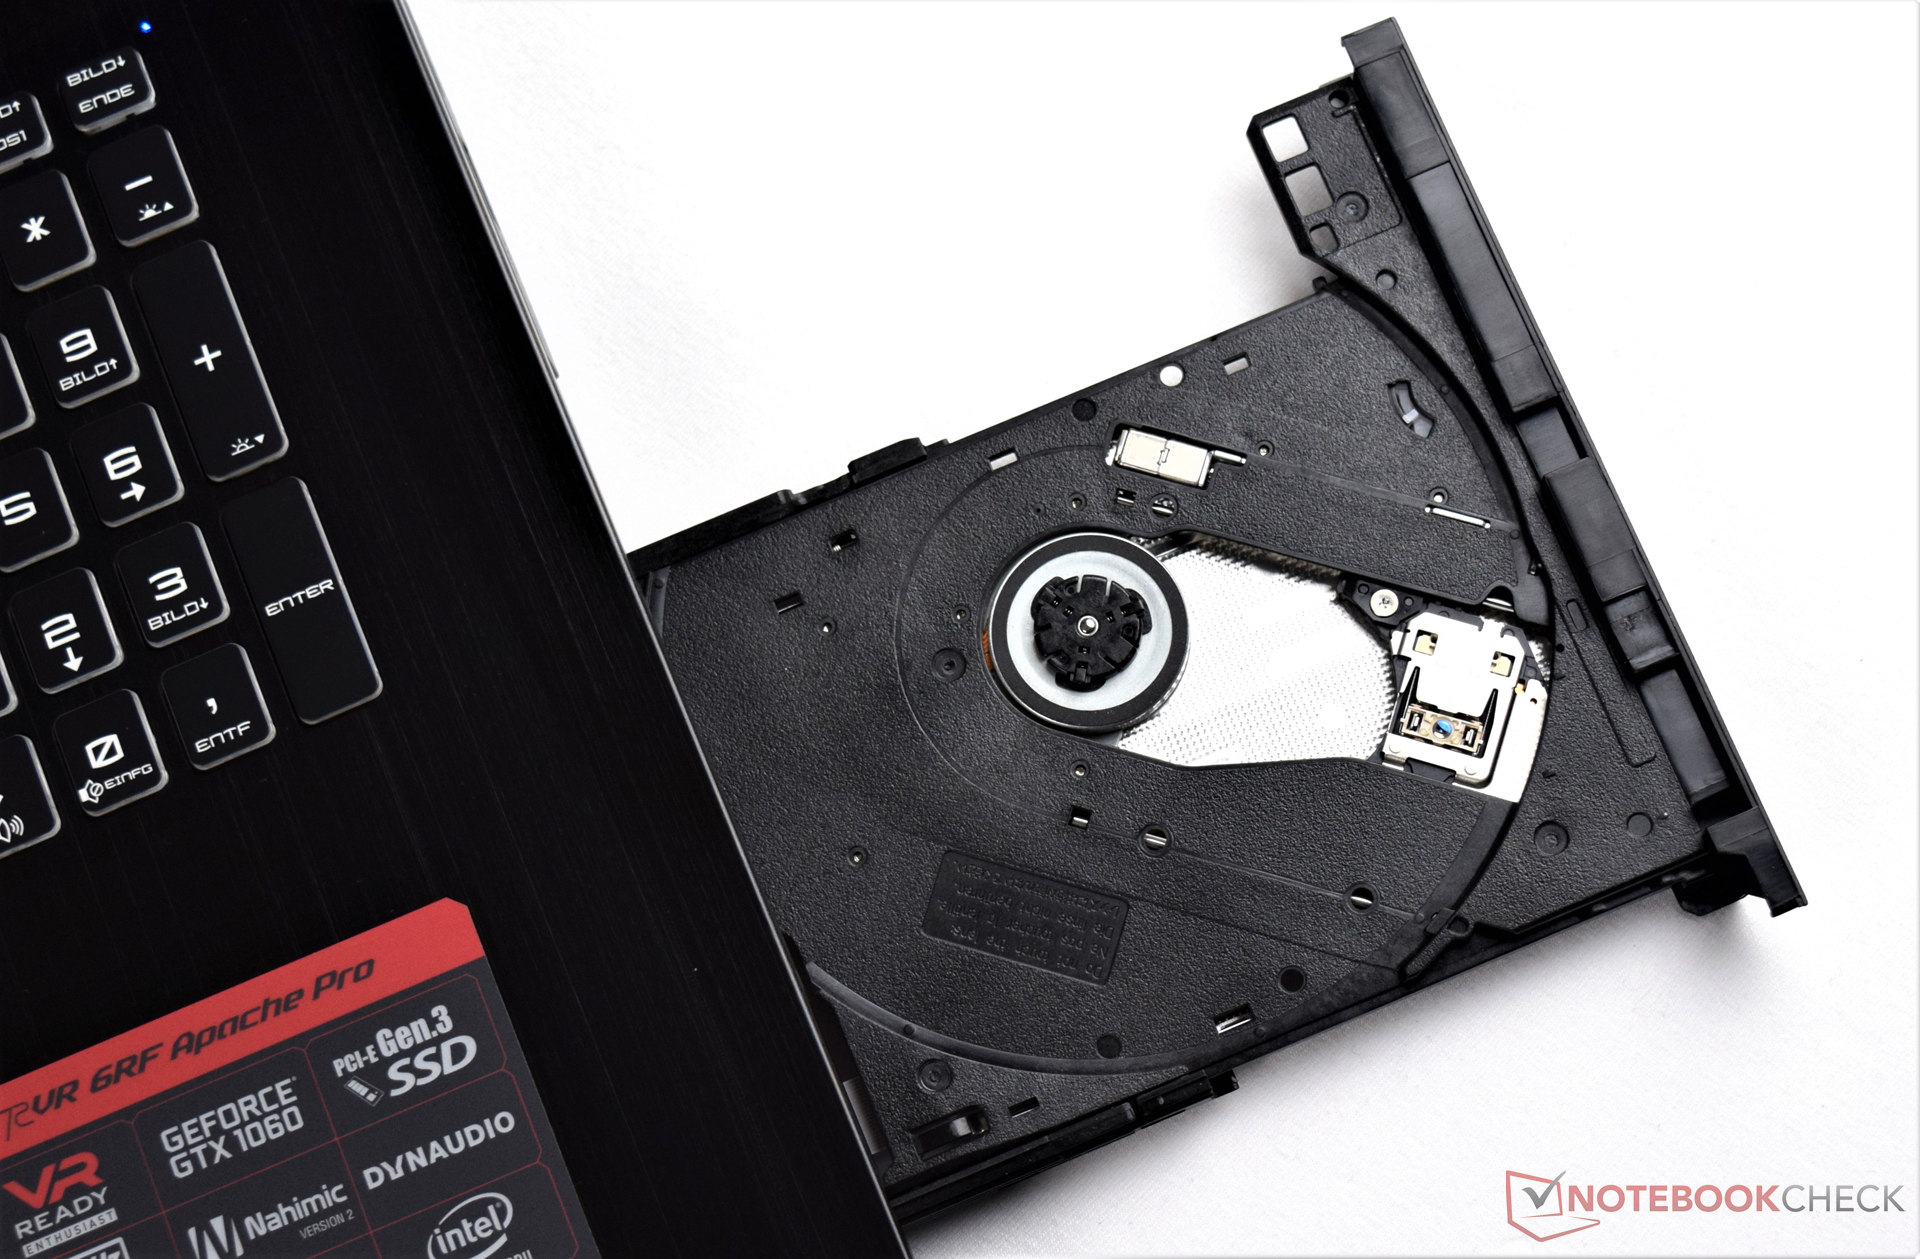
| DVD |
| 40 / dB(A) |
| Load |
| 41 / 49 dB(A) |
 | ||
30 dB silent 40 dB(A) audible 50 dB(A) loud |
||
min: | ||
| MSI GE72 7RE-046 GeForce GTX 1050 Ti Mobile, i7-7700HQ | Aorus X7 v6 GeForce GTX 1070 Mobile, 6820HK | HP Omen 17-w110ng GeForce GTX 1070 Mobile, 6700HQ | MSI GS73VR 6RF GeForce GTX 1060 Mobile, 6700HQ | Asus GL702VM-GC102D GeForce GTX 1060 Mobile, 6700HQ | |
|---|---|---|---|---|---|
| Noise | -4% | -1% | 2% | 6% | |
| off / environment * (dB) | 30 | 30 -0% | 30 -0% | 28.4 5% | 30.5 -2% |
| Idle Minimum * (dB) | 34 | 33 3% | 33 3% | 31.9 6% | 31.4 8% |
| Idle Average * (dB) | 35 | 35 -0% | 34 3% | 32 9% | 31.4 10% |
| Idle Maximum * (dB) | 36 | 40 -11% | 35 3% | 34 6% | 31.5 12% |
| Load Average * (dB) | 41 | 43 -5% | 45 -10% | 47 -15% | 40.9 -0% |
| Load Maximum * (dB) | 49 | 54 -10% | 52 -6% | 49.4 -1% | 46.2 6% |
* ... smaller is better
Temperature
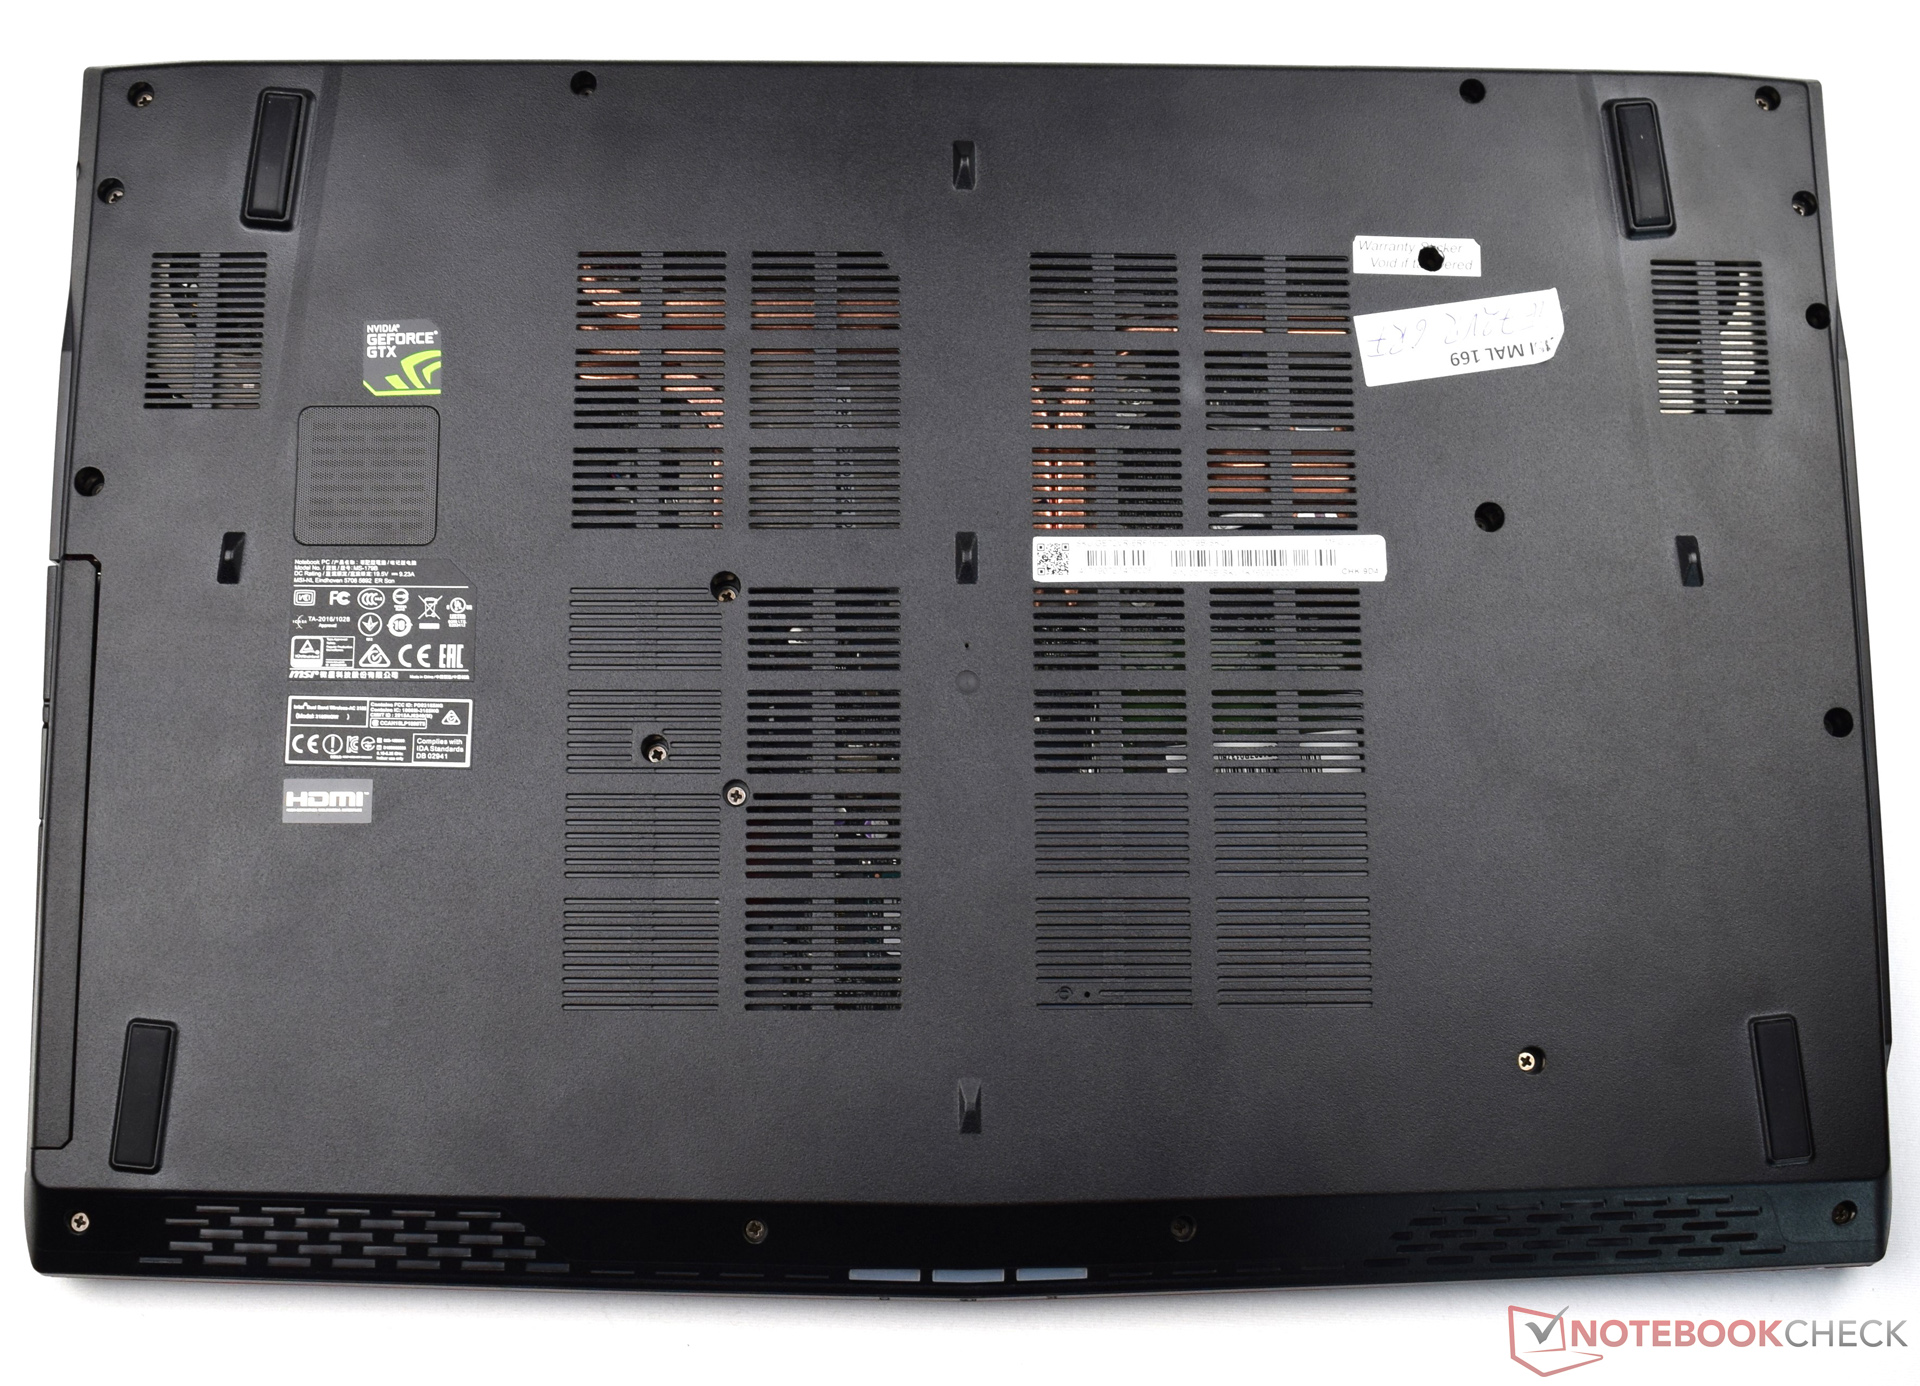
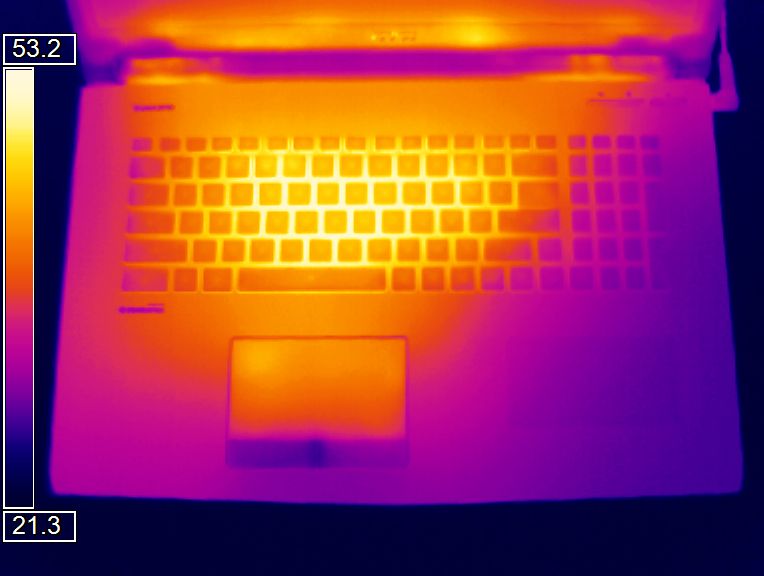
In general, the case temperatures are alright. While the chassis achieves a maximum of 32 °C in idle mode, our thermometer showed up to 46 °C under full load. More powerful gaming notebooks often exceed the 59 °C level in the stress test. However, MSI could improve the position of the components. In contrast to the thicker 17-inch sibling GT73VR, the palm rests alreadsy get slightly warm in idle mode. Among others, this is caused by the location of the HDD.
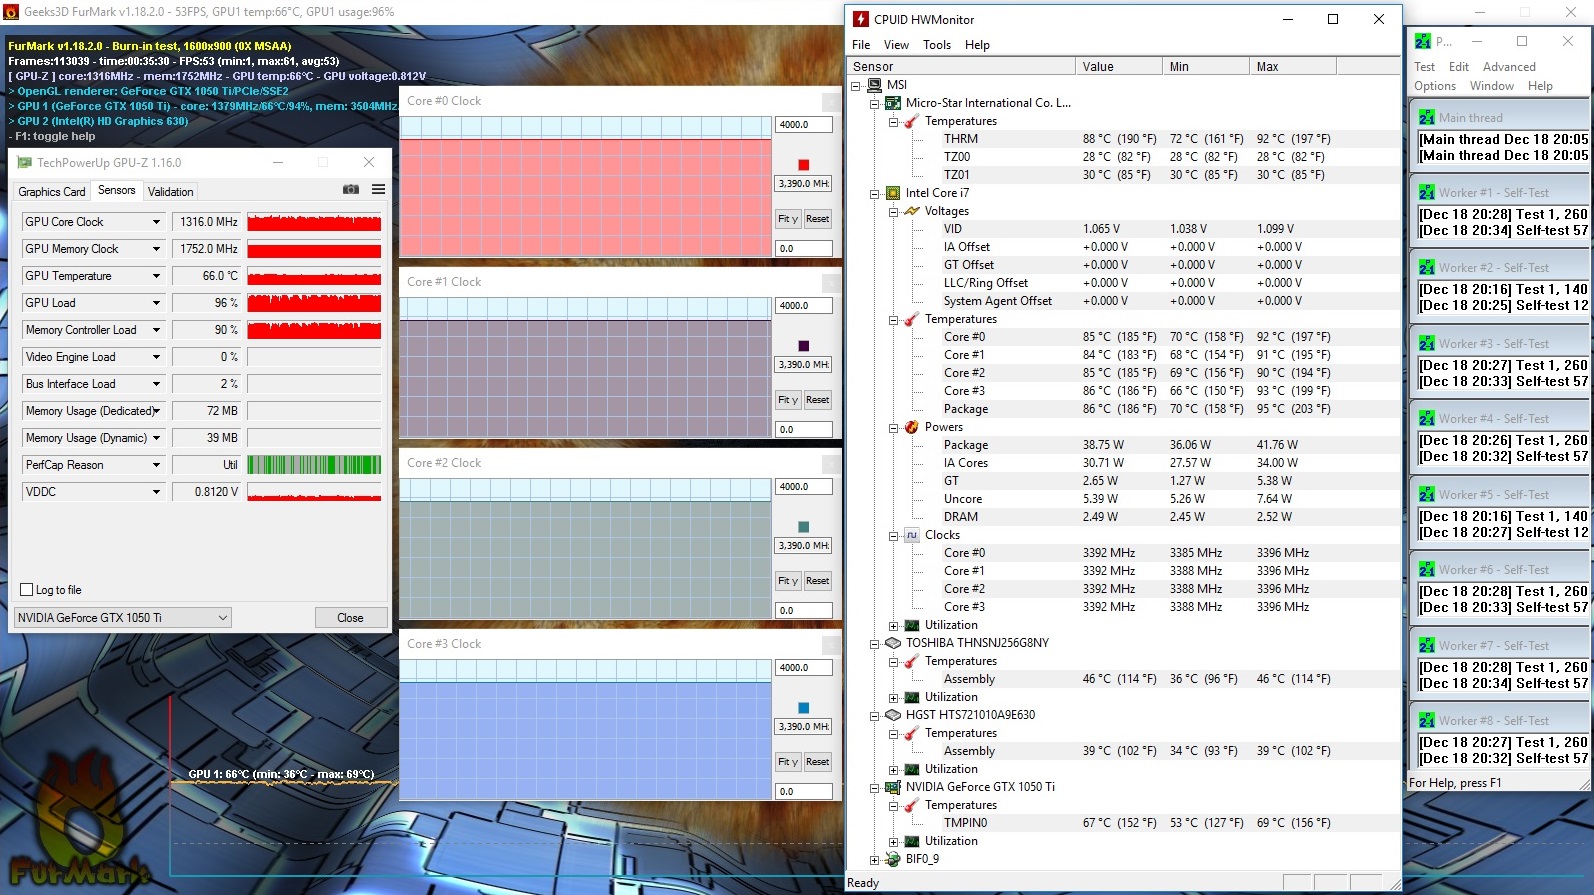
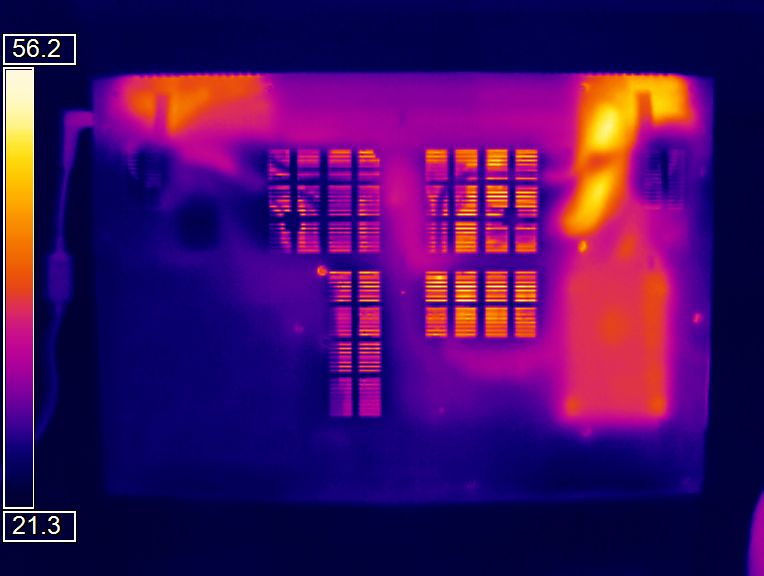
Let's briefly discuss the inner components. »Thanks« to fact that the CPU Turbo sticks at 3.4 GHz, the Core i7-7700HQ gets quite warm unter full load. After one hour, the HWMonitor tool reported about 90 °C. Most of the time, the GPU remained significantly cooler with a maximum of 69 °C - no reason to complain apart from the fact that it slightly throttles.
(-) The maximum temperature on the upper side is 45.8 °C / 114 F, compared to the average of 40.4 °C / 105 F, ranging from 21.2 to 68.8 °C for the class Gaming.
(-) The bottom heats up to a maximum of 45.2 °C / 113 F, compared to the average of 43.2 °C / 110 F
(+) In idle usage, the average temperature for the upper side is 26.7 °C / 80 F, compared to the device average of 33.9 °C / 93 F.
(-) The palmrests and touchpad can get very hot to the touch with a maximum of 40.3 °C / 104.5 F.
(-) The average temperature of the palmrest area of similar devices was 28.8 °C / 83.8 F (-11.5 °C / -20.7 F).
| MSI GE72 7RE-046 GeForce GTX 1050 Ti Mobile, i7-7700HQ | Aorus X7 v6 GeForce GTX 1070 Mobile, 6820HK | HP Omen 17-w110ng GeForce GTX 1070 Mobile, 6700HQ | MSI GS73VR 6RF GeForce GTX 1060 Mobile, 6700HQ | Asus GL702VM-GC102D GeForce GTX 1060 Mobile, 6700HQ | |
|---|---|---|---|---|---|
| Heat | -3% | -2% | -7% | -8% | |
| Maximum Upper Side * (°C) | 45.8 | 47.5 -4% | 45 2% | 50.8 -11% | 53.1 -16% |
| Maximum Bottom * (°C) | 45.2 | 54.5 -21% | 54.3 -20% | 60 -33% | 44.9 1% |
| Idle Upper Side * (°C) | 31.7 | 28.6 10% | 29.6 7% | 27.4 14% | 32.9 -4% |
| Idle Bottom * (°C) | 29.9 | 28.8 4% | 28.6 4% | 28.8 4% | 33.4 -12% |
* ... smaller is better
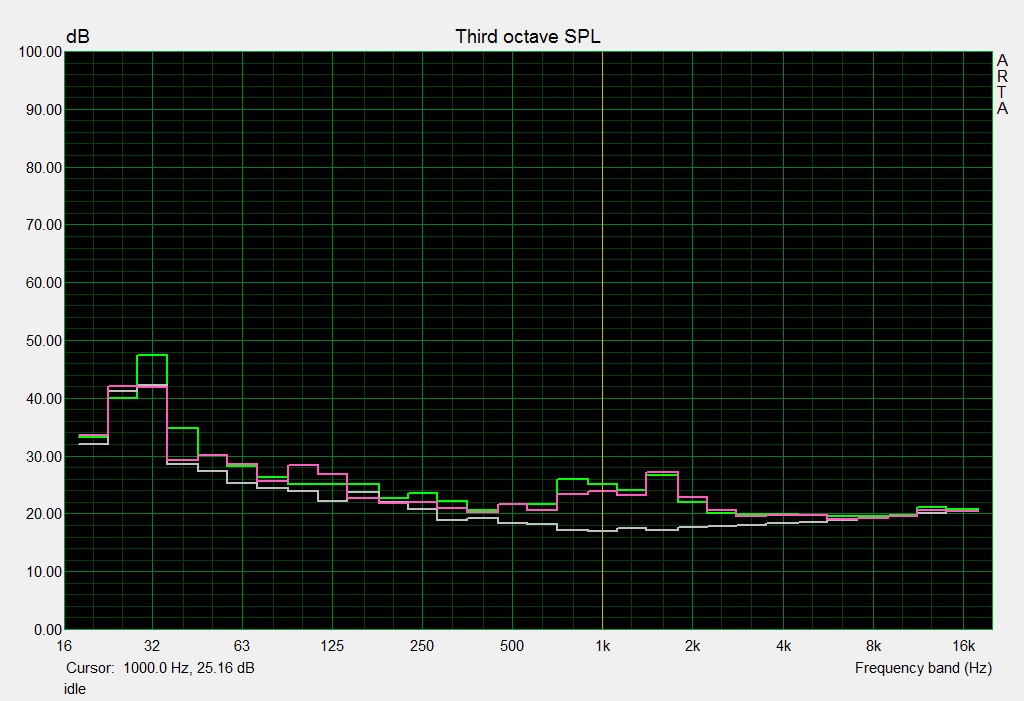
Speakers
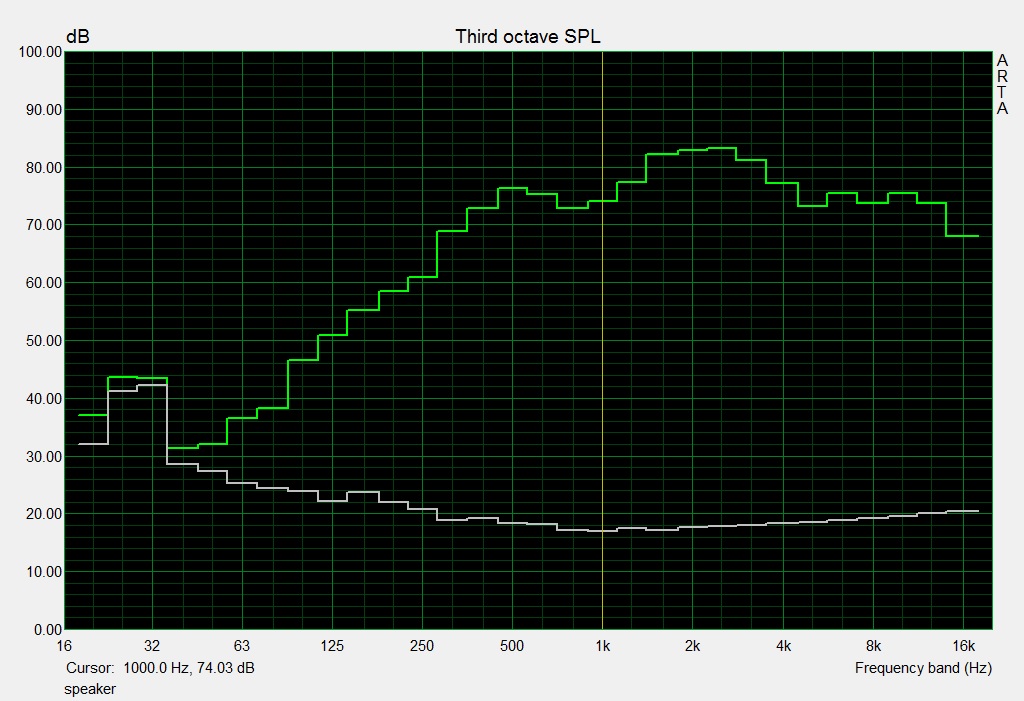
MSI GE72 7RE-046 audio analysis
(+) | speakers can play relatively loud (91 dB)
Bass 100 - 315 Hz
(-) | nearly no bass - on average 17.2% lower than median
(±) | linearity of bass is average (9.2% delta to prev. frequency)
Mids 400 - 2000 Hz
(+) | balanced mids - only 3.3% away from median
(+) | mids are linear (4.7% delta to prev. frequency)
Highs 2 - 16 kHz
(+) | balanced highs - only 3.3% away from median
(+) | highs are linear (4% delta to prev. frequency)
Overall 100 - 16.000 Hz
(+) | overall sound is linear (13.7% difference to median)
Compared to same class
» 21% of all tested devices in this class were better, 7% similar, 72% worse
» The best had a delta of 6%, average was 18%, worst was 132%
Compared to all devices tested
» 15% of all tested devices were better, 4% similar, 81% worse
» The best had a delta of 4%, average was 23%, worst was 134%
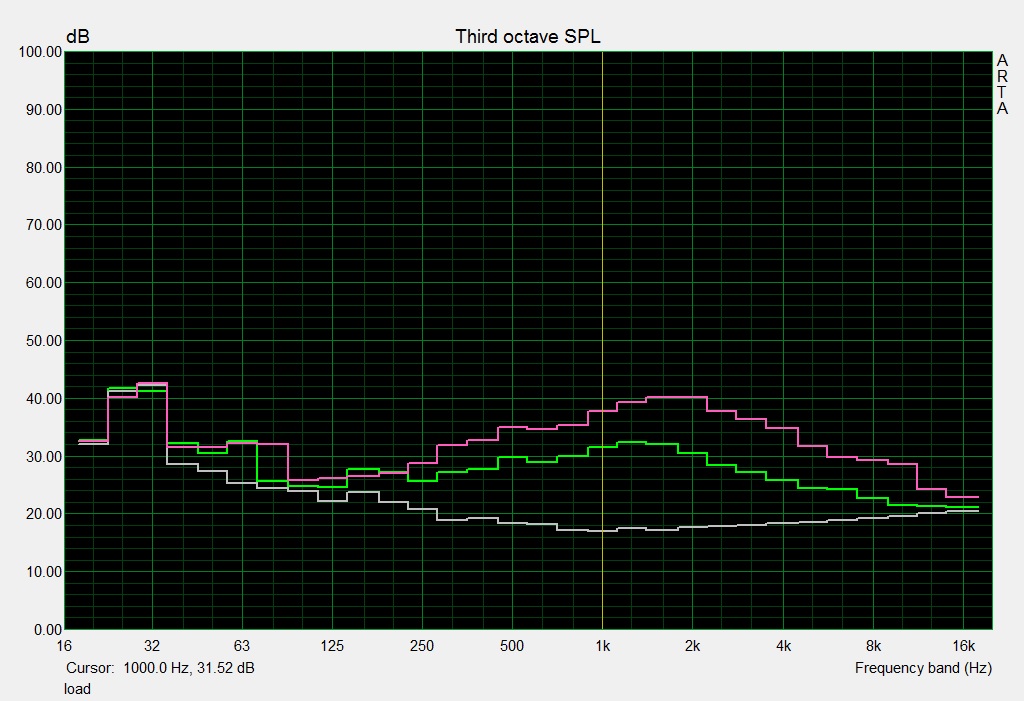
Asus GL702VM-GC102D audio analysis
(-) | not very loud speakers (64 dB)
Bass 100 - 315 Hz
(±) | reduced bass - on average 7.7% lower than median
(±) | linearity of bass is average (14% delta to prev. frequency)
Mids 400 - 2000 Hz
(+) | balanced mids - only 1.5% away from median
(+) | mids are linear (6.3% delta to prev. frequency)
Highs 2 - 16 kHz
(±) | reduced highs - on average 5.3% lower than median
(±) | linearity of highs is average (9.8% delta to prev. frequency)
Overall 100 - 16.000 Hz
(±) | linearity of overall sound is average (16.7% difference to median)
Compared to same class
» 43% of all tested devices in this class were better, 10% similar, 47% worse
» The best had a delta of 6%, average was 18%, worst was 132%
Compared to all devices tested
» 29% of all tested devices were better, 7% similar, 64% worse
» The best had a delta of 4%, average was 23%, worst was 134%
Frequenzdiagramm im Vergleich (Checkboxen oben an-/abwählbar!)
Energy Management
Power Consumption
Since the GE72 7RE is slightly more designed for mobility than its thicker siblings, MSI omitted G-Sync support and decided to implement an automatic graphics switch instead. Nvidia's Optimus technology uses either the GTX 1050 Ti or the processor graphics (Intel HD Graphics 630) depending on the software. Hence, energy is not wasted when running simple tasks such as office or web surfing.
The power consumption does hardly differ from several GTX 1060 notebooks, for example the Asus GL702VM, which is almost on par overall. MSI includes a 150 W power adapter, which weighs moderate 516 g and should be sufficient for the used components.
| Off / Standby | |
| Idle | |
| Load |
|
Key:
min: | |
| MSI GE72 7RE-046 GeForce GTX 1050 Ti Mobile, i7-7700HQ | Aorus X7 v6 GeForce GTX 1070 Mobile, 6820HK | HP Omen 17-w110ng GeForce GTX 1070 Mobile, 6700HQ | MSI GS73VR 6RF GeForce GTX 1060 Mobile, 6700HQ | Asus GL702VM-GC102D GeForce GTX 1060 Mobile, 6700HQ | |
|---|---|---|---|---|---|
| Power Consumption | -67% | -28% | -44% | -3% | |
| Idle Minimum * (Watt) | 14 | 29 -107% | 19 -36% | 22.6 -61% | 15.6 -11% |
| Idle Average * (Watt) | 20 | 31 -55% | 25 -25% | 32.7 -64% | 20.2 -1% |
| Idle Maximum * (Watt) | 25 | 38 -52% | 31 -24% | 32.8 -31% | 21.4 14% |
| Load Average * (Watt) | 82 | 111 -35% | 90 -10% | 114.7 -40% | 90 -10% |
| Load Maximum * (Watt) | 135 | 253 -87% | 193 -43% | 167.9 -24% | 147 -9% |
* ... smaller is better
Battery Life
The graphics switch of the GE72 7RE, can only make up for the modest battery capacity of 51 Wh to some extent. 3:04 hours of web surfing via Wi-Fi and 3:15 hours HD video playback at medium brightness are not much for users who are fond of travelling. Those who are frequently on the move should therefore rather buy the HP Omen 17 (95 Wh) or the Asus GL702VM (76 Wh).
| MSI GE72 7RE-046 51.4 Wh | Aorus X7 v6 94 Wh | HP Omen 17-w110ng 95 Wh | MSI GS73VR 6RF 65 Wh | Asus GL702VM-GC102D 76 Wh | |
|---|---|---|---|---|---|
| Battery runtime | -3% | 25% | 16% | 34% | |
| H.264 (h) | 3.3 | 3.9 18% | 4.4 33% | ||
| WiFi v1.3 (h) | 3.1 | 3 -3% | 4.1 32% | 3.6 16% | 4.2 35% |
Pros
Cons
Verdict
Although the GE72 7RE lacks a certification for virtual reality, you can still consider it a gaming notebook. Nvidia's brand new GeForce GTX 1050 Ti mostly offers sufficient performance for achieving halfway decent frame rates with a resolution of 1,920 x 1,080 pixels and high details.
The performance will first fall quickly in the 3K and 4K range and make demanding titles unplayable. However, gamers should generally consider spending extra money on a GTX 1060. In the long run, 6 GB VRAM are more future-proof than 4 GB and such devices hardly cost more.
In our opinion, Intel's Kaby Lake architecture is quite unspectacular and only slightly improves CPU performance.
Those you are on the fence between a cheap multimedia laptop and a genuine high-end laptop might be happy with the GE72 7RE.
MSI GE72 7RE-046
- 12/28/2016 v6 (old)
Florian Glaser
Price comparison
