Notebookcheck Logo

Dirt Showdown Benchmarked

Dirtier than ever. With Dirt Showdown the race game expert Codemasters follows in the footsteps of the action-packed Flatout series. Traditional rallies are passé for now. The developer focuses on flashy demolition derbies. Find out if the track also pushes mobile graphics cards to their limits.
Dirt Showdown (Artwork: Codemasters)

In the past, particular focus was placed on the rally aspect in the Dirt series. Thanks to the successful mixture of arcade and simulation not only action fans (Need for Speed, Burnout, etc.), but also fans of authenticity were fairly satisfied. Besides the car model and track design, especially the atmosphere and technology convinced.

Graphics

First-rate technology

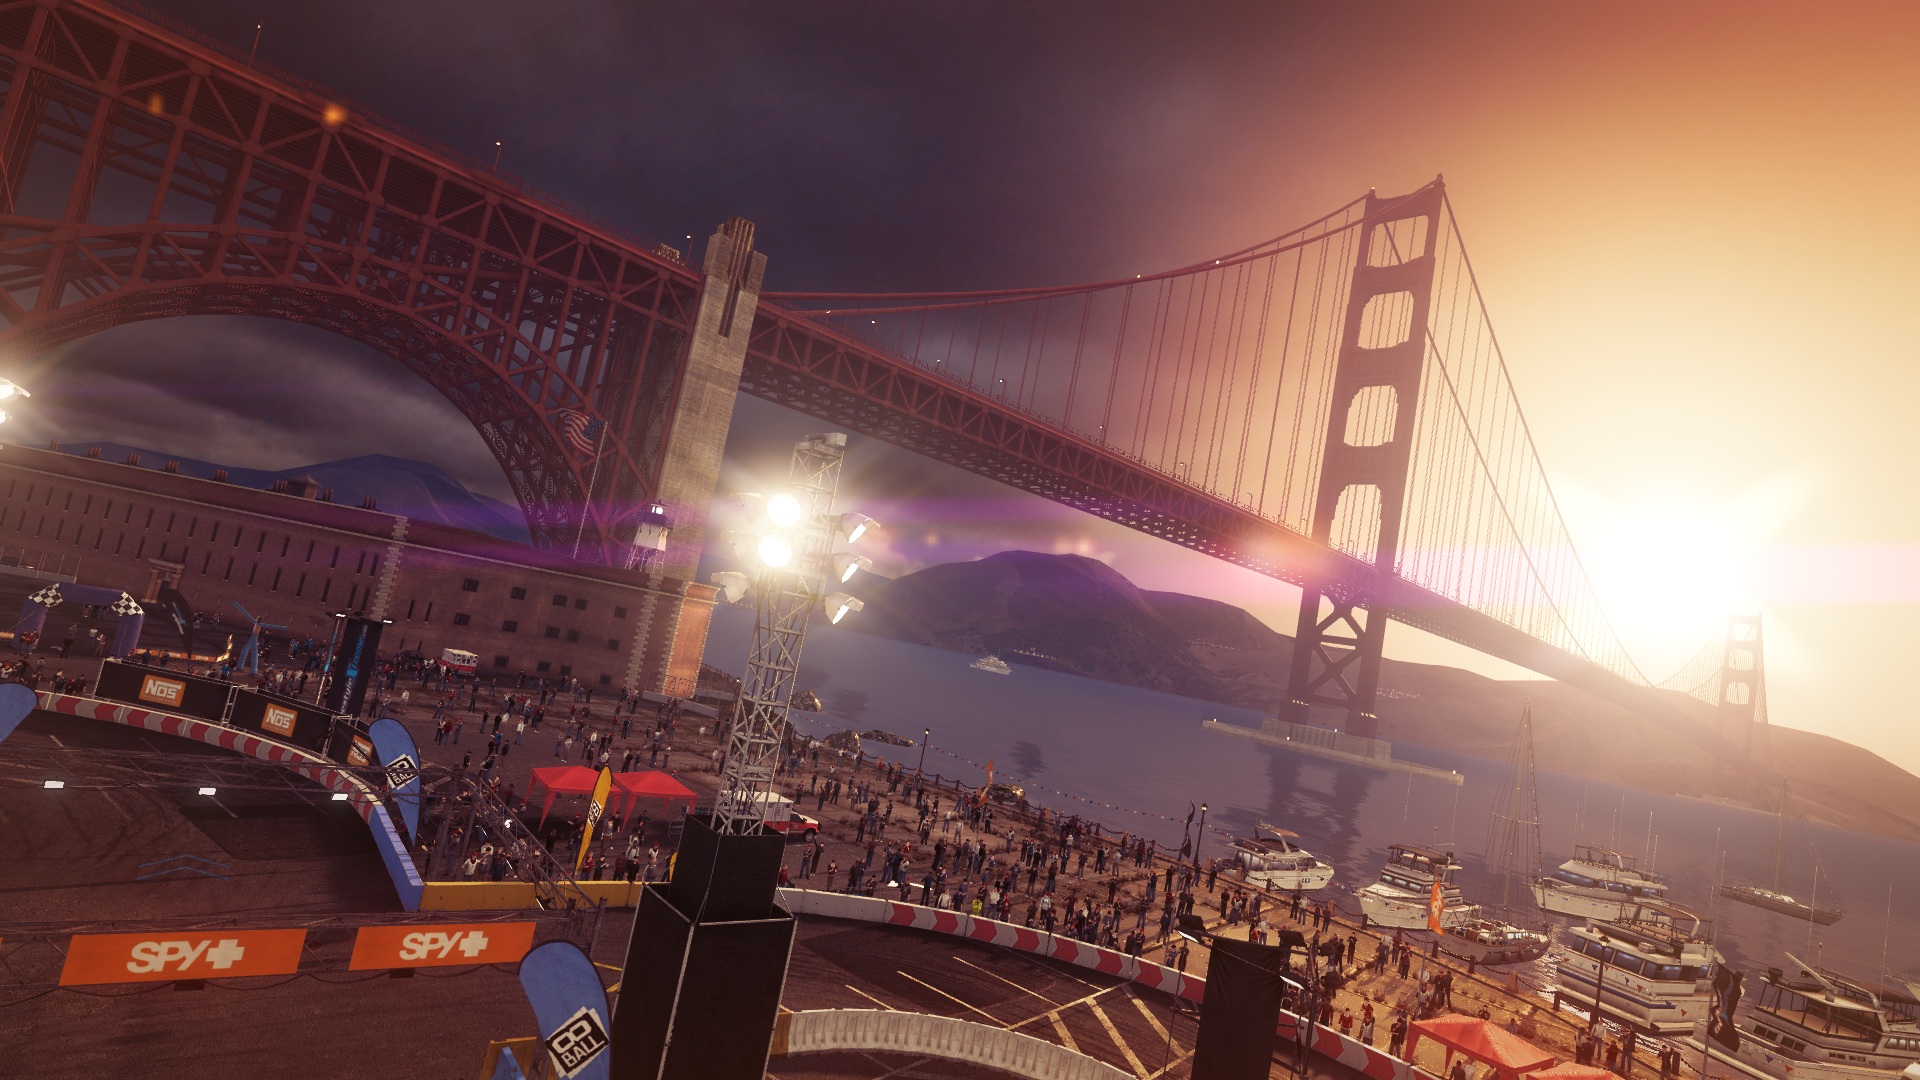
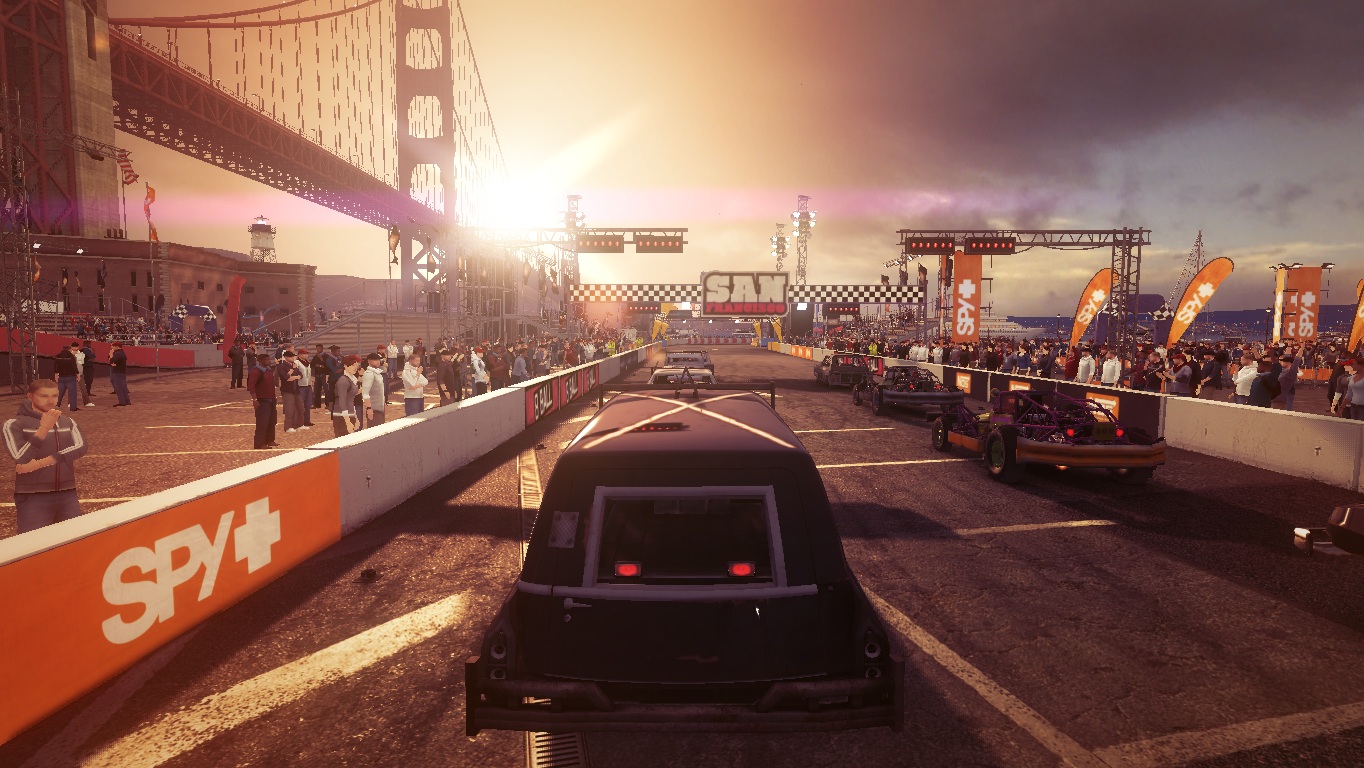
The same is true for the latest version. The screenshots show that Dirt Showdown offers outstanding graphics. Few rivals can present such clear textures, authentic reflections and fine shadows. The coherent light impressed us most – depending on the time of day, the levels shine in a different light. Sometimes you would just simply like to dive into the screen. The bundle is finished off with fastidious details such as cheering spectators.

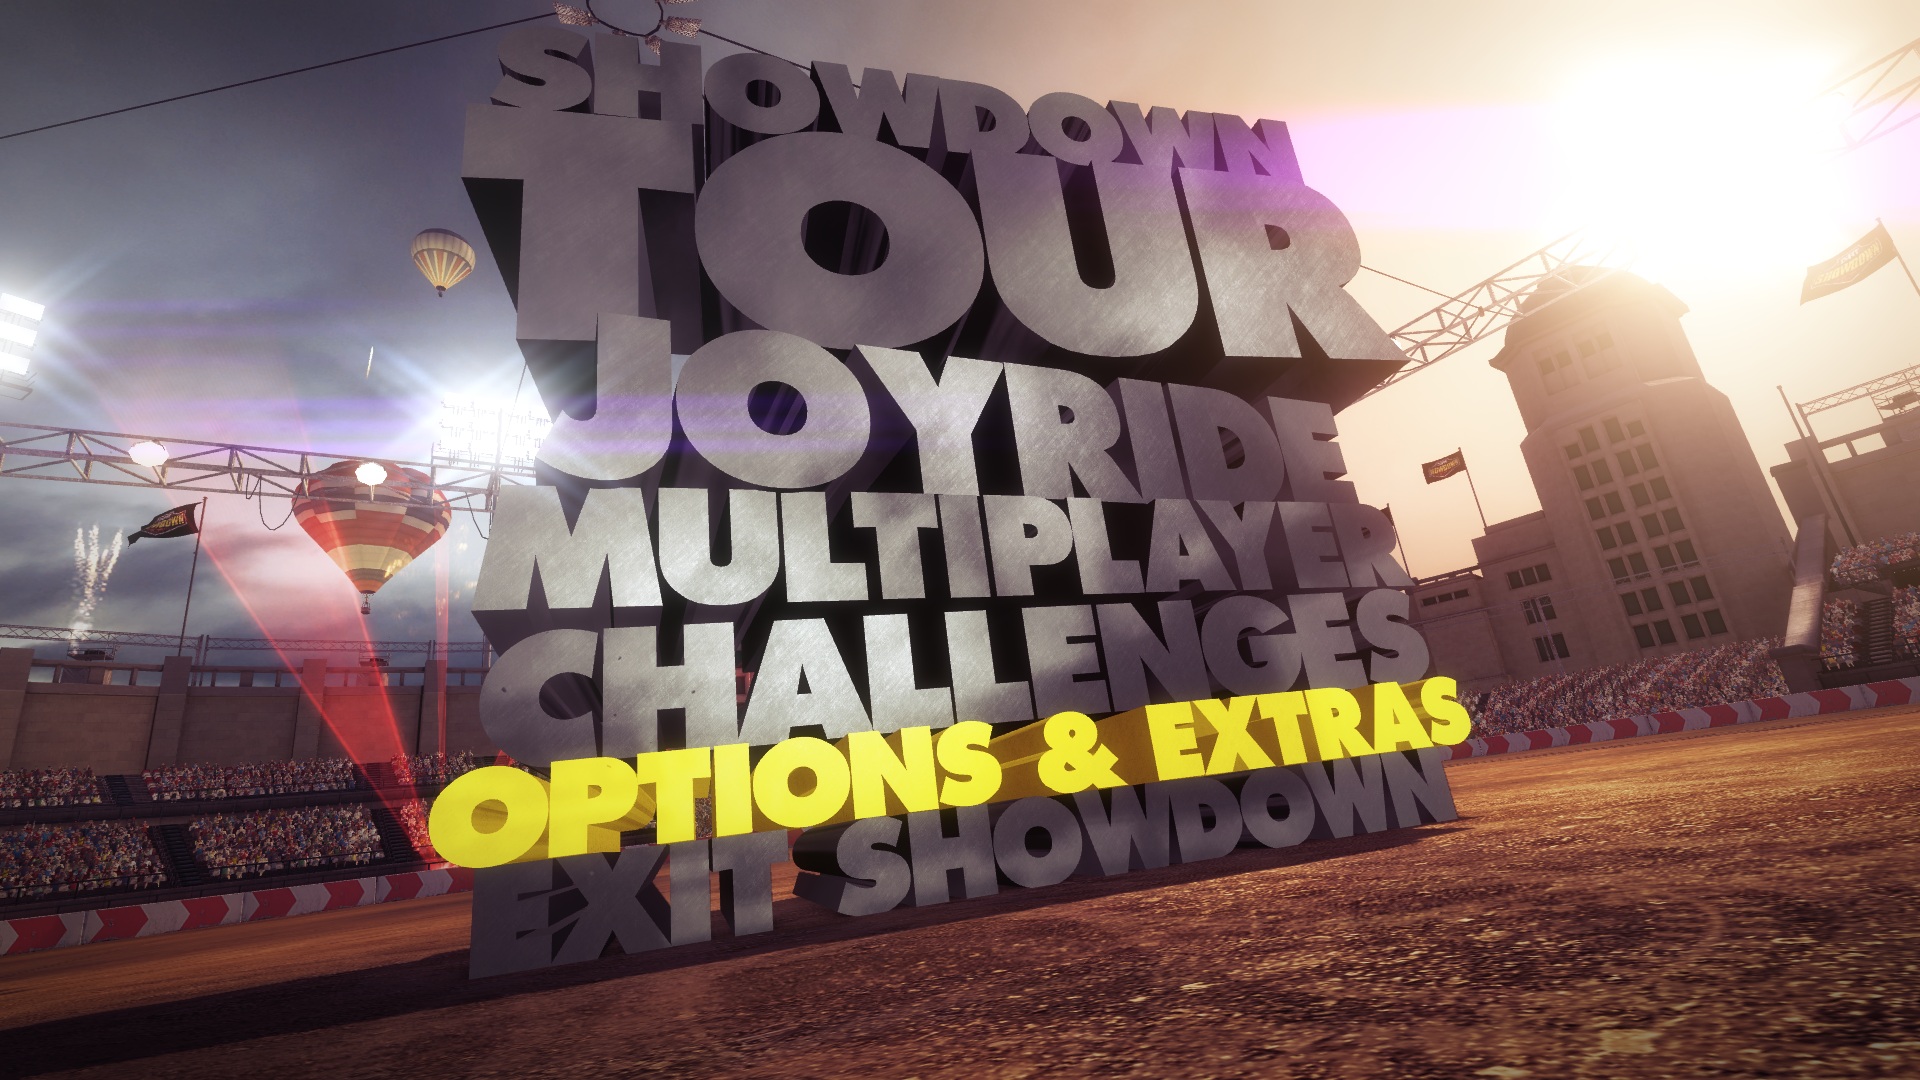
Beyond that, the developer earns praise for the stylish menus that again make a quite complex impression, but whose design fits perfectly to the "destruction" motto.

The hardware requirements have increased a bit compared with Dirt 3. The latest episode occasionally runs noticeably slower when using the same hardware and settings.

Benchmarks

Cool menus
Cool menus

We use the limited demo version for our benchmarks that can be downloaded for free via the online platform Steam. Under "Showdown Tour" "Spy+ Pro" you will discover the 8-ball race that takes place in sunny San Francisco (8 ball refers to the layout).

We wait for booting and the intro video to finish and start recording with the tool Fraps when the user interface (position, health, etc.) appears. The benchmark is stopped on the finish line after exactly one round.

Settings

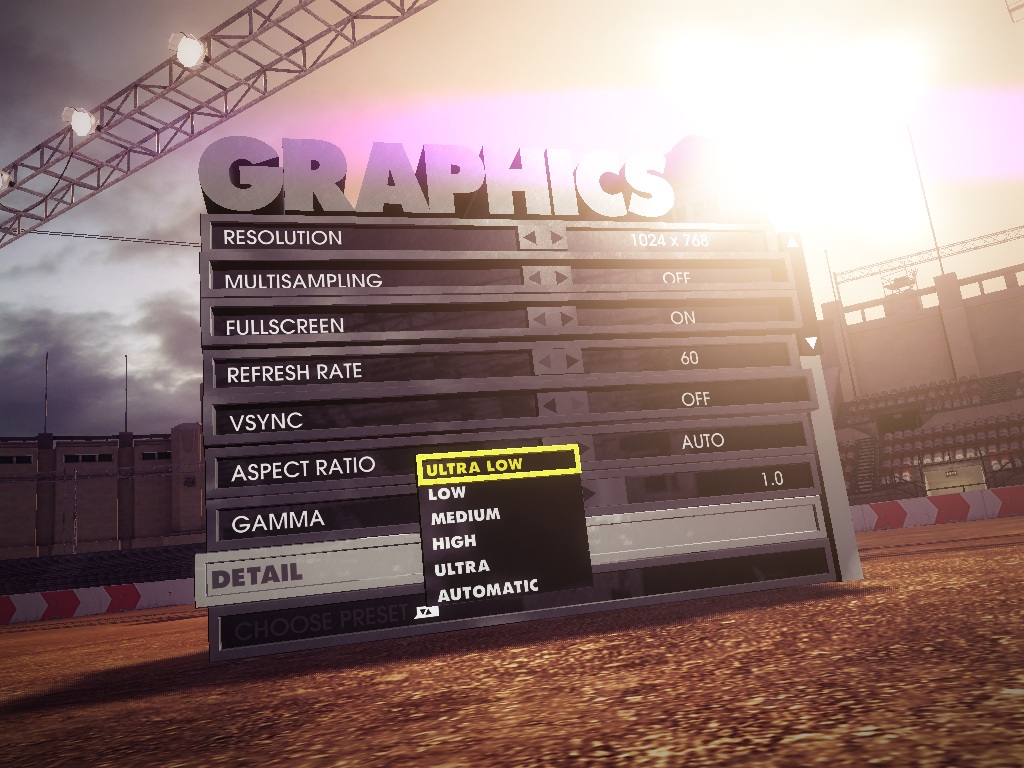
The graphics options are found in a clearly arranged menu. In addition to resolution, anti-aliasing (Codemasters relies on MSAA) and the screen mode, you can also modify the refresh rate and aspect ratio. To prevent annoying time lapses, VSync should also be enabled (the benchmarks were performed without VSync because of the fps limit). The detail level can be set automatically, manually or via five presets.

Great: Dirt Showdown accepts all modifications directly in a running game. Therefore, unlike other games, there is no need to restart or stop the race when altering the settings. Here are our four test settings:

Ultra setting: 1920 x 1080, ultra preset, 4x MSAA
High setting: 1366 x768, high preset, 2x MSAA
Medium setting: 1366 x 768, medium preset
Low setting: 1024 x 768, ultra low preset

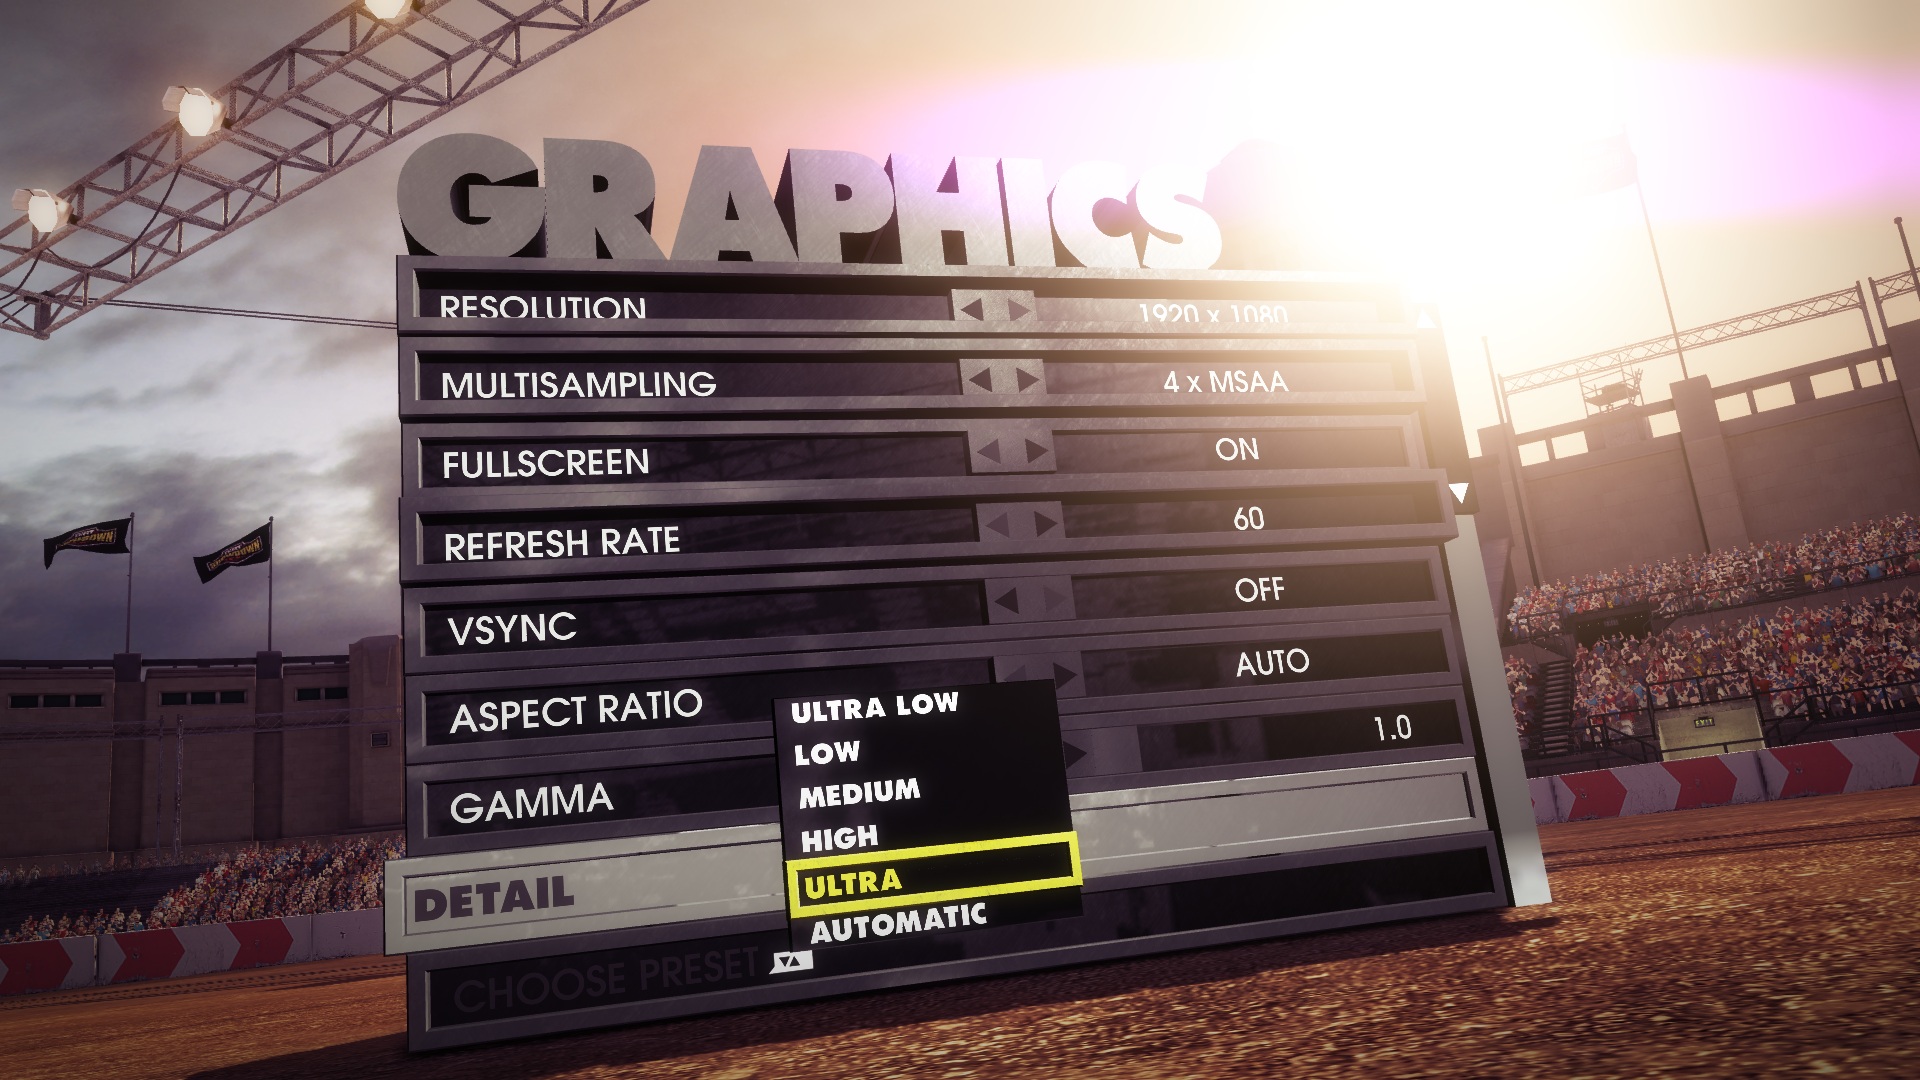
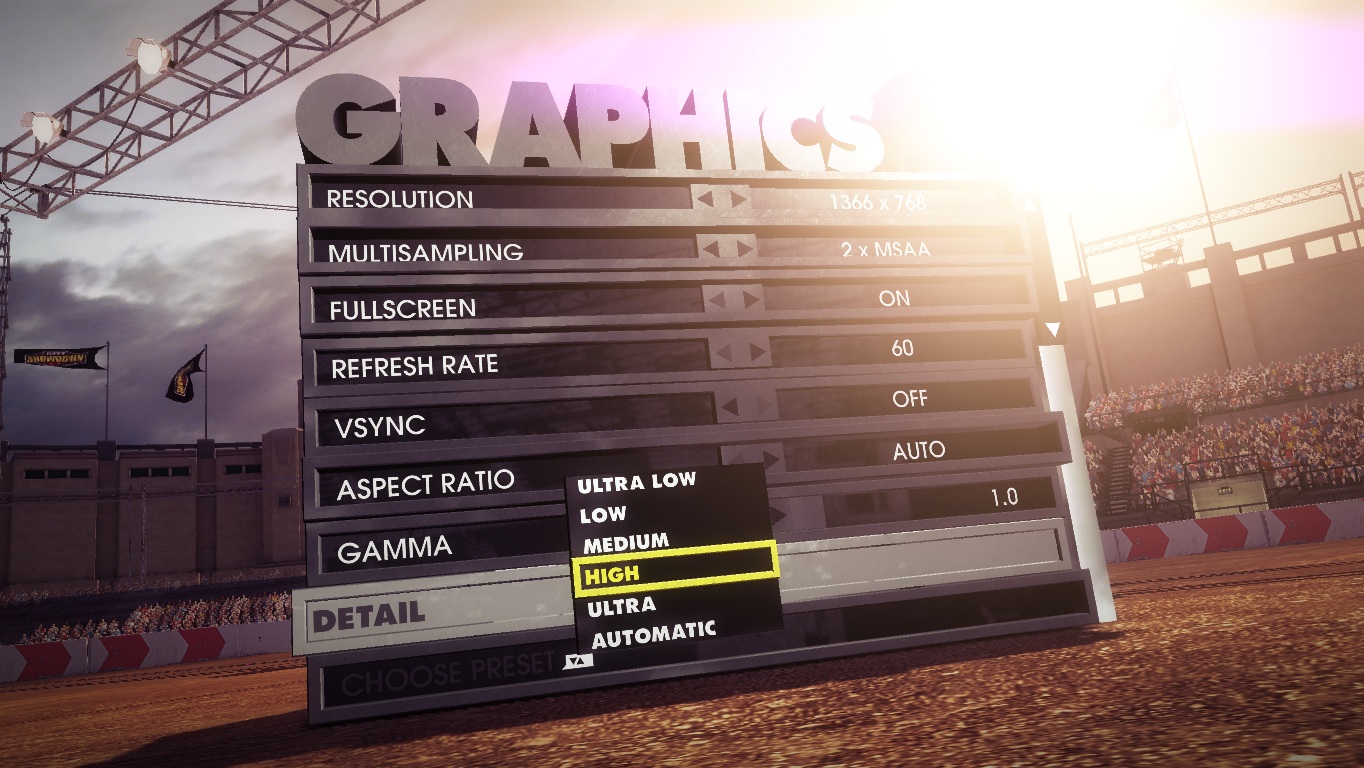
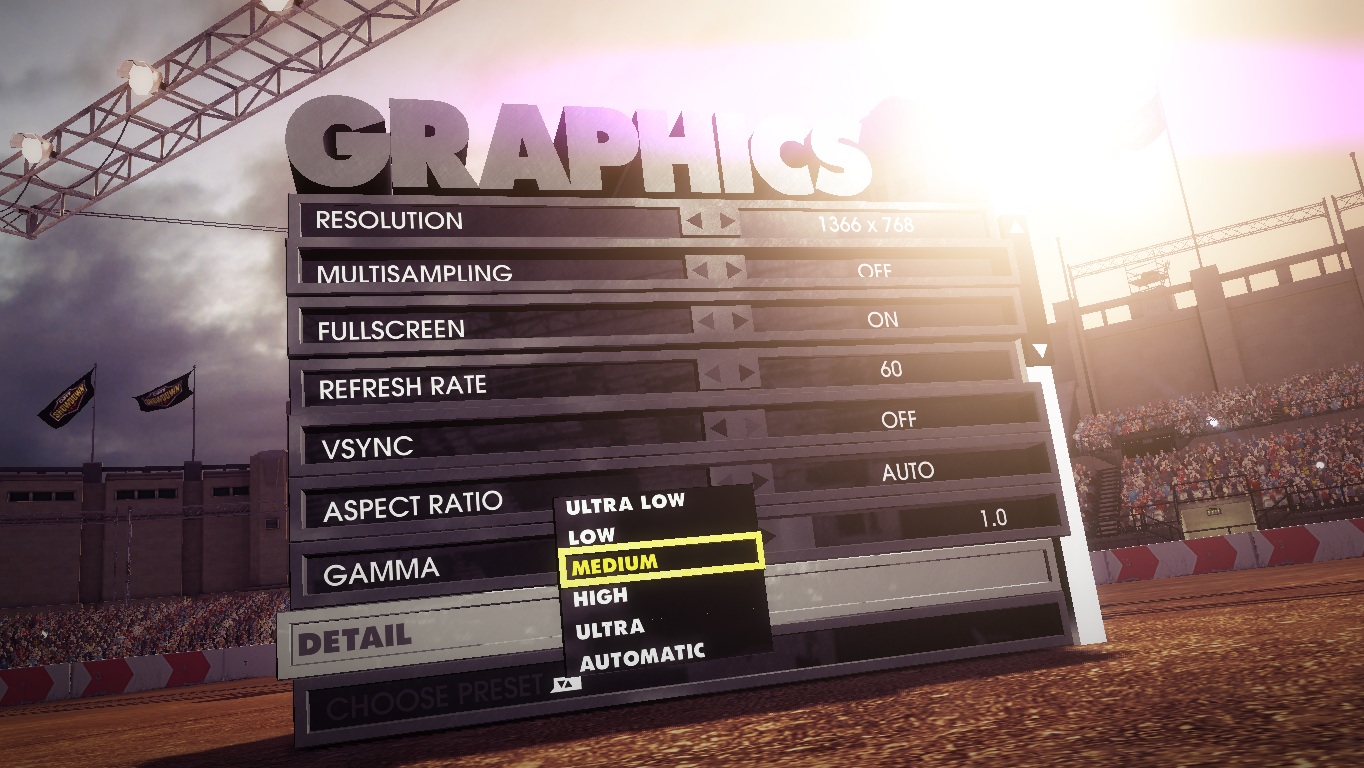
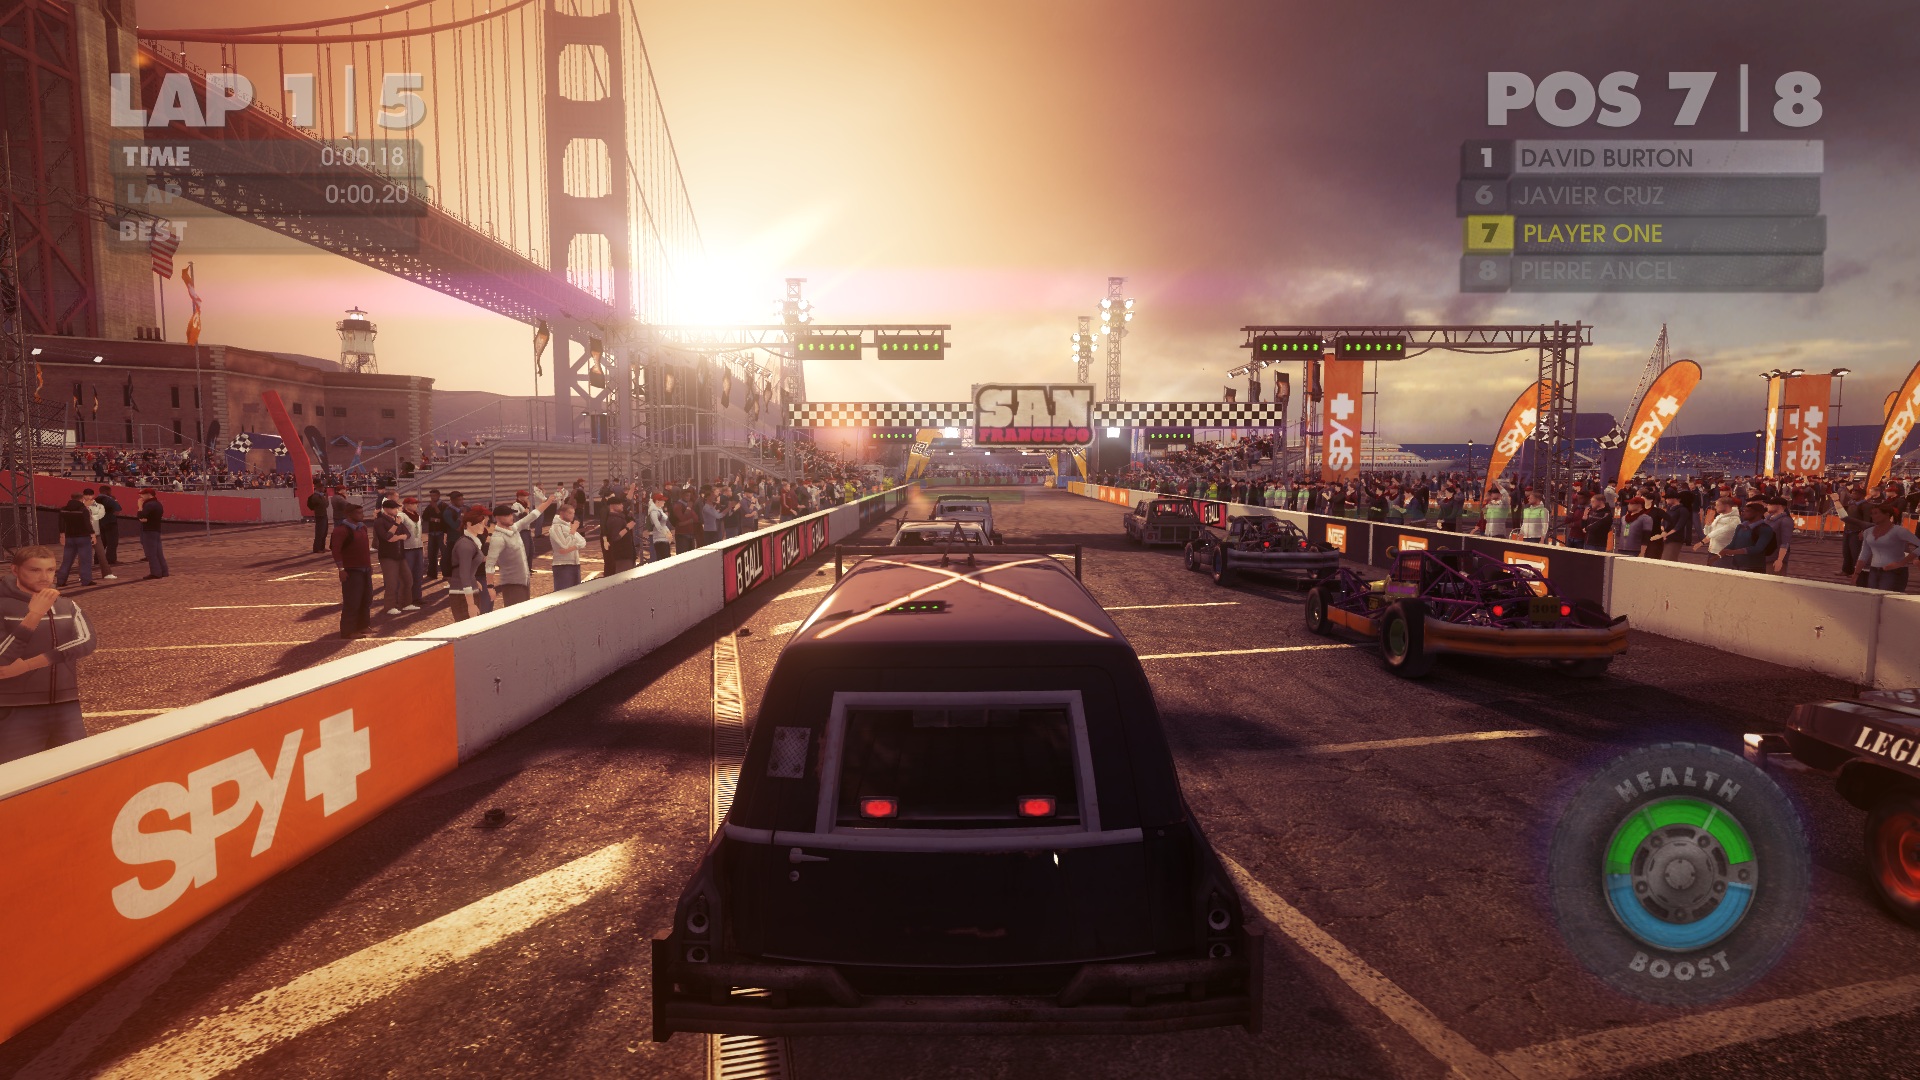
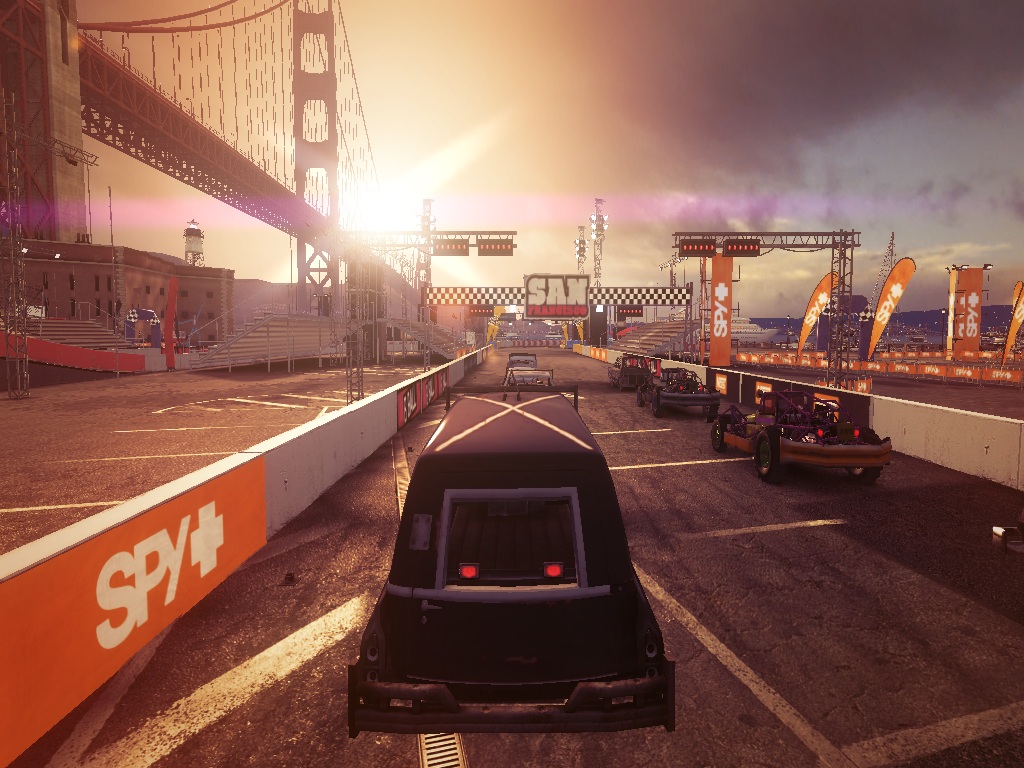
As expected, the ultra and high presets do not differ much. With the exception of the coarser shadow (compare picture I and II), you cannot see any significant deviation even when looking closely. Texture quality, illumination and reflections are on a high standard.

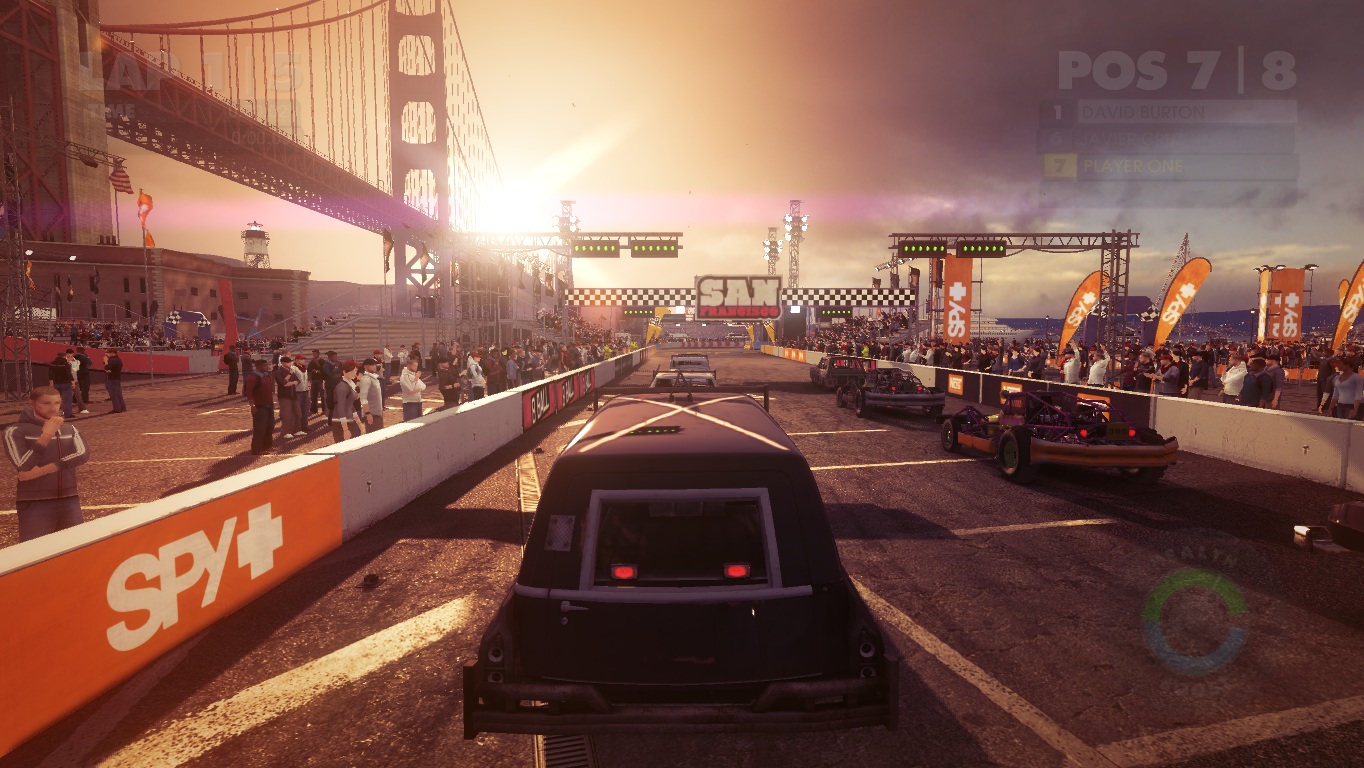
Medium settings also look good. However, some objects at the sides (note the spectators in the third picture) do not cast a shadow. There are virtually no shadows or reflections in minimum graphics settings. The absence of spectators also has a negative impact on the atmosphere (picture IV).

Ultra
Ultra
High
High
Medium
Medium
Ultra Low
Ultra Low

Results

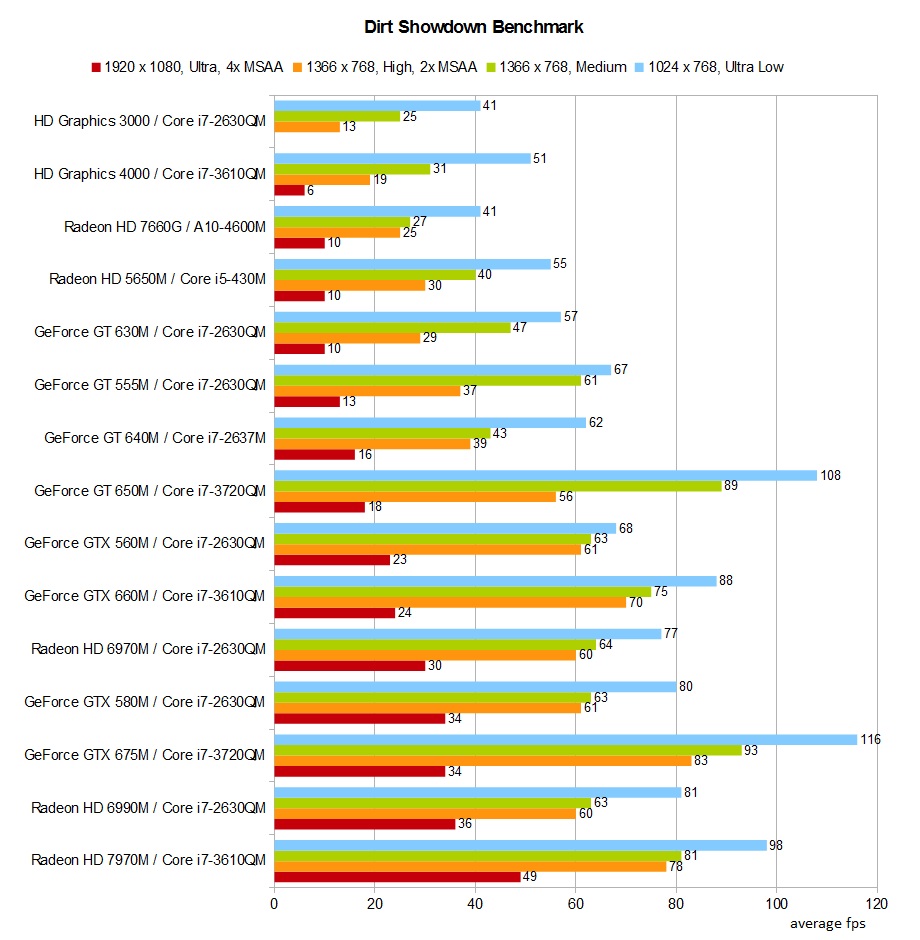
If you want to enjoy Dirt Showdown in its full beauty, you will have to fall back on a notebook with a high-end graphics card. Ultra details, 1920x1080 pixels and four-time anti-aliasing, are only properly displayed on a top model, such as the Radeon HD 6990M or GeForce GTX 675M. At least an upper midrange member (e.g. GeForce GT 640M) should be installed in the notebook for high details and two-time anti-aliasing.

Typical multimedia graphics cards on the level of a GeForce GT 630M can only display the medium preset smoothly in higher resolutions. In the meantime, minimum settings are also properly processed by integrated GPUs, such as the HD Graphics 3000 (only applies for low resolutions).

If we rule out the ultra preset, the processor has a surprising amount of impact in Dirt Showdown. Our benchmark chart shows that notebooks with a weaker graphics card frequently overtake notebooks with a stronger GPU model – depending on the installed CPU.

Benchmark chart: Dirt Showdown

Test Systems

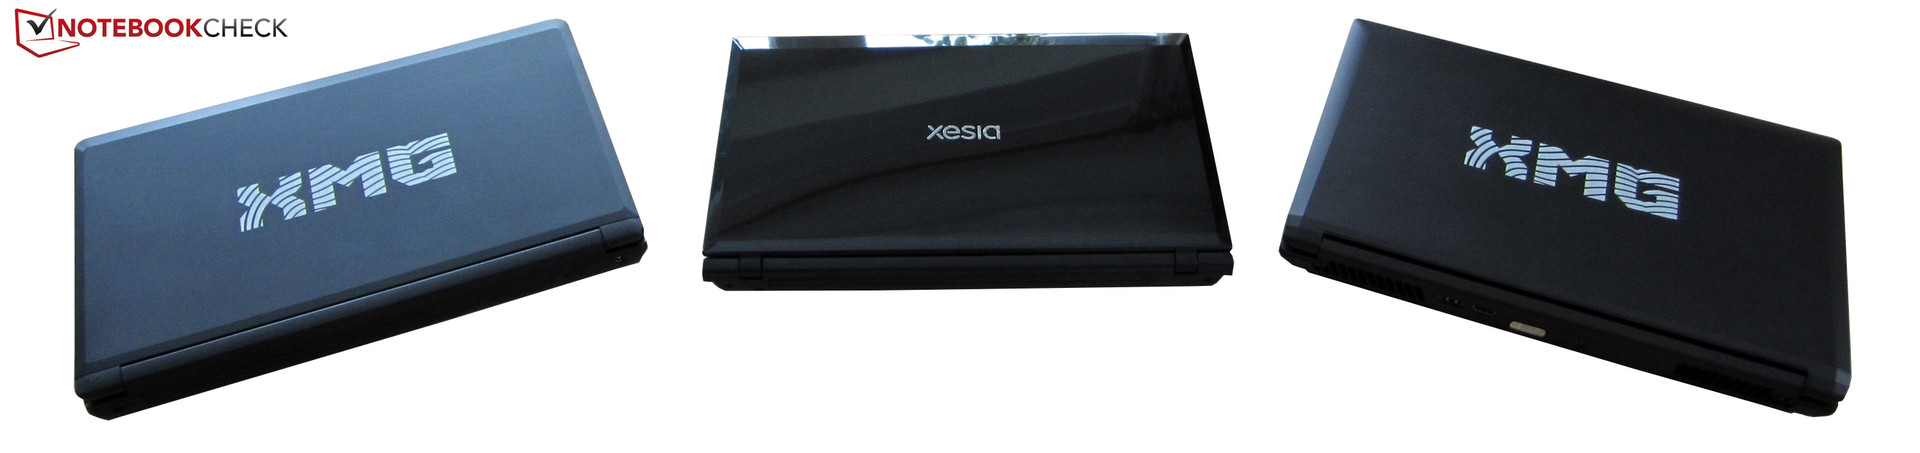
Parts of the results originate from Schenker Notebooks (mysn.de):

  • XMG P501 (Core i7-2630QM, GeForce GTX 560M, GTX 580M, Radeon HD 6970M & HD 6990M, 8 GB RAM)
  • XMG A501 (Core i7-2630QM, HD Graphics 3000 & GeForce GT 555M, 8 GB RAM)
  • Xesia M501 (Core i7-2630QM, GeForce GT 630M, 4 GB RAM)

Many thanks for the great support!

From left to right: Schenker XMG A501, Xesia M501 & XMG P501

In following, a list of all performed benchmarks:

Show Restrictions
PosModel< PrevNext >Dirt Showdown
 Dirt Showdown (2012)
low
1024x768
Ultra Low Preset
med.
1366x768
Medium Preset
high
1366x768
High Preset
2xMSAA
ultra
1920x1080
Ultra Preset
4xMSAA
NVIDIA GeForce GTX 680
102
77
75
75
AMD Radeon HD 7970
87.3
73.1
69.2
61.2
NVIDIA GeForce GTX 880M
103.1
95.1
90.5
77.9
NVIDIA GeForce GTX 660 Ti
90.9
72.9
71.7
62.1
NVIDIA GeForce GTX 780M
112.9
87.8
88
66n3
AMD Radeon HD 7870
87.3
71.2
68.8
53.9
NVIDIA GeForce GTX 965M
98.1
90.6
65.9
AMD Radeon HD 8970M
115.1
85.3
59.25n2
44.6n2
NVIDIA GeForce GTX 680M
101.1
81.3
75.5n2
53.4n3
AMD Radeon HD 7970M
97.7
81.1
78.3
48.7n3
NVIDIA GeForce GTX 770M
109.9
85.3
84.9
45.2
NVIDIA GeForce GTX 860M
96.9
91.6
48.4
NVIDIA GeForce GTX 675MX
80.3
84.5
39.4
NVIDIA GeForce GTX 850M
61.9
39
AMD Radeon HD 6870
42
NVIDIA GeForce GTX 765M
122
90.45n2
81.6n3
33.6n3
ATI Radeon HD 5850
85.8
75.6
74.4
42.7
NVIDIA GeForce GTX 675M
115.6
93
82.7
34.02
NVIDIA GeForce GTX 580M
79.6
62.6
61.4
34.3
PosModel< PrevNext >Dirt Showdown
low med. high ultra
AMD Radeon HD 6990M
81.4
62.7
60.1
35.7
AMD Radeon HD 7770
94
71
67.9
33.2
NVIDIA GeForce GT 650M SLI
104.7
74.05n2
51.35n2
19.2n2
NVIDIA GeForce GTX 670MX
93.7
73.3
76.1n2
31.6n2
NVIDIA GeForce GTX 760M
81.35n2
55.25n2
50.9n2
30.1
NVIDIA GeForce GTX 670M
101
77
73.2n2
29.4n2
AMD Radeon HD 6970M
76.6
64.2
59.5
30.3
AMD Radeon HD 8870M
72.9n2
47.2n2
37.4n2
24.5n2
NVIDIA GeForce GT 755M
74.3
62.5
57.8
25.8
NVIDIA GeForce GTX 660M
81.55n2
65.8n2
50.7n4
23.4n3
AMD Radeon HD 8850M
70
46.7
31.9
AMD Radeon R9 M265X
92.9
74.5
68.9
21.8
AMD Radeon HD 8790M
82
47
27
19
NVIDIA GeForce GT 750M
108.2
81.8
59
21.2
NVIDIA GeForce GT 650M
91n7
61.05n8
53.9n11
18.15n10
NVIDIA GeForce GT 745M
90.65n2
69.7n2
51.3n2
19.7
NVIDIA GeForce GTX 560M
67.8
63
60.5
23
NVIDIA GeForce GT 740M
64.3n5
48.8n5
32.9n5
17.9n3
NVIDIA GeForce GT 735M
57.5
40.9
14.8
NVIDIA GeForce GT 730M
51
32.4
19.7
PosModel< PrevNext >Dirt Showdown
low med. high ultra
NVIDIA GeForce GT 645M
74.6n2
53.6n3
39.6n3
17.2
AMD Radeon HD 8750M
71.3
44.3
35.1
15.9
NVIDIA GeForce GT 640M
75n3
43.8n3
39n3
15.6n2
AMD Radeon HD 7730M
74
45
33
15
NVIDIA GeForce GT 640M LE
73.8
55.1
36.1
13.4
AMD Radeon HD 8730M
55.2
37.5
33
14.8
NVIDIA GeForce GT 555M
66.6
61.4
37.1
12.9
AMD Radeon HD 8670M
62
35
22
9
AMD Radeon HD 7670M
60.35n4
41.1n4
29.6n4
11.9n2
NVIDIA GeForce GT 630M
76.6n5
49.15n6
30.55n6
12n3
NVIDIA GeForce 820M
48
31.6
27.6
NVIDIA GeForce GT 720M
38
31.6
22
AMD Radeon HD 8570M
59.4
29.4
13.6
7
Intel HD Graphics 6000
57
36
23
10
AMD Radeon HD 8550M
16.5
11.5
10.4
Intel HD Graphics 4600
49.9
26.6
Intel HD Graphics 5500
51.4
30
21.9
AMD Radeon HD 7660G
41
27
25
9.9
AMD Radeon HD 7650M
58.8
38
32.9
AMD Radeon HD 7570M
57
38
16
PosModel< PrevNext >Dirt Showdown
low med. high ultra
ATI Mobility Radeon HD 5650
55.2
40.2
30.3
10.4
NVIDIA GeForce GT 620M
48.55n2
33.1n2
25.3n2
AMD Radeon HD 7640G
30.2
Intel HD Graphics 4400
41.05n2
24.8n2
17
5
AMD Radeon HD 7550M
65.4
39.6
25.9
Intel HD Graphics 4000
52.65n6
27.8n6
17.2n5
6n5
AMD Radeon R4 (Beema)
29.2
21.1
16.4
AMD Radeon R3 (Mullins/Beema)
31.2
21.3
17
Intel HD Graphics 4200
34.5
18.9
12.6
4.9
AMD Radeon HD 6450 GDDR5
74n2
32.5n2
22n2
6.5n2
AMD Radeon HD 8450G
25
14.7
AMD Radeon HD 7520G
27.3
15.7
13.3
AMD Radeon HD 8330
27.7
20.7
16.2
Intel HD Graphics (Haswell)
31
18.8
11.7
AMD Radeon HD 8250
15.9
12.6
11.5
Intel HD Graphics 3000
31.1n5
17.2n5
9.5n5
NVIDIA GeForce G210M
32
20
10
Intel HD Graphics (Ivy Bridge)
35.65n2
13.35n2
Intel HD Graphics (Sandy Bridge)
27
13.4
8.6
5
Intel HD Graphics (Bay Trail)
28
PosModel< PrevNext >Dirt Showdown
low med. high ultra
Intel Graphics Media Accelerator (GMA) 4500MHD
9
(-) * Smaller values are better. / n123 Number of benchmarks for this median value / * Approximate position


Legend
5Stutters – This game is very likely to stutter and have poor frame rates. Based on all known benchmarks using the specified graphical settings, average frame rates are expected to fall below 25fps
May Stutter – This graphics card has not been explicitly tested on this game. Based on interpolated information from surrounding graphics cards of similar performance levels, stutters and poor frame rates are expected.
30Fluent – Based on all known benchmarks using the specified graphical settings, this game should run at or above 25fps
40Fluent – Based on all known benchmarks using the specified graphical settings, this game should run at or above 35fps
60Fluent – Based on all known benchmarks using the specified graphical settings, this game should run at or above 58fps
May Run Fluently – This graphics card has not been explicitly tested on this game. Based on interpolated information from surrounding graphics cards of similar performance levels, fluent frame rates are expected.
?Uncertain – This graphics card experienced unexpected performance issues during testing for this game. A slower card may be able to achieve better and more consistent frame rates than this particular GPU running the same benchmark scene.
Uncertain – This graphics card has not been explicitly tested on this game and no reliable interpolation can be made based on the performances of surrounding cards of the same class or family.
The value in the fields displays the average frame rate of all values in the database. Move your cursor over the value to see individual results.
static version load dynamic
Loading Comments
Comment on this article
Please share our article, every link counts!
Florian Glaser, 2012-05-26 (Update: 2013-09-12)