

AMD Radeon HD 7770 vs NVIDIA GeForce GTX 780 Ti
AMD Radeon HD 7770
► remove from comparison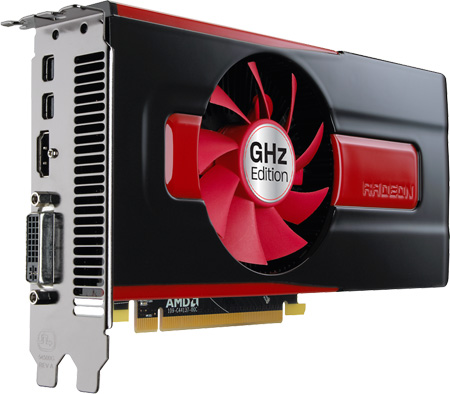
The AMD Radeon HD 7770 is a mid-range desktop graphics card based on the Cape Verde chip (Southern Islands). It uses the 1. generation of GCN architecture with 640 unified shaders (1D) and 40 texture units. The core is clocked at 1000 MHz and the 1 GB GDDR5 memory (128 Bit) is clocked at 1,125 MHz.
NVIDIA GeForce GTX 780 Ti
► remove from comparison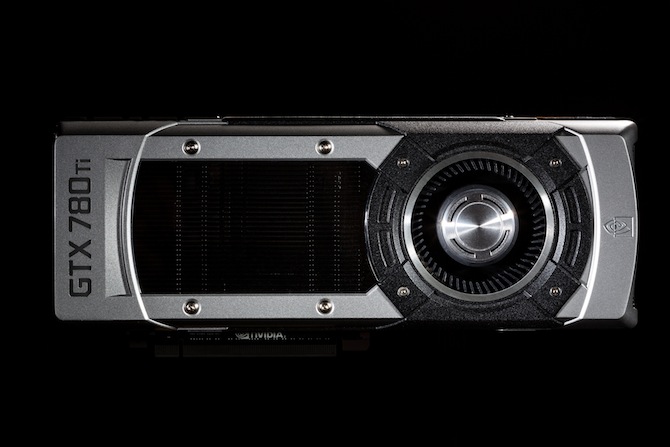
The NVIDIA GeForce GTX 780 Ti is a high-end desktop graphics card based on the Kepler architecture in 28 nm. It uses the full GK110 chip with 2880 CUDA cores and was the fastest single chip card at the beginning of 2014. The 780 Ti is much faster than the similar named laptop graphics card Nvidia GeForce GTX 780M (based on the GK104 like the desktop GTX 770 but with lower clock rates).
| AMD Radeon HD 7770 | NVIDIA GeForce GTX 780 Ti | ||||||||||
| Codename | Cape Verde | GK110 | |||||||||
| Architecture | GCN | Kepler | |||||||||
| Pipelines | 640 - unified | 2880 - unified | |||||||||
| Core Speed | 1000 MHz | 875 - 928 (Boost) MHz | |||||||||
| Memory Speed | 4500 MHz | 3500 MHz | |||||||||
| Memory Bus Width | 128 Bit | 384 Bit | |||||||||
| Memory Type | GDDR5 | GDDR5 | |||||||||
| Max. Amount of Memory | 1024 MB | 3 GB | |||||||||
| Shared Memory | no | no | |||||||||
| API | DirectX 11.1, Shader 5.1, OpenGL 4.2 | DirectX 12 (FL 11_0), Shader 5.0, OpenGL 4.4 | |||||||||
| Power Consumption | 80 Watt | 250 Watt | |||||||||
| Transistors | 1.5 Billion | 7.1 Billion | |||||||||
| technology | 28 nm | 28 nm | |||||||||
| Features | Eyefinity, HD3D, CrossFire | SLI, Purevideo, 3D Vision, PhysX, CUDA, GPU Boost 2.0, GeForce Experience, Adaptive VSync | |||||||||
| Date of Announcement | 15.02.2012 | 07.11.2013 | |||||||||
| Link to Manufacturer Page | www.amd.com | www.nvidia.de | |||||||||
| GeForce GTX 700 Series |
|
Benchmarks
3DM Vant. Perf. total + AMD Radeon HD 7770
Average Benchmarks AMD Radeon HD 7770 → 100% n=11
Average Benchmarks NVIDIA GeForce GTX 780 Ti → 362% n=11
* Smaller numbers mean a higher performance
1 This benchmark is not used for the average calculation
Game Benchmarks
The following benchmarks stem from our benchmarks of review laptops. The performance depends on the used graphics memory, clock rate, processor, system settings, drivers, and operating systems. So the results don't have to be representative for all laptops with this GPU. For detailed information on the benchmark results, click on the fps number.

F1 2014
2014
The Evil Within
2014
Ryse: Son of Rome
2014
Alien: Isolation
2014

Fifa 15
2014
Sims 4
2014
Risen 3: Titan Lords
2014
GRID: Autosport
2014
Watch Dogs
2014


Thief
2014
Call of Duty: Ghosts
2013
Battlefield 4
2013
F1 2013
2013
Fifa 14
2013
Total War: Rome II
2013
Saints Row IV
2013


Dota 2
2013
Company of Heroes 2
2013
GRID 2
2013
Metro: Last Light
2013BioShock Infinite
2013SimCity
2013
Tomb Raider
2013Crysis 3
2013Dead Space 3
2013
Far Cry 3
2012
Assassin´s Creed III
2012
Hitman: Absolution
2012


Dishonored
2012
World of Tanks v8
2012Fifa 13
2012
F1 2012
2012
Borderlands 2
2012
Torchlight 2
2012
Guild Wars 2
2012Counter-Strike: GO
2012Darksiders II
2012Sleeping Dogs
2012
The Secret World
2012
Max Payne 3
2012Dirt Showdown
2012
Diablo III
2012
Risen 2: Dark Waters
2012
Mass Effect 3
2012Alan Wake
2012
Anno 2070
2011

Battlefield 3
2011
Batman: Arkham City
2011
Fifa 12
2011
F1 2011
2011

Crysis 2
2011
StarCraft 2
2010
Metro 2033
2010Average Gaming AMD Radeon HD 7770 → 100%
Average Gaming 30-70 fps → 100%
Average Gaming NVIDIA GeForce GTX 780 Ti → 257%
Average Gaming 30-70 fps → 420%
| AMD Radeon HD 7770 | NVIDIA GeForce GTX 780 Ti | |||||||||||||
|---|---|---|---|---|---|---|---|---|---|---|---|---|---|---|
| low | med. | high | ultra | QHD | 4K | low | med. | high | ultra | QHD | 4K | |||
| F1 2014 | 133 | 131 | 127 | 118 | ||||||||||
| The Evil Within | 66.1 | 65.7 | 64.7 | |||||||||||
| Ryse: Son of Rome | 89.4 | 84.9 | 67.9 | 63.9 | ||||||||||
| Alien: Isolation | 250.3 | 234.4 | 166.6 | 116.3 | ||||||||||
| Middle-earth: Shadow of Mordor | 225.8 | 194.9 | 112.3 | 88 | ||||||||||
| Fifa 15 | 326.1 | 284.4 | 268.7 | |||||||||||
| Sims 4 | 168.9 | 102.1 | 92.3 | 90.4 | ||||||||||
| Risen 3: Titan Lords | 57.1 | 67.3 | 78.4 | 90 | ||||||||||
| GRID: Autosport | 284.3 | 159.9 | 139.4 | 122.6 | ||||||||||
| Watch Dogs | 94.4 | 79.7 | 62.7 | 52.2 | ||||||||||
| Wolfenstein: The New Order | 60 | 60 | 60 | 60 | ||||||||||
| The Elder Scrolls Online | 98.2 | 95.7 | 90.1 | 58.6 | ||||||||||
| Thief | 98.2 | 96.3 | 97.8 | 76.8 | ||||||||||
| Call of Duty: Ghosts | 170.1 | 154 | 110.6 | 81.8 | ||||||||||
| Battlefield 4 | 171 | 147.9 | 136 | 89 | ||||||||||
| Saints Row IV | 92.4 | 76.2 | 43.4 | 26.6 | 99.6 | 87.7 | 79.6 | 80.6 | ||||||
| Dota 2 | 113.7 | 104.4 | 67.2 | 119.7 | 118.6 | 118.1 | ||||||||
| GRID 2 | 201.4 | 137.8 | 106.1 | 36.9 | 210.4 | 159 | 148.9 | 129.9 | ||||||
| Metro: Last Light | 94.1 | 71.2 | 35.9 | 18.8 | 141.3 | 138.1 | 123.9 | 80.9 | ||||||
| BioShock Infinite | 171.6 | 91.8 | 76.7 | 24.7 | 289.9 | 237.9 | 218.6 | 116.4 | ||||||
| Tomb Raider | 188.8 | 95.6 | 63.3 | 27.7 | 485.5 | 391 | 309 | 148.6 | ||||||
| Crysis 3 | 86.2 | 46.5 | 30.4 | 12.6 | 146.2 | 135.7 | 107.2 | 60.3 | ||||||
| Far Cry 3 | 110.7 | 89.4 | 44 | 14.3 | 131.4 | 119.7 | 100.2 | 65.6 | ||||||
| Hitman: Absolution | 64.2 | 60.4 | 38.6 | 14.7 | 96 | 90 | 80.1 | 74 | ||||||
| Guild Wars 2 | 66.8 | 41.7 | 20.5 | 131.6 | 72.9 | 66.4 | ||||||||
| AMD Radeon HD 7770 | NVIDIA GeForce GTX 780 Ti | |||||||||||||
| low | med. | high | ultra | QHD | 4K | low | med. | high | ultra | QHD | 4K | < 30 fps < 60 fps < 120 fps ≥ 120 fps | 7 3 | 1 7 1 | 6 3 | 8 1 1 | | | < 30 fps < 60 fps < 120 fps ≥ 120 fps | 1 9 15 | 12 11 | 15 9 | 2 18 4 | | |
For more games that might be playable and a list of all games and graphics cards visit our Gaming List