Notebookcheck Logo

AMD Ryzen 7 2700X vs AMD Athlon Gold 3150U vs AMD Ryzen 7 2700

AMD Ryzen 7 2700X

► remove from comparison AMD R7 2700X

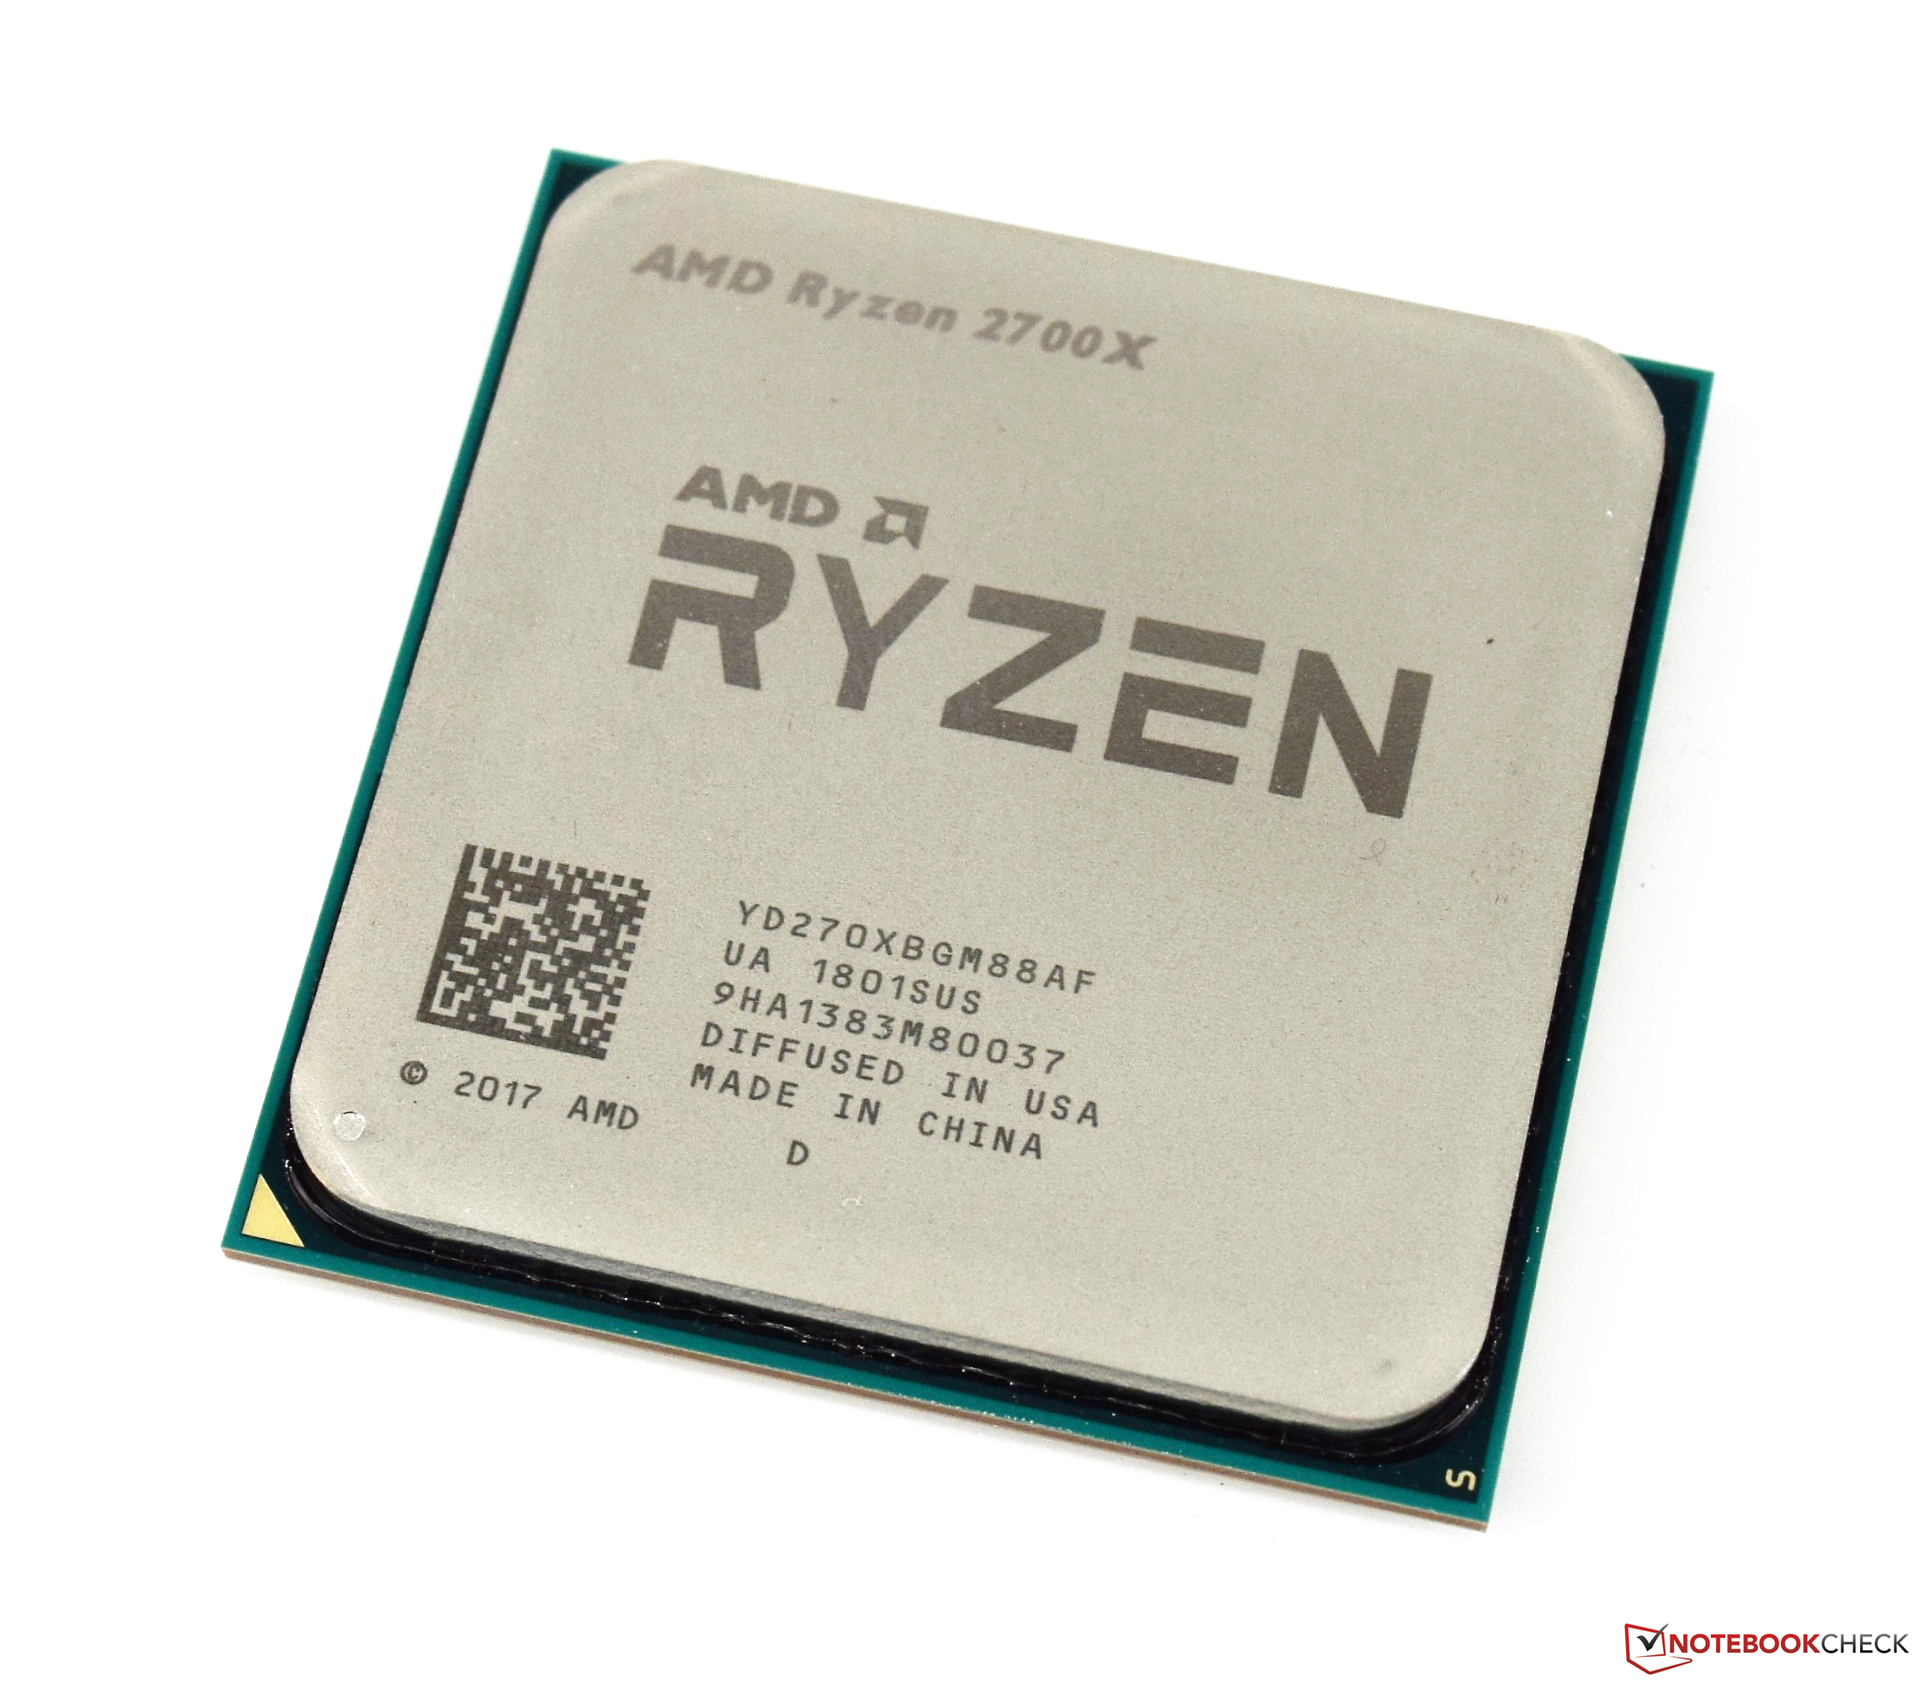
The AMD Ryzen 7 2700X is a high-end desktop processor with 8 cores (16 threads) that was announced early 2018. It is based on the revised Zen+ cores and at launch the fastest Ryzen CPU. The CPU cores clock at 3.7 GHz base and using Precision Boost 2 up to 4.3 GHz. All 8 cores and 16 threads can clock up to 4 GHz. The 8 cores are divided in two cluster (4 cores each with own L3 cache) connected via Infinity Fabric.

Compared to the older first Ryzen generation (e.g., Ryzen 5 1700X), the second generation is manufactured in an improved process (12nm called), offers and improved Precision Boost 2 (especially in partial load of the cores) and faster cache and memory speeds.

See our second generation Ryzen review for detailed benchmarks and information.

AMD Athlon Gold 3150U

► remove from comparison AMD Athlon 3150U

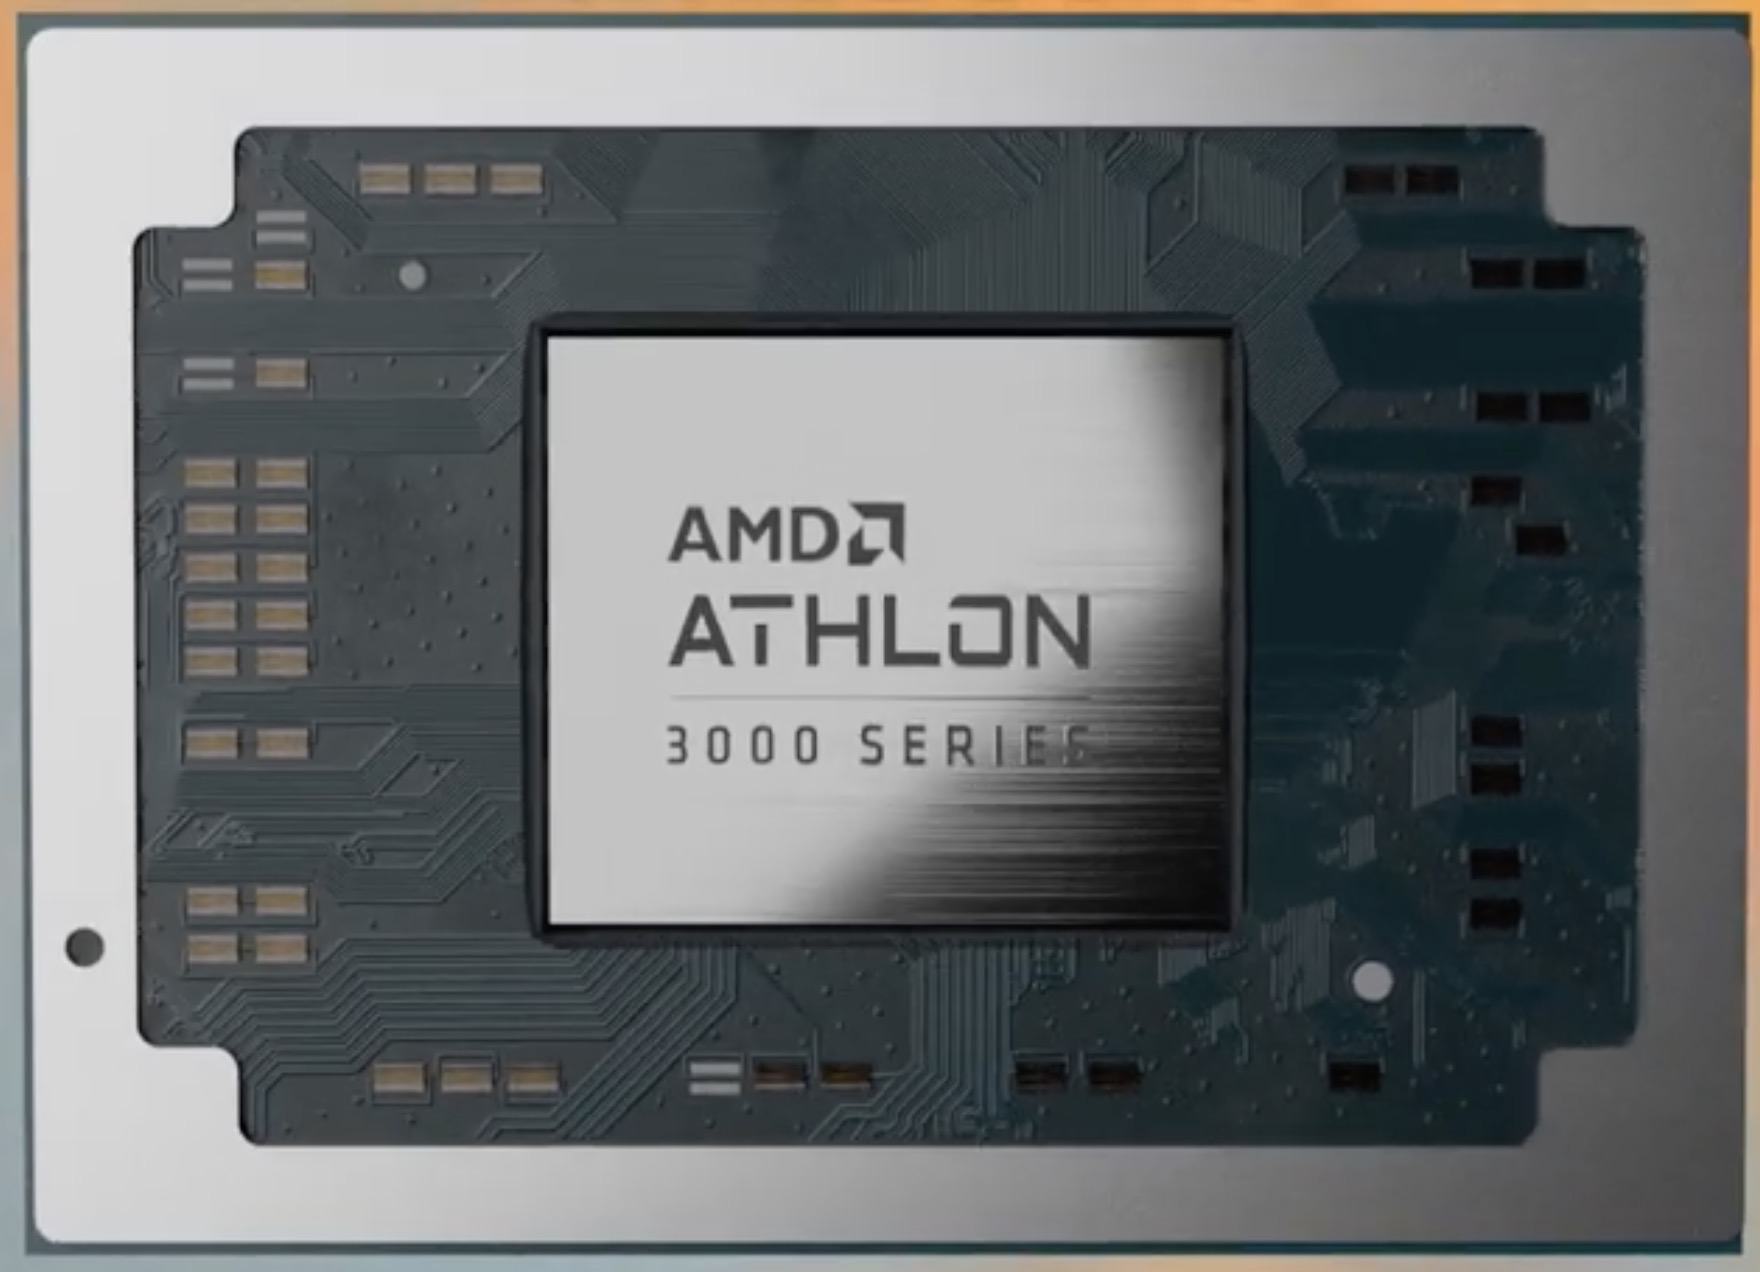
The AMD Athlon Gold 3150U is a mobile processor for thin and light entry level laptops. It is based on the Dali series (Raven Ridge Dual Core) and offers two Zen cores clocked at 2.6 to 3.3 GHz with SMT (four threads at once) and 4 MB L3-Cache. The integrated graphics card is called Radeon RX Vega 3 and offers only 3 CUs (192 Shaders) clocked at up to 1000 MHz.

In Chromebooks, AMD calles the APU AMD Athlon Gold 3150C, but with the exact same specifications (and performance).

Performance

The average 3150U in our database is in the same league as the Core i3-10110U, as far as multi-thread benchmark scores are concerned. In other words, this is an entry-level chip, as of mid 2022. While not slow by any means, it is anything but fast, either.

Your mileage may vary depending on how high the CPU power limits are and how competent the cooling solution of your system is.

Power consumption

The Athlon has a default TDP, also known as the long-term power limit, of 15 W that laptop makers are free to change to anything between 12 W and 25 W with clock speeds and performance changing accordingly as a result. Most will go for a higher value to reach higher performance levels. Either way, an active cooling solution will be needed to dissipate the heat.

The AMD 3150U is built with a 14 nm manufacturing process resulting in low, as of early 2023, energy efficiency.

AMD Ryzen 7 2700

► remove from comparison AMD R7 2700

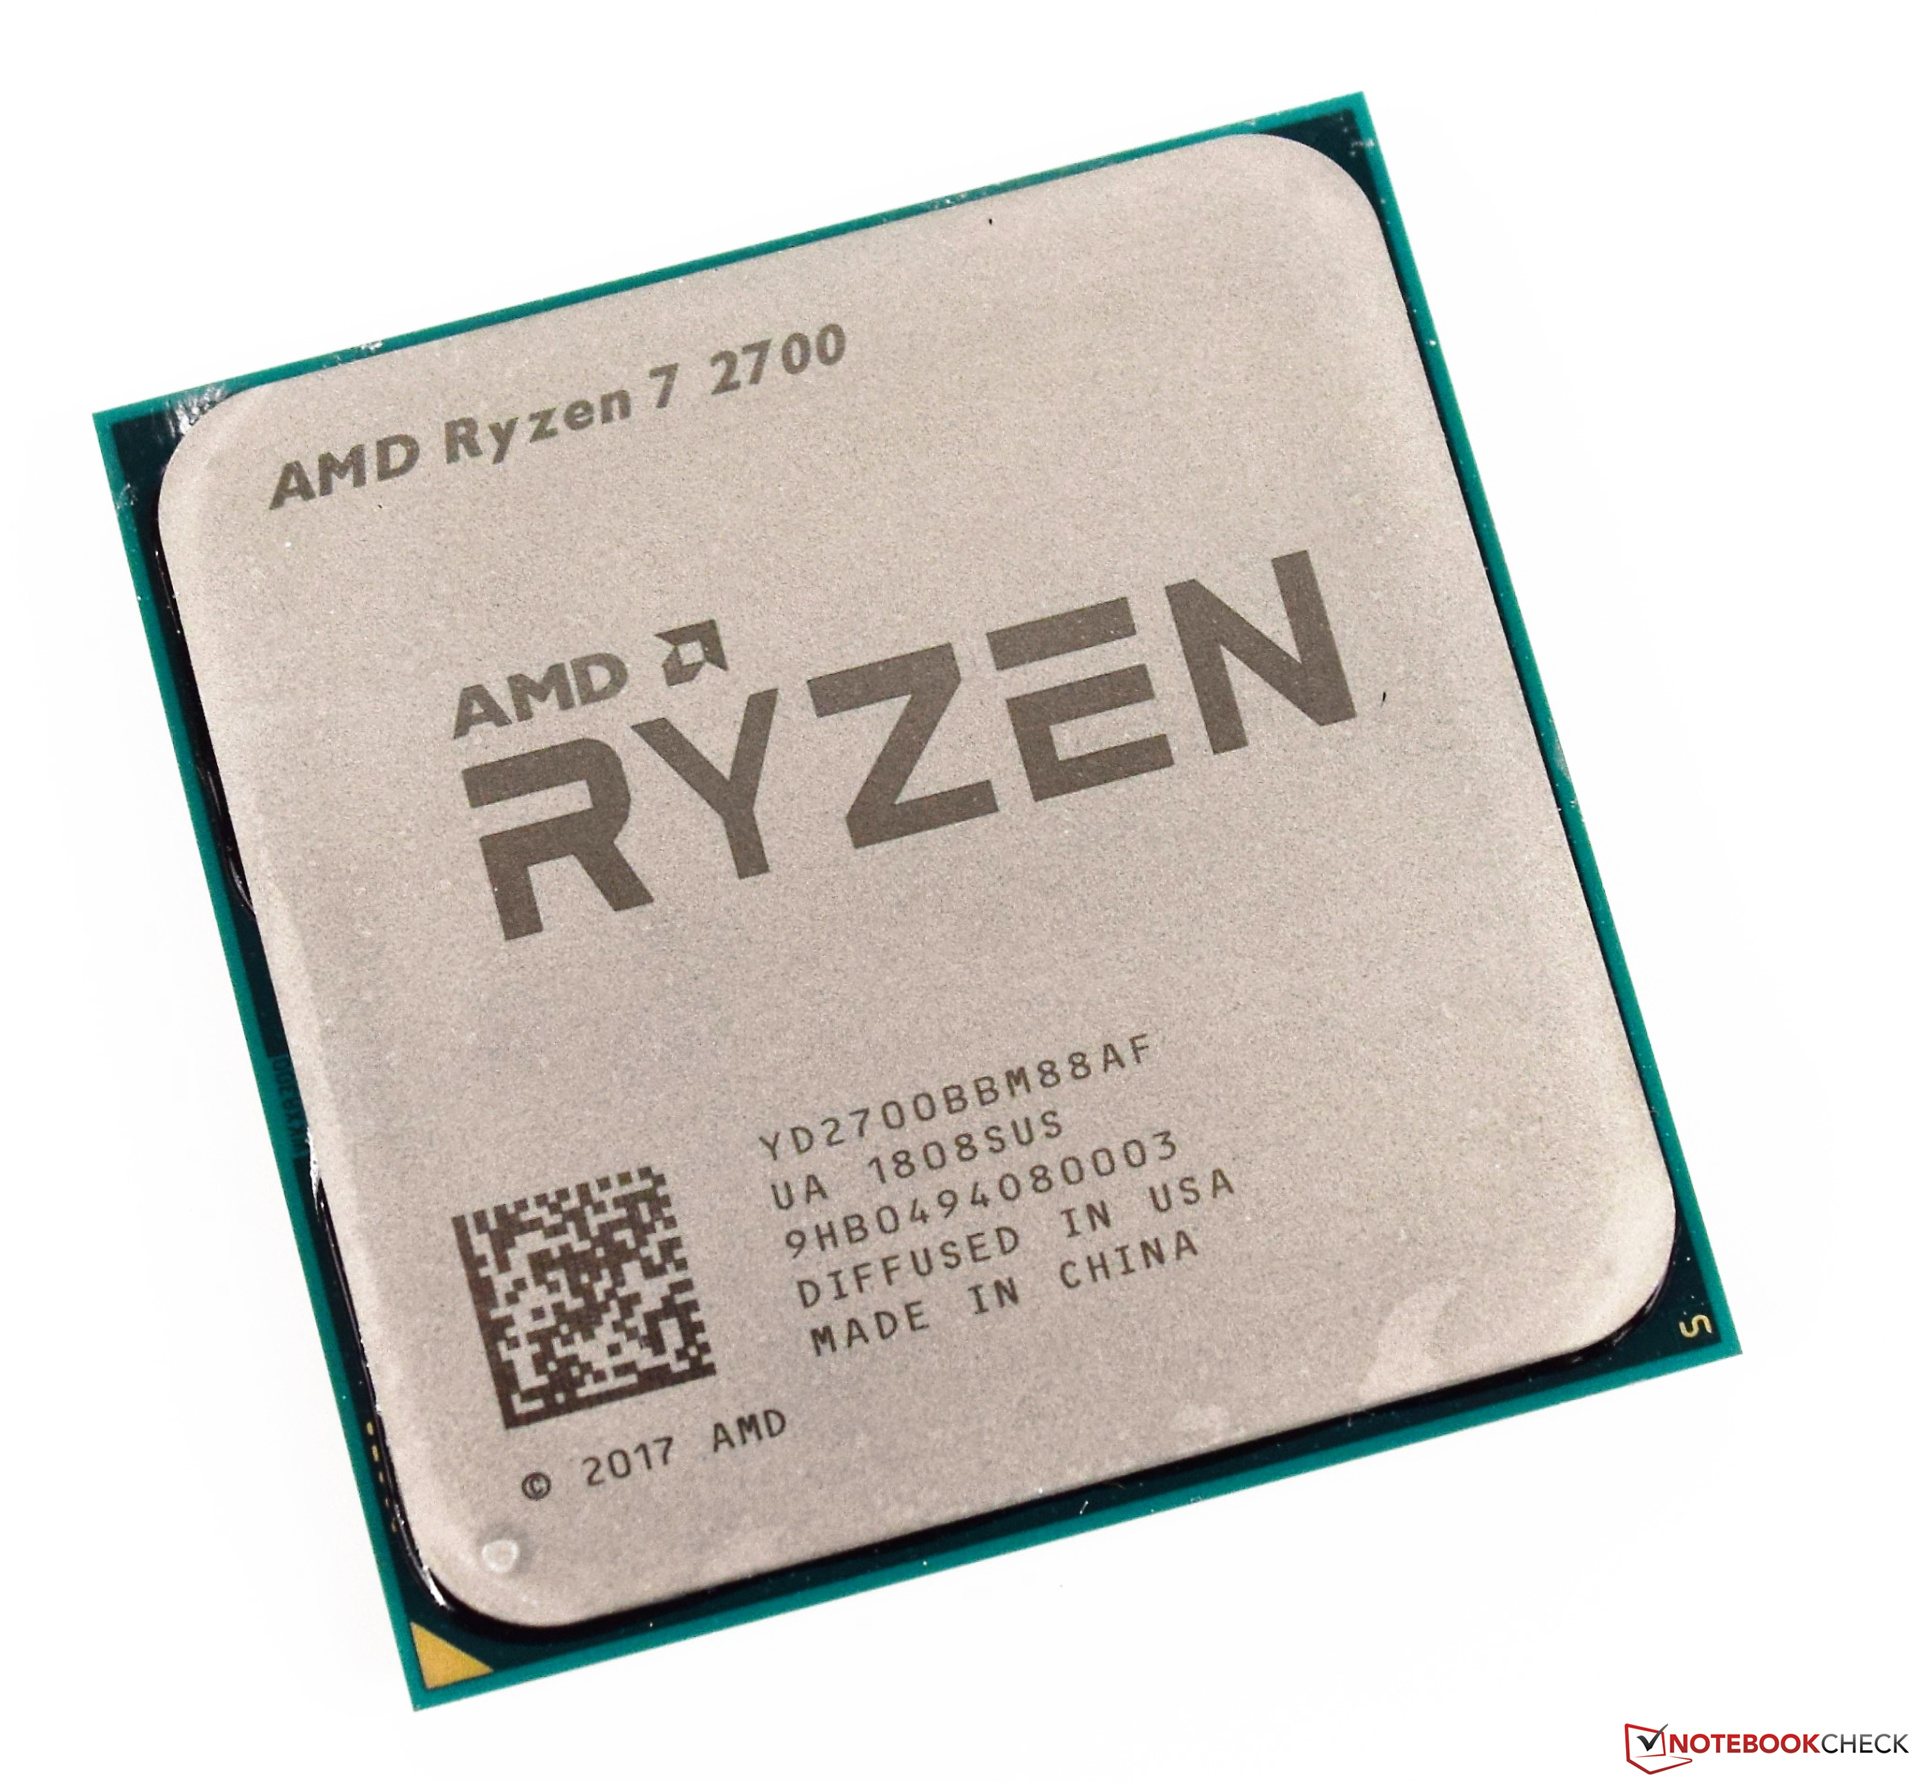
The AMD Ryzen 7 2700 is an eight-core desktop processor that can handle sixteen threads simultaneously thanks to Simultaneous Multithreading (SMT). This technology is equivalent to Intel's Hyper-Threading. Launched in April 2018, the Ryzen 7 2700 is the second fastest Ryzen 7 processor and is much more economical than its flagship sibling. The Ryzen 7 2700 has a 65 W TDP, which is nearly 50% more efficient than the 105 W TDP Ryzen 7 2700 X. This energy efficiency comes at a cost to performance though.

The Ryzen 7 2700 has a base clock speed of 3.2 GHz, which can be boosted by Extended Frequency Range (XFR) up to 4.1 GHz. The power gain is still high in multi-threaded applications, although this is some way off the Ryzen 7 2700X. The Ryzen 7 2700 benefits from AMD's new Zen+ architecture, with a greater number of instructions per cycle (IPC) and higher clock speeds than last year's Zen chips. The Ryzen 7 2700's eight cores are divided into two clusters that are connected by Infinity Fabric, a subset of HyperTransport. Each cluster has its own L3 cache.

The Ryzen 7 2700 has good performance in games. However, if it is operating at a lower base clock because of low TDP, then the Ryzen 7 2700 falls behind the Ryzen 5 2600 in gaming benchmarks. This behaviour could be because many games currently lack multi-core support. Hence, games rely more on clock speed more than core count.

Detailed information, benchmarks and values can be found in our review of the Ryzen 7 2700.

ModelAMD Ryzen 7 2700XAMD Athlon Gold 3150UAMD Ryzen 7 2700
SeriesAMD Ryzen 7AMD Picasso (Ryzen 3000 APU)AMD Ryzen 7
CodenameZen+Dali (Zen)Zen+
Series: Ryzen 7 Zen+
AMD Ryzen 7 2700X « 3.7 - 4.3 GHz8 / 16 cores16 MB L3
AMD Ryzen 7 27003.2 - 4.1 GHz8 / 16 cores16 MB L3
AMD Athlon Gold 3150U « 2.4 - 3.3 GHz2 / 4 cores4 MB L3
AMD Athlon Silver 3050U2.3 - 3.2 GHz2 / 2 cores4 MB L3
AMD Ryzen 7 2700X3.7 - 4.3 GHz8 / 16 cores16 MB L3
AMD Ryzen 7 2700 « 3.2 - 4.1 GHz8 / 16 cores16 MB L3
Clock3700 - 4300 MHz2400 - 3300 MHz3200 - 4100 MHz
L2 Cache4 MB1 MB4 MB
L3 Cache16 MB4 MB16 MB
Cores / Threads8 / 162 / 48 / 16
TDP105 Watt15 Watt65 Watt
Transistors4940 Million4500 Million4940 Million
Technology12 nm14 nm12 nm
Die Size213 mm2213 mm2
SocketAM4 (1331)FP5AM4 (1331)
FeaturesSSE4.2, SSE4A, AMD-V, AES, AVX2, FMA3, SHADDR4-2400 RAM, PCIe 3, MMX, SSE, SSE2, SSE3, SSSE3, SSE4A, SSE4.1, SSE4.2, AVX, AVX2, BMI2, ABM, FMA, ADX, SMEP, SMAP, SMT, CPB, AES-NI, RDRAND, RDSEED, SHA, SMESSE4.2, SSE4A, AMD-V, AES, AVX2, FMA3, SHA
Architecturex86x86x86
$329 U.S.$299 U.S.
Announced
L1 Cache192 KB
max. Temp.95 °C
iGPUAMD Radeon RX Vega 3 ( - 1000 MHz)
Manufacturerwww.amd.com

Benchmarks

Performance Rating - CB R15 + R20 + 7-Zip + X265 + Blender + 3DM11 CPU - Athlon 3150U
22.8 pt (32%)
Cinebench R20 - Cinebench R20 CPU (Single Core)
430 Points (48%)
303 Points (34%)
Cinebench R20 - Cinebench R20 CPU (Multi Core)
3944 Points (10%)
795 Points (2%)
Cinebench R15 - Cinebench R15 CPU Multi 64 Bit
min: 1740     avg: 1768     median: 1762 (11%)     max: 1801 Points
352 Points (2%)
1551 Points (10%)
Cinebench R15 - Cinebench R15 CPU Single 64 Bit
min: 175.5     avg: 175.7     median: 175.7 (53%)     max: 176 Points
117 Points (35%)
161 Points (48%)
Cinebench R11.5 - Cinebench R11.5 CPU Multi 64 Bit
18.7 Points (24%)
4 Points (5%)
16.7 Points (22%)
Cinebench R11.5 - Cinebench R11.5 CPU Single 64 Bit
2 Points (49%)
1.4 Points (34%)
1.8 Points (44%)
Cinebench R10 - Cinebench R10 Rend. Single (32bit)
5256 Points (32%)
3639 Points (22%)
4505 Points (27%)
Cinebench R10 - Cinebench R10 Rend. Multi (32bit)
34763 Points (25%)
7566 Points (5%)
31385 Points (23%)
Cinebench R10 - Cinebench R10 Rend. Multi (64bit)
57811 Points (40%)
49441 Points (34%)
Cinebench R10 - Cinebench R10 Rend. Single (64bit)
8673 Points (11%)
7756 Points (9%)
wPrime 2.10 - wPrime 2.0 1024m *
96.6 s (1%)
1280 s (15%)
130.5 s (2%)
wPrime 2.10 - wPrime 2.0 32m *
3.5 s (1%)
40.1 s (8%)
5.1 s (1%)
WinRAR - WinRAR 4.0
4779 Points (8%)
1631 Points (3%)
4440 Points (7%)
7-Zip 18.03 - 7-Zip 18.03 Multli Thread 4 runs
45814 MIPS (26%)
8752 MIPS (5%)
7-Zip 18.03 - 7-Zip 18.03 Single Thread 4 runs
4647 MIPS (56%)
3065 MIPS (37%)
X264 HD Benchmark 4.0 - x264 Pass 2
104.5 fps (36%)
22.5 fps (8%)
89.7 fps (31%)
X264 HD Benchmark 4.0 - x264 Pass 1
226.7 fps (52%)
106.6 fps (25%)
195.7 fps (45%)
HWBOT x265 Benchmark v2.2 - HWBOT x265 4k Preset
2 fps (4%)
468%
1 R7 2700 +
9.5 fps (17%)
TrueCrypt - TrueCrypt Serpent
1 GB/s (0%)
0.2 GB/s (0%)
0.9 GB/s (0%)
TrueCrypt - TrueCrypt Twofish
1.6 GB/s (28%)
0.3 GB/s (6%)
1.4 GB/s (24%)
TrueCrypt - TrueCrypt AES
10.6 GB/s (28%)
2.2 GB/s (6%)
9 GB/s (23%)
Blender - Blender 2.79 BMW27 CPU *
min: 264     avg: 266.8     median: 266.8 (2%)     max: 269.6 Seconds
1348 Seconds (9%)
308.3 Seconds (2%)
R Benchmark 2.5 - R Benchmark 2.5 *
0.6 sec (13%)
0.9 sec (19%)
3DMark 06 - CPU - 3DMark 06 - CPU
min: 10429     avg: 10651     median: 10643 (23%)     max: 10823 Points
4189 Points (9%)
9475 Points (20%)
Super Pi mod 1.5 XS 1M - Super Pi mod 1.5 XS 1M *
10.8 s (2%)
13.9 s (3%)
11.1 s (2%)
Super Pi mod 1.5 XS 2M - Super Pi mod 1.5 XS 2M *
23.2 s (1%)
100%
1 R7 2700 +
24.1 s (1%)
Super Pi Mod 1.5 XS 32M - Super Pi mod 1.5 XS 32M *
578 s (3%)
727 s (3%)
597 s (3%)
3DMark Vantage - 3DM Vant. Perf. CPU no Physx
min: 55102     avg: 57950     median: 58836.5 (52%)     max: 59792 Points
51796 Points (45%)
3DMark 11 - 3DM11 Performance Physics
min: 12874     avg: 14926     median: 15098 (41%)     max: 15552 Points
4287 Points (12%)
13959 Points (38%)
3DMark - 3DMark Ice Storm Physics
min: 71788     avg: 75803     median: 76251 (62%)     max: 77677 Points
64158 Points (52%)
3DMark - 3DMark Ice Storm Extreme Physics
min: 73539     avg: 76030     median: 76288 (62%)     max: 77262 Points
64932 Points (53%)
3DMark - 3DMark Ice Storm Unlimited Physics
min: 74344     avg: 76804     median: 76312 (64%)     max: 79006 Points
66419 Points (56%)
3DMark - 3DMark Cloud Gate Physics
min: 13090     avg: 14891     median: 15060.5 (38%)     max: 15851 Points
3923 Points (10%)
12224 Points (31%)
3DMark - 3DMark Fire Strike Standard Physics
min: 20189     avg: 21001     median: 20923.5 (37%)     max: 21975 Points
5692 Points (10%)
17915 Points (32%)
3DMark - 3DMark Time Spy CPU
min: 8241     avg: 8676     median: 8747 (37%)     max: 8954 Points
1862 Points (8%)
8049 Points (34%)
Geekbench 5.5 - Geekbench 5.1 - 5.4 64 Bit Single-Core
min: 1131     avg: 1177     median: 1177 (50%)     max: 1223 Points
751 Points (32%)
1000 Points (42%)
Geekbench 5.5 - Geekbench 5.1 - 5.4 64 Bit Multi-Core
min: 6372     avg: 7022     median: 7021.5 (13%)     max: 7671 Points
1847 Points (3%)
6560 Points (12%)
Geekbench 5.0 - Geekbench 5.0 64 Bit Single-Core
1126 Points (5%)
Geekbench 5.0 - Geekbench 5.0 64 Bit Multi-Core
7878 Points (25%)
Geekbench 4.4 - Geekbench 4.1 - 4.4 64 Bit Single-Core
min: 4999     avg: 5050     median: 5049.5 (50%)     max: 5100 Points
4681 Points (47%)
Geekbench 4.4 - Geekbench 4.1 - 4.4 64 Bit Multi-Core
min: 25919     avg: 27790     median: 27789.5 (30%)     max: 29660 Points
22776 Points (25%)
Power Consumption - Prime95 Power Consumption - external Monitor *
211.2 Watt (36%)
119%
1 R7 2700 +
140.9 Watt (24%)
Power Consumption - Cinebench R15 Multi Power Consumption - external Monitor *
219.2 Watt (40%)
123%
1 R7 2700 +
143.2 Watt (26%)
Power Consumption - Cinebench R15 Multi Power Efficiency - external Monitor
8.2 Points per Watt (6%)
131%
1 R7 2700 +
10.8 Points per Watt (8%)

Average Benchmarks AMD Ryzen 7 2700X → 100% n=24

Average Benchmarks AMD Athlon Gold 3150U → 47% n=24

Average Benchmarks AMD Ryzen 7 2700 → 91% n=24

- Range of benchmark values for this graphics card
- Average benchmark values for this graphics card
* Smaller numbers mean a higher performance
1 This benchmark is not used for the average calculation

v1.26
log 30. 06:01:14

#0 checking url part for id 9978 +0s ... 0s

#1 checking url part for id 11693 +0s ... 0s

#2 checking url part for id 10030 +0s ... 0s

#3 not redirecting to Ajax server +0s ... 0s

#4 did not recreate cache, as it is less than 5 days old! Created at Tue, 28 May 2024 05:33:54 +0200 +0.001s ... 0.001s

#5 composed specs +0.038s ... 0.039s

#6 did output specs +0s ... 0.039s

#7 getting avg benchmarks for device 9978 +0.004s ... 0.043s

#8 got single benchmarks 9978 +0.057s ... 0.099s

#9 getting avg benchmarks for device 11693 +0.016s ... 0.115s

#10 got single benchmarks 11693 +0.01s ... 0.125s

#11 getting avg benchmarks for device 10030 +0.003s ... 0.128s

#12 got single benchmarks 10030 +0.008s ... 0.136s

#13 got avg benchmarks for devices +0s ... 0.136s

#14 min, max, avg, median took s +0.358s ... 0.494s

#15 return log +0s ... 0.494s

Please share our article, every link counts!
> Expert Reviews and News on Laptops, Smartphones and Tech Innovations > Benchmarks / Tech > Processor Comparison - Head 2 Head
Redaktion, 2017-09- 8 (Update: 2023-07- 1)