Notebookcheck Logo

Intel Iris Pro Graphics 6200 vs Intel Iris Plus Graphics 640

Intel Iris Pro Graphics 6200

► remove from comparison Intel Iris Pro Graphics 6200

The Intel Iris Pro Graphics 6200 (GT3e) is an integrated graphics card and the fastest GPU of the Broadwell generation. It is built into several high-end CPUs specified at 47 W TDP. The so-called GT3e GPU offers a fast eDRAM cache as well as 48 EUs (Execution Units) and therefore somewhat more shader power than the previous Iris Pro Graphics 5200. The clock range depends on the model it is built into (up to 1150 MHz with Turbo Boost).

Architecture and Features

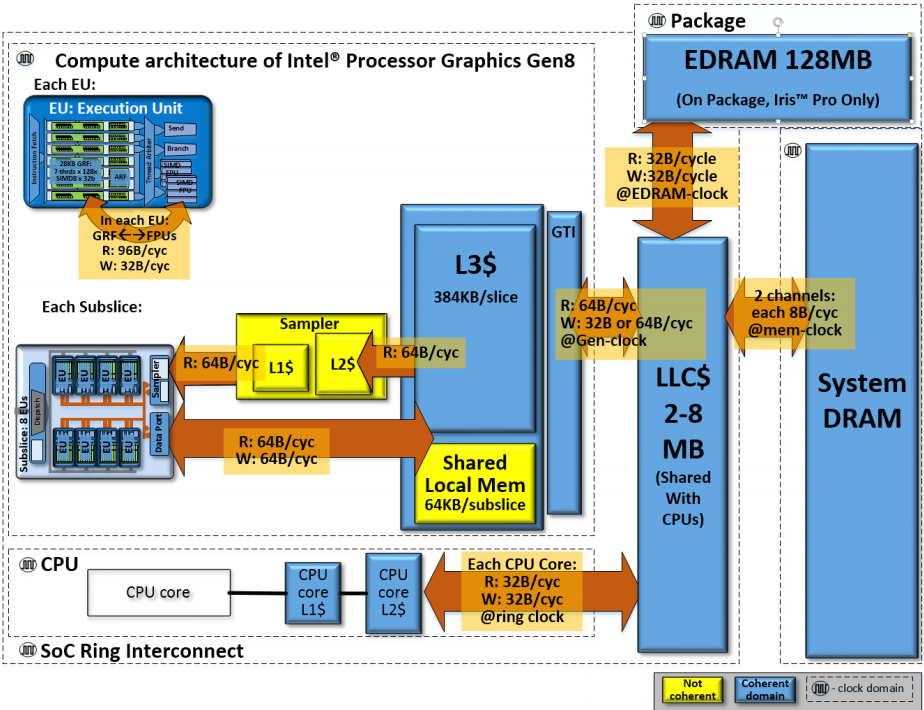
Broadwell features a GPU based on the Intel Gen8 architecture, which has been optimized in various aspects compared to the previous Gen7.5 (Haswell). Inter alia, the shader arrays called "subslice" have been reorganized and now offer 8 Execution Units (EUs) each. Three subslices form a "slice" for a total of 24 EUs. Combined with other improvements such as larger L1 caches and an optimized frontend, the integrated GPU has become faster and more efficient than its predecessor.

The Iris Pro Graphics 6200 represents the high-end "GT3e" version of the Broadwell GPU family and consists of two slices with 48 EUs in total. In addition, there is also a fast eDRAM cache (128 MB), which can be found only on the Iris Pro.

All Broadwell GPUs support OpenCL 2.0 and DirectX 12 (FL 11_1). The video engine can now decode H.265 using both fixed function hardware as well as available GPU shaders. Up to three displays can be connected via DP 1.2/eDP 1.3 (max. 3840 x 2160 @ 60 Hz) or HDMI 1.4a (max. 3840 x 2160 @ 24 Hz). HDMI 2.0, however, is not supported.

Performance

Depending on the benchmark, the Iris Pro Graphics 6200 performs similar to a dedicated GeForce GT 750M or GeForce 940M. Many games of 2014/2015 can be played fluently in WXGA resolution (1366 x 768) and medium detail settings. However, very demanding games such as The Witcher 3 will require lower resolutions and/or details.

Power Consumption

Utilizing a new 14 nm FinFET process, the Iris Pro Graphics 6200 is specified at 47 W TDP (entire chip including CPU, GPU and memory controller) and therefore suited for medium-sized notebooks. The TDP is flexible and can be further reduced (37 W), which has a significant impact on performance.

Intel Iris Plus Graphics 640

► remove from comparison Intel Iris Plus Graphics 640

The Intel Iris Plus Graphics 640 (GT3e) is a processor graphics card for Kaby Lake models announced in January 2017. As the successor to the Intel Iris Graphics 540 (Skylake), the Iris Plus Graphics 640 is used for 15-Watt ULV models and is equipped with 64 MB eDRAM cache. There should not be any big changes compared to the Iris Graphics 540.

The so called GT3e version of the Kaby Lake GPU still has 48 Execution Units (EUs), which can reach up to 1050 MHz depending on the model. Besides eDRAM cache, the Iris 640 can also access the system memory (2x 64 Bit DDR3L-1600/LPDDR3-1866/DDR4-2400) via processor interface.

Compared to the Iris Plus 650 from the 28-Watt models, the Iris 640 only has a slightly lower maximum clock as well as the lower TDP, so the utilization of the Turbo Boost potential should be worse.

Performance

The exact performance of the Iris Plus Graphics 640 depends on the CPU model, because maximum clock as well as the size of the L3 cache can differ a bit. The system memory (DDR3/DDR4) will influence the performance as well.

The fastest chips are high-clocked Core i7 models like the Core i7-7660U. Depending on the game, the Iris Plus 640 will probably be similar to the previous model somewhere between a dedicated GeForce 920M and GeForce 940M and is usually limited to low settings in modern games.

Features

The reworked video engine now fully supports hardware decoding of H.265/HEVC videos. Contrary to Skylake, however, Kaby Lake can now also decode H.265/HEVC Main 10 with a 10-bit color depth as well as Google's VP9 codec. The video output is possible via DP 1.2/eDP 1.3 (up to 3840 x 2160 @60 Hz), whereas HDMI is also supported in the older 1.4a standard. An HDMI 2.0 output can be added via converter from DisplayPort. The GPU can drive up to three displays simultaneously.

Power Consumption

The Iris Plus Graphics 640 is used for 15-Watt ULV processor and therefore thin notebooks and Ultrabooks.

Intel Iris Pro Graphics 6200Intel Iris Plus Graphics 640
Gen. 9.5 Series
Iris Pro Graphics 6200 48 @ 0.3 - 1.15 GHzeDRAM + 64/128 Bit
Iris Pro Graphics 5200 compare 40 @ 0.2 - 1.3 GHzeDRAM + 64/128 Bit
Iris Graphics 6100 compare 48 @ 0.3 - 1.1 GHz64/128 Bit
Iris Graphics 5100 compare 40 @ 0.2 - 1.2 GHz64/128 Bit
Iris Plus Graphics 655 compare 48 @ 0.3 - 1.2 GHz
Iris Plus Graphics 650 compare 48 @ 0.3 - 1.1 GHz64/128 Bit
Iris Plus Graphics 645 compare 48 @ 0.3 - 1.15 GHz
Iris Plus Graphics 640 48 @ 0.3 - 1.05 GHz64/128 Bit
UHD Graphics 630 compare 24 @ 0.3 - 1.15 GHz64/128 Bit
UHD Graphics P630 compare 24 @ 0.3 - 1.2 GHz64/128 Bit
HD Graphics 630 compare 24 @ 0.3 - 1.15 GHz64/128 Bit
HD Graphics P630 compare 24 64/128 Bit
UHD Graphics 620 compare 24 @ 0.3 - 1.15 GHz
HD Graphics 620 compare 24 @ 0.3 - 1.05 GHz64/128 Bit
UHD Graphics 617 compare 24 @ 0.3 - 1.15 GHz64/128 Bit
UHD Graphics 615 compare 24 @ 0.3 - 1 GHz64/128 Bit
HD Graphics 615 compare 24 @ 0.3 - 1.05 GHz64/128 Bit
CodenameBroadwell GT3eKaby Lake GT3e
ArchitectureGen. 8 BroadwellGen. 9.5 Kaby Lake
Pipelines48 - unified48 - unified
Core Speed300 - 1150 (Boost) MHz300 - 1050 (Boost) MHz
Memory Bus WidtheDRAM + 64/128 Bit64/128 Bit
Shared Memoryyesyes
APIDirectX 12 (FL 11_1), OpenGL 4.3DirectX 12_1, OpenGL 4.4
technology14 nm14 nm
FeaturesQuickSyncQuickSync
Notebook Sizemedium sized
Date of Announcement02.06.2015 03.01.2017
Memory TypeDDR3/DDR4
Max. Amount of Memory64 MB
CPU in Iris Pro Graphics 6200GPU Base SpeedGPU Boost / Turbo
Intel Core i7-5775C4 x 3300 MHz, 65 W300 MHz1150 MHz
Intel Core i7-5950HQ4 x 2900 MHz, 47 W300 MHz1150 MHz
Intel Core i7-5850HQ4 x 2700 MHz, 47 W300 MHz1100 MHz
min. - max.300 MHz1050 - 1150 MHz
CPU in Iris Plus Graphics 640GPU Base SpeedGPU Boost / Turbo
Intel Core i7-7660U2 x 2500 MHz, 15 W300 MHz1050 MHz
Intel Core i7-7560U2 x 2400 MHz, 15 W300 MHz1050 MHz
Intel Core i5-7360U2 x 2300 MHz, 15 W300 MHz1000 MHz
Intel Core i5-7260U2 x 2200 MHz, 15 W300 MHz950 MHz
min. - max.300 MHz950 - 1150 MHz

Benchmarks

3DMark - 3DMark Time Spy Score
min: 467     avg: 499.8     median: 494.5 (1%)     max: 543 Points
3DMark - 3DMark Time Spy Graphics
min: 413     avg: 442.5     median: 437 (1%)     max: 483 Points
3DMark - 3DMark Ice Storm Unlimited Graphics
min: 142163     avg: 147298     median: 145481 (16%)     max: 154251 Points
3DMark - 3DMark Ice Storm Extreme Graphics
100535 Points (13%)
3DMark - 3DMark Cloud Gate Score
min: 12893     avg: 13059     median: 13058.5 (14%)     max: 13224 Points
min: 7558     avg: 8025     median: 8067 (9%)     max: 8711 Points
3DMark - 3DMark Cloud Gate Graphics
min: 15361     avg: 15388     median: 15387.5 (4%)     max: 15414 Points
min: 10486     avg: 11119     median: 11248 (3%)     max: 11495 Points
3DMark - 3DMark Fire Strike Standard Score
min: 1662     avg: 1685     median: 1685 (3%)     max: 1708 Points
min: 1236     avg: 1349     median: 1310 (2%)     max: 1509 Points
3DMark - 3DMark Fire Strike Standard Graphics
min: 1704     avg: 1737     median: 1736.5 (2%)     max: 1769 Points
min: 1315     avg: 1411     median: 1393.5 (2%)     max: 1541 Points
3DMark 11 - 3DM11 Performance Score
3094 Points (4%)
min: 2136     avg: 2440     median: 2561 (4%)     max: 2664 Points
3DMark 11 - 3DM11 Performance GPU
2766 Points (2%)
min: 1980     avg: 2275     median: 2379 (2%)     max: 2493 Points
3DMark 06 3DMark 06 - Standard 1280x1024 + Intel Iris Plus Graphics 640
3DMark 06
min: 13164     avg: 14118     median: 14117.5 (18%)     max: 15071 Points
Unigine Valley 1.0 - Unigine Valley 1.0 DX
6.5 fps (2%)
Cinebench R10 Cinebench R10 Shading (32bit) + Intel Iris Plus Graphics 640
Cinebench R10 - Cinebench R10 Shading (32bit)
min: 8824     avg: 9678     median: 9703 (7%)     max: 10506 Points
Cinebench R11.5 Cinebench R11.5 OpenGL 64 Bit + Intel Iris Plus Graphics 640
Cinebench R11.5 - Cinebench R11.5 OpenGL 64 Bit
46.1 fps (16%)
Cinebench R15
Cinebench R15 OpenGL 64 Bit + Intel Iris Plus Graphics 640
Cinebench R15 - Cinebench R15 OpenGL 64 Bit
min: 41.32     avg: 54     median: 56.2 (3%)     max: 62.3 fps
Cinebench R15 OpenGL Ref. Match 64 Bit + Intel Iris Plus Graphics 640
Cinebench R15 - Cinebench R15 OpenGL Ref. Match 64 Bit
min: 97.8     avg: 98.2     median: 97.8 (98%)     max: 99.3 %
GFXBench - GFXBench Car Chase Offscreen
40.7 fps (5%)
GFXBench 3.1 - GFXBench Manhattan ES 3.1 Offscreen
56.1 fps (1%)
GFXBench 3.0 - GFXBench 3.0 Manhattan Offscreen
31.2 fps (2%)
GFXBench (DX / GLBenchmark) 2.7
GFXBench T-Rex HD Offscreen C24Z16 + Intel Iris Plus Graphics 640
GFXBench (DX / GLBenchmark) 2.7 - GFXBench T-Rex HD Offscreen C24Z16
171 fps (1%)
LuxMark v2.0 64Bit - LuxMark v2.0 Room GPU
min: 315     avg: 325     median: 325 (1%)     max: 335 Samples/s
LuxMark v2.0 64Bit - LuxMark v2.0 Sala GPU
min: 748     avg: 779     median: 778.5 (1%)     max: 809 Samples/s
ComputeMark v2.1 - ComputeMark v2.1 Result
min: 1575     avg: 1677     median: 1677 (2%)     max: 1779 Points
Power Consumption - Furmark Stress Test Power Consumption - external Monitor *
min: 30.8     avg: 33.6     median: 31.5 (4%)     max: 38.5 Watt
Power Consumption - The Witcher 3 Power Consumption - external Monitor *
min: 28     avg: 33.5     median: 33.5 (5%)     max: 38.9 Watt
Power Consumption - Witcher 3 Power Consumption *
min: 31.7     avg: 34.9     median: 34.9 (8%)     max: 38.1 Watt
Power Consumption - Witcher 3 ultra Power Efficiency - external Monitor
0.1 fps per Watt (9%)
Emissions Witcher 3 Fan Noise + Intel Iris Plus Graphics 640
Emissions - Witcher 3 Fan Noise
33.4 dB(A) (53%)
Clock Speed - GPU Clock Witcher 3 ultra
min: 748     avg: 823     median: 823 (32%)     max: 898 MHz
Clock Speed - GPU Clock Speed Furmark
min: 570     avg: 634     median: 634 (25%)     max: 698 MHz

Average Benchmarks Intel Iris Pro Graphics 6200 → 100% n=6

Average Benchmarks Intel Iris Plus Graphics 640 → 77% n=6

- Range of benchmark values for this graphics card
- Average benchmark values for this graphics card
* Smaller numbers mean a higher performance
1 This benchmark is not used for the average calculation

Game Benchmarks

The following benchmarks stem from our benchmarks of review laptops. The performance depends on the used graphics memory, clock rate, processor, system settings, drivers, and operating systems. So the results don't have to be representative for all laptops with this GPU. For detailed information on the benchmark results, click on the fps number.

low 1280x720
Iris Plus Graphics 640:
13.8  fps
low 1280x720
Iris Plus Graphics 640:
28  fps
FIFA 18

FIFA 18

2017
low 1280x720
Iris Plus Graphics 640:
69.5 (!)  fps
med. 1920x1080
Iris Plus Graphics 640:
38.8 (!)  fps
F1 2017

F1 2017

2017
low 1280x720
Iris Plus Graphics 640:
33 38 ~ 36 fps
med. 1920x1080
Iris Plus Graphics 640:
15 15 ~ 15 fps
low 1280x720
Iris Plus Graphics 640:
22.9  fps
med. 1366x768
Iris Plus Graphics 640:
99  fps
high 1920x1080
Iris Plus Graphics 640:
48  fps
ultra 1920x1080
Iris Plus Graphics 640:
31.8  fps
Dirt 4

Dirt 4

2017
med. 1920x1080
Iris Plus Graphics 640:
27.5 (!)  fps
low 1280x720
Iris Plus Graphics 640:
69.3 96 101 103 ~ 92 fps
med. 1920x1080
Iris Plus Graphics 640:
33.9 35.8 42.6 48.2 ~ 40 fps
high 1920x1080
Iris Plus Graphics 640:
24.9 25.3 29.3 33.6 ~ 28 fps
Prey

Prey

2017
low 1280x720
Iris Plus Graphics 640:
39.9 45.4 ~ 43 fps
med. 1920x1080
Iris Plus Graphics 640:
17.9 18.1 ~ 18 fps
high 1920x1080
Iris Plus Graphics 640:
14.8  fps
low 1280x720
Iris Plus Graphics 640:
33.8  fps
low 1280x720
Iris Plus Graphics 640:
20.4  fps
low 1280x720
Iris Plus Graphics 640:
16 16.6 ~ 16 fps
For Honor

For Honor

2017
low 1280x720
Iris Plus Graphics 640:
30.8 33.5 ~ 32 fps
med. 1920x1080
Iris Plus Graphics 640:
11.8 12.7 ~ 12 fps
low 1280x720
Iris Plus Graphics 640:
42.9 45 ~ 44 fps
med. 1366x768
Iris Plus Graphics 640:
31.4  fps
high 1920x1080
Iris Plus Graphics 640:
22.9  fps
low 1280x720
Iris Plus Graphics 640:
121  fps
med. 1366x768
Iris Plus Graphics 640:
91  fps
high 1920x1080
Iris Plus Graphics 640:
31.6  fps
ultra 1920x1080
Iris Plus Graphics 640:
17.8  fps
low 1280x720
Iris Plus Graphics 640:
26.6 29.2 38.6 ~ 31 fps
med. 1366x768
Iris Plus Graphics 640:
19.6 24.2 ~ 22 fps
high 1920x1080
Iris Plus Graphics 640:
9.2 11.1 ~ 10 fps
low 1280x720
Iris Plus Graphics 640:
20.2  fps
Overwatch

Overwatch

2016
low 1280x720
Iris Plus Graphics 640:
53.6 56.1 63.3 67.3 ~ 60 fps
med. 1366x768
Iris Plus Graphics 640:
24.1 36.5 41 52.9 ~ 39 fps
high 1920x1080
Iris Plus Graphics 640:
15.9 29.9 36.5 ~ 27 fps
ultra 1920x1080
Iris Plus Graphics 640:
19.5  fps
low 1280x720
Iris Plus Graphics 640:
24.9  fps
low 1280x720
Iris Plus Graphics 640:
28  fps
med. 1920x1080
Iris Plus Graphics 640:
13  fps
low 1024x768
Iris Plus Graphics 640:
23.5 25.8 ~ 25 fps
med. 1366x768
Iris Plus Graphics 640:
16.7 19.4 ~ 18 fps
high 1920x1080
Iris Plus Graphics 640:
9.1  fps
low 1024x768
Iris Plus Graphics 640:
45.4 (!) 50.5 59.2 ~ 52 fps
med. 1366x768
Iris Plus Graphics 640:
29 30.7 (!) 32.9 ~ 31 fps
high 1920x1080
Iris Plus Graphics 640:
16.4 16.6 (!) 18.7 ~ 17 fps
ultra 1920x1080
Iris Plus Graphics 640:
14.2  fps
low 1024x768
Iris Plus Graphics 640:
44.7  fps
med. 1366x768
Iris Plus Graphics 640:
26.2  fps
high 1920x1080
Iris Plus Graphics 640:
12.9  fps
low 1280x720
Iris Plus Graphics 640:
68 92 ~ 80 fps
med. 1366x768
Iris Plus Graphics 640:
55 63.7 ~ 59 fps
high 1920x1080
Iris Plus Graphics 640:
27.6 29.5 ~ 29 fps
ultra 1920x1080
Iris Plus Graphics 640:
19.8 23 ~ 21 fps
low 1024x768
Iris Plus Graphics 640:
16.4 17.5 21 21.7 ~ 19 fps
med. 1366x768
Iris Plus Graphics 640:
13.4  fps
ultra 1920x1080
Iris Plus Graphics 640:
4  fps
GTA V

GTA V

2015
low 1024x768
Iris Plus Graphics 640:
56.7  fps
med. 1366x768
Iris Plus Graphics 640:
28.9  fps
high 1920x1080
Iris Plus Graphics 640:
11.8  fps
Sims 4

Sims 4

2014
high 1920x1080
Iris Plus Graphics 640:
28.6  fps
ultra 1920x1080
Iris Plus Graphics 640:
20.2 20.8 ~ 21 fps
low 1024x768
Iris Plus Graphics 640:
43.1 60.3 ~ 52 fps
med. 1366x768
Iris Plus Graphics 640:
29.7 42 ~ 36 fps
high 1366x768
Iris Plus Graphics 640:
23.2 30.7 ~ 27 fps
ultra 1920x1080
Iris Plus Graphics 640:
8.2 9.9 ~ 9 fps
low 1280x720
Iris Plus Graphics 640:
61 68.2 ~ 65 fps
med. 1366x768
Iris Plus Graphics 640:
40.2 45.1 ~ 43 fps
high 1366x768
Iris Plus Graphics 640:
33.5 38.3 ~ 36 fps
ultra 1920x1080
Iris Plus Graphics 640:
10.7 12.5 ~ 12 fps
low 1024x768
Iris Plus Graphics 640:
103 132.6 ~ 118 fps
med. 1366x768
Iris Plus Graphics 640:
54.1 68.7 ~ 61 fps
high 1366x768
Iris Plus Graphics 640:
37 47.1 ~ 42 fps
ultra 1920x1080
Iris Plus Graphics 640:
17.2 21.6 ~ 19 fps
ultra 1920x1080
Iris Plus Graphics 640:
35.2  fps
World of Warcraft

World of Warcraft

2005
high 1280x1024
Iris Plus Graphics 640:
28.5  fps
Intel Iris Plus Graphics 640lowmed.highultraQHD4K
The Evil Within 213.8
Middle-earth: Shadow of War28
FIFA 1869.538.8
F1 20173615
Playerunknown's Battlegrounds (PUBG)22.9
Team Fortress 2994831.8
Dirt 427.5
Rocket League924028
Prey431814.8
Warhammer 40.000: Dawn of War III33.8
Mass Effect Andromeda20.4
Ghost Recon Wildlands16
For Honor3212
Titanfall 24431.422.9
Farming Simulator 171219131.617.8
Battlefield 1312210
Deus Ex Mankind Divided20.2
Overwatch60392719.5
The Division24.9
Far Cry Primal2813
Rise of the Tomb Raider25189.1
Rainbow Six Siege52311714.2
Star Wars Battlefront44.726.212.9
Dota 2 Reborn80592921
The Witcher 31913.44
GTA V56.728.911.8
Sims 428.621
Battlefield 45236279
BioShock Infinite65433612
Tomb Raider118614219
Diablo III35.2
World of Warcraft28.5
< 30 fps
< 60 fps
< 120 fps
≥ 120 fps
10
10
6
1
10
8
3
13
4

9
2


For more games that might be playable and a list of all games and graphics cards visit our Gaming List

Add one or more devices and compare

In the following list you can select (and also search for) devices that should be added to the comparison. You can select more than one device.

restrict list:

show all (including archived), 2024, 2023
v1.26
log 05. 11:39:10

#0 checking url part for id 5947 +0s ... 0s

#1 checking url part for id 7656 +0s ... 0s

#2 not redirecting to Ajax server +0s ... 0s

#3 did not recreate cache, as it is less than 5 days old! Created at Sat, 04 May 2024 05:42:18 +0200 +0.001s ... 0.001s

#4 composed specs +0.086s ... 0.087s

#5 did output specs +0s ... 0.087s

#6 start showIntegratedCPUs +0s ... 0.087s

#7 getting avg benchmarks for device 5947 +0.028s ... 0.116s

#8 got single benchmarks 5947 +0.01s ... 0.125s

#9 getting avg benchmarks for device 7656 +0.002s ... 0.127s

#10 got single benchmarks 7656 +0.016s ... 0.143s

#11 got avg benchmarks for devices +0s ... 0.143s

#12 min, max, avg, median took s +0.148s ... 0.291s

#13 before gaming benchmark output +0s ... 0.291s

#14 Got 133 rows for game benchmarks. +0.014s ... 0.305s

#15 composed SQL query for gamebenchmarks +0s ... 0.305s

#16 got data and put it in $dataArray +0.02s ... 0.325s

#17 benchmarks composed for output. +0.072s ... 0.397s

#18 calculated avg scores. +0s ... 0.397s

#19 return log +0.04s ... 0.437s

Please share our article, every link counts!
> Expert Reviews and News on Laptops, Smartphones and Tech Innovations > Benchmarks / Tech > Graphics Card Comparison - Head 2 Head
Redaktion, 2017-09- 8 (Update: 2023-07- 1)