Notebookcheck Logo

Apple M3 Pro 12-Core vs AMD Ryzen AI 9 HX 370 vs AMD Ryzen AI 9 HX 375

Apple M3 Pro 12-Core

► remove from comparison Apple Apple M3 Pro 12-Core

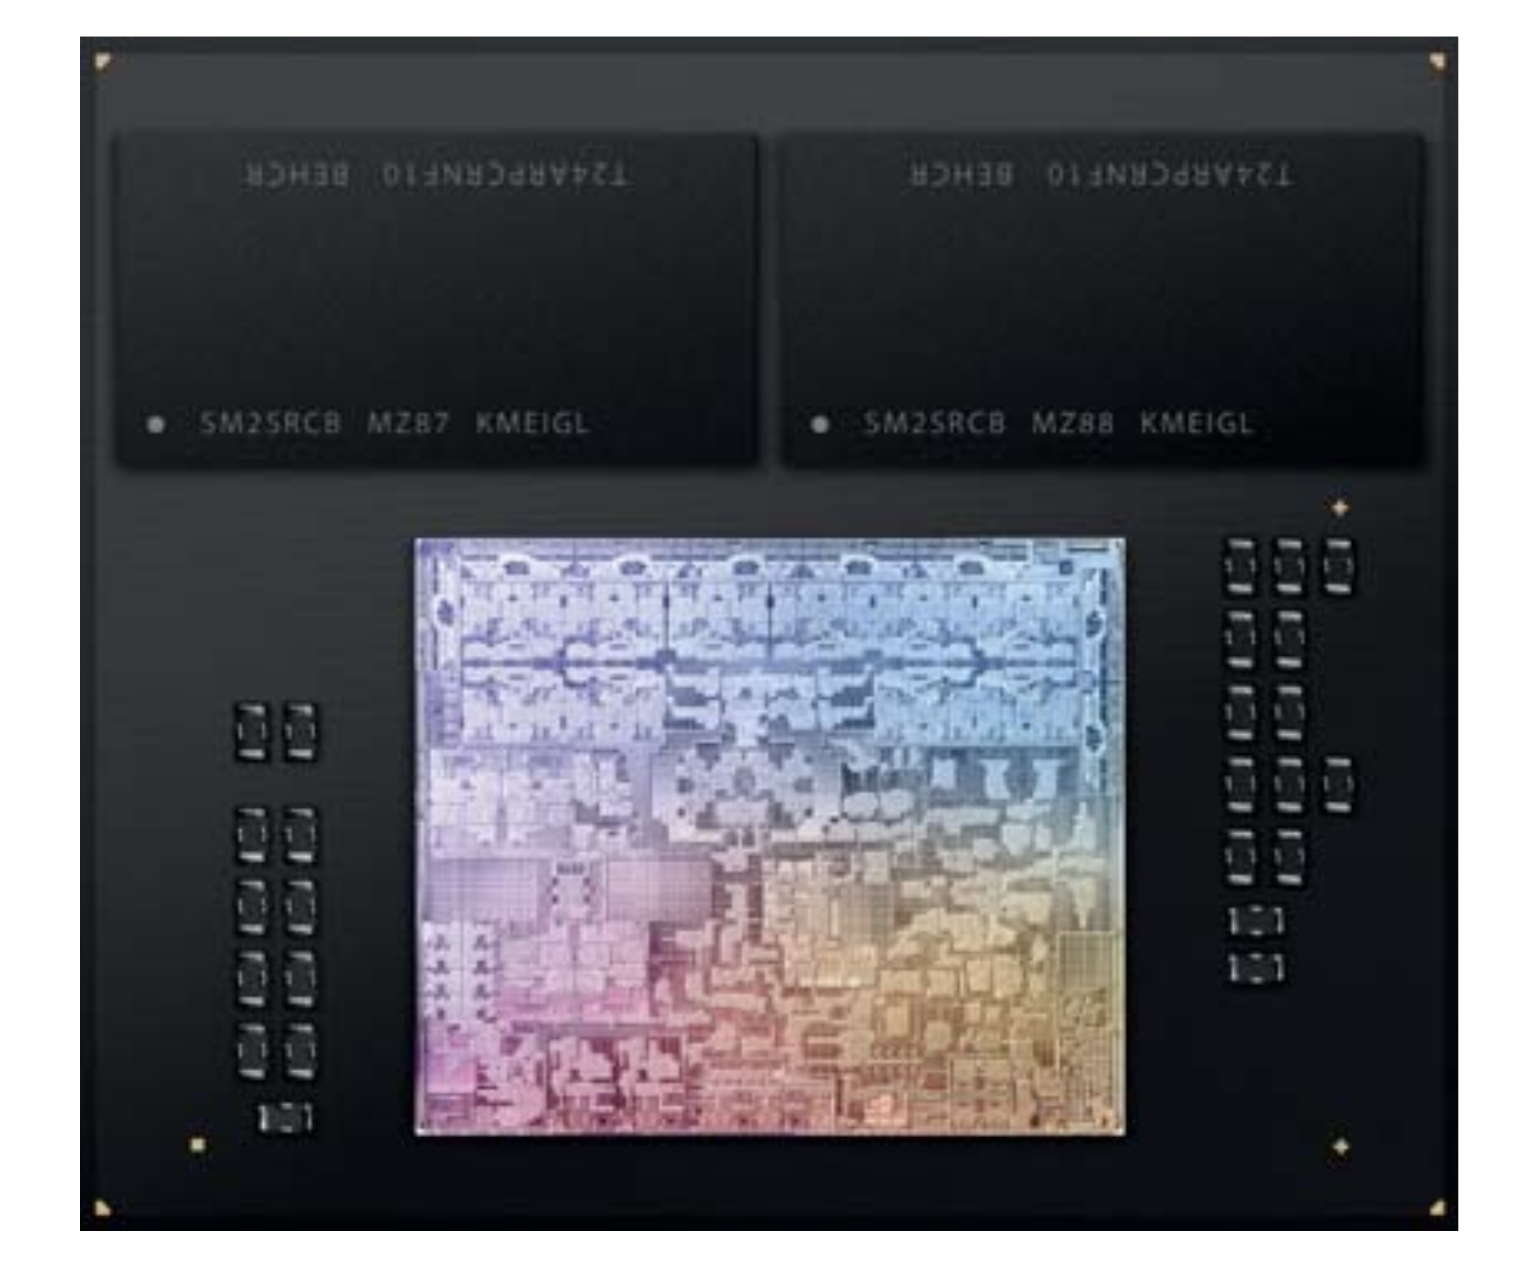
The Apple M3 Pro (12 Core) is a system on a chip (SoC) from Apple for notebooks that was launched in late 2023. It integrates a new 12-core CPU with 6 performance cores with up to 4.06 GHz and 6 efficiency cores with 2.8 GHz. There is also a slimmed-down 11-core variant with a 14-core GPU.

Compared to the M2 Pro the M3 Pro has been slimmed down somewhat and swaps two performance cores for efficiency cores. This is due to the changed core configuration, as 6 cores are now used per cluster (the M2 Pro and M3 still have 4 cores per cluster). Furthermore, the memory bus has been reduced from 256 bits to 192 bits (150 GB/s vs. 200 GB/s). However, thanks to the new architecture and higher clock rates, the new M3 Pro is still slightly faster.

The M3 Pro also integrates a new graphics card with dynamic caching, mesh shading and ray tracing acceleration via hardware. In the top model, all 18 cores of the chip are used and support up to 3 displays simultaneously (internal and 2 external).

GPU and CPU can jointly access the shared memory on the package (unified memory). This is available in 18 or 36 GB variants and offers 150 GB/s maximum bandwidth (192 bit bus).

The integrated 16-core Neural Engine has also been revised and now offers 18 TOPS peak performance (compared to 15.8 TOPS in the M2 but 35 TOPS in the new A17 Pro). The video engine now also supports AV1 decoding in hardware. H.264, HEVC and ProRes (RAW) can still be decoded and encoded.

Unfortunately, the integrated WLAN only continues to support WiFi 6E (no WiFi 7), unlike the small M3 SoC thunderbolt 4 is also supported (max 40 Gbit/s).

The chip is manufactured in the current 3nm process (N3B) at TSMC and contains 37 billion transistors (-7.5% vs. Apple M2 Pro).

AMD Ryzen AI 9 HX 370

► remove from comparison AMD Ryzen AI 9 HX 370

The AMD Ryzen AI 9 HX 370 is a powerful Strix Point family processor that debuted in June 2024. The APU comes with 12 CPU cores running at 2.0 GHz to 5.1 GHz, the 16 CU RDNA 3+ Radeon 890M graphics adapter and the 50 TOPS XDNA 2 neural engine. Other noteworthy features include PCIe 4, USB 4 and LPDDR5x-8000 RAM support.

Of the 12 CPU cores, 4 are full Zen 5 cores and 8 are smaller Zen 5c cores. The latter run at significantly lower clock speeds than the former.

Architecture and Features

Strix Point family APUs are powered by Zen 5 and Zen 5c microarchitecture cores, the latter being a slightly slower, smaller and more energy-efficient version of the former. One of the differences between Zen 5 and Zen 5c is cache size; Zen 5 cores have larger caches to work with. According to AMD, Zen 5 delivers a 16% IPC improvement over Zen 4 thanks to branch prediction improvements and other refinements.

Elsewhere, the HX 370 supports LPDDR5x-8000 and DDR5-5600 RAM, and is natively compatible with USB 4 (and therefore Thunderbolt). It has PCIe 4.0 support for a throughput of 1.9 GB/s per lane, just like its 8000 series predecessors did. The integrated XDNA 2 NPU delivers up to 50 INT8 TOPS for accelerating various AI workloads.

Performance

Given the IPC improvement, we expect 4 Zen 5 cores combined with 8 Zen 5c cores to perform about as well as 16 Zen 4 cores meaning there is a real chance of the HX 370 dethroning the Ryzen 9 7945HX3D. We'll make sure to update this section once we get our hands on a laptop powered by the HX 370.

Graphics

The Radeon 890M is the most powerful iGPU that AMD has on offer right now. It features 16 RDNA 3+ architecture CUs (1024 unified shaders) running at up to 2,900 MHz. We expect the graphics adapter to deliver gaming performance good enough for playing 2023 and 2024 games in 1080p (Low detail settings).

Naturally, the 890M is capable of driving four SUHD 4320p60 monitors. It can also efficiently encode and decode the most popular video codecs including AVC, HEVC, VP9 and AV1. The latest addition to that list, the VVC codec, is not supported unlike it is with Intel Lunar Lake chips.

Power consumption

The HX 370 is supposed to have a base TDP of 28 W, with laptop makers free to crank it up to up to 54 W. Which they will most likely do to maximize performance.

The 4 nm TSMC process that the CPU cores are built with make for decent, as of mid 2024, energy efficiency.

AMD Ryzen AI 9 HX 375

► remove from comparison AMD Ryzen AI 9 HX 375

The AMD Ryzen AI 9 HX 375 is a powerful Strix Point family processor that debuted quietly in July 2024. The APU comes equipped with 12 CPU cores running at 2.0 GHz to 5.1 GHz along with the 16 CU RDNA 3.5 Radeon 890M graphics adapter and the 55 TOPS XDNA 2 neural engine. Other noteworthy features include PCIe 4, USB 4 and LPDDR5x-7500 RAM support.

Of the 12 CPU cores, 4 are full Zen 5 cores and 8 are smaller Zen 5c cores. The latter probably run at somewhat lower clock speeds than the former.

This Ryzen AI 9 series APU shares most of the specifications with the Ryzen AI 9 HX 370.

Architecture and Features

Strix Point family APUs are powered by Zen 5 and Zen 5c microarchitecture cores, the latter being a slightly slower, smaller and more power-efficient version of the full Zen 5 core. One of the differences between Zen 5 and Zen 5c is the cache size; Zen 5 cores have larger caches to work with. According to AMD, Zen 5 APUs deliver a 16% IPC improvement over Zen 4-powered APUs thanks to branch prediction improvements and other refinements.

Elsewhere, the HX 375 supports LPDDR5x-7500 and DDR5-5600 RAM, and is also natively compatible with USB 4 (and therefore Thunderbolt). It has PCIe 4.0 support for a throughput of 1.9 GB/s per lane, just like its 8000 series predecessors did. The integrated XDNA 2 NPU is a lot more complex than the original XDNA was for up to 55 INT8 TOPS for accelerating various AI workloads.

Performance

Given the striking similarity in specs, we fully expect the HX 375 to perform about as well as the HX 370 for very decent but certainly not ground-breaking multi-thread performance that's mostly on par with the Core i5-13500HX and the Ryzen 7 7745HX.

Graphics

The Radeon 890M is the most powerful AMD iGPU, as of mid 2024. It features 16 RDNA 3.5 architecture CUs (1024 unified shaders) running at up to 2,900 MHz. Performance-wise, the graphics adapter can be as slow as the Arc 8 or as fast as the RTX 2050 Laptop depending on the benchmark or game. On average, the 890M finds itself very close to the GTX 1650 Laptop making it possible to play 2024 AAA games at 1080p with most settings set to Low.

Naturally, the AMD iGPU is capable of driving four SUHD 4320p60 monitors and it can also efficiently encode and decode the most popular video codecs including first and foremost AVC, HEVC, VP9 and AV1. The latest addition to that list, the VVC codec, is not supported unlike it is with Intel Lunar Lake chips.

Power consumption

The HX 375 is supposed to have a base TDP of 28 W, with laptop makers free to crank it up to up to 54 W if needed. Which they will most likely do to maximize performance.

The TSMC N4P process that the CPU cores are built with make for decent, as of mid 2024, power efficiency.

ModelApple M3 Pro 12-CoreAMD Ryzen AI 9 HX 370AMD Ryzen AI 9 HX 375
SeriesApple M3AMD Strix / Gorgon PointAMD Strix / Gorgon Point
Series: Strix / Gorgon Point Strix Point-HX (Zen 5)
Apple M3 Max 16-Core2.75 - 4.06 GHz16 / 16 cores
Apple M3 Max 14-Core2.75 - 4.06 GHz14 / 14 cores
Apple M3 Pro 12-Core « 2.75 - 4.06 GHz12 / 12 cores
Apple M3 Pro 11-Core2.75 - 4.06 GHz11 / 11 cores
Apple M32.75 - 4.06 GHz8 / 8 cores
AMD Ryzen AI 9 HX 375 « 2 - 5.1 GHz12 / 24 cores24 MB L3
AMD Ryzen AI 9 HX PRO 3752 - 5.1 GHz12 / 24 cores24 MB L3
Clock2748 - 4056 MHz2000 - 5100 MHz2000 - 5100 MHz
Cores / Threads12 / 12
6 x 4.1 GHz Apple M3 P-Core
6 x 2.7 GHz Apple M3 E-Core
12 / 24
4 x 5.1 GHz AMD Zen 5
8 x 3.3 GHz AMD Zen 5c
12 / 24
4 x 5.1 GHz AMD Zen 5
8 x 3.3 GHz AMD Zen 5c
TDP27 Watt28 Watt54 Watt
Transistors37000 Million
Technology3 nm4 nm4 nm
FeaturesARMv8 Instruction SetDDR5-5600/LPDDR5x-8000 RAM, PCIe 4, USB 4, XDNA 2 NPU (50 TOPS), SMT, AES, AVX, AVX2, AVX512, FMA3, MMX (+), SHA, SSE, SSE2, SSE3, SSSE3, SSE4.1, SSE4.2, SSE4ADDR5-5600/LPDDR5x-7500 RAM, PCIe 4, USB 4, XDNA 2 NPU (55 TOPS), SMT, AES, AVX, AVX2, AVX512, FMA3, MMX (+), SHA, SSE, SSE2, SSE3, SSSE3, SSE4.1, SSE4.2, SSE4A
iGPUApple M3 Pro 18-Core GPUAMD Radeon 890M ( - 2900 MHz)AMD Radeon 890M ( - 2900 MHz)
NPU / AI18 TOPS INT850 TOPS INT855 TOPS INT8
ArchitectureARMx86x86
Announced
Manufacturerwww.apple.comwww.amd.comwww.amd.com
CodenameStrix Point-HX (Zen 5/5c)Strix Point-HX (Zen 5)
L2 Cache12 MB12 MB
L3 Cache24 MB24 MB
TDP Turbo PL254 Watt
max. Temp.100 °C100 °C
SocketFP8FP8
Chip AI80 TOPS INT885 TOPS INT8

Benchmarks

Performance Rating - CB R15 + R20 + 7-Zip + X265 + Blender + 3DM11 CPU - Ryzen AI 9 HX 370
43.2 pt (72%)
Restrict / Search: Model: Max. age: years
Performance Rating - CB R15 + R20 + 7-Zip + X265 + Blender + 3DM11 CPU - Ryzen AI 9 HX 375
42.2 pt (70%)
Restrict / Search: Model: Max. age: years
Cinebench 2024 - Cinebench 2024 CPU Single Core
143 Points (72%)
min: 113.6     avg: 117     median: 117 (58%)     max: 121 Points
95.6 Points (48%)
Cinebench 2024 - Cinebench 2024 CPU Multi Core
1059 Points (20%)
min: 621     avg: 1083     median: 1152 (21%)     max: 1299 Points
1162 Points (22%)
Cinebench R23 - Cinebench R23 Multi Core
15106 Points (14%)
min: 10435     avg: 20668     median: 21897 (20%)     max: 23902 Points
21812 Points (20%)
Cinebench R23 - Cinebench R23 Single Core
1977 Points (80%)
min: 1921     avg: 2012     median: 2018.5 (82%)     max: 2049 Points
1988 Points (81%)
Cinebench R20 - Cinebench R20 CPU (Single Core)
min: 753     avg: 789     median: 791 (86%)     max: 804 Points
776 Points (85%)
Cinebench R20 - Cinebench R20 CPU (Multi Core)
min: 6449     avg: 8395     median: 8817 (21%)     max: 9280 Points
8541 Points (21%)
Cinebench R15 - Cinebench R15 CPU Multi 64 Bit
2163 Points (14%)
min: 2498.13     avg: 3242     median: 3448 (22%)     max: 3551 Points
3334 Points (21%)
Cinebench R15 - Cinebench R15 CPU Single 64 Bit
min: 188.8     avg: 291.6     median: 307 (85%)     max: 315 Points
301 Points (83%)
Cinebench R11.5 - Cinebench R11.5 CPU Multi 64 Bit
min: 34.85     avg: 39     median: 39.5 (51%)     max: 41.17 Points
Cinebench R11.5 - Cinebench R11.5 CPU Single 64 Bit
min: 3.59     avg: 3.7     median: 3.7 (88%)     max: 3.7 Points
Cinebench R10 - Cinebench R10 Rend. Single (32bit)
min: 8437     avg: 8639     median: 8655 (52%)     max: 8797 Points
Cinebench R10 - Cinebench R10 Rend. Multi (32bit)
min: 48553     avg: 53517     median: 53766 (39%)     max: 56689 Points
Cinebench R10 - Cinebench R10 Rend. Multi (64bit)
min: 89081     avg: 97658     median: 98125 (63%)     max: 103657 Points
Cinebench R10 - Cinebench R10 Rend. Single (64bit)
min: 15381     avg: 15748     median: 15797 (19%)     max: 15935 Points
wPrime 2.10 - wPrime 2.0 1024m *
min: 50.536     avg: 75.7     median: 79.4 (1%)     max: 84.742 s
wPrime 2.10 - wPrime 2.0 32m *
min: 2.701     avg: 2.9     median: 2.7 (1%)     max: 3.743 s
WinRAR - WinRAR 4.0
min: 4008     avg: 4504     median: 4759 (8%)     max: 4859 Points
7-Zip 18.03 - 7-Zip 18.03 Multi Thread 4 runs
min: 66154     avg: 78634     median: 80868 (46%)     max: 84735 MIPS
77867 MIPS (45%)
7-Zip 18.03 - 7-Zip 18.03 Single Thread 4 runs
min: 5859     avg: 6178     median: 6179 (73%)     max: 6497 MIPS
5856 MIPS (69%)
X264 HD Benchmark 4.0 - x264 Pass 2
min: 144.9     avg: 167.2     median: 169.8 (4%)     max: 185.1 fps
X264 HD Benchmark 4.0 - x264 Pass 1
min: 300     avg: 309.4     median: 306 (8%)     max: 330 fps
HWBOT x265 Benchmark v2.2 - HWBOT x265 4k Preset
min: 20.3     avg: 25.5     median: 26.3 (46%)     max: 28.7 fps
25.1 fps (44%)
TrueCrypt - TrueCrypt Serpent
min: 1.6     avg: 1.6     median: 1.6 (47%)     max: 1.7 GB/s
TrueCrypt - TrueCrypt Twofish
min: 2.5     avg: 2.7     median: 2.7 (47%)     max: 2.8 GB/s
TrueCrypt - TrueCrypt AES
min: 15.1     avg: 15.5     median: 15.3 (40%)     max: 16.6 GB/s
Blender - Blender 3.3 Classroom CPU *
314 Seconds (4%)
min: 208     avg: 237     median: 221 (3%)     max: 306 Seconds
241 Seconds (3%)
Blender - Blender 2.79 BMW27 CPU *
327 Seconds (2%)
min: 139     avg: 155.2     median: 147.5 (1%)     max: 192 Seconds
159 Seconds (1%)
R Benchmark 2.5 - R Benchmark 2.5 *
min: 0.3892     avg: 0.4     median: 0.4 (9%)     max: 0.529 sec
0.4 sec (9%)
3DMark 06 - CPU - 3DMark 06 - CPU
min: 13761     avg: 16239     median: 16471.5 (35%)     max: 17466 Points
Super Pi mod 1.5 XS 1M - Super Pi mod 1.5 XS 1M *
min: 8.224     avg: 8.4     median: 8.4 (2%)     max: 8.482 s
Super Pi mod 1.5 XS 2M - Super Pi mod 1.5 XS 2M *
min: 17.504     avg: 18.6     median: 17.8 (1%)     max: 22.248 s
3DMark Vantage - 3DM Vant. Perf. CPU no Physx
min: 66119     avg: 73048     median: 75346 (58%)     max: 77565 Points
3DMark 11 - 3DM11 Performance Physics
min: 17129     avg: 20590     median: 20813 (51%)     max: 24599 Points
20306 Points (50%)
3DMark - 3DMark Ice Storm Physics
min: 50952     avg: 62767     median: 63723.5 (52%)     max: 76578 Points
3DMark - 3DMark Ice Storm Extreme Physics
min: 50955     avg: 64270     median: 66513.5 (54%)     max: 77375 Points
3DMark - 3DMark Ice Storm Unlimited Physics
min: 48351     avg: 63261     median: 64870 (52%)     max: 76518 Points
3DMark - 3DMark Cloud Gate Physics
min: 16960     avg: 19505     median: 19578 (50%)     max: 21349 Points
19569 Points (50%)
3DMark - 3DMark Fire Strike Standard Physics
min: 24918     avg: 30155     median: 30474.5 (54%)     max: 33844 Points
30229 Points (54%)
3DMark - 3DMark Time Spy CPU
min: 8866     avg: 10471     median: 10581.5 (45%)     max: 12293 Points
10891 Points (46%)
Geekbench 6.5 - Geekbench 6.5 Single-Core
3138 Points (73%)
min: 2780     avg: 2888     median: 2884 (67%)     max: 2965 Points
2867 Points (66%)
Geekbench 6.5 - Geekbench 6.5 Multi-Core
15480 Points (60%)
min: 11973     avg: 14661     median: 15043 (58%)     max: 16311 Points
15220 Points (59%)
Geekbench 6.0 - Geekbench 6.0 Single-Core
min: 2645     avg: 2751     median: 2764 (88%)     max: 2844 Points
Geekbench 6.0 - Geekbench 6.0 Multi-Core
min: 12289     avg: 13856     median: 14161 (58%)     max: 15017 Points
Geekbench 5.5 - Geekbench 5.1 - 5.5 64 Bit Single-Core
2327 Points (78%)
min: 1957     avg: 2089     median: 2097 (71%)     max: 2175 Points
2121 Points (71%)
Geekbench 5.5 - Geekbench 5.1 - 5.5 64 Bit Multi-Core
15298 Points (27%)
min: 11394     avg: 14325     median: 14477.5 (26%)     max: 16322 Points
14728 Points (26%)
Geekbench 5.0 - Geekbench 5.0 64 Bit Single-Core
min: 1827     avg: 1935     median: 1934.5 (8%)     max: 2041 Points
Geekbench 5.0 - Geekbench 5.0 64 Bit Multi-Core
min: 12962     avg: 14250     median: 14282 (45%)     max: 15009 Points
Geekbench 4.4 - Geekbench 4.1 - 4.4 64 Bit Single-Core
min: 7480     avg: 7969     median: 7818 (78%)     max: 8628 Points
Geekbench 4.4 - Geekbench 4.1 - 4.4 64 Bit Multi-Core
min: 42842     avg: 52918     median: 54586.5 (54%)     max: 57060 Points
Mozilla Kraken 1.1 - Kraken 1.1 Total Score *
376.2 ms (0%)
min: 307.8     avg: 436     median: 433.5 (1%)     max: 503 ms
431 ms (1%)
Octane V2 - Octane V2 Total Score
96501 Points (64%)
min: 64079     avg: 112489     median: 122618 (81%)     max: 125813 Points
WebXPRT 4 - WebXPRT 4 Score
min: 210     avg: 256.8     median: 259 (67%)     max: 345 Points
277 Points (72%)
WebXPRT 3 - WebXPRT 3 Score
427 Points (77%)
min: 252     avg: 308.4     median: 317 (57%)     max: 363 Points
348 Points (62%)
CrossMark - CrossMark Overall
1977 Points (74%)
min: 1344     avg: 1779     median: 1785 (67%)     max: 2040 Points
1720 Points (64%)
Power Consumption - Prime95 Power Consumption - external Monitor *
min: 45.6     avg: 90.6     median: 93 (16%)     max: 133.7 Watt
68.1 Watt (12%)
Power Consumption - Cinebench R15 Multi Power Consumption - external Monitor *
47.9 Watt (9%)
min: 46.3     avg: 94.6     median: 101.8 (19%)     max: 130.3 Watt
67.8 Watt (12%)
Power Consumption - Idle Power Consumption - external Monitor *
5.8 Watt (4%)
min: 3.66     avg: 8.7     median: 7.6 (5%)     max: 19.6 Watt
2.9 Watt (2%)
Power Consumption - Idle Power Consumption 150cd 1min *
7.5 Watt (5%)
min: 6.31     avg: 9.5     median: 9.2 (7%)     max: 12.8 Watt
3.6 Watt (3%)
Power Consumption - Power Efficiency - Cinebench R15 Multi external Monitor
45.2 Points per Watt (34%)
min: 26.9     avg: 36.1     median: 32.4 (24%)     max: 54.9 Points per Watt
49.2 Points per Watt (37%)

Average Benchmarks Apple M3 Pro 12-Core → 100% n=14

Average Benchmarks AMD Ryzen AI 9 HX 370 → 113% n=14

Average Benchmarks AMD Ryzen AI 9 HX 375 → 110% n=14

- Range of benchmark values for this graphics card
red legend - Average benchmark values for this graphics card
* Smaller numbers mean a higher performance
1 This benchmark is not used for the average calculation

v1.35
log 29. 23:39:14

#0 ran 0s before starting gpusingle class +0s ... 0s

#1 checking url part for id 15115 +0s ... 0s

#2 checking url part for id 17543 +0s ... 0s

#3 checking url part for id 17992 +0s ... 0s

#4 redirected to Ajax server, took 1767047953s time from redirect:0 +0s ... 0s

#5 did not recreate cache, as it is less than 5 days old! Created at Mon, 29 Dec 2025 10:37:44 +0100 +0s ... 0s

#6 composed specs +0.009s ... 0.009s

#7 did output specs +0s ... 0.009s

#8 getting avg benchmarks for device 15115 +0.001s ... 0.01s

#9 got single benchmarks 15115 +0.005s ... 0.014s

#10 getting avg benchmarks for device 17543 +0.004s ... 0.019s

#11 got single benchmarks 17543 +0.033s ... 0.052s

#12 getting avg benchmarks for device 17992 +0.004s ... 0.056s

#13 got single benchmarks 17992 +0.004s ... 0.06s

#14 got avg benchmarks for devices +0s ... 0.06s

#15 min, max, avg, median took s +0.058s ... 0.118s

#16 return log +0s ... 0.118s

Please share our article, every link counts!
Mail Logo
Google Logo Add as a preferred
source on Google
> Expert Reviews and News on Laptops, Smartphones and Tech Innovations > Benchmarks / Tech > Processor Comparison - Head 2 Head
Redaktion, 2017-09- 8 (Update: 2023-07- 1)