




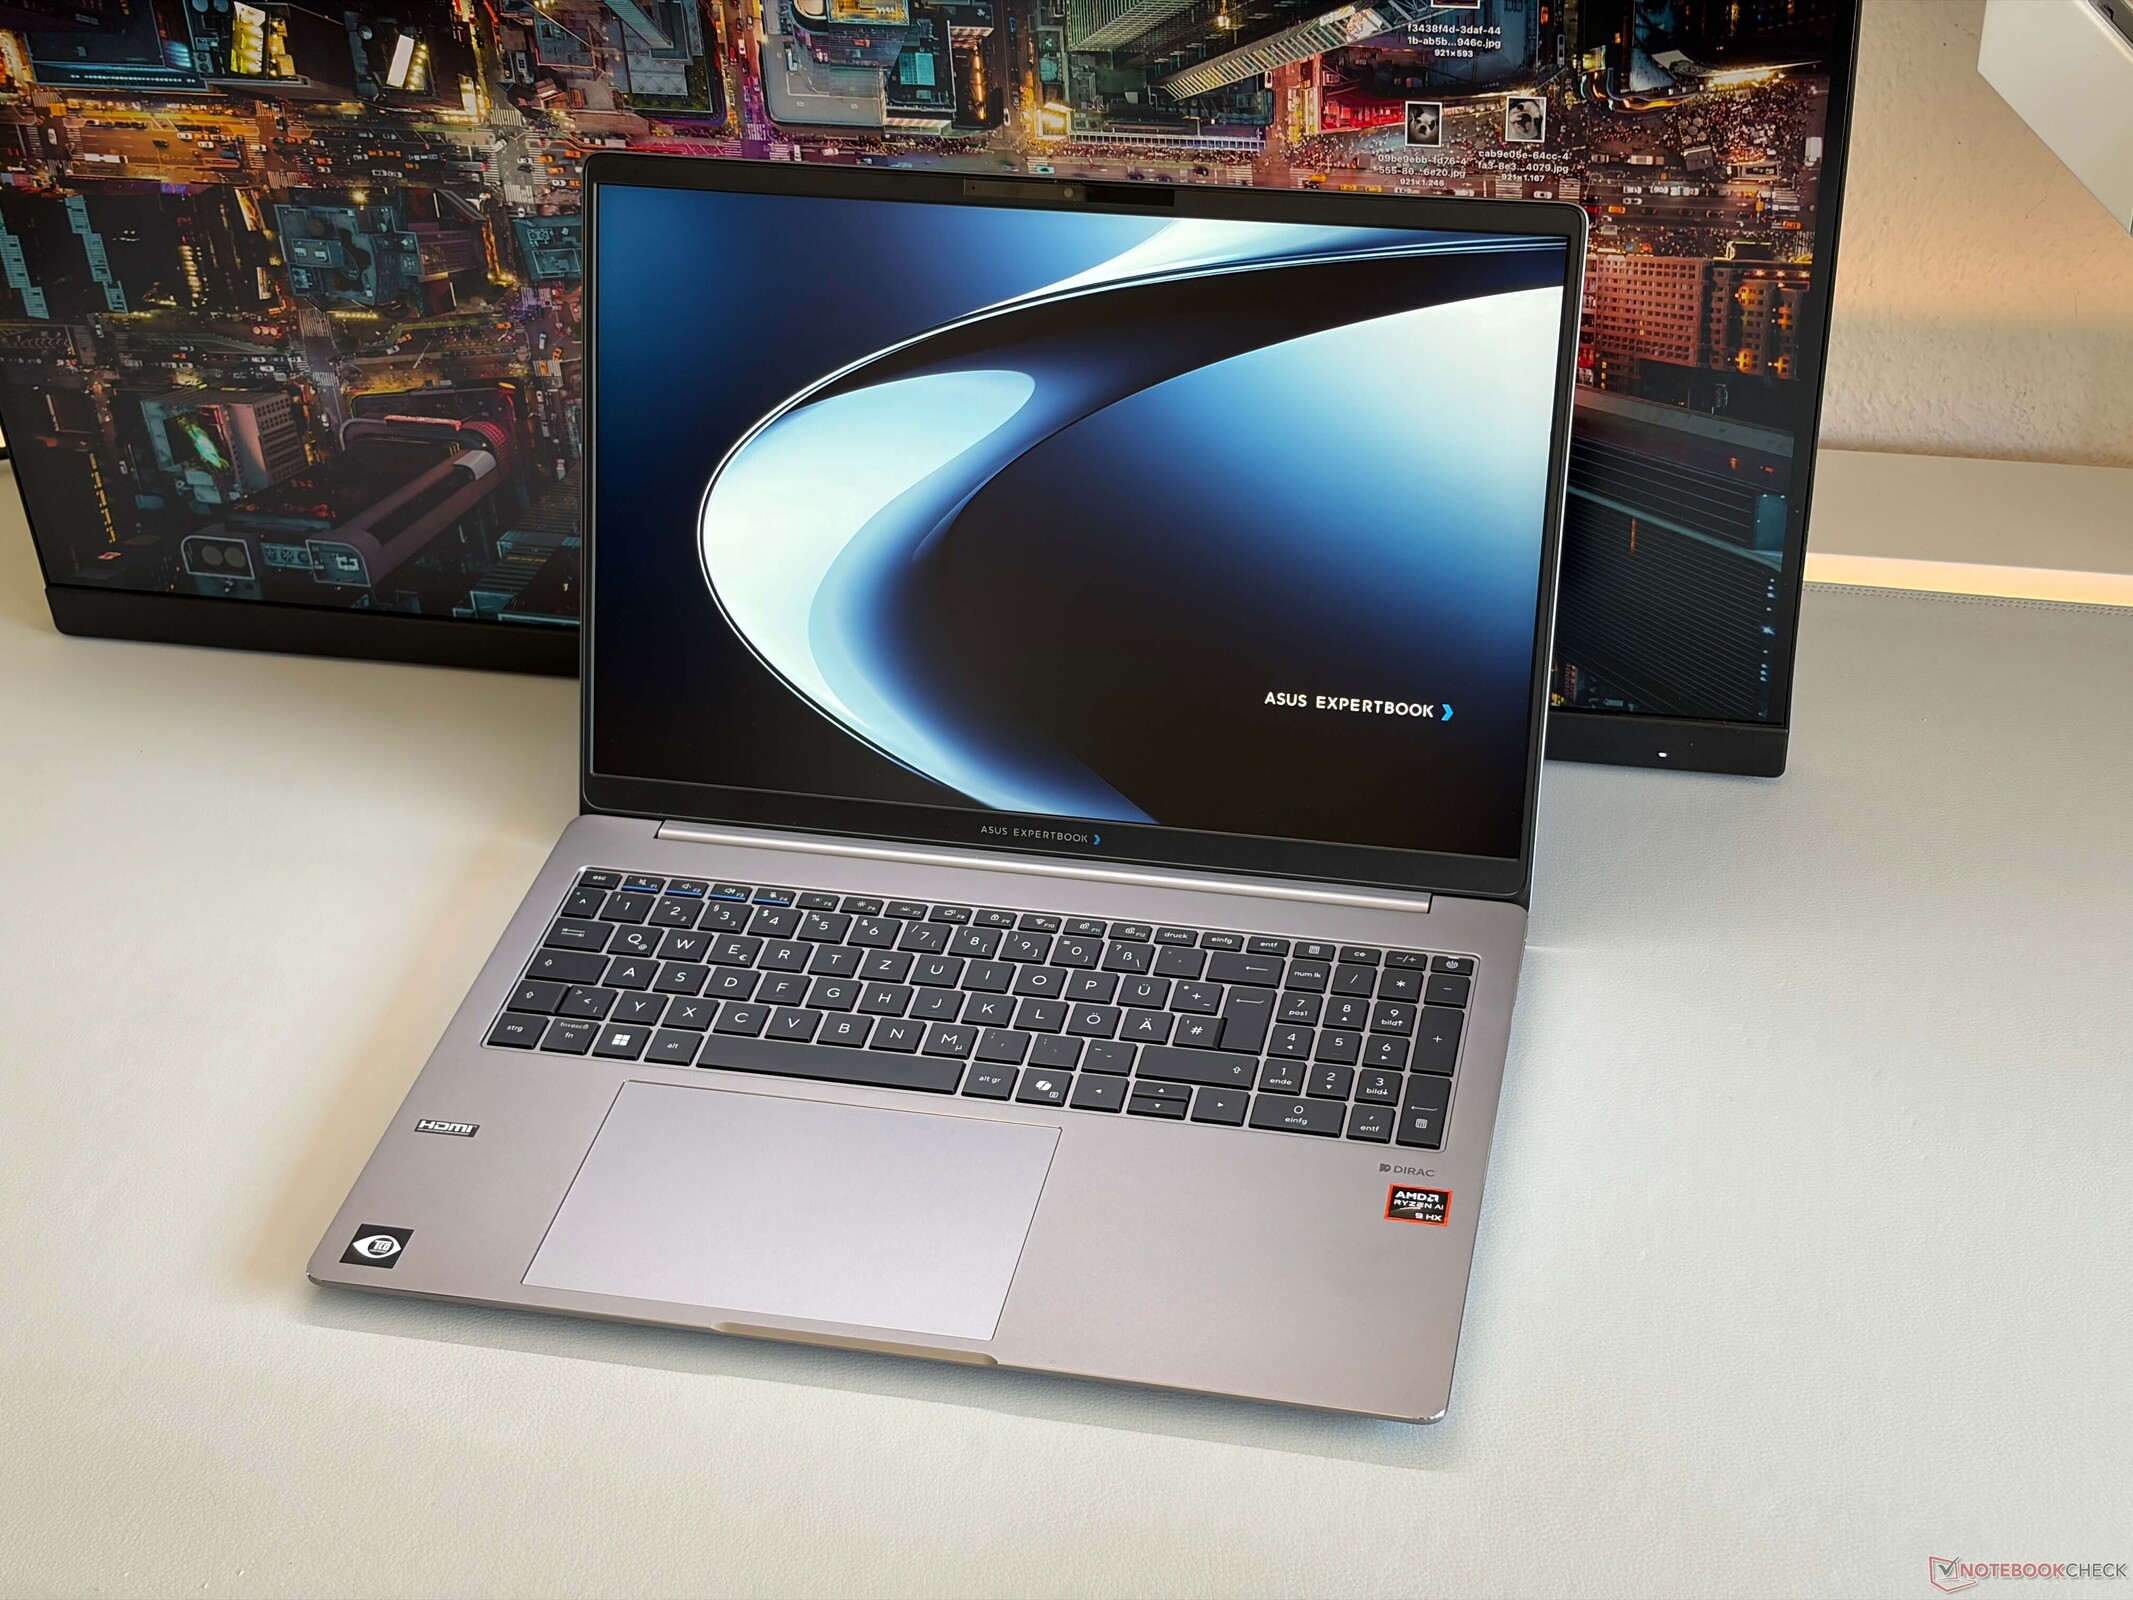
Verdict - The ExpertBook PM5 G2 seems unbalanced
In our test, the new Asus ExpertBook PM5 G2 leaves a mixed impression. The large 16-inch business laptop looks sleek, but its aluminum chassis has slight creaking noises and somewhat wobbly hinges. The keyboard is comfortable and backlit, but the mechanical clicks of the large ClickPad feel a bit cheap. The connectivity and security features are adequate, and in addition to an Ethernet port, it also includes a modern Wi-Fi 7 module.
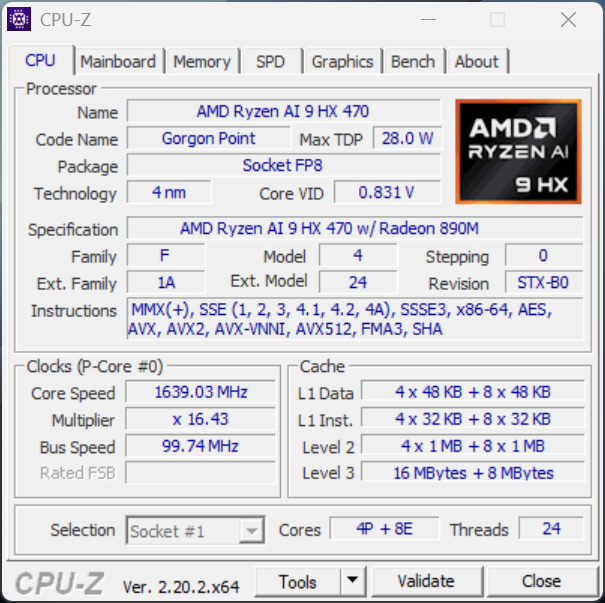
The built-in AMD Ryzen AI 9 HX 470 offers good and stable multi-core performance, but the processor’s high TDP places a heavy load on the single cooler, which can therefore become very loud. At least Asus offers quieter power profiles, allowing the device to remain very quiet under full load if desired.
The built-in matte WQHD display with a 144 Hz refresh rate offers good image quality and is superior to many business competitors in this regard. The panel is excellent for work, and battery life is still very good.
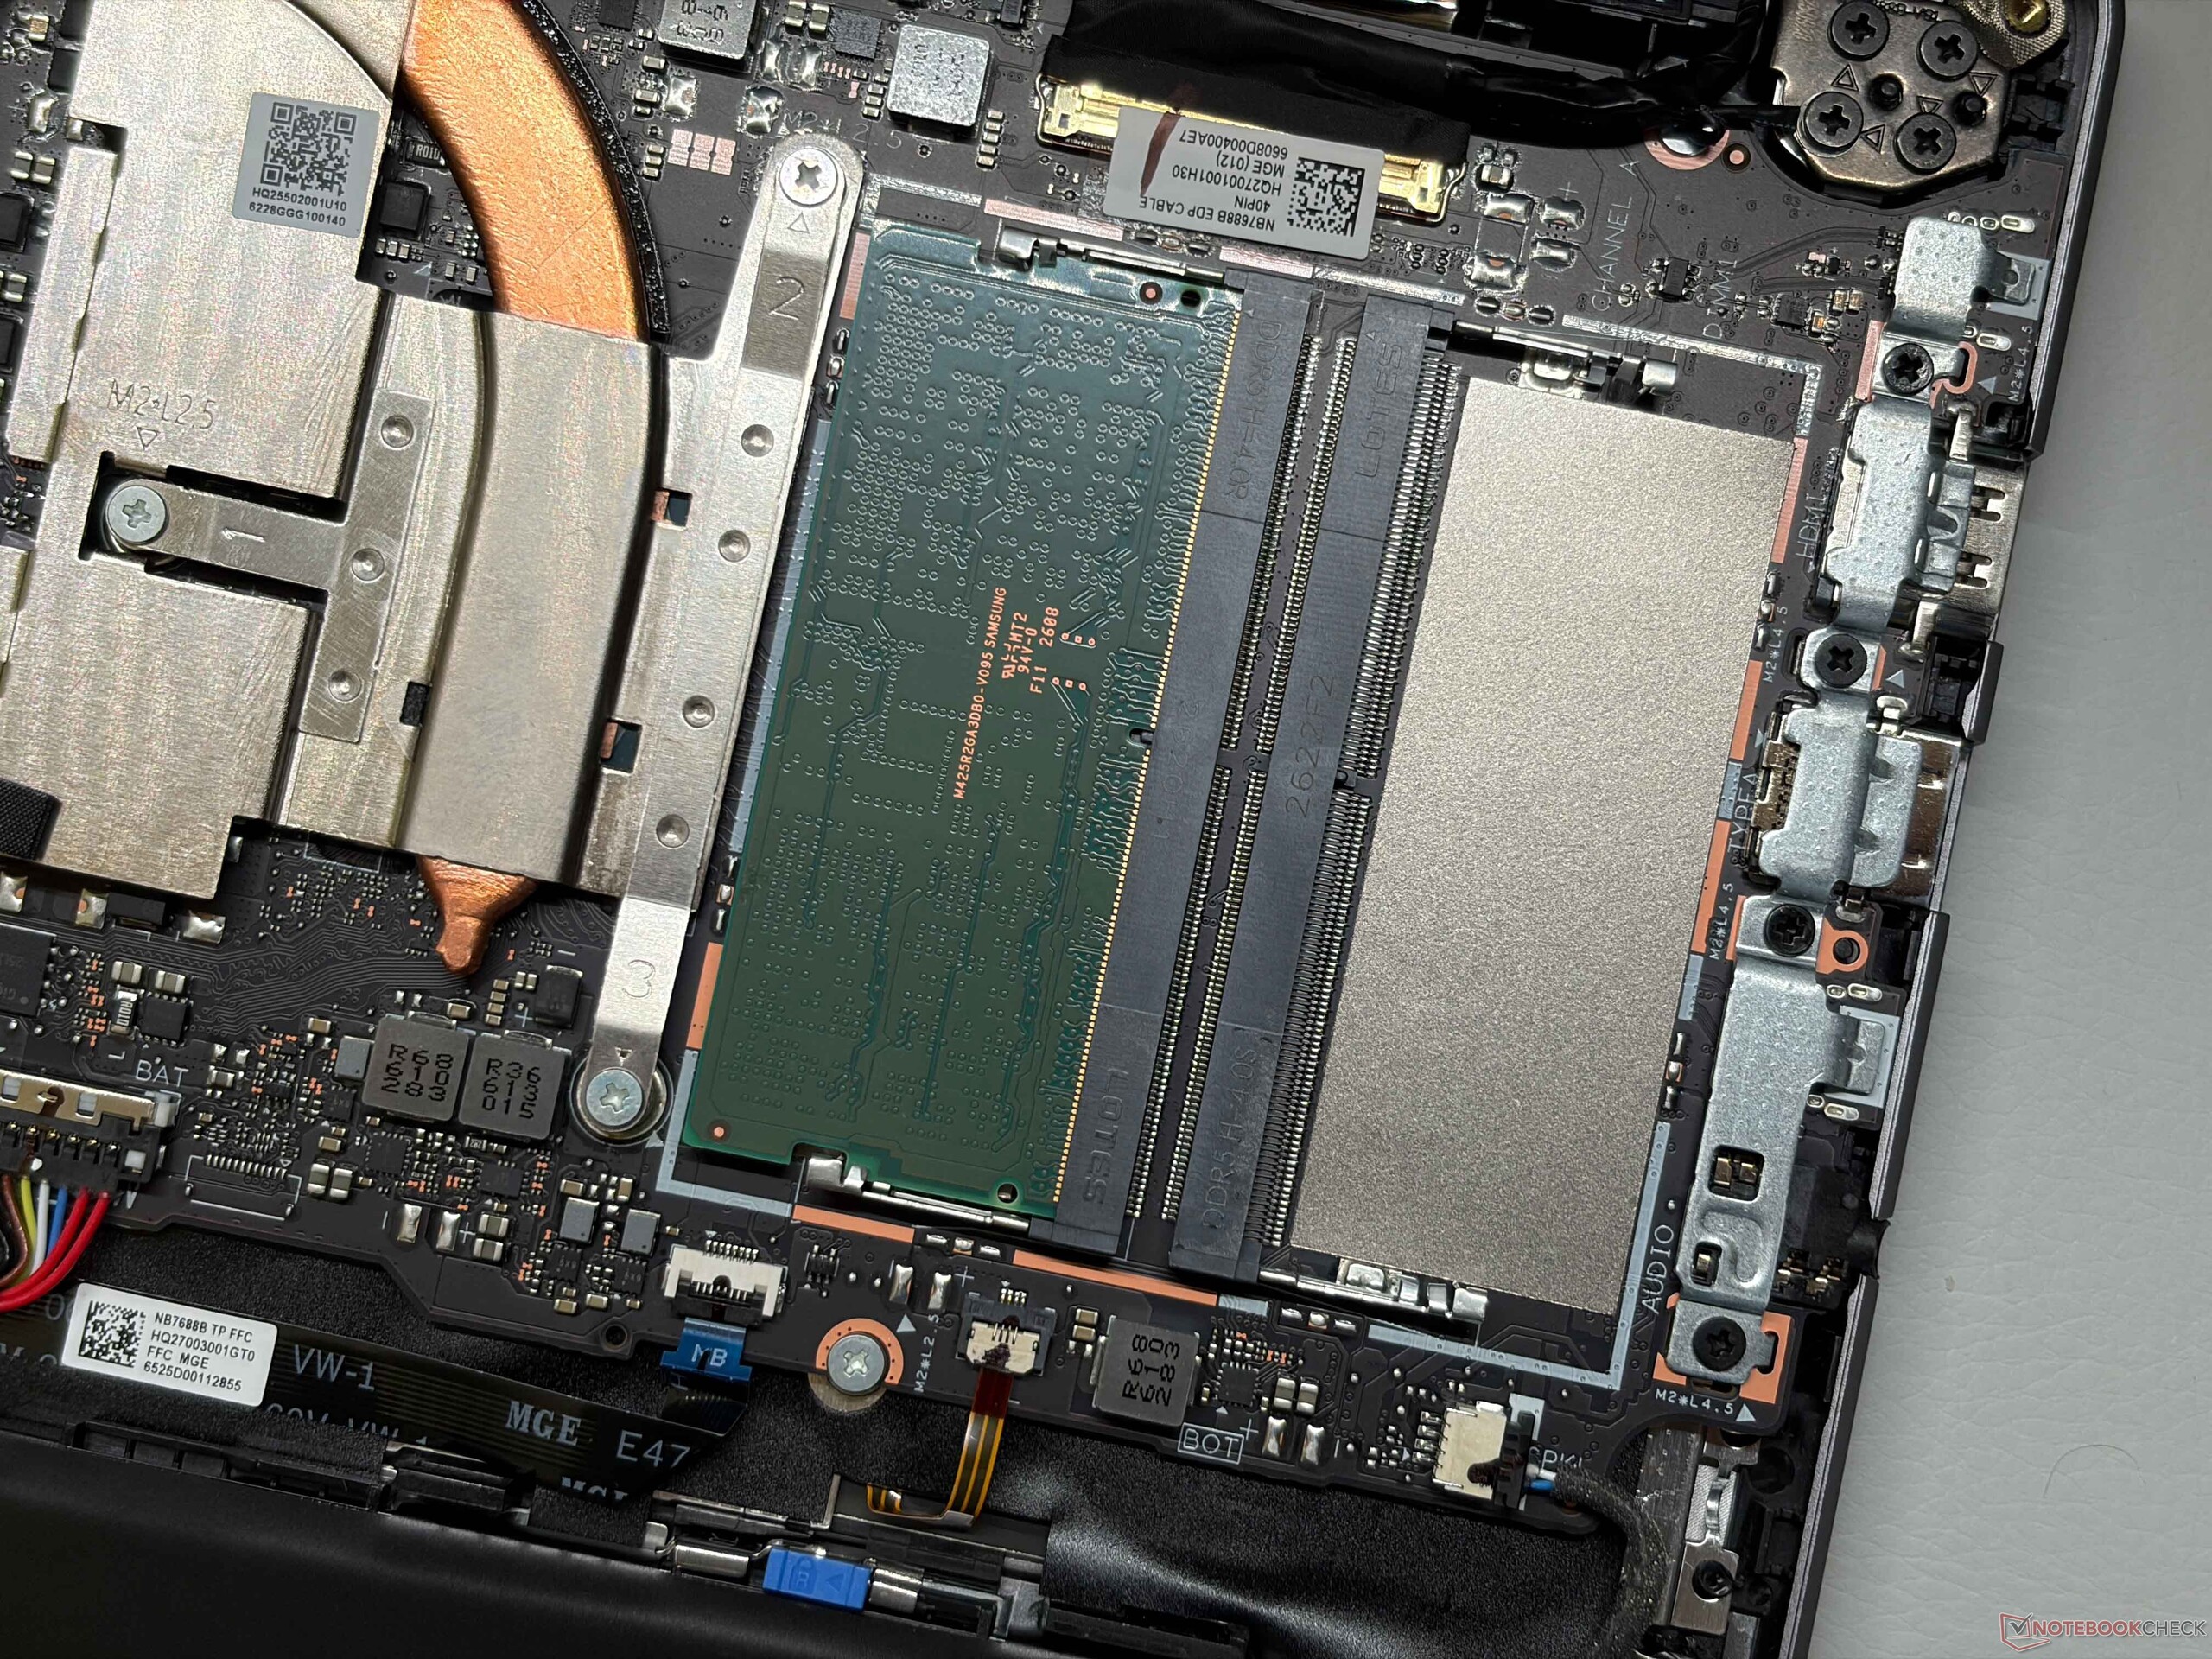
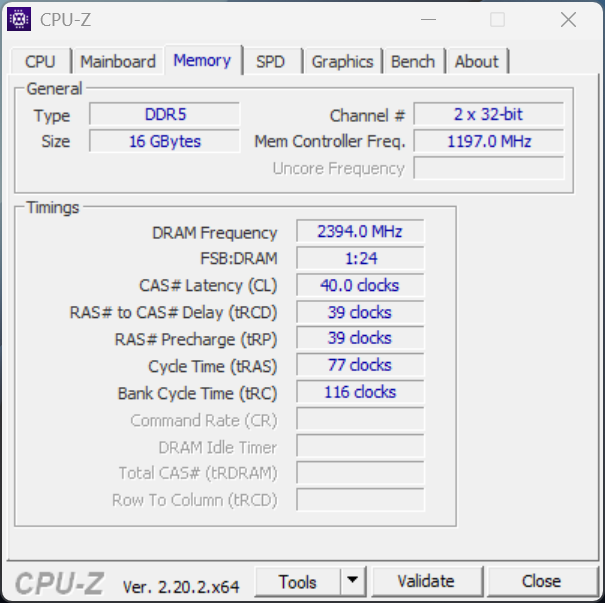
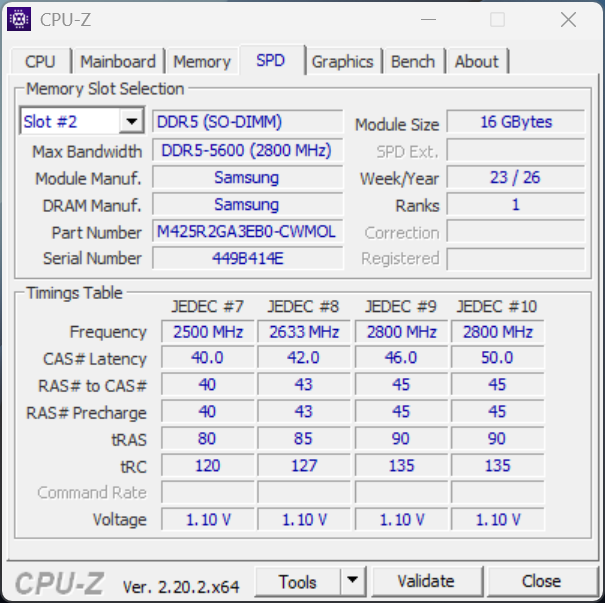
Another issue is the meager memory configuration with only 16 GB of RAM, though this can at least be easily upgraded with an additional module. All in all, the ExpertBook PM5 G2 is a good business laptop, but given its starting price of around 1,700 euros, these quality issues really shouldn’t be happening.
Pros
Cons
Price and Availability
The ExpertBook PM5 G2 with the Ryzen AI 9 HX 470 is currently available in Germany only with 64 GB of RAM and a 1-TB SSD for around 2,250 euros. Amazon also offers the version with the slower Ryzen AI 7 445 starting at around 1,800 euros.

- $2,056.68Asus ExpertBook B5 Flip G2 B5406FMA-XS54T-S 14" Touchscreen Convertible 2 in 1 Notebook - WUXGA - Intel Core 5 Series 3 320-16 GB - 512 GB SSD - Gentle Gray
- $73.50ASUS ExpertWiFi EBR63 AX3000 WiFi 6 Business Router - Custom Guest Portal & SDN, Easy Setup & Remote Management, Scalable with ExpertWiFi AIMesh, Free Commercial-Grade Security, VPN, VLAN
- $245.77ASUS ExpertWiFi EBM68 AX7800 Tri-Band Business Mesh WiFi 6 System (1 Pack) - Custom Guest Portal & SDN, Easy Setup & Remote Management, Free Commercial-Grade Network Security & VPN, VLAN, Backup WAN
Specifications
Case, Features, and Input Devices
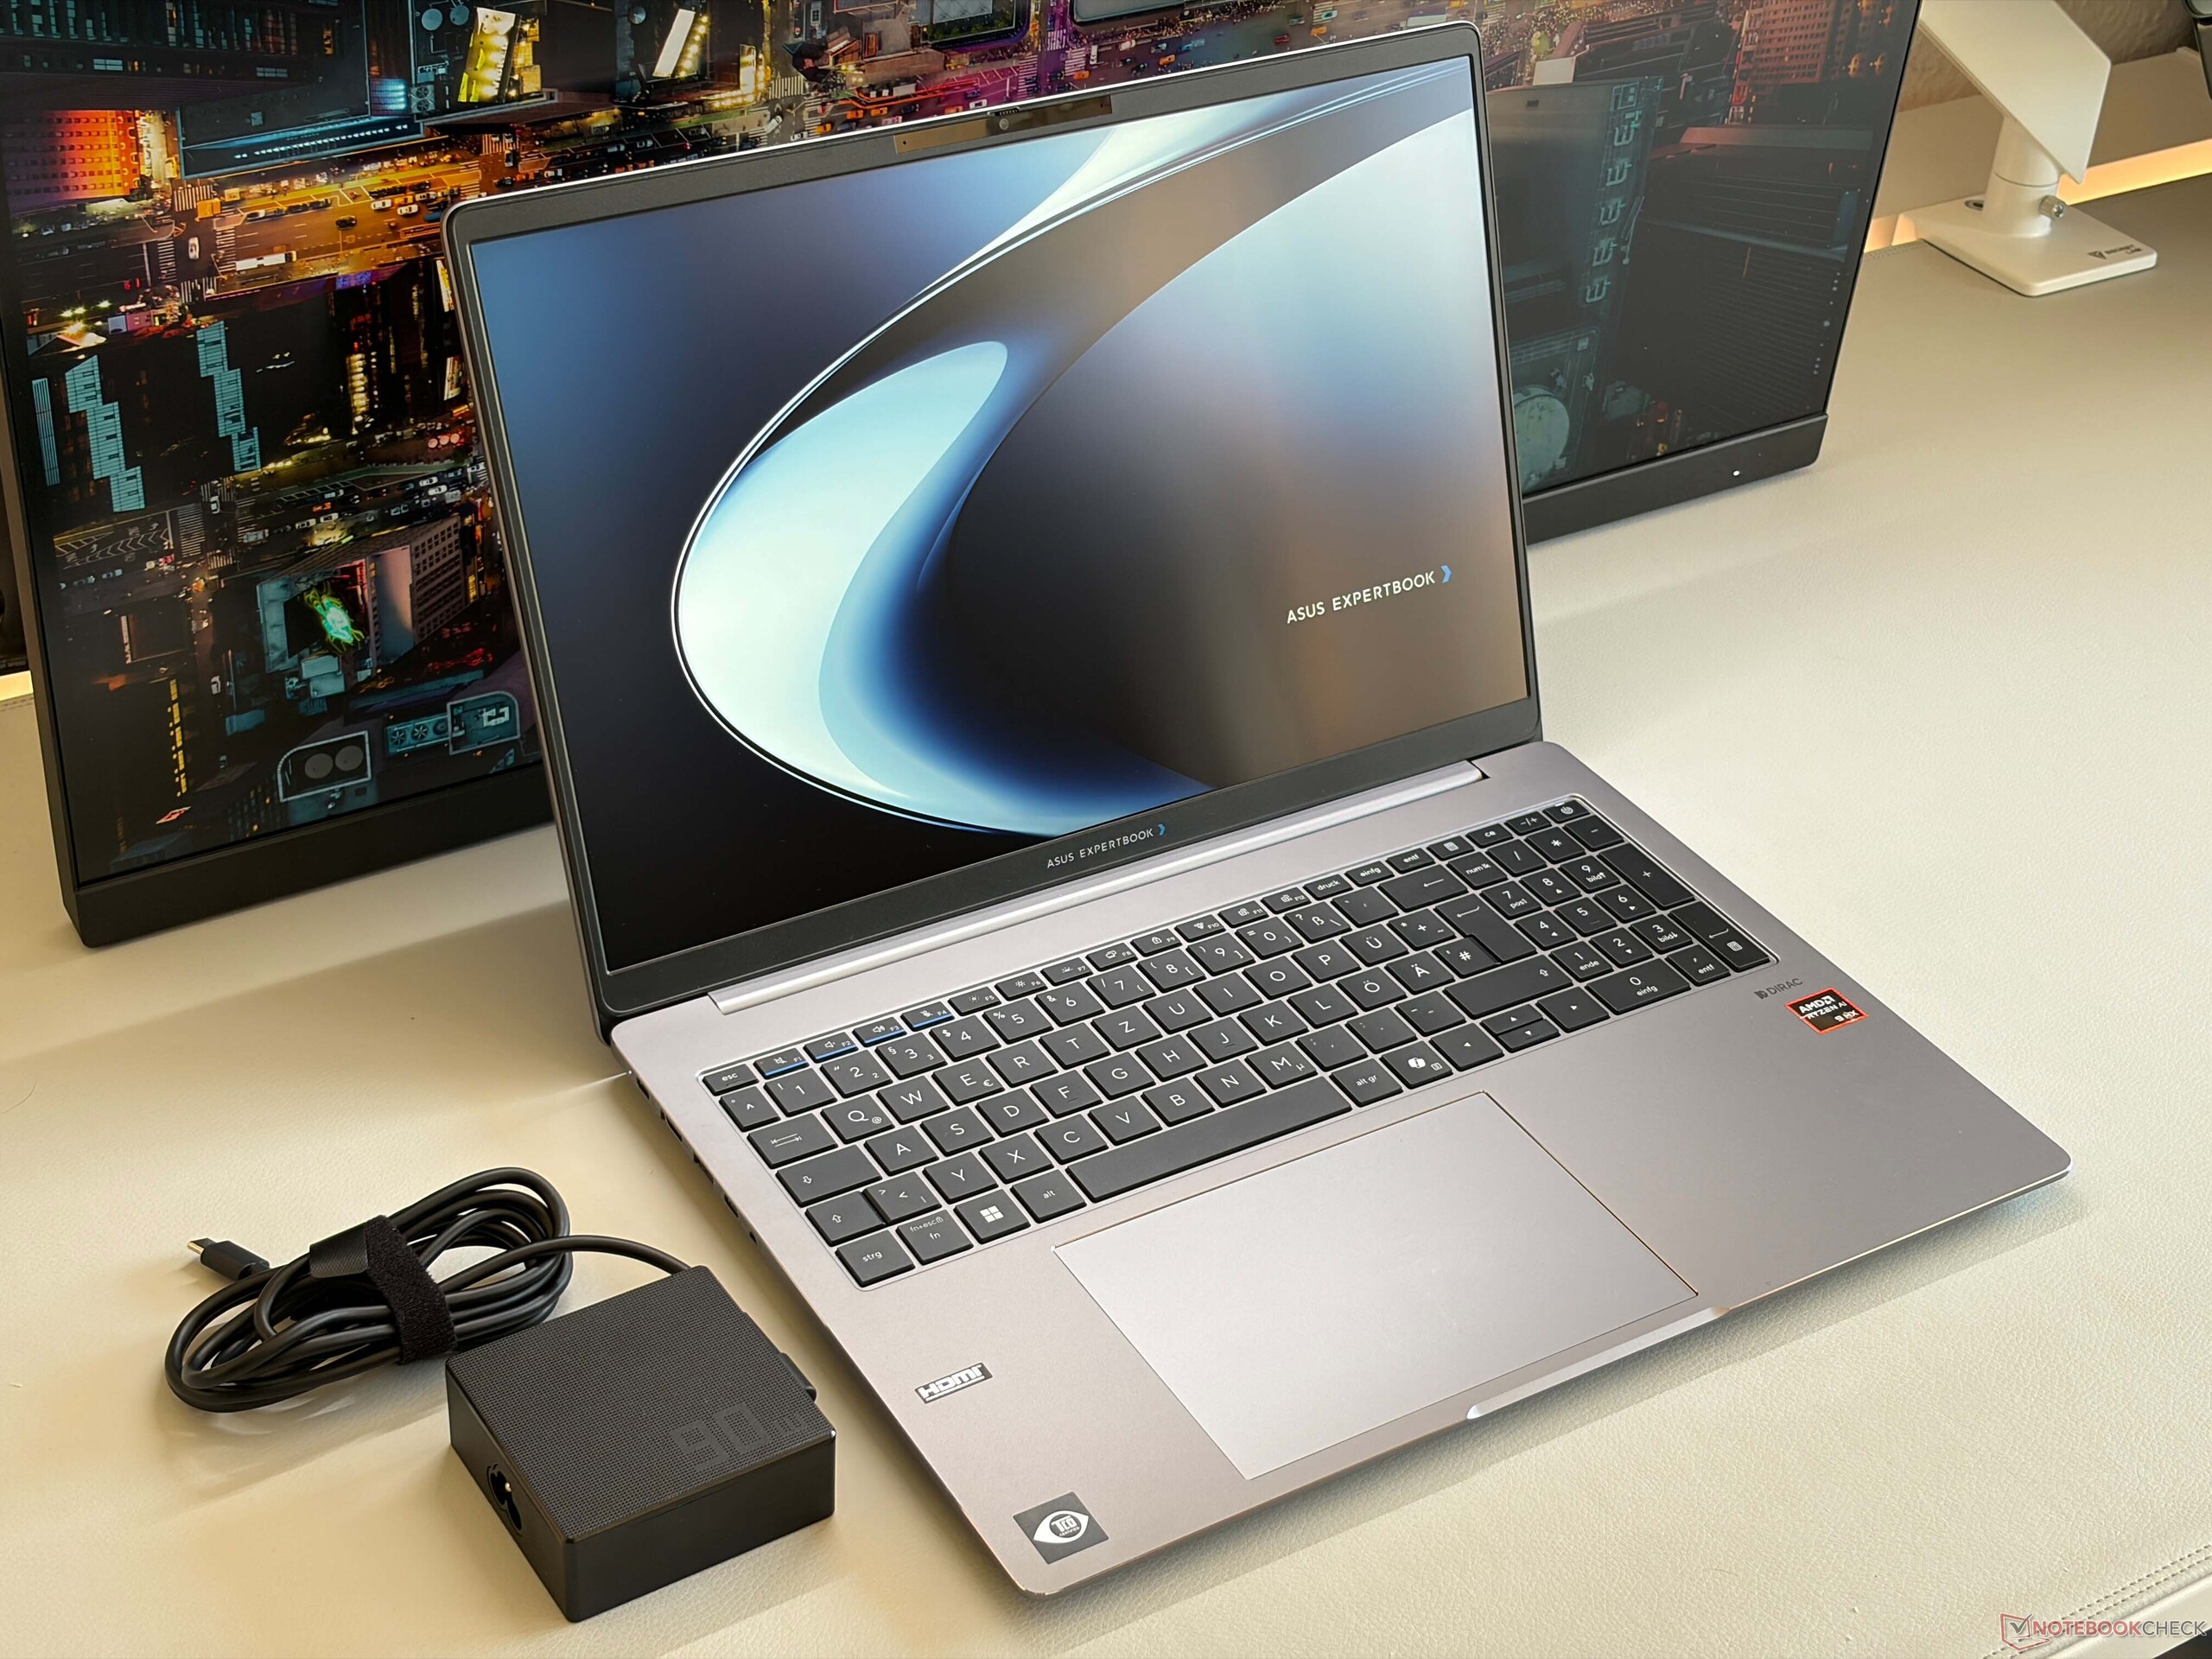
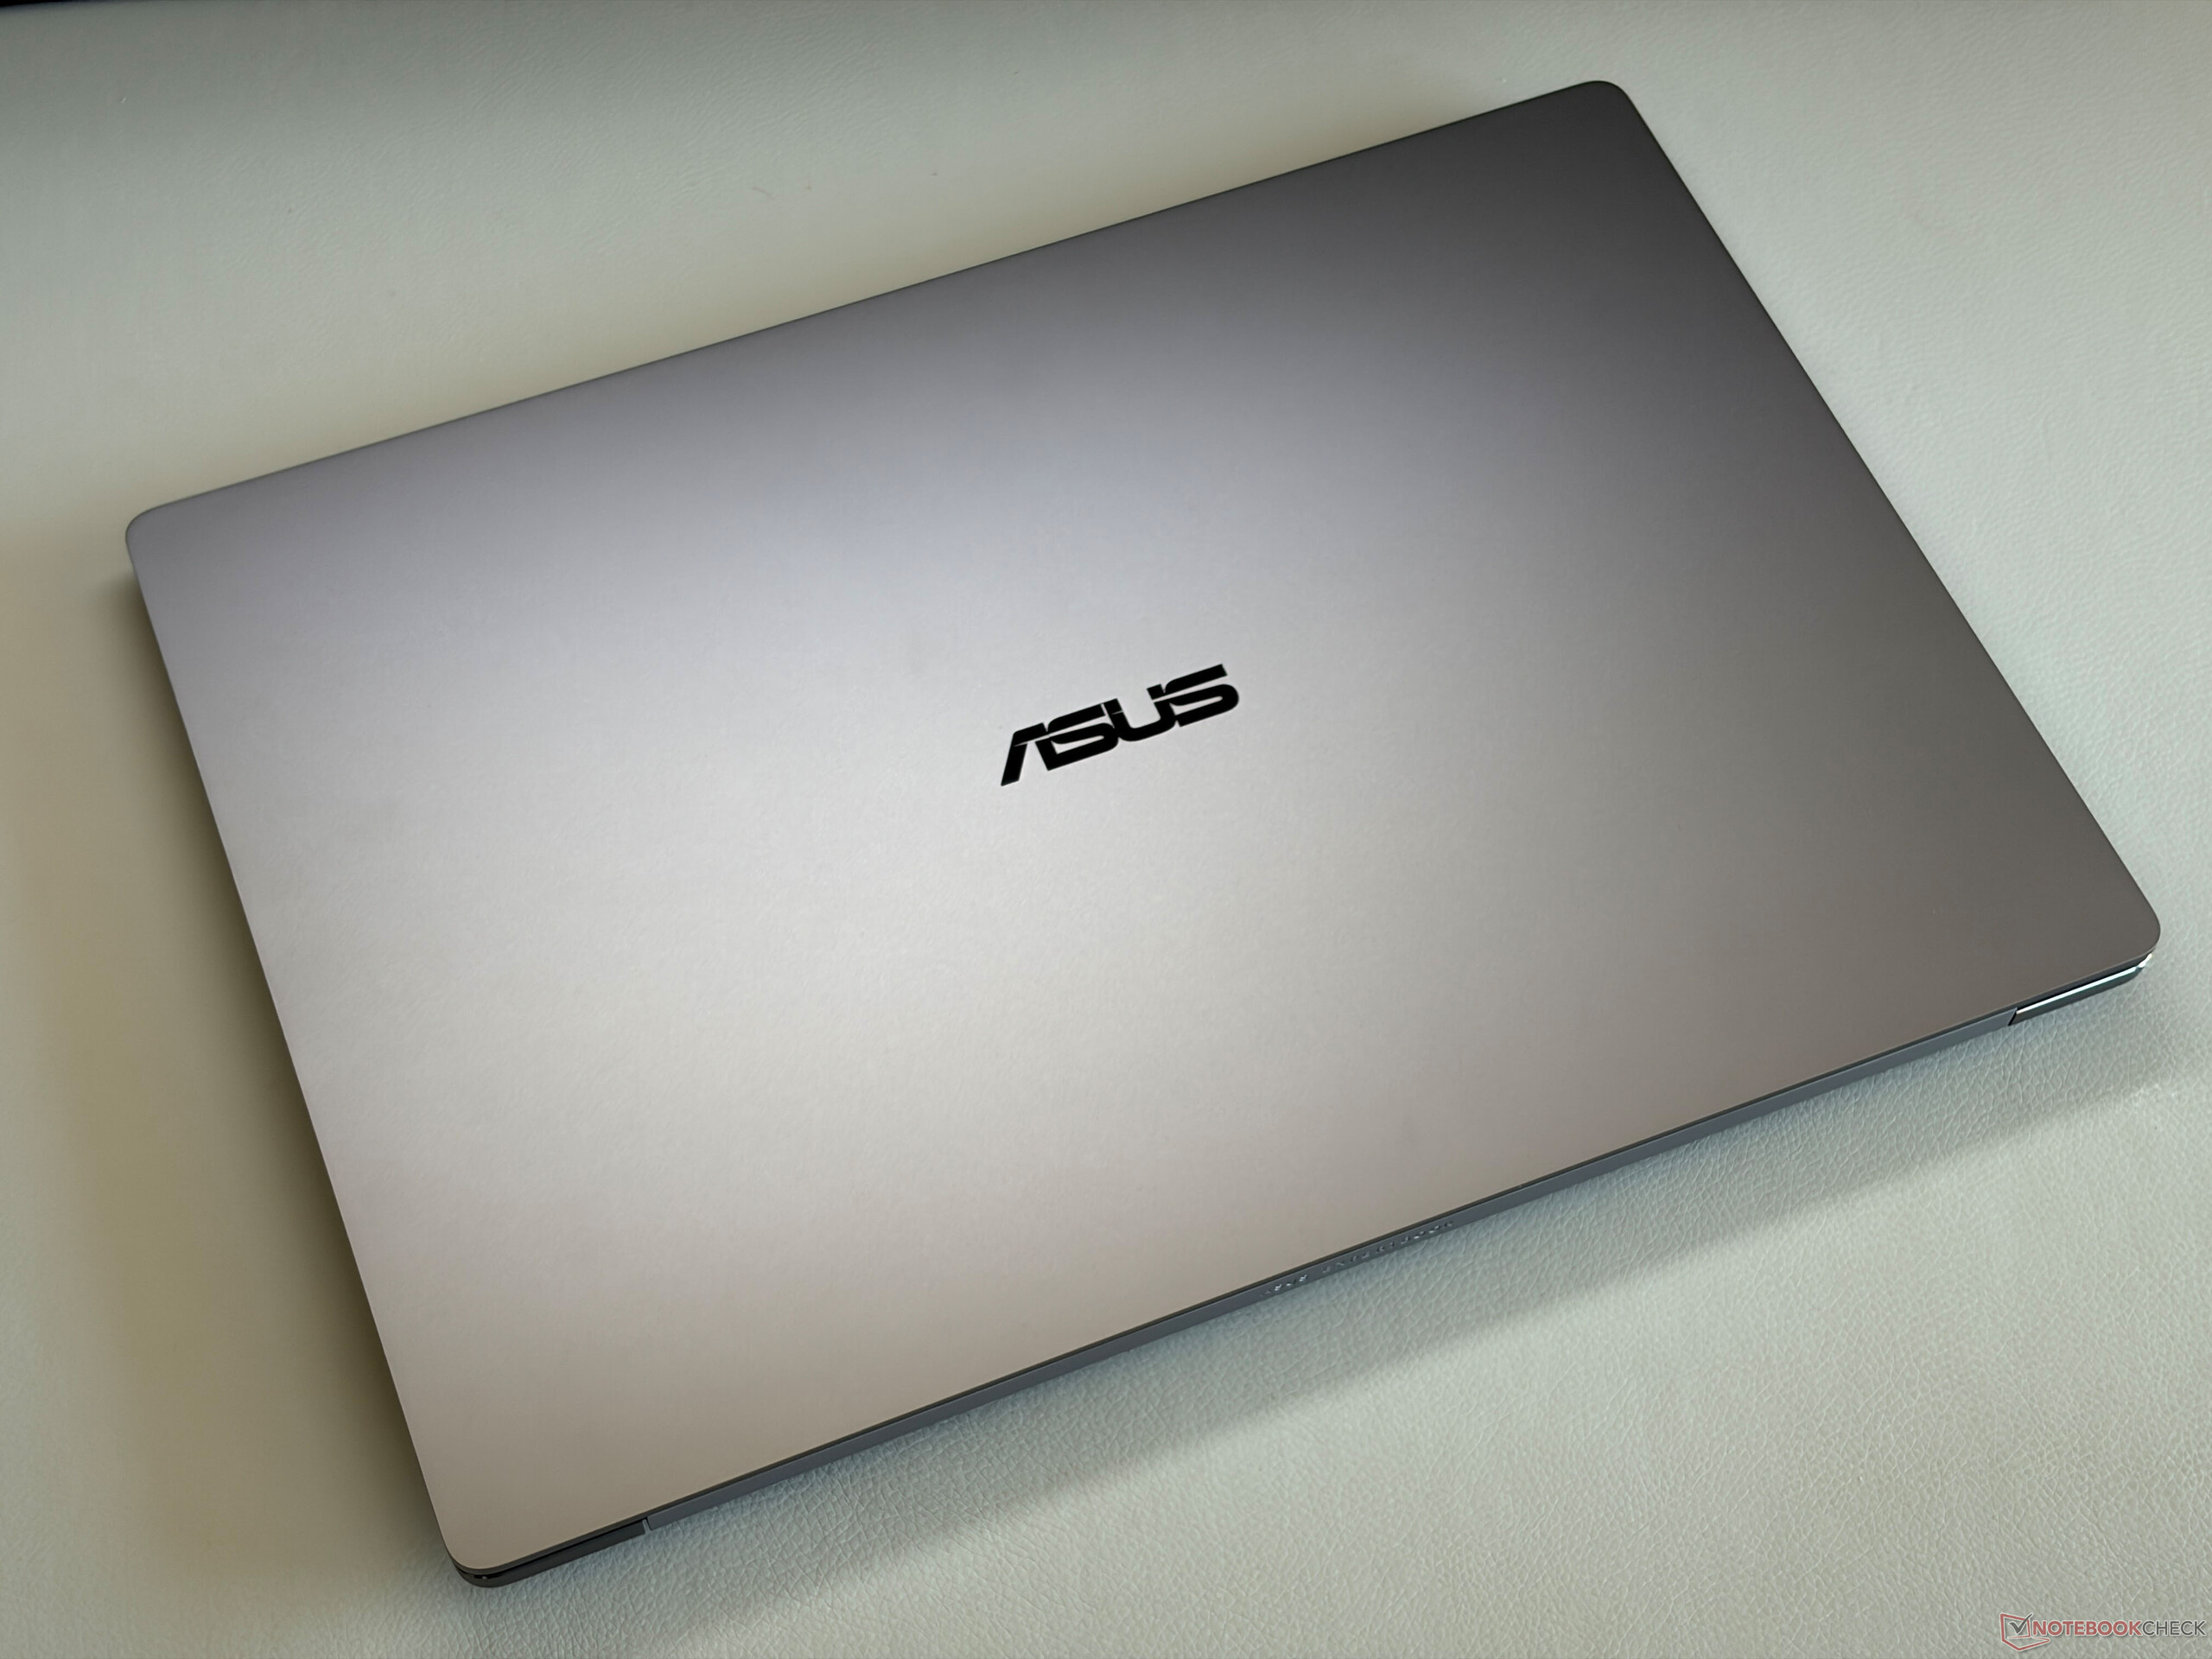
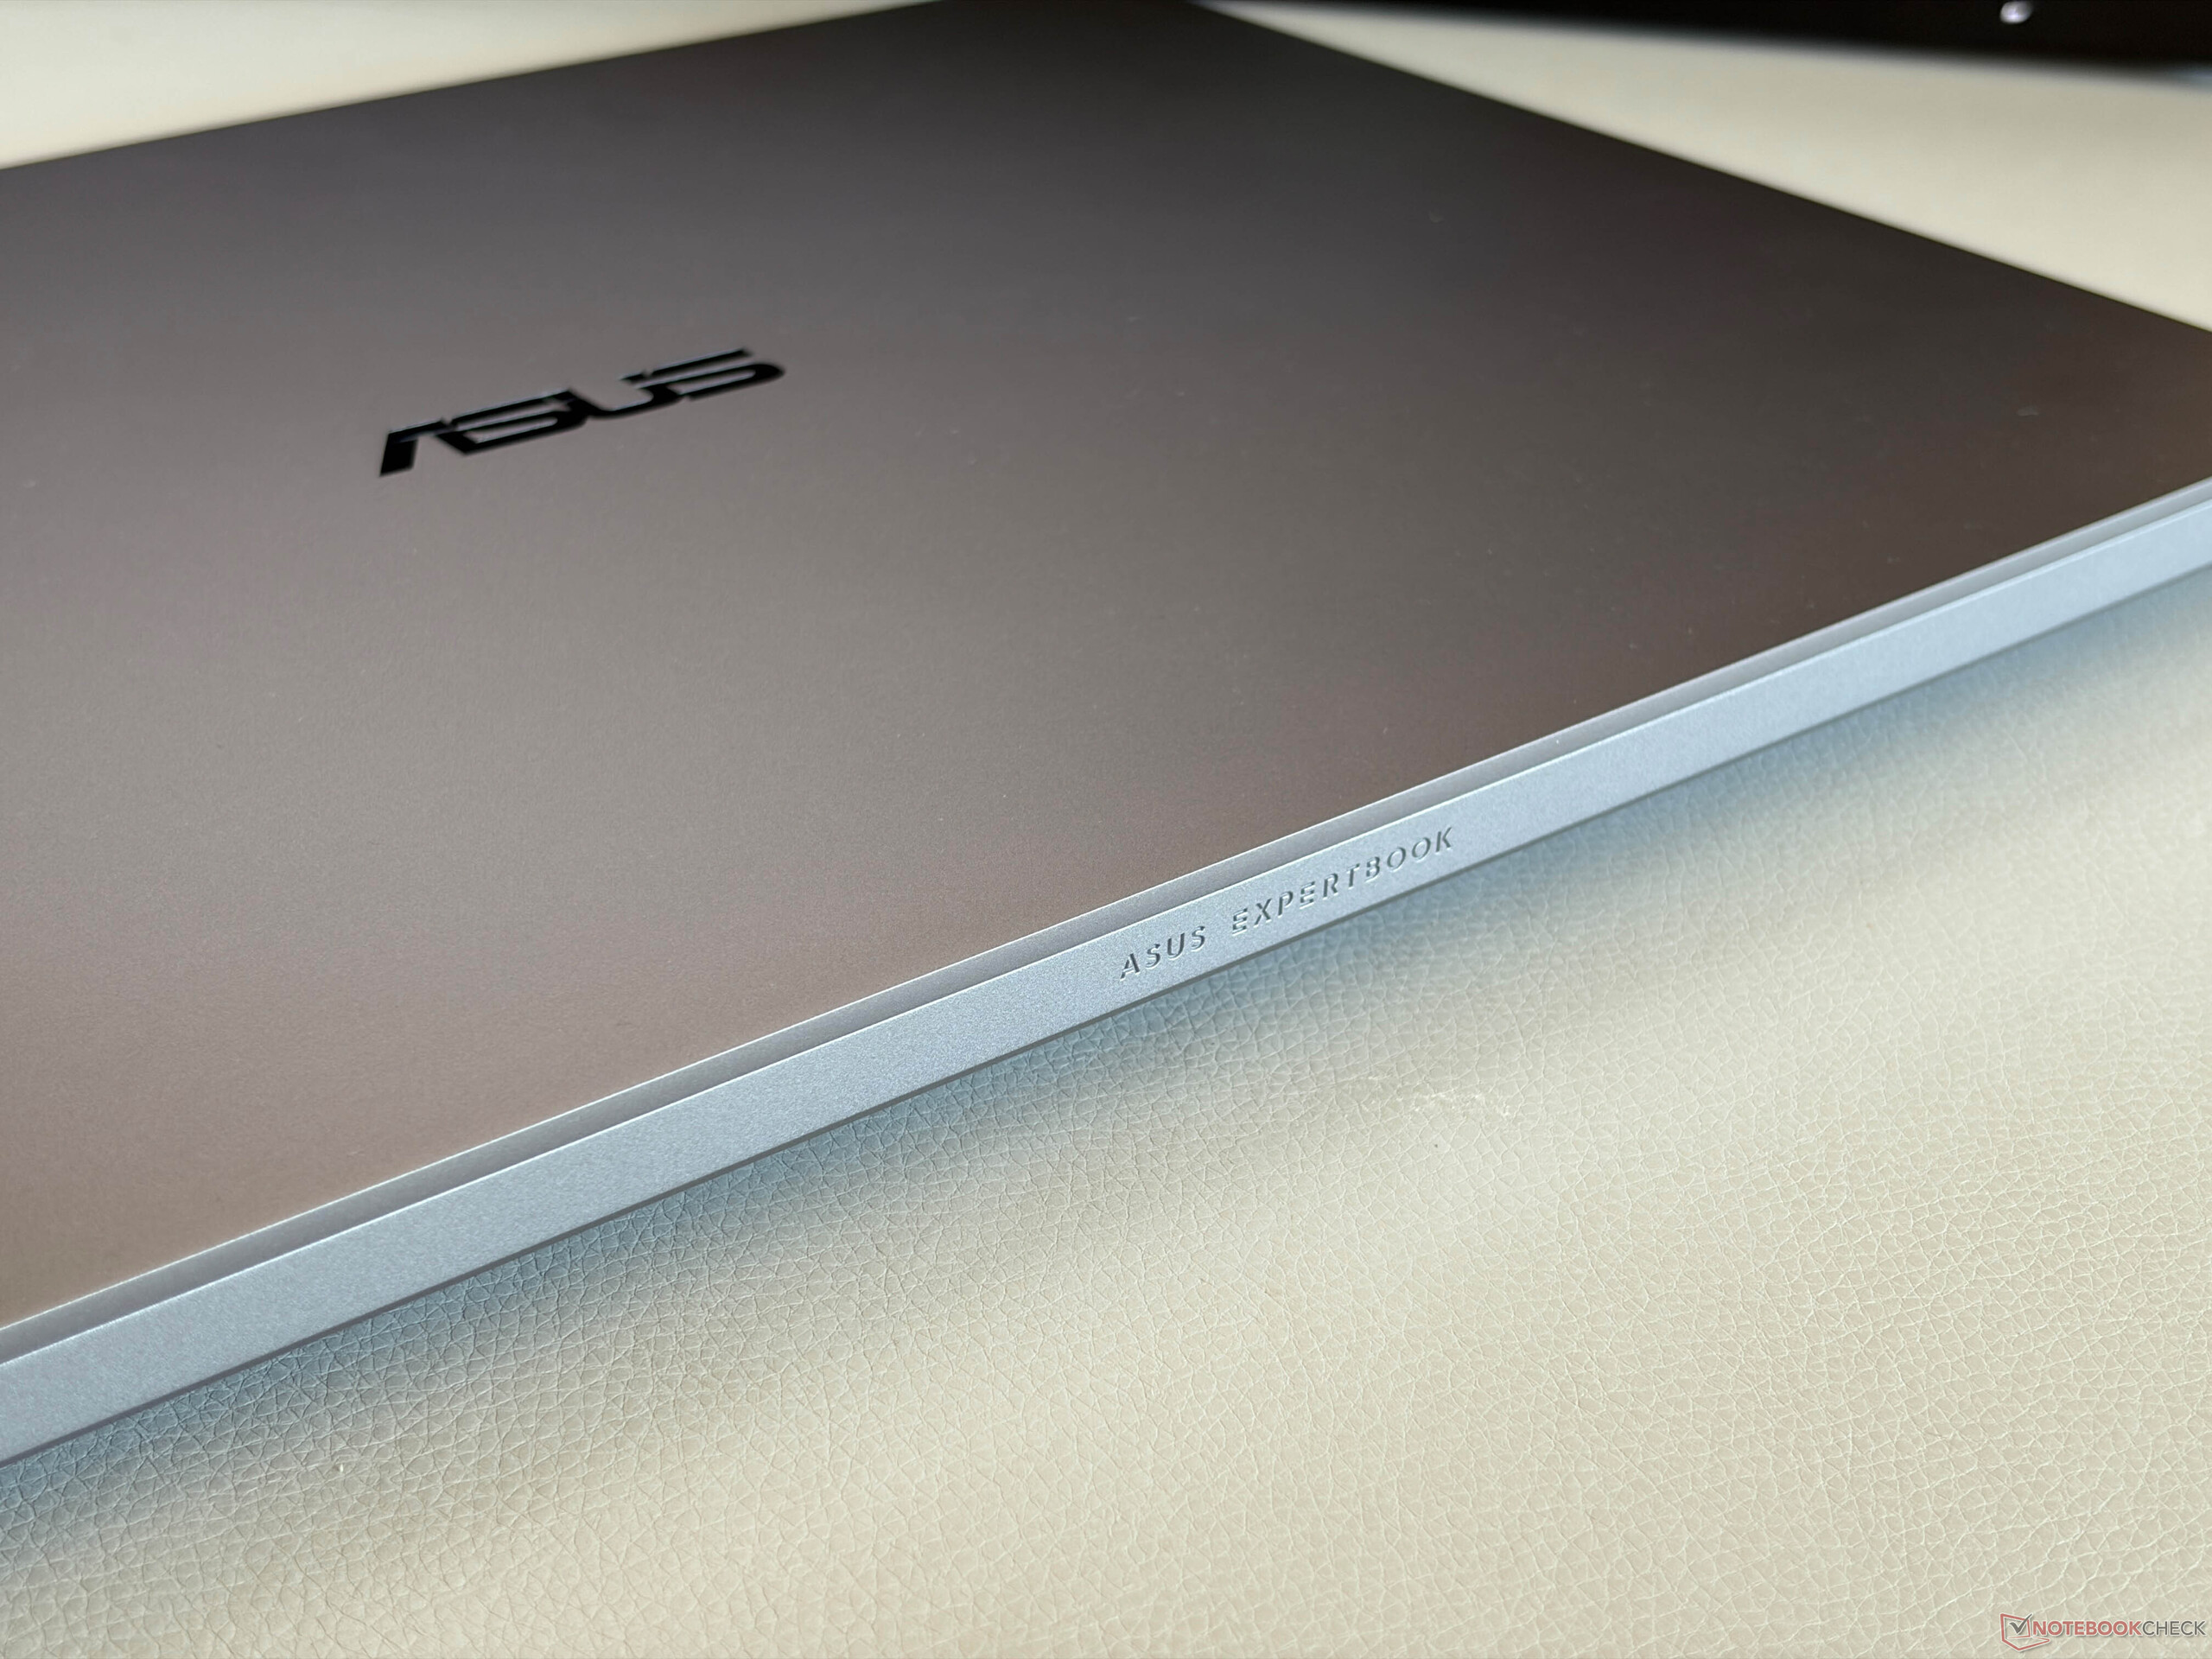
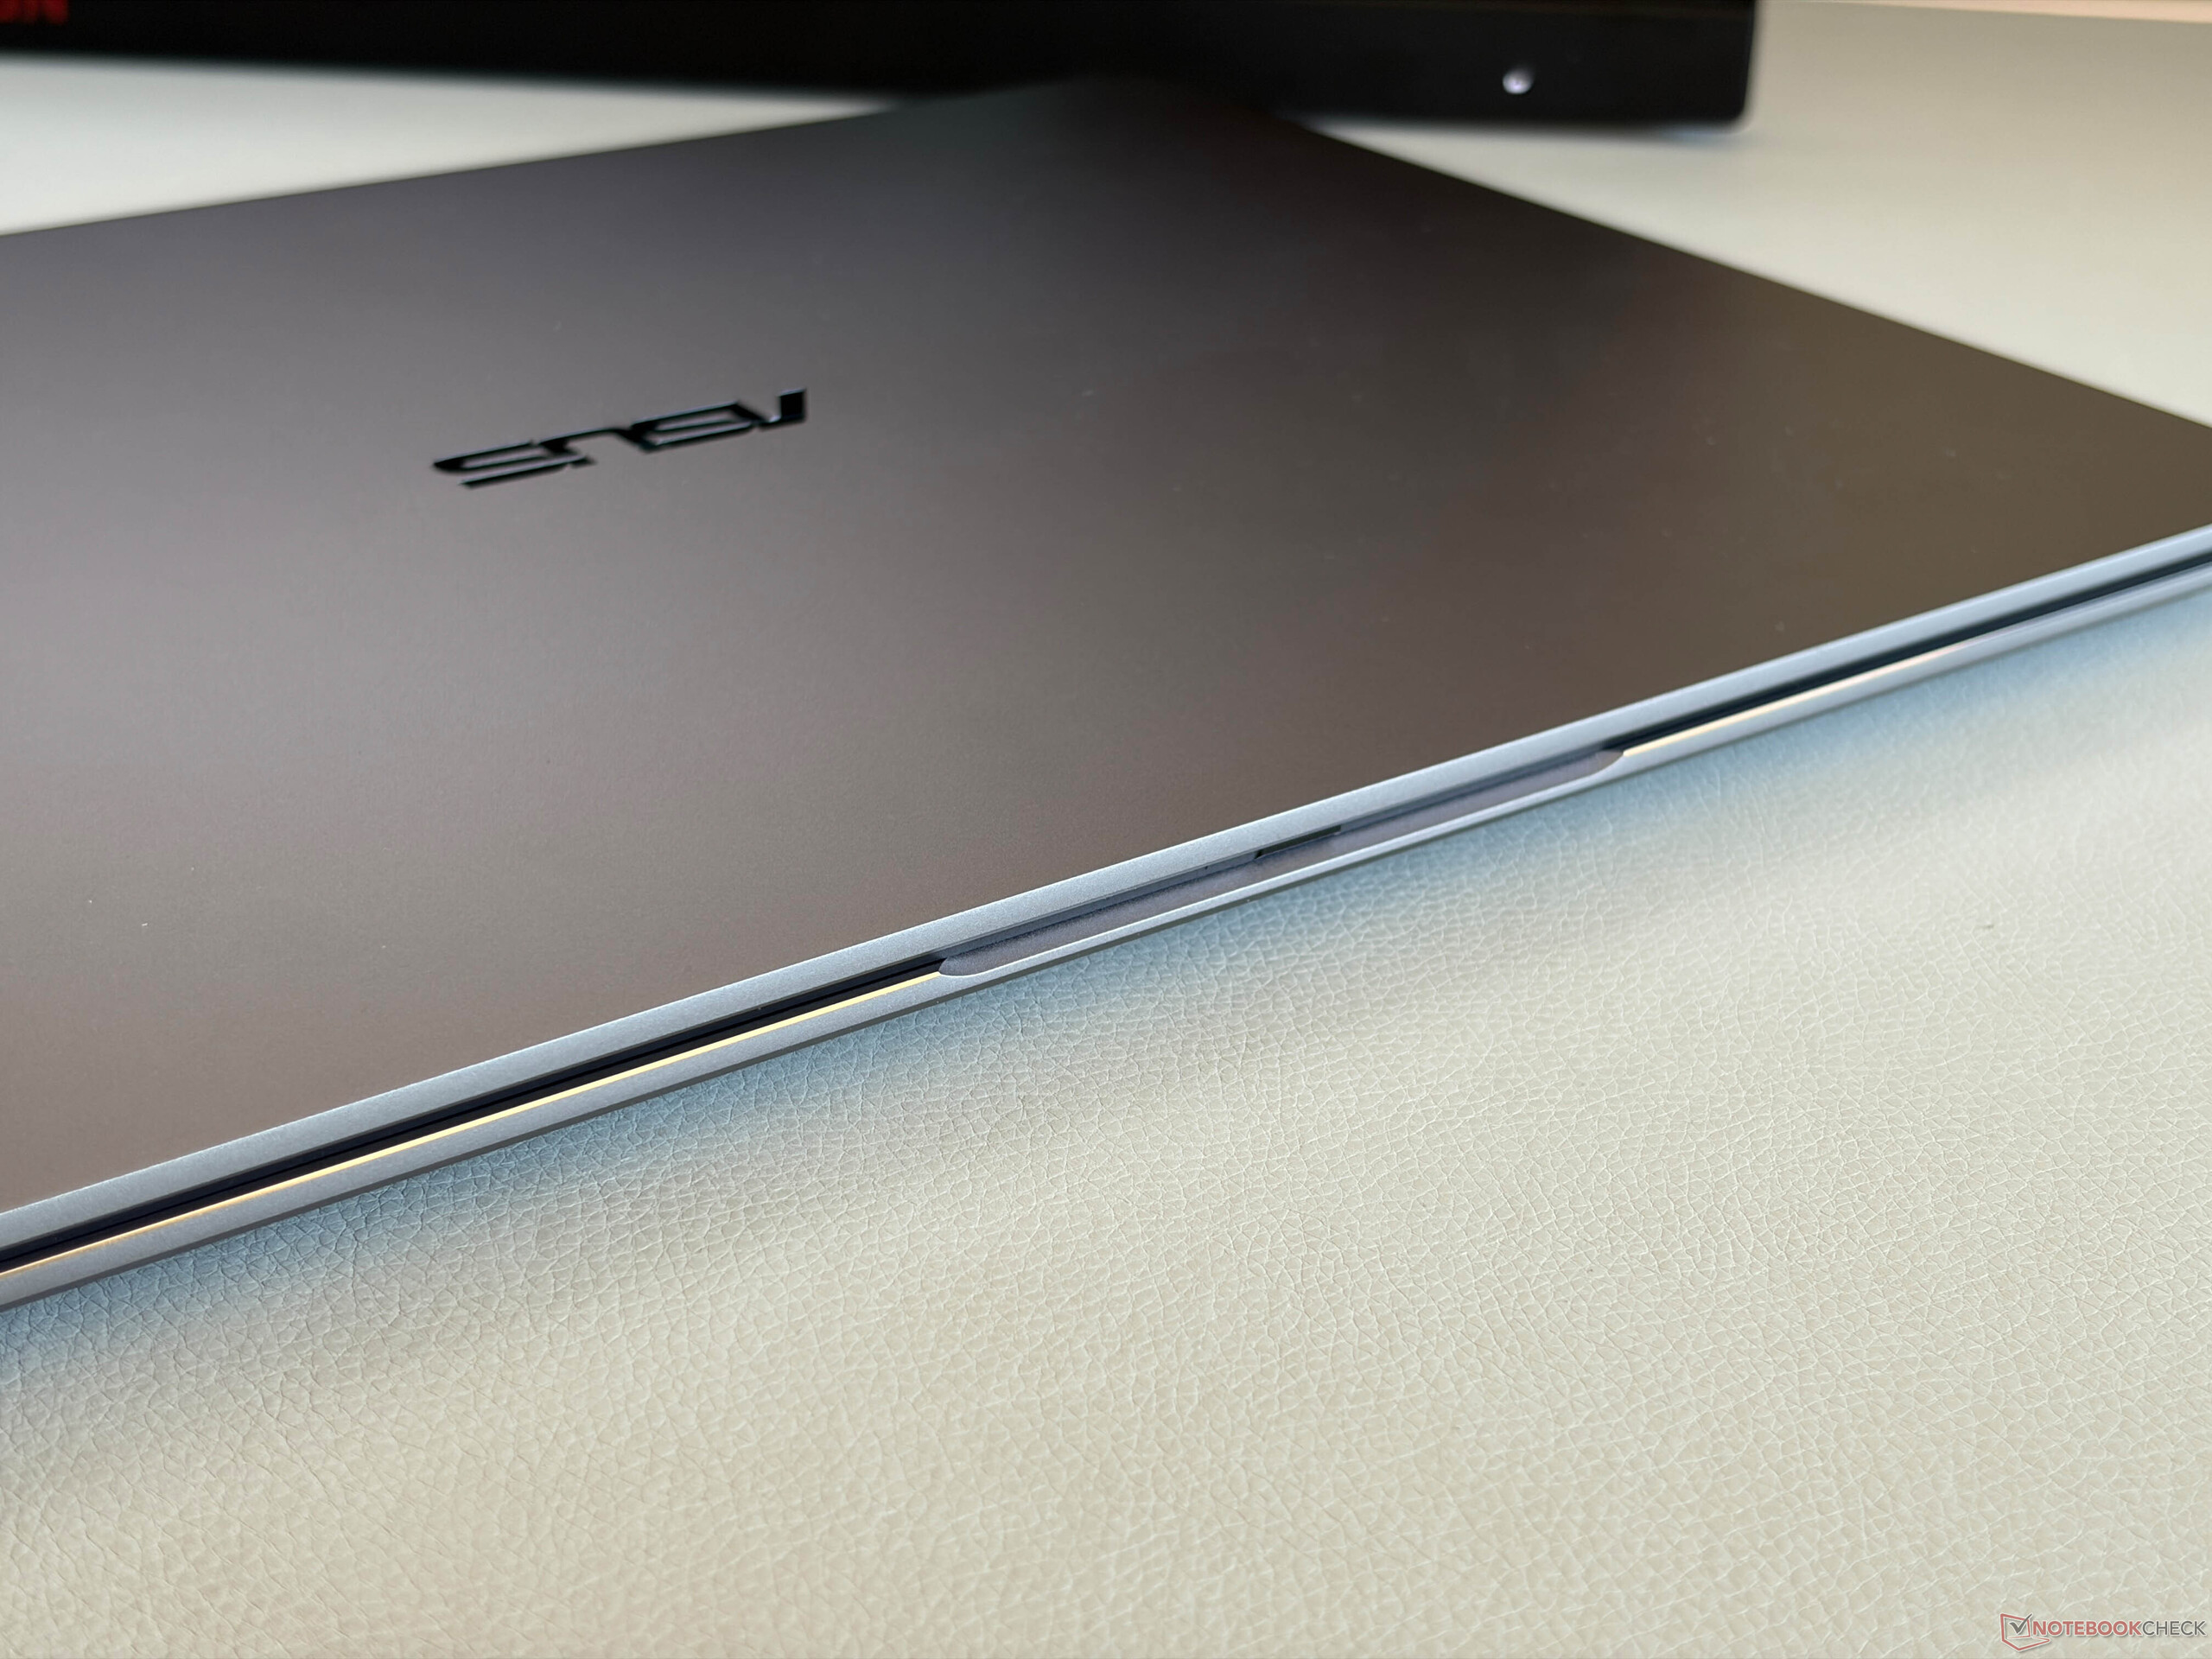
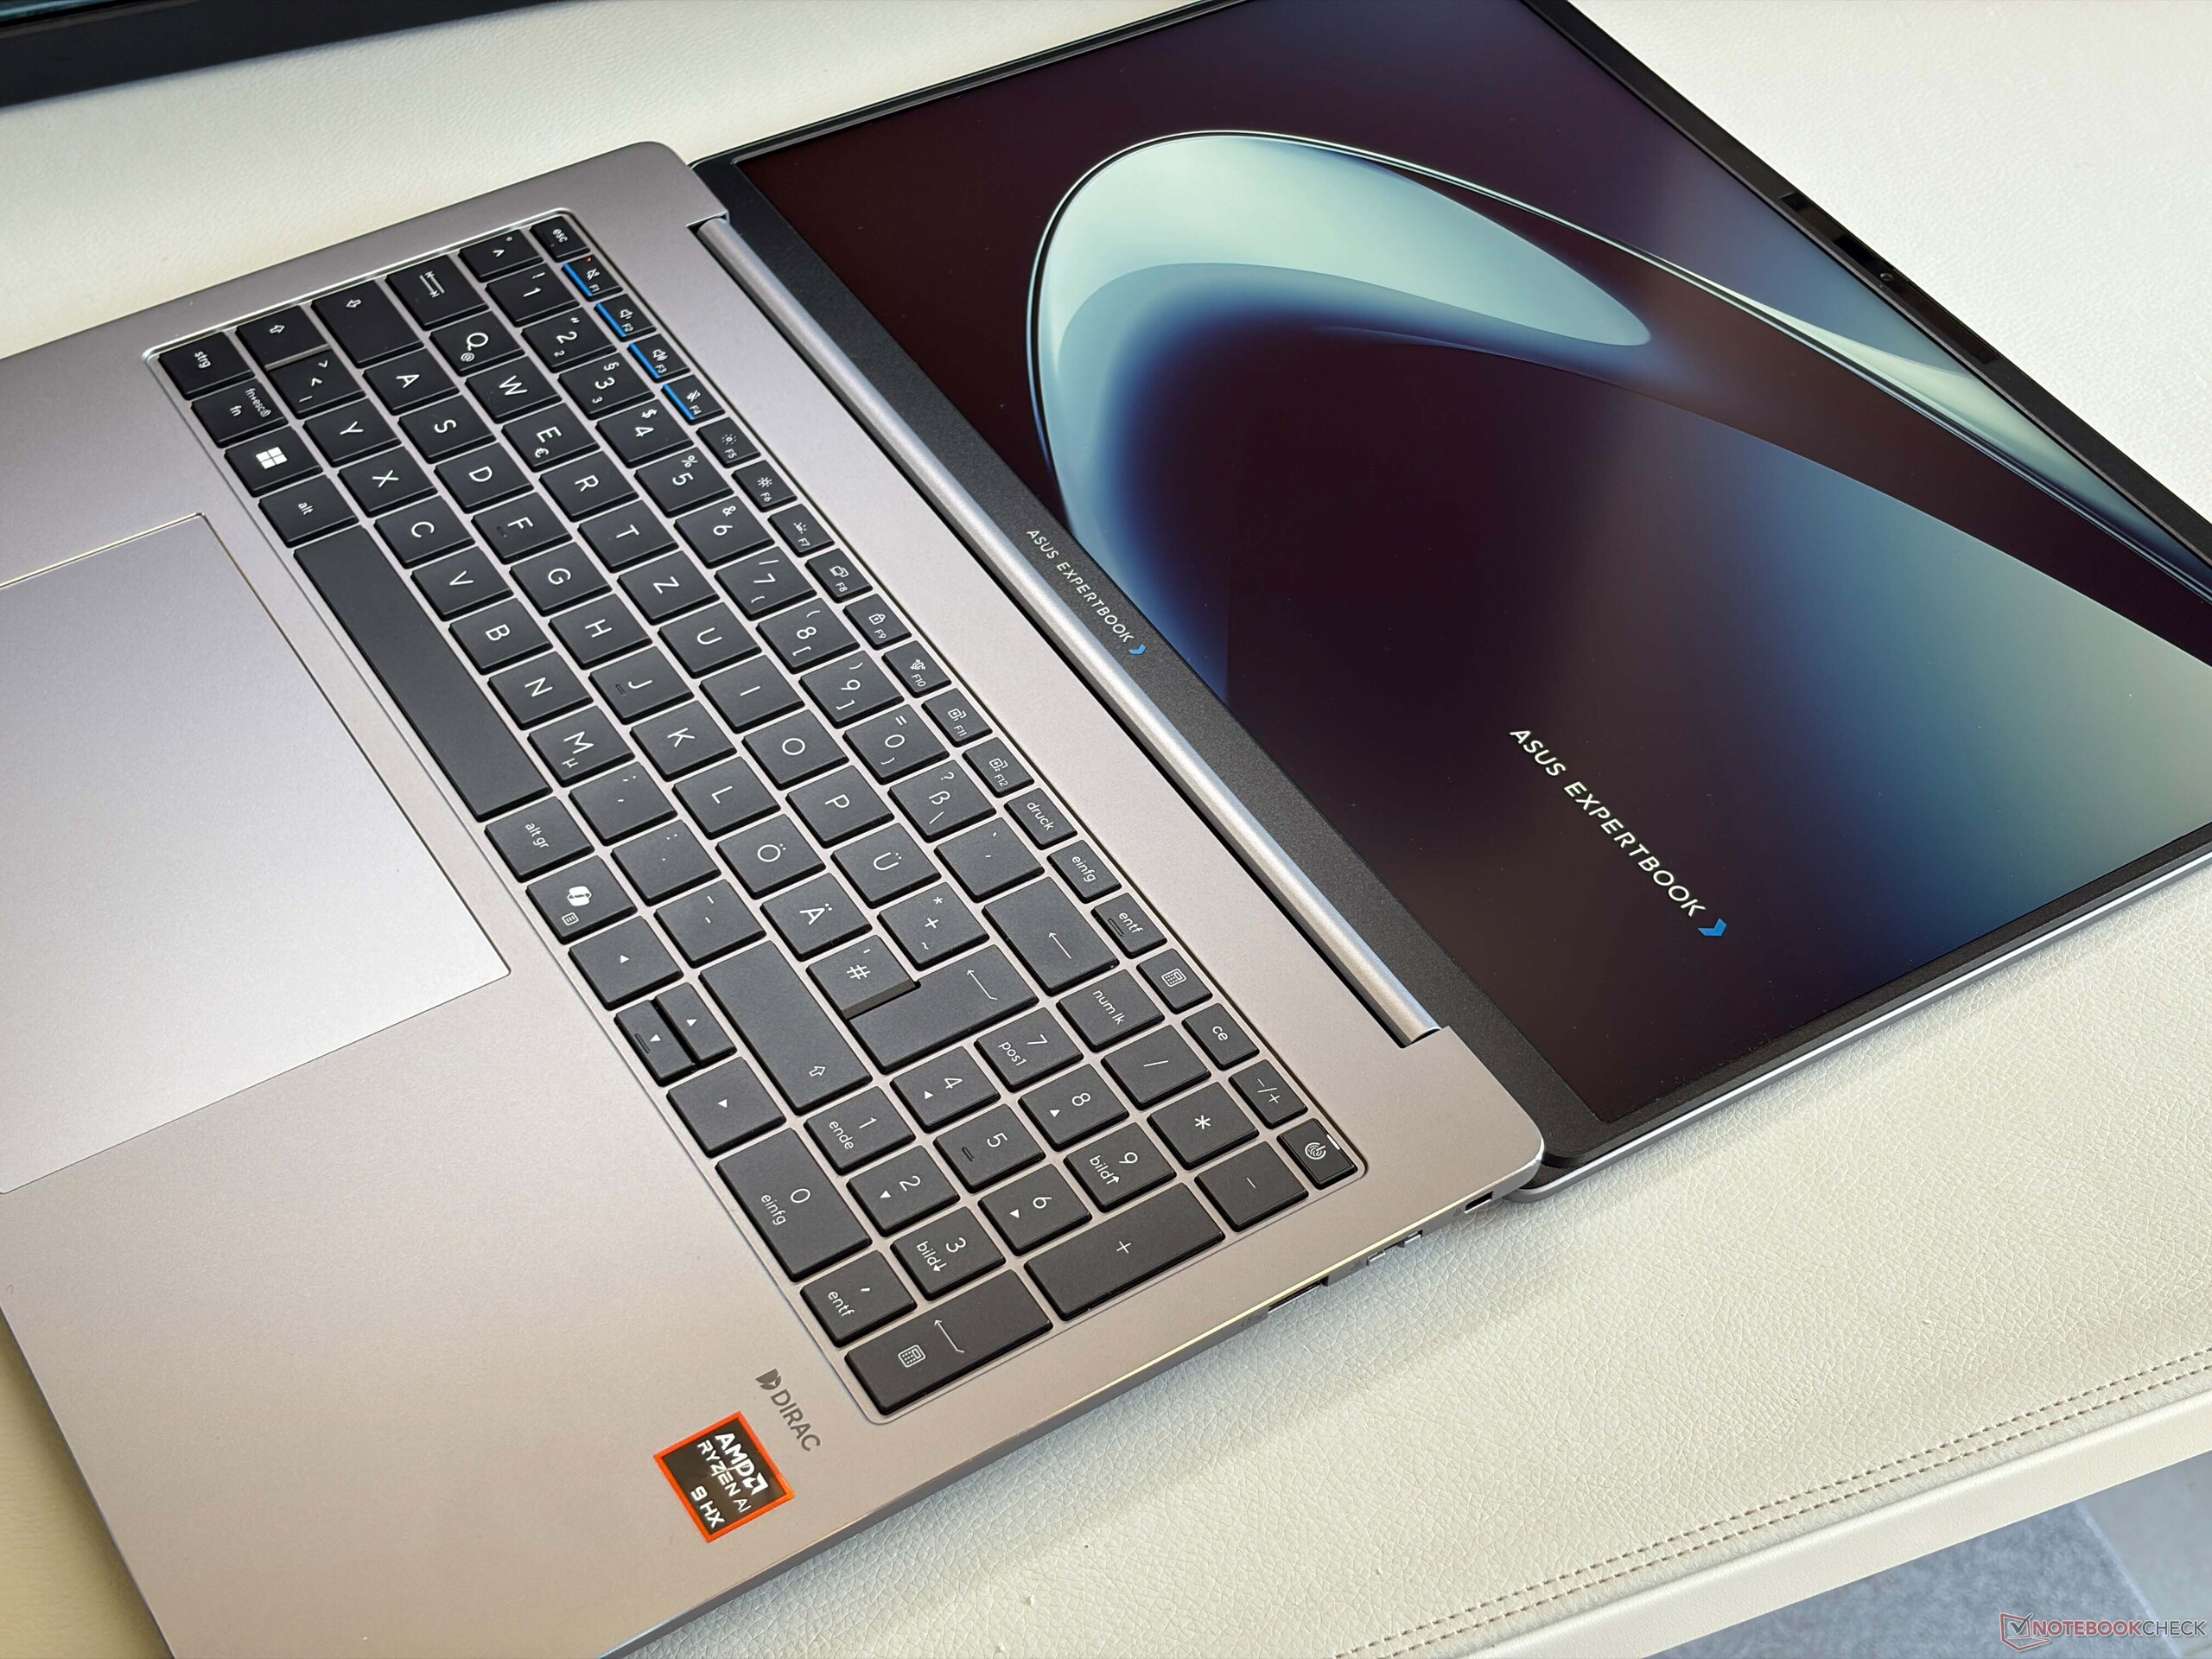
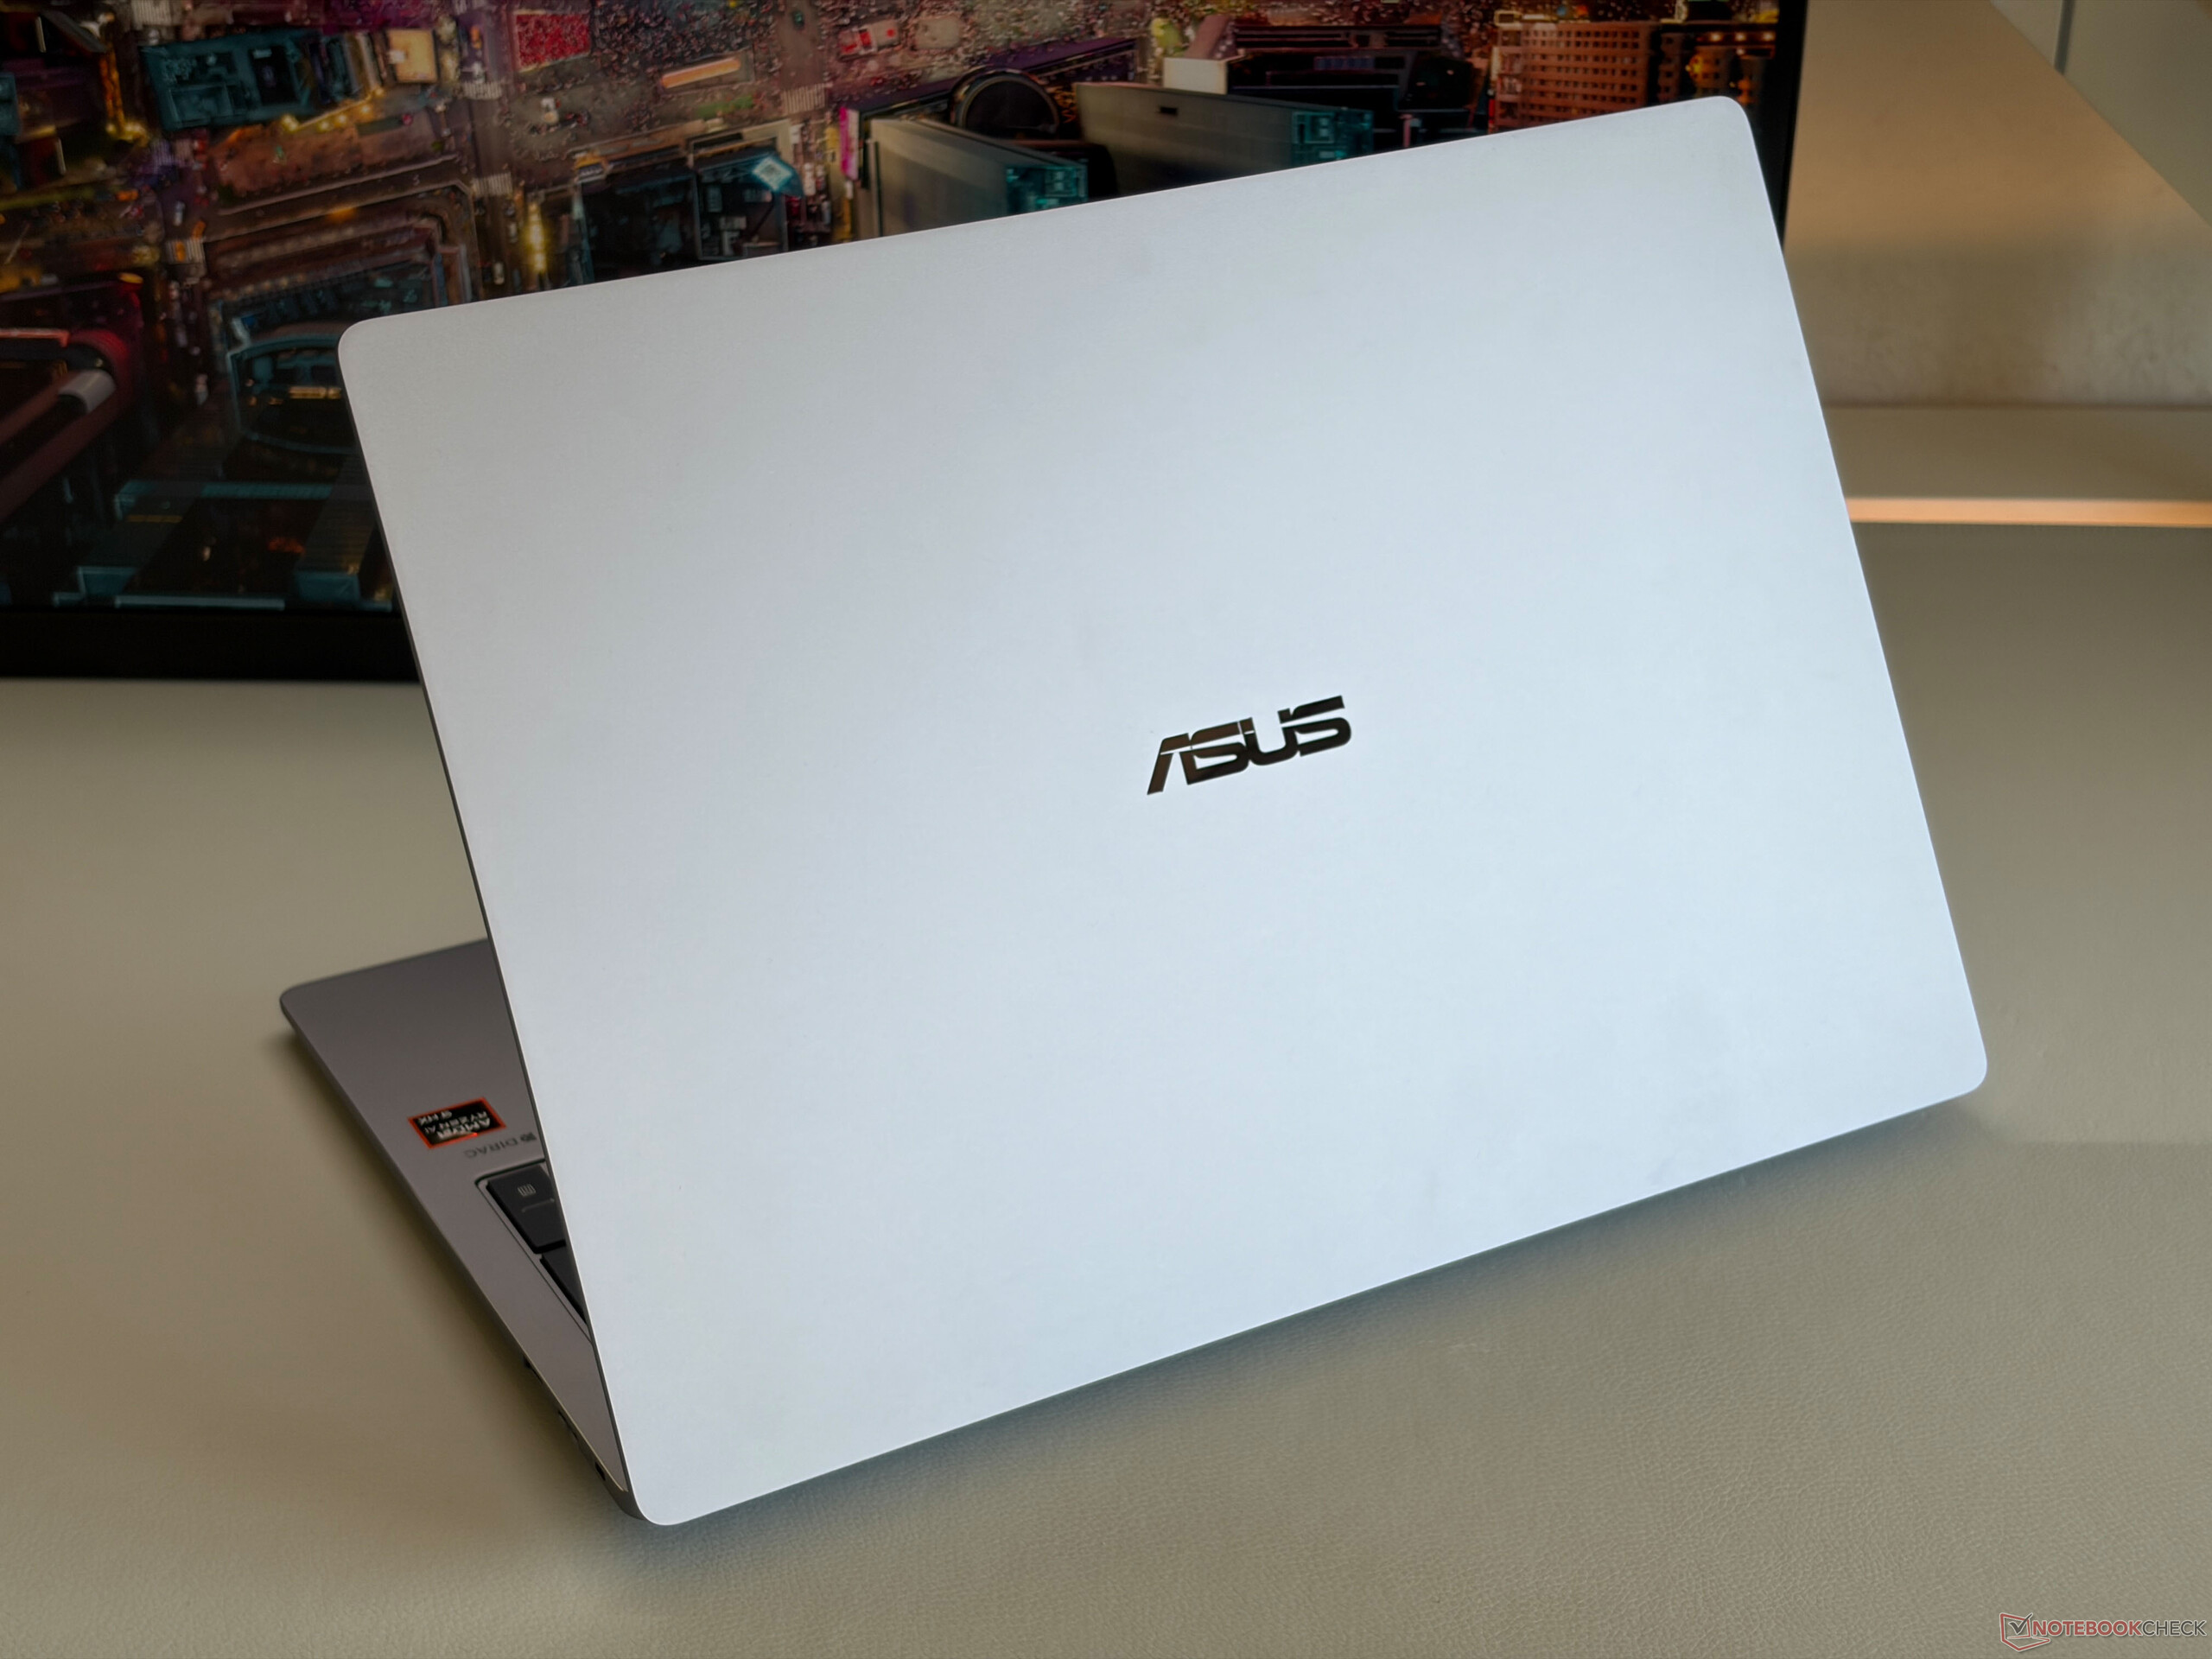
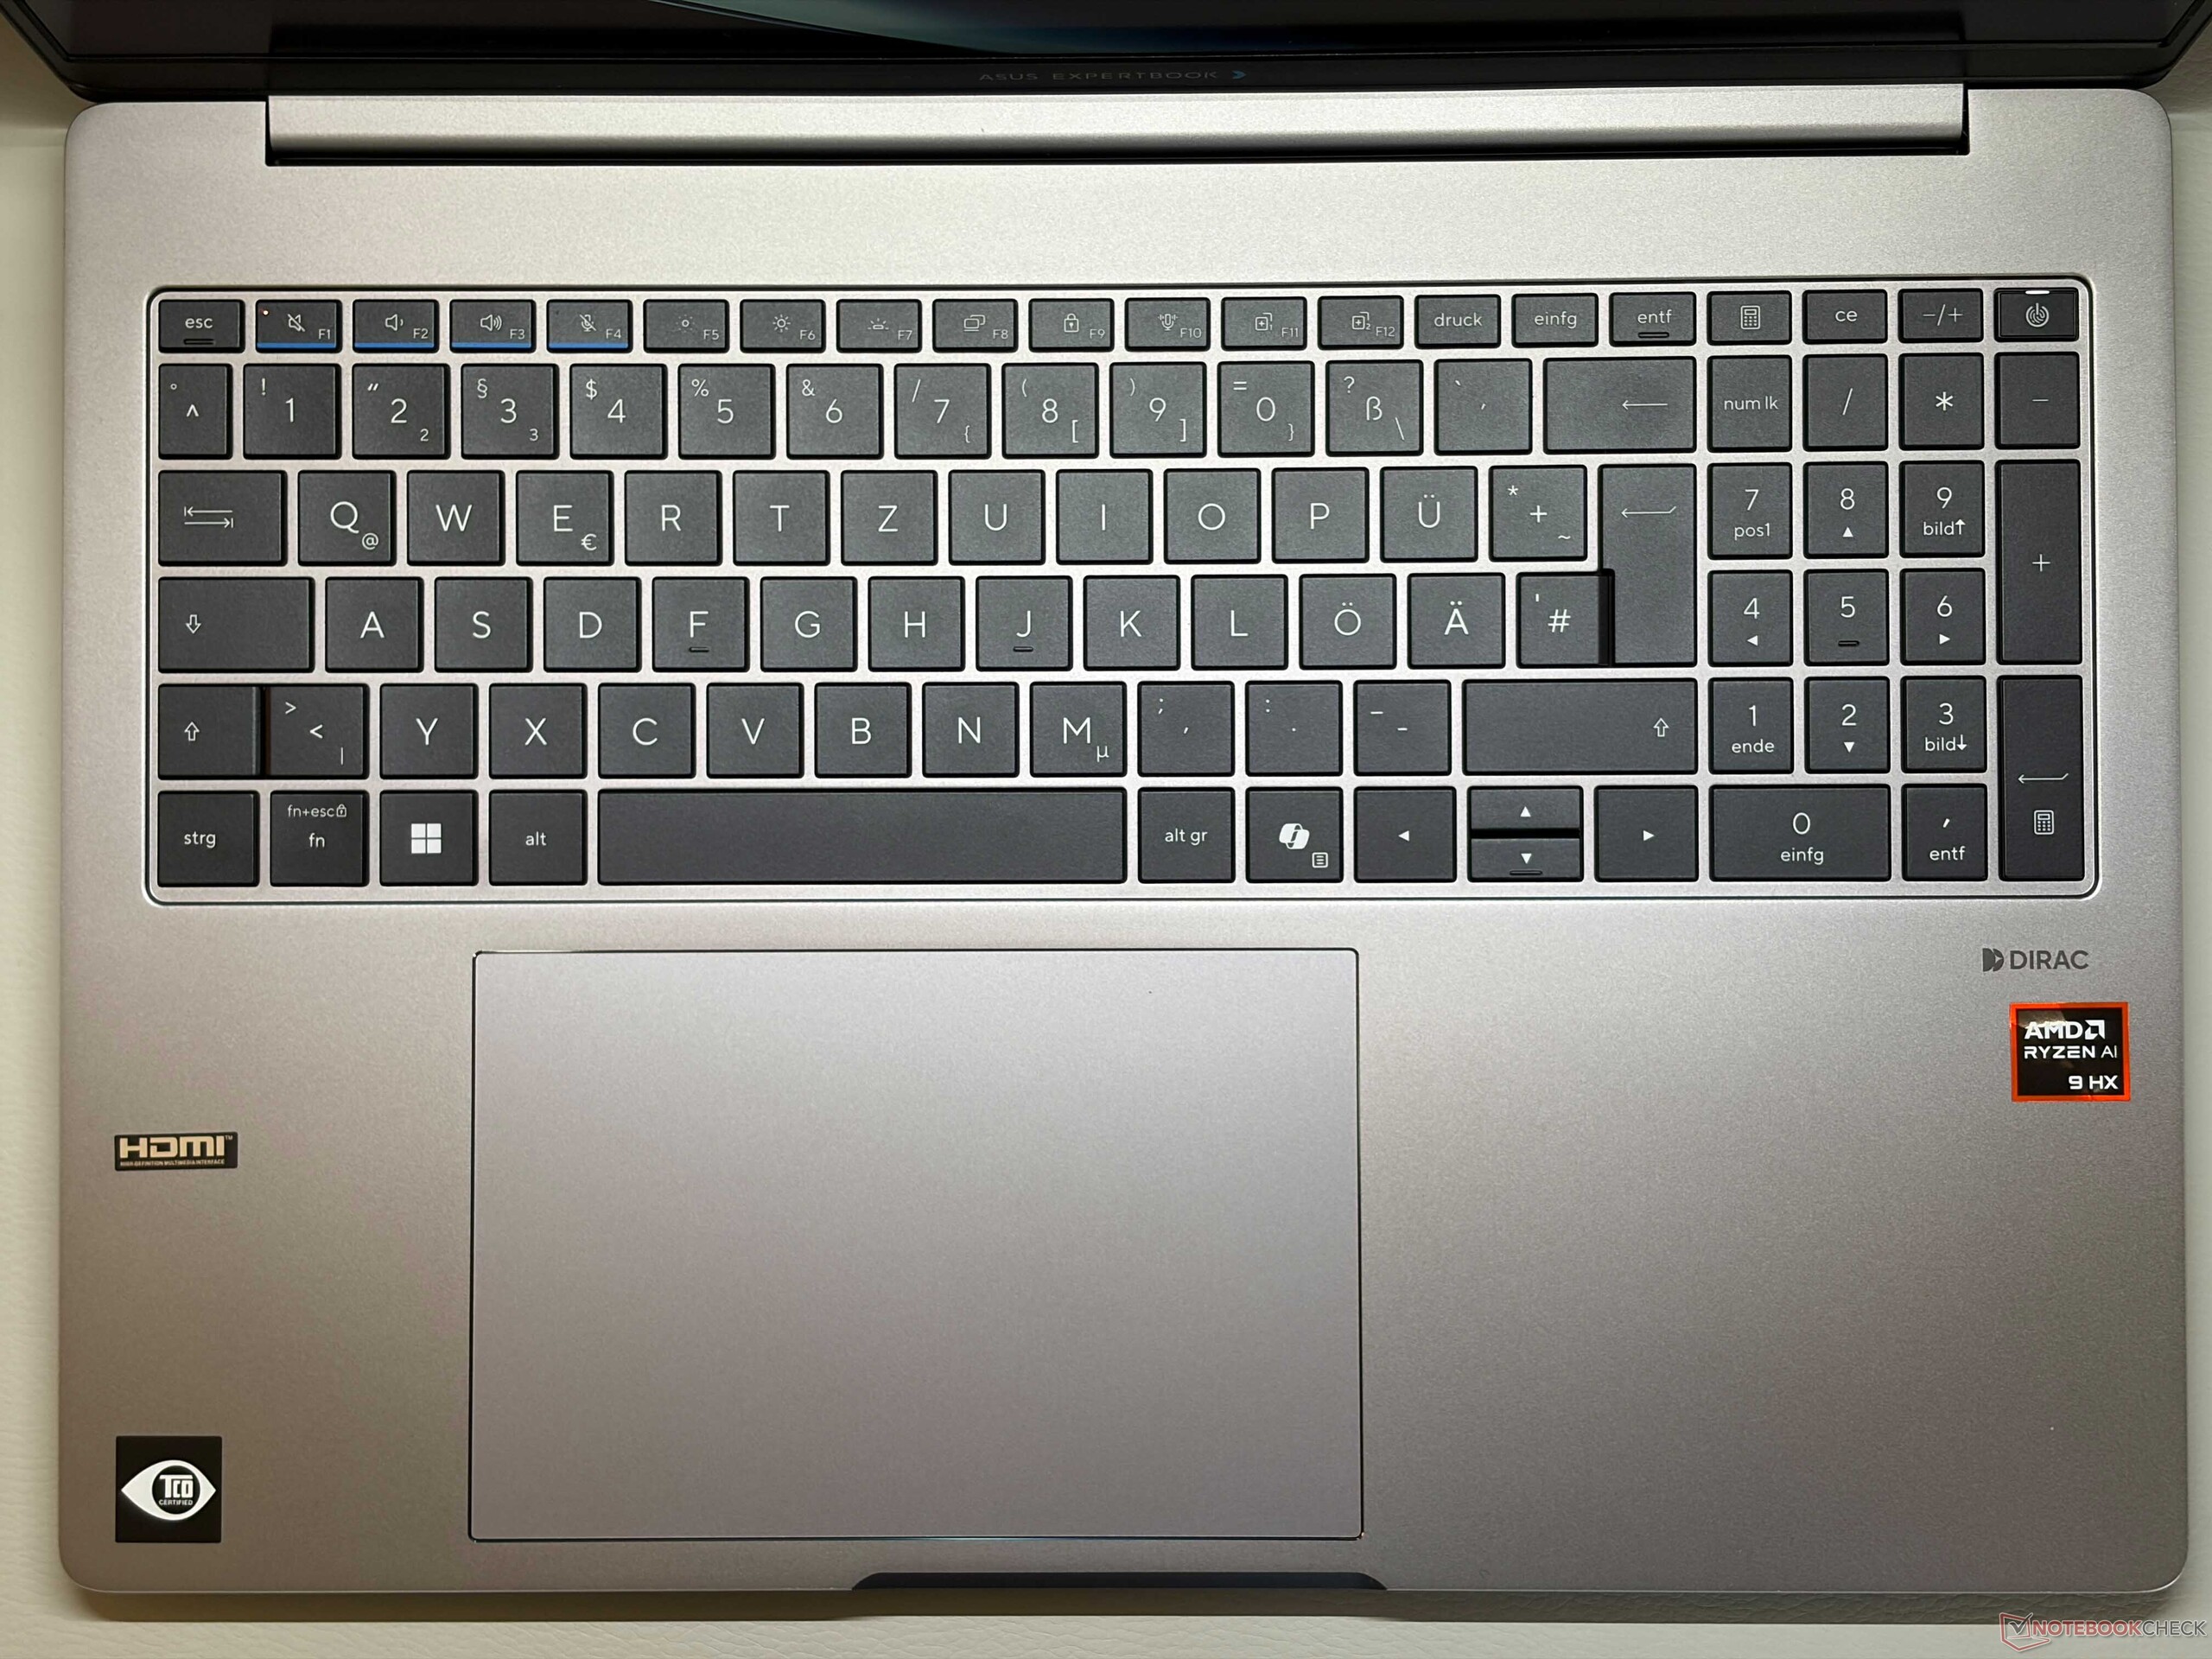
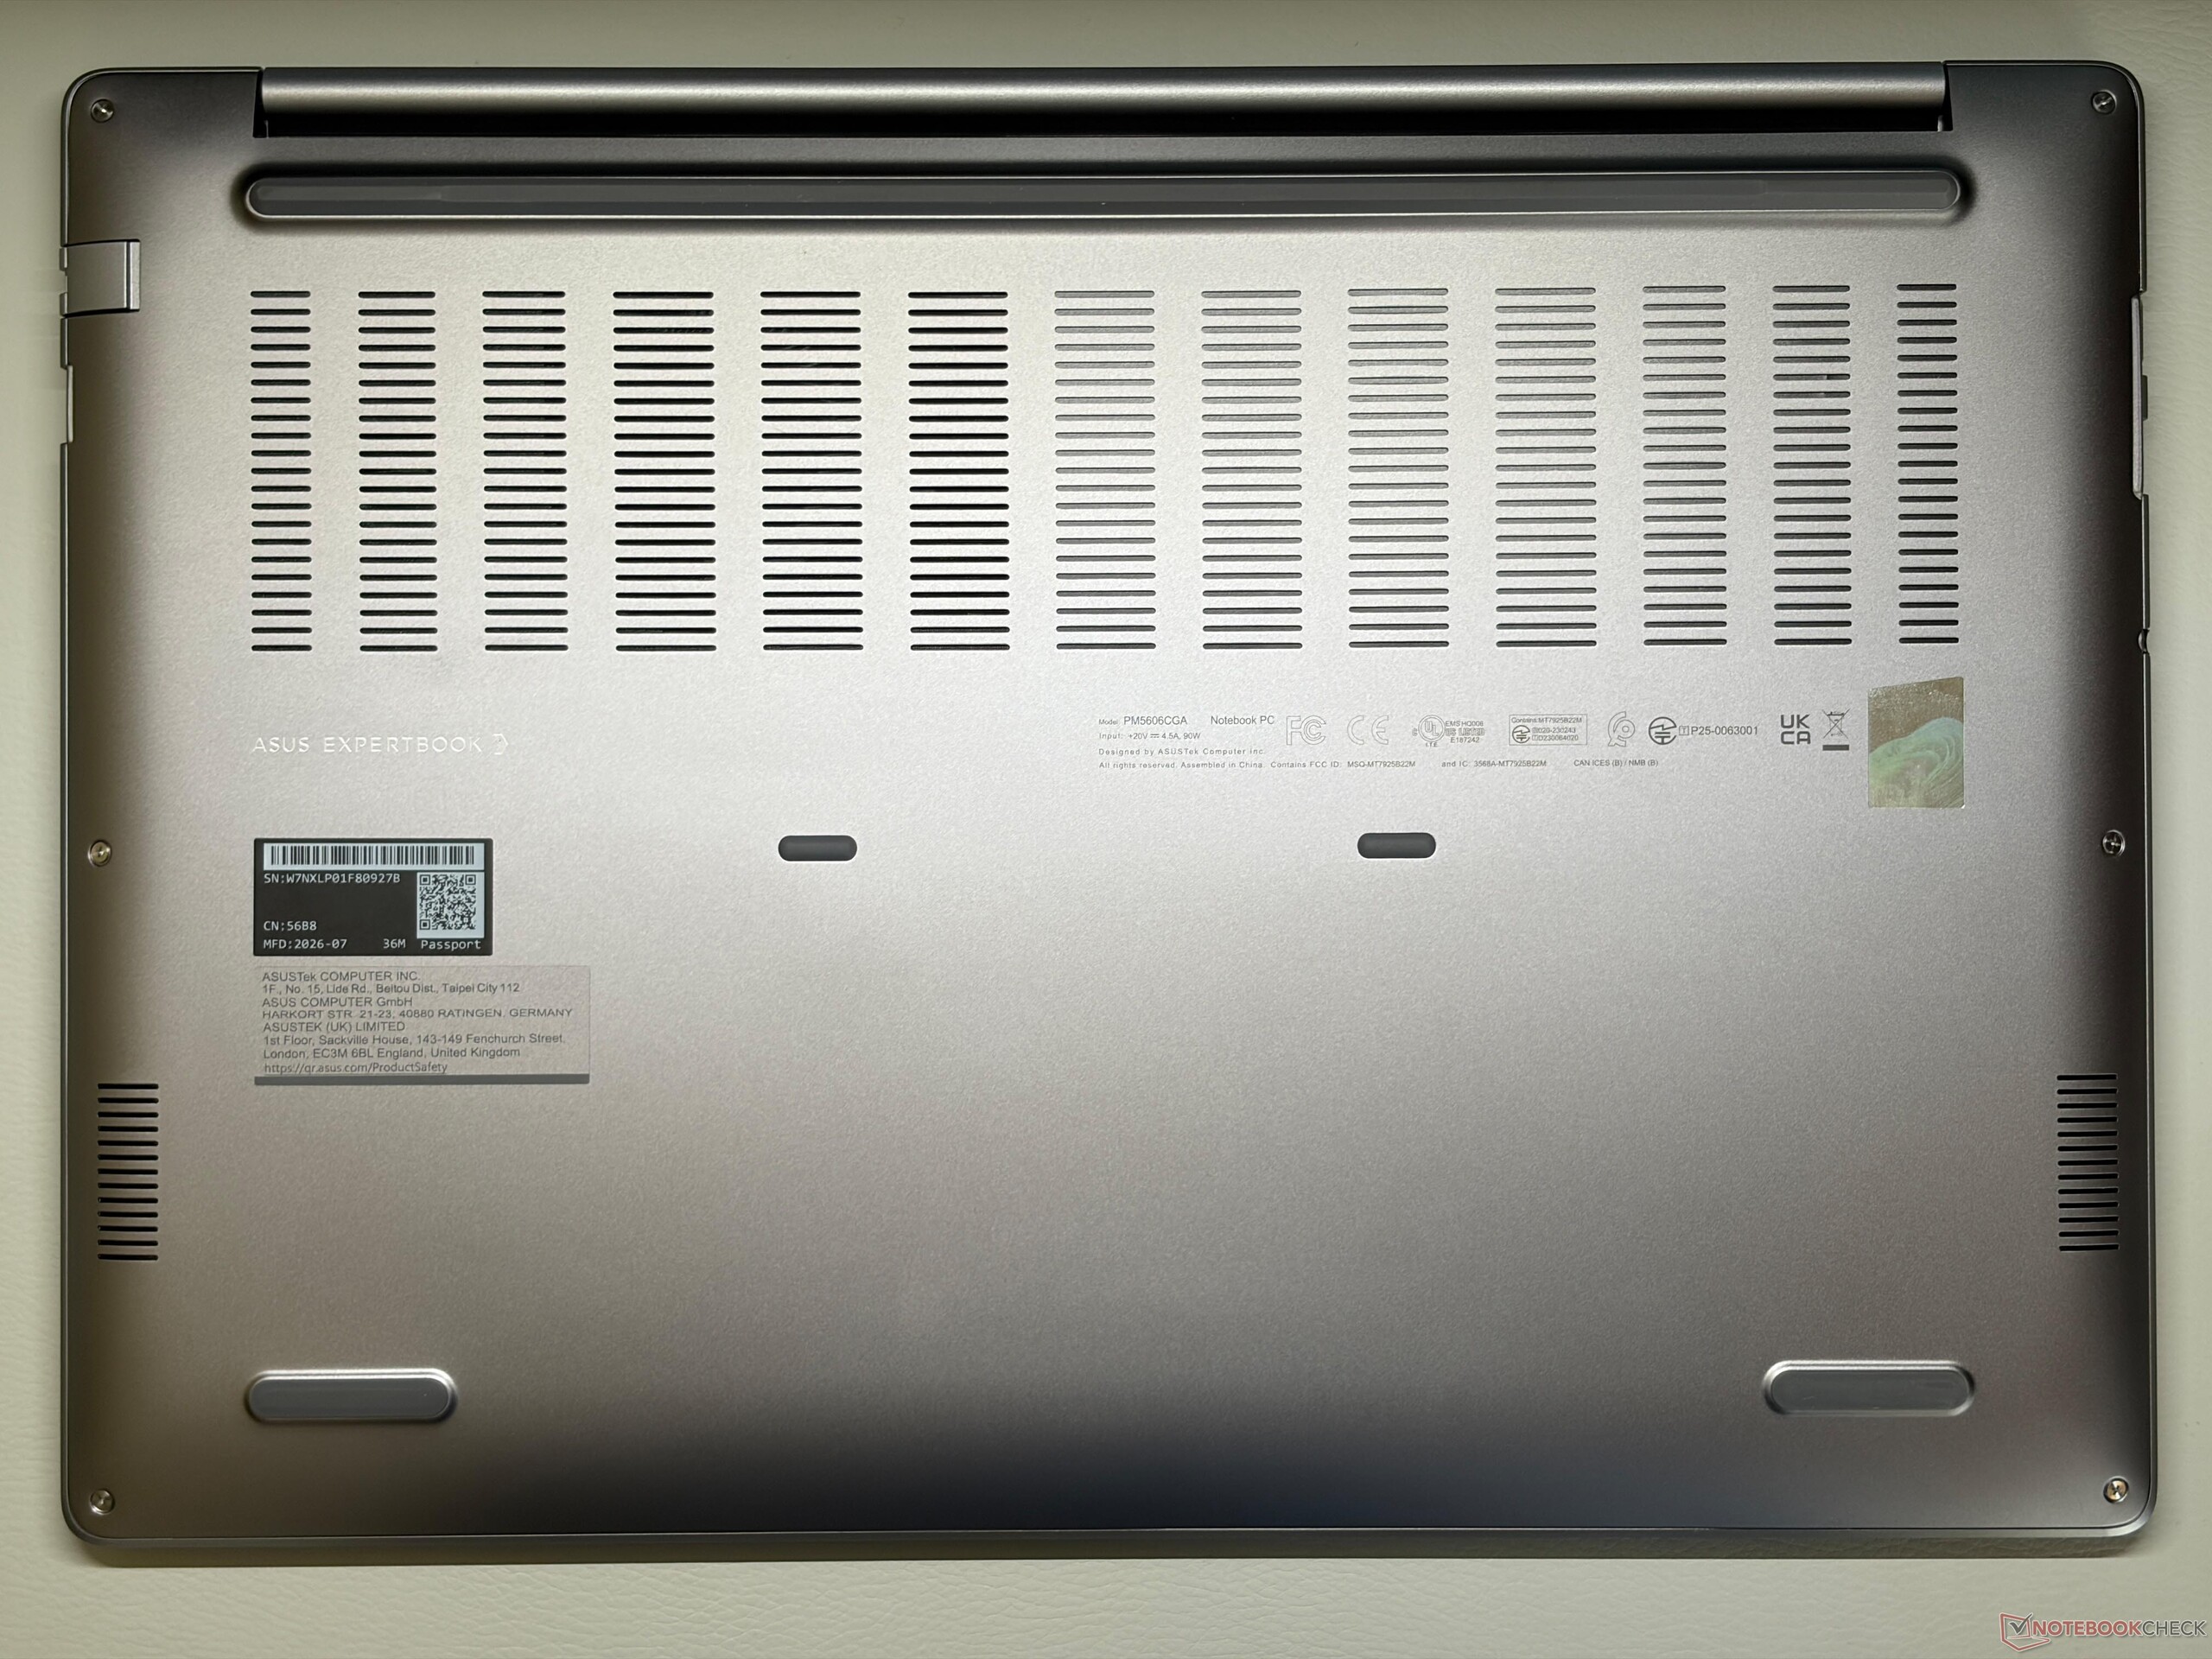
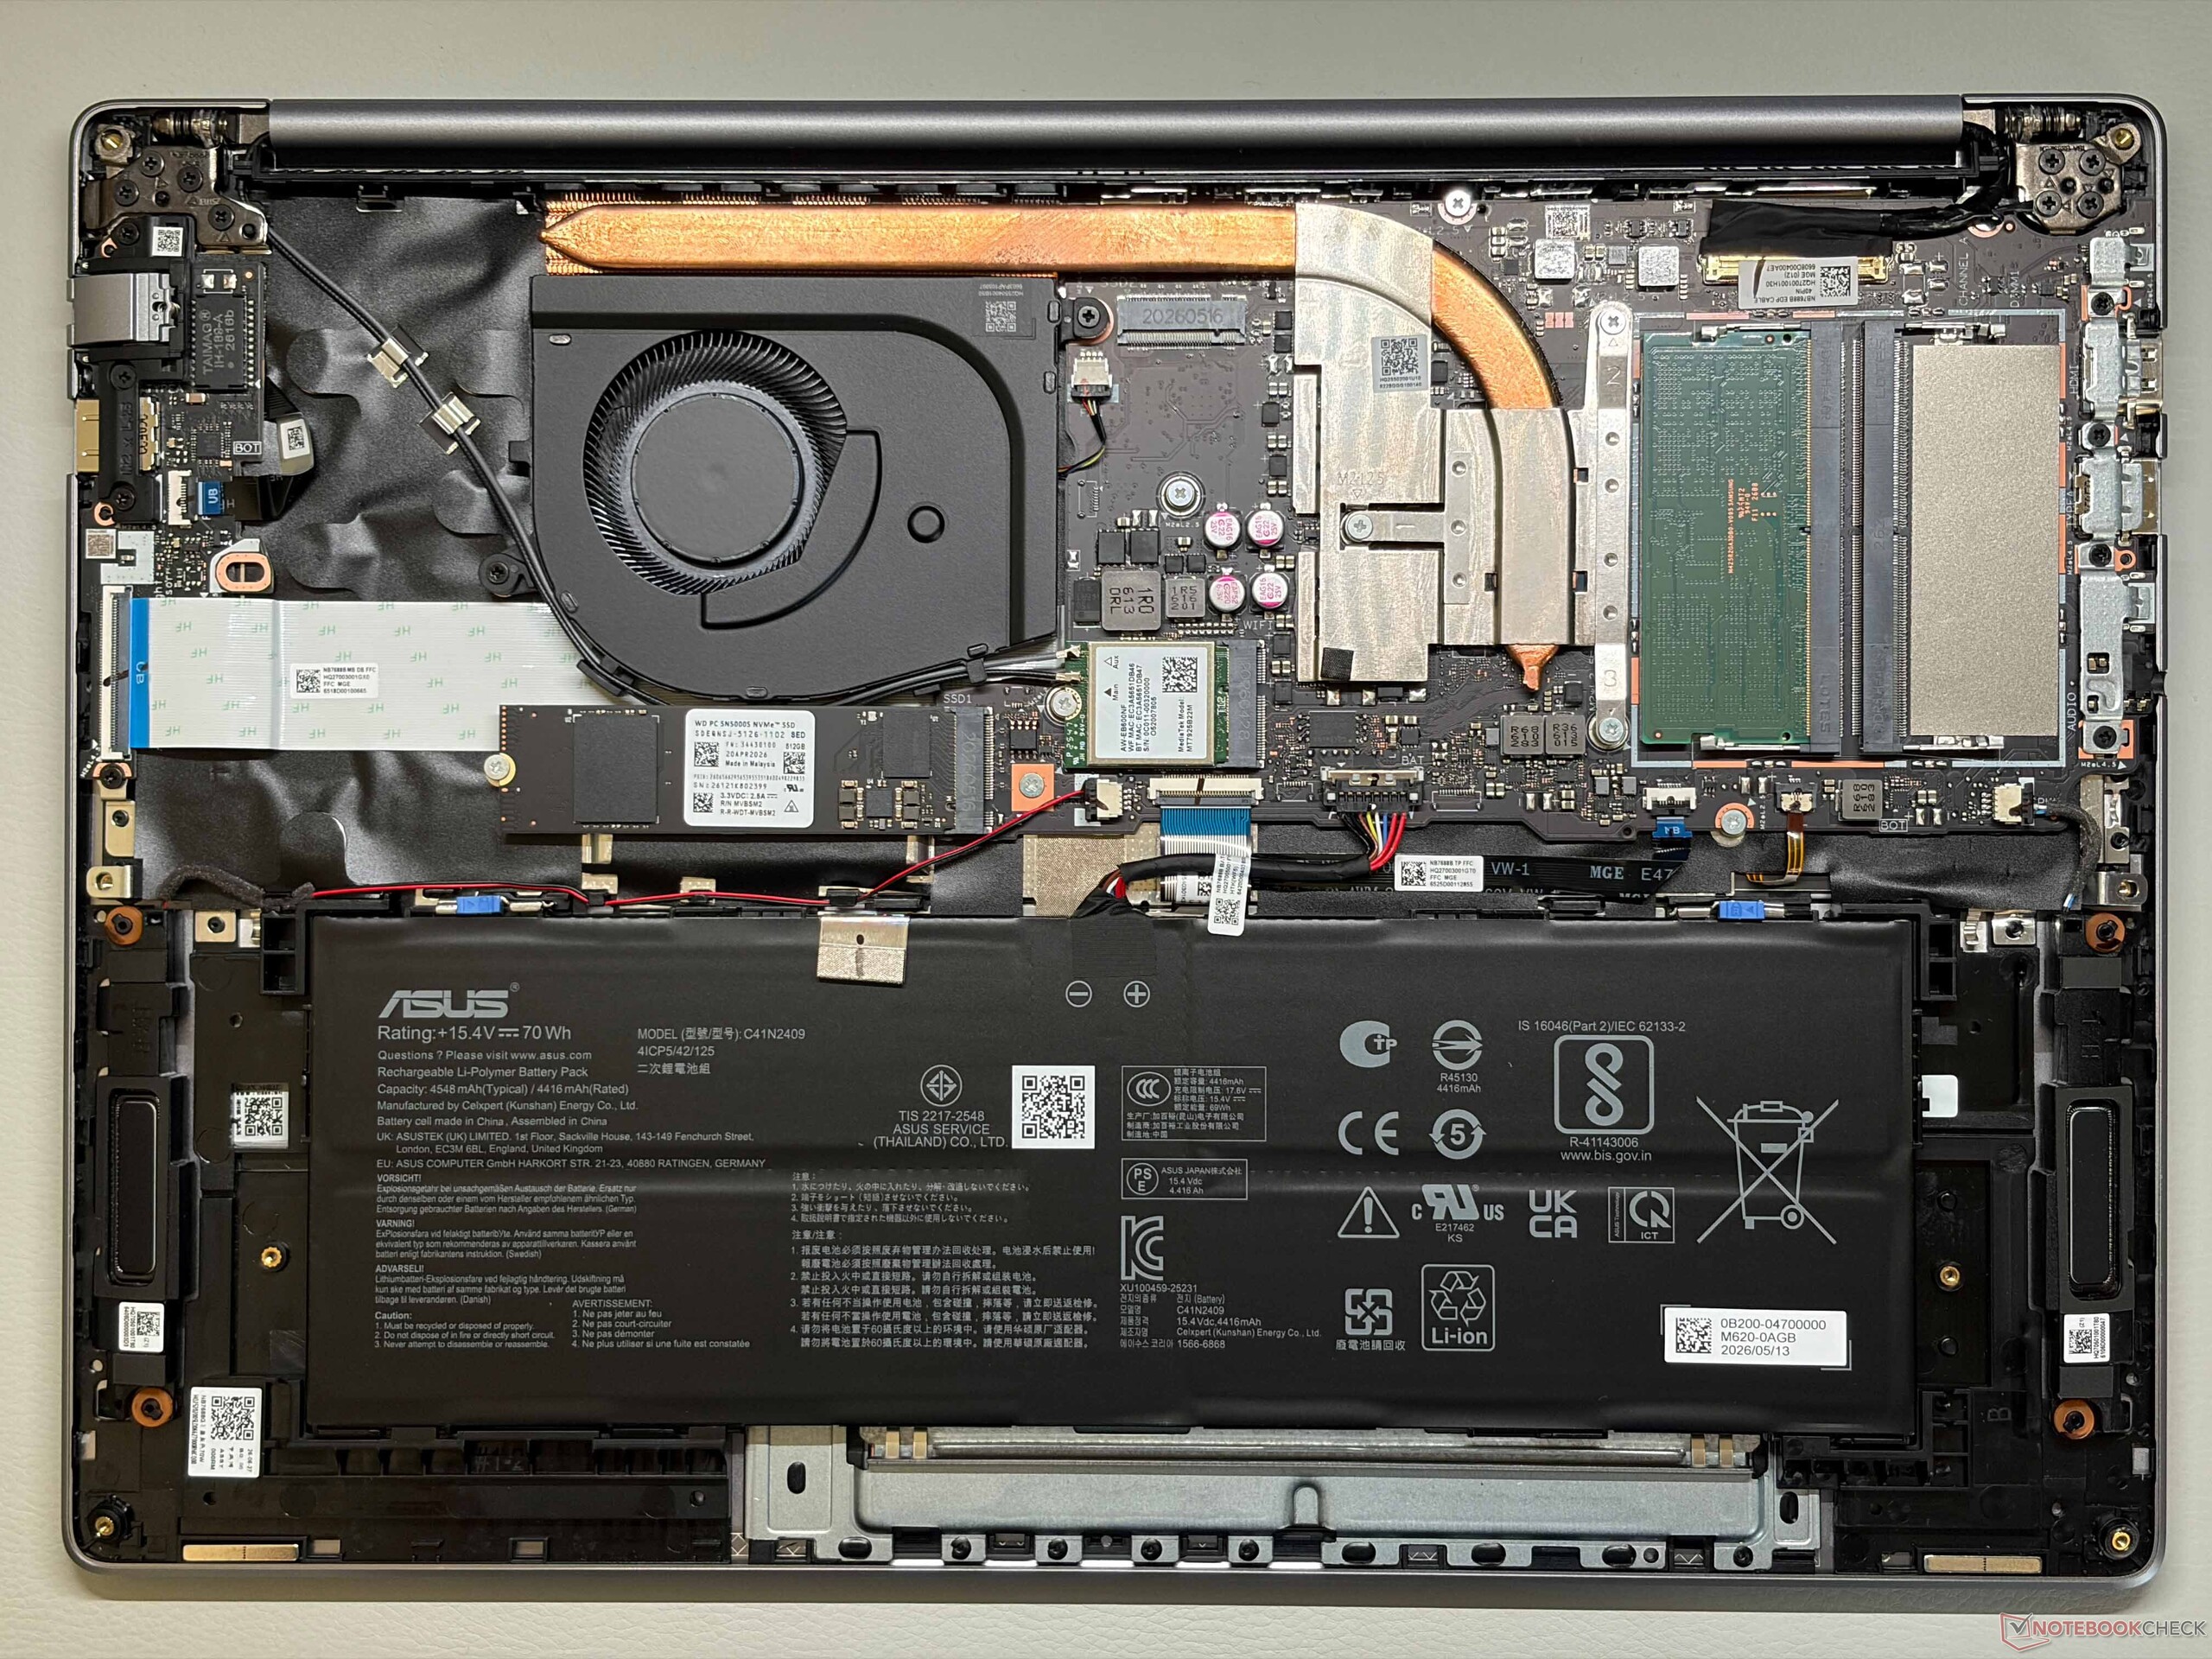
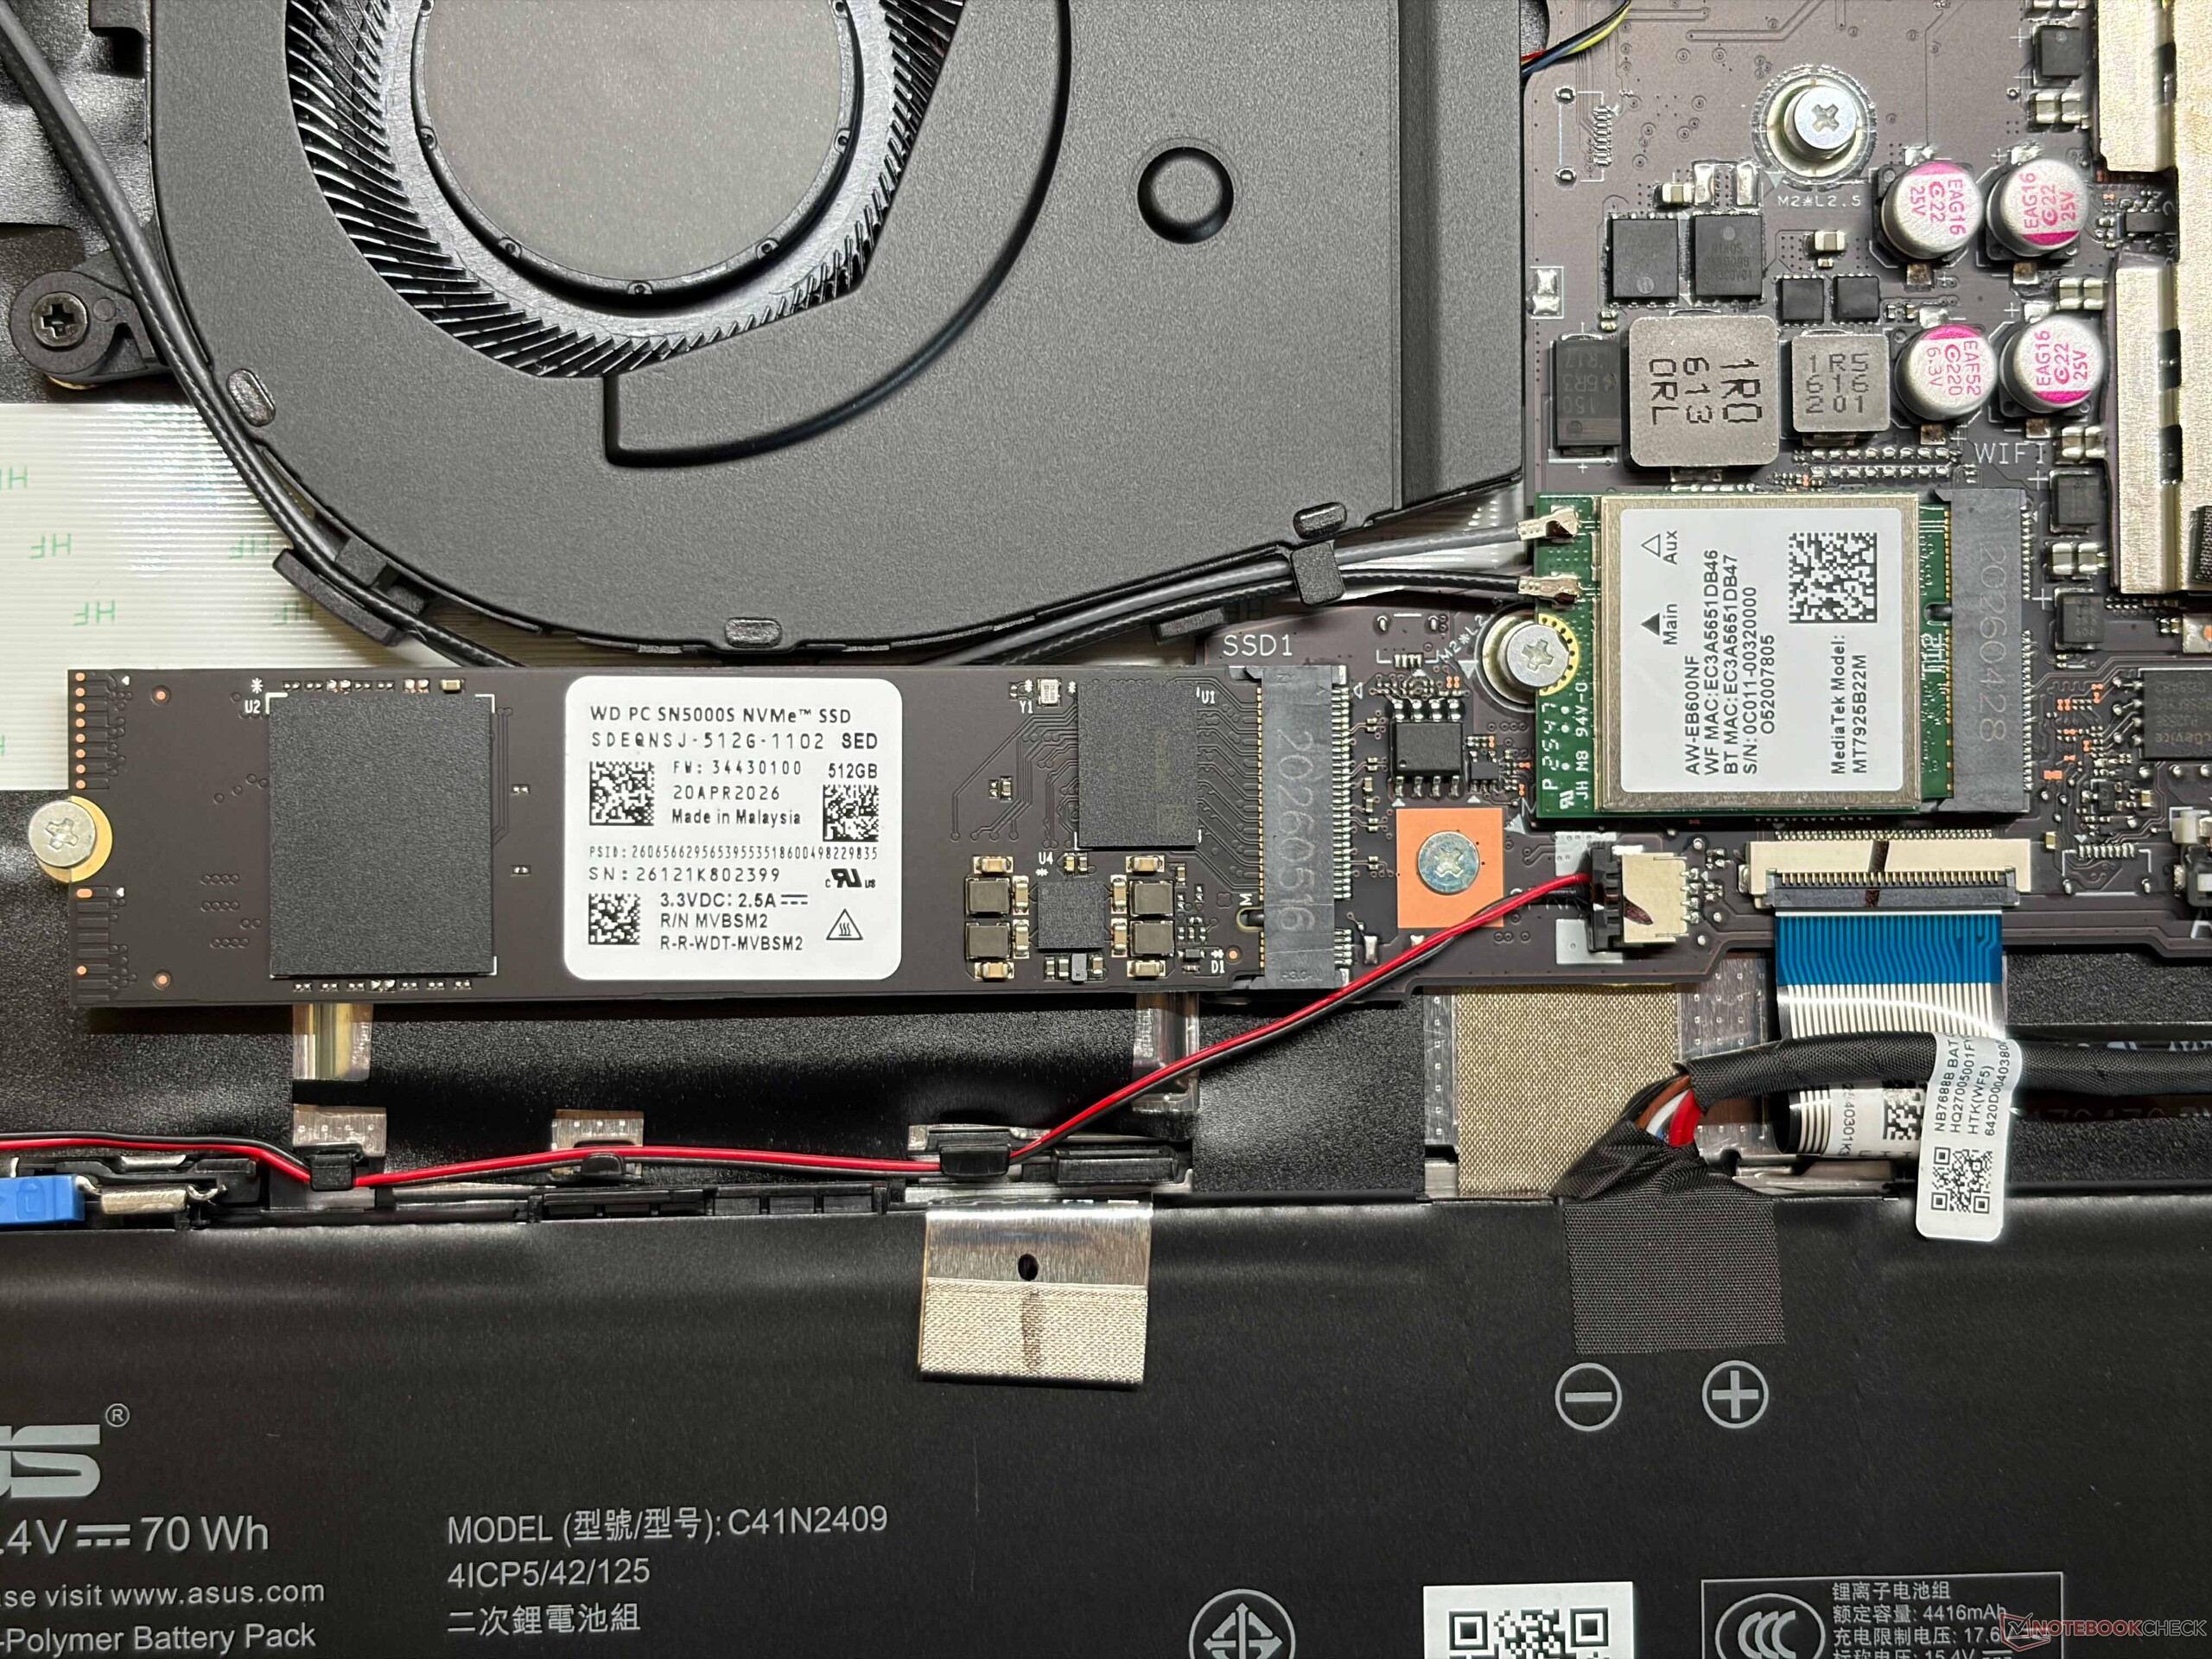
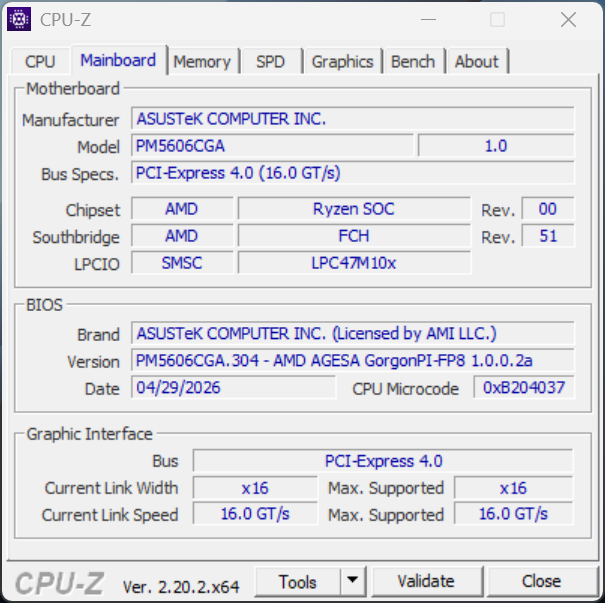
The ExpertBook PM5 G2 features an aluminum chassis in a dark gray finish and is resistant to fingerprints. The design looks high-end, but the impression of quality suffers slightly because of the wobbly hinge and slight creaking noises when handling (from both the base unit and the hinge). In this regard, the ExpertBook falls short of competitors like the ThinkPad T16 or the EliteBook 8. However, the serviceability is very good (2x SO-DIMM, M.2-2280 SSD, Wi-Fi). The keyboard features three-level backlighting and a full-size numeric keypad. It offers 1.5 mm of travel and a comfortable typing feel, though not quite as good as on Asus’s multimedia/gaming laptops. The ClickPad is huge (15 x 10 cm) and offers good glide, but it's shifted slightly to the left, and the mechanical clicks in the lower area feel a bit cheap.
In terms of ports, you get plenty of USB ports, including USB 4.0, as well as an HDMI output. For networking, there’s a Gigabit Ethernet port and a Wi-Fi 7 module, though the latter operates at only 160 MHz. Transfer rates therefore top out at ~2–2.2 Gbit/s but are very stable. The 1080p webcam with a mechanical shutter produces only below-average video quality.



| Networking | |
| Asus ExpertBook PM5 G2 PM5606 | |
| iperf3 transmit Wi-Fi6/7 RT-BE96U | |
| iperf3 receive Wi-Fi6/7 RT-BE96U | |
| Dell Pro 5 16 P516265 | |
| iperf3 receive AXE11000 6GHz | |
| iperf3 transmit AXE11000 6GHz | |
| iperf3 transmit AXE11000 | |
| iperf3 receive AXE11000 | |
| Dynabook Tecra A60 A65-M | |
| iperf3 receive AXE11000 6GHz | |
| iperf3 transmit AXE11000 6GHz | |
| iperf3 transmit AXE11000 | |
| iperf3 receive AXE11000 | |
| HP EliteBook 8 G1a 16 AI | |
| iperf3 receive AXE11000 6GHz | |
| iperf3 transmit AXE11000 6GHz | |
| iperf3 transmit AXE11000 | |
| iperf3 receive AXE11000 | |


Display - WQHD IPS at 144 Hz
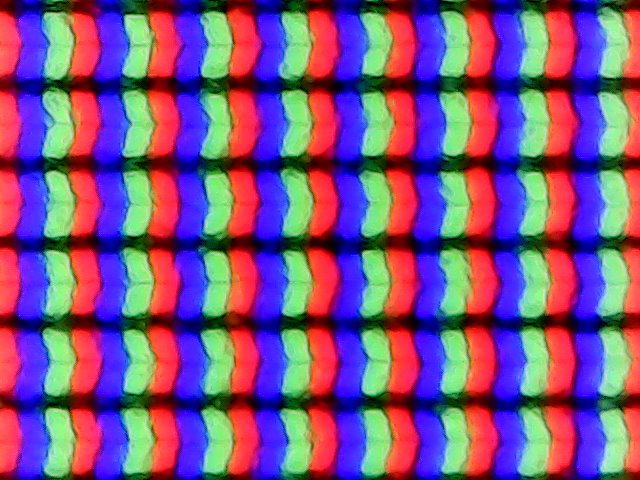

Asus features a matte IPS display with a resolution of 2,560 x 1,600 pixels (16:10) and a refresh rate of 144 Hz. Subjective image quality is very good, and this is where the ExpertBook has an advantage over many competitors, which often offer Full HD panels at 60 Hz. There is no PWM flicker, and even bright content appears only minimally grainy—though this is hardly noticeable. This makes the panel very well-suited for work.
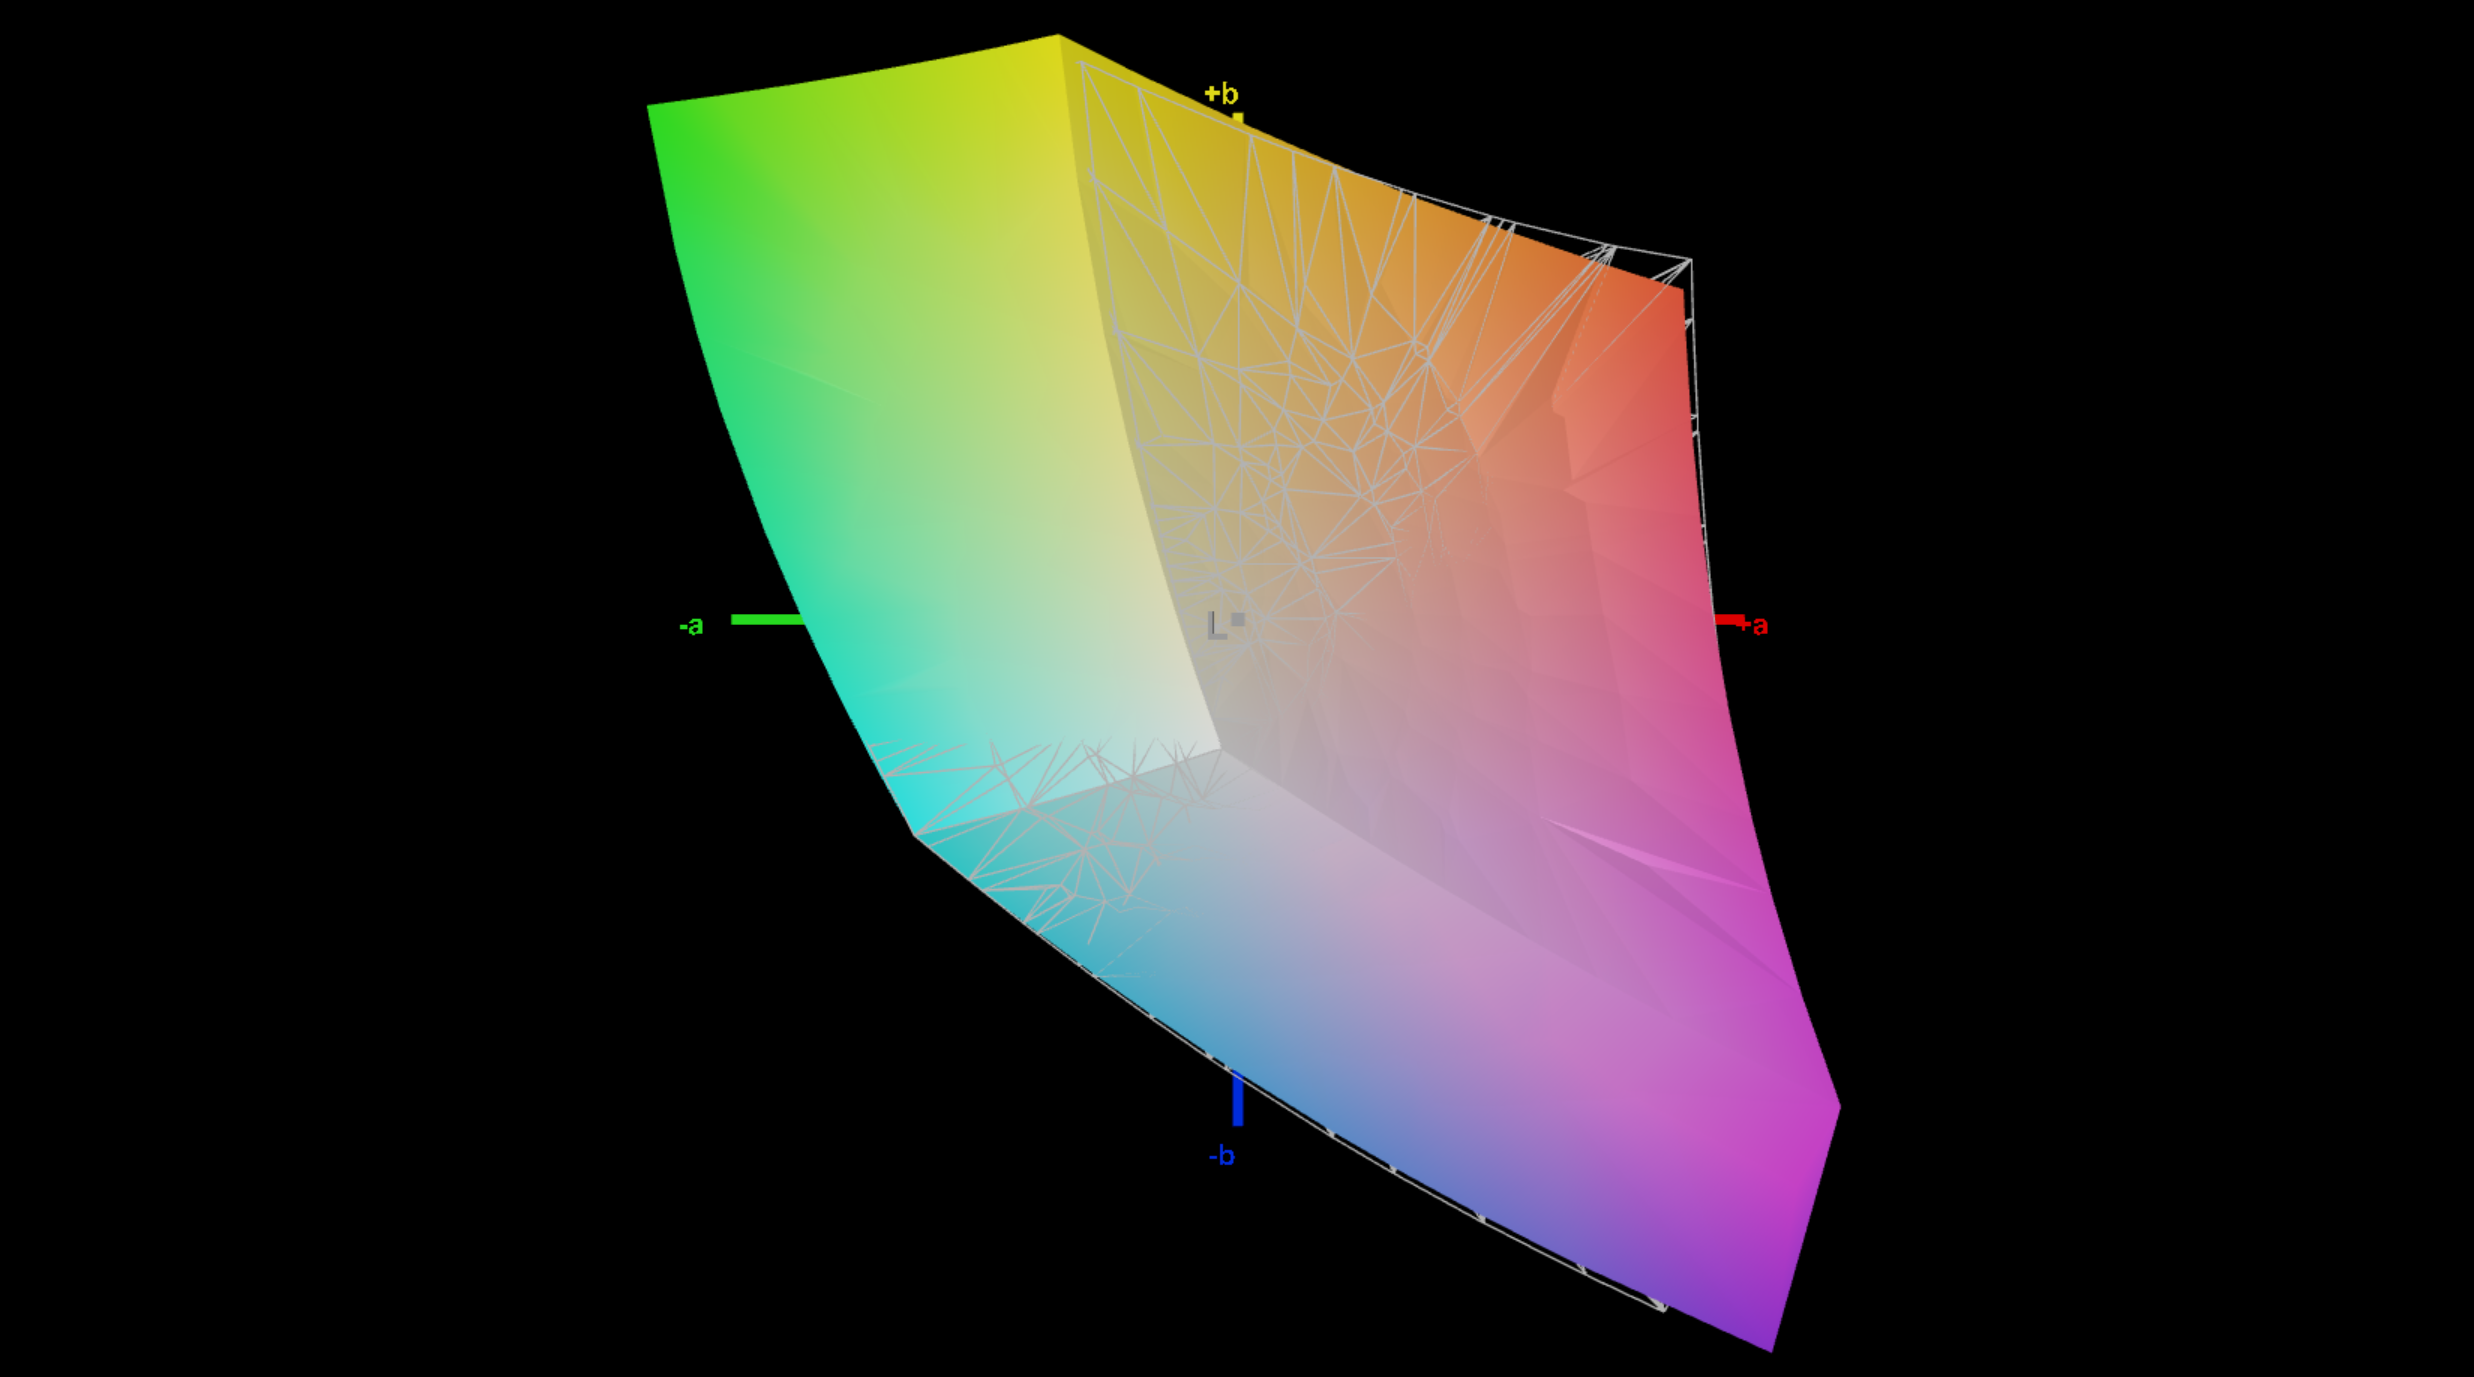
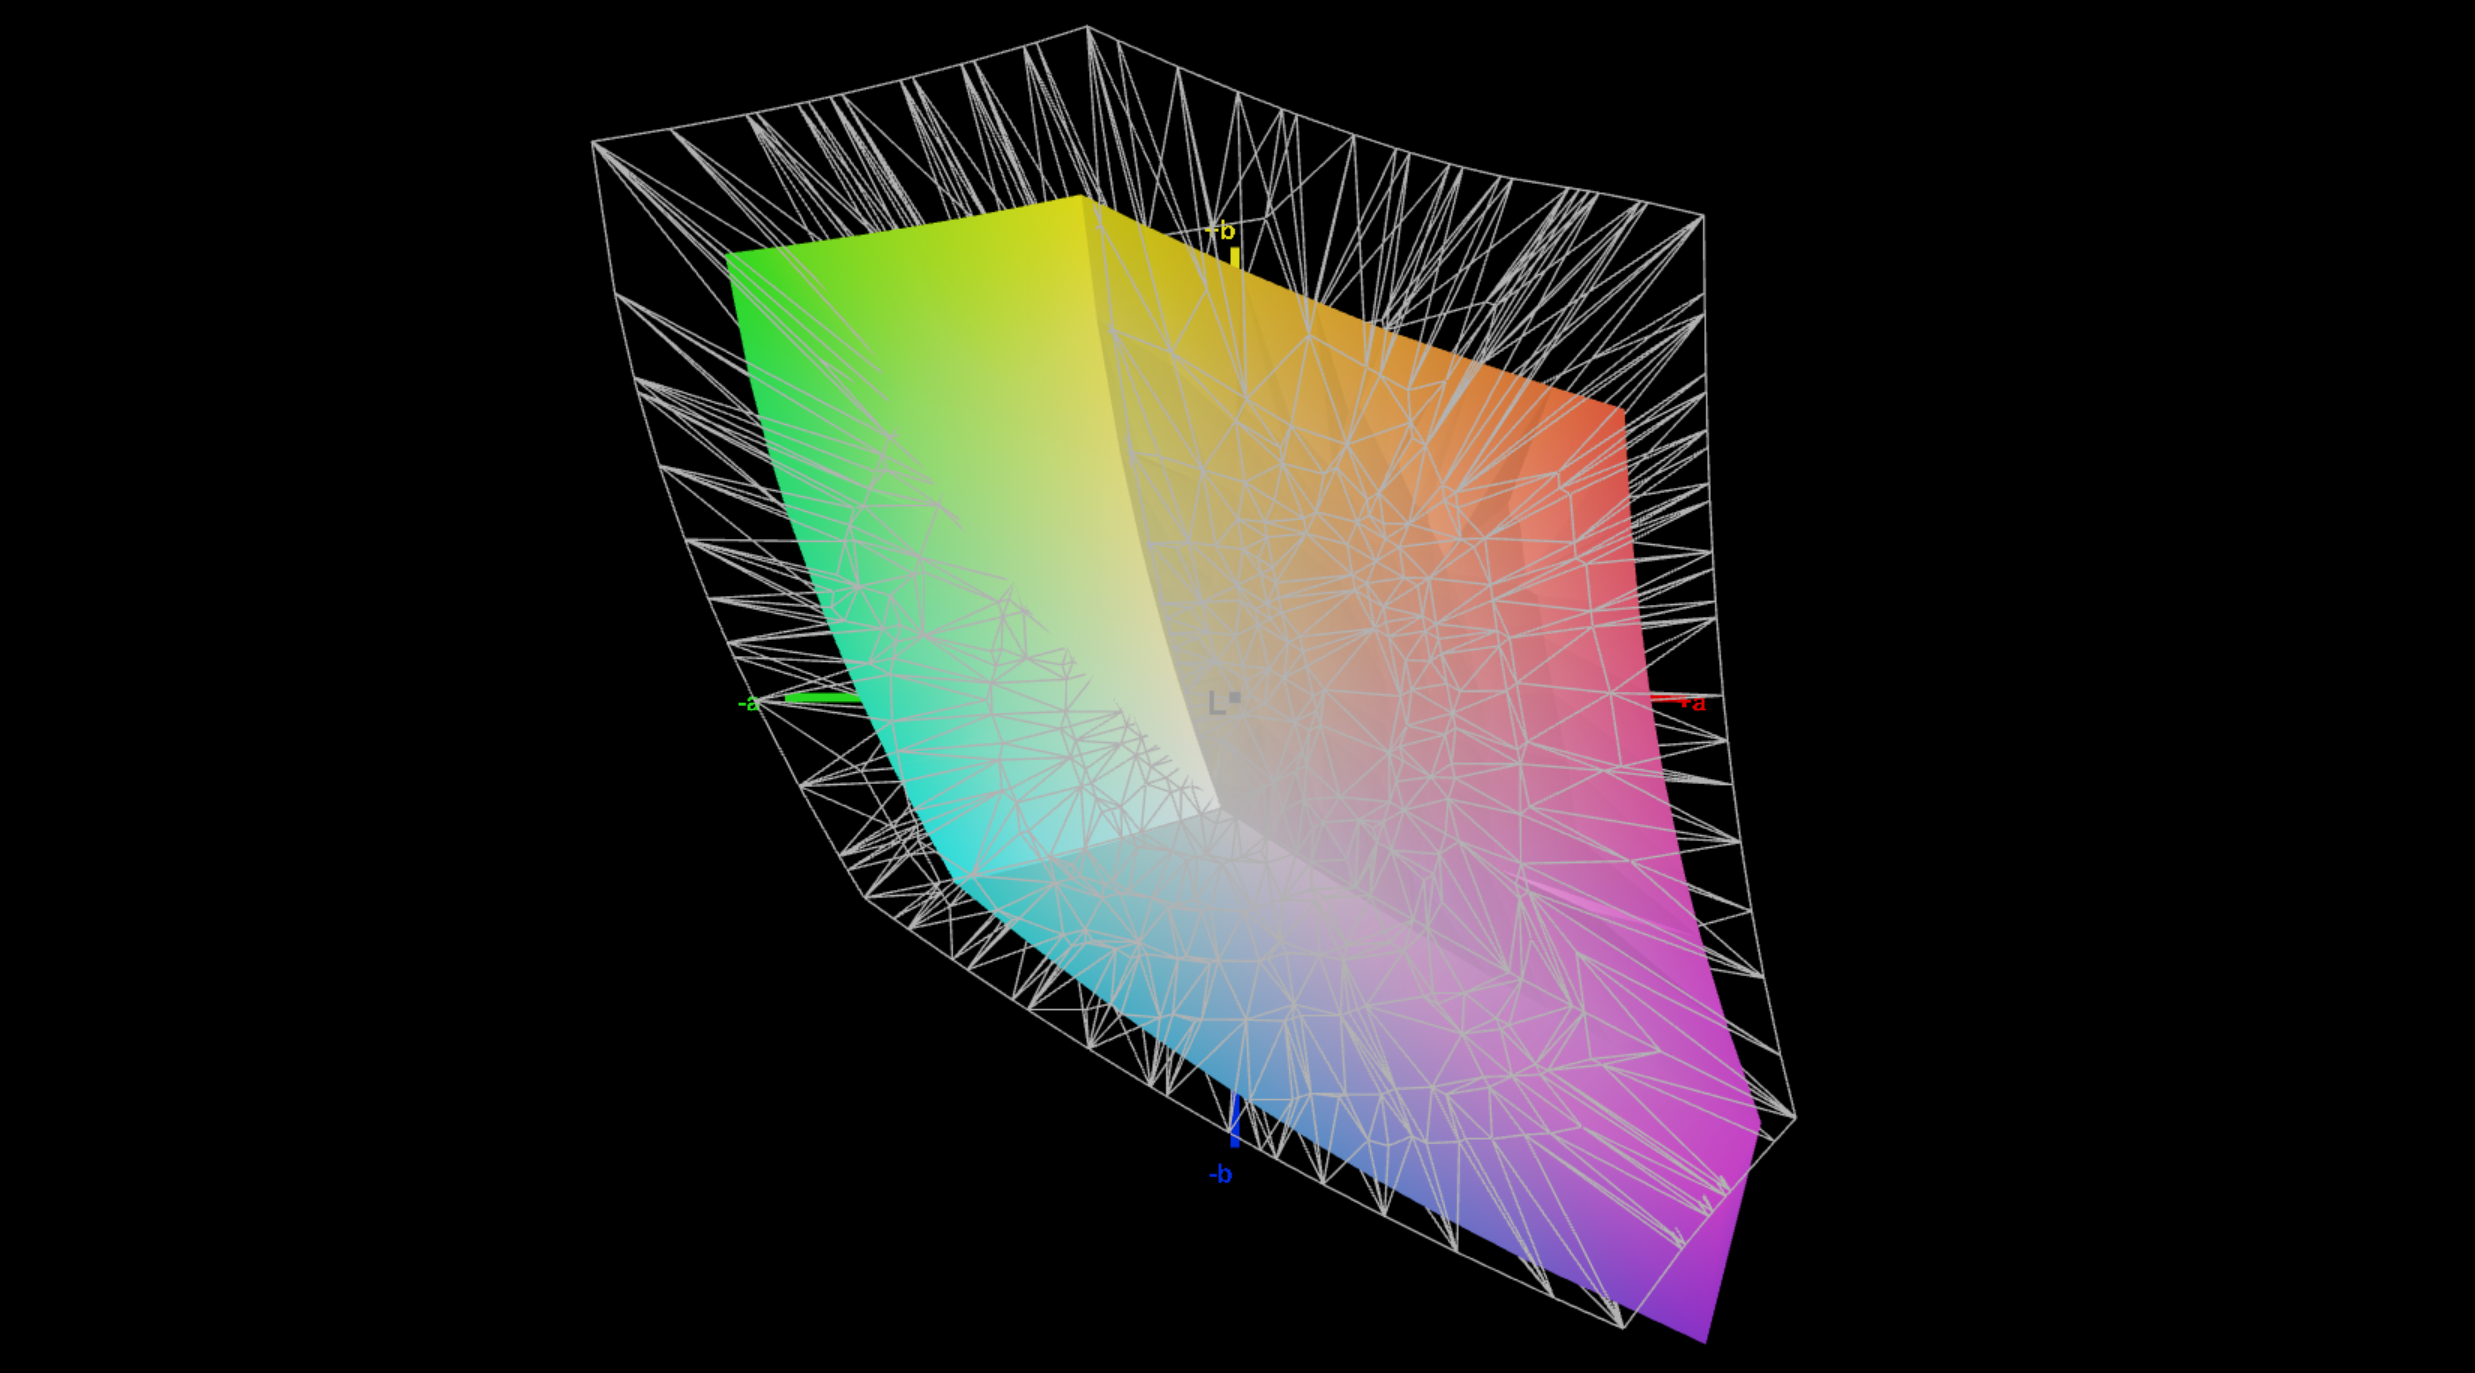
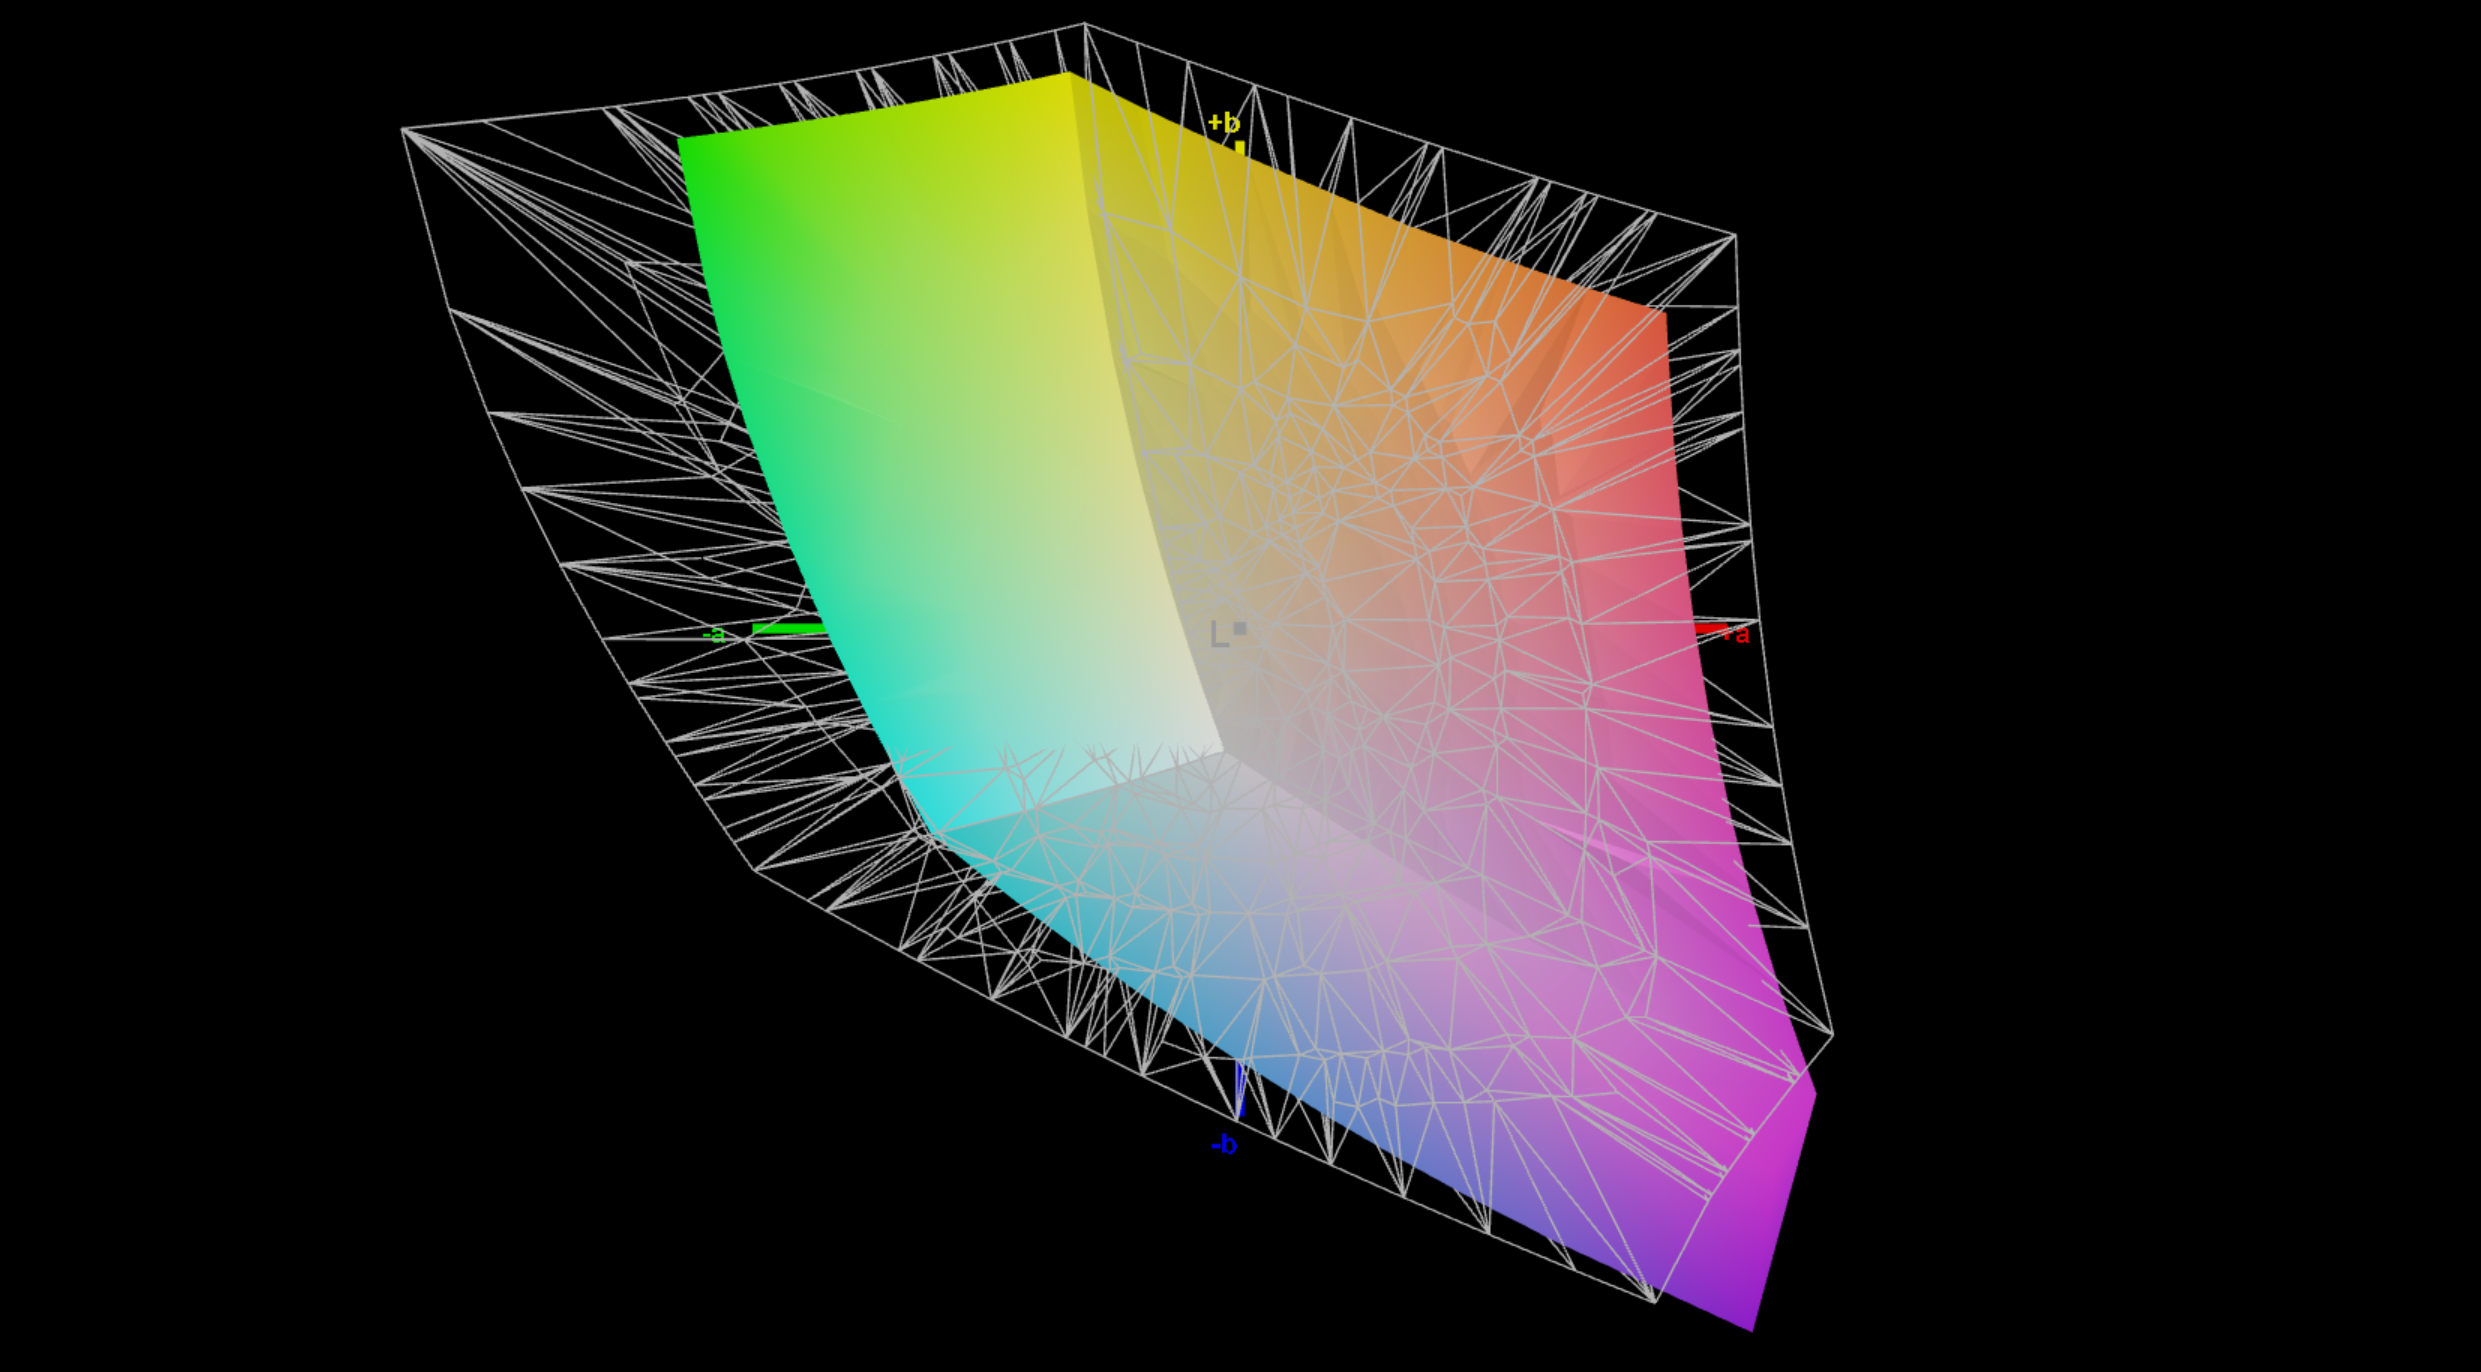
The maximum brightness averages ~425 cd/m², and the black level is low at 0.28 cd/m², resulting in a very good maximum contrast ratio of 1,500:1. In our analysis using the professional CalMAN software, the factory profile shows a slight blue cast combined with a color temperature that’s too cool. We can correct this issue with our own calibration (the profile is available for free download in the box above) and also improve the color deviations; only 100% blue continues to show a higher deviation. The sRGB color space is covered almost completely.
| |||||||||||||||||||||||||
Brightness Distribution: 93 %
Center on Battery: 421 cd/m²
Contrast: 1504:1 (Black: 0.28 cd/m²)
ΔE ColorChecker Calman: 3.1 | ∀{0.5-29.43 Ø4.69}
calibrated: 1.3
ΔE Greyscale Calman: 3.9 | ∀{0.09-98 Ø4.94}
69.5% AdobeRGB 1998 (Argyll 3D)
98.5% sRGB (Argyll 3D)
68.6% Display P3 (Argyll 3D)
Gamma: 2.28
CCT: 7365 K
| Asus ExpertBook PM5 G2 PM5606 NE160QDM-NX4, IPS, 2560x1600, 16", 120 Hz | Dell Pro 5 16 P516265 BOE NS16M30, IPS, 2560x1600, 16", 120 Hz | Lenovo ThinkPad T16 Gen 5 22AN001WGE N160JCA-ELN, IPS, 1920x1200, 16", 60 Hz | Dynabook Tecra A60 A65-M BOE NV160WUM-N43, IPS, 1920x1200, 16", 60 Hz | HP EliteBook 8 G1a 16 AI IPS, 1920x1200, 16", 60 Hz | |
|---|---|---|---|---|---|
| Display | 3% | -40% | -41% | 0% | |
| Display P3 Coverage (%) | 68.6 | 71 3% | 40.7 -41% | 39.9 -42% | 68.5 0% |
| sRGB Coverage (%) | 98.5 | 100 2% | 61.1 -38% | 58 -41% | 98.6 0% |
| AdobeRGB 1998 Coverage (%) | 69.5 | 72.4 4% | 42 -40% | 41 -41% | 70.4 1% |
| Response Times | -13% | 19% | -3% | -48% | |
| Response Time Grey 50% / Grey 80% * (ms) | 36.2 ? | 38.3 ? -6% | 32.6 ? 10% | 33.7 ? 7% | 50.2 ? -39% |
| Response Time Black / White * (ms) | 19.6 ? | 23.4 ? -19% | 14.2 ? 28% | 22.1 ? -13% | 30.7 ? -57% |
| PWM Frequency (Hz) | |||||
| Screen | -5% | -52% | -68% | 12% | |
| Brightness middle (cd/m²) | 421 | 470.3 12% | 479 14% | 362.3 -14% | 439.2 4% |
| Brightness (cd/m²) | 425 | 464 9% | 452 6% | 342 -20% | 405 -5% |
| Brightness Distribution (%) | 93 | 94 1% | 89 -4% | 88 -5% | 88 -5% |
| Black Level * (cd/m²) | 0.28 | 0.17 39% | 0.51 -82% | 0.5 -79% | 0.31 -11% |
| Contrast (:1) | 1504 | 2766 84% | 939 -38% | 725 -52% | 1417 -6% |
| Colorchecker dE 2000 * | 3.1 | 4.45 -44% | 4.1 -32% | 5.63 -82% | 2.2 29% |
| Colorchecker dE 2000 max. * | 5.6 | 11.13 -99% | 16.8 -200% | 18.23 -226% | 4.31 23% |
| Colorchecker dE 2000 calibrated * | 1.3 | 0.6 54% | 3.8 -192% | 3.39 -161% | 0.49 62% |
| Greyscale dE 2000 * | 3.9 | 7.8 -100% | 1.7 56% | 2.7 31% | 3.2 18% |
| Gamma | 2.28 96% | 2.15 102% | 2.25 98% | 2.19 100% | 2.3 96% |
| CCT | 7365 88% | 7237 90% | 6777 96% | 6147 106% | 6438 101% |
| Total Average (Program / Settings) | -5% /
-4% | -24% /
-40% | -37% /
-53% | -12% /
1% |
* ... smaller is better


Display Response Times
| ↔ Response Time Black to White | ||
|---|---|---|
| 19.6 ms ... rise ↗ and fall ↘ combined | ↗ 7.6 ms rise | 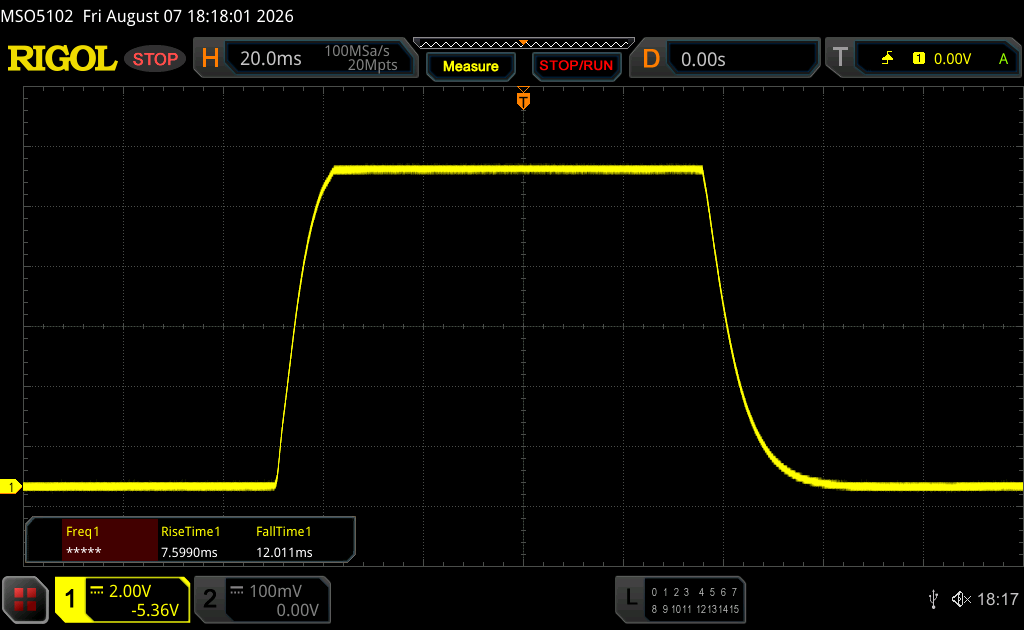 |
| ↘ 12 ms fall | ||
| The screen shows good response rates in our tests, but may be too slow for competitive gamers. In comparison, all tested devices range from 0.1 (minimum) to 240 (maximum) ms. » 44 % of all devices are better. This means that the measured response time is similar to the average of all tested devices (19.7 ms). | ||
| ↔ Response Time 50% Grey to 80% Grey | ||
| 36.2 ms ... rise ↗ and fall ↘ combined | ↗ 17.1 ms rise | 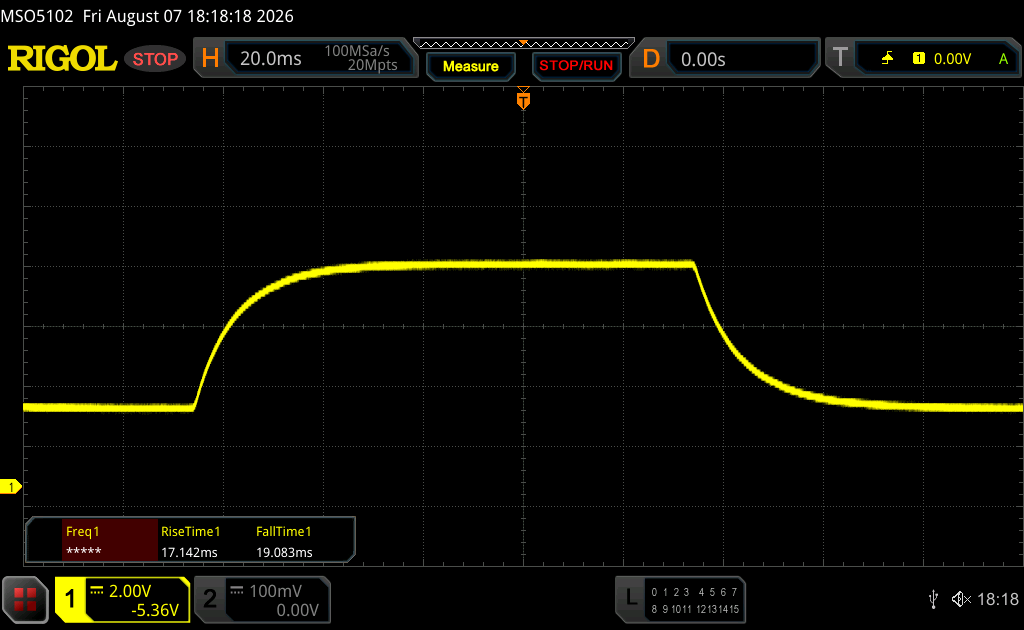 |
| ↘ 19.1 ms fall | ||
| The screen shows slow response rates in our tests and will be unsatisfactory for gamers. In comparison, all tested devices range from 0.13 (minimum) to 636 (maximum) ms. » 53 % of all devices are better. This means that the measured response time is worse than the average of all tested devices (30.7 ms). | ||
Screen Flickering / PWM (Pulse-Width Modulation)
| Screen flickering / PWM not detected | 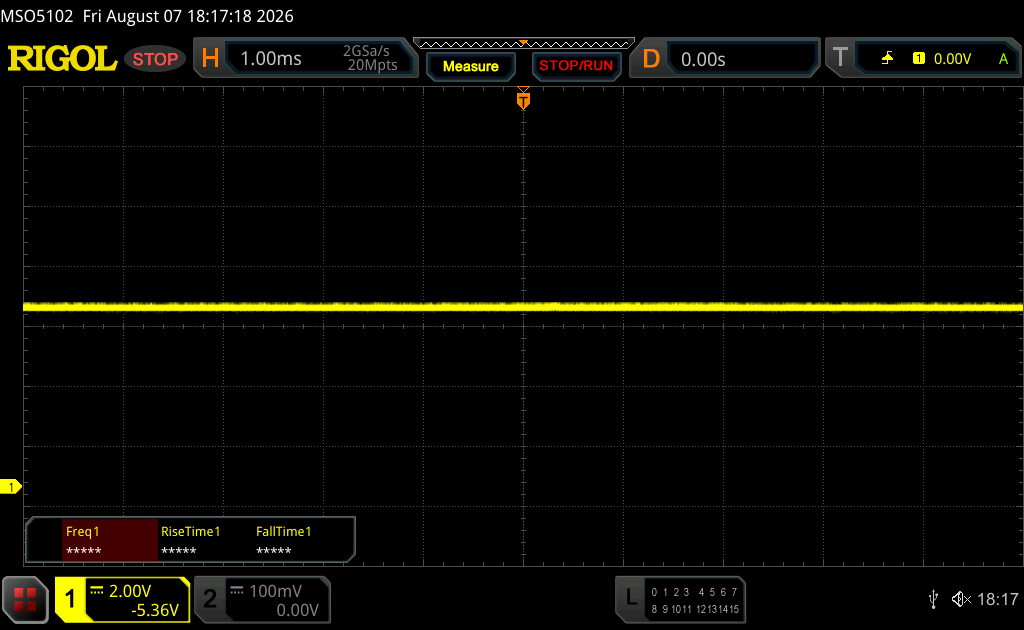 | ||
In comparison: 52 % of all tested devices do not use PWM to dim the display. If PWM was detected, an average of 7625 (minimum: 5 - maximum: 343500) Hz was measured. | |||


Performance - Ryzen AI 9 HX 470
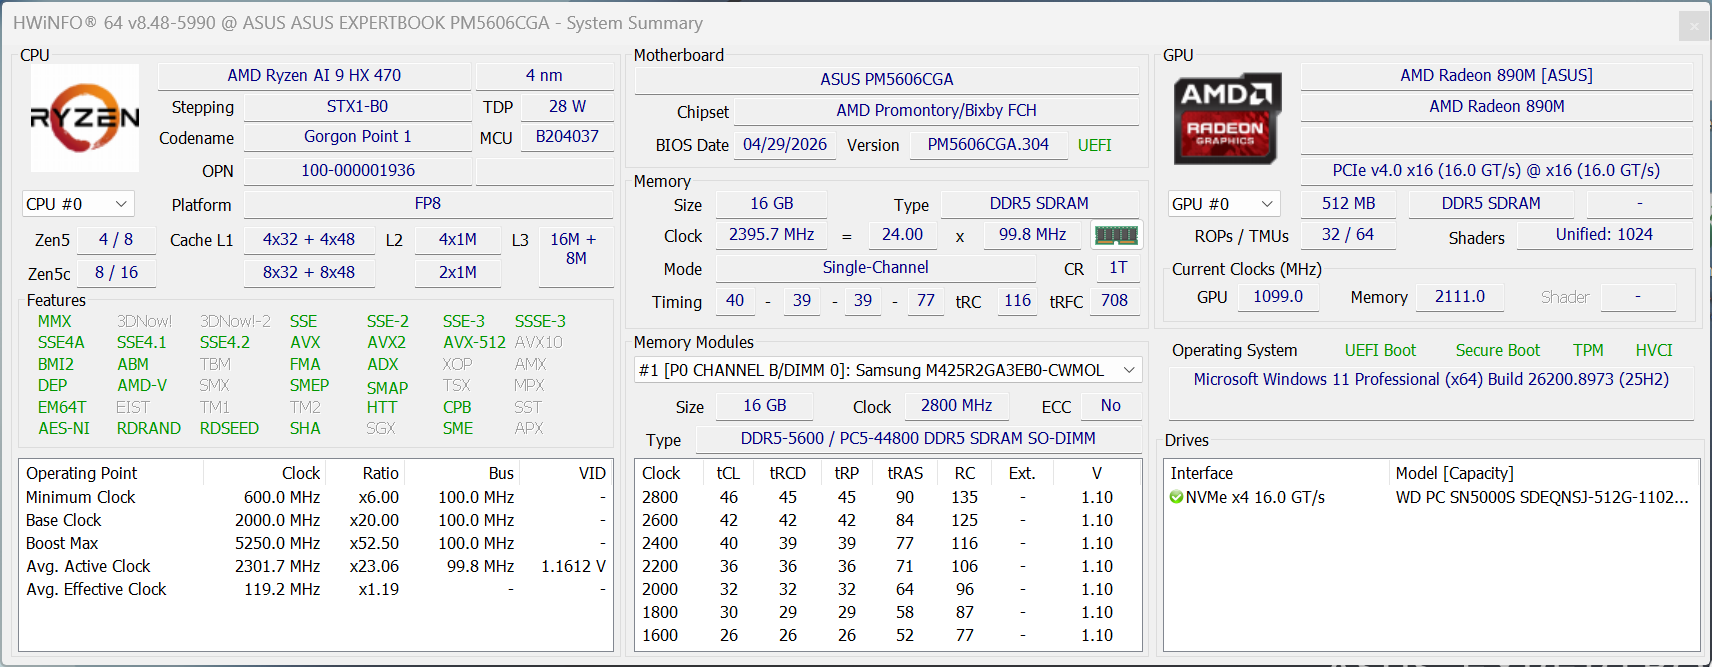
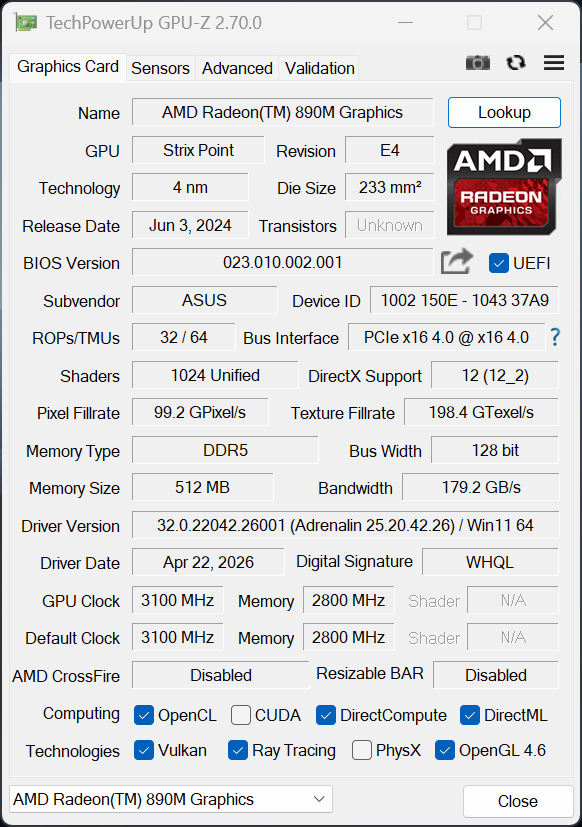
Test Conditions
We ran the benchmarks in Performance mode, as this is the only way to achieve maximum CPU performance.
Processor Performance
The AMD Ryzen AI 9 HX 470 (Zen 5) consumes 52/48 watts, delivering high and consistent multi-core performance. When running on battery power, the CPU is limited to a maximum of 32/28 watts (Standard mode), so performance is about 20% lower in this scenario.
Cinebench R15 Multi loop
Cinebench 2024: CPU Multi Core | CPU Single Core
Cinebench R23: Multi Core | Single Core
Cinebench R20: CPU (Multi Core) | CPU (Single Core)
Cinebench R15: CPU Multi 64Bit | CPU Single 64Bit
Blender: v2.79 BMW27 CPU
7-Zip 18.03: 7z b 4 | 7z b 4 -mmt1
Geekbench 6.7: Multi-Core | Single-Core
Geekbench 5.5: Multi-Core | Single-Core
HWBOT x265 Benchmark v2.2: 4k Preset
LibreOffice : 20 Documents To PDF
R Benchmark 2.5: Overall mean
| CPU Performance rating | |
| Average AMD Ryzen AI 9 HX 470 | |
| Dell Pro 5 16 P516265 | |
| Asus ExpertBook PM5 G2 PM5606 | |
| HP EliteBook 8 G1a 16 AI | |
| Dynabook Tecra A60 A65-M | |
| Average of class Office | |
| Lenovo ThinkPad T16 Gen 5 22AN001WGE -1! | |
| Cinebench 2024 / CPU Multi Core | |
| Average AMD Ryzen AI 9 HX 470 (1045 - 1247, n=7) | |
| Dell Pro 5 16 P516265 | |
| Asus ExpertBook PM5 G2 PM5606 | |
| HP EliteBook 8 G1a 16 AI | |
| Dynabook Tecra A60 A65-M | |
| Average of class Office (100 - 1168, n=51, last 2 years) | |
| Cinebench 2024 / CPU Single Core | |
| Average of class Office (58 - 821, n=53, last 2 years) | |
| Dell Pro 5 16 P516265 | |
| Average AMD Ryzen AI 9 HX 470 (117 - 122, n=7) | |
| Asus ExpertBook PM5 G2 PM5606 | |
| HP EliteBook 8 G1a 16 AI | |
| Lenovo ThinkPad T16 Gen 5 22AN001WGE | |
| Dynabook Tecra A60 A65-M | |
| Cinebench R23 / Multi Core | |
| Average AMD Ryzen AI 9 HX 470 (20813 - 23997, n=7) | |
| Asus ExpertBook PM5 G2 PM5606 | |
| Dell Pro 5 16 P516265 | |
| HP EliteBook 8 G1a 16 AI | |
| Dynabook Tecra A60 A65-M | |
| Average of class Office (1673 - 22808, n=79, last 2 years) | |
| Lenovo ThinkPad T16 Gen 5 22AN001WGE | |
| Cinebench R23 / Single Core | |
| Dell Pro 5 16 P516265 | |
| Average AMD Ryzen AI 9 HX 470 (2011 - 2091, n=7) | |
| Asus ExpertBook PM5 G2 PM5606 | |
| HP EliteBook 8 G1a 16 AI | |
| Average of class Office (708 - 2169, n=79, last 2 years) | |
| Lenovo ThinkPad T16 Gen 5 22AN001WGE | |
| Dynabook Tecra A60 A65-M | |
| Cinebench R20 / CPU (Multi Core) | |
| Average AMD Ryzen AI 9 HX 470 (8104 - 9354, n=7) | |
| Asus ExpertBook PM5 G2 PM5606 | |
| Dell Pro 5 16 P516265 | |
| HP EliteBook 8 G1a 16 AI | |
| Dynabook Tecra A60 A65-M | |
| Average of class Office (648 - 8840, n=78, last 2 years) | |
| Lenovo ThinkPad T16 Gen 5 22AN001WGE | |
| Cinebench R20 / CPU (Single Core) | |
| Dell Pro 5 16 P516265 | |
| Average AMD Ryzen AI 9 HX 470 (793 - 822, n=7) | |
| Asus ExpertBook PM5 G2 PM5606 | |
| HP EliteBook 8 G1a 16 AI | |
| Average of class Office (345 - 820, n=78, last 2 years) | |
| Dynabook Tecra A60 A65-M | |
| Lenovo ThinkPad T16 Gen 5 22AN001WGE | |
| Cinebench R15 / CPU Multi 64Bit | |
| Average AMD Ryzen AI 9 HX 470 (3068 - 3607, n=7) | |
| Asus ExpertBook PM5 G2 PM5606 | |
| Dell Pro 5 16 P516265 | |
| HP EliteBook 8 G1a 16 AI | |
| Dynabook Tecra A60 A65-M | |
| Average of class Office (250 - 3380, n=80, last 2 years) | |
| Lenovo ThinkPad T16 Gen 5 22AN001WGE | |
| Cinebench R15 / CPU Single 64Bit | |
| Dell Pro 5 16 P516265 | |
| Asus ExpertBook PM5 G2 PM5606 | |
| HP EliteBook 8 G1a 16 AI | |
| Average AMD Ryzen AI 9 HX 470 (192.7 - 322, n=7) | |
| Dynabook Tecra A60 A65-M | |
| Lenovo ThinkPad T16 Gen 5 22AN001WGE | |
| Average of class Office (99.5 - 323, n=80, last 2 years) | |
| Blender / v2.79 BMW27 CPU | |
| Average of class Office (154 - 1940, n=79, last 2 years) | |
| Lenovo ThinkPad T16 Gen 5 22AN001WGE | |
| Dynabook Tecra A60 A65-M | |
| HP EliteBook 8 G1a 16 AI | |
| Dell Pro 5 16 P516265 | |
| Asus ExpertBook PM5 G2 PM5606 | |
| Average AMD Ryzen AI 9 HX 470 (140 - 154, n=7) | |
| 7-Zip 18.03 / 7z b 4 | |
| Average AMD Ryzen AI 9 HX 470 (73258 - 84545, n=7) | |
| Asus ExpertBook PM5 G2 PM5606 | |
| Dell Pro 5 16 P516265 | |
| HP EliteBook 8 G1a 16 AI | |
| Dynabook Tecra A60 A65-M | |
| Average of class Office (7098 - 76886, n=80, last 2 years) | |
| Lenovo ThinkPad T16 Gen 5 22AN001WGE | |
| 7-Zip 18.03 / 7z b 4 -mmt1 | |
| Average AMD Ryzen AI 9 HX 470 (6244 - 6562, n=7) | |
| Asus ExpertBook PM5 G2 PM5606 | |
| Dell Pro 5 16 P516265 | |
| Dynabook Tecra A60 A65-M | |
| Lenovo ThinkPad T16 Gen 5 22AN001WGE | |
| HP EliteBook 8 G1a 16 AI | |
| Average of class Office (3387 - 6469, n=80, last 2 years) | |
| Geekbench 6.7 / Multi-Core | |
| Dell Pro 5 16 P516265 | |
| Average AMD Ryzen AI 9 HX 470 (11437 - 16116, n=10) | |
| HP EliteBook 8 G1a 16 AI | |
| Asus ExpertBook PM5 G2 PM5606 | |
| Average of class Office (757 - 17846, n=85, last 2 years) | |
| Dynabook Tecra A60 A65-M | |
| Lenovo ThinkPad T16 Gen 5 22AN001WGE | |
| Geekbench 6.7 / Single-Core | |
| Dell Pro 5 16 P516265 | |
| Average AMD Ryzen AI 9 HX 470 (2872 - 3000, n=10) | |
| Asus ExpertBook PM5 G2 PM5606 | |
| HP EliteBook 8 G1a 16 AI | |
| Average of class Office (462 - 2988, n=86, last 2 years) | |
| Lenovo ThinkPad T16 Gen 5 22AN001WGE | |
| Dynabook Tecra A60 A65-M | |
| Geekbench 5.5 / Multi-Core | |
| Dell Pro 5 16 P516265 | |
| Average AMD Ryzen AI 9 HX 470 (12418 - 16002, n=7) | |
| Asus ExpertBook PM5 G2 PM5606 | |
| HP EliteBook 8 G1a 16 AI | |
| Average of class Office (1483 - 16999, n=72, last 2 years) | |
| Dynabook Tecra A60 A65-M | |
| Lenovo ThinkPad T16 Gen 5 22AN001WGE | |
| Geekbench 5.5 / Single-Core | |
| Dell Pro 5 16 P516265 | |
| HP EliteBook 8 G1a 16 AI | |
| Average AMD Ryzen AI 9 HX 470 (1950 - 2193, n=7) | |
| Asus ExpertBook PM5 G2 PM5606 | |
| Average of class Office (811 - 2183, n=71, last 2 years) | |
| Lenovo ThinkPad T16 Gen 5 22AN001WGE | |
| Dynabook Tecra A60 A65-M | |
| HWBOT x265 Benchmark v2.2 / 4k Preset | |
| Average AMD Ryzen AI 9 HX 470 (23.6 - 28.5, n=7) | |
| Asus ExpertBook PM5 G2 PM5606 | |
| Dell Pro 5 16 P516265 | |
| HP EliteBook 8 G1a 16 AI | |
| Dynabook Tecra A60 A65-M | |
| Average of class Office (2.21 - 26, n=79, last 2 years) | |
| Lenovo ThinkPad T16 Gen 5 22AN001WGE | |
| LibreOffice / 20 Documents To PDF | |
| HP EliteBook 8 G1a 16 AI | |
| Average of class Office (39.1 - 102.3, n=79, last 2 years) | |
| Dynabook Tecra A60 A65-M | |
| Average AMD Ryzen AI 9 HX 470 (53.8 - 59.9, n=7) | |
| Lenovo ThinkPad T16 Gen 5 22AN001WGE | |
| Asus ExpertBook PM5 G2 PM5606 | |
| Dell Pro 5 16 P516265 | |
| R Benchmark 2.5 / Overall mean | |
| HP EliteBook 8 G1a 16 AI | |
| Average of class Office (0.393 - 0.888, n=79, last 2 years) | |
| Dynabook Tecra A60 A65-M | |
| Lenovo ThinkPad T16 Gen 5 22AN001WGE | |
| Average AMD Ryzen AI 9 HX 470 (0.3848 - 0.4157, n=7) | |
| Asus ExpertBook PM5 G2 PM5606 | |
| Dell Pro 5 16 P516265 | |
* ... smaller is better
AIDA64: FP32 Ray-Trace | FPU Julia | CPU SHA3 | CPU Queen | FPU SinJulia | FPU Mandel | CPU AES | CPU ZLib | FP64 Ray-Trace | CPU PhotoWorxx | CPU CheckMate
| Performance rating | |
| Average AMD Ryzen AI 9 HX 470 | |
| Asus ExpertBook PM5 G2 PM5606 -1! | |
| Dell Pro 5 16 P516265 -1! | |
| HP EliteBook 8 G1a 16 AI -1! | |
| Dynabook Tecra A60 A65-M -1! | |
| Average of class Office | |
| Lenovo ThinkPad T16 Gen 5 22AN001WGE -1! | |
| AIDA64 / FP32 Ray-Trace | |
| Average AMD Ryzen AI 9 HX 470 (31533 - 38491, n=11) | |
| Asus ExpertBook PM5 G2 PM5606 (v6.92.6600) | |
| Dell Pro 5 16 P516265 (v8.20.8100) | |
| HP EliteBook 8 G1a 16 AI (v6.92.6600) | |
| Dynabook Tecra A60 A65-M (v6.92.6600) | |
| Lenovo ThinkPad T16 Gen 5 22AN001WGE (v8.20.8100) | |
| Average of class Office (2083 - 34130, n=87, last 2 years) | |
| AIDA64 / FPU Julia | |
| Average AMD Ryzen AI 9 HX 470 (117908 - 152422, n=11) | |
| Asus ExpertBook PM5 G2 PM5606 (v6.92.6600) | |
| Dell Pro 5 16 P516265 (v8.20.8100) | |
| HP EliteBook 8 G1a 16 AI (v6.92.6600) | |
| Dynabook Tecra A60 A65-M (v6.92.6600) | |
| Lenovo ThinkPad T16 Gen 5 22AN001WGE (v8.20.8100) | |
| Average of class Office (8191 - 128729, n=87, last 2 years) | |
| AIDA64 / CPU SHA3 | |
| Average AMD Ryzen AI 9 HX 470 (5033 - 5821, n=11) | |
| Asus ExpertBook PM5 G2 PM5606 (v6.92.6600) | |
| Dell Pro 5 16 P516265 (v8.20.8100) | |
| Dynabook Tecra A60 A65-M (v6.92.6600) | |
| HP EliteBook 8 G1a 16 AI (v6.92.6600) | |
| Average of class Office (433 - 5755, n=87, last 2 years) | |
| Lenovo ThinkPad T16 Gen 5 22AN001WGE (v8.20.8100) | |
| AIDA64 / CPU Queen | |
| Dynabook Tecra A60 A65-M (v6.92.6600) | |
| Average AMD Ryzen AI 9 HX 470 (89114 - 100451, n=5) | |
| Asus ExpertBook PM5 G2 PM5606 (v6.92.6600) | |
| HP EliteBook 8 G1a 16 AI (v6.92.6600) | |
| Average of class Office (22784 - 115197, n=62, last 2 years) | |
| AIDA64 / FPU SinJulia | |
| Average AMD Ryzen AI 9 HX 470 (17575 - 19320, n=11) | |
| Asus ExpertBook PM5 G2 PM5606 (v6.92.6600) | |
| Dell Pro 5 16 P516265 (v8.20.8100) | |
| Dynabook Tecra A60 A65-M (v6.92.6600) | |
| HP EliteBook 8 G1a 16 AI (v6.92.6600) | |
| Lenovo ThinkPad T16 Gen 5 22AN001WGE (v8.20.8100) | |
| Average of class Office (1357 - 18575, n=87, last 2 years) | |
| AIDA64 / FPU Mandel | |
| Average AMD Ryzen AI 9 HX 470 (65448 - 78045, n=11) | |
| Asus ExpertBook PM5 G2 PM5606 (v6.92.6600) | |
| Dell Pro 5 16 P516265 (v8.20.8100) | |
| HP EliteBook 8 G1a 16 AI (v6.92.6600) | |
| Dynabook Tecra A60 A65-M (v6.92.6600) | |
| Lenovo ThinkPad T16 Gen 5 22AN001WGE (v8.20.8100) | |
| Average of class Office (4601 - 67977, n=87, last 2 years) | |
| AIDA64 / CPU AES | |
| Asus ExpertBook PM5 G2 PM5606 (v6.92.6600) | |
| Dell Pro 5 16 P516265 (v8.20.8100) | |
| Average AMD Ryzen AI 9 HX 470 (77849 - 117375, n=11) | |
| HP EliteBook 8 G1a 16 AI (v6.92.6600) | |
| Dynabook Tecra A60 A65-M (v6.92.6600) | |
| Average of class Office (4854 - 155900, n=87, last 2 years) | |
| Lenovo ThinkPad T16 Gen 5 22AN001WGE (v8.20.8100) | |
| AIDA64 / CPU ZLib | |
| Average AMD Ryzen AI 9 HX 470 (1305 - 1549, n=11) | |
| Asus ExpertBook PM5 G2 PM5606 (v6.92.6600) | |
| Dell Pro 5 16 P516265 (v8.20.8100) | |
| HP EliteBook 8 G1a 16 AI (v6.92.6600) | |
| Dynabook Tecra A60 A65-M (v6.92.6600) | |
| Average of class Office (114.6 - 1407, n=87, last 2 years) | |
| Lenovo ThinkPad T16 Gen 5 22AN001WGE (v8.20.8100) | |
| AIDA64 / FP64 Ray-Trace | |
| Average AMD Ryzen AI 9 HX 470 (16524 - 20313, n=11) | |
| Asus ExpertBook PM5 G2 PM5606 (v6.92.6600) | |
| Dell Pro 5 16 P516265 (v8.20.8100) | |
| HP EliteBook 8 G1a 16 AI (v6.92.6600) | |
| Dynabook Tecra A60 A65-M (v6.92.6600) | |
| Lenovo ThinkPad T16 Gen 5 22AN001WGE (v8.20.8100) | |
| Average of class Office (1109 - 18334, n=87, last 2 years) | |
| AIDA64 / CPU PhotoWorxx | |
| Dell Pro 5 16 P516265 (v8.20.8100) | |
| HP EliteBook 8 G1a 16 AI (v6.92.6600) | |
| Average of class Office (11090 - 84065, n=87, last 2 years) | |
| Average AMD Ryzen AI 9 HX 470 (23851 - 54302, n=11) | |
| Asus ExpertBook PM5 G2 PM5606 (v6.92.6600) | |
| Dynabook Tecra A60 A65-M (v6.92.6600) | |
| Lenovo ThinkPad T16 Gen 5 22AN001WGE (v8.20.8100) | |
| AIDA64 / CPU CheckMate | |
| Average AMD Ryzen AI 9 HX 470 (7672 - 8080, n=6) | |
| Dell Pro 5 16 P516265 (v8.20.8100) | |
| Lenovo ThinkPad T16 Gen 5 22AN001WGE (v8.20.8100) | |
| Average of class Office (377 - 7017, n=24, last 2 years) | |
System and Storage Performance
Asus includes a PCIe 4.0 SSD (M.2-2280), which, in our test unit, is made by Western Digital and offers only 512 GB of storage (398 GB free). Performance is decent and consistent, which is why the system itself responds quickly. However, 16 GB of RAM can become a bottleneck relatively quickly when running complex apps or multiple applications simultaneously.
PCMark 10: Score | Essentials | Productivity | Digital Content Creation
CrossMark: Overall | Productivity | Creativity | Responsiveness
WebXPRT 3: Overall
WebXPRT 4: Overall
Mozilla Kraken 1.1: Total
| Performance rating | |
| Dell Pro 5 16 P516265 | |
| Average AMD Ryzen AI 9 HX 470, AMD Radeon 890M | |
| Asus ExpertBook PM5 G2 PM5606 | |
| HP EliteBook 8 G1a 16 AI | |
| Average of class Office | |
| Dynabook Tecra A60 A65-M | |
| Lenovo ThinkPad T16 Gen 5 22AN001WGE | |
| PCMark 10 / Score | |
| Asus ExpertBook PM5 G2 PM5606 | |
| Dell Pro 5 16 P516265 | |
| Average AMD Ryzen AI 9 HX 470, AMD Radeon 890M (7221 - 8791, n=6) | |
| HP EliteBook 8 G1a 16 AI | |
| Dynabook Tecra A60 A65-M | |
| Average of class Office (2601 - 10456, n=70, last 2 years) | |
| Lenovo ThinkPad T16 Gen 5 22AN001WGE | |
| PCMark 10 / Essentials | |
| HP EliteBook 8 G1a 16 AI | |
| Dell Pro 5 16 P516265 | |
| Asus ExpertBook PM5 G2 PM5606 | |
| Average AMD Ryzen AI 9 HX 470, AMD Radeon 890M (9704 - 10841, n=6) | |
| Average of class Office (3245 - 11715, n=70, last 2 years) | |
| Dynabook Tecra A60 A65-M | |
| Lenovo ThinkPad T16 Gen 5 22AN001WGE | |
| PCMark 10 / Productivity | |
| Asus ExpertBook PM5 G2 PM5606 | |
| Dell Pro 5 16 P516265 | |
| Average AMD Ryzen AI 9 HX 470, AMD Radeon 890M (9899 - 16696, n=6) | |
| Dynabook Tecra A60 A65-M | |
| Lenovo ThinkPad T16 Gen 5 22AN001WGE | |
| HP EliteBook 8 G1a 16 AI | |
| Average of class Office (5336 - 18738, n=70, last 2 years) | |
| PCMark 10 / Digital Content Creation | |
| Average AMD Ryzen AI 9 HX 470, AMD Radeon 890M (9999 - 12005, n=6) | |
| Asus ExpertBook PM5 G2 PM5606 | |
| Dell Pro 5 16 P516265 | |
| HP EliteBook 8 G1a 16 AI | |
| Average of class Office (2049 - 14129, n=70, last 2 years) | |
| Dynabook Tecra A60 A65-M | |
| Lenovo ThinkPad T16 Gen 5 22AN001WGE | |
| CrossMark / Overall | |
| Dell Pro 5 16 P516265 | |
| HP EliteBook 8 G1a 16 AI | |
| Average AMD Ryzen AI 9 HX 470, AMD Radeon 890M (1371 - 1869, n=6) | |
| Average of class Office (381 - 2172, n=78, last 2 years) | |
| Lenovo ThinkPad T16 Gen 5 22AN001WGE | |
| Dynabook Tecra A60 A65-M | |
| Asus ExpertBook PM5 G2 PM5606 | |
| CrossMark / Productivity | |
| Dell Pro 5 16 P516265 | |
| HP EliteBook 8 G1a 16 AI | |
| Average AMD Ryzen AI 9 HX 470, AMD Radeon 890M (1212 - 1703, n=6) | |
| Lenovo ThinkPad T16 Gen 5 22AN001WGE | |
| Average of class Office (464 - 1979, n=78, last 2 years) | |
| Dynabook Tecra A60 A65-M | |
| Asus ExpertBook PM5 G2 PM5606 | |
| CrossMark / Creativity | |
| Dell Pro 5 16 P516265 | |
| Average AMD Ryzen AI 9 HX 470, AMD Radeon 890M (1689 - 2211, n=6) | |
| HP EliteBook 8 G1a 16 AI | |
| Average of class Office (319 - 2479, n=78, last 2 years) | |
| Asus ExpertBook PM5 G2 PM5606 | |
| Lenovo ThinkPad T16 Gen 5 22AN001WGE | |
| Dynabook Tecra A60 A65-M | |
| CrossMark / Responsiveness | |
| Dell Pro 5 16 P516265 | |
| HP EliteBook 8 G1a 16 AI | |
| Average AMD Ryzen AI 9 HX 470, AMD Radeon 890M (942 - 1500, n=6) | |
| Average of class Office (360 - 1996, n=78, last 2 years) | |
| Dynabook Tecra A60 A65-M | |
| Lenovo ThinkPad T16 Gen 5 22AN001WGE | |
| Asus ExpertBook PM5 G2 PM5606 | |
| WebXPRT 3 / Overall | |
| Dell Pro 5 16 P516265 | |
| Asus ExpertBook PM5 G2 PM5606 | |
| Average AMD Ryzen AI 9 HX 470, AMD Radeon 890M (285 - 331, n=6) | |
| Lenovo ThinkPad T16 Gen 5 22AN001WGE | |
| Average of class Office (129.9 - 444, n=79, last 2 years) | |
| Dynabook Tecra A60 A65-M | |
| HP EliteBook 8 G1a 16 AI | |
| WebXPRT 4 / Overall | |
| Dell Pro 5 16 P516265 | |
| Asus ExpertBook PM5 G2 PM5606 | |
| Average AMD Ryzen AI 9 HX 470, AMD Radeon 890M (238 - 279, n=6) | |
| Lenovo ThinkPad T16 Gen 5 22AN001WGE | |
| Average of class Office (104.2 - 313, n=81, last 2 years) | |
| Dynabook Tecra A60 A65-M | |
| HP EliteBook 8 G1a 16 AI | |
| Mozilla Kraken 1.1 / Total | |
| HP EliteBook 8 G1a 16 AI | |
| Average of class Office (391 - 1297, n=81, last 2 years) | |
| Dynabook Tecra A60 A65-M | |
| Lenovo ThinkPad T16 Gen 5 22AN001WGE | |
| Asus ExpertBook PM5 G2 PM5606 | |
| Average AMD Ryzen AI 9 HX 470, AMD Radeon 890M (414 - 444, n=6) | |
| Dell Pro 5 16 P516265 | |
* ... smaller is better
| PCMark 10 Score | 8765 points | |
Help | ||
| AIDA64 / Memory Copy | |
| Dell Pro 5 16 P516265 | |
| HP EliteBook 8 G1a 16 AI | |
| Average of class Office (20075 - 116863, n=84, last 2 years) | |
| Average AMD Ryzen AI 9 HX 470 (38489 - 86767, n=11) | |
| Asus ExpertBook PM5 G2 PM5606 | |
| Dynabook Tecra A60 A65-M | |
| Lenovo ThinkPad T16 Gen 5 22AN001WGE | |
| AIDA64 / Memory Read | |
| Dell Pro 5 16 P516265 | |
| Average of class Office (10084 - 128030, n=85, last 2 years) | |
| Average AMD Ryzen AI 9 HX 470 (39901 - 93860, n=11) | |
| HP EliteBook 8 G1a 16 AI | |
| Asus ExpertBook PM5 G2 PM5606 | |
| Lenovo ThinkPad T16 Gen 5 22AN001WGE | |
| Dynabook Tecra A60 A65-M | |
| AIDA64 / Memory Write | |
| HP EliteBook 8 G1a 16 AI | |
| Dell Pro 5 16 P516265 | |
| Average of class Office (20073 - 120952, n=85, last 2 years) | |
| Average AMD Ryzen AI 9 HX 470 (40283 - 118364, n=11) | |
| Dynabook Tecra A60 A65-M | |
| Lenovo ThinkPad T16 Gen 5 22AN001WGE | |
| Asus ExpertBook PM5 G2 PM5606 | |
| AIDA64 / Memory Latency | |
| Lenovo ThinkPad T16 Gen 5 22AN001WGE | |
| HP EliteBook 8 G1a 16 AI | |
| Average of class Office (7.6 - 162.9, n=79, last 2 years) | |
| Dynabook Tecra A60 A65-M | |
| Dell Pro 5 16 P516265 | |
| Average AMD Ryzen AI 9 HX 470 (87.4 - 104.5, n=11) | |
| Asus ExpertBook PM5 G2 PM5606 | |
* ... smaller is better
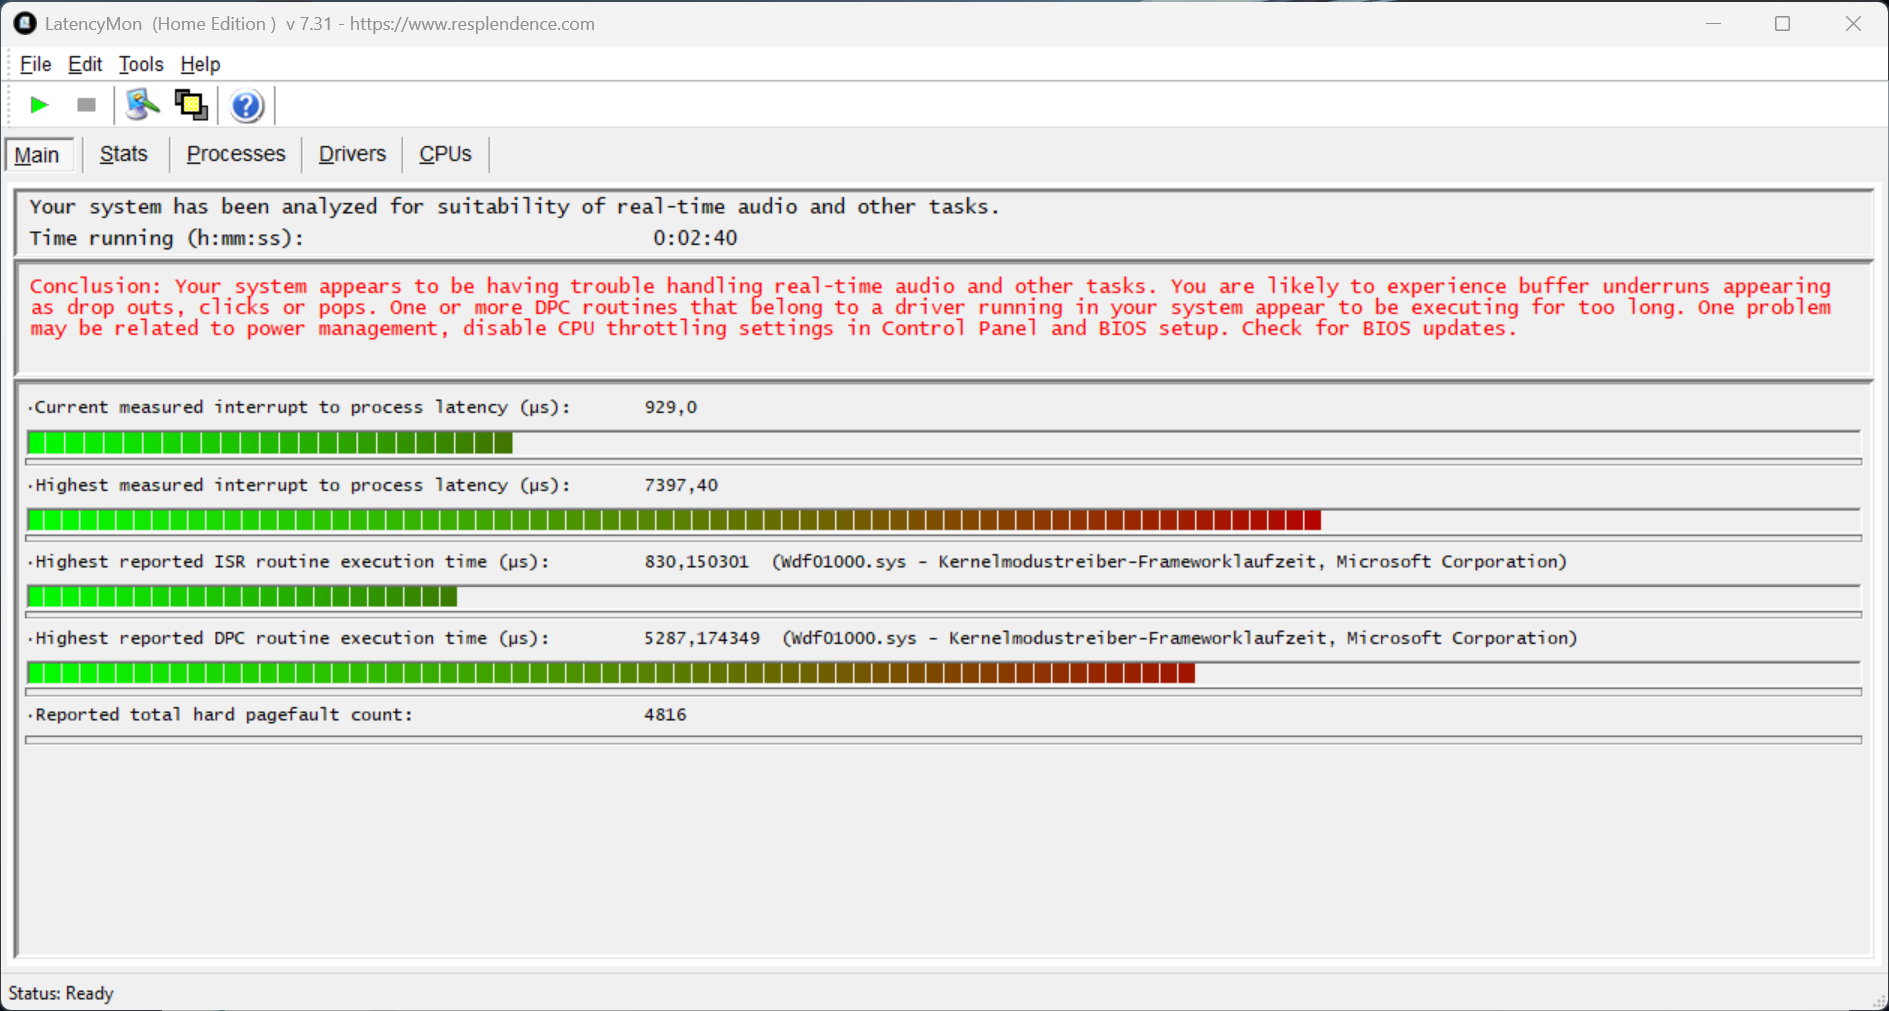
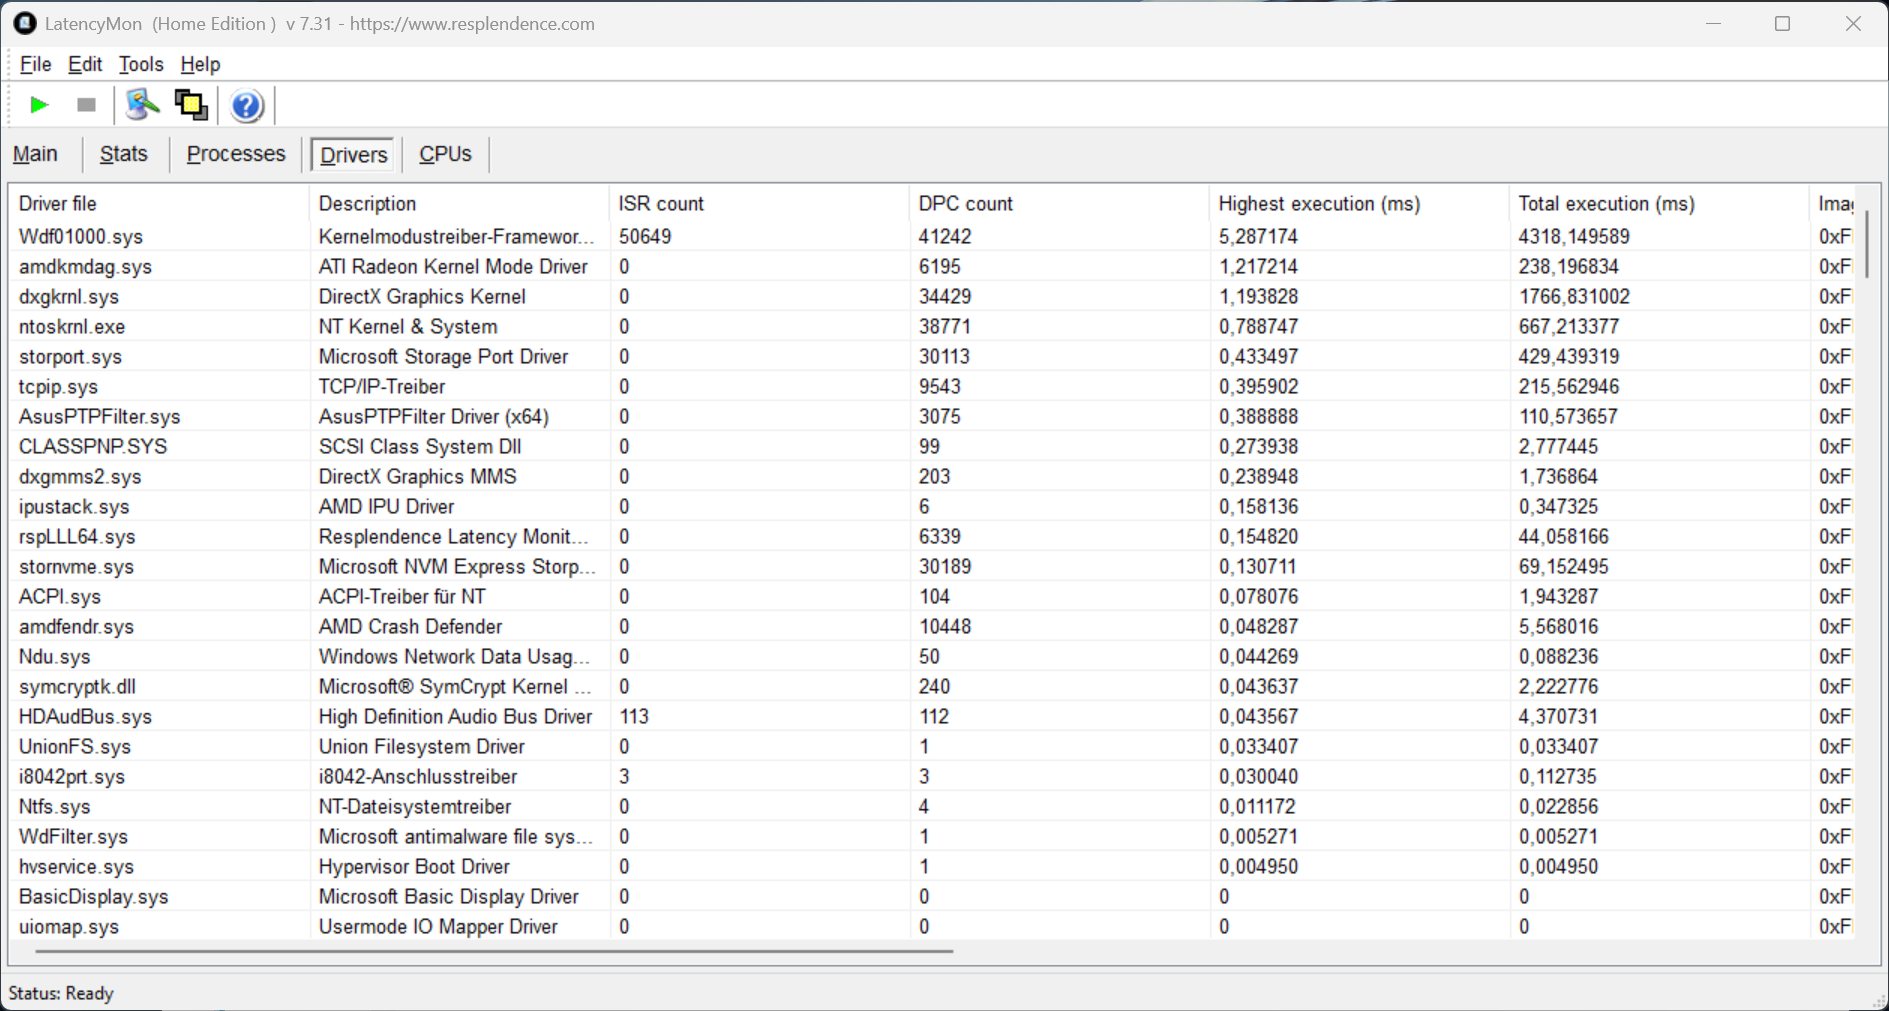
| DPC Latencies / LatencyMon - interrupt to process latency (max), Web, Youtube, Prime95 | |
| Asus ExpertBook PM5 G2 PM5606 | |
| Dell Pro 5 16 P516265 | |
| HP EliteBook 8 G1a 16 AI | |
| Average of class Office (226 - 98089, n=64, last 2 years) | |
| Dynabook Tecra A60 A65-M | |
| Lenovo ThinkPad T16 Gen 5 22AN001WGE | |
* ... smaller is better

* ... smaller is better
Sustained Read Performance: DiskSpd Read Loop, Queue Depth 8
GPU and Gaming Performance
The Radeon 890M is actually a fast integrated GPU, but on the test unit, its performance is limited by the single-channel memory configuration. This is, of course, sufficient for everyday office use, but anyone who likes to play a few games after work should install an additional RAM module.
| 3DMark 11 Performance | 9030 points | |
| 3DMark Fire Strike Score | 4953 points | |
| 3DMark Time Spy Score | 2331 points | |
| 3DMark Steel Nomad Score | 343 points | |
| 3DMark Steel Nomad Light Score | 2082 points | |
Help | ||
| Blender / v3.3 Classroom CPU | |
| Average of class Office (233 - 3219, n=78, last 2 years) | |
| Lenovo ThinkPad T16 Gen 5 22AN001WGE | |
| Dynabook Tecra A60 A65-M | |
| HP EliteBook 8 G1a 16 AI | |
| Average AMD Radeon 890M (211 - 475, n=31) | |
| Dell Pro 5 16 P516265 | |
| Asus ExpertBook PM5 G2 PM5606 | |
* ... smaller is better
| Performance rating - Percent | |
| Dell Pro 5 16 P516265 | |
| HP EliteBook 8 G1a 16 AI | |
| Average of class Office | |
| Asus ExpertBook PM5 G2 PM5606 | |
| Dynabook Tecra A60 A65-M | |
| Lenovo ThinkPad T16 Gen 5 22AN001WGE | |
| Cyberpunk 2077 - 1920x1080 Ultra Preset (FSR off) | |
| Dell Pro 5 16 P516265 | |
| Average of class Office (3.1 - 61.5, n=74, last 2 years) | |
| HP EliteBook 8 G1a 16 AI | |
| Asus ExpertBook PM5 G2 PM5606 | |
| Dynabook Tecra A60 A65-M | |
| Lenovo ThinkPad T16 Gen 5 22AN001WGE | |
| Baldur's Gate 3 - 1920x1080 Ultra Preset AA:T | |
| Dell Pro 5 16 P516265 | |
| HP EliteBook 8 G1a 16 AI | |
| Average of class Office (3.5 - 65.2, n=68, last 2 years) | |
| Asus ExpertBook PM5 G2 PM5606 | |
| Dynabook Tecra A60 A65-M | |
| Lenovo ThinkPad T16 Gen 5 22AN001WGE | |
| GTA V - 1920x1080 Highest AA:4xMSAA + FX AF:16x | |
| Dell Pro 5 16 P516265 | |
| HP EliteBook 8 G1a 16 AI | |
| Average of class Office (5.77 - 45.3, n=70, last 2 years) | |
| Asus ExpertBook PM5 G2 PM5606 | |
| Dynabook Tecra A60 A65-M | |
| Lenovo ThinkPad T16 Gen 5 22AN001WGE | |
| Final Fantasy XV Benchmark - 1920x1080 High Quality | |
| Dell Pro 5 16 P516265 | |
| HP EliteBook 8 G1a 16 AI | |
| Average of class Office (8.09 - 79.5, n=72, last 2 years) | |
| Asus ExpertBook PM5 G2 PM5606 | |
| Dynabook Tecra A60 A65-M | |
| Lenovo ThinkPad T16 Gen 5 22AN001WGE | |
| Strange Brigade - 1920x1080 ultra AA:ultra AF:16 | |
| Dell Pro 5 16 P516265 | |
| Average of class Office (12.9 - 142.1, n=56, last 2 years) | |
| HP EliteBook 8 G1a 16 AI | |
| Asus ExpertBook PM5 G2 PM5606 | |
| Dynabook Tecra A60 A65-M | |
| Lenovo ThinkPad T16 Gen 5 22AN001WGE | |
| Dota 2 Reborn - 1920x1080 ultra (3/3) best looking | |
| Dell Pro 5 16 P516265 | |
| HP EliteBook 8 G1a 16 AI | |
| Average of class Office (14.6 - 135, n=80, last 2 years) | |
| Dynabook Tecra A60 A65-M | |
| Asus ExpertBook PM5 G2 PM5606 | |
| Lenovo ThinkPad T16 Gen 5 22AN001WGE | |
| X-Plane 11.11 - 1920x1080 high (fps_test=3) | |
| Dell Pro 5 16 P516265 | |
| Asus ExpertBook PM5 G2 PM5606 | |
| HP EliteBook 8 G1a 16 AI | |
| Average of class Office (12 - 82.4, n=73, last 2 years) | |
| Dynabook Tecra A60 A65-M | |
| Lenovo ThinkPad T16 Gen 5 22AN001WGE | |
Cyberpunk 2077 Ultra FPS Chart
| low | med. | high | ultra | |
|---|---|---|---|---|
| GTA V (2015) | 139.9 | 119.5 | 36.4 | 14.4 |
| Dota 2 Reborn (2015) | 162.8 | 113.8 | 61.8 | 55.6 |
| Final Fantasy XV Benchmark (2018) | 46.8 | 24.1 | 17.8 | |
| X-Plane 11.11 (2018) | 67.8 | 51.4 | 41.4 | |
| Strange Brigade (2018) | 98.9 | 34.3 | 29.9 | 26 |
| Baldur's Gate 3 (2023) | 29.2 | 21.1 | 17.6 | 17.3 |
| Cyberpunk 2077 (2023) | 27.1 | 22.5 | 17 | 15 |
Emissions & Energy
Noise Emissions

The single fan is very quiet at idle but revs up quickly under load, especially in Performance mode. Here, the high TDP limit is problematic, and the noise level quickly reaches the maximum of ~48 dB(A)—which is quite loud for an office device. In Standard mode, the maximum is 39 dB(A), and in Whisper mode, the ExpertBook is barely audible at 29.1 dB(A), even during a stress test. The test unit produced no other electronic noise.
Noise level
| Idle |
| 24.7 / 24.7 / 24.7 dB(A) |
| Load |
| 47.8 / 47.8 dB(A) |
 | ||
30 dB silent 40 dB(A) audible 50 dB(A) loud |
||
min:  , med: , med:  , max: , max:  Earthworks M23R, Arta (15 cm distance) environment noise: 24.7 dB(A) Earthworks M23R, Arta (15 cm distance) environment noise: 24.7 dB(A) | ||
| Asus ExpertBook PM5 G2 PM5606 Ryzen AI 9 HX 470, Radeon 890M | Dell Pro 5 16 P516265 Ryzen AI 9 HX PRO 470, Radeon 890M | Lenovo ThinkPad T16 Gen 5 22AN001WGE R5 PRO 215, Radeon 740M | Dynabook Tecra A60 A65-M R7 250, Radeon 780M | HP EliteBook 8 G1a 16 AI Ryzen AI 7 PRO 350, Radeon 860M | |
|---|---|---|---|---|---|
| Noise | 6% | 13% | 12% | 3% | |
| off / environment * (dB) | 24.7 | 23 7% | 24.6 -0% | 22.6 9% | 22.7 8% |
| Idle Minimum * (dB) | 24.7 | 23.2 6% | 24.6 -0% | 22.8 8% | 22.8 8% |
| Idle Average * (dB) | 24.7 | 23.2 6% | 24.6 -0% | 22.9 7% | 22.8 8% |
| Idle Maximum * (dB) | 24.7 | 27 -9% | 26.4 -7% | 23.5 5% | 24.7 -0% |
| Load Average * (dB) | 47.8 | 34.1 29% | 28.6 40% | 35 27% | 46 4% |
| Cyberpunk 2077 ultra * (dB) | 47.8 | 46.5 3% | 34.2 28% | 41.1 14% | 48.7 -2% |
| Load Maximum * (dB) | 47.8 | 46.7 2% | 34.2 28% | 41.3 14% | 49.5 -4% |
* ... smaller is better
Temperature
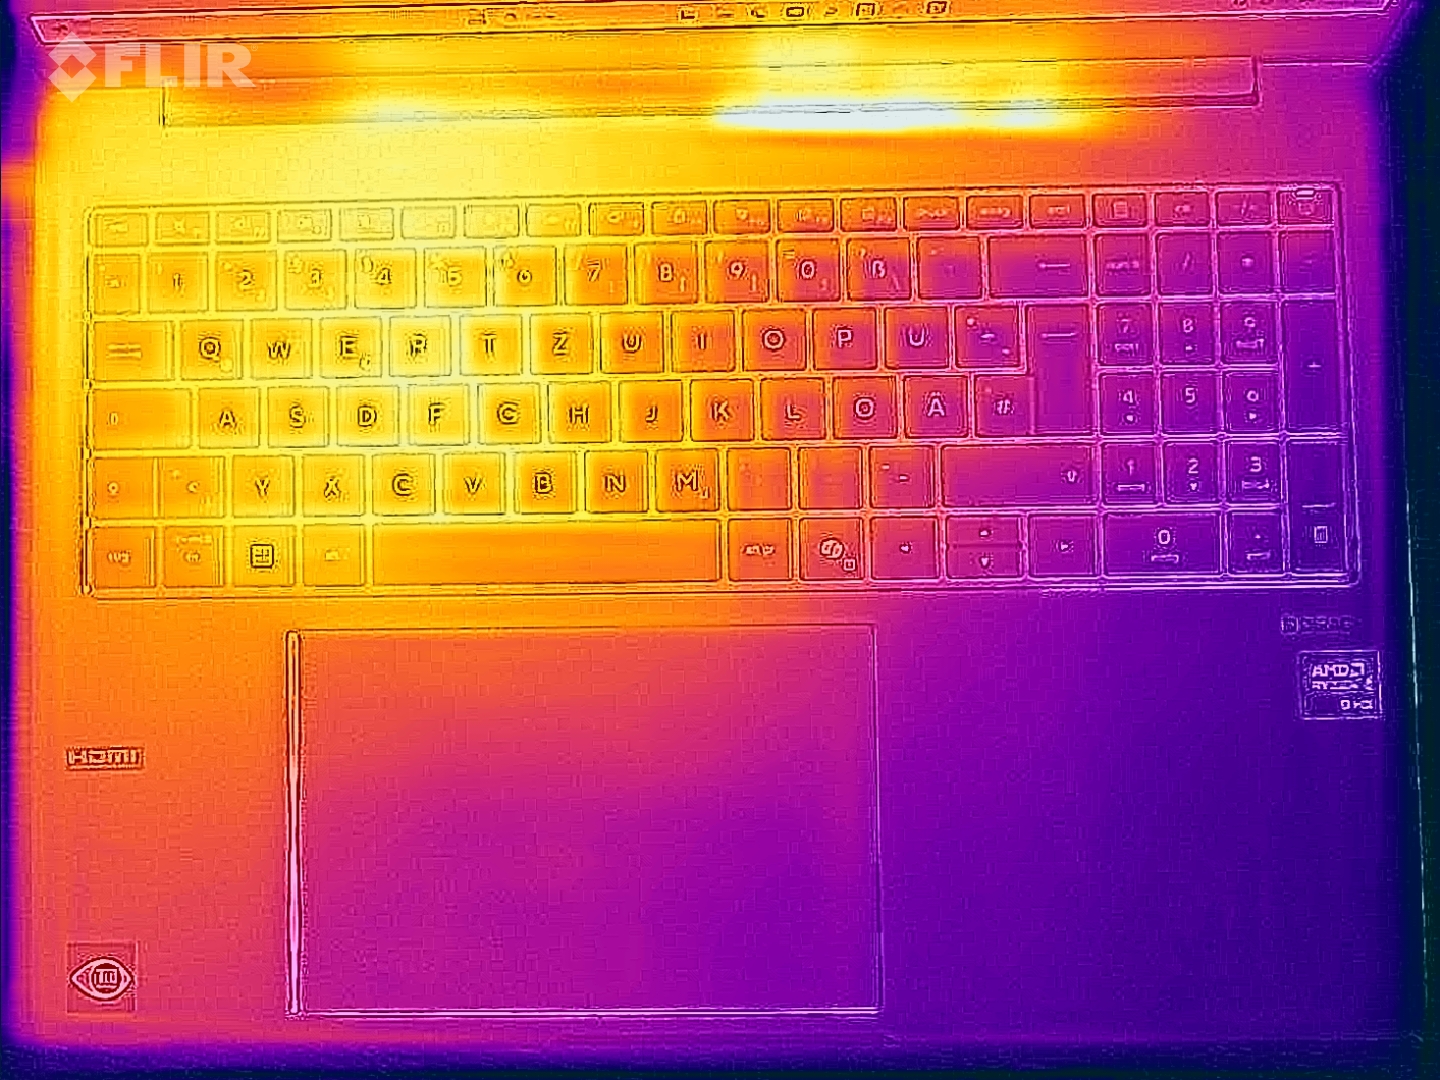
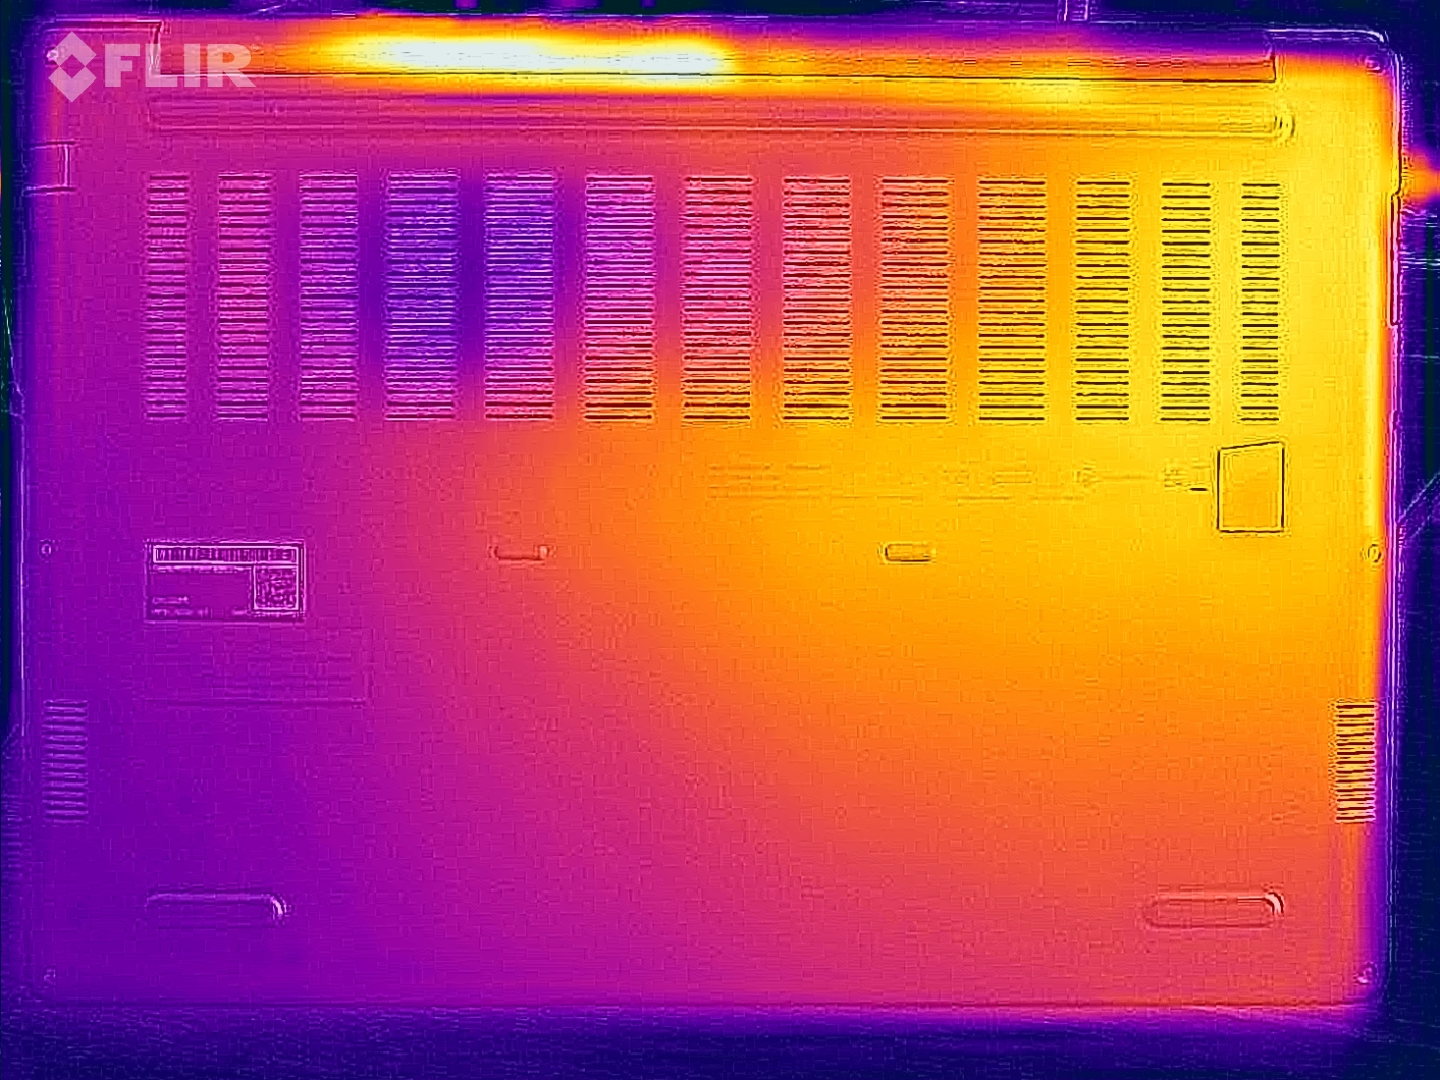
Due to the single fan, the left side of the base unit heats up the most, and during the stress test in Performance mode, we measured a temperature of just under 48 °C at one point on the underside (rear, center); direct skin contact should therefore be avoided in this area. Otherwise, however, there are no issues with temperatures. During the stress test, the processor briefly runs at 48 watts and then stabilizes at 45 watts (~82 °C).

(±) The maximum temperature on the upper side is 42.7 °C / 109 F, compared to the average of 34.4 °C / 94 F, ranging from 21.2 to 62.5 °C for the class Office.
(-) The bottom heats up to a maximum of 47.8 °C / 118 F, compared to the average of 36.8 °C / 98 F
(+) In idle usage, the average temperature for the upper side is 24.1 °C / 75 F, compared to the device average of 29.5 °C / 85 F.
(±) 3: The average temperature for the upper side is 35.8 °C / 96 F, compared to the average of 29.5 °C / 85 F for the class Office.
(+) The palmrests and touchpad are reaching skin temperature as a maximum (34.4 °C / 93.9 F) and are therefore not hot.
(-) The average temperature of the palmrest area of similar devices was 27.6 °C / 81.7 F (-6.8 °C / -12.2 F).
| Asus ExpertBook PM5 G2 PM5606 Ryzen AI 9 HX 470, Radeon 890M | Dell Pro 5 16 P516265 Ryzen AI 9 HX PRO 470, Radeon 890M | Lenovo ThinkPad T16 Gen 5 22AN001WGE R5 PRO 215, Radeon 740M | Dynabook Tecra A60 A65-M R7 250, Radeon 780M | HP EliteBook 8 G1a 16 AI Ryzen AI 7 PRO 350, Radeon 860M | |
|---|---|---|---|---|---|
| Heat | -2% | 5% | 8% | 4% | |
| Maximum Upper Side * (°C) | 42.7 | 41 4% | 37 13% | 35.8 16% | 38 11% |
| Maximum Bottom * (°C) | 47.8 | 39.2 18% | 40.9 14% | 36 25% | 33.4 30% |
| Idle Upper Side * (°C) | 24.9 | 28.4 -14% | 24.9 -0% | 25.6 -3% | 28 -12% |
| Idle Bottom * (°C) | 24.9 | 28.6 -15% | 26.4 -6% | 26.6 -7% | 28.2 -13% |
* ... smaller is better
Speaker
The stereo speakers offer surprisingly good sound quality, especially for a business device. However, its direct competitors are at a similarly high level.
Asus ExpertBook PM5 G2 PM5606 audio analysis
(±) | speaker loudness is average but good (76.9 dB)
Bass 100 - 315 Hz
(±) | reduced bass - on average 7.3% lower than median
(±) | linearity of bass is average (7.9% delta to prev. frequency)
Mids 400 - 2000 Hz
(+) | balanced mids - only 4% away from median
(+) | mids are linear (5.4% delta to prev. frequency)
Highs 2 - 16 kHz
(+) | balanced highs - only 2.1% away from median
(+) | highs are linear (3.9% delta to prev. frequency)
Overall 100 - 16.000 Hz
(+) | overall sound is linear (11.9% difference to median)
Compared to same class
» 5% of all tested devices in this class were better, 1% similar, 94% worse
» The best had a delta of 7%, average was 21%, worst was 53%
Compared to all devices tested
» 9% of all tested devices were better, 3% similar, 88% worse
» The best had a delta of 4%, average was 23%, worst was 136%
Dell Pro 5 16 P516265 audio analysis
(+) | speakers can play relatively loud (85.1 dB)
Bass 100 - 315 Hz
(±) | reduced bass - on average 14.1% lower than median
(±) | linearity of bass is average (10.5% delta to prev. frequency)
Mids 400 - 2000 Hz
(+) | balanced mids - only 2.9% away from median
(+) | mids are linear (5.3% delta to prev. frequency)
Highs 2 - 16 kHz
(+) | balanced highs - only 3.6% away from median
(+) | highs are linear (4.8% delta to prev. frequency)
Overall 100 - 16.000 Hz
(+) | overall sound is linear (12.7% difference to median)
Compared to same class
» 6% of all tested devices in this class were better, 2% similar, 92% worse
» The best had a delta of 7%, average was 21%, worst was 53%
Compared to all devices tested
» 12% of all tested devices were better, 3% similar, 85% worse
» The best had a delta of 4%, average was 23%, worst was 136%
Lenovo ThinkPad T16 Gen 5 22AN001WGE audio analysis
(±) | speaker loudness is average but good (80.9 dB)
Bass 100 - 315 Hz
(±) | reduced bass - on average 9.3% lower than median
(±) | linearity of bass is average (8.9% delta to prev. frequency)
Mids 400 - 2000 Hz
(+) | balanced mids - only 3.8% away from median
(+) | mids are linear (3.6% delta to prev. frequency)
Highs 2 - 16 kHz
(+) | balanced highs - only 2.8% away from median
(+) | highs are linear (5.3% delta to prev. frequency)
Overall 100 - 16.000 Hz
(+) | overall sound is linear (11% difference to median)
Compared to same class
» 2% of all tested devices in this class were better, 2% similar, 96% worse
» The best had a delta of 7%, average was 21%, worst was 53%
Compared to all devices tested
» 6% of all tested devices were better, 2% similar, 92% worse
» The best had a delta of 4%, average was 23%, worst was 136%
Dynabook Tecra A60 A65-M audio analysis
(+) | speakers can play relatively loud (82.5 dB)
Bass 100 - 315 Hz
(-) | nearly no bass - on average 17.3% lower than median
(±) | linearity of bass is average (11.4% delta to prev. frequency)
Mids 400 - 2000 Hz
(+) | balanced mids - only 2.4% away from median
(+) | mids are linear (3.3% delta to prev. frequency)
Highs 2 - 16 kHz
(+) | balanced highs - only 3.2% away from median
(+) | highs are linear (1.7% delta to prev. frequency)
Overall 100 - 16.000 Hz
(+) | overall sound is linear (12.5% difference to median)
Compared to same class
» 6% of all tested devices in this class were better, 2% similar, 92% worse
» The best had a delta of 7%, average was 21%, worst was 53%
Compared to all devices tested
» 11% of all tested devices were better, 2% similar, 86% worse
» The best had a delta of 4%, average was 23%, worst was 136%
HP EliteBook 8 G1a 16 AI audio analysis
(+) | speakers can play relatively loud (86.7 dB)
Bass 100 - 315 Hz
(±) | reduced bass - on average 11.4% lower than median
(±) | linearity of bass is average (10.8% delta to prev. frequency)
Mids 400 - 2000 Hz
(+) | balanced mids - only 4.4% away from median
(+) | mids are linear (4.6% delta to prev. frequency)
Highs 2 - 16 kHz
(+) | balanced highs - only 3% away from median
(+) | highs are linear (3.6% delta to prev. frequency)
Overall 100 - 16.000 Hz
(+) | overall sound is linear (9.2% difference to median)
Compared to same class
» 1% of all tested devices in this class were better, 0% similar, 99% worse
» The best had a delta of 7%, average was 21%, worst was 53%
Compared to all devices tested
» 3% of all tested devices were better, 1% similar, 96% worse
» The best had a delta of 4%, average was 23%, worst was 136%
Power Consumption and Battery Life


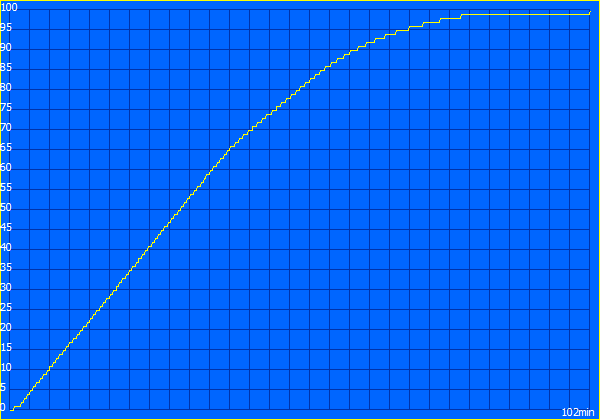
Power consumption measurements reveal no surprises; in idle mode, the device consumes between 4.3 and 10.7 watts, depending on brightness. Under load, we measured a maximum of 78 watts, so the included 90-watt power adapter is sufficiently rated. The 70-Wh battery delivers 10.5 to 12.5 hours of battery life in our Wi-Fi test (depending on brightness); only competitors with weaker displays last slightly longer here.
| Off / Standby | 0.37 / 0.58 Watt |
| Idle | 4.3 / 10.2 / 10.7 Watt |
| Load |
75.8 / 78.4 Watt |
   
| |
Key:
min: ,
med: ,
max: Metrahit Energy | |
Power Consumption in Cyberpunk / Stress Test
Power consumption with an external monitor
Notebookcheck Overall Rating
Asus ExpertBook PM5 G2 PM5606
- 08/13/2026 v8
Andreas Osthoff
 Total Sustainability Score:
 Possible Alternatives Comparison
Image | Model / Review | Price | Weight | Height | Display |
|---|---|---|---|---|---|
1. 84.7%  | Asus ExpertBook PM5 G2 PM5606 AMD Ryzen AI 9 HX 470 ⎘ AMD Radeon 890M ⎘ 16 GB Memory, 512 GB SSD | List Price: 1700€ | 1.8 kg | 18 mm | 16.00" 2560x1600 189 PPI IPS |
2. 83.4%  | Dell Pro 5 16 P516265 AMD Ryzen AI 9 HX PRO 470 ⎘ AMD Radeon 890M ⎘ 64 GB Memory, 1024 GB SSD | List Price: 4500 USD | 2 kg | 18.95 mm | 16.00" 2560x1600 189 PPI IPS |
3. 86.9%  | Lenovo ThinkPad T16 Gen 5 22AN001WGE AMD Ryzen 5 PRO 215 ⎘ AMD Radeon 740M ⎘ 16 GB Memory, 512 GB SSD | Amazon: 1. $1,799.95 Lenovo ThinkPad T16 Gen 4 Bu... 2. $1,099.99 Lenovo ThinkPad T16 Gen 4 La... 3. $1,699.95 Lenovo ThinkPad T16 Gen 4 In... List Price: 1640€ | 1.9 kg | 18.2 mm | 16.00" 1920x1200 142 PPI IPS |
4. 83.7%  | Dynabook Tecra A60 A65-M AMD Ryzen 7 250 ⎘ AMD Radeon 780M ⎘ 16 GB Memory, 512 GB SSD | Amazon: 1. $29.99 UL Charger for Dynabook Tecr... 2. $123.00 16.0" WUXGA 1920(RGB)*1200 f... 3. $1,209.00 dynabook Tecra A45-M 14” B... List Price: 1300 USD | 1.7 kg | 19.9 mm | 16.00" 1920x1200 142 PPI IPS |
5. 87%  | HP EliteBook 8 G1a 16 AI AMD Ryzen AI 7 PRO 350 ⎘ AMD Radeon 860M ⎘ 32 GB Memory, 512 GB SSD | List Price: 4400 USD | 1.9 kg | 15.5 mm | 16.00" 1920x1200 142 PPI IPS |
Transparency
The selection of devices to be reviewed is made by our editorial team. The test sample was provided to the author as a loan by the manufacturer or retailer for the purpose of this review. The lender had no influence on this review, nor did the manufacturer receive a copy of this review before publication. There was no obligation to publish this review. As an independent media company, Notebookcheck is not subjected to the authority of manufacturers, retailers or publishers.
This is how Notebookcheck is testing
Every year, Notebookcheck independently reviews hundreds of laptops and smartphones using standardized procedures to ensure that all results are comparable. We have continuously developed our test methods for around 20 years and set industry standards in the process. In our test labs, high-quality measuring equipment is utilized by experienced technicians and editors. These tests involve a multi-stage validation process. Our complex rating system is based on hundreds of well-founded measurements and benchmarks, which maintains objectivity. Further information on our test methods can be found here.
 Add as a preferred source on Google


