 Deutsch
 English
 Español
 Français
 Italiano
 Nederlands
 Polski
 Português
 Русский
 Türkçe
 Svenska
 Chinese
 Magyar
Samsung Galaxy Book3 Ultra 16 review: Enduring 16-inch ultrabook with RTX 4050
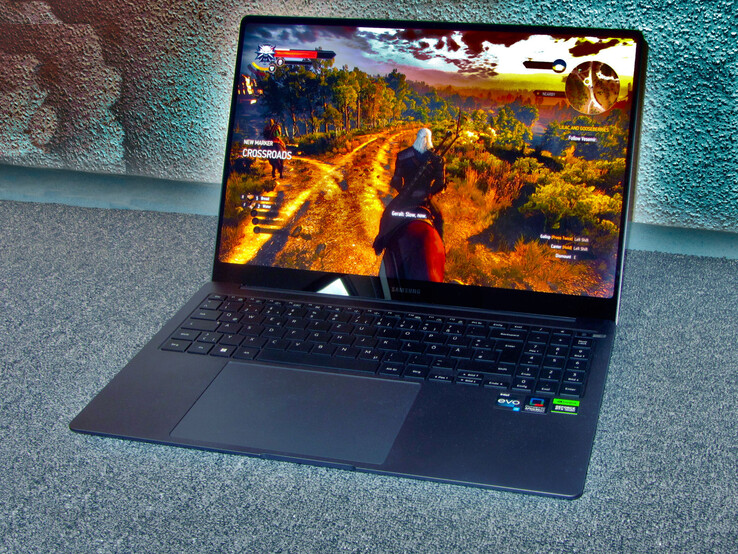
In the Galaxy Book 3 Ultra 16, Samsung introduces a combination of gaming notebook, workstation and laptop for creative workers, with a focus on mobility, ergonomics and low energy consumption. High performance is not required: the Core i7-13700H and the GeForce RTX 4050 are slowed down by conservative power limits, namely a low TGP (60 watts). A 100 watt power supply covers all hardware demands.
Competitors include devices such as the Schenker Vision 16 Pro, the LG Gram 17, the Dell XPS 15 9520, the Asus VivoBook Pro 16X OLED, the Acer Swift X SFX16-52G and the Lenovo ThinkBook 16p G3 ARH.
Possible competitors in comparison
Rating | Date | Model | Weight | Height | Size | Resolution | Best Price |
|---|---|---|---|---|---|---|---|
| 89.4 % | 04/2023 | Samsung Galaxy Book3 Ultra 16 i7-13700H, NVIDIA GeForce RTX 4050 Laptop GPU | 1.8 kg | 16.5 mm | 16.00" | 2880x1800 | |
| 87.8 % | 11/2022 | SCHENKER Vision 16 Pro RTX 3070 Ti i7-12700H, GeForce RTX 3070 Ti Laptop GPU | 1.7 kg | 17.1 mm | 16.00" | 2560x1600 | |
| 86.4 % | 03/2023 | LG Gram 17Z90Q-E.AD78G i7-1260P, GeForce RTX 2050 Mobile | 1.4 kg | 17.8 mm | 17.00" | 2560x1600 | |
| 87.9 % | 10/2022 | Lenovo ThinkBook 16p G3 ARH R9 6900HX, GeForce RTX 3060 Laptop GPU | 2.1 kg | 19.5 mm | 16.00" | 2560x1600 | |
| 89.5 % | 05/2022 | Dell XPS 15 9520 RTX 3050 Ti i7-12700H, GeForce RTX 3050 Ti Laptop GPU | 1.9 kg | 18 mm | 15.60" | 3456x2160 | |
| 83.7 % | 11/2022 | Asus VivoBook Pro 16X OLED N7600PC-L2026X i7-11370H, GeForce RTX 3050 4GB Laptop GPU | 2 kg | 18.9 mm | 16.00" | 3840x2400 | |
| 86.4 % | 11/2022 | Acer Swift X SFX16-52G-77RX i7-1260P, A370M | 1.8 kg | 21.2 mm | 16.00" | 2560x1600 |
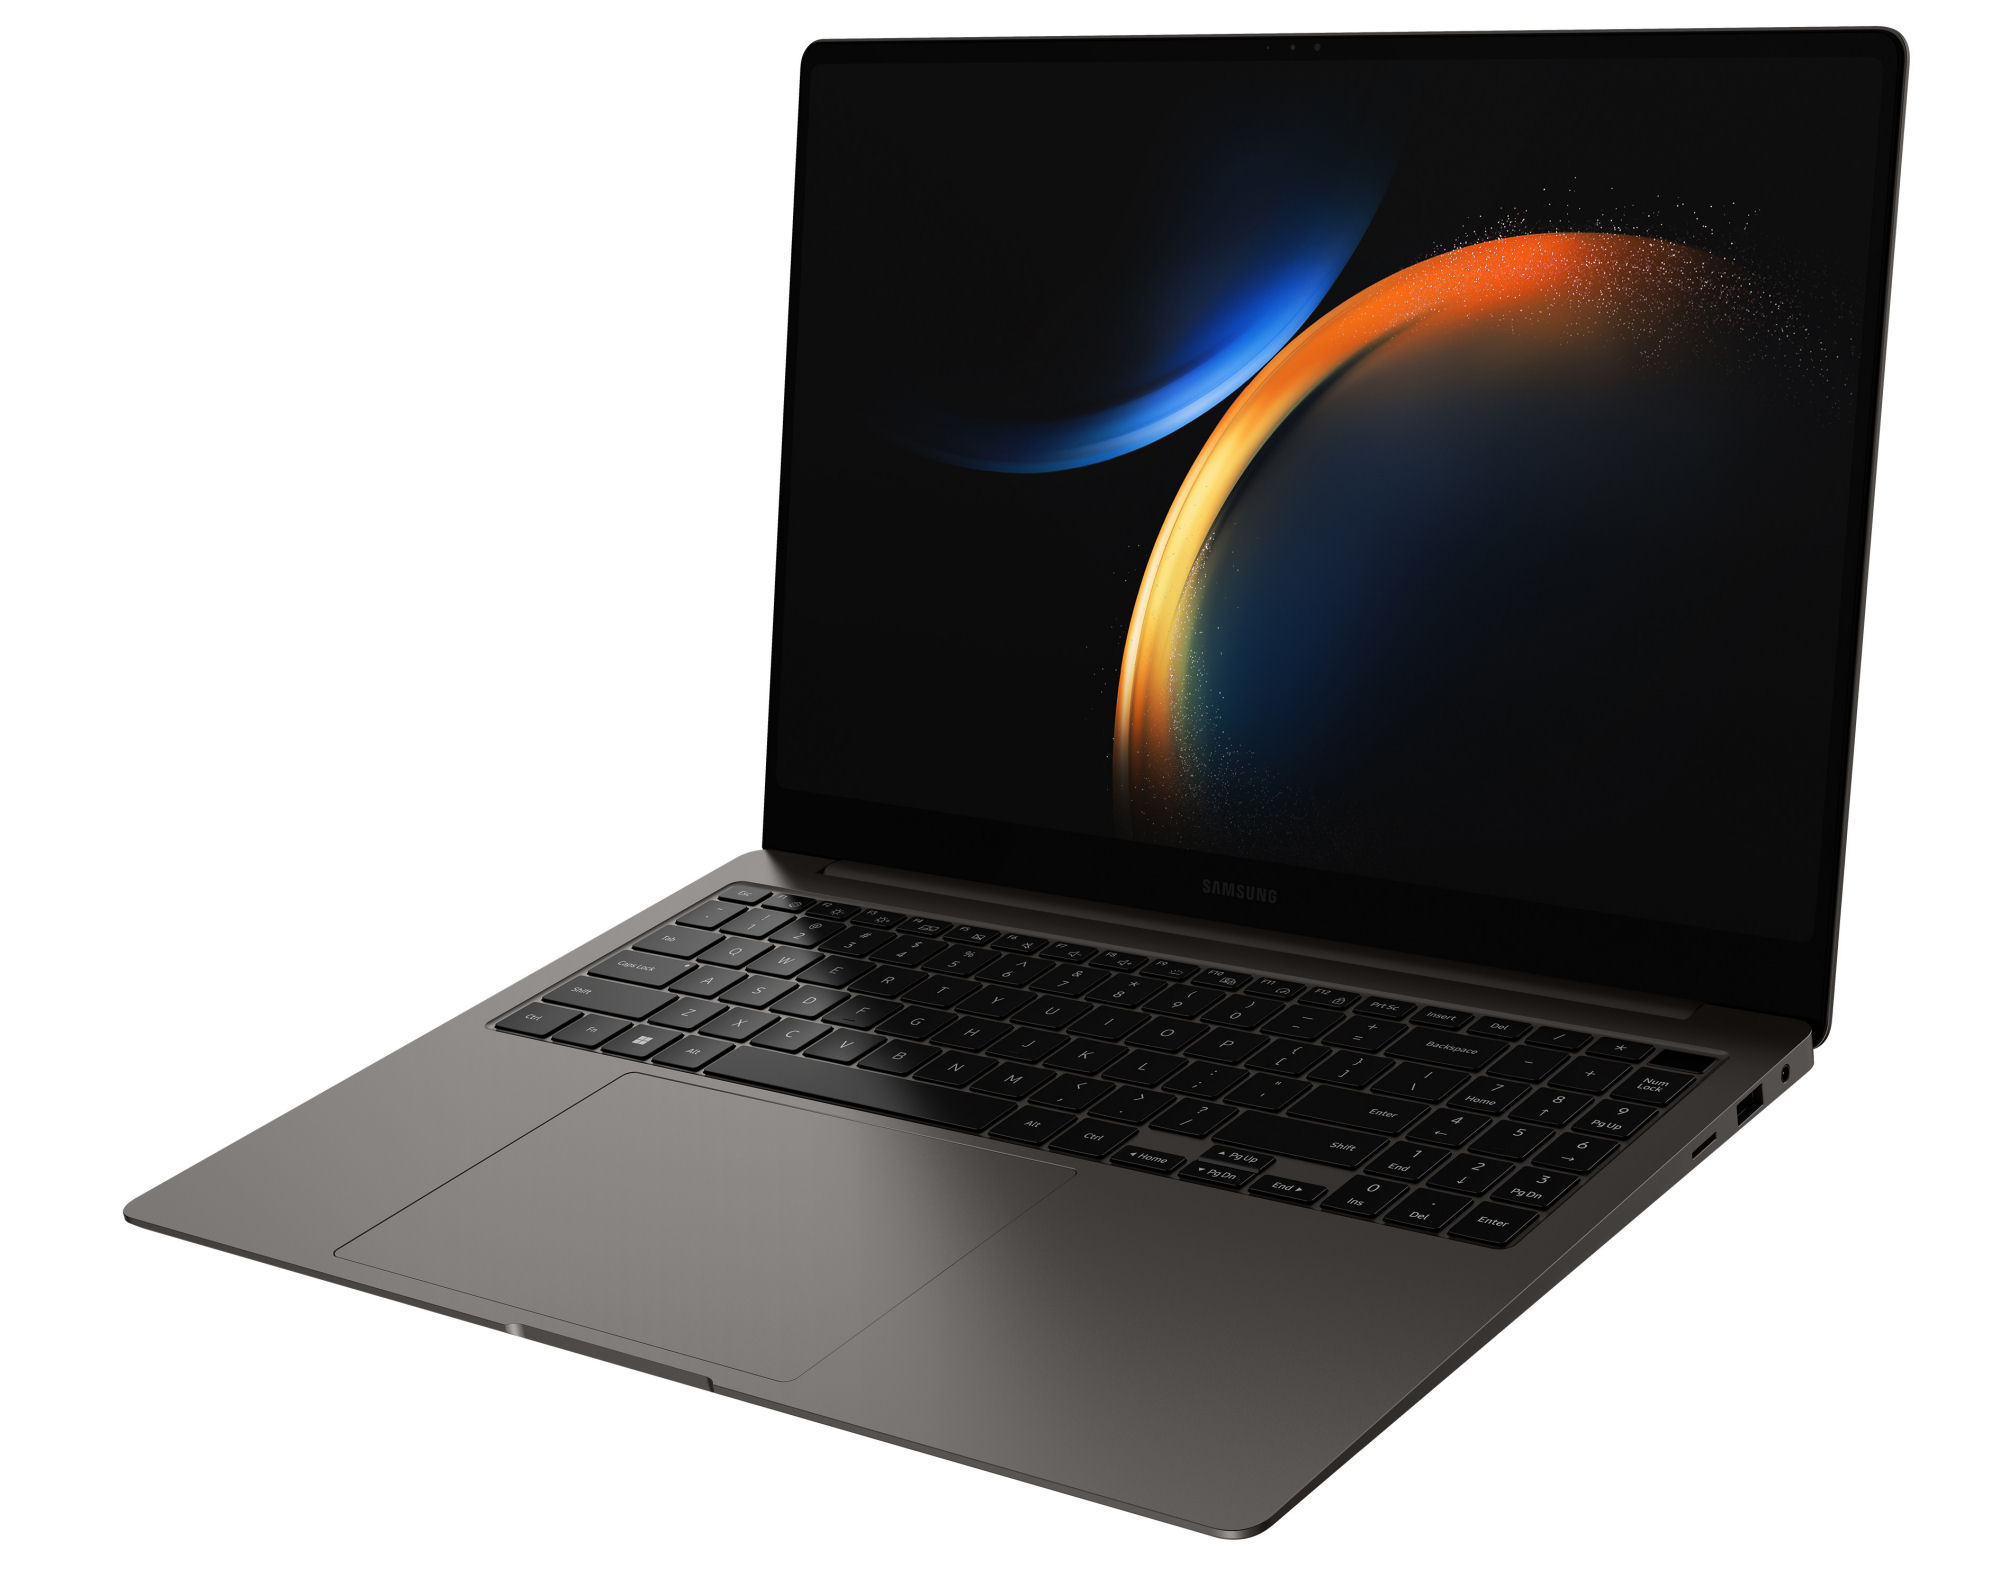
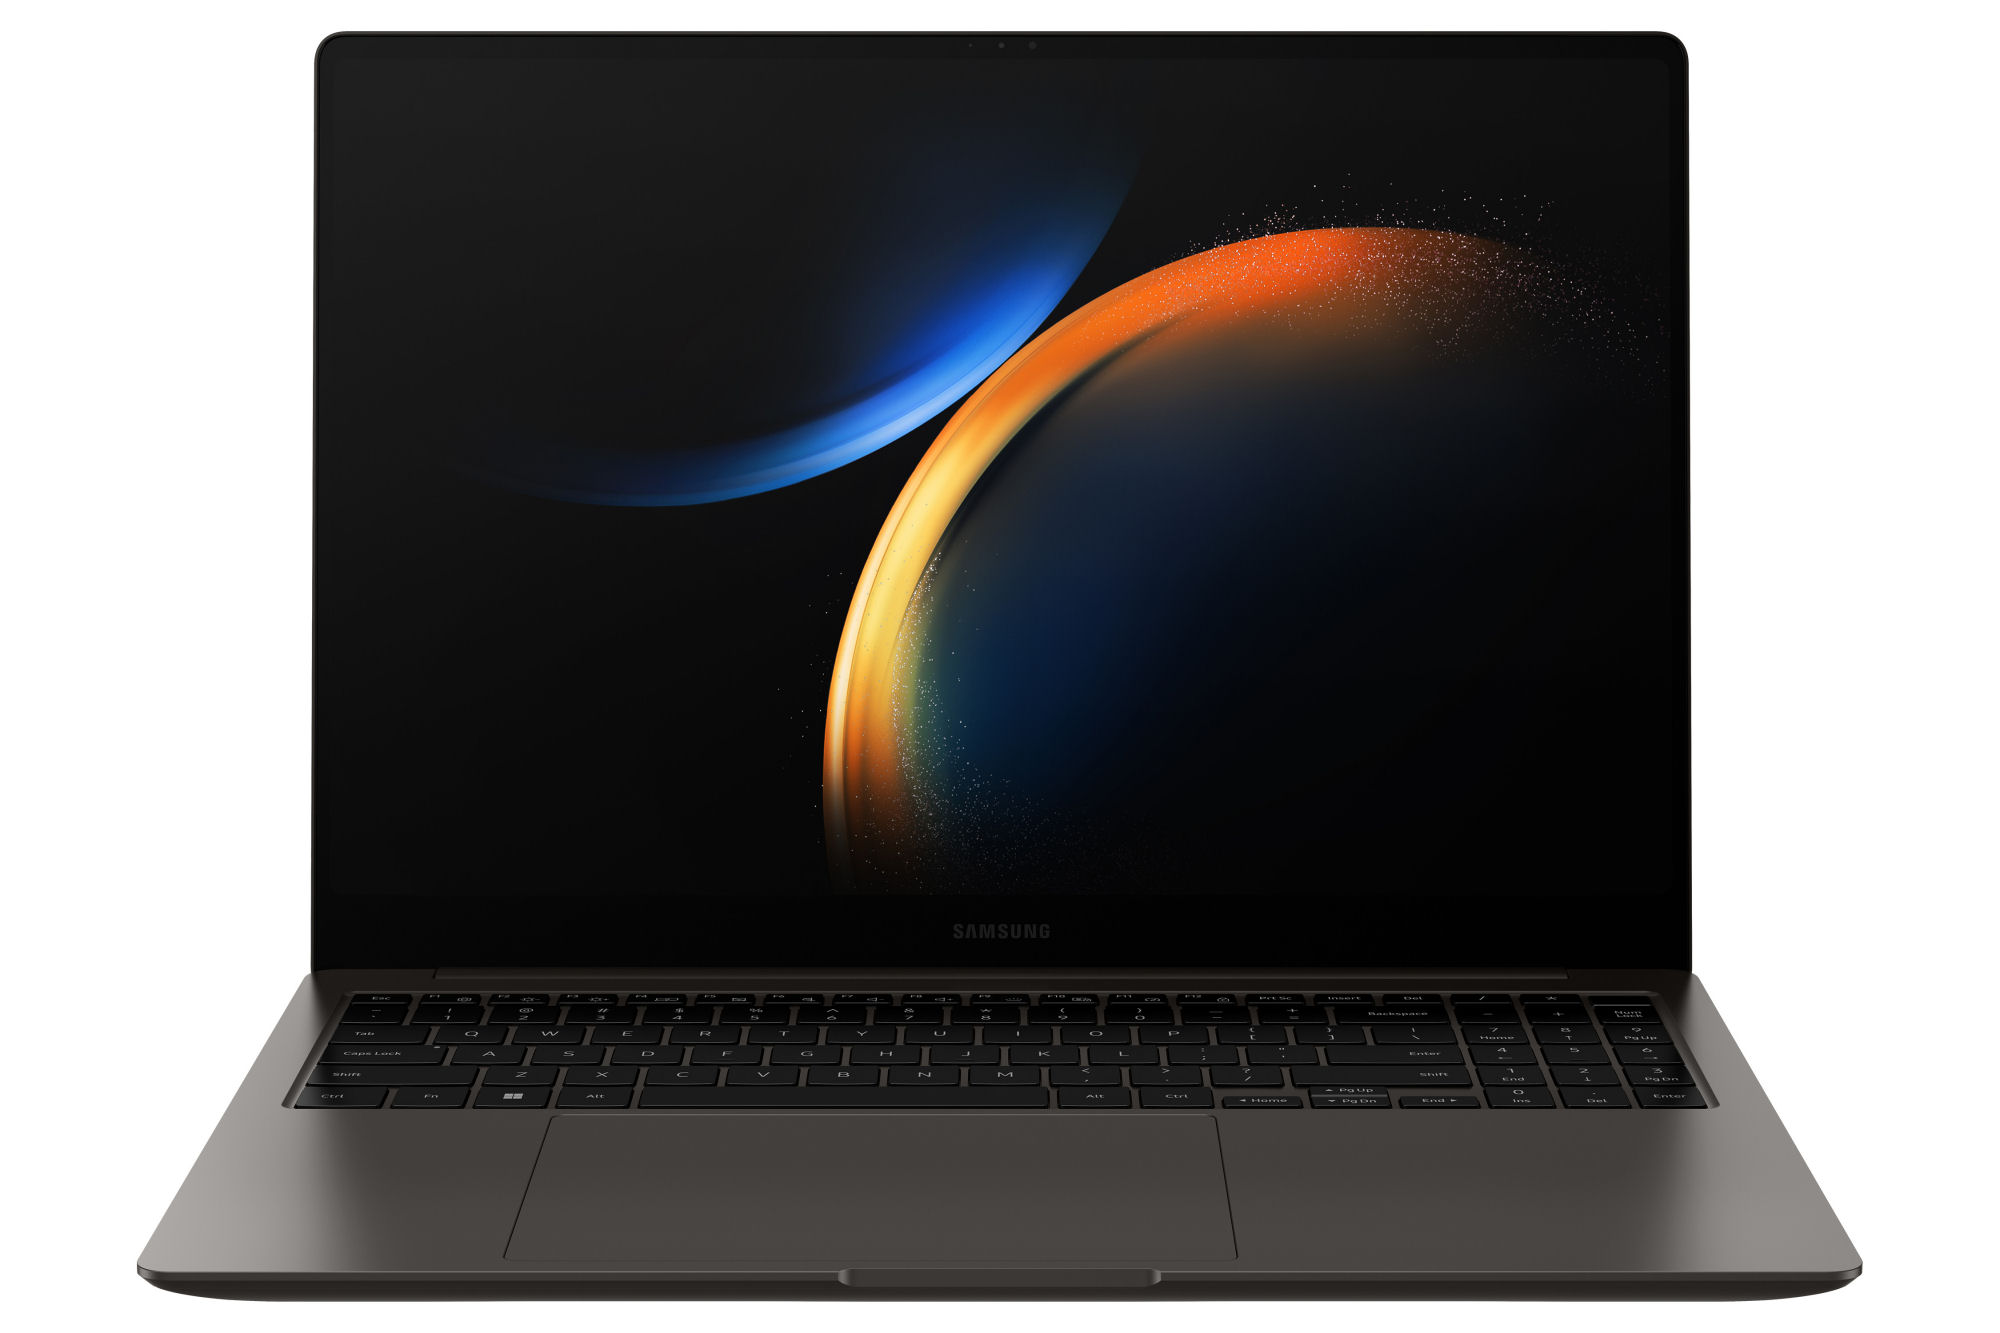
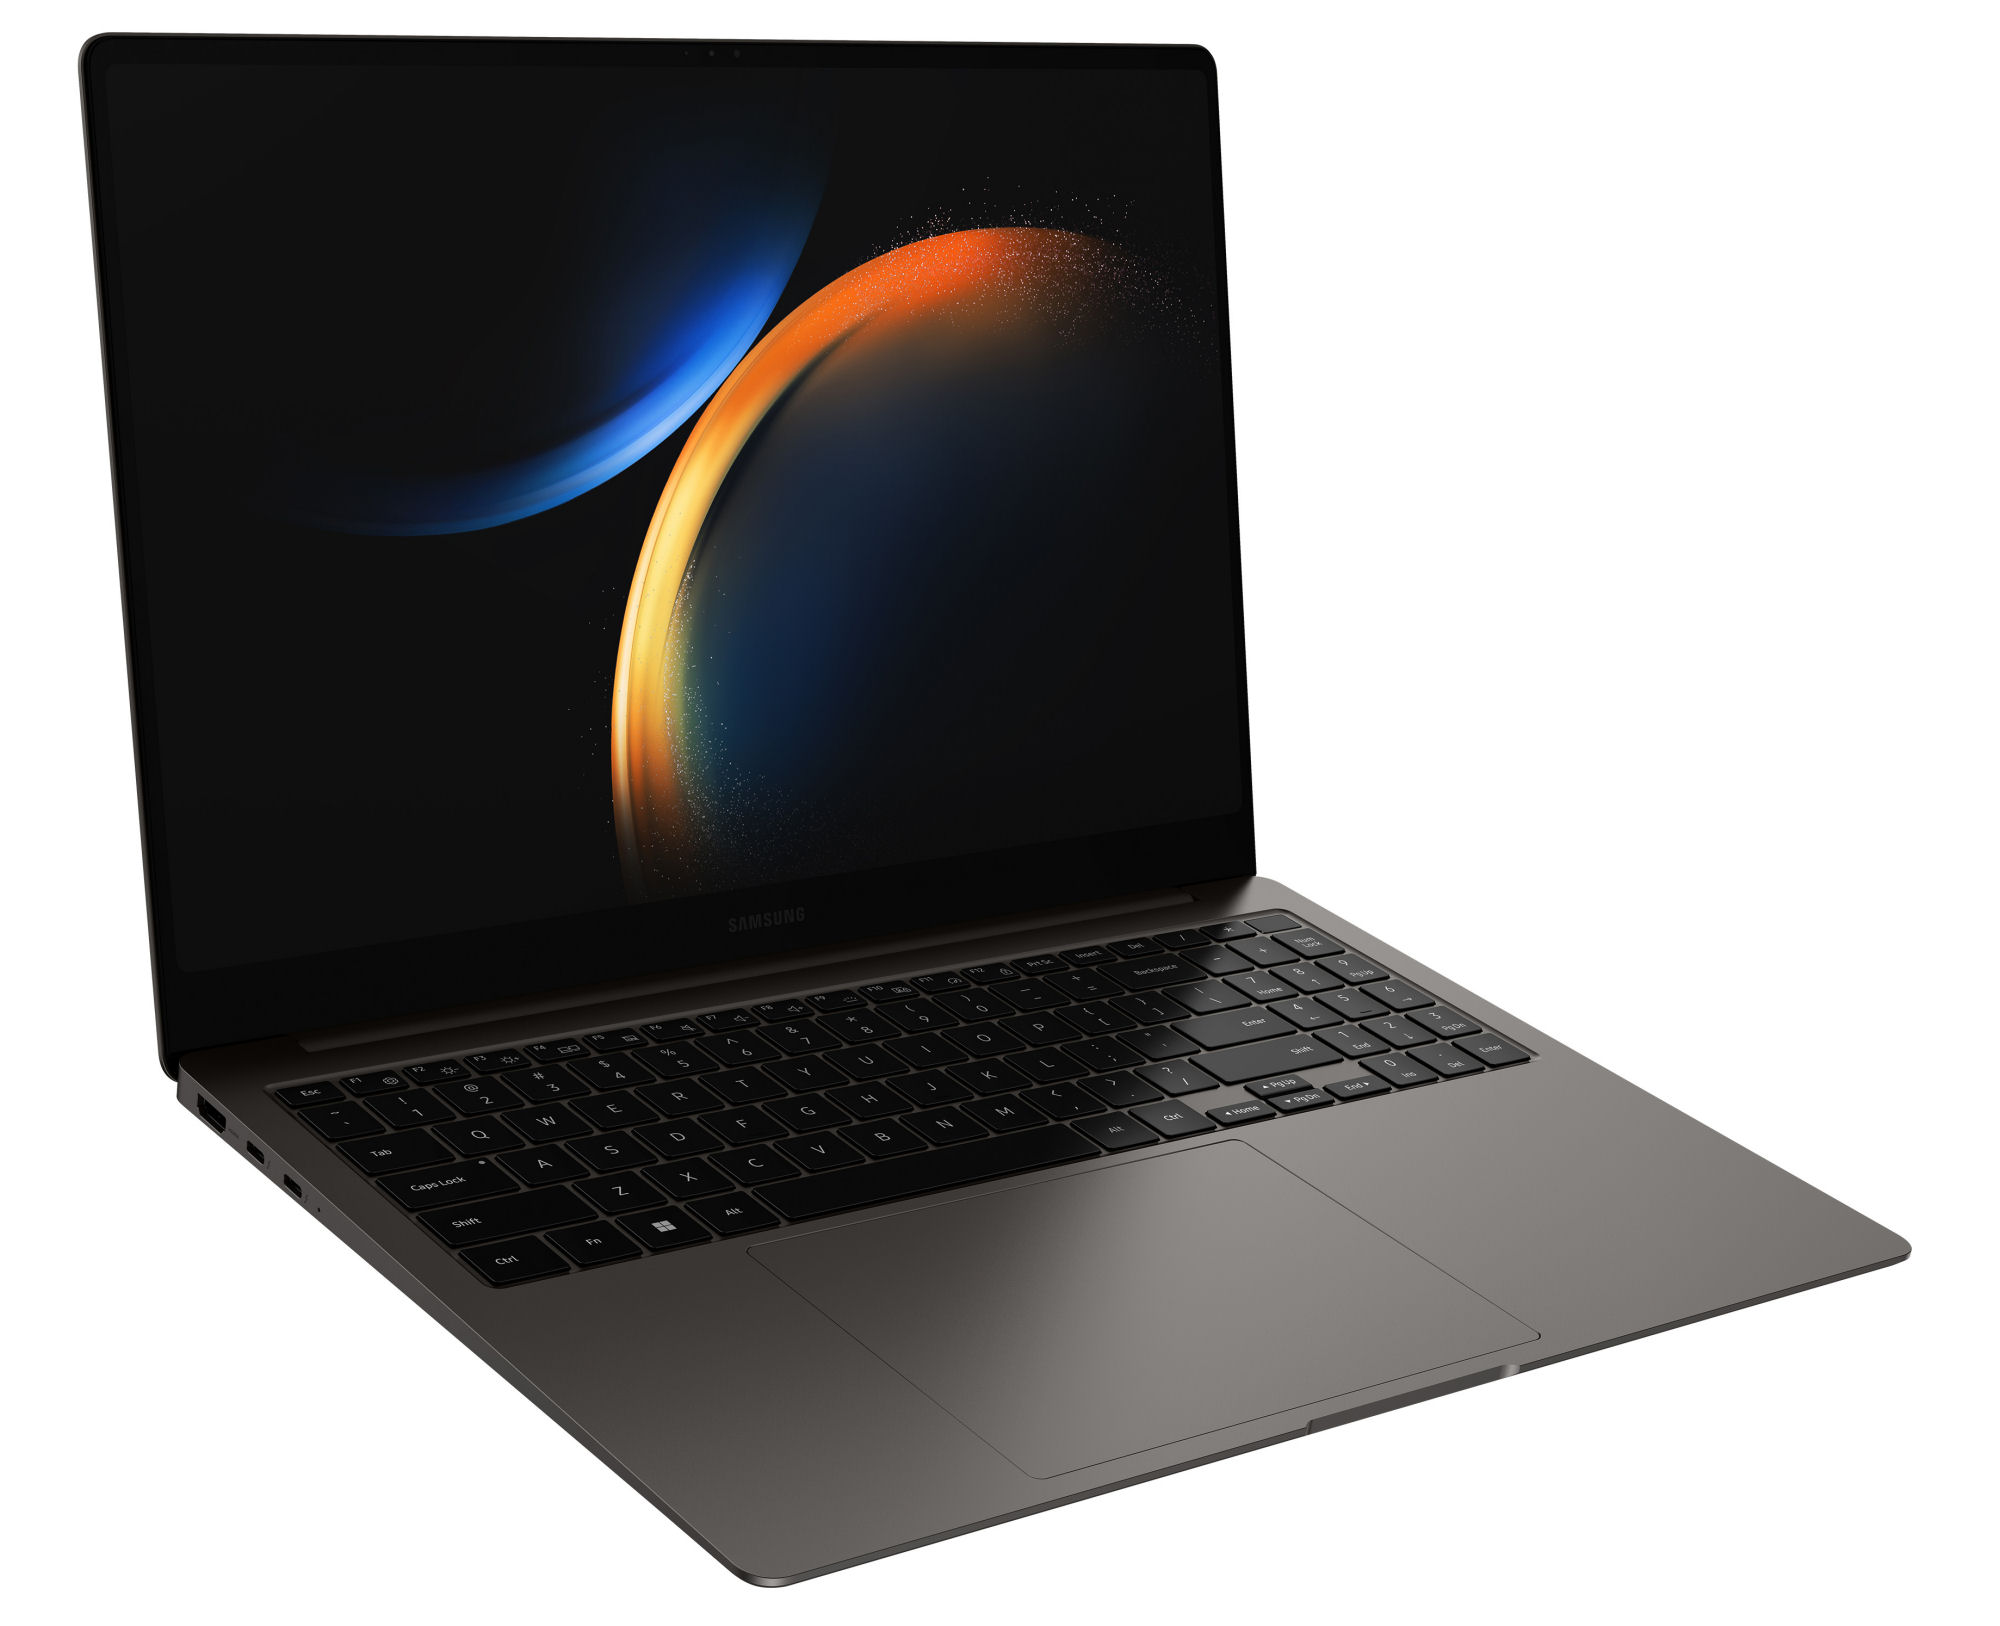
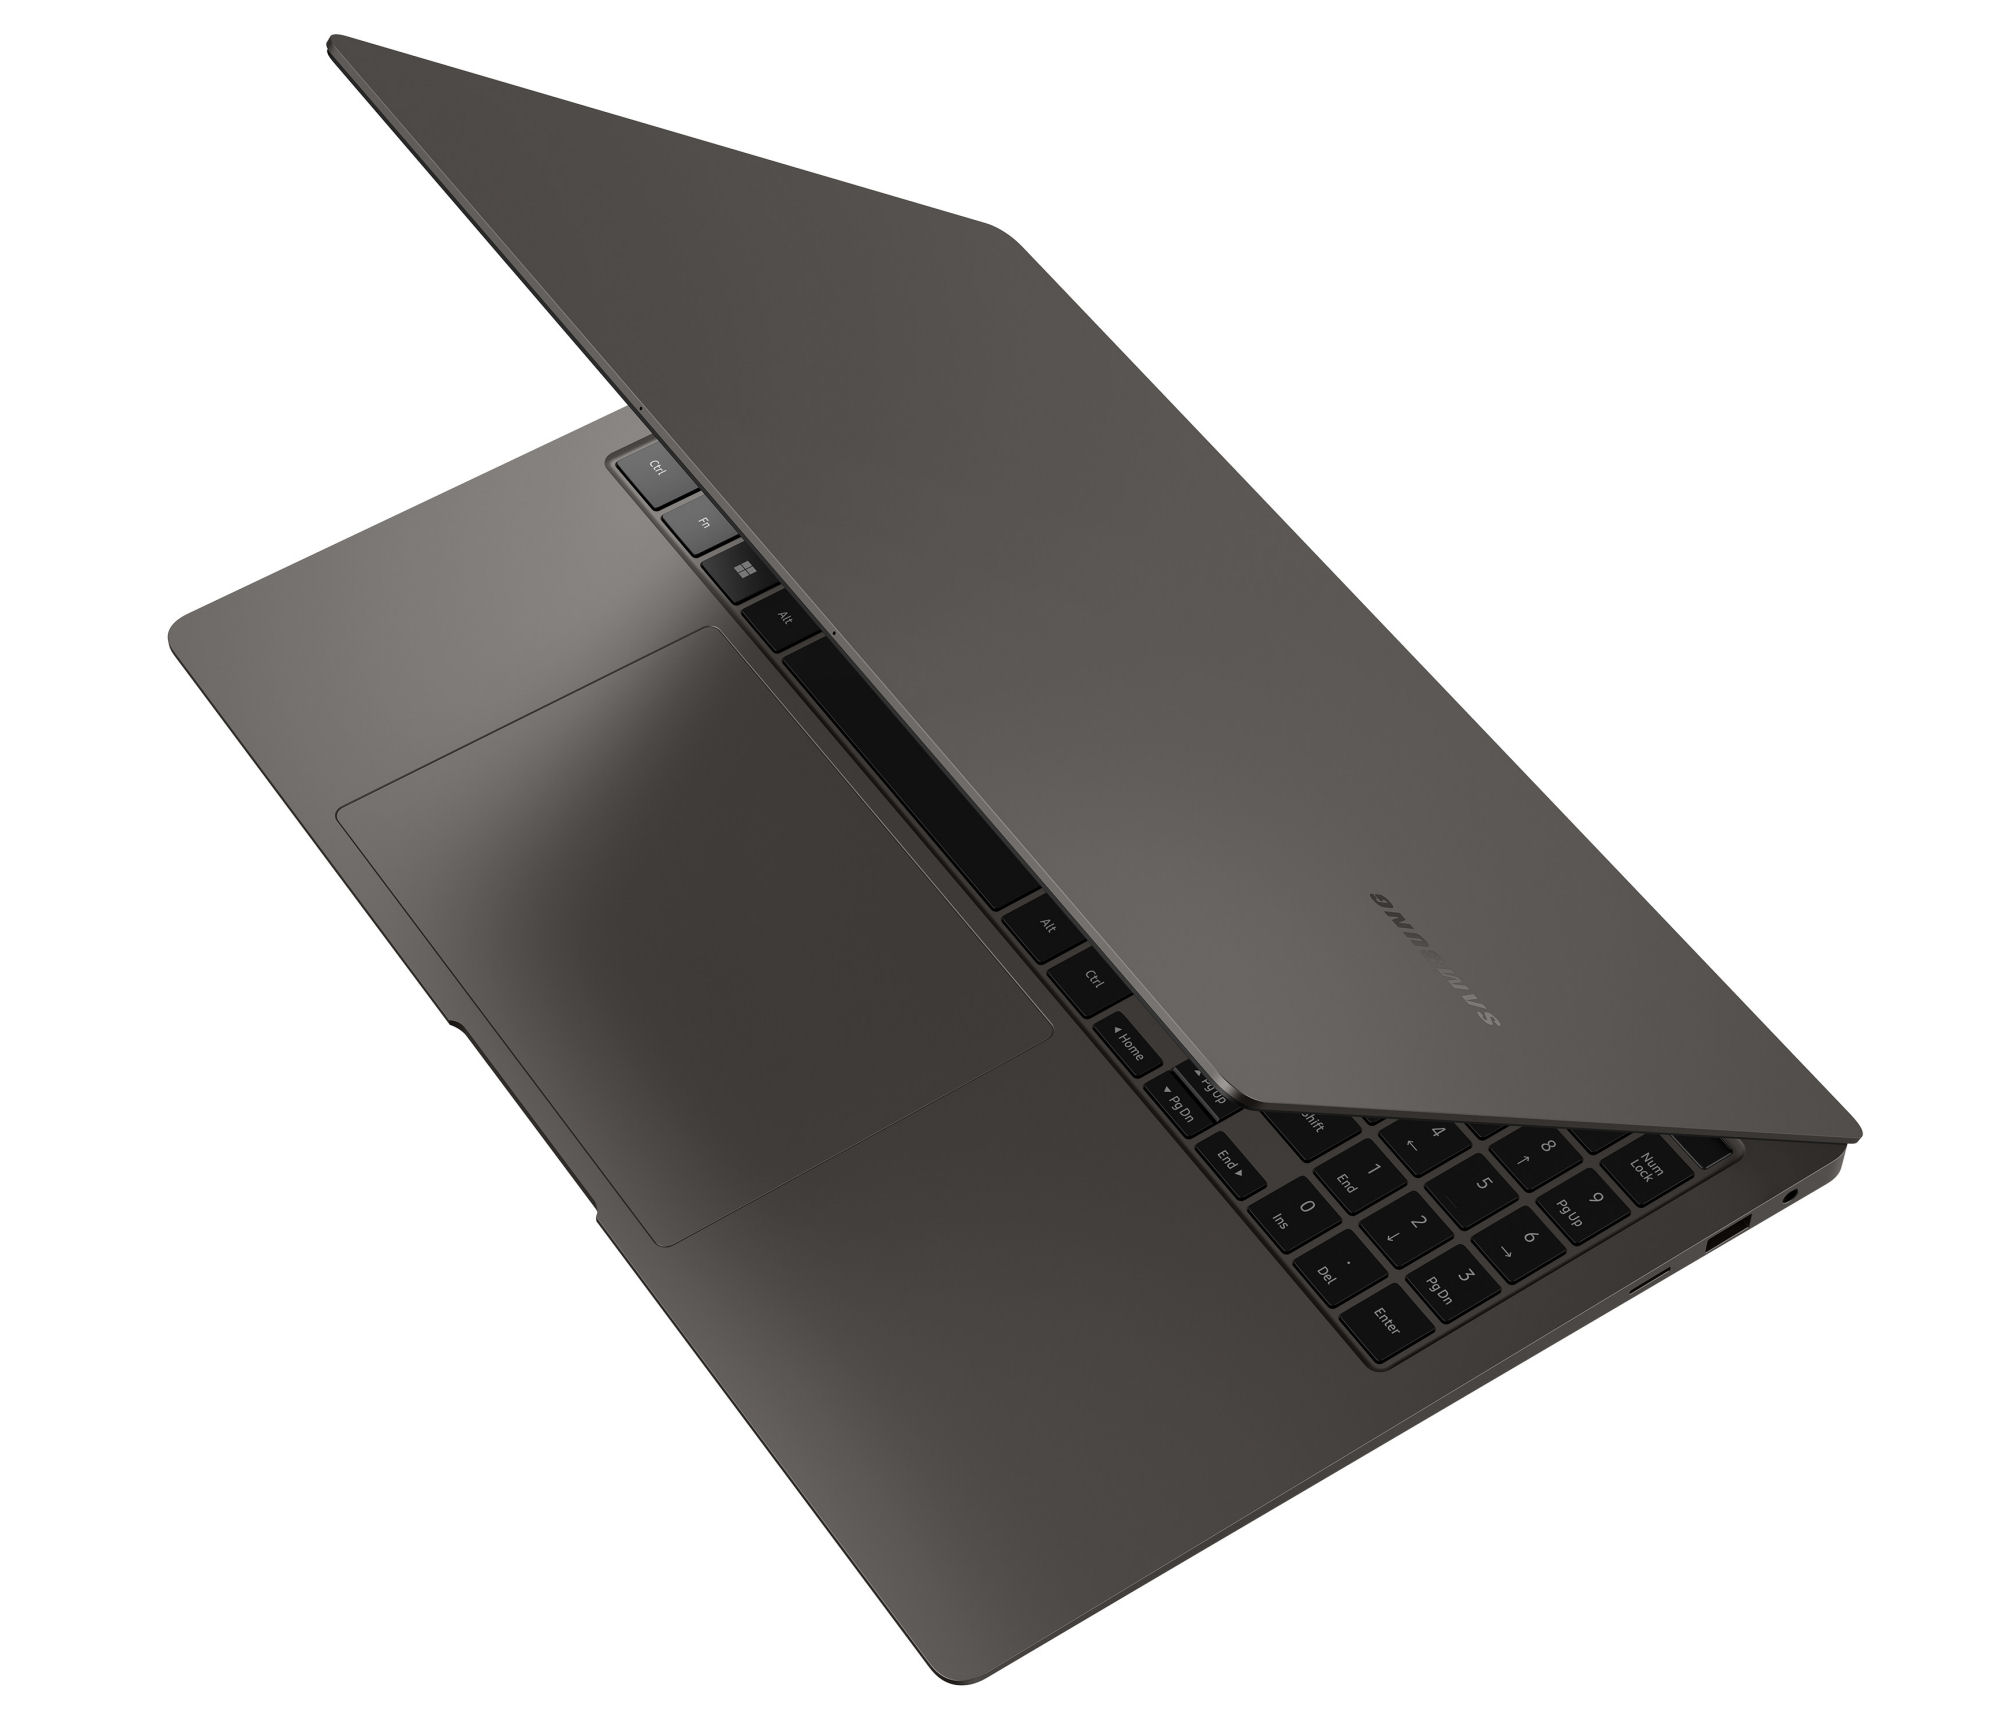
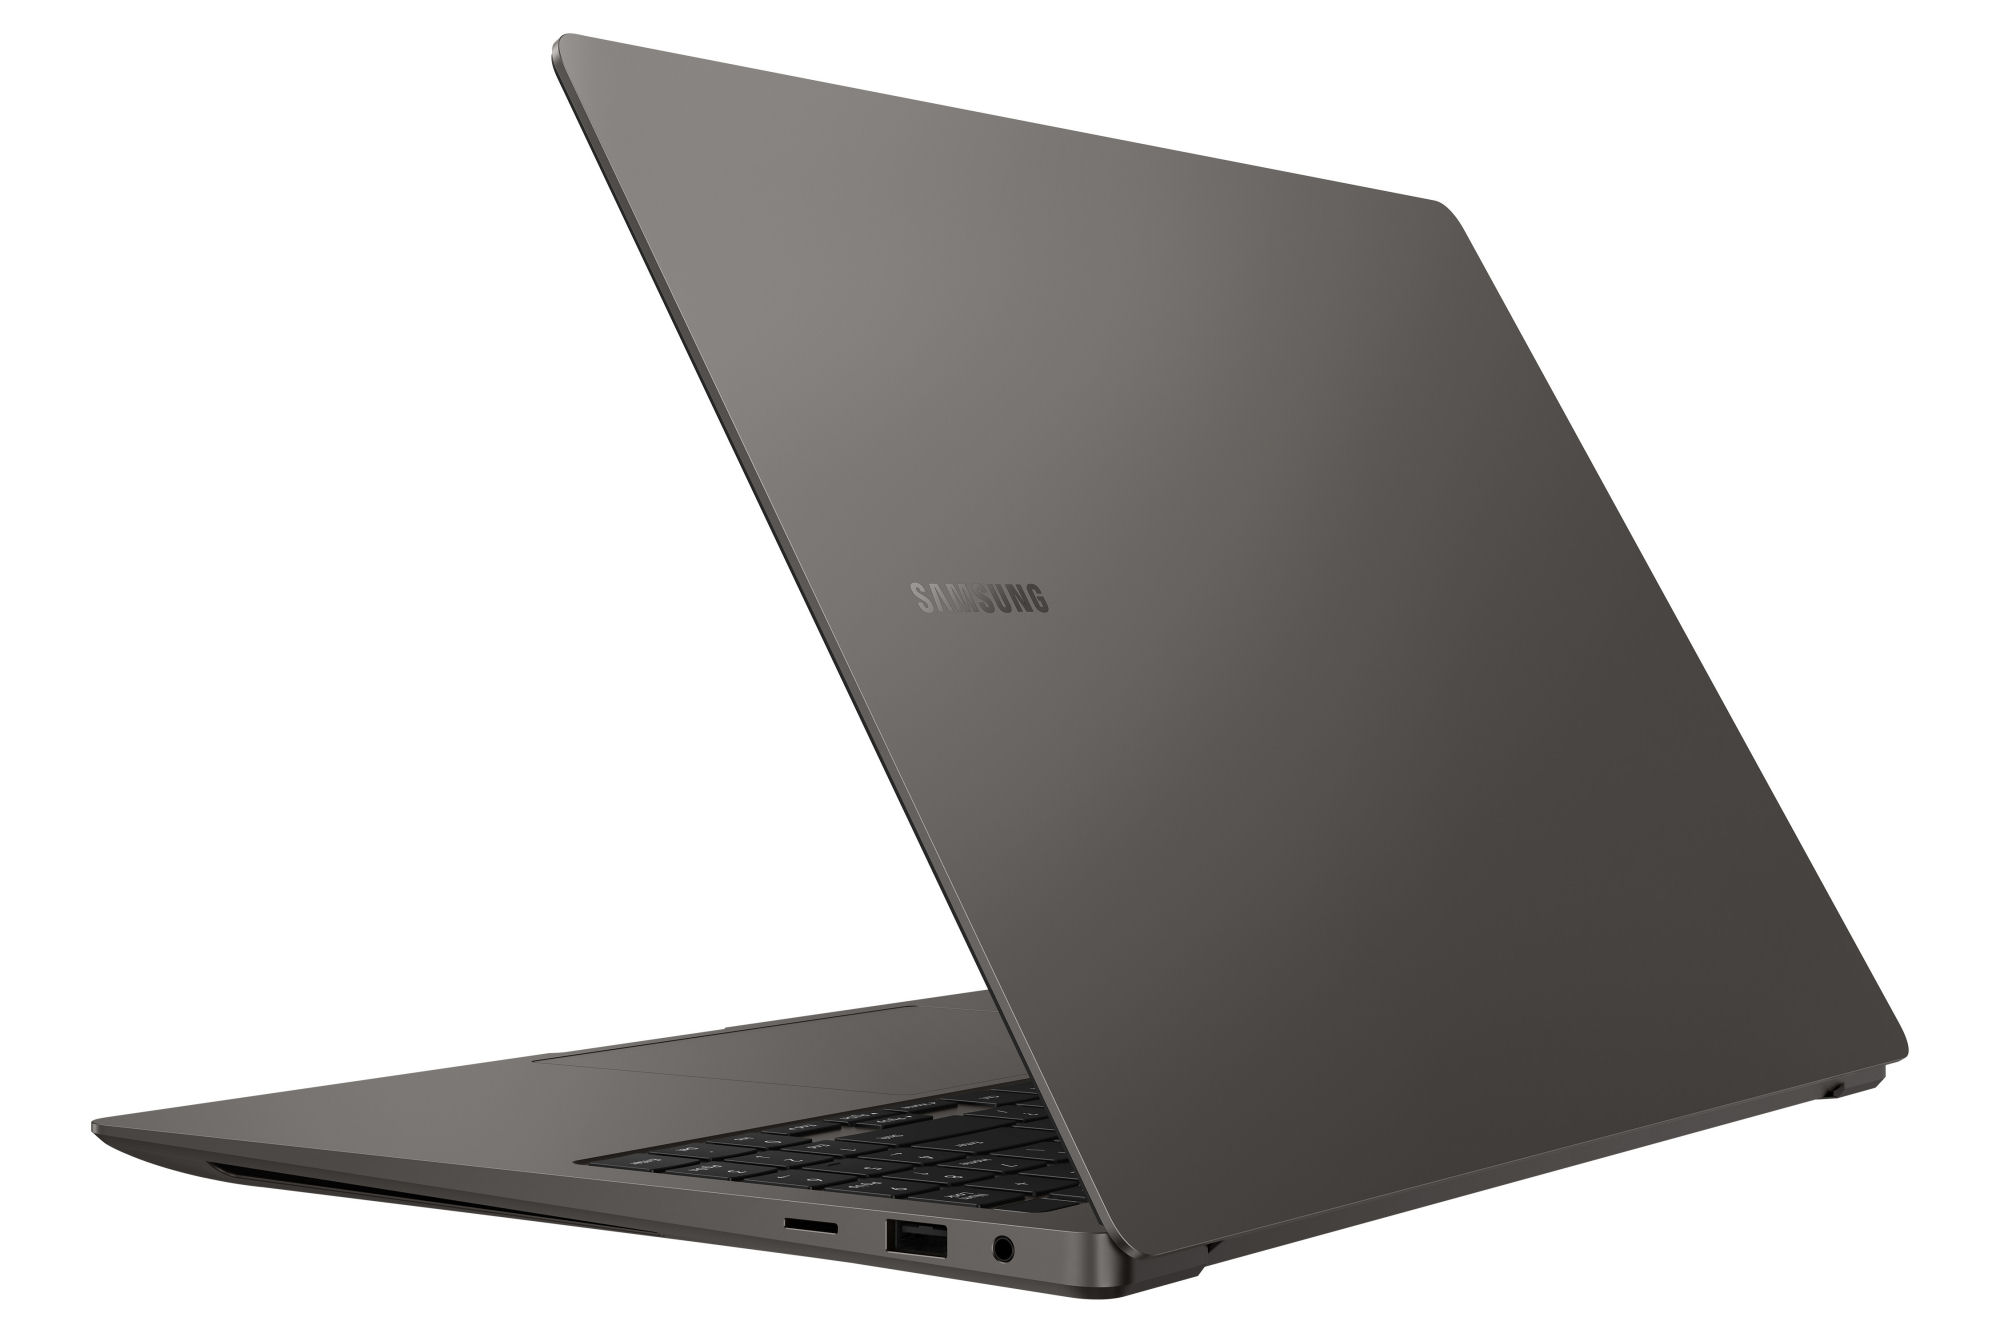
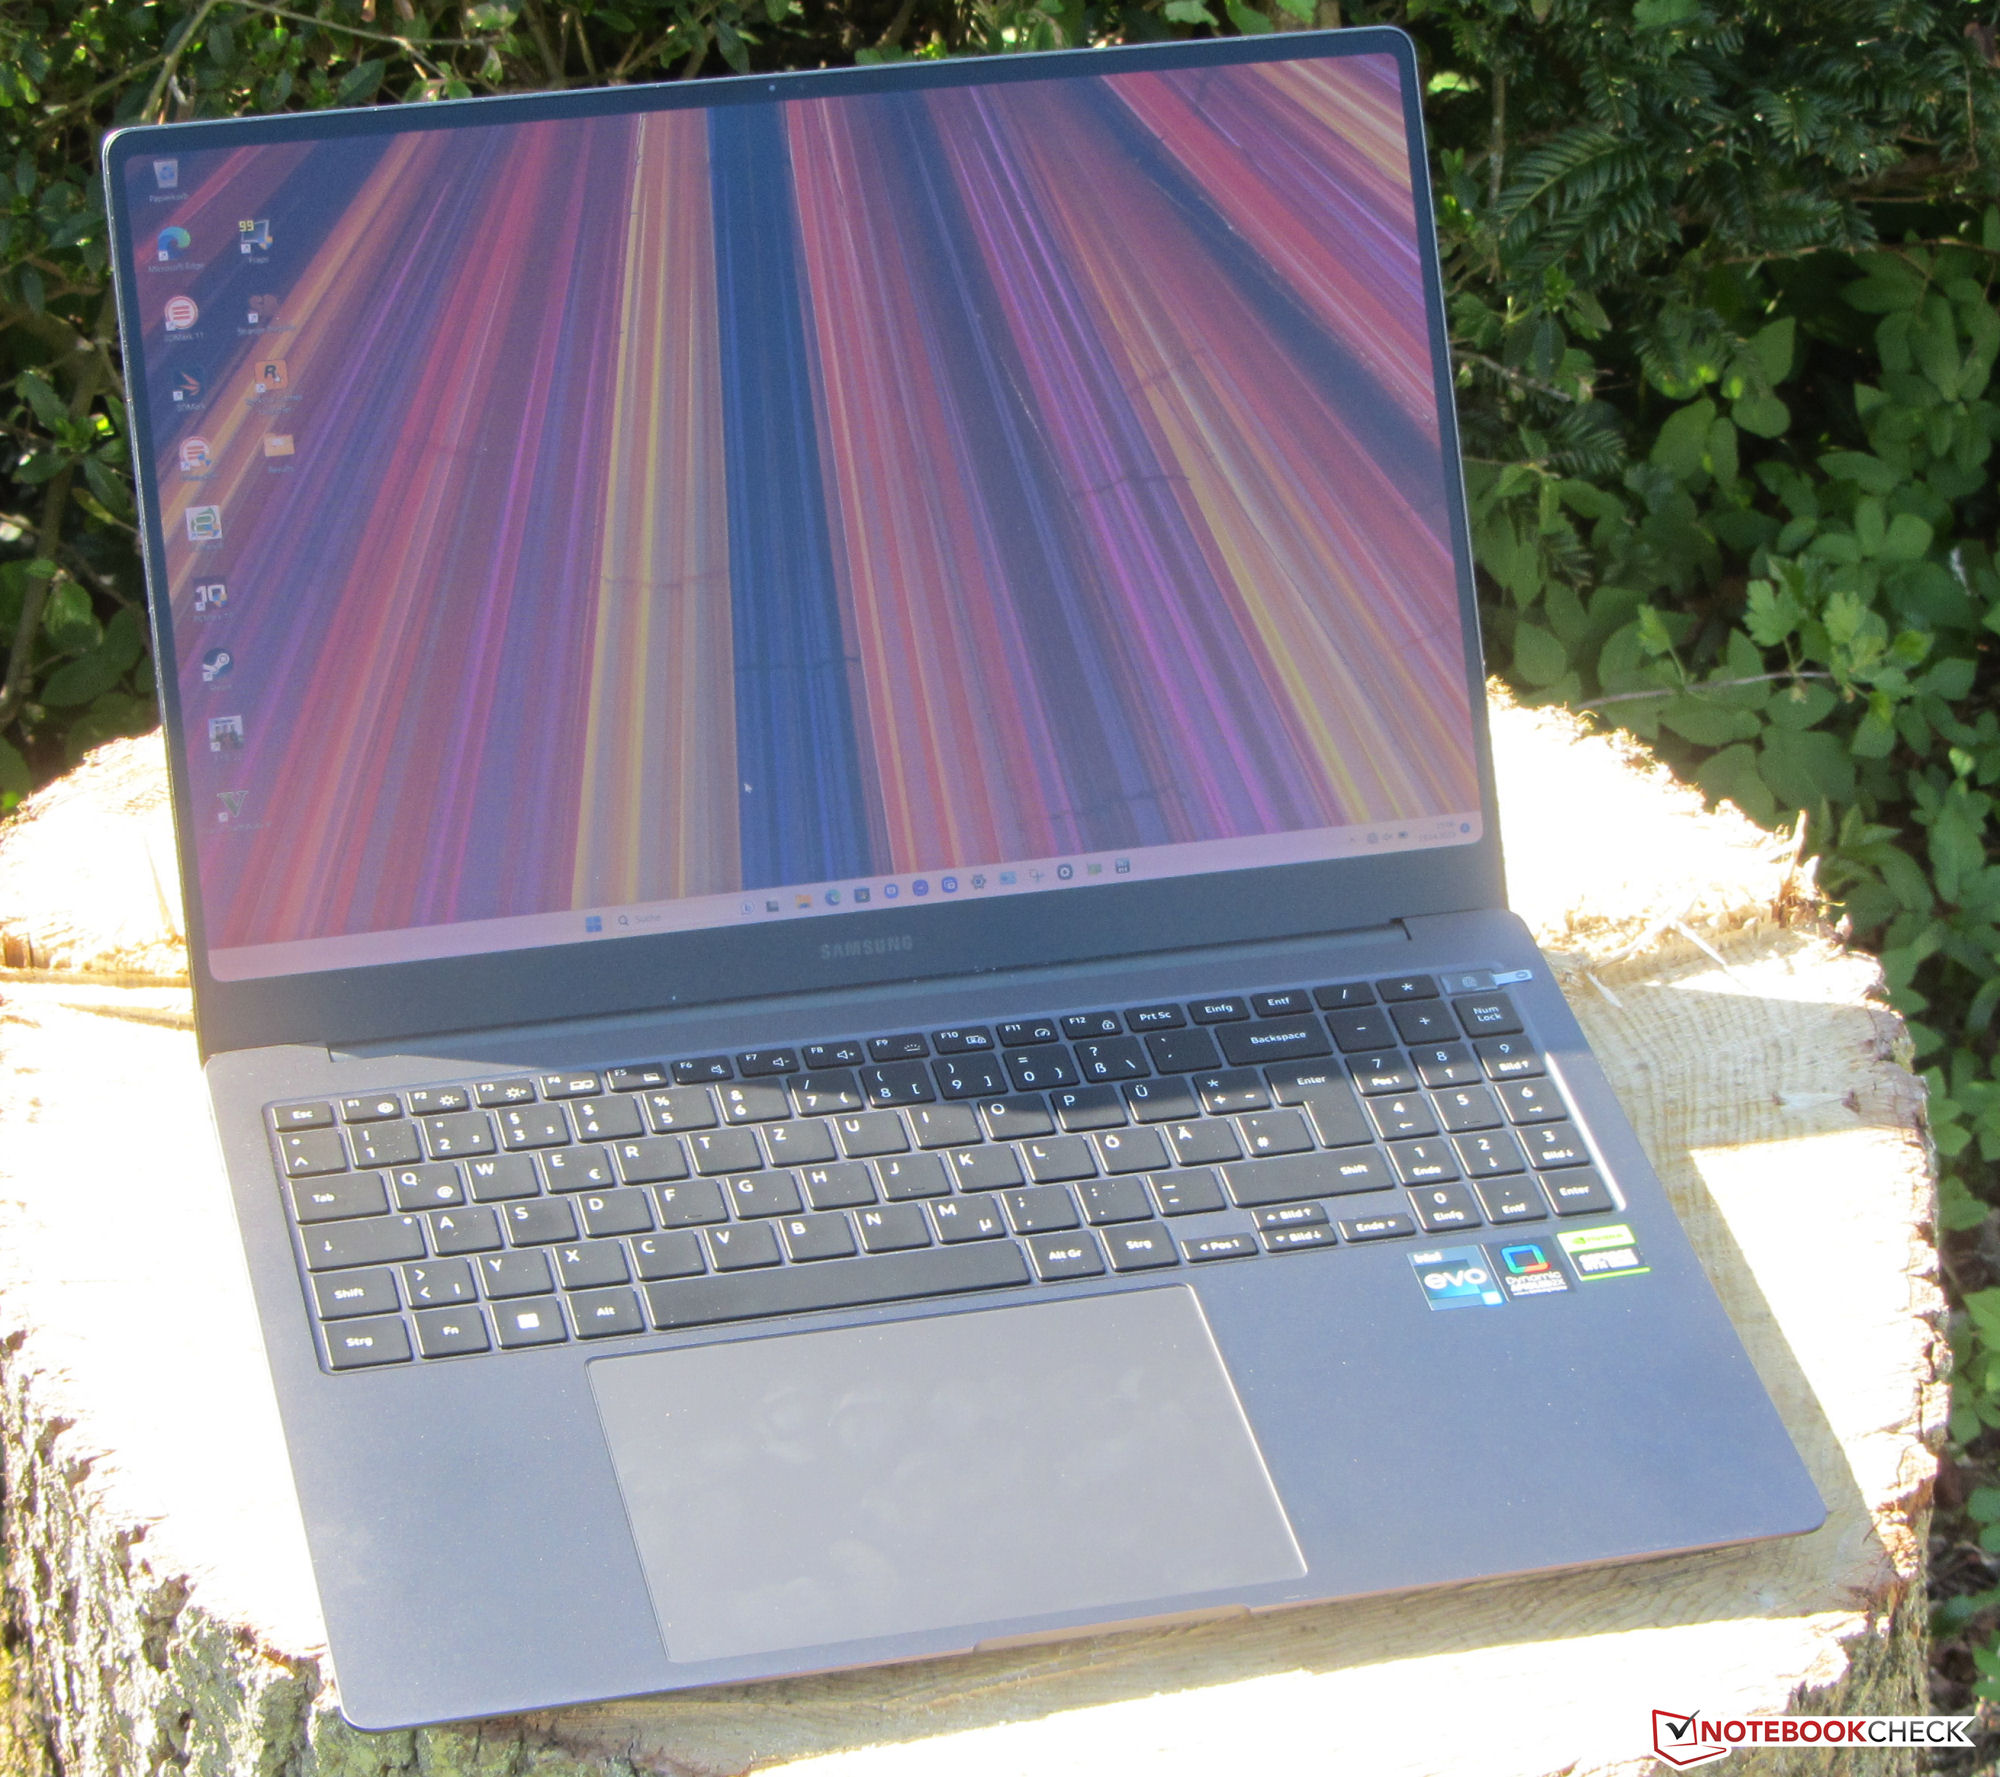
Case - A fancy aluminum chassis for the Galaxy
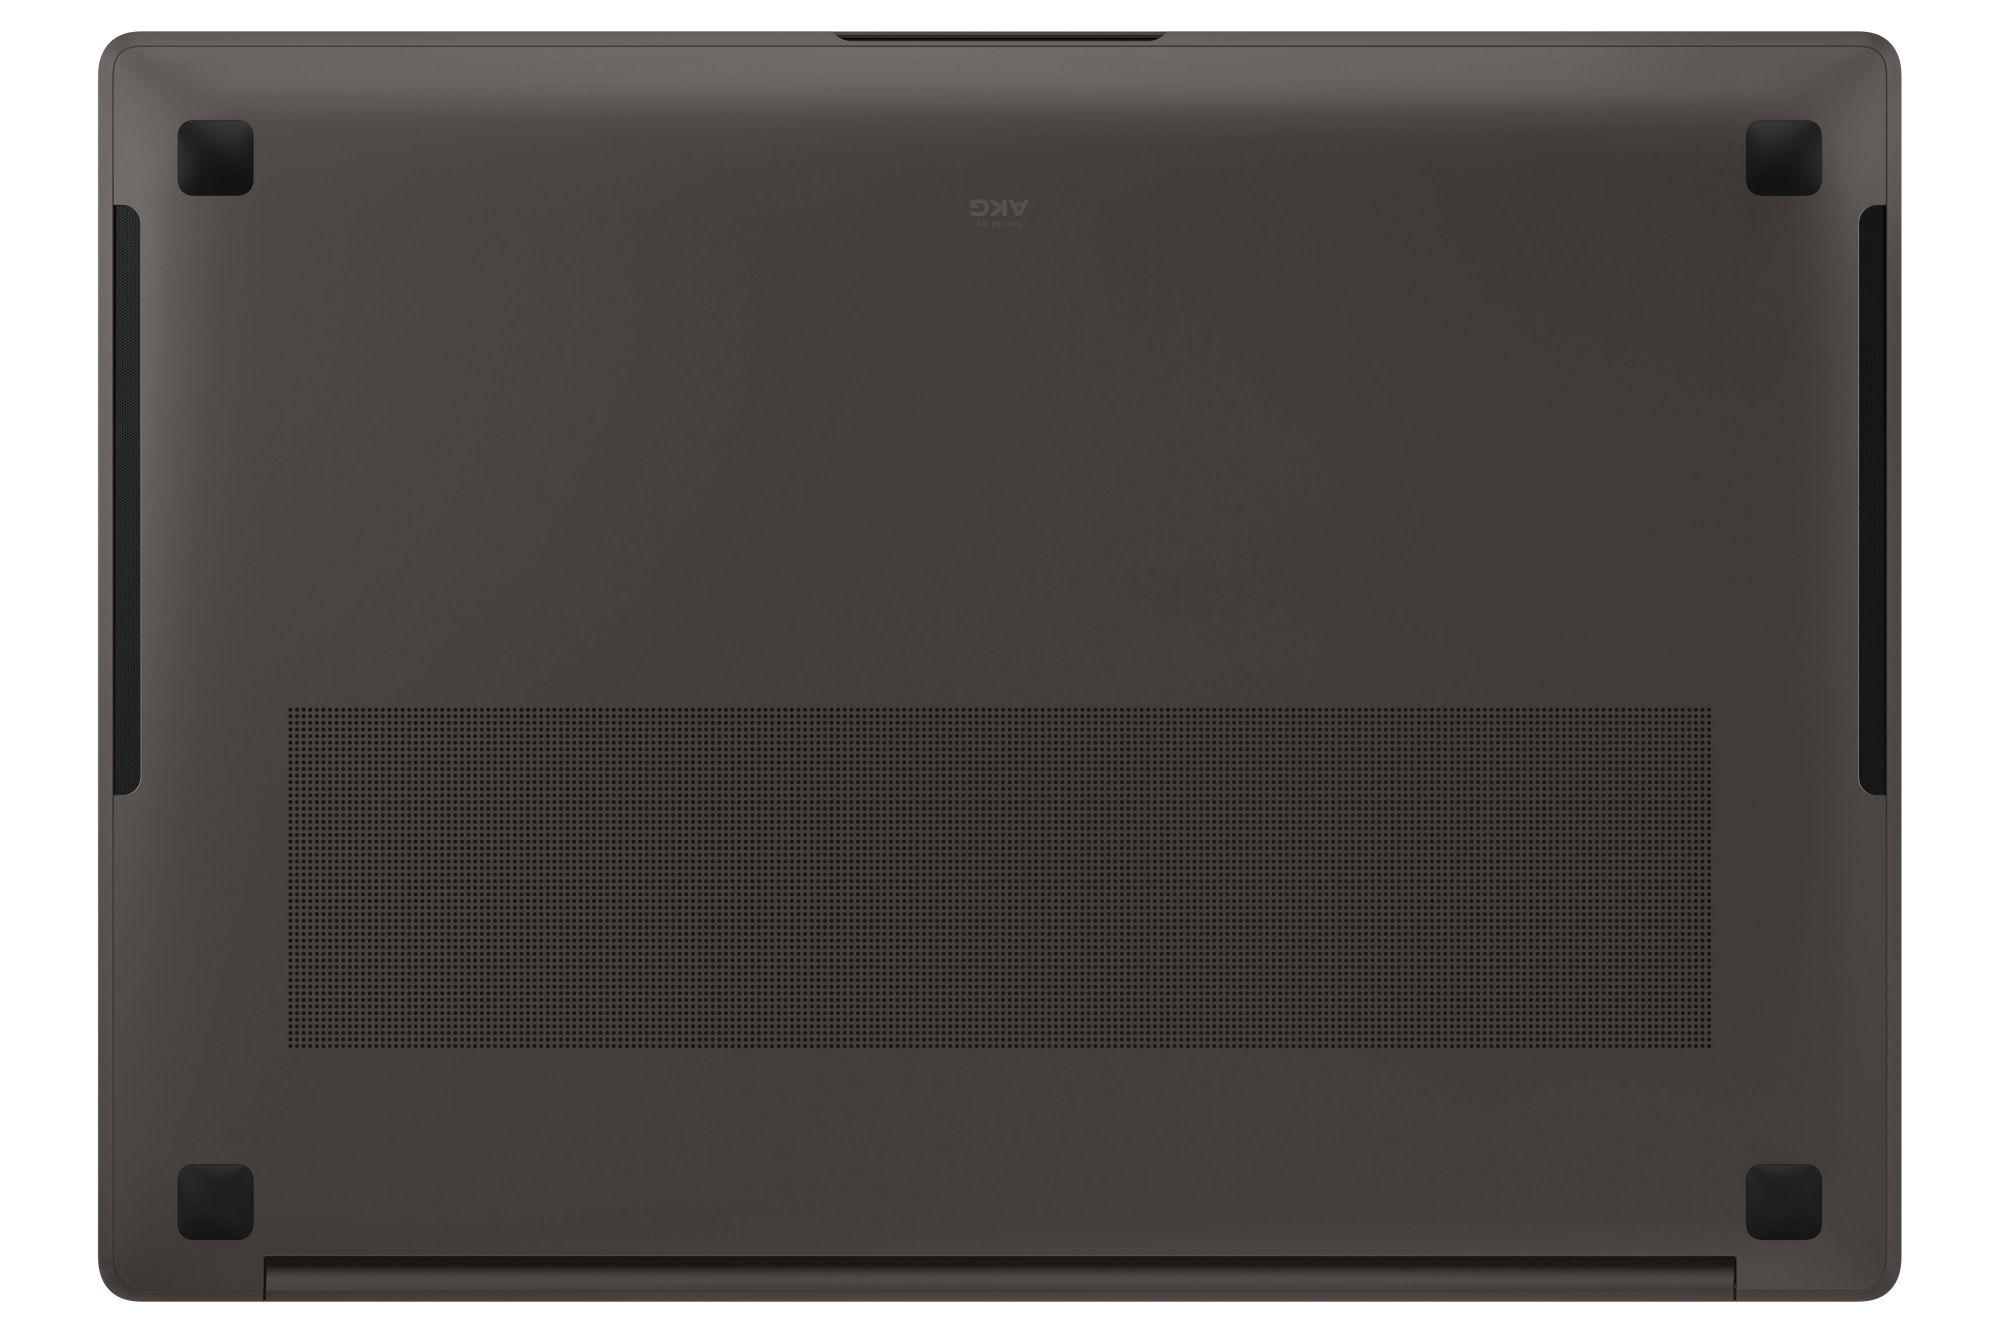
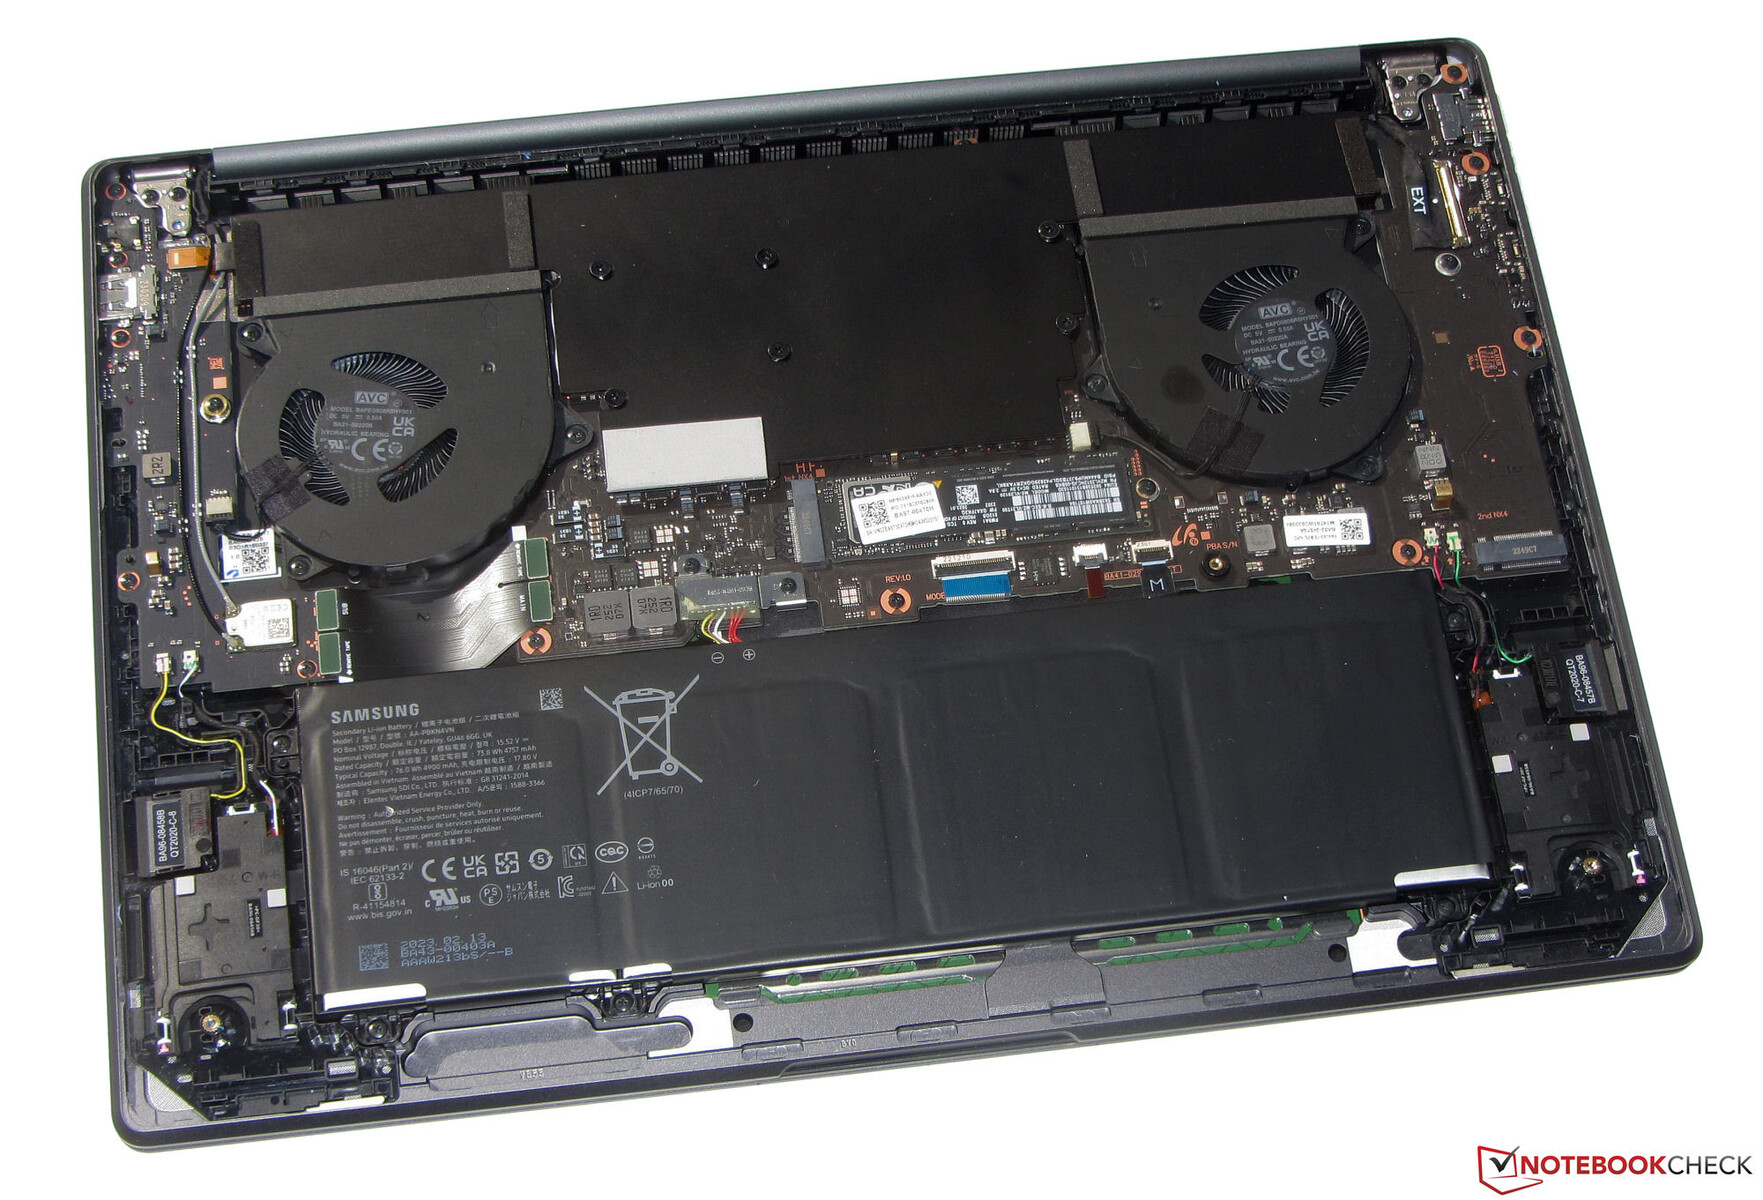
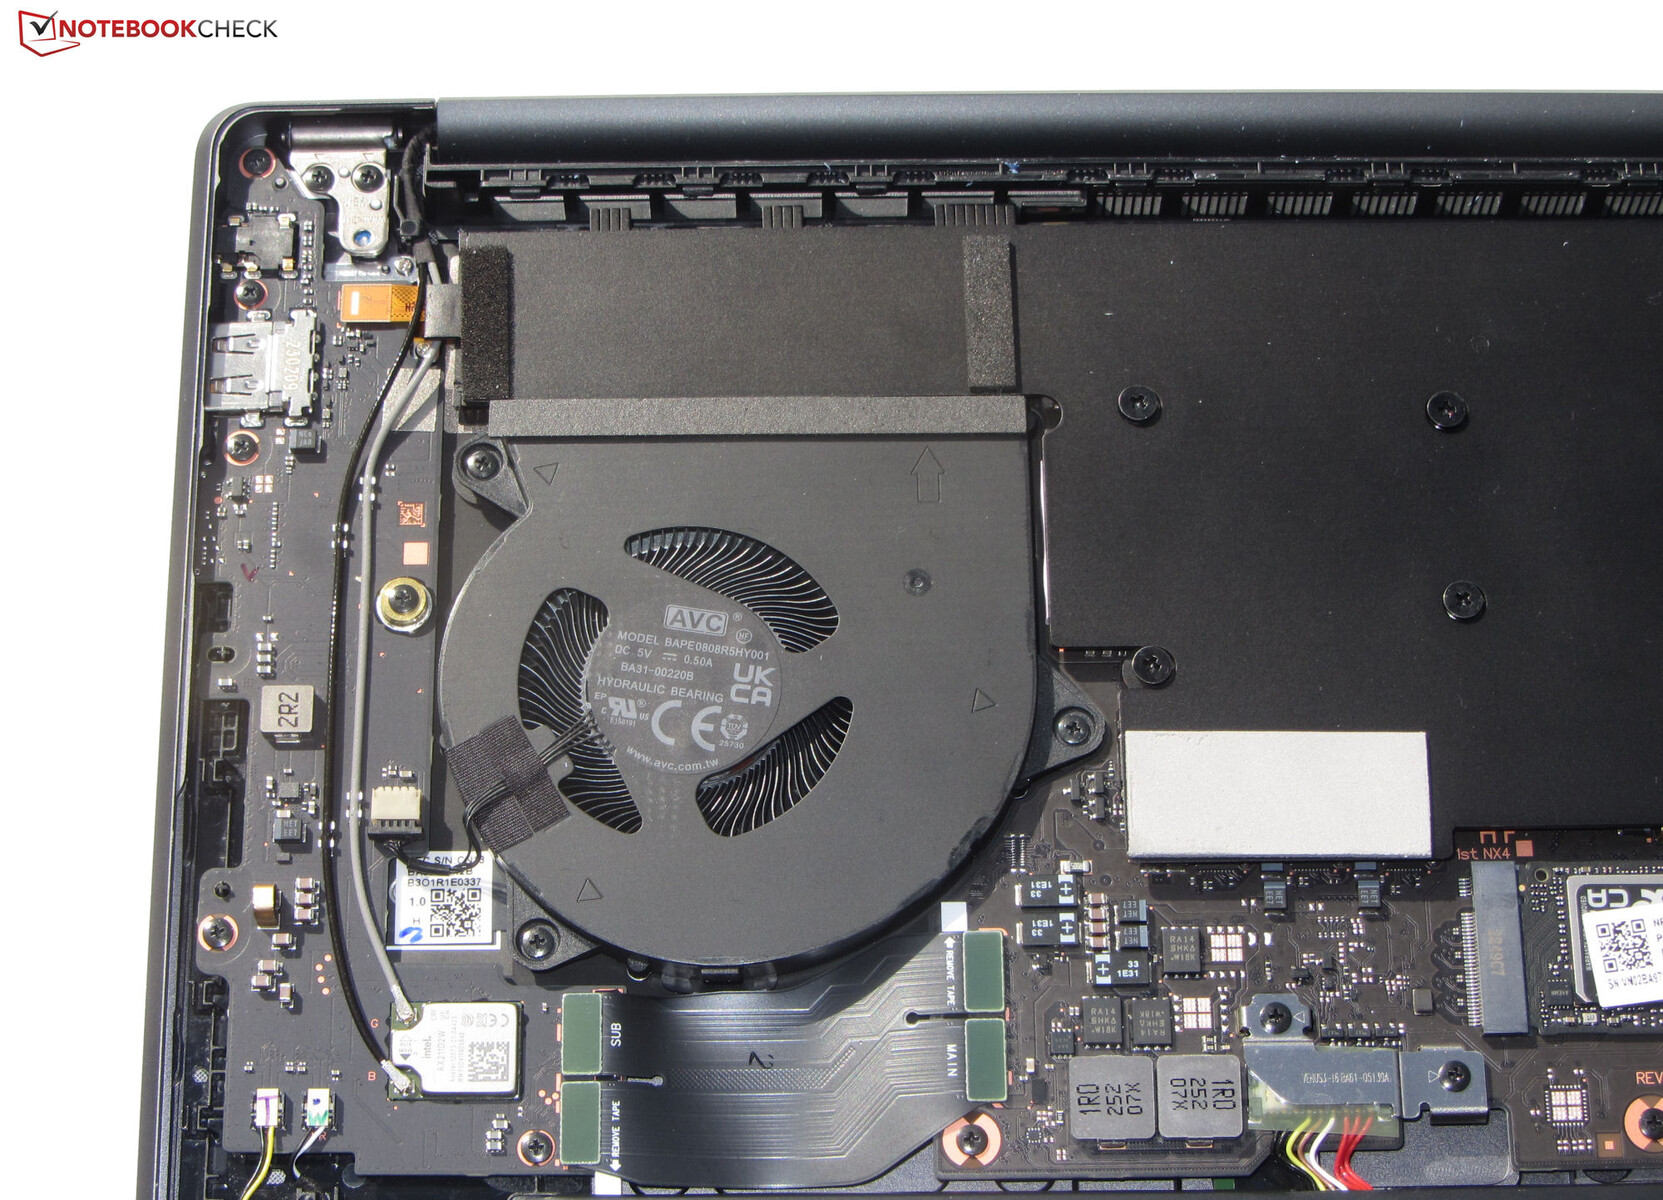
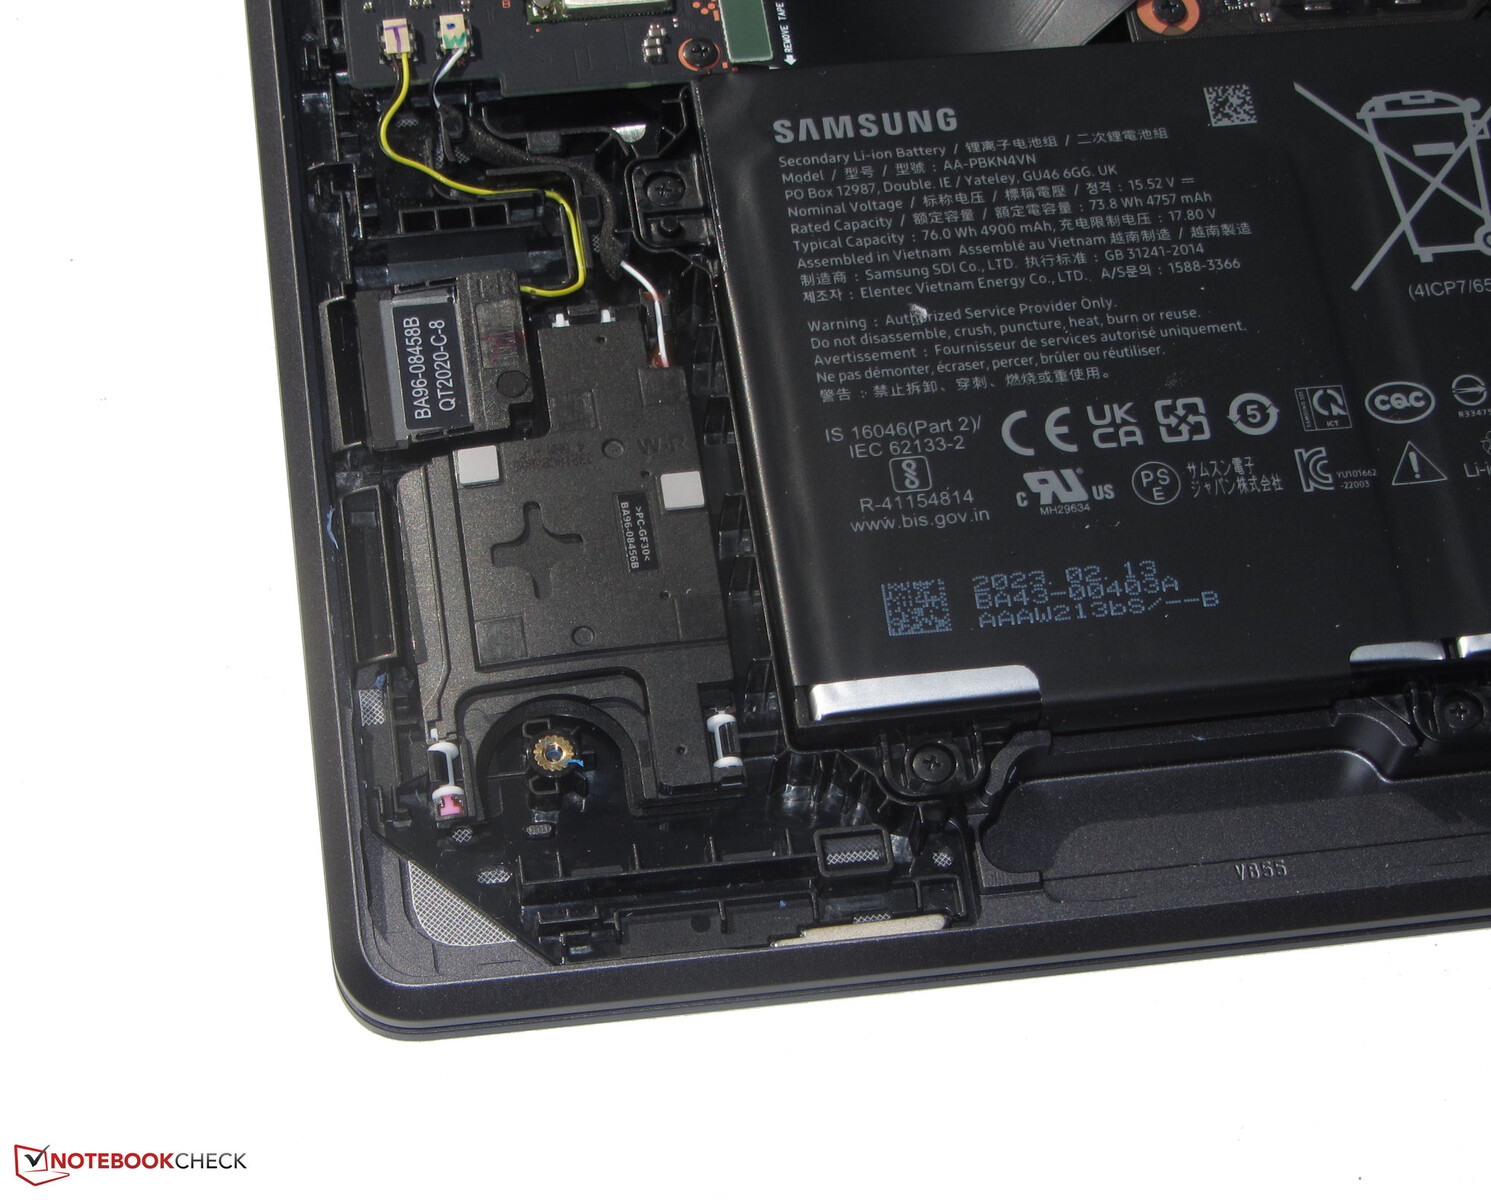
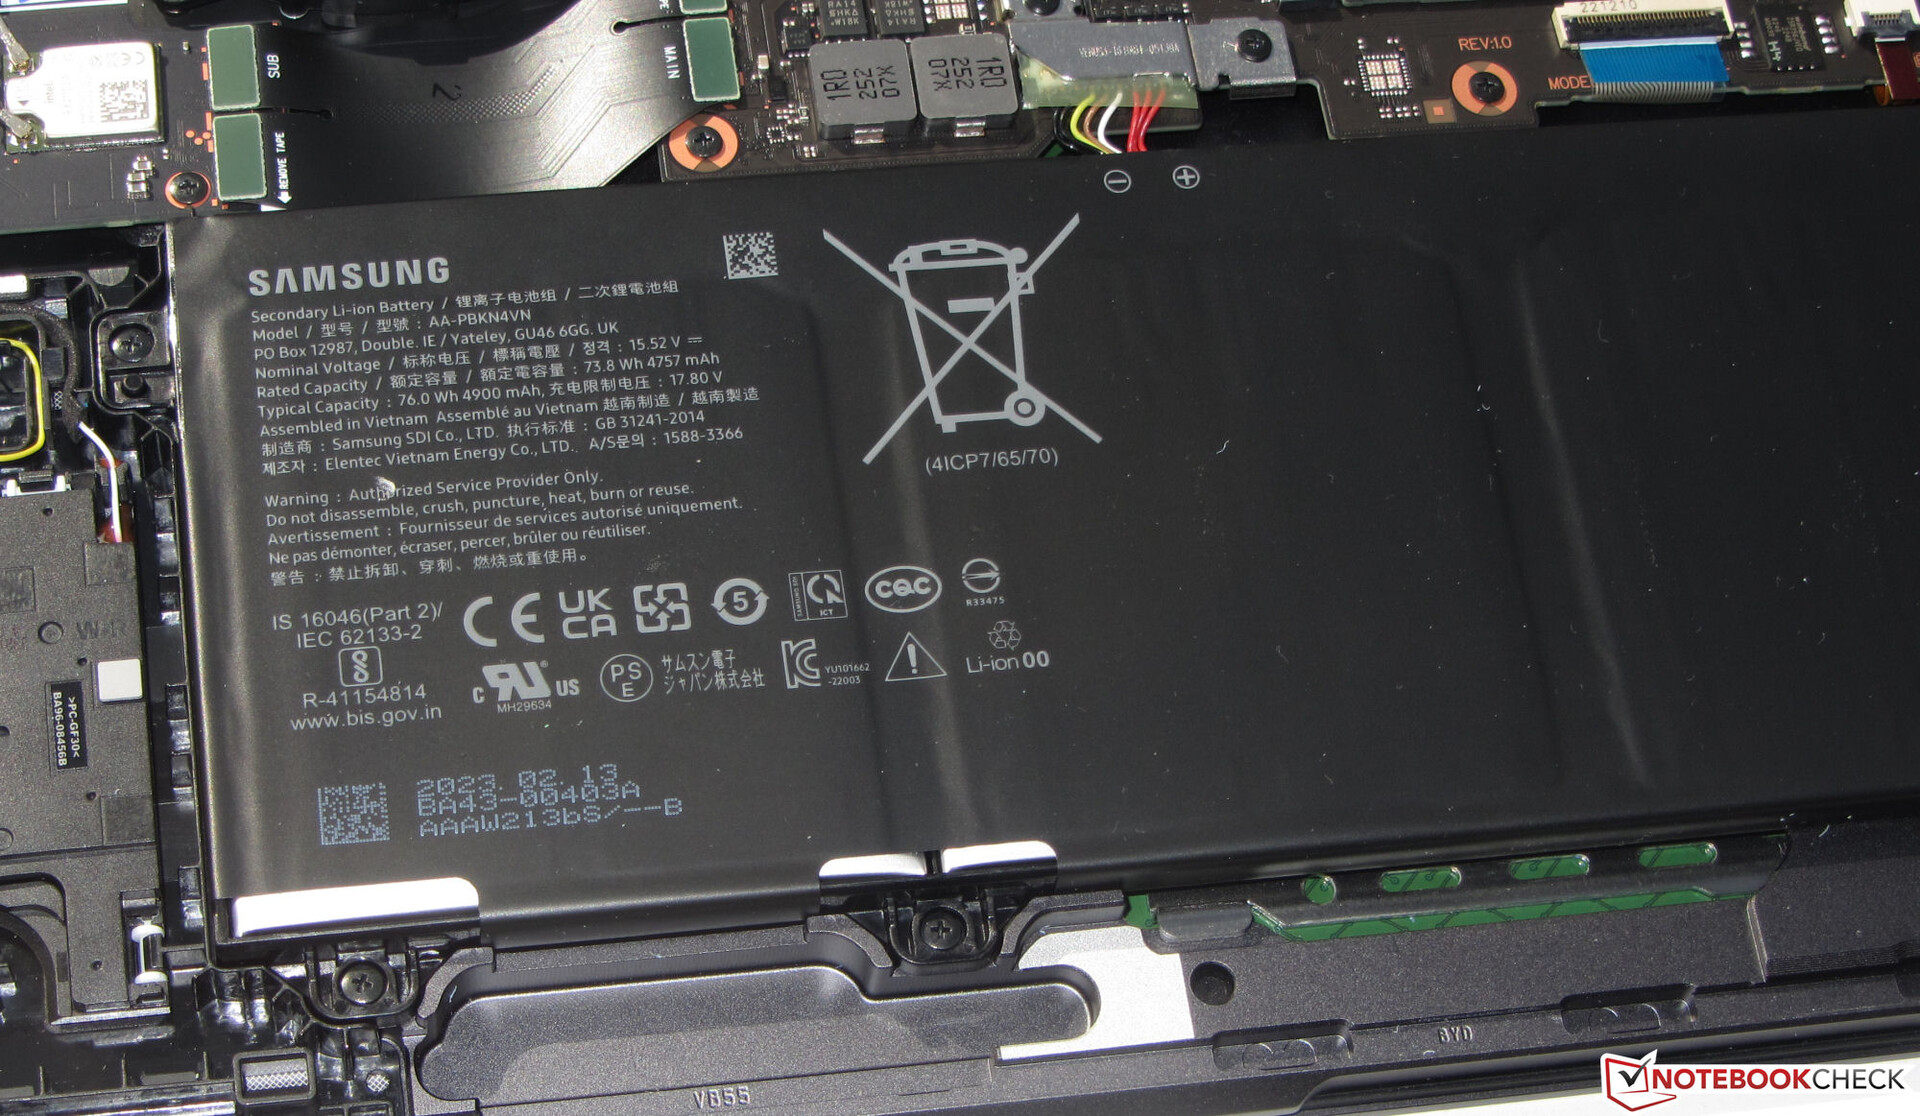
Samsung uses a gray-black (graphite) aluminum case with smooth, matte surfaces. The chic-elegant computer doesn't have any eye-catching design features and does not need them either. The battery (screwed, not glued) and the other internal components are accessible after removing the bottom shell.
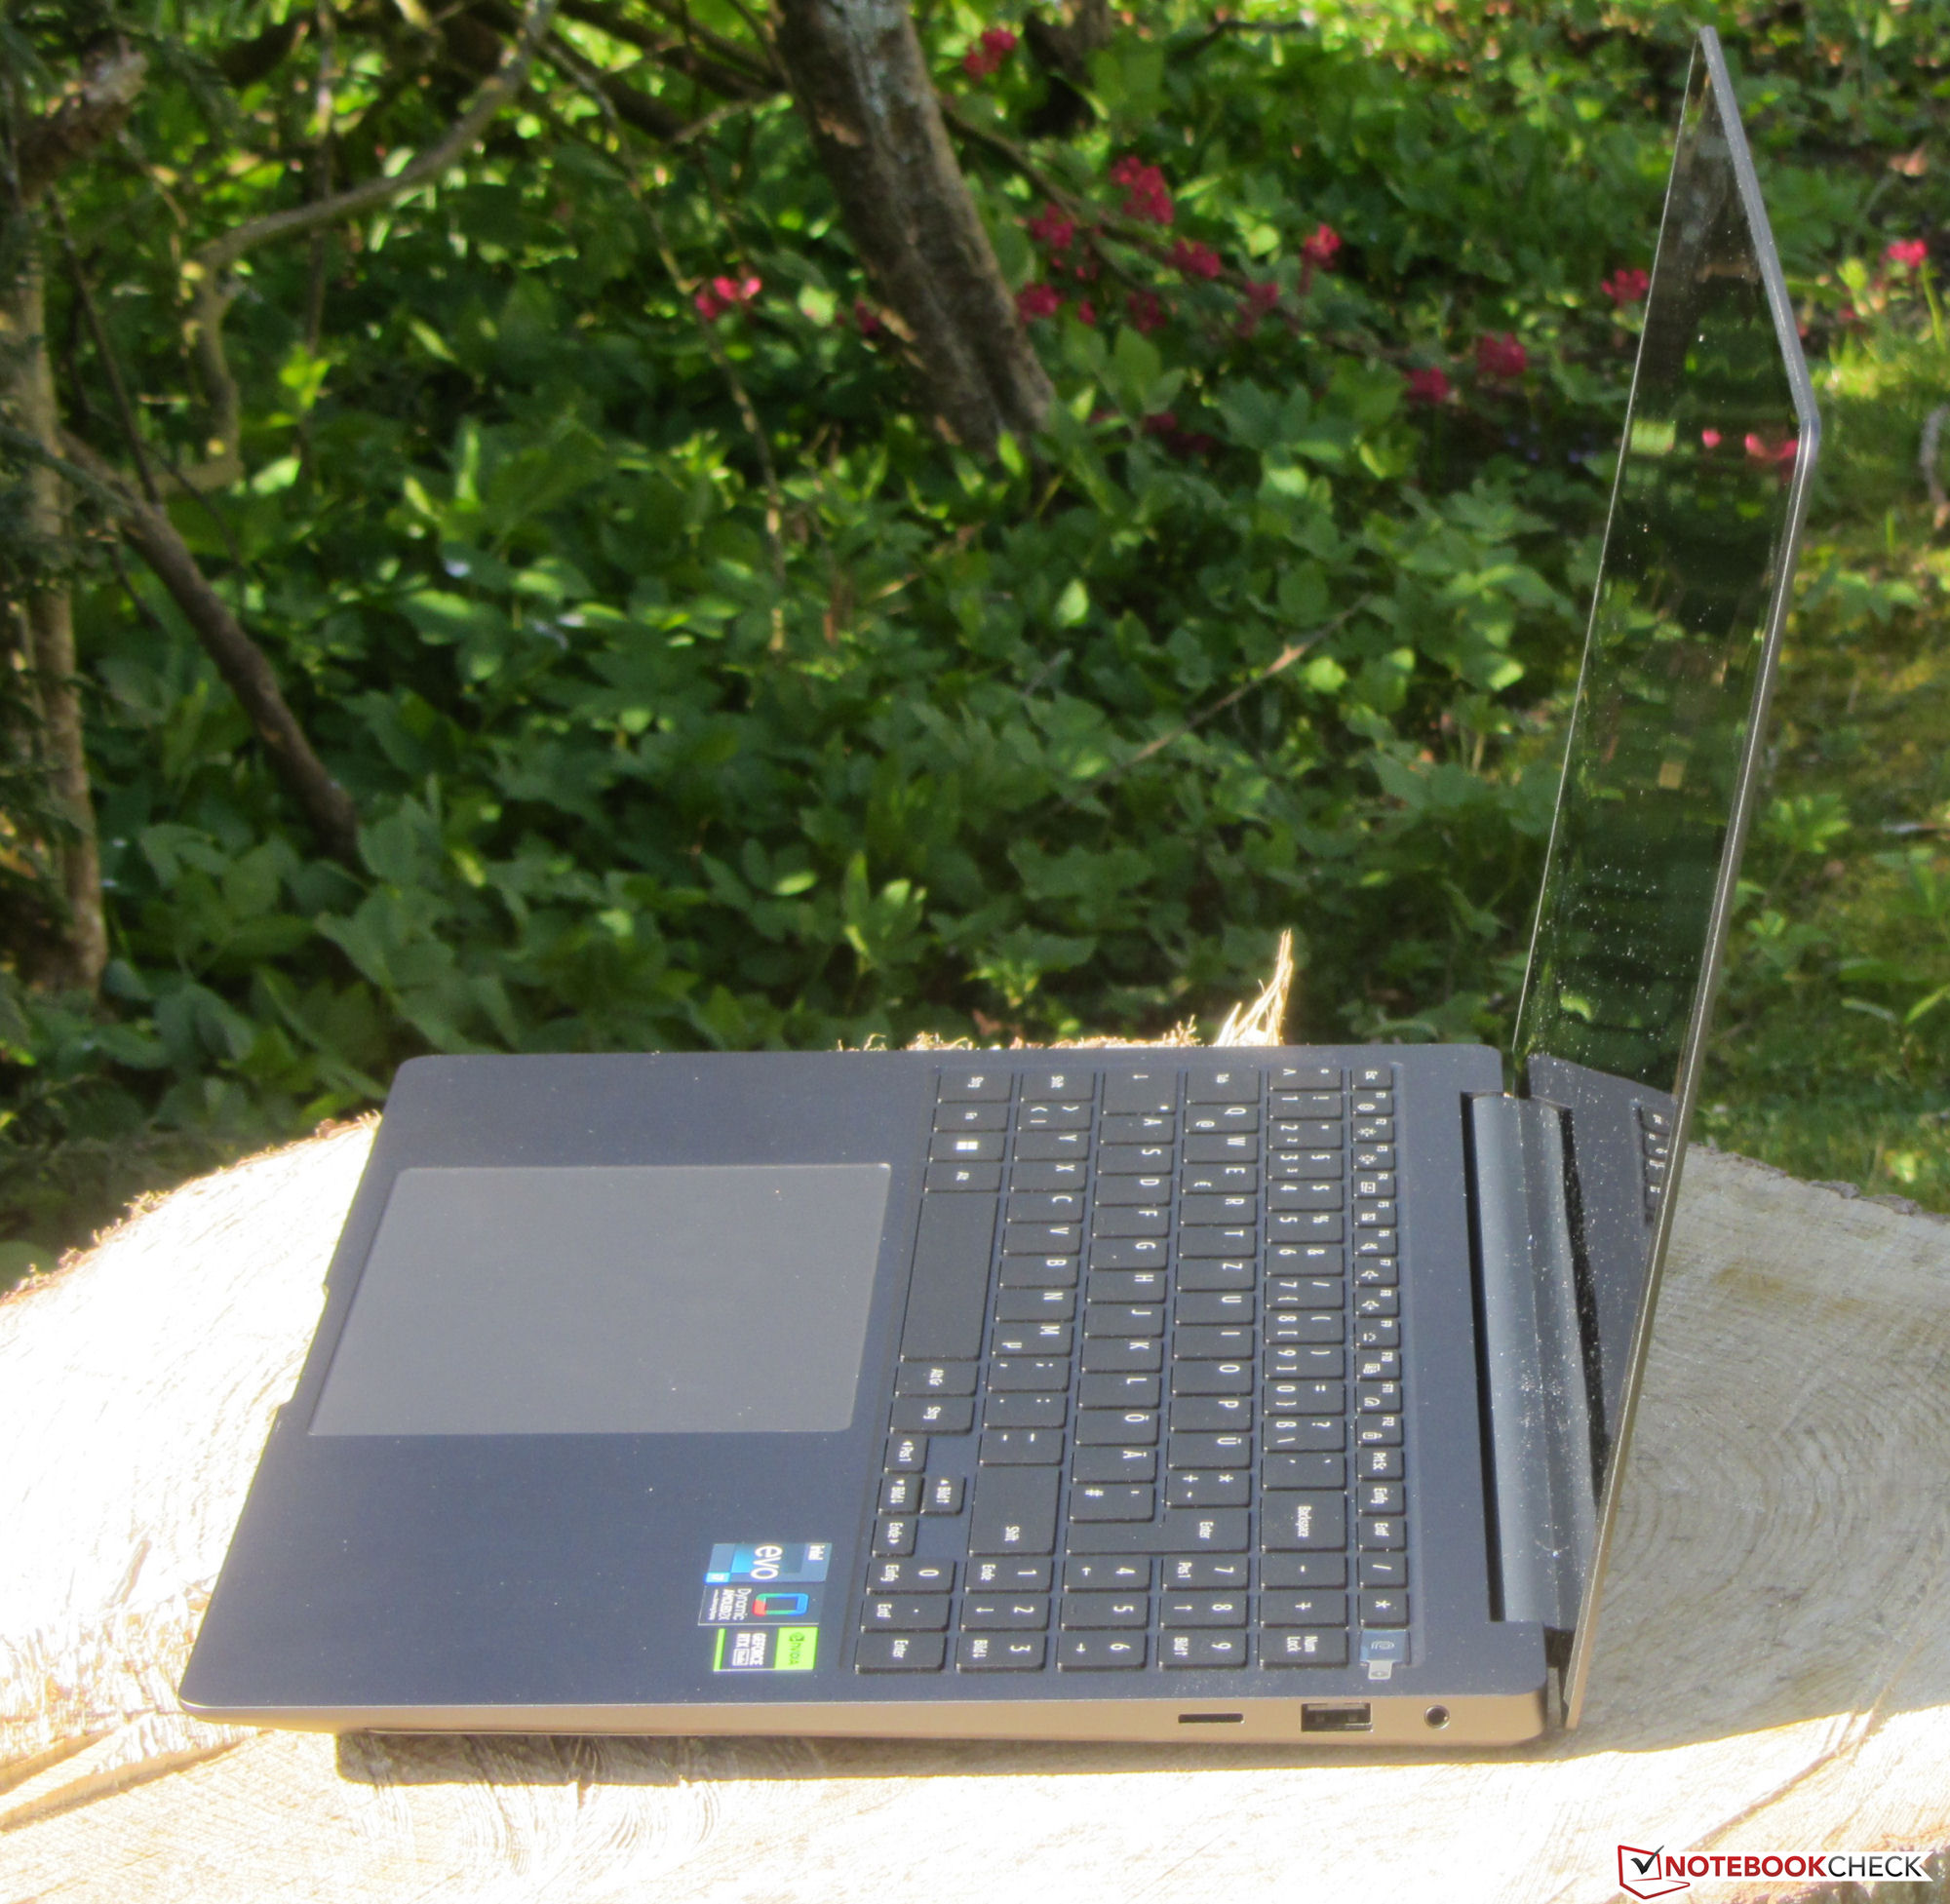
The notebook is of good workmanship. Gap dimensions are even and no material protrusions are to be found. The base unit and lid can only be twisted to a very small degree. The hinges keep the lid firmly in place, and the maximum opening angle is around 125 degrees. One-hand opening is possible.
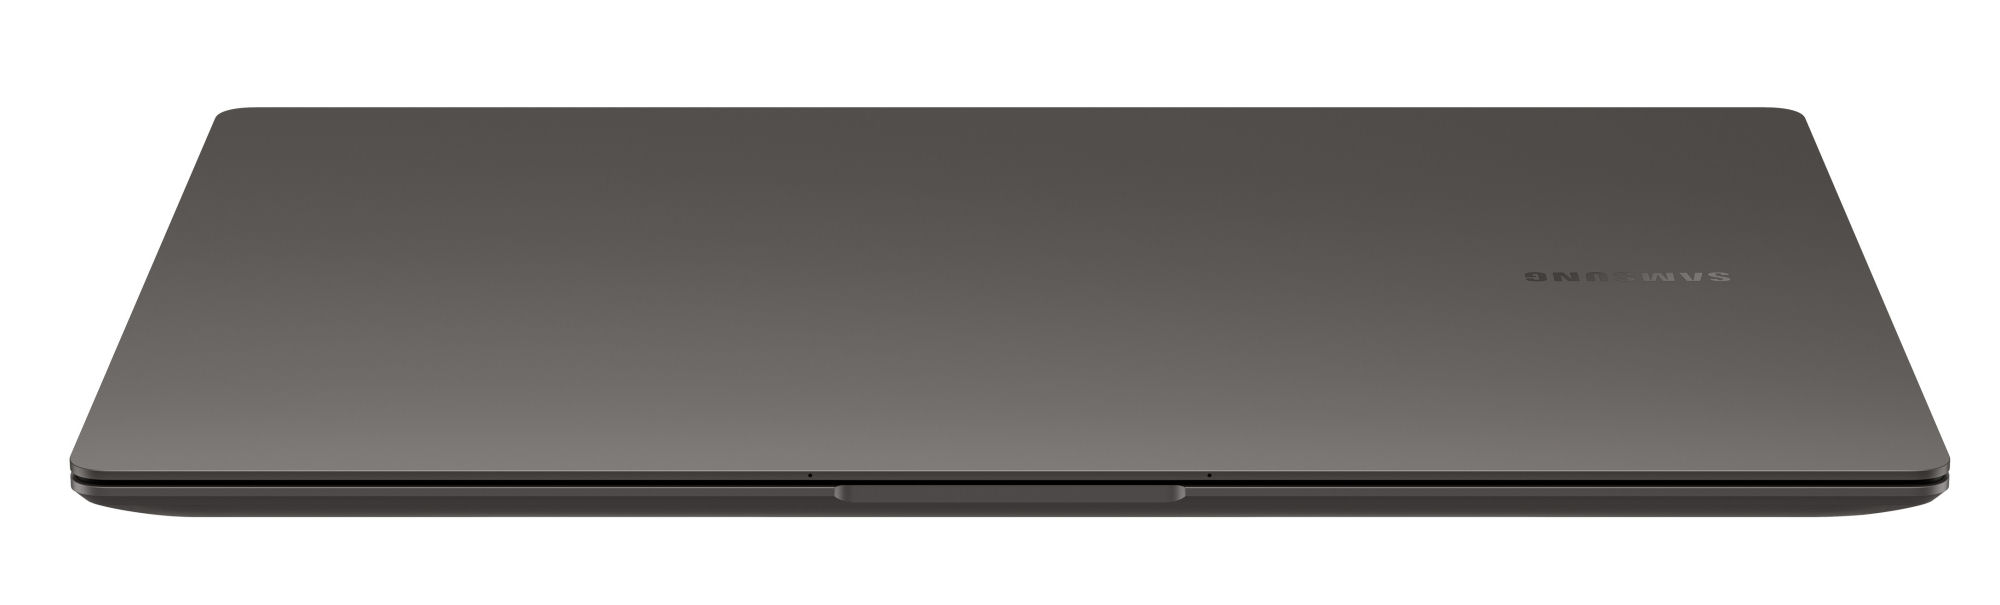

The Galaxy Book3 fundamentally belongs in the category of compact and light notebooks. However, it lands in the middle of the comparison field. Its direct competitor, the Schenker Vision 16 Pro, is a little more compact and lighter. No laptop can match the low weight (1.4 kg) of the LG Gram 17.
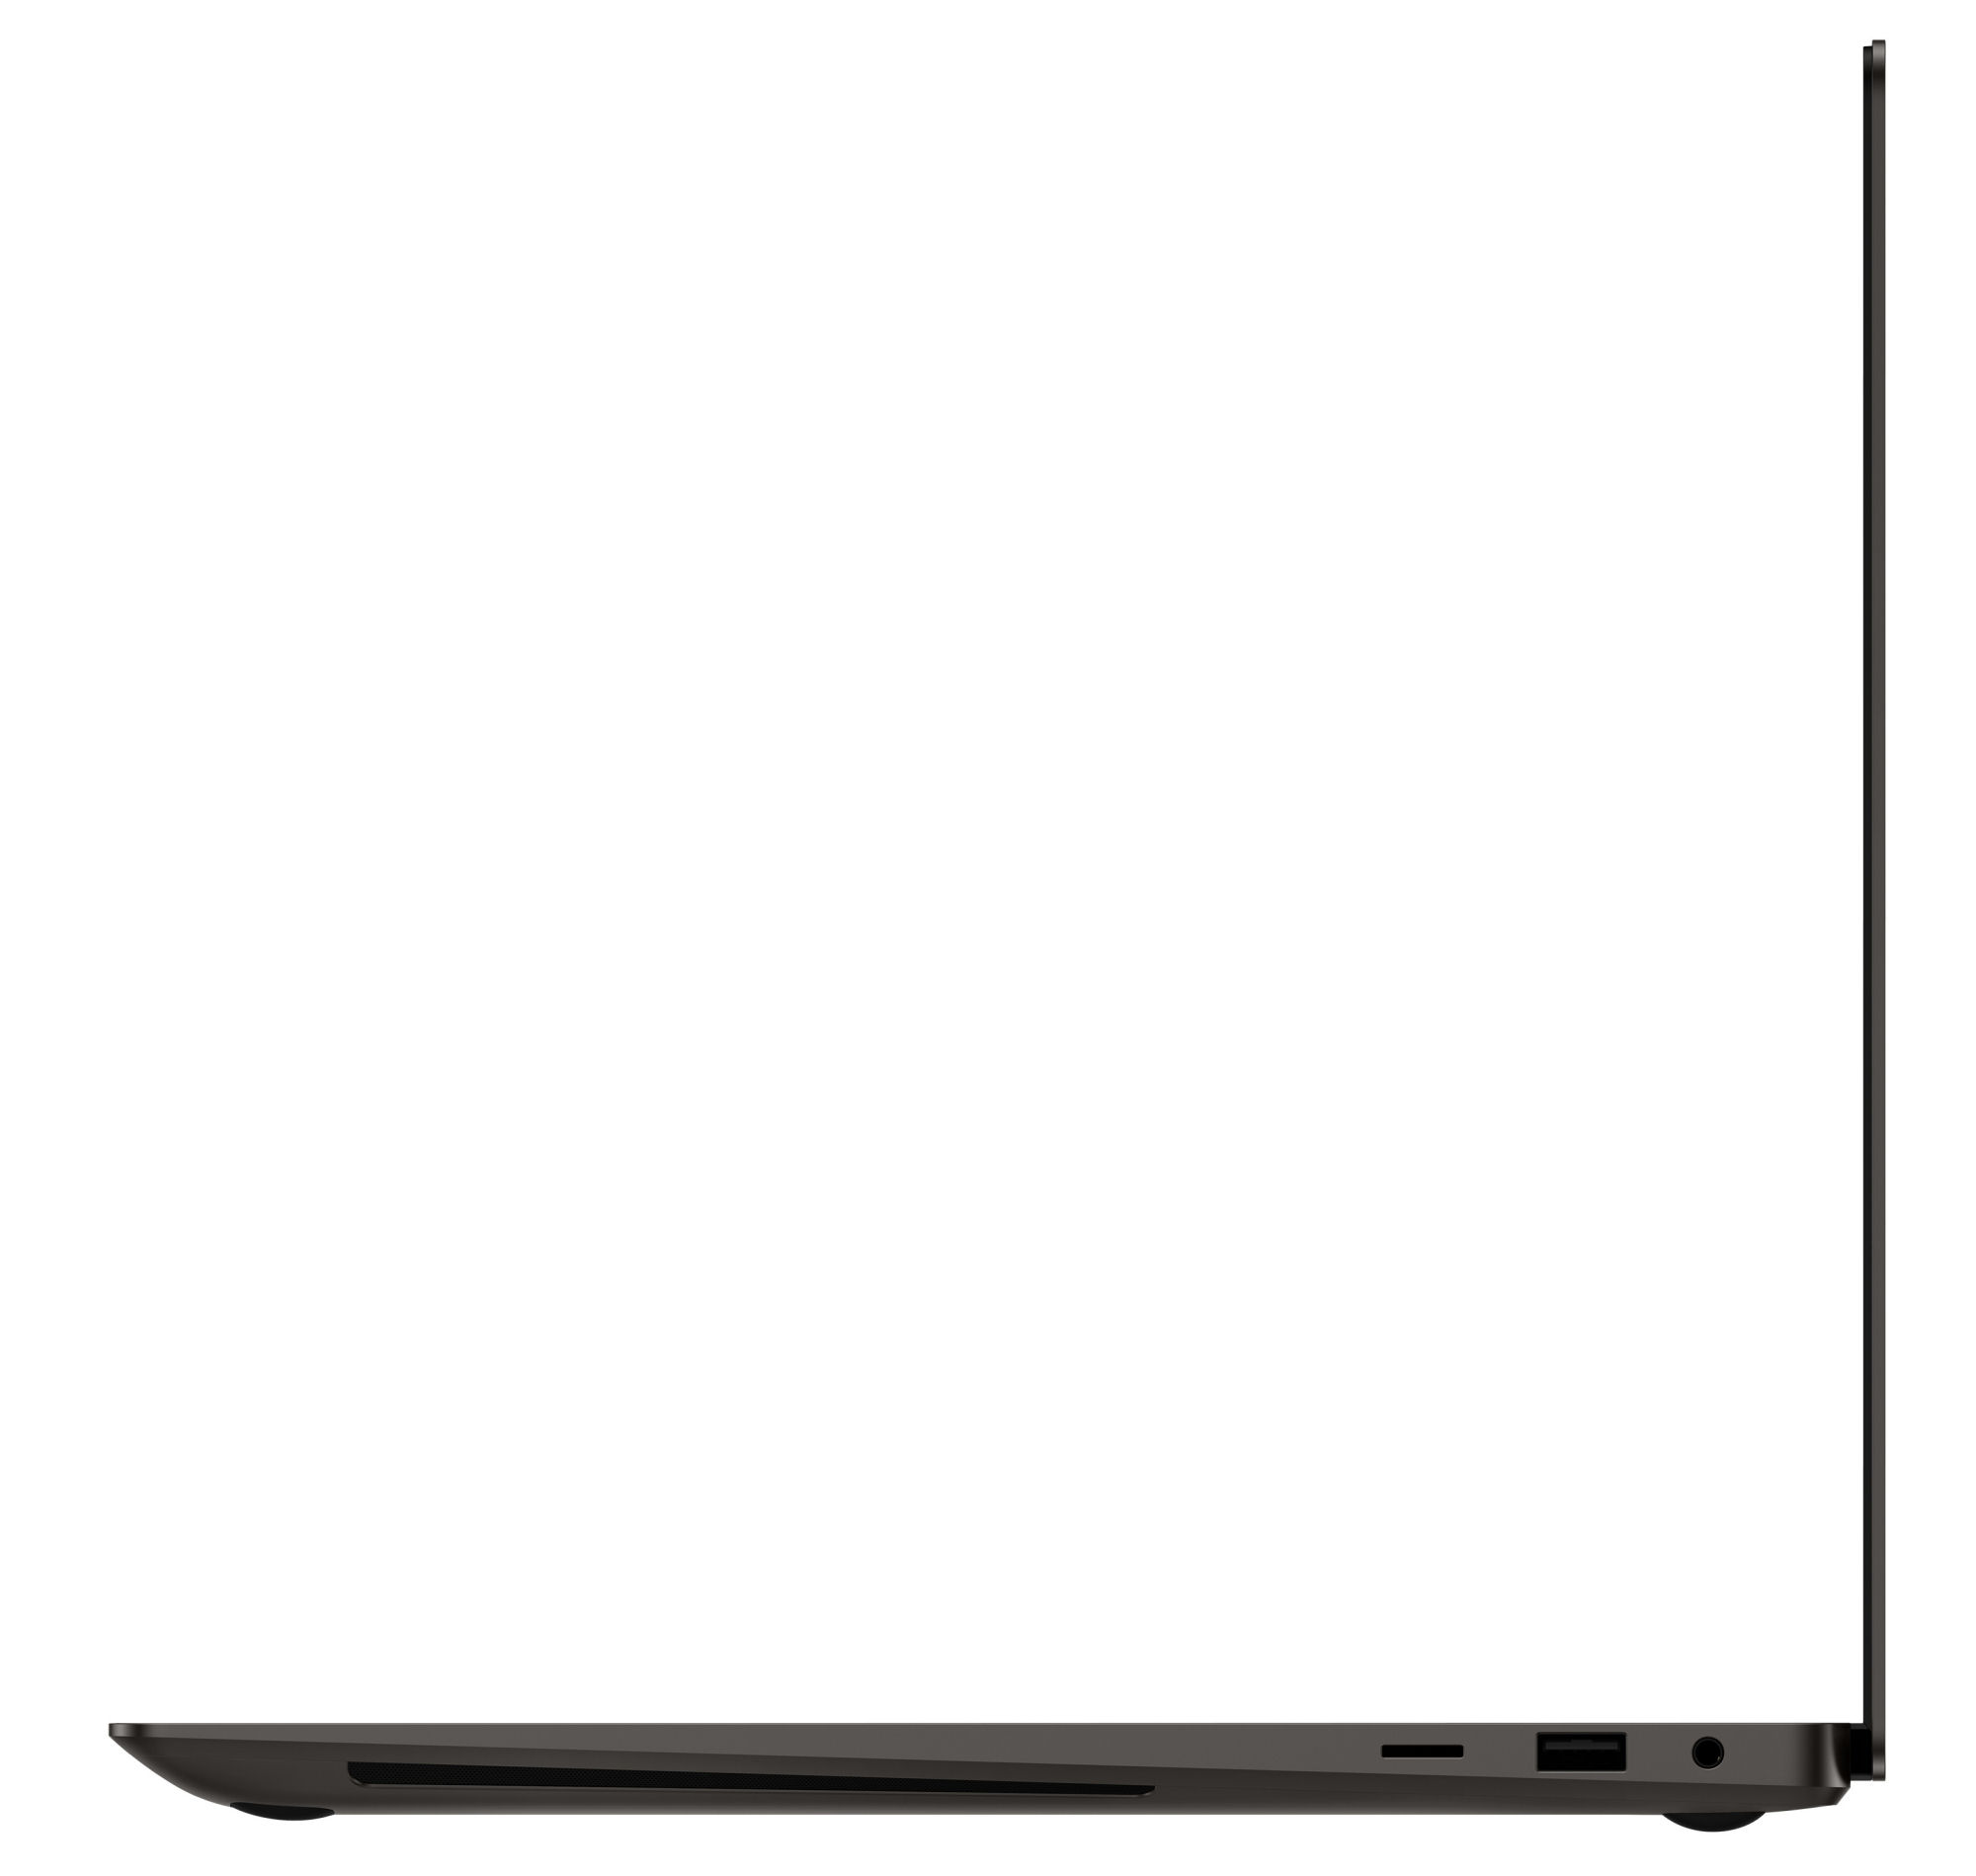
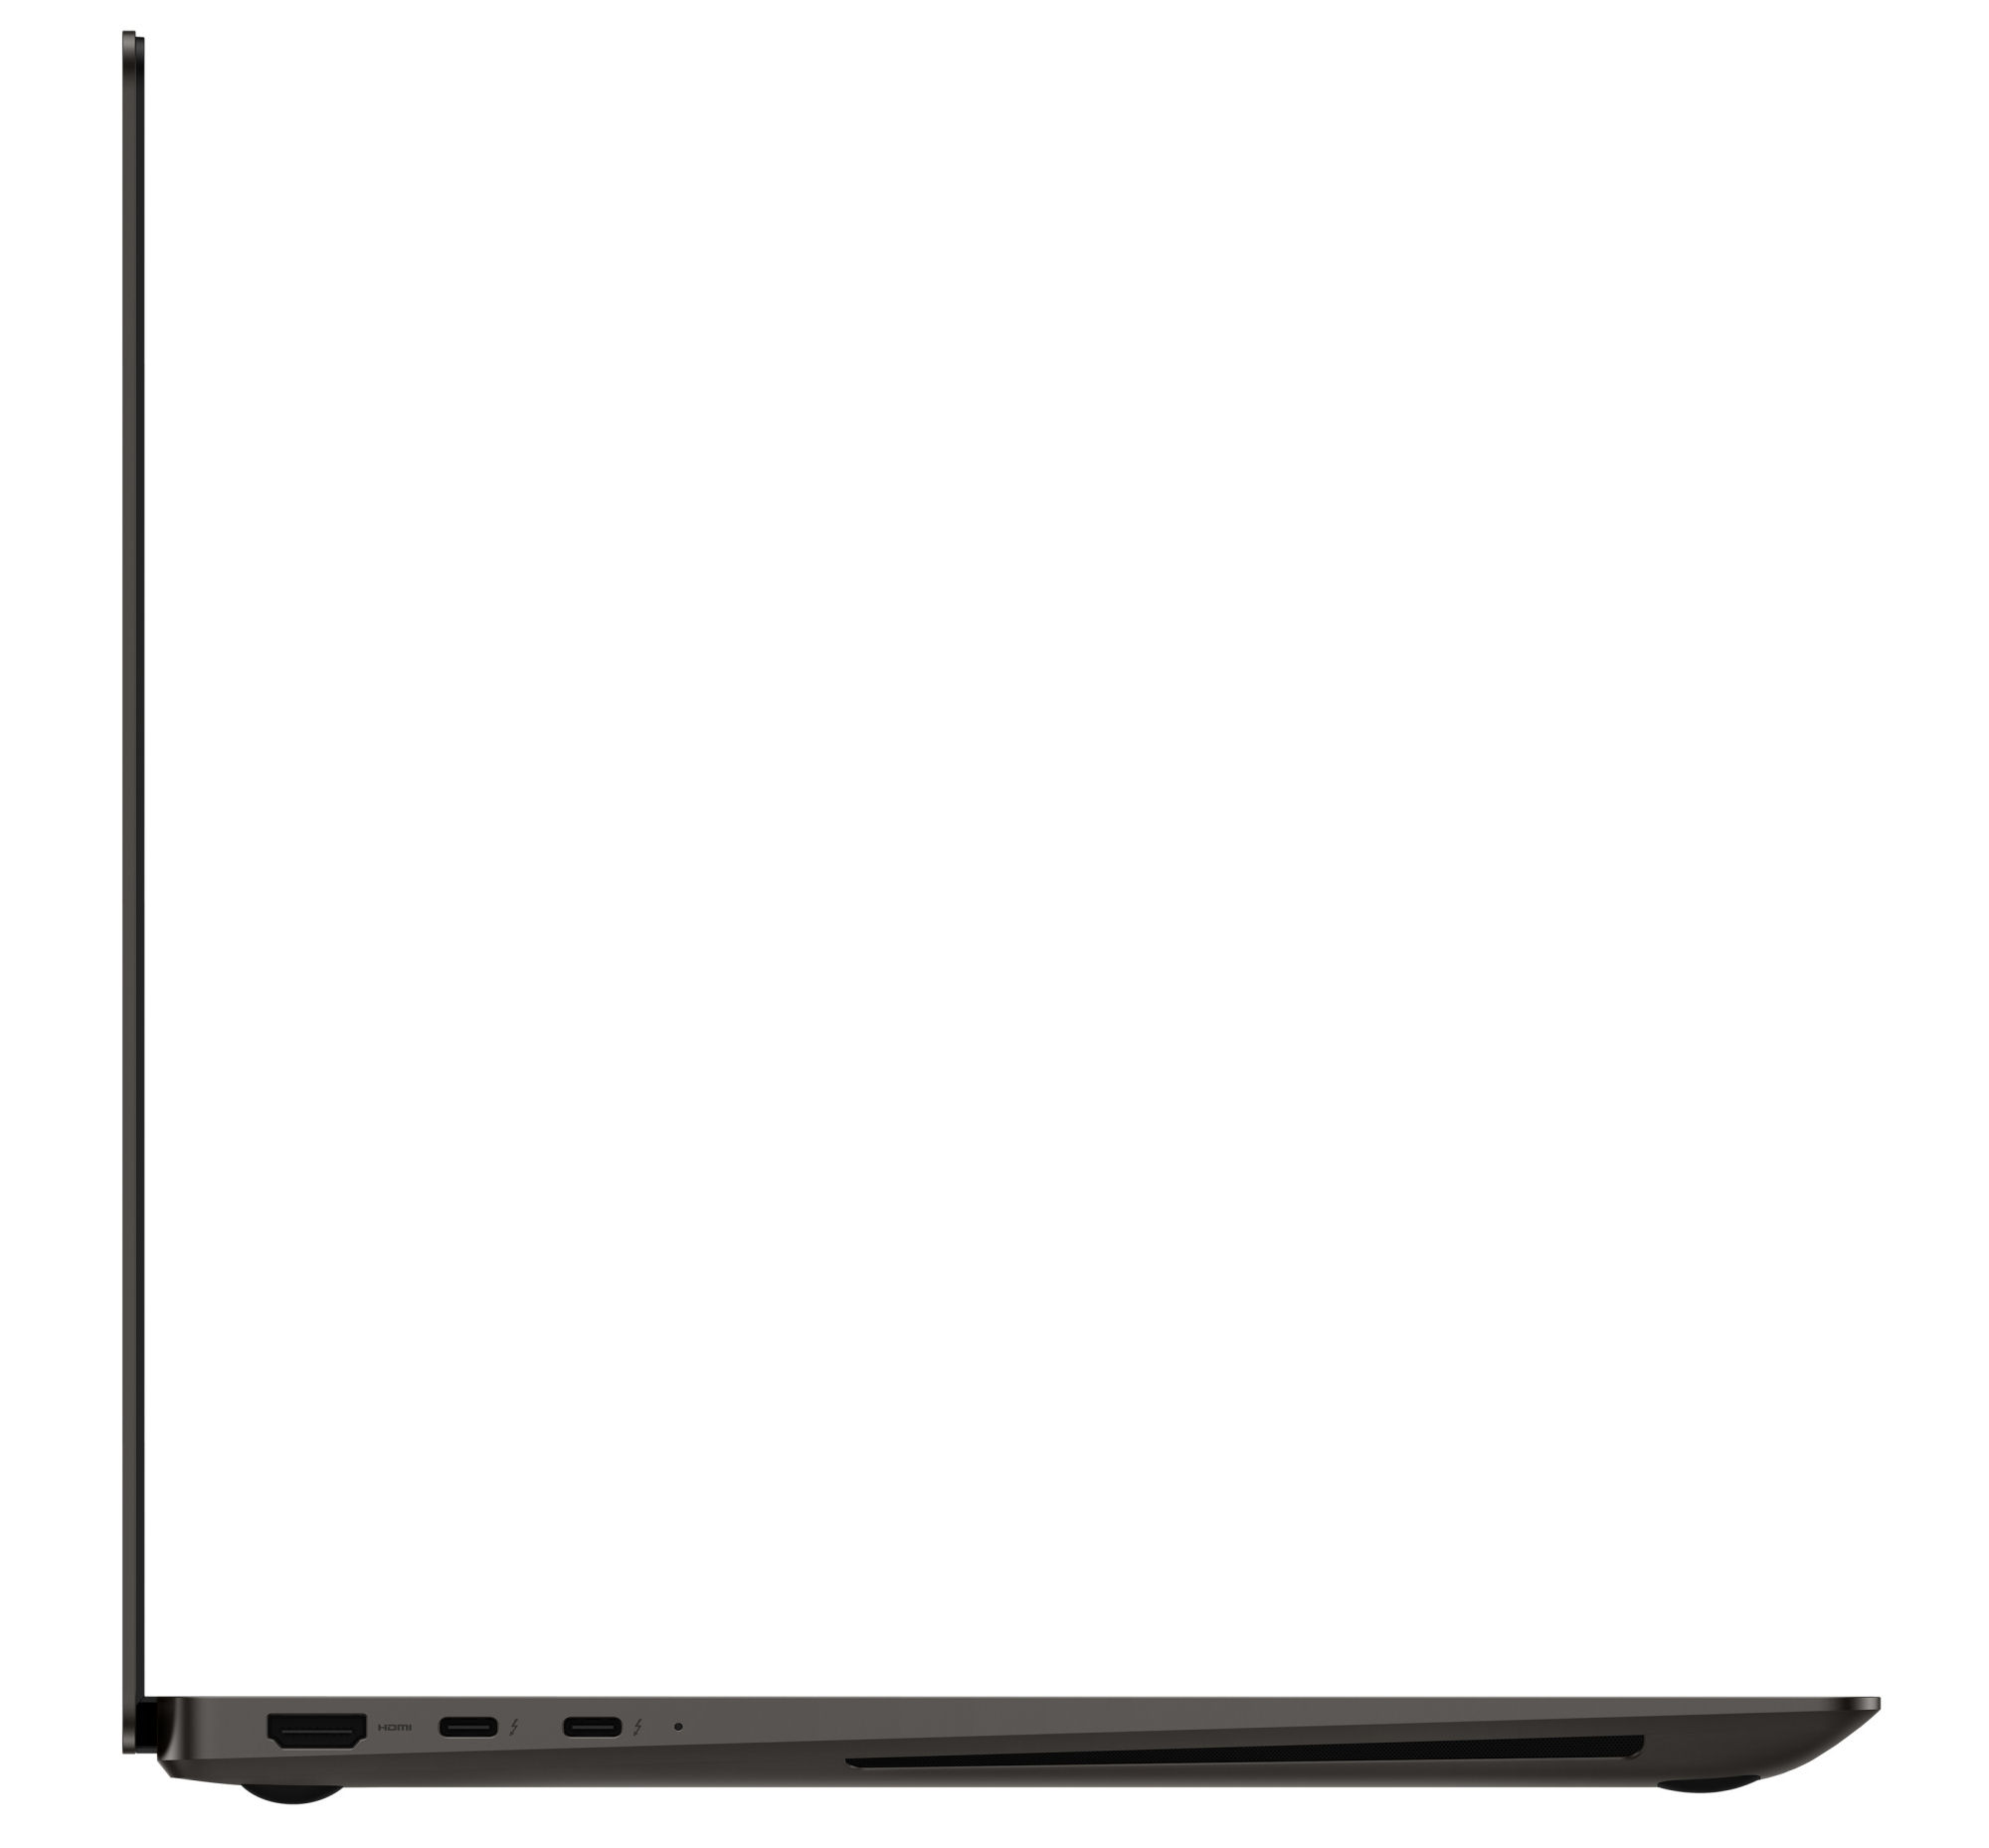
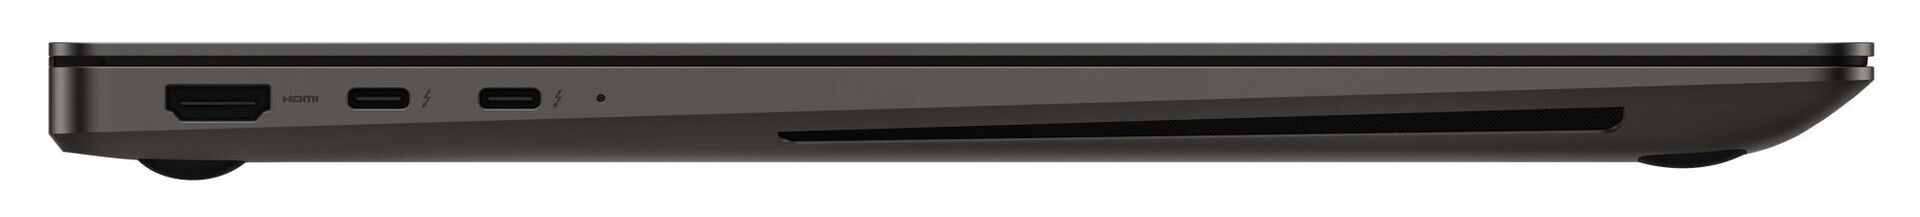
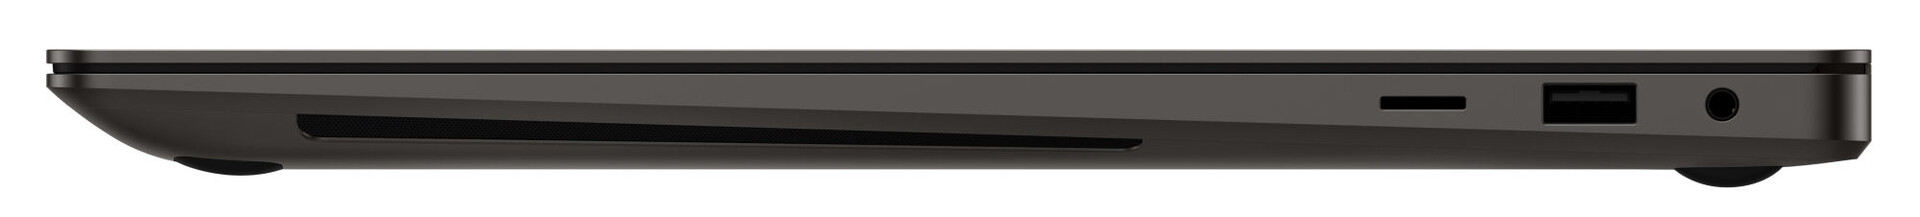
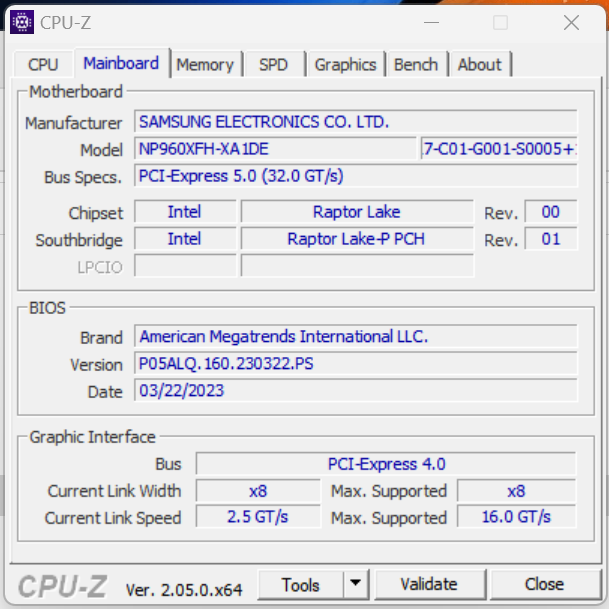
Equipment - Samsung installs Thunderbolt 4 into the Ultra 16
The laptop has one USB-A port (USB 3.2 Gen 1) and two USB-C ports (Thunderbolt 4). The latter can supply the laptop with power (Power Delivery) and also output DisplayPort. There are a total of three video outputs (2x DP, 1x HDMI). Missing ports can be added with a docking station.
The ports are located in the back areas of the right and left sides, so the space next to the palm rest remains free of cables. One downside: all video outputs and power connections are on the left. Installing Thunderbolt 4 on both sides would have made sense here.
SD Card Reader
The microSD memory card reader (reference card: AV PRO microSD 128 GB V60) counts among the medium-fast models with maximum transfer rates of 74 MB/s (transfer of 250 jpg image files with around 5 MB each) and 83 MB/s (copying of large data blocks).
| SD Card Reader | |
| average JPG Copy Test (av. of 3 runs) | |
| Dell XPS 15 9520 RTX 3050 Ti (Toshiba Exceria Pro SDXC 64 GB UHS-II) | |
| Average of class Multimedia (17.6 - 205, n=66, last 2 years) | |
| SCHENKER Vision 16 Pro RTX 3070 Ti (AV Pro V60) | |
| Lenovo ThinkBook 16p G3 ARH (AV PRO microSD 128 GB V60) | |
| LG Gram 17Z90Q-E.AD78G (AV Pro SD microSD 128 GB V60) | |
| Samsung Galaxy Book3 Ultra 16 (AV PRO microSD 128 GB V60) | |
| Asus VivoBook Pro 16X OLED N7600PC-L2026X | |
| maximum AS SSD Seq Read Test (1GB) | |
| Dell XPS 15 9520 RTX 3050 Ti (Toshiba Exceria Pro SDXC 64 GB UHS-II) | |
| Average of class Multimedia (16.8 - 266, n=62, last 2 years) | |
| LG Gram 17Z90Q-E.AD78G (AV Pro SD microSD 128 GB V60) | |
| Lenovo ThinkBook 16p G3 ARH (AV PRO microSD 128 GB V60) | |
| Samsung Galaxy Book3 Ultra 16 (AV PRO microSD 128 GB V60) | |
| SCHENKER Vision 16 Pro RTX 3070 Ti (AV Pro V60) | |
| Asus VivoBook Pro 16X OLED N7600PC-L2026X | |
Communication
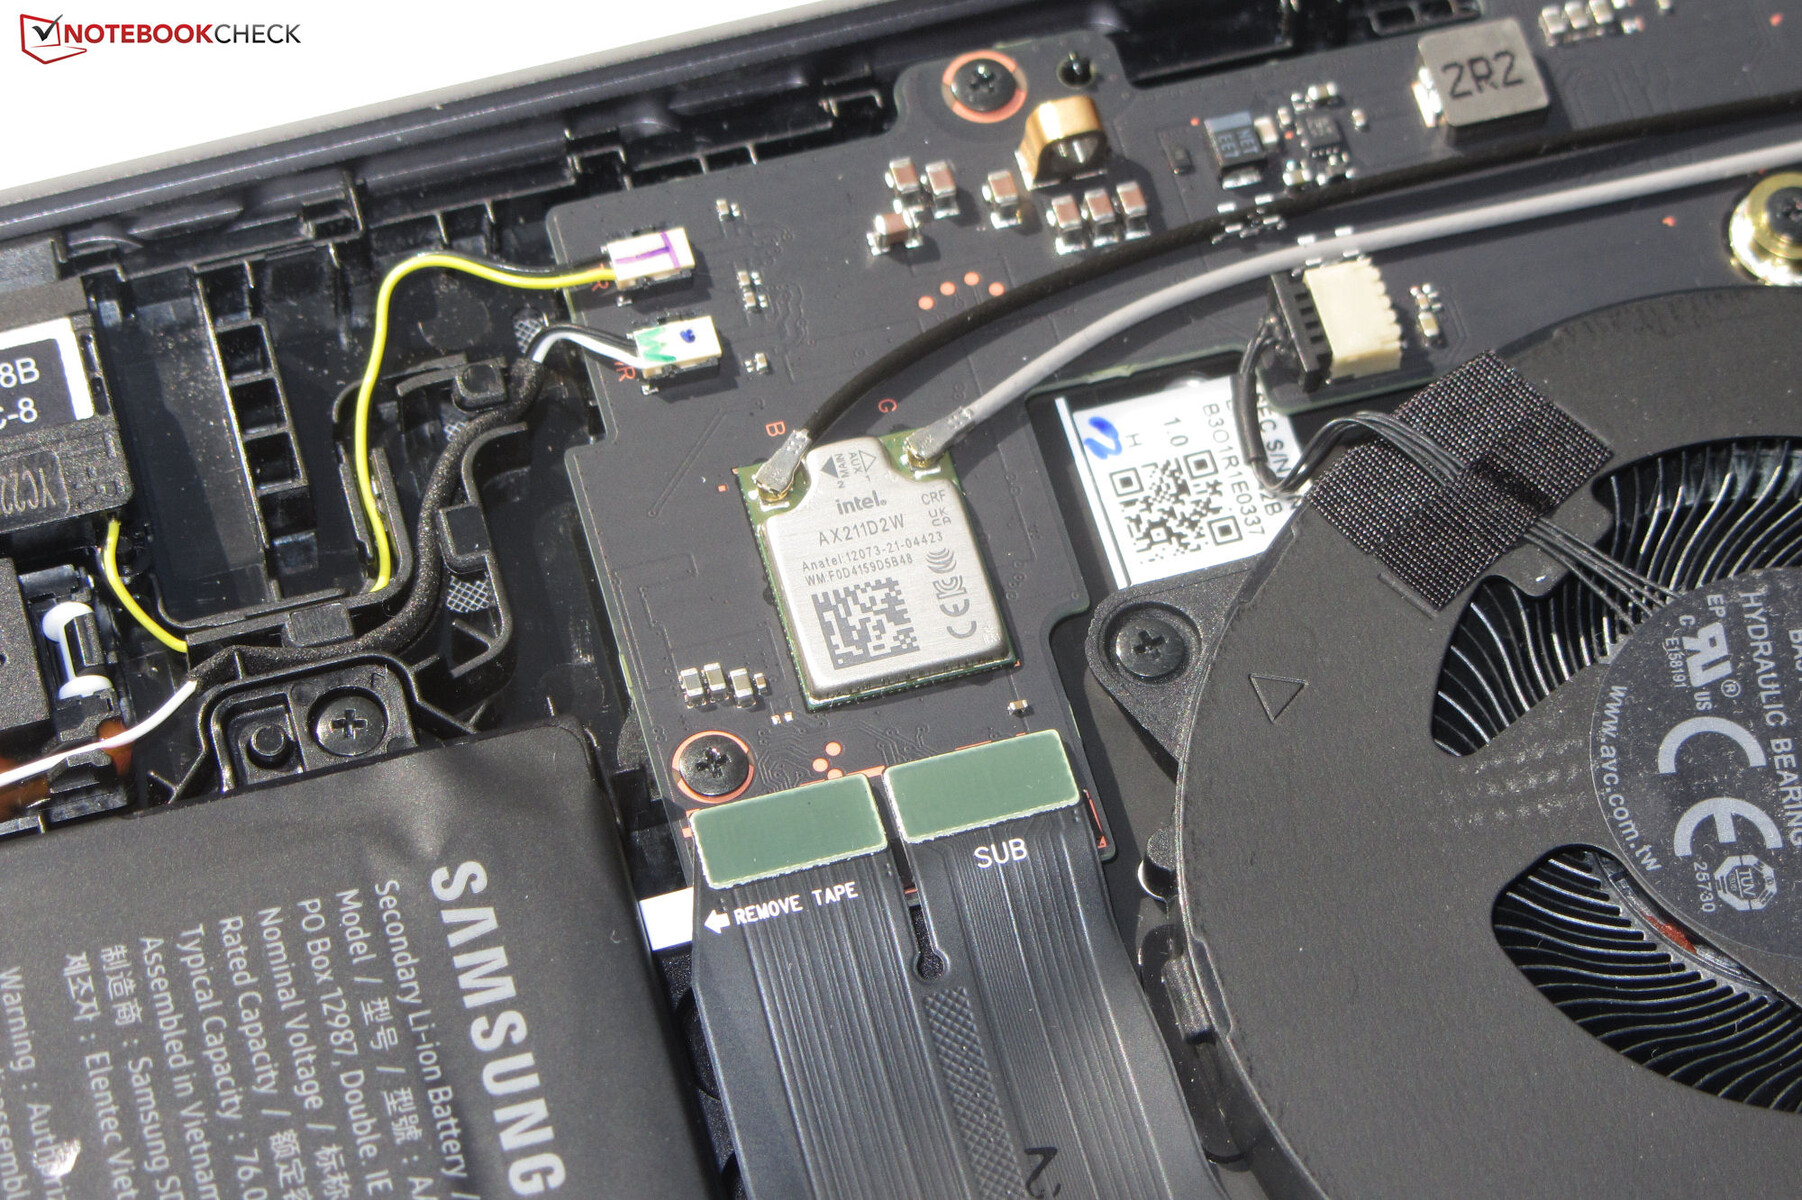
Excellent WiFi data rates are achieved under optimal conditions (no WLAN devices in the near vicinity, small distance between laptop and server PC). The Samsung notebook has a WiFi 6E chip (Intel AX211) on board. An Ethernet slot is not available.
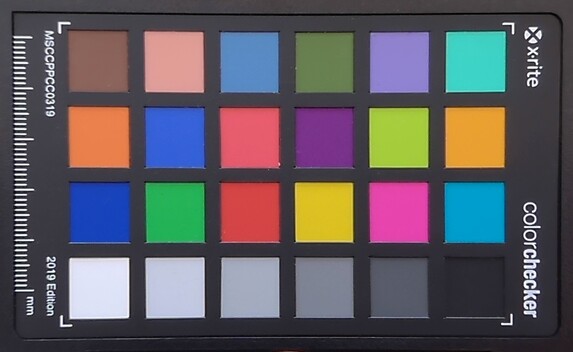
Webcam
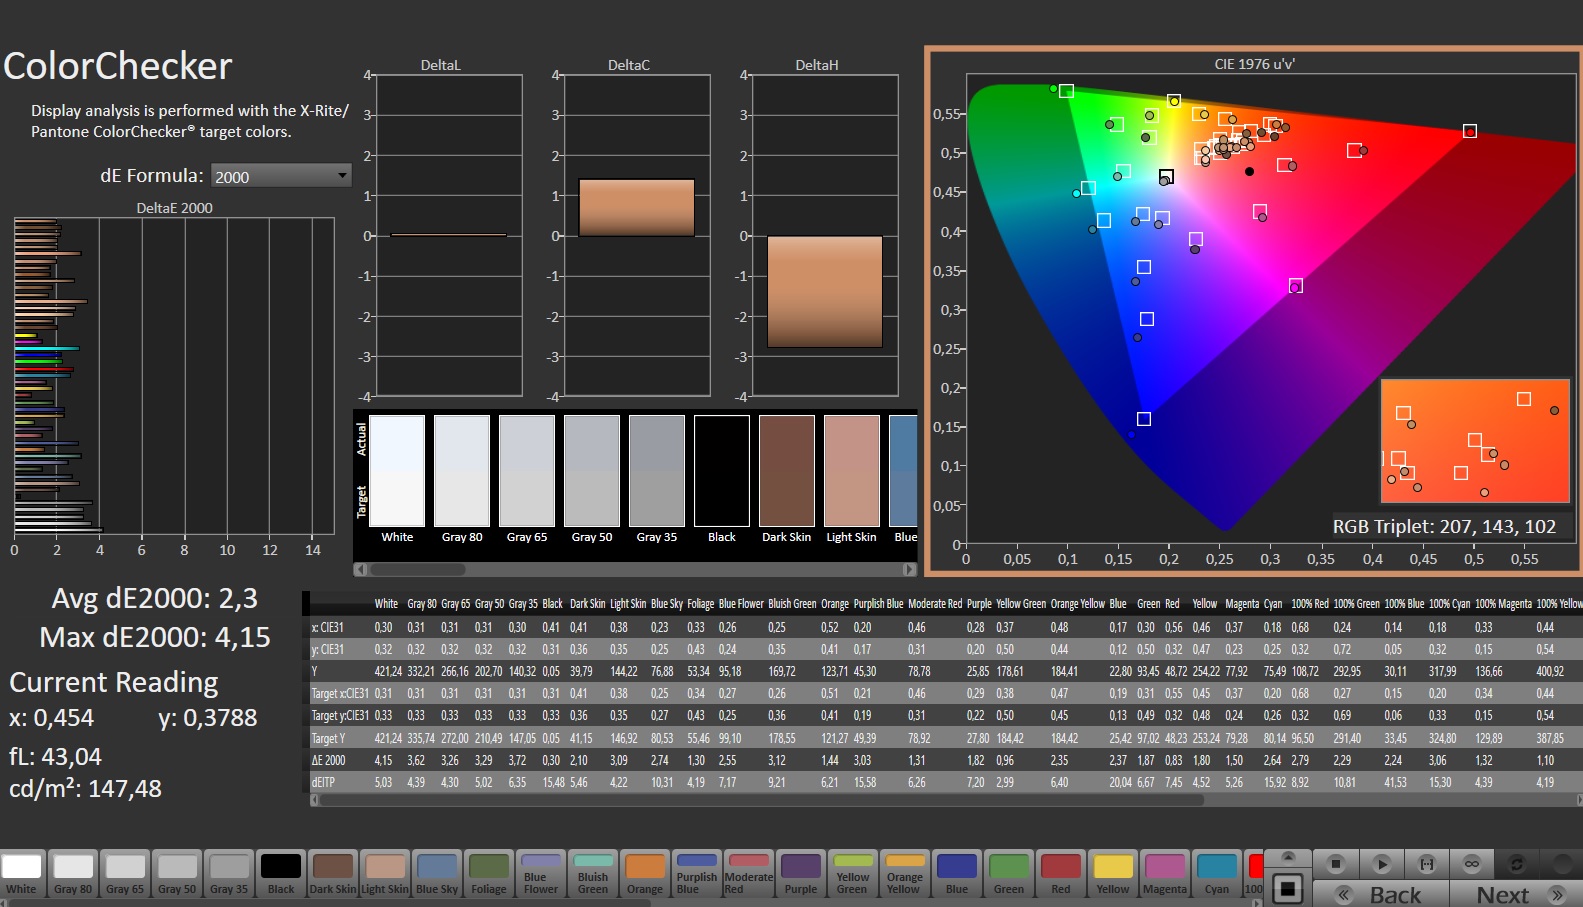
The webcam (2.1 MP, max. 1,920 x 1,080) does not have a mechanical shutter. Qualitatively, it delivers standard fare. Color accuracy is a problem, as the target (DeltaE less than 3) is missed with a color deviation of almost 8.


Accessories
Apart from the usual documents (warranty information, quick start guide), the notebook does not come with any other accessories.
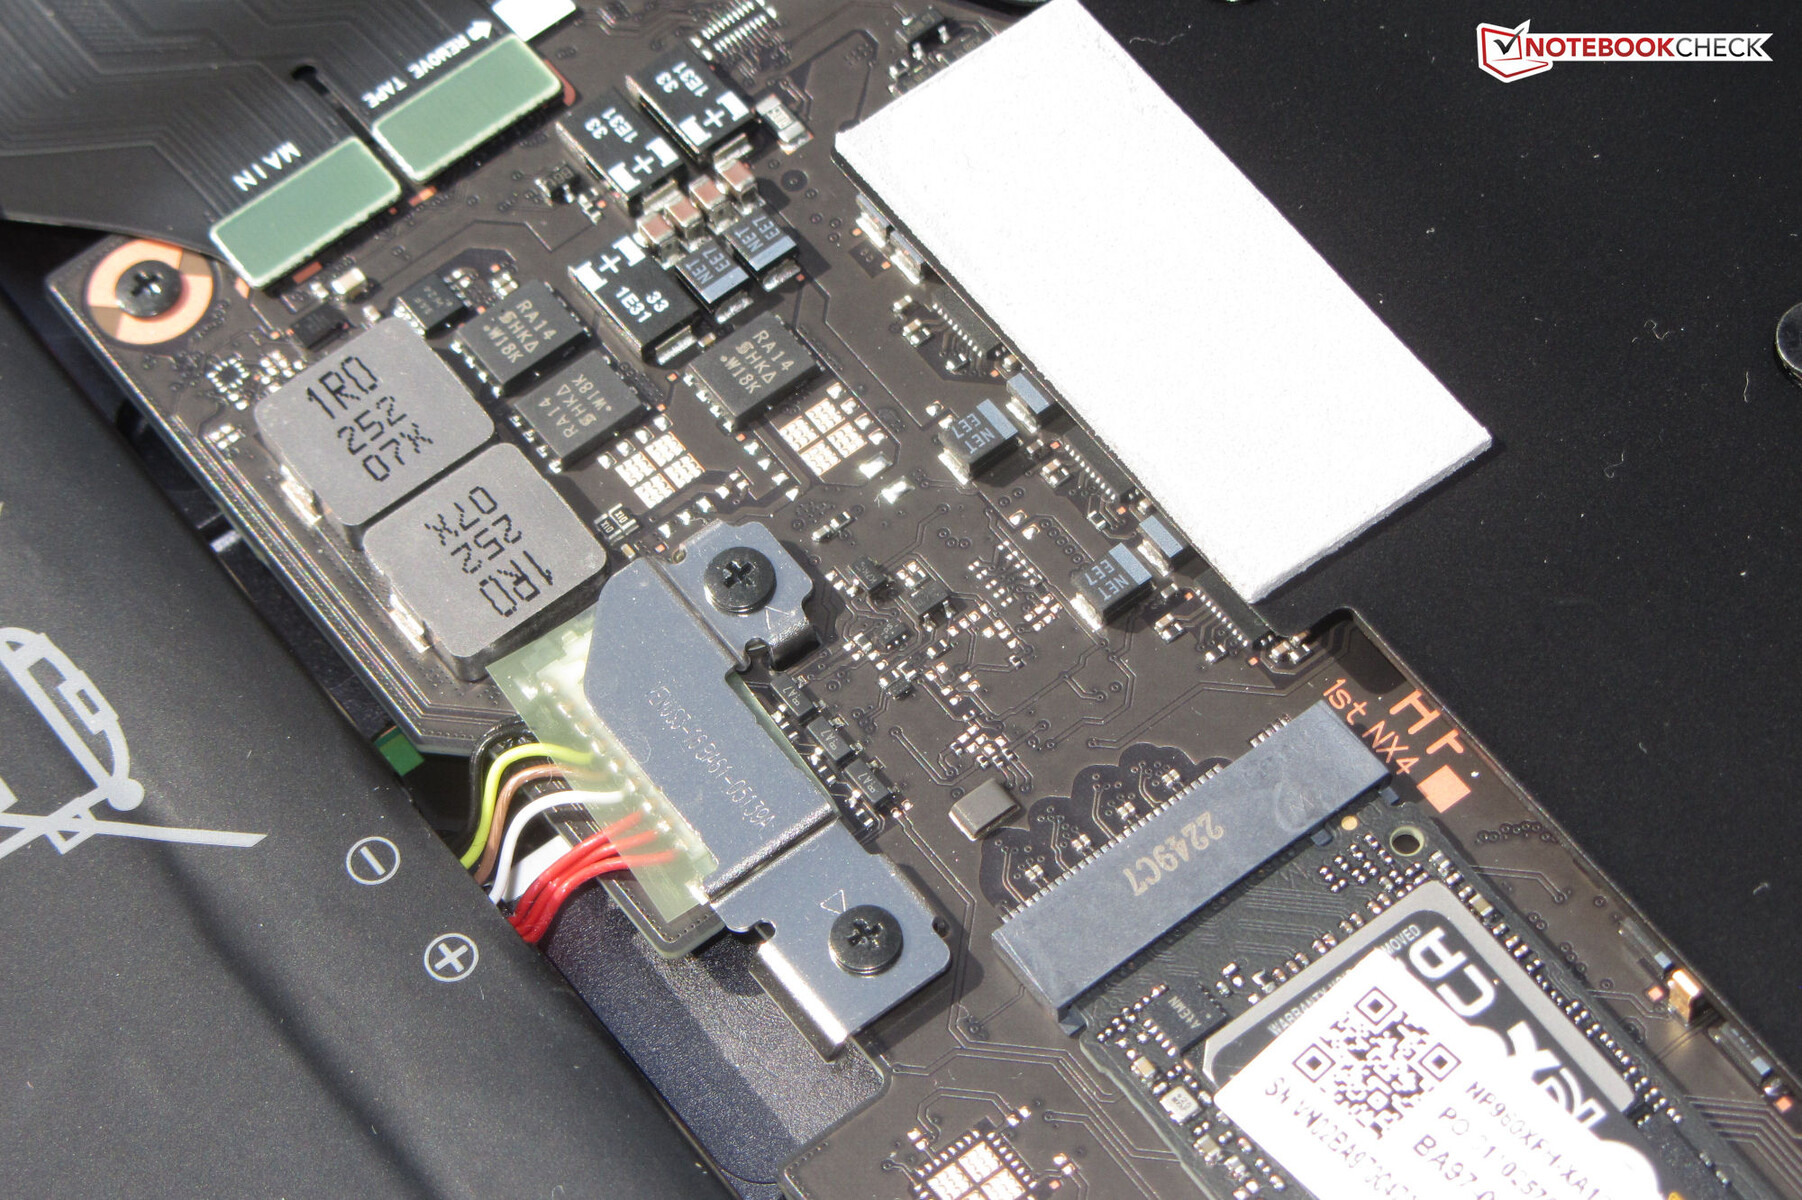
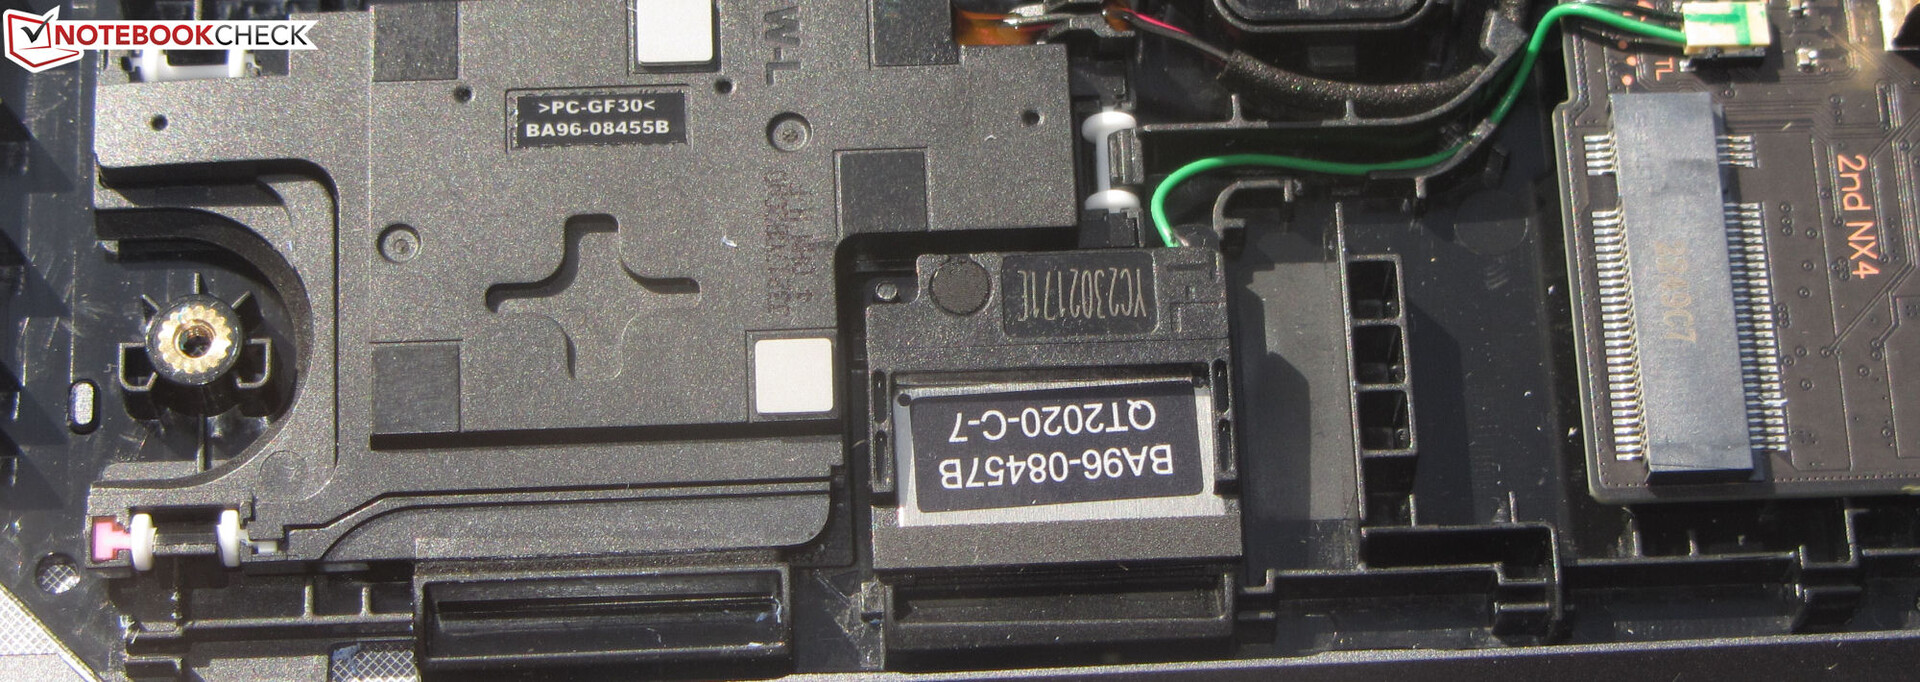
Maintenance
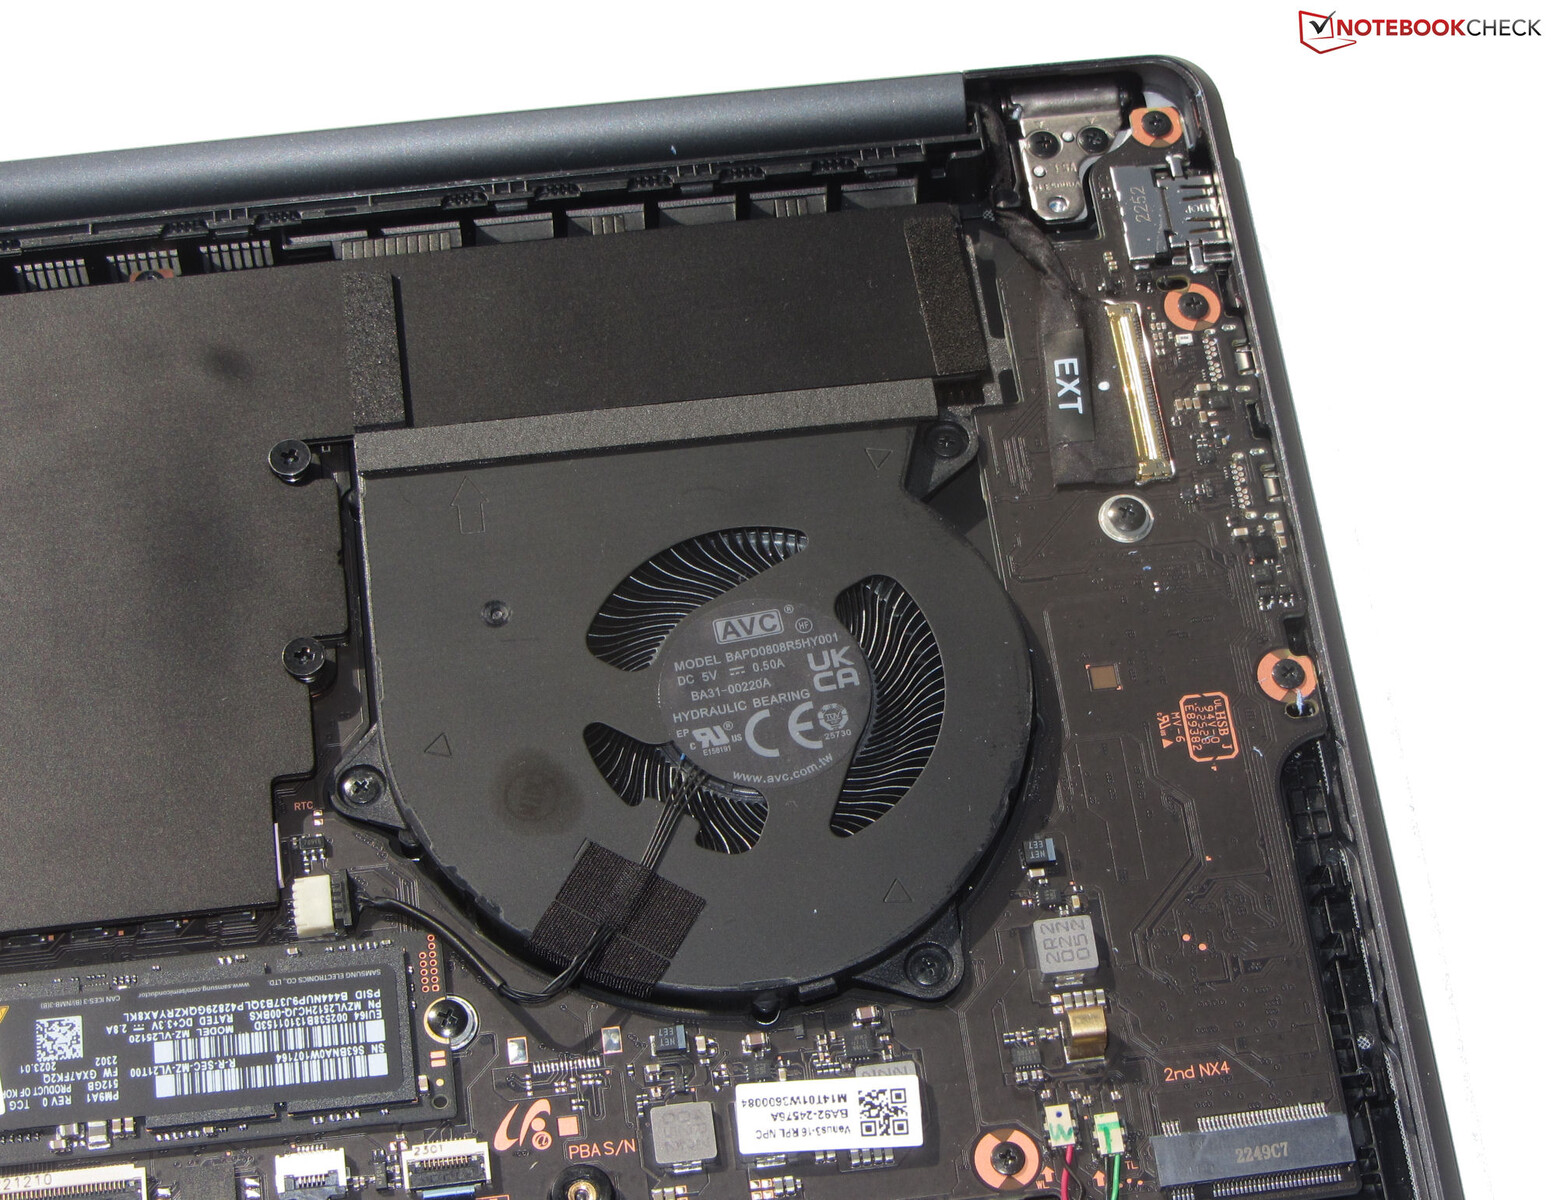
Dismantling the bottom cover requires removing all screws that are hidden under the four rubber feet (inserted, not glued). After that, you should exercise care (!) in removing the bottom cover, which is very tight and can be damaged. We recommend using a flat spatula. Afterwards, the SSD (PCIe 4, M.2-2280), the second SSD slot, the fans, the speakers and the battery can be accessed.
Warranty
Samsung grants the 16-incher a two-year warranty in Germany. An extension by one or two years costs EUR 79 and 149, respectively. These terms may differ in other countries, so buyers should double-check before purchasing.
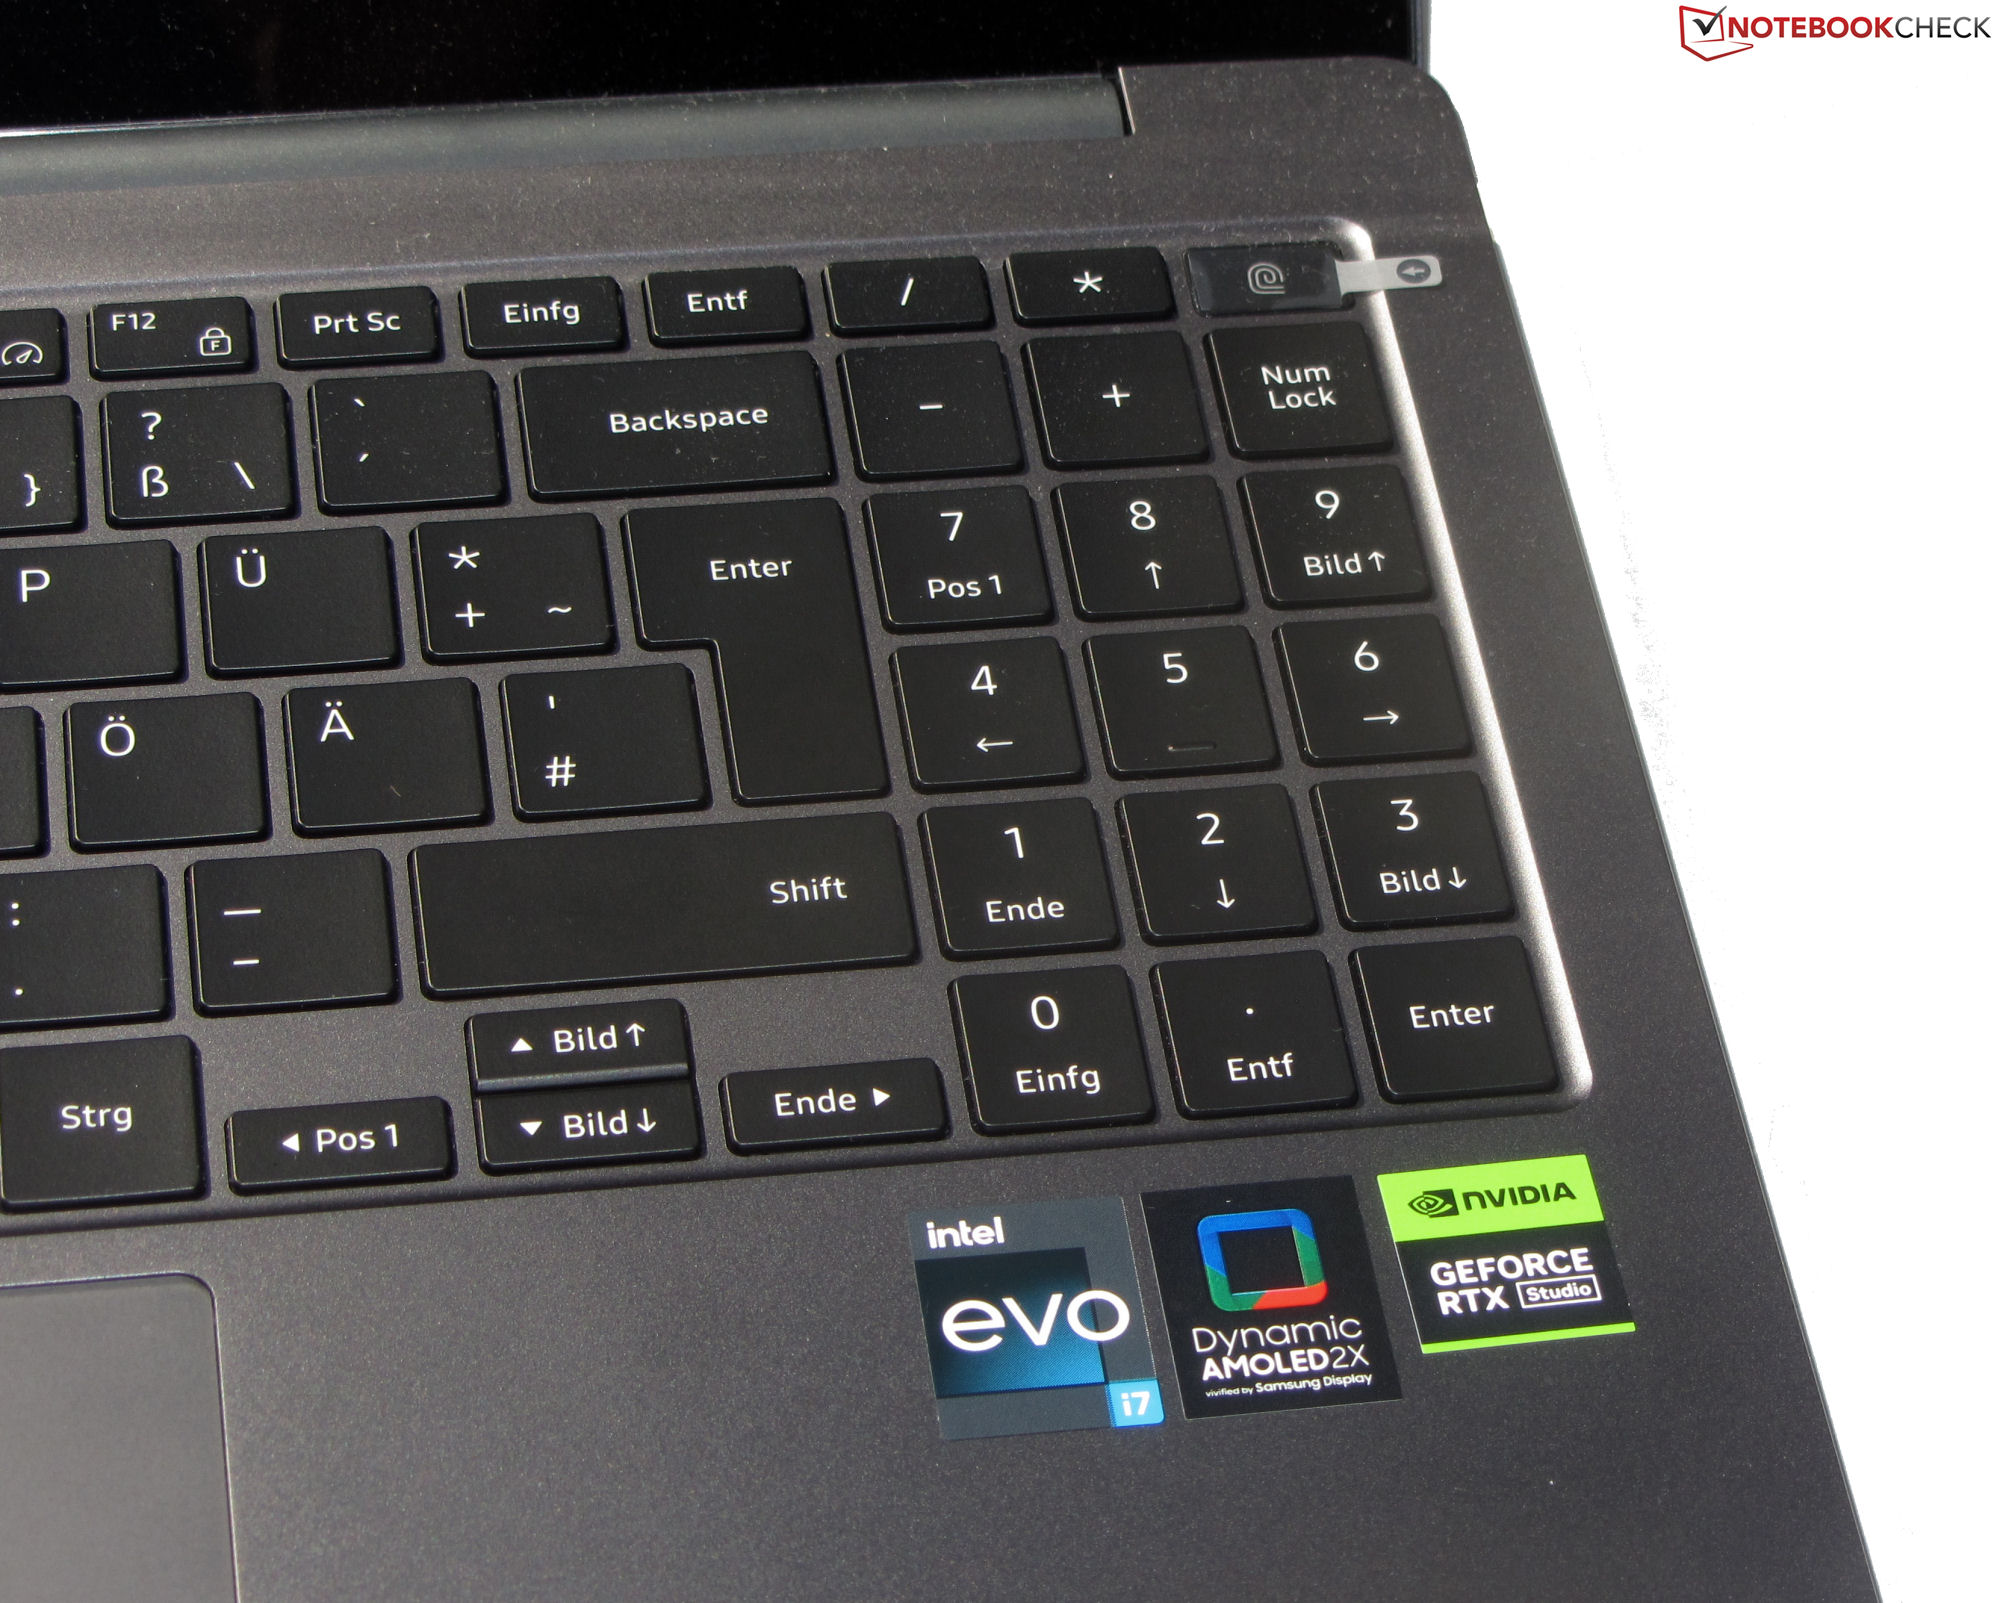
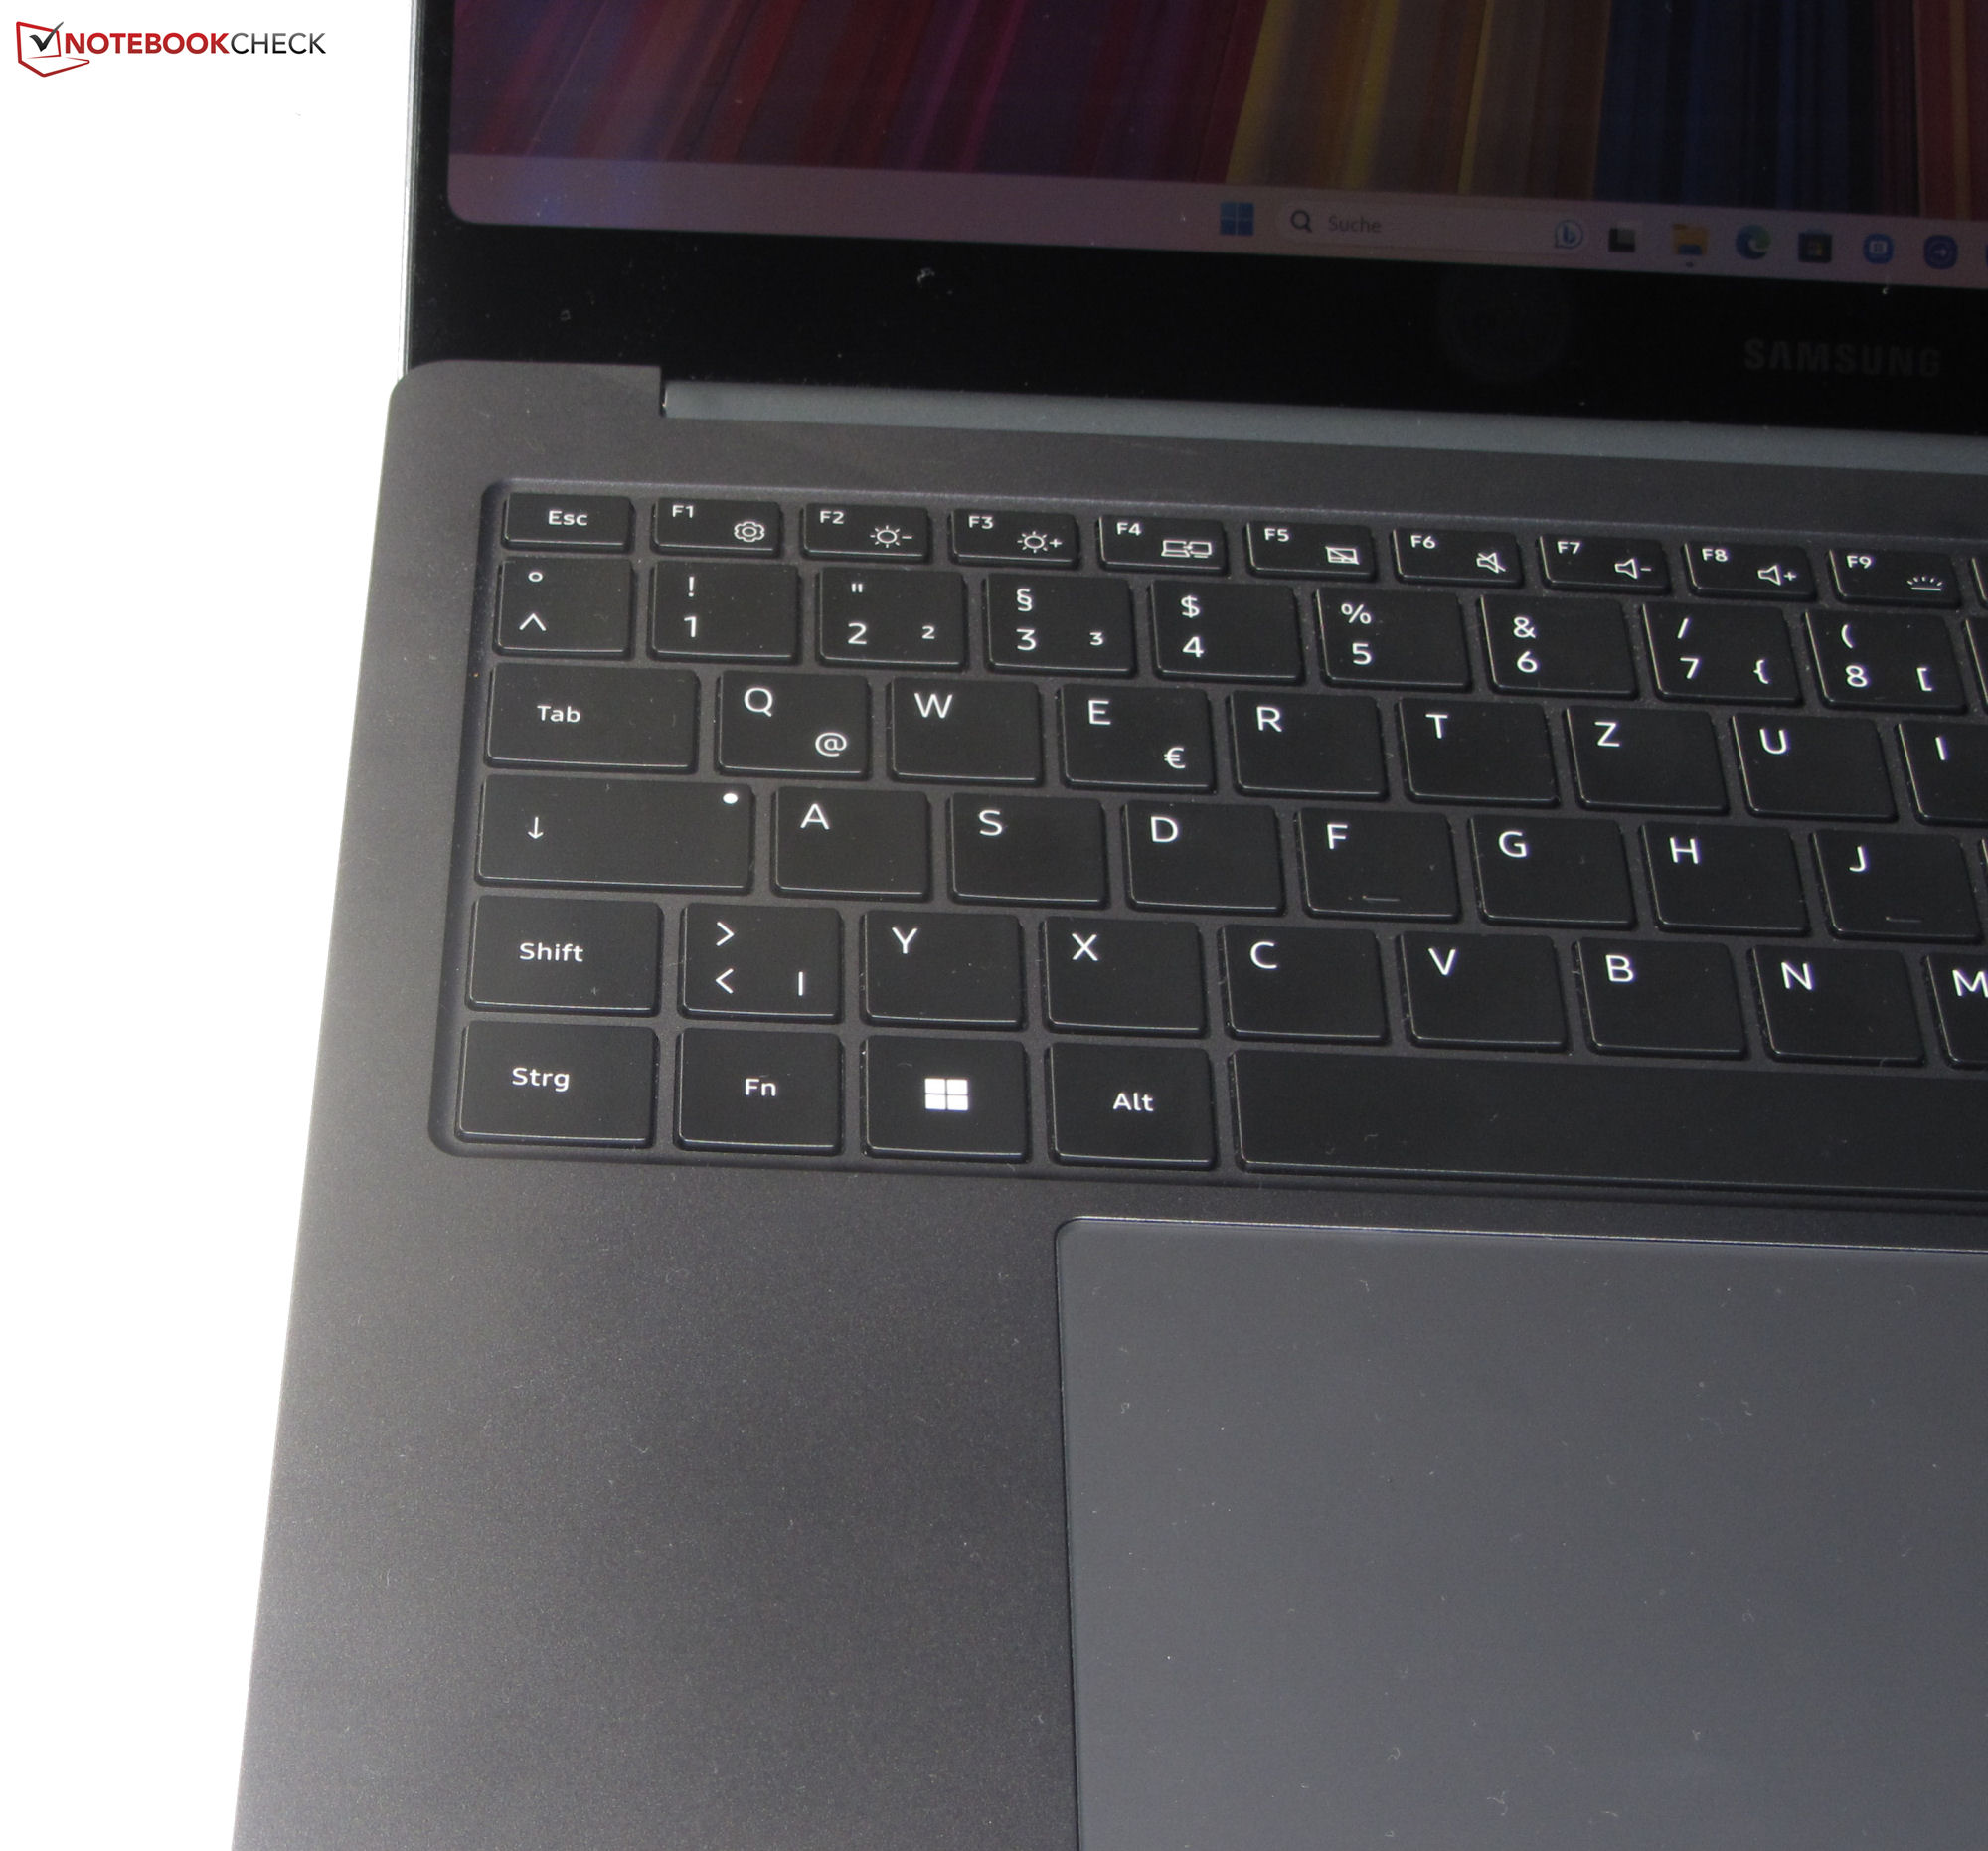
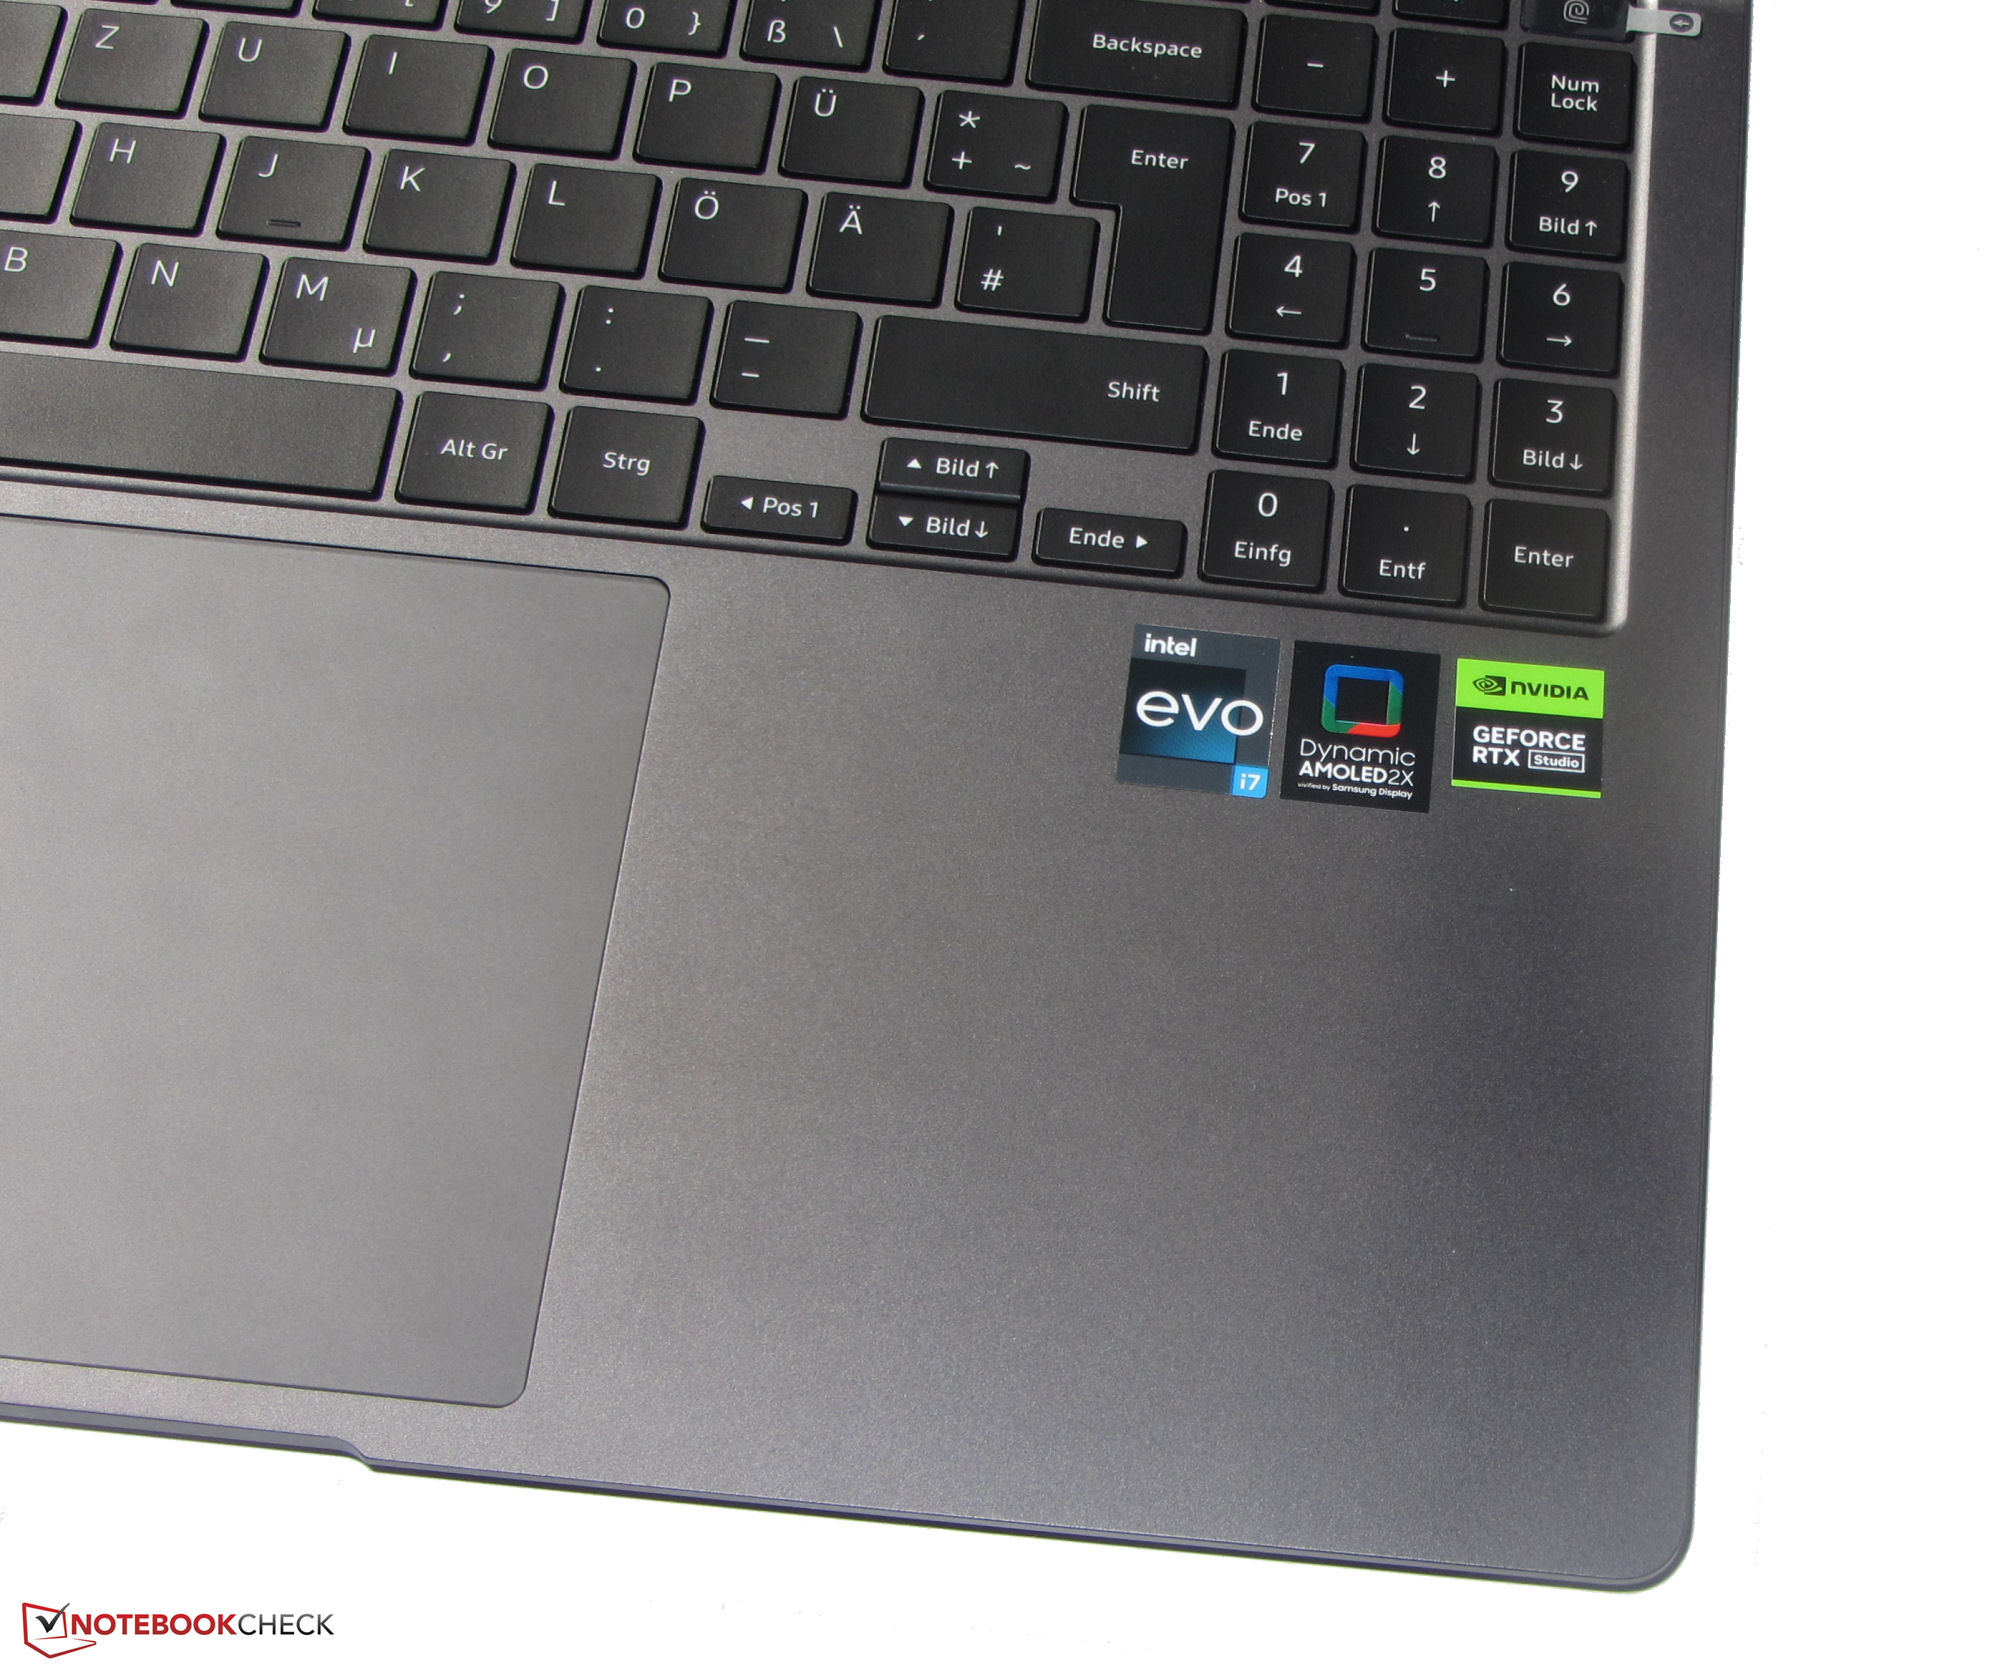
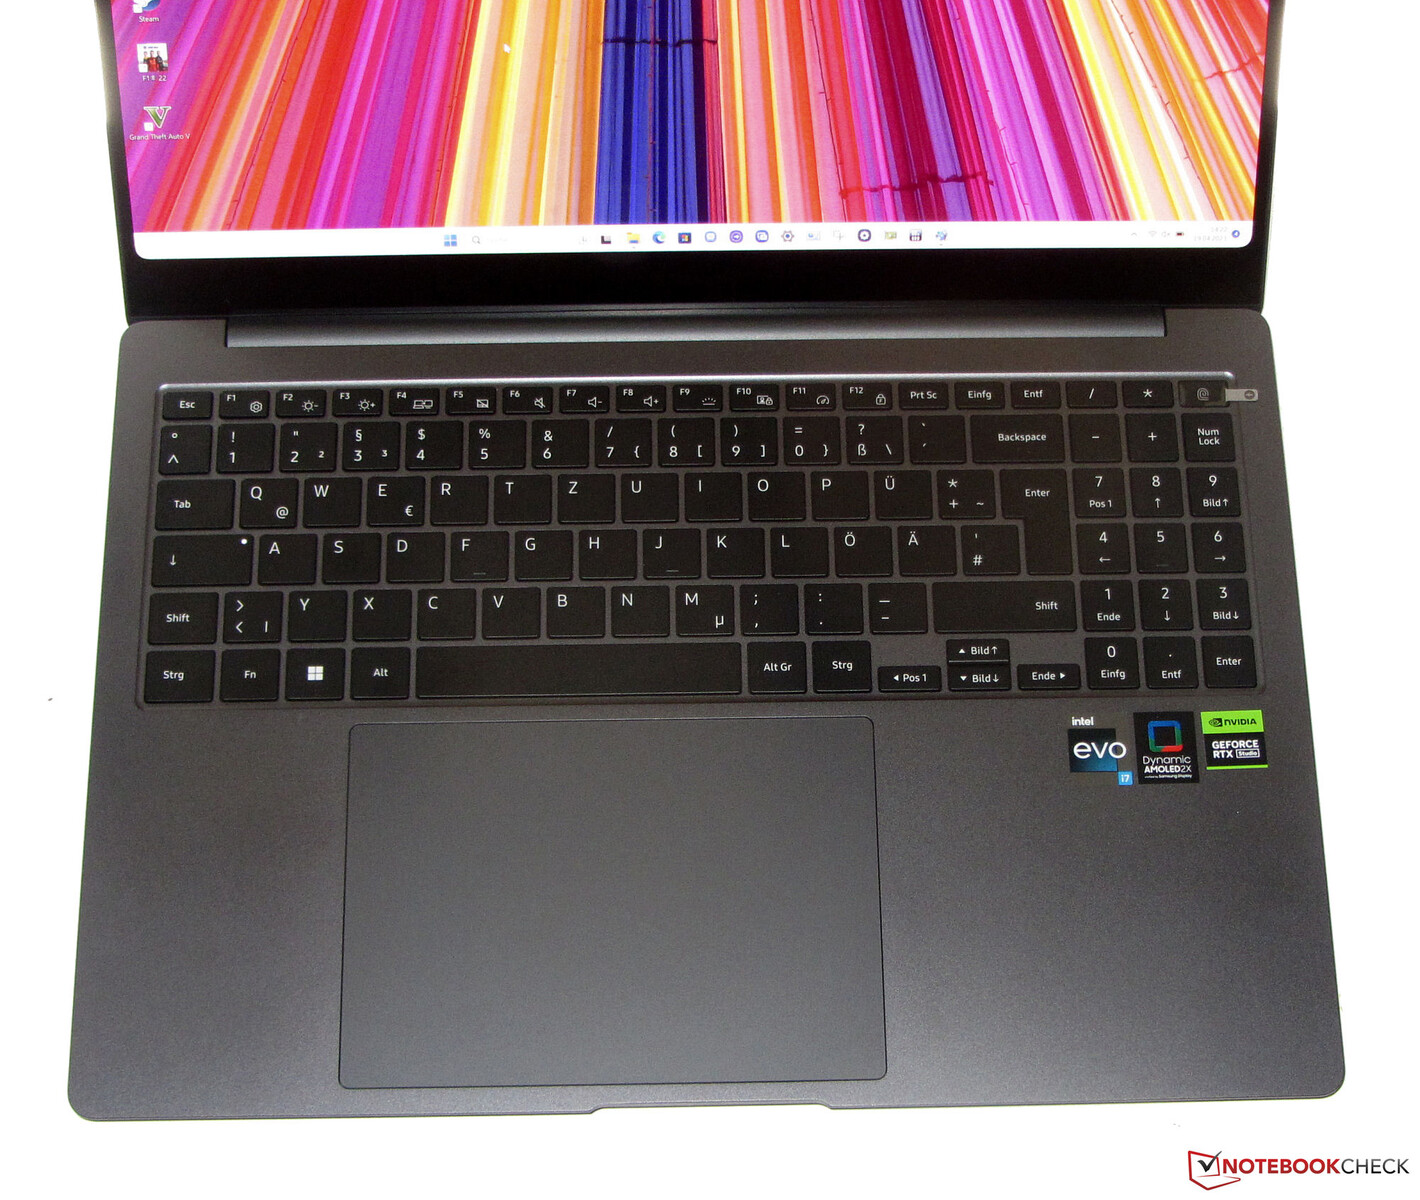
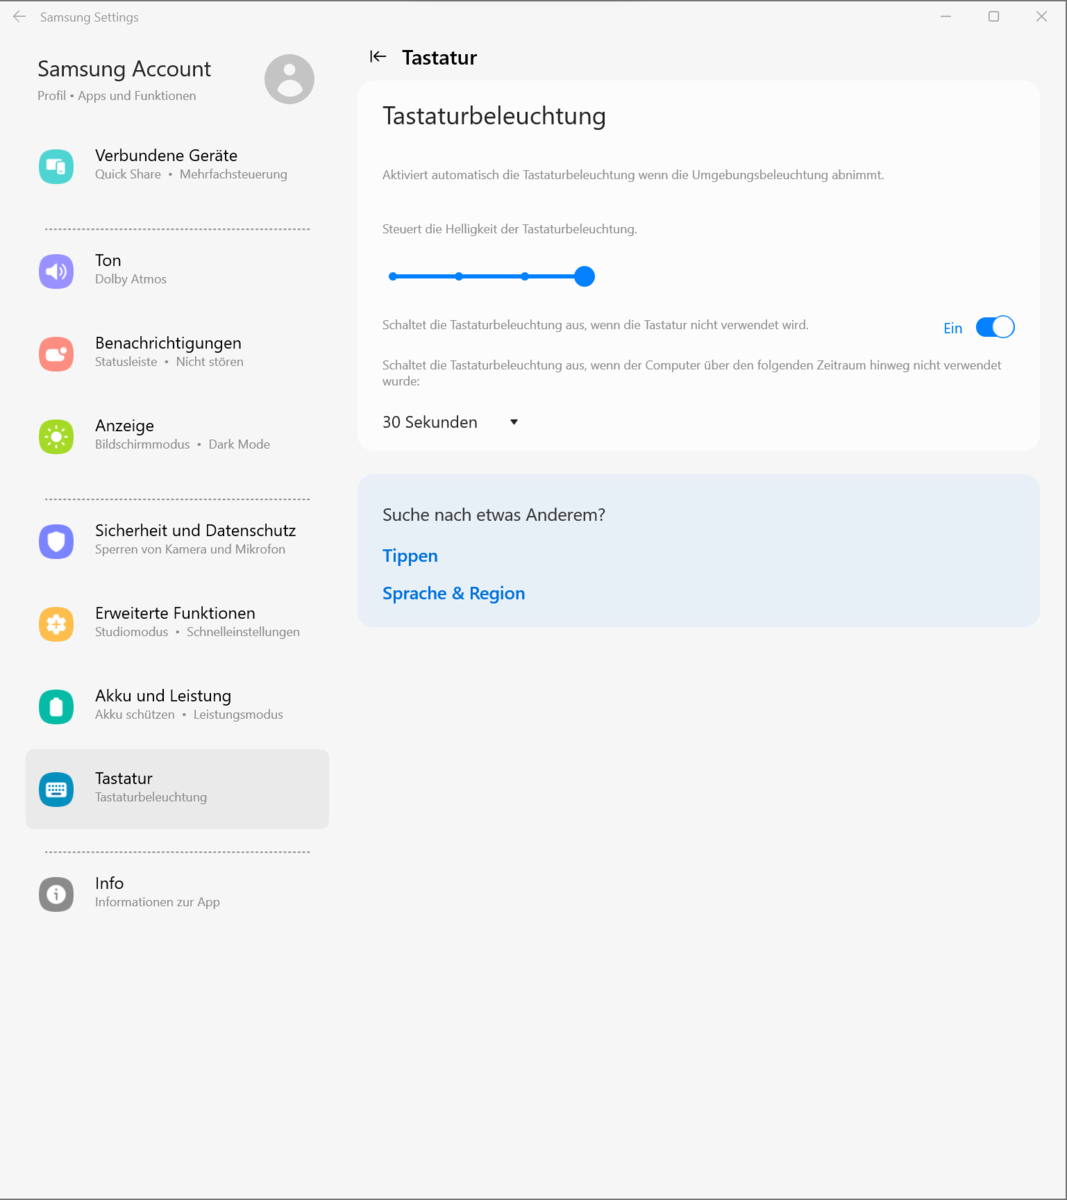
Input Devices - Galaxy Book3 offers an backlit keyboard
Keyboard
The NP960XFH has an backlit chiclet keyboard together with a numpad. The smooth, slightly concave keys offer short travel and a clear pressure point. Key resistance is acceptable. The keyboard yields slightly under pressure, but is not a cause for concern. The three-stage backlight is controlled via a function key. All in all, Samsung delivers a keyboard suitable for everyday use.
Touchpad
The ClickPad measures approximately 15.1 x 10.8 cm. One size smaller would have also sufficied: If the WASD keys are used with the left hand, the entire thumb rests on the pad. So the latter would have to be turned off in such a case. Otherwise, the smooth surface is very conducive to finger gliding and swiping. It reacts to inputs in the corners, offers short travel and a clear pressure point.
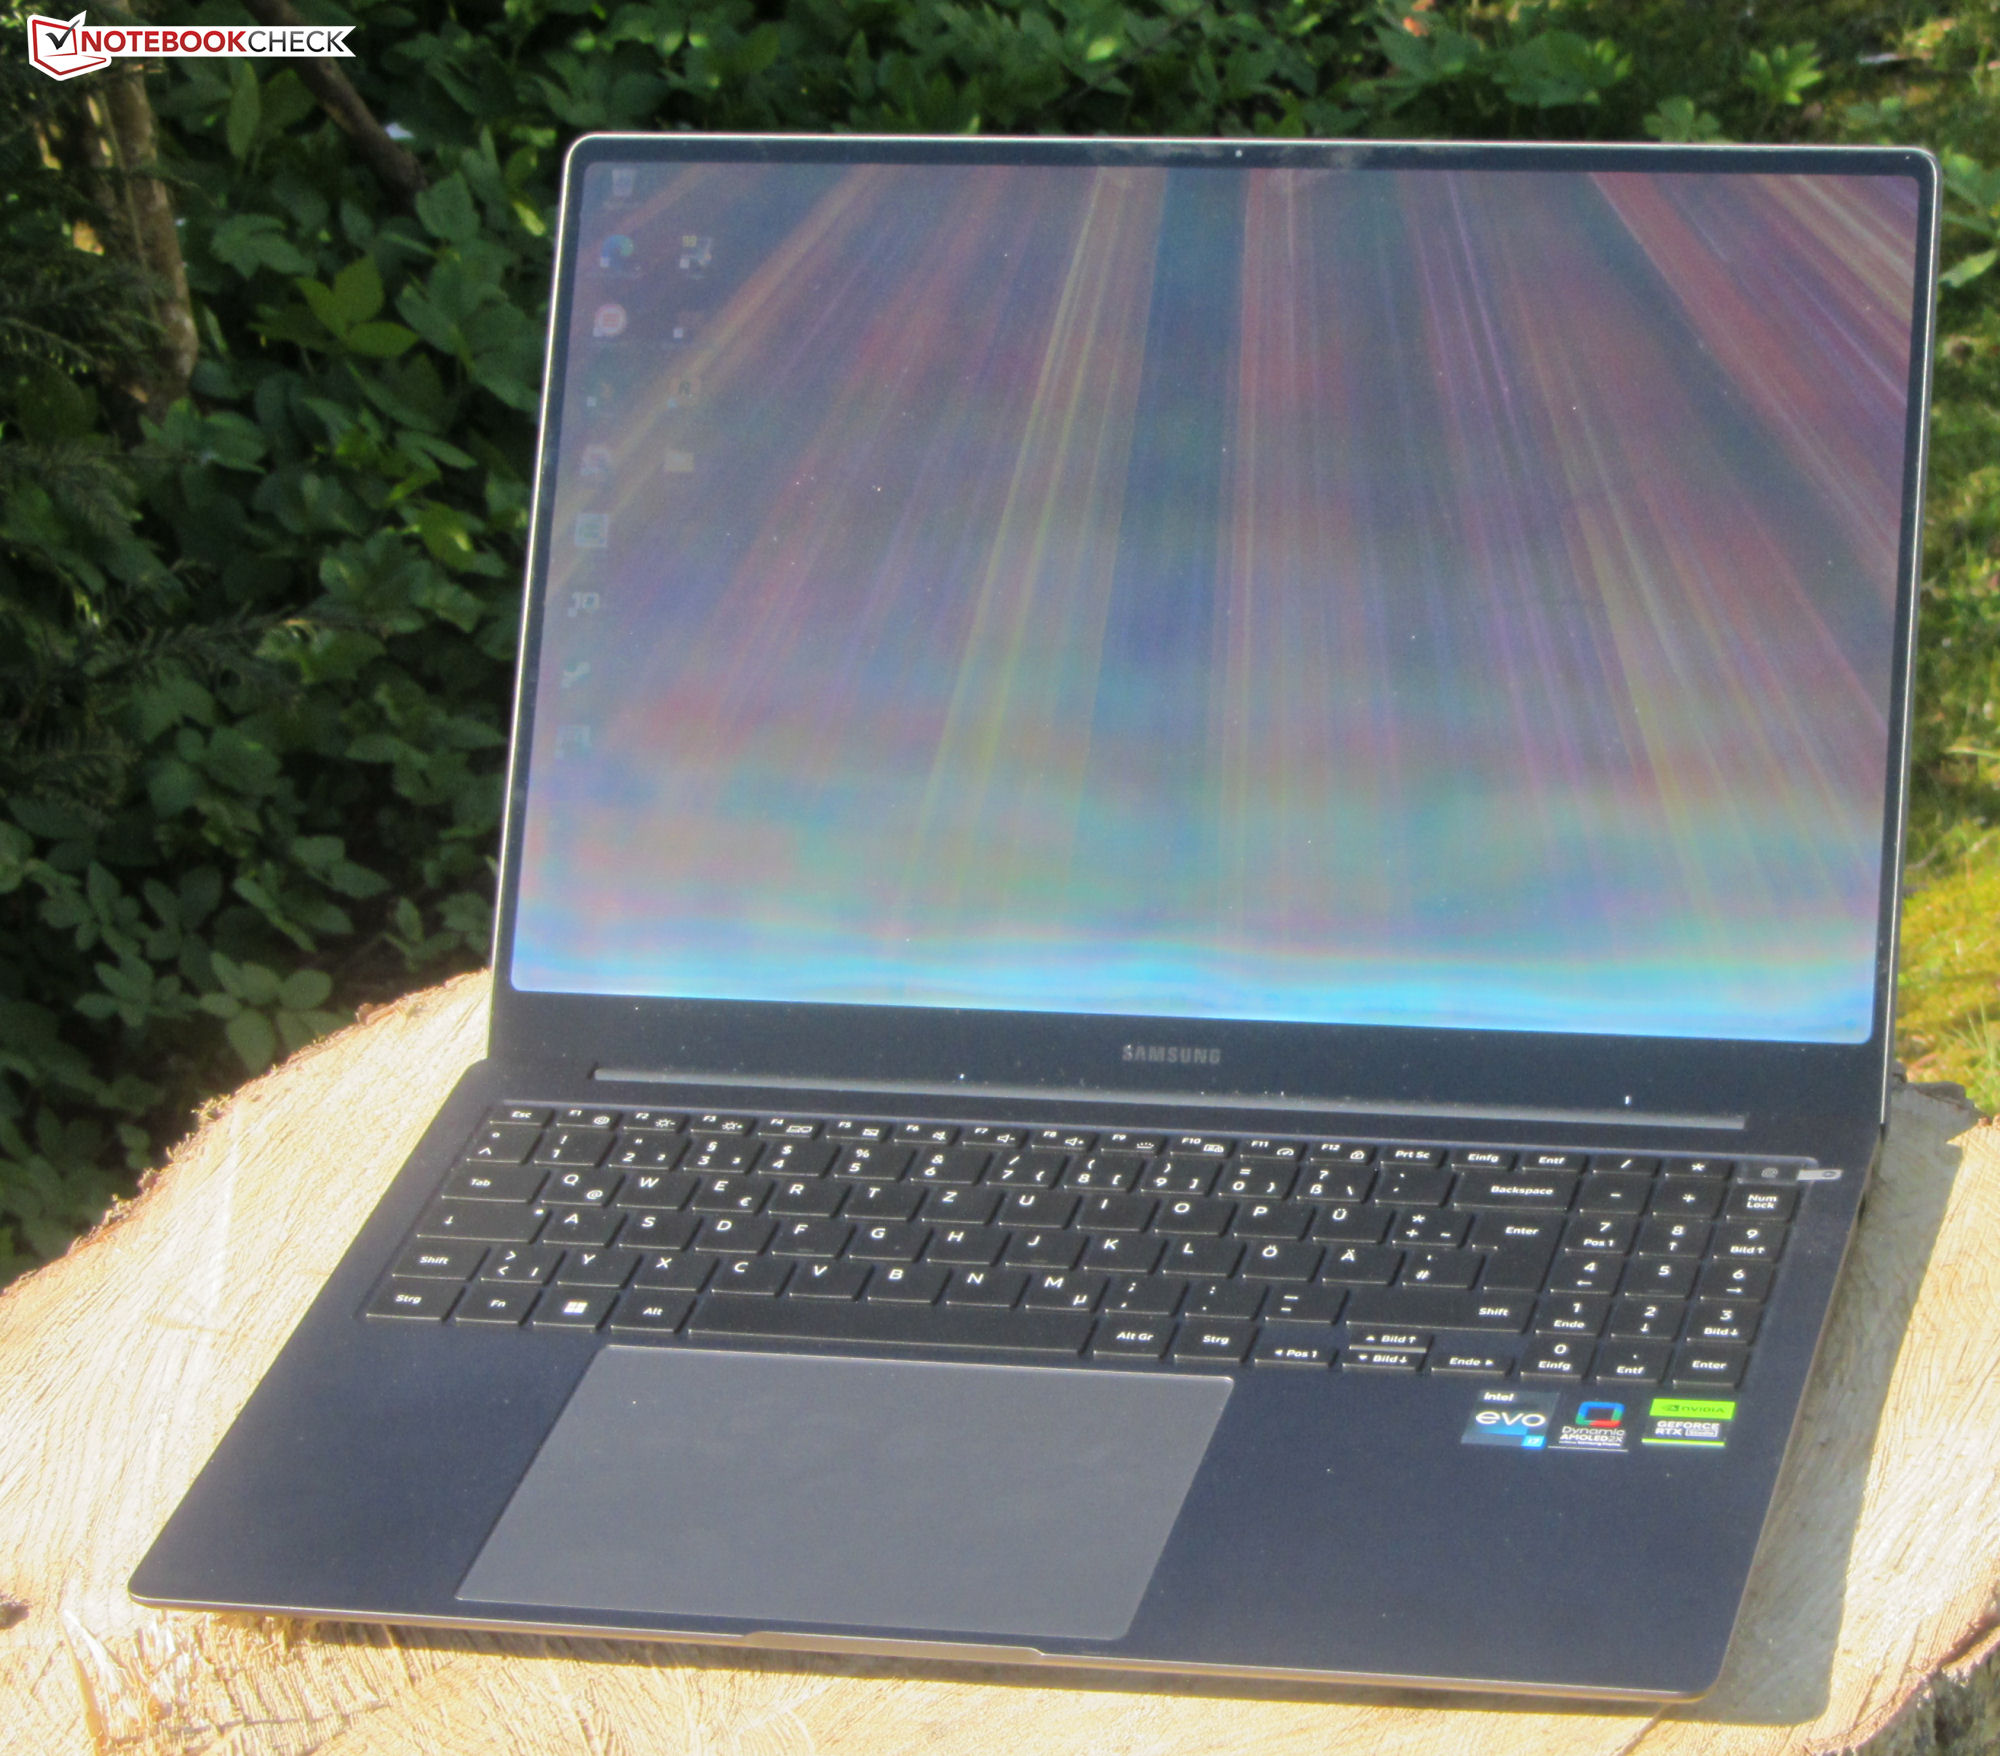
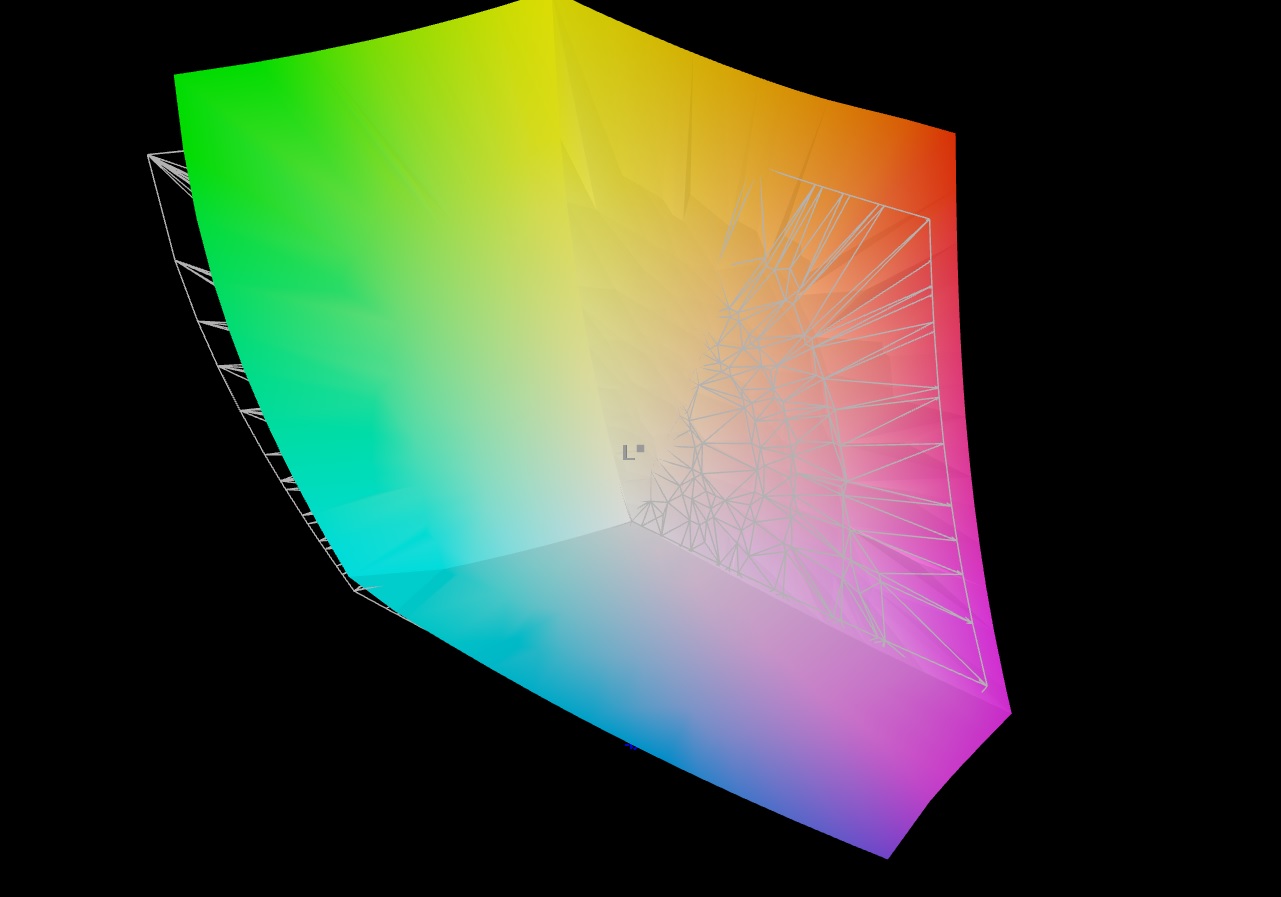
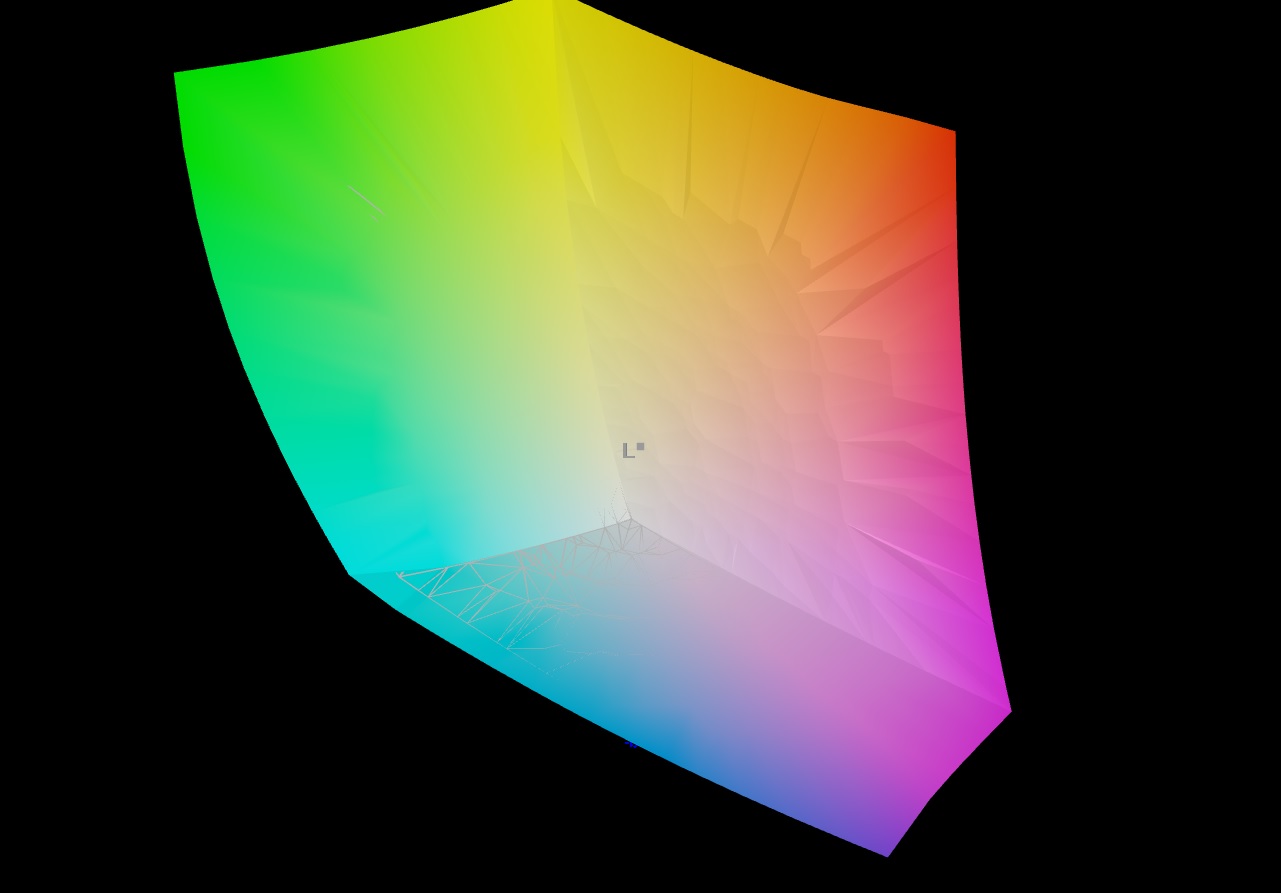
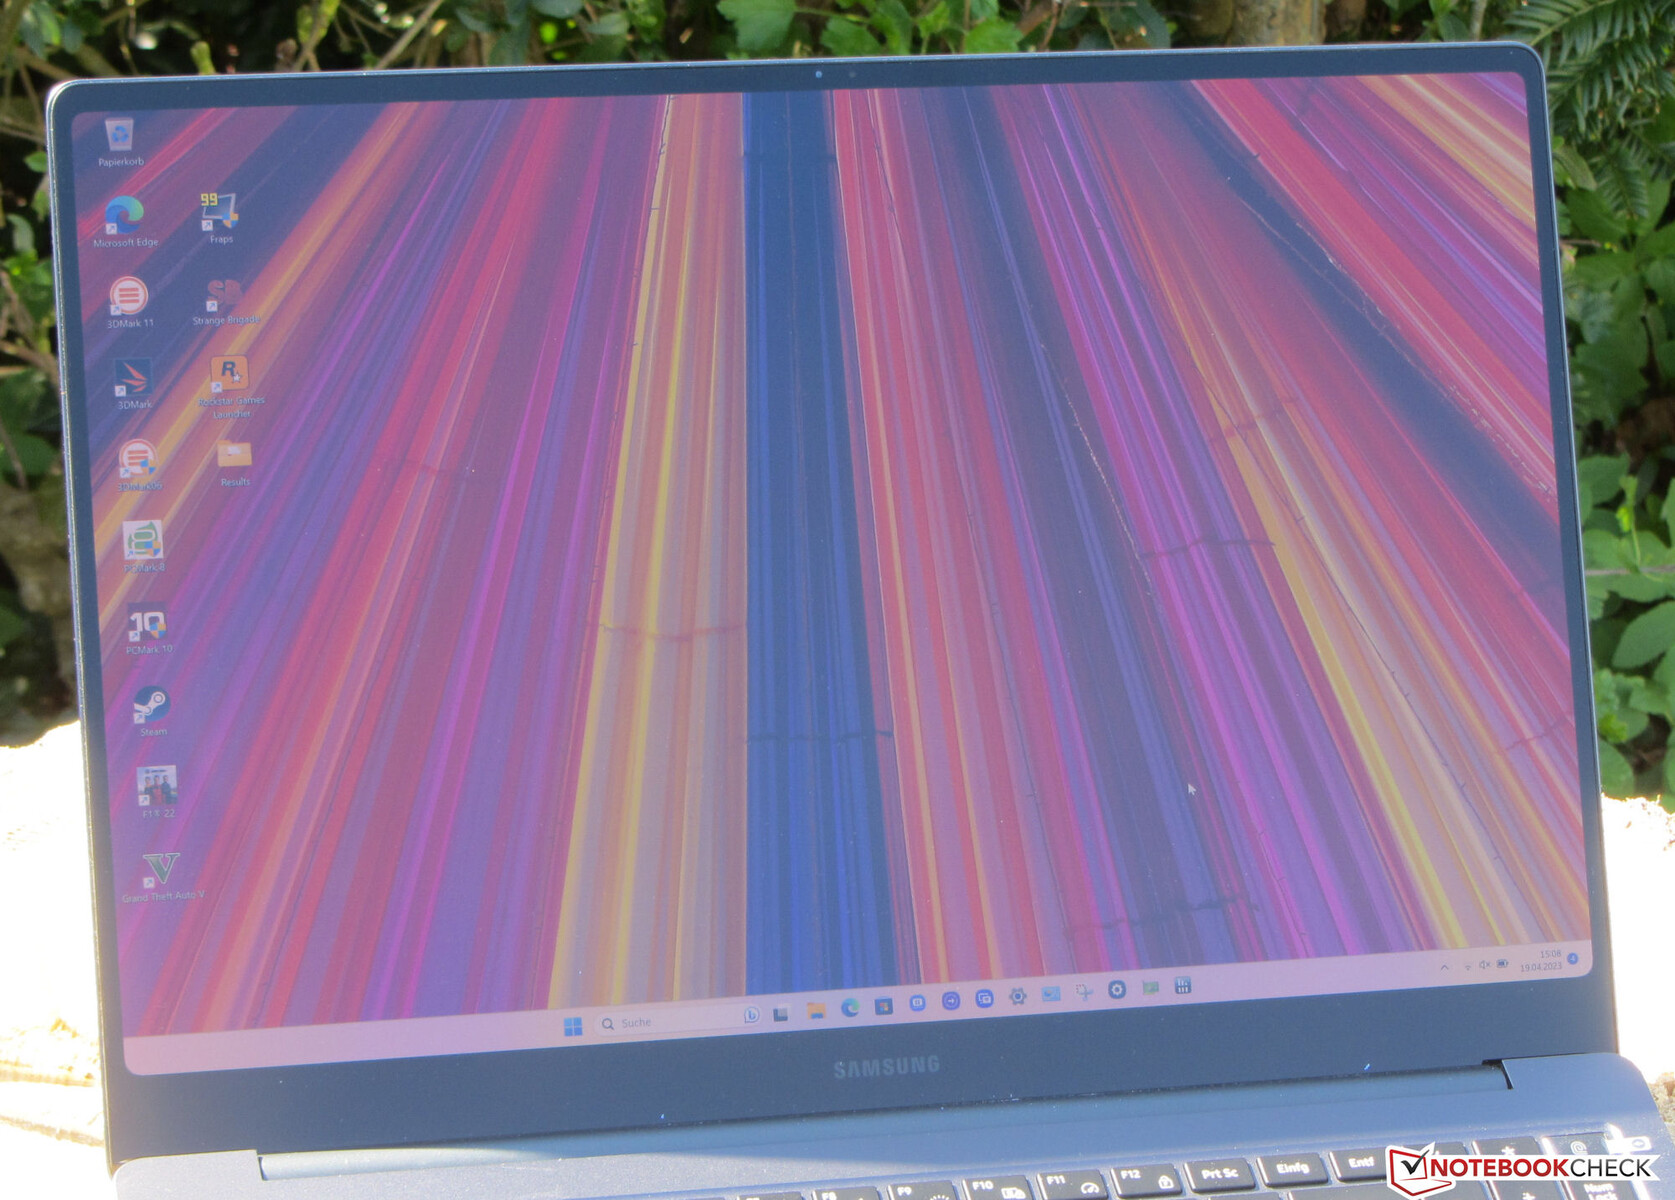
Display - AMOLED in 16:10 format
The large 16-inch screen (2880x1800) in a work-friendly 16:10 format offers an excellent black value and short response times, which is typical for OLEDs. The display's brightness exceeds the target, although the ThinkBook 16p G3 ARH has a much brighter display.
The weaknesses of the OLED panel: it has a reflective surface and flickers at a brightness level of ≤ 100 percent at a frequency of 240 Hz. The flickering is related to the brightness control of the panel.
| |||||||||||||||||||||||||
Brightness Distribution: 93 %
Center on Battery: 400 cd/m²
Contrast: 13333:1 (Black: 0.03 cd/m²)
ΔE Color 2.3 | 0.5-29.43 Ø5, calibrated: 1.66
ΔE Greyscale 2.7 | 0.57-98 Ø5.3
96.3% AdobeRGB 1998 (Argyll 2.2.0 3D)
100% sRGB (Argyll 2.2.0 3D)
99.9% Display P3 (Argyll 2.2.0 3D)
Gamma: 2.266
| Samsung Galaxy Book3 Ultra 16 Samsung ATNA60CL03-0, AMOLED, 2880x1800, 16.00 | SCHENKER Vision 16 Pro RTX 3070 Ti N160QDM-NZ1, IPS, 2560x1600, 16.00 | LG Gram 17Z90Q-E.AD78G LG Display LP170WQ1-SPF2, IPS, 2560x1600, 17.00 | Lenovo ThinkBook 16p G3 ARH BOE CQ NE160QDM-NY1, IPS, 2560x1600, 16.00 | Dell XPS 15 9520 RTX 3050 Ti Samsung 156XG01, OLED, 3456x2160, 15.60 | Asus VivoBook Pro 16X OLED N7600PC-L2026X Samsung ATNA60YV02-0, OLED, 3840x2400, 16.00 | Acer Swift X SFX16-52G-77RX B160QAN02.M, IPS-LED, 2560x1600, 16.00 | |
|---|---|---|---|---|---|---|---|
| Display | -20% | -8% | -19% | -4% | 1% | -15% | |
| Display P3 Coverage | 99.9 | 68.7 -31% | 92.2 -8% | 69.8 -30% | 97.8 -2% | 99.9 0% | 76.4 -24% |
| sRGB Coverage | 100 | 96.7 -3% | 98.66 -1% | 98.2 -2% | 99.9 0% | 100 0% | 100 0% |
| AdobeRGB 1998 Coverage | 96.3 | 70 -27% | 82.98 -14% | 71.4 -26% | 86 -11% | 98.05 2% | 76.6 -20% |
| Response Times | -2021% | -3068% | -2354% | -185% | -103% | -4422% | |
| Response Time Grey 50% / Grey 80% * | 0.49 ? | 14.3 ? -2818% | 22 ? -4390% | 15.6 ? -3084% | 1.9 ? -288% | 1 -104% | 33 ? -6635% |
| Response Time Black / White * | 0.65 ? | 8.6 ? -1223% | 12 ? -1746% | 11.2 ? -1623% | 1.9 ? -192% | 2 ? -208% | 15 ? -2208% |
| PWM Frequency | 240 ? | 59.52 ? -75% | 247 ? 3% | ||||
| Screen | -140% | -125% | -186% | -32% | 8% | -108% | |
| Brightness middle | 400 | 364 -9% | 391 -2% | 532.8 33% | 381.4 -5% | 383 -4% | 411 3% |
| Brightness | 399 | 347 -13% | 358 -10% | 519 30% | 384 -4% | 390 -2% | 378 -5% |
| Brightness Distribution | 93 | 89 -4% | 84 -10% | 94 1% | 95 2% | 96 3% | 83 -11% |
| Black Level * | 0.03 | 0.3 -900% | 0.29 -867% | 0.55 -1733% | 0.027 10% | 0.29 -867% | |
| Contrast | 13333 | 1213 -91% | 1348 -90% | 969 -93% | 14185 6% | 1417 -89% | |
| Colorchecker dE 2000 * | 2.3 | 3.3 -43% | 3.52 -53% | 1.32 43% | 4.34 -89% | 2.29 -0% | 2.18 5% |
| Colorchecker dE 2000 max. * | 4.15 | 6.6 -59% | 6.06 -46% | 3.97 4% | 9.24 -123% | 3.47 16% | 4.84 -17% |
| Colorchecker dE 2000 calibrated * | 1.66 | 2.5 -51% | 1.43 14% | 1.59 4% | 1.48 11% | ||
| Greyscale dE 2000 * | 2.7 | 5.2 -93% | 4.27 -58% | 1.8 33% | 2 26% | 1.84 32% | 2.68 1% |
| Gamma | 2.266 97% | 2.14 103% | 2.3 96% | 2.64 83% | 2.13 103% | 2.32 95% | 2.43 91% |
| CCT | 7047 92% | 6331 103% | 7203 90% | 6761 96% | 6210 105% | 6308 103% | 6717 97% |
| Total Average (Program / Settings) | -727% /
-383% | -1067% /
-520% | -853% /
-460% | -74% /
-63% | -31% /
-18% | -1515% /
-704% |
* ... smaller is better
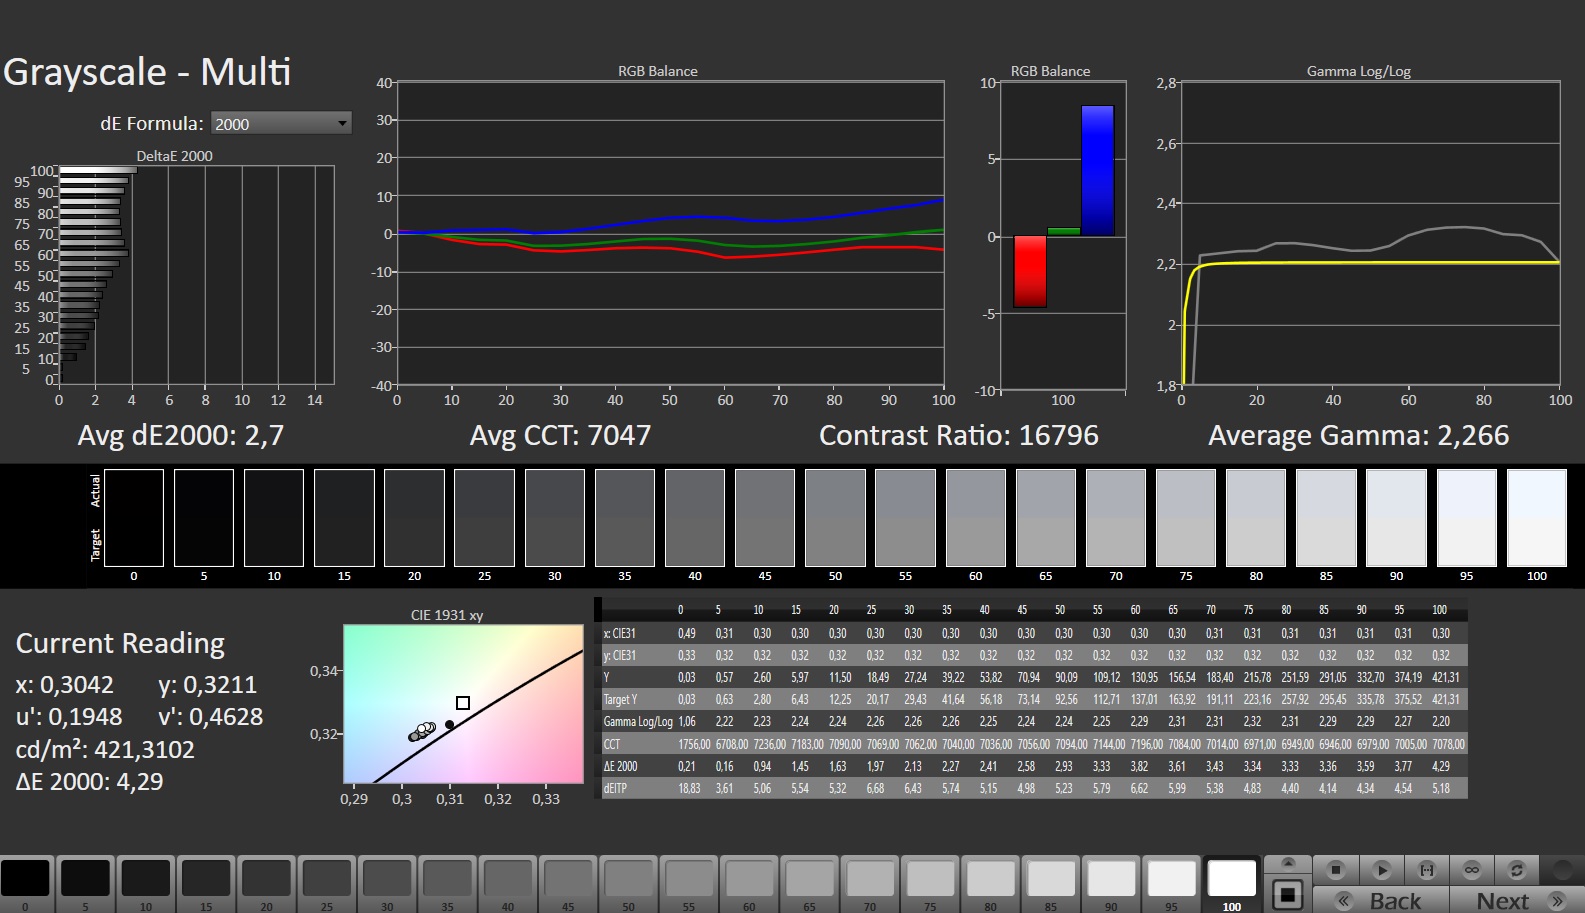
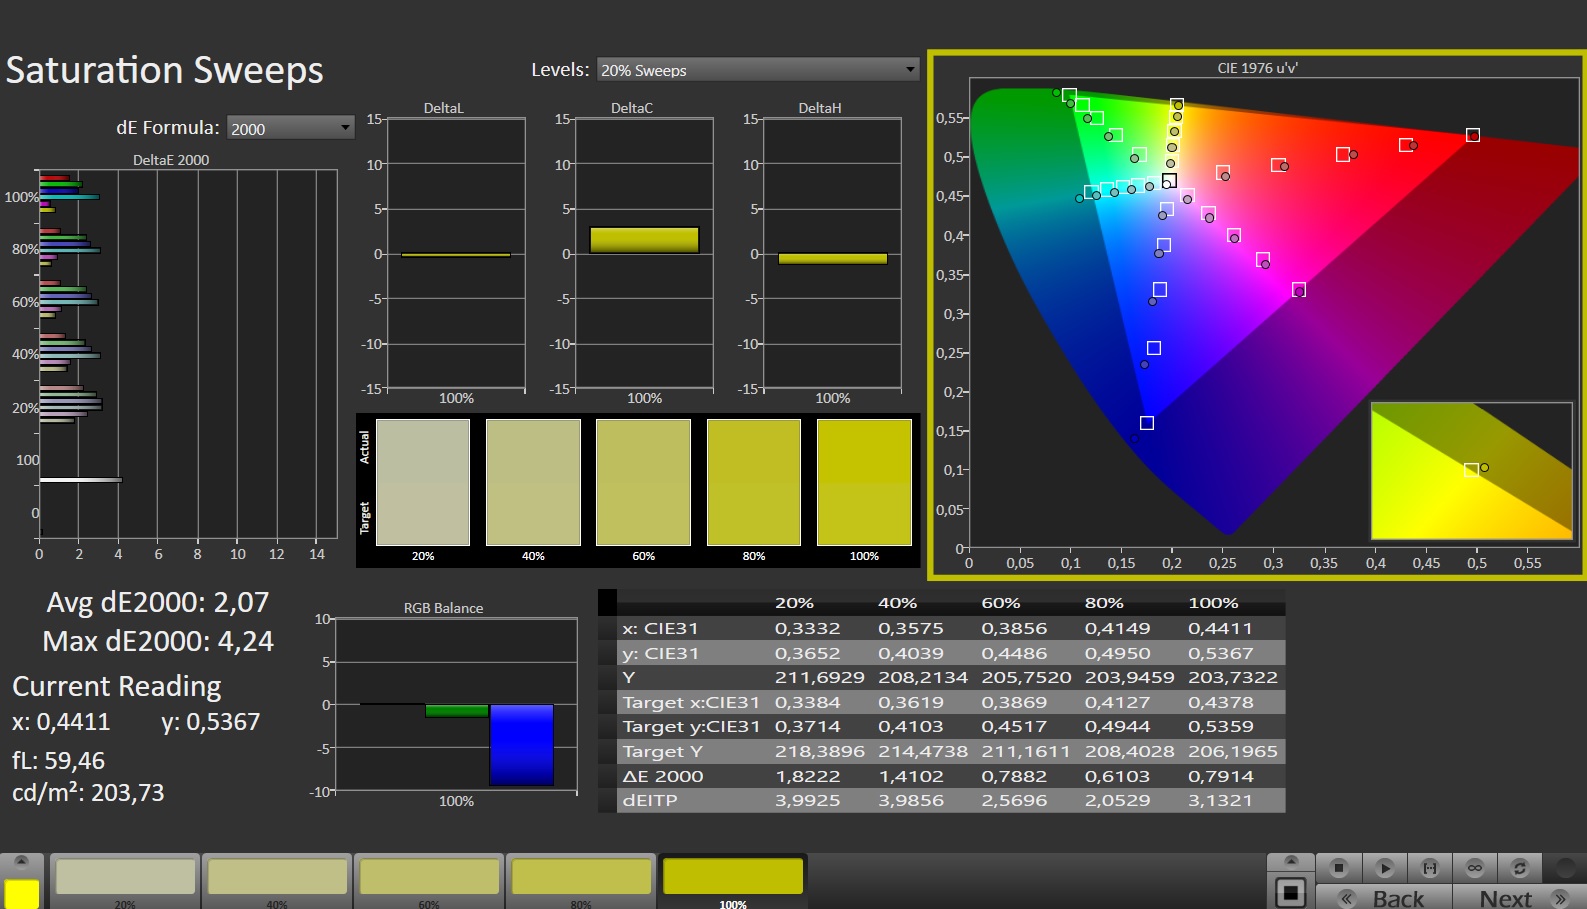
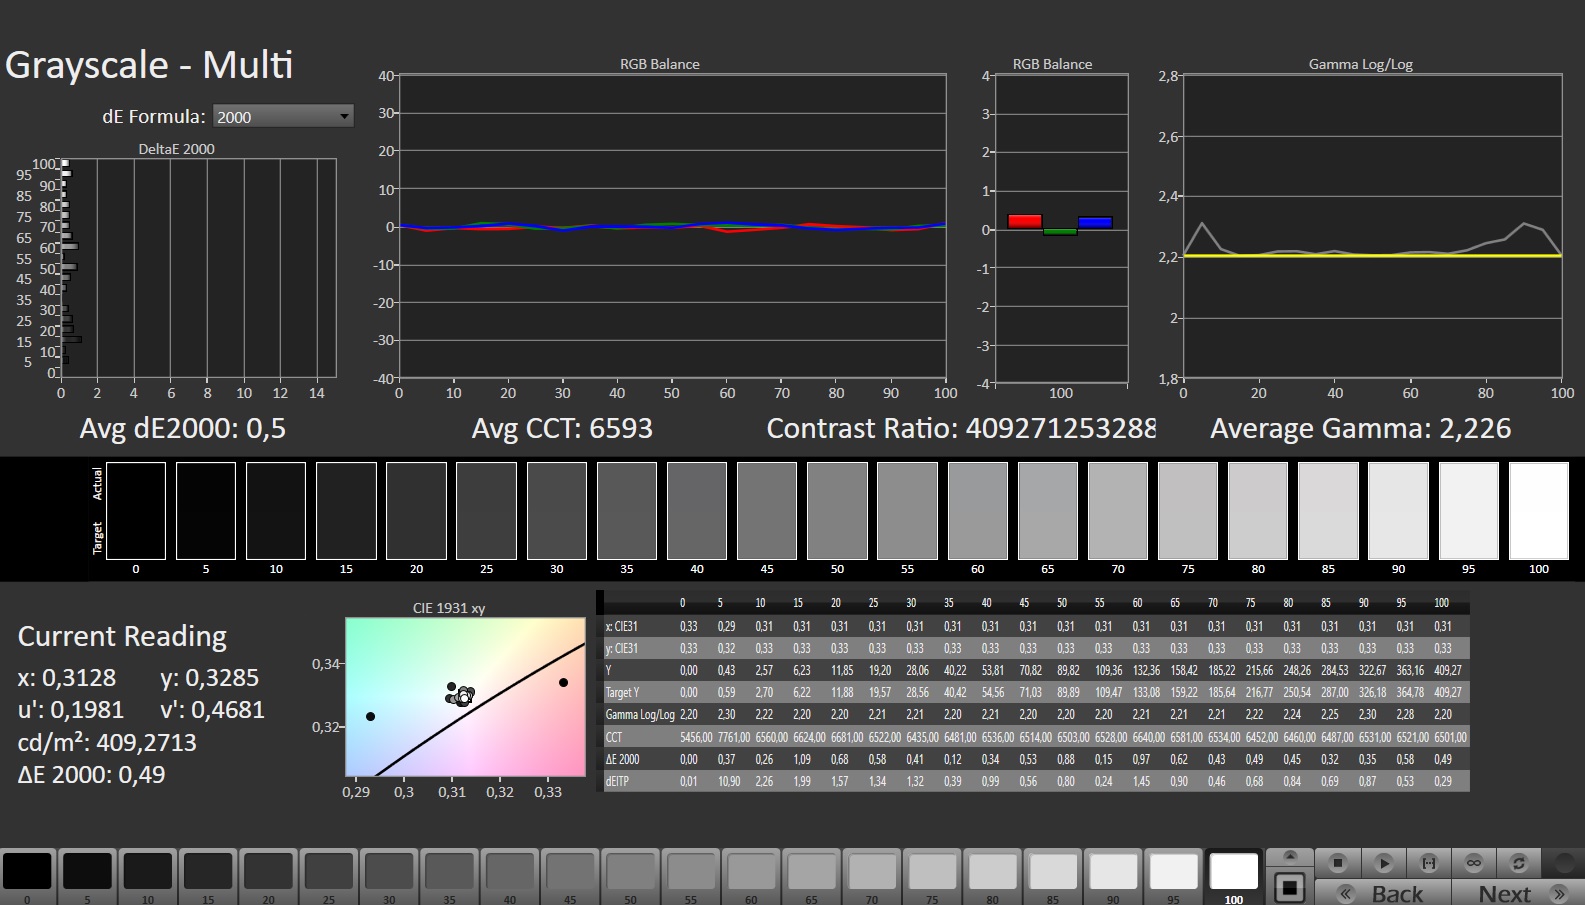
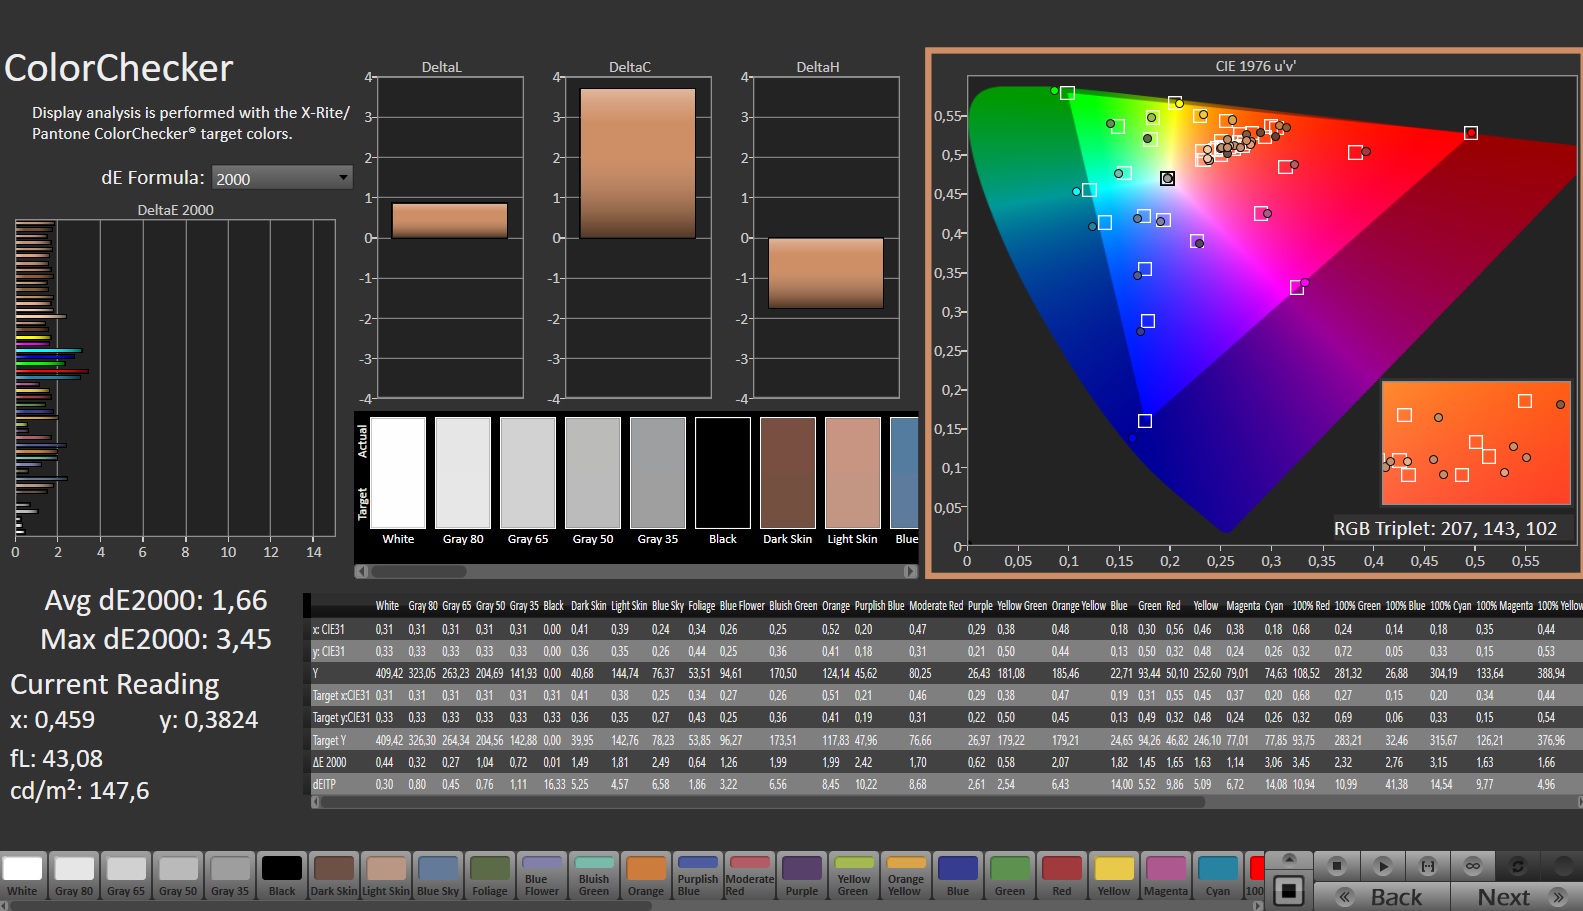
The screen already has good color reproduction in its state of delivery: At a deviation of 2.3, the target (DeltaE < 3) is met. Calibration reduces the value to 1.66 and ensures more balanced grayscale levels.
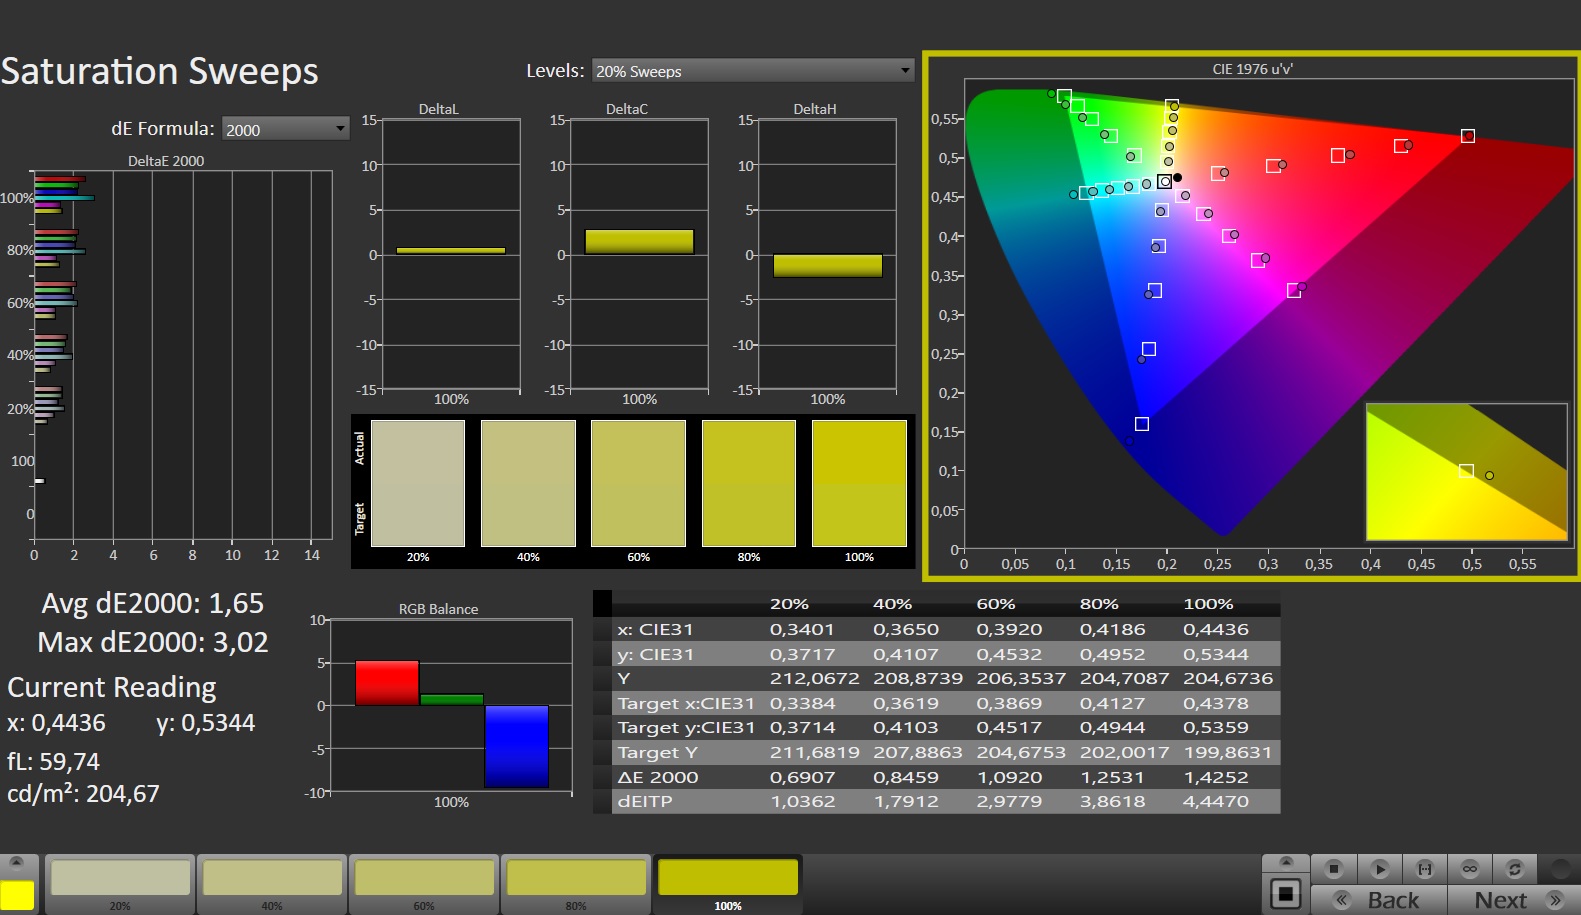
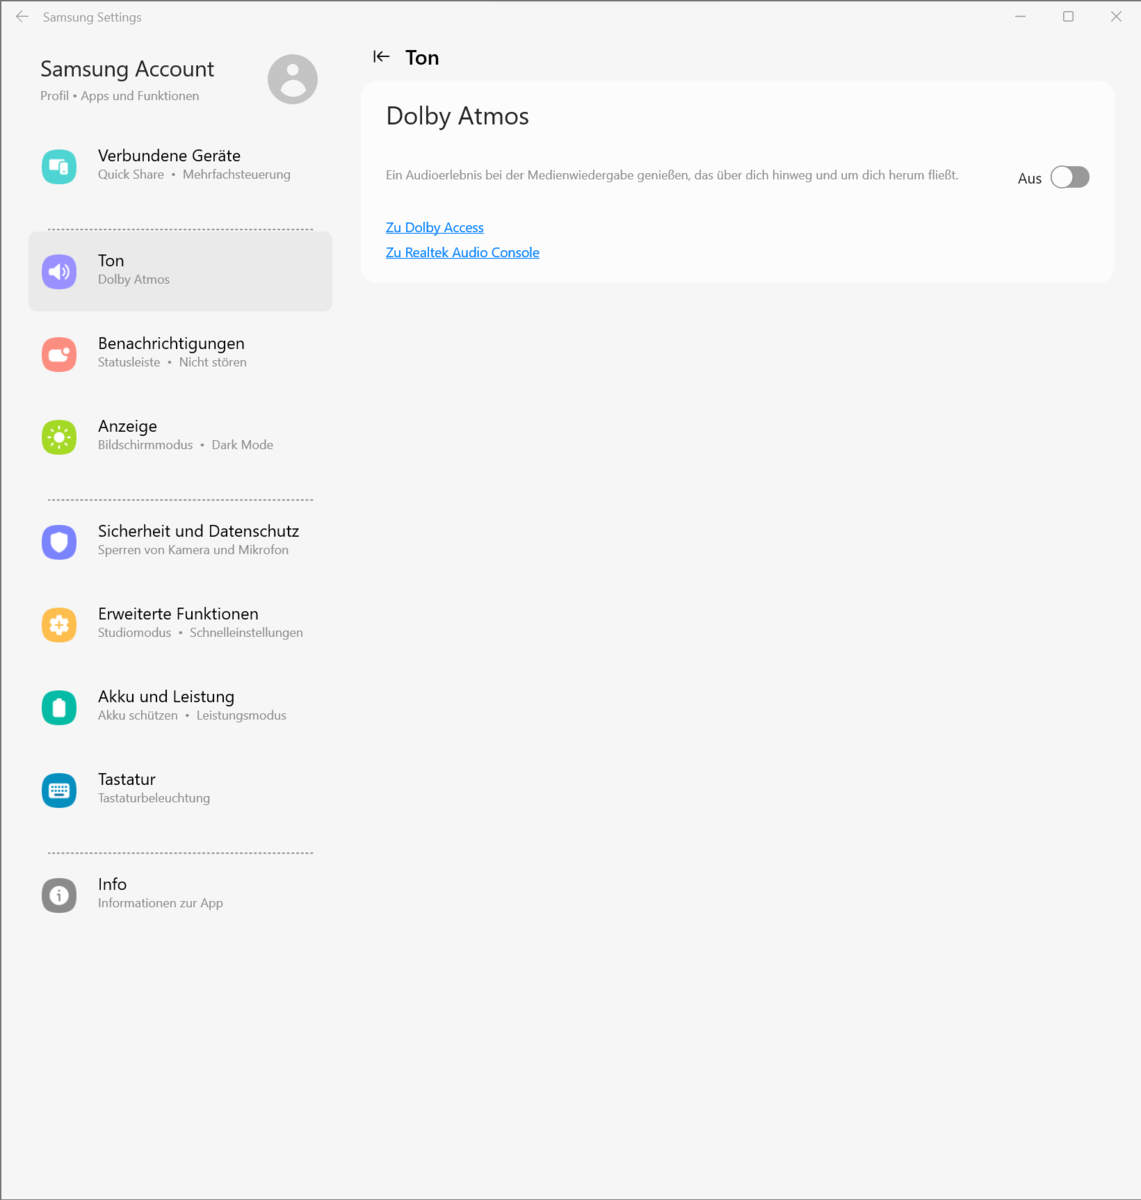
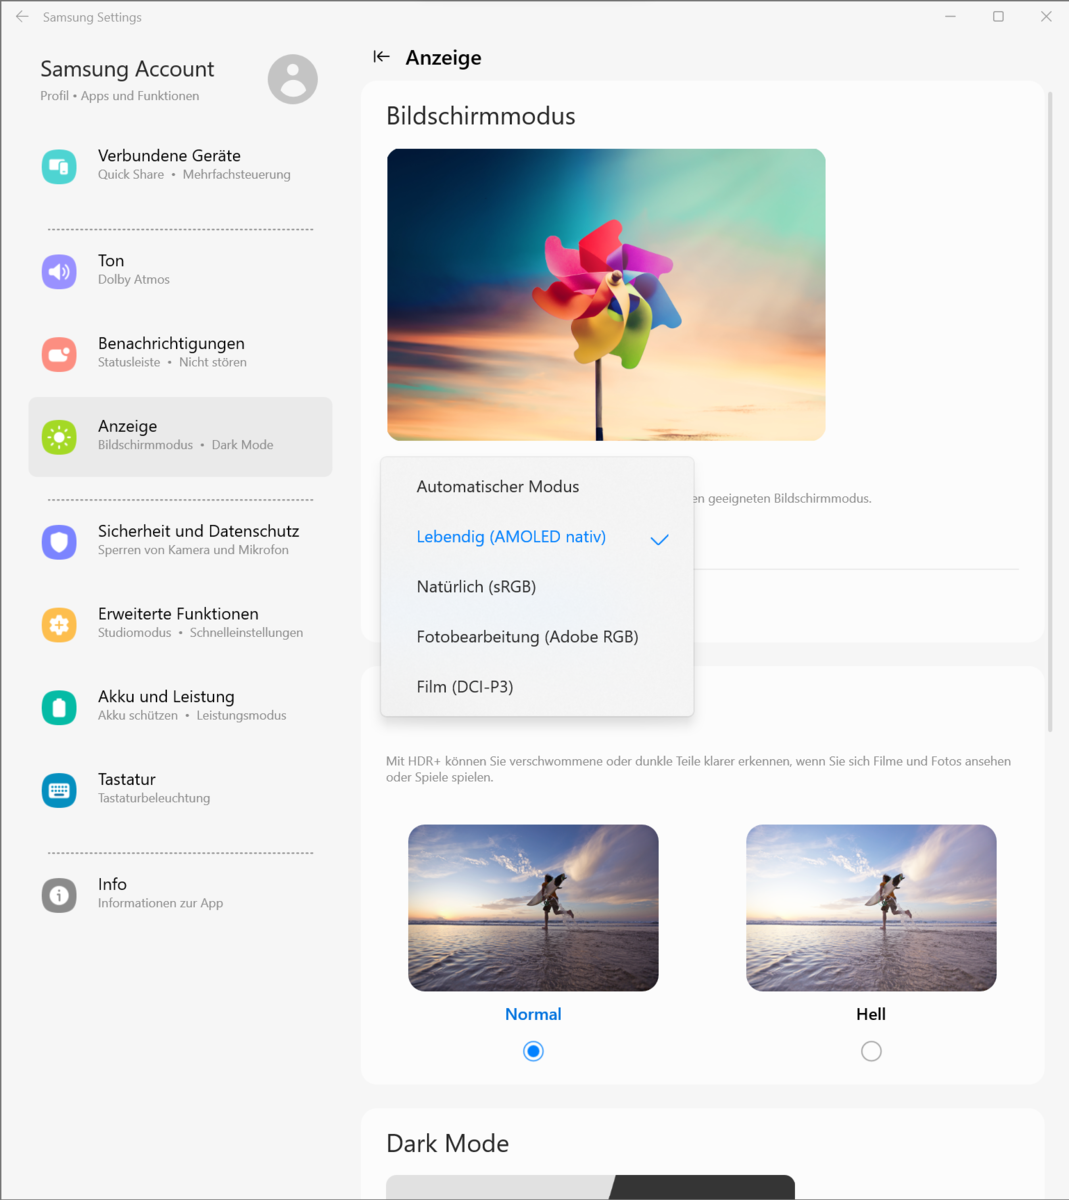
Color fidelity is a given: the sRGB and the DCI-P3 color space are fully reproduced and the Adobe RGB space almost completely. The display can be adjusted to one of the three spaces via the preinstalled Samsung software settings. We used the default setting "Vivid (AMOLED native)" here.

Display Response Times
| ↔ Response Time Black to White | ||
|---|---|---|
| 0.65 ms ... rise ↗ and fall ↘ combined | ↗ 0.37 ms rise | 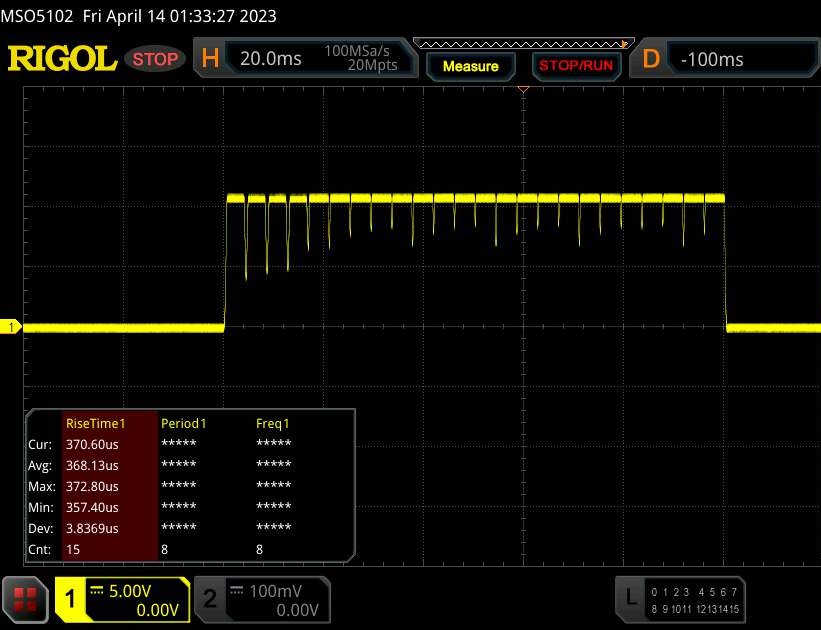 |
| ↘ 0.28 ms fall | ||
| The screen shows very fast response rates in our tests and should be very well suited for fast-paced gaming. In comparison, all tested devices range from 0.1 (minimum) to 240 (maximum) ms. » 0 % of all devices are better. This means that the measured response time is better than the average of all tested devices (21.5 ms). | ||
| ↔ Response Time 50% Grey to 80% Grey | ||
| 0.49 ms ... rise ↗ and fall ↘ combined | ↗ 0.26 ms rise | 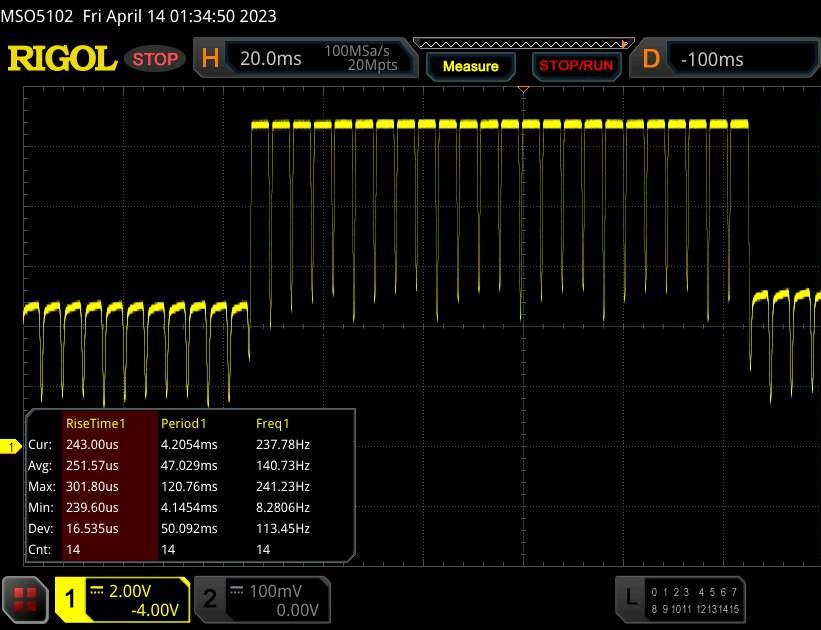 |
| ↘ 0.23 ms fall | ||
| The screen shows very fast response rates in our tests and should be very well suited for fast-paced gaming. In comparison, all tested devices range from 0.2 (minimum) to 636 (maximum) ms. » 0 % of all devices are better. This means that the measured response time is better than the average of all tested devices (33.7 ms). | ||
Screen Flickering / PWM (Pulse-Width Modulation)
| Screen flickering / PWM detected | 240 Hz | ≤ 100 % brightness setting | 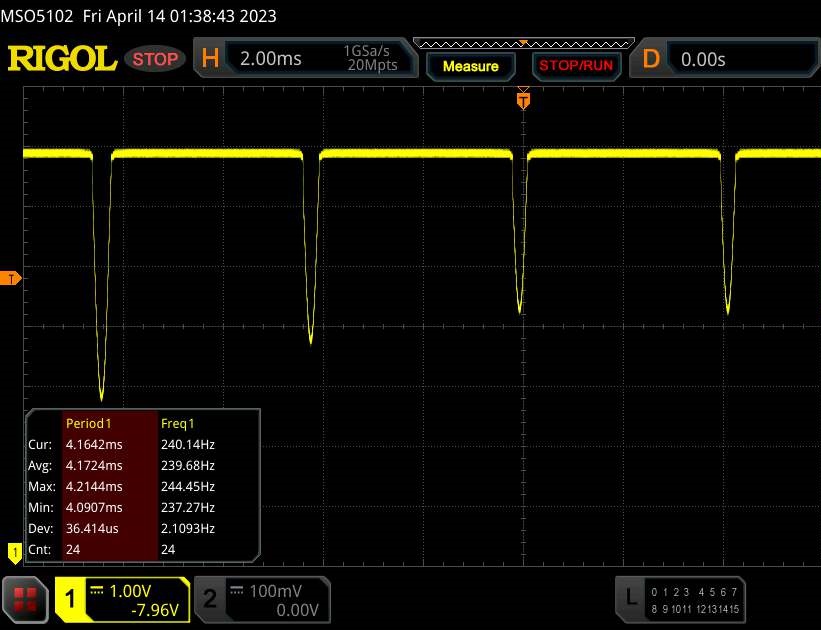 |
The display backlight flickers at 240 Hz (worst case, e.g., utilizing PWM) Flickering detected at a brightness setting of 100 % and below. There should be no flickering or PWM above this brightness setting. The frequency of 240 Hz is relatively low, so sensitive users will likely notice flickering and experience eyestrain at the stated brightness setting and below. In comparison: 53 % of all tested devices do not use PWM to dim the display. If PWM was detected, an average of 17903 (minimum: 5 - maximum: 3846000) Hz was measured. | |||
The viewing-angle stable panel can be read from any position. Reading outdoors is difficult due to the reflective display surface.

Performance - Alder Lake and Ada Lovelace on board
With its Galaxy Book3 Ultra 16 models, Samsung offers a series of mobile notebooks for gamers and creative workers. The GeForce RTX Studio certification should guarantee high computing power, adjusted drivers, good software support and suitable color space coverage of the display.
Low-power versions of the RTX 4050 or RTX 4070 GPU are used, while the processors come from Intel (Raptor Lake). This variant is based on the RTX 4050 and is the entry-level model at a price of around US$2,400.
Testing Conditions
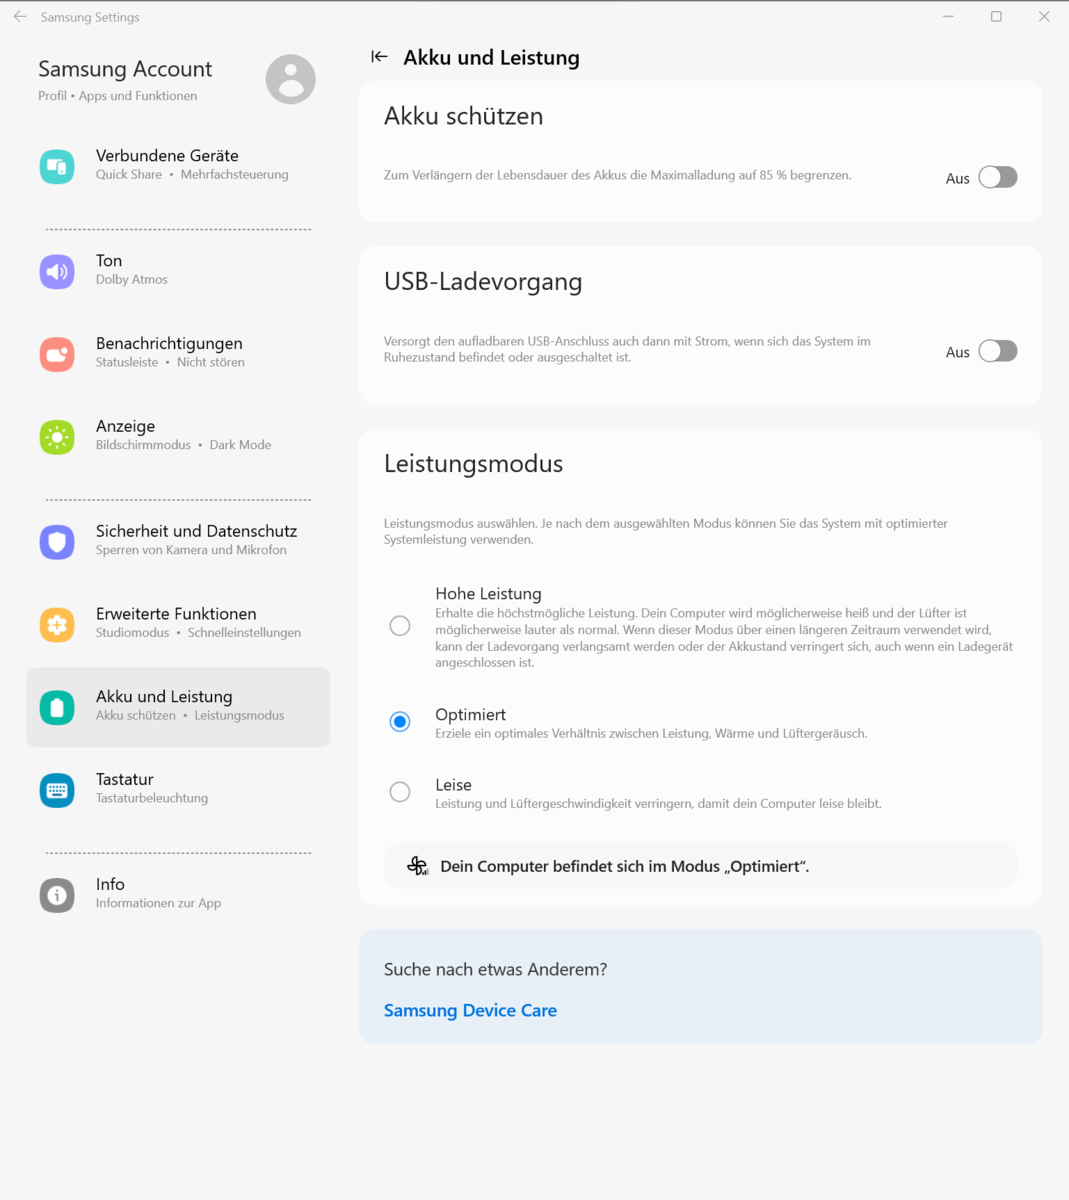
The notebook has three manufacturer-specific performance modes (see table), which can be switched between via the key combination "Fn" + "F11" (or via Samsung's software settings over the laptop's control center). The modes "Optimized" (benchmarks) and "Silent" (battery tests) were used.
| High Peformance | Optimized | Silent | |
|---|---|---|---|
| Powerlimit 1 (HWInfo) | 70 watts | 45 watts | 30 watts |
| Powerlimit 2 (HWInfo) | 75 watts | 75 watts | 75 watts |
| TGP RTX 4050 | 60 watts | ~ 40 - 45 watts | 20 watts |
| Noise (Witcher 3) | 48 dB(A) | 39 dB(A) | 34 dB(A) |
| Performance (Witcher 3) | ~ 73 fps | ~ 60 fps | ~ 20 fps |

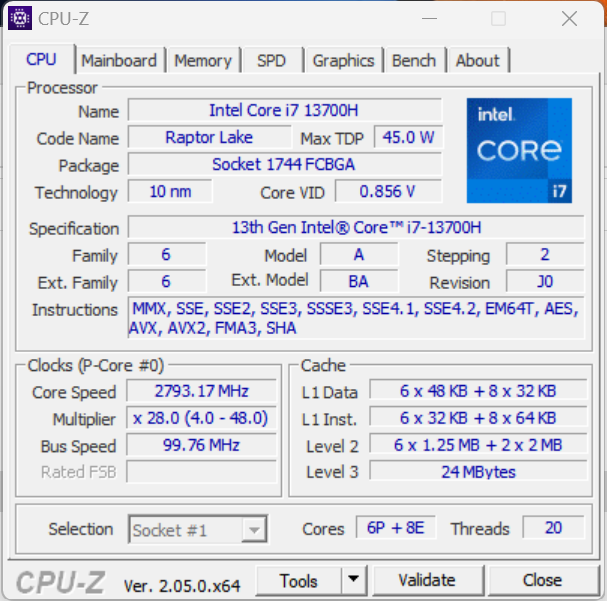
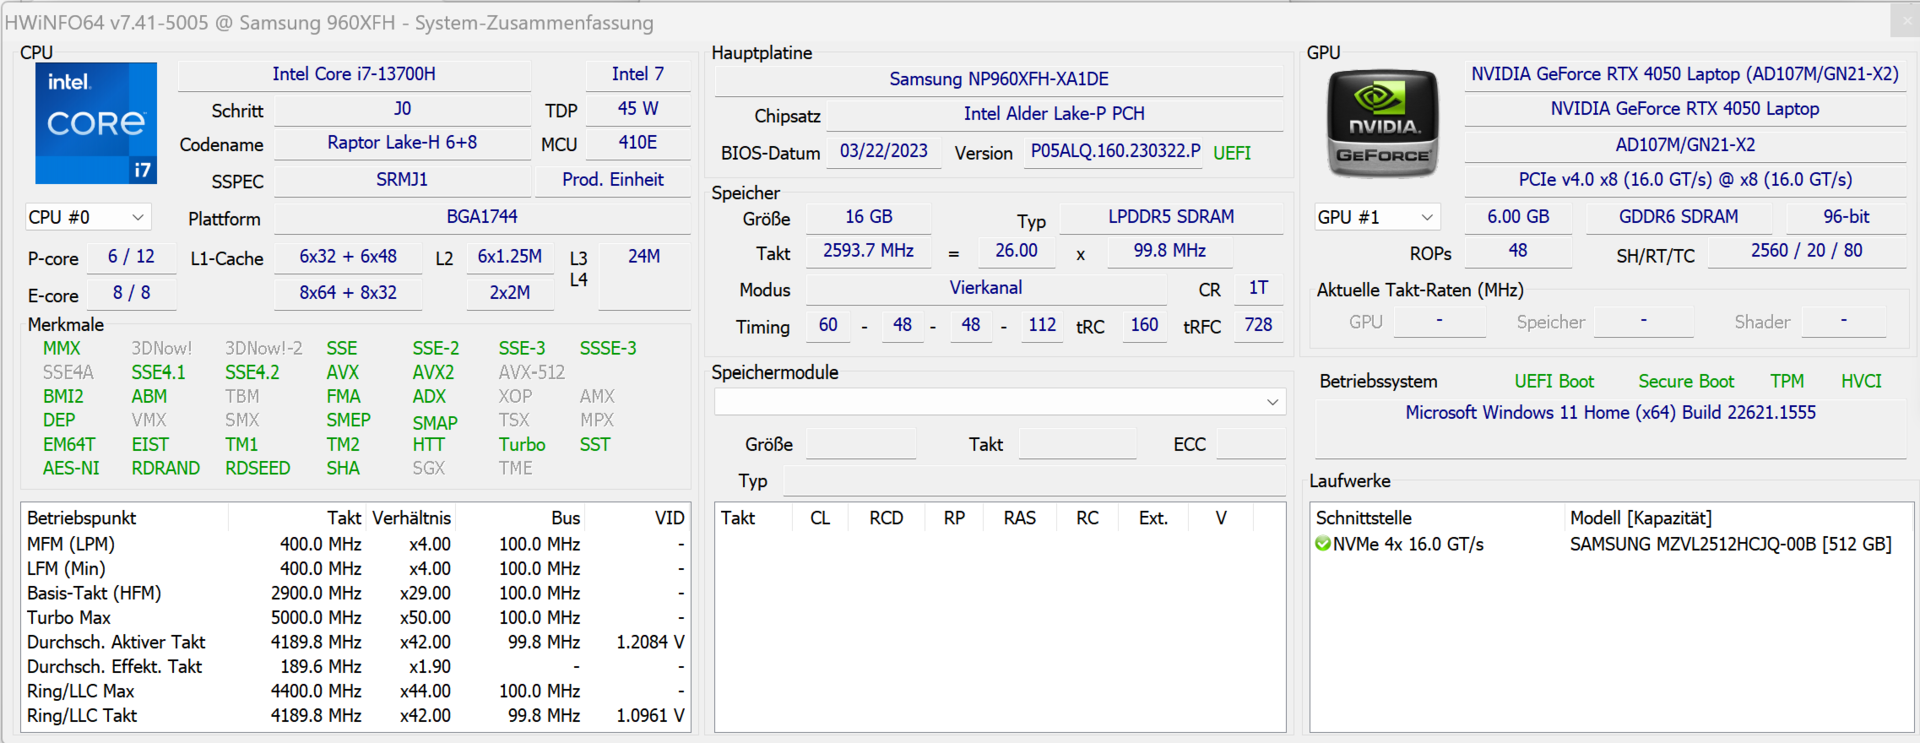
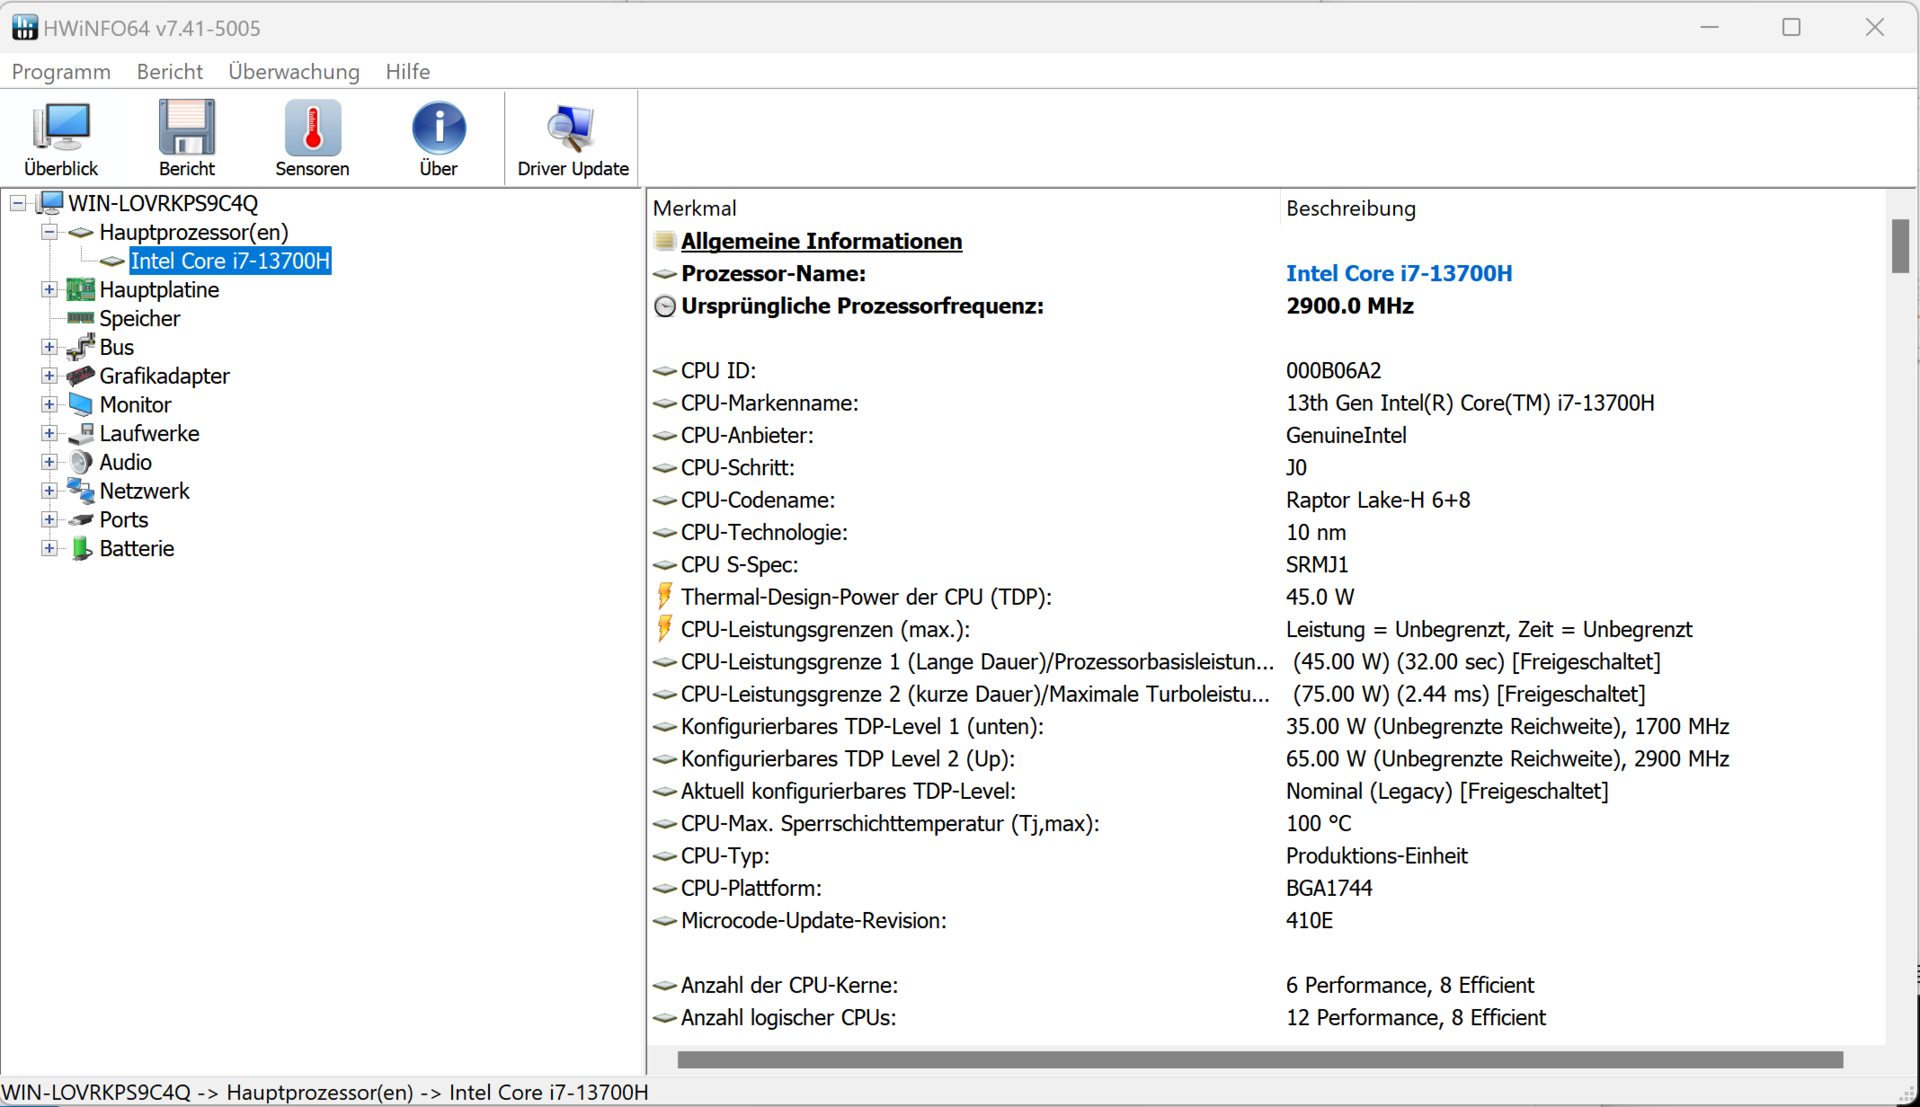
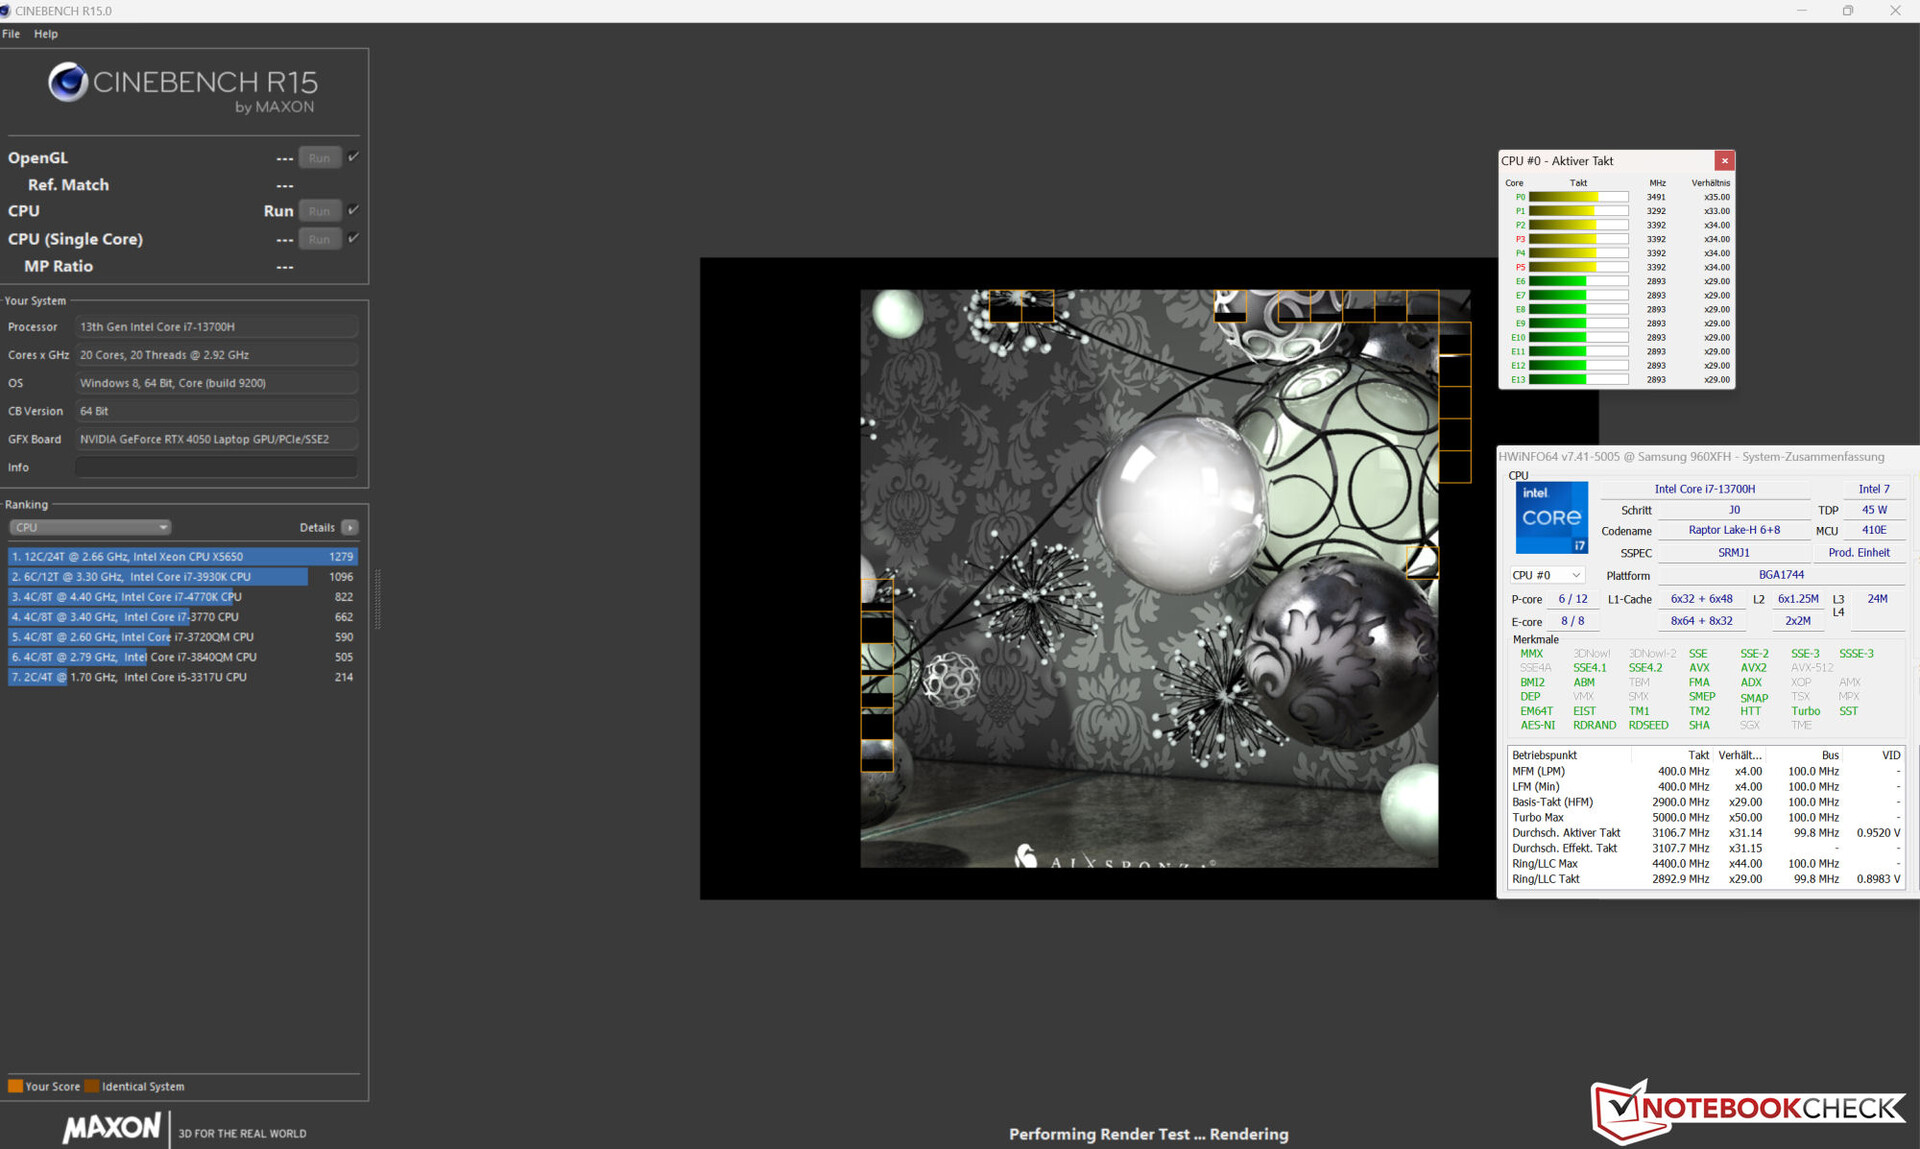
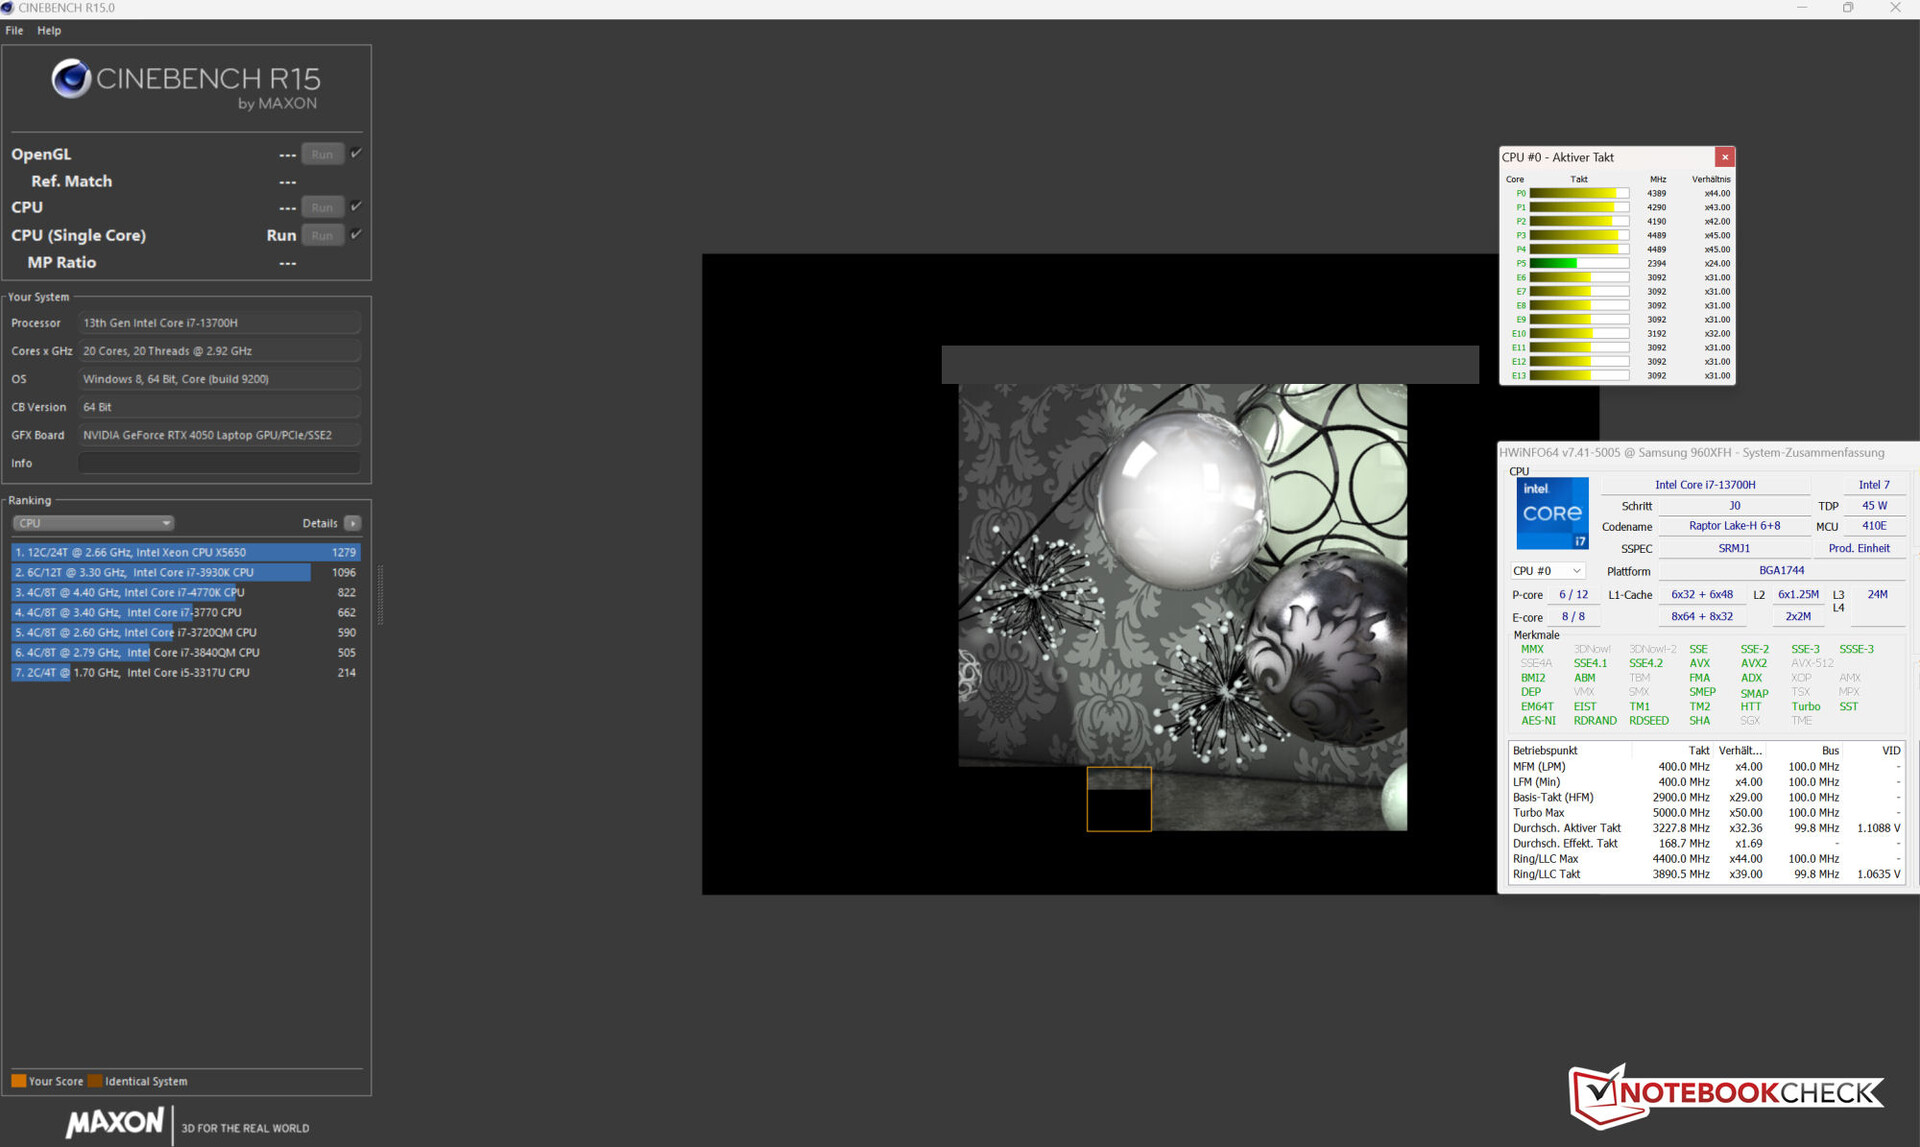
Processor
The Core i7-13700H processor (Raptor Lake) consists of eight efficient cores (no hyperthreading, 1.8 to 3.7 GHz) and six performance cores (hyperthreading, 2.4 to 5 GHz). This amounts to 20 logical CPU cores in total.
The "High Performance" and "Optimized" performance modes deliver benchmark results that are roughly on the level of the CPU average determined so far. The "Silent" profile pushes these values far down, but still provides more than enough performance for everyday use.
The CB15 loop test reveals that continuous multi-thread load causes the turbo clock to drop with each additional run and fluctuate from the eighth run. A constant level cannot be maintained. The "High Performance" profile ensures a higher average clock and lower fluctuations.
Cinebench R15 Multi Sustained Load
| CPU Performance Rating - Percent | |
| Samsung Galaxy Book3 Ultra 16 | |
| Average Intel Core i7-13700H | |
| Samsung Galaxy Book3 Ultra 16 | |
| Dell XPS 15 9520 RTX 3050 Ti | |
| Average of class Multimedia | |
| SCHENKER Vision 16 Pro RTX 3070 Ti | |
| Lenovo ThinkBook 16p G3 ARH | |
| Acer Swift X SFX16-52G-77RX | |
| Samsung Galaxy Book3 Ultra 16 | |
| LG Gram 17Z90Q-E.AD78G | |
| Asus VivoBook Pro 16X OLED N7600PC-L2026X | |
| Cinebench R23 | |
| Multi Core | |
| Samsung Galaxy Book3 Ultra 16 | |
| Average Intel Core i7-13700H (5890 - 20034, n=27) | |
| Samsung Galaxy Book3 Ultra 16 (Hohe Leistung) | |
| Average of class Multimedia (4624 - 30789, n=101, last 2 years) | |
| Dell XPS 15 9520 RTX 3050 Ti | |
| Lenovo ThinkBook 16p G3 ARH | |
| SCHENKER Vision 16 Pro RTX 3070 Ti | |
| Samsung Galaxy Book3 Ultra 16 (Leise) | |
| Acer Swift X SFX16-52G-77RX | |
| LG Gram 17Z90Q-E.AD78G | |
| LG Gram 17Z90Q-E.AD78G | |
| Asus VivoBook Pro 16X OLED N7600PC-L2026X | |
| Single Core | |
| Samsung Galaxy Book3 Ultra 16 (Hohe Leistung) | |
| SCHENKER Vision 16 Pro RTX 3070 Ti | |
| Average Intel Core i7-13700H (1323 - 1914, n=27) | |
| Dell XPS 15 9520 RTX 3050 Ti | |
| Acer Swift X SFX16-52G-77RX | |
| Average of class Multimedia (878 - 2110, n=99, last 2 years) | |
| Samsung Galaxy Book3 Ultra 16 | |
| LG Gram 17Z90Q-E.AD78G | |
| Lenovo ThinkBook 16p G3 ARH | |
| Asus VivoBook Pro 16X OLED N7600PC-L2026X | |
| Samsung Galaxy Book3 Ultra 16 (Leise) | |
| Cinebench R20 | |
| CPU (Multi Core) | |
| Samsung Galaxy Book3 Ultra 16 | |
| Average Intel Core i7-13700H (2322 - 7674, n=27) | |
| Samsung Galaxy Book3 Ultra 16 (Hohe Leistung) | |
| Dell XPS 15 9520 RTX 3050 Ti | |
| Average of class Multimedia (1783 - 11768, n=97, last 2 years) | |
| Lenovo ThinkBook 16p G3 ARH | |
| SCHENKER Vision 16 Pro RTX 3070 Ti | |
| Samsung Galaxy Book3 Ultra 16 (Leise) | |
| Acer Swift X SFX16-52G-77RX | |
| LG Gram 17Z90Q-E.AD78G | |
| Asus VivoBook Pro 16X OLED N7600PC-L2026X | |
| CPU (Single Core) | |
| Samsung Galaxy Book3 Ultra 16 (Hohe Leistung) | |
| SCHENKER Vision 16 Pro RTX 3070 Ti | |
| Average Intel Core i7-13700H (508 - 741, n=27) | |
| Dell XPS 15 9520 RTX 3050 Ti | |
| Acer Swift X SFX16-52G-77RX | |
| Samsung Galaxy Book3 Ultra 16 | |
| Average of class Multimedia (341 - 812, n=97, last 2 years) | |
| LG Gram 17Z90Q-E.AD78G | |
| Lenovo ThinkBook 16p G3 ARH | |
| Asus VivoBook Pro 16X OLED N7600PC-L2026X | |
| Samsung Galaxy Book3 Ultra 16 (Leise) | |
| Cinebench R15 | |
| CPU Multi 64Bit | |
| SCHENKER Vision 16 Pro RTX 3070 Ti (Turbo) | |
| SCHENKER Vision 16 Pro RTX 3070 Ti | |
| Samsung Galaxy Book3 Ultra 16 | |
| Samsung Galaxy Book3 Ultra 16 (Hohe Leistung) | |
| Average Intel Core i7-13700H (905 - 2982, n=27) | |
| Average of class Multimedia (785 - 4703, n=106, last 2 years) | |
| Samsung Galaxy Book3 Ultra 16 (Leise) | |
| Dell XPS 15 9520 RTX 3050 Ti | |
| Lenovo ThinkBook 16p G3 ARH | |
| Acer Swift X SFX16-52G-77RX | |
| LG Gram 17Z90Q-E.AD78G | |
| Asus VivoBook Pro 16X OLED N7600PC-L2026X | |
| CPU Single 64Bit | |
| Samsung Galaxy Book3 Ultra 16 (Hohe Leistung) | |
| SCHENKER Vision 16 Pro RTX 3070 Ti | |
| Average Intel Core i7-13700H (213 - 276, n=27) | |
| Dell XPS 15 9520 RTX 3050 Ti | |
| Average of class Multimedia (142.6 - 308, n=99, last 2 years) | |
| Acer Swift X SFX16-52G-77RX | |
| Samsung Galaxy Book3 Ultra 16 | |
| Lenovo ThinkBook 16p G3 ARH | |
| Asus VivoBook Pro 16X OLED N7600PC-L2026X | |
| Asus VivoBook Pro 16X OLED N7600PC-L2026X | |
| LG Gram 17Z90Q-E.AD78G | |
| Samsung Galaxy Book3 Ultra 16 (Leise) | |
| Blender - v2.79 BMW27 CPU | |
| Asus VivoBook Pro 16X OLED N7600PC-L2026X | |
| LG Gram 17Z90Q-E.AD78G | |
| Acer Swift X SFX16-52G-77RX | |
| Samsung Galaxy Book3 Ultra 16 (Leise) | |
| Average of class Multimedia (107 - 662, n=95, last 2 years) | |
| SCHENKER Vision 16 Pro RTX 3070 Ti | |
| Lenovo ThinkBook 16p G3 ARH | |
| Average Intel Core i7-13700H (169 - 555, n=27) | |
| Dell XPS 15 9520 RTX 3050 Ti | |
| Samsung Galaxy Book3 Ultra 16 | |
| Samsung Galaxy Book3 Ultra 16 (Hohe Leistung) | |
| 7-Zip 18.03 | |
| 7z b 4 | |
| Dell XPS 15 9520 RTX 3050 Ti | |
| Average Intel Core i7-13700H (27322 - 76344, n=27) | |
| Samsung Galaxy Book3 Ultra 16 | |
| Samsung Galaxy Book3 Ultra 16 (Hohe Leistung) | |
| Average of class Multimedia (20166 - 119900, n=90, last 2 years) | |
| Lenovo ThinkBook 16p G3 ARH | |
| SCHENKER Vision 16 Pro RTX 3070 Ti | |
| Samsung Galaxy Book3 Ultra 16 (Leise) | |
| Acer Swift X SFX16-52G-77RX | |
| LG Gram 17Z90Q-E.AD78G | |
| Asus VivoBook Pro 16X OLED N7600PC-L2026X | |
| 7z b 4 -mmt1 | |
| Samsung Galaxy Book3 Ultra 16 (Hohe Leistung) | |
| SCHENKER Vision 16 Pro RTX 3070 Ti | |
| Average Intel Core i7-13700H (4825 - 6238, n=27) | |
| Dell XPS 15 9520 RTX 3050 Ti | |
| Average of class Multimedia (3398 - 7163, n=90, last 2 years) | |
| Samsung Galaxy Book3 Ultra 16 | |
| Asus VivoBook Pro 16X OLED N7600PC-L2026X | |
| Acer Swift X SFX16-52G-77RX | |
| Lenovo ThinkBook 16p G3 ARH | |
| LG Gram 17Z90Q-E.AD78G | |
| Samsung Galaxy Book3 Ultra 16 (Leise) | |
| Geekbench 5.5 | |
| Multi-Core | |
| Samsung Galaxy Book3 Ultra 16 (Hohe Leistung) | |
| Average Intel Core i7-13700H (6165 - 14215, n=27) | |
| Dell XPS 15 9520 RTX 3050 Ti | |
| Samsung Galaxy Book3 Ultra 16 | |
| Average of class Multimedia (3828 - 23059, n=100, last 2 years) | |
| SCHENKER Vision 16 Pro RTX 3070 Ti | |
| Acer Swift X SFX16-52G-77RX | |
| Samsung Galaxy Book3 Ultra 16 (Leise) | |
| Lenovo ThinkBook 16p G3 ARH | |
| LG Gram 17Z90Q-E.AD78G | |
| Asus VivoBook Pro 16X OLED N7600PC-L2026X | |
| Single-Core | |
| Samsung Galaxy Book3 Ultra 16 (Hohe Leistung) | |
| SCHENKER Vision 16 Pro RTX 3070 Ti | |
| Average Intel Core i7-13700H (1362 - 1919, n=27) | |
| Acer Swift X SFX16-52G-77RX | |
| Dell XPS 15 9520 RTX 3050 Ti | |
| Average of class Multimedia (926 - 2342, n=100, last 2 years) | |
| Samsung Galaxy Book3 Ultra 16 | |
| LG Gram 17Z90Q-E.AD78G | |
| Lenovo ThinkBook 16p G3 ARH | |
| Asus VivoBook Pro 16X OLED N7600PC-L2026X | |
| Samsung Galaxy Book3 Ultra 16 (Leise) | |
| HWBOT x265 Benchmark v2.2 - 4k Preset | |
| Samsung Galaxy Book3 Ultra 16 (Hohe Leistung) | |
| Lenovo ThinkBook 16p G3 ARH | |
| Samsung Galaxy Book3 Ultra 16 | |
| Average Intel Core i7-13700H (6.72 - 21.2, n=27) | |
| Average of class Multimedia (4.99 - 30.5, n=88, last 2 years) | |
| Dell XPS 15 9520 RTX 3050 Ti | |
| SCHENKER Vision 16 Pro RTX 3070 Ti | |
| Acer Swift X SFX16-52G-77RX | |
| Samsung Galaxy Book3 Ultra 16 (Leise) | |
| LG Gram 17Z90Q-E.AD78G | |
| Asus VivoBook Pro 16X OLED N7600PC-L2026X | |
| LibreOffice - 20 Documents To PDF | |
| LG Gram 17Z90Q-E.AD78G | |
| Lenovo ThinkBook 16p G3 ARH | |
| Acer Swift X SFX16-52G-77RX | |
| Asus VivoBook Pro 16X OLED N7600PC-L2026X | |
| Samsung Galaxy Book3 Ultra 16 (Leise) | |
| Samsung Galaxy Book3 Ultra 16 | |
| Average Intel Core i7-13700H (31.3 - 62.4, n=27) | |
| Average of class Multimedia (6.7 - 84.9, n=92, last 2 years) | |
| SCHENKER Vision 16 Pro RTX 3070 Ti | |
| Dell XPS 15 9520 RTX 3050 Ti | |
| Samsung Galaxy Book3 Ultra 16 (Hohe Leistung) | |
| R Benchmark 2.5 - Overall mean | |
| Samsung Galaxy Book3 Ultra 16 (Leise) | |
| Asus VivoBook Pro 16X OLED N7600PC-L2026X | |
| LG Gram 17Z90Q-E.AD78G | |
| Lenovo ThinkBook 16p G3 ARH | |
| Samsung Galaxy Book3 Ultra 16 | |
| Average of class Multimedia (0.3826 - 0.723, n=90, last 2 years) | |
| Samsung Galaxy Book3 Ultra 16 (Hohe Leistung) | |
| Acer Swift X SFX16-52G-77RX | |
| Average Intel Core i7-13700H (0.4308 - 0.607, n=27) | |
| SCHENKER Vision 16 Pro RTX 3070 Ti | |
| Dell XPS 15 9520 RTX 3050 Ti | |
* ... smaller is better
AIDA64: FP32 Ray-Trace | FPU Julia | CPU SHA3 | CPU Queen | FPU SinJulia | FPU Mandel | CPU AES | CPU ZLib | FP64 Ray-Trace | CPU PhotoWorxx
| Performance Rating | |
| Lenovo ThinkBook 16p G3 ARH | |
| Samsung Galaxy Book3 Ultra 16 | |
| Average Intel Core i7-13700H | |
| Average of class Multimedia | |
| SCHENKER Vision 16 Pro RTX 3070 Ti | |
| Dell XPS 15 9520 RTX 3050 Ti | |
| Acer Swift X SFX16-52G-77RX | |
| LG Gram 17Z90Q-E.AD78G | |
| Asus VivoBook Pro 16X OLED N7600PC-L2026X | |
| AIDA64 / FP32 Ray-Trace | |
| Lenovo ThinkBook 16p G3 ARH (v6.75.6100) | |
| Samsung Galaxy Book3 Ultra 16 (v6.75.6100) | |
| Average Intel Core i7-13700H (4986 - 18908, n=27) | |
| Average of class Multimedia (3804 - 27411, n=88, last 2 years) | |
| SCHENKER Vision 16 Pro RTX 3070 Ti (v6.75.6100) | |
| Acer Swift X SFX16-52G-77RX (v6.70.6000) | |
| Dell XPS 15 9520 RTX 3050 Ti (v6.50.5800) | |
| Asus VivoBook Pro 16X OLED N7600PC-L2026X (v6.75.6100) | |
| LG Gram 17Z90Q-E.AD78G (v6.50.5800) | |
| AIDA64 / FPU Julia | |
| Lenovo ThinkBook 16p G3 ARH (v6.75.6100) | |
| Average Intel Core i7-13700H (25360 - 92359, n=27) | |
| Samsung Galaxy Book3 Ultra 16 (v6.75.6100) | |
| Average of class Multimedia (16379 - 136048, n=88, last 2 years) | |
| SCHENKER Vision 16 Pro RTX 3070 Ti (v6.75.6100) | |
| Acer Swift X SFX16-52G-77RX (v6.70.6000) | |
| Dell XPS 15 9520 RTX 3050 Ti (v6.50.5800) | |
| Asus VivoBook Pro 16X OLED N7600PC-L2026X (v6.75.6100) | |
| LG Gram 17Z90Q-E.AD78G (v6.50.5800) | |
| AIDA64 / CPU SHA3 | |
| Lenovo ThinkBook 16p G3 ARH (v6.75.6100) | |
| Average Intel Core i7-13700H (1339 - 4224, n=27) | |
| Samsung Galaxy Book3 Ultra 16 (v6.75.6100) | |
| Average of class Multimedia (1099 - 6681, n=88, last 2 years) | |
| SCHENKER Vision 16 Pro RTX 3070 Ti (v6.75.6100) | |
| Dell XPS 15 9520 RTX 3050 Ti (v6.50.5800) | |
| Acer Swift X SFX16-52G-77RX (v6.70.6000) | |
| Asus VivoBook Pro 16X OLED N7600PC-L2026X (v6.75.6100) | |
| LG Gram 17Z90Q-E.AD78G (v6.50.5800) | |
| AIDA64 / CPU Queen | |
| Lenovo ThinkBook 16p G3 ARH (v6.75.6100) | |
| Samsung Galaxy Book3 Ultra 16 (v6.75.6100) | |
| Dell XPS 15 9520 RTX 3050 Ti (v6.50.5800) | |
| Average Intel Core i7-13700H (68763 - 107159, n=27) | |
| Average of class Multimedia (21547 - 134321, n=88, last 2 years) | |
| SCHENKER Vision 16 Pro RTX 3070 Ti (v6.75.6100) | |
| Acer Swift X SFX16-52G-77RX (v6.70.6000) | |
| LG Gram 17Z90Q-E.AD78G (v6.50.5800) | |
| Asus VivoBook Pro 16X OLED N7600PC-L2026X (v6.75.6100) | |
| AIDA64 / FPU SinJulia | |
| Lenovo ThinkBook 16p G3 ARH (v6.75.6100) | |
| Samsung Galaxy Book3 Ultra 16 (v6.75.6100) | |
| Average of class Multimedia (3099 - 15484, n=88, last 2 years) | |
| Average Intel Core i7-13700H (4800 - 11050, n=27) | |
| Dell XPS 15 9520 RTX 3050 Ti (v6.50.5800) | |
| SCHENKER Vision 16 Pro RTX 3070 Ti (v6.75.6100) | |
| Acer Swift X SFX16-52G-77RX (v6.70.6000) | |
| LG Gram 17Z90Q-E.AD78G (v6.50.5800) | |
| Asus VivoBook Pro 16X OLED N7600PC-L2026X (v6.75.6100) | |
| AIDA64 / FPU Mandel | |
| Lenovo ThinkBook 16p G3 ARH (v6.75.6100) | |
| Samsung Galaxy Book3 Ultra 16 (v6.75.6100) | |
| Average Intel Core i7-13700H (12321 - 45118, n=27) | |
| Average of class Multimedia (9602 - 68591, n=88, last 2 years) | |
| SCHENKER Vision 16 Pro RTX 3070 Ti (v6.75.6100) | |
| Acer Swift X SFX16-52G-77RX (v6.70.6000) | |
| Dell XPS 15 9520 RTX 3050 Ti (v6.50.5800) | |
| Asus VivoBook Pro 16X OLED N7600PC-L2026X (v6.75.6100) | |
| LG Gram 17Z90Q-E.AD78G (v6.50.5800) | |
| AIDA64 / CPU AES | |
| Dell XPS 15 9520 RTX 3050 Ti (v6.50.5800) | |
| Average Intel Core i7-13700H (28769 - 151254, n=27) | |
| Average of class Multimedia (23702 - 169946, n=88, last 2 years) | |
| Samsung Galaxy Book3 Ultra 16 (v6.75.6100) | |
| SCHENKER Vision 16 Pro RTX 3070 Ti (v6.75.6100) | |
| Asus VivoBook Pro 16X OLED N7600PC-L2026X (v6.75.6100) | |
| Lenovo ThinkBook 16p G3 ARH (v6.75.6100) | |
| Acer Swift X SFX16-52G-77RX (v6.70.6000) | |
| LG Gram 17Z90Q-E.AD78G (v6.50.5800) | |
| AIDA64 / CPU ZLib | |
| Samsung Galaxy Book3 Ultra 16 (v6.75.6100) | |
| Average Intel Core i7-13700H (389 - 1215, n=27) | |
| Average of class Multimedia (302 - 1901, n=88, last 2 years) | |
| Lenovo ThinkBook 16p G3 ARH (v6.75.6100) | |
| SCHENKER Vision 16 Pro RTX 3070 Ti (v6.75.6100) | |
| Dell XPS 15 9520 RTX 3050 Ti (v6.50.5800) | |
| Acer Swift X SFX16-52G-77RX (v6.70.6000) | |
| LG Gram 17Z90Q-E.AD78G (v6.50.5800) | |
| Asus VivoBook Pro 16X OLED N7600PC-L2026X (v6.75.6100) | |
| AIDA64 / FP64 Ray-Trace | |
| Lenovo ThinkBook 16p G3 ARH (v6.75.6100) | |
| Samsung Galaxy Book3 Ultra 16 (v6.75.6100) | |
| Average Intel Core i7-13700H (2540 - 10135, n=27) | |
| Average of class Multimedia (1996 - 14590, n=88, last 2 years) | |
| SCHENKER Vision 16 Pro RTX 3070 Ti (v6.75.6100) | |
| Acer Swift X SFX16-52G-77RX (v6.70.6000) | |
| Dell XPS 15 9520 RTX 3050 Ti (v6.50.5800) | |
| Asus VivoBook Pro 16X OLED N7600PC-L2026X (v6.75.6100) | |
| LG Gram 17Z90Q-E.AD78G (v6.50.5800) | |
| AIDA64 / CPU PhotoWorxx | |
| Samsung Galaxy Book3 Ultra 16 (v6.75.6100) | |
| Acer Swift X SFX16-52G-77RX (v6.70.6000) | |
| SCHENKER Vision 16 Pro RTX 3070 Ti (v6.75.6100) | |
| Average Intel Core i7-13700H (19552 - 52727, n=27) | |
| LG Gram 17Z90Q-E.AD78G (v6.50.5800) | |
| Average of class Multimedia (7419 - 53918, n=88, last 2 years) | |
| Dell XPS 15 9520 RTX 3050 Ti (v6.50.5800) | |
| Lenovo ThinkBook 16p G3 ARH (v6.75.6100) | |
| Asus VivoBook Pro 16X OLED N7600PC-L2026X (v6.75.6100) | |
System Performance
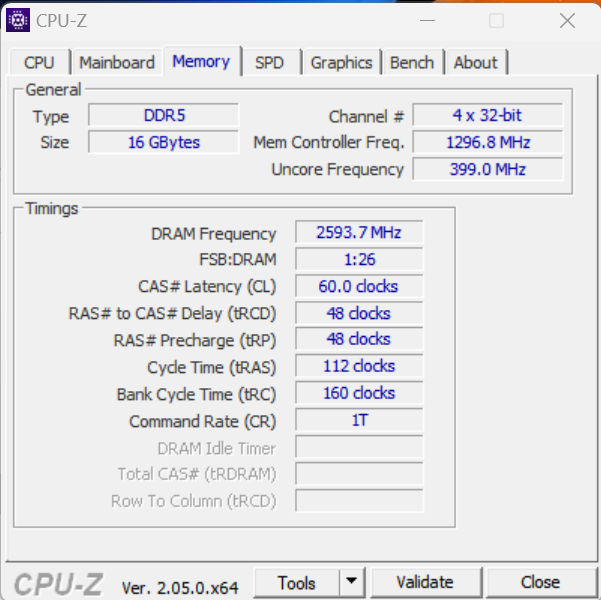
The smooth-running system is not designed for maximum performance. A compromise between compactness, mobility, energy consumption and performance is the aim here. Nevertheless, the laptop can handle demanding applications such as rendering and gaming, as confirmed by the good PCMark results. The RAM's transfer rates are on a normal level for LPDDR5-5200 RAM.
CrossMark: Overall | Productivity | Creativity | Responsiveness
| PCMark 10 / Score | |
| Average Intel Core i7-13700H, NVIDIA GeForce RTX 4050 Laptop GPU (6822 - 7556, n=7) | |
| Dell XPS 15 9520 RTX 3050 Ti | |
| Lenovo ThinkBook 16p G3 ARH | |
| Samsung Galaxy Book3 Ultra 16 | |
| Average of class Multimedia (4635 - 8670, n=85, last 2 years) | |
| LG Gram 17Z90Q-E.AD78G | |
| Acer Swift X SFX16-52G-77RX | |
| Asus VivoBook Pro 16X OLED N7600PC-L2026X | |
| PCMark 10 / Essentials | |
| Dell XPS 15 9520 RTX 3050 Ti | |
| Average Intel Core i7-13700H, NVIDIA GeForce RTX 4050 Laptop GPU (10283 - 11549, n=7) | |
| Acer Swift X SFX16-52G-77RX | |
| Samsung Galaxy Book3 Ultra 16 | |
| Average of class Multimedia (8480 - 12420, n=85, last 2 years) | |
| Lenovo ThinkBook 16p G3 ARH | |
| LG Gram 17Z90Q-E.AD78G | |
| Asus VivoBook Pro 16X OLED N7600PC-L2026X | |
| PCMark 10 / Productivity | |
| Dell XPS 15 9520 RTX 3050 Ti | |
| LG Gram 17Z90Q-E.AD78G | |
| Average Intel Core i7-13700H, NVIDIA GeForce RTX 4050 Laptop GPU (8368 - 9836, n=7) | |
| Lenovo ThinkBook 16p G3 ARH | |
| Average of class Multimedia (5845 - 11186, n=85, last 2 years) | |
| Samsung Galaxy Book3 Ultra 16 | |
| Asus VivoBook Pro 16X OLED N7600PC-L2026X | |
| Acer Swift X SFX16-52G-77RX | |
| PCMark 10 / Digital Content Creation | |
| Average Intel Core i7-13700H, NVIDIA GeForce RTX 4050 Laptop GPU (9527 - 10643, n=7) | |
| Samsung Galaxy Book3 Ultra 16 | |
| Lenovo ThinkBook 16p G3 ARH | |
| Dell XPS 15 9520 RTX 3050 Ti | |
| Average of class Multimedia (4688 - 13548, n=85, last 2 years) | |
| LG Gram 17Z90Q-E.AD78G | |
| Acer Swift X SFX16-52G-77RX | |
| Asus VivoBook Pro 16X OLED N7600PC-L2026X | |
| CrossMark / Overall | |
| Dell XPS 15 9520 RTX 3050 Ti | |
| Average Intel Core i7-13700H, NVIDIA GeForce RTX 4050 Laptop GPU (1205 - 1937, n=9) | |
| Acer Swift X SFX16-52G-77RX | |
| Average of class Multimedia (1009 - 2146, n=91, last 2 years) | |
| SCHENKER Vision 16 Pro RTX 3070 Ti | |
| Samsung Galaxy Book3 Ultra 16 | |
| Lenovo ThinkBook 16p G3 ARH | |
| LG Gram 17Z90Q-E.AD78G | |
| Asus VivoBook Pro 16X OLED N7600PC-L2026X | |
| CrossMark / Productivity | |
| Dell XPS 15 9520 RTX 3050 Ti | |
| Acer Swift X SFX16-52G-77RX | |
| Average Intel Core i7-13700H, NVIDIA GeForce RTX 4050 Laptop GPU (1158 - 1877, n=9) | |
| Average of class Multimedia (971 - 2064, n=91, last 2 years) | |
| SCHENKER Vision 16 Pro RTX 3070 Ti | |
| Lenovo ThinkBook 16p G3 ARH | |
| Samsung Galaxy Book3 Ultra 16 | |
| LG Gram 17Z90Q-E.AD78G | |
| Asus VivoBook Pro 16X OLED N7600PC-L2026X | |
| CrossMark / Creativity | |
| Dell XPS 15 9520 RTX 3050 Ti | |
| Average of class Multimedia (1054 - 2865, n=91, last 2 years) | |
| Average Intel Core i7-13700H, NVIDIA GeForce RTX 4050 Laptop GPU (1293 - 2044, n=9) | |
| SCHENKER Vision 16 Pro RTX 3070 Ti | |
| Acer Swift X SFX16-52G-77RX | |
| Samsung Galaxy Book3 Ultra 16 | |
| LG Gram 17Z90Q-E.AD78G | |
| Lenovo ThinkBook 16p G3 ARH | |
| Asus VivoBook Pro 16X OLED N7600PC-L2026X | |
| CrossMark / Responsiveness | |
| Dell XPS 15 9520 RTX 3050 Ti | |
| Acer Swift X SFX16-52G-77RX | |
| Average Intel Core i7-13700H, NVIDIA GeForce RTX 4050 Laptop GPU (1097 - 1929, n=9) | |
| Samsung Galaxy Book3 Ultra 16 | |
| Average of class Multimedia (926 - 2171, n=91, last 2 years) | |
| SCHENKER Vision 16 Pro RTX 3070 Ti | |
| Lenovo ThinkBook 16p G3 ARH | |
| LG Gram 17Z90Q-E.AD78G | |
| Asus VivoBook Pro 16X OLED N7600PC-L2026X | |
| PCMark 8 Home Score Accelerated v2 | 4564 points | |
| PCMark 8 Work Score Accelerated v2 | 5090 points | |
| PCMark 10 Score | 6822 points | |
Help | ||
| AIDA64 / Memory Copy | |
| Samsung Galaxy Book3 Ultra 16 | |
| LG Gram 17Z90Q-E.AD78G | |
| Acer Swift X SFX16-52G-77RX | |
| Average Intel Core i7-13700H (40018 - 78081, n=27) | |
| SCHENKER Vision 16 Pro RTX 3070 Ti | |
| Average of class Multimedia (20513 - 94254, n=88, last 2 years) | |
| Dell XPS 15 9520 RTX 3050 Ti | |
| Lenovo ThinkBook 16p G3 ARH | |
| Asus VivoBook Pro 16X OLED N7600PC-L2026X | |
| AIDA64 / Memory Read | |
| LG Gram 17Z90Q-E.AD78G | |
| Samsung Galaxy Book3 Ultra 16 | |
| Average Intel Core i7-13700H (44583 - 79656, n=27) | |
| Acer Swift X SFX16-52G-77RX | |
| SCHENKER Vision 16 Pro RTX 3070 Ti | |
| Average of class Multimedia (22917 - 90142, n=88, last 2 years) | |
| Dell XPS 15 9520 RTX 3050 Ti | |
| Lenovo ThinkBook 16p G3 ARH | |
| Asus VivoBook Pro 16X OLED N7600PC-L2026X | |
| AIDA64 / Memory Write | |
| Samsung Galaxy Book3 Ultra 16 | |
| Average Intel Core i7-13700H (42710 - 99898, n=27) | |
| SCHENKER Vision 16 Pro RTX 3070 Ti | |
| Average of class Multimedia (20226 - 95196, n=88, last 2 years) | |
| LG Gram 17Z90Q-E.AD78G | |
| Acer Swift X SFX16-52G-77RX | |
| Dell XPS 15 9520 RTX 3050 Ti | |
| Lenovo ThinkBook 16p G3 ARH | |
| Asus VivoBook Pro 16X OLED N7600PC-L2026X | |
| AIDA64 / Memory Latency | |
| Lenovo ThinkBook 16p G3 ARH | |
| Acer Swift X SFX16-52G-77RX | |
| LG Gram 17Z90Q-E.AD78G | |
| Average of class Multimedia (75 - 346, n=87, last 2 years) | |
| Dell XPS 15 9520 RTX 3050 Ti | |
| Samsung Galaxy Book3 Ultra 16 | |
| Average Intel Core i7-13700H (82.4 - 136.8, n=27) | |
| SCHENKER Vision 16 Pro RTX 3070 Ti | |
| Asus VivoBook Pro 16X OLED N7600PC-L2026X | |
* ... smaller is better
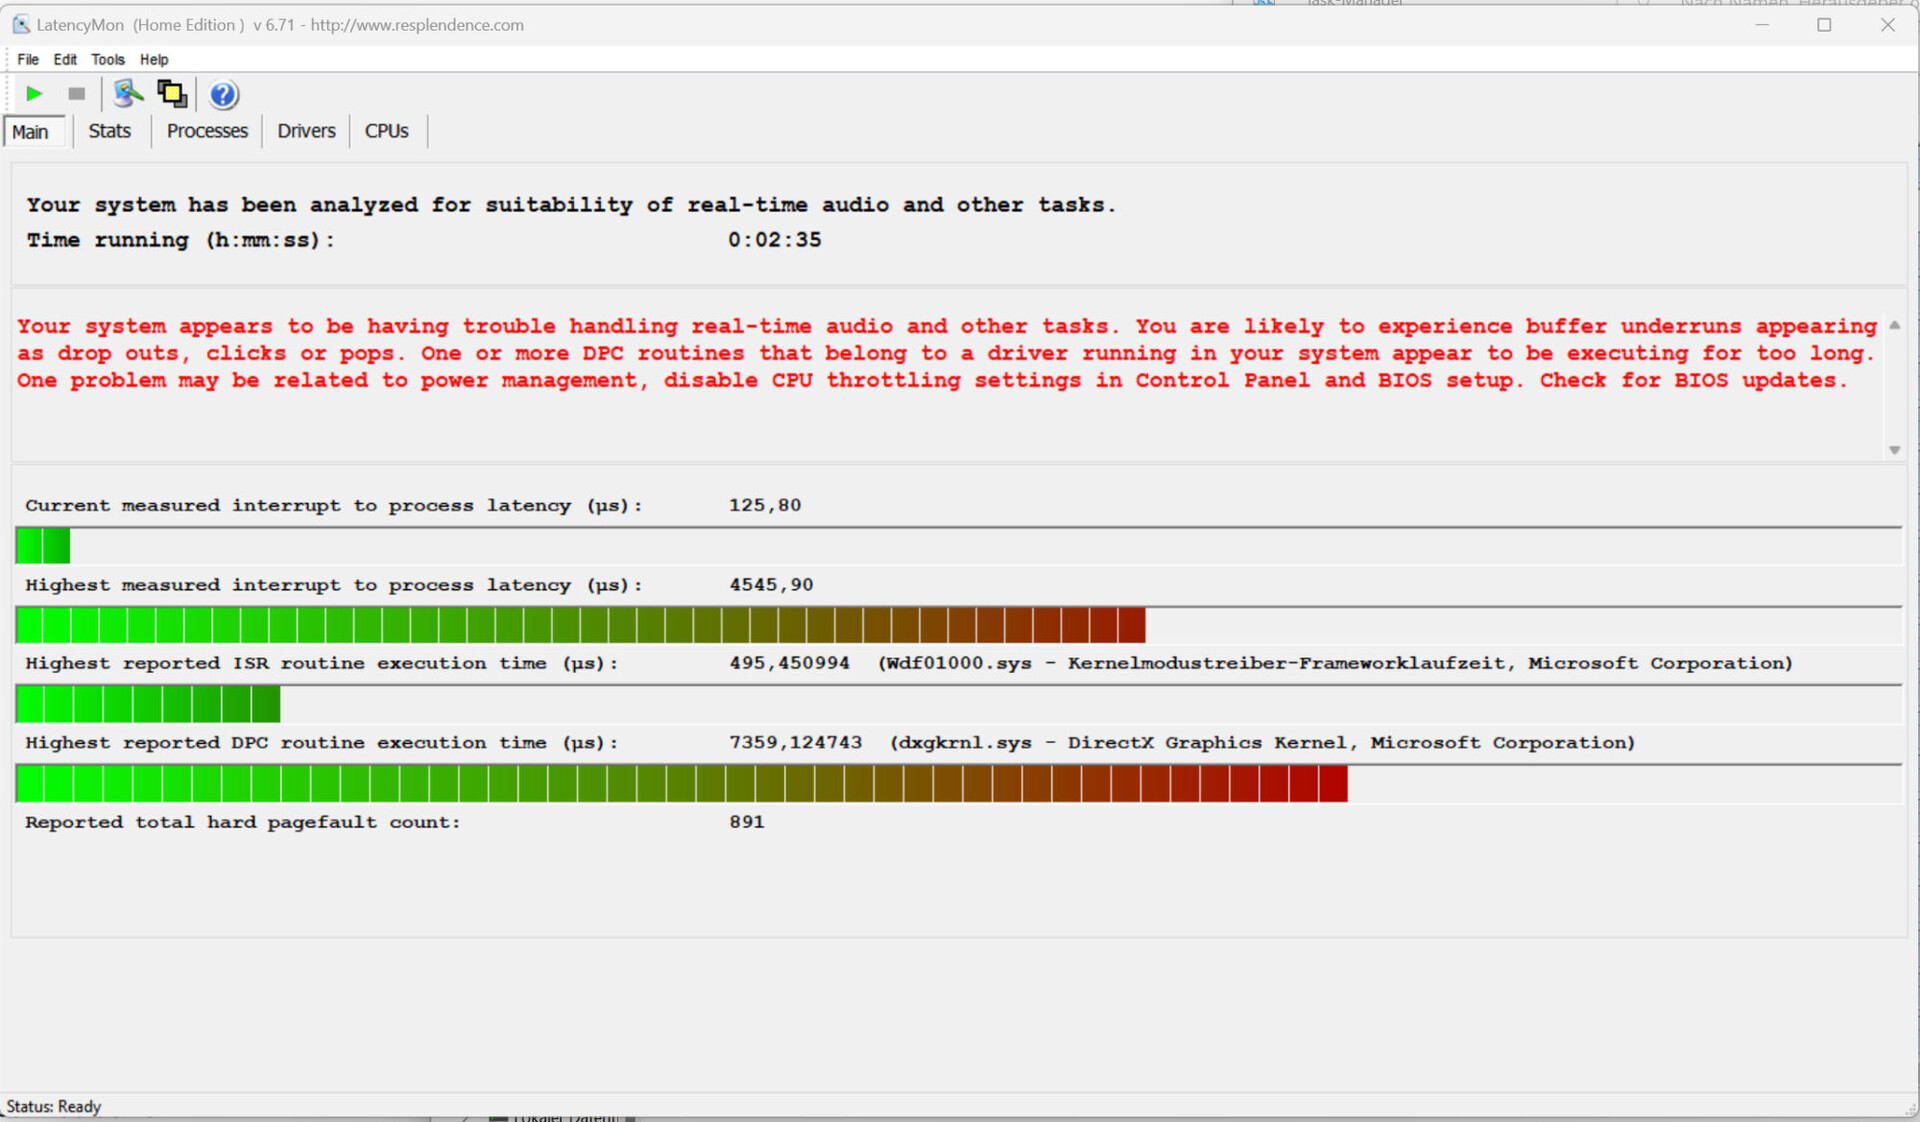
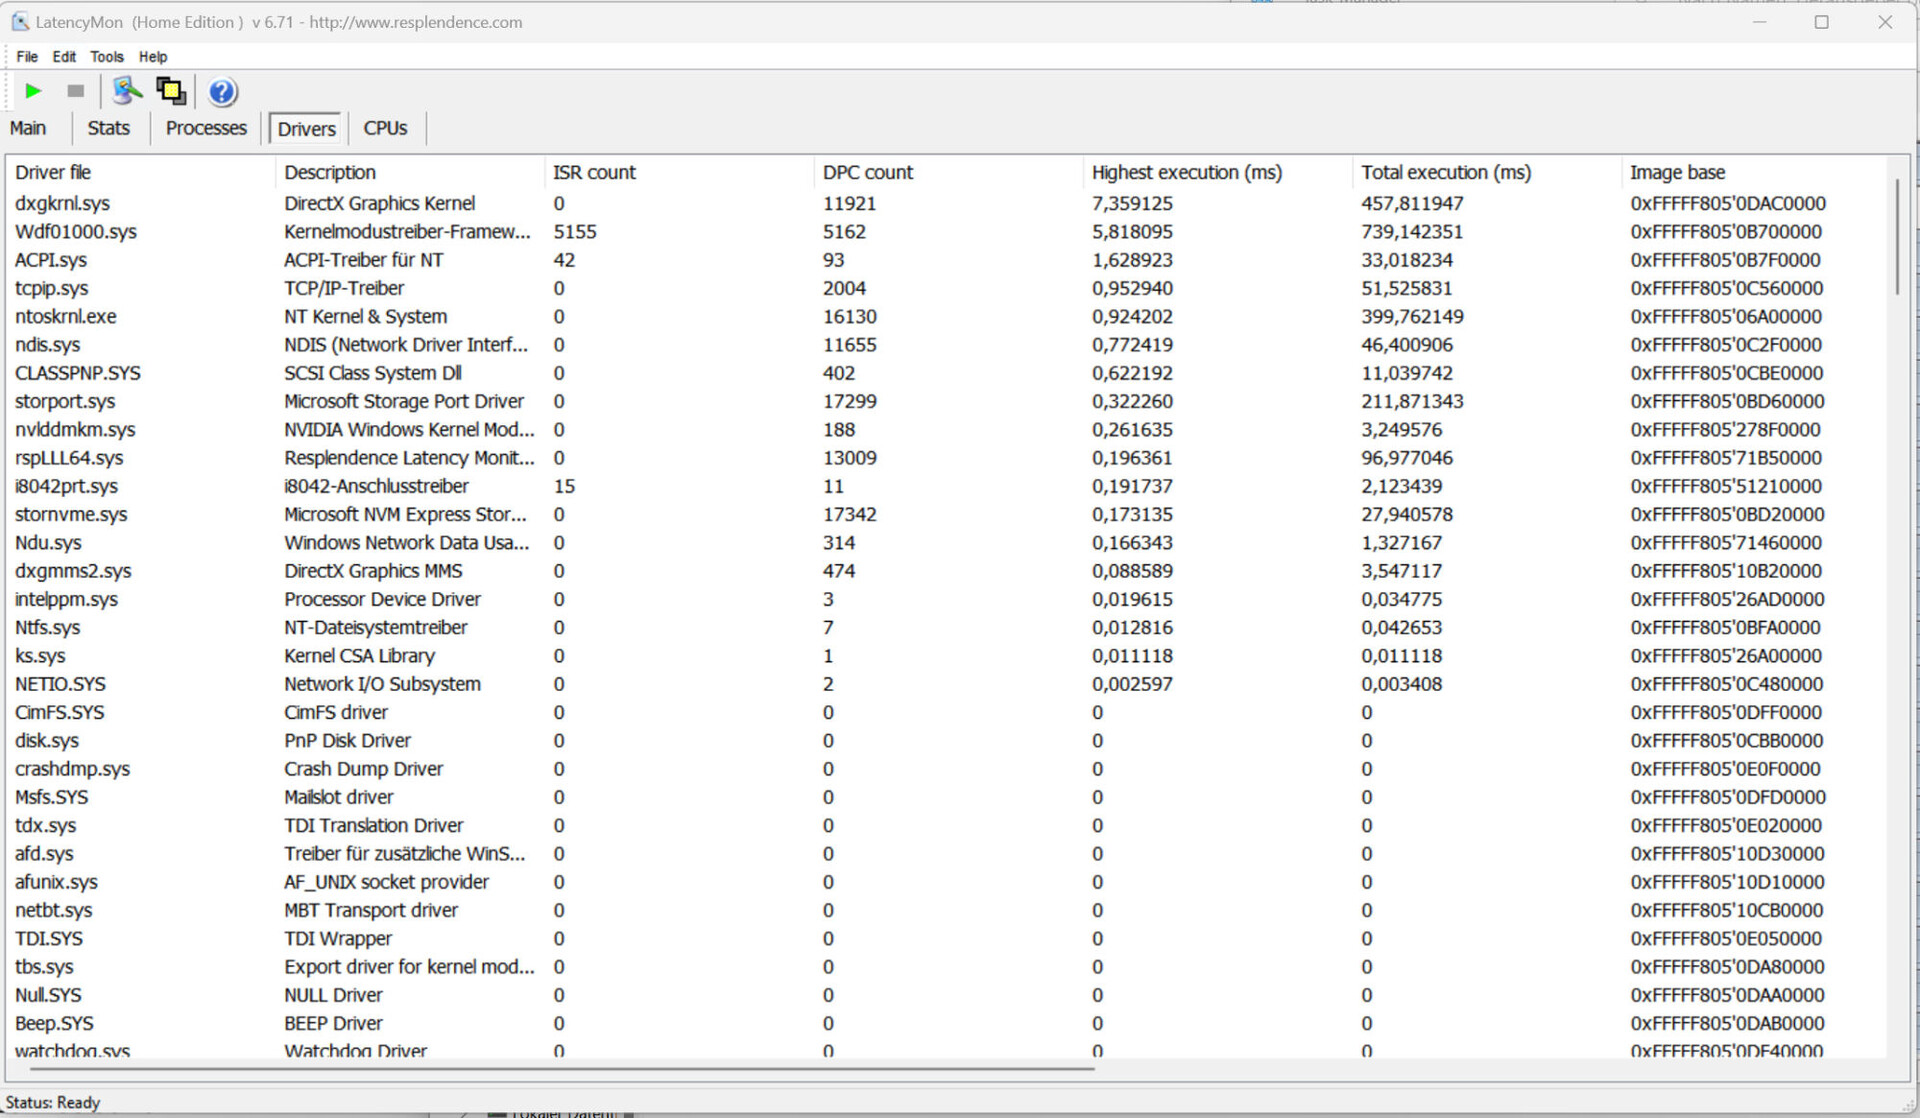
DPC Latency
The standardized latency monitor test (web surfing, 4k video playback, Prime95 high-load) revealed abnormalities, so the system does not appear to be suitable for real-time video and audio editing. Future software updates could lead to improvement or even deterioration.
| DPC Latencies / LatencyMon - interrupt to process latency (max), Web, Youtube, Prime95 | |
| LG Gram 17Z90Q-E.AD78G | |
| Samsung Galaxy Book3 Ultra 16 | |
| Lenovo ThinkBook 16p G3 ARH | |
| Dell XPS 15 9520 RTX 3050 Ti | |
| Acer Swift X SFX16-52G-77RX | |
| SCHENKER Vision 16 Pro RTX 3070 Ti | |
| Asus VivoBook Pro 16X OLED N7600PC-L2026X | |
* ... smaller is better
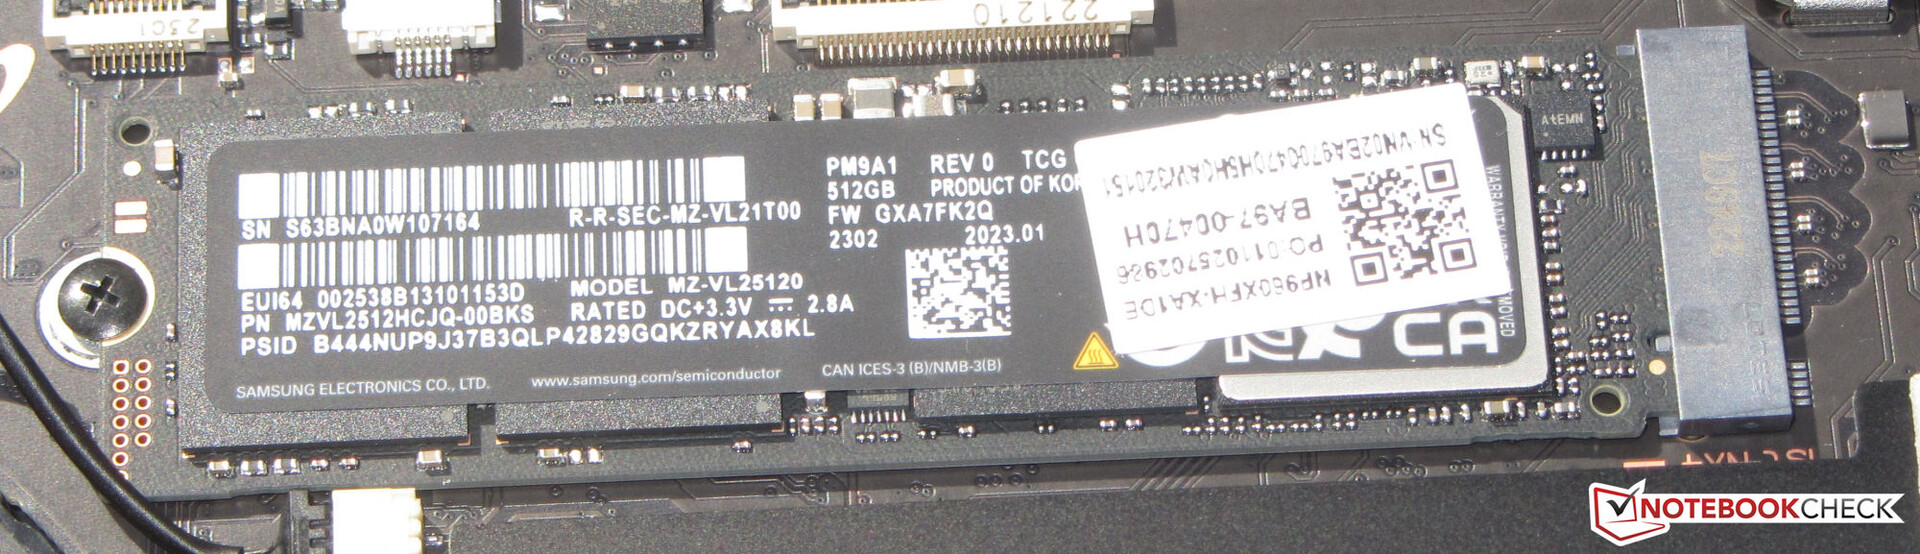
Storage Devices
Samsung is stingy when it comes to storage space, for the built-in PCIe 4 SSD (M.2 2280) of our test device only has 512 GB - too little for a US$2400 laptop. At least it delivers excellent data rates. A second SSD can be installed.

* ... smaller is better
Sustained Read Performance: DiskSpd Read Loop, Queue Depth 8
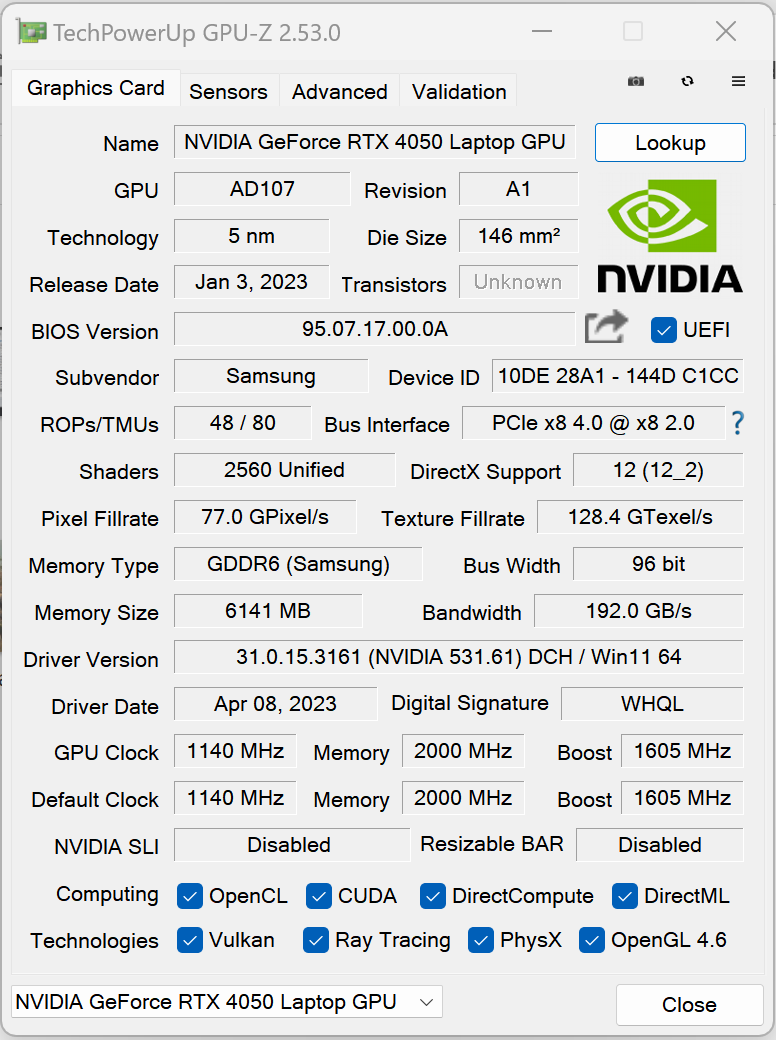
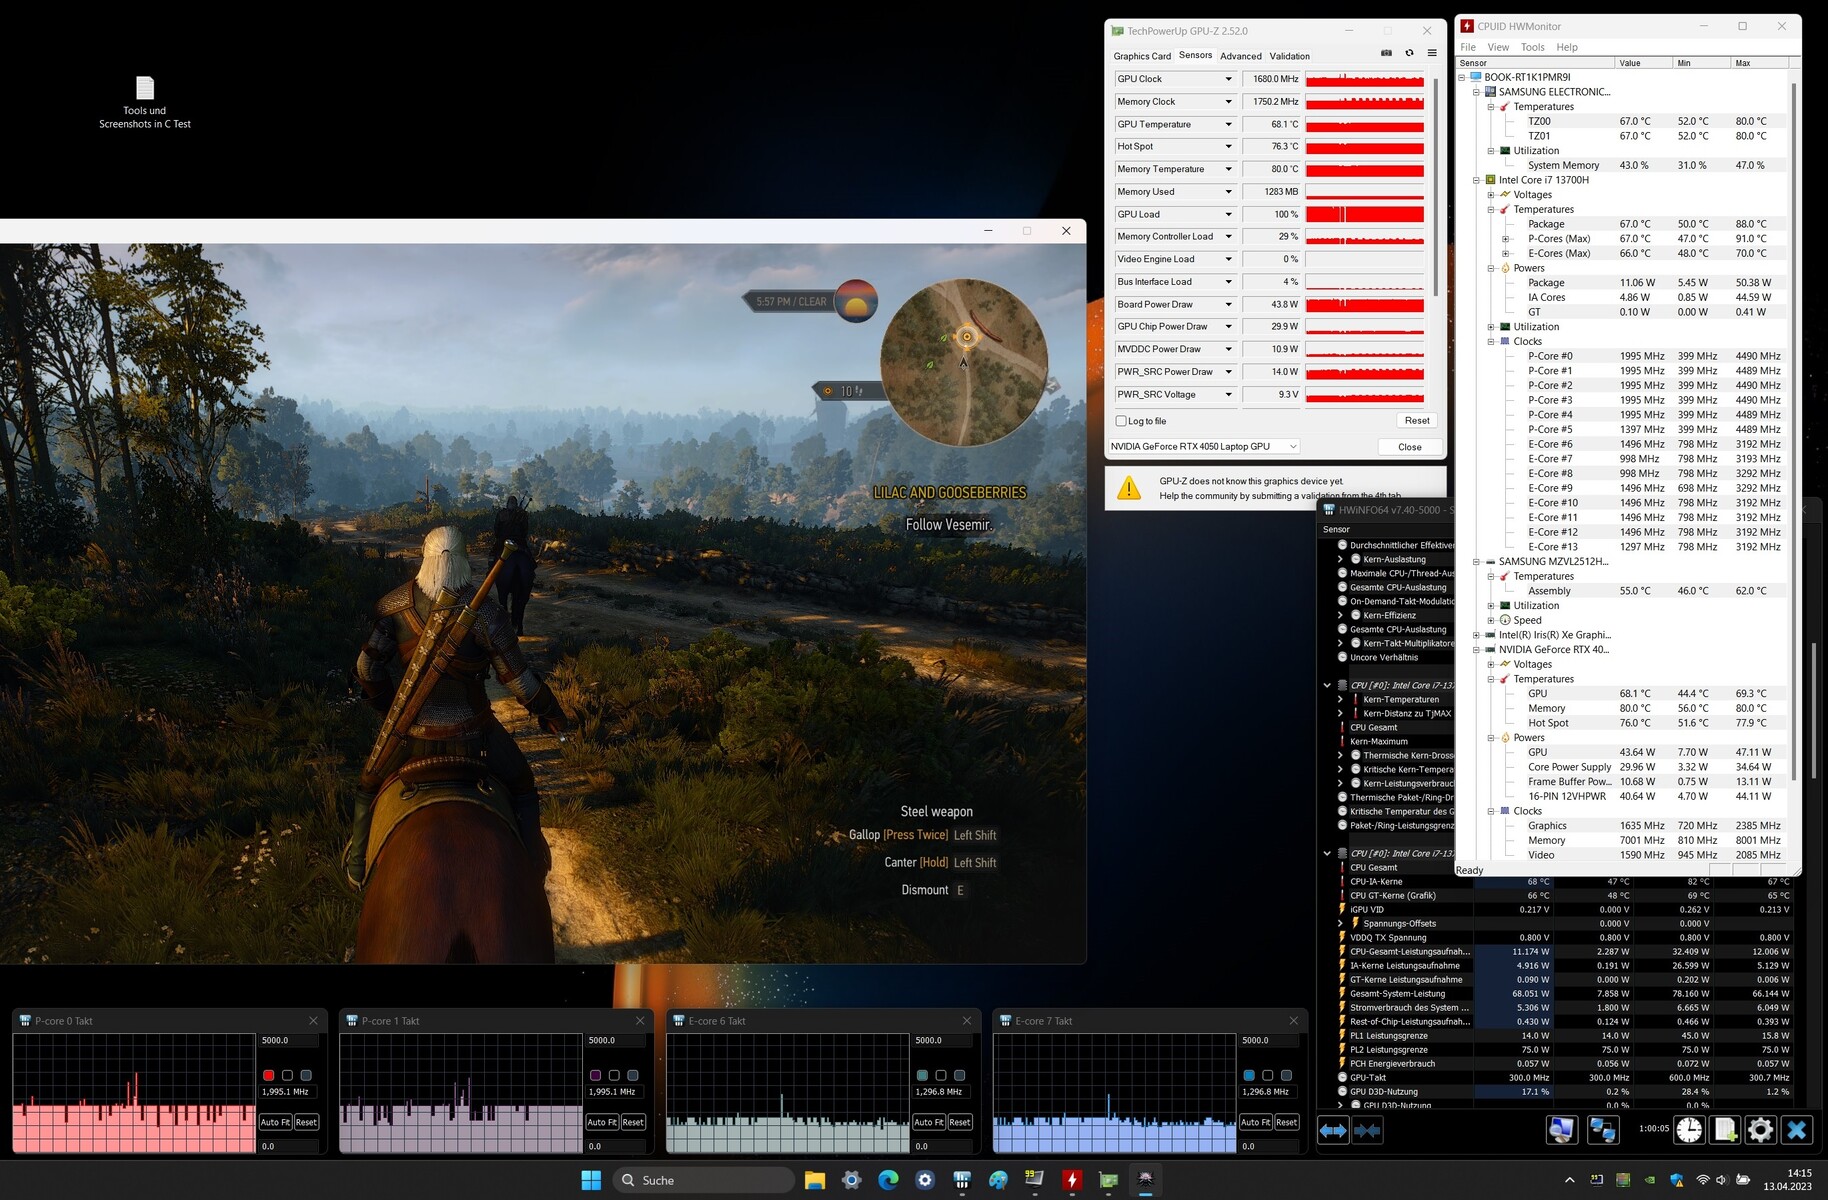
Graphics Card
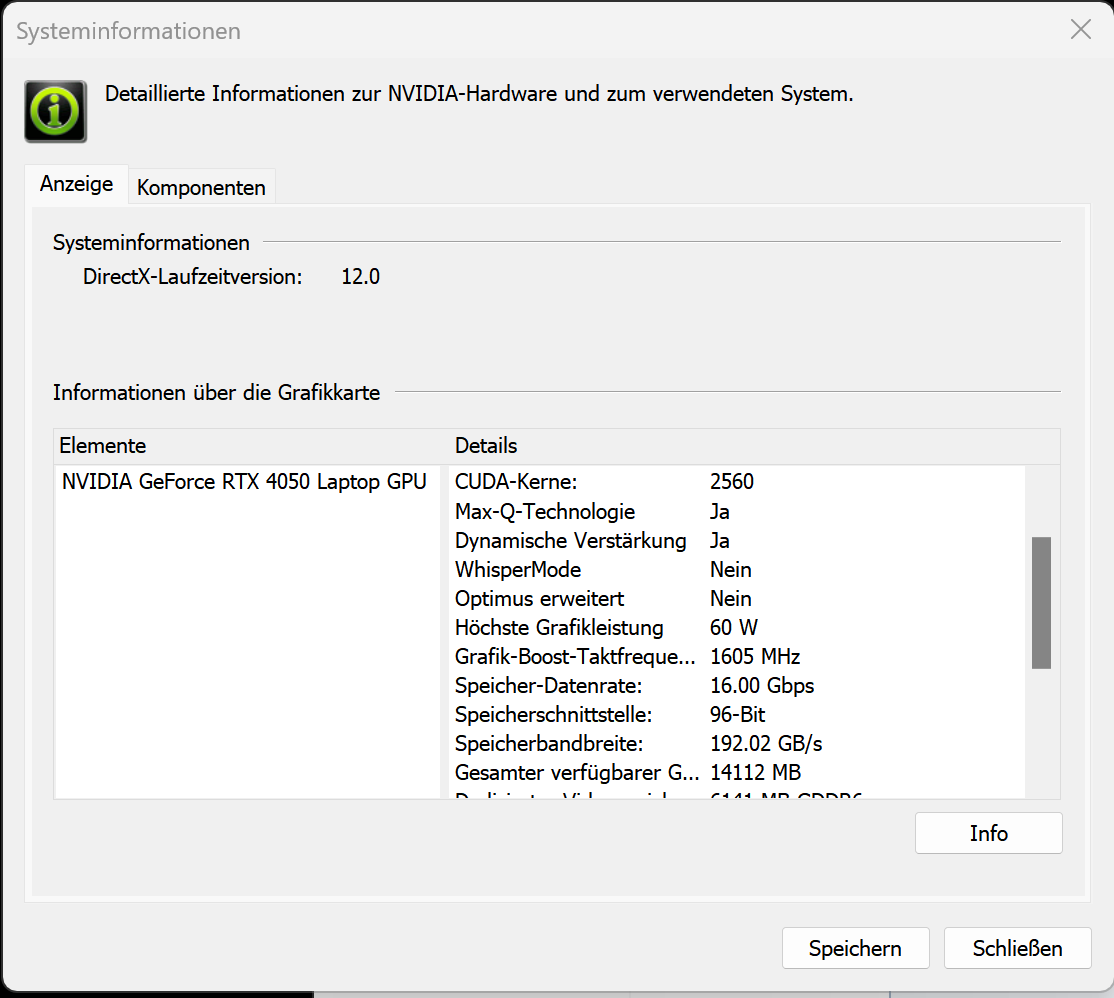
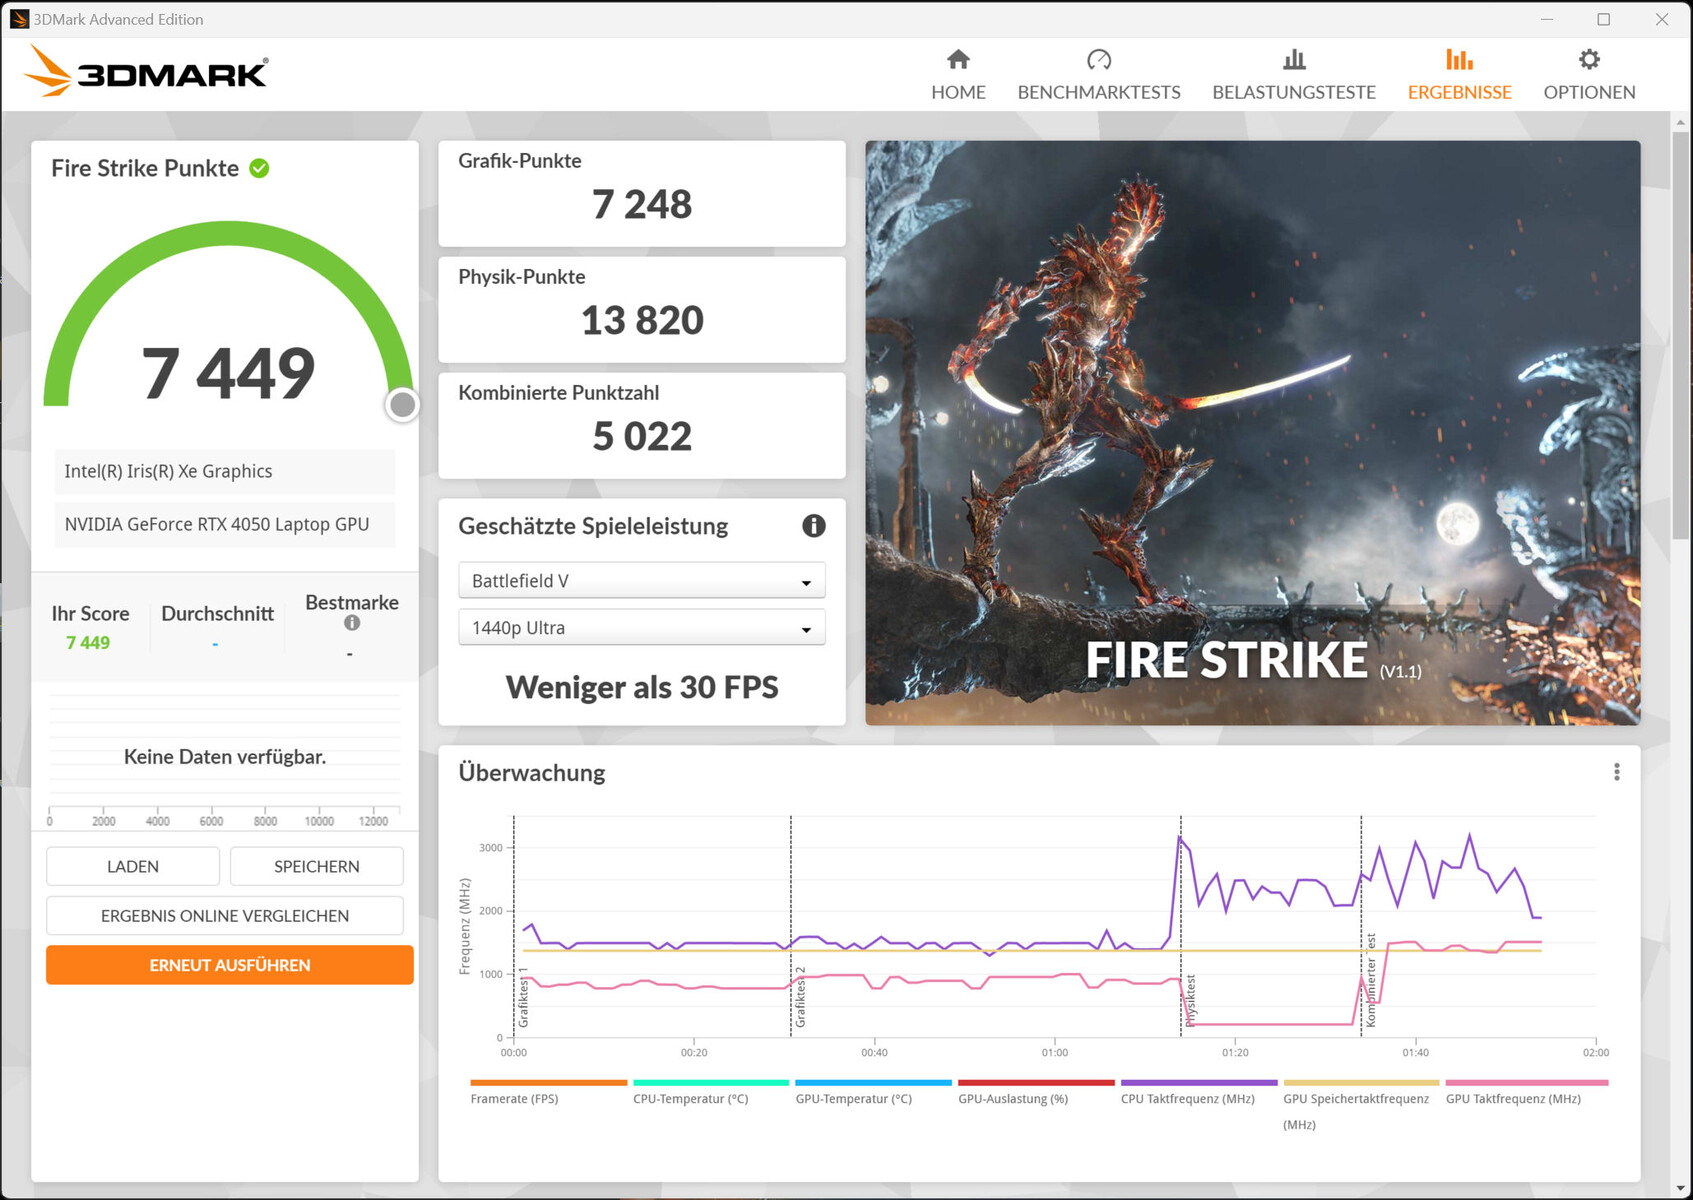
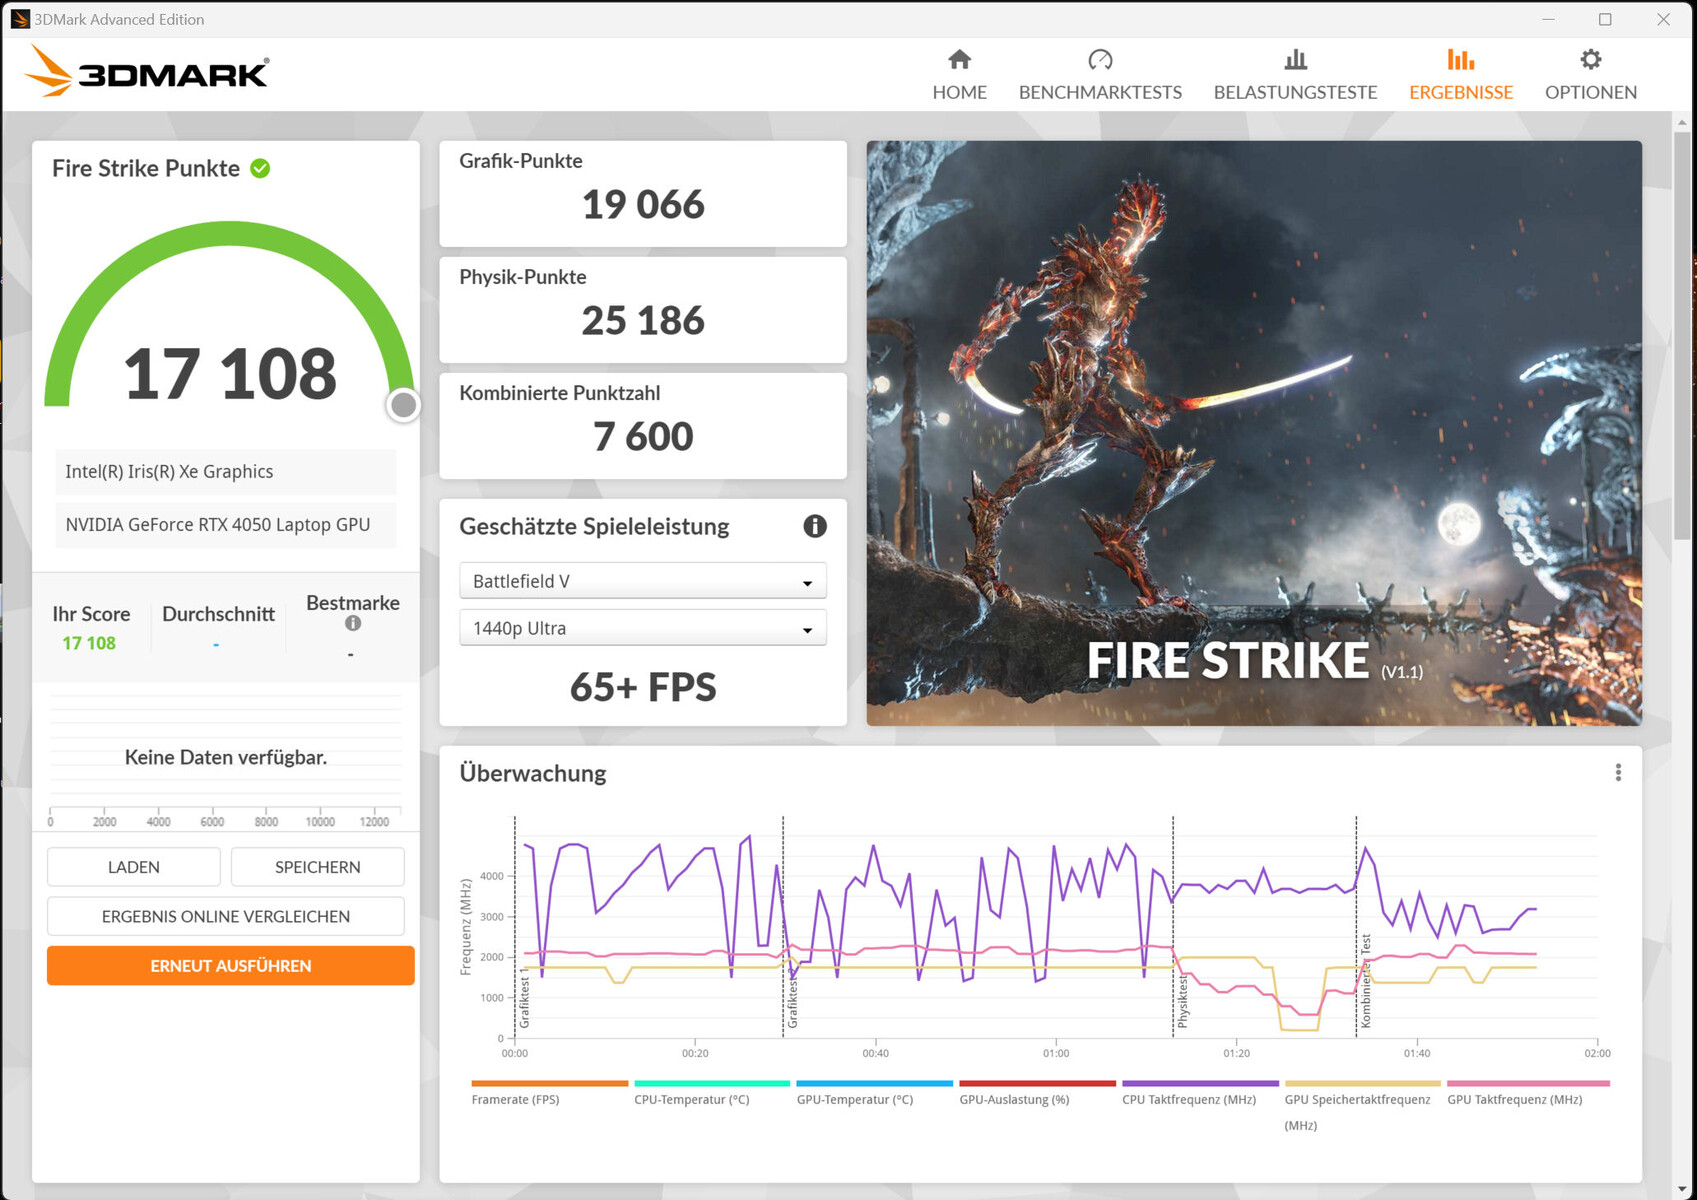
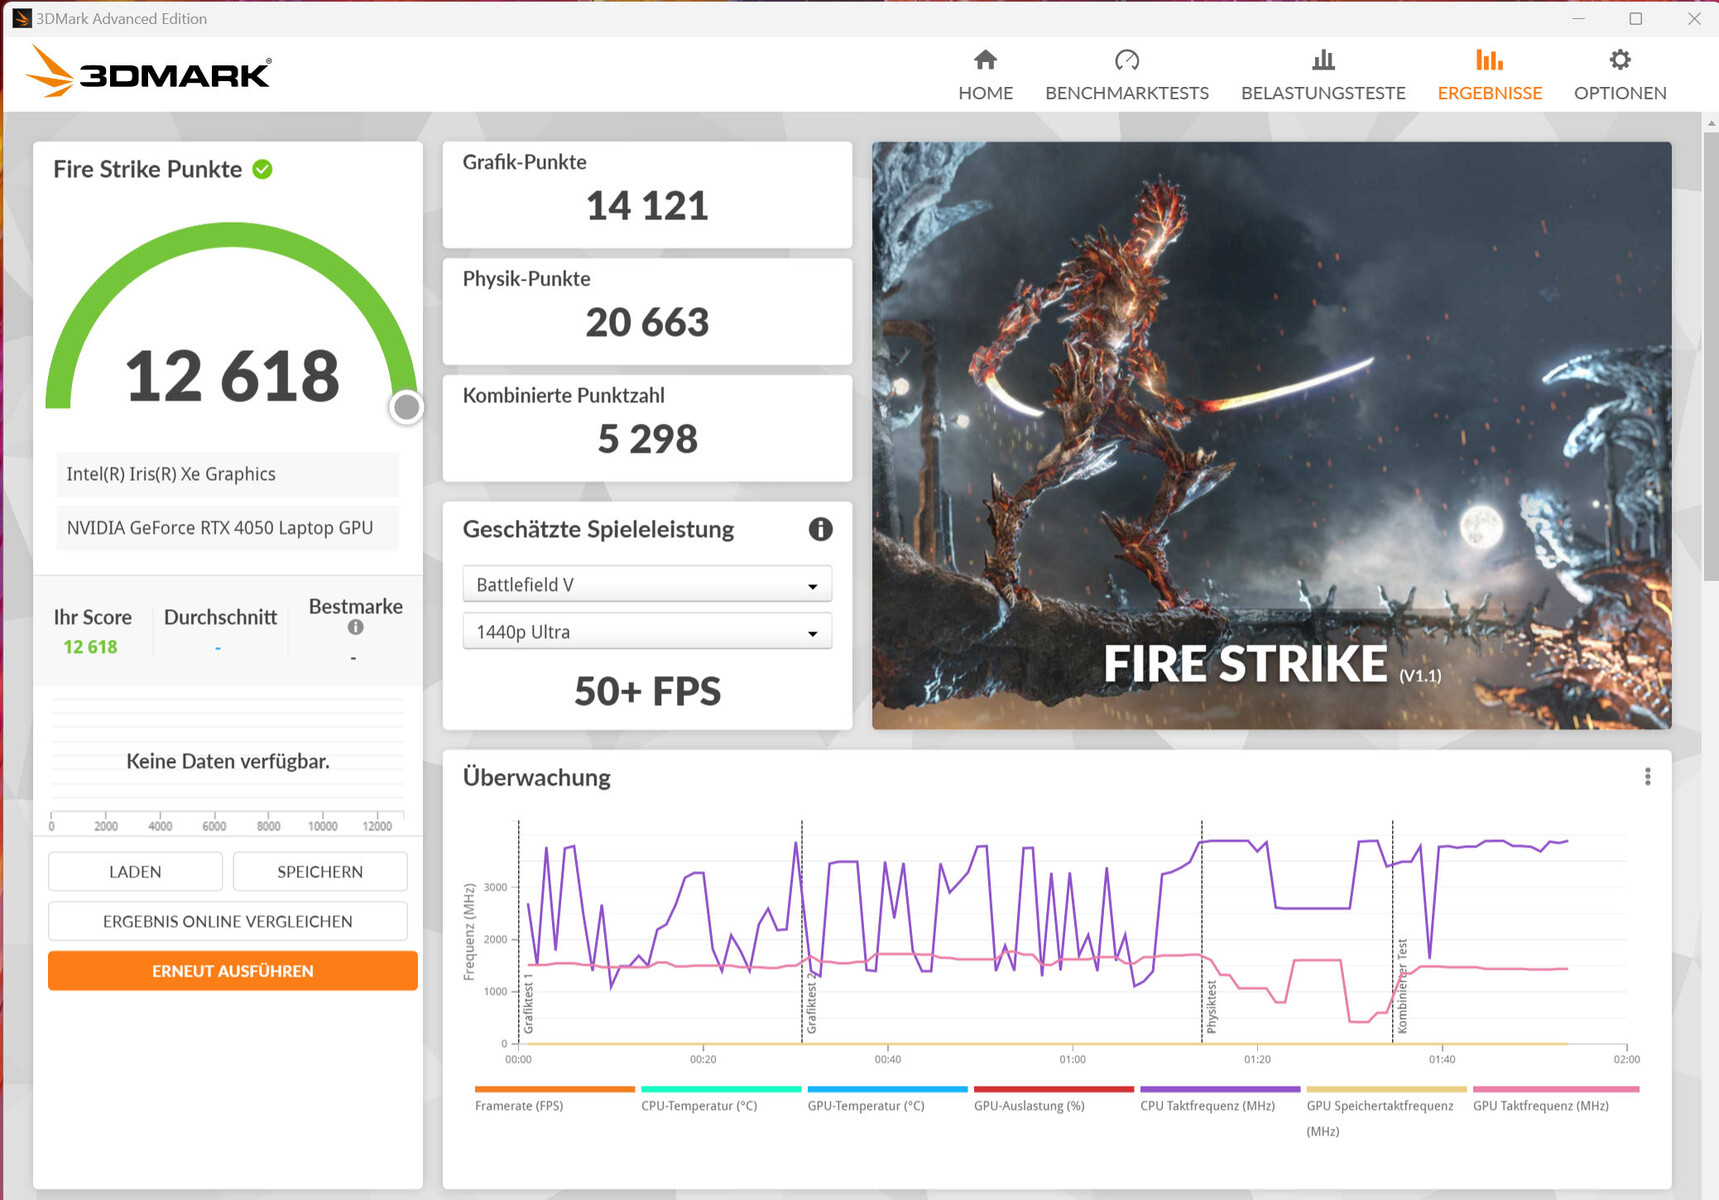
The GeForce RTX 4050 laptop offers 2,560 shaders, a 96-bit wide bus and fast GDDR6 memory (6,144 MB). Samsung grants it a TGP of 60 watts (35 watts + 25 watts dynamic) - a value at the lower end of what is possible. According to the Witcher 3 test, the TGP is fully utilized - but only when the "High Performance" profile is active. The notebook does not offer a dGPU mode.
The benchmark results depend on the performance profile chosen, but are always below the RTX 4050 average. Basically, the RTX 4050 works quite efficiently with a low TGP, achieving more points or higher frame rates per watt than the RTX 4050 of the MSI Katana 15 (TGP: 105 watts).
| 3DMark Performance Rating - Percent | |
| SCHENKER Vision 16 Pro RTX 3070 Ti -1! | |
| MSI Katana 15 B12VEK | |
| Average NVIDIA GeForce RTX 4050 Laptop GPU | |
| Lenovo ThinkBook 16p G3 ARH | |
| Samsung Galaxy Book3 Ultra 16 | |
| Samsung Galaxy Book3 Ultra 16 | |
| Average of class Multimedia | |
| Samsung Galaxy Book3 Ultra 16 | |
| Dell XPS 15 9520 RTX 3050 Ti | |
| Asus VivoBook Pro 16X OLED N7600PC-L2026X | |
| Acer Swift X SFX16-52G-77RX | |
| LG Gram 17Z90Q-E.AD78G | |
| 3DMark 11 - 1280x720 Performance GPU | |
| SCHENKER Vision 16 Pro RTX 3070 Ti | |
| MSI Katana 15 B12VEK | |
| Average NVIDIA GeForce RTX 4050 Laptop GPU (13339 - 32642, n=36) | |
| Samsung Galaxy Book3 Ultra 16 (Hohe Leistung) | |
| Lenovo ThinkBook 16p G3 ARH | |
| Samsung Galaxy Book3 Ultra 16 | |
| Samsung Galaxy Book3 Ultra 16 (Leise) | |
| Average of class Multimedia (3505 - 60250, n=89, last 2 years) | |
| Asus VivoBook Pro 16X OLED N7600PC-L2026X | |
| Dell XPS 15 9520 RTX 3050 Ti | |
| Acer Swift X SFX16-52G-77RX | |
| LG Gram 17Z90Q-E.AD78G | |
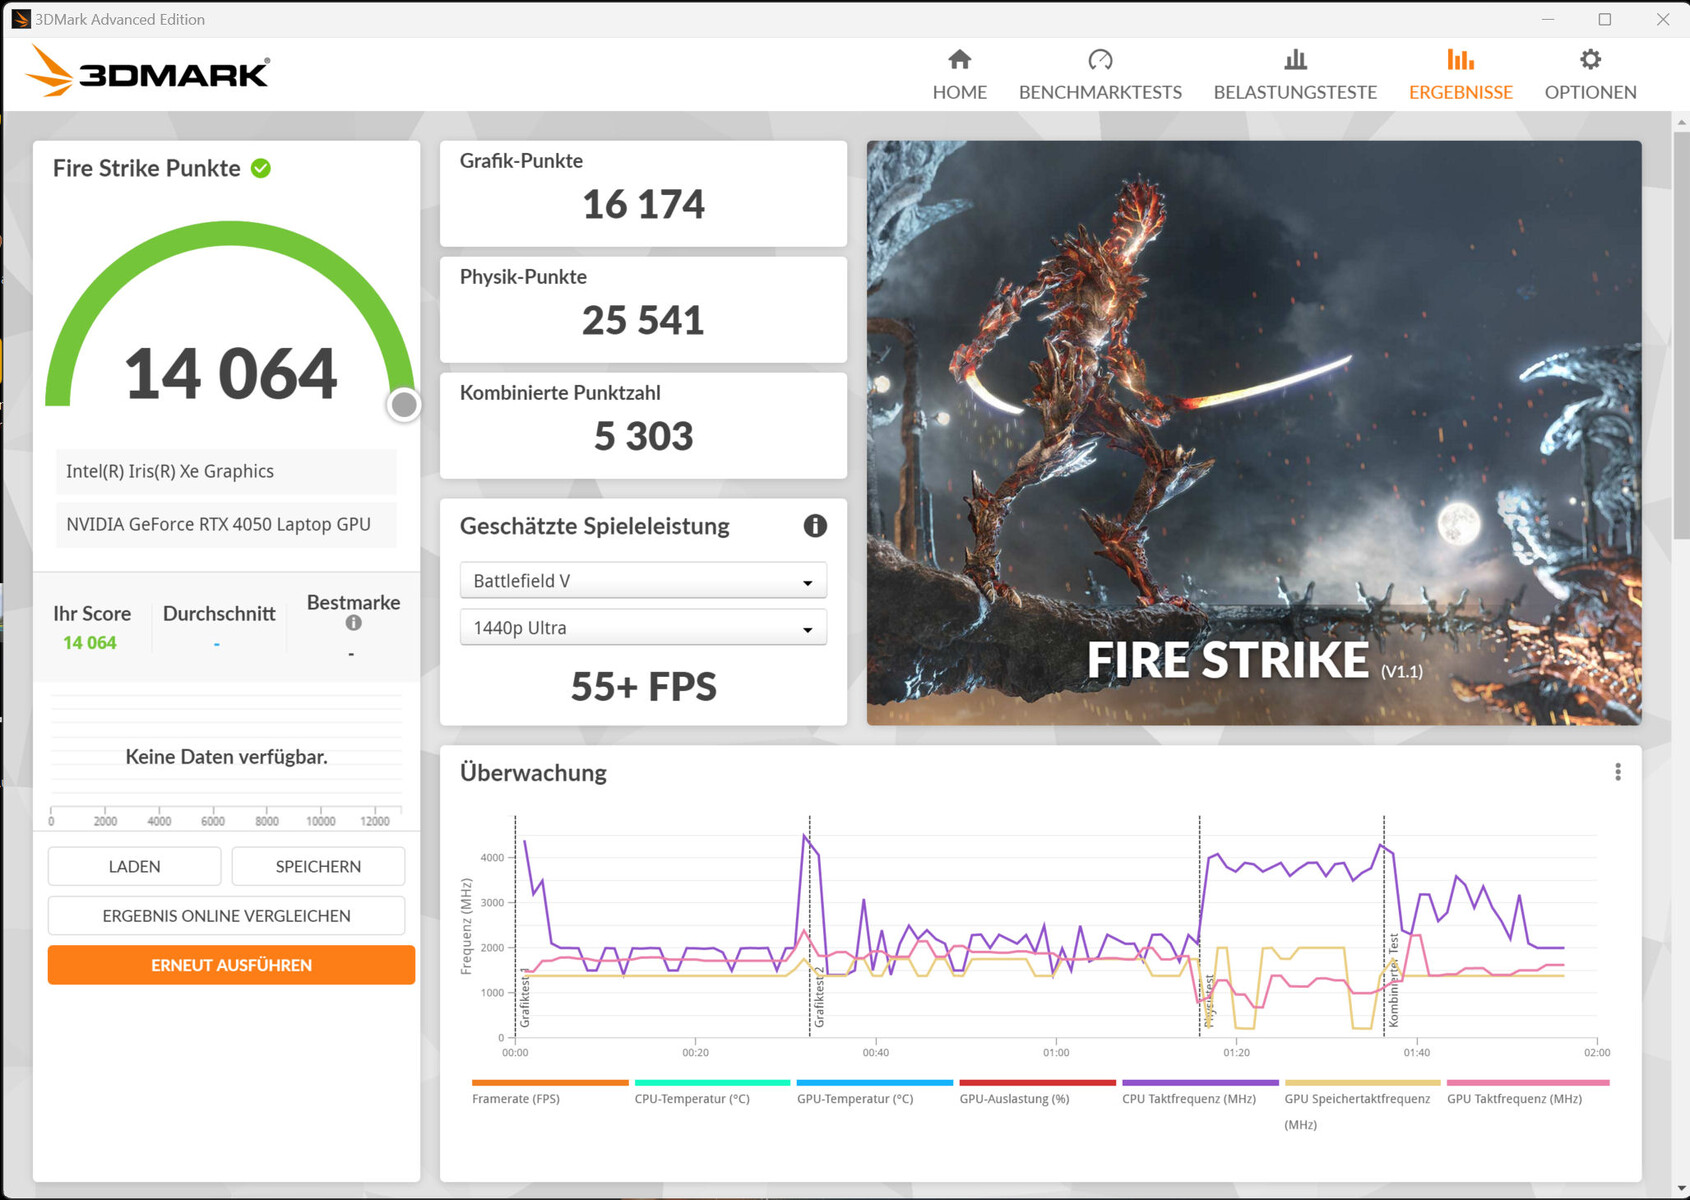
| 3DMark 06 Standard Score | 45618 points | |
| 3DMark 11 Performance | 18217 points | |
| 3DMark Cloud Gate Standard Score | 41061 points | |
| 3DMark Fire Strike Score | 14064 points | |
| 3DMark Time Spy Score | 5784 points | |
Help | ||
| Blender | |
| v3.3 Classroom OPTIX/RTX | |
| LG Gram 17Z90Q-E.AD78G (3.3.2) | |
| Asus VivoBook Pro 16X OLED N7600PC-L2026X (3.3.0) | |
| Average of class Multimedia (19 - 99, n=45, last 2 years) | |
| Samsung Galaxy Book3 Ultra 16 (3.3.3, Leise) | |
| Lenovo ThinkBook 16p G3 ARH (3.3.0) | |
| Samsung Galaxy Book3 Ultra 16 (3.3.3) | |
| Average NVIDIA GeForce RTX 4050 Laptop GPU (25 - 37, n=35) | |
| Samsung Galaxy Book3 Ultra 16 (3.3.3, Hohe Leistung) | |
| SCHENKER Vision 16 Pro RTX 3070 Ti (3.3.0) | |
| v3.3 Classroom CUDA | |
| LG Gram 17Z90Q-E.AD78G (3.3.2) | |
| Asus VivoBook Pro 16X OLED N7600PC-L2026X (3.3.0) | |
| Average of class Multimedia (32 - 172, n=48, last 2 years) | |
| Samsung Galaxy Book3 Ultra 16 (3.3.3, Leise) | |
| Samsung Galaxy Book3 Ultra 16 (3.3.3) | |
| Lenovo ThinkBook 16p G3 ARH (3.3.0) | |
| Average NVIDIA GeForce RTX 4050 Laptop GPU (47 - 175, n=35) | |
| Samsung Galaxy Book3 Ultra 16 (3.3.3, Hohe Leistung) | |
| SCHENKER Vision 16 Pro RTX 3070 Ti (3.3.0) | |
| v3.3 Classroom oneAPI/Intel | |
| Acer Swift X SFX16-52G-77RX | |
| Average of class Multimedia (last 2 years) | |
| Geekbench 5.5 | |
| OpenCL Score | |
| SCHENKER Vision 16 Pro RTX 3070 Ti | |
| Lenovo ThinkBook 16p G3 ARH | |
| Average NVIDIA GeForce RTX 4050 Laptop GPU (63538 - 90075, n=33) | |
| Samsung Galaxy Book3 Ultra 16 (Hohe Leistung) | |
| Samsung Galaxy Book3 Ultra 16 | |
| Samsung Galaxy Book3 Ultra 16 (Leise) | |
| Dell XPS 15 9520 RTX 3050 Ti | |
| Average of class Multimedia (10769 - 120093, n=99, last 2 years) | |
| Asus VivoBook Pro 16X OLED N7600PC-L2026X | |
| LG Gram 17Z90Q-E.AD78G | |
| Acer Swift X SFX16-52G-77RX | |
| Vulkan Score | |
| Lenovo ThinkBook 16p G3 ARH | |
| Dell XPS 15 9520 RTX 3050 Ti | |
| Average NVIDIA GeForce RTX 4050 Laptop GPU (4586 - 59879, n=33) | |
| Average of class Multimedia (4239 - 61294, n=90, last 2 years) | |
| Samsung Galaxy Book3 Ultra 16 (Hohe Leistung) | |
| Samsung Galaxy Book3 Ultra 16 (Leise) | |
| Samsung Galaxy Book3 Ultra 16 | |
| Acer Swift X SFX16-52G-77RX | |
| SCHENKER Vision 16 Pro RTX 3070 Ti | |
| LG Gram 17Z90Q-E.AD78G | |
| Asus VivoBook Pro 16X OLED N7600PC-L2026X | |
| V-Ray Benchmark Next 4.10 | |
| GPU | |
| Average NVIDIA GeForce RTX 4050 Laptop GPU (333 - 529, n=30) | |
| SCHENKER Vision 16 Pro RTX 3070 Ti (v4.10.07 ) | |
| Samsung Galaxy Book3 Ultra 16 (v4.10.07, Hohe Leistung) | |
| Samsung Galaxy Book3 Ultra 16 (v4.10.07 ) | |
| Samsung Galaxy Book3 Ultra 16 (v4.10.07, Leise) | |
| Average of class Multimedia (31 - 684, n=68, last 2 years) | |
| Asus VivoBook Pro 16X OLED N7600PC-L2026X (v4.10.07 ) | |
| LG Gram 17Z90Q-E.AD78G (v4.10.07 ) | |
| Acer Swift X SFX16-52G-77RX (v4.10.07 ) | |
| CPU | |
| Samsung Galaxy Book3 Ultra 16 (v4.10.07, Hohe Leistung ) | |
| Samsung Galaxy Book3 Ultra 16 (v4.10.07 ) | |
| Average NVIDIA GeForce RTX 4050 Laptop GPU (5413 - 24181, n=30) | |
| Average of class Multimedia (5305 - 30140, n=68, last 2 years) | |
| SCHENKER Vision 16 Pro RTX 3070 Ti (v4.10.07 ) | |
| Samsung Galaxy Book3 Ultra 16 (v4.10.07, Leise) | |
| Acer Swift X SFX16-52G-77RX (v4.10.07 ) | |
| LG Gram 17Z90Q-E.AD78G (v4.10.07 ) | |
| Asus VivoBook Pro 16X OLED N7600PC-L2026X (v4.10.07 ) | |
* ... smaller is better
Gaming Performance
The laptop can handle FHD gaming at medium to high, sometimes maximum settings. The full splendor (2880x1800) of the OLED screen can be brought out in reduced settings. The frame rate depends on the performance mode used, but are always below the RTX 4050 average. "High Performance" delivers about 20 to 30 percent higher frame rates than "Optimized". The "Silent" profile is primarily suitable for gaming at HD level.
| Performance Rating - Percent | |
| SCHENKER Vision 16 Pro RTX 3070 Ti | |
| MSI Katana 15 B12VEK | |
| Average NVIDIA GeForce RTX 4050 Laptop GPU | |
| Samsung Galaxy Book3 Ultra 16 | |
| Lenovo ThinkBook 16p G3 ARH | |
| Samsung Galaxy Book3 Ultra 16 | |
| Average of class Multimedia | |
| Dell XPS 15 9520 RTX 3050 Ti | |
| Asus VivoBook Pro 16X OLED N7600PC-L2026X | |
| LG Gram 17Z90Q-E.AD78G | |
| Samsung Galaxy Book3 Ultra 16 | |
| Acer Swift X SFX16-52G-77RX | |
| The Witcher 3 - 1920x1080 Ultra Graphics & Postprocessing (HBAO+) | |
| SCHENKER Vision 16 Pro RTX 3070 Ti | |
| MSI Katana 15 B12VEK | |
| Average NVIDIA GeForce RTX 4050 Laptop GPU (18.5 - 94.7, n=38) | |
| Lenovo ThinkBook 16p G3 ARH | |
| Samsung Galaxy Book3 Ultra 16 (Hohe Leistung) | |
| Samsung Galaxy Book3 Ultra 16 | |
| Average of class Multimedia (8 - 143.2, n=99, last 2 years) | |
| Asus VivoBook Pro 16X OLED N7600PC-L2026X | |
| Dell XPS 15 9520 RTX 3050 Ti | |
| LG Gram 17Z90Q-E.AD78G | |
| Acer Swift X SFX16-52G-77RX | |
| Samsung Galaxy Book3 Ultra 16 | |
| GTA V - 1920x1080 Highest Settings possible AA:4xMSAA + FX AF:16x | |
| SCHENKER Vision 16 Pro RTX 3070 Ti | |
| MSI Katana 15 B12VEK | |
| Samsung Galaxy Book3 Ultra 16 (Hohe Leistung) | |
| Average NVIDIA GeForce RTX 4050 Laptop GPU (14.9 - 101.7, n=30) | |
| Lenovo ThinkBook 16p G3 ARH | |
| Samsung Galaxy Book3 Ultra 16 | |
| Average of class Multimedia (4.24 - 123, n=88, last 2 years) | |
| Asus VivoBook Pro 16X OLED N7600PC-L2026X | |
| Dell XPS 15 9520 RTX 3050 Ti | |
| LG Gram 17Z90Q-E.AD78G | |
| Acer Swift X SFX16-52G-77RX | |
| Samsung Galaxy Book3 Ultra 16 (Leise) | |
| Final Fantasy XV Benchmark - 1920x1080 High Quality | |
| SCHENKER Vision 16 Pro RTX 3070 Ti (1.3) | |
| MSI Katana 15 B12VEK (1.3) | |
| Lenovo ThinkBook 16p G3 ARH (1.3) | |
| Average NVIDIA GeForce RTX 4050 Laptop GPU (15.5 - 122.3, n=34) | |
| Samsung Galaxy Book3 Ultra 16 (1.3, Hohe Leistung) | |
| Samsung Galaxy Book3 Ultra 16 (1.3) | |
| Average of class Multimedia (6.53 - 141.8, n=89, last 2 years) | |
| Dell XPS 15 9520 RTX 3050 Ti (1.3) | |
| Asus VivoBook Pro 16X OLED N7600PC-L2026X (1.3) | |
| LG Gram 17Z90Q-E.AD78G (1.3) | |
| Acer Swift X SFX16-52G-77RX (1.3) | |
| Samsung Galaxy Book3 Ultra 16 (1.3, Leise) | |
| Strange Brigade - 1920x1080 ultra AA:ultra AF:16 | |
| SCHENKER Vision 16 Pro RTX 3070 Ti (1.47.22.14 D3D12) | |
| MSI Katana 15 B12VEK (1.47.22.14 D3D12) | |
| Average NVIDIA GeForce RTX 4050 Laptop GPU (21.2 - 156.6, n=33) | |
| Lenovo ThinkBook 16p G3 ARH (1.47.22.14 D3D12) | |
| Samsung Galaxy Book3 Ultra 16 (1.47.22.14 D3D12, Hohe Leistung) | |
| Samsung Galaxy Book3 Ultra 16 (1.47.22.14 D3D12) | |
| Average of class Multimedia (11 - 233, n=86, last 2 years) | |
| Dell XPS 15 9520 RTX 3050 Ti (1.47.22.14 D3D12) | |
| Asus VivoBook Pro 16X OLED N7600PC-L2026X (1.47.22.14 D3D12) | |
| Acer Swift X SFX16-52G-77RX (1.47.22.14 D3D12) | |
| LG Gram 17Z90Q-E.AD78G (1.47.22.14 D3D12) | |
| Samsung Galaxy Book3 Ultra 16 (1.47.22.14 D3D12, Leise) | |
| Dota 2 Reborn - 1920x1080 ultra (3/3) best looking | |
| SCHENKER Vision 16 Pro RTX 3070 Ti | |
| MSI Katana 15 B12VEK | |
| Samsung Galaxy Book3 Ultra 16 (Hohe Leistung) | |
| Average NVIDIA GeForce RTX 4050 Laptop GPU (73.5 - 175.6, n=34) | |
| Samsung Galaxy Book3 Ultra 16 (Leise) | |
| Dell XPS 15 9520 RTX 3050 Ti | |
| Average of class Multimedia (26.3 - 171.6, n=90, last 2 years) | |
| Asus VivoBook Pro 16X OLED N7600PC-L2026X | |
| Lenovo ThinkBook 16p G3 ARH | |
| Samsung Galaxy Book3 Ultra 16 | |
| Acer Swift X SFX16-52G-77RX | |
| LG Gram 17Z90Q-E.AD78G | |
| X-Plane 11.11 - 1920x1080 high (fps_test=3) | |
| SCHENKER Vision 16 Pro RTX 3070 Ti | |
| Dell XPS 15 9520 RTX 3050 Ti | |
| Samsung Galaxy Book3 Ultra 16 (Hohe Leistung) | |
| MSI Katana 15 B12VEK | |
| Average NVIDIA GeForce RTX 4050 Laptop GPU (65 - 117, n=35) | |
| Samsung Galaxy Book3 Ultra 16 (Leise) | |
| Samsung Galaxy Book3 Ultra 16 | |
| Average of class Multimedia (23 - 131.1, n=95, last 2 years) | |
| Asus VivoBook Pro 16X OLED N7600PC-L2026X | |
| Lenovo ThinkBook 16p G3 ARH | |
| LG Gram 17Z90Q-E.AD78G | |
| LG Gram 17Z90Q-E.AD78G | |
| Acer Swift X SFX16-52G-77RX | |
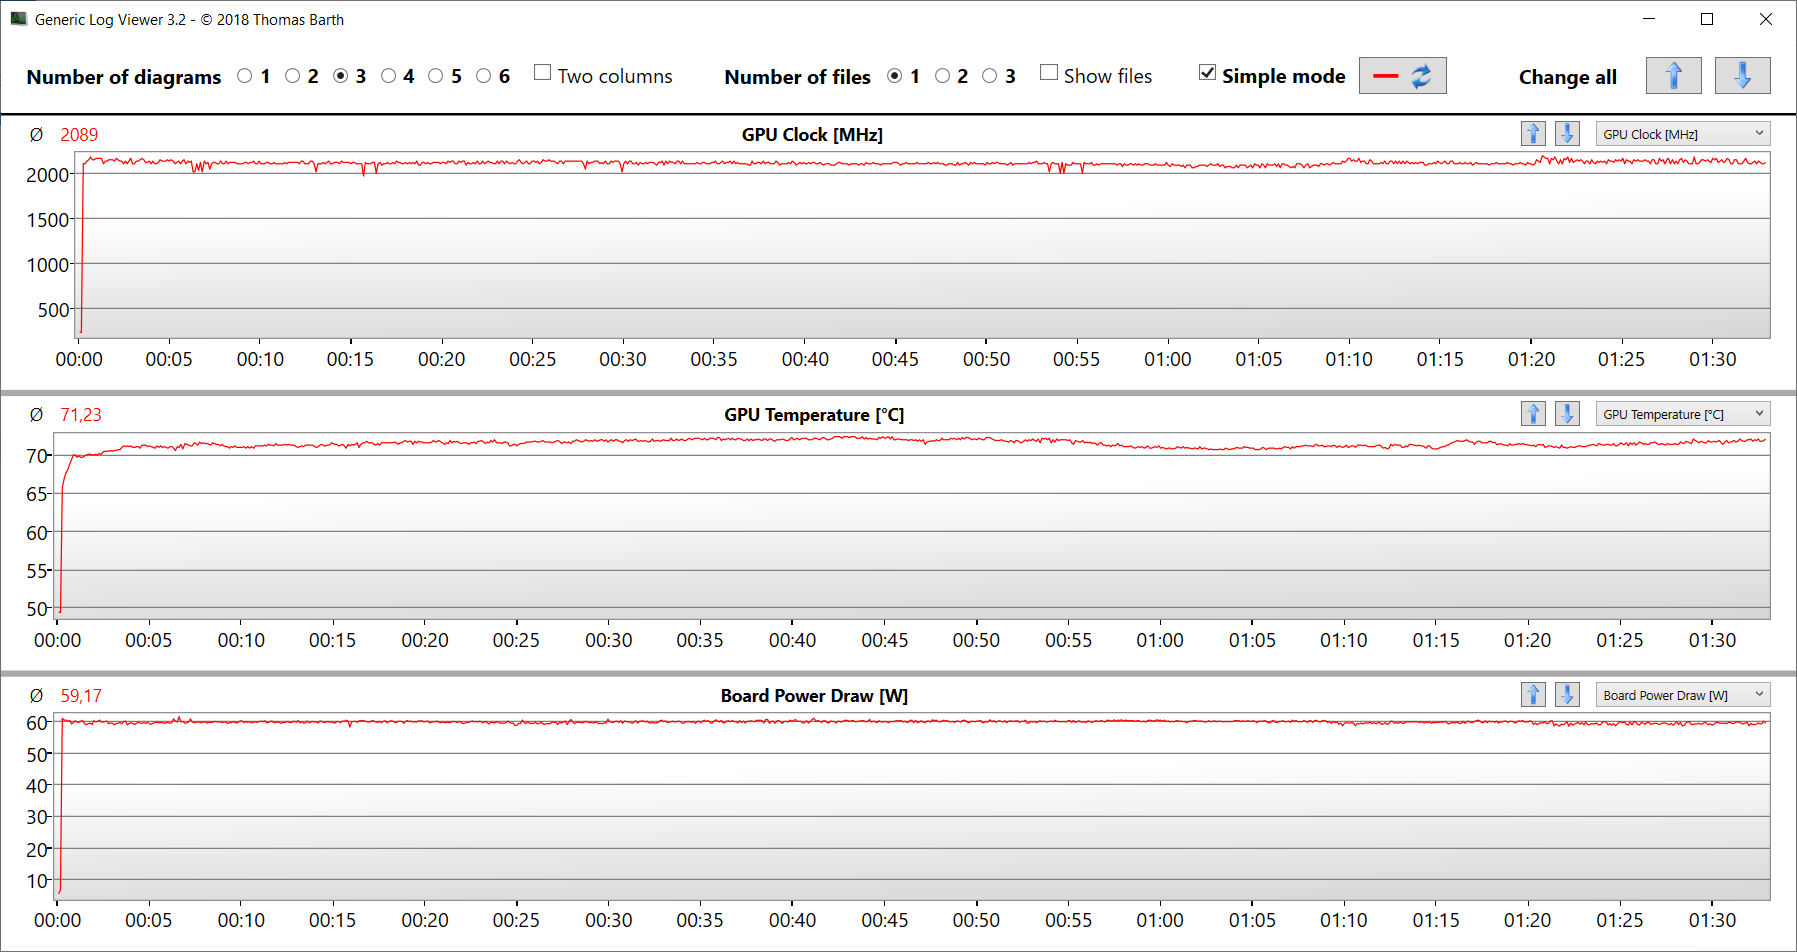
To check whether the frame rate remains constant over a longer period, we ran "The Witcher 3" for about 60 minutes in Full HD resolution and at maximum quality settings. The game character was not moved. No drop in frame rate was detected.
Witcher 3 FPS chart
| low | med. | high | ultra | QHD | |
| GTA V (2015) | 182.1 | 166.5 | 133.2 | 65.3 | 50.5 |
| The Witcher 3 (2015) | 268.5 | 184.1 | 107.1 | 60.1 | |
| Dota 2 Reborn (2015) | 161.8 | 138.7 | 79.2 | 73.5 | |
| Final Fantasy XV Benchmark (2018) | 105 | 77.2 | 56.9 | 41.5 | |
| X-Plane 11.11 (2018) | 143.6 | 88.2 | 79 | ||
| Far Cry 5 (2018) | 148 | 87 | 74 | 71 | 56 |
| Strange Brigade (2018) | 321 | 153.5 | 120.1 | 103.9 | 72.7 |
| The Division 2 (2019) | 130 | 83 | 69 | 53 | 35 |
| Doom Eternal (2020) | 228 | 135.6 | 124.7 | 114.3 | 82.5 |
| Gears Tactics (2020) | 268.5 | 141.8 | 95.2 | 64.8 | 44.8 |
| Flight Simulator 2020 (2020) | 107.2 | 57.6 | 40.5 | 30.6 | 22.9 |
| Crysis Remastered (2020) | 242 | 121.1 | 49.5 | 41.6 | 28.6 |
| Hitman 3 (2021) | 193.9 | 111.4 | 101 | 94.2 | 60.1 |
| Alan Wake Remastered (2021) | 161.5 | 98.3 | 86.7 | 63.2 | |
| Riders Republic (2021) | 138 | 72 | 67 | 63 | 44 |
| Forza Horizon 5 (2021) | 119 | 68 | 69 | 42 | 36 |
| Rainbow Six Extraction (2022) | 139 | 115 | 111 | 89 | 56 |
| Cyberpunk 2077 1.6 (2022) | 71 | 54.7 | 48 | 44.4 | 27.2 |
| Tiny Tina's Wonderlands (2022) | 104.5 | 93.4 | 63.3 | 49.8 | 33.6 |
| F1 22 (2022) | 135.3 | 127.4 | 97.5 | 36.2 | 23.1 |
| The Quarry (2022) | 91 | 68.8 | 57 | 44.6 | 28.5 |
| FIFA 23 (2022) | 94.3 | ||||
| A Plague Tale Requiem (2022) | 58.6 | 49 | 42.8 | 36.3 | 27.5 |
| Call of Duty Modern Warfare 2 2022 (2022) | 79 | 73 | 56 | 54 | 36 |
| Spider-Man Miles Morales (2022) | 72.9 | 67.1 | 56.9 | 51.5 | 42.5 |
| The Callisto Protocol (2022) | 74 | 62.5 | 59.3 | 41.4 | 29.5 |
| Need for Speed Unbound (2022) | 51.2 | 42.8 | 37 | 28.9 | 26.7 |
| High On Life (2023) | 104.9 | 78.1 | 65.3 | 57.3 | 35.7 |
| The Witcher 3 v4.00 (2023) | 113.4 | 82.5 | 43 | 38.1 | 23.8 |
| Dead Space Remake (2023) | 47.9 | 47.7 | 40.2 | 39.8 | 25.1 |
| Hogwarts Legacy (2023) | 92 | 74.2 | 59.6 | 51.9 | 23.9 |
| Returnal (2023) | 59 | 57 | 52 | 44 | |
| Atomic Heart (2023) | 95 | 76.1 | 47.8 | 37.8 | 28.2 |
| Company of Heroes 3 (2023) | 116.4 | 106.2 | 79 | 79.7 | 55.7 |
| Resident Evil 4 Remake (2023) | 81 | 57.7 | 53.4 | 36.8 | 23.8 |
Emissions - Samsung ultrabook with moderate noise development
Noise
Overall, Samsung has the noise development quite well under control. The notebook's profiles offer an acceptable balance between noise and performance. The maximum value of 48 dB(A) was reached during the Witcher 3 test under "High Performance". "Optimized" ensures moderate levels of noise with still playable frame rates. The "Silent" profile lives up to its namesake. Little to nothing is heard from the two fans in idle and everyday use, as they often stand still.
Noise Level
| Idle |
| 26 / 27 / 28 dB(A) |
| Load |
| 40 / 41 dB(A) |
 | ||
30 dB silent 40 dB(A) audible 50 dB(A) loud |
||
min: | ||
| Samsung Galaxy Book3 Ultra 16 i7-13700H, NVIDIA GeForce RTX 4050 Laptop GPU | SCHENKER Vision 16 Pro RTX 3070 Ti i7-12700H, GeForce RTX 3070 Ti Laptop GPU | LG Gram 17Z90Q-E.AD78G i7-1260P, GeForce RTX 2050 Mobile | Lenovo ThinkBook 16p G3 ARH R9 6900HX, GeForce RTX 3060 Laptop GPU | Dell XPS 15 9520 RTX 3050 Ti i7-12700H, GeForce RTX 3050 Ti Laptop GPU | Asus VivoBook Pro 16X OLED N7600PC-L2026X i7-11370H, GeForce RTX 3050 4GB Laptop GPU | Acer Swift X SFX16-52G-77RX i7-1260P, A370M | |
|---|---|---|---|---|---|---|---|
| Noise | -2% | -10% | 5% | 10% | -22% | -0% | |
| off / environment * | 25 | 22.9 8% | 26 -4% | 22.7 9% | 22.8 9% | 25.15 -1% | 25 -0% |
| Idle Minimum * | 26 | 24.3 7% | 28 -8% | 23.1 11% | 22.9 12% | 30 -15% | 25 4% |
| Idle Average * | 27 | 24.3 10% | 28 -4% | 23.2 14% | 22.9 15% | 30 -11% | 25 7% |
| Idle Maximum * | 28 | 24.3 13% | 28.8 -3% | 23.6 16% | 22.9 18% | 30 -7% | 25 11% |
| Load Average * | 40 | 38.5 4% | 49.3 -23% | 30.6 23% | 30.9 23% | 57.6 -44% | 44.7 -12% |
| Witcher 3 ultra * | 39 | 51 -31% | 47.6 -22% | 37.8 3% | |||
| Load Maximum * | 41 | 51 -24% | 49.1 -20% | 47.5 -16% | 44.7 -9% | 62.9 -53% | 45.6 -11% |
* ... smaller is better
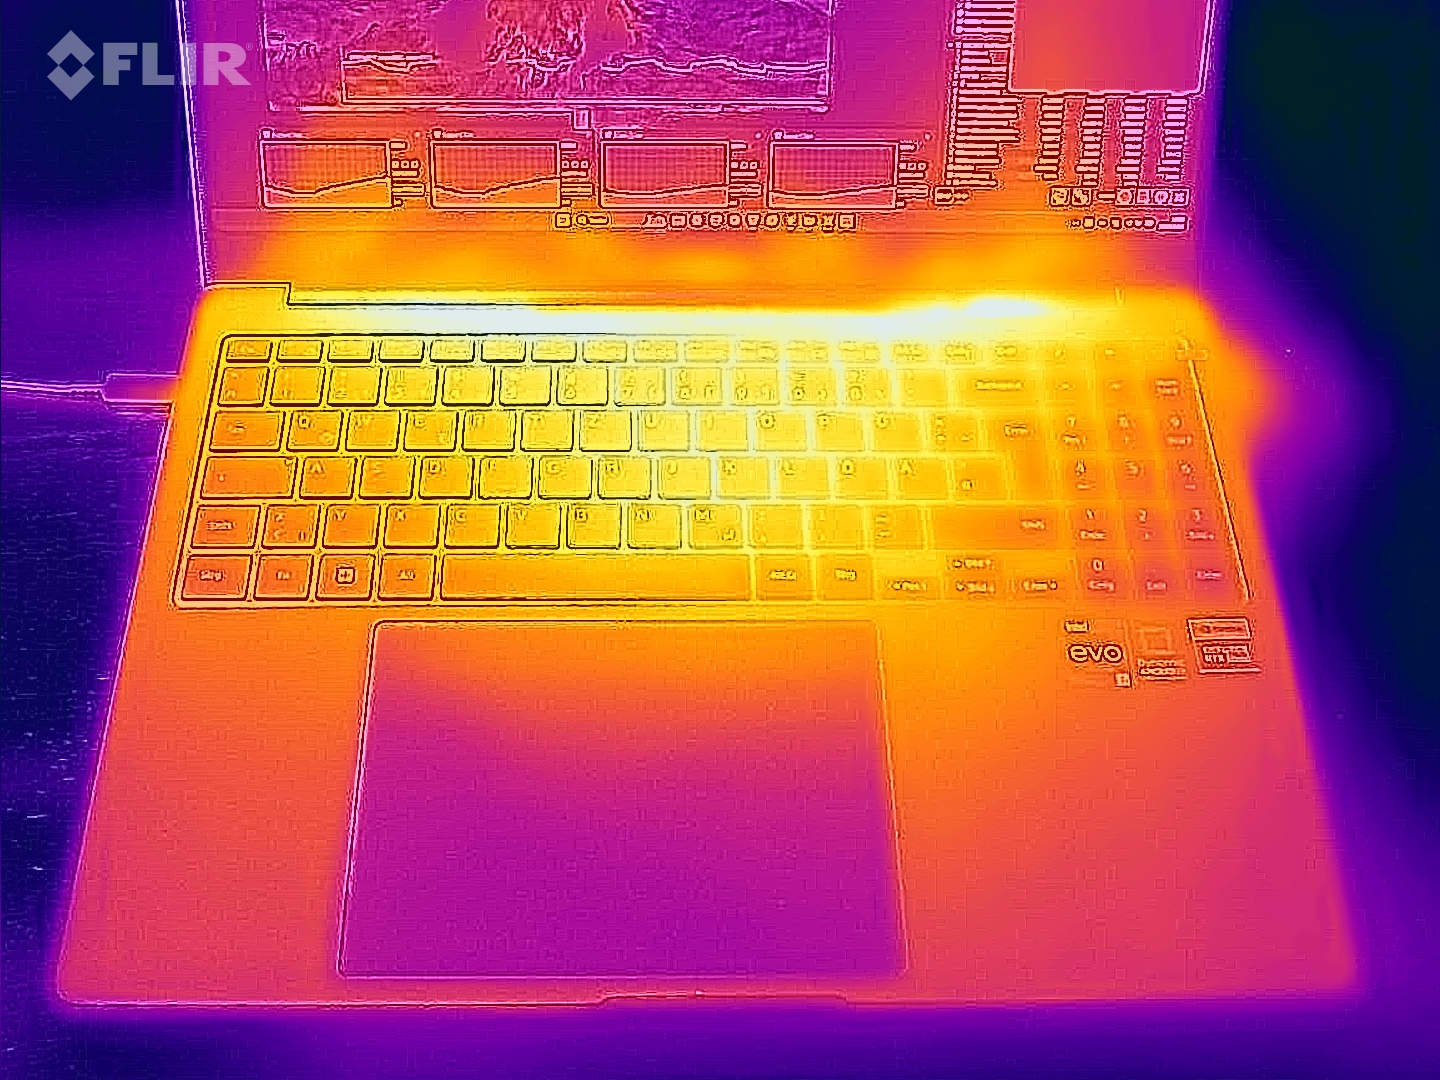
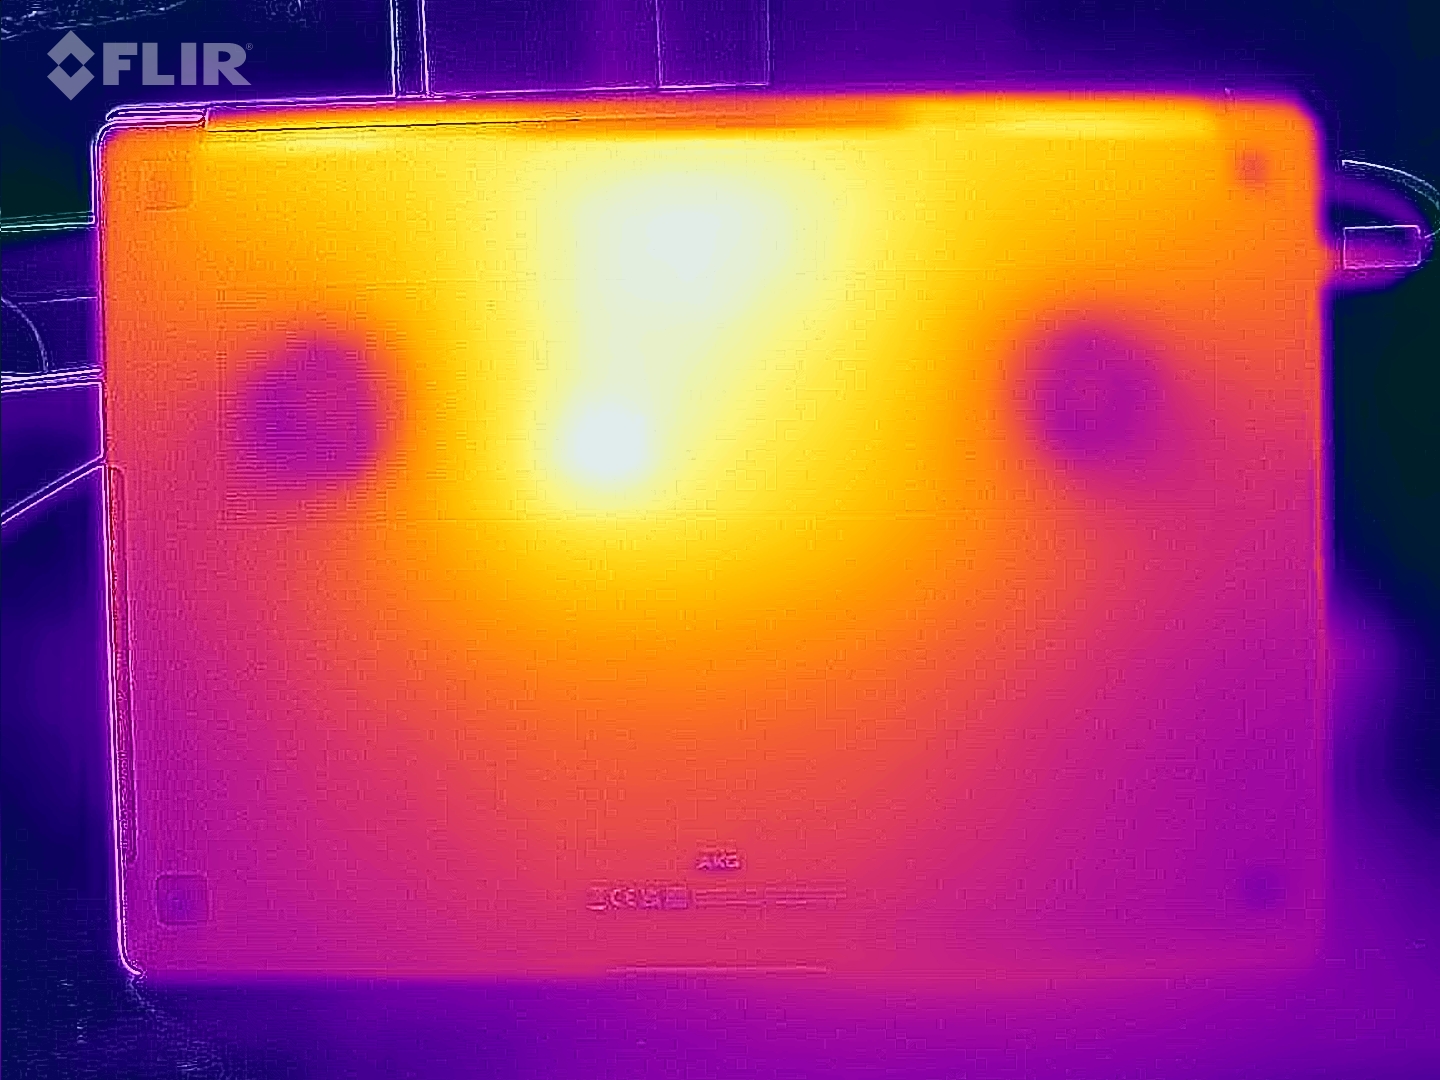
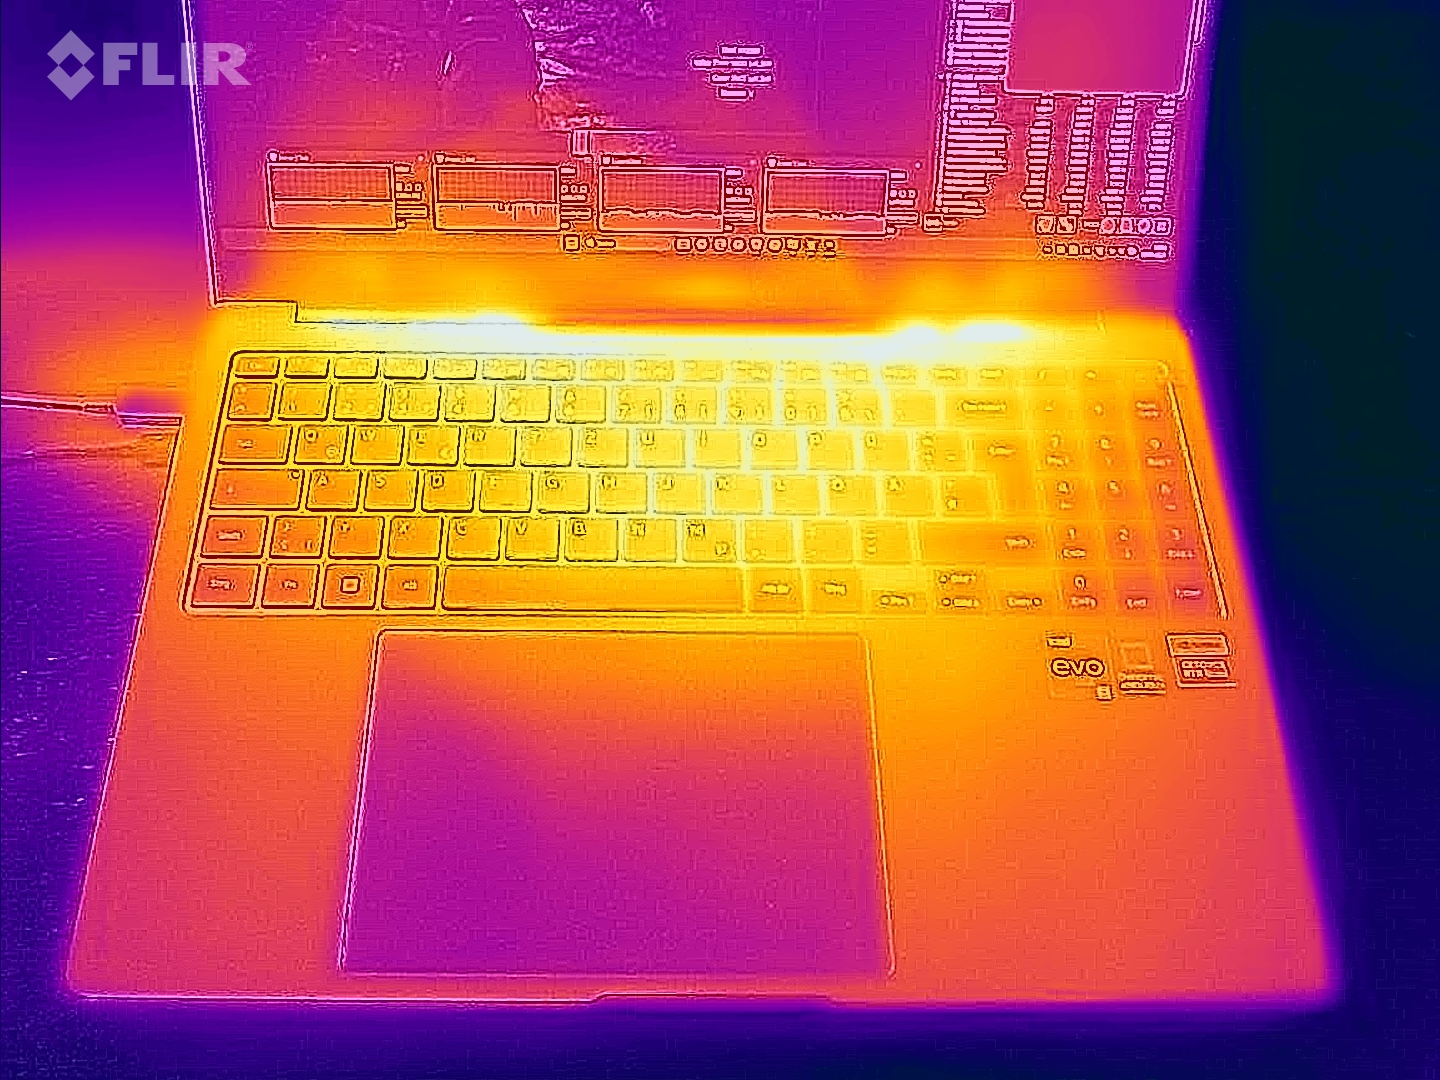
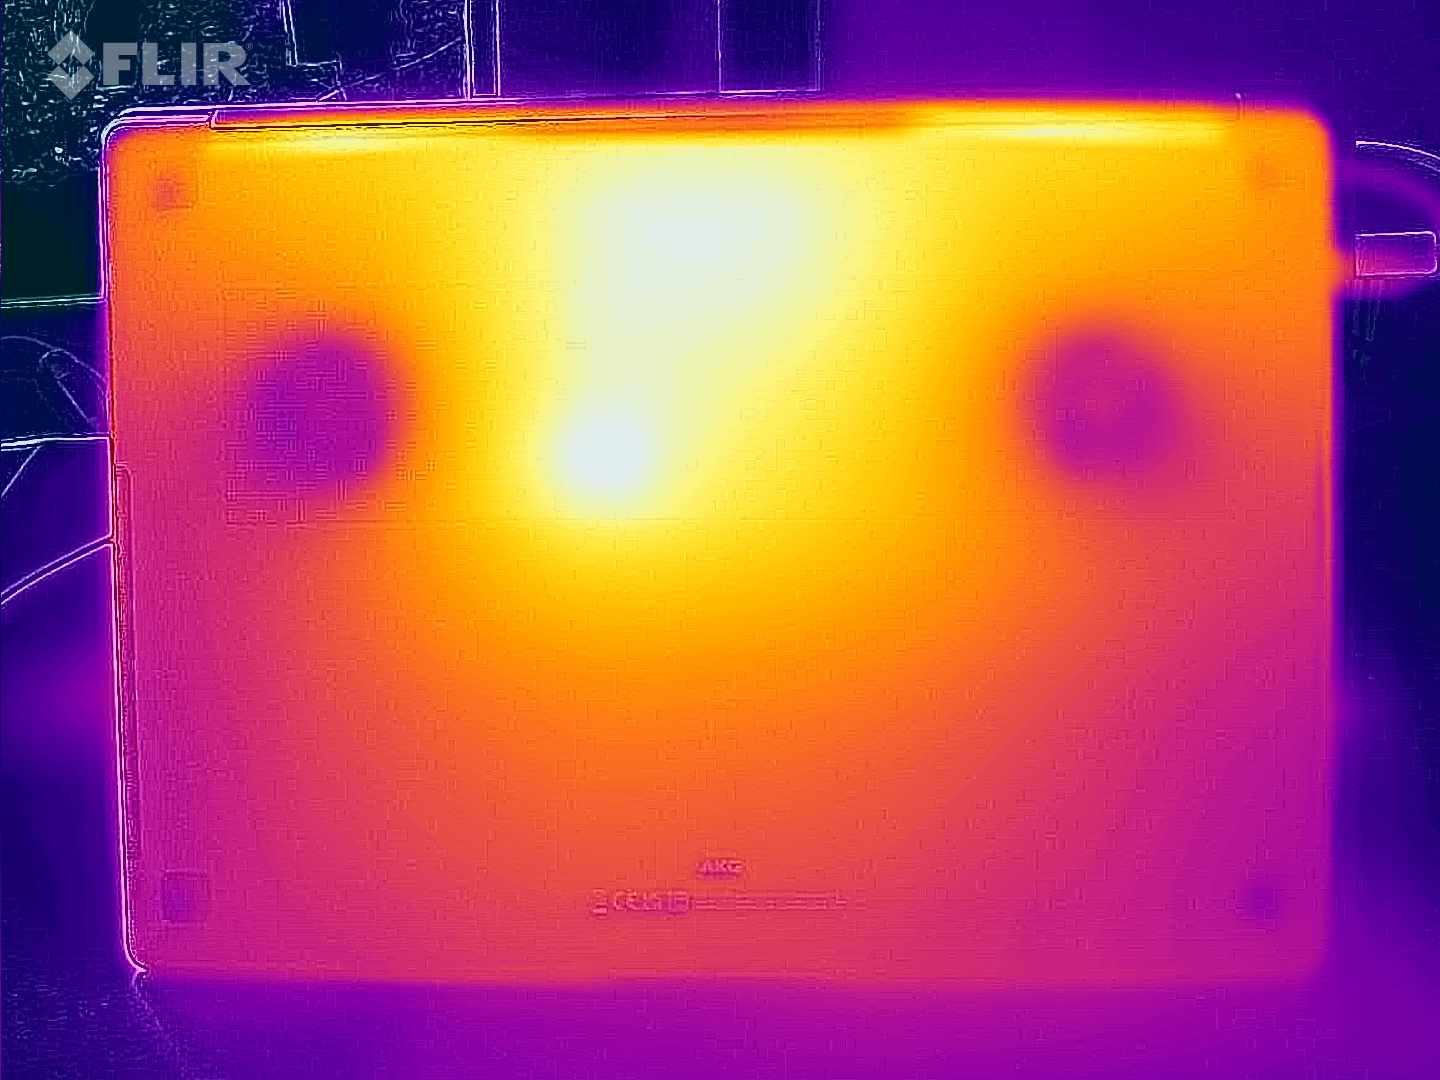
Temperature
Case temperatures remain within the green zone in everyday use (office, internet). Under load (stress test, Witcher 3 test), the notebook heats up noticeably, but not excessively. The CPU temperatures are no cause for concern.
(±) The maximum temperature on the upper side is 41 °C / 106 F, compared to the average of 36.9 °C / 98 F, ranging from 21.1 to 71 °C for the class Multimedia.
(±) The bottom heats up to a maximum of 44 °C / 111 F, compared to the average of 39.1 °C / 102 F
(+) In idle usage, the average temperature for the upper side is 22.9 °C / 73 F, compared to the device average of 31.2 °C / 88 F.
(-) Playing The Witcher 3, the average temperature for the upper side is 38.6 °C / 101 F, compared to the device average of 31.2 °C / 88 F.
(+) The palmrests and touchpad are reaching skin temperature as a maximum (35 °C / 95 F) and are therefore not hot.
(-) The average temperature of the palmrest area of similar devices was 28.8 °C / 83.8 F (-6.2 °C / -11.2 F).
| Samsung Galaxy Book3 Ultra 16 Intel Core i7-13700H, NVIDIA GeForce RTX 4050 Laptop GPU | SCHENKER Vision 16 Pro RTX 3070 Ti Intel Core i7-12700H, NVIDIA GeForce RTX 3070 Ti Laptop GPU | LG Gram 17Z90Q-E.AD78G Intel Core i7-1260P, NVIDIA GeForce RTX 2050 Mobile | Lenovo ThinkBook 16p G3 ARH AMD Ryzen 9 6900HX, NVIDIA GeForce RTX 3060 Laptop GPU | Dell XPS 15 9520 RTX 3050 Ti Intel Core i7-12700H, NVIDIA GeForce RTX 3050 Ti Laptop GPU | Asus VivoBook Pro 16X OLED N7600PC-L2026X Intel Core i7-11370H, NVIDIA GeForce RTX 3050 4GB Laptop GPU | Acer Swift X SFX16-52G-77RX Intel Core i7-1260P, Intel Arc A370M | |
|---|---|---|---|---|---|---|---|
| Heat | -12% | -15% | -25% | -25% | -14% | -24% | |
| Maximum Upper Side * | 41 | 50.8 -24% | 50.3 -23% | 48.2 -18% | 51.4 -25% | 40.6 1% | 49.4 -20% |
| Maximum Bottom * | 44 | 46.3 -5% | 52.5 -19% | 49.6 -13% | 51 -16% | 53 -20% | 55.5 -26% |
| Idle Upper Side * | 23 | 27.2 -18% | 26.9 -17% | 31.8 -38% | 30 -30% | 29 -26% | 28.4 -23% |
| Idle Bottom * | 26 | 26.6 -2% | 26.5 -2% | 33.6 -29% | 33 -27% | 28.3 -9% | 32.6 -25% |
* ... smaller is better
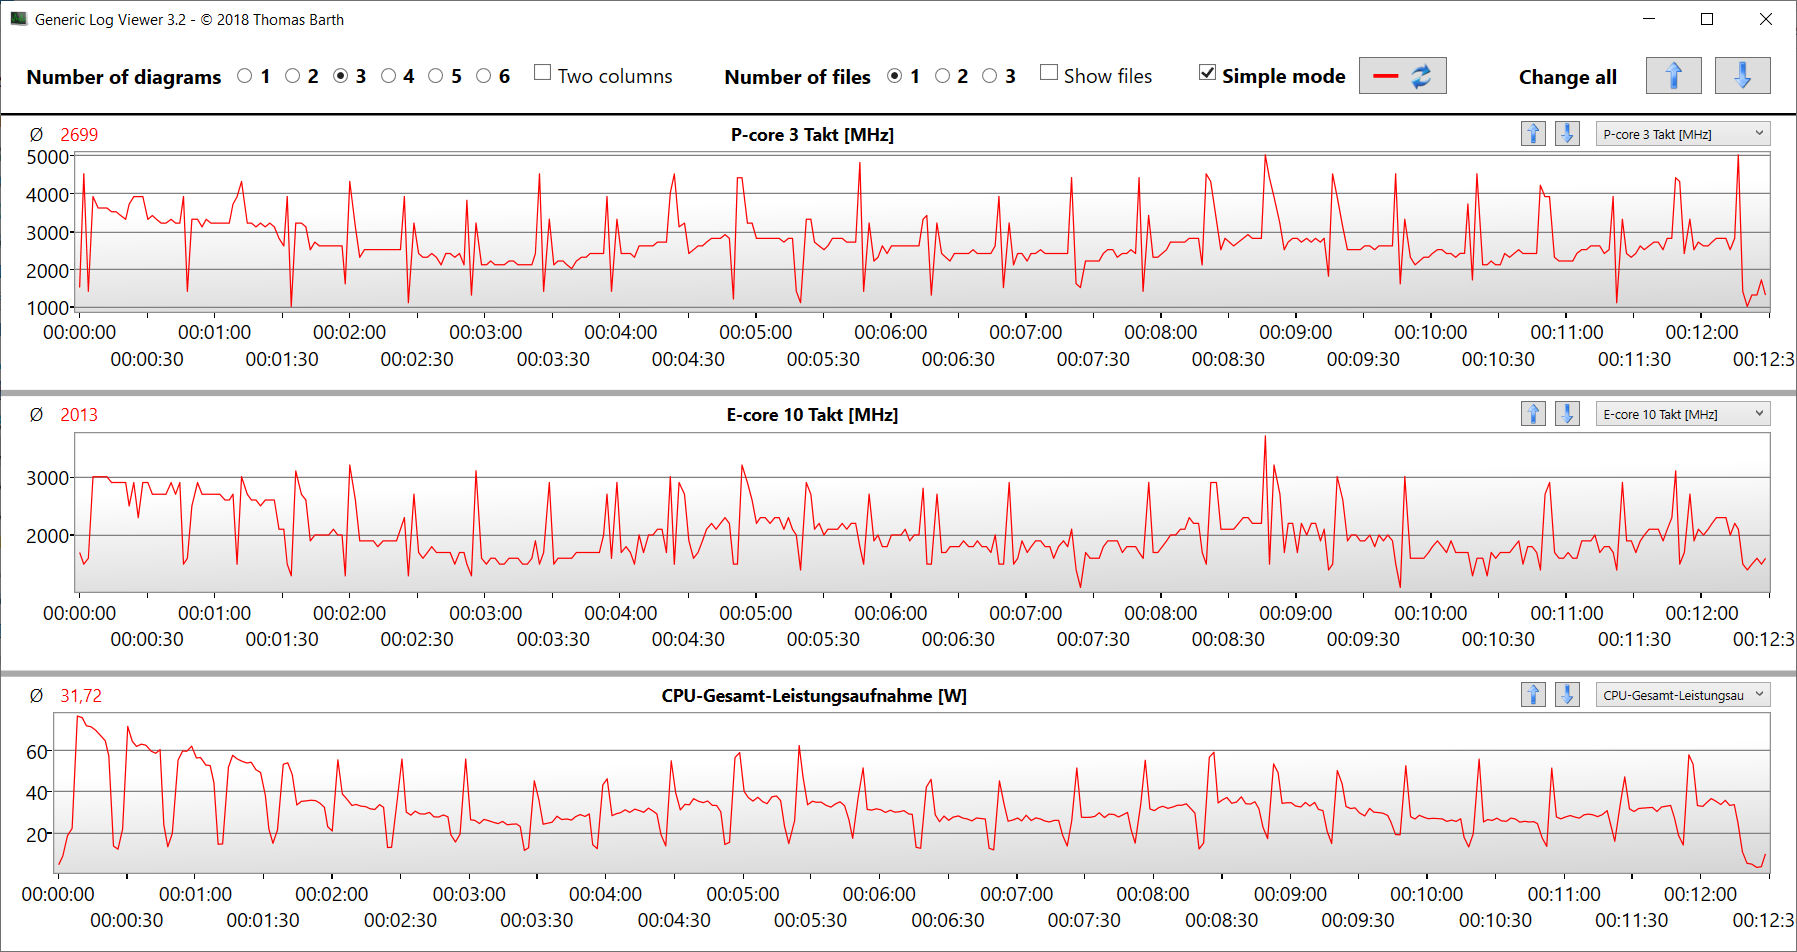
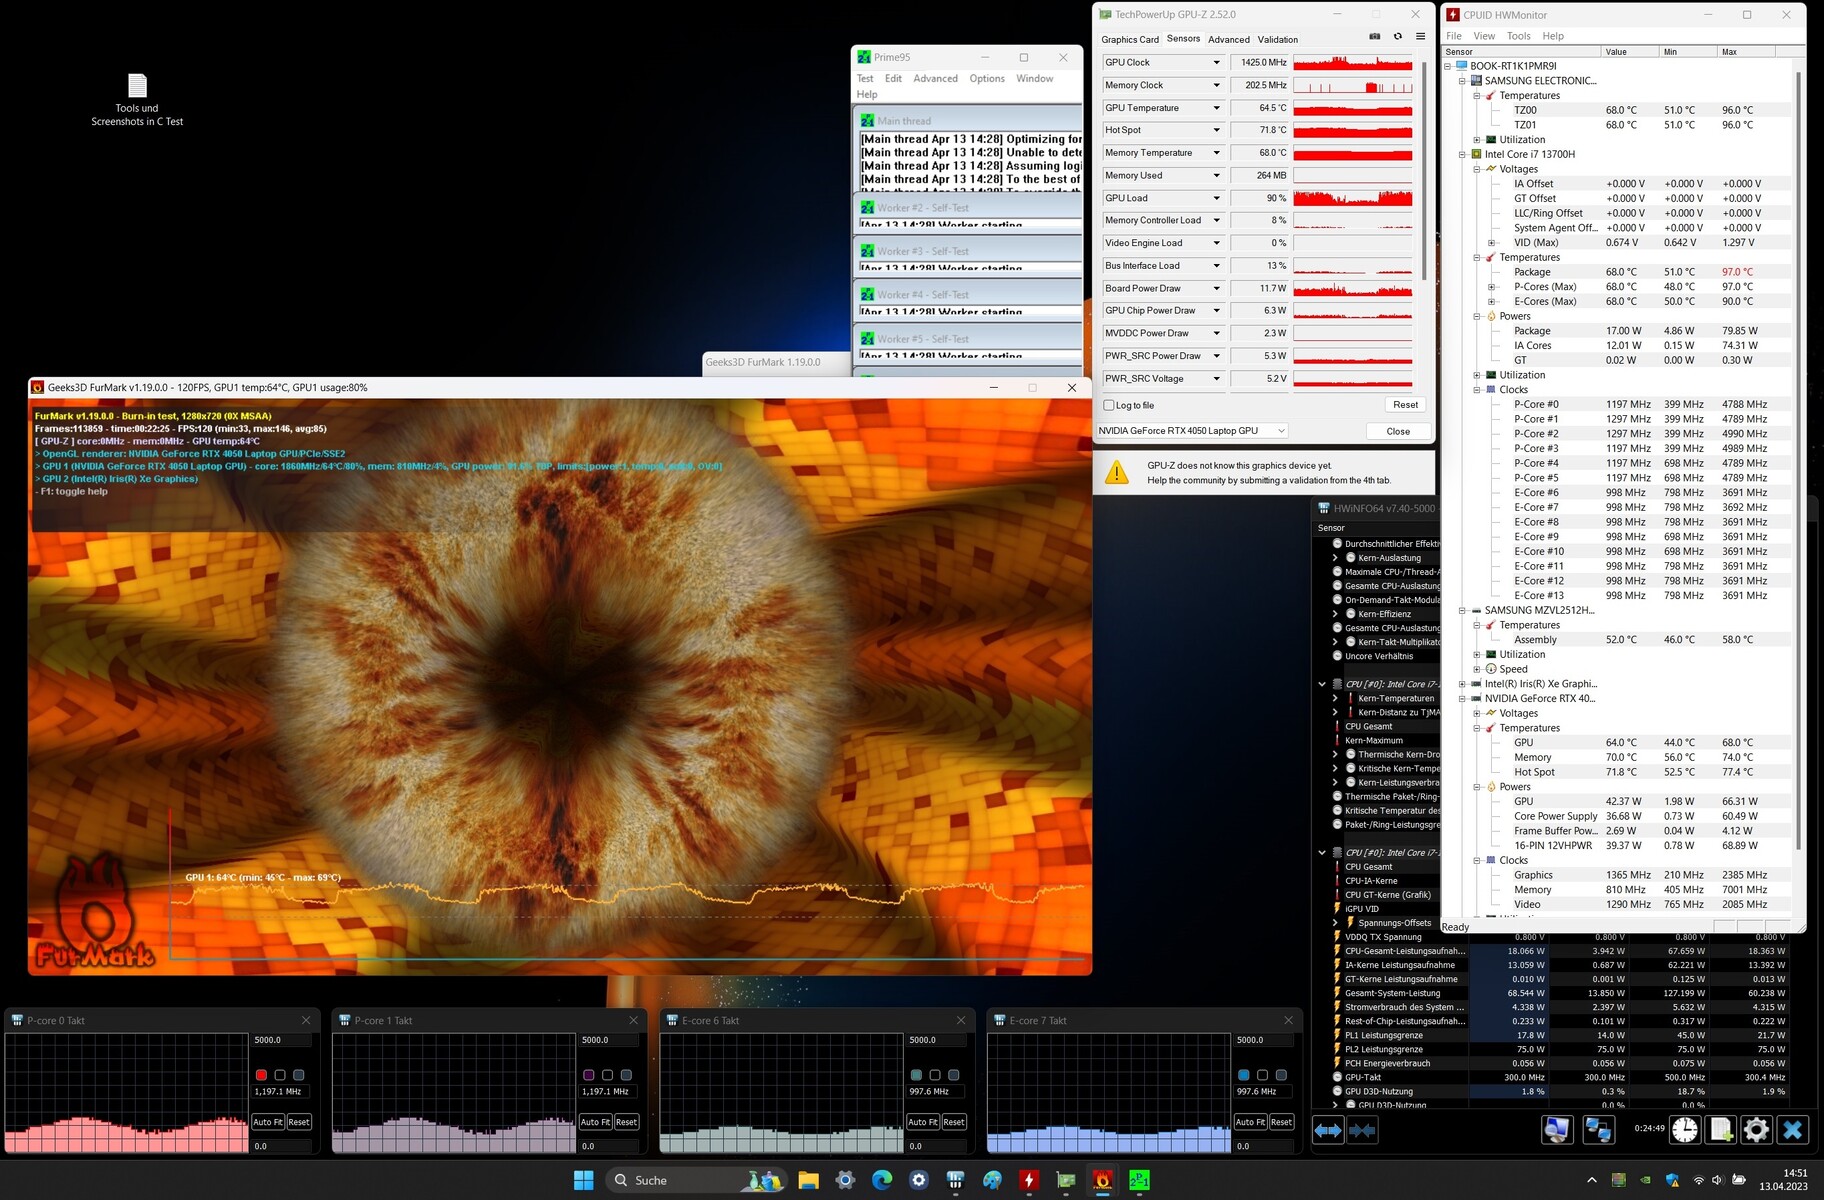
Stress Test
The stress test (Prime95 and Furmark in sustained operation) represents an extreme scenario for checking system stability under full load. The CPU (P: 2.8 to 2.9 GHz, E: 2.3 to 2.4 GHz) and the GPU (approx. 1,100 MHz) start the test with speeds roughly around the base clock level, dropping significantly over the course of testing.
Speakers
The stereo speakers produce very decent sound, but could use more bass. Headphones or external speakers are recommended for better sound quality.
Samsung Galaxy Book3 Ultra 16 audio analysis
(+) | speakers can play relatively loud (83 dB)
Bass 100 - 315 Hz
(±) | reduced bass - on average 11.4% lower than median
(±) | linearity of bass is average (10.3% delta to prev. frequency)
Mids 400 - 2000 Hz
(±) | higher mids - on average 5.4% higher than median
(+) | mids are linear (3% delta to prev. frequency)
Highs 2 - 16 kHz
(+) | balanced highs - only 1.6% away from median
(+) | highs are linear (3.8% delta to prev. frequency)
Overall 100 - 16.000 Hz
(+) | overall sound is linear (11.8% difference to median)
Compared to same class
» 13% of all tested devices in this class were better, 4% similar, 83% worse
» The best had a delta of 5%, average was 18%, worst was 45%
Compared to all devices tested
» 6% of all tested devices were better, 2% similar, 92% worse
» The best had a delta of 4%, average was 25%, worst was 134%
SCHENKER Vision 16 Pro RTX 3070 Ti audio analysis
(±) | speaker loudness is average but good (77.6 dB)
Bass 100 - 315 Hz
(-) | nearly no bass - on average 17.9% lower than median
(±) | linearity of bass is average (12.2% delta to prev. frequency)
Mids 400 - 2000 Hz
(+) | balanced mids - only 3.3% away from median
(+) | mids are linear (4.9% delta to prev. frequency)
Highs 2 - 16 kHz
(+) | balanced highs - only 2.8% away from median
(+) | highs are linear (5.1% delta to prev. frequency)
Overall 100 - 16.000 Hz
(±) | linearity of overall sound is average (15.1% difference to median)
Compared to same class
» 29% of all tested devices in this class were better, 4% similar, 66% worse
» The best had a delta of 5%, average was 18%, worst was 45%
Compared to all devices tested
» 17% of all tested devices were better, 4% similar, 79% worse
» The best had a delta of 4%, average was 25%, worst was 134%
Power Management - The NP960XFH doesn't lack stamina
Power Consumption
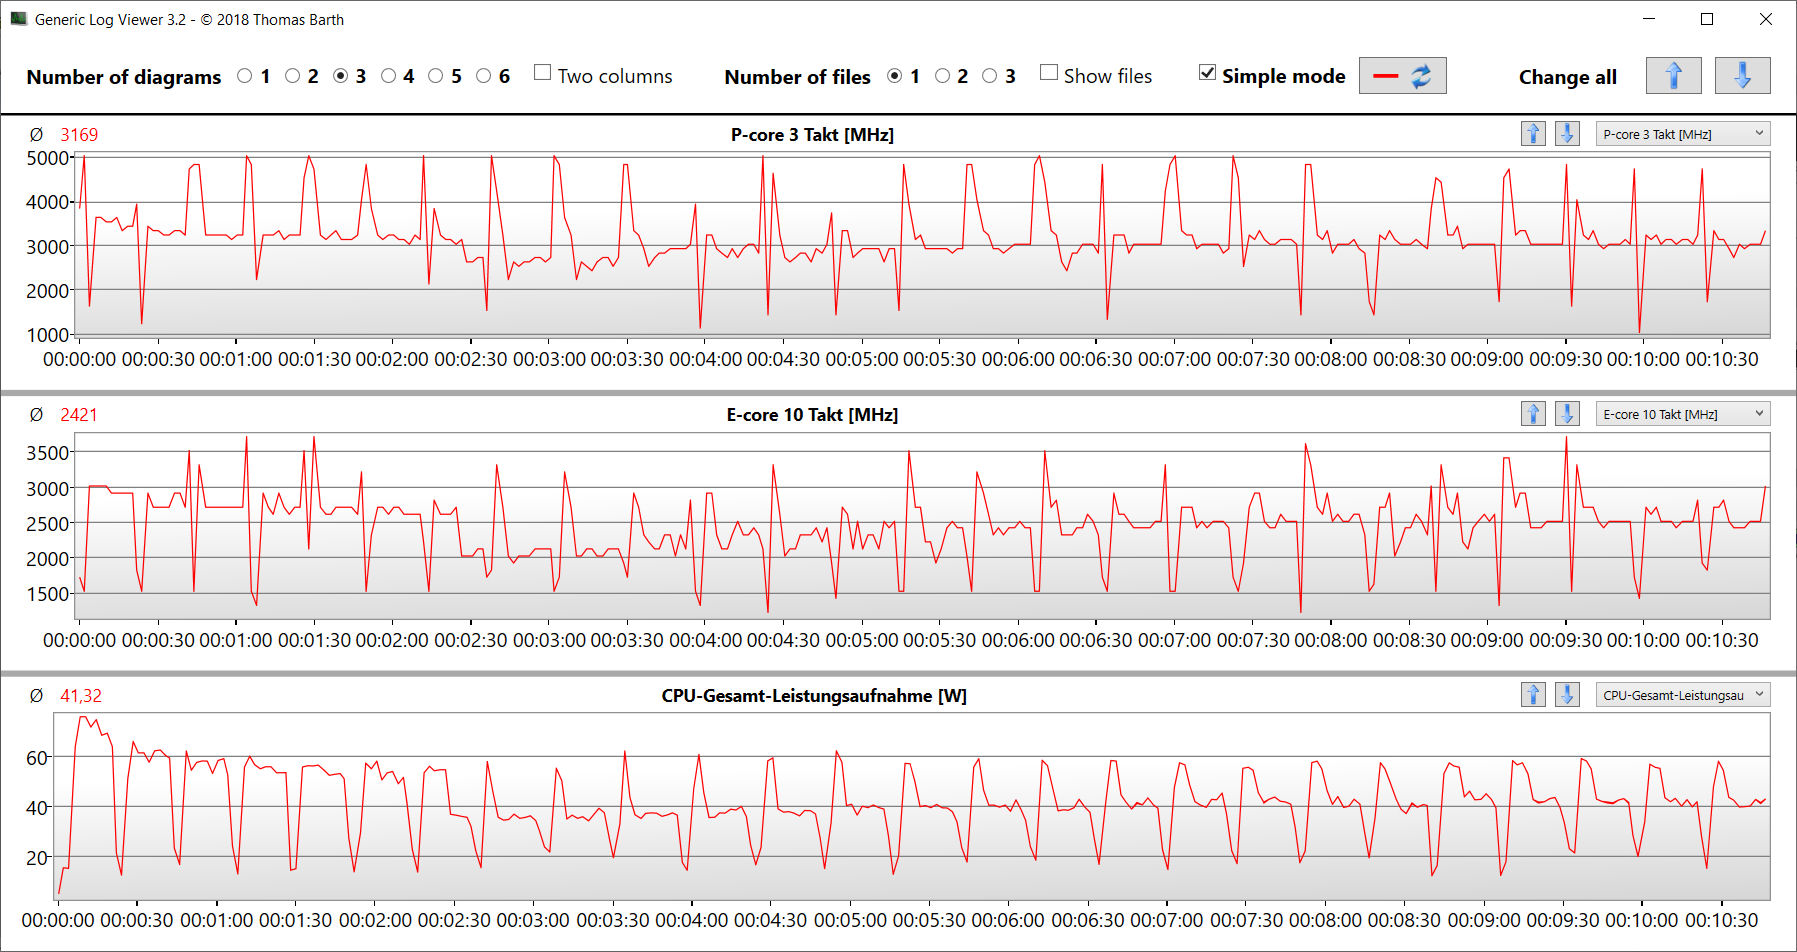
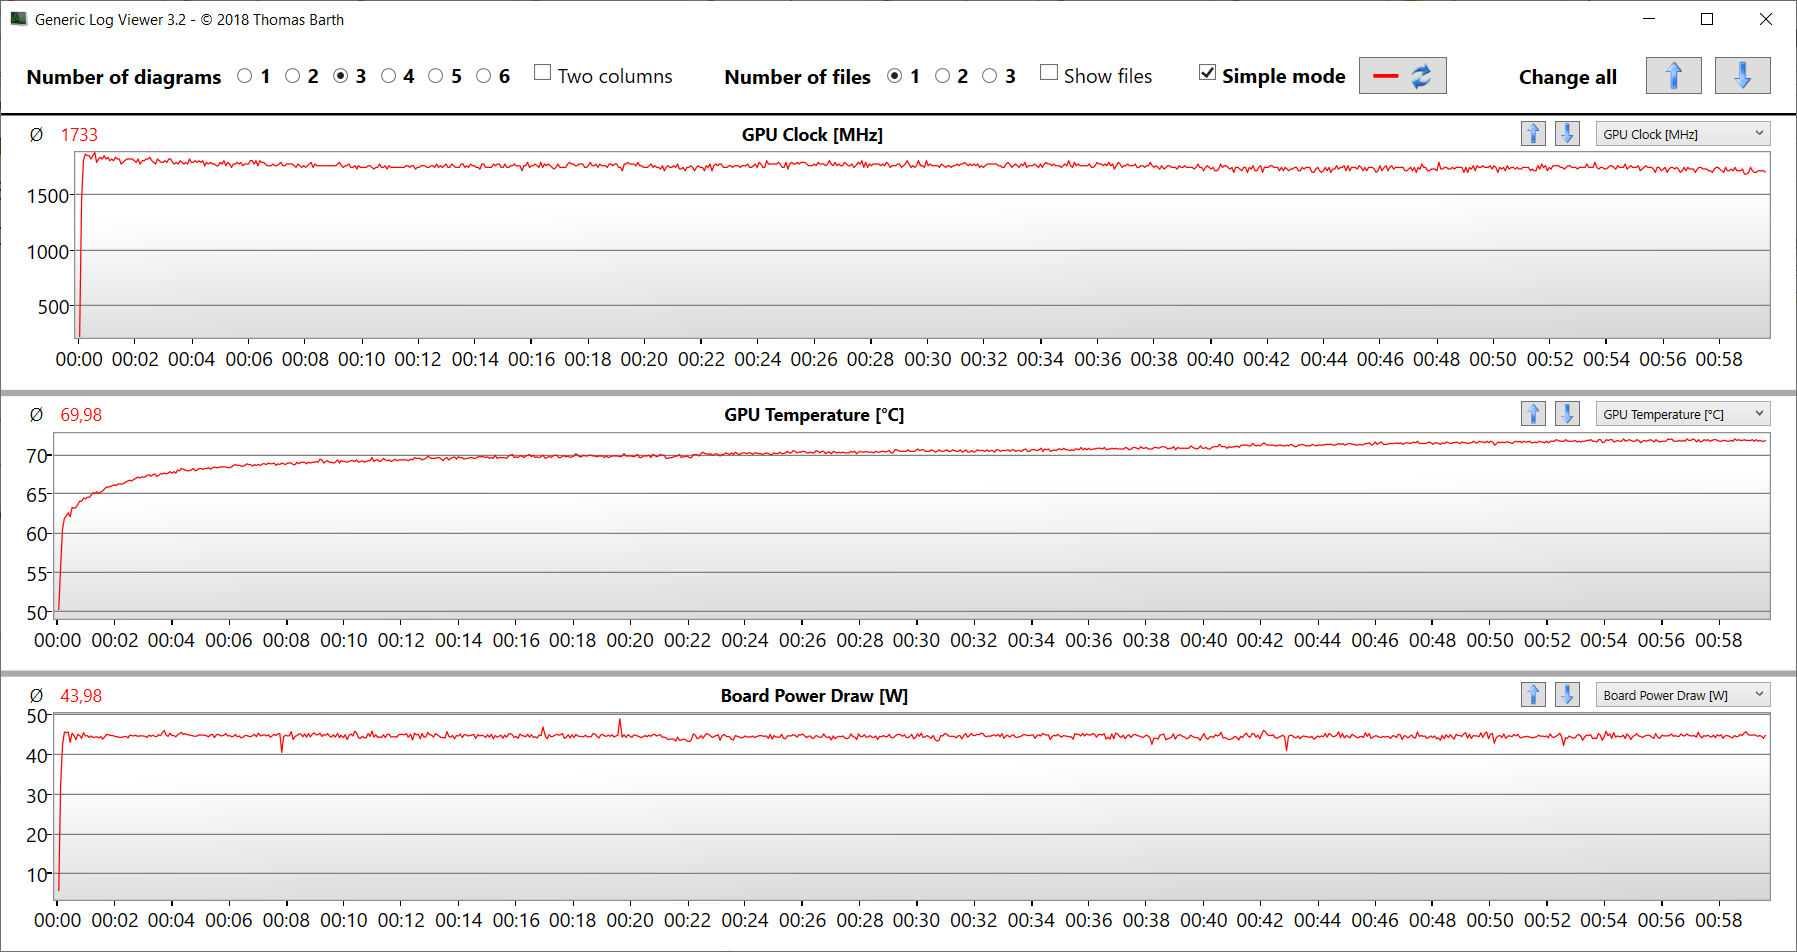
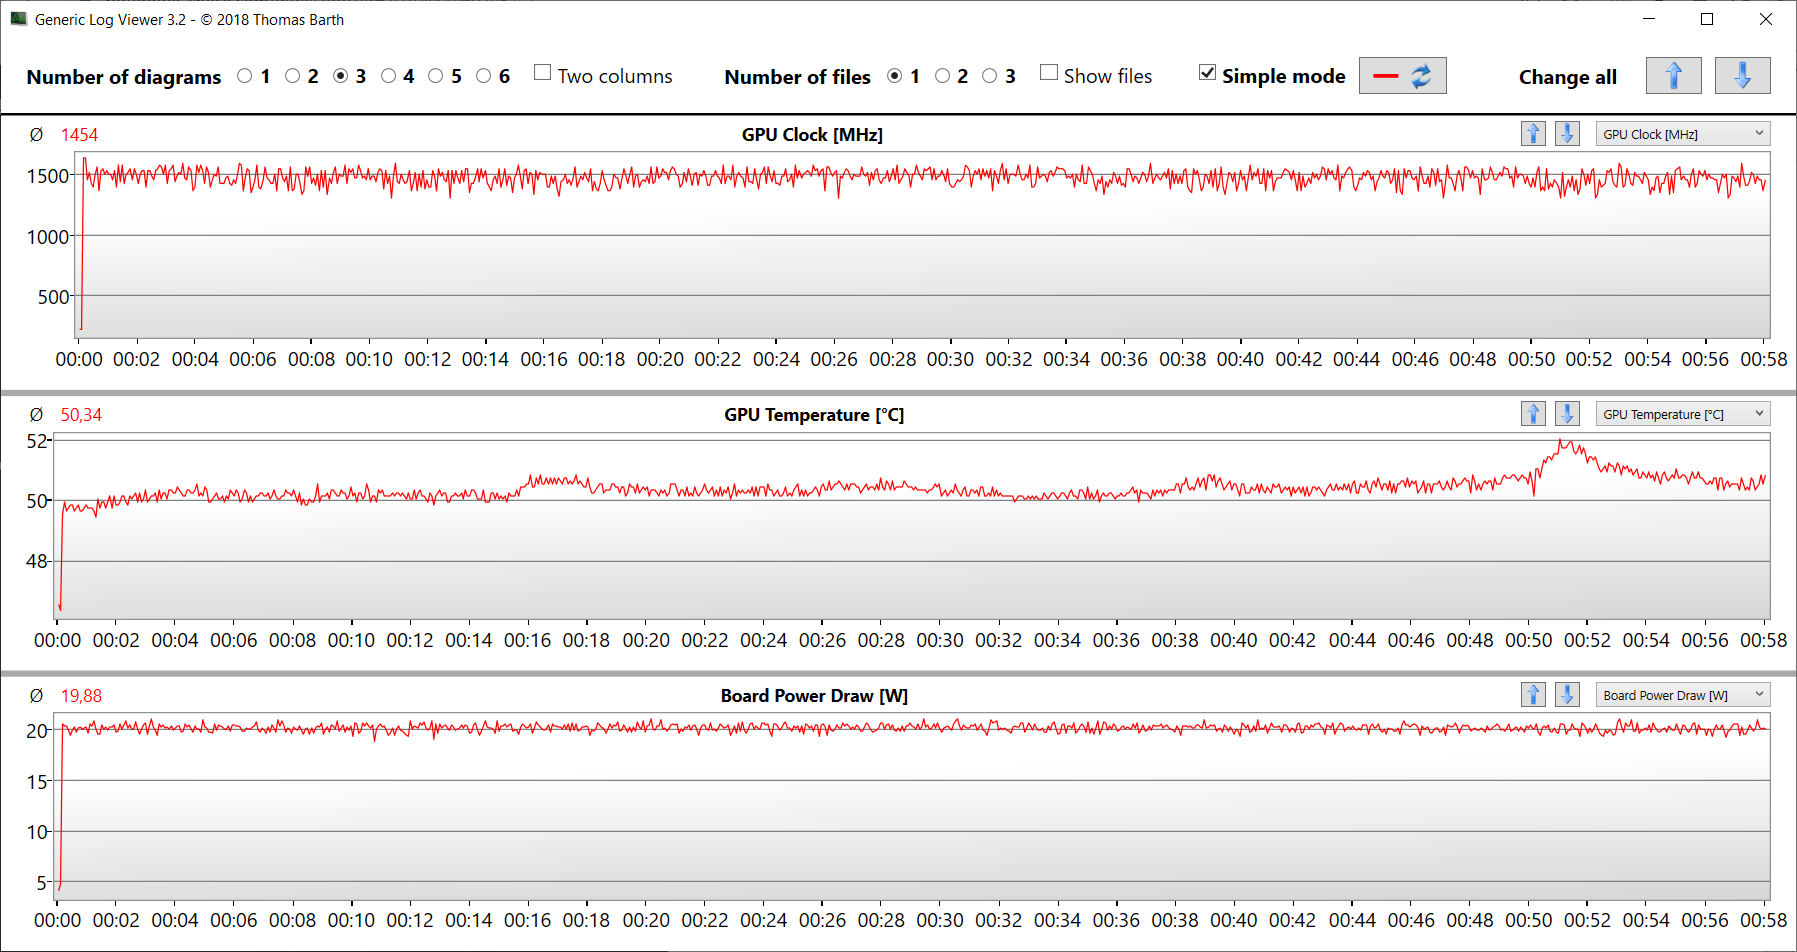
Overall, Samsung's laptop is satisfied with relatively little energy. Both in idle and under load, energy demands are lower than that of the competition, with the exception of the LG Gram. The Witcher 3 test and stress test run on relatively constant power consumption. Towards the end of the stress test, the demand drops a little. The USB-C power supply (100 watts) is sufficiently sized.
| Off / Standby | |
| Idle | |
| Load |
|
| Samsung Galaxy Book3 Ultra 16 i7-13700H, NVIDIA GeForce RTX 4050 Laptop GPU | SCHENKER Vision 16 Pro RTX 3070 Ti i7-12700H, GeForce RTX 3070 Ti Laptop GPU | LG Gram 17Z90Q-E.AD78G i7-1260P, GeForce RTX 2050 Mobile | Lenovo ThinkBook 16p G3 ARH R9 6900HX, GeForce RTX 3060 Laptop GPU | Dell XPS 15 9520 RTX 3050 Ti i7-12700H, GeForce RTX 3050 Ti Laptop GPU | Asus VivoBook Pro 16X OLED N7600PC-L2026X i7-11370H, GeForce RTX 3050 4GB Laptop GPU | Acer Swift X SFX16-52G-77RX i7-1260P, A370M | Average NVIDIA GeForce RTX 4050 Laptop GPU | Average of class Multimedia | |
|---|---|---|---|---|---|---|---|---|---|
| Power Consumption | -105% | -7% | -126% | -39% | -63% | -12% | -119% | -66% | |
| Idle Minimum * | 3 | 9 -200% | 4.1 -37% | 10.3 -243% | 5.5 -83% | 8.9 -197% | 3.7 -23% | 10.1 ? -237% | 7.29 ? -143% |
| Idle Average * | 5 | 13.3 -166% | 9.8 -96% | 16 -220% | 7.2 -44% | 10.2 -104% | 7.6 -52% | 15.1 ? -202% | 11.8 ? -136% |
| Idle Maximum * | 11 | 14.3 -30% | 12 -9% | 24 -118% | 16 -45% | 12 -9% | 11.1 -1% | 18.3 ? -66% | 14.6 ? -33% |
| Load Average * | 72 | 107 -49% | 49.3 32% | 85.4 -19% | 91.8 -28% | 94 -31% | 70 3% | 87.7 ? -22% | 77.7 ? -8% |
| Witcher 3 ultra * | 69.7 | 155.2 -123% | 49.3 29% | 132.2 -90% | 74.6 -7% | 93.1 -34% | 68.8 1% | ||
| Load Maximum * | 108 | 172 -59% | 66 39% | 181.9 -68% | 134.7 -25% | 112 -4% | 108 -0% | 182 ? -69% | 121 ? -12% |
* ... smaller is better
Power consumption Witcher 3 / Stress test
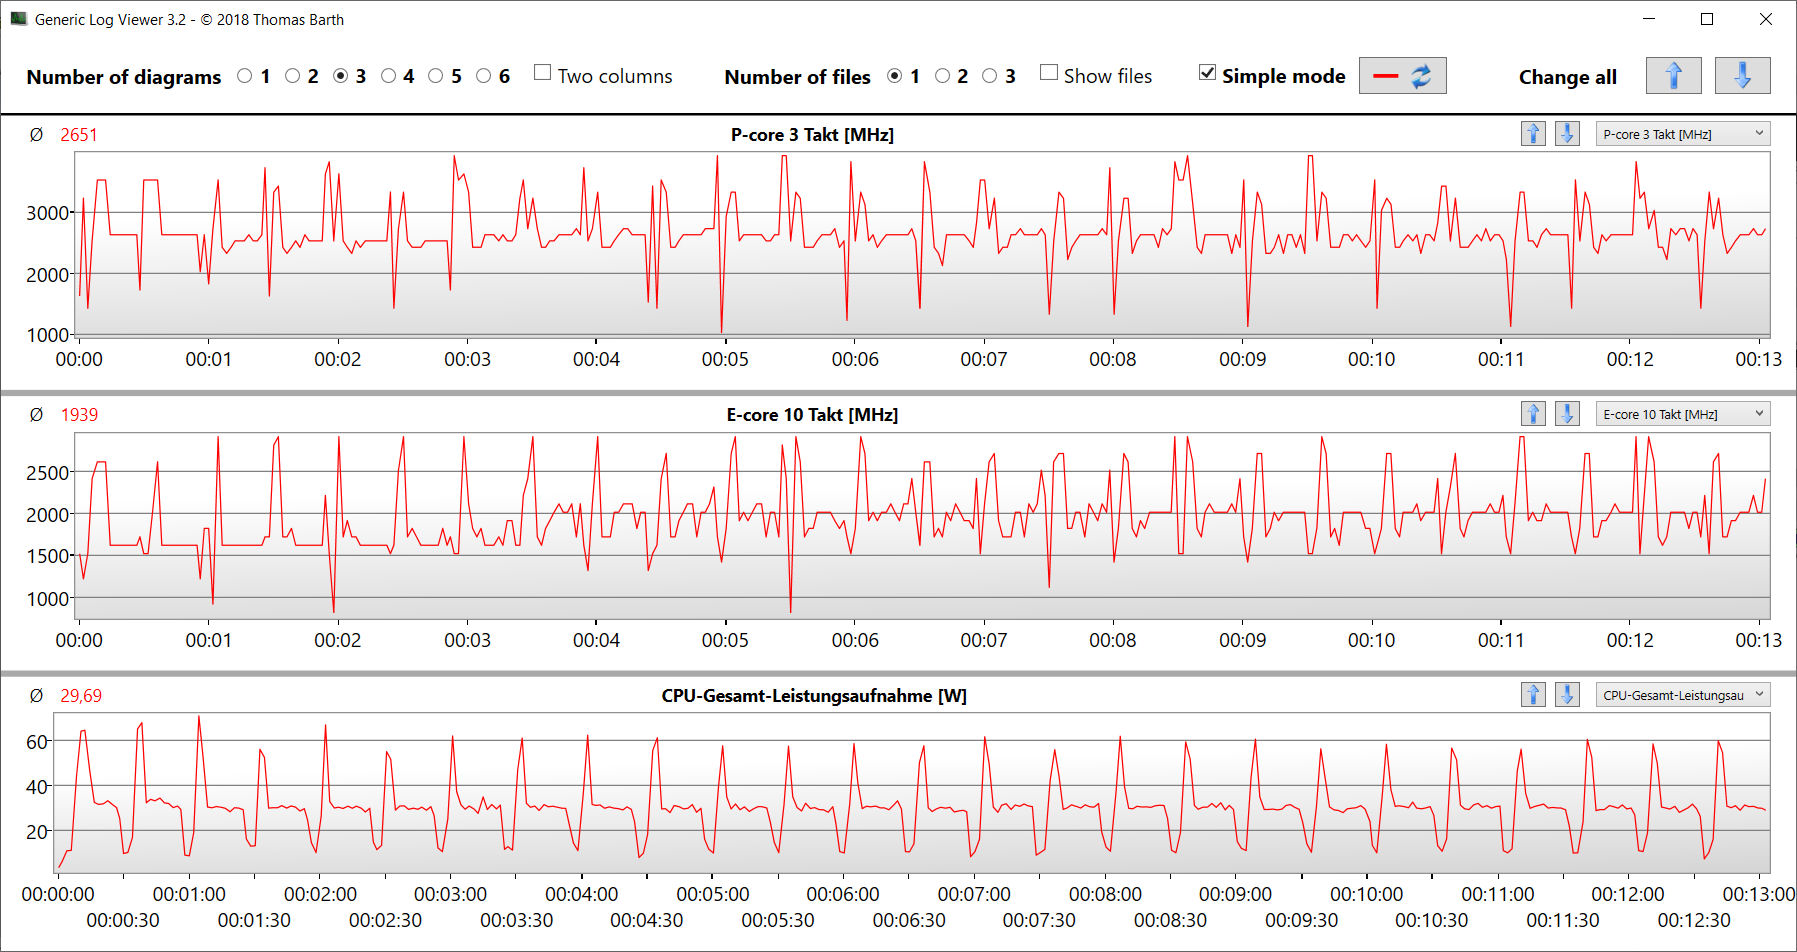
Power consumption with an external monitor
Battery Life
The 16-incher achieves runtimes of 9:36 h and 13:23 h in the WLAN test (calling up websites via a script) and video test (short movie Big Buck Bunny, H.264 encoding, FHD, in a loop), respectively. During both tests, the notebook's energy-saving features were disabled and the display brightness set to about 150 cd/m². The wireless modules were also disabled during the video test.
| Samsung Galaxy Book3 Ultra 16 i7-13700H, NVIDIA GeForce RTX 4050 Laptop GPU, 76 Wh | SCHENKER Vision 16 Pro RTX 3070 Ti i7-12700H, GeForce RTX 3070 Ti Laptop GPU, 80 Wh | LG Gram 17Z90Q-E.AD78G i7-1260P, GeForce RTX 2050 Mobile, 90 Wh | Lenovo ThinkBook 16p G3 ARH R9 6900HX, GeForce RTX 3060 Laptop GPU, 71 Wh | Dell XPS 15 9520 RTX 3050 Ti i7-12700H, GeForce RTX 3050 Ti Laptop GPU, 86 Wh | Asus VivoBook Pro 16X OLED N7600PC-L2026X i7-11370H, GeForce RTX 3050 4GB Laptop GPU, 96 Wh | Acer Swift X SFX16-52G-77RX i7-1260P, A370M, 56 Wh | Average of class Multimedia | |
|---|---|---|---|---|---|---|---|---|
| Battery Runtime | -39% | 37% | -33% | 18% | -2% | -22% | -9% | |
| Reader / Idle | 1093 | 886 -19% | 663 -39% | 933 ? -15% | ||||
| H.264 | 803 | 367 -54% | 624 -22% | 710 ? -12% | ||||
| WiFi v1.3 | 576 | 361 -37% | 872 51% | 387 -33% | 528 -8% | 520 -10% | 543 -6% | 572 ? -1% |
| Load | 106 | 77 -27% | 129 22% | 192 81% | 152 43% | 65 -39% | 97.7 ? -8% |
Pros
Cons
Conclusion - A successful compromise

The Galaxy Book3 Ultra 16 is a good compromise between performance, mobility and ergonomics. The Core i7-13700H and GeForce RTX 4050 laptop run at reduced performance, but still deliver enough power for FHD gaming and rendering.
Samsung delivers a mobile notebook for gamers and creative workers in the Galaxy Book3 Ultra 16. But the overly high price tag casts a shadow on the laptop's otherwise strong character.
The compact device does not weigh too much at 1.8 kg. In combination with a practical battery life of 9 to 13 hours, you have a fairly mobile device on your hands. Noise and heat development are moderate. Two USB-C slots (Thunderbolt 4) are used for the power supply and enable easy integration into existing workplace setups.
The large 16-inch screen (2,880 x 1,800, OLED) in a work-friendly 16:10 format scores with high brightness, excellent contrast, stable viewing angles, short response times, great color reproduction and very good color space coverage. The downside: the panel has a reflective surface, and it also uses PWM for all brightness levels - a US$2399.99 device should offer more here.
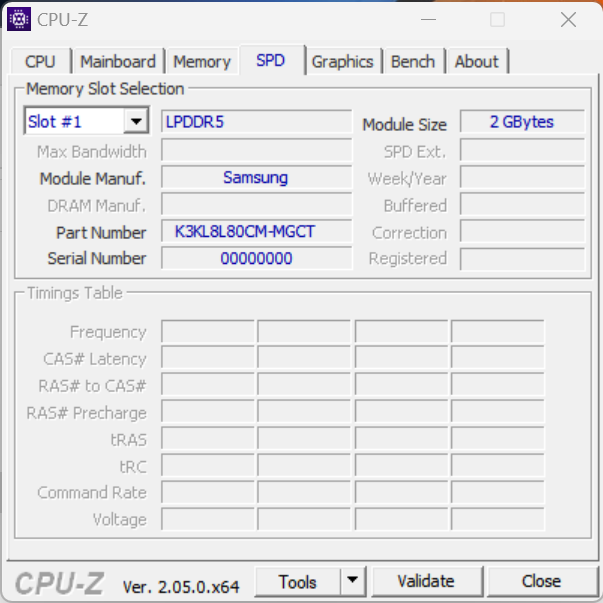
The RAM is also a little thin at 16 GB. A device with the claim of the Galaxy Book should offer 32 GB here, especially since the memory (onboard) cannot be expanded. At least higher-priced 32 GB models are available.
The Schenker Vision 16 Pro could be considered as an alternative. It offers more graphics performance and expandable RAM, but is at a disadvantage in terms of runtimes and emissions. The Asus VivoBook Pro 16X OLED (approx. US$1,400) and the Acer Swift X 16 (approx. US$1,100) are cheaper and weaker alternatives to the Samsung computer. They offer less performance, occasionally shorter runtimes and permanently soldered working memory.
Price and availability
The configuration of our test device is available via Amazon UK and Amazon Canada for £2,449.00 and CAD$2,799.99, respectively. In the US, 1TB appears to be the minimum configuration on Samsung's website, starting at $2399.99.
Samsung Galaxy Book3 Ultra 16
-
04/26/2023 v7
Sascha Mölck
More articles related to this device
Samsung Galaxy Book3 Ultra 16 (Galaxy Book3 Series)Related Articles


Transparency
The present review sample was made available to the author as a loan by the manufacturer or a shop for the purposes of review. The lender had no influence on this review, nor did the manufacturer receive a copy of this review before publication. There was no obligation to publish this review.
Pricecompare

