Acer Swift X 16 review: RTX 3050 shines in multimedia laptop
The Acer Swift X 16 basically differs from the Acer Swift 3 (SF316) only in the graphic cards, with the former using Nvidia's GeForce RTX 3050. The multimedia laptop is powered by either a Core i5-11320H or a Core i7-11390H QuadCore CPU - Tiger Lake Refresh with a 35-watt TDP. No AMD variant is on offer like its little brother, the Acer Swift X 14. The RAM is always a soldered 16 GB of LPDDR4X-4266, while the PCIe 3.0 SSD holds 512 GB.
Of particular interest for our review is whether the display and multimedia performance benchmarks are appropiately reflected in the price of US$ 1,200. After all, competing devices such as Dell's Inspiron 16 Plus, Lenovo's IdeaPad 5 Pro 16 and Asus' VivoBook Pro 16X are not to be underestimated.
Possible Competitors in Comparison
Rating | Date | Model | Weight | Height | Size | Resolution | Price |
|---|---|---|---|---|---|---|---|
| 86.2 % v7 (old) | 07 / 2022 | Acer Swift X SFX16-51G-5388 i5-11320H, GeForce RTX 3050 4GB Laptop GPU | 1.8 kg | 18.9 mm | 16.10" | 1920x1080 | |
| 86.4 % v7 (old) | 10 / 2021 | Acer Swift 3 SF316-51 i7-11370H, Iris Xe G7 96EUs | 1.7 kg | 15.9 mm | 16.10" | 1920x1080 | |
| 85.6 % v7 (old) | 03 / 2022 | Acer Swift X SFX14-41G-R7F3 R5 5500U, GeForce GTX 1650 Mobile | 1.4 kg | 18.89 mm | 14.00" | 1920x1080 | |
| 86.1 % v7 (old) | 09 / 2021 | Lenovo IdeaPad 5 Pro 16ACH R7 5800H, GeForce GTX 1650 Mobile | 2 kg | 17.5 mm | 16.00" | 2560x1600 | |
| 86.7 % v7 (old) | 08 / 2021 | Dell Inspiron 16 Plus 7610 i7-11800H, GeForce RTX 3050 4GB Laptop GPU | 2 kg | 18.99 mm | 16.00" | 3072x1920 | |
v (old) | 12 / 2021 | Asus Vivobook Pro 16X-M7600QE R9 5900HX, GeForce RTX 3050 Ti Laptop GPU | 1.9 kg | 19 mm | 16.10" | 3840x2400 | |
| 86.5 % v7 (old) | 10 / 2021 | Huawei MateBook 16 R7 5800H R7 5800H, Vega 8 | 2 kg | 17.8 mm | 16.00" | 2520x1680 |
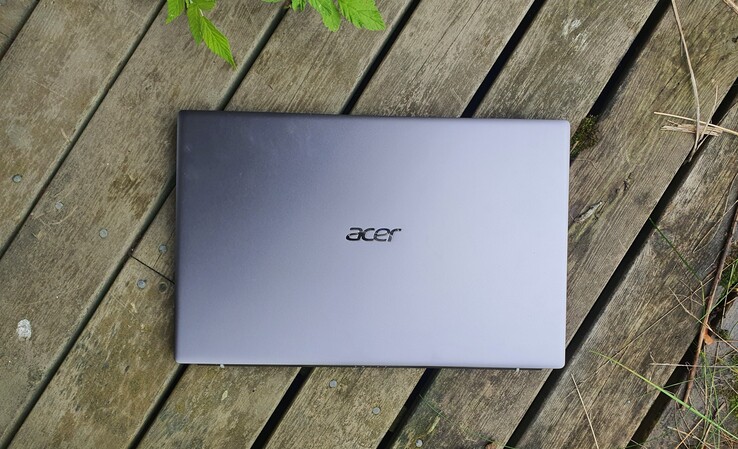
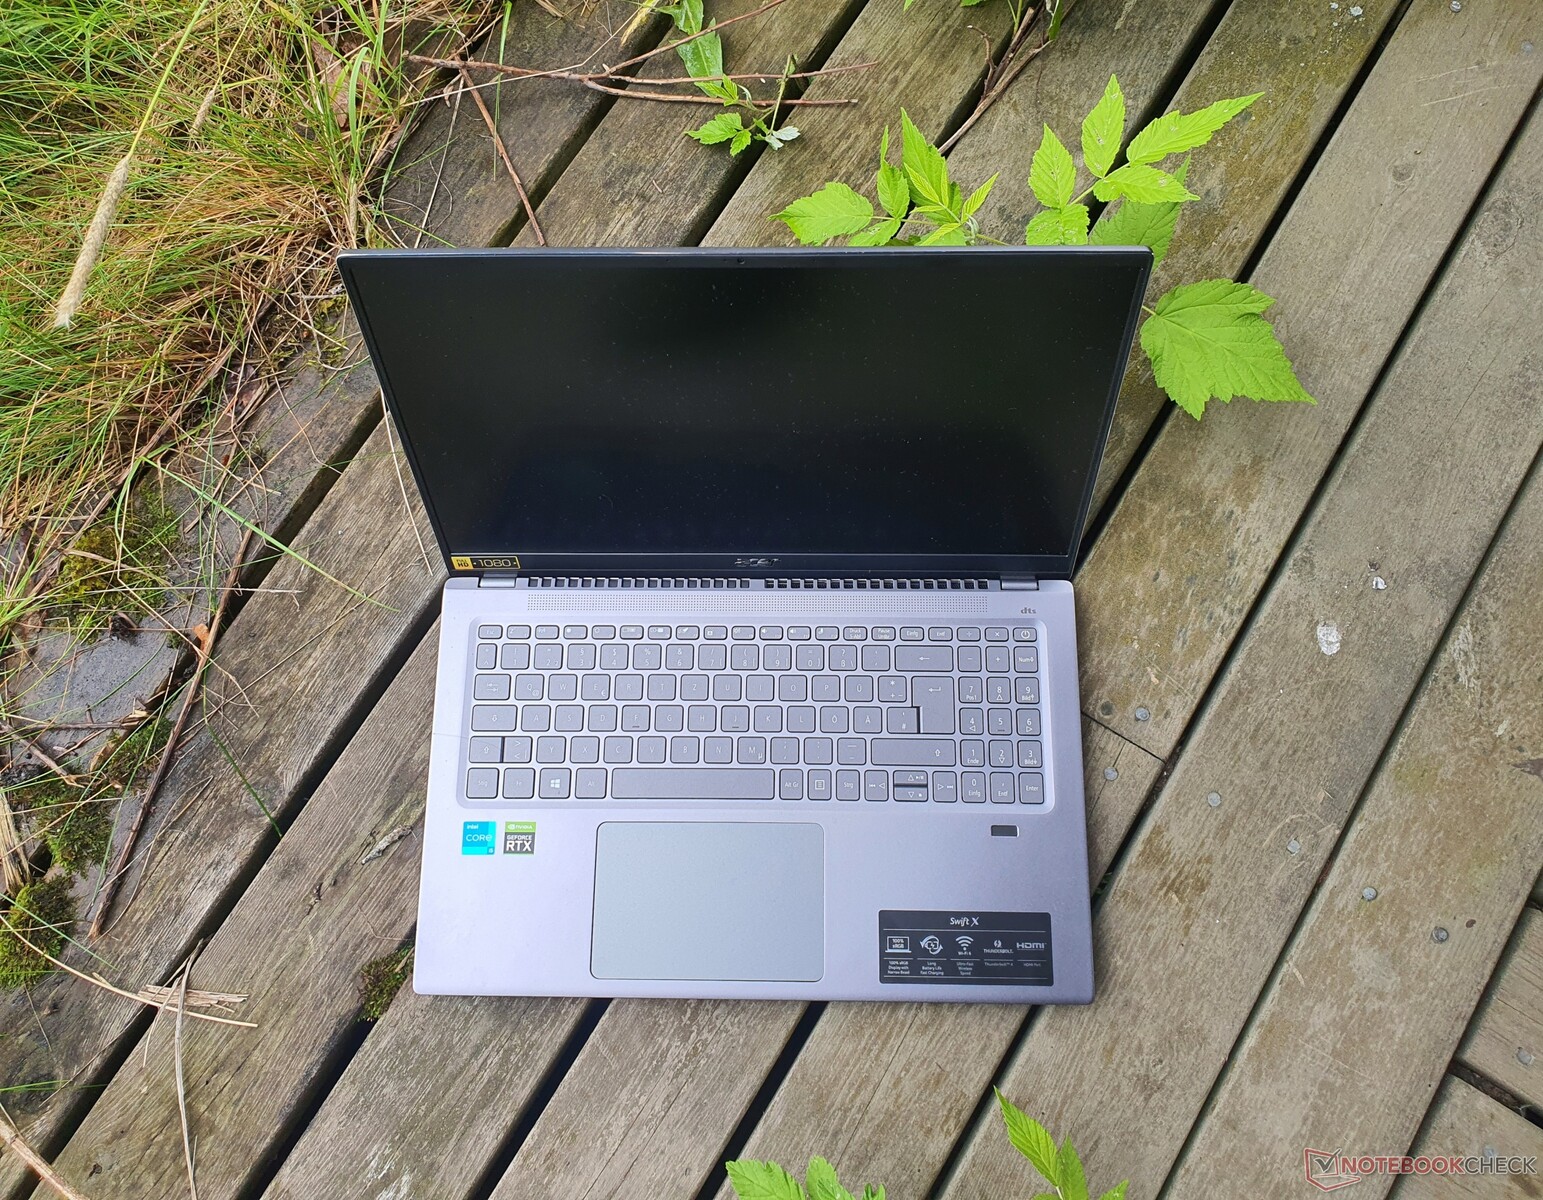
Aluminum case gives the Acer Swift X 16 stability
The grey-bluish and matte aluminium casing has a high-quality feel and is quite stable; there is minimal flex on the palm rest. The hinges are tight so that the screen only teeters a little, but allows for one-handed opening at the same time.
However, the lid could have been a little more torsion-resistant and it fares less well under selected applications of pressure. But this is hardly a problem in everyday use. The workmanship shows no gaps or protrusions and the maximum opening angle is a relatively small 130 degrees.
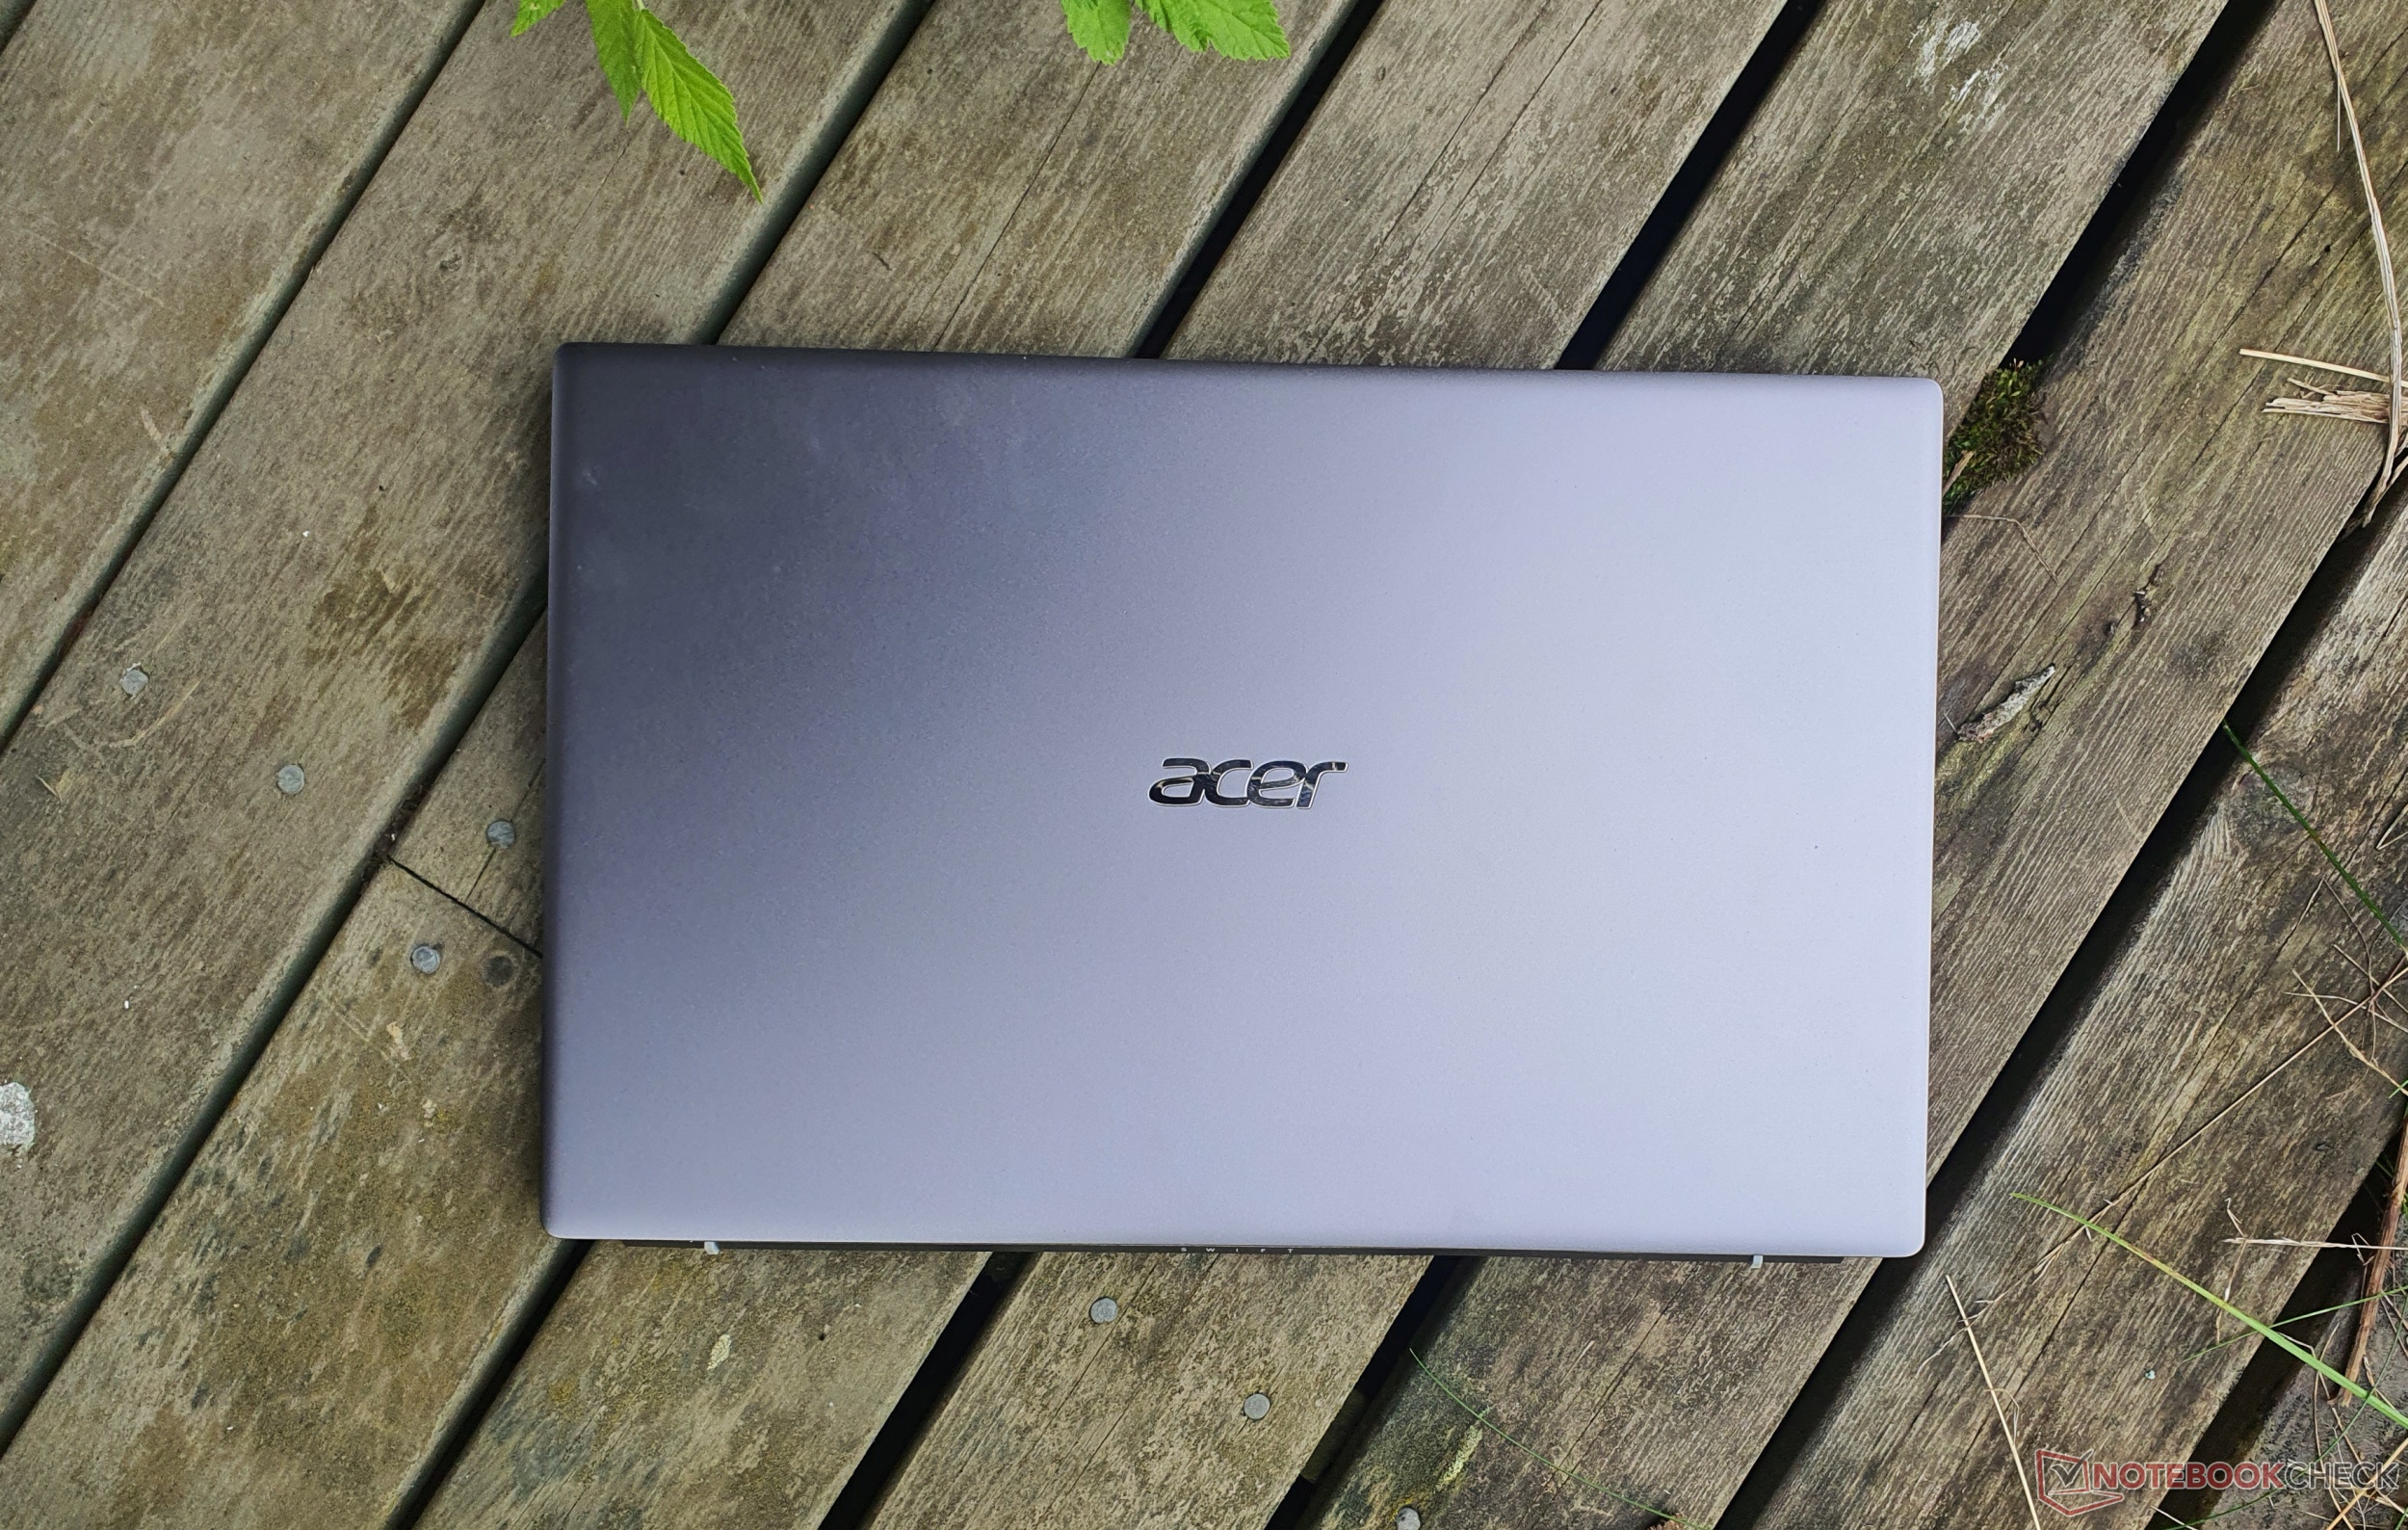
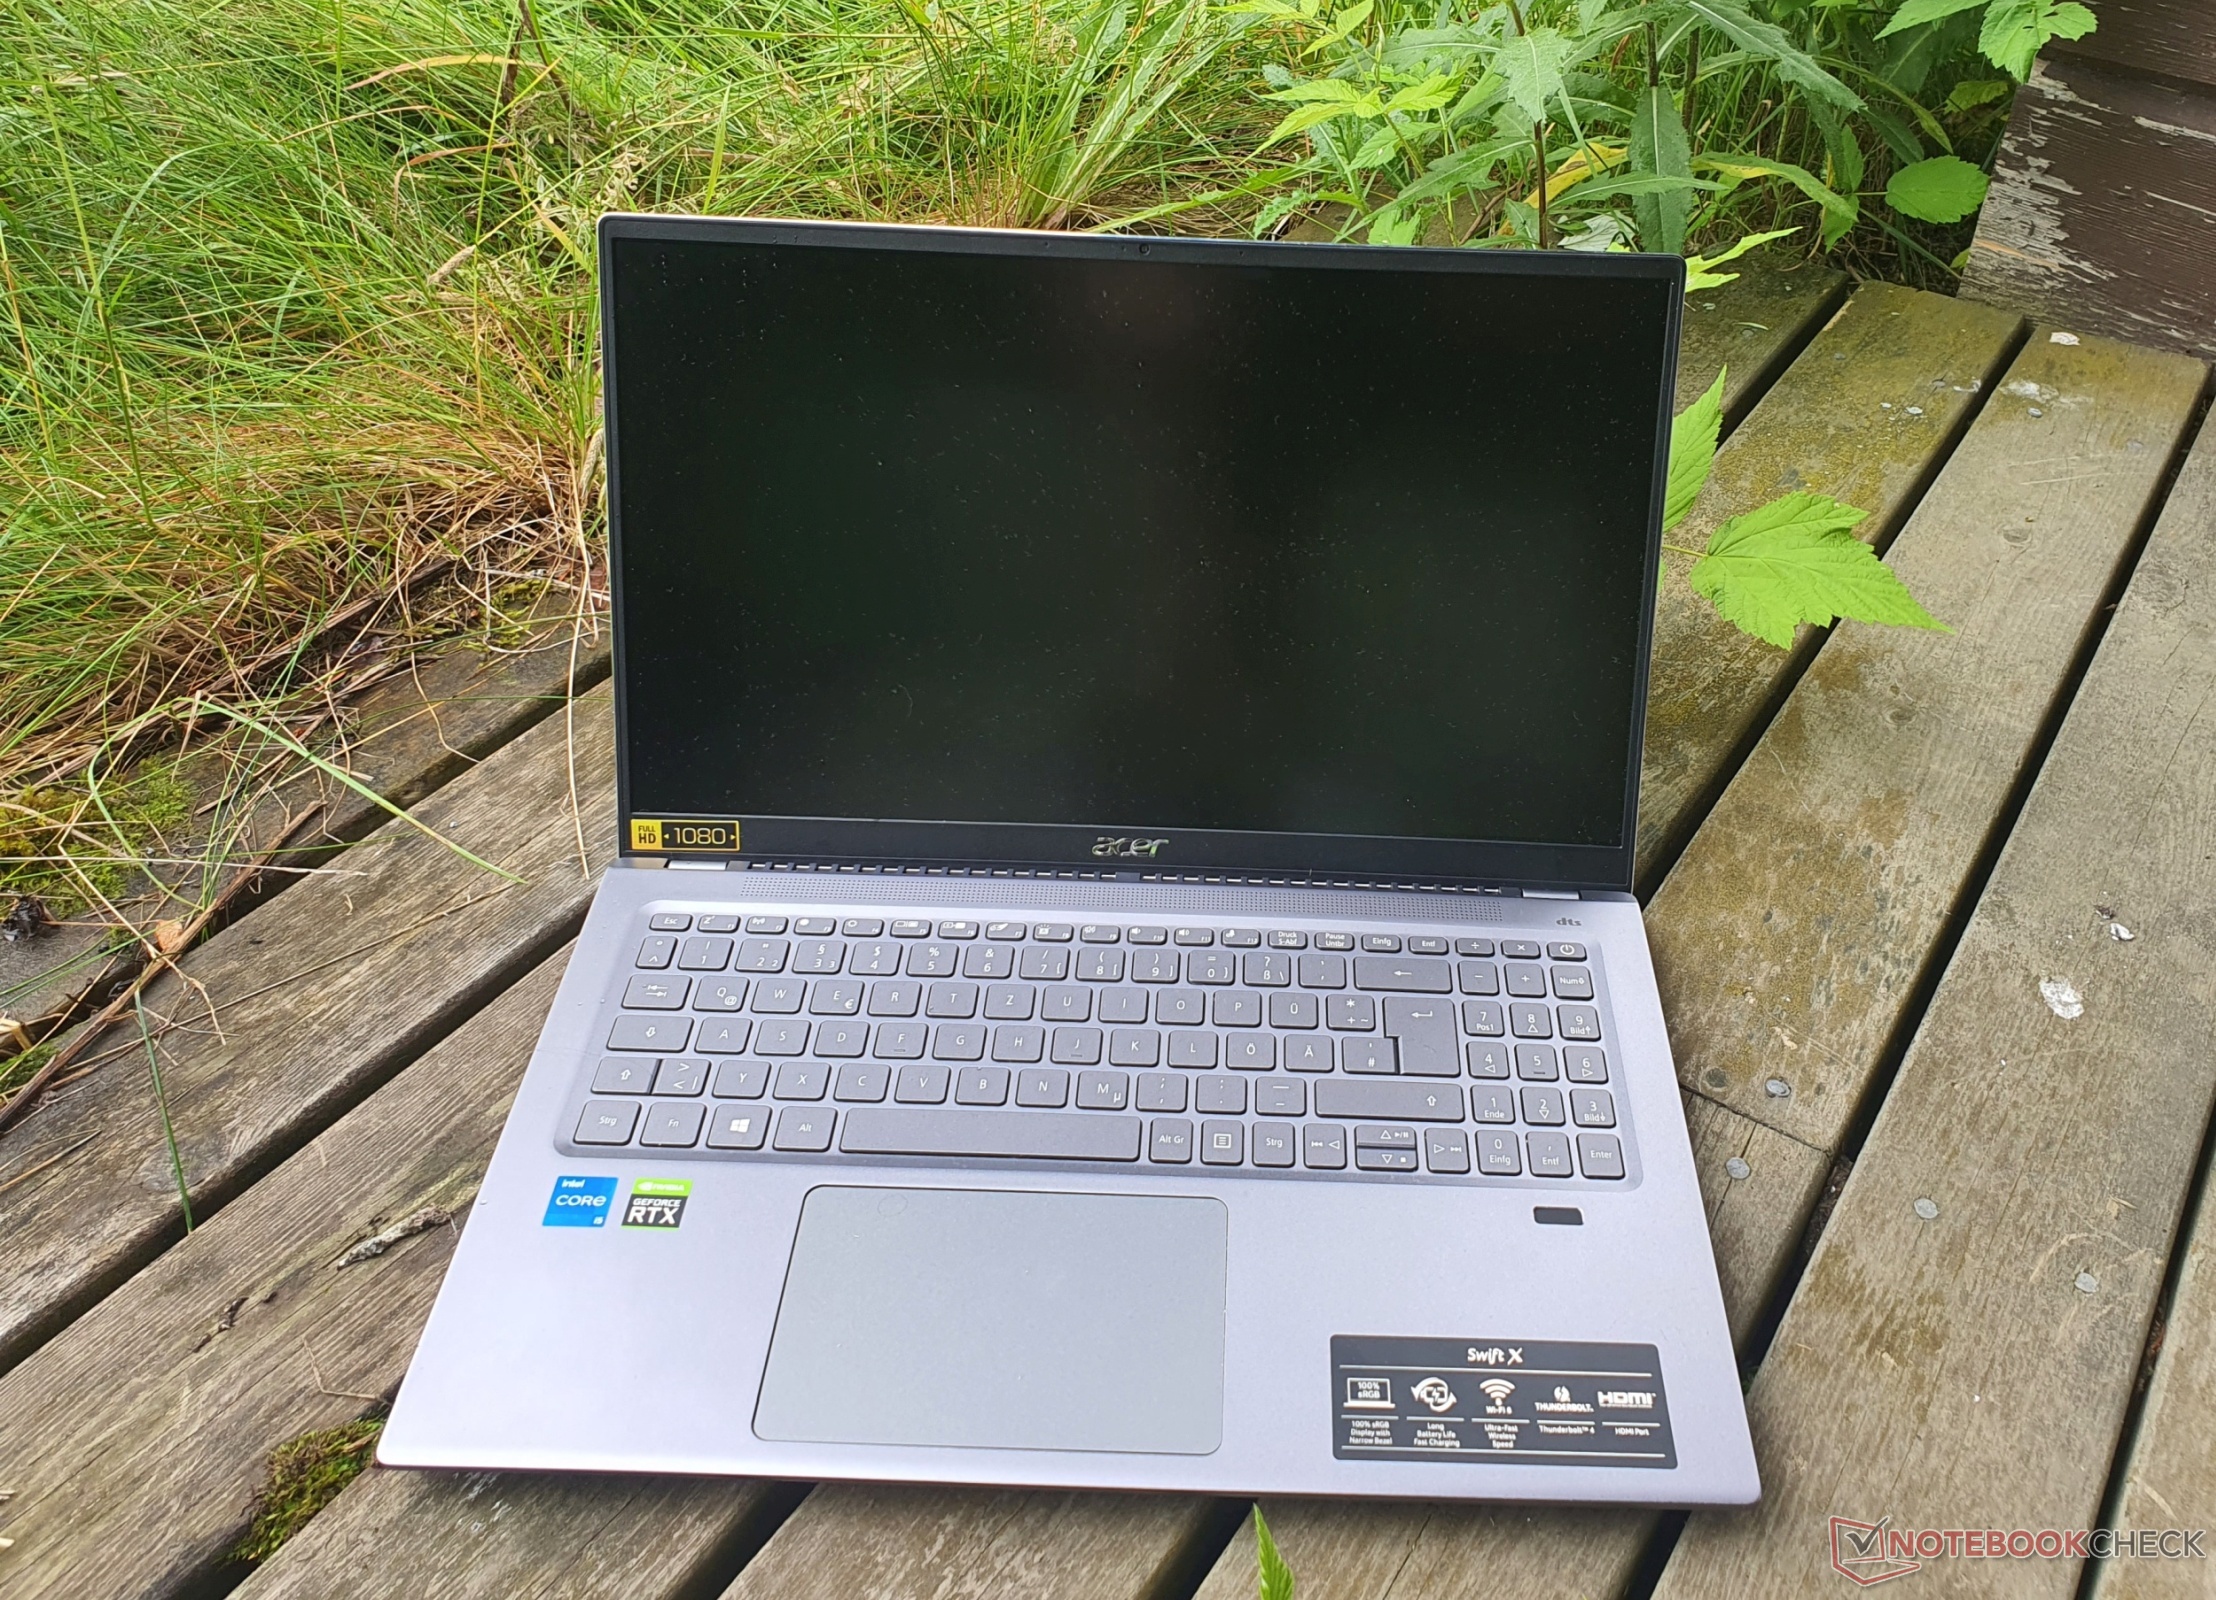
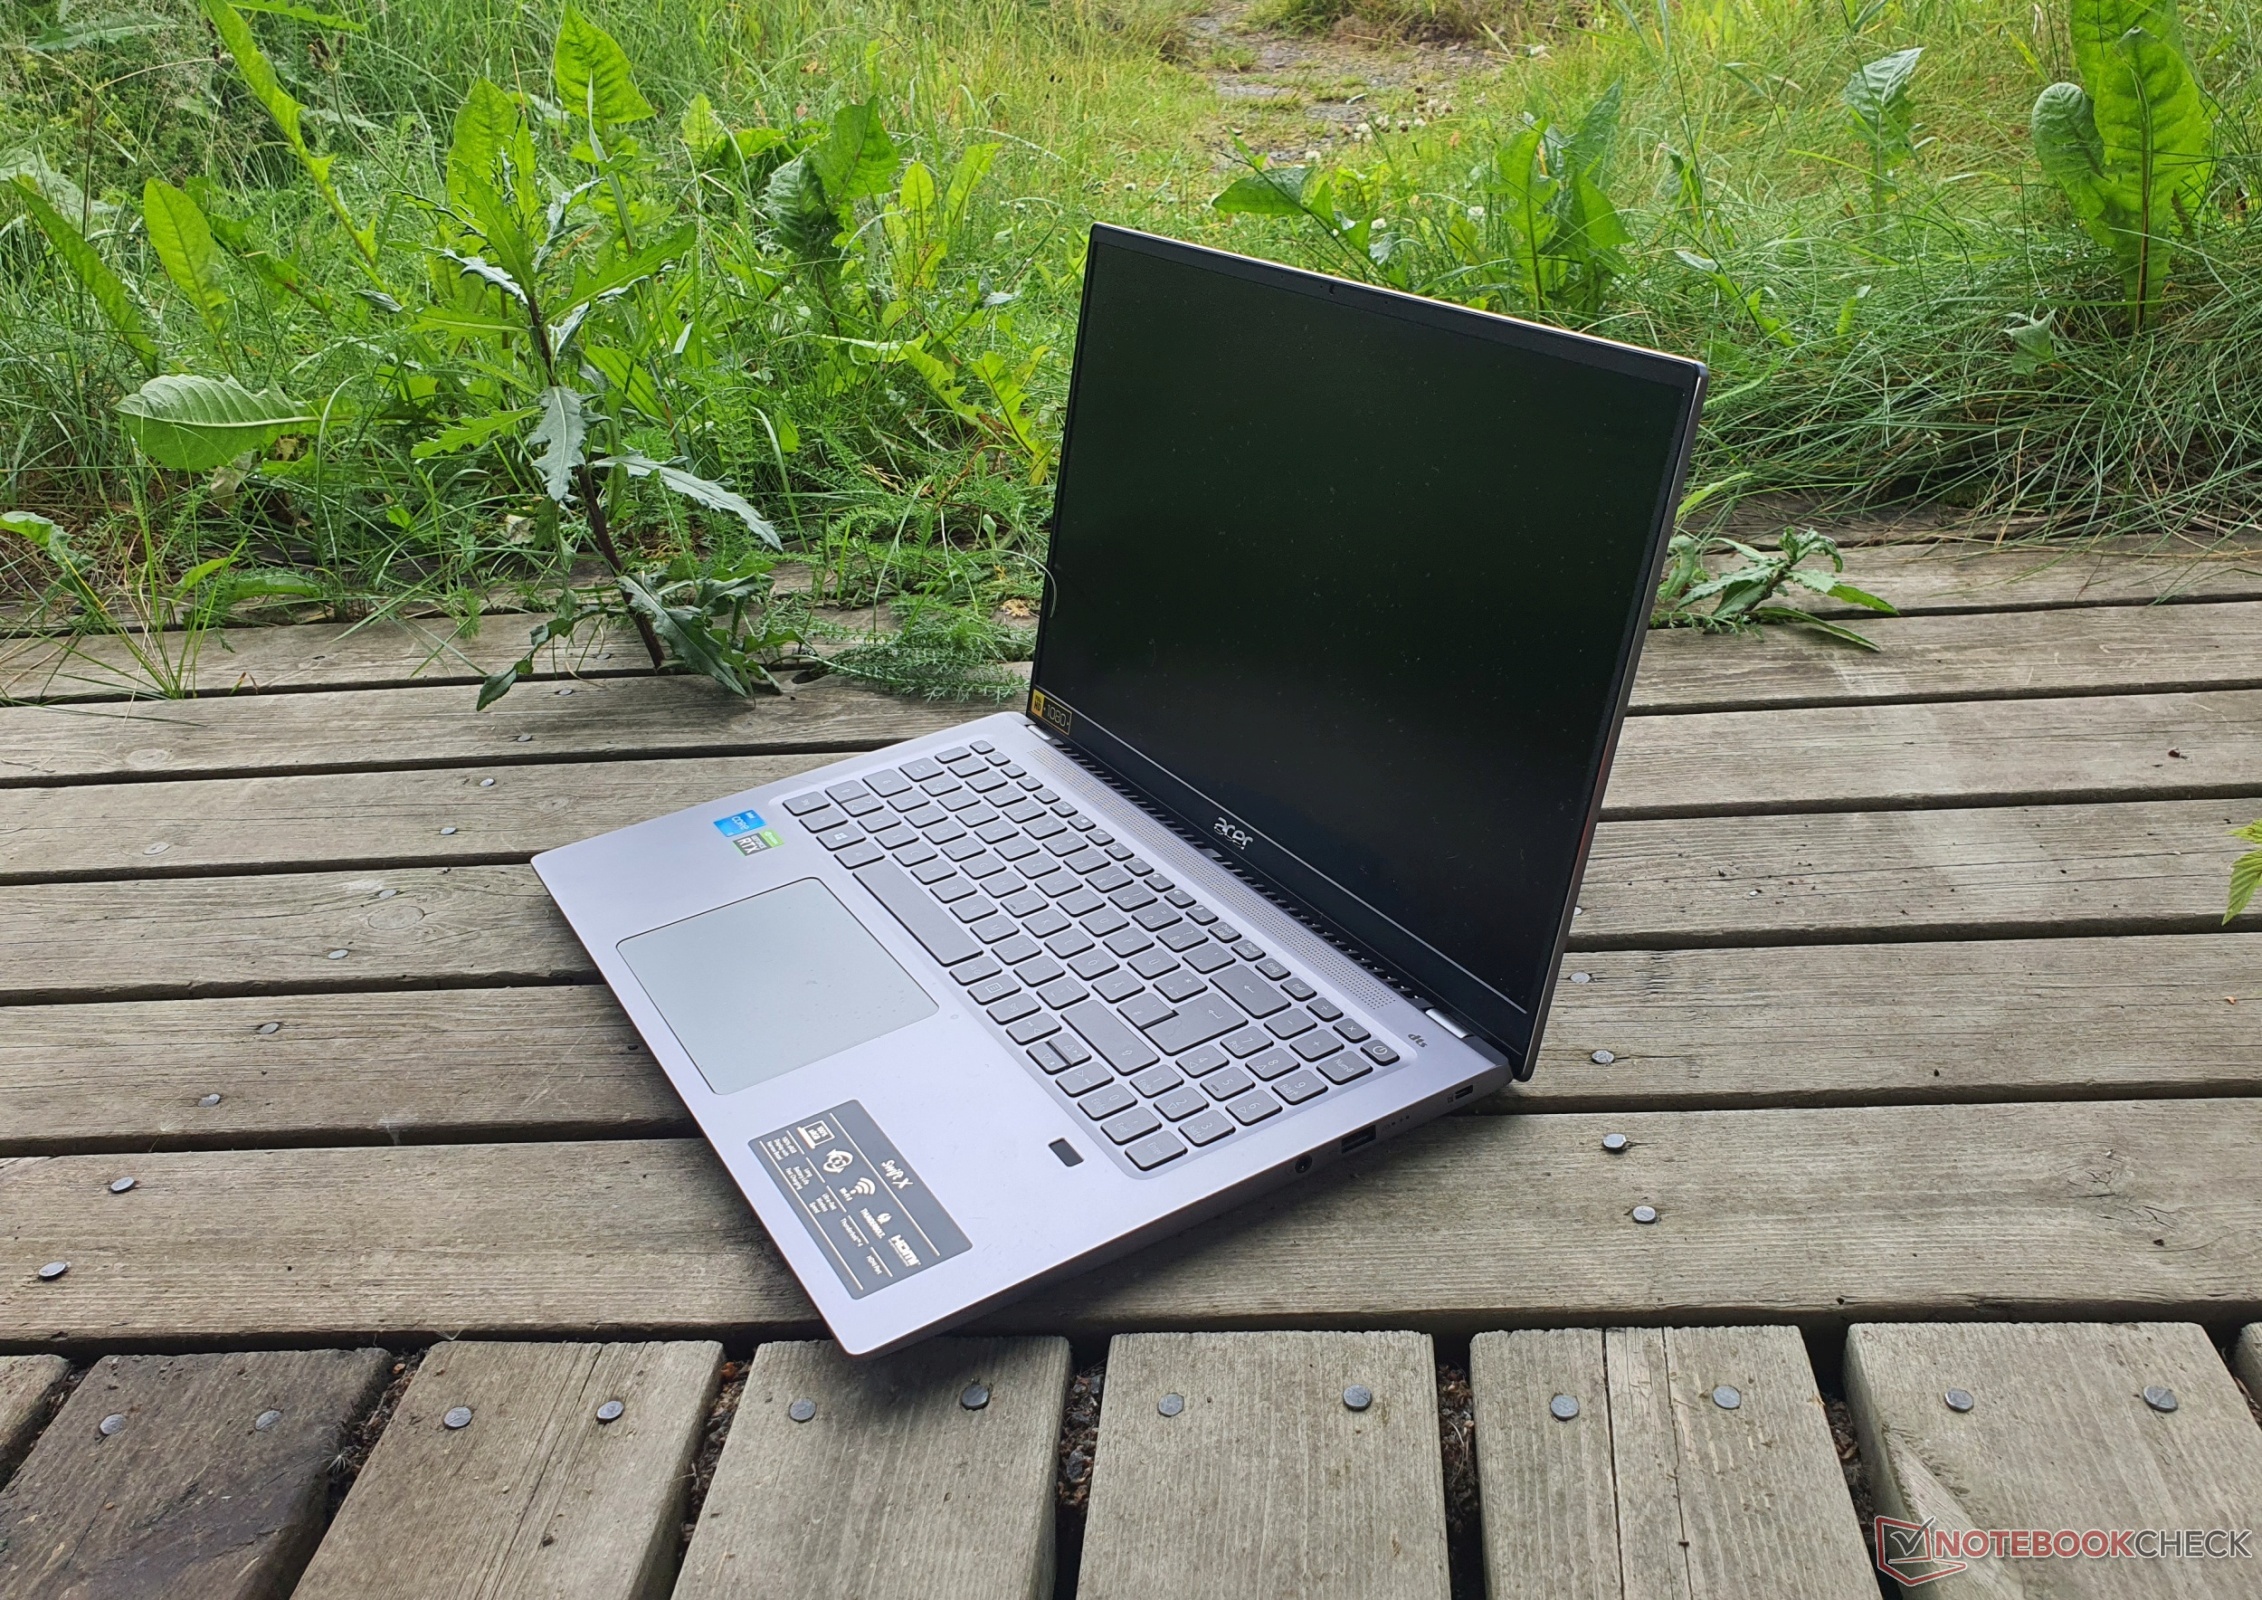
Owing to the 16.1-inch screen in 16:9 format, the Acer Swift X is slightly longer, but less wide and comparatively light at 1.8kg. The Swift 3 weighs about 130 grams less due to the lack of a dGPU. All other comparison devices offer a 16-inch display in 16:10 format and weigh around 2 kg.
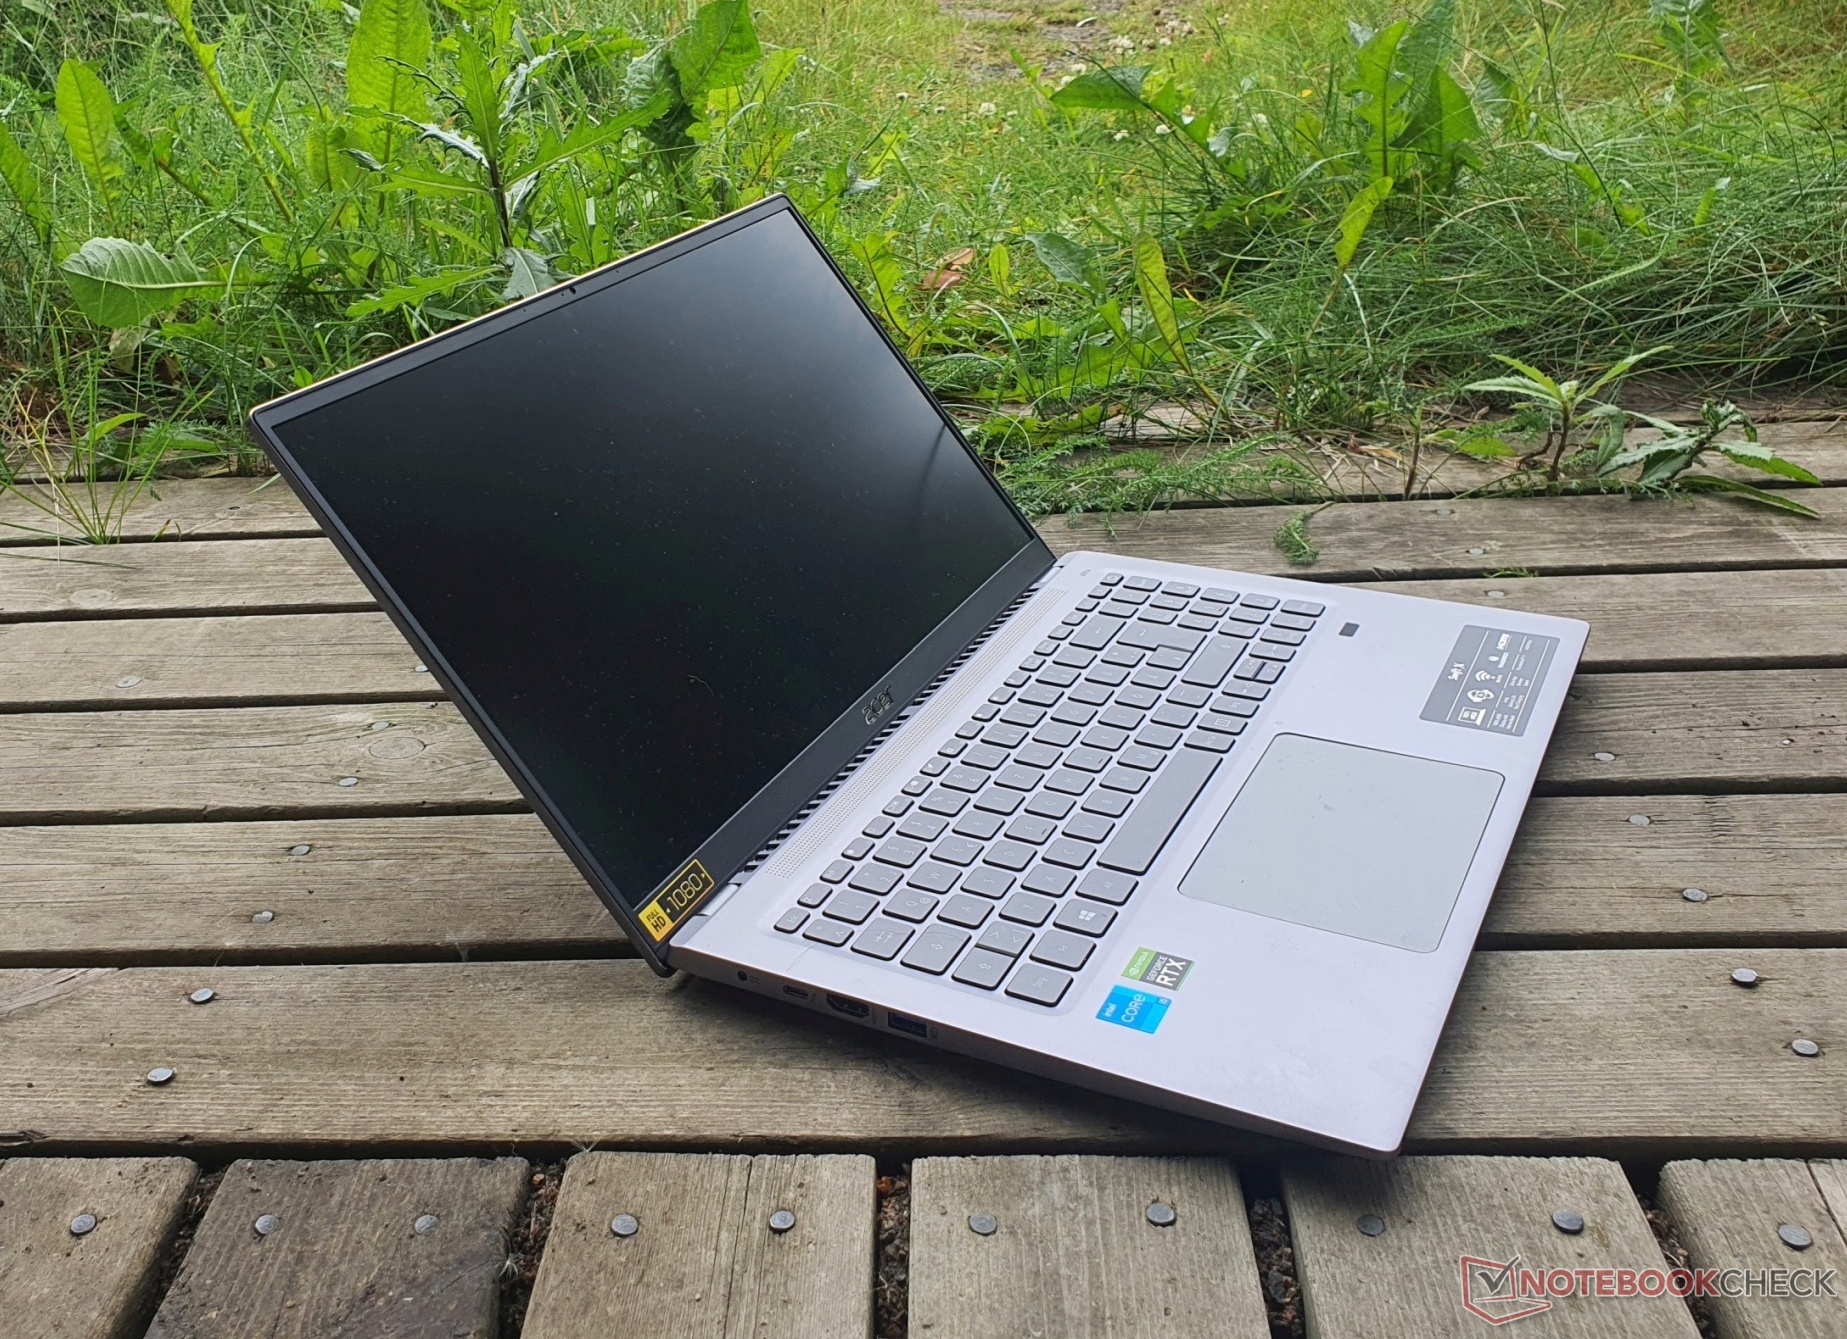
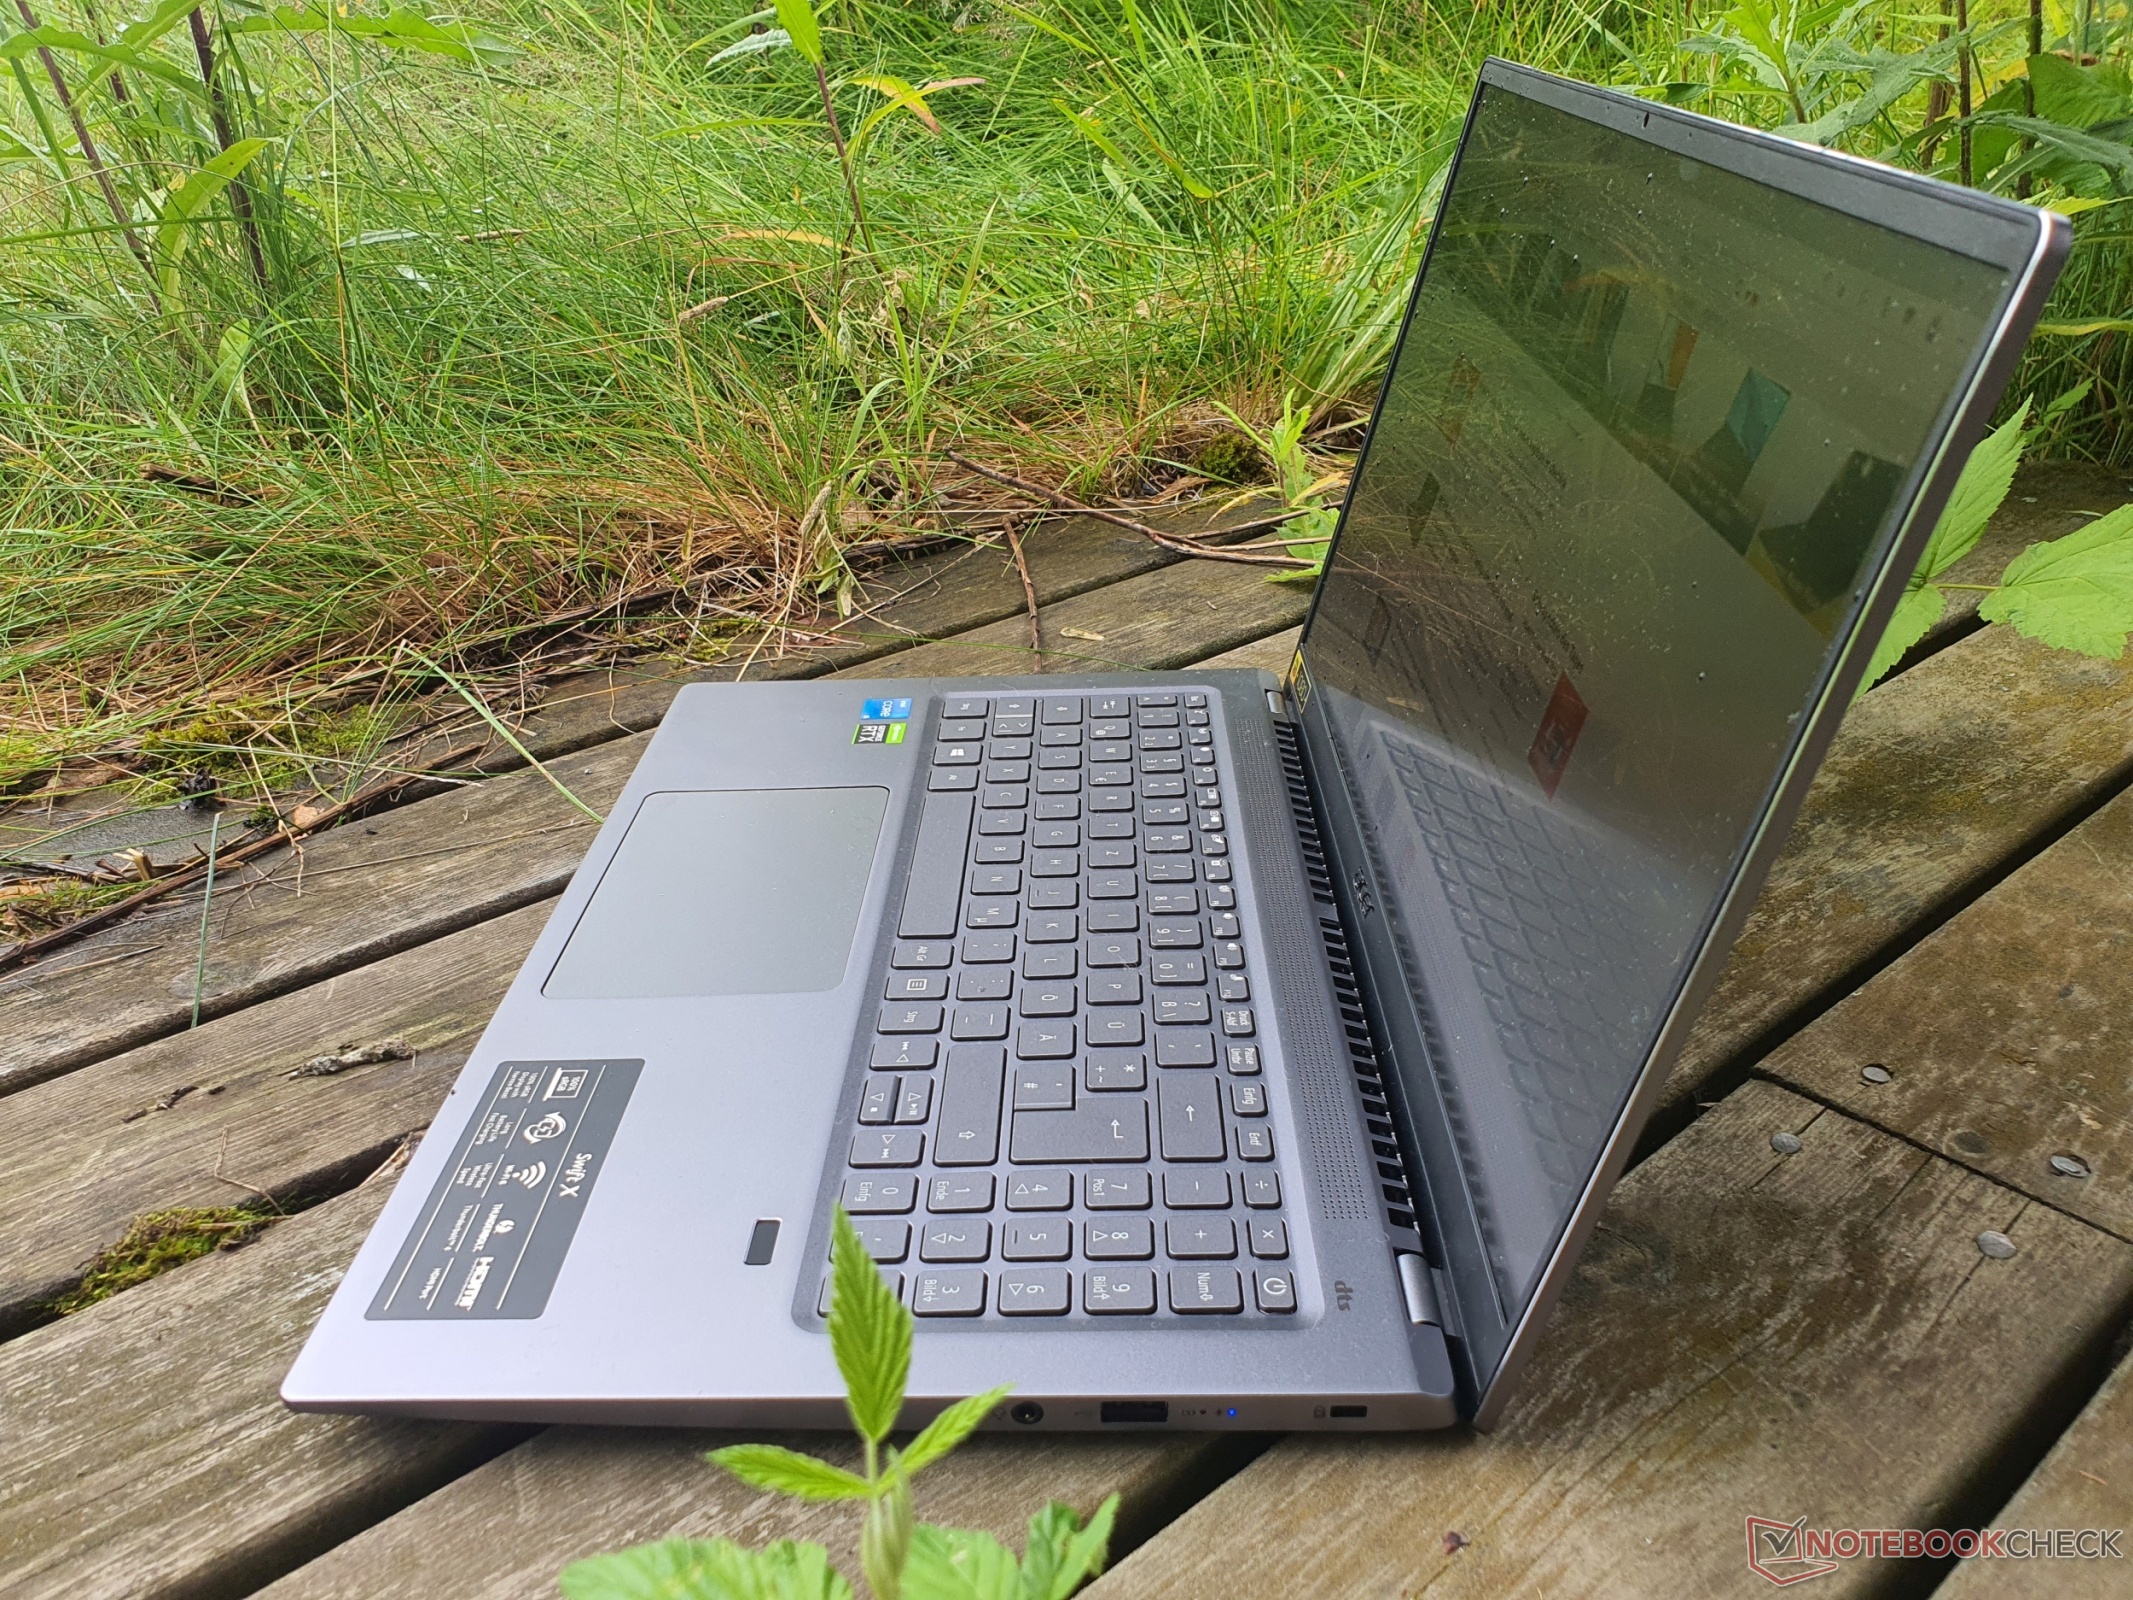
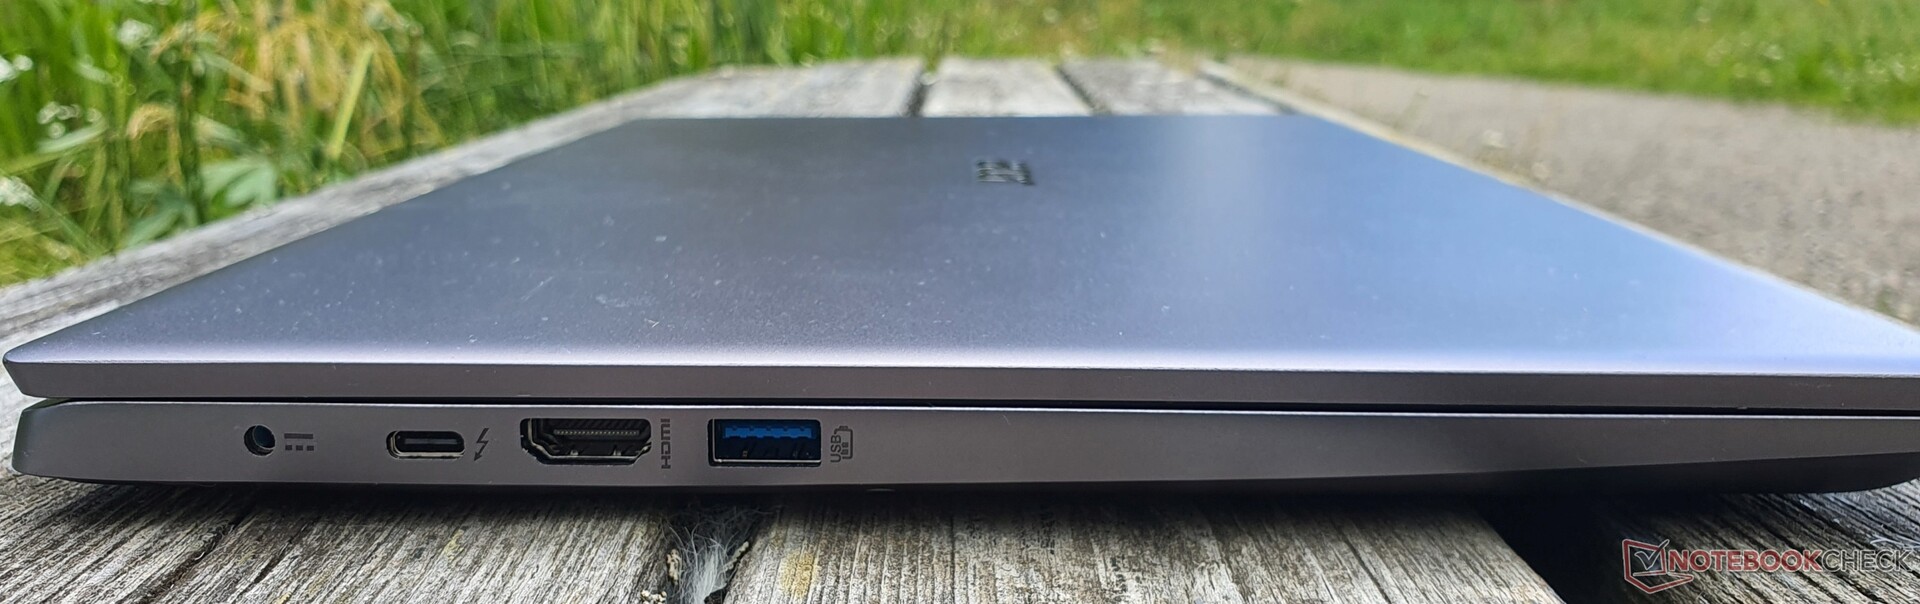
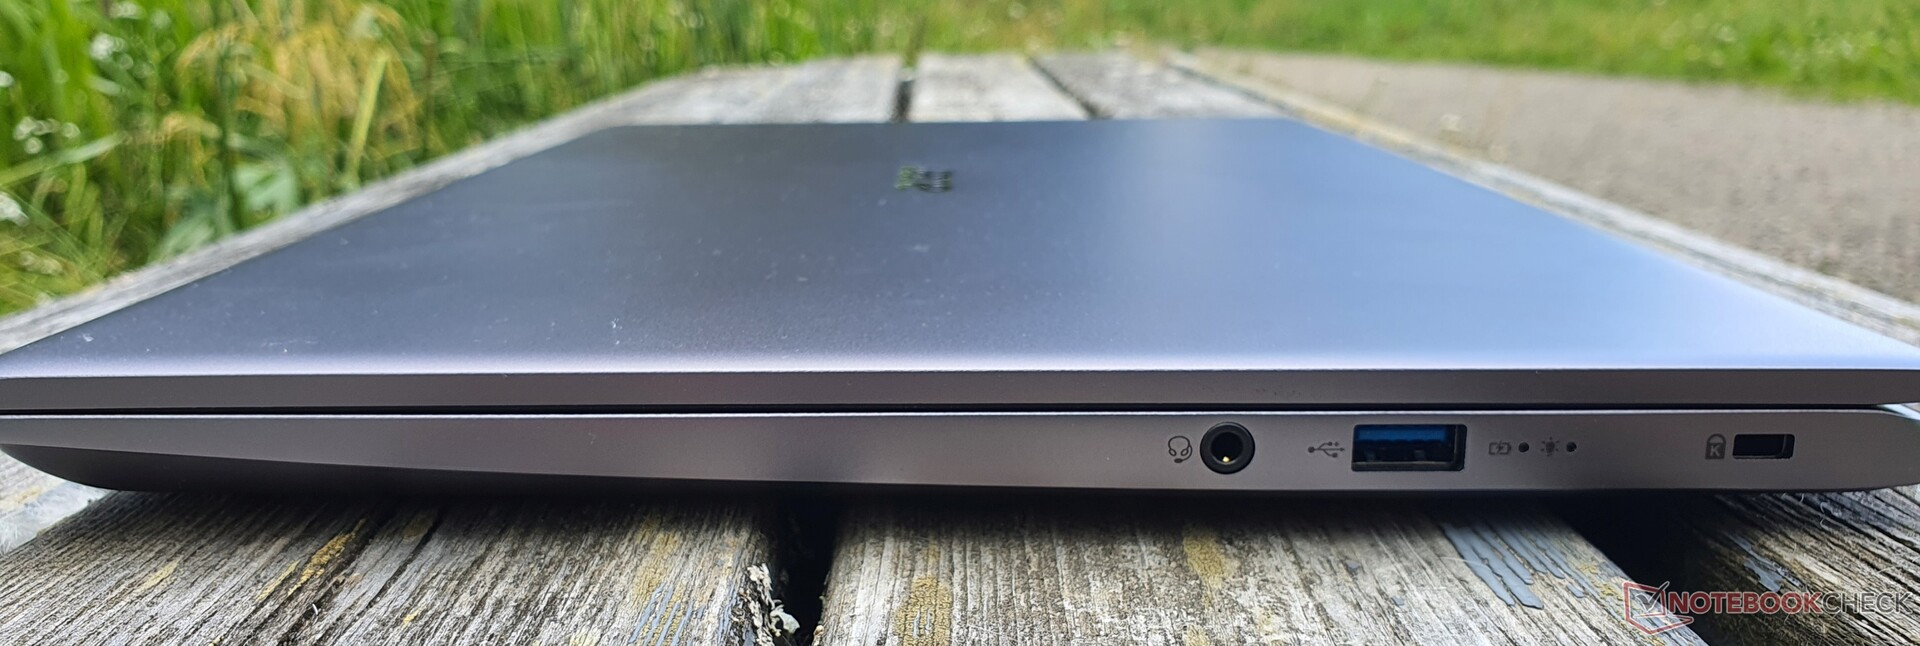
Equipment: Acer is "Swift" with Thunderbolt 4
The ports on the Acer Swift X are all sufficiently spaced so as not to block each other. An HDMI 2.0 port and DisplayPort 1.4 via Thunderbolt 4 are available for external displays.
There are also two USB-A 3.2 Gen1 ports, one on each side. An audio jack and a Kensington device are also on offer, but no SD card reader or LAN port. Charging takes place via a proprietary connection or USB-C.
Communication
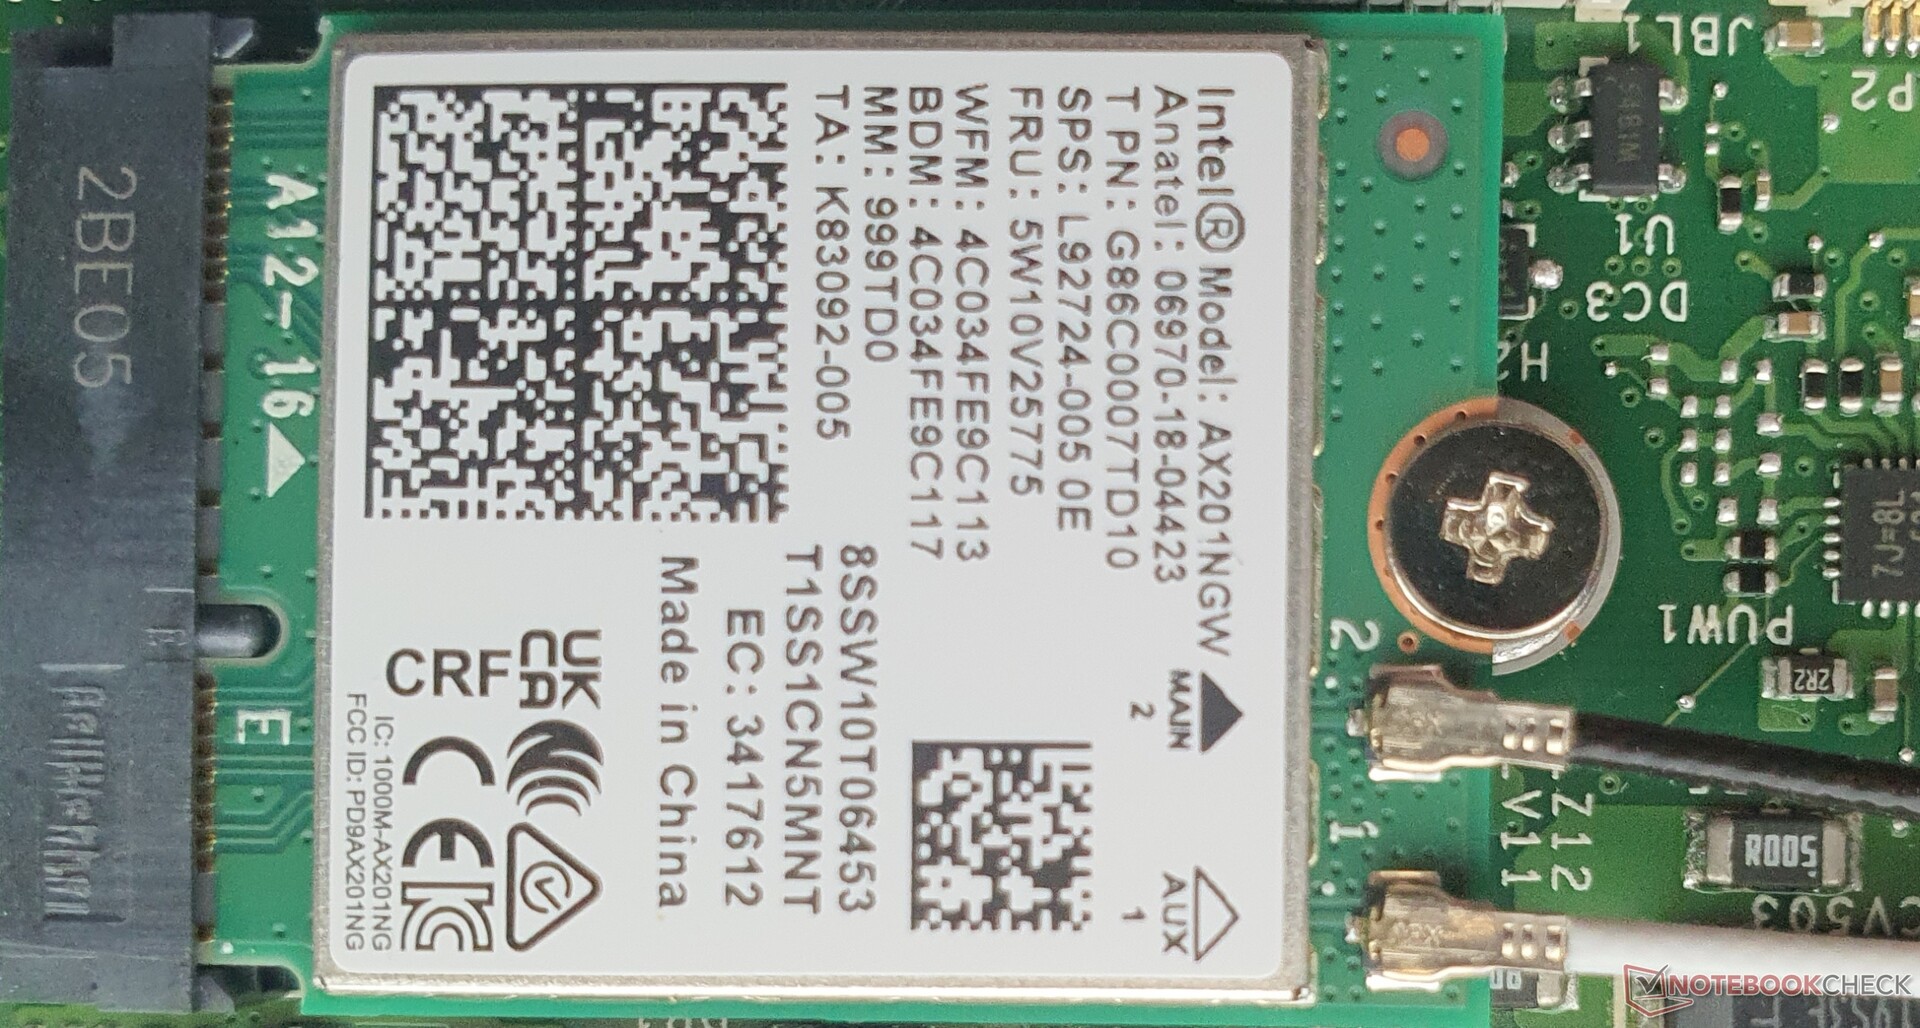
Thanks to the plugged-in Intel AX201 WiFi 6 module, transfer speeds are at a very good level. Only Huawei's Matebook 16 is somewhat faster in terms of sending. Bluetooth 5.0 is included, but there are no options for WWAN and NFC.
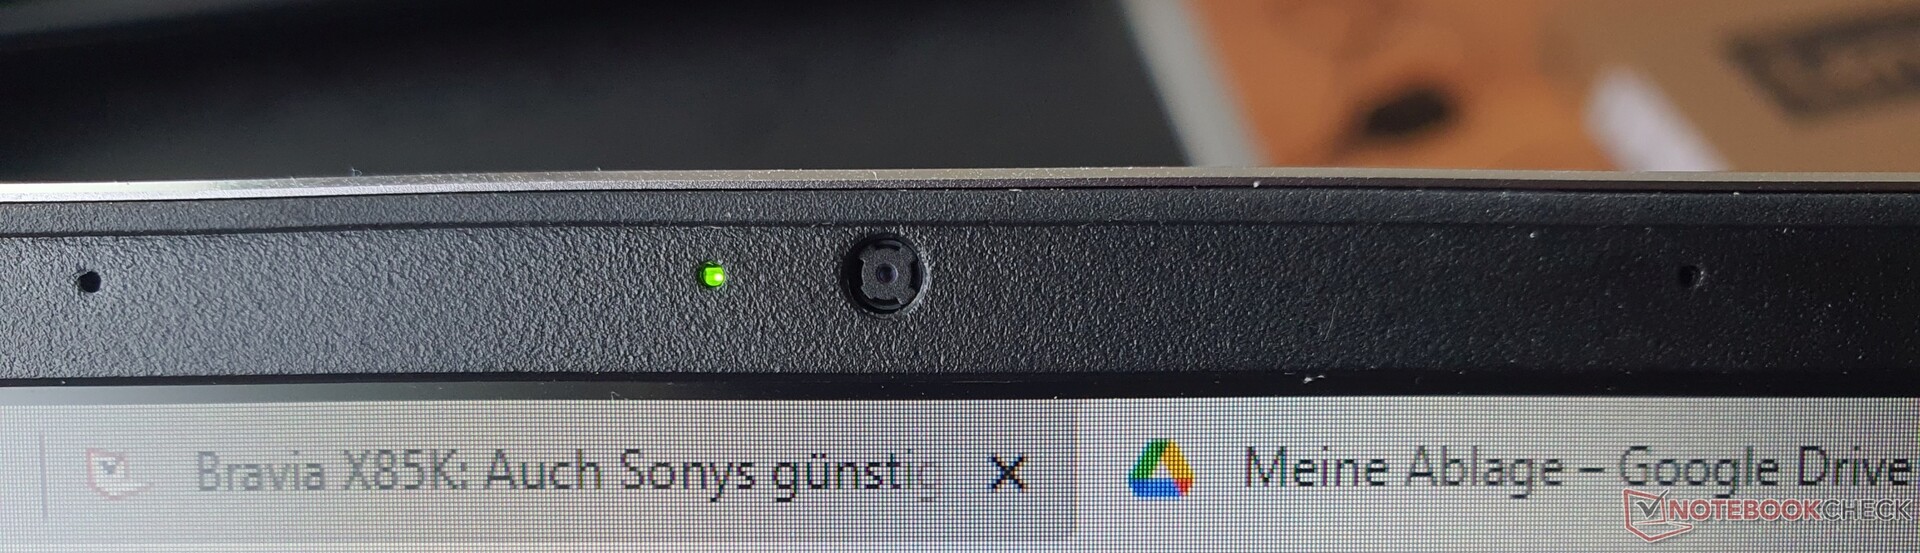
Webcam

As is often the case, the quality of the built-in 720p webcam (1,280 x 720) leaves much to be desired: the image is noisy, blurred and washed out. The DeltaE values (10.4 on average) provide average color accuracy at best. There is no webcam aperture or IR for Windows Hello, but there are dual-array microphones with noise reduction.


Security
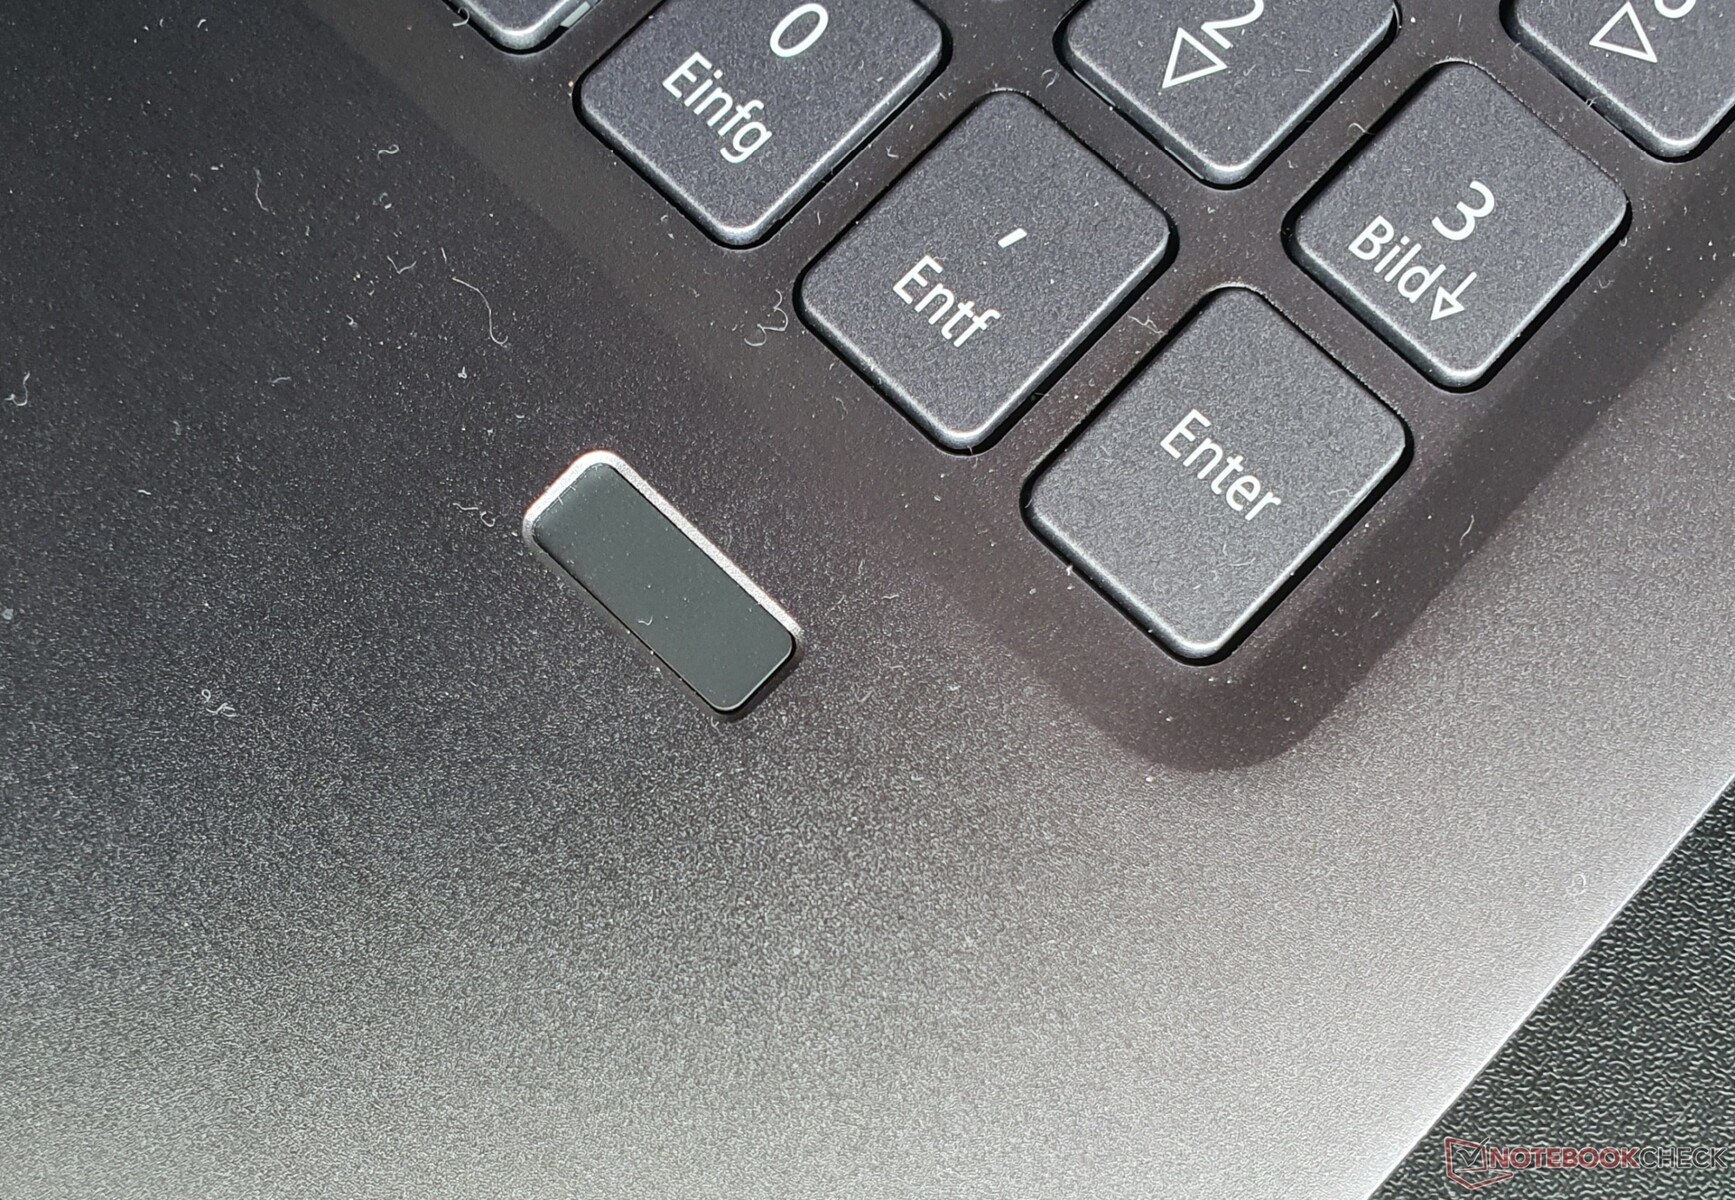
In addition to the TPM 2.0 security chip, there is a Kensington lock device (nano) and a fingerprint reader that does its job quickly and reliably with a simple touch of the finger.
Accessories
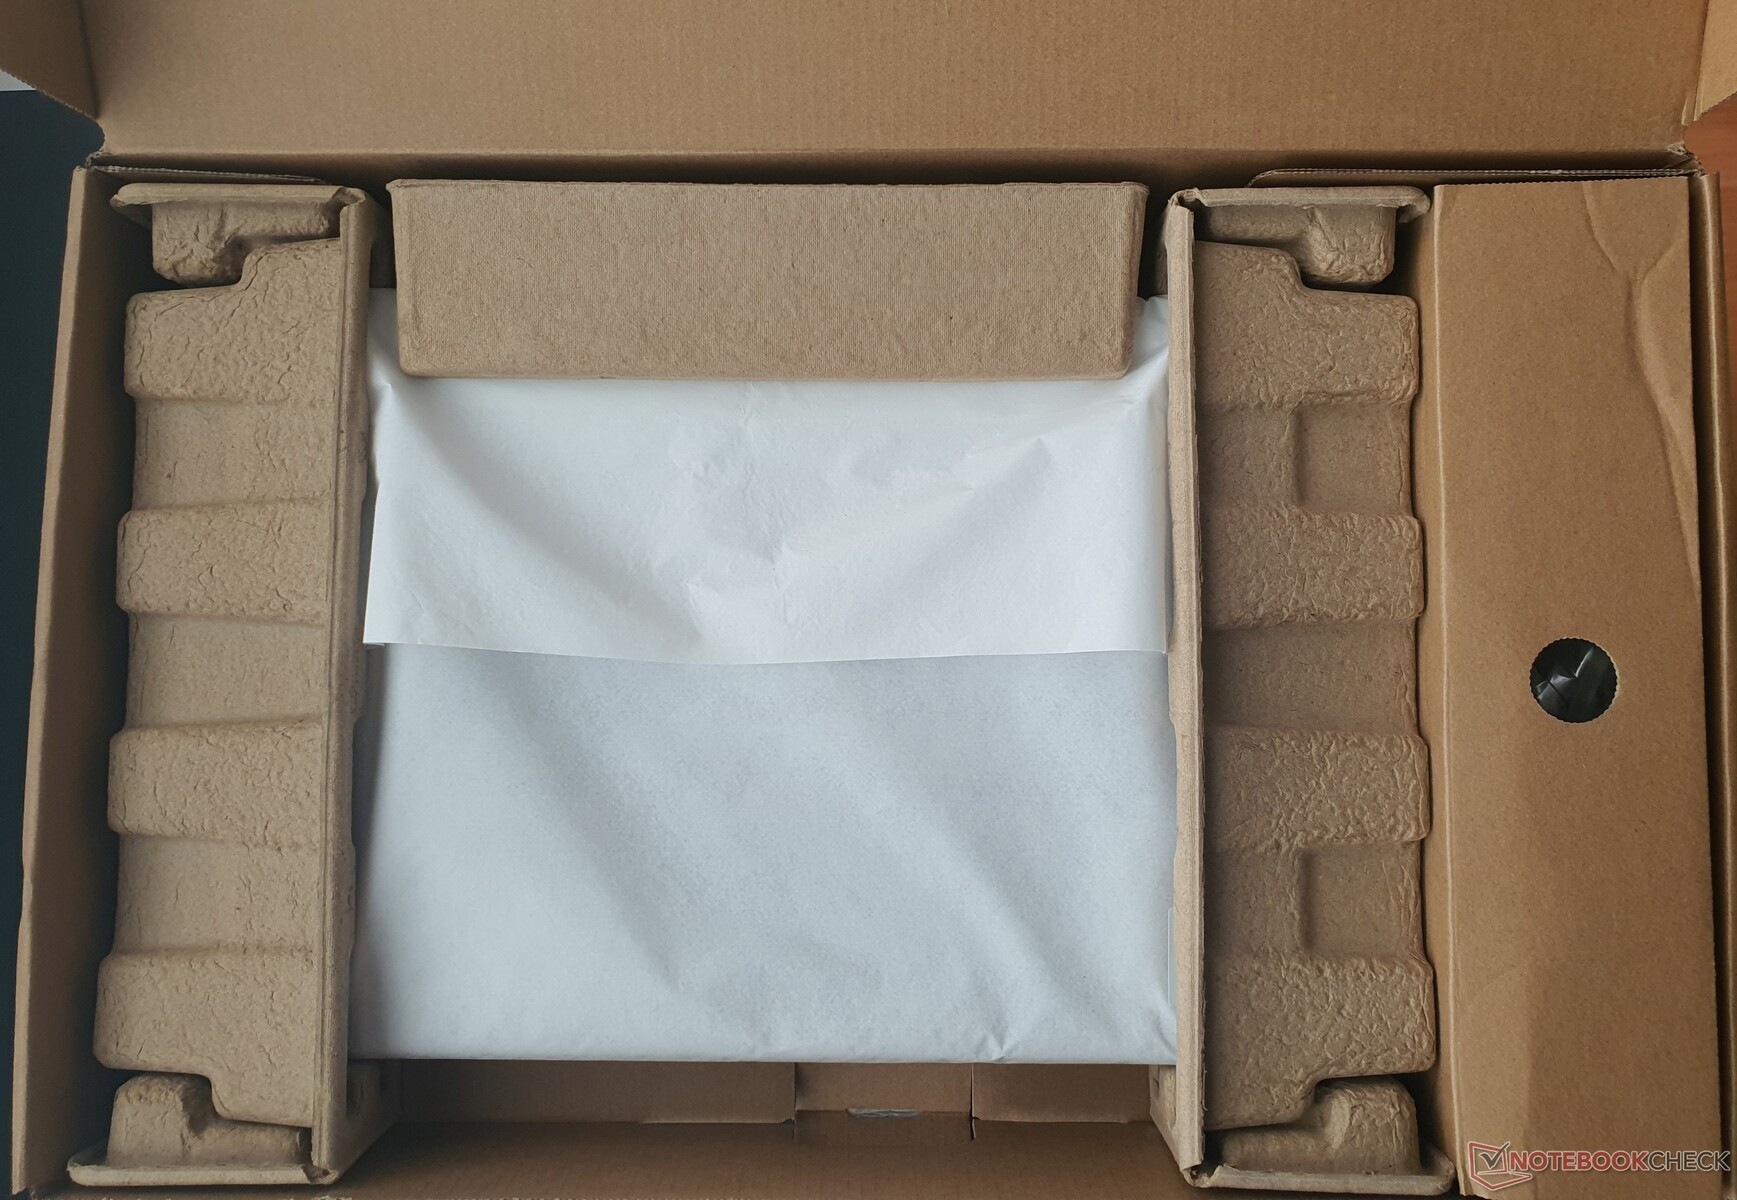
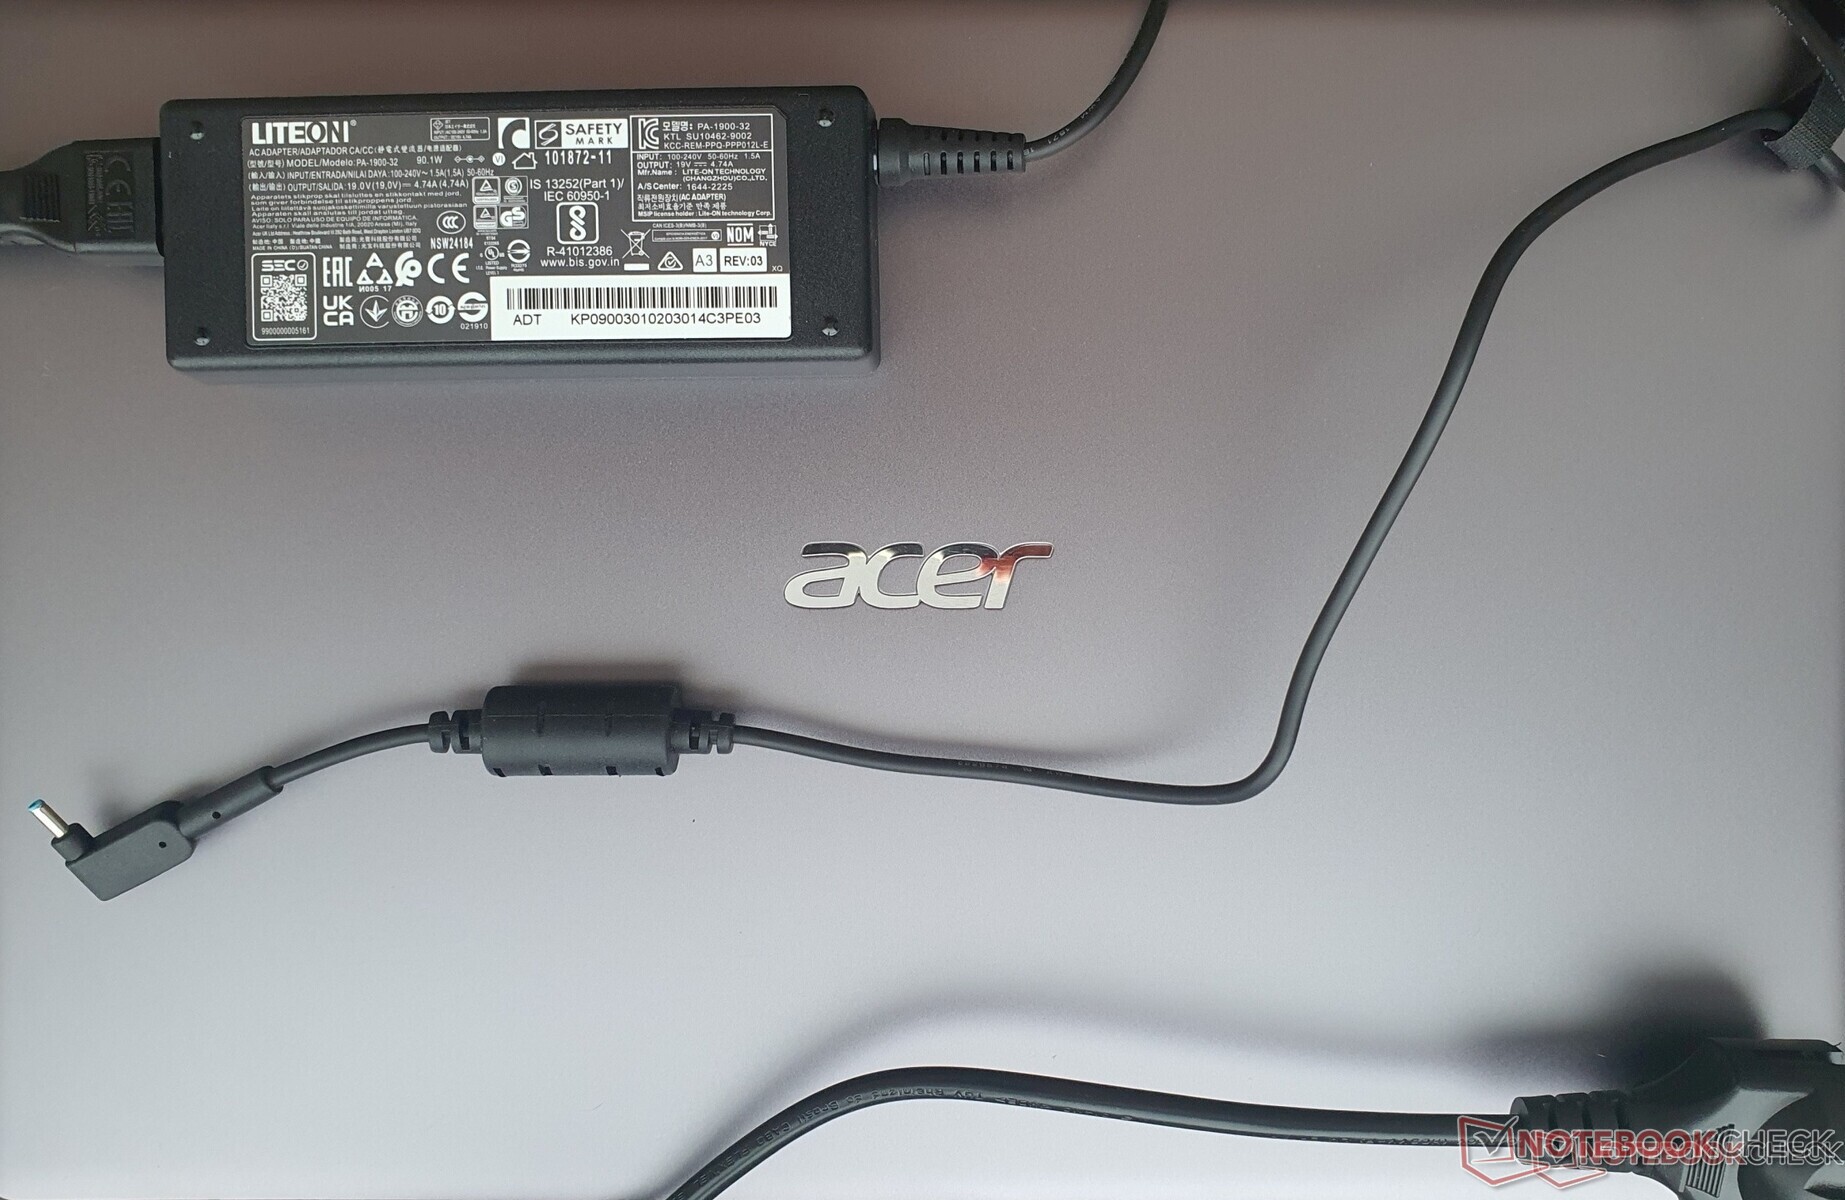
No accessories are included, apart from the 90-watt LiteON brand power supply that is needed for the Nvidia GPU. Acer is set on environmentally friendly packaging for the Swift X - very little plastic is used.
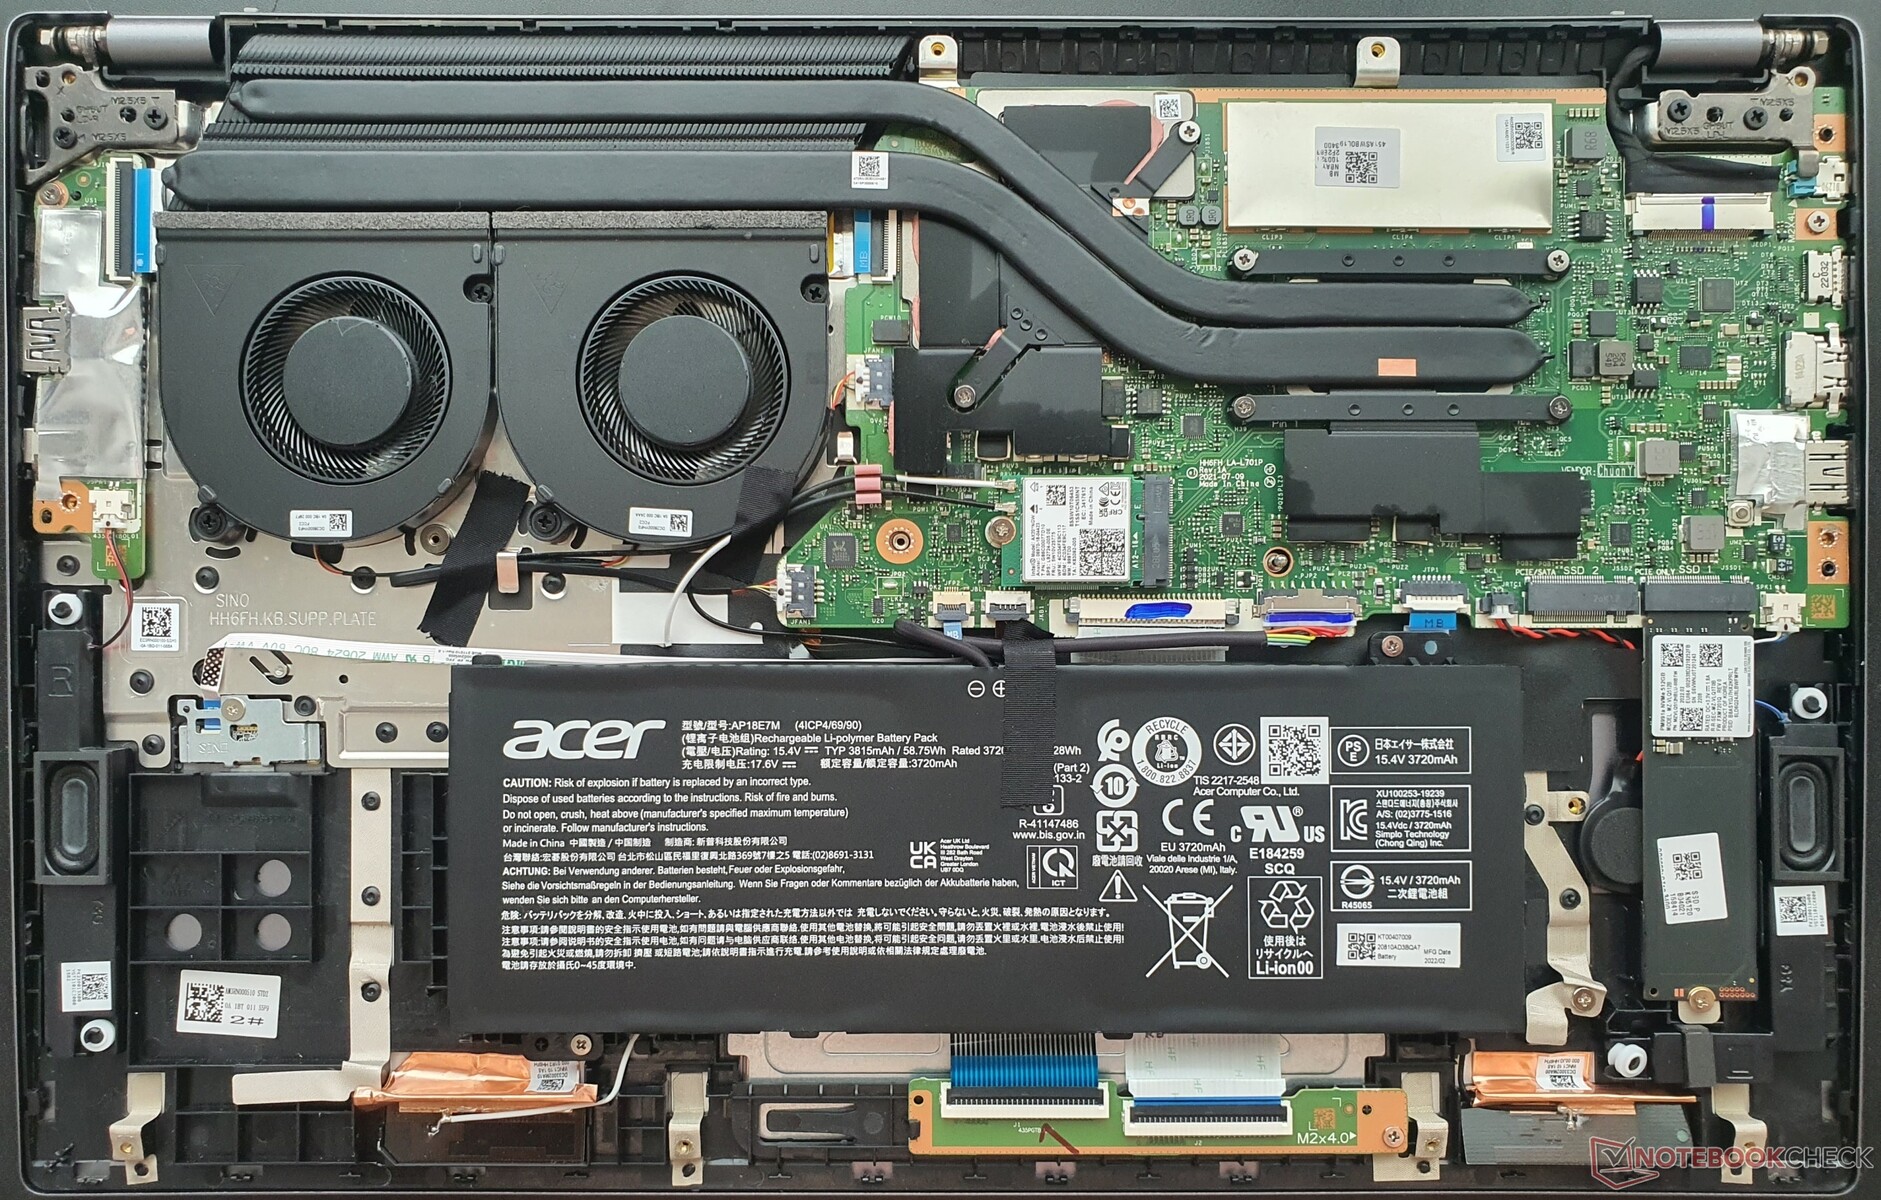
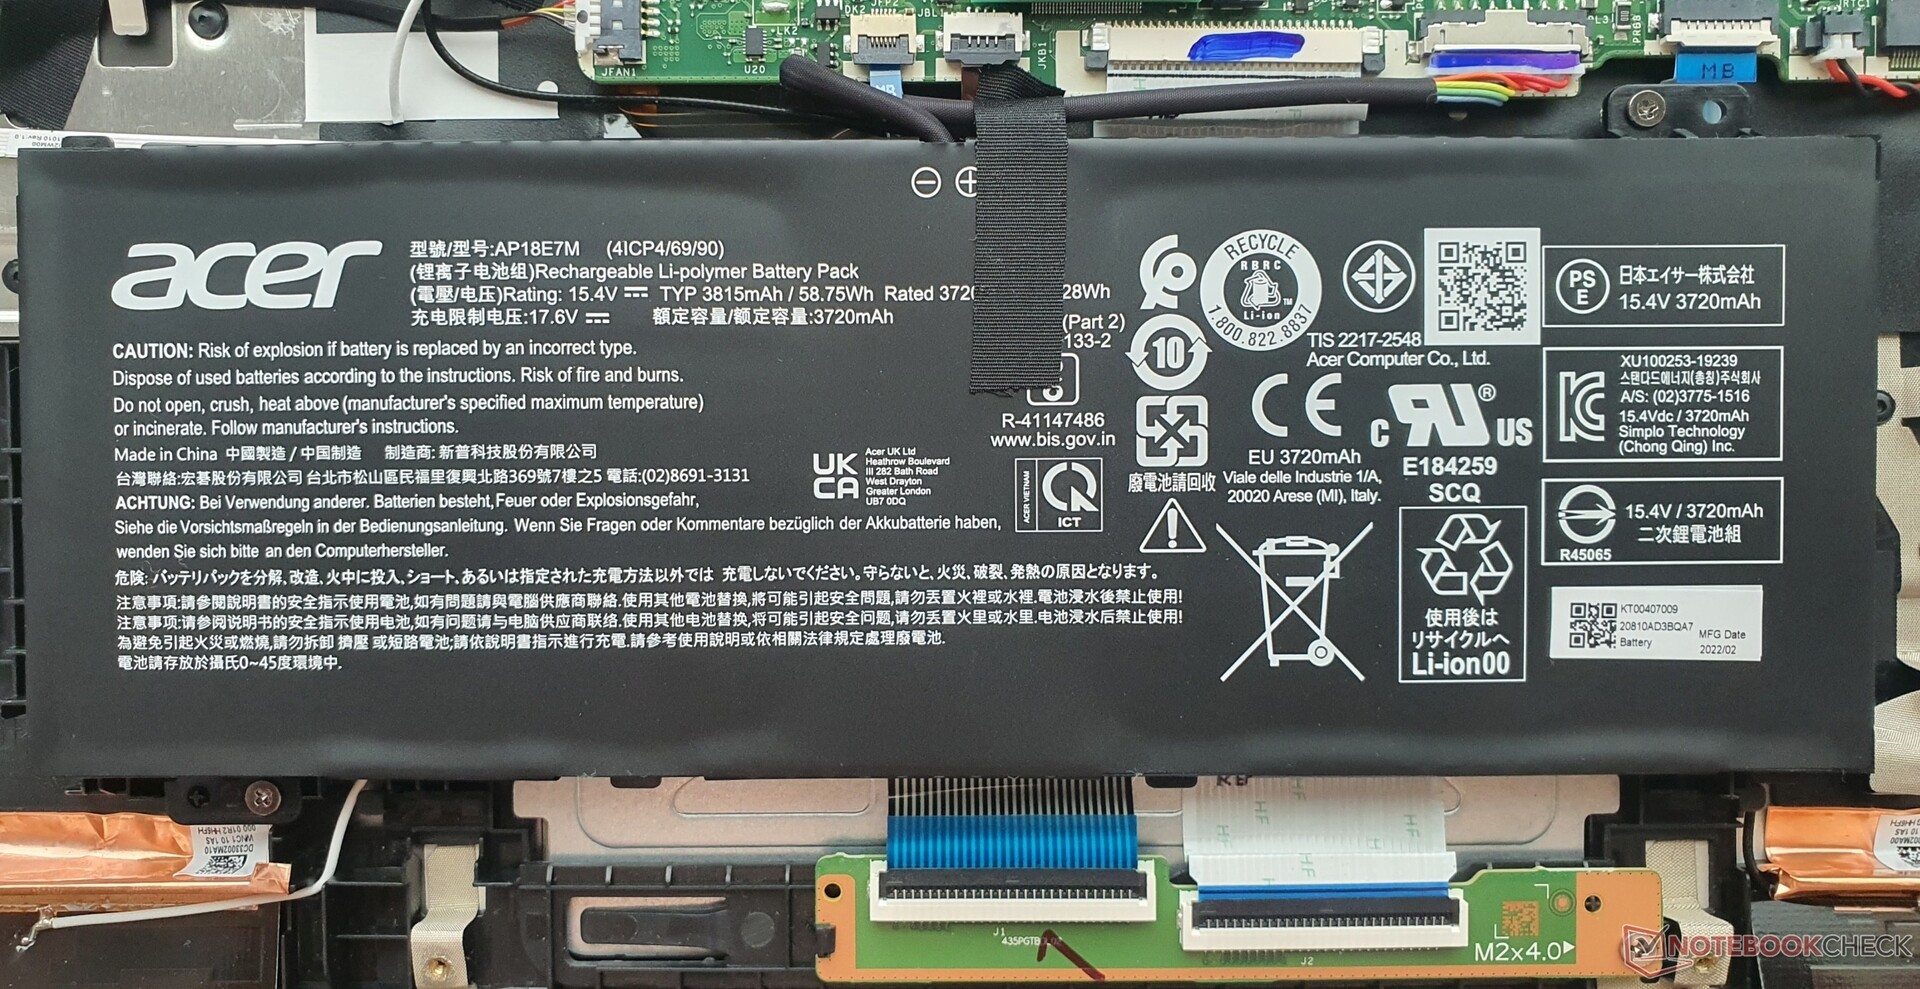
Maintenance
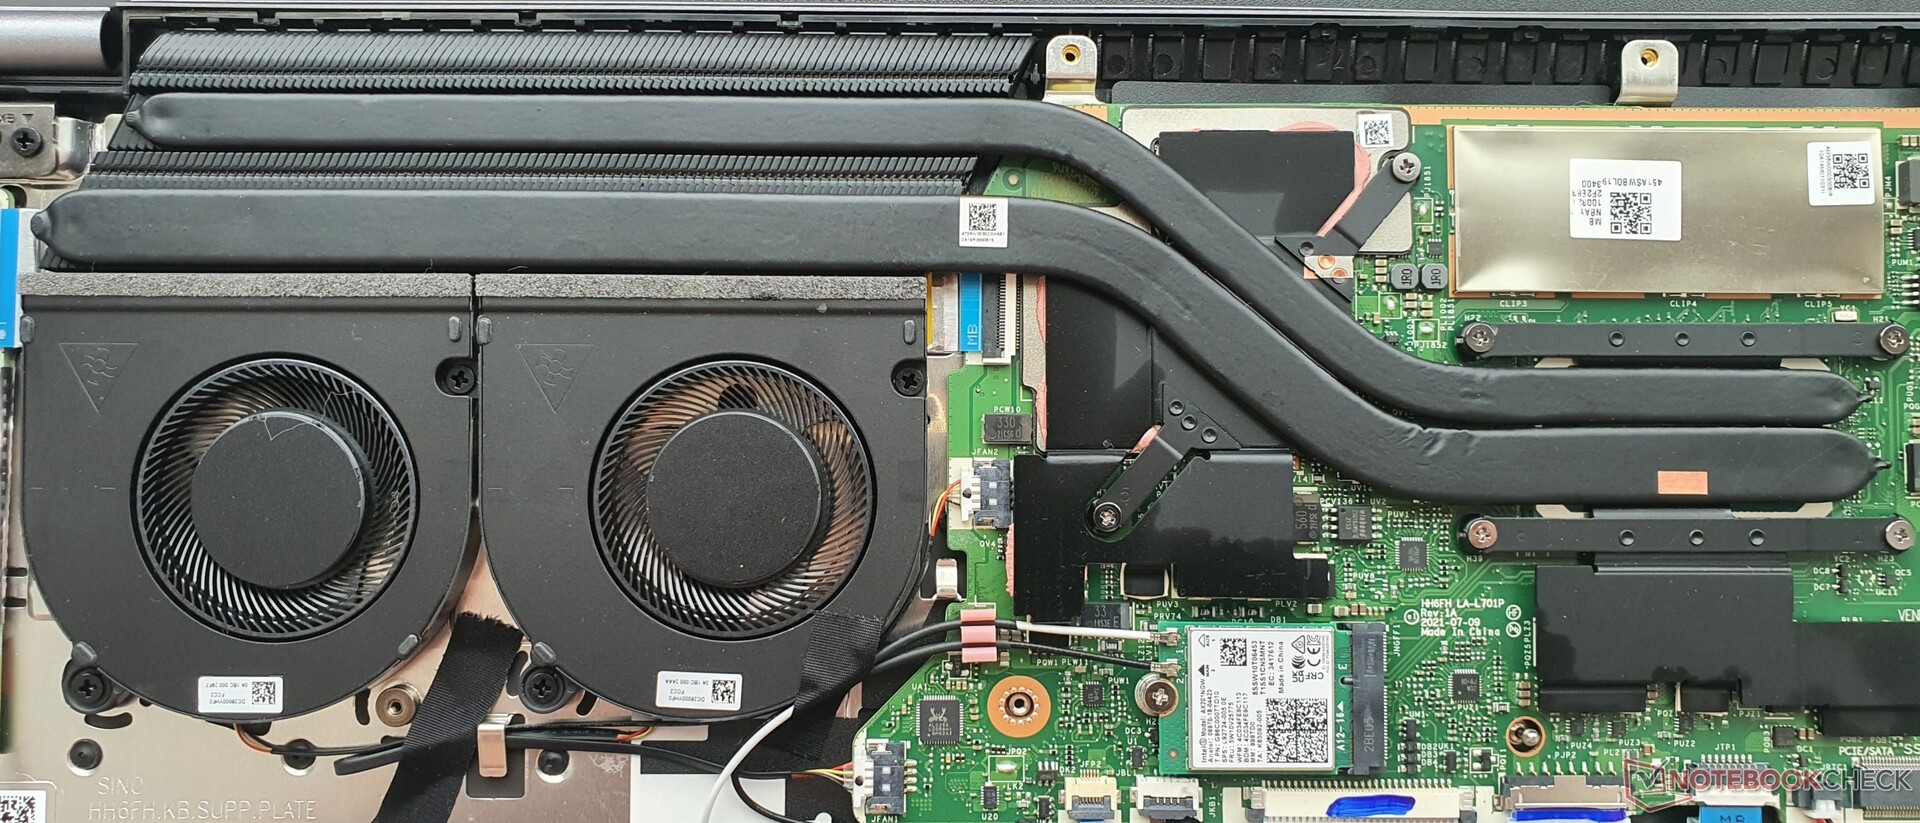
After loosening 12 small Torx screws, the baseplate can be easily removed with the help of a flat plastic spatula. The RAM is completely soldered, but there are two M.2-2280 slots. The WLAN module and screwed battery are replaceable, and the fans can be cleaned.
Warranty
In most countries, Acer offers a 1-year limited warranty on its laptops. This may vary, so be sure to check with your supplier before purchase.
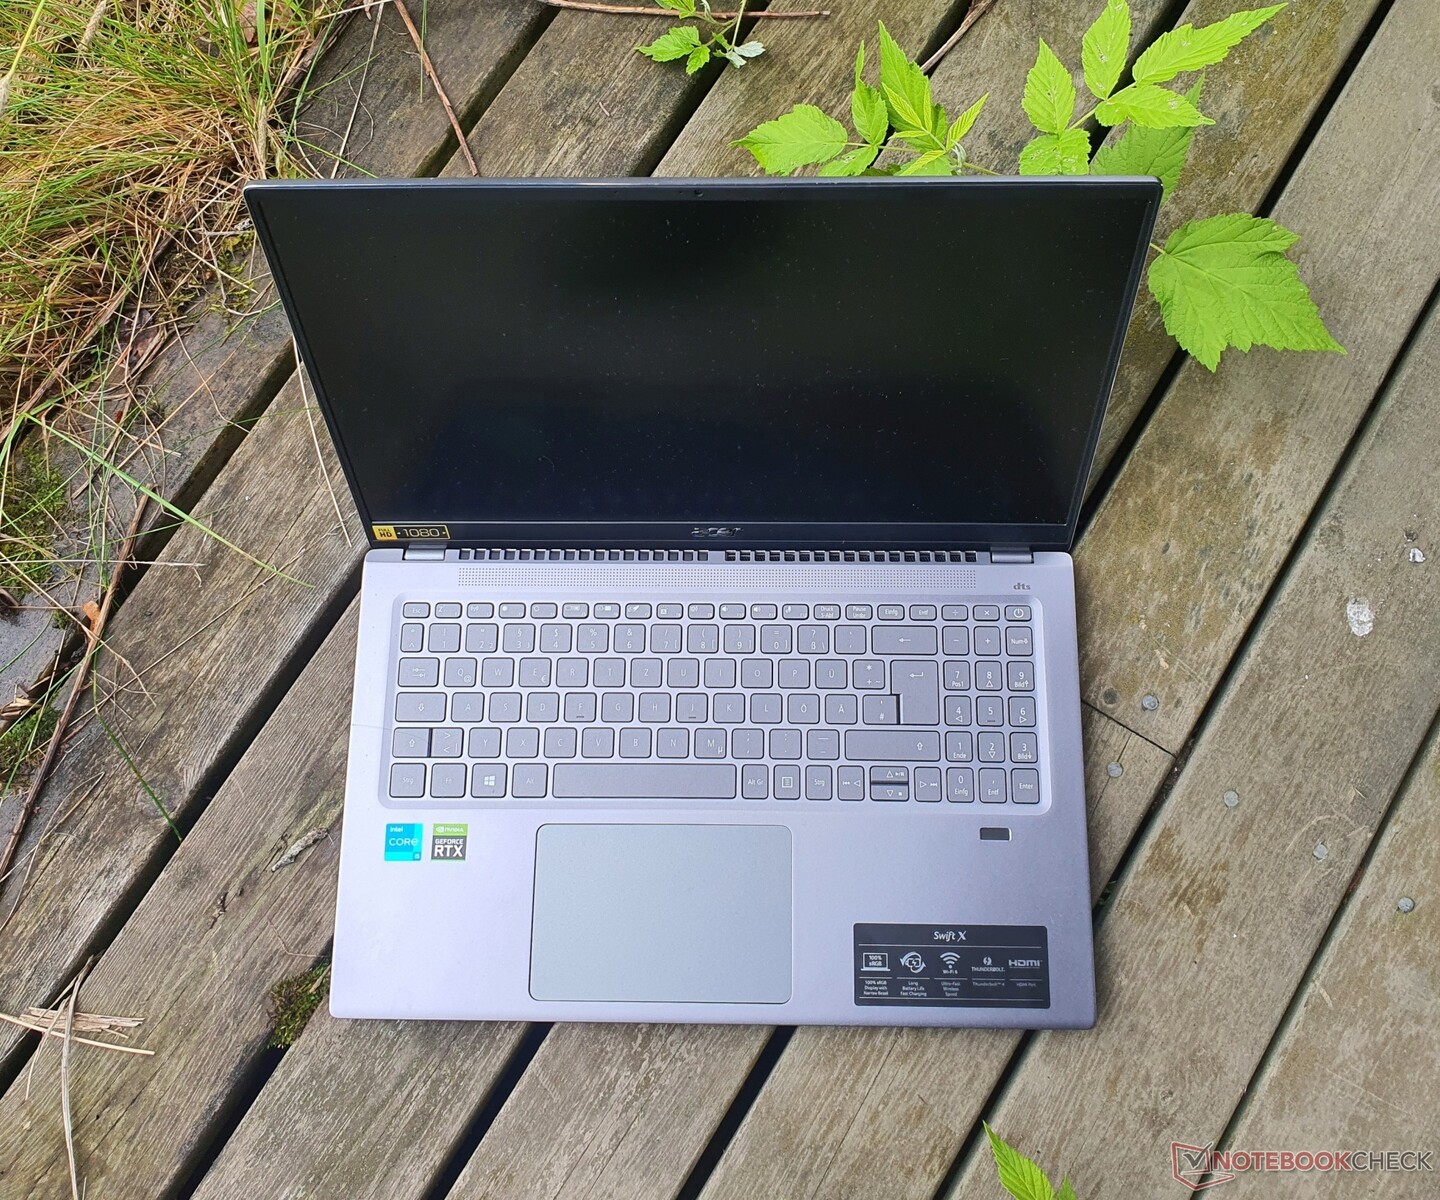
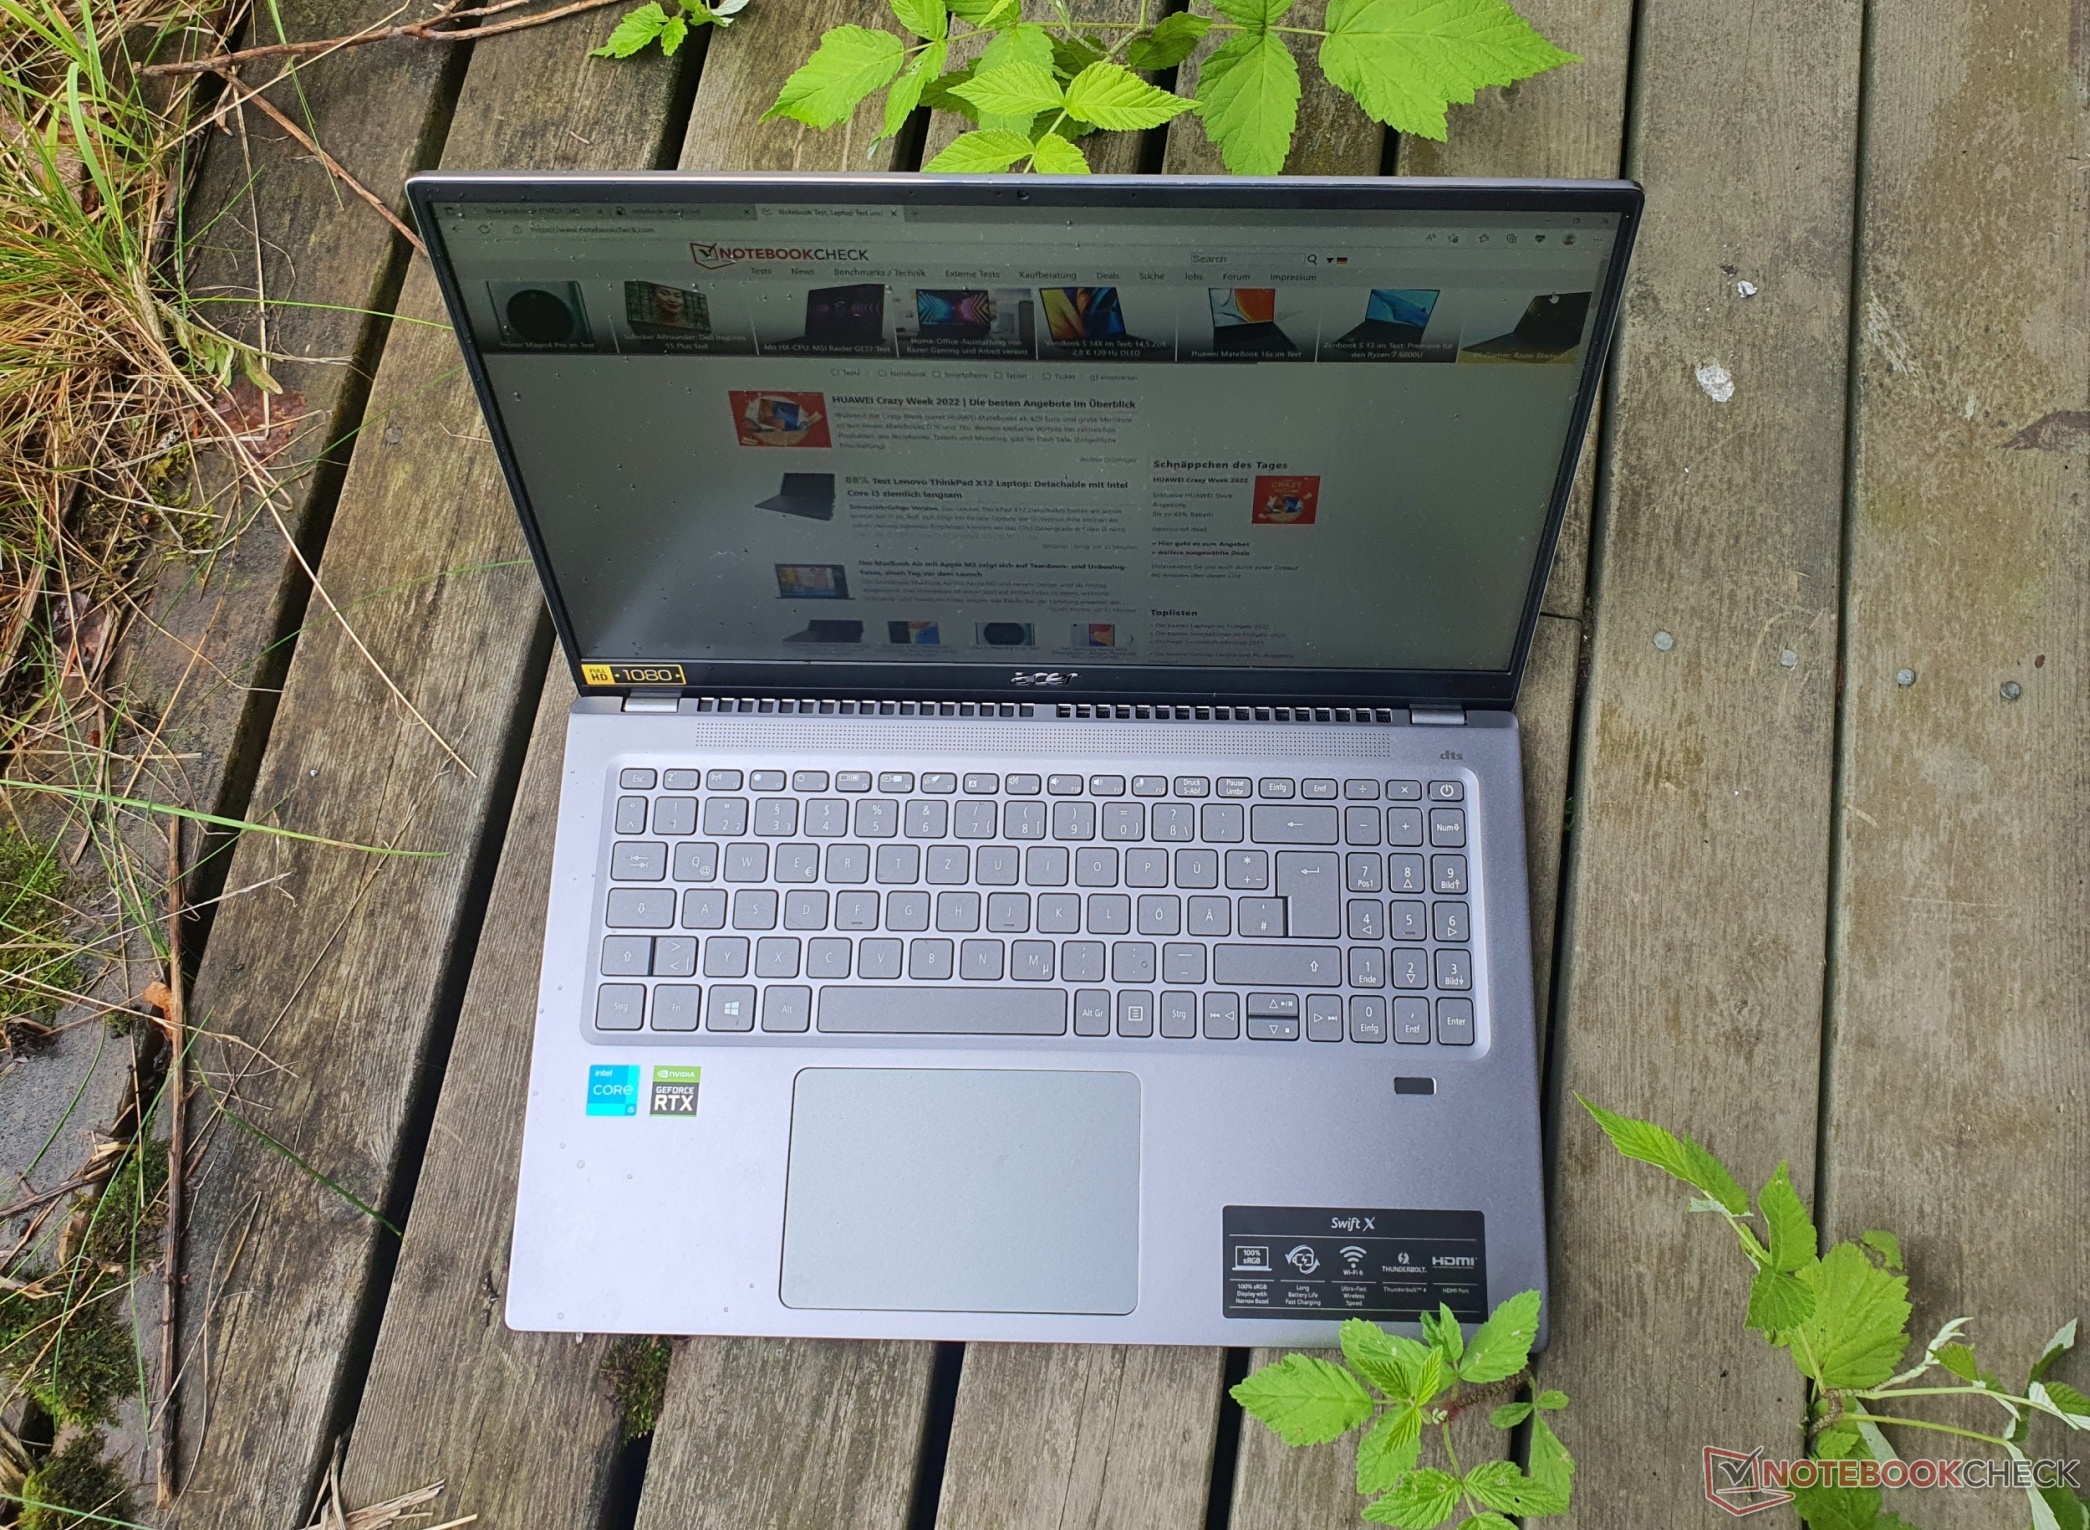
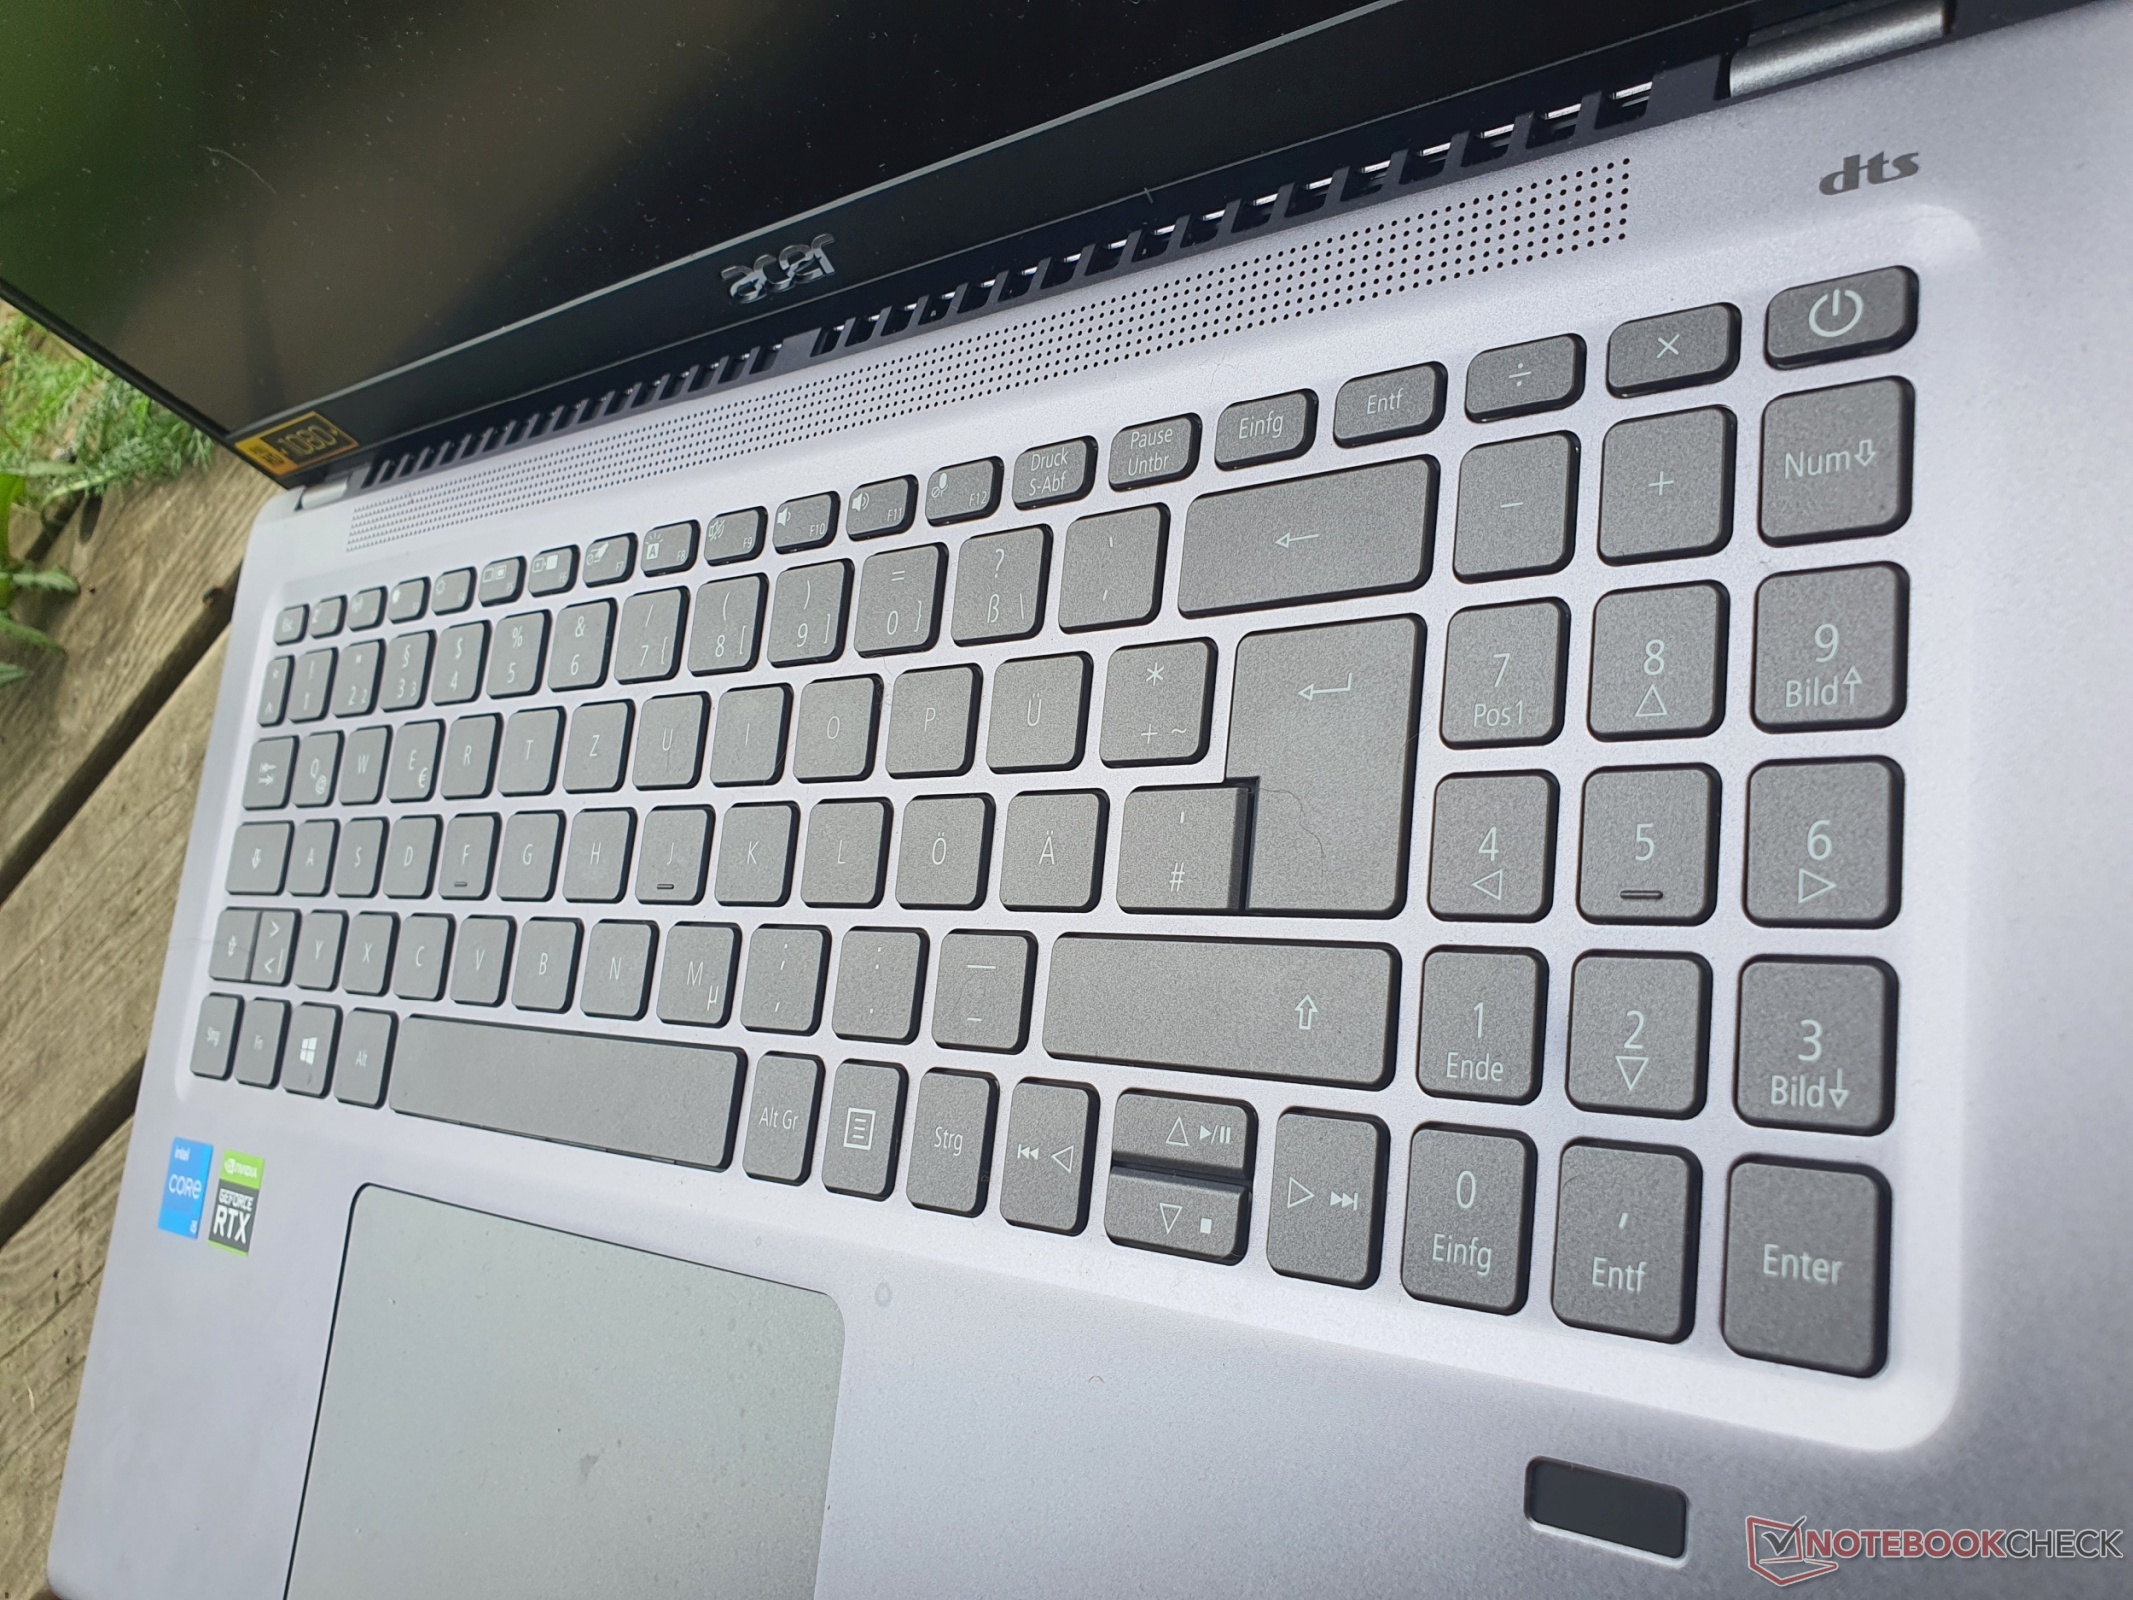
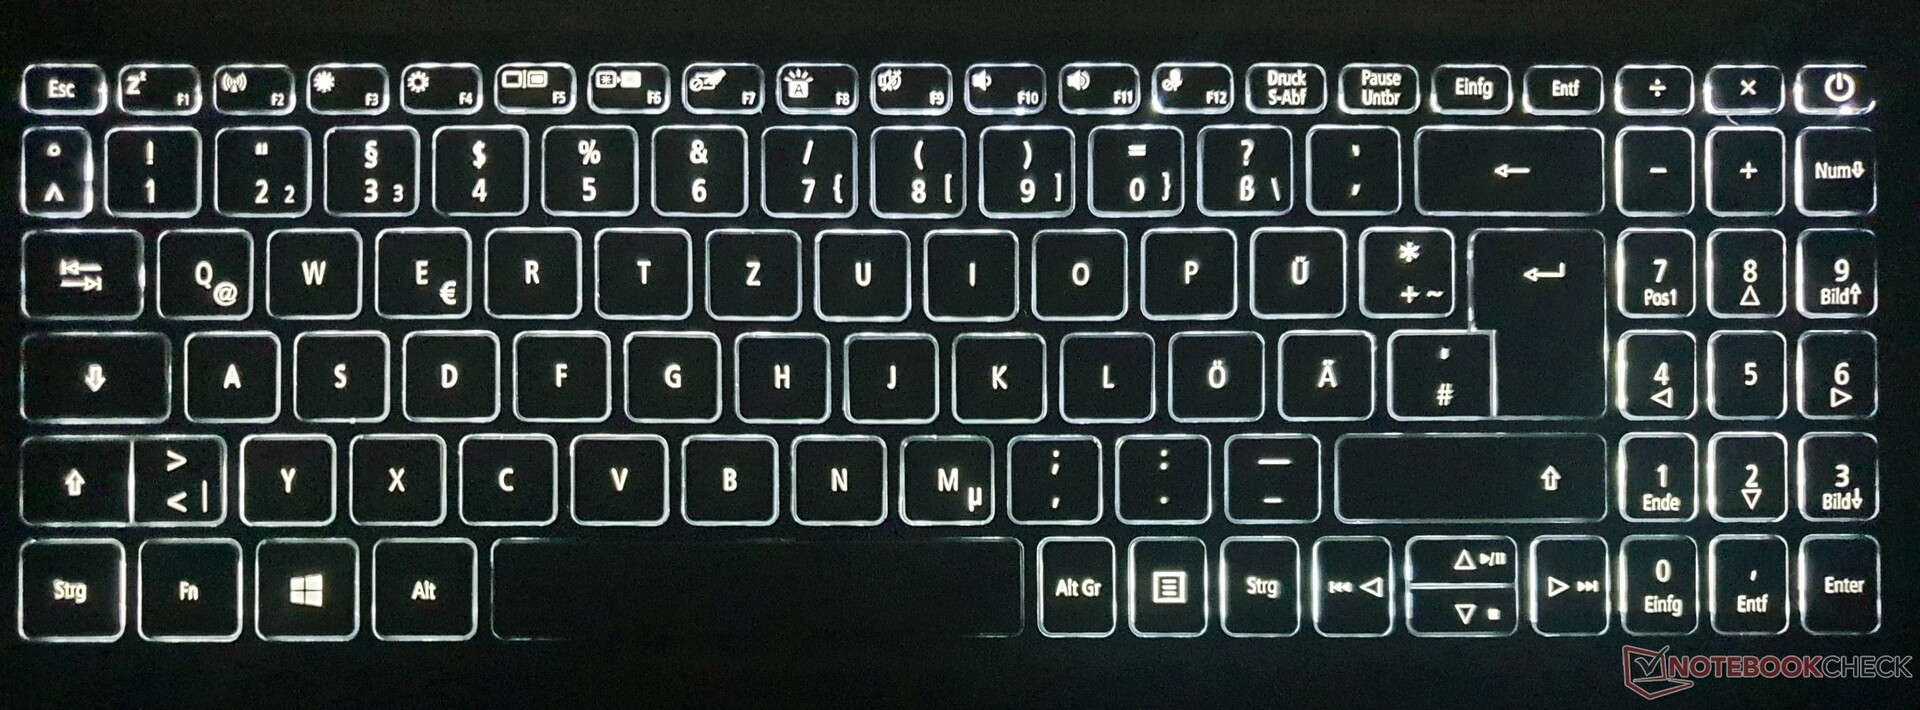
Input devices: Fast typing on backlit keyboard
Keyboard
The keys of the Swift X are a little smaller, especially the top row, the NumPad and the vertical arrow keys. Key travel is short, the pressure point well dosed and the resistance clear. Overall, fast typing is possible on the single-level backlit Acer keyboard, which also does its work pleasantly quietly.
The layout is good, with double assignments for "Pos1/End" and some multimedia functions (play, pause, rewind). The keyboard yields slightly under pressure, but this is not an issue when typing.
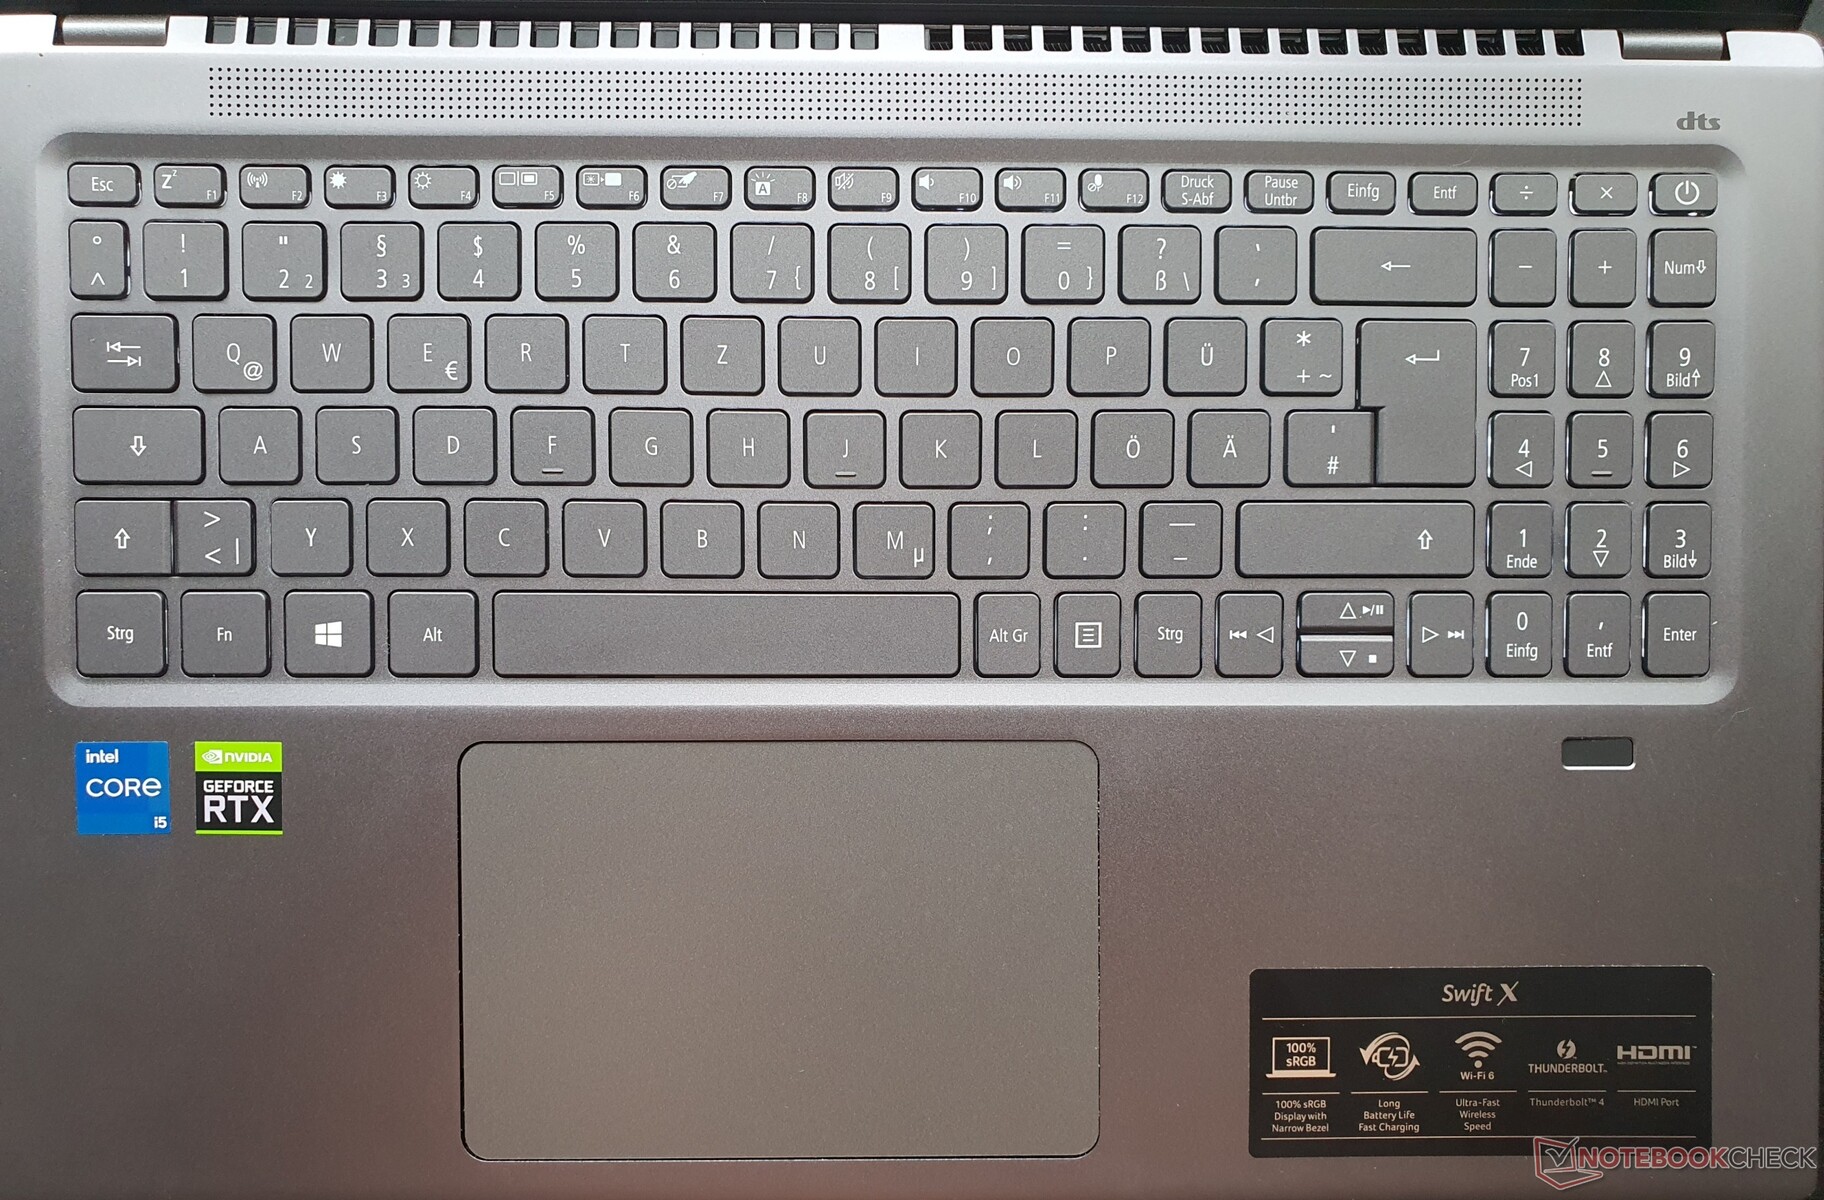
Touchpad
The clickpad measures a large 12.5 x 8 cm and gliding the mouse pointer is child's play on the smooth surface. The integrated buttons in the lower touchpad area have a short travel, require more force than usual to click and provide moderate feedback (for the reviewer's taste).
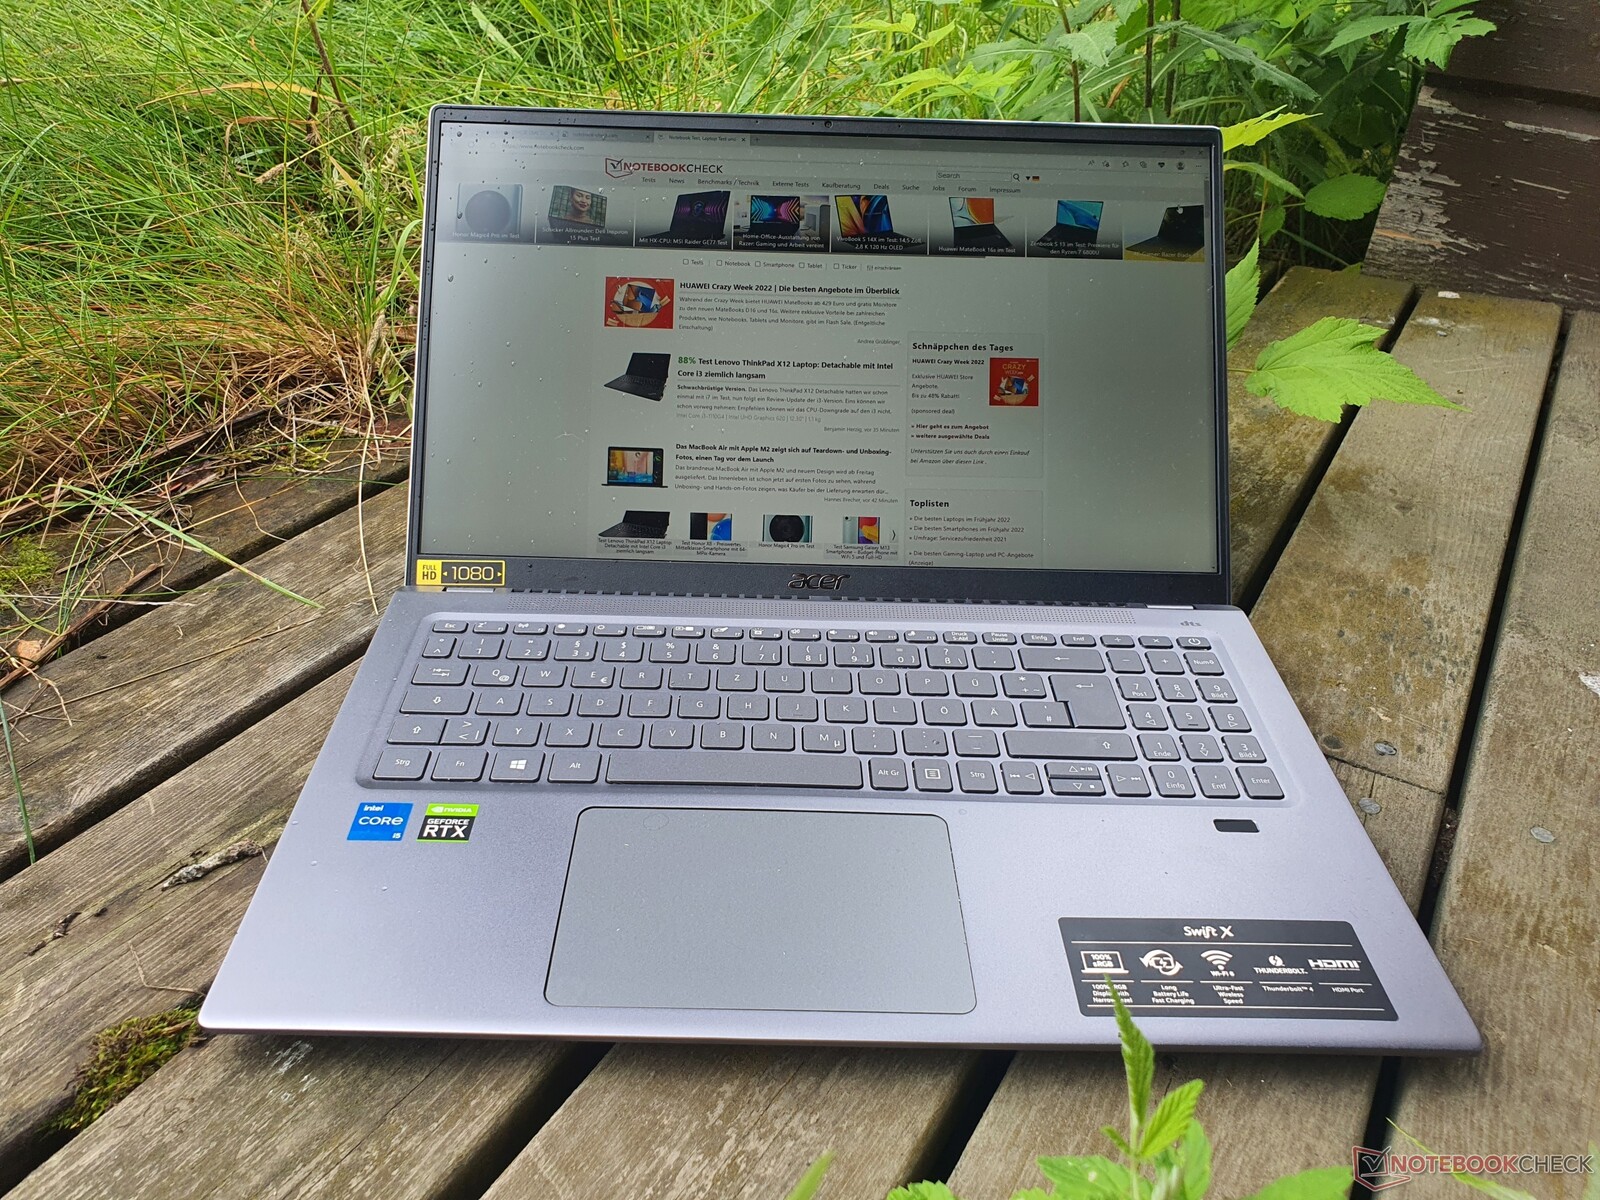
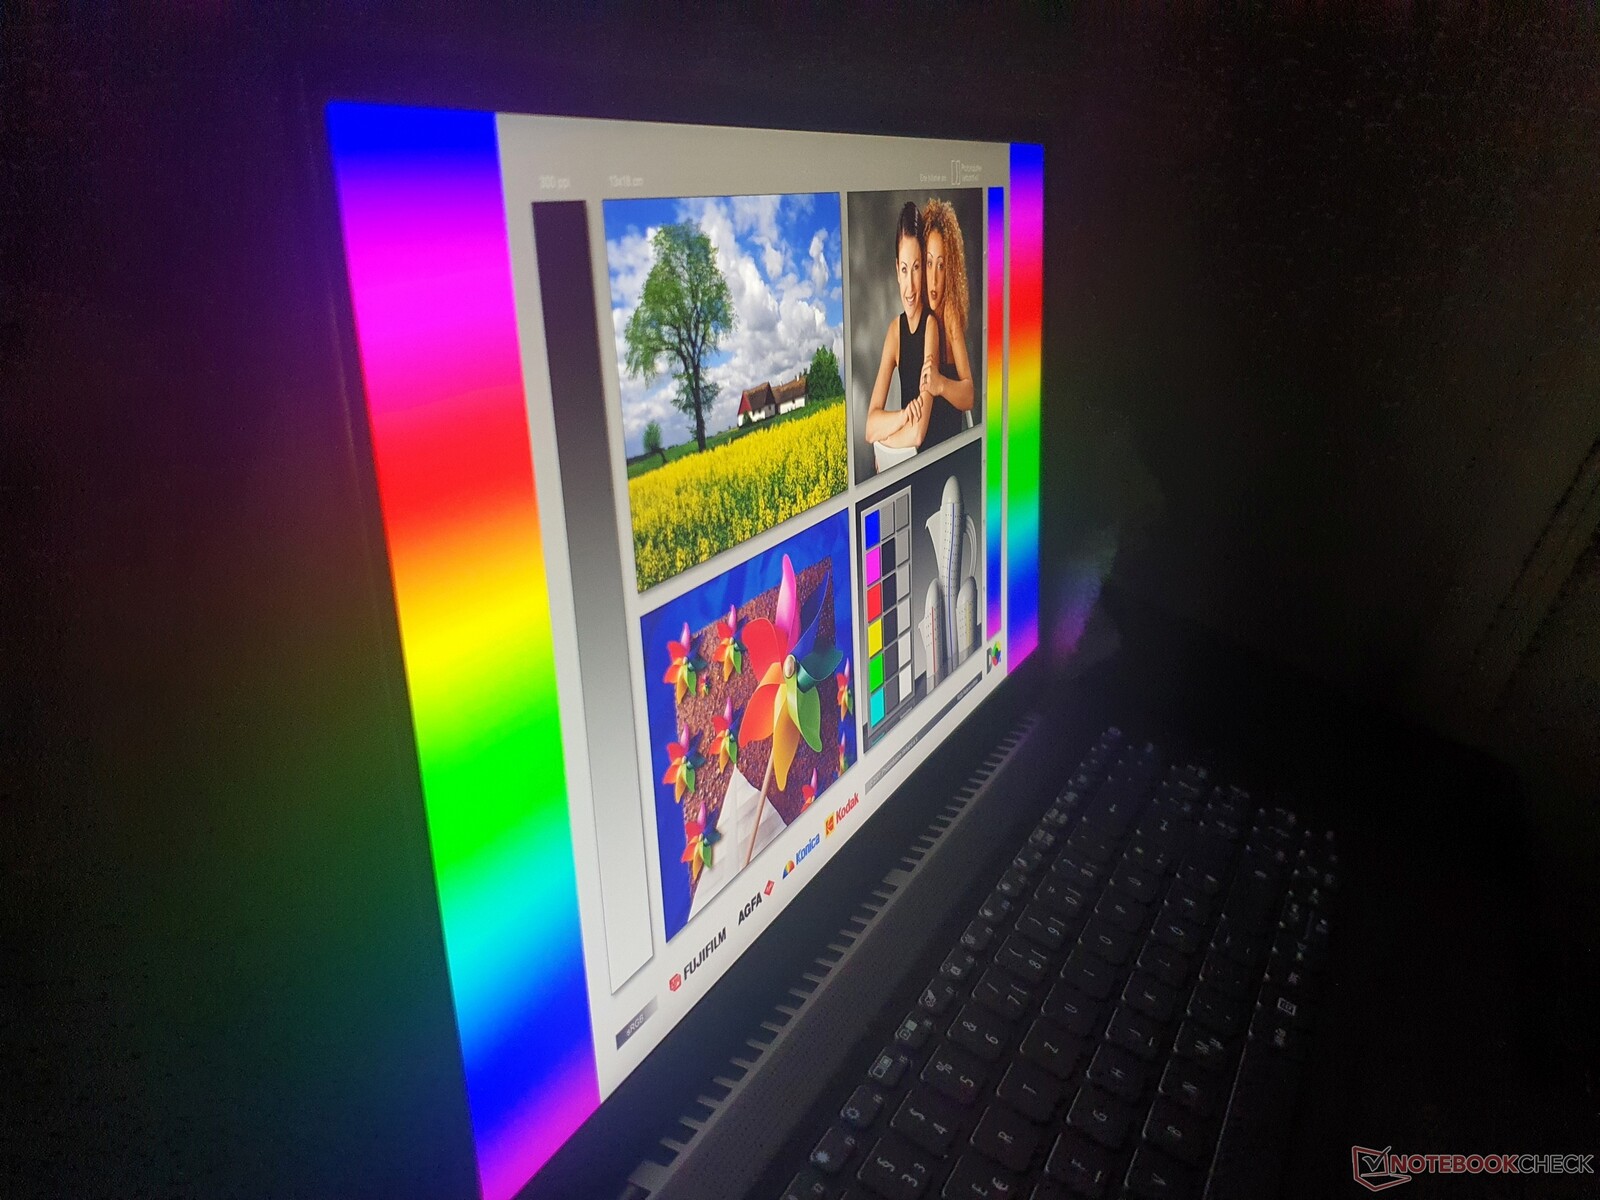
Display: Acer promises 100% sRGB for the Swift X 16

The matte display of the Acer Swift X measures 16.1 inches, but retains the 16:9 format (good for media, less suitable for office tasks), while the competition often uses 16:10. The resolution of 1,920 x 1,080 pixels is fine on 16 inches, which means the Windows scaling can remain at 100% (optimal image sharpness).
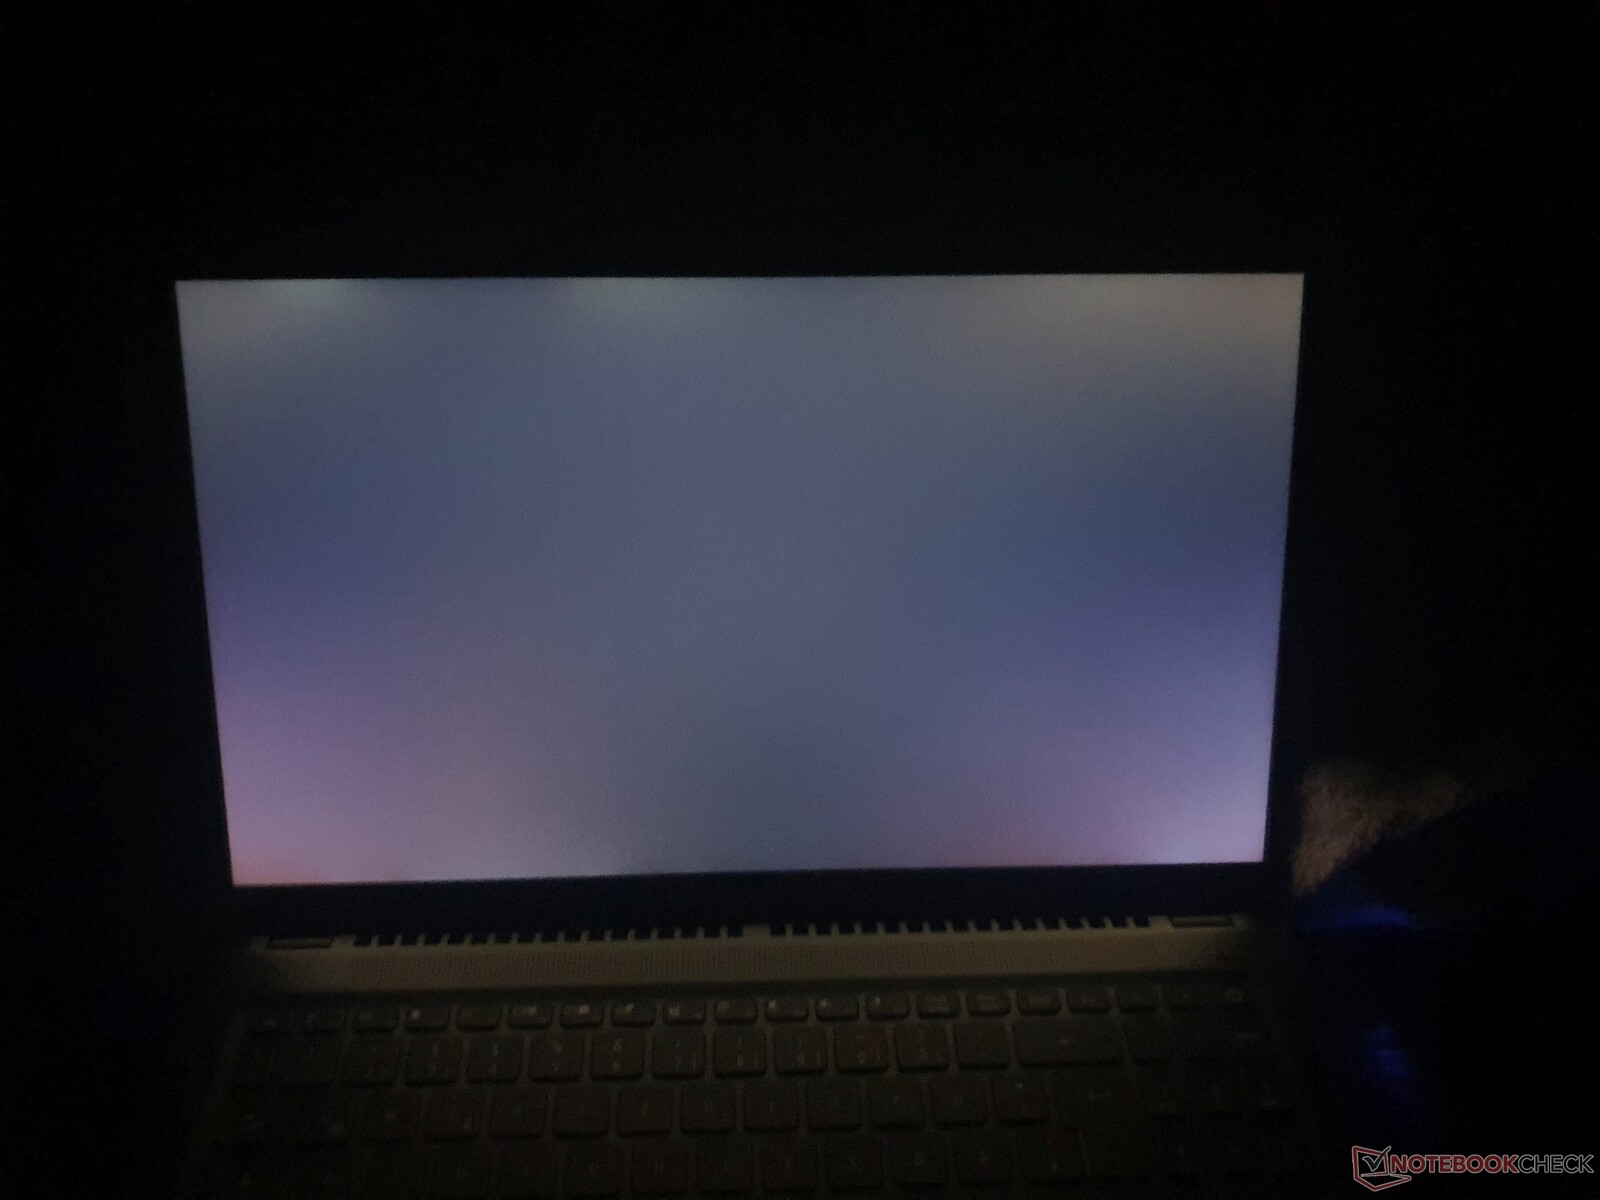
A disadvantage is the low brightness of the measured 264 nits, which is sufficient indoors, but suboptimal. There are no alternative display options. Furthermore, the brightness falls again in battery mode to only 180 nits.
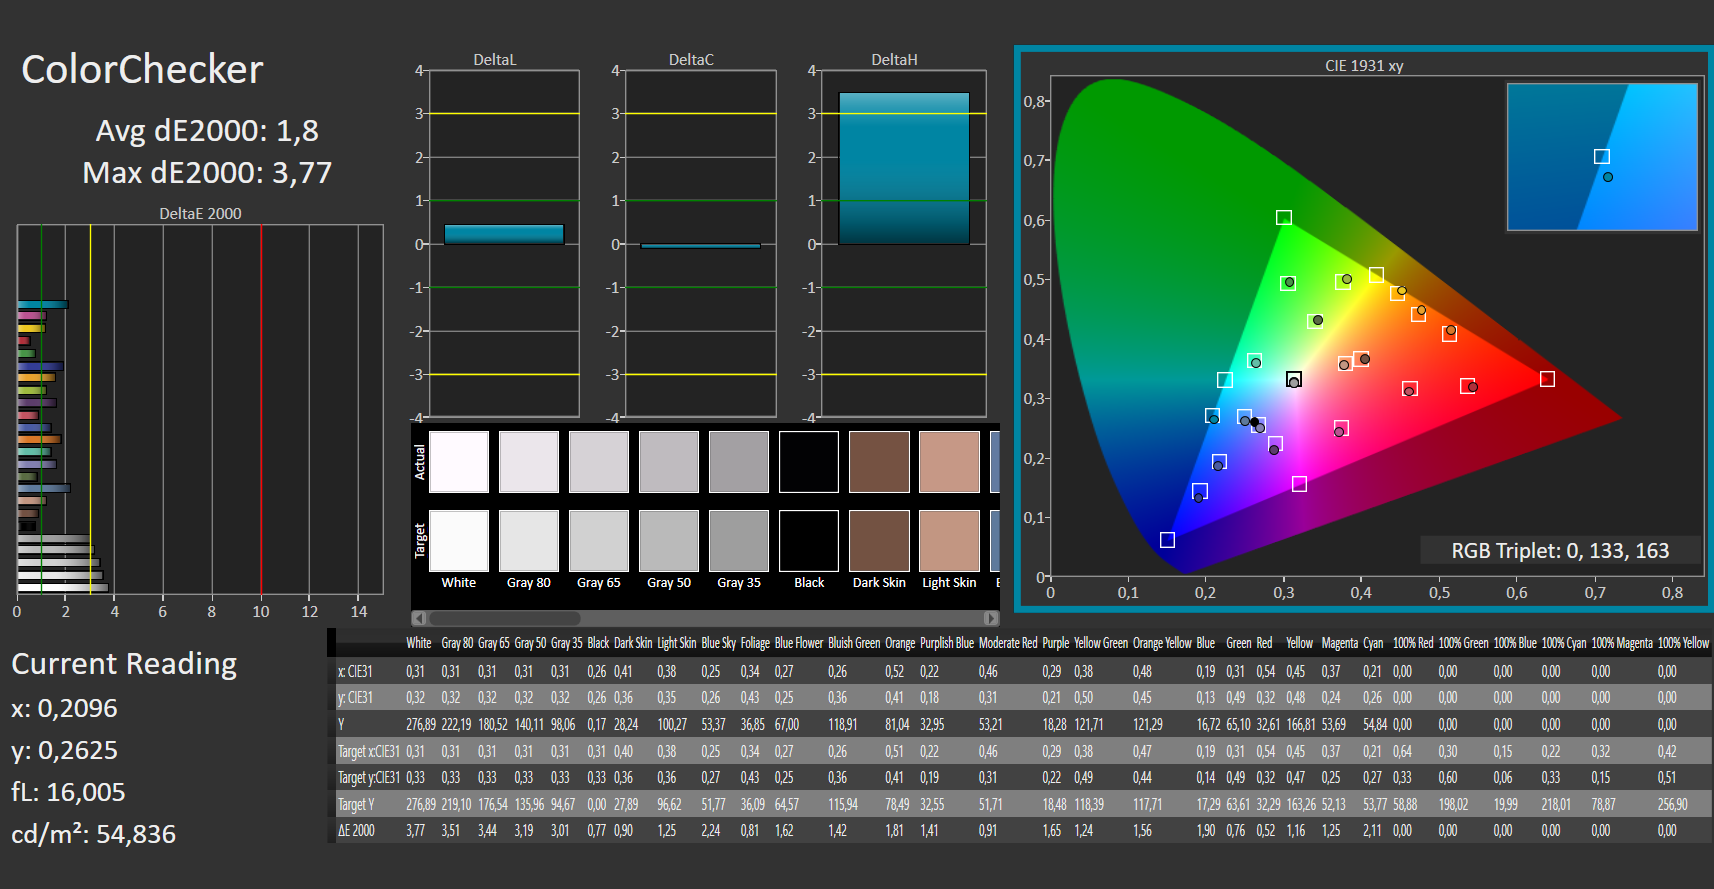
The contrast ratio (1,725:1) and black level (0.16 nits) are very good for an IPS display and the low DeltaE values result in adequate color representation. The panel's response times are neither good nor bad, but are sufficient for casual gaming. No PWM flickering was detected.
The panel itself is fundamentally solid, but competing laptops in our comparison chart have consistently better panels with higher resolutions and brightness values. The Lenovo IdeaPad 5 Pro 16 also has a 120 Hz refresh rate, while the Asus Vivobook Pro 16X has a 4K OLED panel.
| |||||||||||||||||||||||||
Brightness Distribution: 85 %
Center on Battery: 180 cd/m²
Contrast: 1725:1 (Black: 0.16 cd/m²)
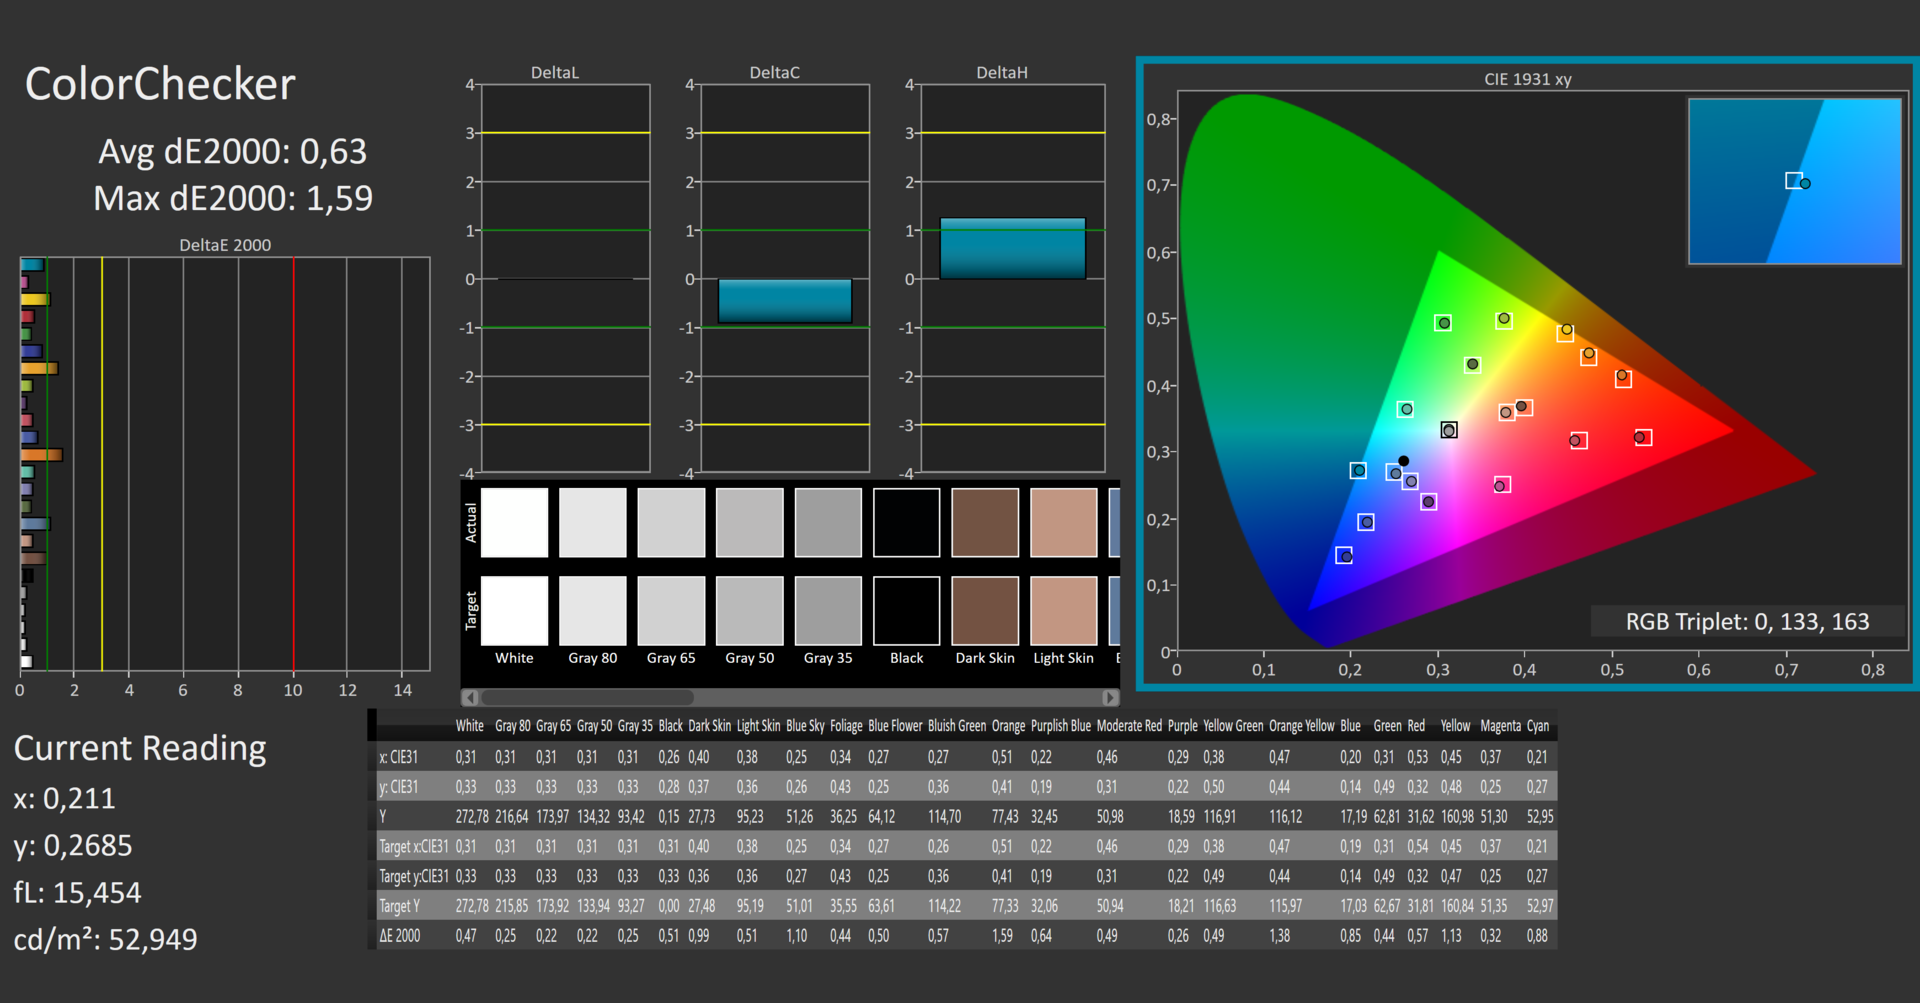
ΔE ColorChecker Calman: 1.8 | ∀{0.5-29.43 Ø4.72}
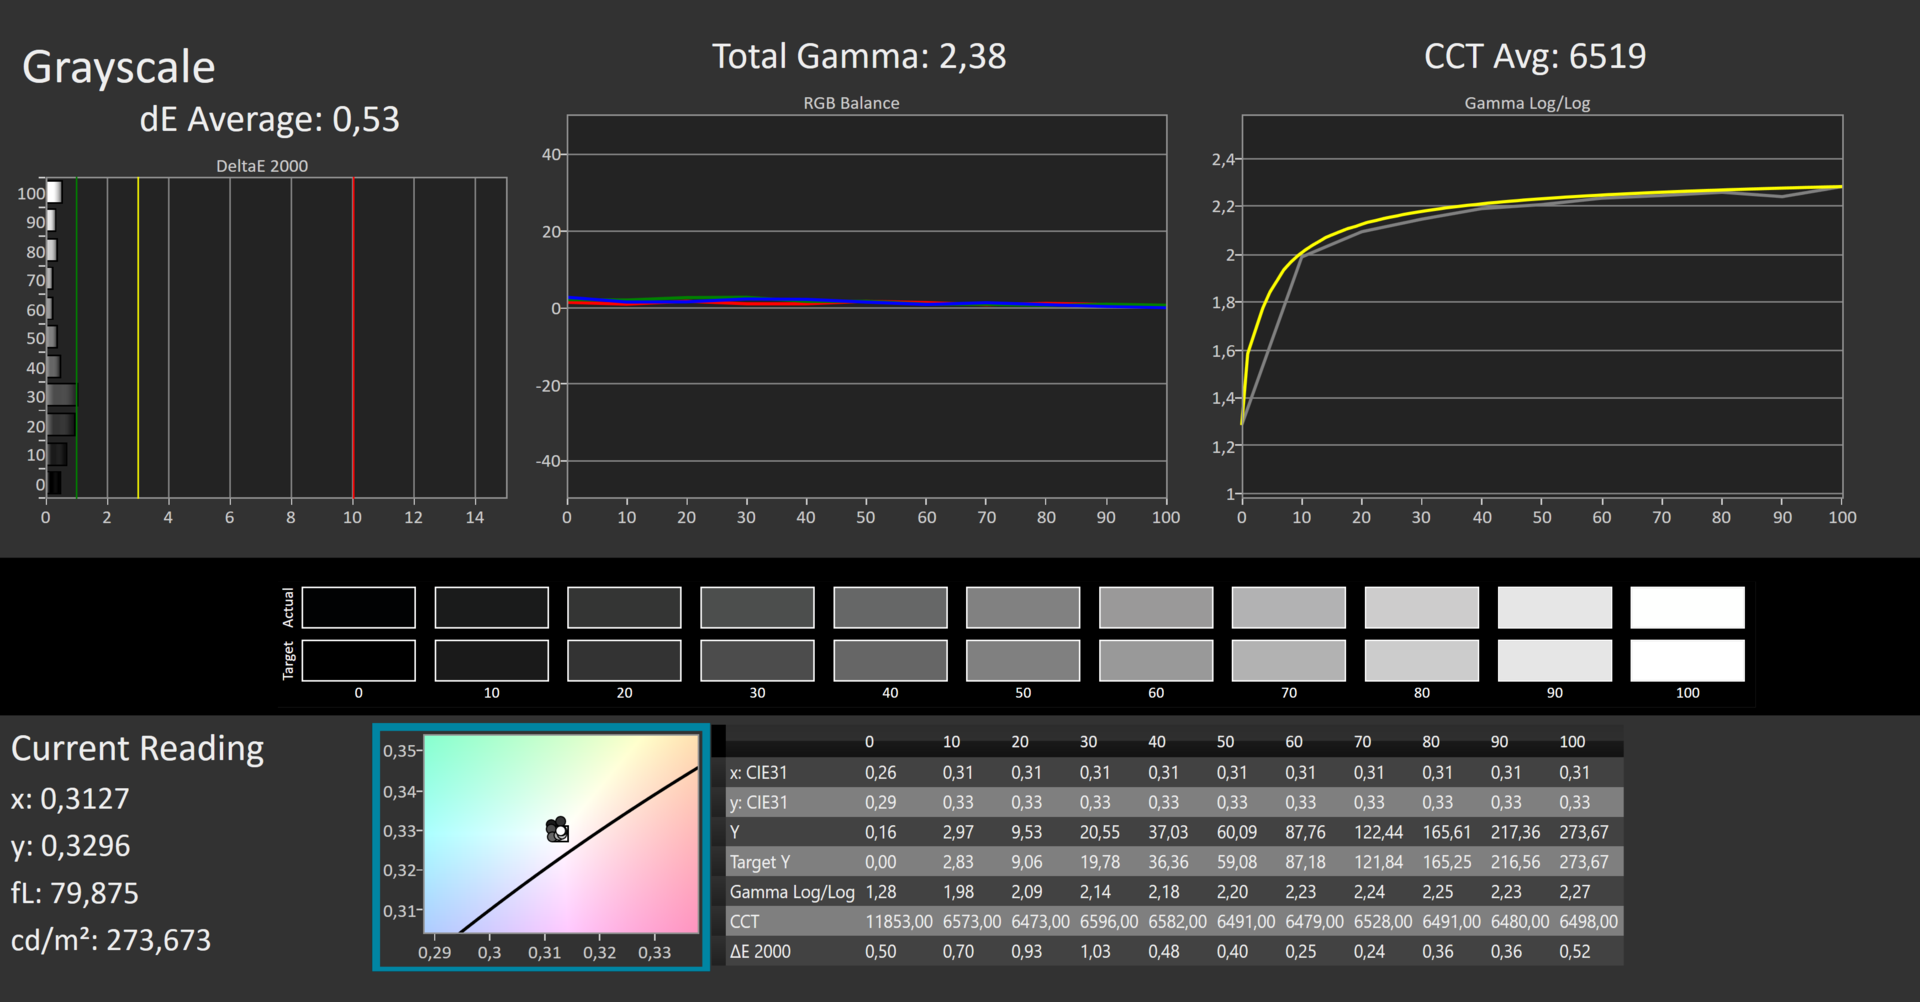
calibrated: 0.63
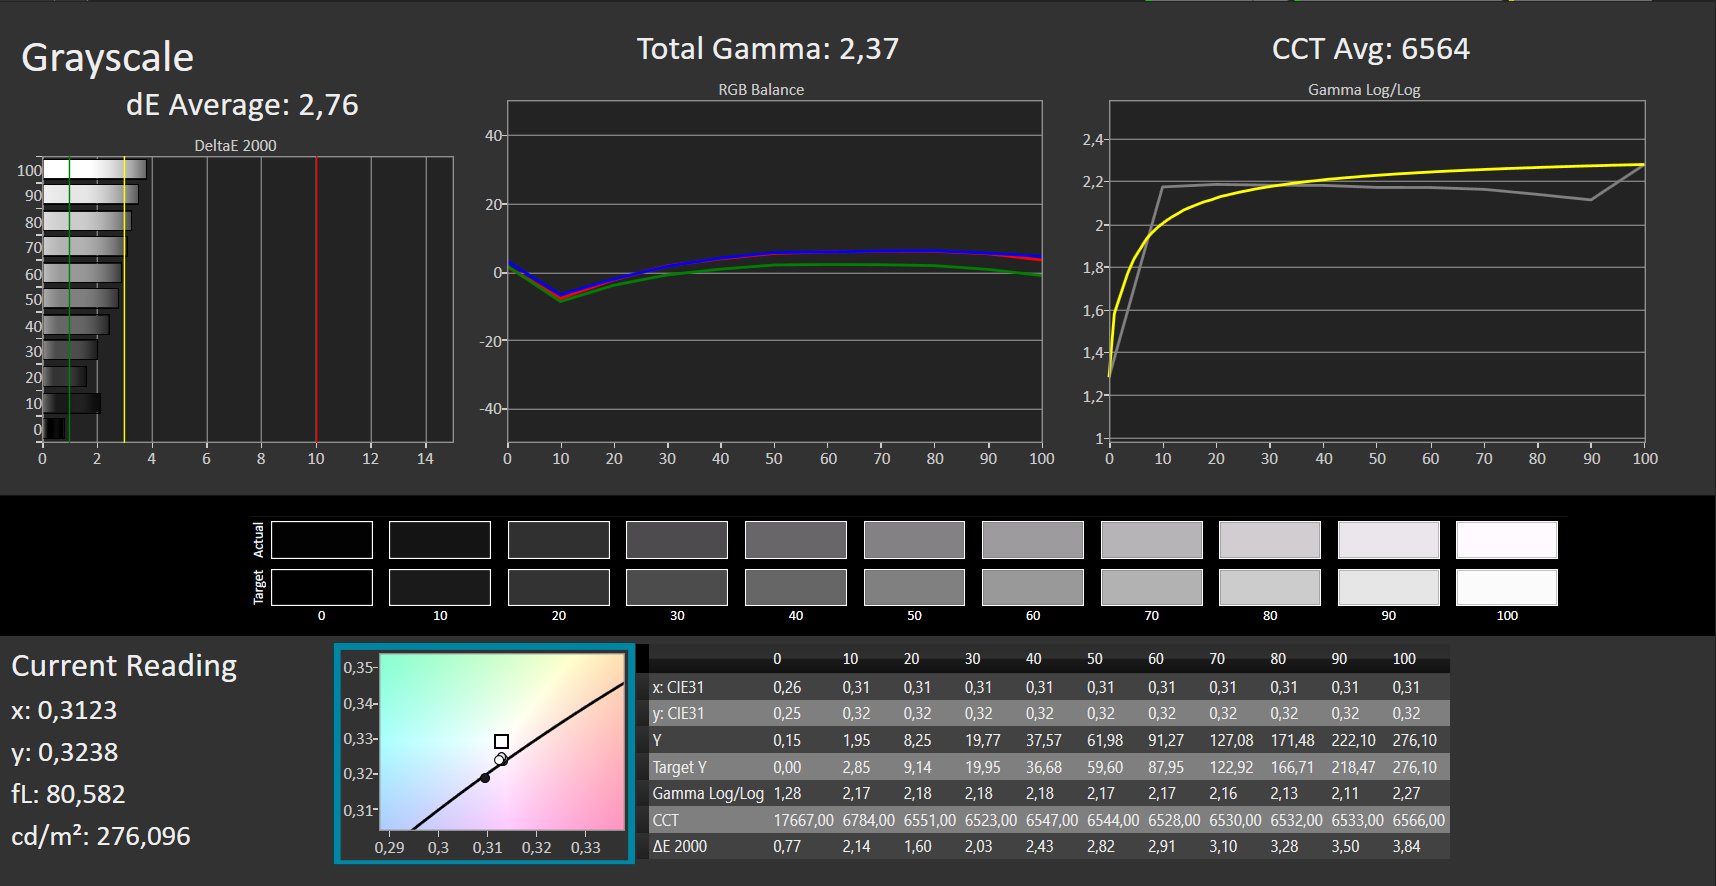
ΔE Greyscale Calman: 2.76 | ∀{0.09-98 Ø4.97}
66.75% AdobeRGB 1998 (Argyll 3D)
95.65% sRGB (Argyll 3D)
65.1% Display P3 (Argyll 3D)
Gamma: 2.37
CCT: 6564 K
| Acer Swift X SFX16-51G-5388 Chi Mei N161HCA-EA3, , 1920x1080, 16.1" | Acer Swift 3 SF316-51 Chi Mei CMN160B, IPS, 1920x1080, 16.1" | Lenovo IdeaPad 5 Pro 16ACH IPS LED, 2560x1600, 16" | Dell Inspiron 16 Plus 7610 AU Optronics B160QAN, IPS, 3072x1920, 16" | Asus Vivobook Pro 16X-M7600QE Samsung ATNA60YV02-0, OLED, 3840x2400, 16.1" | Huawei MateBook 16 R7 5800H BOE TV160DKT-NH0, , 2520x1680, 16" | |
|---|---|---|---|---|---|---|
| Display | 3% | 8% | 11% | 34% | -2% | |
| Display P3 Coverage (%) | 65.1 | 66.6 2% | 71 9% | 74.1 14% | 99.8 53% | 63.1 -3% |
| sRGB Coverage (%) | 95.65 | 99.5 4% | 99 4% | 99.4 4% | 100 5% | 94.9 -1% |
| AdobeRGB 1998 Coverage (%) | 66.75 | 68.5 3% | 73.3 10% | 75.8 14% | 96.9 45% | 65.1 -2% |
| Response Times | -4% | 51% | -74% | 92% | -35% | |
| Response Time Grey 50% / Grey 80% * (ms) | 30 ? | 32 ? -7% | 16.4 ? 45% | 49.2 ? -64% | 2 ? 93% | 41.2 ? -37% |
| Response Time Black / White * (ms) | 20 ? | 20 ? -0% | 8.8 ? 56% | 36.8 ? -84% | 2 ? 90% | 26.4 ? -32% |
| PWM Frequency (Hz) | 2500 ? | 24940 ? | 60 ? | |||
| Screen | 7% | -25% | -32% | -5% | 7% | |
| Brightness middle (cd/m²) | 276 | 304 10% | 395 43% | 296.8 8% | 392 42% | 357 29% |
| Brightness (cd/m²) | 264 | 284 8% | 375 42% | 292 11% | 396 50% | 349 32% |
| Brightness Distribution (%) | 85 | 88 4% | 90 6% | 87 2% | 98 15% | 93 9% |
| Black Level * (cd/m²) | 0.16 | 0.165 -3% | 0.32 -100% | 0.21 -31% | 0.21 -31% | |
| Contrast (:1) | 1725 | 1842 7% | 1234 -28% | 1413 -18% | 1700 -1% | |
| Colorchecker dE 2000 * | 1.8 | 1.44 20% | 2.6 -44% | 2.56 -42% | 1.74 3% | 1.6 11% |
| Colorchecker dE 2000 max. * | 3.77 | 3.62 4% | 5.4 -43% | 4.76 -26% | 3.18 16% | 3.9 -3% |
| Colorchecker dE 2000 calibrated * | 0.63 | 1.1 -75% | 1.86 -195% | 1.85 -194% | 0.6 5% | |
| Greyscale dE 2000 * | 2.76 | 2.6 6% | 3.4 -23% | 2.6 6% | 1.77 36% | 2.4 13% |
| Gamma | 2.37 93% | 2.41 91% | 2.12 104% | 2.07 106% | 2.22 99% | 2.14 103% |
| CCT | 6564 99% | 6527 100% | 6140 106% | 6628 98% | 6483 100% | 6728 97% |
| Color Space (Percent of AdobeRGB 1998) (%) | 68.5 | |||||
| Color Space (Percent of sRGB) (%) | 99.5 | |||||
| Total Average (Program / Settings) | 2% /
4% | 11% /
-7% | -32% /
-29% | 40% /
21% | -10% /
-1% |
* ... smaller is better
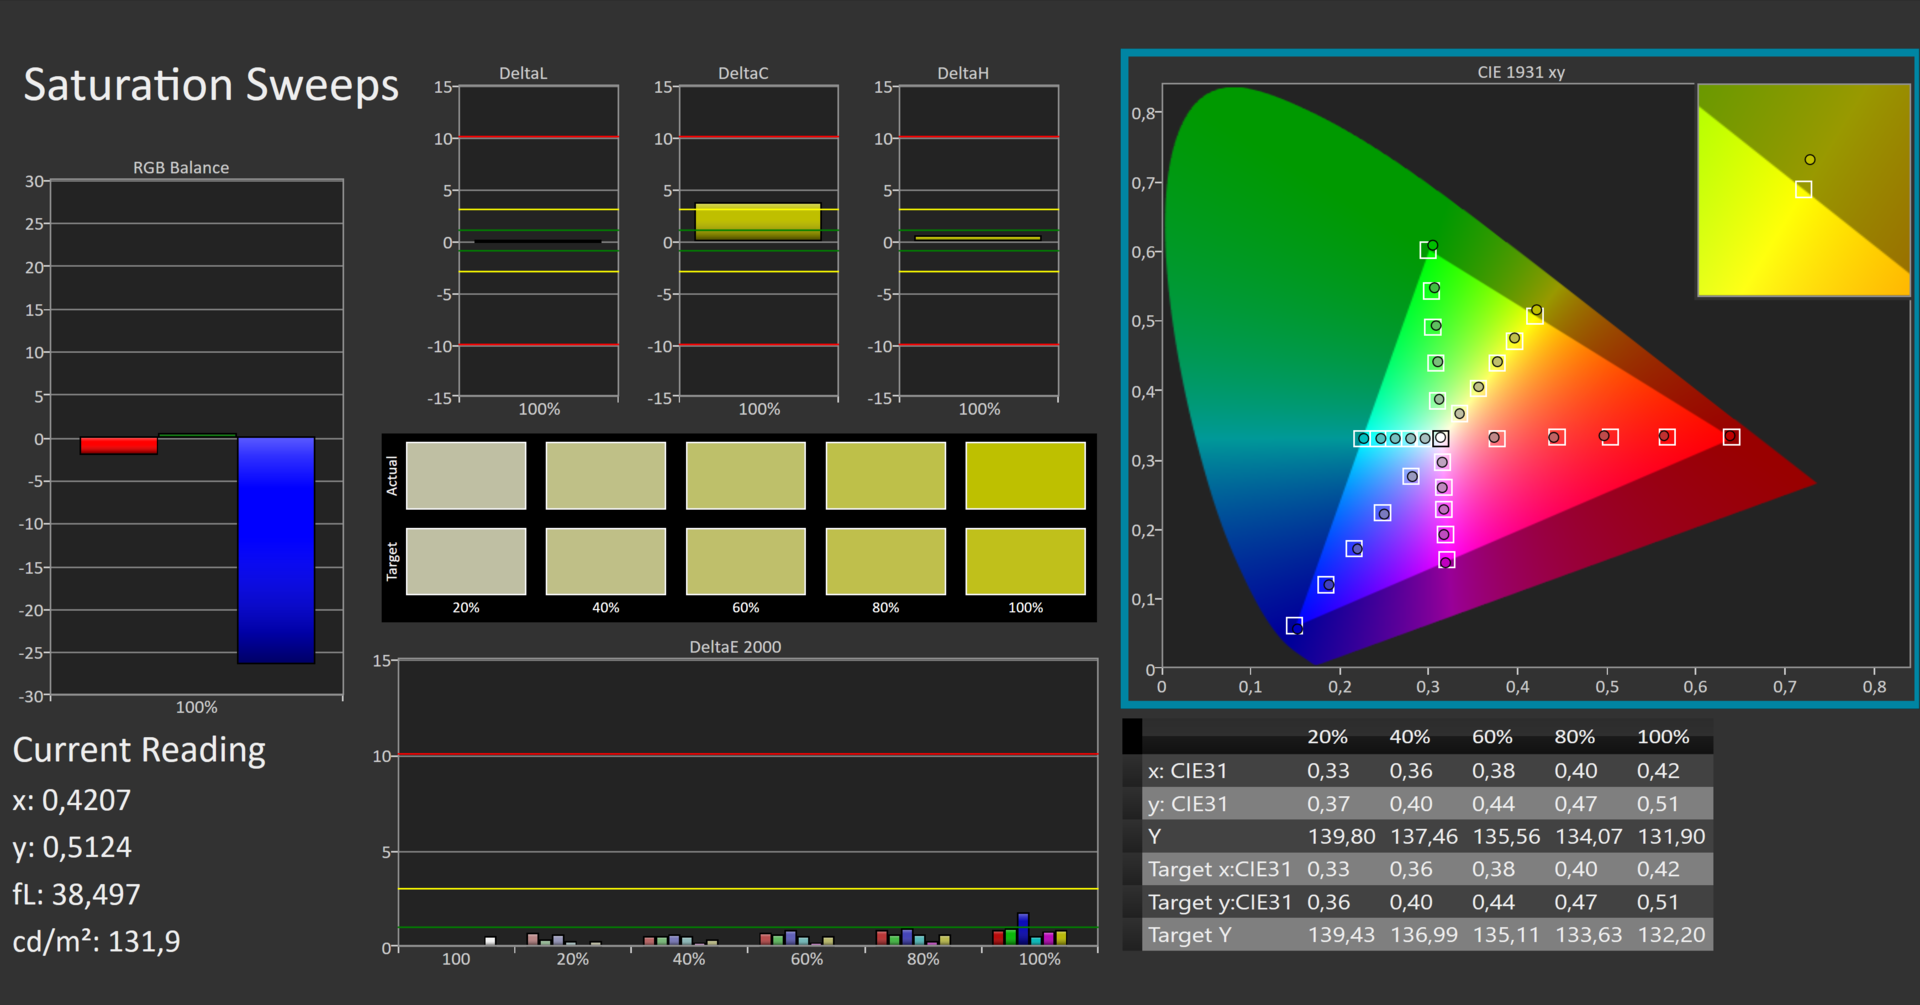
Acer promises complete sRGB coverage, which is confirmed by our measurement of 95.7%. For the Adobe RGB and DCI-P3 color spaces, we registered 66.8% and 65.1%, respectively. This makes semi-professional image and video editing possible.
The display is already calibrated quite well ex works, but we were able to improve the results even more. As always, our ICC color profile is available for download next to the illumination graphic.
Display Response Times
| ↔ Response Time Black to White | ||
|---|---|---|
| 20 ms ... rise ↗ and fall ↘ combined | ↗ 11 ms rise |  |
| ↘ 9 ms fall | ||
| The screen shows good response rates in our tests, but may be too slow for competitive gamers. In comparison, all tested devices range from 0.1 (minimum) to 240 (maximum) ms. » 44 % of all devices are better. This means that the measured response time is similar to the average of all tested devices (19.8 ms). | ||
| ↔ Response Time 50% Grey to 80% Grey | ||
| 30 ms ... rise ↗ and fall ↘ combined | ↗ 14 ms rise |  |
| ↘ 16 ms fall | ||
| The screen shows slow response rates in our tests and will be unsatisfactory for gamers. In comparison, all tested devices range from 0.165 (minimum) to 636 (maximum) ms. » 40 % of all devices are better. This means that the measured response time is similar to the average of all tested devices (31 ms). | ||
Screen Flickering / PWM (Pulse-Width Modulation)
| Screen flickering / PWM not detected |  | ||
In comparison: 52 % of all tested devices do not use PWM to dim the display. If PWM was detected, an average of 7769 (minimum: 5 - maximum: 343500) Hz was measured. | |||
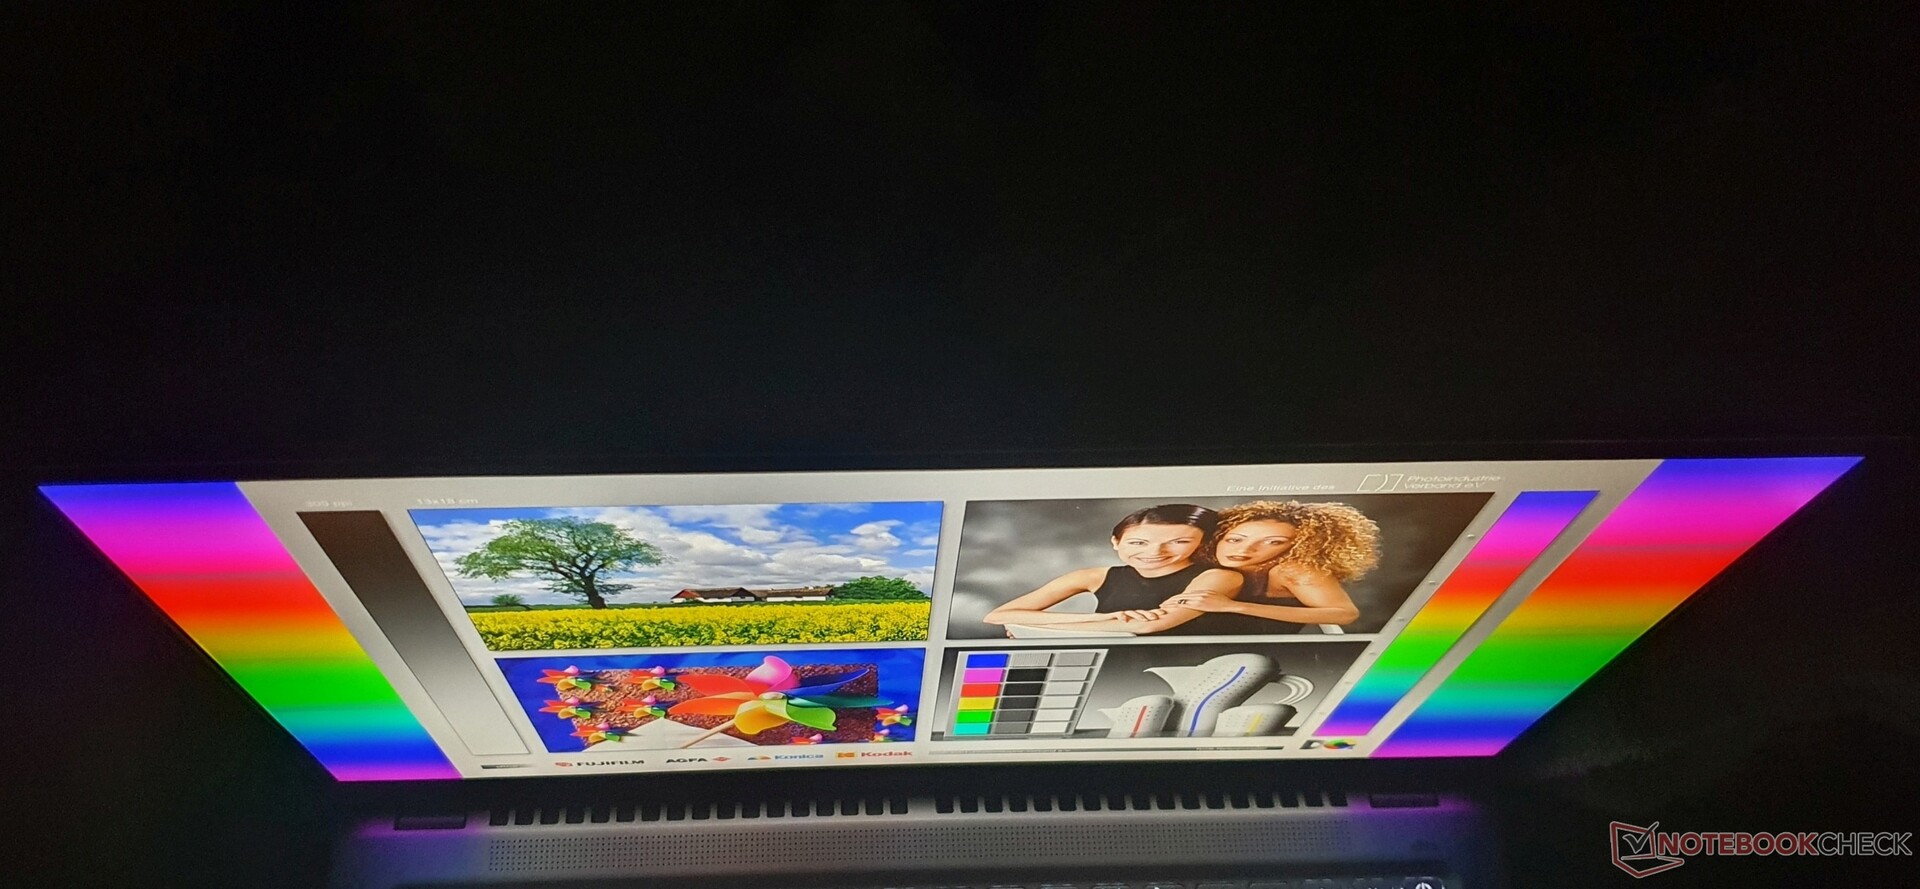
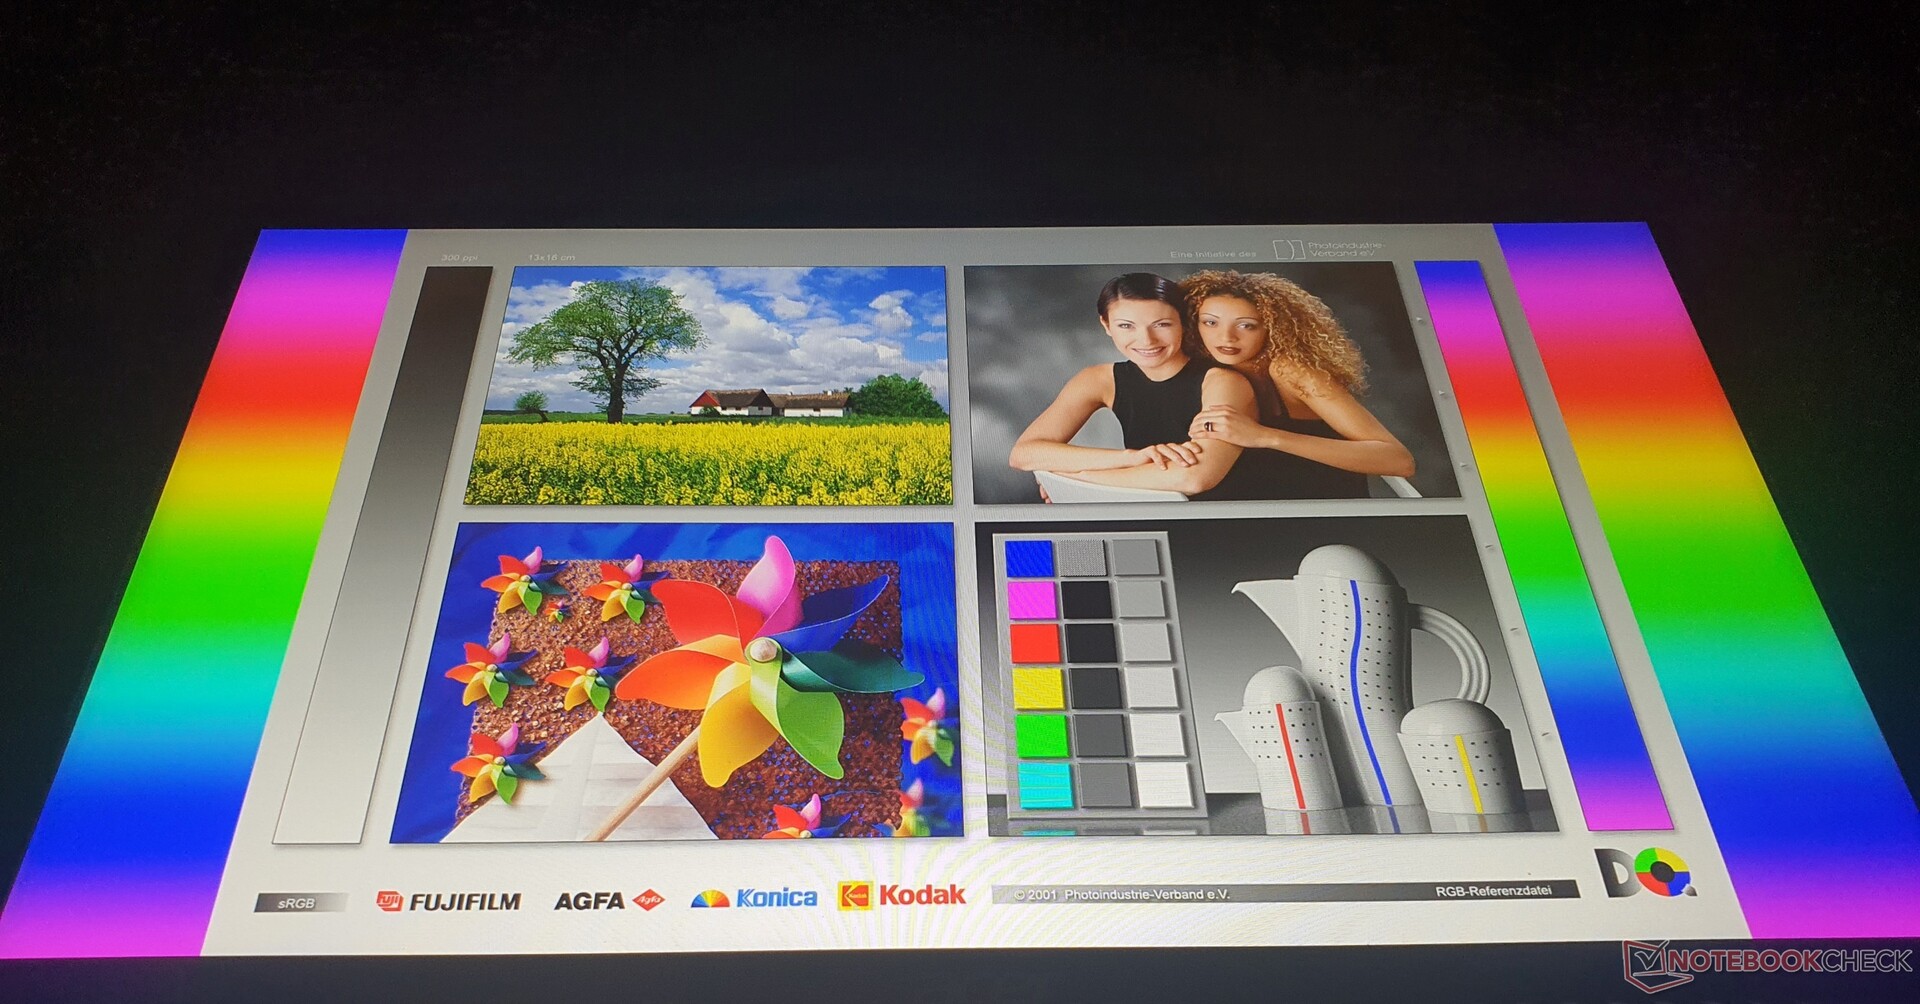
For outdoor use, the Acer Swift X 16 can only be used in the shade. Despite its matte surface, the display is simply not bright enough to stand up to the sun.
Performance: Swift X performs well, but SSD is throttled
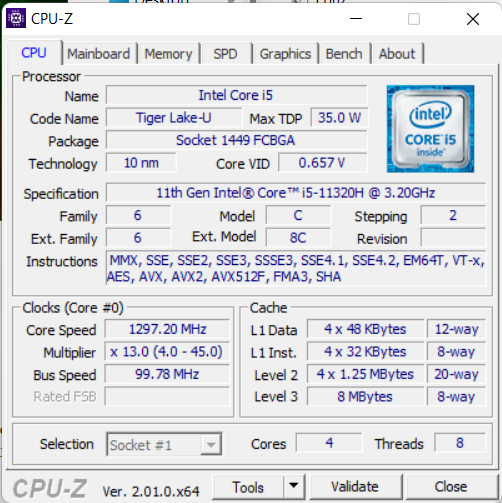
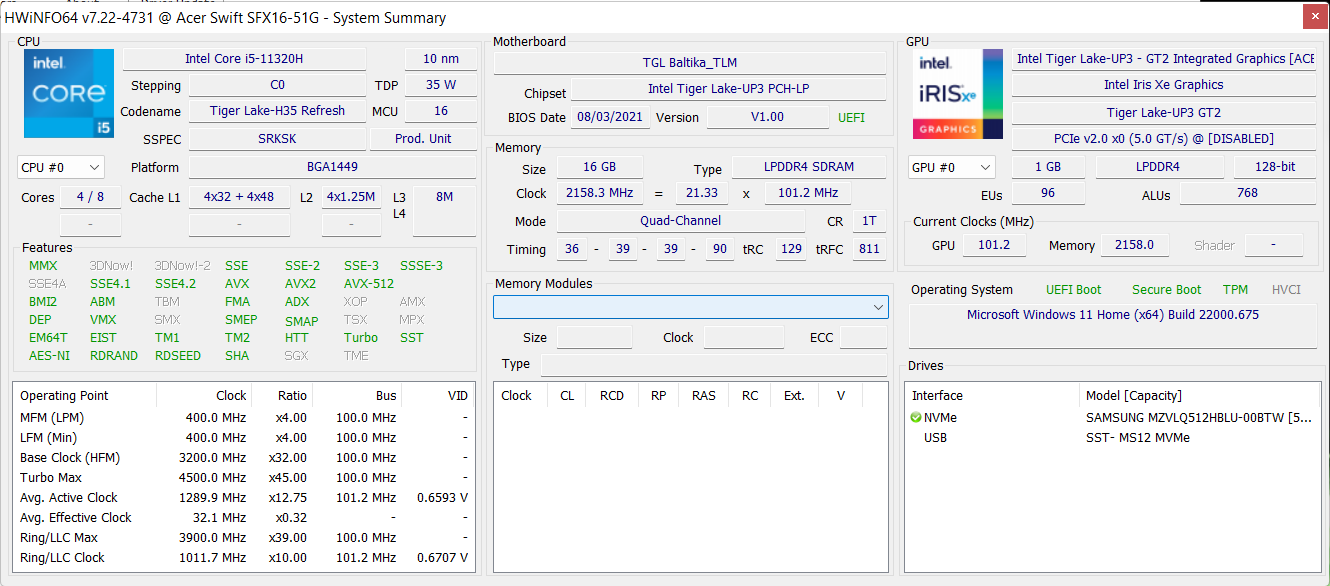
Acer offers exactly two CPU options for its Swift X 16: An Intel Core i5-11320H with 4.5 GHz Turbo (in our model) and a Core i7-11390H with 5 GHz Turbo. Both are quad-core processors.
The laptop usually comes with a Nvidia GeForce RTX 3050 and 16 GB of soldered LPDDR4X-4266 RAM. As for storage space, 512 GB SSD (PCIe 3.0) is the standard, although a 1 TB SDD is offered in some configurations in other countries. Overall, this level of hardware is sufficient for multimedia purposes such as simple video editing, audio editing or FHD gaming, and for general office use.


Testing Conditions
Acer provides three different power modes that can be toggled via the key combination "Fn + F": "Silent", "Normal" and "Performance".
These directly influence the fan volume and performance limits. The fans are thus significantly quieter in Silent mode, and less intrusive in Normal mode (relative to Performance mode). Turbo Boost is not affected and raw CPU performance is only slightly reduced in Silent mode - under constant load (6% thermal throttling). The GPU is never throttled, but the extra 5 watts of "Dynamic Boost" is only available in Performance mode.
The quietest setting is achieved under the Windows option "Best Power Saving" + Acer's Silent mode. Our benchmarks were conducted in Performance mode, while the battery runtimes (web surfing & video) were determined in Balanced mode.
| TDP in Watt | TGP in Watt | kombiniert | |
|---|---|---|---|
| Silent-Modus | 35 | 35 | 20+35 |
| Normal-Modus | 35 | 35 | 25+35 |
| Performance-Modus | 35 | 40 | 25+40 |
| Akkubetrieb | 25 | 30 | 15+30 |
| Win11: Beste Einsparung | 12,5 | 30 | 12,5+30 |
Processor
The Intel Core i5-11320H is a quad-core CPU with a 35-watt TDP and a base clock of 3.2 GHz. Turbo is specified as 4.5 GHz. The CPU is roughly the same as the Core i5-1155G7, which can be configured between 15 and a maximum of 28 watts.
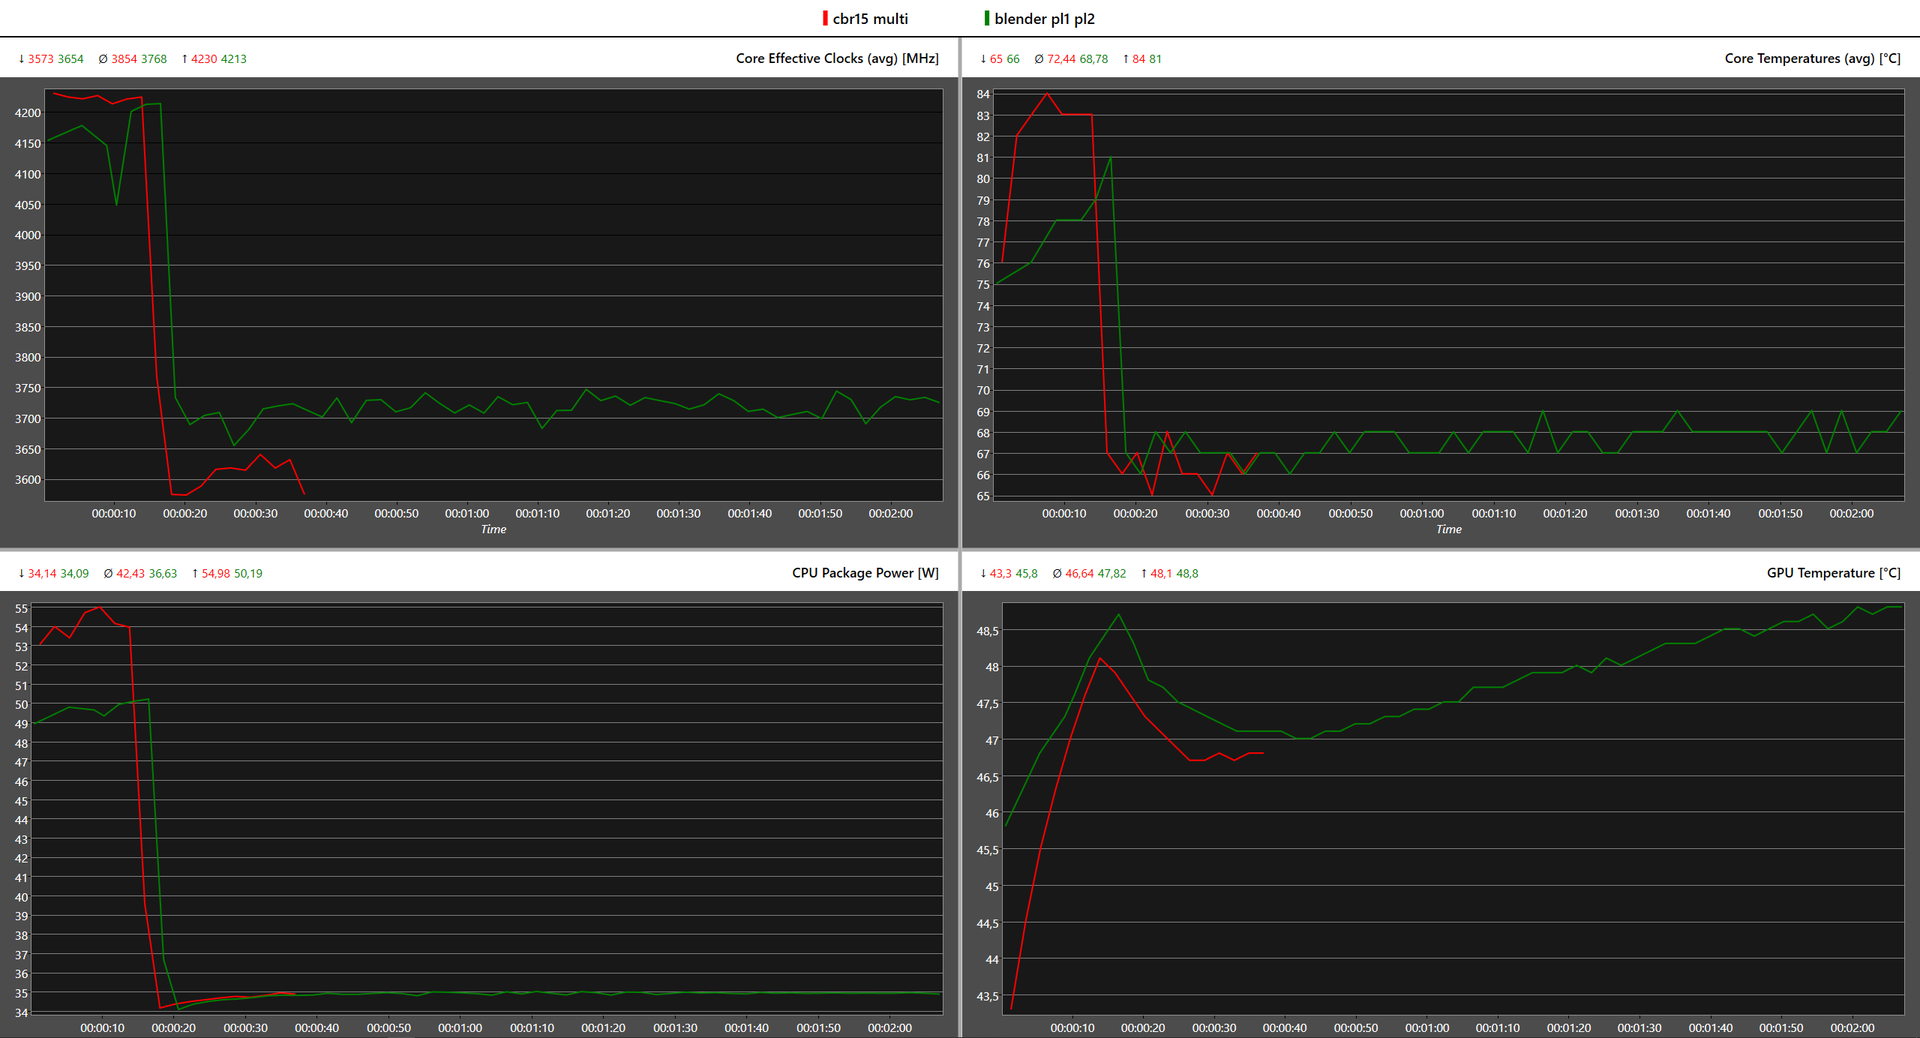
Under Turbo, the Intel processor initally draws 55 watts at 4.15 GHz. The power consumption then drops permanently to the specified 35 watts after less than a minute, so that the base clock of 3.2 GHz comes into play.
The Swift X brings up the rear in the comparison field in terms of performance. In battery mode, the CPU can still consume 25 watts, but performance drops by ~25%.

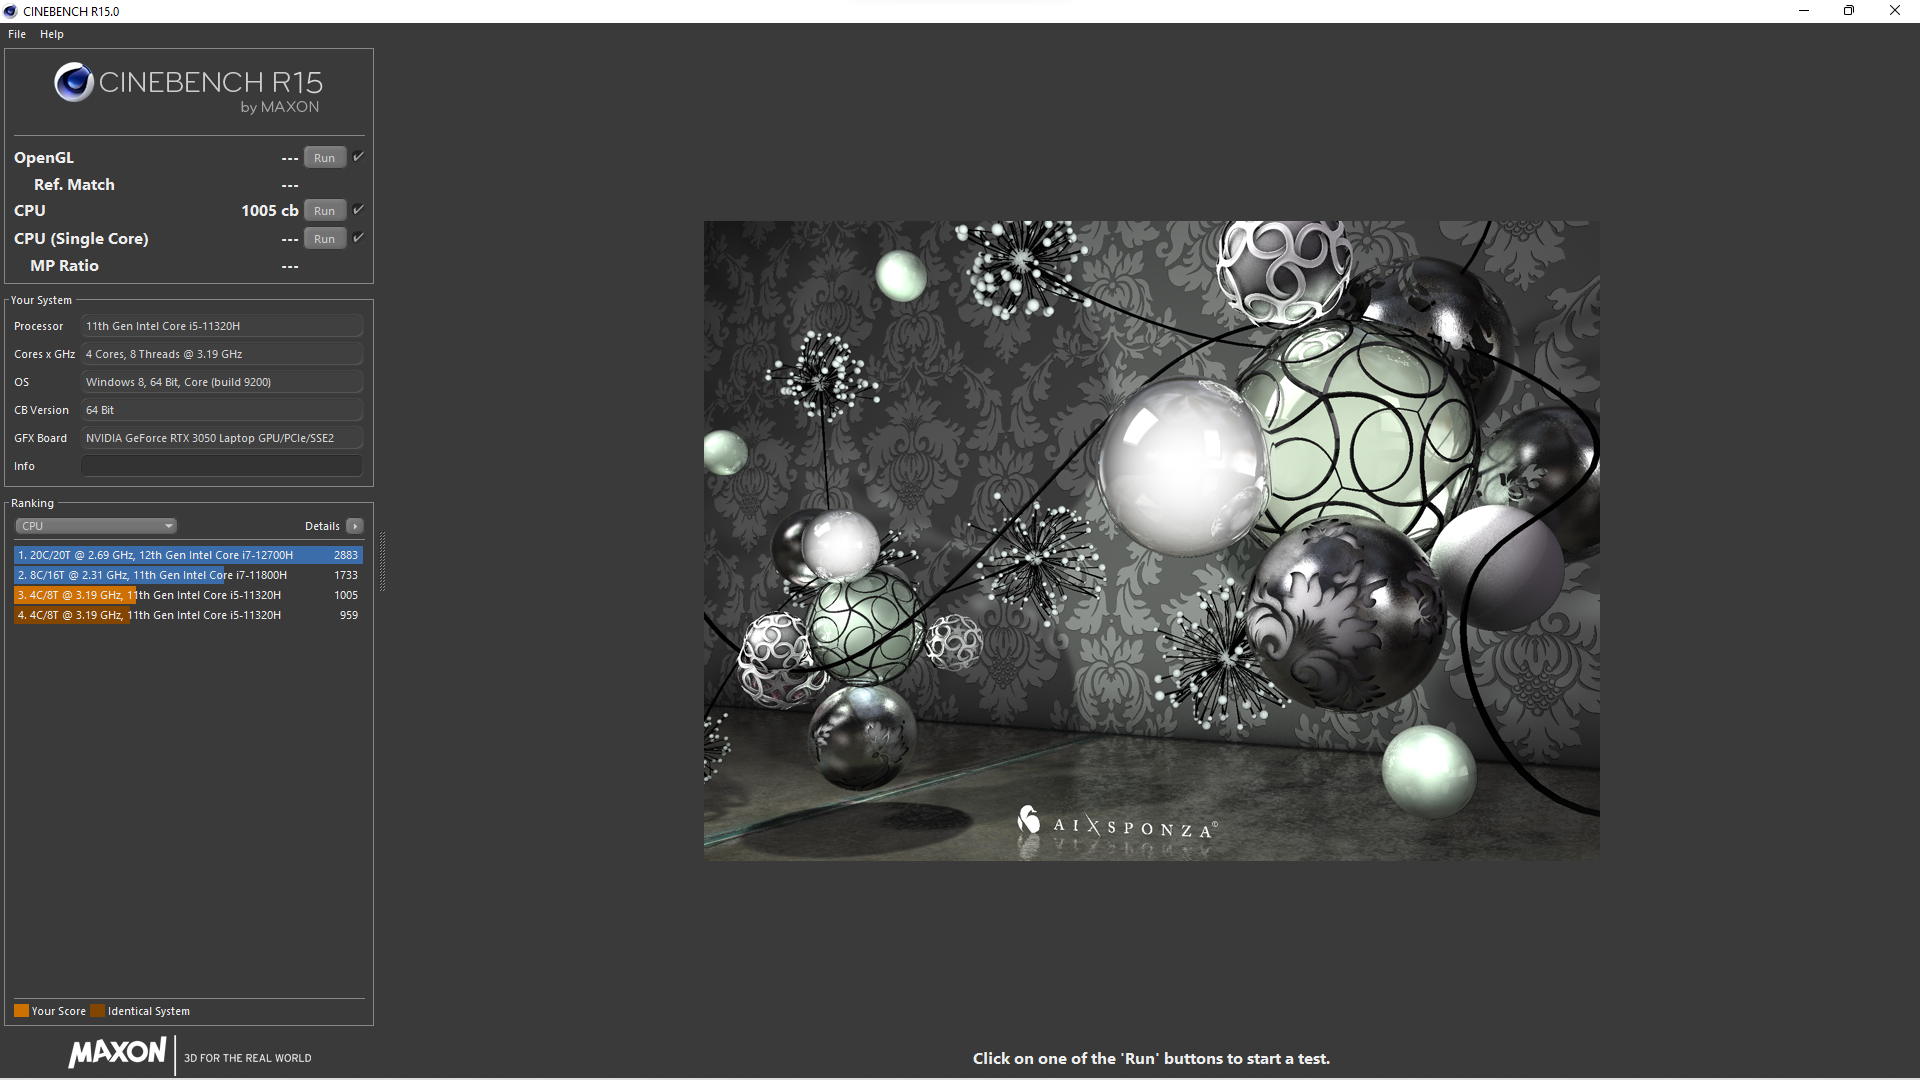
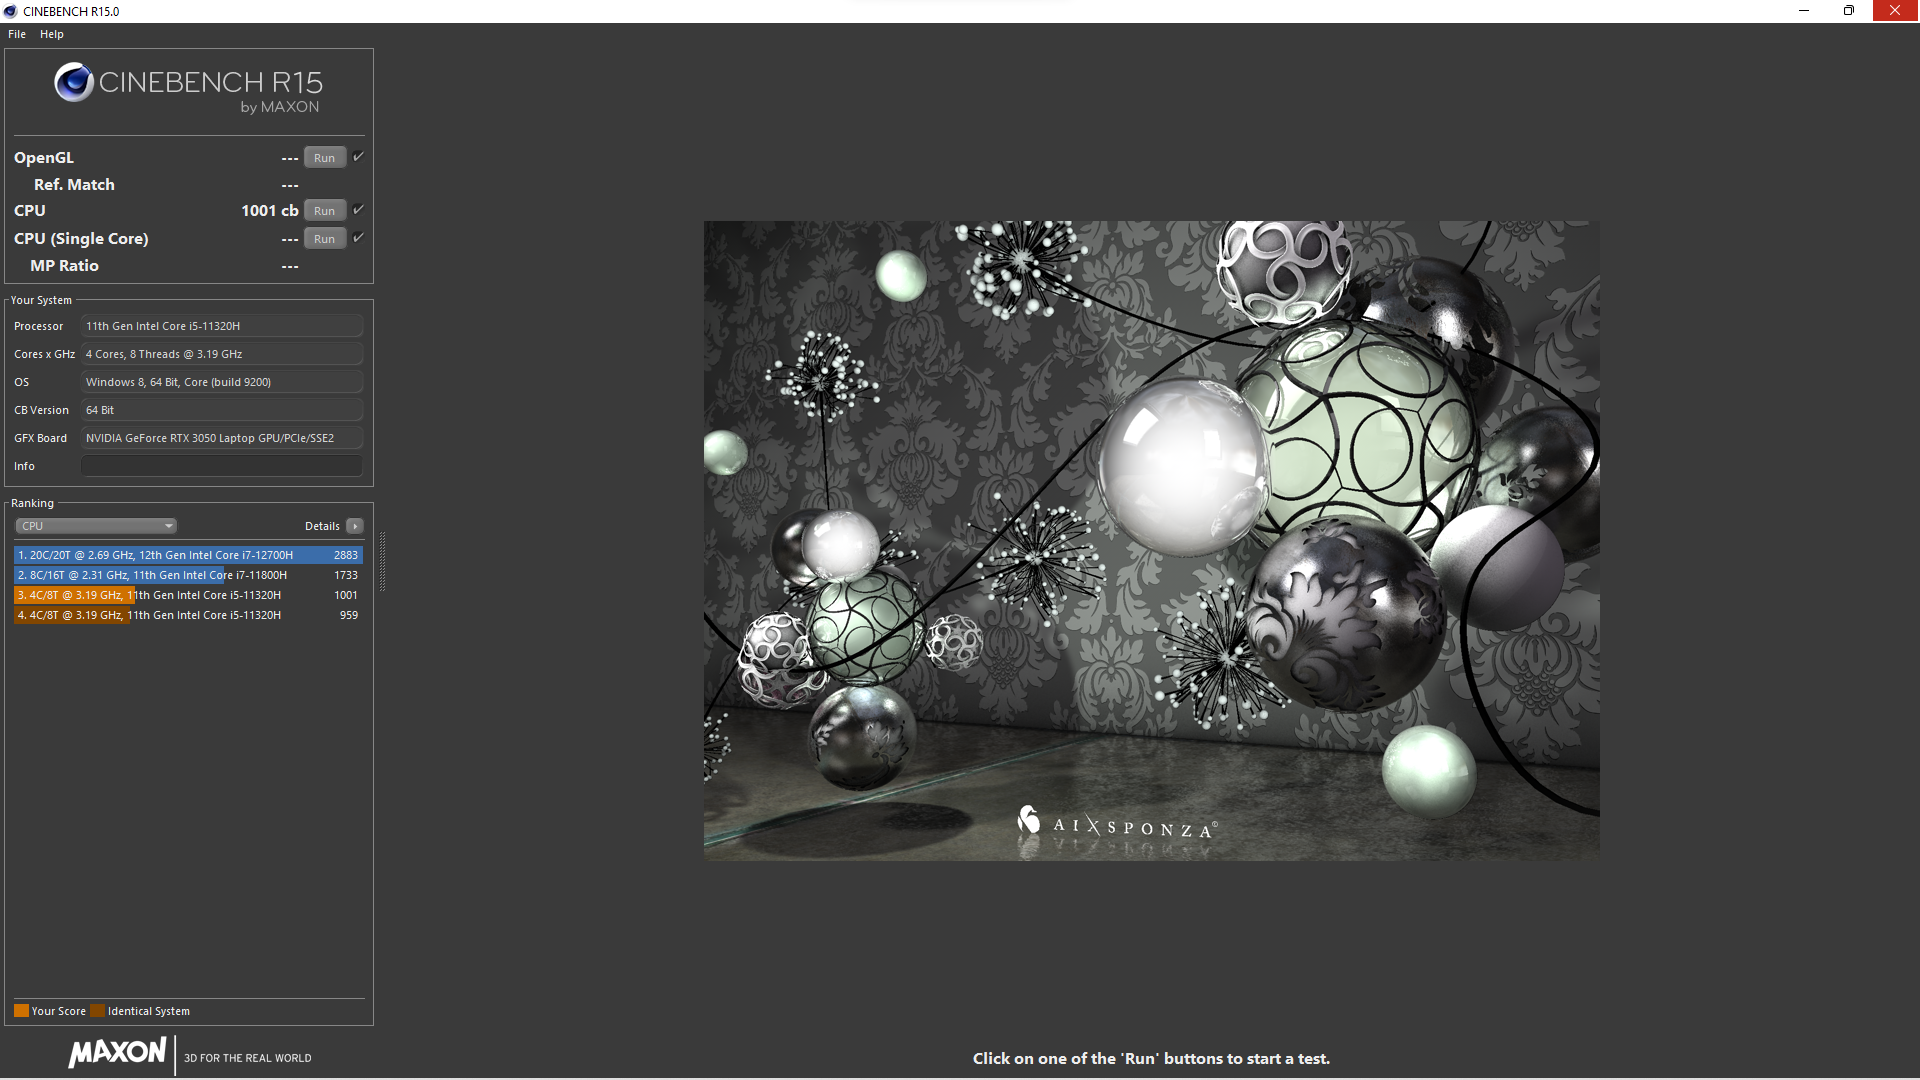
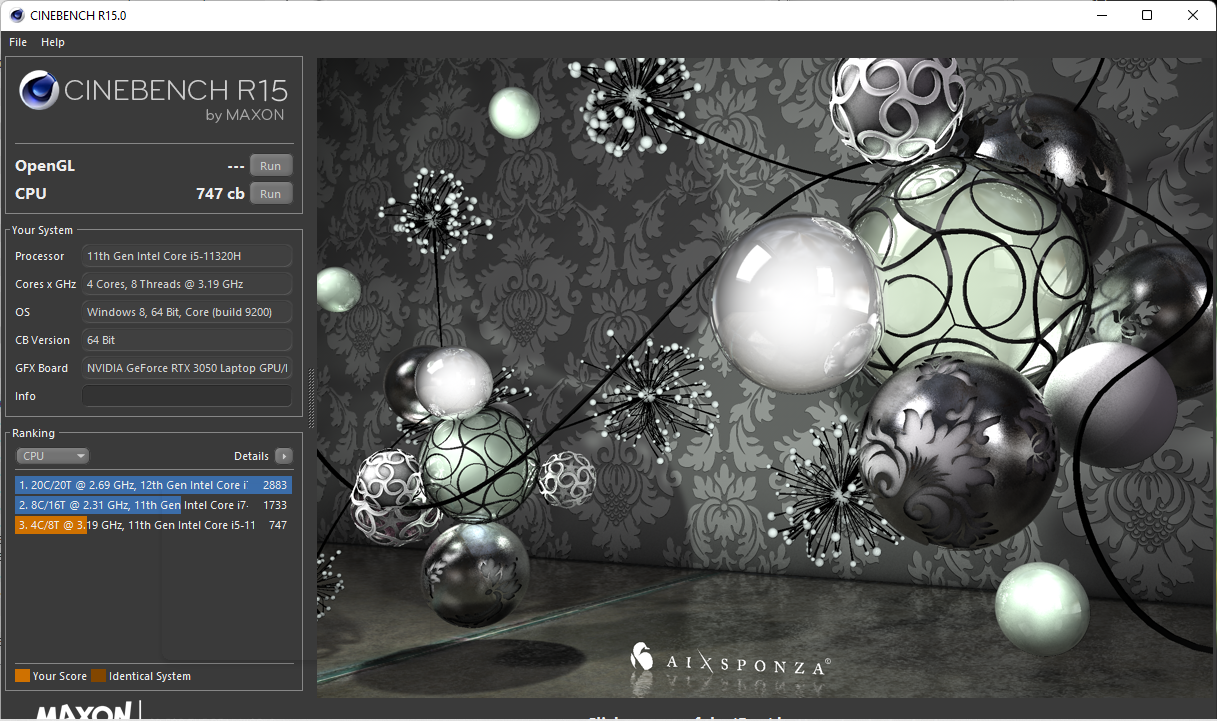
Cinebench R15 Multi Sustained Load
Cinebench R23: Multi Core | Single Core
Cinebench R20: CPU (Multi Core) | CPU (Single Core)
Cinebench R15: CPU Multi 64Bit | CPU Single 64Bit
Blender: v2.79 BMW27 CPU | v3.3 Classroom CPU | v3.3 Classroom CUDA
7-Zip 18.03: 7z b 4 | 7z b 4 -mmt1
Geekbench 5.5: Multi-Core | Single-Core | OpenCL Score
HWBOT x265 Benchmark v2.2: 4k Preset
LibreOffice : 20 Documents To PDF
R Benchmark 2.5: Overall mean
V-Ray 5 Benchmark: CPU | GPU CUDA
WebXPRT 3: Overall
WebXPRT 4: Overall
Mozilla Kraken 1.1: Total
Octane V2: Total Score
Jetstream 2: 2.0 Total
| CPU Performance rating | |
| Average of class Multimedia | |
| Asus Vivobook Pro 16X-M7600QE -7! | |
| Lenovo IdeaPad 5 Pro 16ACH -7! | |
| Dell Inspiron 16 Plus 7610 -8! | |
| Acer Swift 3 SF316-51 -7! | |
| Acer Swift X SFX14-41G-R7F3 -7! | |
| Acer Swift X SFX16-51G-5388 | |
| Average Intel Core i5-11320H | |
| Cinebench R23 / Multi Core | |
| Average of class Multimedia (4861 - 33362, n=81, last 2 years) | |
| Asus Vivobook Pro 16X-M7600QE | |
| Asus Vivobook Pro 16X-M7600QE | |
| Lenovo IdeaPad 5 Pro 16ACH | |
| Dell Inspiron 16 Plus 7610 | |
| Acer Swift X SFX14-41G-R7F3 | |
| Acer Swift 3 SF316-51 | |
| Acer Swift X SFX16-51G-5388 | |
| Average Intel Core i5-11320H (5720 - 6051, n=4) | |
| Cinebench R23 / Single Core | |
| Average of class Multimedia (1128 - 2459, n=73, last 2 years) | |
| Acer Swift 3 SF316-51 | |
| Dell Inspiron 16 Plus 7610 | |
| Asus Vivobook Pro 16X-M7600QE | |
| Asus Vivobook Pro 16X-M7600QE | |
| Average Intel Core i5-11320H (1341 - 1467, n=4) | |
| Lenovo IdeaPad 5 Pro 16ACH | |
| Acer Swift X SFX16-51G-5388 | |
| Acer Swift X SFX14-41G-R7F3 | |
| Cinebench R20 / CPU (Multi Core) | |
| Average of class Multimedia (1887 - 12912, n=64, last 2 years) | |
| Asus Vivobook Pro 16X-M7600QE | |
| Asus Vivobook Pro 16X-M7600QE | |
| Lenovo IdeaPad 5 Pro 16ACH | |
| Dell Inspiron 16 Plus 7610 | |
| Acer Swift X SFX14-41G-R7F3 | |
| Acer Swift X SFX16-51G-5388 | |
| Acer Swift 3 SF316-51 | |
| Average Intel Core i5-11320H (2208 - 2349, n=4) | |
| Cinebench R20 / CPU (Single Core) | |
| Average of class Multimedia (425 - 853, n=64, last 2 years) | |
| Acer Swift 3 SF316-51 | |
| Dell Inspiron 16 Plus 7610 | |
| Asus Vivobook Pro 16X-M7600QE | |
| Asus Vivobook Pro 16X-M7600QE | |
| Average Intel Core i5-11320H (557 - 567, n=4) | |
| Acer Swift X SFX16-51G-5388 | |
| Lenovo IdeaPad 5 Pro 16ACH | |
| Acer Swift X SFX14-41G-R7F3 | |
| Cinebench R15 / CPU Multi 64Bit | |
| Average of class Multimedia (856 - 5224, n=68, last 2 years) | |
| Asus Vivobook Pro 16X-M7600QE | |
| Asus Vivobook Pro 16X-M7600QE | |
| Lenovo IdeaPad 5 Pro 16ACH | |
| Dell Inspiron 16 Plus 7610 | |
| Acer Swift X SFX14-41G-R7F3 | |
| Acer Swift X SFX16-51G-5388 | |
| Acer Swift 3 SF316-51 | |
| Average Intel Core i5-11320H (857 - 1019, n=4) | |
| Cinebench R15 / CPU Single 64Bit | |
| Average of class Multimedia (184.8 - 326, n=66, last 2 years) | |
| Asus Vivobook Pro 16X-M7600QE | |
| Asus Vivobook Pro 16X-M7600QE | |
| Acer Swift 3 SF316-51 | |
| Dell Inspiron 16 Plus 7610 | |
| Lenovo IdeaPad 5 Pro 16ACH | |
| Acer Swift X SFX16-51G-5388 | |
| Average Intel Core i5-11320H (212 - 215, n=4) | |
| Acer Swift X SFX14-41G-R7F3 | |
| Blender / v2.79 BMW27 CPU | |
| Average Intel Core i5-11320H (507 - 543, n=4) | |
| Acer Swift 3 SF316-51 | |
| Acer Swift X SFX16-51G-5388 | |
| Acer Swift X SFX14-41G-R7F3 | |
| Dell Inspiron 16 Plus 7610 | |
| Lenovo IdeaPad 5 Pro 16ACH | |
| Asus Vivobook Pro 16X-M7600QE | |
| Asus Vivobook Pro 16X-M7600QE | |
| Average of class Multimedia (100 - 557, n=65, last 2 years) | |
| Blender / v3.3 Classroom CPU | |
| Average Intel Core i5-11320H (937 - 1010, n=3) | |
| Acer Swift X SFX16-51G-5388 | |
| Average of class Multimedia (134.5 - 1042, n=67, last 2 years) | |
| Blender / v3.3 Classroom CUDA | |
| Acer Swift X SFX16-51G-5388 | |
| Average Intel Core i5-11320H (n=1) | |
| Average of class Multimedia (20 - 186, n=24, last 2 years) | |
| 7-Zip 18.03 / 7z b 4 | |
| Average of class Multimedia (26062 - 130368, n=62, last 2 years) | |
| Asus Vivobook Pro 16X-M7600QE | |
| Asus Vivobook Pro 16X-M7600QE | |
| Lenovo IdeaPad 5 Pro 16ACH | |
| Dell Inspiron 16 Plus 7610 | |
| Acer Swift X SFX14-41G-R7F3 | |
| Acer Swift 3 SF316-51 | |
| Average Intel Core i5-11320H (24718 - 26858, n=4) | |
| Acer Swift X SFX16-51G-5388 | |
| 7-Zip 18.03 / 7z b 4 -mmt1 | |
| Average of class Multimedia (3666 - 7545, n=63, last 2 years) | |
| Asus Vivobook Pro 16X-M7600QE | |
| Asus Vivobook Pro 16X-M7600QE | |
| Dell Inspiron 16 Plus 7610 | |
| Acer Swift 3 SF316-51 | |
| Lenovo IdeaPad 5 Pro 16ACH | |
| Average Intel Core i5-11320H (4813 - 5119, n=4) | |
| Acer Swift X SFX16-51G-5388 | |
| Acer Swift X SFX14-41G-R7F3 | |
| Geekbench 5.5 / Multi-Core | |
| Average of class Multimedia (4652 - 20422, n=62, last 2 years) | |
| Asus Vivobook Pro 16X-M7600QE | |
| Asus Vivobook Pro 16X-M7600QE | |
| Lenovo IdeaPad 5 Pro 16ACH | |
| Acer Swift 3 SF316-51 | |
| Acer Swift X SFX16-51G-5388 | |
| Acer Swift X SFX14-41G-R7F3 | |
| Average Intel Core i5-11320H (4927 - 5955, n=4) | |
| Geekbench 5.5 / Single-Core | |
| Average of class Multimedia (805 - 2974, n=62, last 2 years) | |
| Acer Swift 3 SF316-51 | |
| Asus Vivobook Pro 16X-M7600QE | |
| Asus Vivobook Pro 16X-M7600QE | |
| Average Intel Core i5-11320H (1453 - 1523, n=4) | |
| Acer Swift X SFX16-51G-5388 | |
| Lenovo IdeaPad 5 Pro 16ACH | |
| Acer Swift X SFX14-41G-R7F3 | |
| Geekbench 5.5 / OpenCL Score | |
| Average of class Multimedia (11562 - 217159, n=62, last 2 years) | |
| Asus Vivobook Pro 16X-M7600QE | |
| Asus Vivobook Pro 16X-M7600QE | |
| Acer Swift X SFX16-51G-5388 | |
| Lenovo IdeaPad 5 Pro 16ACH | |
| Acer Swift X SFX14-41G-R7F3 | |
| Average Intel Core i5-11320H (17641 - 50997, n=4) | |
| Acer Swift 3 SF316-51 | |
| HWBOT x265 Benchmark v2.2 / 4k Preset | |
| Average of class Multimedia (5.26 - 36.1, n=63, last 2 years) | |
| Asus Vivobook Pro 16X-M7600QE | |
| Asus Vivobook Pro 16X-M7600QE | |
| Lenovo IdeaPad 5 Pro 16ACH | |
| Dell Inspiron 16 Plus 7610 | |
| Acer Swift X SFX14-41G-R7F3 | |
| Acer Swift X SFX16-51G-5388 | |
| Acer Swift 3 SF316-51 | |
| Average Intel Core i5-11320H (7.25 - 7.91, n=4) | |
| LibreOffice / 20 Documents To PDF | |
| Asus Vivobook Pro 16X-M7600QE | |
| Asus Vivobook Pro 16X-M7600QE | |
| Acer Swift X SFX16-51G-5388 | |
| Average of class Multimedia (23.9 - 146.7, n=64, last 2 years) | |
| Average Intel Core i5-11320H (44 - 50, n=4) | |
| Lenovo IdeaPad 5 Pro 16ACH | |
| Dell Inspiron 16 Plus 7610 | |
| Acer Swift 3 SF316-51 | |
| R Benchmark 2.5 / Overall mean | |
| Acer Swift X SFX14-41G-R7F3 | |
| Average Intel Core i5-11320H (0.581 - 0.622, n=4) | |
| Acer Swift X SFX16-51G-5388 | |
| Dell Inspiron 16 Plus 7610 | |
| Acer Swift 3 SF316-51 | |
| Lenovo IdeaPad 5 Pro 16ACH | |
| Asus Vivobook Pro 16X-M7600QE | |
| Asus Vivobook Pro 16X-M7600QE | |
| Average of class Multimedia (0.3604 - 0.947, n=63, last 2 years) | |
| V-Ray 5 Benchmark / CPU | |
| Average of class Multimedia (3126 - 16017, n=30, last 2 years) | |
| Dell Inspiron 16 Plus 7610 | |
| Acer Swift X SFX16-51G-5388 | |
| Average Intel Core i5-11320H (3985 - 4415, n=4) | |
| V-Ray 5 Benchmark / GPU CUDA | |
| Average of class Multimedia (277 - 1482, n=7, last 2 years) | |
| Acer Swift X SFX16-51G-5388 | |
| Average Intel Core i5-11320H (99 - 374, n=2) | |
| WebXPRT 3 / Overall | |
| Average of class Multimedia (136.4 - 596, n=70, last 2 years) | |
| Asus Vivobook Pro 16X-M7600QE | |
| Lenovo IdeaPad 5 Pro 16ACH | |
| Acer Swift 3 SF316-51 | |
| Average Intel Core i5-11320H (243 - 269, n=4) | |
| Dell Inspiron 16 Plus 7610 | |
| Acer Swift X SFX16-51G-5388 | |
| Acer Swift X SFX14-41G-R7F3 | |
| WebXPRT 4 / Overall | |
| Average of class Multimedia (167.3 - 402, n=71, last 2 years) | |
| Average Intel Core i5-11320H (202 - 206, n=3) | |
| Acer Swift X SFX16-51G-5388 | |
| Mozilla Kraken 1.1 / Total | |
| Acer Swift X SFX14-41G-R7F3 | |
| Acer Swift X SFX16-51G-5388 | |
| Average Intel Core i5-11320H (662 - 680, n=4) | |
| Lenovo IdeaPad 5 Pro 16ACH | |
| Dell Inspiron 16 Plus 7610 | |
| Acer Swift 3 SF316-51 | |
| Asus Vivobook Pro 16X-M7600QE | |
| Asus Vivobook Pro 16X-M7600QE | |
| Average of class Multimedia (228 - 835, n=73, last 2 years) | |
| Octane V2 / Total Score | |
| Average of class Multimedia (64079 - 153175, n=34, last 2 years) | |
| Acer Swift X SFX16-51G-5388 | |
| Average Intel Core i5-11320H (n=1) | |
| Acer Swift X SFX14-41G-R7F3 | |
| Jetstream 2 / 2.0 Total | |
| Average of class Multimedia (287 - 481, n=35, last 2 years) | |
| Acer Swift X SFX16-51G-5388 | |
| Average Intel Core i5-11320H (174.3 - 208, n=3) | |
| Dell Inspiron 16 Plus 7610 | |
* ... smaller is better
AIDA64: FP32 Ray-Trace | FPU Julia | CPU SHA3 | CPU Queen | FPU SinJulia | FPU Mandel | CPU AES | CPU ZLib | FP64 Ray-Trace | CPU PhotoWorxx
| Performance rating | |
| Average of class Multimedia | |
| Asus Vivobook Pro 16X-M7600QE | |
| Lenovo IdeaPad 5 Pro 16ACH | |
| Acer Swift X SFX14-41G-R7F3 | |
| Average Intel Core i5-11320H | |
| Acer Swift X SFX16-51G-5388 | |
| Dell Inspiron 16 Plus 7610 -9! | |
| AIDA64 / FP32 Ray-Trace | |
| Average of class Multimedia (2214 - 50388, n=60, last 2 years) | |
| Asus Vivobook Pro 16X-M7600QE | |
| Asus Vivobook Pro 16X-M7600QE | |
| Lenovo IdeaPad 5 Pro 16ACH | |
| Acer Swift X SFX14-41G-R7F3 | |
| Average Intel Core i5-11320H (6369 - 7489, n=4) | |
| Acer Swift X SFX16-51G-5388 | |
| AIDA64 / FPU Julia | |
| Asus Vivobook Pro 16X-M7600QE | |
| Asus Vivobook Pro 16X-M7600QE | |
| Lenovo IdeaPad 5 Pro 16ACH | |
| Average of class Multimedia (12867 - 201874, n=61, last 2 years) | |
| Acer Swift X SFX14-41G-R7F3 | |
| Average Intel Core i5-11320H (27391 - 31637, n=4) | |
| Acer Swift X SFX16-51G-5388 | |
| AIDA64 / CPU SHA3 | |
| Average of class Multimedia (626 - 8623, n=61, last 2 years) | |
| Asus Vivobook Pro 16X-M7600QE | |
| Asus Vivobook Pro 16X-M7600QE | |
| Lenovo IdeaPad 5 Pro 16ACH | |
| Average Intel Core i5-11320H (1847 - 2099, n=4) | |
| Acer Swift X SFX16-51G-5388 | |
| Acer Swift X SFX14-41G-R7F3 | |
| AIDA64 / CPU Queen | |
| Asus Vivobook Pro 16X-M7600QE | |
| Asus Vivobook Pro 16X-M7600QE | |
| Lenovo IdeaPad 5 Pro 16ACH | |
| Average of class Multimedia (13483 - 181505, n=48, last 2 years) | |
| Acer Swift X SFX14-41G-R7F3 | |
| Average Intel Core i5-11320H (43565 - 52477, n=4) | |
| Acer Swift X SFX16-51G-5388 | |
| AIDA64 / FPU SinJulia | |
| Asus Vivobook Pro 16X-M7600QE | |
| Asus Vivobook Pro 16X-M7600QE | |
| Lenovo IdeaPad 5 Pro 16ACH | |
| Acer Swift X SFX14-41G-R7F3 | |
| Average of class Multimedia (886 - 28794, n=61, last 2 years) | |
| Average Intel Core i5-11320H (4381 - 5011, n=4) | |
| Acer Swift X SFX16-51G-5388 | |
| AIDA64 / FPU Mandel | |
| Asus Vivobook Pro 16X-M7600QE | |
| Asus Vivobook Pro 16X-M7600QE | |
| Lenovo IdeaPad 5 Pro 16ACH | |
| Average of class Multimedia (6395 - 105740, n=60, last 2 years) | |
| Acer Swift X SFX14-41G-R7F3 | |
| Average Intel Core i5-11320H (16659 - 18770, n=4) | |
| Acer Swift X SFX16-51G-5388 | |
| AIDA64 / CPU AES | |
| Asus Vivobook Pro 16X-M7600QE | |
| Asus Vivobook Pro 16X-M7600QE | |
| Lenovo IdeaPad 5 Pro 16ACH | |
| Average Intel Core i5-11320H (59851 - 76500, n=4) | |
| Average of class Multimedia (8171 - 126790, n=61, last 2 years) | |
| Acer Swift X SFX16-51G-5388 | |
| Acer Swift X SFX14-41G-R7F3 | |
| AIDA64 / CPU ZLib | |
| Average of class Multimedia (143.8 - 2022, n=61, last 2 years) | |
| Asus Vivobook Pro 16X-M7600QE | |
| Asus Vivobook Pro 16X-M7600QE | |
| Lenovo IdeaPad 5 Pro 16ACH | |
| Acer Swift X SFX14-41G-R7F3 | |
| Average Intel Core i5-11320H (330 - 410, n=4) | |
| Acer Swift X SFX16-51G-5388 | |
| Dell Inspiron 16 Plus 7610 | |
| AIDA64 / FP64 Ray-Trace | |
| Average of class Multimedia (1014 - 26875, n=61, last 2 years) | |
| Asus Vivobook Pro 16X-M7600QE | |
| Asus Vivobook Pro 16X-M7600QE | |
| Lenovo IdeaPad 5 Pro 16ACH | |
| Acer Swift X SFX14-41G-R7F3 | |
| Average Intel Core i5-11320H (3536 - 4021, n=4) | |
| Acer Swift X SFX16-51G-5388 | |
| AIDA64 / CPU PhotoWorxx | |
| Average of class Multimedia (8187 - 88154, n=61, last 2 years) | |
| Acer Swift X SFX16-51G-5388 | |
| Average Intel Core i5-11320H (25964 - 36644, n=4) | |
| Asus Vivobook Pro 16X-M7600QE | |
| Asus Vivobook Pro 16X-M7600QE | |
| Acer Swift X SFX14-41G-R7F3 | |
| Lenovo IdeaPad 5 Pro 16ACH | |
System Performance
The system works very quickly and without lags, even while working with multiple tabs and playing a 4K YouTube video in the background.
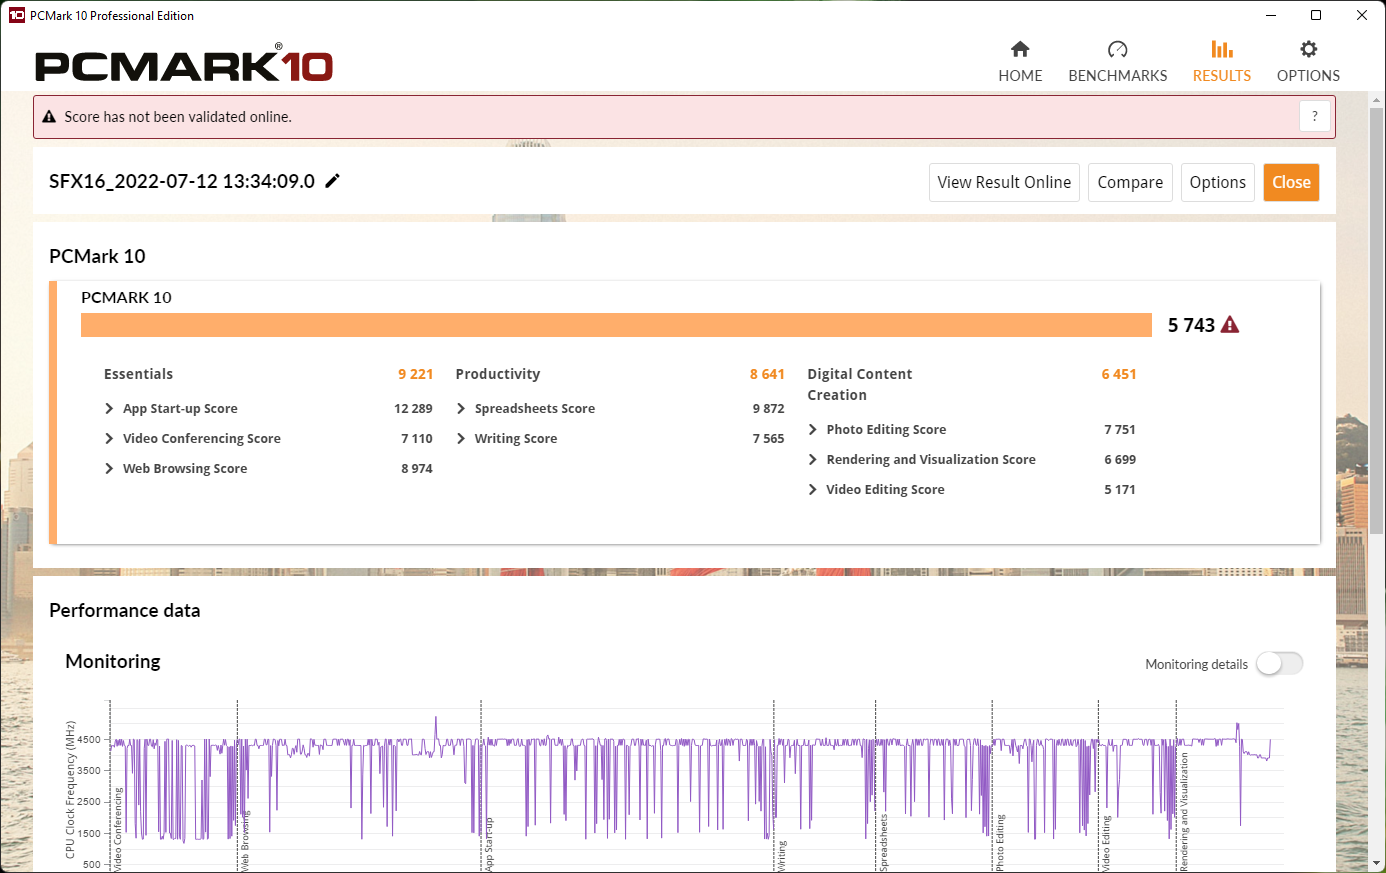
The PCMark 10 scores are relatively close to each other in our comparison field. The Acer Swift X stands out the most in terms of AIDA64/memory scores, likely due to its fast LPDDR4X RAM.
CrossMark: Overall | Productivity | Creativity | Responsiveness
| PCMark 10 / Score | |
| Average of class Multimedia (4325 - 10386, n=58, last 2 years) | |
| Asus Vivobook Pro 16X-M7600QE | |
| Dell Inspiron 16 Plus 7610 | |
| Lenovo IdeaPad 5 Pro 16ACH | |
| Acer Swift X SFX16-51G-5388 | |
| Average Intel Core i5-11320H, NVIDIA GeForce RTX 3050 4GB Laptop GPU (n=1) | |
| Acer Swift 3 SF316-51 | |
| Acer Swift X SFX14-41G-R7F3 | |
| PCMark 10 / Essentials | |
| Asus Vivobook Pro 16X-M7600QE | |
| Average of class Multimedia (8025 - 11664, n=57, last 2 years) | |
| Acer Swift 3 SF316-51 | |
| Lenovo IdeaPad 5 Pro 16ACH | |
| Dell Inspiron 16 Plus 7610 | |
| Acer Swift X SFX16-51G-5388 | |
| Average Intel Core i5-11320H, NVIDIA GeForce RTX 3050 4GB Laptop GPU (n=1) | |
| Acer Swift X SFX14-41G-R7F3 | |
| PCMark 10 / Productivity | |
| Average of class Multimedia (7323 - 18233, n=57, last 2 years) | |
| Asus Vivobook Pro 16X-M7600QE | |
| Acer Swift X SFX16-51G-5388 | |
| Average Intel Core i5-11320H, NVIDIA GeForce RTX 3050 4GB Laptop GPU (n=1) | |
| Dell Inspiron 16 Plus 7610 | |
| Lenovo IdeaPad 5 Pro 16ACH | |
| Acer Swift 3 SF316-51 | |
| Acer Swift X SFX14-41G-R7F3 | |
| PCMark 10 / Digital Content Creation | |
| Average of class Multimedia (3651 - 16240, n=57, last 2 years) | |
| Dell Inspiron 16 Plus 7610 | |
| Asus Vivobook Pro 16X-M7600QE | |
| Lenovo IdeaPad 5 Pro 16ACH | |
| Acer Swift X SFX16-51G-5388 | |
| Average Intel Core i5-11320H, NVIDIA GeForce RTX 3050 4GB Laptop GPU (n=1) | |
| Acer Swift 3 SF316-51 | |
| Acer Swift X SFX14-41G-R7F3 | |
| CrossMark / Overall | |
| Average of class Multimedia (866 - 2728, n=67, last 2 years) | |
| Acer Swift X SFX16-51G-5388 | |
| Average Intel Core i5-11320H, NVIDIA GeForce RTX 3050 4GB Laptop GPU (n=1) | |
| Acer Swift X SFX14-41G-R7F3 | |
| CrossMark / Productivity | |
| Average of class Multimedia (931 - 2489, n=67, last 2 years) | |
| Acer Swift X SFX16-51G-5388 | |
| Average Intel Core i5-11320H, NVIDIA GeForce RTX 3050 4GB Laptop GPU (n=1) | |
| Acer Swift X SFX14-41G-R7F3 | |
| CrossMark / Creativity | |
| Average of class Multimedia (907 - 3465, n=67, last 2 years) | |
| Acer Swift X SFX16-51G-5388 | |
| Average Intel Core i5-11320H, NVIDIA GeForce RTX 3050 4GB Laptop GPU (n=1) | |
| Acer Swift X SFX14-41G-R7F3 | |
| CrossMark / Responsiveness | |
| Average of class Multimedia (605 - 2024, n=67, last 2 years) | |
| Acer Swift X SFX16-51G-5388 | |
| Average Intel Core i5-11320H, NVIDIA GeForce RTX 3050 4GB Laptop GPU (n=1) | |
| Acer Swift X SFX14-41G-R7F3 | |
| PCMark 10 Score | 5743 points | |
Help | ||
| AIDA64 / Memory Copy | |
| Average of class Multimedia (11299 - 132135, n=61, last 2 years) | |
| Acer Swift X SFX16-51G-5388 | |
| Average Intel Core i5-11320H (41106 - 55961, n=4) | |
| Lenovo IdeaPad 5 Pro 16ACH | |
| Huawei MateBook 16 R7 5800H | |
| Acer Swift X SFX14-41G-R7F3 | |
| AIDA64 / Memory Read | |
| Average of class Multimedia (11624 - 174586, n=61, last 2 years) | |
| Acer Swift X SFX16-51G-5388 | |
| Average Intel Core i5-11320H (46516 - 52799, n=4) | |
| Acer Swift X SFX14-41G-R7F3 | |
| Lenovo IdeaPad 5 Pro 16ACH | |
| Huawei MateBook 16 R7 5800H | |
| AIDA64 / Memory Write | |
| Average of class Multimedia (11755 - 134998, n=61, last 2 years) | |
| Acer Swift X SFX16-51G-5388 | |
| Average Intel Core i5-11320H (46760 - 63323, n=4) | |
| Acer Swift X SFX14-41G-R7F3 | |
| Huawei MateBook 16 R7 5800H | |
| Lenovo IdeaPad 5 Pro 16ACH | |
| AIDA64 / Memory Latency | |
| Average of class Multimedia (7 - 535, n=60, last 2 years) | |
| Acer Swift X SFX14-41G-R7F3 | |
| Acer Swift X SFX16-51G-5388 | |
| Average Intel Core i5-11320H (77.6 - 114.1, n=4) | |
| Huawei MateBook 16 R7 5800H | |
| Lenovo IdeaPad 5 Pro 16ACH | |
| Dell Inspiron 16 Plus 7610 | |
* ... smaller is better
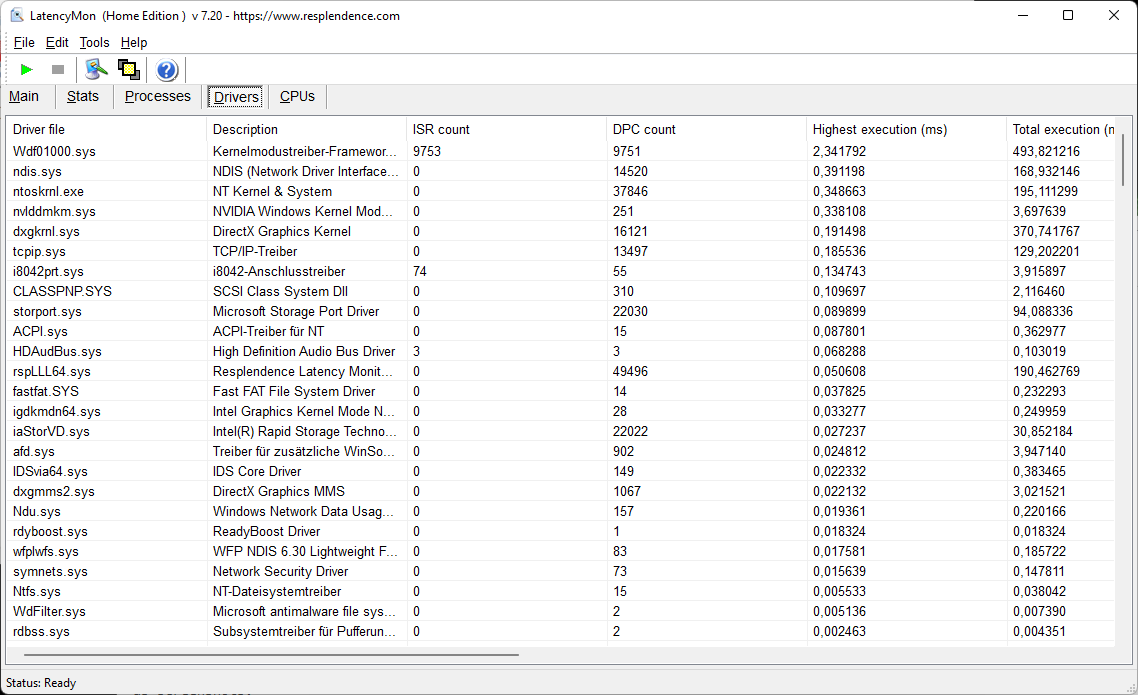
DPC Latency
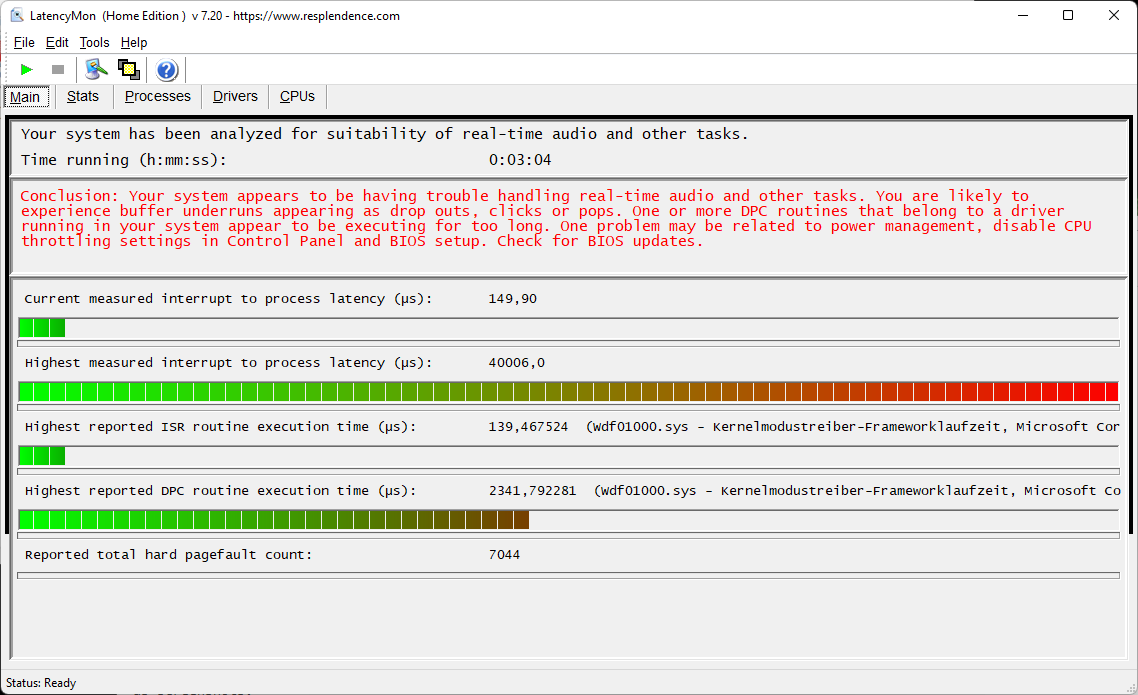
DPC latencies are surprisingly high, which is why we repeated the test several times, but with very similar results: 0.04 seconds of delay is very slow, so that real-time applications (audio/video) are not recommended. Acer should urgently improve this with a BIOS update.
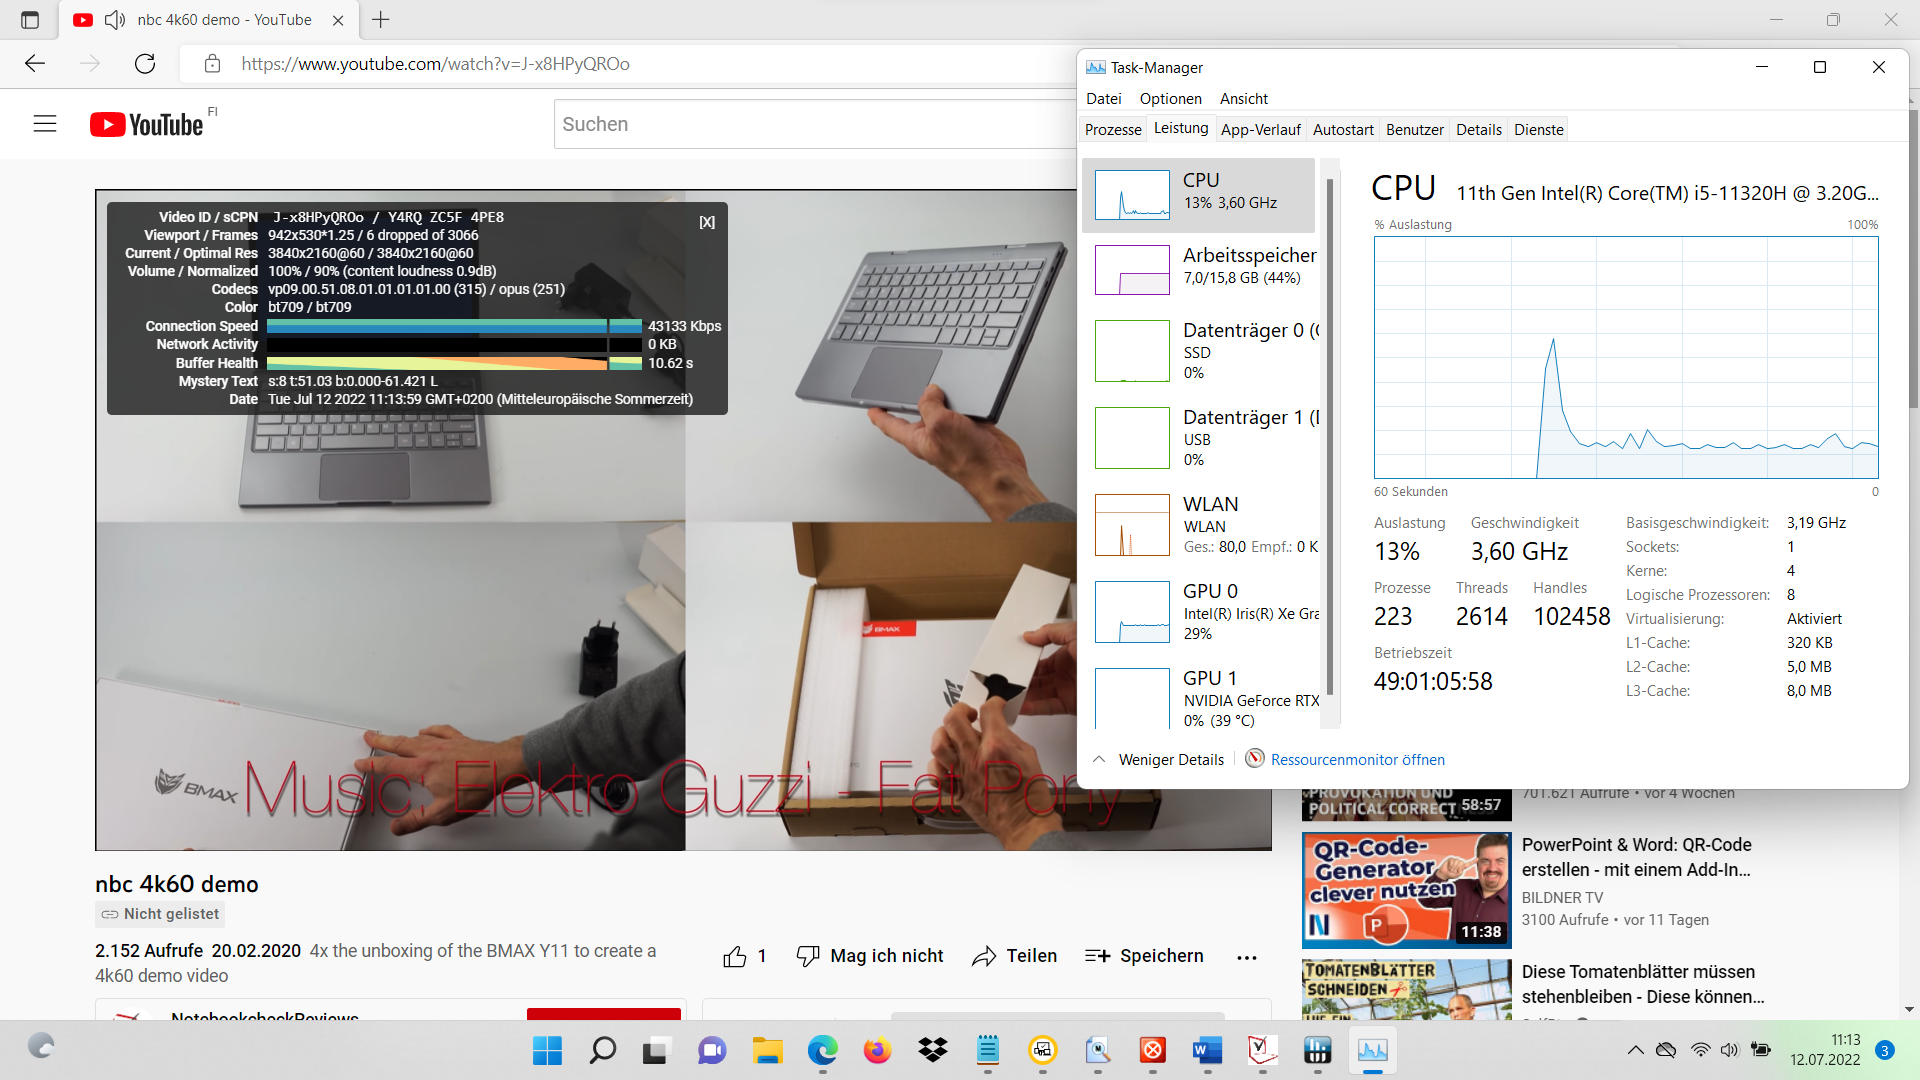
As is so often the case, the cause is the core module driver. 4K YouTube playback causes a CPU load of 13% and almost 30% for the Intel GPU.
| DPC Latencies / LatencyMon - interrupt to process latency (max), Web, Youtube, Prime95 | |
| Acer Swift X SFX16-51G-5388 | |
| Asus Vivobook Pro 16X-M7600QE | |
| Dell Inspiron 16 Plus 7610 | |
| Acer Swift X SFX14-41G-R7F3 | |
| Lenovo IdeaPad 5 Pro 16ACH | |
| Huawei MateBook 16 R7 5800H | |
| Acer Swift 3 SF316-51 | |
* ... smaller is better
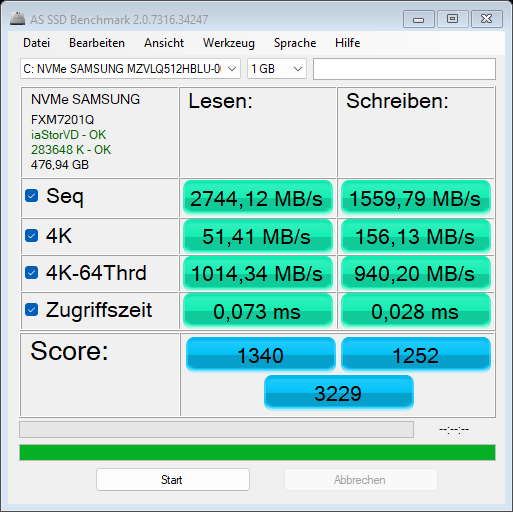
Storage Devices
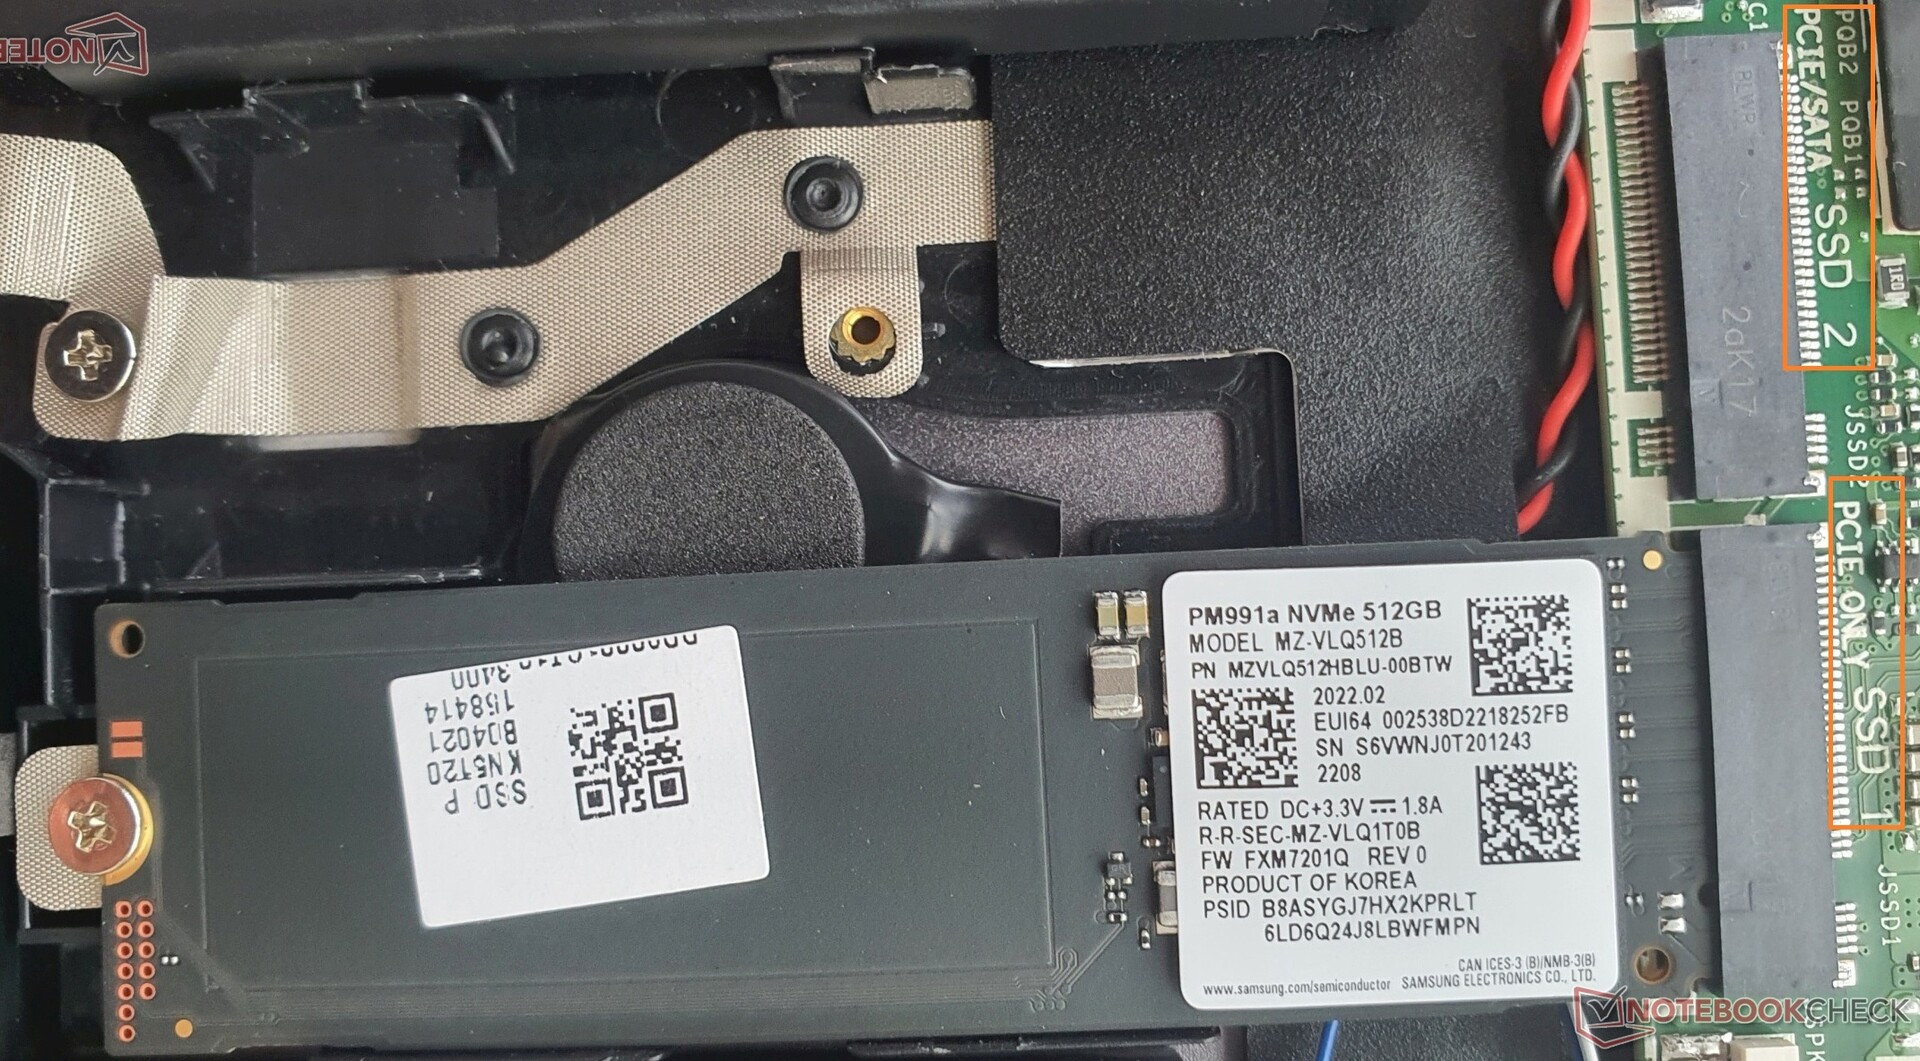
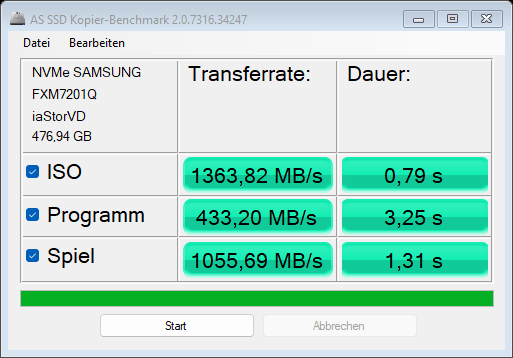
The Samsung PM991 PCIe 3.0 SSD shows average speeds. After a few minutes, however, it drops by ~40%, apparently due to overheating. The Samsung PM991 also shows this behaviour in some of our other laptop tests and is therefore not specific to the Acer Swift X 16.
In contrast to the Swift 3, there is a second M.2 slot for another SSD.
| Acer Swift X SFX16-51G-5388 GeForce RTX 3050 4GB Laptop GPU, i5-11320H, Samsung PM991 MZVLQ512HBLU | Acer Swift 3 SF316-51 Iris Xe G7 96EUs, i7-11370H, Micron 2210 MTFDHBA512QFD | Acer Swift X SFX14-41G-R7F3 GeForce GTX 1650 Mobile, R5 5500U, WDC PC SN530 SDBPNPZ-1T00 | Lenovo IdeaPad 5 Pro 16ACH GeForce GTX 1650 Mobile, R7 5800H, Micron 2300 512GB MTFDHBA512TDV | Dell Inspiron 16 Plus 7610 GeForce RTX 3050 4GB Laptop GPU, i7-11800H, Kingston OM3PDP3512B | Asus Vivobook Pro 16X-M7600QE GeForce RTX 3050 Ti Laptop GPU, R9 5900HX, SK Hynix HFM001TD3JX013N | |
|---|---|---|---|---|---|---|
| AS SSD | -0% | -5% | -19% | -12% | 12% | |
| Seq Read (MB/s) | 2744.12 | 2015 -27% | 2091 -24% | 2643 -4% | 2077 -24% | 2913 6% |
| Seq Write (MB/s) | 1559.79 | 1055 -32% | 1856 19% | 1510 -3% | 778 -50% | 1806 16% |
| 4K Read (MB/s) | 51.41 | 73.9 44% | 27.51 -46% | 42.86 -17% | 49.6 -4% | 47.67 -7% |
| 4K Write (MB/s) | 156.13 | 223.2 43% | 116.3 -26% | 85.5 -45% | 236.1 51% | 101.5 -35% |
| 4K-64 Read (MB/s) | 1014.34 | 589 -42% | 812 -20% | 768 -24% | 801 -21% | 1382 36% |
| 4K-64 Write (MB/s) | 940.2 | 1029 9% | 1415 50% | 1983 111% | 942 0% | 2164 130% |
| Access Time Read * (ms) | 0.073 | 0.056 23% | 0.103 -41% | 0.06 18% | 0.044 40% | |
| Access Time Write * (ms) | 0.028 | 0.039 -39% | 0.033 -18% | 0.101 -261% | 0.073 -161% | 0.109 -289% |
| Score Read (Points) | 1340 | 865 -35% | 1048 -22% | 1075 -20% | 1059 -21% | 1720 28% |
| Score Write (Points) | 1252 | 1358 8% | 1717 37% | 2220 77% | 1256 0% | 2446 95% |
| Score Total (Points) | 3229 | 2644 -18% | 3292 2% | 3797 18% | 2804 -13% | 4995 55% |
| Copy ISO MB/s (MB/s) | 1363.82 | 1186 -13% | 1028 -25% | 2649 94% | ||
| Copy Program MB/s (MB/s) | 433.2 | 782 81% | 794 83% | 372.8 -14% | ||
| Copy Game MB/s (MB/s) | 1055.69 | 1028 -3% | 987 -7% | 1126 7% |
* ... smaller is better
* ... smaller is better
Sustained Performance Read: DiskSpd Read Loop, Queue Depth 8
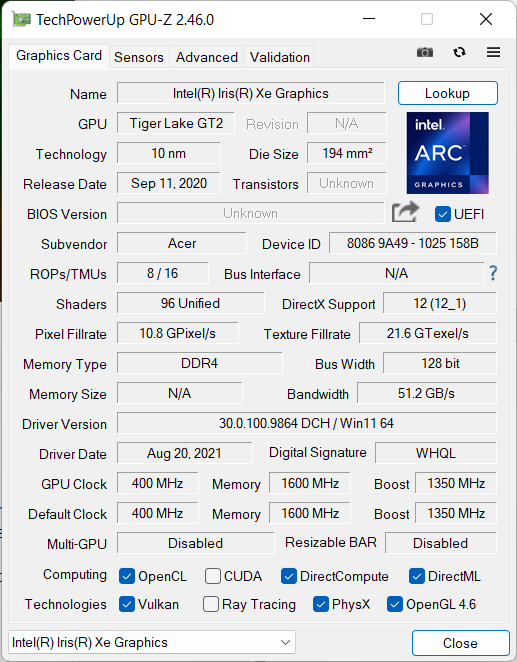
Graphics Card

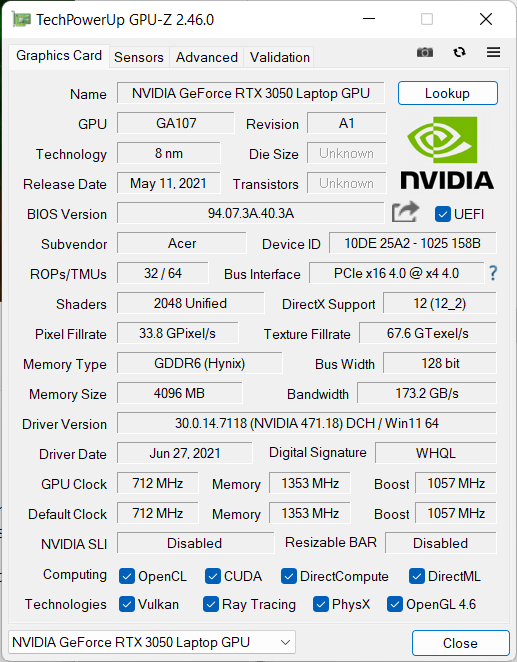
Acer's Swift X 16 comes with an Intel Xe G7 (96EUs) iGPU and the Nvidia GeForce RTX 3050 in the smallest variant with a 35-watt TGP + 5-watt Dynamic Boost. This ensures that new games can be displayed in Full HD at medium to high details and allows for the rendering of some videos.
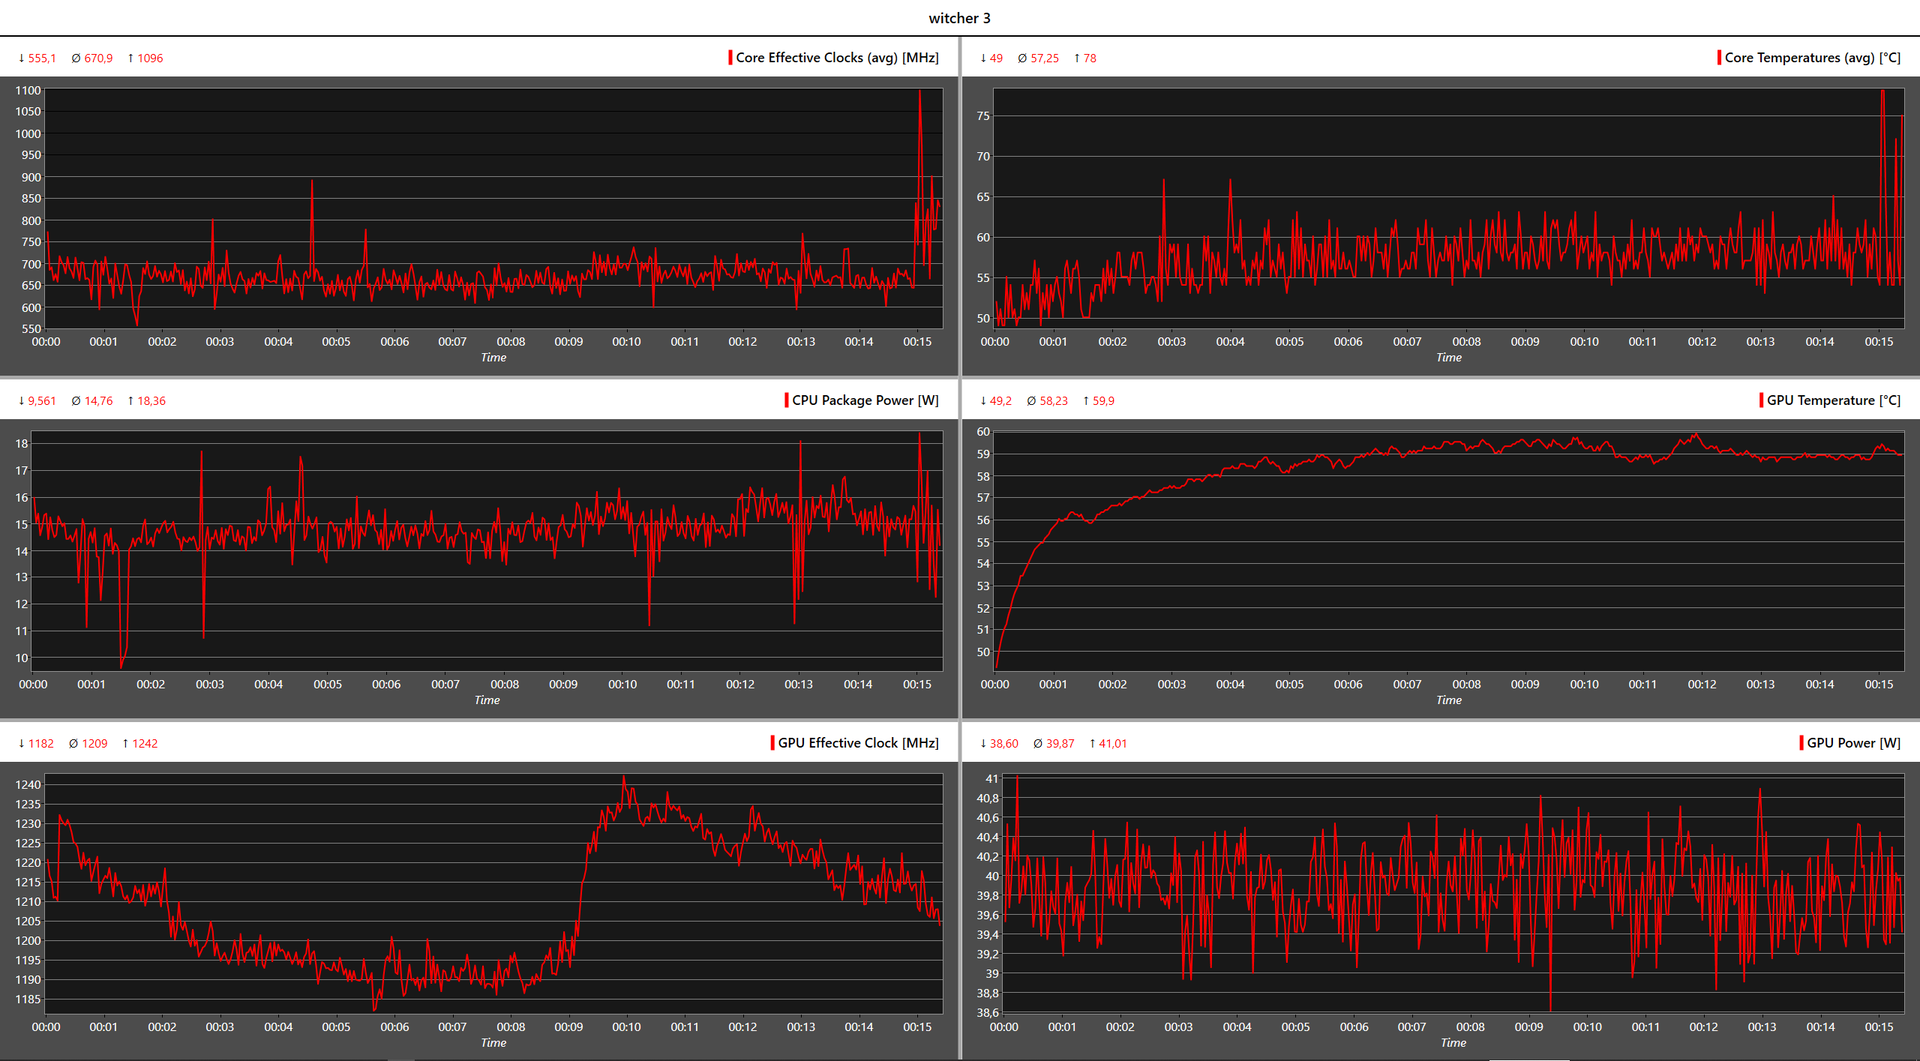
The boost clock of 1,057 MHz is surpassed with an average of 1,209 MHz, which is due to the Dynamic Boost. The GPU temperature does not even climb to 60 °C.
Faster gamers in our comparison field are only the Asus Vivobook Pro 16X (by ~20 %) and Dells Inspiron 16 Plus (by ~40 %), which allow their RTX 3050 a higher TGP (50 and 65 watts, respectively). The IdeaPad 5 Pro 16 with GTX 1650 can be outperformed by 10 to 25% depending on the benchmark/game.
In battery mode, the GPU performance drops by about 15%.
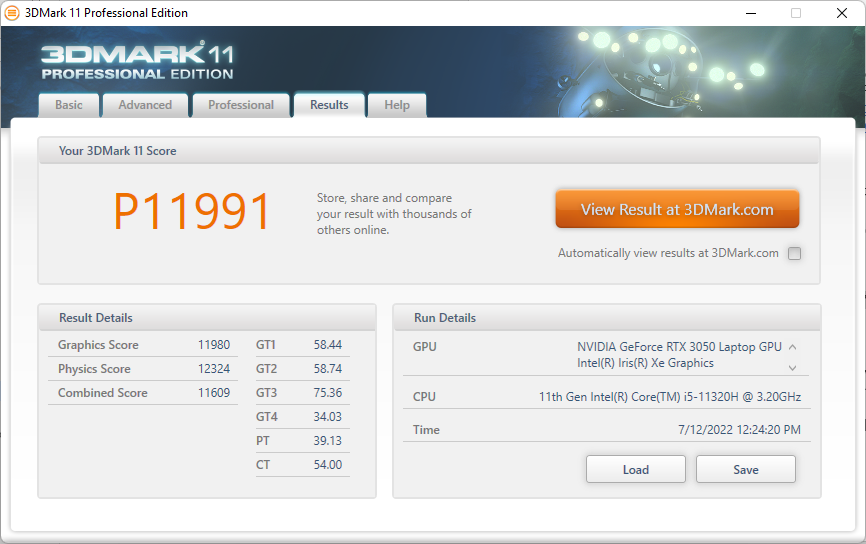
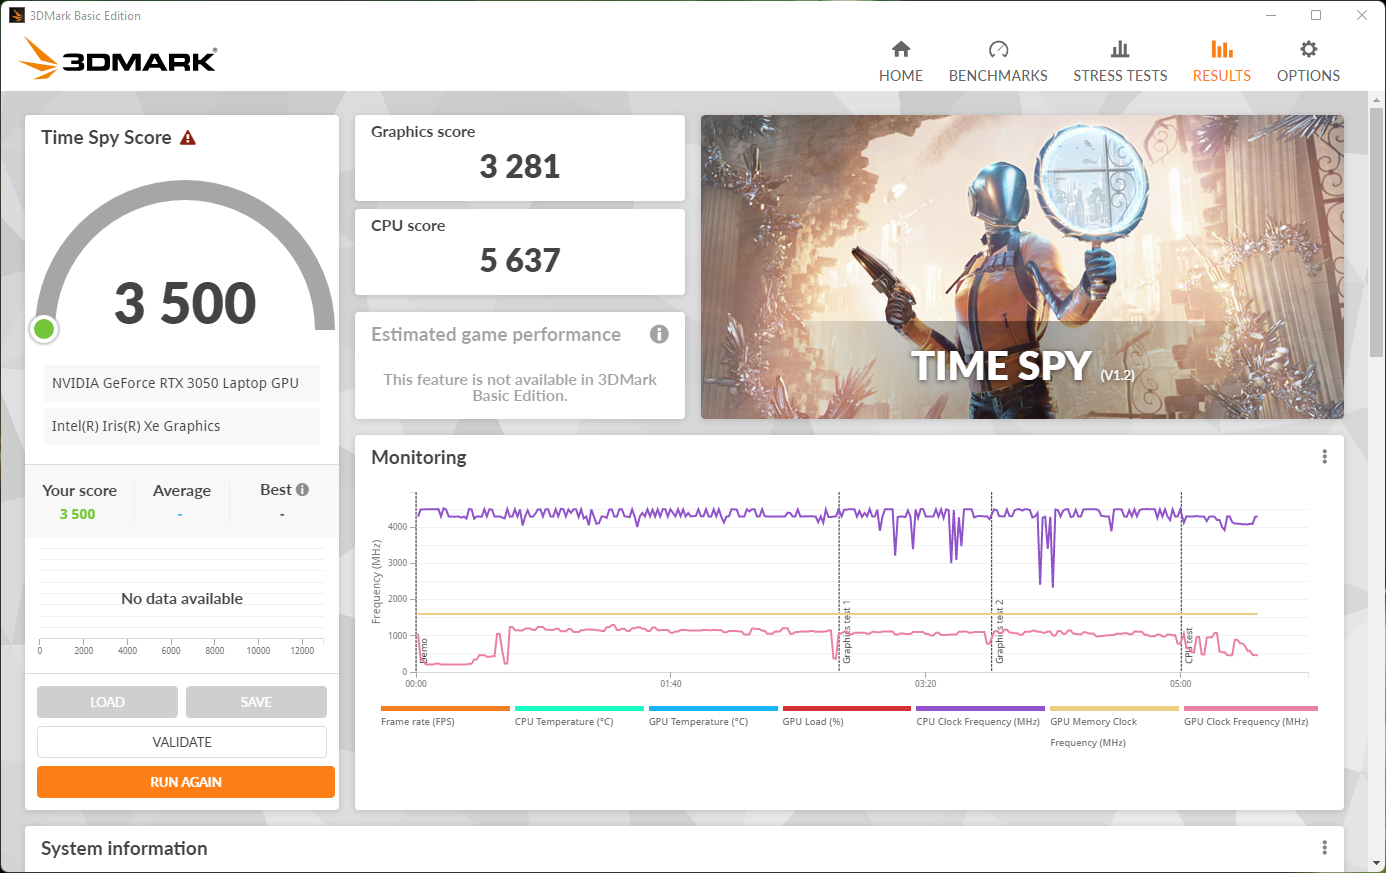
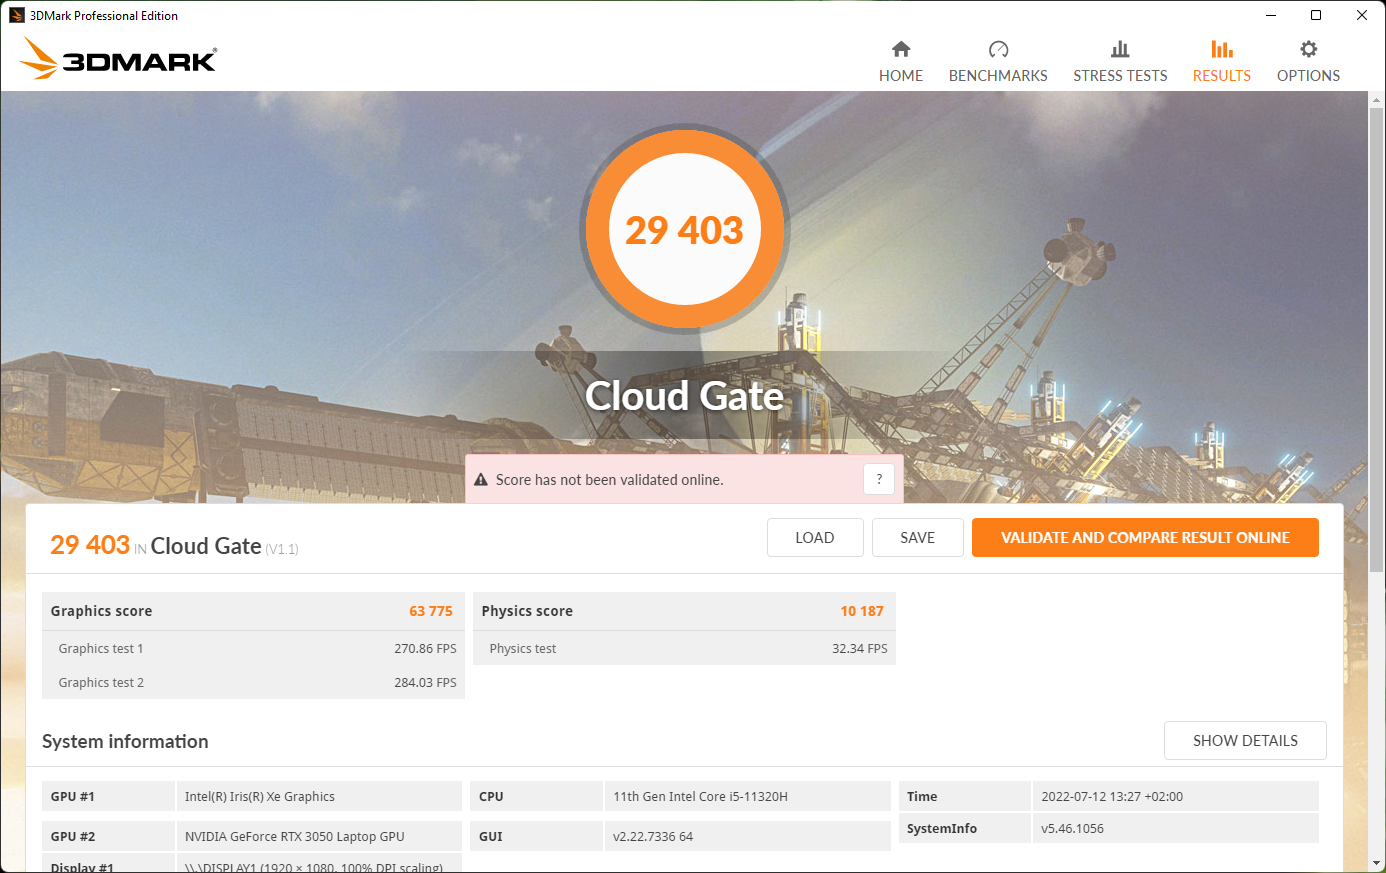
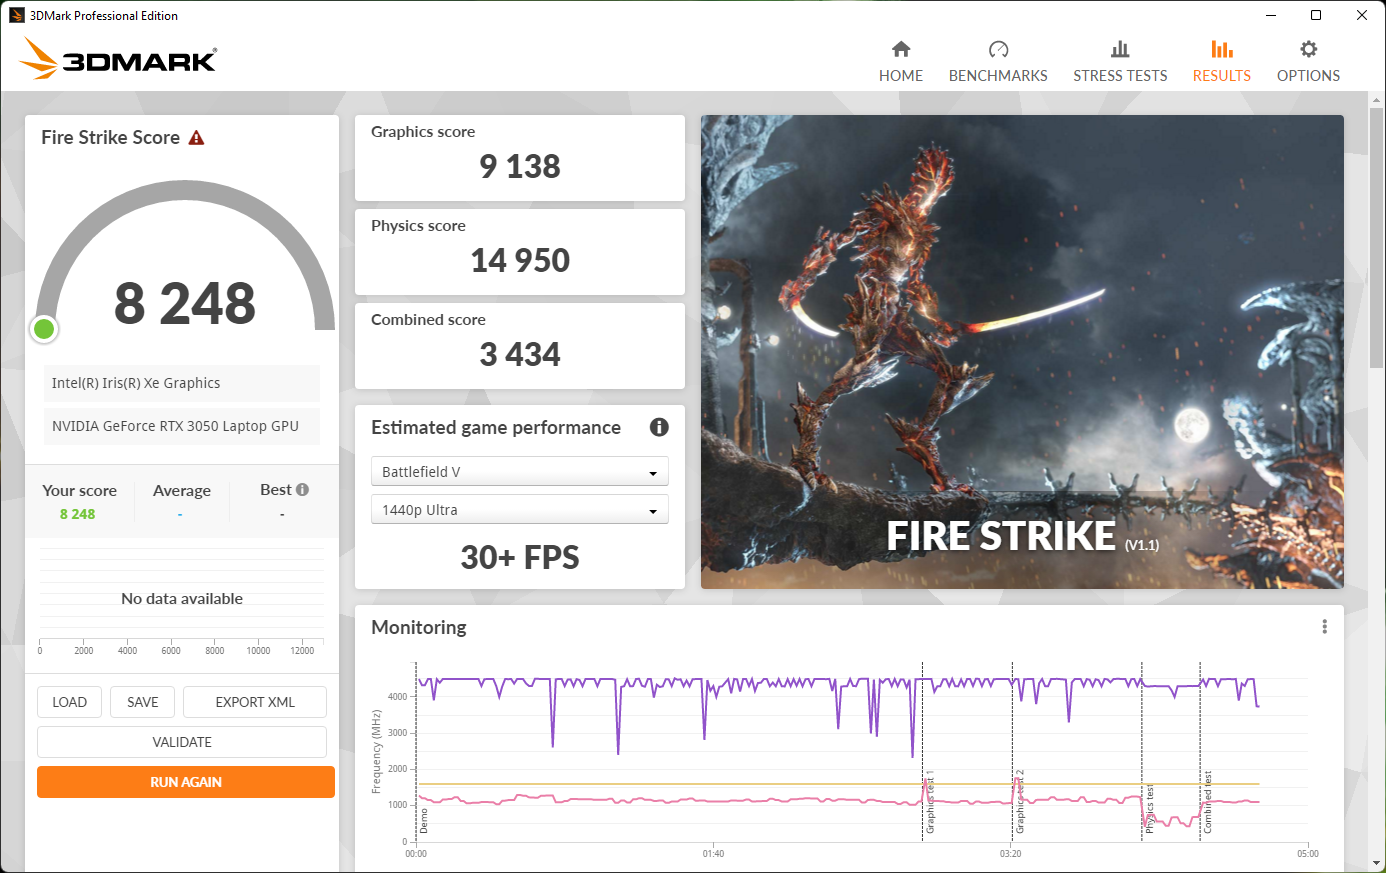
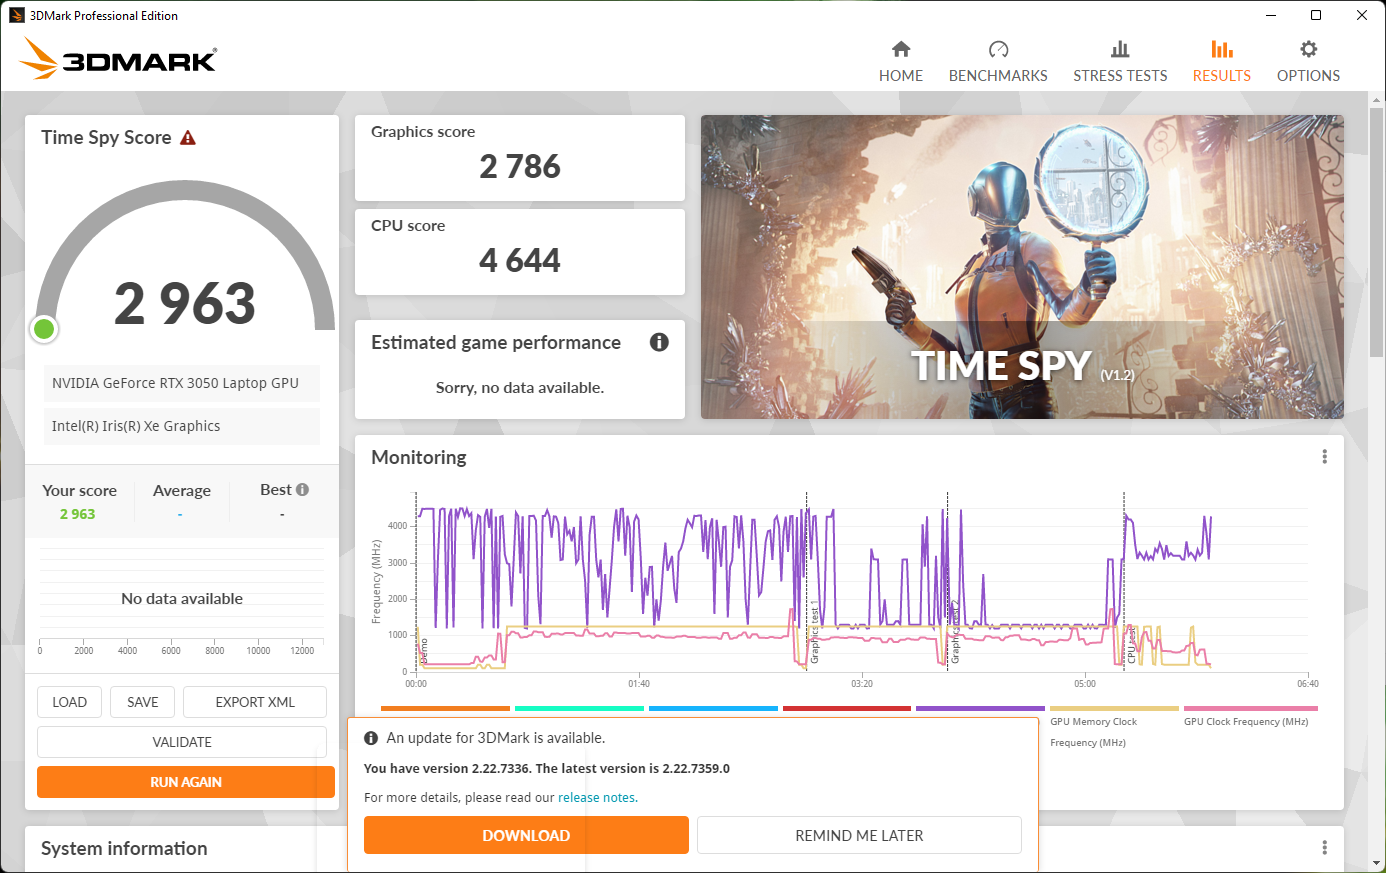
| 3DMark 11 Performance | 11991 points | |
| 3DMark Cloud Gate Standard Score | 29403 points | |
| 3DMark Fire Strike Score | 9249 points | |
| 3DMark Time Spy Score | 3500 points | |
Help | ||
| Ghostwire Tokyo - 1920x1080 High Settings | |
| Average NVIDIA GeForce RTX 3050 4GB Laptop GPU (55.7 - 79.7, n=3) | |
| Acer Swift X SFX16-51G-5388 | |
The one-hour Wichter 3 stress test shows fairly stable performance levels based on the FPS curve
Witcher 3 FPS Chart
| low | med. | high | ultra | |
|---|---|---|---|---|
| GTA V (2015) | 170.4 | 163.1 | 99.2 | 48 |
| The Witcher 3 (2015) | 183.9 | 106.7 | 58.7 | 31.5 |
| Dota 2 Reborn (2015) | 138.6 | 122.7 | 119.4 | 116 |
| Final Fantasy XV Benchmark (2018) | 97.4 | 48.7 | 35.9 | |
| X-Plane 11.11 (2018) | 104.7 | 87 | 72.5 | |
| Far Cry 5 (2018) | 104 | 64 | 56 | 59 |
| Strange Brigade (2018) | 216 | 90.4 | 72.1 | 62.1 |
| Ghostwire Tokyo (2022) | 58.2 | 55.7 | 53.9 |
Emissions: Acer Swift X 16 with Silent mode
System Noise
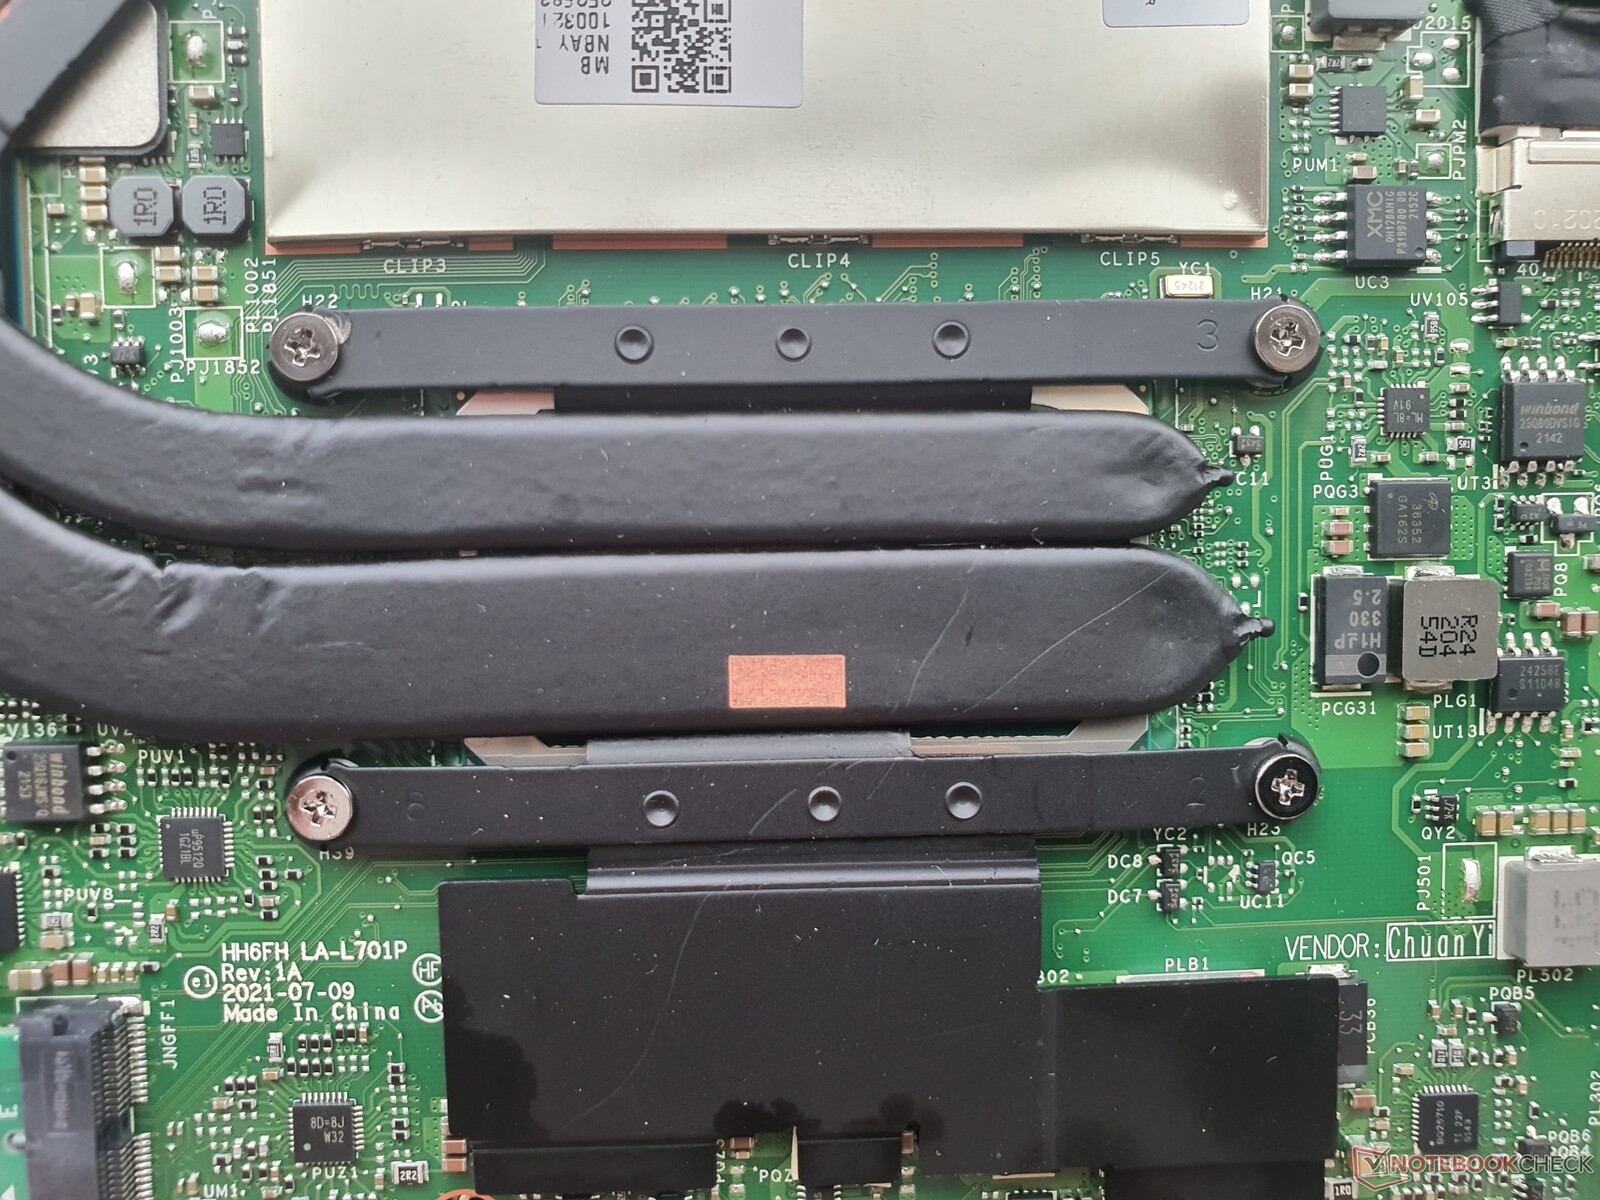
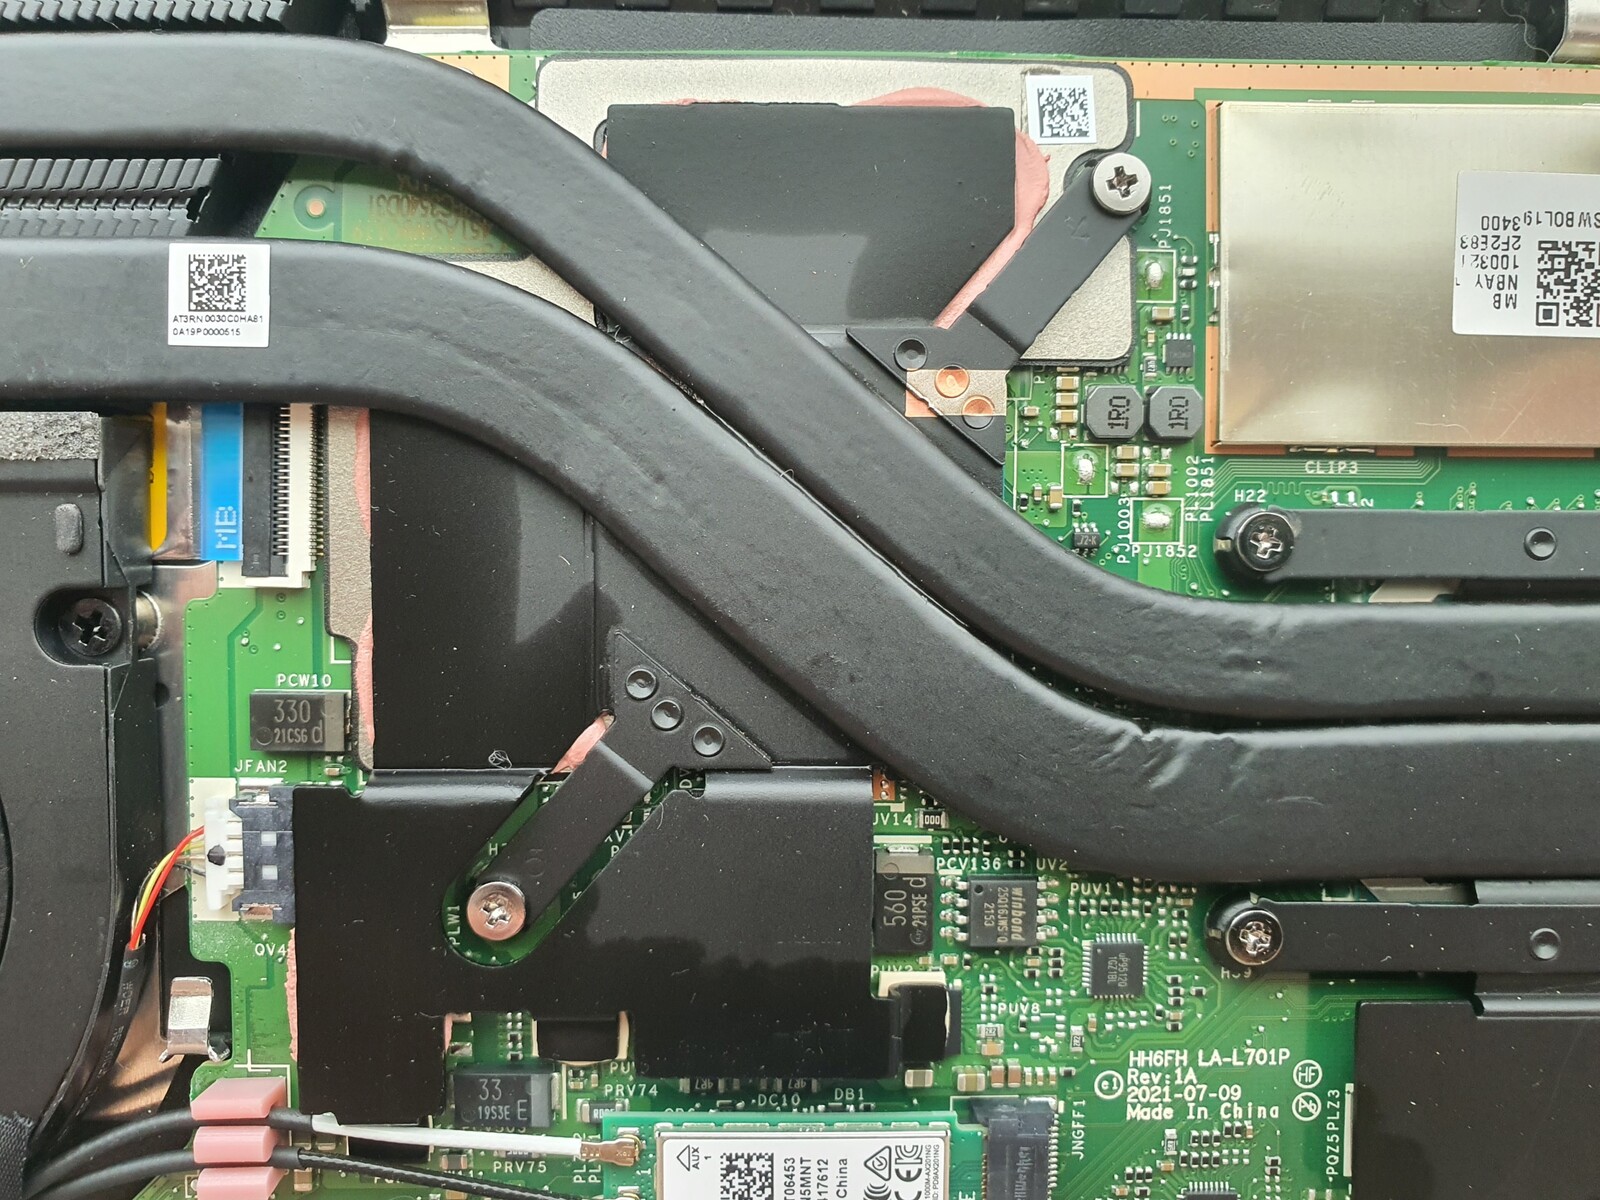
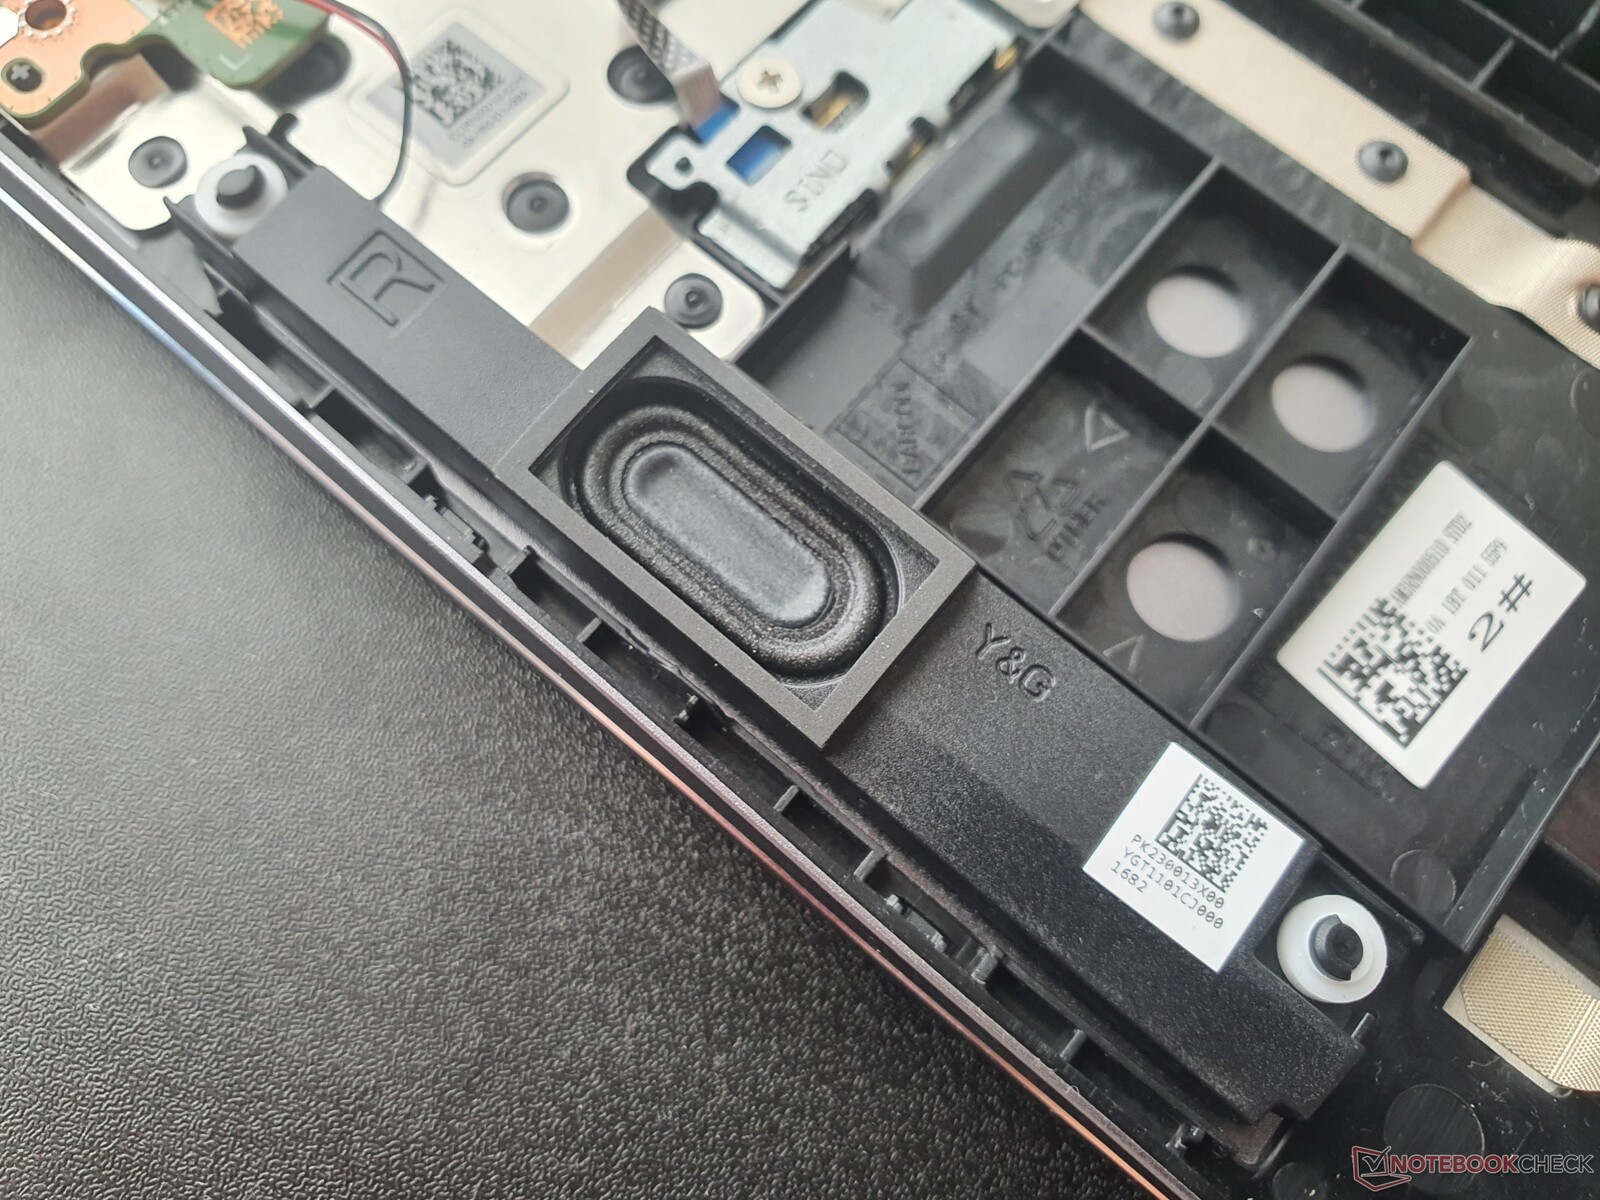
The Swift X 16 is equipped with two medium-sized fans and two heat pipes. Unlike the Swift 3, the CPU shares the cooling system with a dedicated GPU.
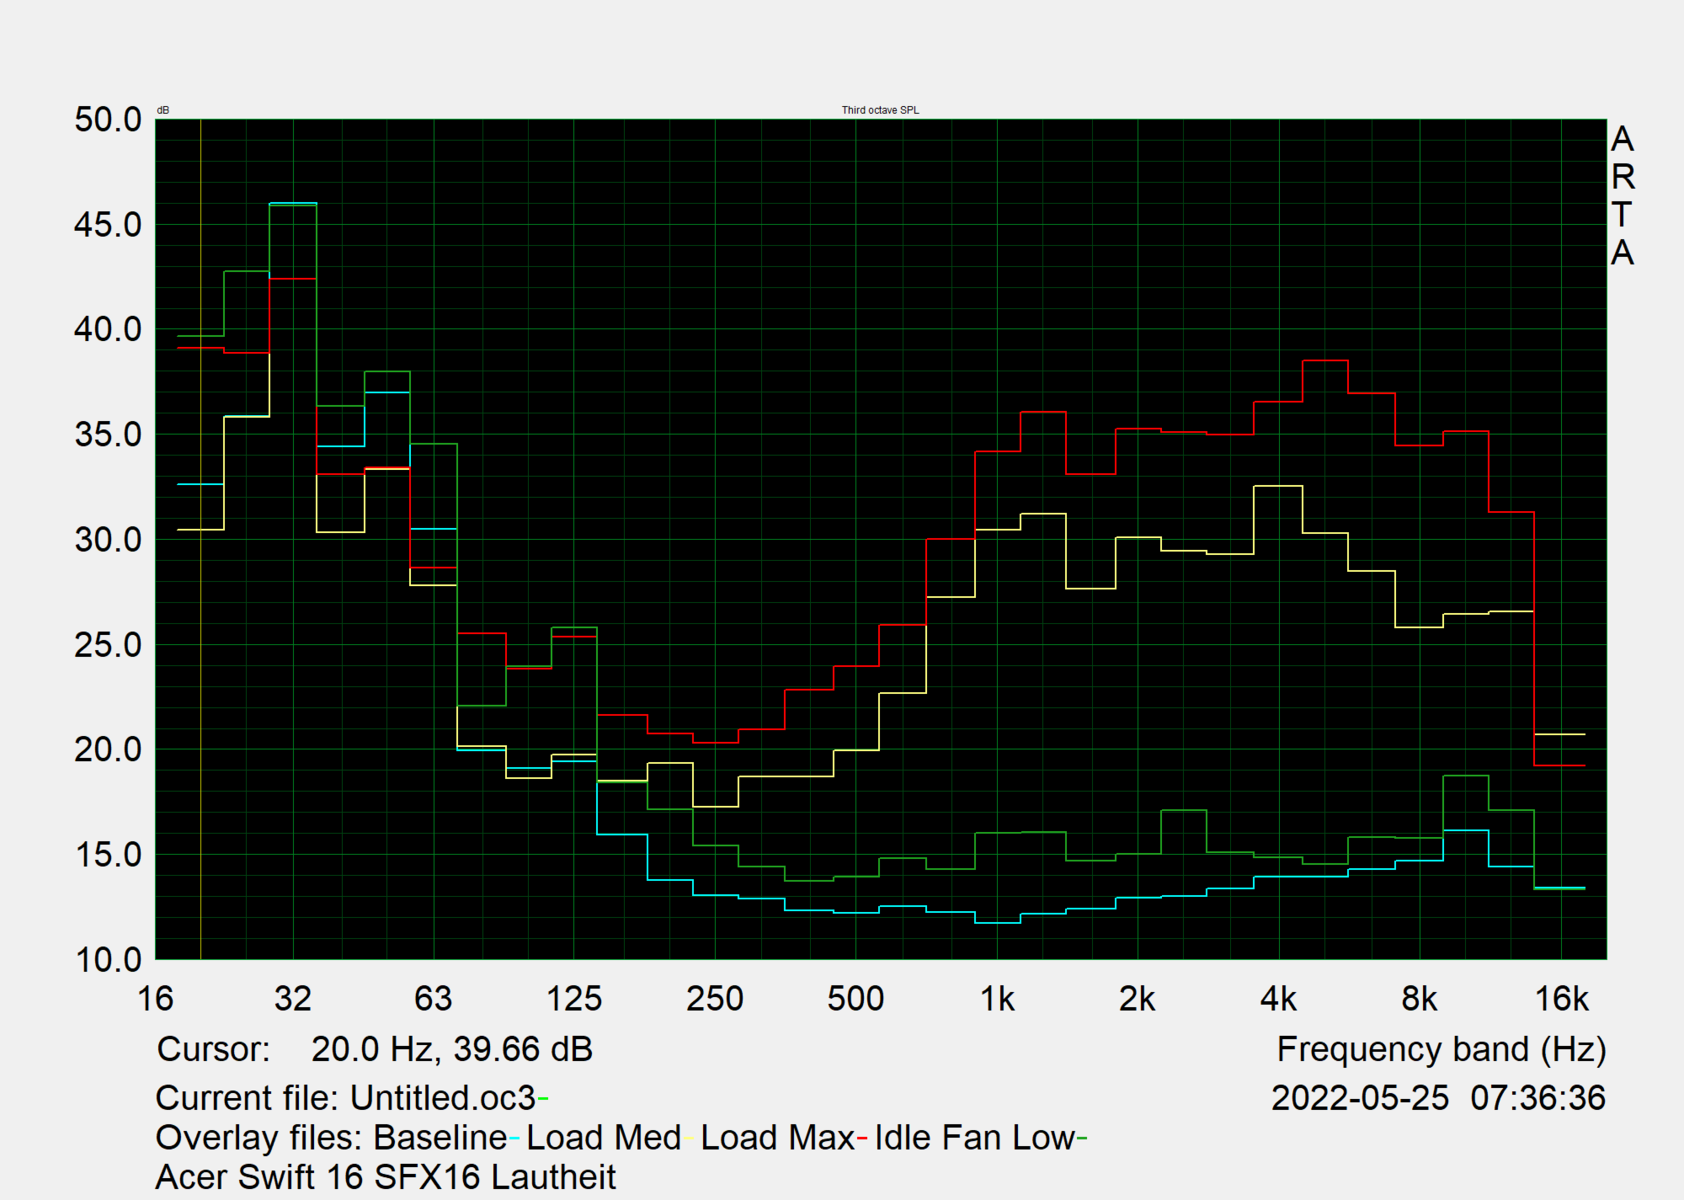
As a result, the fans get louder under load, and gaming also results in irregular fan behavior, but in longer intervals, so it doesn't really stand out. While 41 db(A) under load is not quiet, it is significantly less annoying than a traditional gaming laptop.
The comparison devices with a dedicated GPU are at roughly the same level, but the Dell Inspiron 16 Plus with a higher 55 W TGP gets louder. Acer's own Silent mode makes things even quieter. When surfing the web, the fans often stand still; at a slightly faster surfing speed, there are short "bursts" at comfortable volumes.
Noise level
| Idle |
| 25.4 / 25.4 / 27.8 dB(A) |
| Load |
| 41 / 47 dB(A) |
 | ||
30 dB silent 40 dB(A) audible 50 dB(A) loud |
||
min: | ||
| Acer Swift X SFX16-51G-5388 GeForce RTX 3050 4GB Laptop GPU, i5-11320H, Samsung PM991 MZVLQ512HBLU | Acer Swift 3 SF316-51 Iris Xe G7 96EUs, i7-11370H, Micron 2210 MTFDHBA512QFD | Acer Swift X SFX14-41G-R7F3 GeForce GTX 1650 Mobile, R5 5500U, WDC PC SN530 SDBPNPZ-1T00 | Lenovo IdeaPad 5 Pro 16ACH GeForce GTX 1650 Mobile, R7 5800H, Micron 2300 512GB MTFDHBA512TDV | Dell Inspiron 16 Plus 7610 GeForce RTX 3050 4GB Laptop GPU, i7-11800H, Kingston OM3PDP3512B | Asus Vivobook Pro 16X-M7600QE GeForce RTX 3050 Ti Laptop GPU, R9 5900HX, SK Hynix HFM001TD3JX013N | Huawei MateBook 16 R7 5800H Vega 8, R7 5800H, Lite-On CA5-8D512 | |
|---|---|---|---|---|---|---|---|
| Noise | 5% | -1% | 3% | 0% | -2% | 7% | |
| off / environment * (dB) | 25.4 | 26 -2% | 26 -2% | 24.04 5% | 24.4 4% | 26 -2% | 24.8 2% |
| Idle Minimum * (dB) | 25.4 | 26 -2% | 26 -2% | 24.04 5% | 24.4 4% | 27 -6% | 24.8 2% |
| Idle Average * (dB) | 25.4 | 26 -2% | 27 -6% | 24.04 5% | 24.4 4% | 27 -6% | 24.8 2% |
| Idle Maximum * (dB) | 27.8 | 27.7 -0% | 27.4 1% | 24.04 14% | 24.4 12% | 27.5 1% | 26.7 4% |
| Load Average * (dB) | 41 | 32.7 20% | 42.2 -3% | 41.3 -1% | 48.3 -18% | 41.7 -2% | 32 22% |
| Load Maximum * (dB) | 47 | 39 17% | 44.3 6% | 52.93 -13% | 48.9 -4% | 45.3 4% | 42.4 10% |
| Witcher 3 ultra * (dB) | 49.21 | 48.9 | 32 |
* ... smaller is better
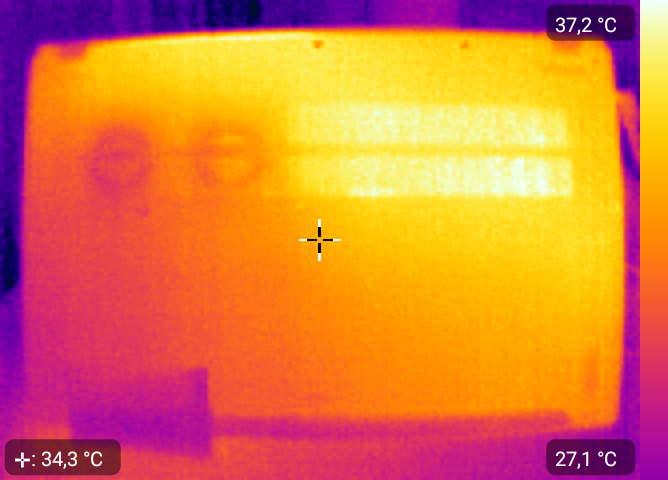
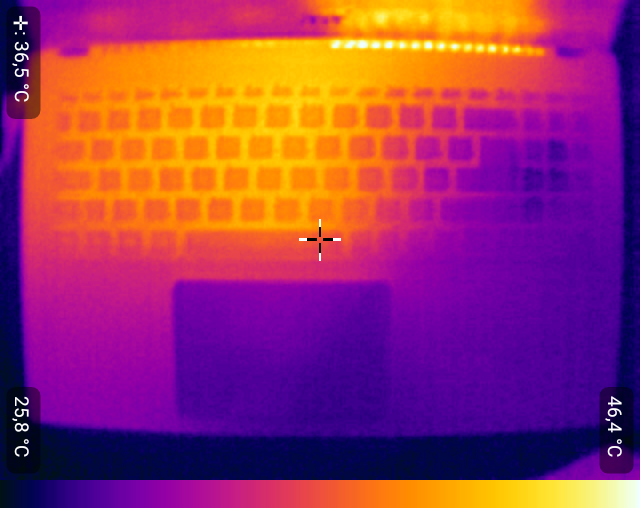
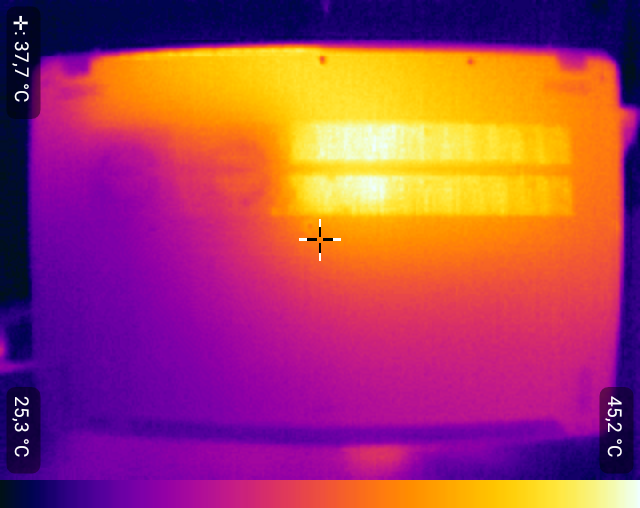
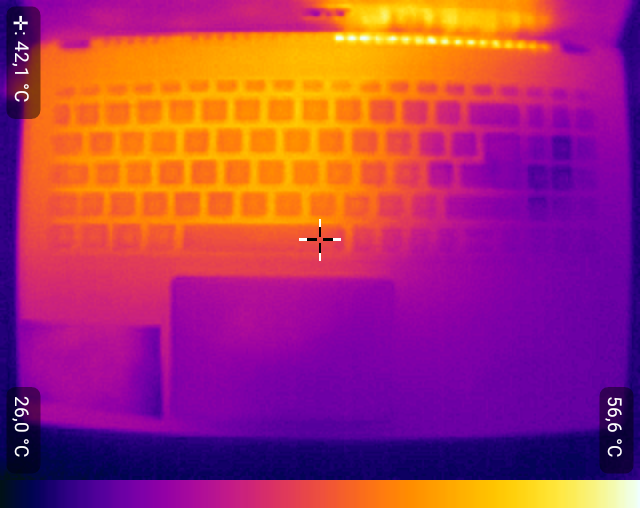
Temperature
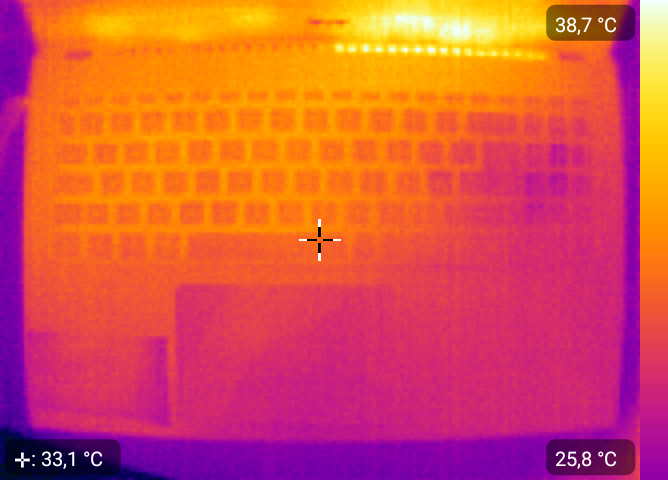
When gaming, temperatures remain within limits and nothing gets noticeably hot or annyoing in any way. Hotspots only occur under the combined stress test, especially above the keyboard. The Asus Vivobook Pro 16X remains significantly cooler despite the RTX 3050, while Dell's Inspiron 16 Plus heats up more noticeably.
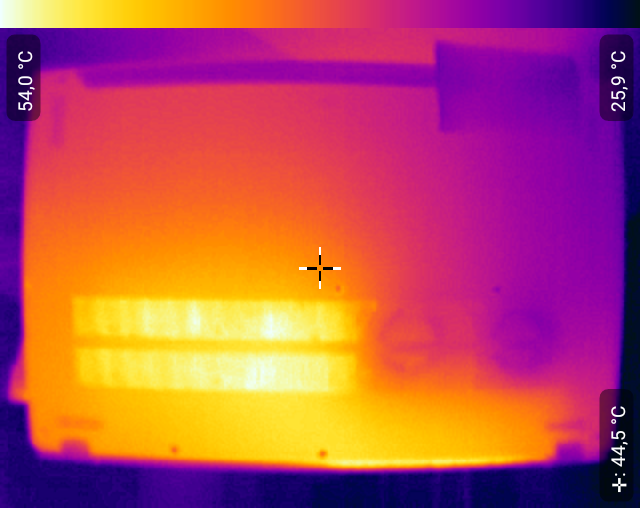
(-) The maximum temperature on the upper side is 52.4 °C / 126 F, compared to the average of 36.8 °C / 98 F, ranging from 21 to 71 °C for the class Multimedia.
(-) The bottom heats up to a maximum of 50 °C / 122 F, compared to the average of 39.1 °C / 102 F
(+) In idle usage, the average temperature for the upper side is 27.8 °C / 82 F, compared to the device average of 31.3 °C / 88 F.
(±) Playing The Witcher 3, the average temperature for the upper side is 32.8 °C / 91 F, compared to the device average of 31.3 °C / 88 F.
(±) The palmrests and touchpad can get very hot to the touch with a maximum of 39.2 °C / 102.6 F.
(-) The average temperature of the palmrest area of similar devices was 28.7 °C / 83.7 F (-10.5 °C / -18.9 F).
| Acer Swift X SFX16-51G-5388 Intel Core i5-11320H, NVIDIA GeForce RTX 3050 4GB Laptop GPU | Acer Swift 3 SF316-51 Intel Core i7-11370H, Intel Iris Xe Graphics G7 96EUs | Lenovo IdeaPad 5 Pro 16ACH AMD Ryzen 7 5800H, NVIDIA GeForce GTX 1650 Mobile | Dell Inspiron 16 Plus 7610 Intel Core i7-11800H, NVIDIA GeForce RTX 3050 4GB Laptop GPU | Asus Vivobook Pro 16X-M7600QE AMD Ryzen 9 5900HX, NVIDIA GeForce RTX 3050 Ti Laptop GPU | Huawei MateBook 16 R7 5800H AMD Ryzen 7 5800H, AMD Radeon RX Vega 8 (Ryzen 4000/5000) | |
|---|---|---|---|---|---|---|
| Heat | 7% | 4% | -6% | 14% | 13% | |
| Maximum Upper Side * (°C) | 52.4 | 40 24% | 51.9 1% | 46.4 11% | 39.4 25% | 40.2 23% |
| Maximum Bottom * (°C) | 50 | 47 6% | 51.5 -3% | 54.8 -10% | 43.6 13% | 49.7 1% |
| Idle Upper Side * (°C) | 30.3 | 30.1 1% | 27.2 10% | 31.4 -4% | 27.6 9% | 26.4 13% |
| Idle Bottom * (°C) | 30.4 | 31.6 -4% | 28.5 6% | 36.6 -20% | 27.5 10% | 26.4 13% |
* ... smaller is better
Stress Test
Under pure CPU stress, the Intel Core i5-11320H clocks at 3 GHz (200 MHz below the base clock) and reaches 73 °C.
Under pure dGPU stress, the RTX 3050 clocks at 700 MHz, which corresponds to its base clock. Combined load (FurMark + Prime95) reduces the CPU to 2.4 GHz, while the GPU throttles only slightly at 600 MHz. Temperatures are around 75 °C and 65 °C, respectively. A good result.
The combined consumption is 25W (CPU) + 35W (GPU) = 60 watts. In gaming, this amounts to 15W + 40W. In battery mode, 15W + 30W.
| CPU Clock (GHz) | GPU Clock (MHz) | Average CPU Temperature (°C) | Average GPU Temperature (°C) | PL1 (Watt) | TGP (Watt) | |
| System Idle | 0,04 | 200 | 29 | 34 | -- | -- |
| Prime95 Stress | 3 | 200 | 73 | 52 | 35 | -- |
| Prime95 + FurMark Stress | 2,4 | 600 | 75 | 66 | 25 | 40 |
| FurMark Stress | 0,1 | 700 | 48 | 56 | -- | 40 |
| Witcher 3 Stress | 0,7 | 1200 | 60 | 59 | 15 | 40 |
| Witcher 3 @Akku | 0,7 | 1057 | 59 | 58 | 15 | 30 |
Speakers
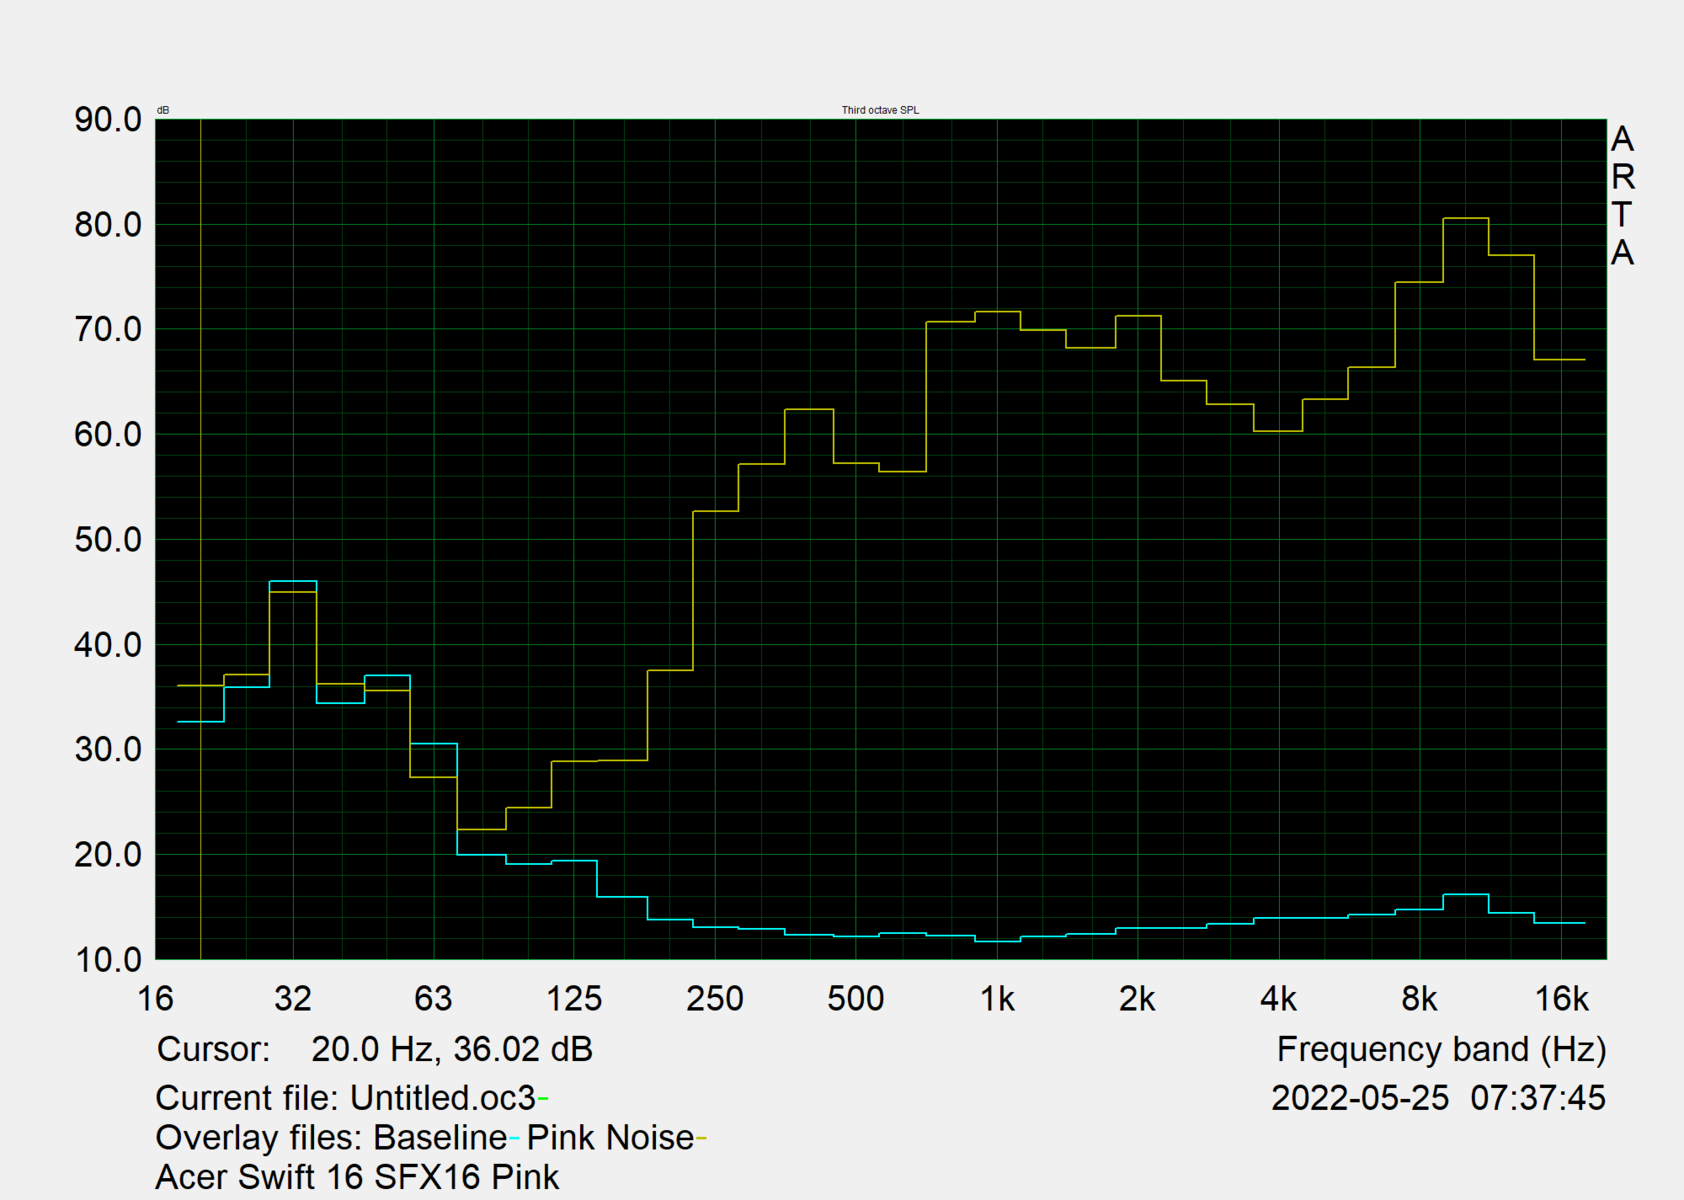
The speakers produce sound of a substandard quality, which should not be the case in a multimedia laptop. Sounds are too quiet, there is hardly any bass and even the mids and highs are only reproduced with limited accuracy.
The use of external audio peripherals via the 3.5mm jack or Bluetooth is thus recommended.
Acer Swift X SFX16-51G-5388 audio analysis
(±) | speaker loudness is average but good (77 dB)
Bass 100 - 315 Hz
(-) | nearly no bass - on average 25% lower than median
(±) | linearity of bass is average (11.6% delta to prev. frequency)
Mids 400 - 2000 Hz
(±) | higher mids - on average 6.1% higher than median
(±) | linearity of mids is average (8.2% delta to prev. frequency)
Highs 2 - 16 kHz
(±) | higher highs - on average 5.3% higher than median
(±) | linearity of highs is average (8.9% delta to prev. frequency)
Overall 100 - 16.000 Hz
(±) | linearity of overall sound is average (22.9% difference to median)
Compared to same class
» 81% of all tested devices in this class were better, 5% similar, 14% worse
» The best had a delta of 5%, average was 17%, worst was 45%
Compared to all devices tested
» 68% of all tested devices were better, 6% similar, 26% worse
» The best had a delta of 4%, average was 24%, worst was 134%
Lenovo IdeaPad 5 Pro 16ACH audio analysis
(-) | not very loud speakers (68.8 dB)
Bass 100 - 315 Hz
(-) | nearly no bass - on average 24.4% lower than median
(±) | linearity of bass is average (13.3% delta to prev. frequency)
Mids 400 - 2000 Hz
(+) | balanced mids - only 3.2% away from median
(+) | mids are linear (4.1% delta to prev. frequency)
Highs 2 - 16 kHz
(+) | balanced highs - only 2% away from median
(+) | highs are linear (6.3% delta to prev. frequency)
Overall 100 - 16.000 Hz
(±) | linearity of overall sound is average (22.5% difference to median)
Compared to same class
» 80% of all tested devices in this class were better, 4% similar, 16% worse
» The best had a delta of 5%, average was 17%, worst was 45%
Compared to all devices tested
» 66% of all tested devices were better, 6% similar, 28% worse
» The best had a delta of 4%, average was 24%, worst was 134%
Energy Management: Swift X, as so often, in the middle
Power Consumption
The Swift X is thirsty in standby, demanding a full 3 watts. Idle values, on the other hand, are mediocre and roughly on par with our comparison field.
Under load, machines with a 45 watt CPU + higher TGP can consume significantly more power - up to 100 watts - which benefits performance. Acer's Swift X 16 extracts a maximum of 63 watts from the mains. The power supply is therefore sufficiently sized at 90 watts.
| Off / Standby | |
| Idle | |
| Load |
|
Key:
min: | |
| Acer Swift X SFX16-51G-5388 i5-11320H, GeForce RTX 3050 4GB Laptop GPU, Samsung PM991 MZVLQ512HBLU, , 1920x1080, 16.1" | Acer Swift 3 SF316-51 i7-11370H, Iris Xe G7 96EUs, Micron 2210 MTFDHBA512QFD, IPS, 1920x1080, 16.1" | Acer Swift X SFX14-41G-R7F3 R5 5500U, GeForce GTX 1650 Mobile, WDC PC SN530 SDBPNPZ-1T00, IPS, 1920x1080, 14" | Lenovo IdeaPad 5 Pro 16ACH R7 5800H, GeForce GTX 1650 Mobile, Micron 2300 512GB MTFDHBA512TDV, IPS LED, 2560x1600, 16" | Dell Inspiron 16 Plus 7610 i7-11800H, GeForce RTX 3050 4GB Laptop GPU, Kingston OM3PDP3512B, IPS, 3072x1920, 16" | Asus Vivobook Pro 16X-M7600QE R9 5900HX, GeForce RTX 3050 Ti Laptop GPU, SK Hynix HFM001TD3JX013N, OLED, 3840x2400, 16.1" | Huawei MateBook 16 R7 5800H R7 5800H, Vega 8, Lite-On CA5-8D512, , 2520x1680, 16" | Average NVIDIA GeForce RTX 3050 4GB Laptop GPU | Average of class Multimedia | |
|---|---|---|---|---|---|---|---|---|---|
| Power Consumption | 39% | 25% | -11% | -33% | -21% | 11% | -16% | 4% | |
| Idle Minimum * (Watt) | 7 | 4.8 31% | 3.4 51% | 5.7 19% | 7.7 -10% | 8.2 -17% | 4.6 34% | 7.17 ? -2% | 5.64 ? 19% |
| Idle Average * (Watt) | 10.1 | 7.4 27% | 6 41% | 9.3 8% | 10.7 -6% | 16.2 -60% | 10.5 -4% | 10.4 ? -3% | 10 ? 1% |
| Idle Maximum * (Watt) | 15 | 9 40% | 9.2 39% | 11 27% | 16.8 -12% | 19.7 -31% | 11.2 25% | 14.8 ? 1% | 12.2 ? 19% |
| Load Average * (Watt) | 63.3 | 34.9 45% | 57 10% | 83.4 -32% | 100.39 -59% | 65.8 -4% | 59.1 7% | 89.7 ? -42% | 64.8 ? -2% |
| Witcher 3 ultra * (Watt) | 63.3 | 34.9 45% | 57.3 9% | 94.4 -49% | 108 -71% | 65.6 -4% | 58.6 7% | ||
| Load Maximum * (Watt) | 94 | 51.4 45% | 93.6 -0% | 128.7 -37% | 129 -37% | 104 -11% | 98.3 -5% | 124.8 ? -33% | 111.7 ? -19% |
* ... smaller is better
Power consumption Witcher 3 / Stress test
Power consumption with an external monitor
Battery Life
The battery life of ~8 hours when surfing the web at 150 nits is acceptable, but it comes last in our comparison field. The Swift 3 without dGPU lasts over one and a half hours longer, and Lenovo's IdeaPad 5 Pro 16 achieves a 50% longer runtime.
| Acer Swift X SFX16-51G-5388 i5-11320H, GeForce RTX 3050 4GB Laptop GPU, 58.7 Wh | Acer Swift 3 SF316-51 i7-11370H, Iris Xe G7 96EUs, 56 Wh | Acer Swift X SFX14-41G-R7F3 R5 5500U, GeForce GTX 1650 Mobile, 58.7 Wh | Lenovo IdeaPad 5 Pro 16ACH R7 5800H, GeForce GTX 1650 Mobile, 75 Wh | Dell Inspiron 16 Plus 7610 i7-11800H, GeForce RTX 3050 4GB Laptop GPU, 86 Wh | Asus Vivobook Pro 16X-M7600QE R9 5900HX, GeForce RTX 3050 Ti Laptop GPU, 96 Wh | Average of class Multimedia | |
|---|---|---|---|---|---|---|---|
| Battery runtime | 19% | 19% | 31% | 71% | 7% | 49% | |
| H.264 (h) | 8.4 | 10.3 23% | 10.4 24% | 16.4 ? 95% | |||
| WiFi v1.3 (h) | 8.1 | 9.8 21% | 10.1 25% | 12.6 56% | 9.9 22% | 11.3 40% | 12 ? 48% |
| Gaming (h) | 1.1 | 1.533 ? 39% | |||||
| Load (h) | 1.5 | 1.7 13% | 1.7 13% | 1.7 13% | 3.3 120% | 1.1 -27% | 1.675 ? 12% |
| Reader / Idle (h) | 20.1 | 7.6 | 20.5 | 20.3 | 25.2 ? | ||
| Witcher 3 ultra (h) | 2.2 | 1.2 |
Pros
Cons
Verdict: Acer Swift X 16 for US$ 1200 is simply too expensive
The compact Acer Swift X 16 is fairly light at 1.8kg and quiet under load thanks to Acer's well-implemented power modes. Input devices are good, while Thunderbolt 4 improves connectivity, although an SD card reader as well as a LAN port are lacking.
The graphics performance of the robust multimedia office hybrid is sufficient for Full HD gaming or occasional content creation. The latter also benefits from the 16-inch screen's 95% sRGB color space. This is also ideal for media enjoyment, but a 16:10 format would be more advantageous for working. Considering the rather high price, Acer could have installed a more powerful version of the GeForce RTX 3050.
For US$ 1,200, you get a high-performance, relatively quiet and compact work device for multimedia tasks. Unfortunately, the 16-inch display is a little too dark and does not keep up with the competition, also in terms of speakers and battery life.
Considering that this is supposed to be a multimedia laptop, a few things annoy us. For example, the too-dark display, the poor speakers, the webcam and the high DPC latencies. Moreover, the RAM is soldered and the battery life of 8 hours is mediocre for the laptop class.
Asus' Vivobook Pro 16X delivers better performance in almost all areas: brighter 4K OLED display, a AMD Ryzen HX CPU, longer runtimes, better speakers and graphics performance (higher TGP). We can also make similar statements about the Dell Inspiron 16 Plus and the much cheaper Lenovo Ideapad 5 Pro 16.
Price and Availability
Readers are advised to check directly via Acer's website for availability in their country. Keep in mind that Acer offers a variety of configurations of the SFX16-51G that vary from location to location. In the following examples, differences to our reviewed model (SFX16-51G-5388: Intel Core i5-11320H, Nvidia GeForce RTX 3050, 16 GB RAM and 512 GB SSD) are highlighted in bold:
US, starting at US$ 1,199.99 (Intel Core i7-11390H, Nvidia GeForce RTX 3050Ti, 16 GB RAM and 512 GB SSD)
UK, starting at GBP£ 1,199.99 (Intel Core i7-11390H, Nvidia GeForce RTX 3050Ti, 16 GB RAM and 1 TB SSD)
Canada, starting at CAD$ 1,299.99 (Intel Core i7-11370H, Intel Iris Xe Graphics, 16 GB RAM and 512 GB SDD)
Prices are as of 18.07.2022. For comparison, our reviewed device had a retail price of EUR 1,200 (US$ 1,200).
Acer Swift X SFX16-51G-5388
- 07/15/2022 v7 (old)
Marvin Gollor
Price comparison

